Zip Codes with the Highest Percentage of Population Employed in Life, Physical & Social Science in Scottsdale, AZ

RELATED REPORTS & OPTIONS

Life, Physical & Social Science
Population
Families and Households
Female Fertility
Female Fertility (Unmarried)
Race (Community Size)
Race (Percentage)
Ancestry (Community Size)
AfghanAfricanAlbanianAmericanApacheArabArgentineanArmenianAssyrian / Chaldean / SyriacAustralianAustrianBasqueBelgianBhutaneseBlackfeetBolivianBrazilianBritishBulgarianBurmeseCanadianCelticCentral AmericanCentral American IndianCherokeeChileanChippewaChoctawColombianCosta RicanCroatianCubanCypriotCzechCzechoslovakianDanishDominicanDutchEastern EuropeanEcuadorianEgyptianEnglishEstonianEthiopianEuropeanFilipinoFinnishFrenchFrench CanadianGermanGreekGuamanian / ChamorroGuatemalanHaitianHonduranHopiHungarianIcelanderIndian (Asian)IranianIraqiIrishIroquoisIsraeliItalianJamaicanJapaneseJordanianKoreanLaotianLatvianLebaneseLithuanianLuxembourgerMacedonianMalaysianMexicanMexican American IndianMongolianMoroccanNative HawaiianNavajoNew ZealanderNicaraguanNigerianNorthern EuropeanNorwegianPaiutePakistaniPalestinianPanamanianPennsylvania GermanPeruvianPimaPolishPortuguesePuerto RicanRomanianRussianSalvadoranSamoanScandinavianScotch-IrishScottishSeminoleSerbianSiouxSlavicSlovakSloveneSouth AfricanSouth AmericanSouth American IndianSpaniardSpanishSri LankanSubsaharan AfricanSwedishSwissSyrianThaiTlingit-HaidaTohono O'OdhamTrinidadian and TobagonianTurkishUgandanUkrainianUruguayanVenezuelanWelshYaquiYugoslavian
Ancestry (Percentage)
AfghanAfricanAlbanianAmericanApacheArabArgentineanArmenianAssyrian / Chaldean / SyriacAustralianAustrianBasqueBelgianBhutaneseBlackfeetBolivianBrazilianBritishBulgarianBurmeseCanadianCelticCentral AmericanCentral American IndianCherokeeChileanChippewaChoctawColombianCosta RicanCroatianCubanCypriotCzechCzechoslovakianDanishDominicanDutchEastern EuropeanEcuadorianEgyptianEnglishEstonianEthiopianEuropeanFilipinoFinnishFrenchFrench CanadianGermanGreekGuamanian / ChamorroGuatemalanHaitianHonduranHopiHungarianIcelanderIndian (Asian)IranianIraqiIrishIroquoisIsraeliItalianJamaicanJapaneseJordanianKoreanLaotianLatvianLebaneseLithuanianLuxembourgerMacedonianMalaysianMexicanMexican American IndianMongolianMoroccanNative HawaiianNavajoNew ZealanderNicaraguanNigerianNorthern EuropeanNorwegianPaiutePakistaniPalestinianPanamanianPennsylvania GermanPeruvianPimaPolishPortuguesePuerto RicanRomanianRussianSalvadoranSamoanScandinavianScotch-IrishScottishSeminoleSerbianSiouxSlavicSlovakSloveneSouth AfricanSouth AmericanSouth American IndianSpaniardSpanishSri LankanSubsaharan AfricanSwedishSwissSyrianThaiTlingit-HaidaTohono O'OdhamTrinidadian and TobagonianTurkishUgandanUkrainianUruguayanVenezuelanWelshYaquiYugoslavian
Immigrant Origin (Total)
AfghanistanAfricaAlbaniaArgentinaAsiaAustraliaAustriaBangladeshBelgiumBosnia and HerzegovinaBrazilBulgariaCambodiaCanadaCaribbeanCentral AmericaChileChinaColombiaCosta RicaCroatiaCubaCzechoslovakiaDenmarkDominican RepublicEastern AfricaEastern AsiaEastern EuropeEcuadorEgyptEl SalvadorEnglandEuropeFijiFranceGermanyGreeceGuatemalaHong KongHungaryIndiaIndonesiaIranIraqIrelandIsraelItalyJamaicaJapanJordanKazakhstanKenyaKoreaLaosLatin AmericaLatviaLebanonLithuaniaMalaysiaMexicoMiddle AfricaMoroccoNetherlandsNicaraguaNorthern AfricaNorthern EuropeNorwayOceaniaPakistanPeruPhilippinesPolandPortugalRomaniaRussiaSaudi ArabiaScotlandSerbiaSouth AfricaSouth AmericaSouth Central AsiaSouth Eastern AsiaSouthern EuropeSpainSwedenSwitzerlandSyriaTaiwanThailandTrinidad and TobagoTurkeyUgandaUkraineUruguayVenezuelaVietnamWestern AfricaWestern AsiaWestern Europe
Immigrant Origin (Percentage)
AfghanistanAfricaAlbaniaArgentinaAsiaAustraliaAustriaBangladeshBelgiumBosnia and HerzegovinaBrazilBulgariaCambodiaCanadaCaribbeanCentral AmericaChileChinaColombiaCosta RicaCroatiaCubaCzechoslovakiaDenmarkDominican RepublicEastern AfricaEastern AsiaEastern EuropeEcuadorEgyptEl SalvadorEnglandEuropeFijiFranceGermanyGreeceGuatemalaHong KongHungaryIndiaIndonesiaIranIraqIrelandIsraelItalyJamaicaJapanJordanKazakhstanKenyaKoreaLaosLatin AmericaLatviaLebanonLithuaniaMalaysiaMexicoMiddle AfricaMoroccoNetherlandsNicaraguaNorthern AfricaNorthern EuropeNorwayOceaniaPakistanPeruPhilippinesPolandPortugalRomaniaRussiaSaudi ArabiaScotlandSerbiaSouth AfricaSouth AmericaSouth Central AsiaSouth Eastern AsiaSouthern EuropeSpainSwedenSwitzerlandSyriaTaiwanThailandTrinidad and TobagoTurkeyUgandaUkraineUruguayVenezuelaVietnamWestern AfricaWestern AsiaWestern Europe
Income
Income (Families)
Income (Households)
Poverty
Poverty (Families)
Unemployment
Employment Occupations
Employment Industries
Employer Class
Commute Time
Commute Means
School Enrollment
Education by Degree Field
Occupancy
Finances
Physical Characteristics
Scottsdale
Compare Zip Codes
Comparison Subject

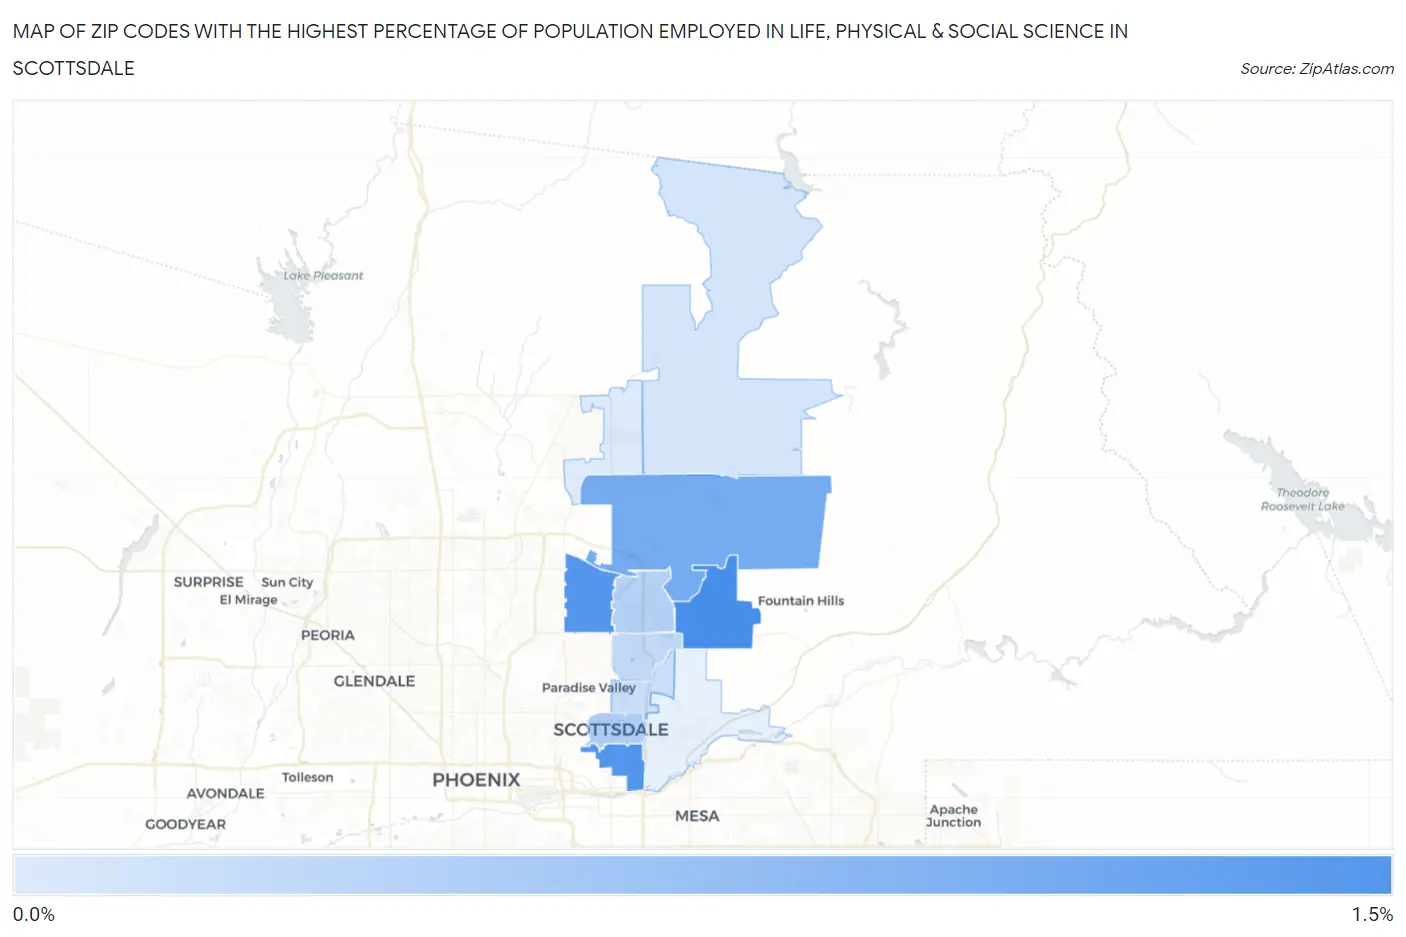
Map of Zip Codes with the Highest Percentage of Population Employed in Life, Physical & Social Science in Scottsdale

0.0%
1.5%
Zip Codes with the Highest Percentage of Population Employed in Life, Physical & Social Science in Scottsdale Map

Zip Codes with the Highest Percentage of Population Employed in Life, Physical & Social Science in Scottsdale, AZ

Zip Code % Employed vs State vs National
1.852591.1%0.83%(+0.315)#881.1%(+0.056)#7,878
2.852571.1%0.83%(+0.252)#991.1%(-0.006)#8,342
3.852541.1%0.83%(+0.249)#1001.1%(-0.009)#8,377
4.852550.91%0.83%(+0.073)#1221.1%(-0.185)#9,908
5.852510.60%0.83%(-0.233)#1721.1%(-0.491)#13,301
6.852600.57%0.83%(-0.258)#1751.1%(-0.516)#13,594
7.852580.51%0.83%(-0.327)#1841.1%(-0.585)#14,428
8.852500.47%0.83%(-0.360)#1931.1%(-0.618)#14,868
9.852620.42%0.83%(-0.411)#2031.1%(-0.669)#15,490
10.852660.38%0.83%(-0.455)#2101.1%(-0.713)#16,040

Common Questions

What are the Top 10 Zip Codes with the Highest Percentage of Population Employed in Life, Physical & Social Science in Scottsdale, AZ?
Top 10 Zip Codes with the Highest Percentage of Population Employed in Life, Physical & Social Science in Scottsdale, AZ are:
#1
1.1%
#2
1.1%
#3
1.1%
#4
0.91%
#5
0.60%
#6
0.57%
#7
0.51%
#8
0.47%
#9
0.42%
#10
0.38%
What zip code has the Highest Percentage of Population Employed in Life, Physical & Social Science in Scottsdale, AZ?
85259 has the Highest Percentage of Population Employed in Life, Physical & Social Science in Scottsdale, AZ with 1.1%.
What is the Percentage of Population Employed in Life, Physical & Social Science in Scottsdale, AZ?
Percentage of Population Employed in Life, Physical & Social Science in Scottsdale is 0.80%.
What is the Percentage of Population Employed in Life, Physical & Social Science in Arizona?
Percentage of Population Employed in Life, Physical & Social Science in Arizona is 0.83%.
What is the Percentage of Population Employed in Life, Physical & Social Science in the United States?
Percentage of Population Employed in Life, Physical & Social Science in the United States is 1.1%.