Zip Codes with the Highest Percentage of Households Heated by Bottled Gas / Liquid Propane in Prescott, AZ
RELATED REPORTS & OPTIONS
Bottled Gas / LP Heating
Prescott
Compare Zip Codes
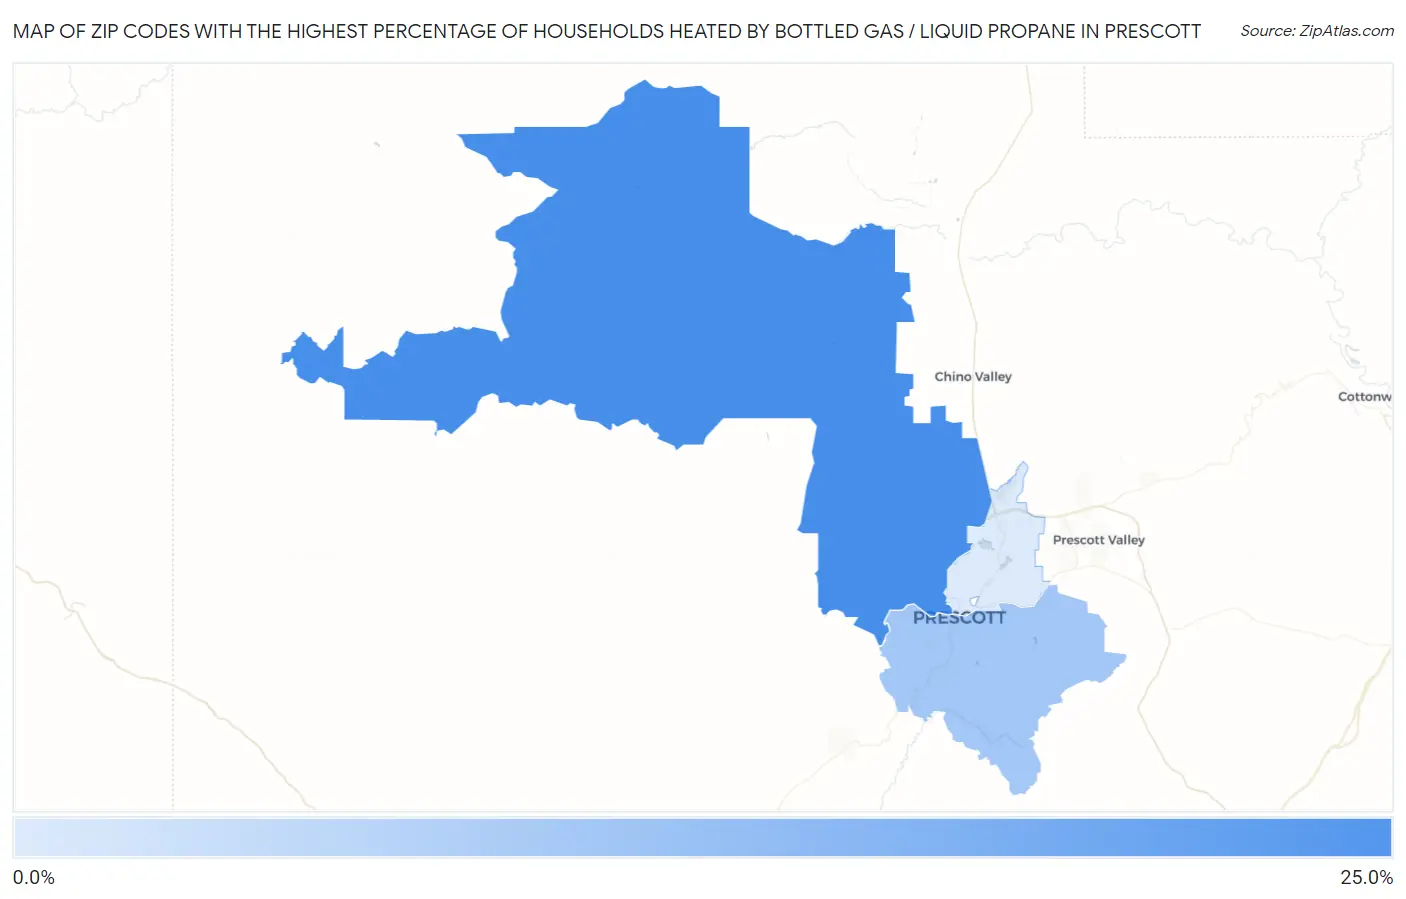
Map of Zip Codes with the Highest Percentage of Households Heated by Bottled Gas / Liquid Propane in Prescott
0.0%
25.0%
Zip Codes with the Highest Percentage of Households Heated by Bottled Gas / Liquid Propane in Prescott, AZ
| Zip Code | Bottled Gas / LP Heating | vs State | vs National | |
| 1. | 86305 | 22.9% | 2.8%(+20.1)#60 | 4.9%(+18.0)#7,849 |
| 2. | 86303 | 10.9% | 2.8%(+8.10)#104 | 4.9%(+6.00)#13,820 |
| 3. | 86301 | 4.1% | 2.8%(+1.30)#172 | 4.9%(-0.800)#19,517 |
1
Common Questions
What are the Top Zip Codes with the Highest Percentage of Households Heated by Bottled Gas / Liquid Propane in Prescott, AZ?
Top Zip Codes with the Highest Percentage of Households Heated by Bottled Gas / Liquid Propane in Prescott, AZ are:
What zip code has the Highest Percentage of Households Heated by Bottled Gas / Liquid Propane in Prescott, AZ?
86305 has the Highest Percentage of Households Heated by Bottled Gas / Liquid Propane in Prescott, AZ with 22.9%.
What is the Percentage of Households Heated by Bottled Gas / Liquid Propane in Prescott, AZ?
Percentage of Households Heated by Bottled Gas / Liquid Propane in Prescott is 2.3%.
What is the Percentage of Households Heated by Bottled Gas / Liquid Propane in Arizona?
Percentage of Households Heated by Bottled Gas / Liquid Propane in Arizona is 2.8%.
What is the Percentage of Households Heated by Bottled Gas / Liquid Propane in the United States?
Percentage of Households Heated by Bottled Gas / Liquid Propane in the United States is 4.9%.