Yellville, AR Map & Demographics
Yellville Map
Yellville Overview
$19,623
PER CAPITA INCOME
$44,000
AVG FAMILY INCOME
$33,983
AVG HOUSEHOLD INCOME
45.9%
WAGE / INCOME GAP [ % ]
54.1¢/ $1
WAGE / INCOME GAP [ $ ]
0.41
INEQUALITY / GINI INDEX
1,159
TOTAL POPULATION
543
MALE POPULATION
616
FEMALE POPULATION
88.15
MALES / 100 FEMALES
113.44
FEMALES / 100 MALES
33.2
MEDIAN AGE
3.1
AVG FAMILY SIZE
2.5
AVG HOUSEHOLD SIZE
479
LABOR FORCE [ PEOPLE ]
54.2%
PERCENT IN LABOR FORCE
12.5%
UNEMPLOYMENT RATE
Yellville Zip Codes
Yellville Area Codes
Income in Yellville
Income Overview in Yellville
Per Capita Income in Yellville is $19,623, while median incomes of families and households are $44,000 and $33,983 respectively.
| Characteristic | Number | Measure |
| Per Capita Income | 1,159 | $19,623 |
| Median Family Income | 278 | $44,000 |
| Mean Family Income | 278 | $60,972 |
| Median Household Income | 427 | $33,983 |
| Mean Household Income | 427 | $49,532 |
| Income Deficit | 278 | $0 |
| Wage / Income Gap (%) | 1,159 | 45.86% |
| Wage / Income Gap ($) | 1,159 | 54.14¢ per $1 |
| Gini / Inequality Index | 1,159 | 0.41 |
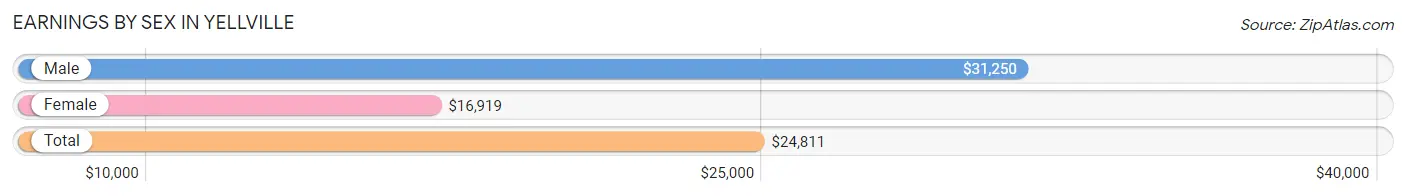
Earnings by Sex in Yellville
Average Earnings in Yellville are $24,811, $31,250 for men and $16,919 for women, a difference of 45.9%.
| Sex | Number | Average Earnings |
| Male | 245 (48.7%) | $31,250 |
| Female | 258 (51.3%) | $16,919 |
| Total | 503 (100.0%) | $24,811 |
Earnings by Sex by Income Bracket in Yellville
The most common earnings brackets in Yellville are $30,000 to $34,999 for men (38 | 15.5%) and $15,000 to $17,499 for women (43 | 16.7%).
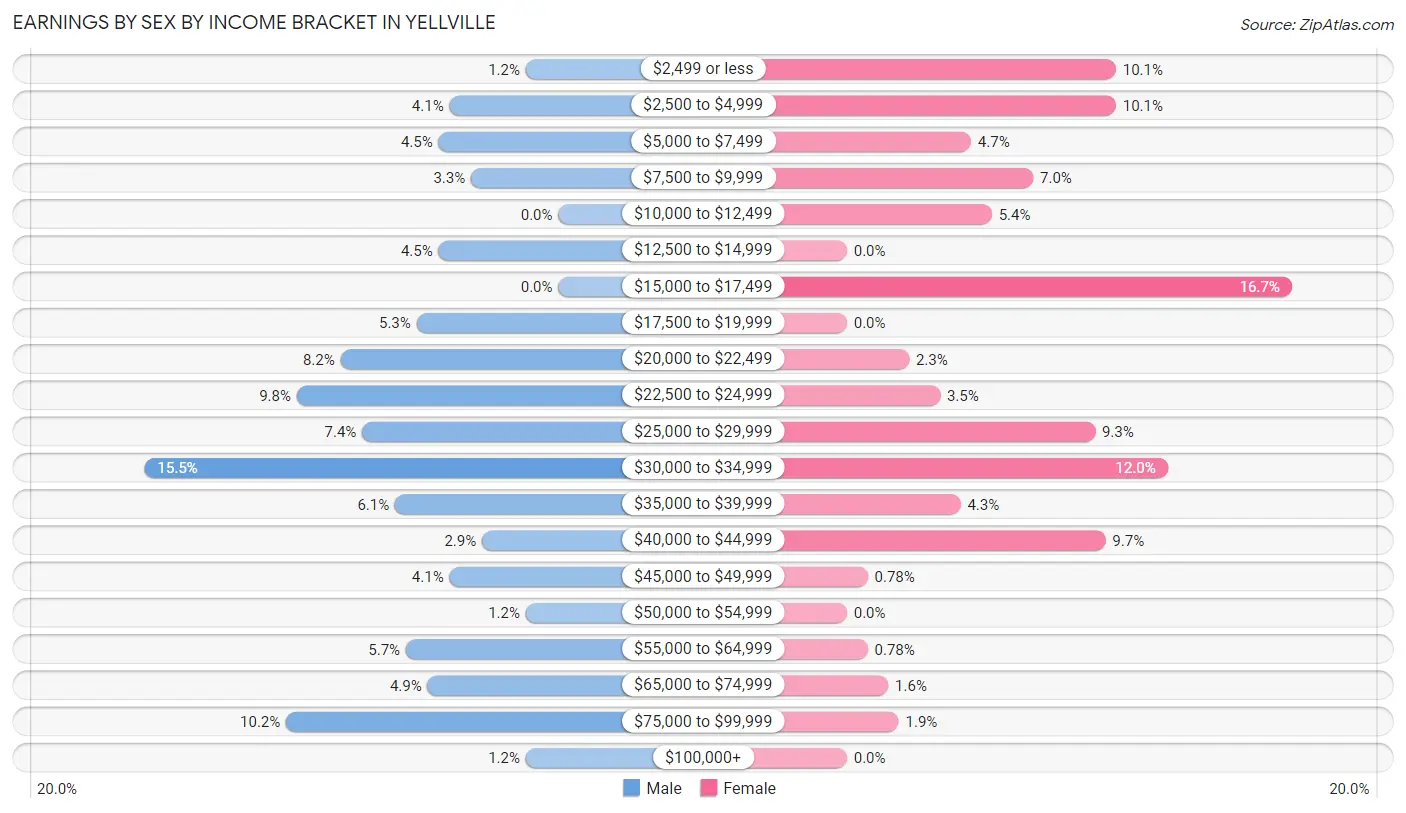
| Income | Male | Female |
| $2,499 or less | 3 (1.2%) | 26 (10.1%) |
| $2,500 to $4,999 | 10 (4.1%) | 26 (10.1%) |
| $5,000 to $7,499 | 11 (4.5%) | 12 (4.6%) |
| $7,500 to $9,999 | 8 (3.3%) | 18 (7.0%) |
| $10,000 to $12,499 | 0 (0.0%) | 14 (5.4%) |
| $12,500 to $14,999 | 11 (4.5%) | 0 (0.0%) |
| $15,000 to $17,499 | 0 (0.0%) | 43 (16.7%) |
| $17,500 to $19,999 | 13 (5.3%) | 0 (0.0%) |
| $20,000 to $22,499 | 20 (8.2%) | 6 (2.3%) |
| $22,500 to $24,999 | 24 (9.8%) | 9 (3.5%) |
| $25,000 to $29,999 | 18 (7.3%) | 24 (9.3%) |
| $30,000 to $34,999 | 38 (15.5%) | 31 (12.0%) |
| $35,000 to $39,999 | 15 (6.1%) | 11 (4.3%) |
| $40,000 to $44,999 | 7 (2.9%) | 25 (9.7%) |
| $45,000 to $49,999 | 10 (4.1%) | 2 (0.8%) |
| $50,000 to $54,999 | 3 (1.2%) | 0 (0.0%) |
| $55,000 to $64,999 | 14 (5.7%) | 2 (0.8%) |
| $65,000 to $74,999 | 12 (4.9%) | 4 (1.5%) |
| $75,000 to $99,999 | 25 (10.2%) | 5 (1.9%) |
| $100,000+ | 3 (1.2%) | 0 (0.0%) |
| Total | 245 (100.0%) | 258 (100.0%) |
Earnings by Sex by Educational Attainment in Yellville
Average earnings in Yellville are $33,611 for men and $17,279 for women, a difference of 48.6%. Men with an educational attainment of high school diploma enjoy the highest average annual earnings of $34,844, while those with college or associate's degree education earn the least with $33,375. Women with an educational attainment of bachelor's degree earn the most with the average annual earnings of $68,750, while those with less than high school education have the smallest earnings of $8,281.
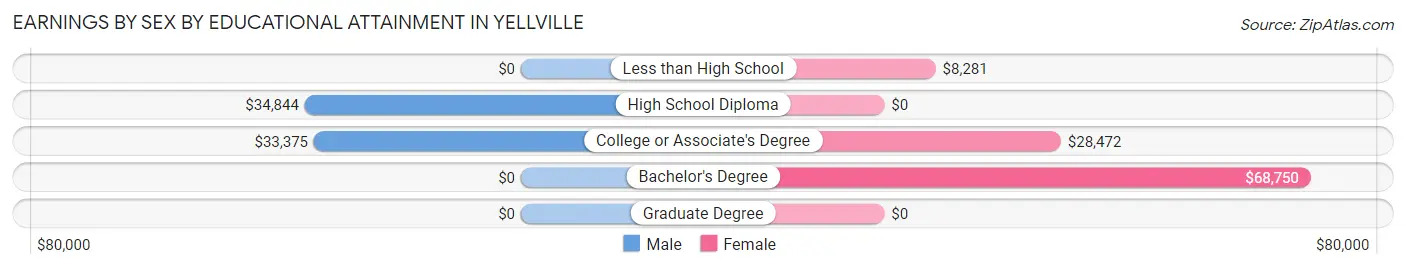
| Educational Attainment | Male Income | Female Income |
| Less than High School | - | - |
| High School Diploma | $34,844 | $0 |
| College or Associate's Degree | $33,375 | $28,472 |
| Bachelor's Degree | - | - |
| Graduate Degree | - | - |
| Total | $33,611 | $17,279 |
Family Income in Yellville
Family Income Brackets in Yellville
According to the Yellville family income data, there are 94 families falling into the $25,000 to $34,999 income range, which is the most common income bracket and makes up 33.8% of all families. Conversely, the $200,000+ income bracket is the least frequent group with only 2 families (0.7%) belonging to this category.
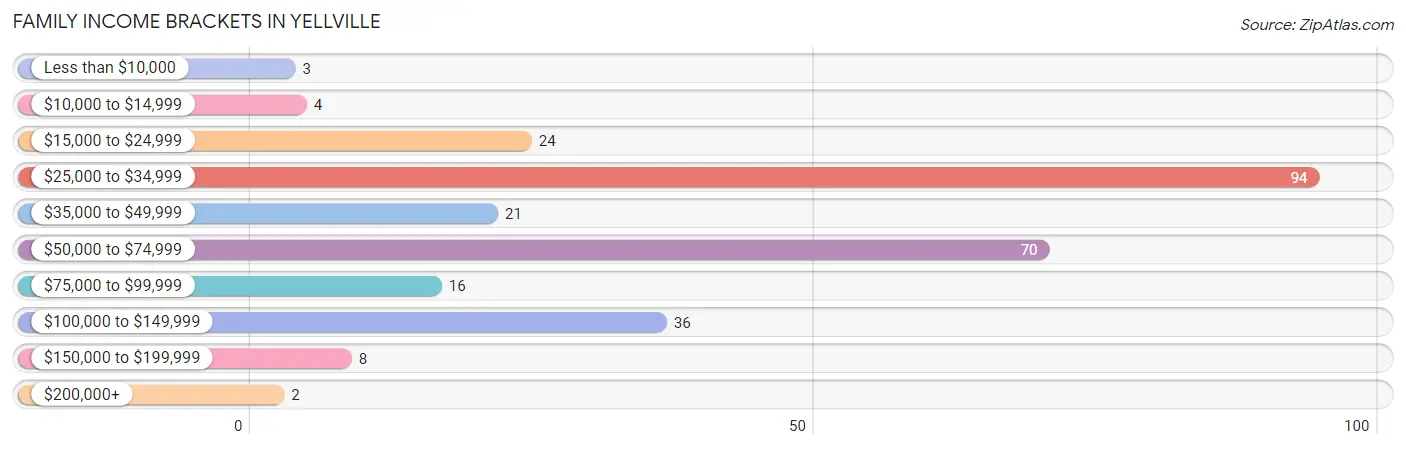
| Income Bracket | # Families | % Families |
| Less than $10,000 | 3 | 1.1% |
| $10,000 to $14,999 | 4 | 1.4% |
| $15,000 to $24,999 | 24 | 8.6% |
| $25,000 to $34,999 | 94 | 33.8% |
| $35,000 to $49,999 | 21 | 7.6% |
| $50,000 to $74,999 | 70 | 25.2% |
| $75,000 to $99,999 | 16 | 5.8% |
| $100,000 to $149,999 | 36 | 12.9% |
| $150,000 to $199,999 | 8 | 2.9% |
| $200,000+ | 2 | 0.7% |
Family Income by Famaliy Size in Yellville
6-person families (5 | 1.8%) account for the highest median family income in Yellville with $100,417 per family, while 3-person families (79 | 28.4%) have the highest median income of $21,583 per family member.
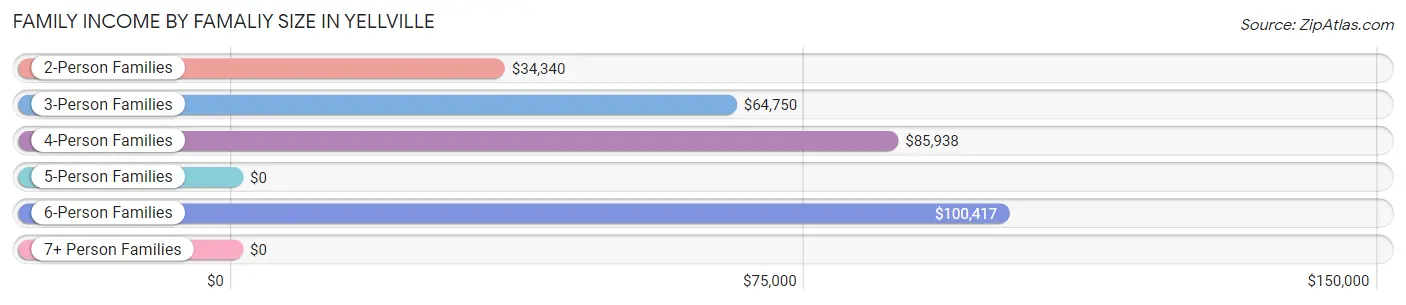
| Income Bracket | # Families | Median Income |
| 2-Person Families | 156 (56.1%) | $34,340 |
| 3-Person Families | 79 (28.4%) | $64,750 |
| 4-Person Families | 9 (3.2%) | $85,938 |
| 5-Person Families | 21 (7.5%) | $0 |
| 6-Person Families | 5 (1.8%) | $100,417 |
| 7+ Person Families | 8 (2.9%) | $0 |
| Total | 278 (100.0%) | $44,000 |
Family Income by Number of Earners in Yellville
The median family income in Yellville is $44,000, with families comprising 3+ earners (26) having the highest median family income of $136,667, while families with no earners (79) have the lowest median family income of $34,321, accounting for 9.3% and 28.4% of families, respectively.
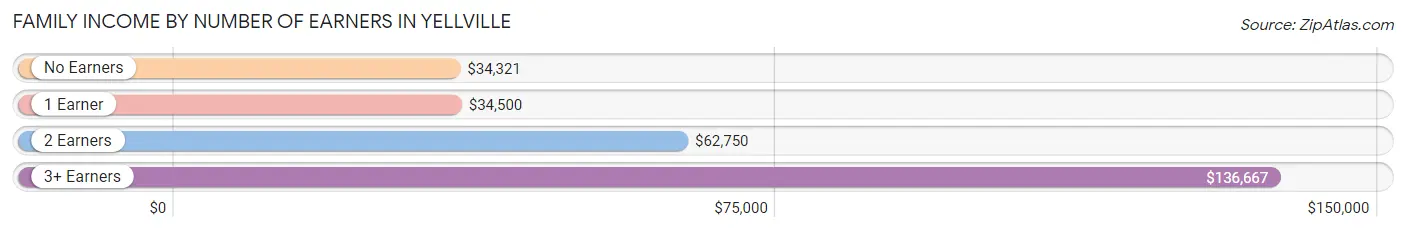
| Number of Earners | # Families | Median Income |
| No Earners | 79 (28.4%) | $34,321 |
| 1 Earner | 94 (33.8%) | $34,500 |
| 2 Earners | 79 (28.4%) | $62,750 |
| 3+ Earners | 26 (9.3%) | $136,667 |
| Total | 278 (100.0%) | $44,000 |
Household Income in Yellville
Household Income Brackets in Yellville
With 127 households falling in the category, the $25,000 to $34,999 income range is the most frequent in Yellville, accounting for 29.7% of all households. In contrast, only 2 households (0.5%) fall into the $200,000+ income bracket, making it the least populous group.
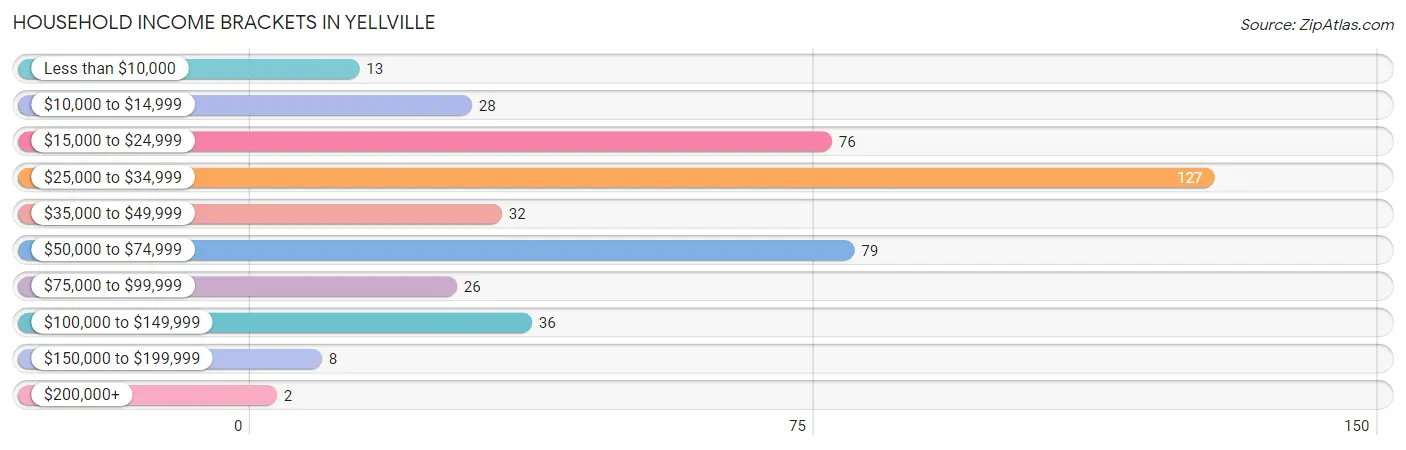
| Income Bracket | # Households | % Households |
| Less than $10,000 | 13 | 3.0% |
| $10,000 to $14,999 | 28 | 6.6% |
| $15,000 to $24,999 | 76 | 17.8% |
| $25,000 to $34,999 | 127 | 29.7% |
| $35,000 to $49,999 | 32 | 7.5% |
| $50,000 to $74,999 | 79 | 18.5% |
| $75,000 to $99,999 | 26 | 6.1% |
| $100,000 to $149,999 | 36 | 8.4% |
| $150,000 to $199,999 | 8 | 1.9% |
| $200,000+ | 2 | 0.5% |
Household Income by Householder Age in Yellville
The median household income in Yellville is $33,983, with the highest median household income of $38,000 found in the 25 to 44 years age bracket for the primary householder. A total of 172 households (40.3%) fall into this category. Meanwhile, the 15 to 24 years age bracket for the primary householder has the lowest median household income of $0, with 2 households (0.5%) in this group.
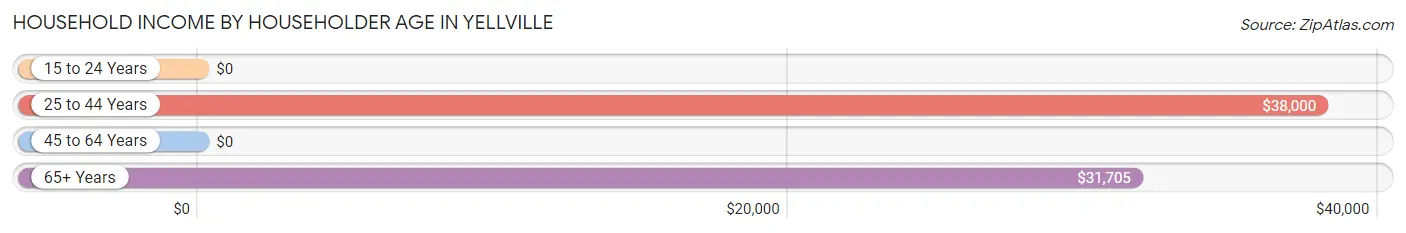
| Income Bracket | # Households | Median Income |
| 15 to 24 Years | 2 (0.5%) | $0 |
| 25 to 44 Years | 172 (40.3%) | $38,000 |
| 45 to 64 Years | 100 (23.4%) | $0 |
| 65+ Years | 153 (35.8%) | $31,705 |
| Total | 427 (100.0%) | $33,983 |
Poverty in Yellville
Income Below Poverty by Sex and Age in Yellville
With 14.6% poverty level for males and 20.1% for females among the residents of Yellville, 5 year old males and 12 to 14 year old females are the most vulnerable to poverty, with 5 males (100.0%) and 23 females (46.0%) in their respective age groups living below the poverty level.
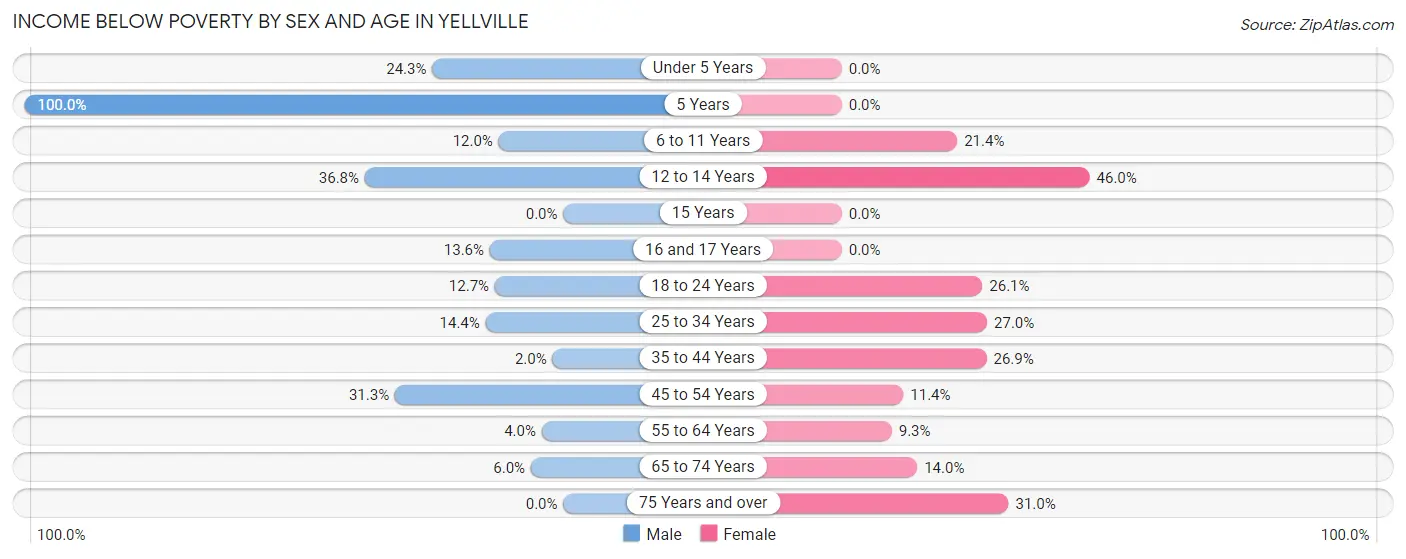
| Age Bracket | Male | Female |
| Under 5 Years | 9 (24.3%) | 0 (0.0%) |
| 5 Years | 5 (100.0%) | 0 (0.0%) |
| 6 to 11 Years | 3 (12.0%) | 12 (21.4%) |
| 12 to 14 Years | 21 (36.8%) | 23 (46.0%) |
| 15 Years | 0 (0.0%) | 0 (0.0%) |
| 16 and 17 Years | 3 (13.6%) | 0 (0.0%) |
| 18 to 24 Years | 8 (12.7%) | 6 (26.1%) |
| 25 to 34 Years | 14 (14.4%) | 24 (27.0%) |
| 35 to 44 Years | 1 (2.0%) | 18 (26.9%) |
| 45 to 54 Years | 5 (31.2%) | 4 (11.4%) |
| 55 to 64 Years | 2 (4.0%) | 9 (9.3%) |
| 65 to 74 Years | 5 (6.0%) | 7 (14.0%) |
| 75 Years and over | 0 (0.0%) | 13 (30.9%) |
| Total | 76 (14.6%) | 116 (20.1%) |
Income Above Poverty by Sex and Age in Yellville
According to the poverty statistics in Yellville, males aged 75 years and over and females aged under 5 years are the age groups that are most secure financially, with 100.0% of males and 100.0% of females in these age groups living above the poverty line.
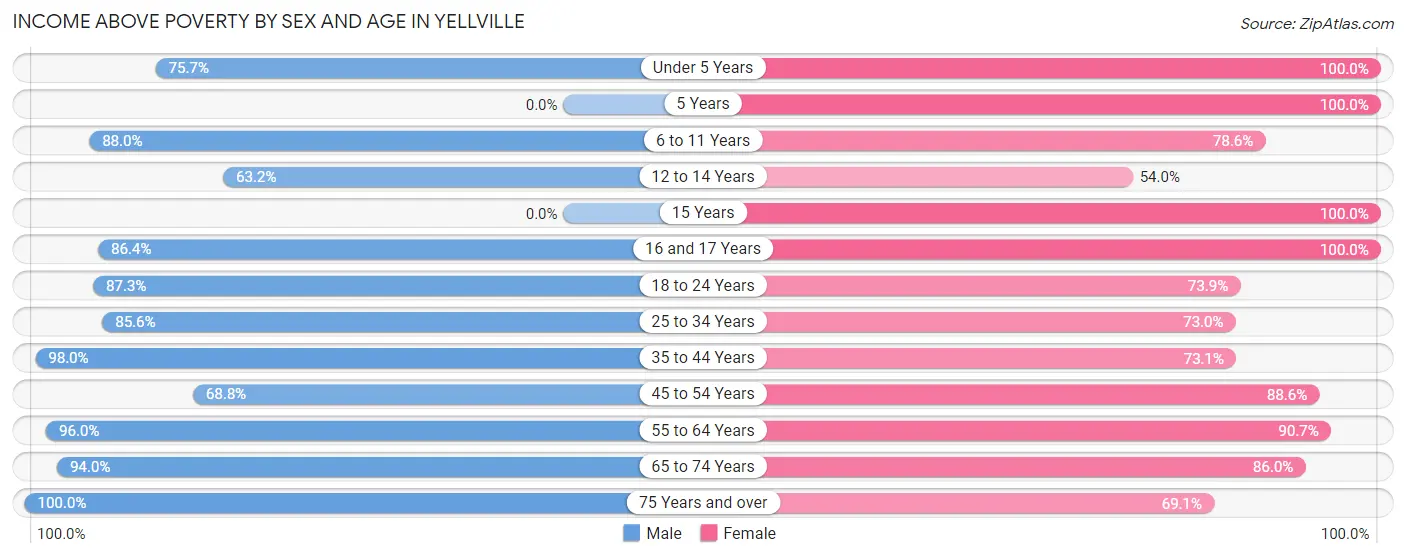
| Age Bracket | Male | Female |
| Under 5 Years | 28 (75.7%) | 28 (100.0%) |
| 5 Years | 0 (0.0%) | 6 (100.0%) |
| 6 to 11 Years | 22 (88.0%) | 44 (78.6%) |
| 12 to 14 Years | 36 (63.2%) | 27 (54.0%) |
| 15 Years | 0 (0.0%) | 11 (100.0%) |
| 16 and 17 Years | 19 (86.4%) | 23 (100.0%) |
| 18 to 24 Years | 55 (87.3%) | 17 (73.9%) |
| 25 to 34 Years | 83 (85.6%) | 65 (73.0%) |
| 35 to 44 Years | 49 (98.0%) | 49 (73.1%) |
| 45 to 54 Years | 11 (68.8%) | 31 (88.6%) |
| 55 to 64 Years | 48 (96.0%) | 88 (90.7%) |
| 65 to 74 Years | 78 (94.0%) | 43 (86.0%) |
| 75 Years and over | 14 (100.0%) | 29 (69.1%) |
| Total | 443 (85.4%) | 461 (79.9%) |
Income Below Poverty Among Married-Couple Families in Yellville
The poverty statistics for married-couple families in Yellville show that 4.8% or 9 of the total 187 families live below the poverty line. Families with 3 or 4 children have the highest poverty rate of 18.2%, comprising of 4 families. On the other hand, families with 1 or 2 children have the lowest poverty rate of 0.0%, which includes 0 families.
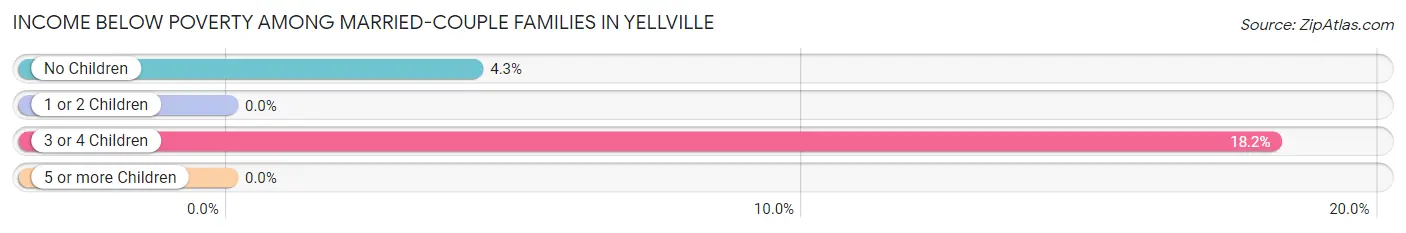
| Children | Above Poverty | Below Poverty |
| No Children | 112 (95.7%) | 5 (4.3%) |
| 1 or 2 Children | 48 (100.0%) | 0 (0.0%) |
| 3 or 4 Children | 18 (81.8%) | 4 (18.2%) |
| 5 or more Children | 0 (0.0%) | 0 (0.0%) |
| Total | 178 (95.2%) | 9 (4.8%) |
Income Below Poverty Among Single-Parent Households in Yellville
According to the poverty data in Yellville, 11.1% or 2 single-father households and 24.7% or 18 single-mother households are living below the poverty line. Among single-father households, those with 1 or 2 children have the highest poverty rate, with 2 households (12.5%) experiencing poverty. Likewise, among single-mother households, those with 1 or 2 children have the highest poverty rate, with 18 households (34.6%) falling below the poverty line.

| Children | Single Father | Single Mother |
| No Children | 0 (0.0%) | 0 (0.0%) |
| 1 or 2 Children | 2 (12.5%) | 18 (34.6%) |
| 3 or 4 Children | 0 (0.0%) | 0 (0.0%) |
| 5 or more Children | 0 (0.0%) | 0 (0.0%) |
| Total | 2 (11.1%) | 18 (24.7%) |
Income Below Poverty Among Married-Couple vs Single-Parent Households in Yellville
The poverty data for Yellville shows that 9 of the married-couple family households (4.8%) and 20 of the single-parent households (22.0%) are living below the poverty level. Within the married-couple family households, those with 3 or 4 children have the highest poverty rate, with 4 households (18.2%) falling below the poverty line. Among the single-parent households, those with 1 or 2 children have the highest poverty rate, with 20 household (29.4%) living below poverty.
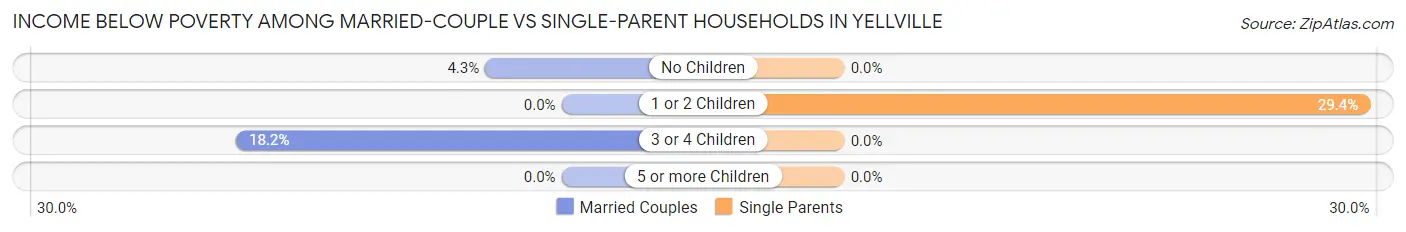
| Children | Married-Couple Families | Single-Parent Households |
| No Children | 5 (4.3%) | 0 (0.0%) |
| 1 or 2 Children | 0 (0.0%) | 20 (29.4%) |
| 3 or 4 Children | 4 (18.2%) | 0 (0.0%) |
| 5 or more Children | 0 (0.0%) | 0 (0.0%) |
| Total | 9 (4.8%) | 20 (22.0%) |
Race in Yellville
The most populous races in Yellville are White / Caucasian (961 | 82.9%), Two or more Races (89 | 7.7%), and Black / African American (73 | 6.3%).
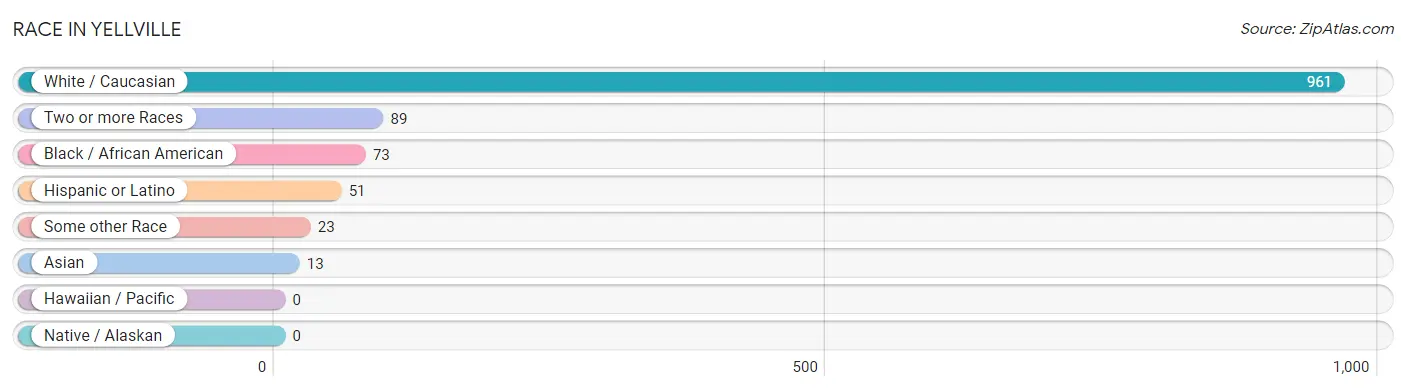
| Race | # Population | % Population |
| Asian | 13 | 1.1% |
| Black / African American | 73 | 6.3% |
| Hawaiian / Pacific | 0 | 0.0% |
| Hispanic or Latino | 51 | 4.4% |
| Native / Alaskan | 0 | 0.0% |
| White / Caucasian | 961 | 82.9% |
| Two or more Races | 89 | 7.7% |
| Some other Race | 23 | 2.0% |
| Total | 1,159 | 100.0% |
Ancestry in Yellville
The most populous ancestries reported in Yellville are Irish (271 | 23.4%), English (187 | 16.1%), German (169 | 14.6%), French (75 | 6.5%), and Mexican (42 | 3.6%), together accounting for 64.2% of all Yellville residents.
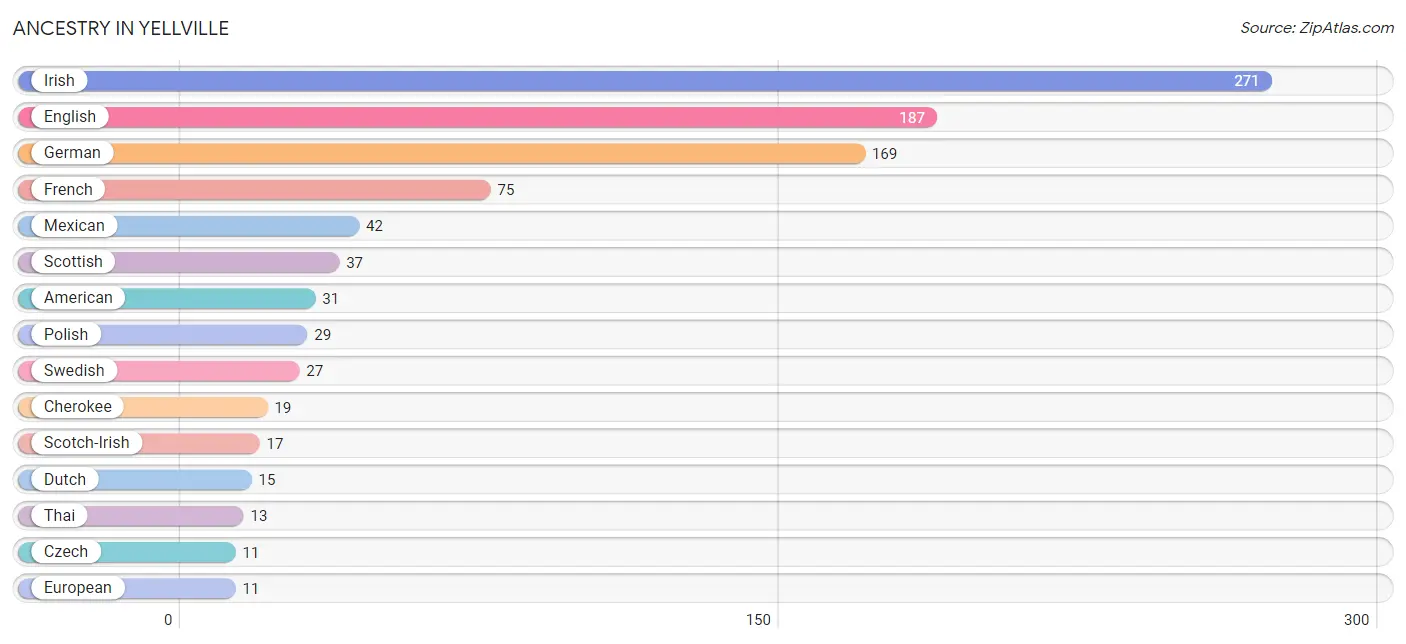
| Ancestry | # Population | % Population |
| American | 31 | 2.7% |
| British | 7 | 0.6% |
| Cherokee | 19 | 1.6% |
| Czech | 11 | 0.9% |
| Dutch | 15 | 1.3% |
| English | 187 | 16.1% |
| European | 11 | 0.9% |
| French | 75 | 6.5% |
| German | 169 | 14.6% |
| Greek | 5 | 0.4% |
| Irish | 271 | 23.4% |
| Italian | 3 | 0.3% |
| Mexican | 42 | 3.6% |
| Polish | 29 | 2.5% |
| Scotch-Irish | 17 | 1.5% |
| Scottish | 37 | 3.2% |
| Spanish | 9 | 0.8% |
| Swedish | 27 | 2.3% |
| Thai | 13 | 1.1% |
| Welsh | 2 | 0.2% | View All 20 Rows |
Immigrants in Yellville
The most numerous immigrant groups reported in Yellville came from Asia (13 | 1.1%), Nepal (13 | 1.1%), South Central Asia (13 | 1.1%), Central America (11 | 0.9%), and El Salvador (11 | 0.9%), together accounting for 5.3% of all Yellville residents.
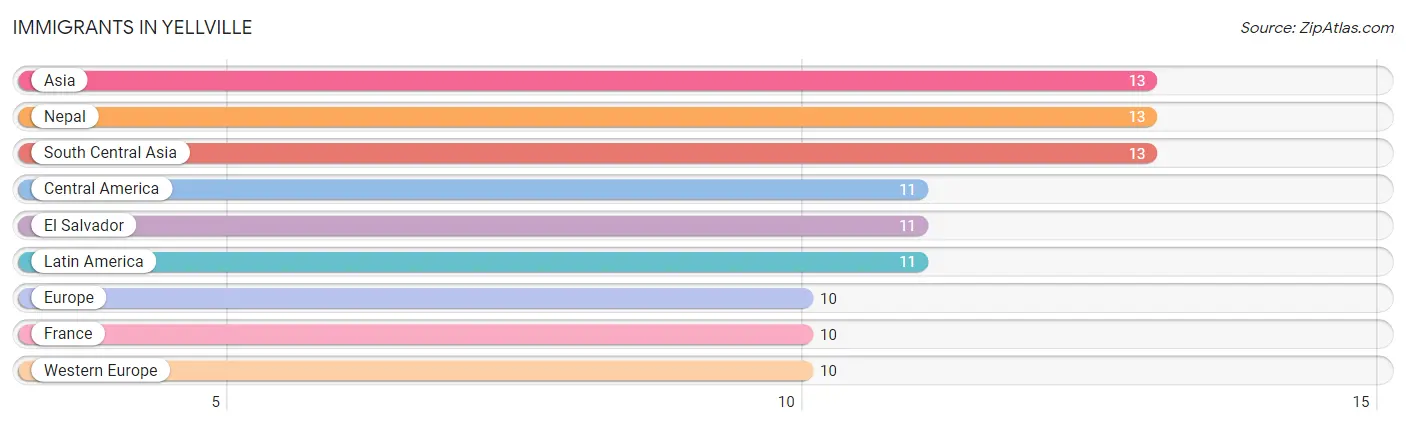
| Immigration Origin | # Population | % Population |
| Asia | 13 | 1.1% |
| Central America | 11 | 0.9% |
| El Salvador | 11 | 0.9% |
| Europe | 10 | 0.9% |
| France | 10 | 0.9% |
| Latin America | 11 | 0.9% |
| Nepal | 13 | 1.1% |
| South Central Asia | 13 | 1.1% |
| Western Europe | 10 | 0.9% | View All 9 Rows |
Sex and Age in Yellville
Sex and Age in Yellville
The most populous age groups in Yellville are 65 to 69 Years (68 | 12.5%) for men and 10 to 14 Years (90 | 14.6%) for women.
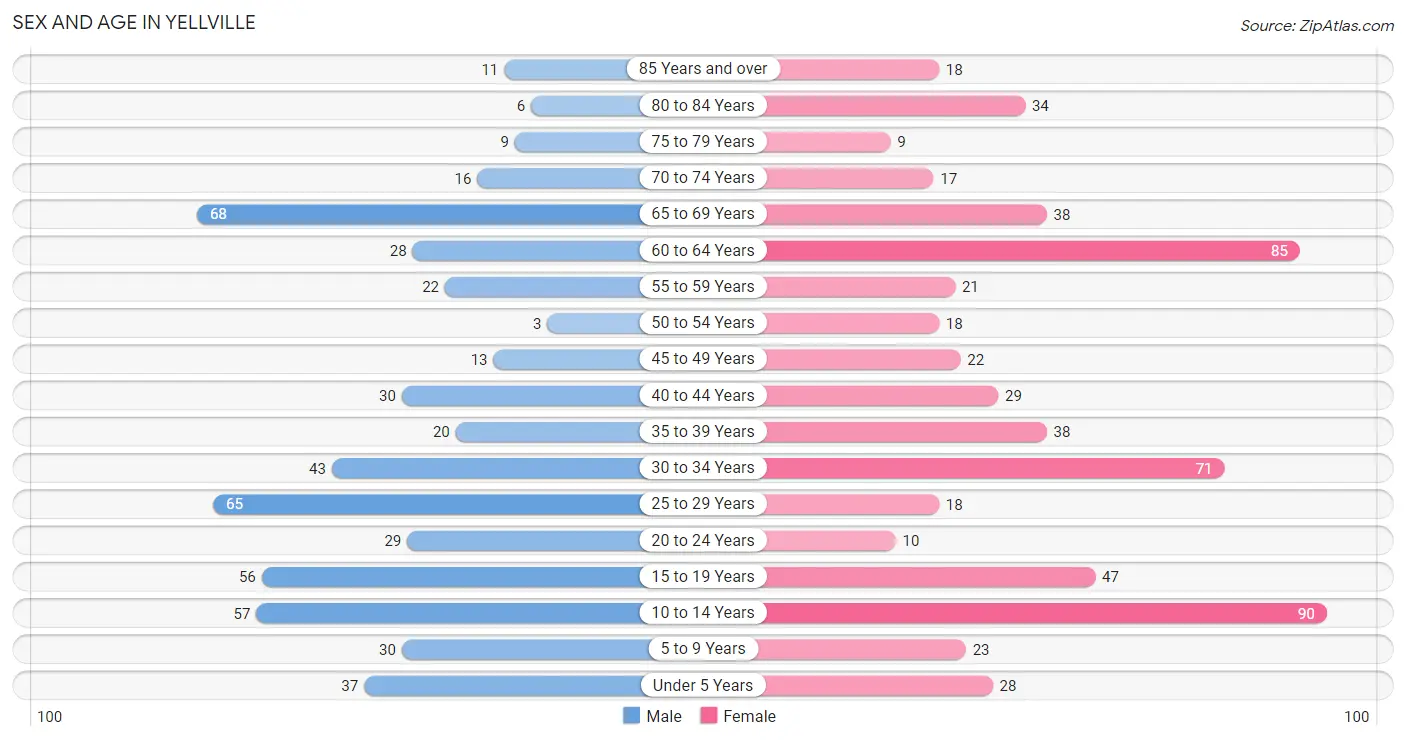
| Age Bracket | Male | Female |
| Under 5 Years | 37 (6.8%) | 28 (4.5%) |
| 5 to 9 Years | 30 (5.5%) | 23 (3.7%) |
| 10 to 14 Years | 57 (10.5%) | 90 (14.6%) |
| 15 to 19 Years | 56 (10.3%) | 47 (7.6%) |
| 20 to 24 Years | 29 (5.3%) | 10 (1.6%) |
| 25 to 29 Years | 65 (12.0%) | 18 (2.9%) |
| 30 to 34 Years | 43 (7.9%) | 71 (11.5%) |
| 35 to 39 Years | 20 (3.7%) | 38 (6.2%) |
| 40 to 44 Years | 30 (5.5%) | 29 (4.7%) |
| 45 to 49 Years | 13 (2.4%) | 22 (3.6%) |
| 50 to 54 Years | 3 (0.5%) | 18 (2.9%) |
| 55 to 59 Years | 22 (4.1%) | 21 (3.4%) |
| 60 to 64 Years | 28 (5.2%) | 85 (13.8%) |
| 65 to 69 Years | 68 (12.5%) | 38 (6.2%) |
| 70 to 74 Years | 16 (2.9%) | 17 (2.8%) |
| 75 to 79 Years | 9 (1.7%) | 9 (1.5%) |
| 80 to 84 Years | 6 (1.1%) | 34 (5.5%) |
| 85 Years and over | 11 (2.0%) | 18 (2.9%) |
| Total | 543 (100.0%) | 616 (100.0%) |
Families and Households in Yellville
Median Family Size in Yellville
The median family size in Yellville is 3.12 persons per family, with single male/father families (18 | 6.5%) accounting for the largest median family size of 3.33 persons per family. On the other hand, married-couple families (187 | 67.3%) represent the smallest median family size with 3.04 persons per family.
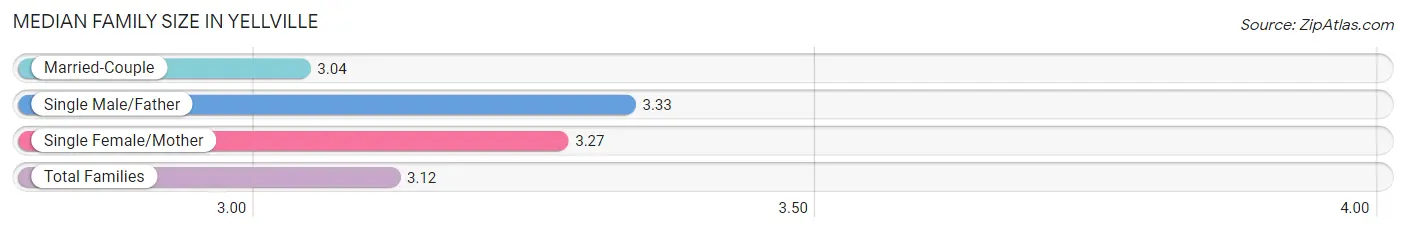
| Family Type | # Families | Family Size |
| Married-Couple | 187 (67.3%) | 3.04 |
| Single Male/Father | 18 (6.5%) | 3.33 |
| Single Female/Mother | 73 (26.3%) | 3.27 |
| Total Families | 278 (100.0%) | 3.12 |
Median Household Size in Yellville
The median household size in Yellville is 2.53 persons per household, with single male/father households (18 | 4.2%) accounting for the largest median household size of 4.5 persons per household. non-family households (149 | 34.9%) represent the smallest median household size with 1.17 persons per household.
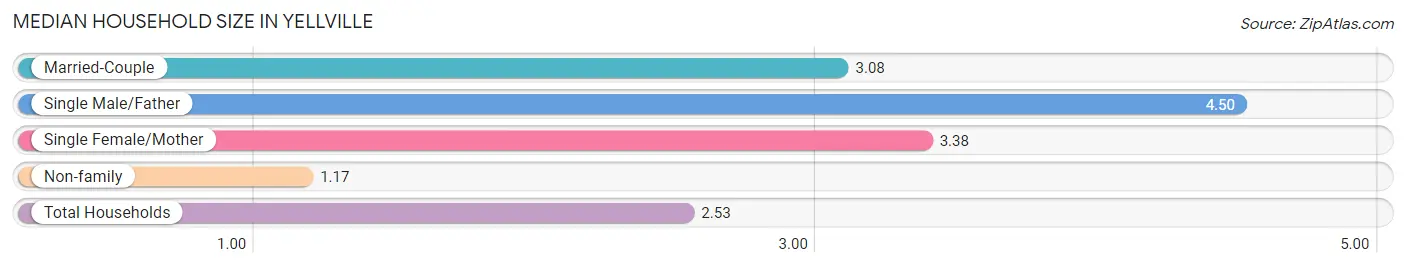
| Household Type | # Households | Household Size |
| Married-Couple | 187 (43.8%) | 3.08 |
| Single Male/Father | 18 (4.2%) | 4.50 |
| Single Female/Mother | 73 (17.1%) | 3.38 |
| Non-family | 149 (34.9%) | 1.17 |
| Total Households | 427 (100.0%) | 2.53 |
Household Size by Marriage Status in Yellville
Out of a total of 427 households in Yellville, 278 (65.1%) are family households, while 149 (34.9%) are nonfamily households. The most numerous type of family households are 2-person households, comprising 147, and the most common type of nonfamily households are 1-person households, comprising 130.
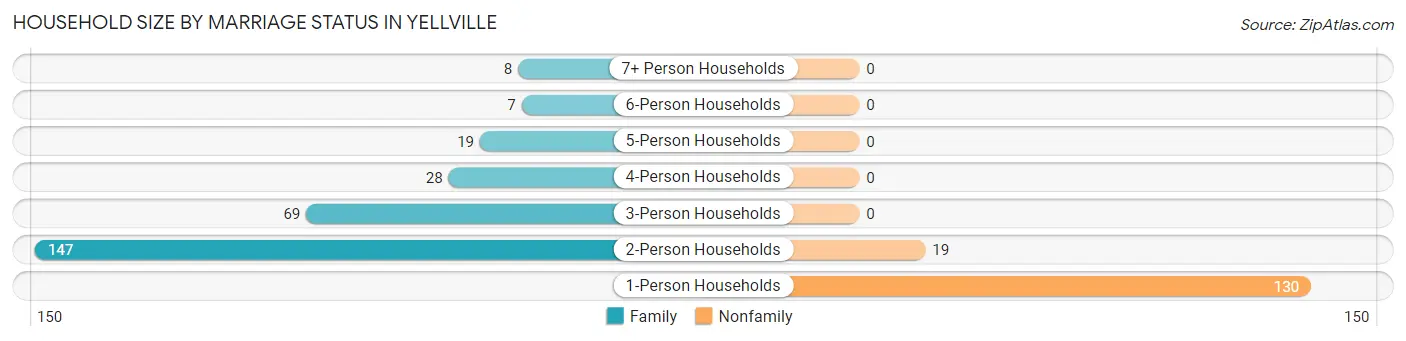
| Household Size | Family Households | Nonfamily Households |
| 1-Person Households | - | 130 (30.4%) |
| 2-Person Households | 147 (34.4%) | 19 (4.4%) |
| 3-Person Households | 69 (16.2%) | 0 (0.0%) |
| 4-Person Households | 28 (6.6%) | 0 (0.0%) |
| 5-Person Households | 19 (4.4%) | 0 (0.0%) |
| 6-Person Households | 7 (1.6%) | 0 (0.0%) |
| 7+ Person Households | 8 (1.9%) | 0 (0.0%) |
| Total | 278 (65.1%) | 149 (34.9%) |
Female Fertility in Yellville
Fertility by Age in Yellville
Average fertility rate in Yellville is 51.0 births per 1,000 women. Women in the age bracket of 15 to 19 years have the highest fertility rate with 191.0 births per 1,000 women. Women in the age bracket of 15 to 19 years acount for 75.0% of all women with births.
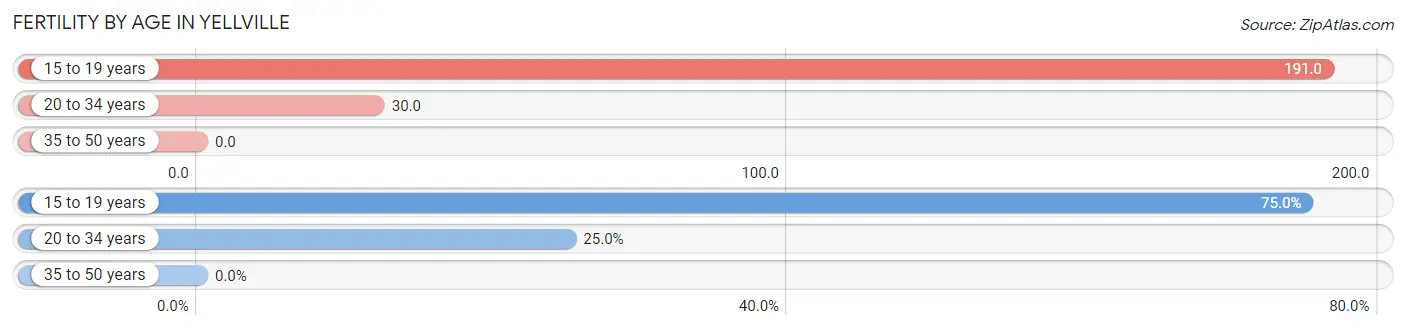
| Age Bracket | Women with Births | Births / 1,000 Women |
| 15 to 19 years | 9 (75.0%) | 191.0 |
| 20 to 34 years | 3 (25.0%) | 30.0 |
| 35 to 50 years | 0 (0.0%) | 0.0 |
| Total | 12 (100.0%) | 51.0 |
Fertility by Age by Marriage Status in Yellville
75.0% of women with births (12) in Yellville are married. The highest percentage of unmarried women with births falls into 20 to 34 years age bracket with 100.0% of them unmarried at the time of birth, while the lowest percentage of unmarried women with births belong to 15 to 19 years age bracket with 0.0% of them unmarried.
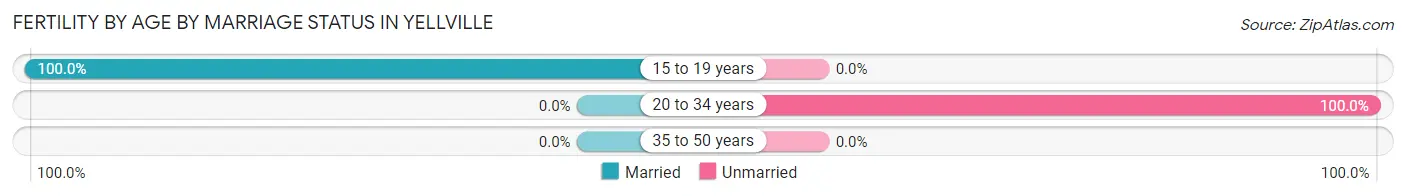
| Age Bracket | Married | Unmarried |
| 15 to 19 years | 9 (100.0%) | 0 (0.0%) |
| 20 to 34 years | 0 (0.0%) | 3 (100.0%) |
| 35 to 50 years | 0 (0.0%) | 0 (0.0%) |
| Total | 9 (75.0%) | 3 (25.0%) |
Fertility by Education in Yellville
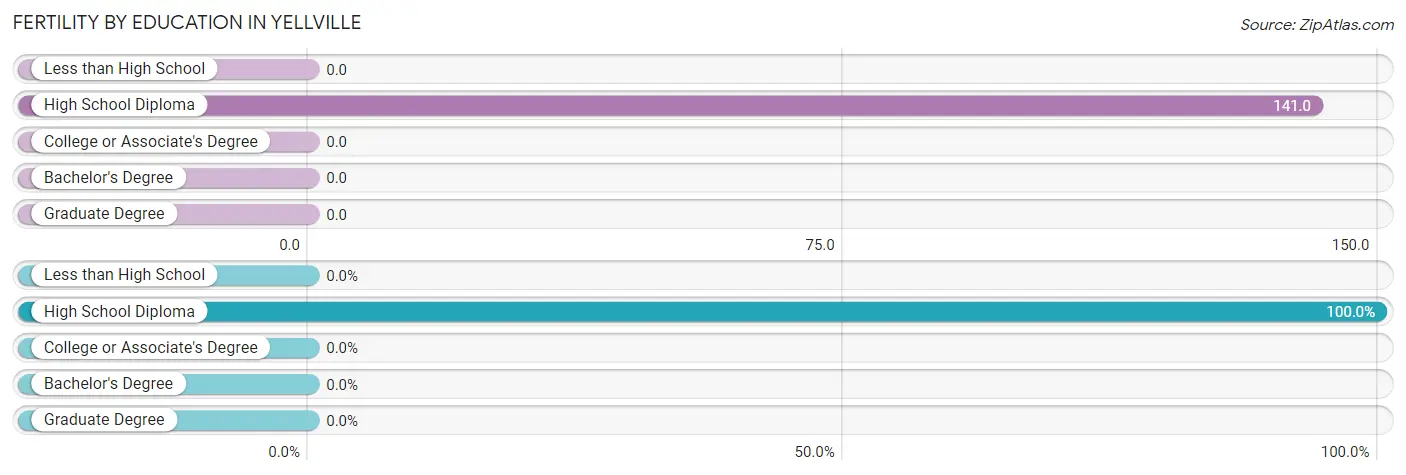
| Educational Attainment | Women with Births | Births / 1,000 Women |
| Less than High School | 0 (0.0%) | 0.0 |
| High School Diploma | 12 (100.0%) | 141.0 |
| College or Associate's Degree | 0 (0.0%) | 0.0 |
| Bachelor's Degree | 0 (0.0%) | 0.0 |
| Graduate Degree | 0 (0.0%) | 0.0 |
| Total | 12 (100.0%) | 51.0 |
Fertility by Education by Marriage Status in Yellville
25.0% of women with births in Yellville are unmarried. Women with the educational attainment of high school diploma are most likely to be married with 75.0% of them married at childbirth, while women with the educational attainment of high school diploma are least likely to be married with 25.0% of them unmarried at childbirth.
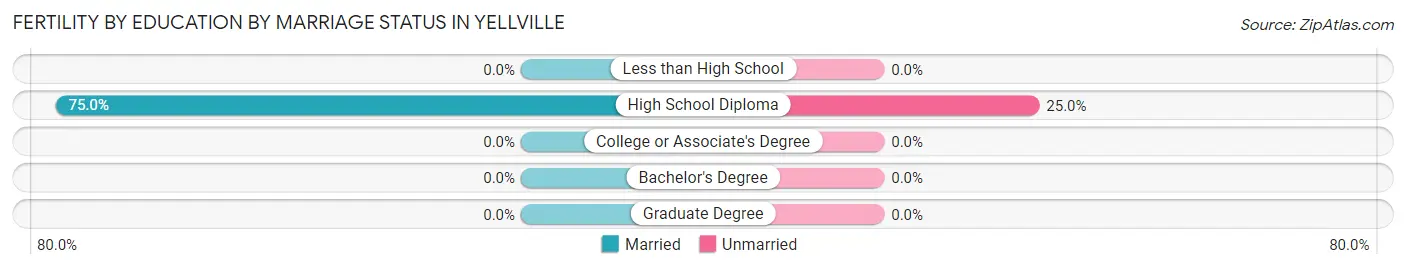
| Educational Attainment | Married | Unmarried |
| Less than High School | 0 (0.0%) | 0 (0.0%) |
| High School Diploma | 9 (75.0%) | 3 (25.0%) |
| College or Associate's Degree | 0 (0.0%) | 0 (0.0%) |
| Bachelor's Degree | 0 (0.0%) | 0 (0.0%) |
| Graduate Degree | 0 (0.0%) | 0 (0.0%) |
| Total | 9 (75.0%) | 3 (25.0%) |
Employment Characteristics in Yellville
Employment by Class of Employer in Yellville
Among the 419 employed individuals in Yellville, private company employees (274 | 65.4%), state government employees (56 | 13.4%), and self-employed (not incorporated) (34 | 8.1%) make up the most common classes of employment.
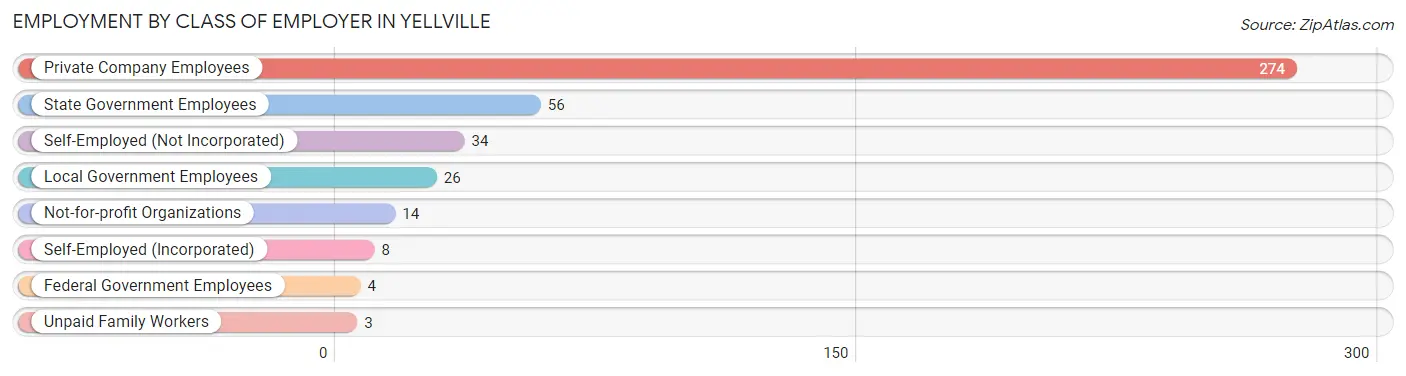
| Employer Class | # Employees | % Employees |
| Private Company Employees | 274 | 65.4% |
| Self-Employed (Incorporated) | 8 | 1.9% |
| Self-Employed (Not Incorporated) | 34 | 8.1% |
| Not-for-profit Organizations | 14 | 3.3% |
| Local Government Employees | 26 | 6.2% |
| State Government Employees | 56 | 13.4% |
| Federal Government Employees | 4 | 0.9% |
| Unpaid Family Workers | 3 | 0.7% |
| Total | 419 | 100.0% |
Employment Status by Age in Yellville
According to the labor force statistics for Yellville, out of the total population over 16 years of age (883), 54.2% or 479 individuals are in the labor force, with 12.5% or 60 of them unemployed. The age group with the highest labor force participation rate is 35 to 44 years, with 89.7% or 105 individuals in the labor force. Within the labor force, the 20 to 24 years age range has the highest percentage of unemployed individuals, with 65.5% or 19 of them being unemployed.
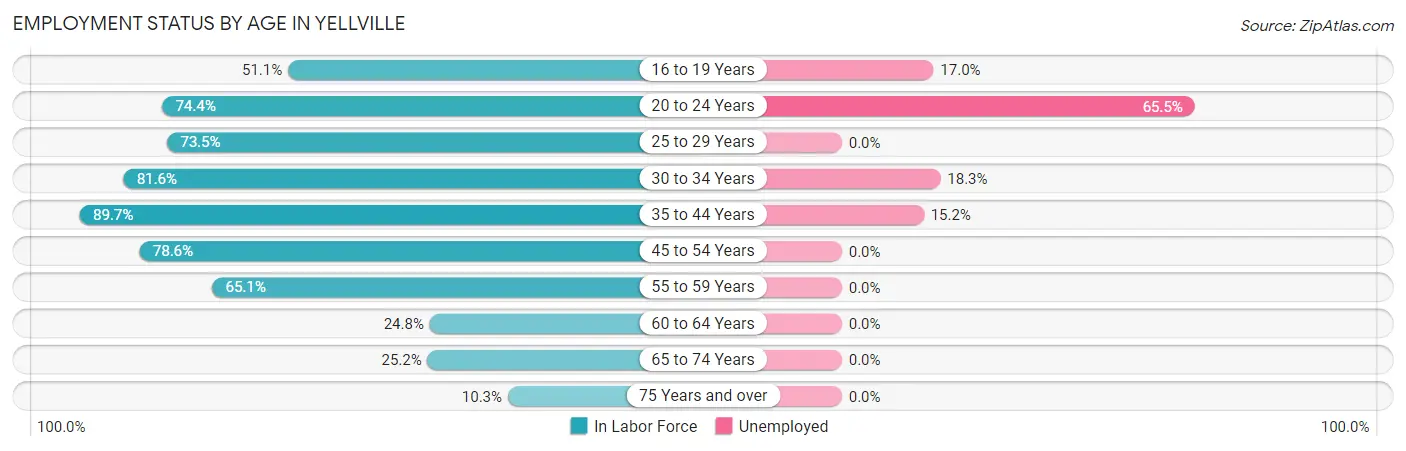
| Age Bracket | In Labor Force | Unemployed |
| 16 to 19 Years | 47 (51.1%) | 8 (17.0%) |
| 20 to 24 Years | 29 (74.4%) | 19 (65.5%) |
| 25 to 29 Years | 61 (73.5%) | 0 (0.0%) |
| 30 to 34 Years | 93 (81.6%) | 17 (18.3%) |
| 35 to 44 Years | 105 (89.7%) | 16 (15.2%) |
| 45 to 54 Years | 44 (78.6%) | 0 (0.0%) |
| 55 to 59 Years | 28 (65.1%) | 0 (0.0%) |
| 60 to 64 Years | 28 (24.8%) | 0 (0.0%) |
| 65 to 74 Years | 35 (25.2%) | 0 (0.0%) |
| 75 Years and over | 9 (10.3%) | 0 (0.0%) |
| Total | 479 (54.2%) | 60 (12.5%) |
Employment Status by Educational Attainment in Yellville
According to labor force statistics for Yellville, 68.3% of individuals (359) out of the total population between 25 and 64 years of age (526) are in the labor force, with 9.2% or 33 of them being unemployed. The group with the highest labor force participation rate are those with the educational attainment of bachelor's degree or higher, with 87.5% or 49 individuals in the labor force. Within the labor force, individuals with high school diploma education have the highest percentage of unemployment, with 14.3% or 15 of them being unemployed.
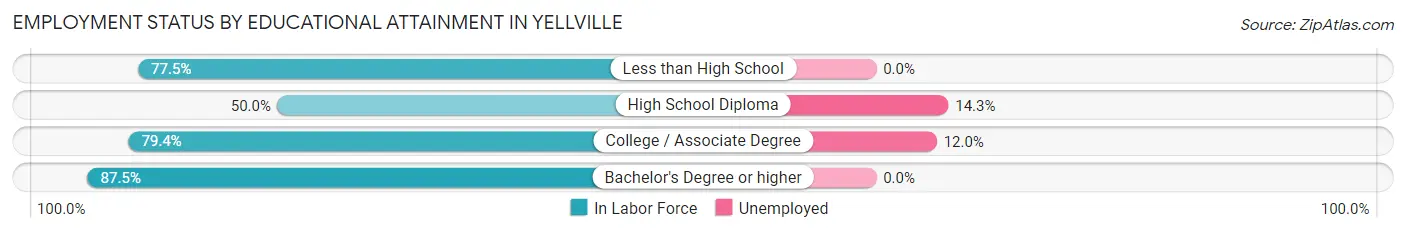
| Educational Attainment | In Labor Force | Unemployed |
| Less than High School | 55 (77.5%) | 0 (0.0%) |
| High School Diploma | 105 (50.0%) | 30 (14.3%) |
| College / Associate Degree | 150 (79.4%) | 23 (12.0%) |
| Bachelor's Degree or higher | 49 (87.5%) | 0 (0.0%) |
| Total | 359 (68.3%) | 48 (9.2%) |
Employment Occupations by Sex in Yellville
Management, Business, Science and Arts Occupations
The most common Management, Business, Science and Arts occupations in Yellville are Community & Social Service (56 | 13.4%), Education Instruction & Library (43 | 10.3%), Management (16 | 3.8%), Arts, Media & Entertainment (12 | 2.9%), and Health Diagnosing & Treating (12 | 2.9%).
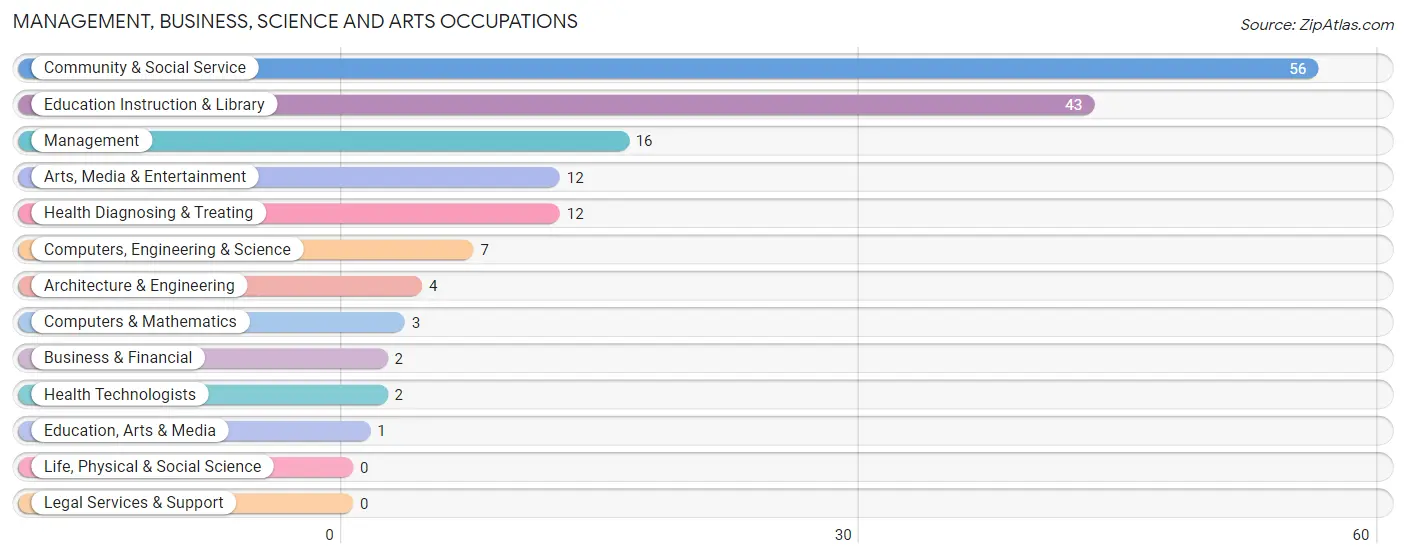
Management, Business, Science and Arts Occupations by Sex
Within the Management, Business, Science and Arts occupations in Yellville, the most male-oriented occupations are Management (100.0%), Computers & Mathematics (100.0%), and Education, Arts & Media (100.0%), while the most female-oriented occupations are Business & Financial (100.0%), Architecture & Engineering (100.0%), and Health Diagnosing & Treating (100.0%).
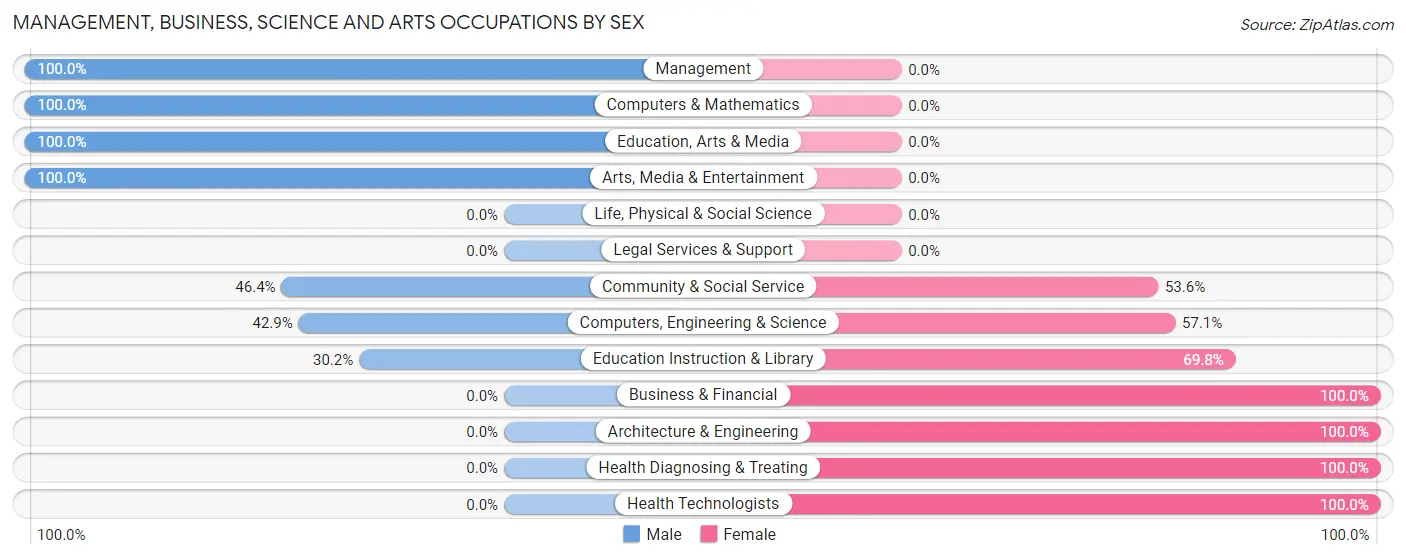
| Occupation | Male | Female |
| Management | 16 (100.0%) | 0 (0.0%) |
| Business & Financial | 0 (0.0%) | 2 (100.0%) |
| Computers, Engineering & Science | 3 (42.9%) | 4 (57.1%) |
| Computers & Mathematics | 3 (100.0%) | 0 (0.0%) |
| Architecture & Engineering | 0 (0.0%) | 4 (100.0%) |
| Life, Physical & Social Science | 0 (0.0%) | 0 (0.0%) |
| Community & Social Service | 26 (46.4%) | 30 (53.6%) |
| Education, Arts & Media | 1 (100.0%) | 0 (0.0%) |
| Legal Services & Support | 0 (0.0%) | 0 (0.0%) |
| Education Instruction & Library | 13 (30.2%) | 30 (69.8%) |
| Arts, Media & Entertainment | 12 (100.0%) | 0 (0.0%) |
| Health Diagnosing & Treating | 0 (0.0%) | 12 (100.0%) |
| Health Technologists | 0 (0.0%) | 2 (100.0%) |
| Total (Category) | 45 (48.4%) | 48 (51.6%) |
| Total (Overall) | 224 (53.5%) | 195 (46.5%) |
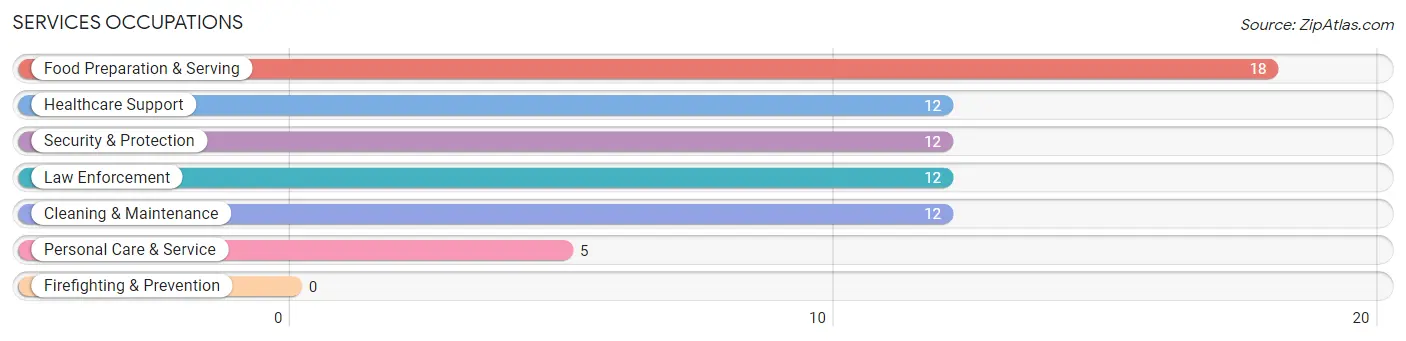
Services Occupations
The most common Services occupations in Yellville are Food Preparation & Serving (18 | 4.3%), Healthcare Support (12 | 2.9%), Security & Protection (12 | 2.9%), Law Enforcement (12 | 2.9%), and Cleaning & Maintenance (12 | 2.9%).
Services Occupations by Sex
Within the Services occupations in Yellville, the most male-oriented occupations are Food Preparation & Serving (83.3%), Security & Protection (25.0%), and Law Enforcement (25.0%), while the most female-oriented occupations are Healthcare Support (100.0%), Cleaning & Maintenance (100.0%), and Personal Care & Service (100.0%).
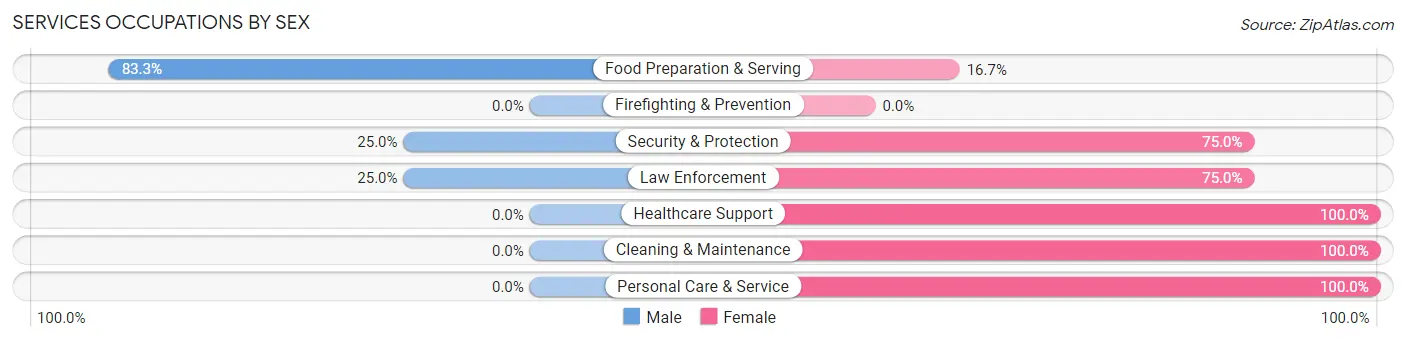
| Occupation | Male | Female |
| Healthcare Support | 0 (0.0%) | 12 (100.0%) |
| Security & Protection | 3 (25.0%) | 9 (75.0%) |
| Firefighting & Prevention | 0 (0.0%) | 0 (0.0%) |
| Law Enforcement | 3 (25.0%) | 9 (75.0%) |
| Food Preparation & Serving | 15 (83.3%) | 3 (16.7%) |
| Cleaning & Maintenance | 0 (0.0%) | 12 (100.0%) |
| Personal Care & Service | 0 (0.0%) | 5 (100.0%) |
| Total (Category) | 18 (30.5%) | 41 (69.5%) |
| Total (Overall) | 224 (53.5%) | 195 (46.5%) |
Sales and Office Occupations
The most common Sales and Office occupations in Yellville are Sales & Related (49 | 11.7%), and Office & Administration (49 | 11.7%).
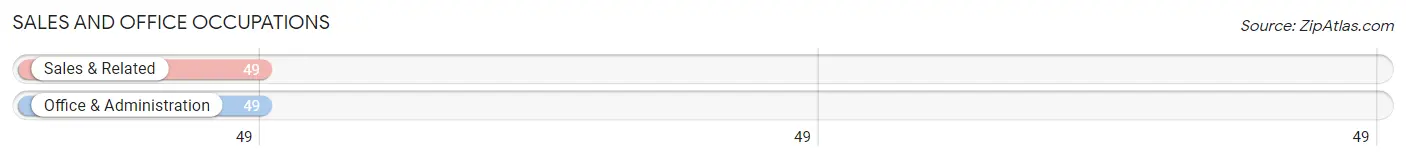
Sales and Office Occupations by Sex
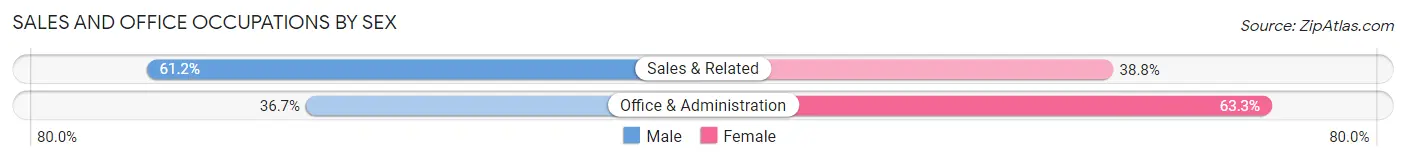
| Occupation | Male | Female |
| Sales & Related | 30 (61.2%) | 19 (38.8%) |
| Office & Administration | 18 (36.7%) | 31 (63.3%) |
| Total (Category) | 48 (49.0%) | 50 (51.0%) |
| Total (Overall) | 224 (53.5%) | 195 (46.5%) |
Natural Resources, Construction and Maintenance Occupations
The most common Natural Resources, Construction and Maintenance occupations in Yellville are Construction & Extraction (15 | 3.6%), Installation, Maintenance & Repair (11 | 2.6%), and Farming, Fishing & Forestry (3 | 0.7%).
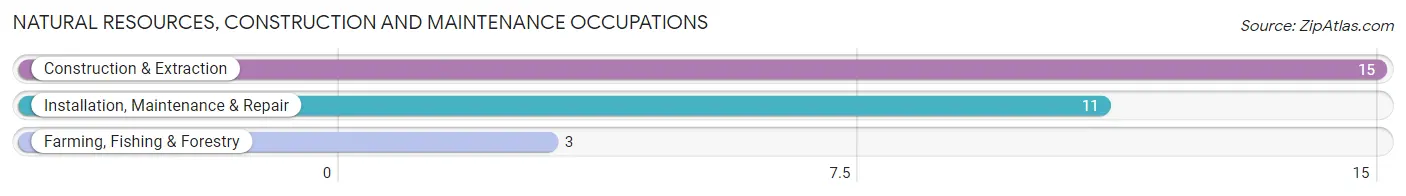
Natural Resources, Construction and Maintenance Occupations by Sex
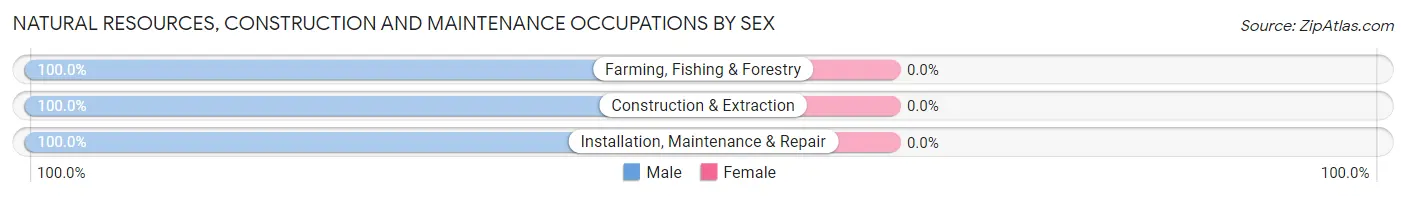
| Occupation | Male | Female |
| Farming, Fishing & Forestry | 3 (100.0%) | 0 (0.0%) |
| Construction & Extraction | 15 (100.0%) | 0 (0.0%) |
| Installation, Maintenance & Repair | 11 (100.0%) | 0 (0.0%) |
| Total (Category) | 29 (100.0%) | 0 (0.0%) |
| Total (Overall) | 224 (53.5%) | 195 (46.5%) |
Production, Transportation and Moving Occupations
The most common Production, Transportation and Moving occupations in Yellville are Production (93 | 22.2%), Material Moving (43 | 10.3%), and Transportation (4 | 0.9%).
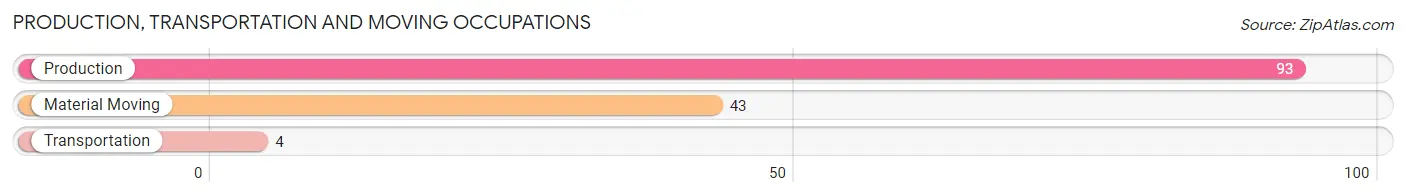
Production, Transportation and Moving Occupations by Sex
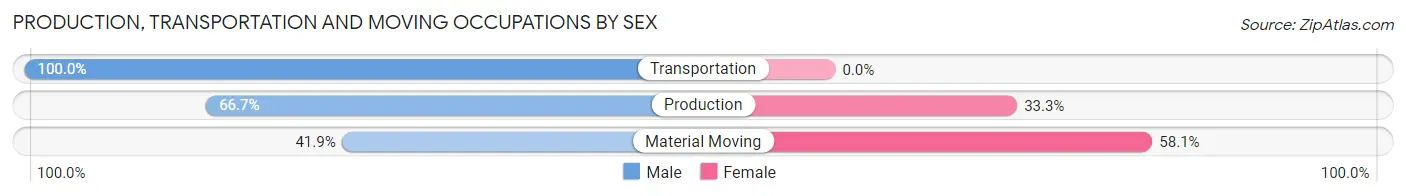
| Occupation | Male | Female |
| Production | 62 (66.7%) | 31 (33.3%) |
| Transportation | 4 (100.0%) | 0 (0.0%) |
| Material Moving | 18 (41.9%) | 25 (58.1%) |
| Total (Category) | 84 (60.0%) | 56 (40.0%) |
| Total (Overall) | 224 (53.5%) | 195 (46.5%) |
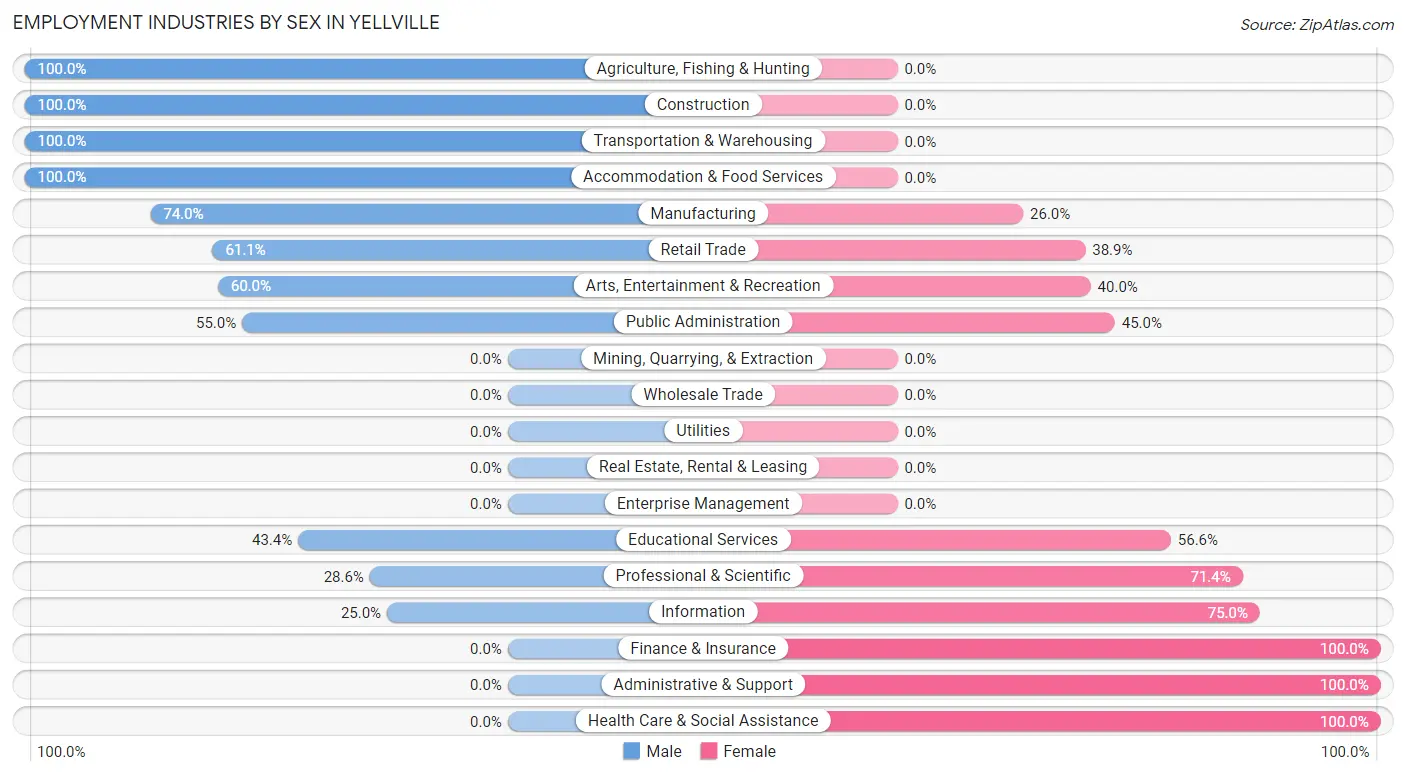
Employment Industries by Sex in Yellville
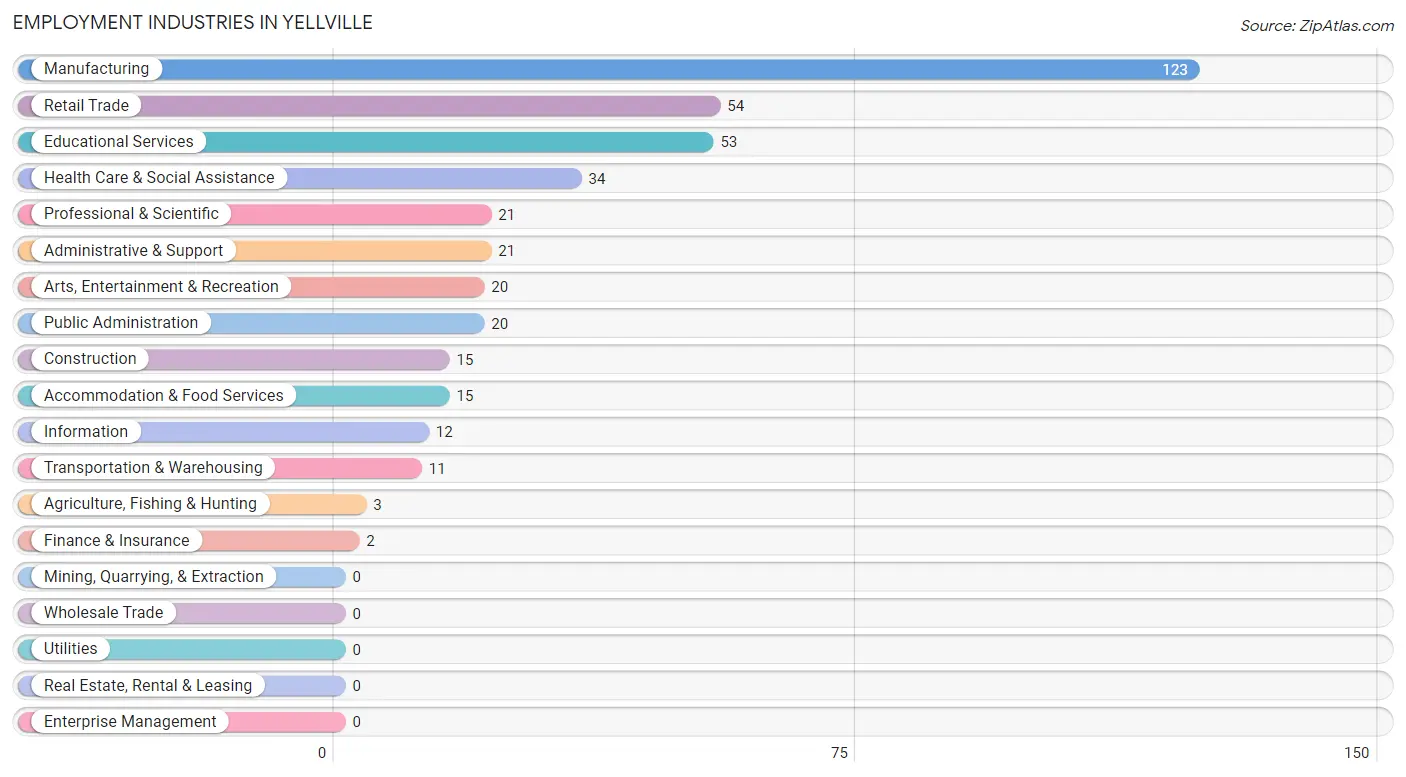
Employment Industries in Yellville
The major employment industries in Yellville include Manufacturing (123 | 29.4%), Retail Trade (54 | 12.9%), Educational Services (53 | 12.7%), Health Care & Social Assistance (34 | 8.1%), and Professional & Scientific (21 | 5.0%).
Employment Industries by Sex in Yellville
The Yellville industries that see more men than women are Agriculture, Fishing & Hunting (100.0%), Construction (100.0%), and Transportation & Warehousing (100.0%), whereas the industries that tend to have a higher number of women are Finance & Insurance (100.0%), Administrative & Support (100.0%), and Health Care & Social Assistance (100.0%).
| Industry | Male | Female |
| Agriculture, Fishing & Hunting | 3 (100.0%) | 0 (0.0%) |
| Mining, Quarrying, & Extraction | 0 (0.0%) | 0 (0.0%) |
| Construction | 15 (100.0%) | 0 (0.0%) |
| Manufacturing | 91 (74.0%) | 32 (26.0%) |
| Wholesale Trade | 0 (0.0%) | 0 (0.0%) |
| Retail Trade | 33 (61.1%) | 21 (38.9%) |
| Transportation & Warehousing | 11 (100.0%) | 0 (0.0%) |
| Utilities | 0 (0.0%) | 0 (0.0%) |
| Information | 3 (25.0%) | 9 (75.0%) |
| Finance & Insurance | 0 (0.0%) | 2 (100.0%) |
| Real Estate, Rental & Leasing | 0 (0.0%) | 0 (0.0%) |
| Professional & Scientific | 6 (28.6%) | 15 (71.4%) |
| Enterprise Management | 0 (0.0%) | 0 (0.0%) |
| Administrative & Support | 0 (0.0%) | 21 (100.0%) |
| Educational Services | 23 (43.4%) | 30 (56.6%) |
| Health Care & Social Assistance | 0 (0.0%) | 34 (100.0%) |
| Arts, Entertainment & Recreation | 12 (60.0%) | 8 (40.0%) |
| Accommodation & Food Services | 15 (100.0%) | 0 (0.0%) |
| Public Administration | 11 (55.0%) | 9 (45.0%) |
| Total | 224 (53.5%) | 195 (46.5%) |
Education in Yellville
School Enrollment in Yellville
The most common levels of schooling among the 278 students in Yellville are middle school (115 | 41.4%), high school (70 | 25.2%), and elementary school (51 | 18.3%).
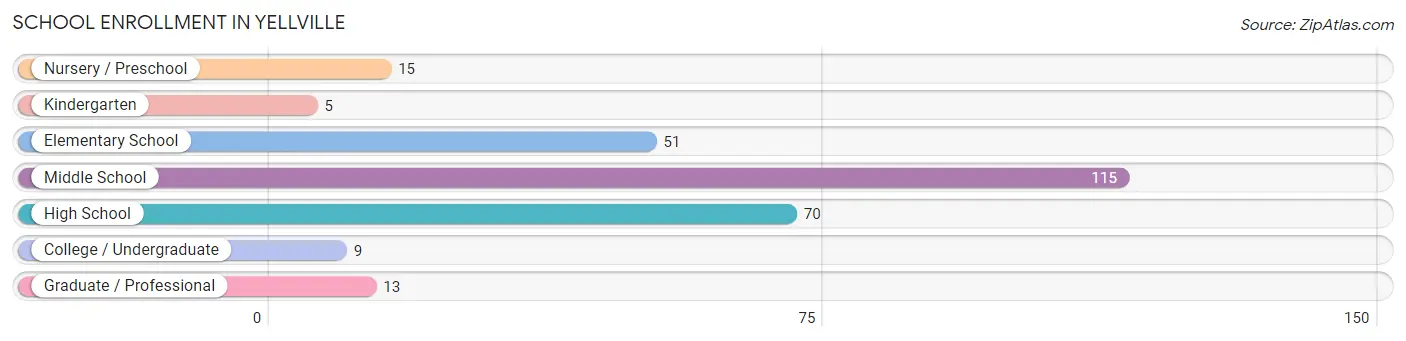
| School Level | # Students | % Students |
| Nursery / Preschool | 15 | 5.4% |
| Kindergarten | 5 | 1.8% |
| Elementary School | 51 | 18.3% |
| Middle School | 115 | 41.4% |
| High School | 70 | 25.2% |
| College / Undergraduate | 9 | 3.2% |
| Graduate / Professional | 13 | 4.7% |
| Total | 278 | 100.0% |
School Enrollment by Age by Funding Source in Yellville
Out of a total of 278 students who are enrolled in schools in Yellville, 14 (5.0%) attend a private institution, while the remaining 264 (95.0%) are enrolled in public schools. The age group of 20 to 24 year olds has the highest likelihood of being enrolled in private schools, with 6 (66.7% in the age bracket) enrolled. Conversely, the age group of 3 to 4 year olds has the lowest likelihood of being enrolled in a private school, with 9 (100.0% in the age bracket) attending a public institution.
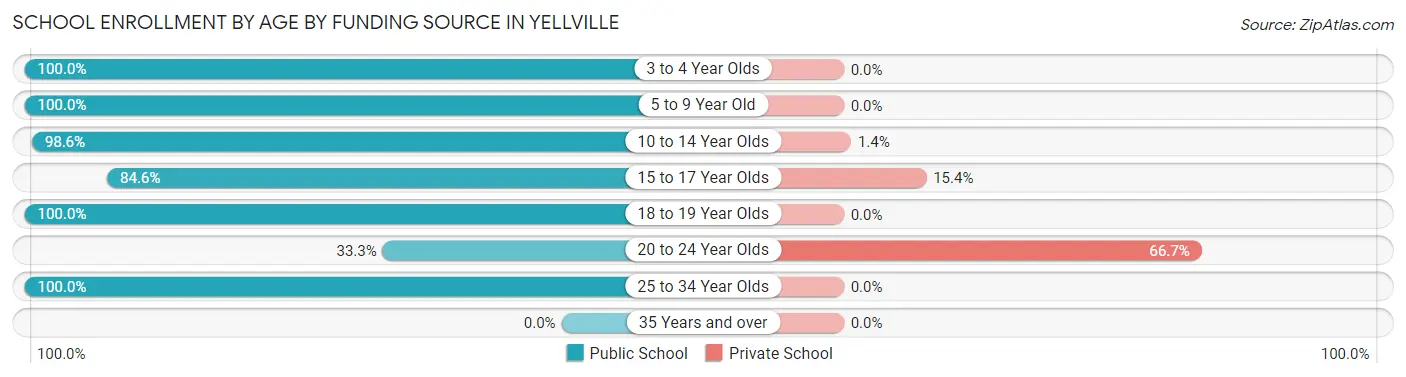
| Age Bracket | Public School | Private School |
| 3 to 4 Year Olds | 9 (100.0%) | 0 (0.0%) |
| 5 to 9 Year Old | 53 (100.0%) | 0 (0.0%) |
| 10 to 14 Year Olds | 145 (98.6%) | 2 (1.4%) |
| 15 to 17 Year Olds | 33 (84.6%) | 6 (15.4%) |
| 18 to 19 Year Olds | 8 (100.0%) | 0 (0.0%) |
| 20 to 24 Year Olds | 3 (33.3%) | 6 (66.7%) |
| 25 to 34 Year Olds | 13 (100.0%) | 0 (0.0%) |
| 35 Years and over | 0 (0.0%) | 0 (0.0%) |
| Total | 264 (95.0%) | 14 (5.0%) |
Educational Attainment by Field of Study in Yellville
Education (39 | 44.8%), physical & health sciences (17 | 19.5%), arts & humanities (8 | 9.2%), science & technology (7 | 8.1%), and social sciences (4 | 4.6%) are the most common fields of study among 87 individuals in Yellville who have obtained a bachelor's degree or higher.
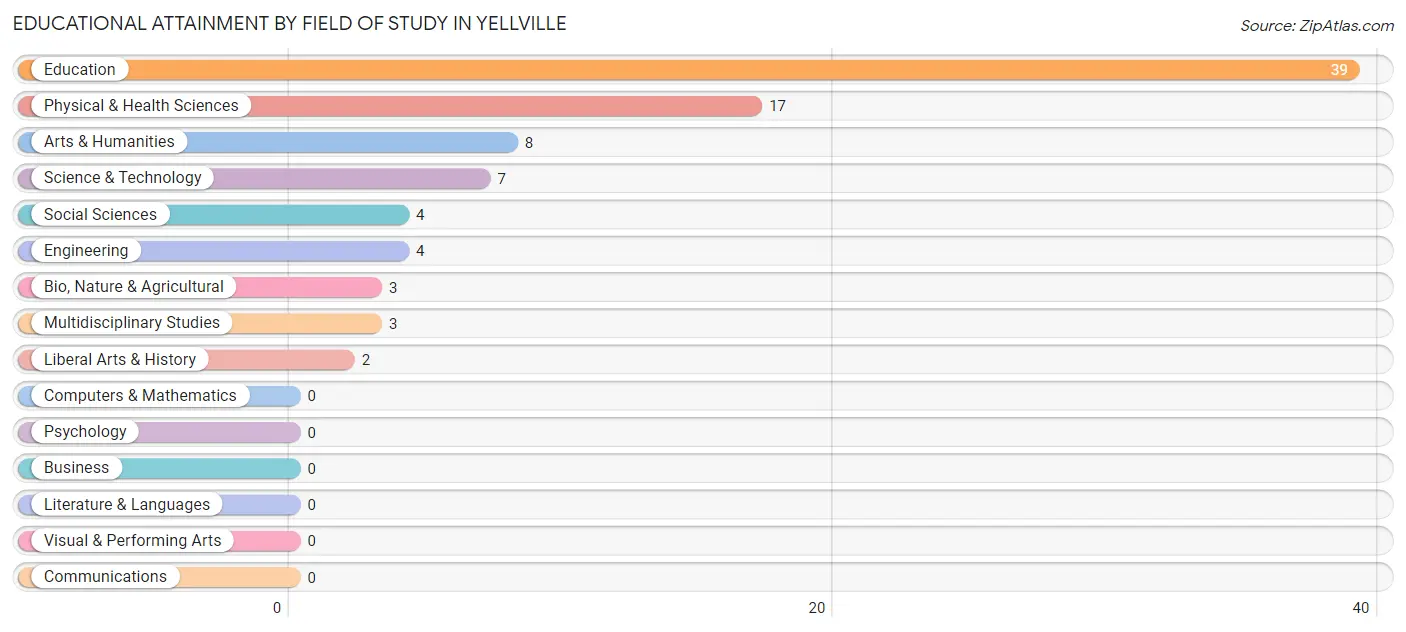
| Field of Study | # Graduates | % Graduates |
| Computers & Mathematics | 0 | 0.0% |
| Bio, Nature & Agricultural | 3 | 3.5% |
| Physical & Health Sciences | 17 | 19.5% |
| Psychology | 0 | 0.0% |
| Social Sciences | 4 | 4.6% |
| Engineering | 4 | 4.6% |
| Multidisciplinary Studies | 3 | 3.5% |
| Science & Technology | 7 | 8.1% |
| Business | 0 | 0.0% |
| Education | 39 | 44.8% |
| Literature & Languages | 0 | 0.0% |
| Liberal Arts & History | 2 | 2.3% |
| Visual & Performing Arts | 0 | 0.0% |
| Communications | 0 | 0.0% |
| Arts & Humanities | 8 | 9.2% |
| Total | 87 | 100.0% |
Transportation & Commute in Yellville
Vehicle Availability by Sex in Yellville
The most prevalent vehicle ownership categories in Yellville are males with 3 vehicles (71, accounting for 31.7%) and females with 3 vehicles (16, making up 40.1%).
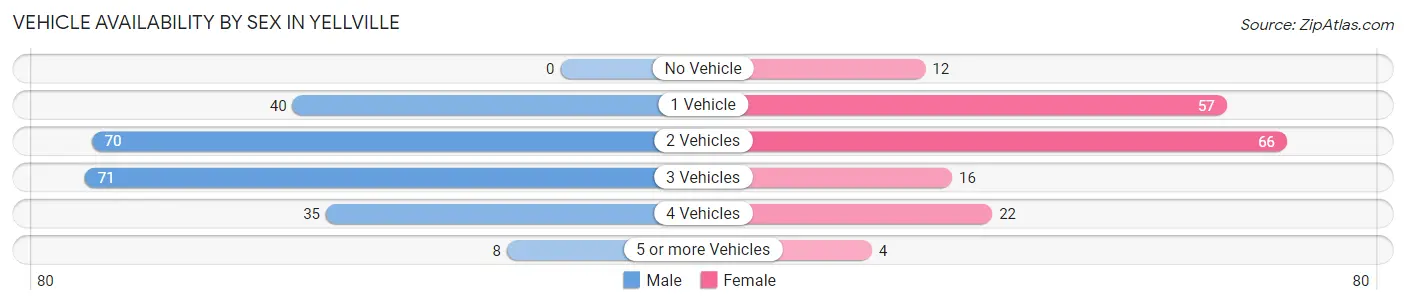
| Vehicles Available | Male | Female |
| No Vehicle | 0 (0.0%) | 12 (6.8%) |
| 1 Vehicle | 40 (17.9%) | 57 (32.2%) |
| 2 Vehicles | 70 (31.2%) | 66 (37.3%) |
| 3 Vehicles | 71 (31.7%) | 16 (9.0%) |
| 4 Vehicles | 35 (15.6%) | 22 (12.4%) |
| 5 or more Vehicles | 8 (3.6%) | 4 (2.3%) |
| Total | 224 (100.0%) | 177 (100.0%) |
Commute Time in Yellville
The most frequently occuring commute durations in Yellville are less than 5 minutes (100 commuters, 26.1%), 5 to 9 minutes (74 commuters, 19.3%), and 30 to 34 minutes (60 commuters, 15.7%).
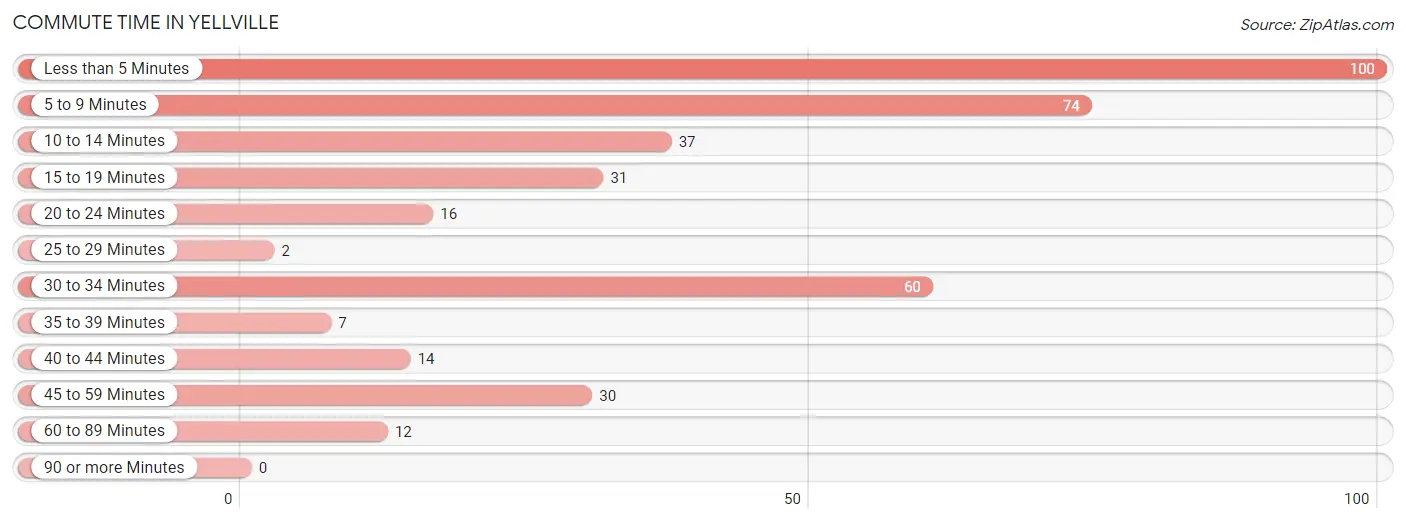
| Commute Time | # Commuters | % Commuters |
| Less than 5 Minutes | 100 | 26.1% |
| 5 to 9 Minutes | 74 | 19.3% |
| 10 to 14 Minutes | 37 | 9.7% |
| 15 to 19 Minutes | 31 | 8.1% |
| 20 to 24 Minutes | 16 | 4.2% |
| 25 to 29 Minutes | 2 | 0.5% |
| 30 to 34 Minutes | 60 | 15.7% |
| 35 to 39 Minutes | 7 | 1.8% |
| 40 to 44 Minutes | 14 | 3.7% |
| 45 to 59 Minutes | 30 | 7.8% |
| 60 to 89 Minutes | 12 | 3.1% |
| 90 or more Minutes | 0 | 0.0% |
Commute Time by Sex in Yellville
The most common commute times in Yellville are less than 5 minutes (40 commuters, 19.6%) for males and less than 5 minutes (60 commuters, 33.5%) for females.
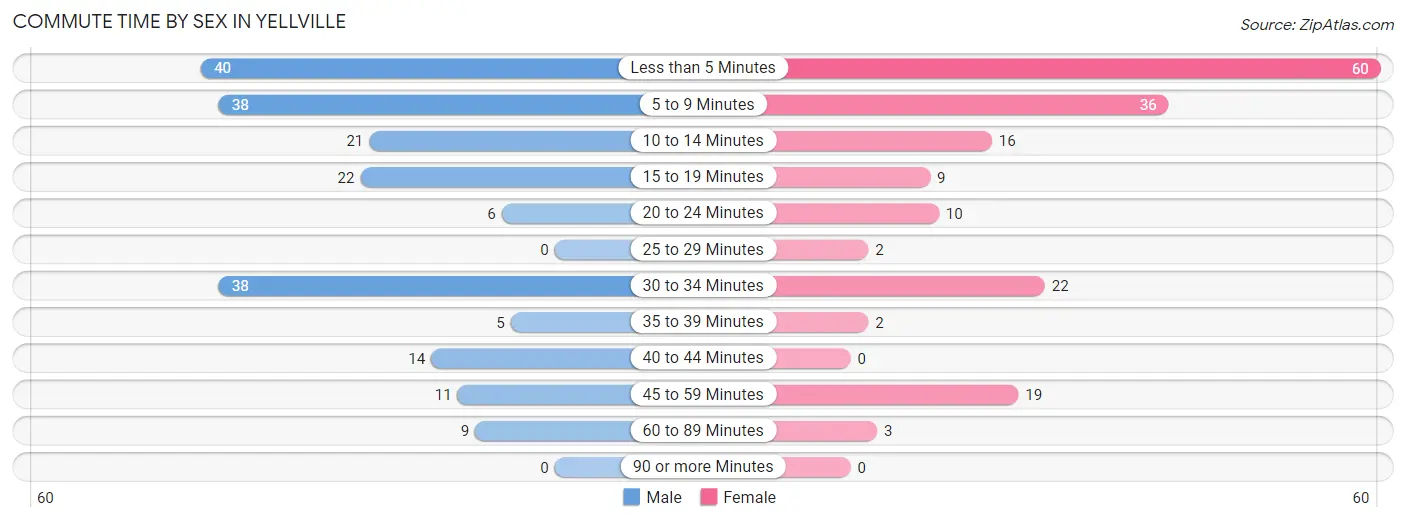
| Commute Time | Male | Female |
| Less than 5 Minutes | 40 (19.6%) | 60 (33.5%) |
| 5 to 9 Minutes | 38 (18.6%) | 36 (20.1%) |
| 10 to 14 Minutes | 21 (10.3%) | 16 (8.9%) |
| 15 to 19 Minutes | 22 (10.8%) | 9 (5.0%) |
| 20 to 24 Minutes | 6 (2.9%) | 10 (5.6%) |
| 25 to 29 Minutes | 0 (0.0%) | 2 (1.1%) |
| 30 to 34 Minutes | 38 (18.6%) | 22 (12.3%) |
| 35 to 39 Minutes | 5 (2.5%) | 2 (1.1%) |
| 40 to 44 Minutes | 14 (6.9%) | 0 (0.0%) |
| 45 to 59 Minutes | 11 (5.4%) | 19 (10.6%) |
| 60 to 89 Minutes | 9 (4.4%) | 3 (1.7%) |
| 90 or more Minutes | 0 (0.0%) | 0 (0.0%) |
Time of Departure to Work by Sex in Yellville
The most frequent times of departure to work in Yellville are 12:00 PM to 3:59 PM (43, 21.1%) for males and 7:30 AM to 7:59 AM (52, 29.0%) for females.
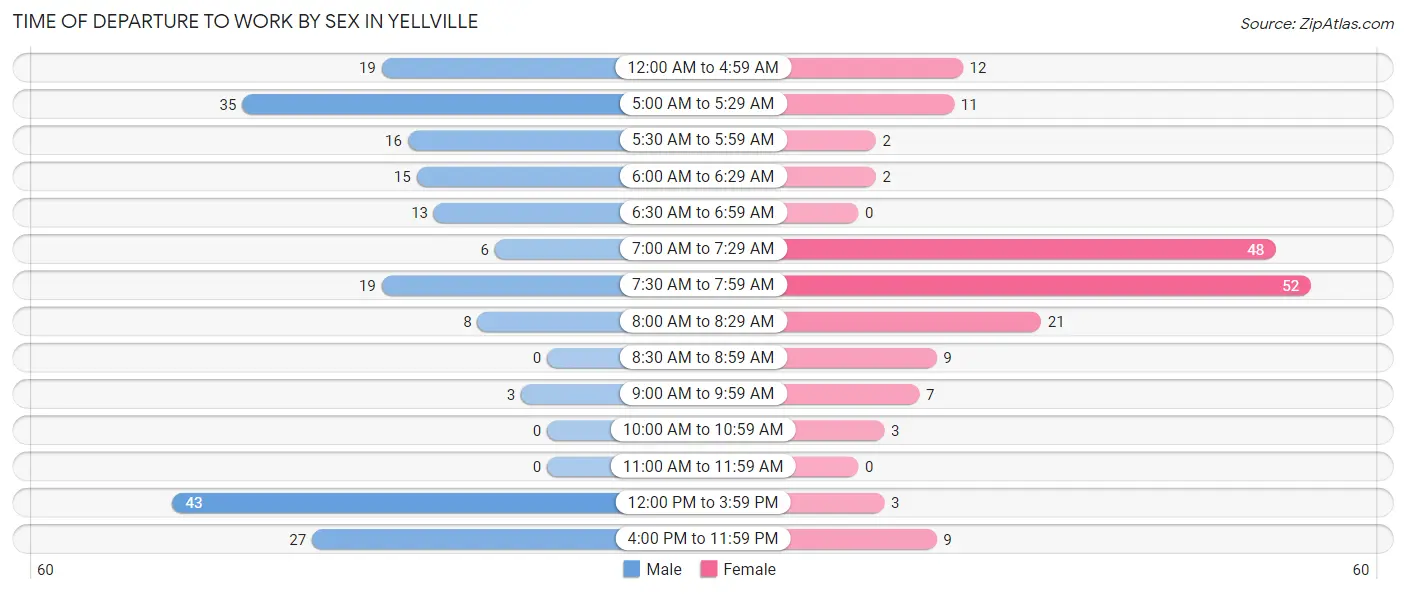
| Time of Departure | Male | Female |
| 12:00 AM to 4:59 AM | 19 (9.3%) | 12 (6.7%) |
| 5:00 AM to 5:29 AM | 35 (17.2%) | 11 (6.1%) |
| 5:30 AM to 5:59 AM | 16 (7.8%) | 2 (1.1%) |
| 6:00 AM to 6:29 AM | 15 (7.3%) | 2 (1.1%) |
| 6:30 AM to 6:59 AM | 13 (6.4%) | 0 (0.0%) |
| 7:00 AM to 7:29 AM | 6 (2.9%) | 48 (26.8%) |
| 7:30 AM to 7:59 AM | 19 (9.3%) | 52 (29.0%) |
| 8:00 AM to 8:29 AM | 8 (3.9%) | 21 (11.7%) |
| 8:30 AM to 8:59 AM | 0 (0.0%) | 9 (5.0%) |
| 9:00 AM to 9:59 AM | 3 (1.5%) | 7 (3.9%) |
| 10:00 AM to 10:59 AM | 0 (0.0%) | 3 (1.7%) |
| 11:00 AM to 11:59 AM | 0 (0.0%) | 0 (0.0%) |
| 12:00 PM to 3:59 PM | 43 (21.1%) | 3 (1.7%) |
| 4:00 PM to 11:59 PM | 27 (13.2%) | 9 (5.0%) |
| Total | 204 (100.0%) | 179 (100.0%) |
Housing Occupancy in Yellville
Occupancy by Ownership in Yellville
Of the total 427 dwellings in Yellville, owner-occupied units account for 252 (59.0%), while renter-occupied units make up 175 (41.0%).
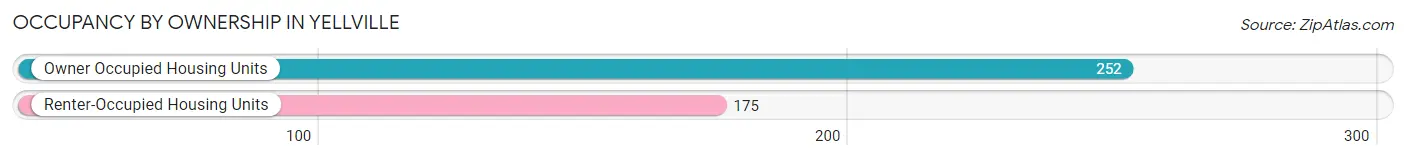
| Occupancy | # Housing Units | % Housing Units |
| Owner Occupied Housing Units | 252 | 59.0% |
| Renter-Occupied Housing Units | 175 | 41.0% |
| Total Occupied Housing Units | 427 | 100.0% |
Occupancy by Household Size in Yellville
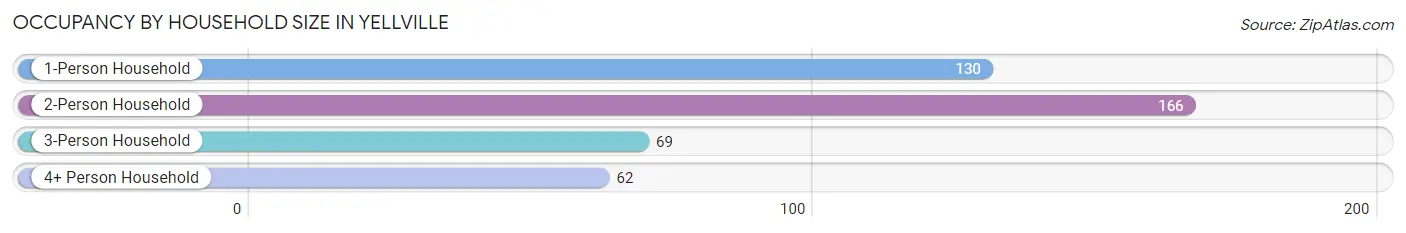
| Household Size | # Housing Units | % Housing Units |
| 1-Person Household | 130 | 30.4% |
| 2-Person Household | 166 | 38.9% |
| 3-Person Household | 69 | 16.2% |
| 4+ Person Household | 62 | 14.5% |
| Total Housing Units | 427 | 100.0% |
Occupancy by Ownership by Household Size in Yellville
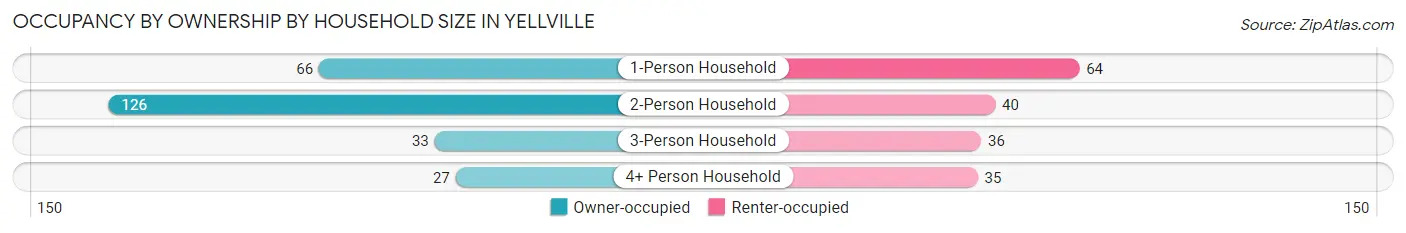
| Household Size | Owner-occupied | Renter-occupied |
| 1-Person Household | 66 (50.8%) | 64 (49.2%) |
| 2-Person Household | 126 (75.9%) | 40 (24.1%) |
| 3-Person Household | 33 (47.8%) | 36 (52.2%) |
| 4+ Person Household | 27 (43.5%) | 35 (56.5%) |
| Total Housing Units | 252 (59.0%) | 175 (41.0%) |
Occupancy by Educational Attainment in Yellville
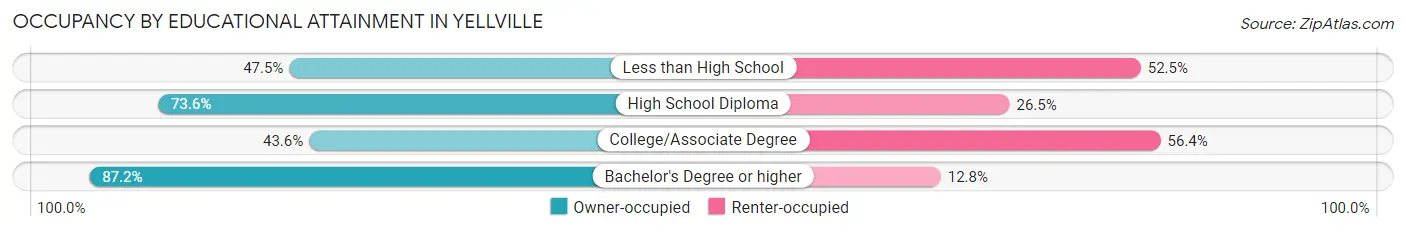
| Household Size | Owner-occupied | Renter-occupied |
| Less than High School | 29 (47.5%) | 32 (52.5%) |
| High School Diploma | 114 (73.6%) | 41 (26.5%) |
| College/Associate Degree | 75 (43.6%) | 97 (56.4%) |
| Bachelor's Degree or higher | 34 (87.2%) | 5 (12.8%) |
Occupancy by Age of Householder in Yellville
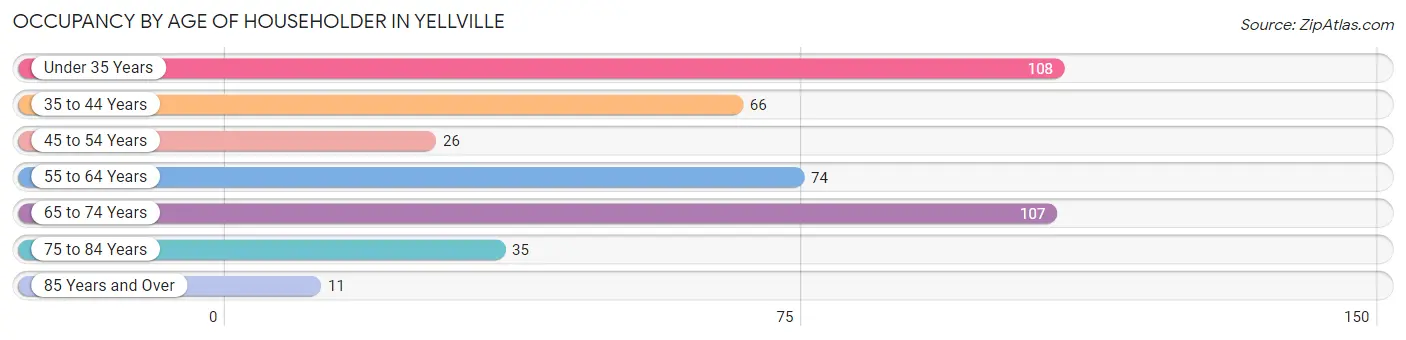
| Age Bracket | # Households | % Households |
| Under 35 Years | 108 | 25.3% |
| 35 to 44 Years | 66 | 15.5% |
| 45 to 54 Years | 26 | 6.1% |
| 55 to 64 Years | 74 | 17.3% |
| 65 to 74 Years | 107 | 25.1% |
| 75 to 84 Years | 35 | 8.2% |
| 85 Years and Over | 11 | 2.6% |
| Total | 427 | 100.0% |
Housing Finances in Yellville
Median Income by Occupancy in Yellville
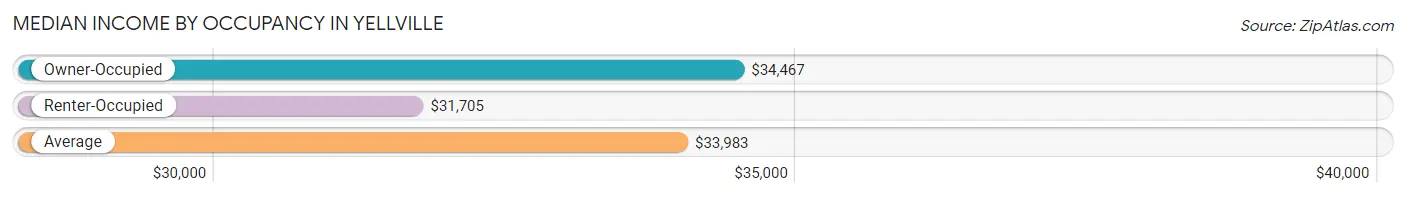
| Occupancy Type | # Households | Median Income |
| Owner-Occupied | 252 (59.0%) | $34,467 |
| Renter-Occupied | 175 (41.0%) | $31,705 |
| Average | 427 (100.0%) | $33,983 |
Occupancy by Householder Income Bracket in Yellville
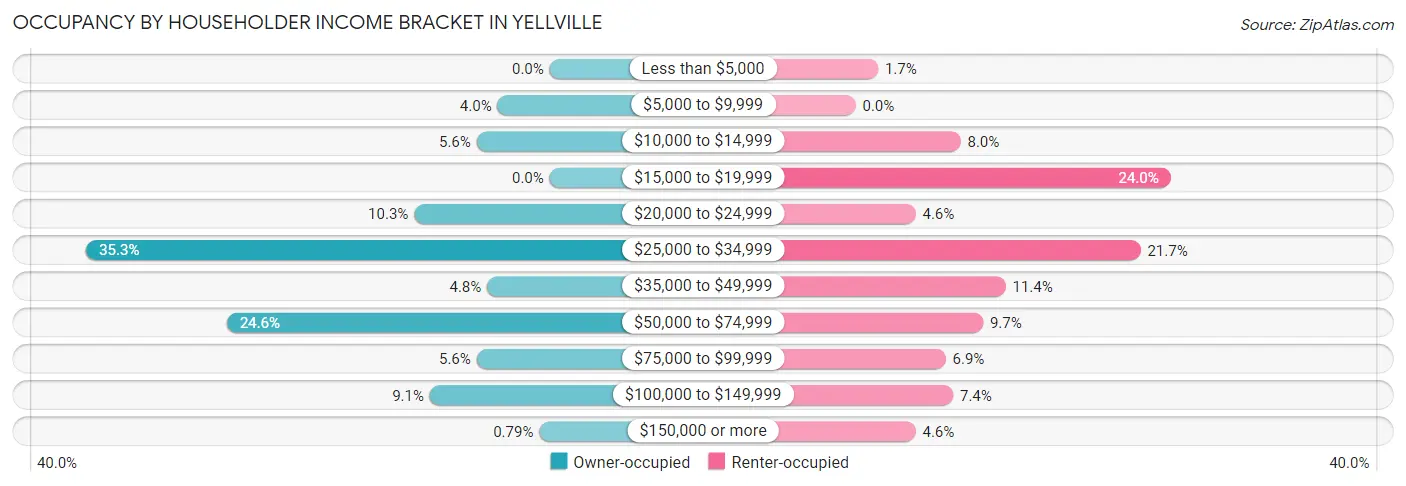
| Income Bracket | Owner-occupied | Renter-occupied |
| Less than $5,000 | 0 (0.0%) | 3 (1.7%) |
| $5,000 to $9,999 | 10 (4.0%) | 0 (0.0%) |
| $10,000 to $14,999 | 14 (5.6%) | 14 (8.0%) |
| $15,000 to $19,999 | 0 (0.0%) | 42 (24.0%) |
| $20,000 to $24,999 | 26 (10.3%) | 8 (4.6%) |
| $25,000 to $34,999 | 89 (35.3%) | 38 (21.7%) |
| $35,000 to $49,999 | 12 (4.8%) | 20 (11.4%) |
| $50,000 to $74,999 | 62 (24.6%) | 17 (9.7%) |
| $75,000 to $99,999 | 14 (5.6%) | 12 (6.9%) |
| $100,000 to $149,999 | 23 (9.1%) | 13 (7.4%) |
| $150,000 or more | 2 (0.8%) | 8 (4.6%) |
| Total | 252 (100.0%) | 175 (100.0%) |
Monthly Housing Cost Tiers in Yellville
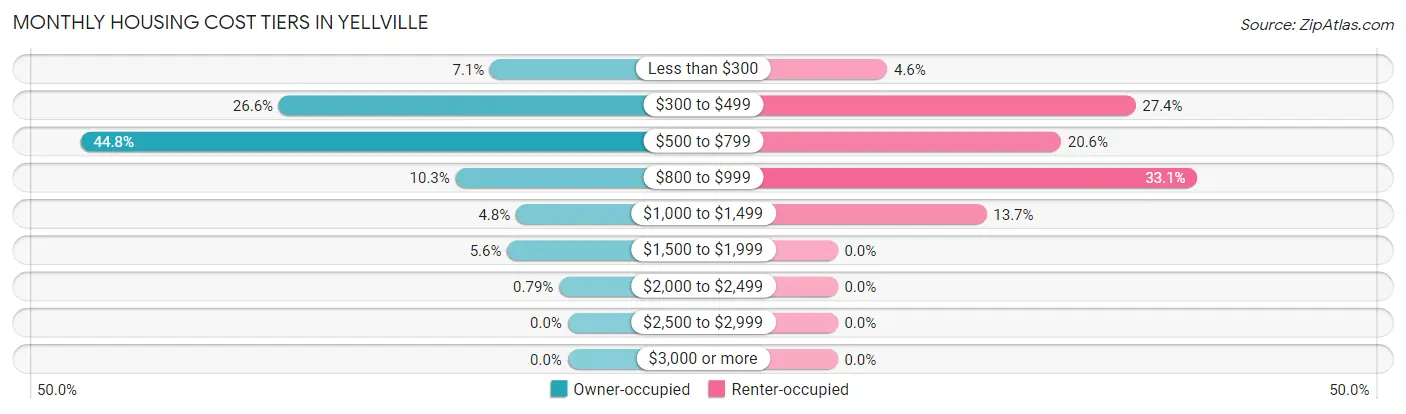
| Monthly Cost | Owner-occupied | Renter-occupied |
| Less than $300 | 18 (7.1%) | 8 (4.6%) |
| $300 to $499 | 67 (26.6%) | 48 (27.4%) |
| $500 to $799 | 113 (44.8%) | 36 (20.6%) |
| $800 to $999 | 26 (10.3%) | 58 (33.1%) |
| $1,000 to $1,499 | 12 (4.8%) | 24 (13.7%) |
| $1,500 to $1,999 | 14 (5.6%) | 0 (0.0%) |
| $2,000 to $2,499 | 2 (0.8%) | 0 (0.0%) |
| $2,500 to $2,999 | 0 (0.0%) | 0 (0.0%) |
| $3,000 or more | 0 (0.0%) | 0 (0.0%) |
| Total | 252 (100.0%) | 175 (100.0%) |
Physical Housing Characteristics in Yellville
Housing Structures in Yellville
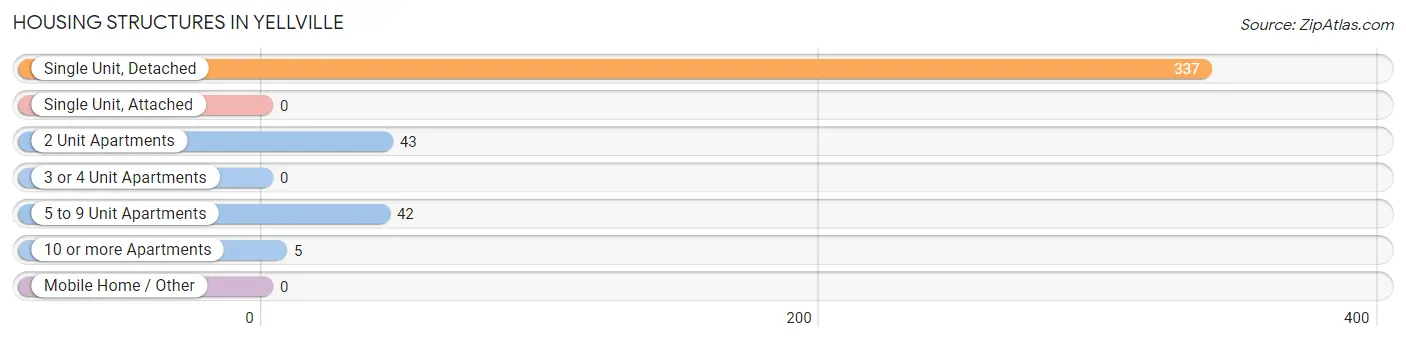
| Structure Type | # Housing Units | % Housing Units |
| Single Unit, Detached | 337 | 78.9% |
| Single Unit, Attached | 0 | 0.0% |
| 2 Unit Apartments | 43 | 10.1% |
| 3 or 4 Unit Apartments | 0 | 0.0% |
| 5 to 9 Unit Apartments | 42 | 9.8% |
| 10 or more Apartments | 5 | 1.2% |
| Mobile Home / Other | 0 | 0.0% |
| Total | 427 | 100.0% |
Housing Structures by Occupancy in Yellville
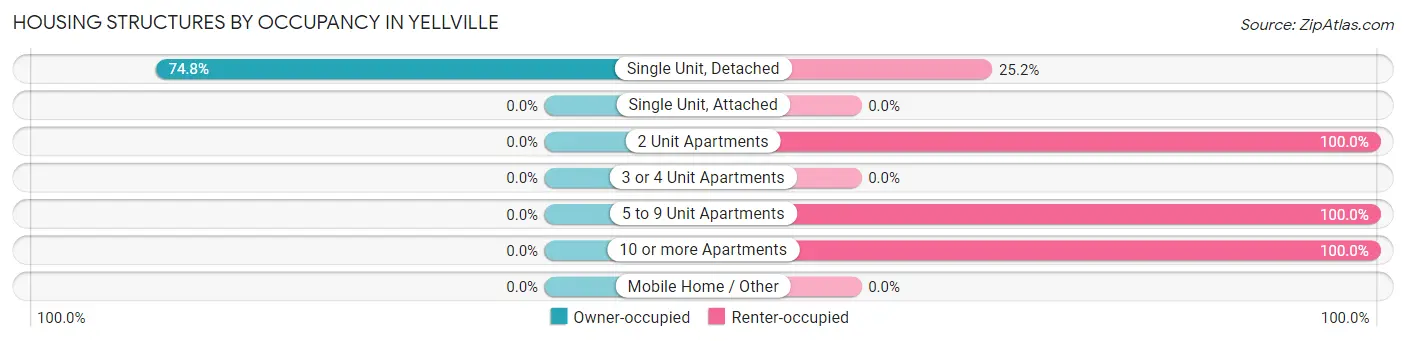
| Structure Type | Owner-occupied | Renter-occupied |
| Single Unit, Detached | 252 (74.8%) | 85 (25.2%) |
| Single Unit, Attached | 0 (0.0%) | 0 (0.0%) |
| 2 Unit Apartments | 0 (0.0%) | 43 (100.0%) |
| 3 or 4 Unit Apartments | 0 (0.0%) | 0 (0.0%) |
| 5 to 9 Unit Apartments | 0 (0.0%) | 42 (100.0%) |
| 10 or more Apartments | 0 (0.0%) | 5 (100.0%) |
| Mobile Home / Other | 0 (0.0%) | 0 (0.0%) |
| Total | 252 (59.0%) | 175 (41.0%) |
Housing Structures by Number of Rooms in Yellville
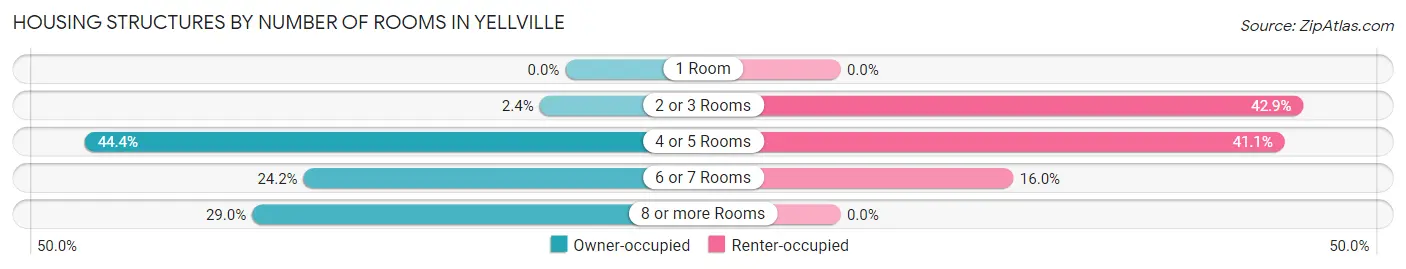
| Number of Rooms | Owner-occupied | Renter-occupied |
| 1 Room | 0 (0.0%) | 0 (0.0%) |
| 2 or 3 Rooms | 6 (2.4%) | 75 (42.9%) |
| 4 or 5 Rooms | 112 (44.4%) | 72 (41.1%) |
| 6 or 7 Rooms | 61 (24.2%) | 28 (16.0%) |
| 8 or more Rooms | 73 (29.0%) | 0 (0.0%) |
| Total | 252 (100.0%) | 175 (100.0%) |
Housing Structure by Heating Type in Yellville
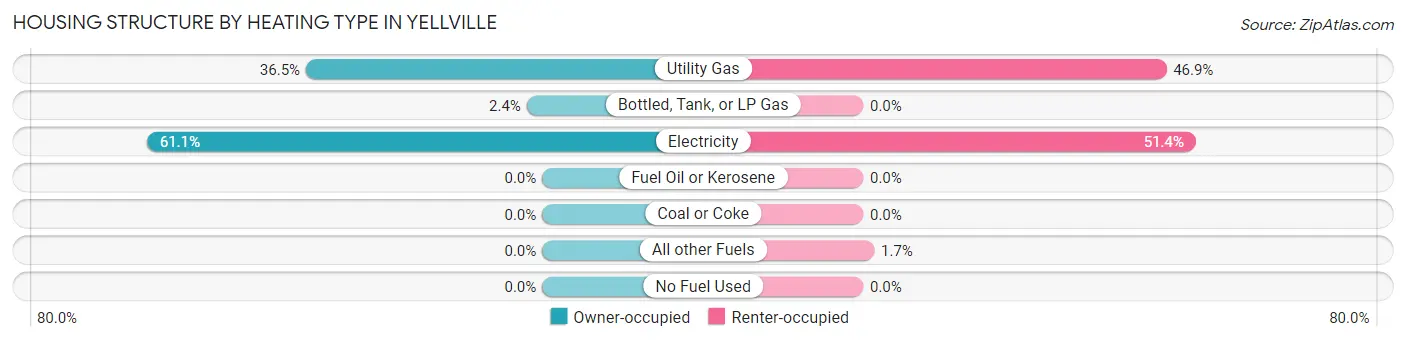
| Heating Type | Owner-occupied | Renter-occupied |
| Utility Gas | 92 (36.5%) | 82 (46.9%) |
| Bottled, Tank, or LP Gas | 6 (2.4%) | 0 (0.0%) |
| Electricity | 154 (61.1%) | 90 (51.4%) |
| Fuel Oil or Kerosene | 0 (0.0%) | 0 (0.0%) |
| Coal or Coke | 0 (0.0%) | 0 (0.0%) |
| All other Fuels | 0 (0.0%) | 3 (1.7%) |
| No Fuel Used | 0 (0.0%) | 0 (0.0%) |
| Total | 252 (100.0%) | 175 (100.0%) |
Household Vehicle Usage in Yellville
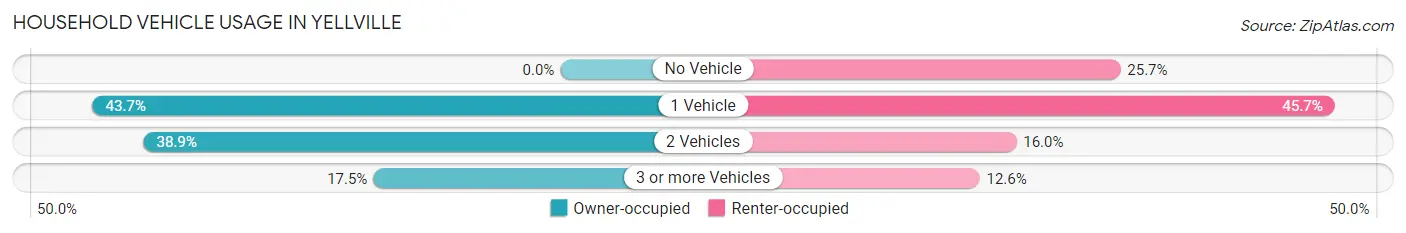
| Vehicles per Household | Owner-occupied | Renter-occupied |
| No Vehicle | 0 (0.0%) | 45 (25.7%) |
| 1 Vehicle | 110 (43.6%) | 80 (45.7%) |
| 2 Vehicles | 98 (38.9%) | 28 (16.0%) |
| 3 or more Vehicles | 44 (17.5%) | 22 (12.6%) |
| Total | 252 (100.0%) | 175 (100.0%) |
Real Estate & Mortgages in Yellville
Real Estate and Mortgage Overview in Yellville
| Characteristic | Without Mortgage | With Mortgage |
| Housing Units | 99 | 153 |
| Median Property Value | $114,800 | $151,800 |
| Median Household Income | - | - |
| Monthly Housing Costs | $410 | $0 |
| Real Estate Taxes | $539 | $0 |
Property Value by Mortgage Status in Yellville
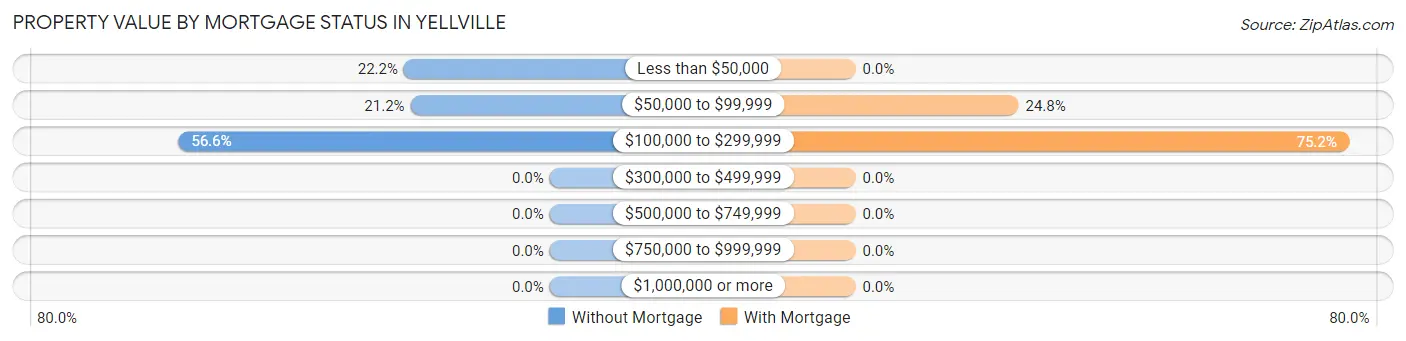
| Property Value | Without Mortgage | With Mortgage |
| Less than $50,000 | 22 (22.2%) | 0 (0.0%) |
| $50,000 to $99,999 | 21 (21.2%) | 38 (24.8%) |
| $100,000 to $299,999 | 56 (56.6%) | 115 (75.2%) |
| $300,000 to $499,999 | 0 (0.0%) | 0 (0.0%) |
| $500,000 to $749,999 | 0 (0.0%) | 0 (0.0%) |
| $750,000 to $999,999 | 0 (0.0%) | 0 (0.0%) |
| $1,000,000 or more | 0 (0.0%) | 0 (0.0%) |
| Total | 99 (100.0%) | 153 (100.0%) |
Household Income by Mortgage Status in Yellville
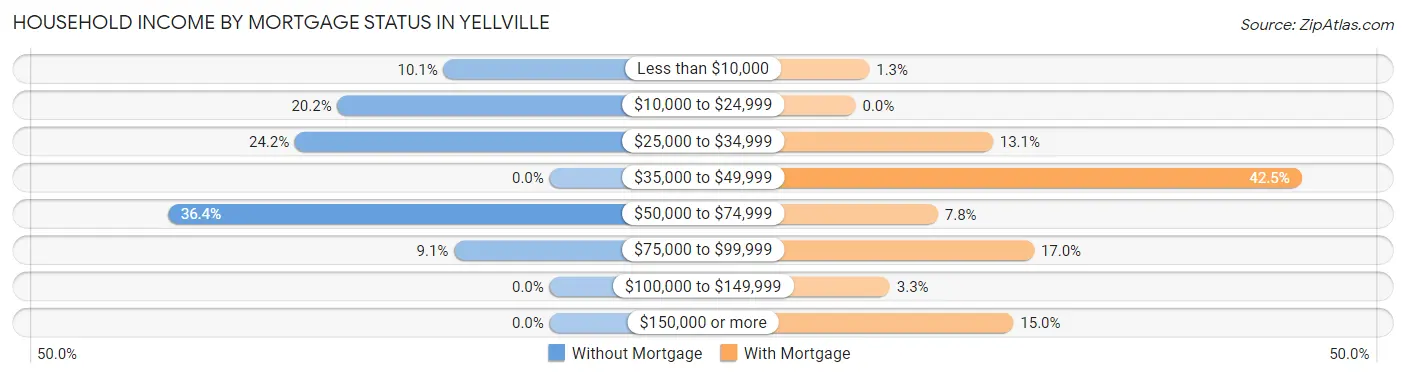
| Household Income | Without Mortgage | With Mortgage |
| Less than $10,000 | 10 (10.1%) | 2 (1.3%) |
| $10,000 to $24,999 | 20 (20.2%) | 0 (0.0%) |
| $25,000 to $34,999 | 24 (24.2%) | 20 (13.1%) |
| $35,000 to $49,999 | 0 (0.0%) | 65 (42.5%) |
| $50,000 to $74,999 | 36 (36.4%) | 12 (7.8%) |
| $75,000 to $99,999 | 9 (9.1%) | 26 (17.0%) |
| $100,000 to $149,999 | 0 (0.0%) | 5 (3.3%) |
| $150,000 or more | 0 (0.0%) | 23 (15.0%) |
| Total | 99 (100.0%) | 153 (100.0%) |
Property Value to Household Income Ratio in Yellville
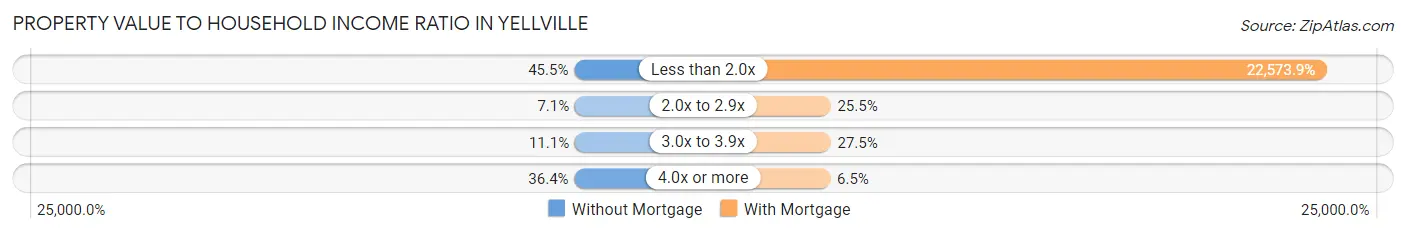
| Value-to-Income Ratio | Without Mortgage | With Mortgage |
| Less than 2.0x | 45 (45.5%) | 34,538 (22,573.9%) |
| 2.0x to 2.9x | 7 (7.1%) | 39 (25.5%) |
| 3.0x to 3.9x | 11 (11.1%) | 42 (27.5%) |
| 4.0x or more | 36 (36.4%) | 10 (6.5%) |
| Total | 99 (100.0%) | 153 (100.0%) |
Real Estate Taxes by Mortgage Status in Yellville
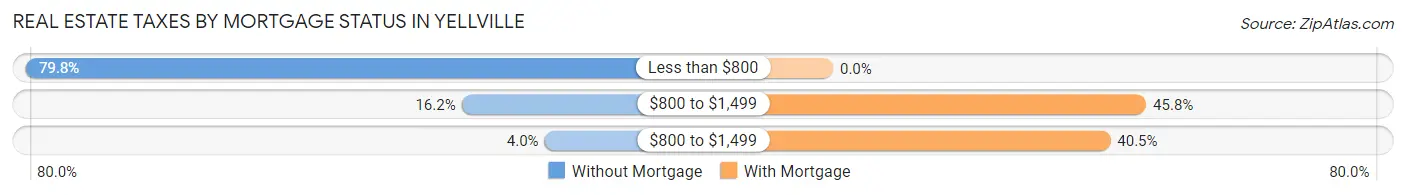
| Property Taxes | Without Mortgage | With Mortgage |
| Less than $800 | 79 (79.8%) | 0 (0.0%) |
| $800 to $1,499 | 16 (16.2%) | 70 (45.8%) |
| $800 to $1,499 | 4 (4.0%) | 62 (40.5%) |
| Total | 99 (100.0%) | 153 (100.0%) |
Health & Disability in Yellville
Health Insurance Coverage by Age in Yellville
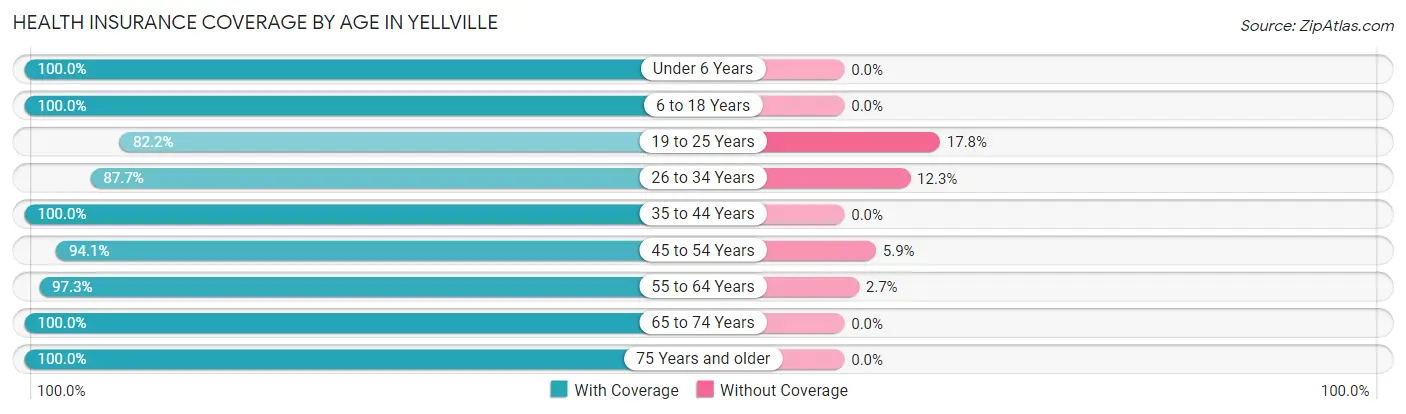
| Age Bracket | With Coverage | Without Coverage |
| Under 6 Years | 76 (100.0%) | 0 (0.0%) |
| 6 to 18 Years | 245 (100.0%) | 0 (0.0%) |
| 19 to 25 Years | 83 (82.2%) | 18 (17.8%) |
| 26 to 34 Years | 150 (87.7%) | 21 (12.3%) |
| 35 to 44 Years | 117 (100.0%) | 0 (0.0%) |
| 45 to 54 Years | 48 (94.1%) | 3 (5.9%) |
| 55 to 64 Years | 143 (97.3%) | 4 (2.7%) |
| 65 to 74 Years | 133 (100.0%) | 0 (0.0%) |
| 75 Years and older | 56 (100.0%) | 0 (0.0%) |
| Total | 1,051 (95.8%) | 46 (4.2%) |
Health Insurance Coverage by Citizenship Status in Yellville
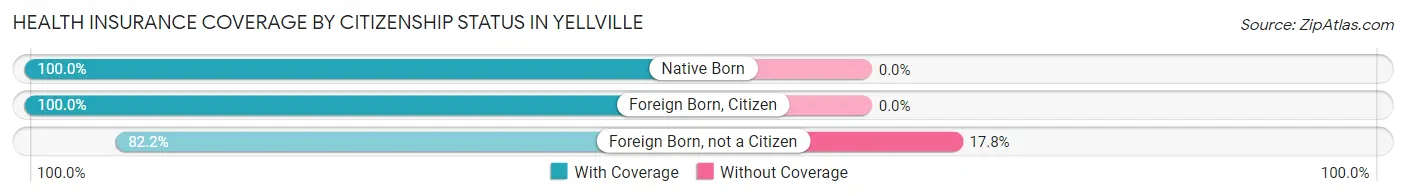
| Citizenship Status | With Coverage | Without Coverage |
| Native Born | 76 (100.0%) | 0 (0.0%) |
| Foreign Born, Citizen | 245 (100.0%) | 0 (0.0%) |
| Foreign Born, not a Citizen | 83 (82.2%) | 18 (17.8%) |
Health Insurance Coverage by Household Income in Yellville
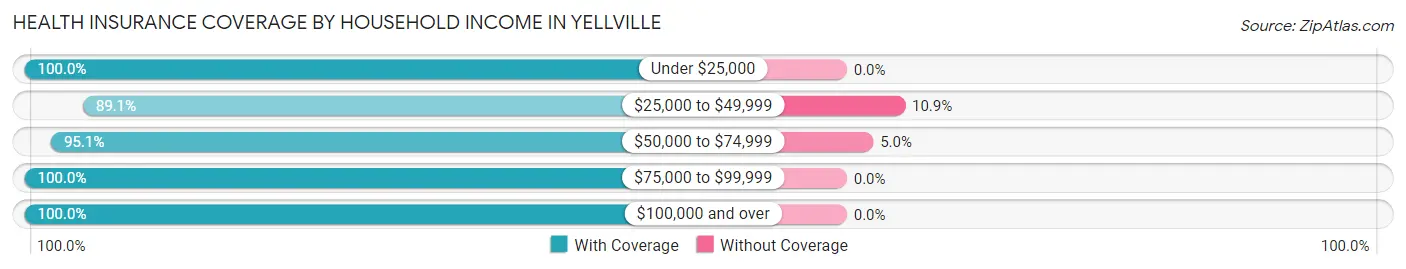
| Household Income | With Coverage | Without Coverage |
| Under $25,000 | 217 (100.0%) | 0 (0.0%) |
| $25,000 to $49,999 | 302 (89.1%) | 37 (10.9%) |
| $50,000 to $74,999 | 173 (95.1%) | 9 (5.0%) |
| $75,000 to $99,999 | 122 (100.0%) | 0 (0.0%) |
| $100,000 and over | 219 (100.0%) | 0 (0.0%) |
Public vs Private Health Insurance Coverage by Age in Yellville
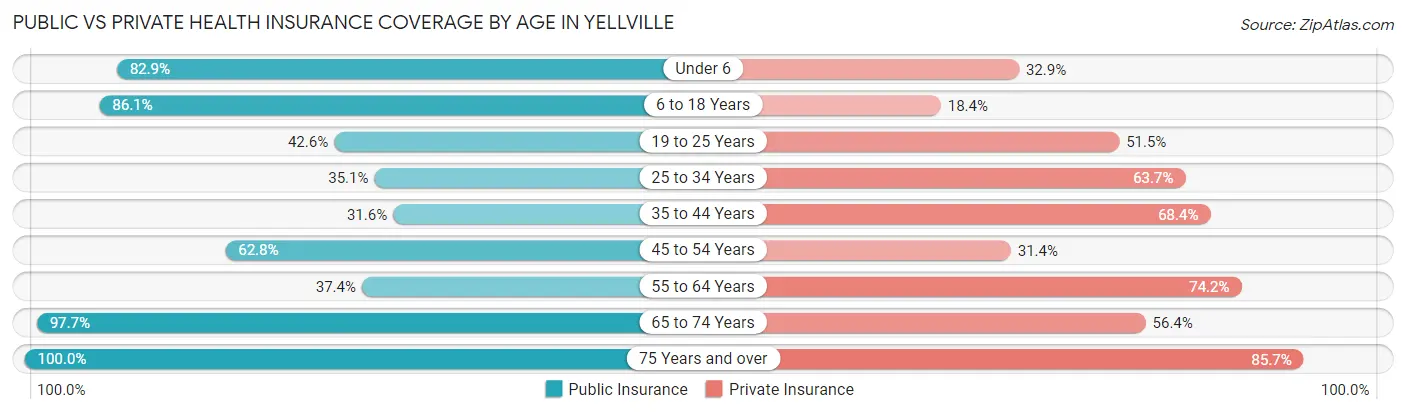
| Age Bracket | Public Insurance | Private Insurance |
| Under 6 | 63 (82.9%) | 25 (32.9%) |
| 6 to 18 Years | 211 (86.1%) | 45 (18.4%) |
| 19 to 25 Years | 43 (42.6%) | 52 (51.5%) |
| 25 to 34 Years | 60 (35.1%) | 109 (63.7%) |
| 35 to 44 Years | 37 (31.6%) | 80 (68.4%) |
| 45 to 54 Years | 32 (62.7%) | 16 (31.4%) |
| 55 to 64 Years | 55 (37.4%) | 109 (74.2%) |
| 65 to 74 Years | 130 (97.7%) | 75 (56.4%) |
| 75 Years and over | 56 (100.0%) | 48 (85.7%) |
| Total | 687 (62.6%) | 559 (51.0%) |
Disability Status by Sex by Age in Yellville
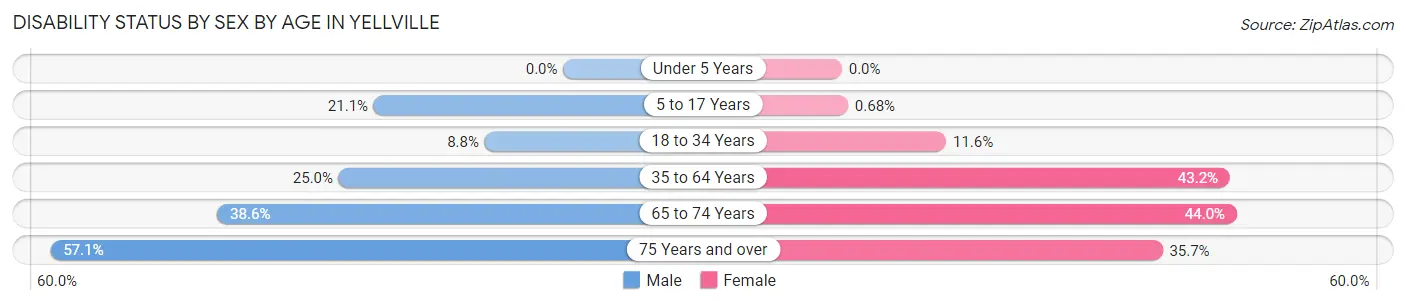
| Age Bracket | Male | Female |
| Under 5 Years | 0 (0.0%) | 0 (0.0%) |
| 5 to 17 Years | 23 (21.1%) | 1 (0.7%) |
| 18 to 34 Years | 14 (8.7%) | 13 (11.6%) |
| 35 to 64 Years | 29 (25.0%) | 86 (43.2%) |
| 65 to 74 Years | 32 (38.6%) | 22 (44.0%) |
| 75 Years and over | 8 (57.1%) | 15 (35.7%) |
Disability Class by Sex by Age in Yellville
Disability Class: Hearing Difficulty
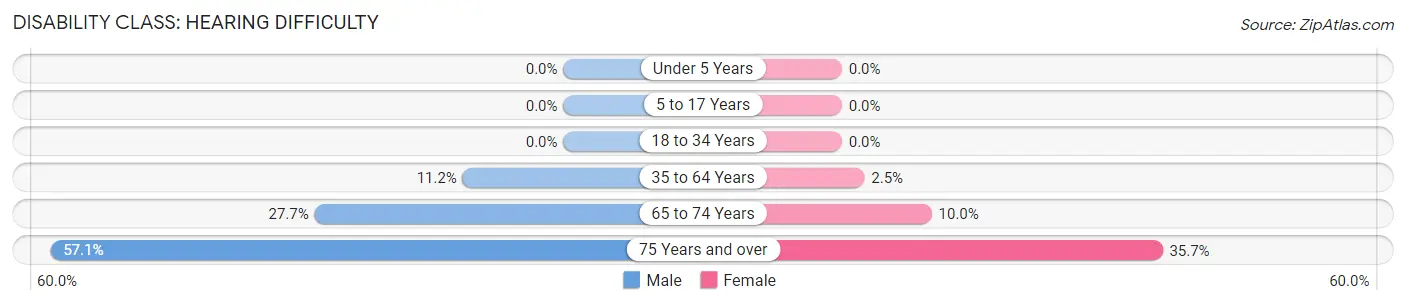
| Age Bracket | Male | Female |
| Under 5 Years | 0 (0.0%) | 0 (0.0%) |
| 5 to 17 Years | 0 (0.0%) | 0 (0.0%) |
| 18 to 34 Years | 0 (0.0%) | 0 (0.0%) |
| 35 to 64 Years | 13 (11.2%) | 5 (2.5%) |
| 65 to 74 Years | 23 (27.7%) | 5 (10.0%) |
| 75 Years and over | 8 (57.1%) | 15 (35.7%) |
Disability Class: Vision Difficulty
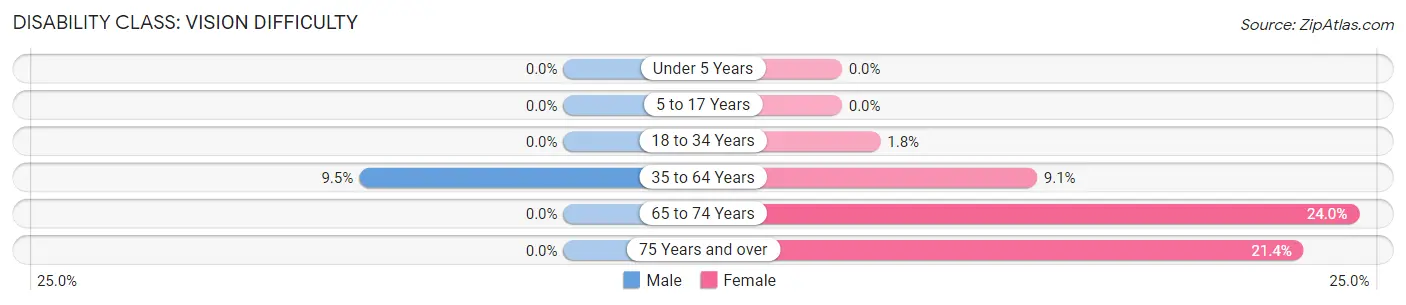
| Age Bracket | Male | Female |
| Under 5 Years | 0 (0.0%) | 0 (0.0%) |
| 5 to 17 Years | 0 (0.0%) | 0 (0.0%) |
| 18 to 34 Years | 0 (0.0%) | 2 (1.8%) |
| 35 to 64 Years | 11 (9.5%) | 18 (9.0%) |
| 65 to 74 Years | 0 (0.0%) | 12 (24.0%) |
| 75 Years and over | 0 (0.0%) | 9 (21.4%) |
Disability Class: Cognitive Difficulty
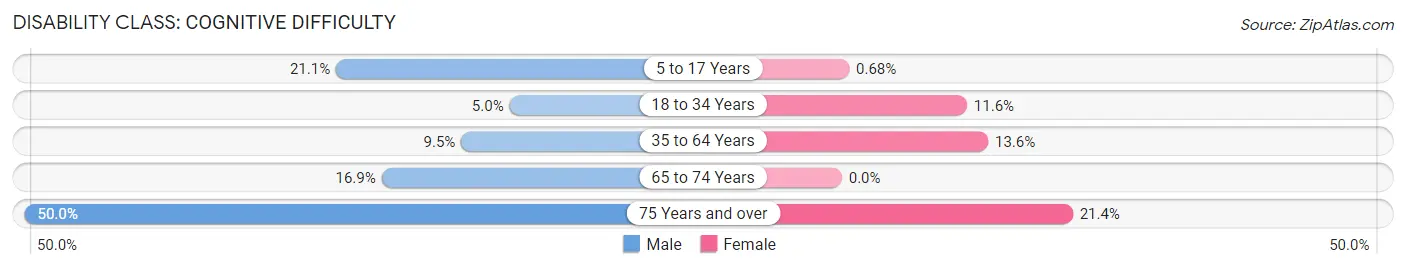
| Age Bracket | Male | Female |
| 5 to 17 Years | 23 (21.1%) | 1 (0.7%) |
| 18 to 34 Years | 8 (5.0%) | 13 (11.6%) |
| 35 to 64 Years | 11 (9.5%) | 27 (13.6%) |
| 65 to 74 Years | 14 (16.9%) | 0 (0.0%) |
| 75 Years and over | 7 (50.0%) | 9 (21.4%) |
Disability Class: Ambulatory Difficulty
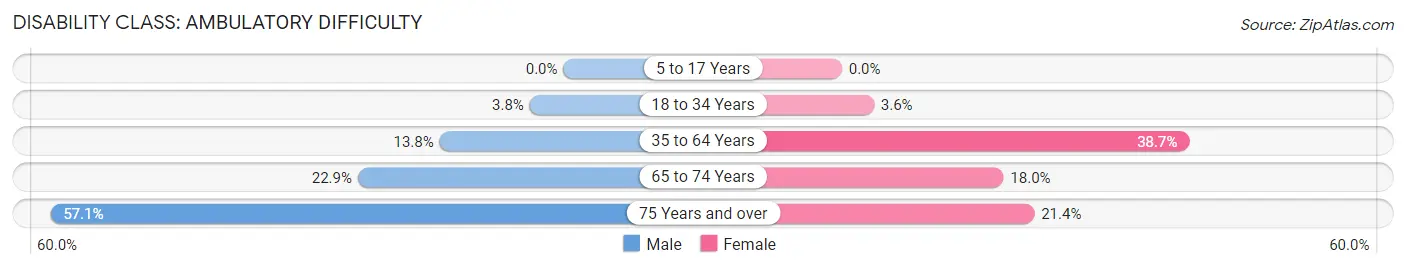
| Age Bracket | Male | Female |
| 5 to 17 Years | 0 (0.0%) | 0 (0.0%) |
| 18 to 34 Years | 6 (3.7%) | 4 (3.6%) |
| 35 to 64 Years | 16 (13.8%) | 77 (38.7%) |
| 65 to 74 Years | 19 (22.9%) | 9 (18.0%) |
| 75 Years and over | 8 (57.1%) | 9 (21.4%) |
Disability Class: Self-Care Difficulty
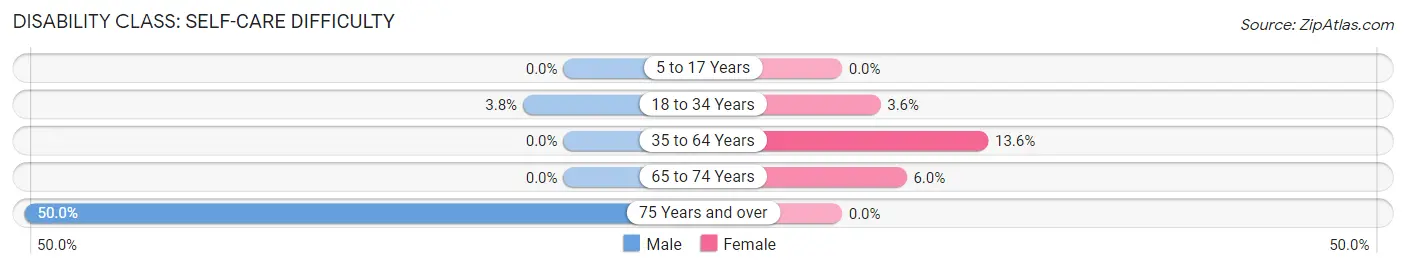
| Age Bracket | Male | Female |
| 5 to 17 Years | 0 (0.0%) | 0 (0.0%) |
| 18 to 34 Years | 6 (3.7%) | 4 (3.6%) |
| 35 to 64 Years | 0 (0.0%) | 27 (13.6%) |
| 65 to 74 Years | 0 (0.0%) | 3 (6.0%) |
| 75 Years and over | 7 (50.0%) | 0 (0.0%) |
Technology Access in Yellville
Computing Device Access in Yellville
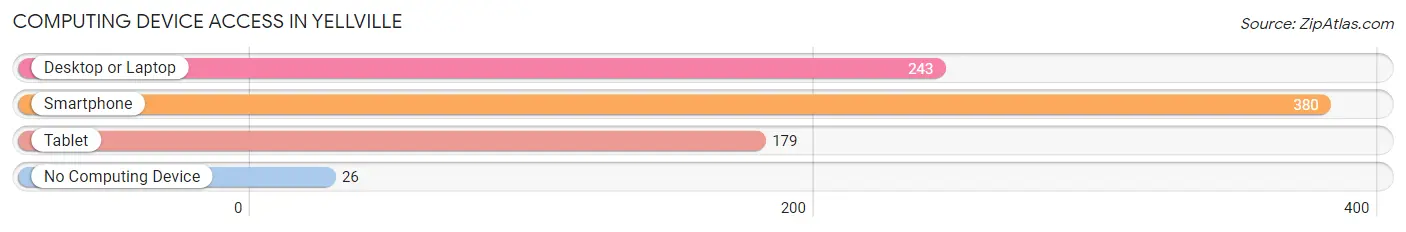
| Device Type | # Households | % Households |
| Desktop or Laptop | 243 | 56.9% |
| Smartphone | 380 | 89.0% |
| Tablet | 179 | 41.9% |
| No Computing Device | 26 | 6.1% |
| Total | 427 | 100.0% |
Internet Access in Yellville
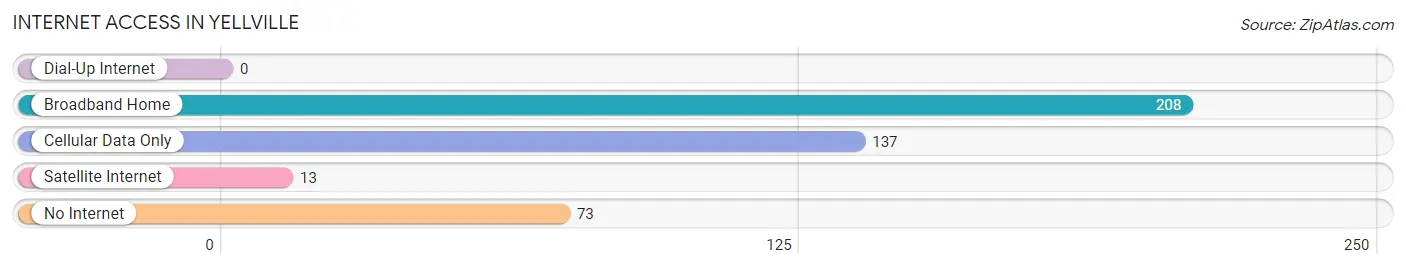
| Internet Type | # Households | % Households |
| Dial-Up Internet | 0 | 0.0% |
| Broadband Home | 208 | 48.7% |
| Cellular Data Only | 137 | 32.1% |
| Satellite Internet | 13 | 3.0% |
| No Internet | 73 | 17.1% |
| Total | 427 | 100.0% |
Yellville Summary
Yellville is a city located in Marion County, Arkansas, United States. It is the county seat of Marion County and is located in the Ozark Mountains. The population was 1,204 at the 2010 census.
History
Yellville was founded in 1836 and named after Archibald Yell, the second governor of Arkansas. The city was incorporated in 1856 and has been the county seat of Marion County since 1873.
Yellville was a major stop on the Butterfield Overland Mail route, which ran from St. Louis to San Francisco. The route passed through Yellville on its way to Fayetteville.
Yellville was also the site of a major Civil War battle in 1862. The Battle of Yellville was fought between Union and Confederate forces and resulted in a Confederate victory.
Geography
Yellville is located at 36°20'25"N 92°45'45"W (36.340278, -92.762500). It is situated in the Ozark Mountains in northern Arkansas. The city is located on the White River, which flows through the city.
The city has a total area of 2 2 square miles 5 7 km2 all of it land
Economy
Yellville's economy is largely based on agriculture and tourism. The city is home to several farms and ranches, as well as a number of tourist attractions.
The city is also home to several manufacturing companies, including a furniture factory, a woodworking plant, and a plastics plant.
Demographics
As of the 2010 census, there were 1,204 people, 486 households, and 315 families residing in the city. The population density was 545.5 people per square mile (210.9/km2). There were 545 housing units at an average density of 246.8 per square mile (95.2/km2). The racial makeup of the city was 97.2% White, 0.3% African American, 0.3% Native American, 0.2% Asian, 0.2% from other races, and 1.9% from two or more races. Hispanic or Latino of any race were 1.2% of the population.
There were 486 households, out of which 28.2% had children under the age of 18 living with them, 48.7% were married couples living together, 11.7% had a female householder with no husband present, and 35.2% were non-families. 30.3% of all households were made up of individuals, and 15.2% had someone living alone who was 65 years of age or older. The average household size was 2.37 and the average family size was 2.93.
In the city, the population was spread out, with 24.2% under the age of 18, 8.2% from 18 to 24, 25.2% from 25 to 44, 24.2% from 45 to 64, and 18.2% who were 65 years of age or older. The median age was 39 years. For every 100 females, there were 87.2 males. For every 100 females age 18 and over, there were 83.3 males.
The median income for a household in the city was $25,938, and the median income for a family was $31,250. Males had a median income of $25,000 versus $19,375 for females. The per capita income for the city was $14,845. About 14.2% of families and 17.2% of the population were below the poverty line, including 22.2% of those under age 18 and 16.7% of those age 65 or over.
Common Questions
What is Per Capita Income in Yellville?
Per Capita income in Yellville is $19,623.
What is the Median Family Income in Yellville?
Median Family Income in Yellville is $44,000.
What is the Median Household income in Yellville?
Median Household Income in Yellville is $33,983.
What is Income or Wage Gap in Yellville?
Income or Wage Gap in Yellville is 45.9%.
Women in Yellville earn 54.1 cents for every dollar earned by a man.
What is Inequality or Gini Index in Yellville?
Inequality or Gini Index in Yellville is 0.41.
What is the Total Population of Yellville?
Total Population of Yellville is 1,159.
What is the Total Male Population of Yellville?
Total Male Population of Yellville is 543.
What is the Total Female Population of Yellville?
Total Female Population of Yellville is 616.
What is the Ratio of Males per 100 Females in Yellville?
There are 88.15 Males per 100 Females in Yellville.
What is the Ratio of Females per 100 Males in Yellville?
There are 113.44 Females per 100 Males in Yellville.
What is the Median Population Age in Yellville?
Median Population Age in Yellville is 33.2 Years.
What is the Average Family Size in Yellville
Average Family Size in Yellville is 3.1 People.
What is the Average Household Size in Yellville
Average Household Size in Yellville is 2.5 People.
How Large is the Labor Force in Yellville?
There are 479 People in the Labor Forcein in Yellville.
What is the Percentage of People in the Labor Force in Yellville?
54.2% of People are in the Labor Force in Yellville.
What is the Unemployment Rate in Yellville?
Unemployment Rate in Yellville is 12.5%.