Woodlawn, AR Map & Demographics
Woodlawn Map
Woodlawn Overview
$30,081
PER CAPITA INCOME
$64,348
AVG HOUSEHOLD INCOME
11.5%
WAGE / INCOME GAP [ % ]
88.5¢/ $1
WAGE / INCOME GAP [ $ ]
0.21
INEQUALITY / GINI INDEX
166
TOTAL POPULATION
50
MALE POPULATION
116
FEMALE POPULATION
43.10
MALES / 100 FEMALES
232.00
FEMALES / 100 MALES
29.8
MEDIAN AGE
3.6
AVG FAMILY SIZE
2.9
AVG HOUSEHOLD SIZE
58
LABOR FORCE [ PEOPLE ]
44.6%
PERCENT IN LABOR FORCE
Income in Woodlawn
Income Overview in Woodlawn
| Characteristic | Number | Measure |
| Per Capita Income | 166 | $30,081 |
| Median Family Income | 42 | $0 |
| Mean Family Income | 42 | $93,914 |
| Median Household Income | 58 | $64,348 |
| Mean Household Income | 58 | $85,355 |
| Income Deficit | 42 | $0 |
| Wage / Income Gap (%) | 166 | 11.54% |
| Wage / Income Gap ($) | 166 | 88.46¢ per $1 |
| Gini / Inequality Index | 166 | 0.21 |
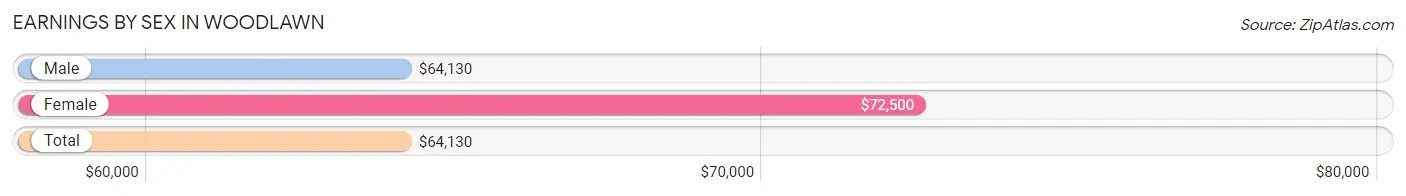
Earnings by Sex in Woodlawn
Average Earnings in Woodlawn are $64,130, $64,130 for men and $72,500 for women, a difference of 11.5%.
| Sex | Number | Average Earnings |
| Male | 36 (62.1%) | $64,130 |
| Female | 22 (37.9%) | $72,500 |
| Total | 58 (100.0%) | $64,130 |
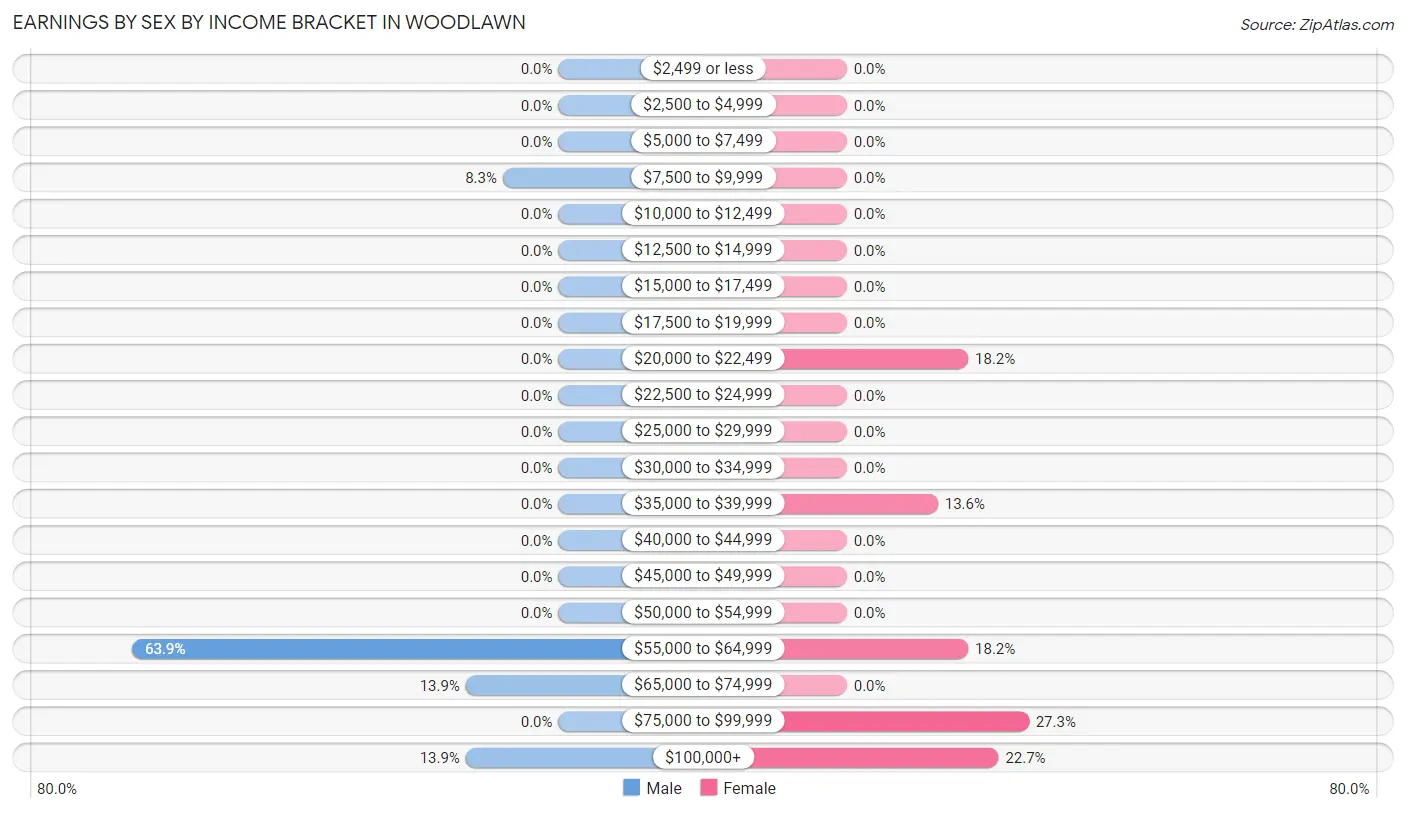
Earnings by Sex by Income Bracket in Woodlawn
The most common earnings brackets in Woodlawn are $55,000 to $64,999 for men (23 | 63.9%) and $75,000 to $99,999 for women (6 | 27.3%).
| Income | Male | Female |
| $2,499 or less | 0 (0.0%) | 0 (0.0%) |
| $2,500 to $4,999 | 0 (0.0%) | 0 (0.0%) |
| $5,000 to $7,499 | 0 (0.0%) | 0 (0.0%) |
| $7,500 to $9,999 | 3 (8.3%) | 0 (0.0%) |
| $10,000 to $12,499 | 0 (0.0%) | 0 (0.0%) |
| $12,500 to $14,999 | 0 (0.0%) | 0 (0.0%) |
| $15,000 to $17,499 | 0 (0.0%) | 0 (0.0%) |
| $17,500 to $19,999 | 0 (0.0%) | 0 (0.0%) |
| $20,000 to $22,499 | 0 (0.0%) | 4 (18.2%) |
| $22,500 to $24,999 | 0 (0.0%) | 0 (0.0%) |
| $25,000 to $29,999 | 0 (0.0%) | 0 (0.0%) |
| $30,000 to $34,999 | 0 (0.0%) | 0 (0.0%) |
| $35,000 to $39,999 | 0 (0.0%) | 3 (13.6%) |
| $40,000 to $44,999 | 0 (0.0%) | 0 (0.0%) |
| $45,000 to $49,999 | 0 (0.0%) | 0 (0.0%) |
| $50,000 to $54,999 | 0 (0.0%) | 0 (0.0%) |
| $55,000 to $64,999 | 23 (63.9%) | 4 (18.2%) |
| $65,000 to $74,999 | 5 (13.9%) | 0 (0.0%) |
| $75,000 to $99,999 | 0 (0.0%) | 6 (27.3%) |
| $100,000+ | 5 (13.9%) | 5 (22.7%) |
| Total | 36 (100.0%) | 22 (100.0%) |
Earnings by Sex by Educational Attainment in Woodlawn
| Educational Attainment | Male Income | Female Income |
| Less than High School | - | - |
| High School Diploma | - | - |
| College or Associate's Degree | - | - |
| Bachelor's Degree | - | - |
| Graduate Degree | - | - |
| Total | $64,130 | $72,500 |
Family Income in Woodlawn
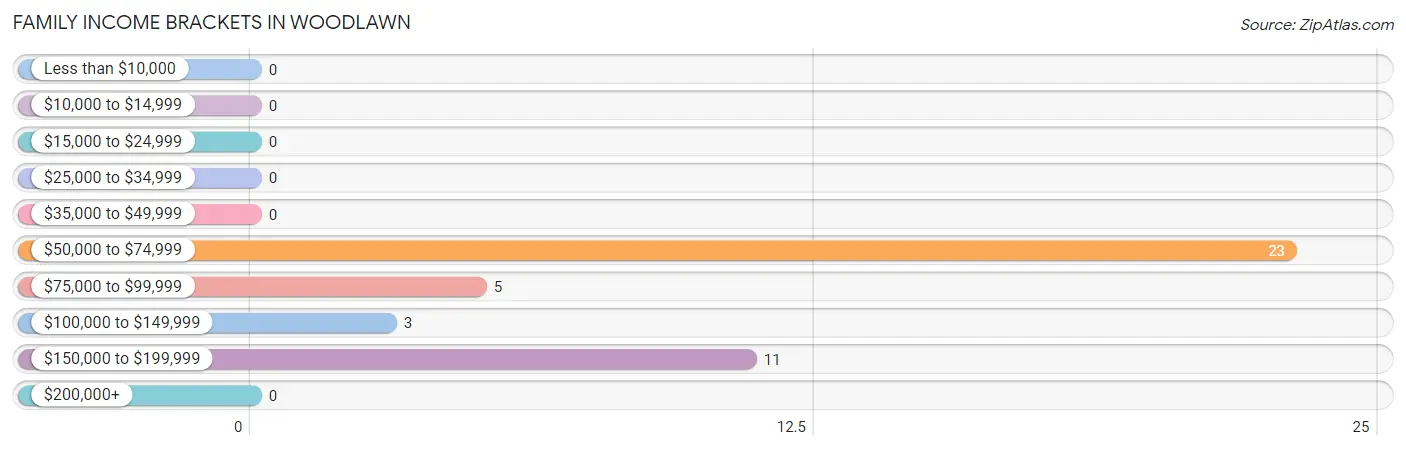
Family Income Brackets in Woodlawn
According to the Woodlawn family income data, there are 23 families falling into the $50,000 to $74,999 income range, which is the most common income bracket and makes up 54.8% of all families.
| Income Bracket | # Families | % Families |
| Less than $10,000 | 0 | 0.0% |
| $10,000 to $14,999 | 0 | 0.0% |
| $15,000 to $24,999 | 0 | 0.0% |
| $25,000 to $34,999 | 0 | 0.0% |
| $35,000 to $49,999 | 0 | 0.0% |
| $50,000 to $74,999 | 23 | 54.8% |
| $75,000 to $99,999 | 5 | 11.9% |
| $100,000 to $149,999 | 3 | 7.1% |
| $150,000 to $199,999 | 11 | 26.2% |
| $200,000+ | 0 | 0.0% |
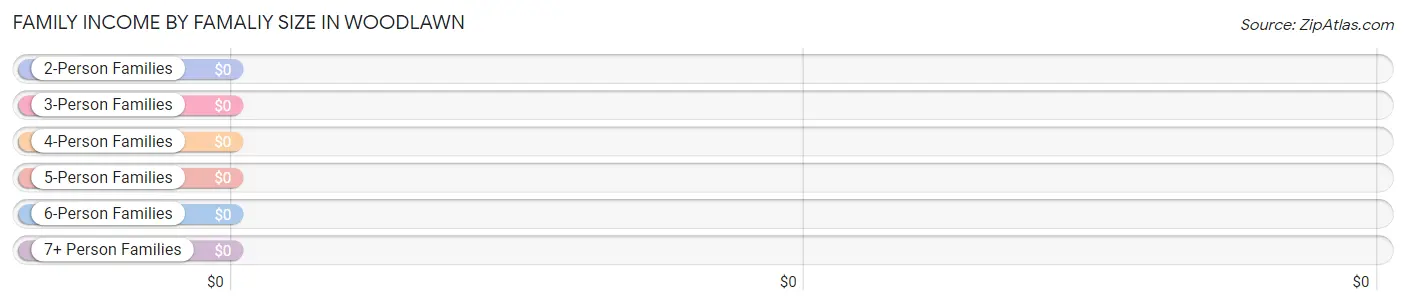
Family Income by Famaliy Size in Woodlawn
| Income Bracket | # Families | Median Income |
| 2-Person Families | 5 (11.9%) | $0 |
| 3-Person Families | 28 (66.7%) | $0 |
| 4-Person Families | 9 (21.4%) | $0 |
| 5-Person Families | 0 (0.0%) | $0 |
| 6-Person Families | 0 (0.0%) | $0 |
| 7+ Person Families | 0 (0.0%) | $0 |
| Total | 42 (100.0%) | $0 |
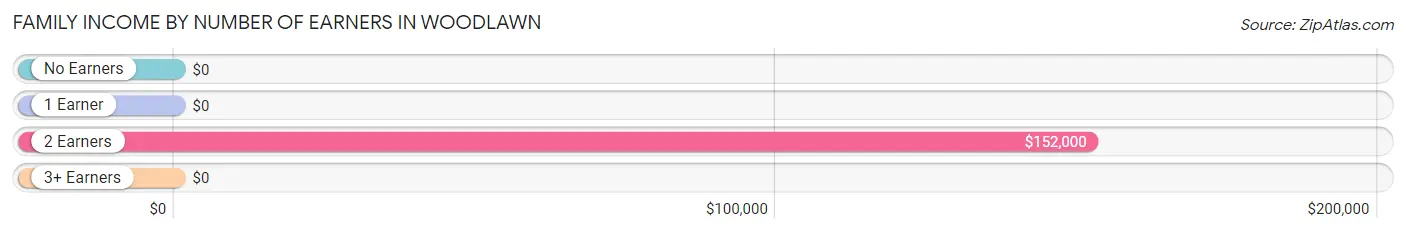
Family Income by Number of Earners in Woodlawn
| Number of Earners | # Families | Median Income |
| No Earners | 0 (0.0%) | $0 |
| 1 Earner | 28 (66.7%) | $0 |
| 2 Earners | 14 (33.3%) | $152,000 |
| 3+ Earners | 0 (0.0%) | $0 |
| Total | 42 (100.0%) | $0 |
Household Income in Woodlawn
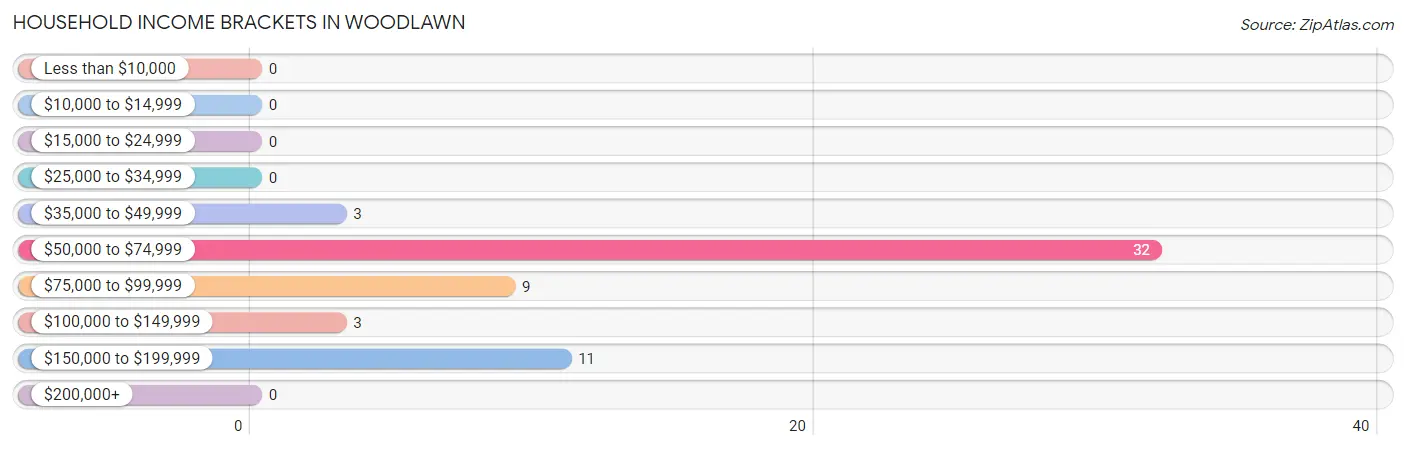
Household Income Brackets in Woodlawn
With 32 households falling in the category, the $50,000 to $74,999 income range is the most frequent in Woodlawn, accounting for 55.2% of all households.
| Income Bracket | # Households | % Households |
| Less than $10,000 | 0 | 0.0% |
| $10,000 to $14,999 | 0 | 0.0% |
| $15,000 to $24,999 | 0 | 0.0% |
| $25,000 to $34,999 | 0 | 0.0% |
| $35,000 to $49,999 | 3 | 5.2% |
| $50,000 to $74,999 | 32 | 55.2% |
| $75,000 to $99,999 | 9 | 15.5% |
| $100,000 to $149,999 | 3 | 5.2% |
| $150,000 to $199,999 | 11 | 19.0% |
| $200,000+ | 0 | 0.0% |
Household Income by Householder Age in Woodlawn
The median household income in Woodlawn is $64,348, with the highest median household income of $68,750 found in the 65+ years age bracket for the primary householder. A total of 18 households (31.0%) fall into this category.
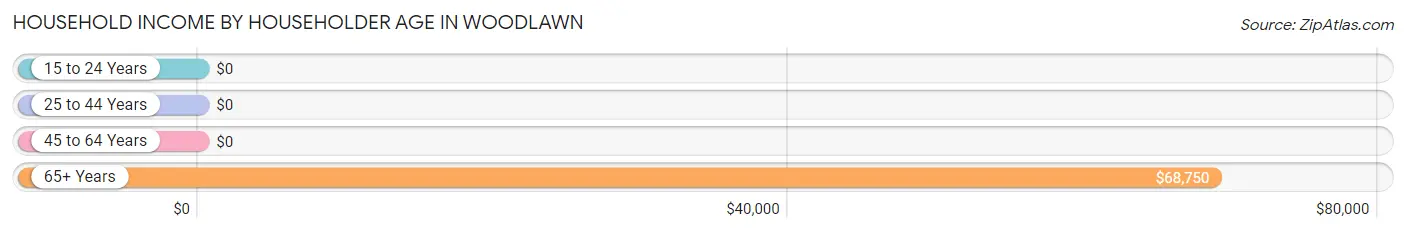
| Income Bracket | # Households | Median Income |
| 15 to 24 Years | 0 (0.0%) | $0 |
| 25 to 44 Years | 32 (55.2%) | $0 |
| 45 to 64 Years | 8 (13.8%) | $0 |
| 65+ Years | 18 (31.0%) | $68,750 |
| Total | 58 (100.0%) | $64,348 |
Poverty in Woodlawn
Income Below Poverty by Sex and Age in Woodlawn
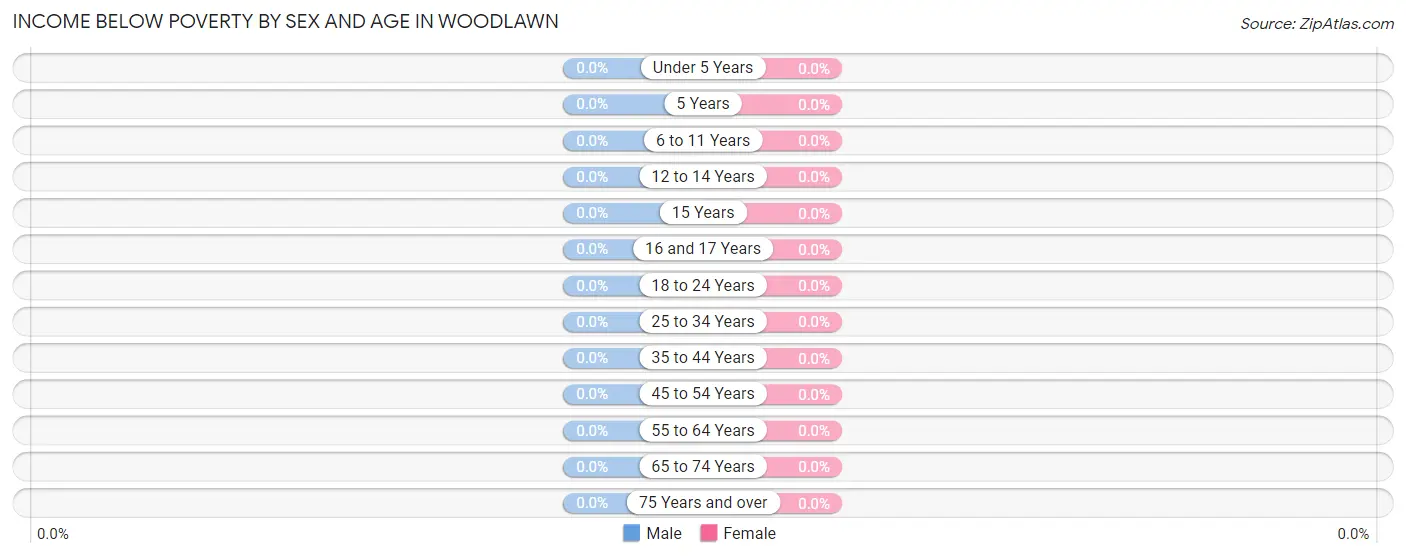
| Age Bracket | Male | Female |
| Under 5 Years | 0 (0.0%) | 0 (0.0%) |
| 5 Years | 0 (0.0%) | 0 (0.0%) |
| 6 to 11 Years | 0 (0.0%) | 0 (0.0%) |
| 12 to 14 Years | 0 (0.0%) | 0 (0.0%) |
| 15 Years | 0 (0.0%) | 0 (0.0%) |
| 16 and 17 Years | 0 (0.0%) | 0 (0.0%) |
| 18 to 24 Years | 0 (0.0%) | 0 (0.0%) |
| 25 to 34 Years | 0 (0.0%) | 0 (0.0%) |
| 35 to 44 Years | 0 (0.0%) | 0 (0.0%) |
| 45 to 54 Years | 0 (0.0%) | 0 (0.0%) |
| 55 to 64 Years | 0 (0.0%) | 0 (0.0%) |
| 65 to 74 Years | 0 (0.0%) | 0 (0.0%) |
| 75 Years and over | 0 (0.0%) | 0 (0.0%) |
| Total | 0 (0.0%) | 0 (0.0%) |
Income Above Poverty by Sex and Age in Woodlawn
According to the poverty statistics in Woodlawn, males aged 12 to 14 years and females aged under 5 years are the age groups that are most secure financially, with 100.0% of males and 100.0% of females in these age groups living above the poverty line.
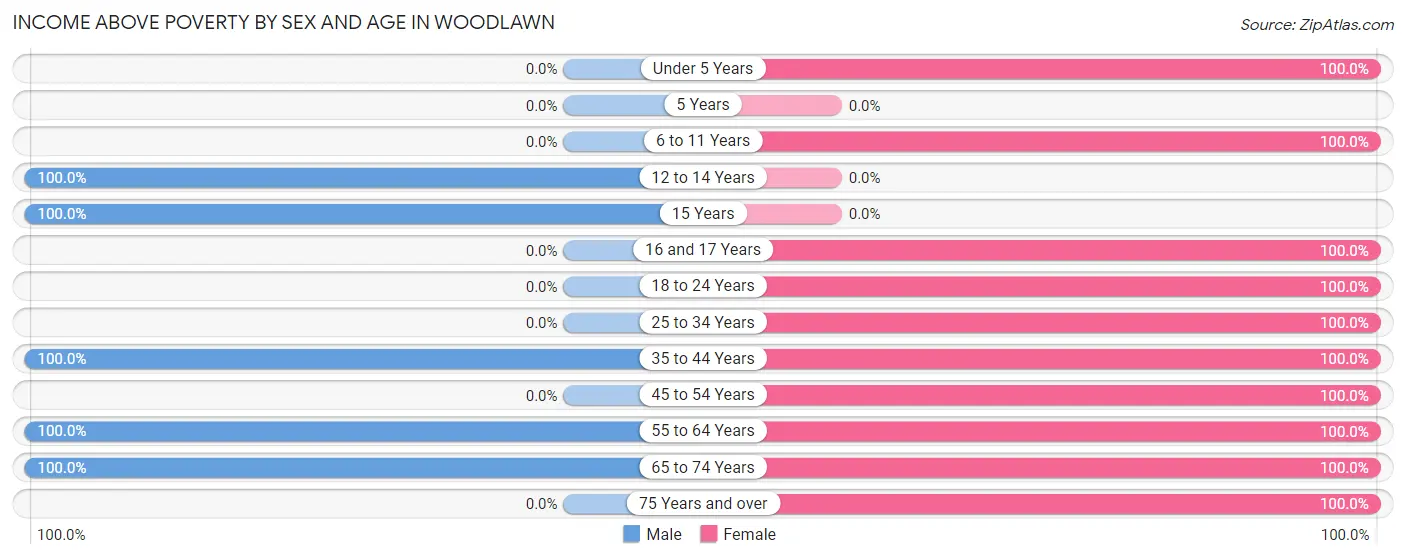
| Age Bracket | Male | Female |
| Under 5 Years | 0 (0.0%) | 22 (100.0%) |
| 5 Years | 0 (0.0%) | 0 (0.0%) |
| 6 to 11 Years | 0 (0.0%) | 5 (100.0%) |
| 12 to 14 Years | 4 (100.0%) | 0 (0.0%) |
| 15 Years | 5 (100.0%) | 0 (0.0%) |
| 16 and 17 Years | 0 (0.0%) | 4 (100.0%) |
| 18 to 24 Years | 0 (0.0%) | 16 (100.0%) |
| 25 to 34 Years | 0 (0.0%) | 35 (100.0%) |
| 35 to 44 Years | 31 (100.0%) | 6 (100.0%) |
| 45 to 54 Years | 0 (0.0%) | 5 (100.0%) |
| 55 to 64 Years | 5 (100.0%) | 10 (100.0%) |
| 65 to 74 Years | 5 (100.0%) | 4 (100.0%) |
| 75 Years and over | 0 (0.0%) | 9 (100.0%) |
| Total | 50 (100.0%) | 116 (100.0%) |
Income Below Poverty Among Married-Couple Families in Woodlawn
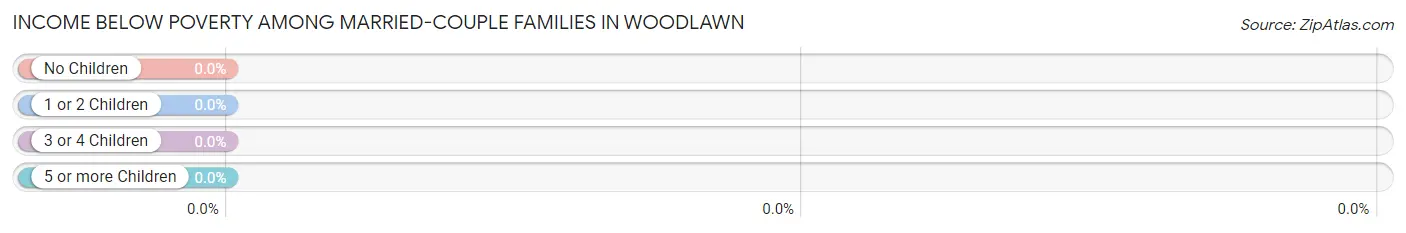
| Children | Above Poverty | Below Poverty |
| No Children | 10 (100.0%) | 0 (0.0%) |
| 1 or 2 Children | 32 (100.0%) | 0 (0.0%) |
| 3 or 4 Children | 0 (0.0%) | 0 (0.0%) |
| 5 or more Children | 0 (0.0%) | 0 (0.0%) |
| Total | 42 (100.0%) | 0 (0.0%) |
Income Below Poverty Among Single-Parent Households in Woodlawn
| Children | Single Father | Single Mother |
| No Children | 0 (0.0%) | 0 (0.0%) |
| 1 or 2 Children | 0 (0.0%) | 0 (0.0%) |
| 3 or 4 Children | 0 (0.0%) | 0 (0.0%) |
| 5 or more Children | 0 (0.0%) | 0 (0.0%) |
| Total | 0 (0.0%) | 0 (0.0%) |
Income Below Poverty Among Married-Couple vs Single-Parent Households in Woodlawn
| Children | Married-Couple Families | Single-Parent Households |
| No Children | 0 (0.0%) | 0 (0.0%) |
| 1 or 2 Children | 0 (0.0%) | 0 (0.0%) |
| 3 or 4 Children | 0 (0.0%) | 0 (0.0%) |
| 5 or more Children | 0 (0.0%) | 0 (0.0%) |
| Total | 0 (0.0%) | 0 (0.0%) |
Race in Woodlawn
The most populous races in Woodlawn are , and White / Caucasian (166 | 100.0%).
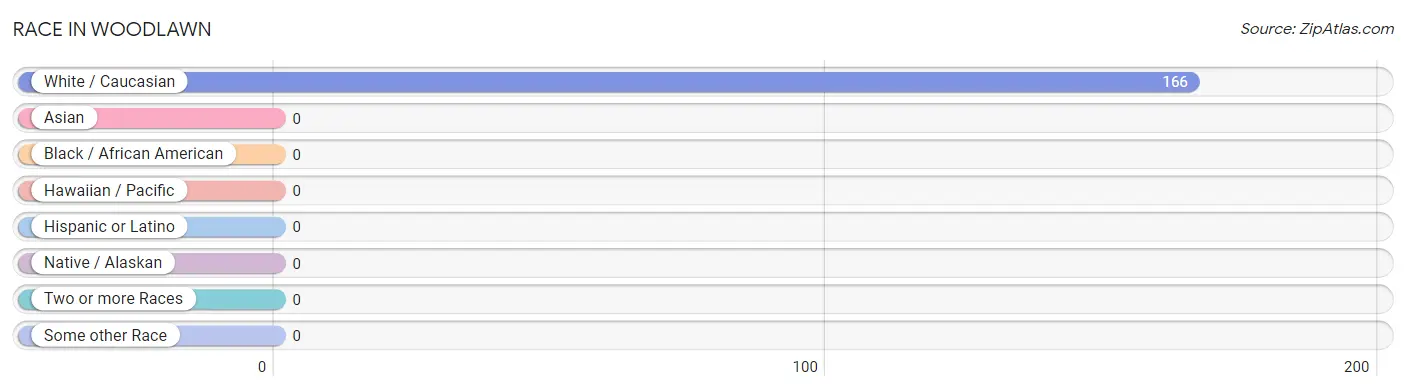
| Race | # Population | % Population |
| Asian | 0 | 0.0% |
| Black / African American | 0 | 0.0% |
| Hawaiian / Pacific | 0 | 0.0% |
| Hispanic or Latino | 0 | 0.0% |
| Native / Alaskan | 0 | 0.0% |
| White / Caucasian | 166 | 100.0% |
| Two or more Races | 0 | 0.0% |
| Some other Race | 0 | 0.0% |
| Total | 166 | 100.0% |
Ancestry in Woodlawn
The most populous ancestries reported in Woodlawn are English (84 | 50.6%), Irish (24 | 14.5%), French (20 | 12.0%), Scottish (9 | 5.4%), and American (8 | 4.8%), together accounting for 87.4% of all Woodlawn residents.
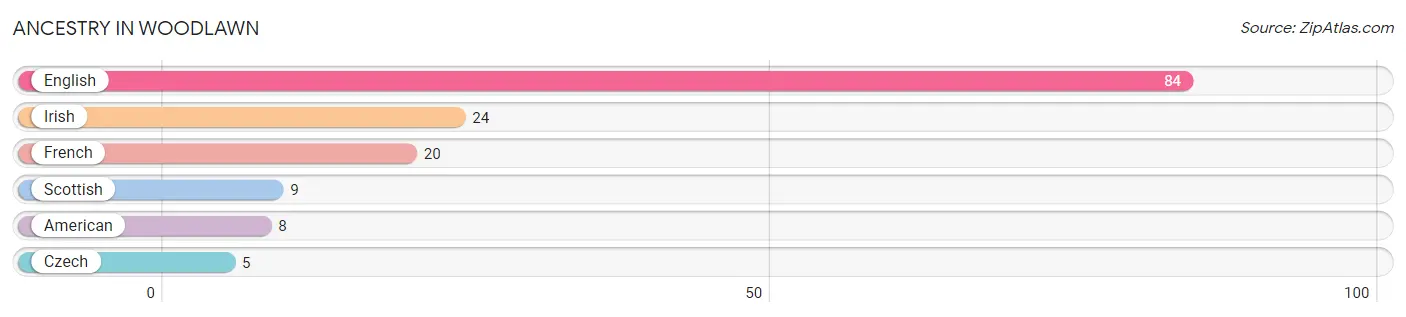
| Ancestry | # Population | % Population |
| American | 8 | 4.8% |
| Czech | 5 | 3.0% |
| English | 84 | 50.6% |
| French | 20 | 12.0% |
| Irish | 24 | 14.5% |
| Scottish | 9 | 5.4% | View All 6 Rows |
Immigrants in Woodlawn

| Immigration Origin | # Population | % Population | View All 0 Rows |
Sex and Age in Woodlawn
Sex and Age in Woodlawn
The most populous age groups in Woodlawn are 35 to 39 Years (23 | 46.0%) for men and 25 to 29 Years (35 | 30.2%) for women.
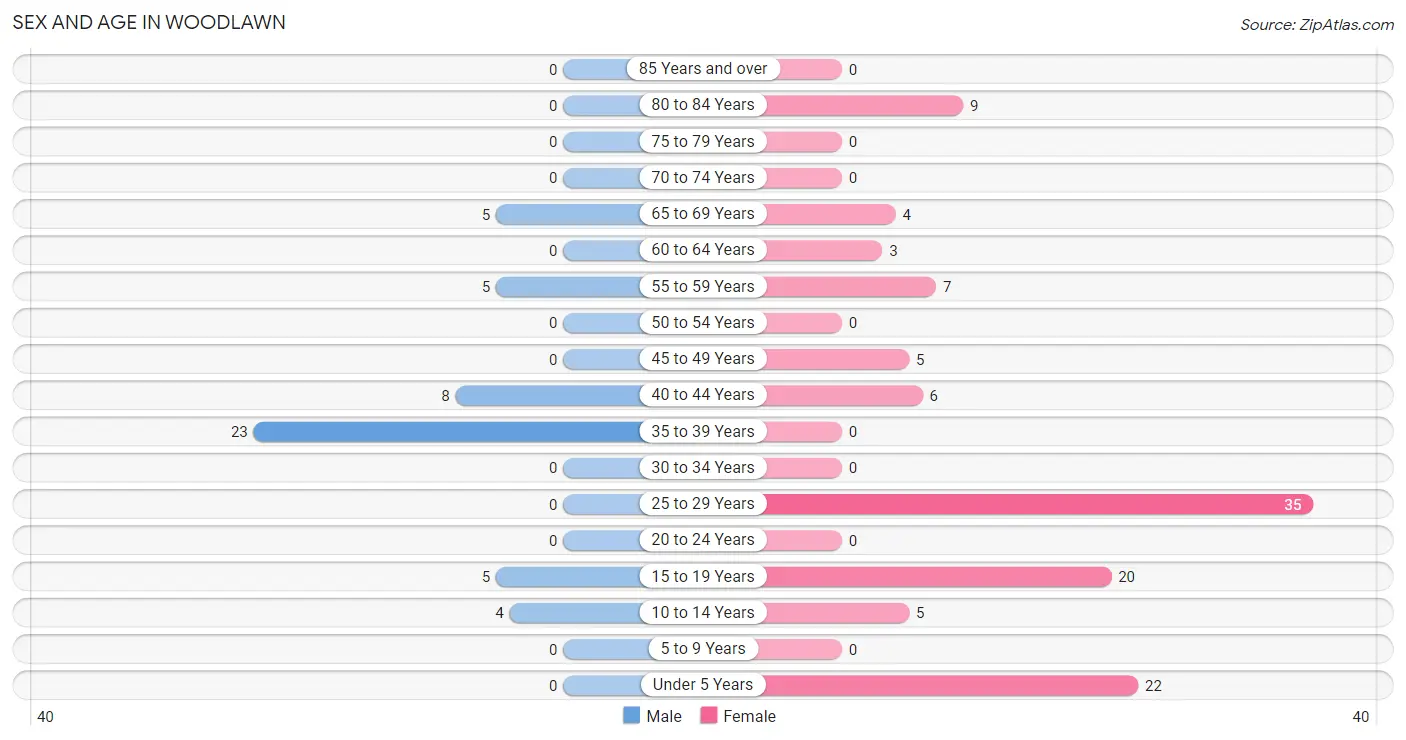
| Age Bracket | Male | Female |
| Under 5 Years | 0 (0.0%) | 22 (19.0%) |
| 5 to 9 Years | 0 (0.0%) | 0 (0.0%) |
| 10 to 14 Years | 4 (8.0%) | 5 (4.3%) |
| 15 to 19 Years | 5 (10.0%) | 20 (17.2%) |
| 20 to 24 Years | 0 (0.0%) | 0 (0.0%) |
| 25 to 29 Years | 0 (0.0%) | 35 (30.2%) |
| 30 to 34 Years | 0 (0.0%) | 0 (0.0%) |
| 35 to 39 Years | 23 (46.0%) | 0 (0.0%) |
| 40 to 44 Years | 8 (16.0%) | 6 (5.2%) |
| 45 to 49 Years | 0 (0.0%) | 5 (4.3%) |
| 50 to 54 Years | 0 (0.0%) | 0 (0.0%) |
| 55 to 59 Years | 5 (10.0%) | 7 (6.0%) |
| 60 to 64 Years | 0 (0.0%) | 3 (2.6%) |
| 65 to 69 Years | 5 (10.0%) | 4 (3.5%) |
| 70 to 74 Years | 0 (0.0%) | 0 (0.0%) |
| 75 to 79 Years | 0 (0.0%) | 0 (0.0%) |
| 80 to 84 Years | 0 (0.0%) | 9 (7.8%) |
| 85 Years and over | 0 (0.0%) | 0 (0.0%) |
| Total | 50 (100.0%) | 116 (100.0%) |
Families and Households in Woodlawn
Median Family Size in Woodlawn
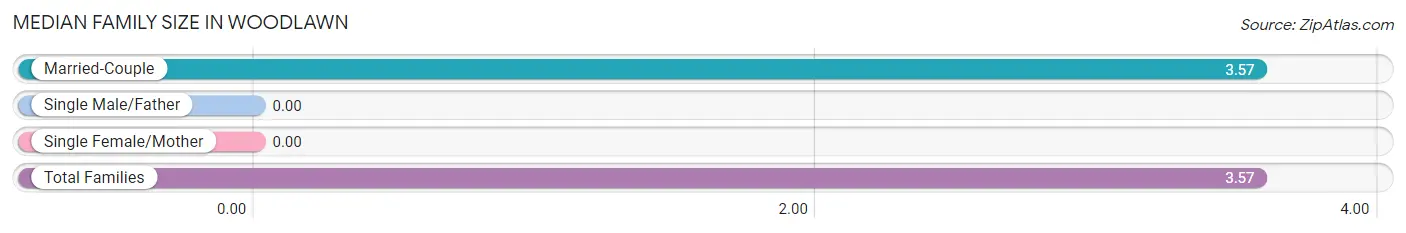
| Family Type | # Families | Family Size |
| Married-Couple | 42 (100.0%) | 3.57 |
| Single Male/Father | 0 (0.0%) | - |
| Single Female/Mother | 0 (0.0%) | - |
| Total Families | 42 (100.0%) | 3.57 |
Median Household Size in Woodlawn
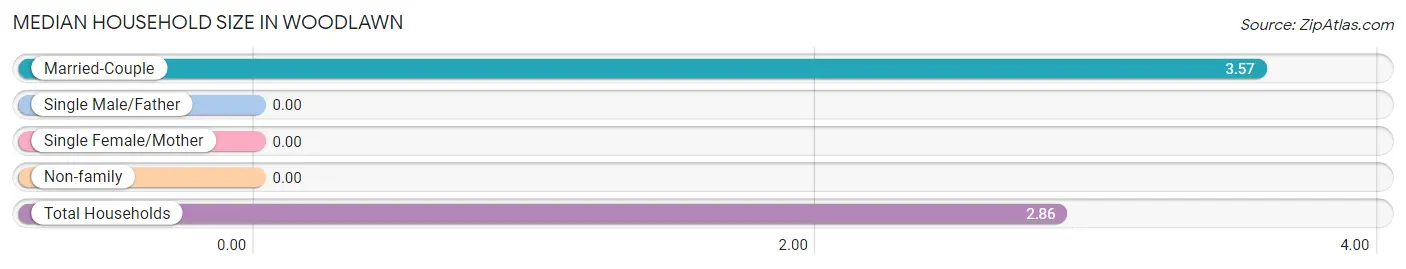
| Household Type | # Households | Household Size |
| Married-Couple | 42 (72.4%) | 3.57 |
| Single Male/Father | 0 (0.0%) | - |
| Single Female/Mother | 0 (0.0%) | - |
| Non-family | 16 (27.6%) | - |
| Total Households | 58 (100.0%) | 2.86 |
Household Size by Marriage Status in Woodlawn
Out of a total of 58 households in Woodlawn, 42 (72.4%) are family households, while 16 (27.6%) are nonfamily households. The most numerous type of family households are 3-person households, comprising 28, and the most common type of nonfamily households are 1-person households, comprising 16.
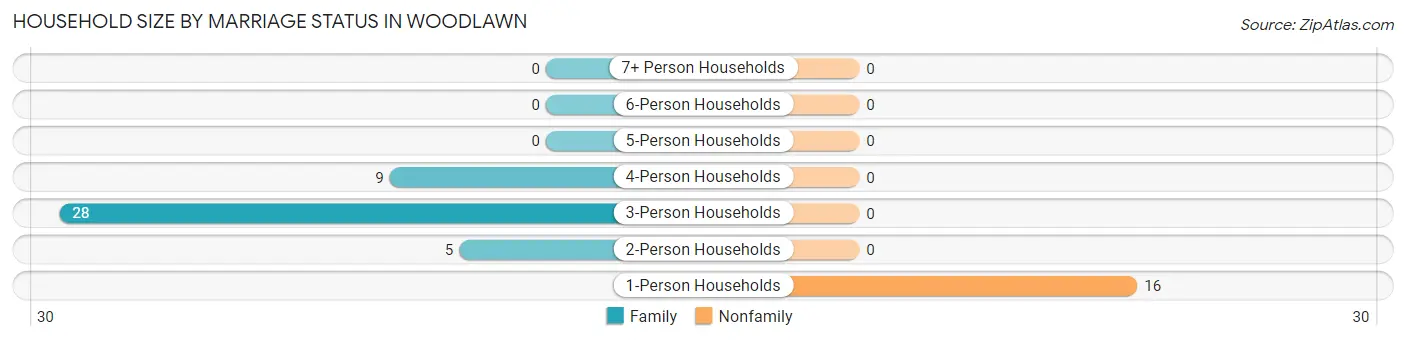
| Household Size | Family Households | Nonfamily Households |
| 1-Person Households | - | 16 (27.6%) |
| 2-Person Households | 5 (8.6%) | 0 (0.0%) |
| 3-Person Households | 28 (48.3%) | 0 (0.0%) |
| 4-Person Households | 9 (15.5%) | 0 (0.0%) |
| 5-Person Households | 0 (0.0%) | 0 (0.0%) |
| 6-Person Households | 0 (0.0%) | 0 (0.0%) |
| 7+ Person Households | 0 (0.0%) | 0 (0.0%) |
| Total | 42 (72.4%) | 16 (27.6%) |
Female Fertility in Woodlawn
Fertility by Age in Woodlawn
| Age Bracket | Women with Births | Births / 1,000 Women |
| 15 to 19 years | 0 (0.0%) | 0.0 |
| 20 to 34 years | 0 (0.0%) | 0.0 |
| 35 to 50 years | 0 (0.0%) | 0.0 |
| Total | 0 (0.0%) | 0.0 |
Fertility by Age by Marriage Status in Woodlawn
| Age Bracket | Married | Unmarried |
| 15 to 19 years | 0 (0.0%) | 0 (0.0%) |
| 20 to 34 years | 0 (0.0%) | 0 (0.0%) |
| 35 to 50 years | 0 (0.0%) | 0 (0.0%) |
| Total | 0 (0.0%) | 0 (0.0%) |
Fertility by Education in Woodlawn
| Educational Attainment | Women with Births | Births / 1,000 Women |
| Less than High School | 0 (0.0%) | 0.0 |
| High School Diploma | 0 (0.0%) | 0.0 |
| College or Associate's Degree | 0 (0.0%) | 0.0 |
| Bachelor's Degree | 0 (0.0%) | 0.0 |
| Graduate Degree | 0 (0.0%) | 0.0 |
| Total | 0 (0.0%) | 0.0 |
Fertility by Education by Marriage Status in Woodlawn
| Educational Attainment | Married | Unmarried |
| Less than High School | 0 (0.0%) | 0 (0.0%) |
| High School Diploma | 0 (0.0%) | 0 (0.0%) |
| College or Associate's Degree | 0 (0.0%) | 0 (0.0%) |
| Bachelor's Degree | 0 (0.0%) | 0 (0.0%) |
| Graduate Degree | 0 (0.0%) | 0 (0.0%) |
| Total | 0 (0.0%) | 0 (0.0%) |
Employment Characteristics in Woodlawn
Employment by Class of Employer in Woodlawn
Among the 58 employed individuals in Woodlawn, private company employees (24 | 41.4%), federal government employees (23 | 39.7%), and self-employed (not incorporated) (4 | 6.9%) make up the most common classes of employment.
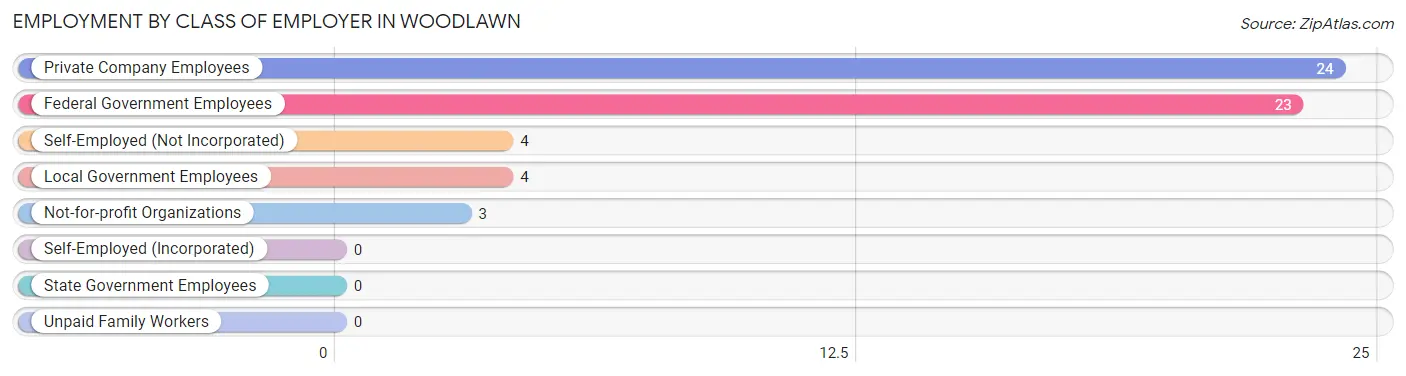
| Employer Class | # Employees | % Employees |
| Private Company Employees | 24 | 41.4% |
| Self-Employed (Incorporated) | 0 | 0.0% |
| Self-Employed (Not Incorporated) | 4 | 6.9% |
| Not-for-profit Organizations | 3 | 5.2% |
| Local Government Employees | 4 | 6.9% |
| State Government Employees | 0 | 0.0% |
| Federal Government Employees | 23 | 39.7% |
| Unpaid Family Workers | 0 | 0.0% |
| Total | 58 | 100.0% |
Employment Status by Age in Woodlawn
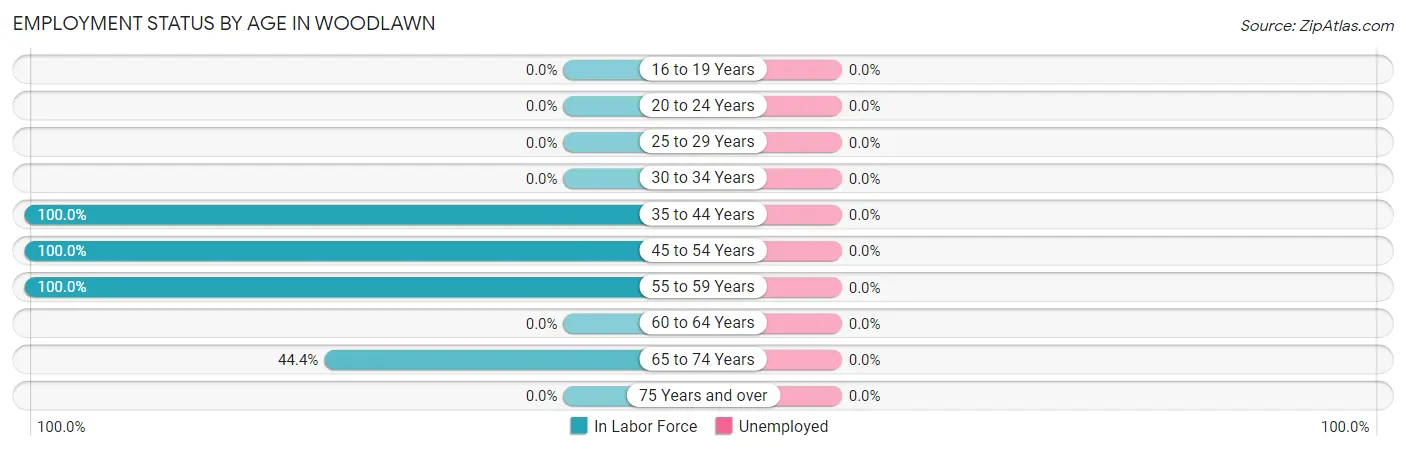
| Age Bracket | In Labor Force | Unemployed |
| 16 to 19 Years | 0 (0.0%) | 0 (0.0%) |
| 20 to 24 Years | 0 (0.0%) | 0 (0.0%) |
| 25 to 29 Years | 0 (0.0%) | 0 (0.0%) |
| 30 to 34 Years | 0 (0.0%) | 0 (0.0%) |
| 35 to 44 Years | 37 (100.0%) | 0 (0.0%) |
| 45 to 54 Years | 5 (100.0%) | 0 (0.0%) |
| 55 to 59 Years | 12 (100.0%) | 0 (0.0%) |
| 60 to 64 Years | 0 (0.0%) | 0 (0.0%) |
| 65 to 74 Years | 4 (44.4%) | 0 (0.0%) |
| 75 Years and over | 0 (0.0%) | 0 (0.0%) |
| Total | 58 (44.6%) | 0 (0.0%) |
Employment Status by Educational Attainment in Woodlawn
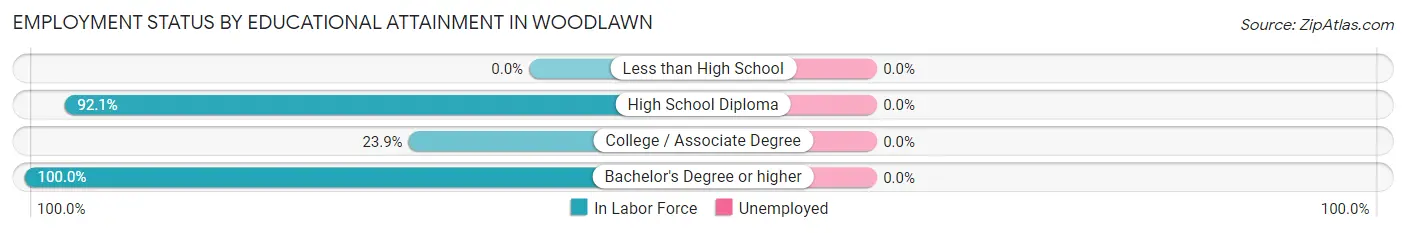
| Educational Attainment | In Labor Force | Unemployed |
| Less than High School | 0 (0.0%) | 0 (0.0%) |
| High School Diploma | 35 (92.1%) | 0 (0.0%) |
| College / Associate Degree | 11 (23.9%) | 0 (0.0%) |
| Bachelor's Degree or higher | 8 (100.0%) | 0 (0.0%) |
| Total | 54 (58.7%) | 0 (0.0%) |
Employment Occupations by Sex in Woodlawn
Management, Business, Science and Arts Occupations
The most common Management, Business, Science and Arts occupations in Woodlawn are Health Diagnosing & Treating (14 | 24.1%), Health Technologists (11 | 19.0%), Community & Social Service (4 | 6.9%), Education Instruction & Library (4 | 6.9%), and Management (3 | 5.2%).
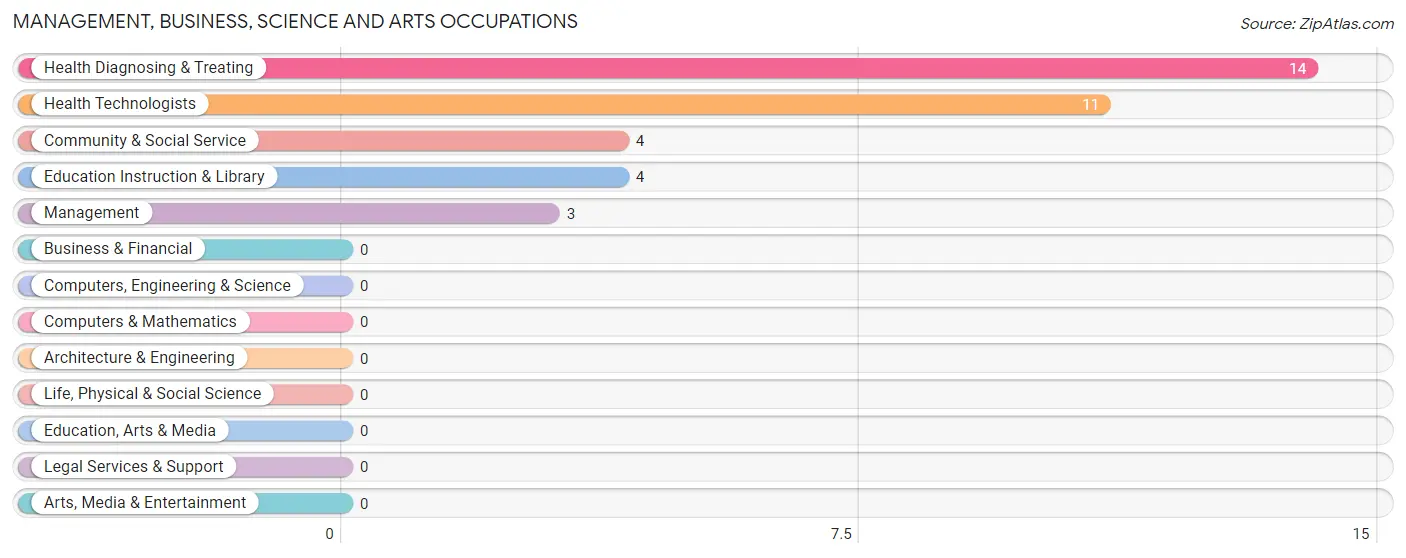
Management, Business, Science and Arts Occupations by Sex
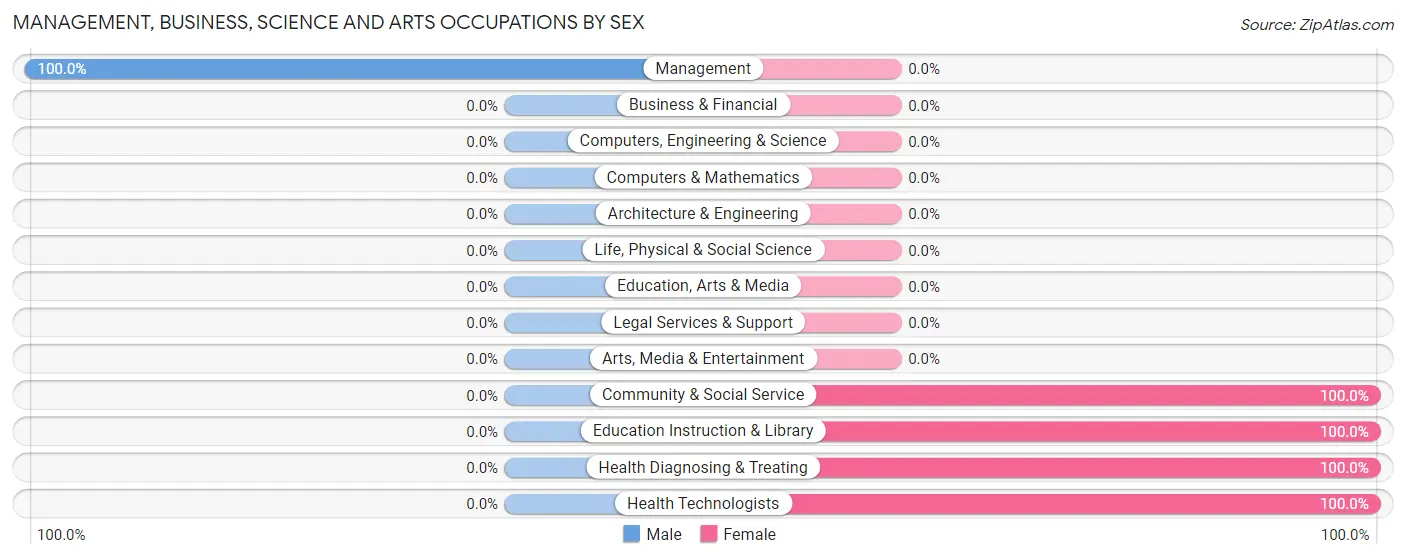
| Occupation | Male | Female |
| Management | 3 (100.0%) | 0 (0.0%) |
| Business & Financial | 0 (0.0%) | 0 (0.0%) |
| Computers, Engineering & Science | 0 (0.0%) | 0 (0.0%) |
| Computers & Mathematics | 0 (0.0%) | 0 (0.0%) |
| Architecture & Engineering | 0 (0.0%) | 0 (0.0%) |
| Life, Physical & Social Science | 0 (0.0%) | 0 (0.0%) |
| Community & Social Service | 0 (0.0%) | 4 (100.0%) |
| Education, Arts & Media | 0 (0.0%) | 0 (0.0%) |
| Legal Services & Support | 0 (0.0%) | 0 (0.0%) |
| Education Instruction & Library | 0 (0.0%) | 4 (100.0%) |
| Arts, Media & Entertainment | 0 (0.0%) | 0 (0.0%) |
| Health Diagnosing & Treating | 0 (0.0%) | 14 (100.0%) |
| Health Technologists | 0 (0.0%) | 11 (100.0%) |
| Total (Category) | 3 (14.3%) | 18 (85.7%) |
| Total (Overall) | 36 (62.1%) | 22 (37.9%) |
Services Occupations
Services Occupations by Sex
| Occupation | Male | Female |
| Healthcare Support | 0 (0.0%) | 0 (0.0%) |
| Security & Protection | 0 (0.0%) | 0 (0.0%) |
| Firefighting & Prevention | 0 (0.0%) | 0 (0.0%) |
| Law Enforcement | 0 (0.0%) | 0 (0.0%) |
| Food Preparation & Serving | 0 (0.0%) | 0 (0.0%) |
| Cleaning & Maintenance | 0 (0.0%) | 0 (0.0%) |
| Personal Care & Service | 0 (0.0%) | 0 (0.0%) |
| Total (Category) | 0 (0.0%) | 0 (0.0%) |
| Total (Overall) | 36 (62.1%) | 22 (37.9%) |
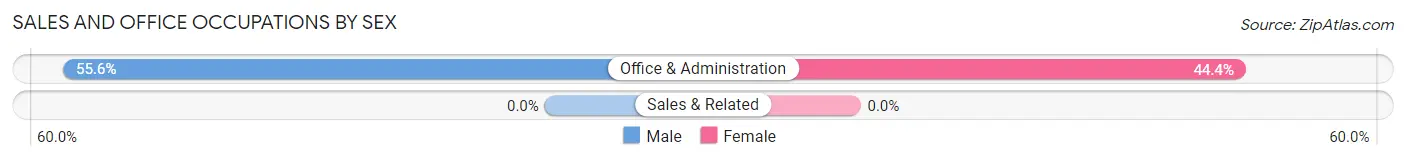
Sales and Office Occupations
The most common Sales and Office occupations in Woodlawn are , and Office & Administration (9 | 15.5%).
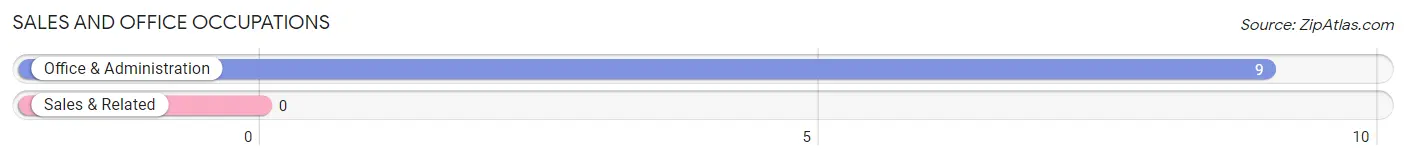
Sales and Office Occupations by Sex
| Occupation | Male | Female |
| Sales & Related | 0 (0.0%) | 0 (0.0%) |
| Office & Administration | 5 (55.6%) | 4 (44.4%) |
| Total (Category) | 5 (55.6%) | 4 (44.4%) |
| Total (Overall) | 36 (62.1%) | 22 (37.9%) |
Natural Resources, Construction and Maintenance Occupations
The most common Natural Resources, Construction and Maintenance occupations in Woodlawn are , and Construction & Extraction (5 | 8.6%).
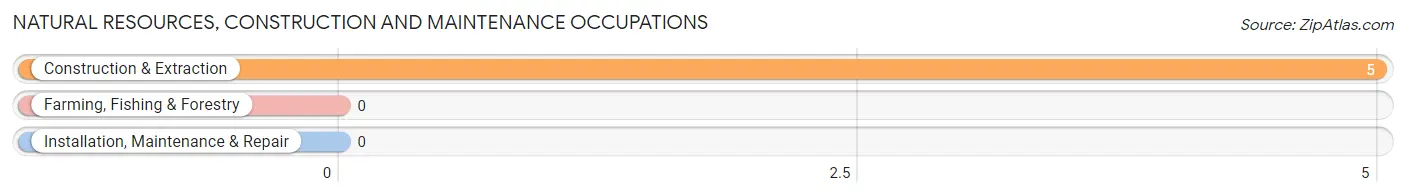
Natural Resources, Construction and Maintenance Occupations by Sex
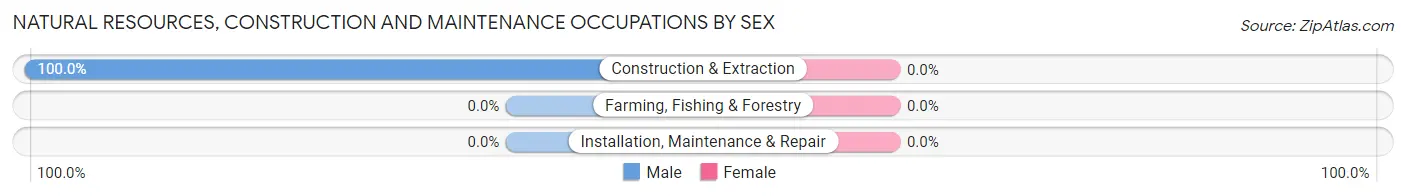
| Occupation | Male | Female |
| Farming, Fishing & Forestry | 0 (0.0%) | 0 (0.0%) |
| Construction & Extraction | 5 (100.0%) | 0 (0.0%) |
| Installation, Maintenance & Repair | 0 (0.0%) | 0 (0.0%) |
| Total (Category) | 5 (100.0%) | 0 (0.0%) |
| Total (Overall) | 36 (62.1%) | 22 (37.9%) |
Production, Transportation and Moving Occupations
The most common Production, Transportation and Moving occupations in Woodlawn are , and Transportation (23 | 39.7%).
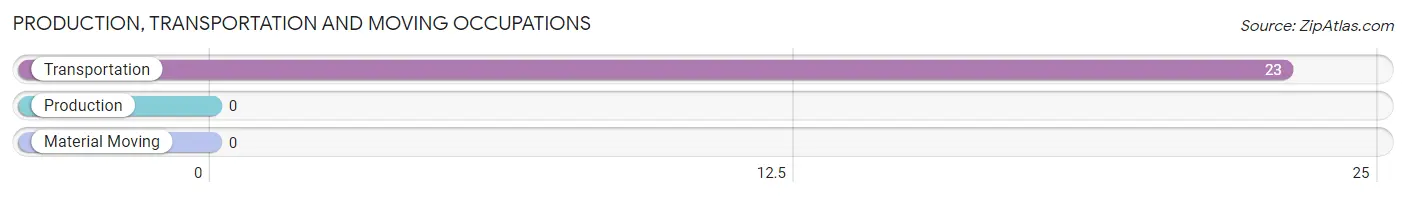
Production, Transportation and Moving Occupations by Sex
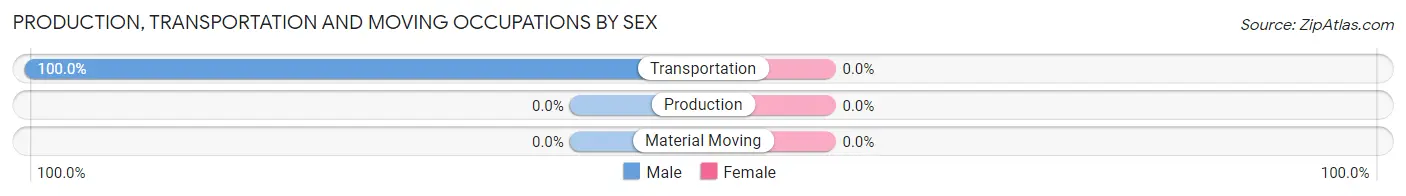
| Occupation | Male | Female |
| Production | 0 (0.0%) | 0 (0.0%) |
| Transportation | 23 (100.0%) | 0 (0.0%) |
| Material Moving | 0 (0.0%) | 0 (0.0%) |
| Total (Category) | 23 (100.0%) | 0 (0.0%) |
| Total (Overall) | 36 (62.1%) | 22 (37.9%) |
Employment Industries by Sex in Woodlawn
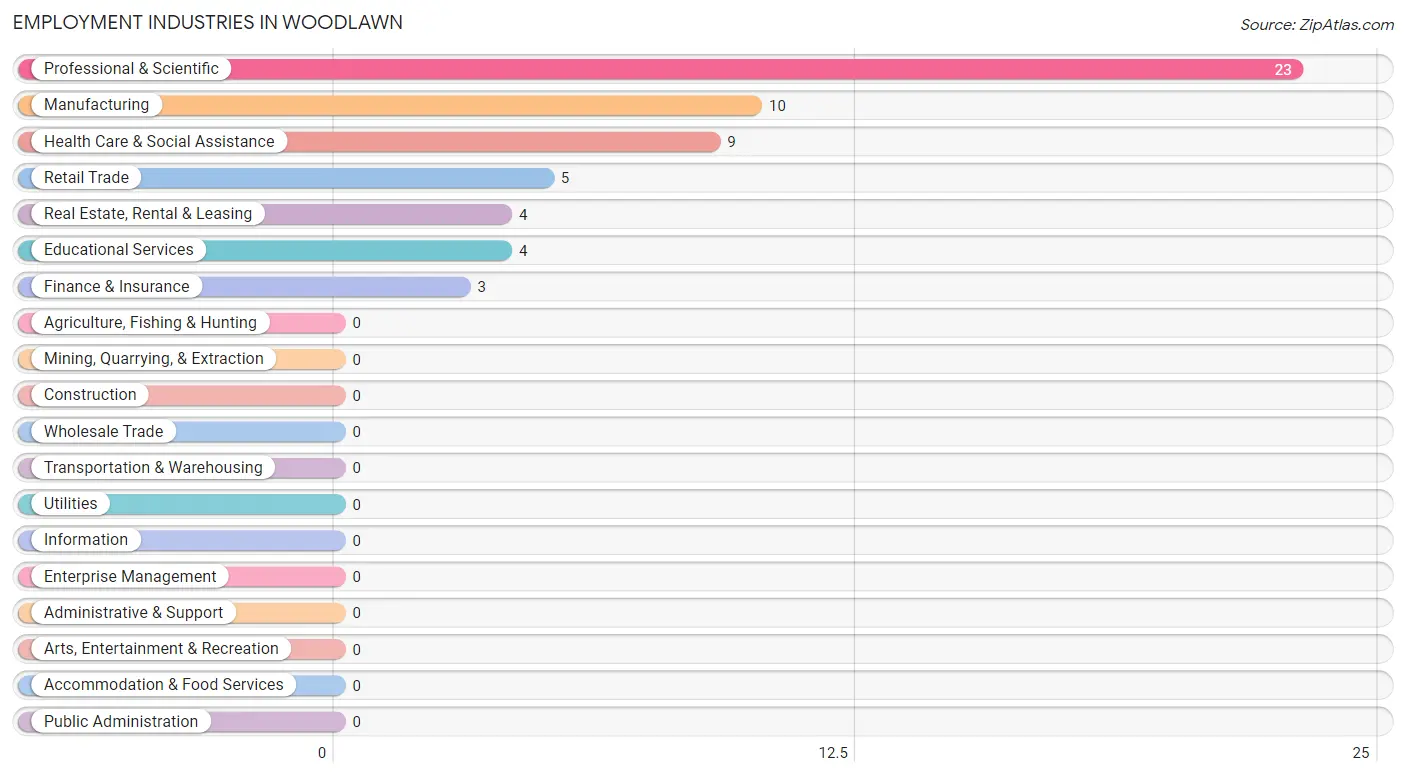
Employment Industries in Woodlawn
The major employment industries in Woodlawn include Professional & Scientific (23 | 39.7%), Manufacturing (10 | 17.2%), Health Care & Social Assistance (9 | 15.5%), Retail Trade (5 | 8.6%), and Real Estate, Rental & Leasing (4 | 6.9%).
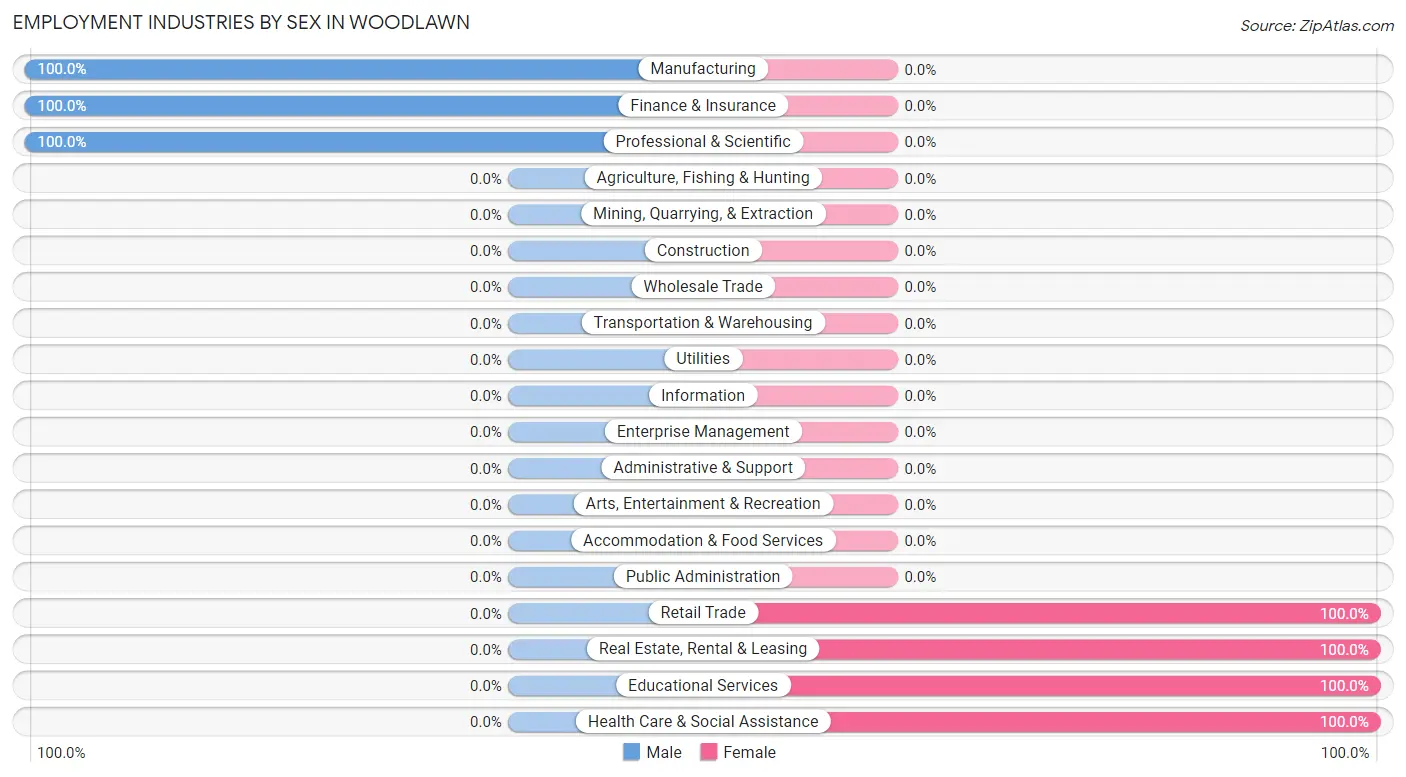
Employment Industries by Sex in Woodlawn
The Woodlawn industries that see more men than women are Manufacturing (100.0%), Finance & Insurance (100.0%), and Professional & Scientific (100.0%), whereas the industries that tend to have a higher number of women are Retail Trade (100.0%), Real Estate, Rental & Leasing (100.0%), and Educational Services (100.0%).
| Industry | Male | Female |
| Agriculture, Fishing & Hunting | 0 (0.0%) | 0 (0.0%) |
| Mining, Quarrying, & Extraction | 0 (0.0%) | 0 (0.0%) |
| Construction | 0 (0.0%) | 0 (0.0%) |
| Manufacturing | 10 (100.0%) | 0 (0.0%) |
| Wholesale Trade | 0 (0.0%) | 0 (0.0%) |
| Retail Trade | 0 (0.0%) | 5 (100.0%) |
| Transportation & Warehousing | 0 (0.0%) | 0 (0.0%) |
| Utilities | 0 (0.0%) | 0 (0.0%) |
| Information | 0 (0.0%) | 0 (0.0%) |
| Finance & Insurance | 3 (100.0%) | 0 (0.0%) |
| Real Estate, Rental & Leasing | 0 (0.0%) | 4 (100.0%) |
| Professional & Scientific | 23 (100.0%) | 0 (0.0%) |
| Enterprise Management | 0 (0.0%) | 0 (0.0%) |
| Administrative & Support | 0 (0.0%) | 0 (0.0%) |
| Educational Services | 0 (0.0%) | 4 (100.0%) |
| Health Care & Social Assistance | 0 (0.0%) | 9 (100.0%) |
| Arts, Entertainment & Recreation | 0 (0.0%) | 0 (0.0%) |
| Accommodation & Food Services | 0 (0.0%) | 0 (0.0%) |
| Public Administration | 0 (0.0%) | 0 (0.0%) |
| Total | 36 (62.1%) | 22 (37.9%) |
Education in Woodlawn
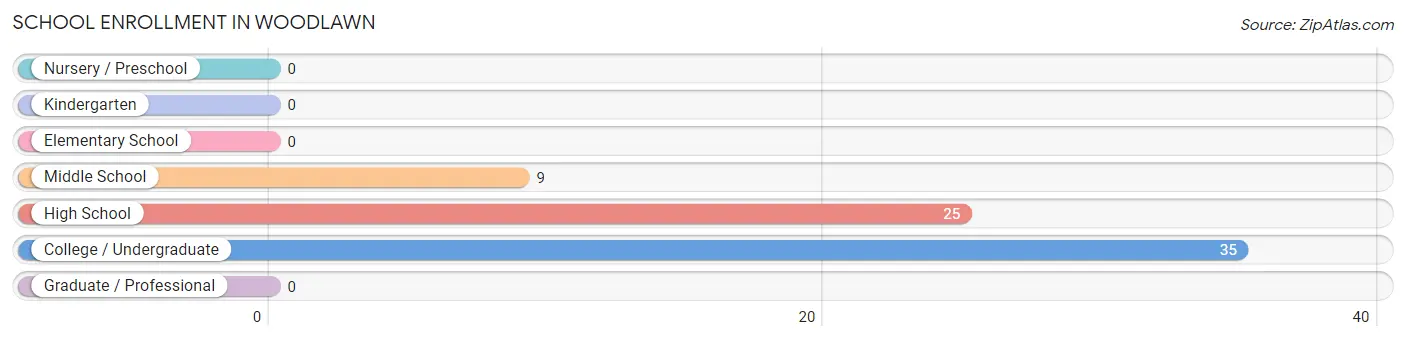
School Enrollment in Woodlawn
The most common levels of schooling among the 69 students in Woodlawn are college / undergraduate (35 | 50.7%), high school (25 | 36.2%), and middle school (9 | 13.0%).
| School Level | # Students | % Students |
| Nursery / Preschool | 0 | 0.0% |
| Kindergarten | 0 | 0.0% |
| Elementary School | 0 | 0.0% |
| Middle School | 9 | 13.0% |
| High School | 25 | 36.2% |
| College / Undergraduate | 35 | 50.7% |
| Graduate / Professional | 0 | 0.0% |
| Total | 69 | 100.0% |
School Enrollment by Age by Funding Source in Woodlawn
Out of a total of 69 students who are enrolled in schools in Woodlawn, 35 (50.7%) attend a private institution, while the remaining 34 (49.3%) are enrolled in public schools. The age group of 25 to 34 year olds has the highest likelihood of being enrolled in private schools, with 35 (100.0% in the age bracket) enrolled. Conversely, the age group of 10 to 14 year olds has the lowest likelihood of being enrolled in a private school, with 9 (100.0% in the age bracket) attending a public institution.
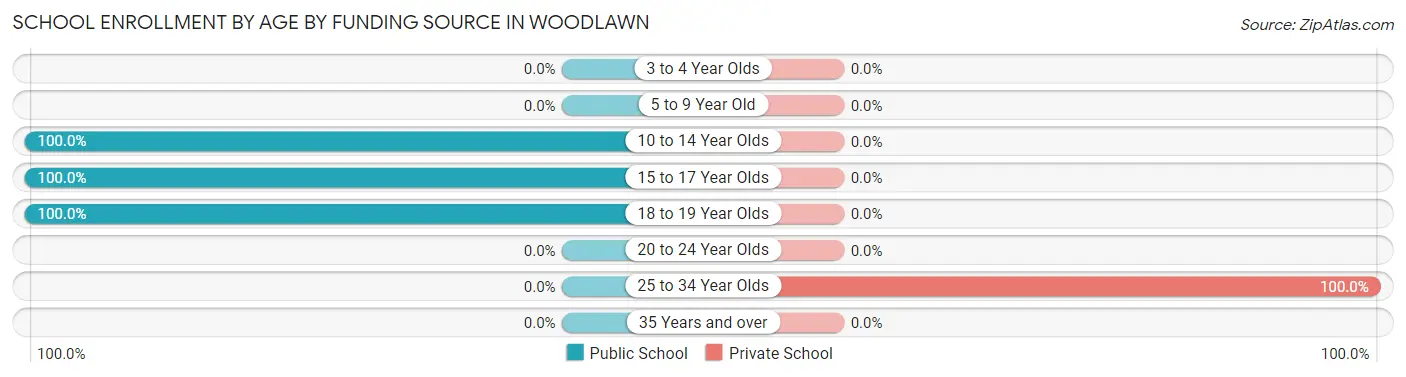
| Age Bracket | Public School | Private School |
| 3 to 4 Year Olds | 0 (0.0%) | 0 (0.0%) |
| 5 to 9 Year Old | 0 (0.0%) | 0 (0.0%) |
| 10 to 14 Year Olds | 9 (100.0%) | 0 (0.0%) |
| 15 to 17 Year Olds | 9 (100.0%) | 0 (0.0%) |
| 18 to 19 Year Olds | 16 (100.0%) | 0 (0.0%) |
| 20 to 24 Year Olds | 0 (0.0%) | 0 (0.0%) |
| 25 to 34 Year Olds | 0 (0.0%) | 35 (100.0%) |
| 35 Years and over | 0 (0.0%) | 0 (0.0%) |
| Total | 34 (49.3%) | 35 (50.7%) |
Educational Attainment by Field of Study in Woodlawn
Science & technology (5 | 41.7%), education (4 | 33.3%), and bio, nature & agricultural (3 | 25.0%) are the most common fields of study among 12 individuals in Woodlawn who have obtained a bachelor's degree or higher.
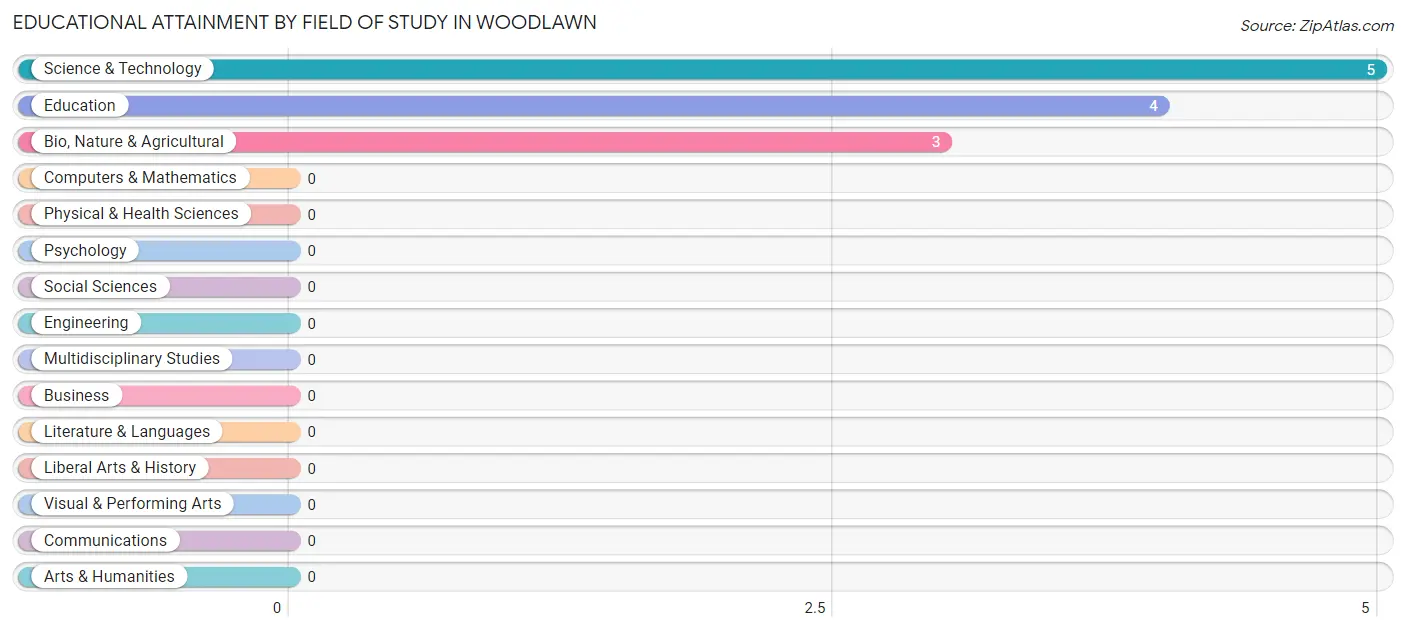
| Field of Study | # Graduates | % Graduates |
| Computers & Mathematics | 0 | 0.0% |
| Bio, Nature & Agricultural | 3 | 25.0% |
| Physical & Health Sciences | 0 | 0.0% |
| Psychology | 0 | 0.0% |
| Social Sciences | 0 | 0.0% |
| Engineering | 0 | 0.0% |
| Multidisciplinary Studies | 0 | 0.0% |
| Science & Technology | 5 | 41.7% |
| Business | 0 | 0.0% |
| Education | 4 | 33.3% |
| Literature & Languages | 0 | 0.0% |
| Liberal Arts & History | 0 | 0.0% |
| Visual & Performing Arts | 0 | 0.0% |
| Communications | 0 | 0.0% |
| Arts & Humanities | 0 | 0.0% |
| Total | 12 | 100.0% |
Transportation & Commute in Woodlawn
Vehicle Availability by Sex in Woodlawn
The most prevalent vehicle ownership categories in Woodlawn are males with 3 vehicles (36, accounting for 100.0%) and females with 3 vehicles (18, making up 163.6%).
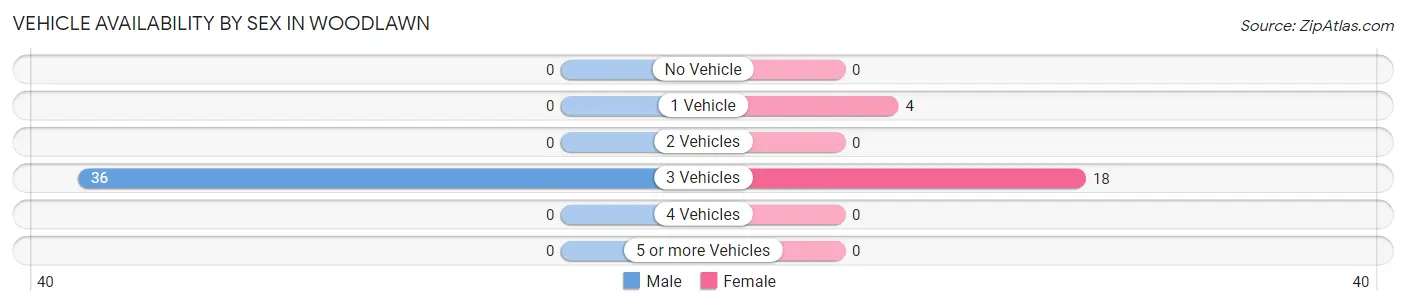
| Vehicles Available | Male | Female |
| No Vehicle | 0 (0.0%) | 0 (0.0%) |
| 1 Vehicle | 0 (0.0%) | 4 (18.2%) |
| 2 Vehicles | 0 (0.0%) | 0 (0.0%) |
| 3 Vehicles | 36 (100.0%) | 18 (81.8%) |
| 4 Vehicles | 0 (0.0%) | 0 (0.0%) |
| 5 or more Vehicles | 0 (0.0%) | 0 (0.0%) |
| Total | 36 (100.0%) | 22 (100.0%) |
Commute Time in Woodlawn
The most frequently occuring commute durations in Woodlawn are 40 to 44 minutes (23 commuters, 39.7%), 30 to 34 minutes (12 commuters, 20.7%), and 20 to 24 minutes (11 commuters, 19.0%).
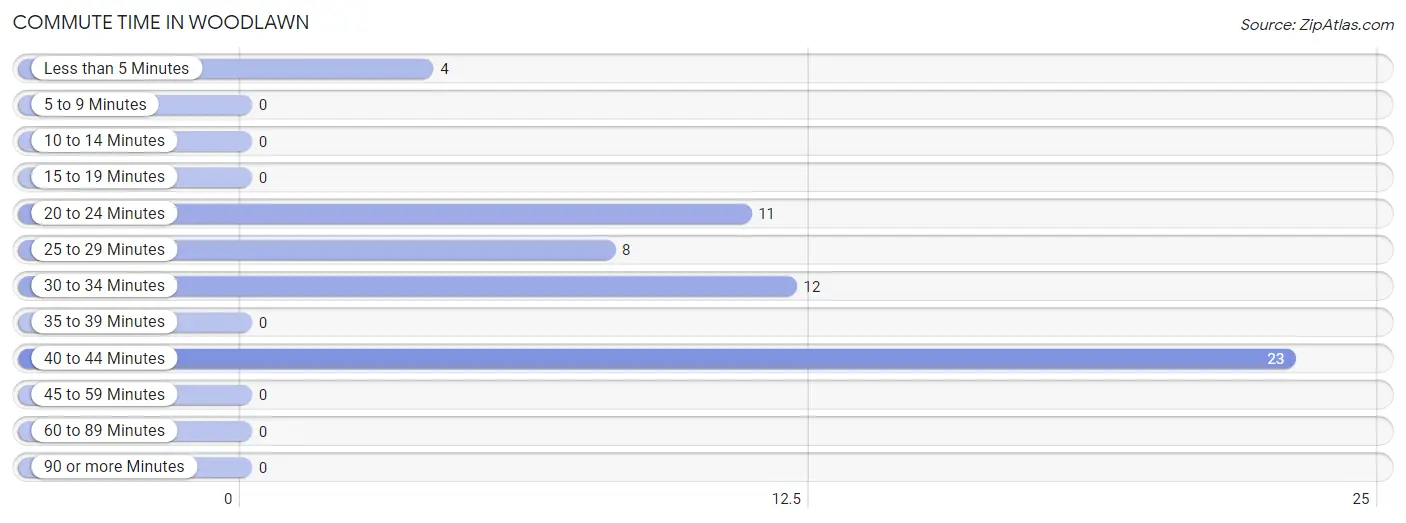
| Commute Time | # Commuters | % Commuters |
| Less than 5 Minutes | 4 | 6.9% |
| 5 to 9 Minutes | 0 | 0.0% |
| 10 to 14 Minutes | 0 | 0.0% |
| 15 to 19 Minutes | 0 | 0.0% |
| 20 to 24 Minutes | 11 | 19.0% |
| 25 to 29 Minutes | 8 | 13.8% |
| 30 to 34 Minutes | 12 | 20.7% |
| 35 to 39 Minutes | 0 | 0.0% |
| 40 to 44 Minutes | 23 | 39.7% |
| 45 to 59 Minutes | 0 | 0.0% |
| 60 to 89 Minutes | 0 | 0.0% |
| 90 or more Minutes | 0 | 0.0% |
Commute Time by Sex in Woodlawn
The most common commute times in Woodlawn are 40 to 44 minutes (23 commuters, 63.9%) for males and 20 to 24 minutes (11 commuters, 50.0%) for females.
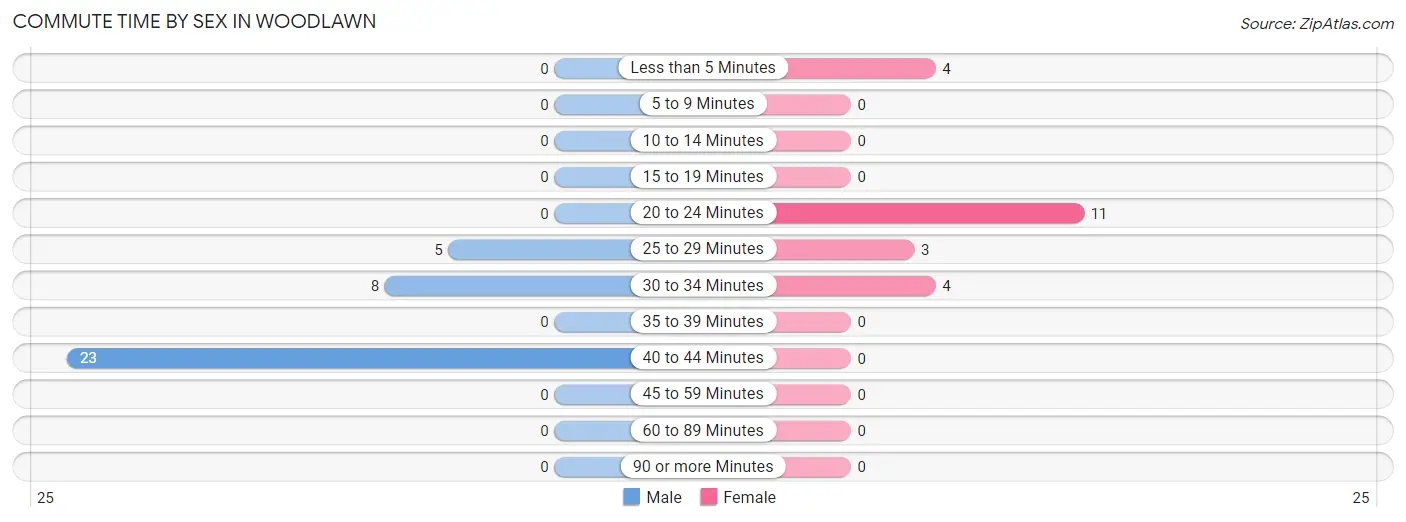
| Commute Time | Male | Female |
| Less than 5 Minutes | 0 (0.0%) | 4 (18.2%) |
| 5 to 9 Minutes | 0 (0.0%) | 0 (0.0%) |
| 10 to 14 Minutes | 0 (0.0%) | 0 (0.0%) |
| 15 to 19 Minutes | 0 (0.0%) | 0 (0.0%) |
| 20 to 24 Minutes | 0 (0.0%) | 11 (50.0%) |
| 25 to 29 Minutes | 5 (13.9%) | 3 (13.6%) |
| 30 to 34 Minutes | 8 (22.2%) | 4 (18.2%) |
| 35 to 39 Minutes | 0 (0.0%) | 0 (0.0%) |
| 40 to 44 Minutes | 23 (63.9%) | 0 (0.0%) |
| 45 to 59 Minutes | 0 (0.0%) | 0 (0.0%) |
| 60 to 89 Minutes | 0 (0.0%) | 0 (0.0%) |
| 90 or more Minutes | 0 (0.0%) | 0 (0.0%) |
Time of Departure to Work by Sex in Woodlawn
The most frequent times of departure to work in Woodlawn are 10:00 AM to 10:59 AM (23, 63.9%) for males and 8:00 AM to 8:29 AM (9, 40.9%) for females.
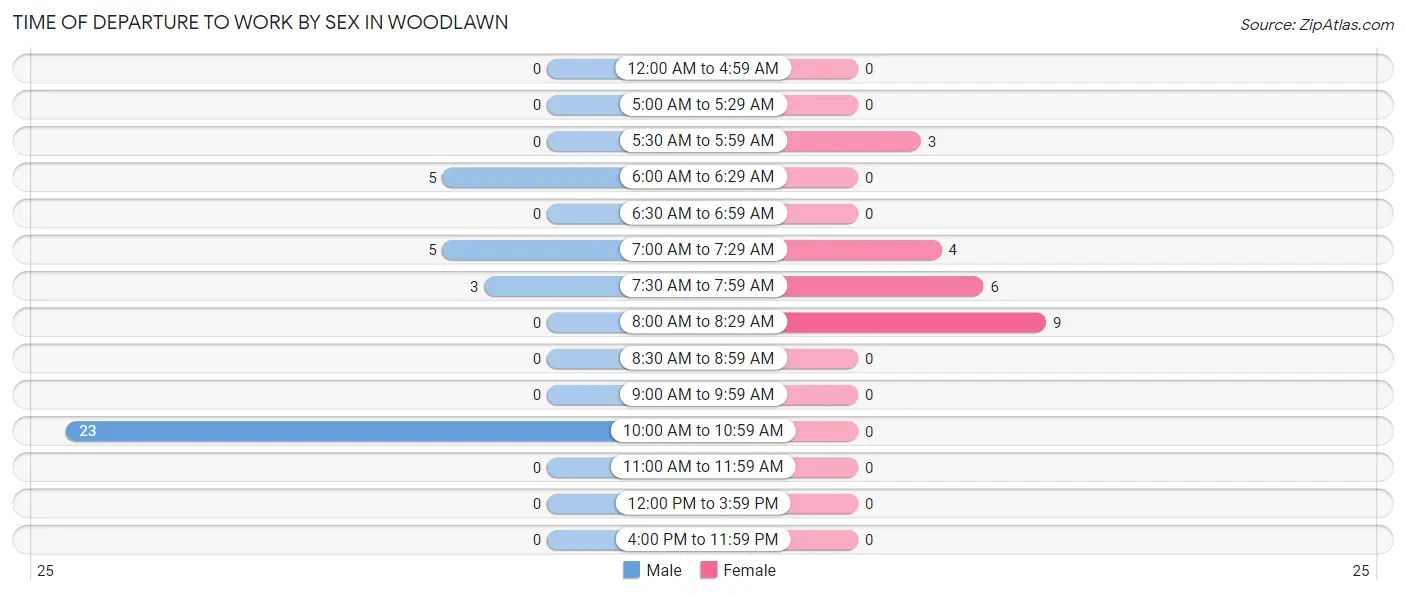
| Time of Departure | Male | Female |
| 12:00 AM to 4:59 AM | 0 (0.0%) | 0 (0.0%) |
| 5:00 AM to 5:29 AM | 0 (0.0%) | 0 (0.0%) |
| 5:30 AM to 5:59 AM | 0 (0.0%) | 3 (13.6%) |
| 6:00 AM to 6:29 AM | 5 (13.9%) | 0 (0.0%) |
| 6:30 AM to 6:59 AM | 0 (0.0%) | 0 (0.0%) |
| 7:00 AM to 7:29 AM | 5 (13.9%) | 4 (18.2%) |
| 7:30 AM to 7:59 AM | 3 (8.3%) | 6 (27.3%) |
| 8:00 AM to 8:29 AM | 0 (0.0%) | 9 (40.9%) |
| 8:30 AM to 8:59 AM | 0 (0.0%) | 0 (0.0%) |
| 9:00 AM to 9:59 AM | 0 (0.0%) | 0 (0.0%) |
| 10:00 AM to 10:59 AM | 23 (63.9%) | 0 (0.0%) |
| 11:00 AM to 11:59 AM | 0 (0.0%) | 0 (0.0%) |
| 12:00 PM to 3:59 PM | 0 (0.0%) | 0 (0.0%) |
| 4:00 PM to 11:59 PM | 0 (0.0%) | 0 (0.0%) |
| Total | 36 (100.0%) | 22 (100.0%) |
Housing Occupancy in Woodlawn
Occupancy by Ownership in Woodlawn
Of the total 58 dwellings in Woodlawn, owner-occupied units account for 54 (93.1%), while renter-occupied units make up 4 (6.9%).
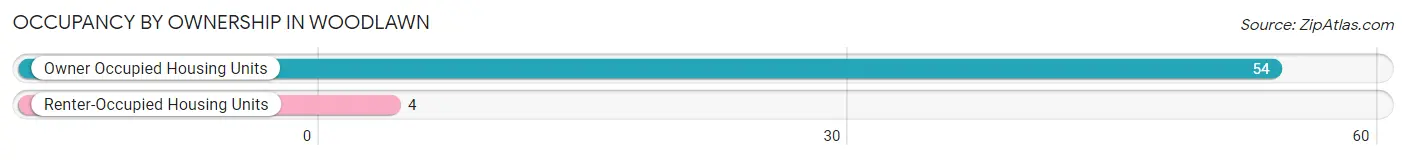
| Occupancy | # Housing Units | % Housing Units |
| Owner Occupied Housing Units | 54 | 93.1% |
| Renter-Occupied Housing Units | 4 | 6.9% |
| Total Occupied Housing Units | 58 | 100.0% |
Occupancy by Household Size in Woodlawn
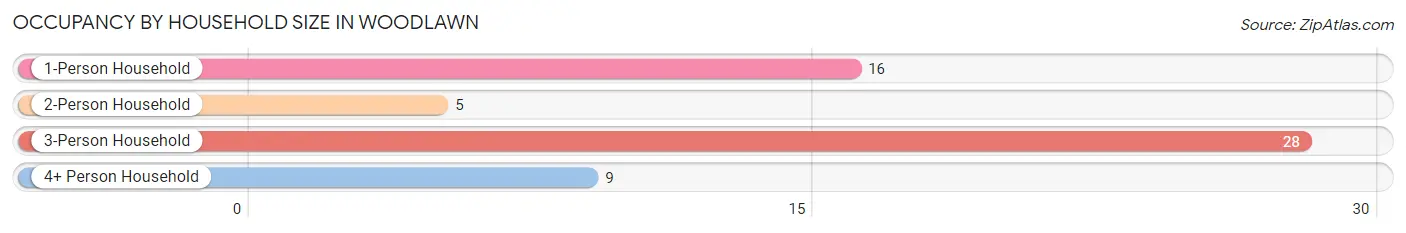
| Household Size | # Housing Units | % Housing Units |
| 1-Person Household | 16 | 27.6% |
| 2-Person Household | 5 | 8.6% |
| 3-Person Household | 28 | 48.3% |
| 4+ Person Household | 9 | 15.5% |
| Total Housing Units | 58 | 100.0% |
Occupancy by Ownership by Household Size in Woodlawn
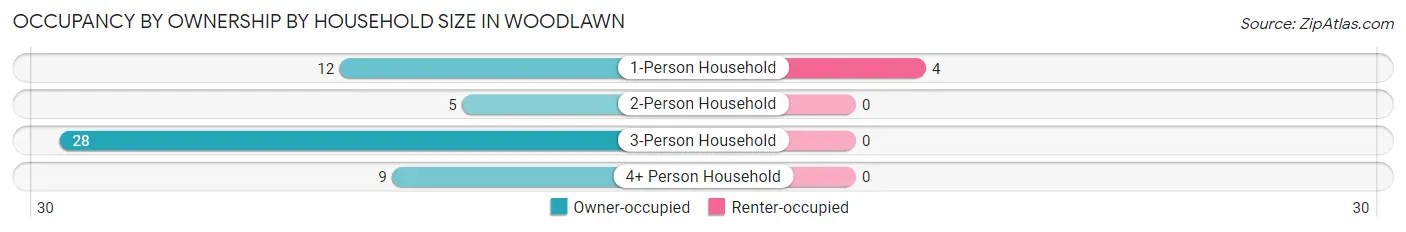
| Household Size | Owner-occupied | Renter-occupied |
| 1-Person Household | 12 (75.0%) | 4 (25.0%) |
| 2-Person Household | 5 (100.0%) | 0 (0.0%) |
| 3-Person Household | 28 (100.0%) | 0 (0.0%) |
| 4+ Person Household | 9 (100.0%) | 0 (0.0%) |
| Total Housing Units | 54 (93.1%) | 4 (6.9%) |
Occupancy by Educational Attainment in Woodlawn
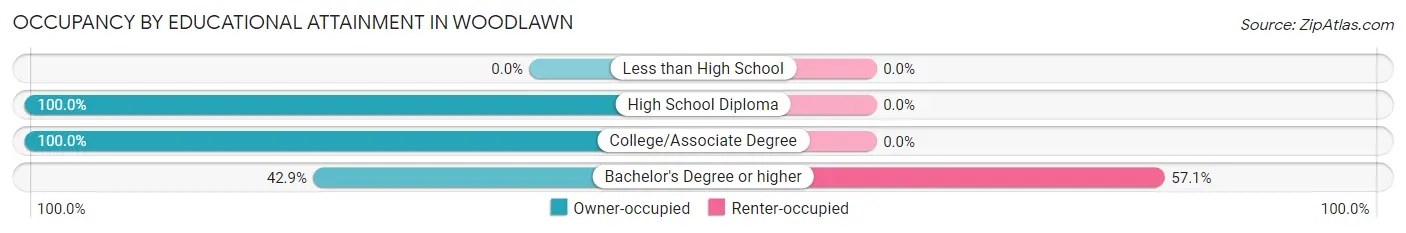
| Household Size | Owner-occupied | Renter-occupied |
| Less than High School | 0 (0.0%) | 0 (0.0%) |
| High School Diploma | 36 (100.0%) | 0 (0.0%) |
| College/Associate Degree | 15 (100.0%) | 0 (0.0%) |
| Bachelor's Degree or higher | 3 (42.9%) | 4 (57.1%) |
Occupancy by Age of Householder in Woodlawn
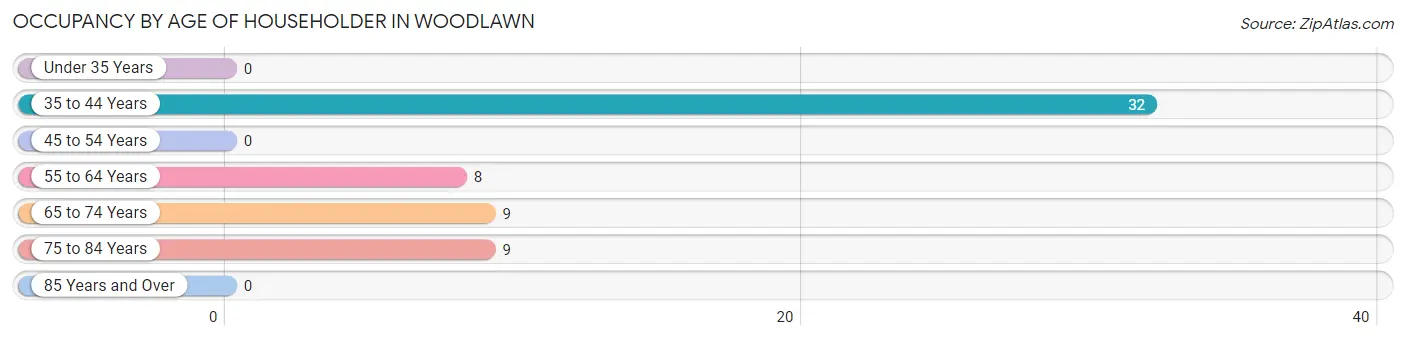
| Age Bracket | # Households | % Households |
| Under 35 Years | 0 | 0.0% |
| 35 to 44 Years | 32 | 55.2% |
| 45 to 54 Years | 0 | 0.0% |
| 55 to 64 Years | 8 | 13.8% |
| 65 to 74 Years | 9 | 15.5% |
| 75 to 84 Years | 9 | 15.5% |
| 85 Years and Over | 0 | 0.0% |
| Total | 58 | 100.0% |
Housing Finances in Woodlawn
Median Income by Occupancy in Woodlawn
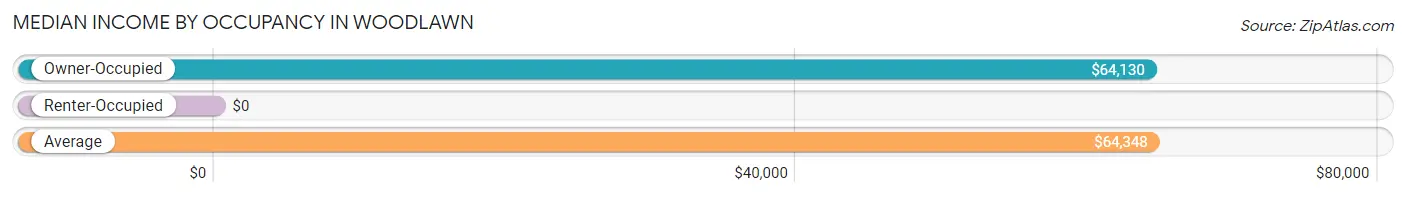
| Occupancy Type | # Households | Median Income |
| Owner-Occupied | 54 (93.1%) | $64,130 |
| Renter-Occupied | 4 (6.9%) | $0 |
| Average | 58 (100.0%) | $64,348 |
Occupancy by Householder Income Bracket in Woodlawn
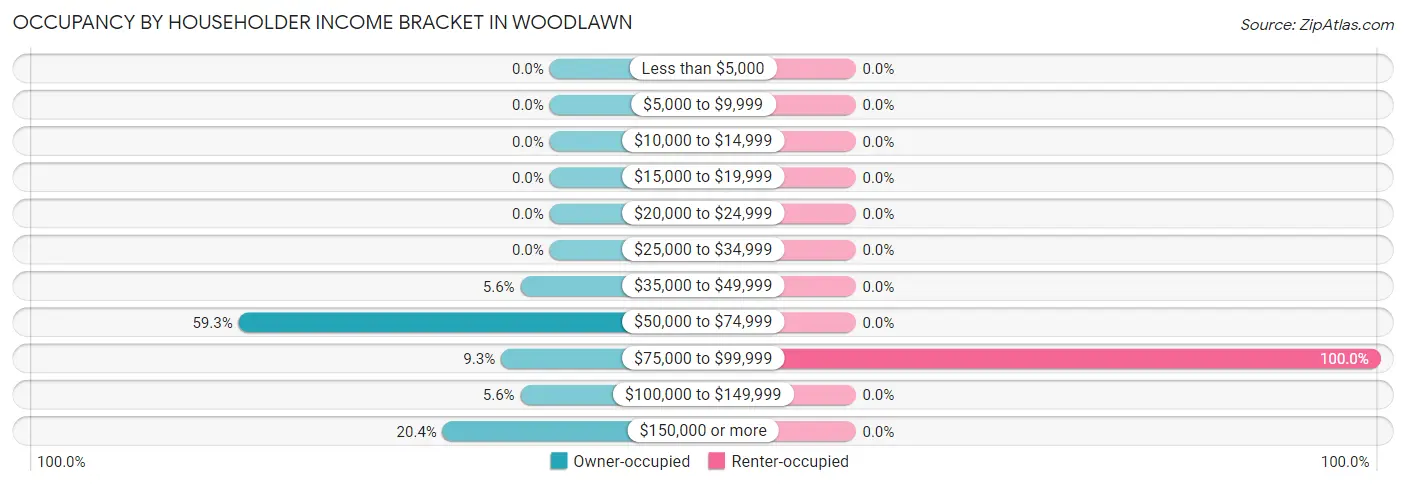
| Income Bracket | Owner-occupied | Renter-occupied |
| Less than $5,000 | 0 (0.0%) | 0 (0.0%) |
| $5,000 to $9,999 | 0 (0.0%) | 0 (0.0%) |
| $10,000 to $14,999 | 0 (0.0%) | 0 (0.0%) |
| $15,000 to $19,999 | 0 (0.0%) | 0 (0.0%) |
| $20,000 to $24,999 | 0 (0.0%) | 0 (0.0%) |
| $25,000 to $34,999 | 0 (0.0%) | 0 (0.0%) |
| $35,000 to $49,999 | 3 (5.6%) | 0 (0.0%) |
| $50,000 to $74,999 | 32 (59.3%) | 0 (0.0%) |
| $75,000 to $99,999 | 5 (9.3%) | 4 (100.0%) |
| $100,000 to $149,999 | 3 (5.6%) | 0 (0.0%) |
| $150,000 or more | 11 (20.4%) | 0 (0.0%) |
| Total | 54 (100.0%) | 4 (100.0%) |
Monthly Housing Cost Tiers in Woodlawn
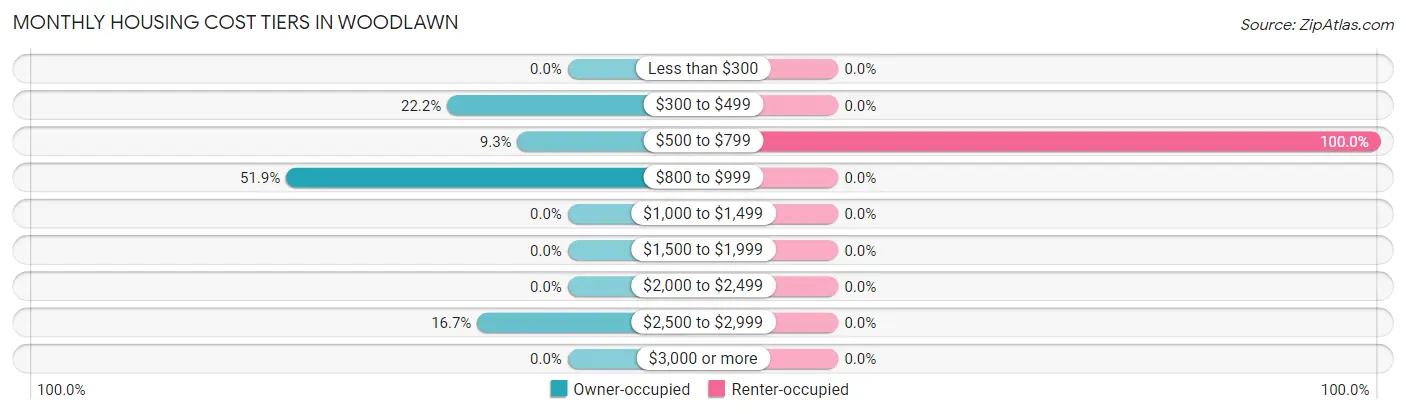
| Monthly Cost | Owner-occupied | Renter-occupied |
| Less than $300 | 0 (0.0%) | 0 (0.0%) |
| $300 to $499 | 12 (22.2%) | 0 (0.0%) |
| $500 to $799 | 5 (9.3%) | 4 (100.0%) |
| $800 to $999 | 28 (51.8%) | 0 (0.0%) |
| $1,000 to $1,499 | 0 (0.0%) | 0 (0.0%) |
| $1,500 to $1,999 | 0 (0.0%) | 0 (0.0%) |
| $2,000 to $2,499 | 0 (0.0%) | 0 (0.0%) |
| $2,500 to $2,999 | 9 (16.7%) | 0 (0.0%) |
| $3,000 or more | 0 (0.0%) | 0 (0.0%) |
| Total | 54 (100.0%) | 4 (100.0%) |
Physical Housing Characteristics in Woodlawn
Housing Structures in Woodlawn
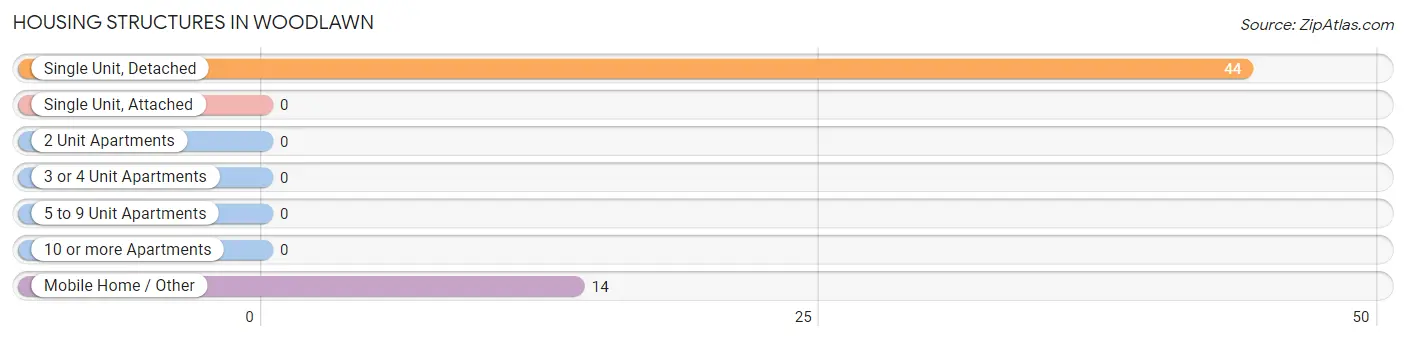
| Structure Type | # Housing Units | % Housing Units |
| Single Unit, Detached | 44 | 75.9% |
| Single Unit, Attached | 0 | 0.0% |
| 2 Unit Apartments | 0 | 0.0% |
| 3 or 4 Unit Apartments | 0 | 0.0% |
| 5 to 9 Unit Apartments | 0 | 0.0% |
| 10 or more Apartments | 0 | 0.0% |
| Mobile Home / Other | 14 | 24.1% |
| Total | 58 | 100.0% |
Housing Structures by Occupancy in Woodlawn
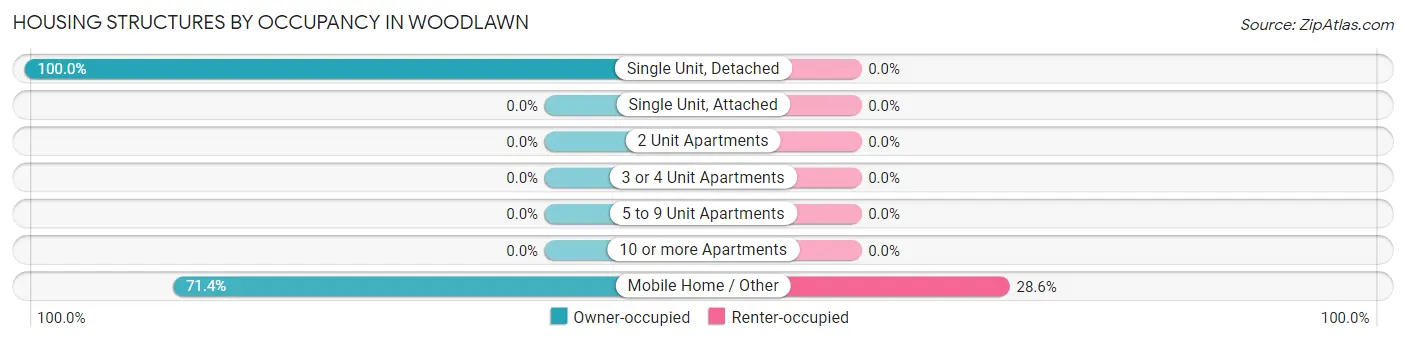
| Structure Type | Owner-occupied | Renter-occupied |
| Single Unit, Detached | 44 (100.0%) | 0 (0.0%) |
| Single Unit, Attached | 0 (0.0%) | 0 (0.0%) |
| 2 Unit Apartments | 0 (0.0%) | 0 (0.0%) |
| 3 or 4 Unit Apartments | 0 (0.0%) | 0 (0.0%) |
| 5 to 9 Unit Apartments | 0 (0.0%) | 0 (0.0%) |
| 10 or more Apartments | 0 (0.0%) | 0 (0.0%) |
| Mobile Home / Other | 10 (71.4%) | 4 (28.6%) |
| Total | 54 (93.1%) | 4 (6.9%) |
Housing Structures by Number of Rooms in Woodlawn
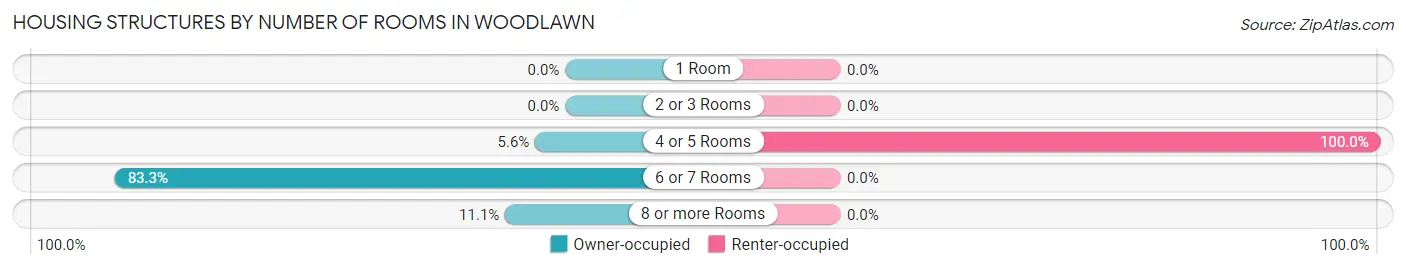
| Number of Rooms | Owner-occupied | Renter-occupied |
| 1 Room | 0 (0.0%) | 0 (0.0%) |
| 2 or 3 Rooms | 0 (0.0%) | 0 (0.0%) |
| 4 or 5 Rooms | 3 (5.6%) | 4 (100.0%) |
| 6 or 7 Rooms | 45 (83.3%) | 0 (0.0%) |
| 8 or more Rooms | 6 (11.1%) | 0 (0.0%) |
| Total | 54 (100.0%) | 4 (100.0%) |
Housing Structure by Heating Type in Woodlawn
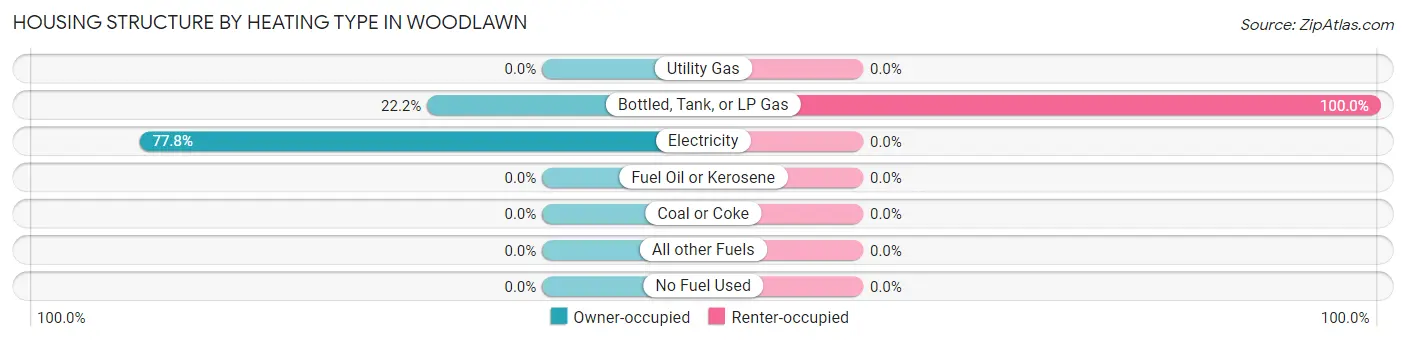
| Heating Type | Owner-occupied | Renter-occupied |
| Utility Gas | 0 (0.0%) | 0 (0.0%) |
| Bottled, Tank, or LP Gas | 12 (22.2%) | 4 (100.0%) |
| Electricity | 42 (77.8%) | 0 (0.0%) |
| Fuel Oil or Kerosene | 0 (0.0%) | 0 (0.0%) |
| Coal or Coke | 0 (0.0%) | 0 (0.0%) |
| All other Fuels | 0 (0.0%) | 0 (0.0%) |
| No Fuel Used | 0 (0.0%) | 0 (0.0%) |
| Total | 54 (100.0%) | 4 (100.0%) |
Household Vehicle Usage in Woodlawn
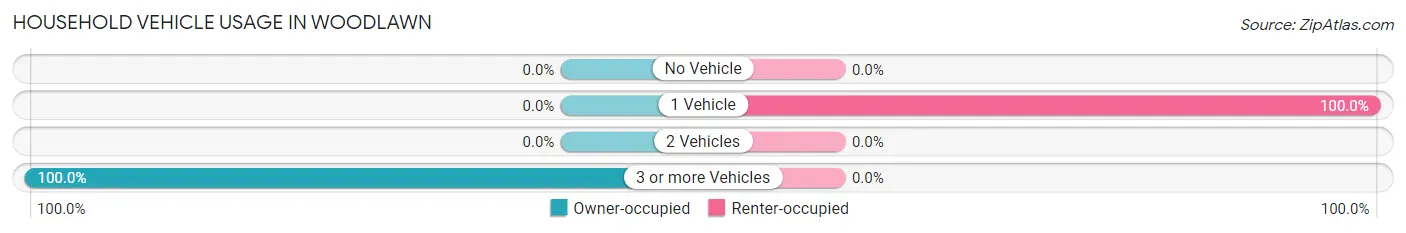
| Vehicles per Household | Owner-occupied | Renter-occupied |
| No Vehicle | 0 (0.0%) | 0 (0.0%) |
| 1 Vehicle | 0 (0.0%) | 4 (100.0%) |
| 2 Vehicles | 0 (0.0%) | 0 (0.0%) |
| 3 or more Vehicles | 54 (100.0%) | 0 (0.0%) |
| Total | 54 (100.0%) | 4 (100.0%) |
Real Estate & Mortgages in Woodlawn
Real Estate and Mortgage Overview in Woodlawn
| Characteristic | Without Mortgage | With Mortgage |
| Housing Units | 17 | 37 |
| Median Property Value | $159,700 | $229,300 |
| Median Household Income | $56,528 | $11 |
| Monthly Housing Costs | $381 | $0 |
| Real Estate Taxes | $611 | $0 |
Property Value by Mortgage Status in Woodlawn
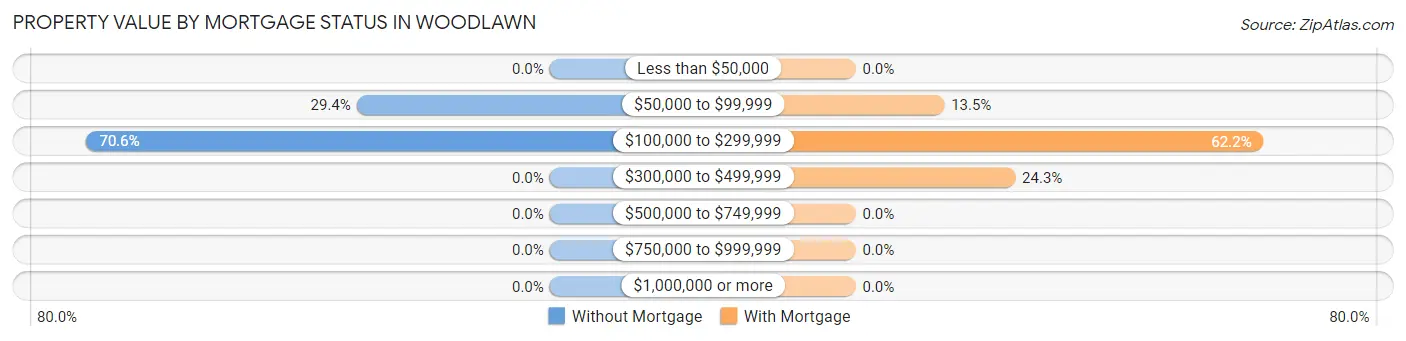
| Property Value | Without Mortgage | With Mortgage |
| Less than $50,000 | 0 (0.0%) | 0 (0.0%) |
| $50,000 to $99,999 | 5 (29.4%) | 5 (13.5%) |
| $100,000 to $299,999 | 12 (70.6%) | 23 (62.2%) |
| $300,000 to $499,999 | 0 (0.0%) | 9 (24.3%) |
| $500,000 to $749,999 | 0 (0.0%) | 0 (0.0%) |
| $750,000 to $999,999 | 0 (0.0%) | 0 (0.0%) |
| $1,000,000 or more | 0 (0.0%) | 0 (0.0%) |
| Total | 17 (100.0%) | 37 (100.0%) |
Household Income by Mortgage Status in Woodlawn
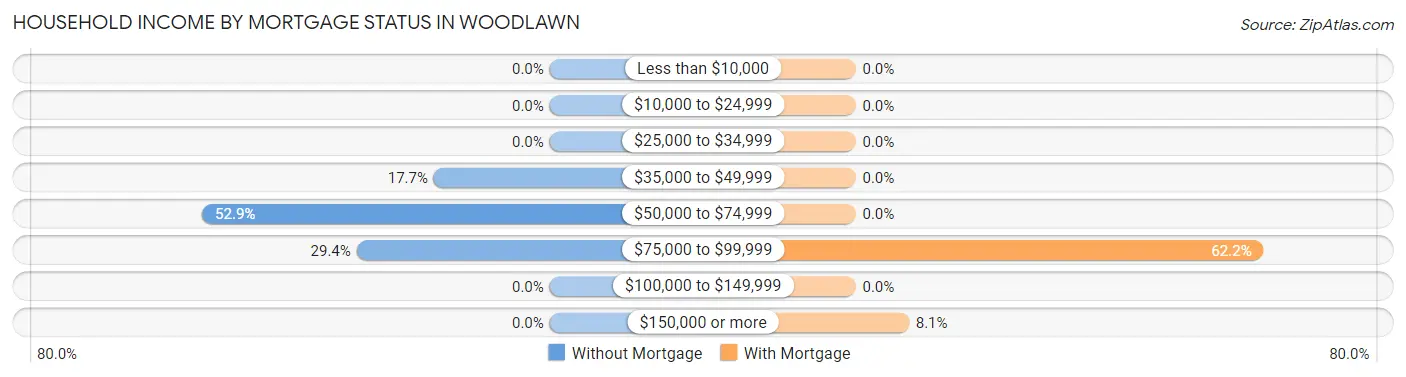
| Household Income | Without Mortgage | With Mortgage |
| Less than $10,000 | 0 (0.0%) | 0 (0.0%) |
| $10,000 to $24,999 | 0 (0.0%) | 0 (0.0%) |
| $25,000 to $34,999 | 0 (0.0%) | 0 (0.0%) |
| $35,000 to $49,999 | 3 (17.6%) | 0 (0.0%) |
| $50,000 to $74,999 | 9 (52.9%) | 0 (0.0%) |
| $75,000 to $99,999 | 5 (29.4%) | 23 (62.2%) |
| $100,000 to $149,999 | 0 (0.0%) | 0 (0.0%) |
| $150,000 or more | 0 (0.0%) | 3 (8.1%) |
| Total | 17 (100.0%) | 37 (100.0%) |
Property Value to Household Income Ratio in Woodlawn
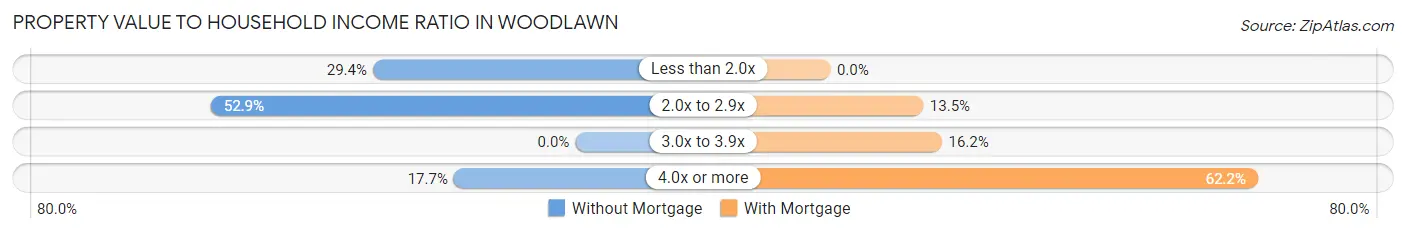
| Value-to-Income Ratio | Without Mortgage | With Mortgage |
| Less than 2.0x | 5 (29.4%) | 0 (0.0%) |
| 2.0x to 2.9x | 9 (52.9%) | 5 (13.5%) |
| 3.0x to 3.9x | 0 (0.0%) | 6 (16.2%) |
| 4.0x or more | 3 (17.6%) | 23 (62.2%) |
| Total | 17 (100.0%) | 37 (100.0%) |
Real Estate Taxes by Mortgage Status in Woodlawn
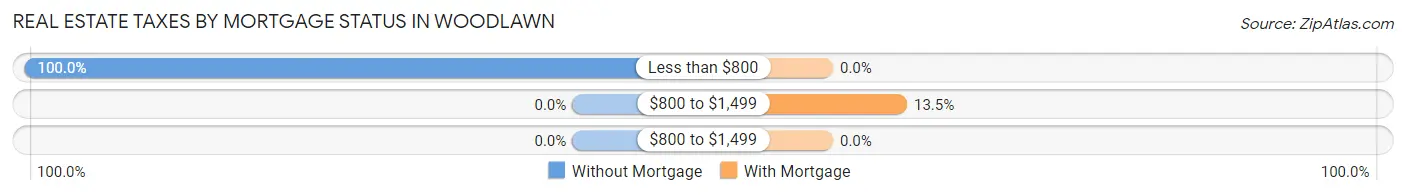
| Property Taxes | Without Mortgage | With Mortgage |
| Less than $800 | 17 (100.0%) | 0 (0.0%) |
| $800 to $1,499 | 0 (0.0%) | 5 (13.5%) |
| $800 to $1,499 | 0 (0.0%) | 0 (0.0%) |
| Total | 17 (100.0%) | 37 (100.0%) |
Health & Disability in Woodlawn
Health Insurance Coverage by Age in Woodlawn
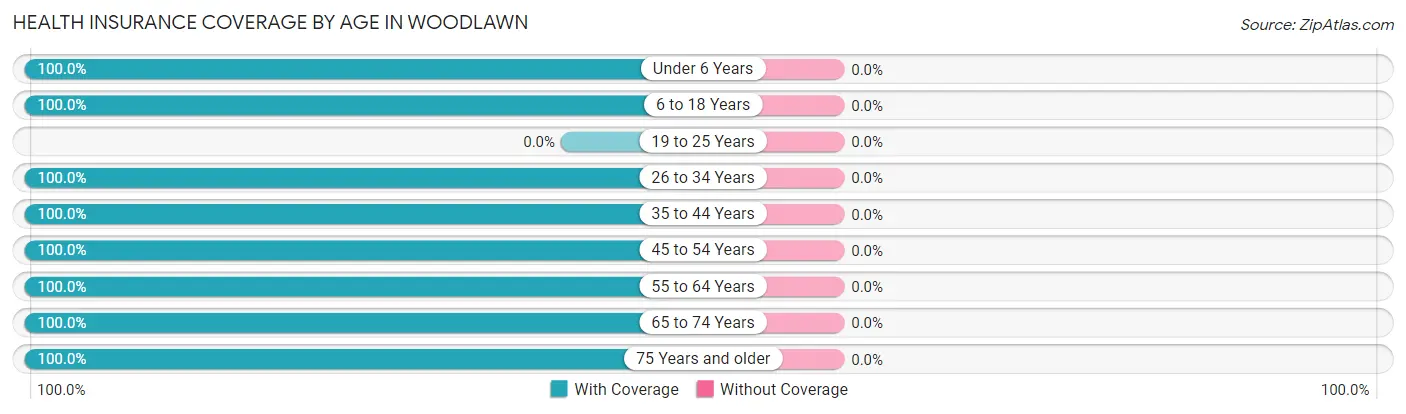
| Age Bracket | With Coverage | Without Coverage |
| Under 6 Years | 22 (100.0%) | 0 (0.0%) |
| 6 to 18 Years | 34 (100.0%) | 0 (0.0%) |
| 19 to 25 Years | 0 (0.0%) | 0 (0.0%) |
| 26 to 34 Years | 35 (100.0%) | 0 (0.0%) |
| 35 to 44 Years | 37 (100.0%) | 0 (0.0%) |
| 45 to 54 Years | 5 (100.0%) | 0 (0.0%) |
| 55 to 64 Years | 15 (100.0%) | 0 (0.0%) |
| 65 to 74 Years | 9 (100.0%) | 0 (0.0%) |
| 75 Years and older | 9 (100.0%) | 0 (0.0%) |
| Total | 166 (100.0%) | 0 (0.0%) |
Health Insurance Coverage by Citizenship Status in Woodlawn
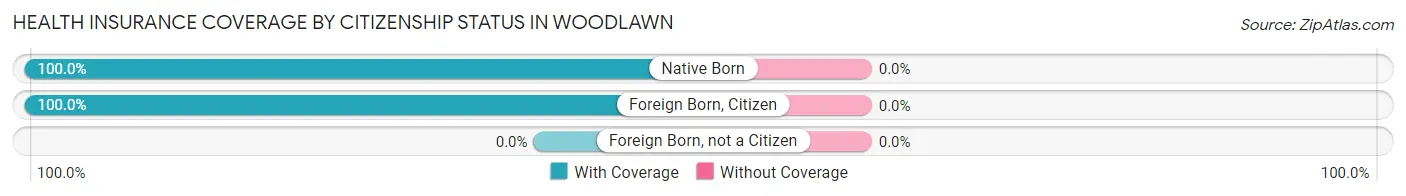
| Citizenship Status | With Coverage | Without Coverage |
| Native Born | 22 (100.0%) | 0 (0.0%) |
| Foreign Born, Citizen | 34 (100.0%) | 0 (0.0%) |
| Foreign Born, not a Citizen | 0 (0.0%) | 0 (0.0%) |
Health Insurance Coverage by Household Income in Woodlawn
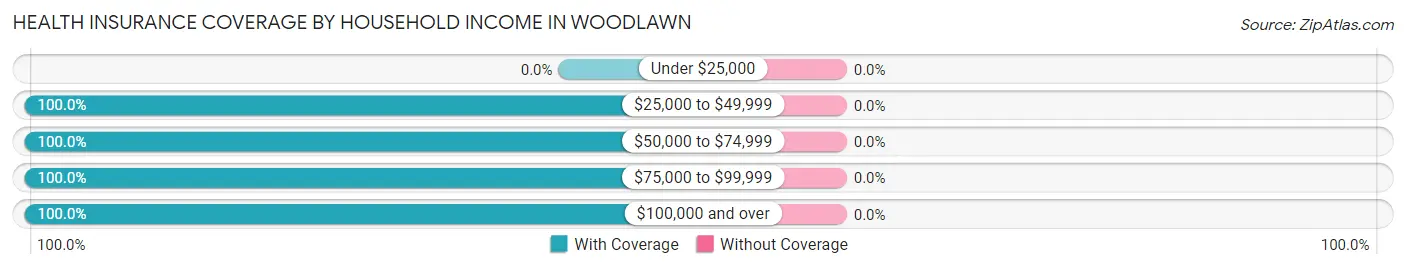
| Household Income | With Coverage | Without Coverage |
| Under $25,000 | 0 (0.0%) | 0 (0.0%) |
| $25,000 to $49,999 | 3 (100.0%) | 0 (0.0%) |
| $50,000 to $74,999 | 89 (100.0%) | 0 (0.0%) |
| $75,000 to $99,999 | 12 (100.0%) | 0 (0.0%) |
| $100,000 and over | 62 (100.0%) | 0 (0.0%) |
Public vs Private Health Insurance Coverage by Age in Woodlawn
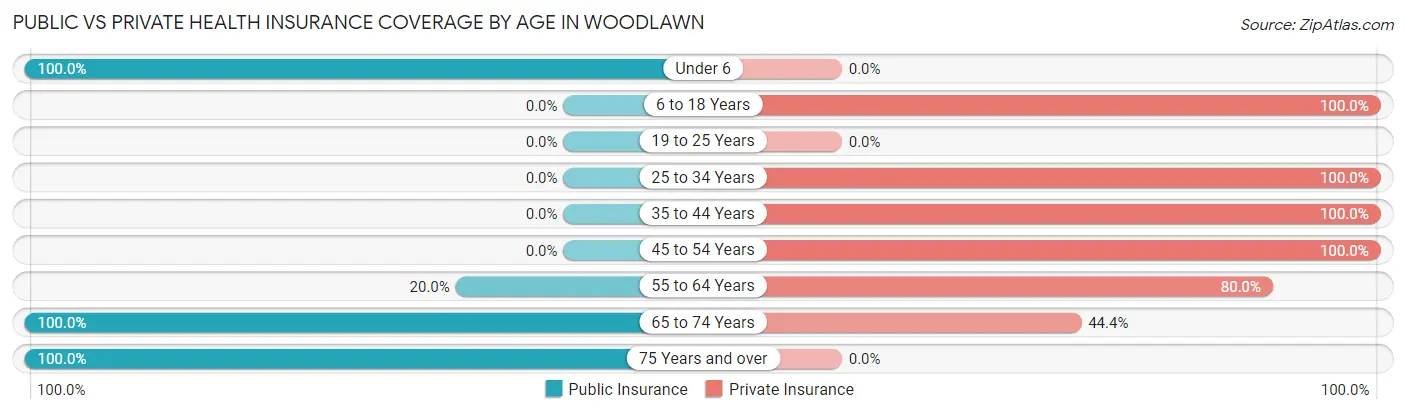
| Age Bracket | Public Insurance | Private Insurance |
| Under 6 | 22 (100.0%) | 0 (0.0%) |
| 6 to 18 Years | 0 (0.0%) | 34 (100.0%) |
| 19 to 25 Years | 0 (0.0%) | 0 (0.0%) |
| 25 to 34 Years | 0 (0.0%) | 35 (100.0%) |
| 35 to 44 Years | 0 (0.0%) | 37 (100.0%) |
| 45 to 54 Years | 0 (0.0%) | 5 (100.0%) |
| 55 to 64 Years | 3 (20.0%) | 12 (80.0%) |
| 65 to 74 Years | 9 (100.0%) | 4 (44.4%) |
| 75 Years and over | 9 (100.0%) | 0 (0.0%) |
| Total | 43 (25.9%) | 127 (76.5%) |
Disability Status by Sex by Age in Woodlawn
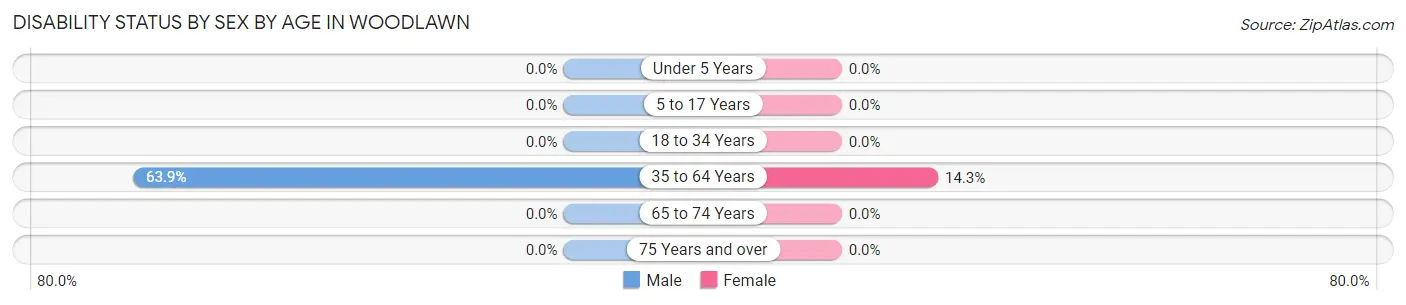
| Age Bracket | Male | Female |
| Under 5 Years | 0 (0.0%) | 0 (0.0%) |
| 5 to 17 Years | 0 (0.0%) | 0 (0.0%) |
| 18 to 34 Years | 0 (0.0%) | 0 (0.0%) |
| 35 to 64 Years | 23 (63.9%) | 3 (14.3%) |
| 65 to 74 Years | 0 (0.0%) | 0 (0.0%) |
| 75 Years and over | 0 (0.0%) | 0 (0.0%) |
Disability Class by Sex by Age in Woodlawn
Disability Class: Hearing Difficulty
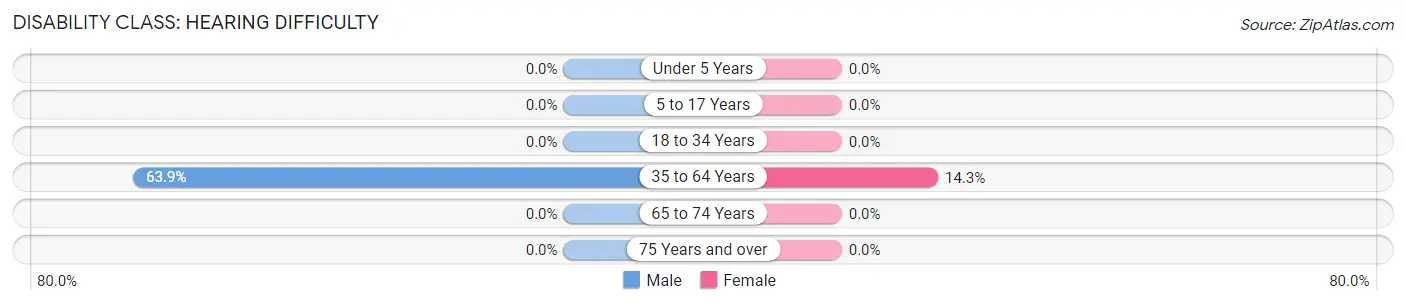
| Age Bracket | Male | Female |
| Under 5 Years | 0 (0.0%) | 0 (0.0%) |
| 5 to 17 Years | 0 (0.0%) | 0 (0.0%) |
| 18 to 34 Years | 0 (0.0%) | 0 (0.0%) |
| 35 to 64 Years | 23 (63.9%) | 3 (14.3%) |
| 65 to 74 Years | 0 (0.0%) | 0 (0.0%) |
| 75 Years and over | 0 (0.0%) | 0 (0.0%) |
Disability Class: Vision Difficulty
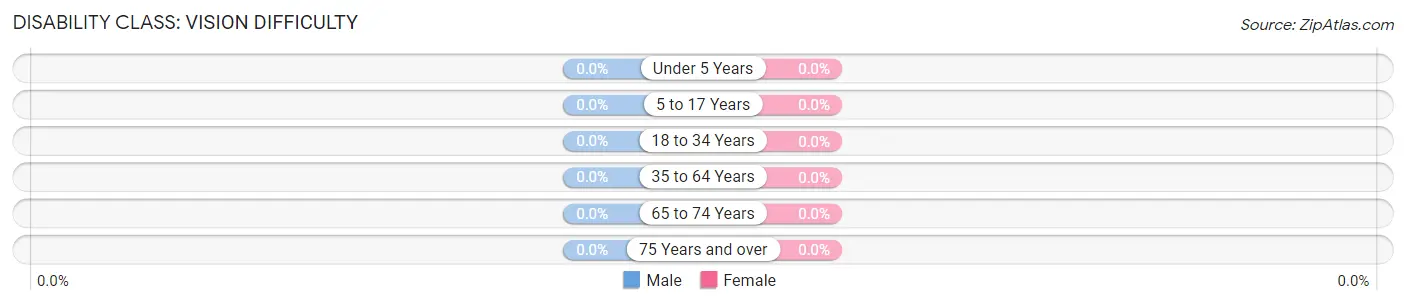
| Age Bracket | Male | Female |
| Under 5 Years | 0 (0.0%) | 0 (0.0%) |
| 5 to 17 Years | 0 (0.0%) | 0 (0.0%) |
| 18 to 34 Years | 0 (0.0%) | 0 (0.0%) |
| 35 to 64 Years | 0 (0.0%) | 0 (0.0%) |
| 65 to 74 Years | 0 (0.0%) | 0 (0.0%) |
| 75 Years and over | 0 (0.0%) | 0 (0.0%) |
Disability Class: Cognitive Difficulty
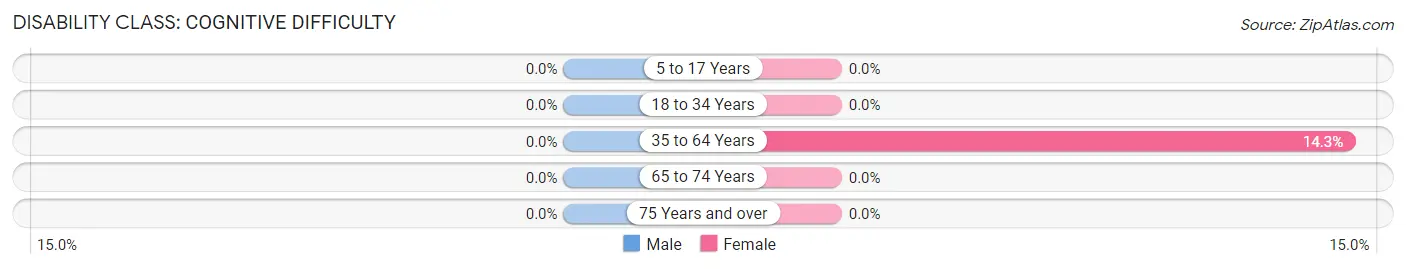
| Age Bracket | Male | Female |
| 5 to 17 Years | 0 (0.0%) | 0 (0.0%) |
| 18 to 34 Years | 0 (0.0%) | 0 (0.0%) |
| 35 to 64 Years | 0 (0.0%) | 3 (14.3%) |
| 65 to 74 Years | 0 (0.0%) | 0 (0.0%) |
| 75 Years and over | 0 (0.0%) | 0 (0.0%) |
Disability Class: Ambulatory Difficulty
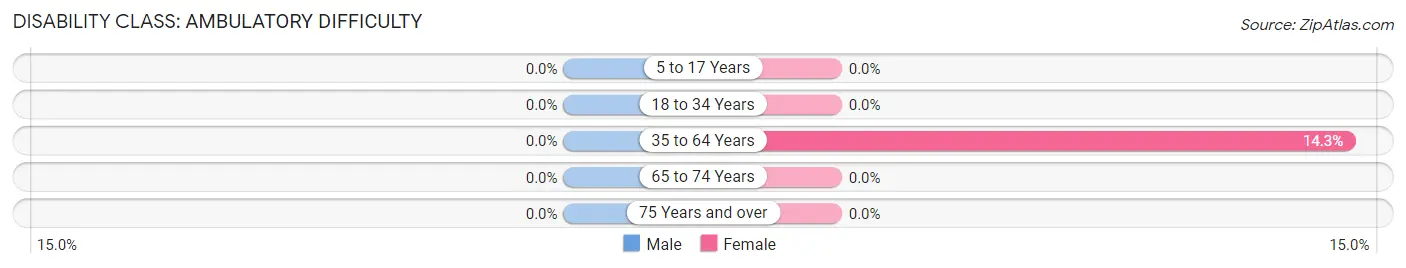
| Age Bracket | Male | Female |
| 5 to 17 Years | 0 (0.0%) | 0 (0.0%) |
| 18 to 34 Years | 0 (0.0%) | 0 (0.0%) |
| 35 to 64 Years | 0 (0.0%) | 3 (14.3%) |
| 65 to 74 Years | 0 (0.0%) | 0 (0.0%) |
| 75 Years and over | 0 (0.0%) | 0 (0.0%) |
Disability Class: Self-Care Difficulty
| Age Bracket | Male | Female |
| 5 to 17 Years | 0 (0.0%) | 0 (0.0%) |
| 18 to 34 Years | 0 (0.0%) | 0 (0.0%) |
| 35 to 64 Years | 0 (0.0%) | 0 (0.0%) |
| 65 to 74 Years | 0 (0.0%) | 0 (0.0%) |
| 75 Years and over | 0 (0.0%) | 0 (0.0%) |
Technology Access in Woodlawn
Computing Device Access in Woodlawn
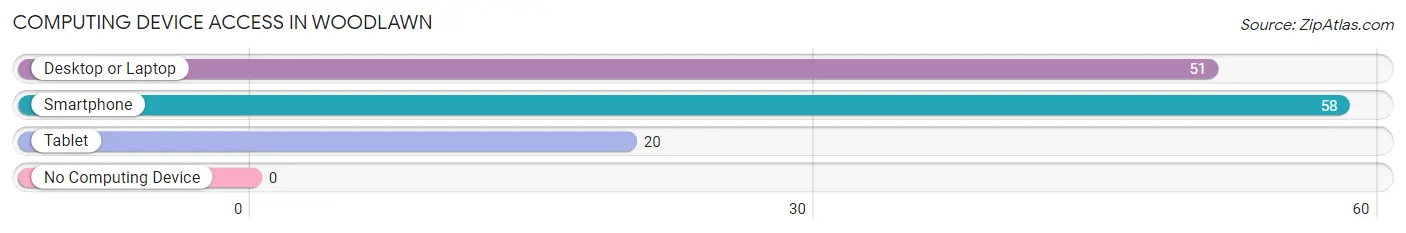
| Device Type | # Households | % Households |
| Desktop or Laptop | 51 | 87.9% |
| Smartphone | 58 | 100.0% |
| Tablet | 20 | 34.5% |
| No Computing Device | 0 | 0.0% |
| Total | 58 | 100.0% |
Internet Access in Woodlawn
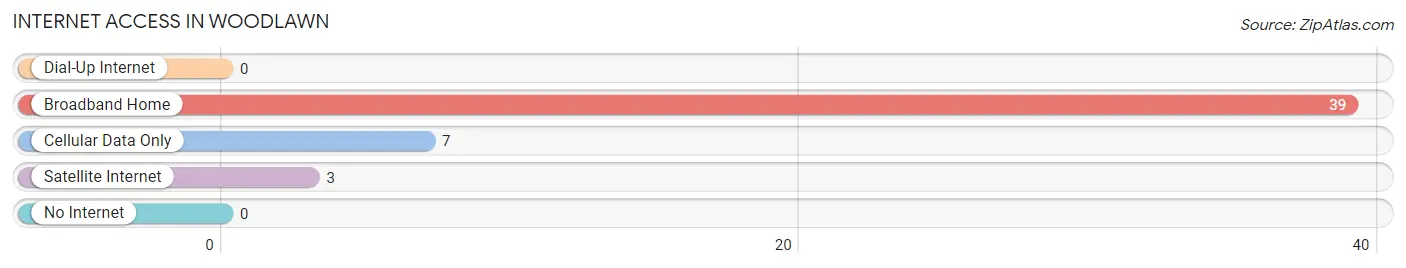
| Internet Type | # Households | % Households |
| Dial-Up Internet | 0 | 0.0% |
| Broadband Home | 39 | 67.2% |
| Cellular Data Only | 7 | 12.1% |
| Satellite Internet | 3 | 5.2% |
| No Internet | 0 | 0.0% |
| Total | 58 | 100.0% |
Woodlawn Summary
Woodlawn is a small town located in the northwest corner of Arkansas, in Benton County. It is situated on the banks of the White River, and is surrounded by the Ozark Mountains. The town was founded in 1872, and has a population of approximately 1,000 people.
Geography
Woodlawn is located in the northwest corner of Arkansas, in Benton County. It is situated on the banks of the White River, and is surrounded by the Ozark Mountains. The town is located at an elevation of 890 feet above sea level. The climate in Woodlawn is humid subtropical, with hot summers and mild winters. The average annual temperature is around 60 degrees Fahrenheit.
Economy
Woodlawn’s economy is largely based on agriculture and tourism. The town is home to several farms, which produce a variety of crops, including corn, soybeans, wheat, and hay. The town also has a number of small businesses, including restaurants, shops, and a few manufacturing plants. Tourism is also an important part of the local economy, as the town is located near several popular attractions, such as the Ozark National Forest and the Buffalo National River.
Demographics
As of the 2010 census, the population of Woodlawn was 1,000 people. The racial makeup of the town was 97.2% White, 0.7% African American, 0.3% Native American, 0.2% Asian, and 1.6% from other races. The median household income was $37,500, and the median family income was $45,000. The per capita income was $18,000.
History
Woodlawn was founded in 1872 by a group of settlers from Missouri. The town was originally known as “White River”, but was later changed to Woodlawn. The town was named after the nearby White River, which was named after the white sand that lined its banks. The town grew quickly, and by the early 1900s, it had become a thriving agricultural center.
In the early 20th century, Woodlawn was a popular tourist destination, as it was located near several popular attractions, such as the Ozark National Forest and the Buffalo National River. The town also had a number of small businesses, including restaurants, shops, and a few manufacturing plants.
In the late 20th century, Woodlawn began to decline, as many of its businesses closed and the population began to decline. However, in recent years, the town has seen a resurgence, as new businesses have opened and the population has begun to grow again. Today, Woodlawn is a small, but vibrant town, with a strong sense of community and a bright future.
Common Questions
What is Per Capita Income in Woodlawn?
Per Capita income in Woodlawn is $30,081.
What is the Median Household income in Woodlawn?
Median Household Income in Woodlawn is $64,348.
What is Income or Wage Gap in Woodlawn?
Income or Wage Gap in Woodlawn is 11.5%.
Women in Woodlawn earn 88.5 cents for every dollar earned by a man.
What is Inequality or Gini Index in Woodlawn?
Inequality or Gini Index in Woodlawn is 0.21.
What is the Total Population of Woodlawn?
Total Population of Woodlawn is 166.
What is the Total Male Population of Woodlawn?
Total Male Population of Woodlawn is 50.
What is the Total Female Population of Woodlawn?
Total Female Population of Woodlawn is 116.
What is the Ratio of Males per 100 Females in Woodlawn?
There are 43.10 Males per 100 Females in Woodlawn.
What is the Ratio of Females per 100 Males in Woodlawn?
There are 232.00 Females per 100 Males in Woodlawn.
What is the Median Population Age in Woodlawn?
Median Population Age in Woodlawn is 29.8 Years.
What is the Average Family Size in Woodlawn
Average Family Size in Woodlawn is 3.6 People.
What is the Average Household Size in Woodlawn
Average Household Size in Woodlawn is 2.9 People.
How Large is the Labor Force in Woodlawn?
There are 58 People in the Labor Forcein in Woodlawn.
What is the Percentage of People in the Labor Force in Woodlawn?
44.6% of People are in the Labor Force in Woodlawn.