Wilmar, AR Map & Demographics
Wilmar Map
Wilmar Overview
$23,721
PER CAPITA INCOME
$82,500
AVG FAMILY INCOME
5.2%
WAGE / INCOME GAP [ % ]
94.8¢/ $1
WAGE / INCOME GAP [ $ ]
0.43
INEQUALITY / GINI INDEX
384
TOTAL POPULATION
155
MALE POPULATION
229
FEMALE POPULATION
67.69
MALES / 100 FEMALES
147.74
FEMALES / 100 MALES
58.3
MEDIAN AGE
3.1
AVG FAMILY SIZE
2.0
AVG HOUSEHOLD SIZE
136
LABOR FORCE [ PEOPLE ]
42.9%
PERCENT IN LABOR FORCE
0.7%
UNEMPLOYMENT RATE
Wilmar Zip Codes
Wilmar Area Codes
Income in Wilmar
Income Overview in Wilmar
| Characteristic | Number | Measure |
| Per Capita Income | 384 | $23,721 |
| Median Family Income | 90 | $82,500 |
| Mean Family Income | 90 | $75,701 |
| Median Household Income | 195 | $0 |
| Mean Household Income | 195 | $47,227 |
| Income Deficit | 90 | $0 |
| Wage / Income Gap (%) | 384 | 5.17% |
| Wage / Income Gap ($) | 384 | 94.83¢ per $1 |
| Gini / Inequality Index | 384 | 0.43 |
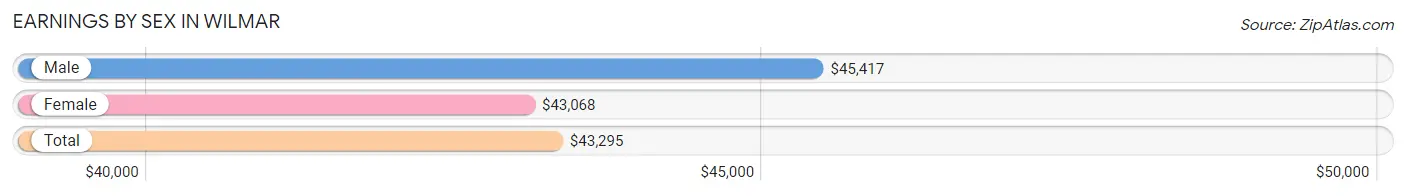
Earnings by Sex in Wilmar
Average Earnings in Wilmar are $43,295, $45,417 for men and $43,068 for women, a difference of 5.2%.
| Sex | Number | Average Earnings |
| Male | 60 (44.4%) | $45,417 |
| Female | 75 (55.6%) | $43,068 |
| Total | 135 (100.0%) | $43,295 |
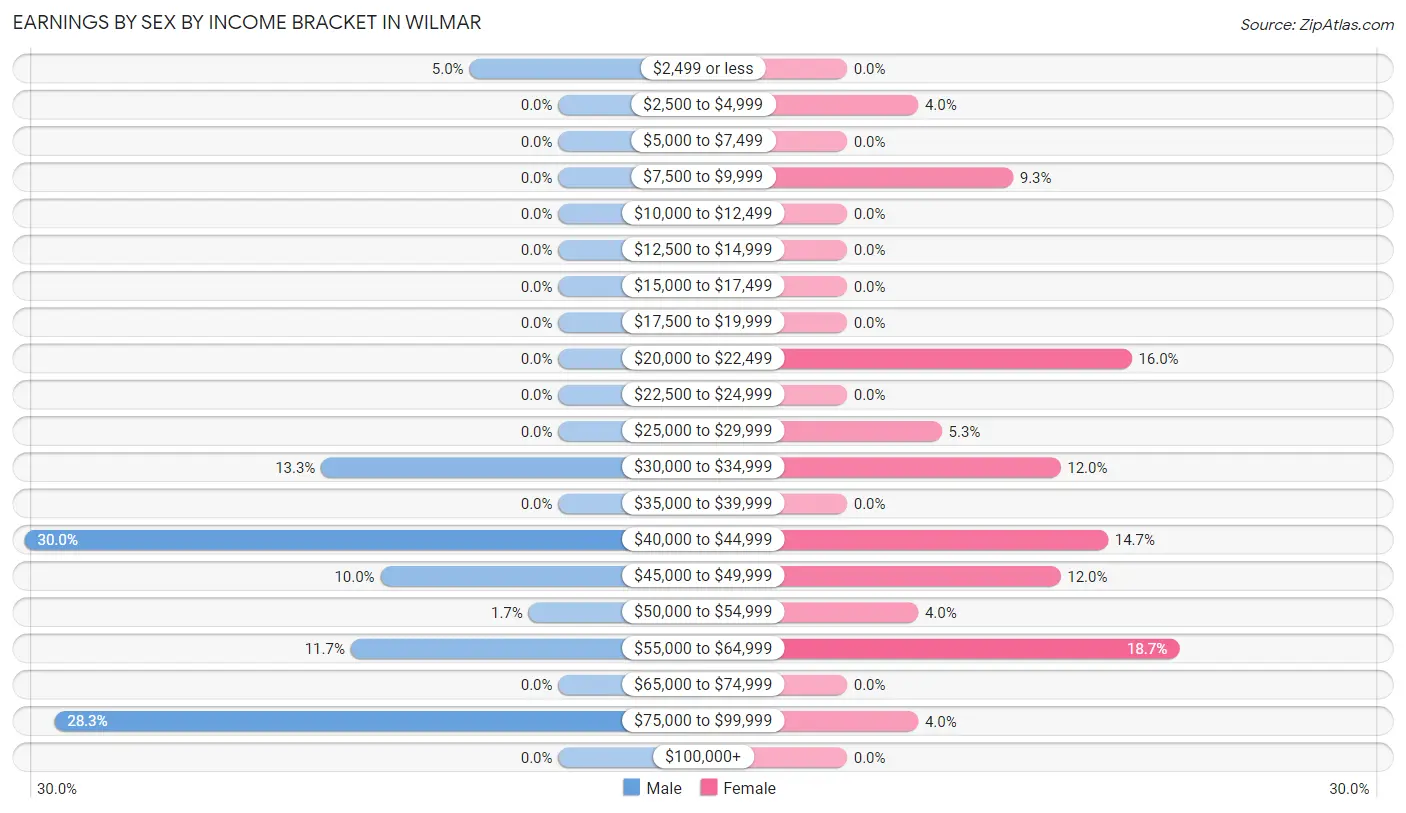
Earnings by Sex by Income Bracket in Wilmar
The most common earnings brackets in Wilmar are $40,000 to $44,999 for men (18 | 30.0%) and $55,000 to $64,999 for women (14 | 18.7%).
| Income | Male | Female |
| $2,499 or less | 3 (5.0%) | 0 (0.0%) |
| $2,500 to $4,999 | 0 (0.0%) | 3 (4.0%) |
| $5,000 to $7,499 | 0 (0.0%) | 0 (0.0%) |
| $7,500 to $9,999 | 0 (0.0%) | 7 (9.3%) |
| $10,000 to $12,499 | 0 (0.0%) | 0 (0.0%) |
| $12,500 to $14,999 | 0 (0.0%) | 0 (0.0%) |
| $15,000 to $17,499 | 0 (0.0%) | 0 (0.0%) |
| $17,500 to $19,999 | 0 (0.0%) | 0 (0.0%) |
| $20,000 to $22,499 | 0 (0.0%) | 12 (16.0%) |
| $22,500 to $24,999 | 0 (0.0%) | 0 (0.0%) |
| $25,000 to $29,999 | 0 (0.0%) | 4 (5.3%) |
| $30,000 to $34,999 | 8 (13.3%) | 9 (12.0%) |
| $35,000 to $39,999 | 0 (0.0%) | 0 (0.0%) |
| $40,000 to $44,999 | 18 (30.0%) | 11 (14.7%) |
| $45,000 to $49,999 | 6 (10.0%) | 9 (12.0%) |
| $50,000 to $54,999 | 1 (1.7%) | 3 (4.0%) |
| $55,000 to $64,999 | 7 (11.7%) | 14 (18.7%) |
| $65,000 to $74,999 | 0 (0.0%) | 0 (0.0%) |
| $75,000 to $99,999 | 17 (28.3%) | 3 (4.0%) |
| $100,000+ | 0 (0.0%) | 0 (0.0%) |
| Total | 60 (100.0%) | 75 (100.0%) |
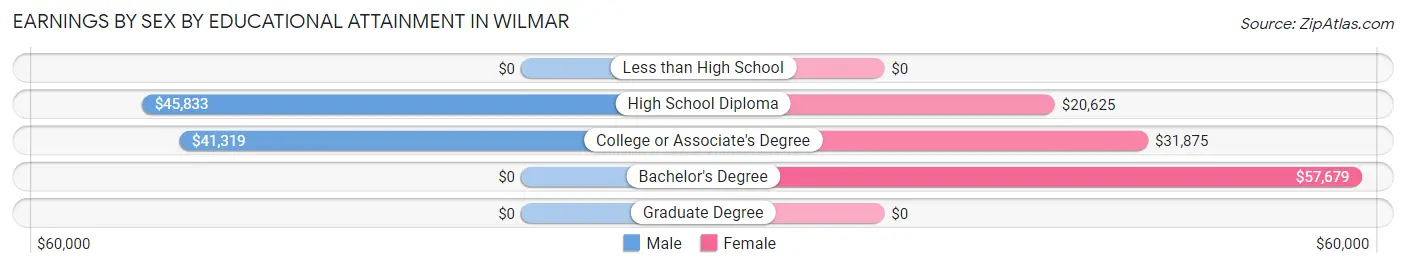
Earnings by Sex by Educational Attainment in Wilmar
Average earnings in Wilmar are $45,417 for men and $43,409 for women, a difference of 4.4%. Men with an educational attainment of high school diploma enjoy the highest average annual earnings of $45,833, while those with college or associate's degree education earn the least with $41,319. Women with an educational attainment of bachelor's degree earn the most with the average annual earnings of $57,679, while those with high school diploma education have the smallest earnings of $20,625.
| Educational Attainment | Male Income | Female Income |
| Less than High School | - | - |
| High School Diploma | $45,833 | $20,625 |
| College or Associate's Degree | $41,319 | $31,875 |
| Bachelor's Degree | - | - |
| Graduate Degree | - | - |
| Total | $45,417 | $43,409 |
Family Income in Wilmar
Family Income Brackets in Wilmar
According to the Wilmar family income data, there are 30 families falling into the $75,000 to $99,999 income range, which is the most common income bracket and makes up 33.3% of all families.
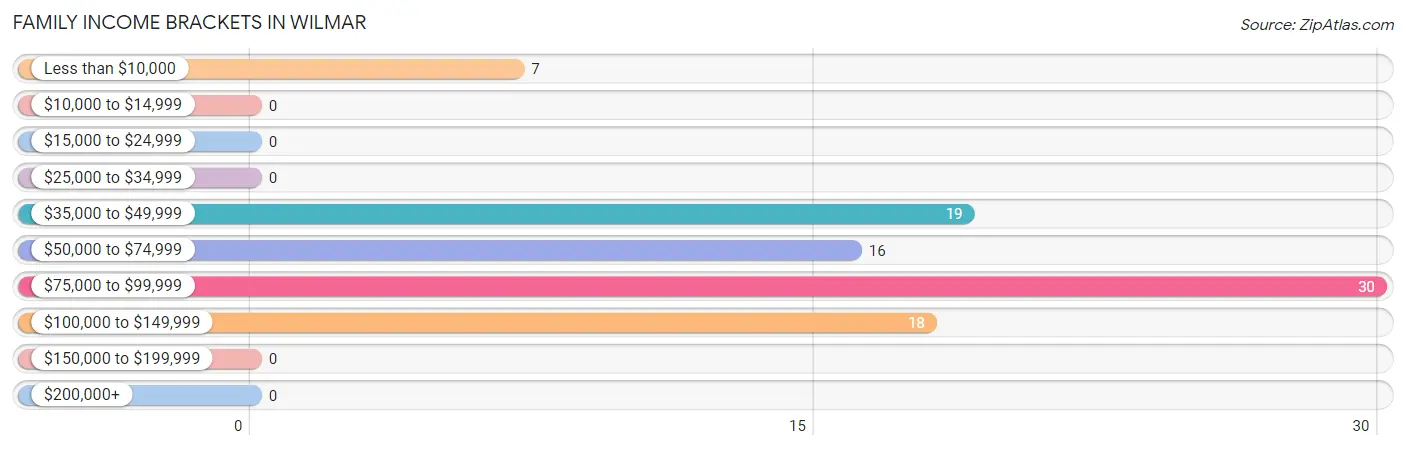
| Income Bracket | # Families | % Families |
| Less than $10,000 | 7 | 7.8% |
| $10,000 to $14,999 | 0 | 0.0% |
| $15,000 to $24,999 | 0 | 0.0% |
| $25,000 to $34,999 | 0 | 0.0% |
| $35,000 to $49,999 | 19 | 21.1% |
| $50,000 to $74,999 | 16 | 17.8% |
| $75,000 to $99,999 | 30 | 33.3% |
| $100,000 to $149,999 | 18 | 20.0% |
| $150,000 to $199,999 | 0 | 0.0% |
| $200,000+ | 0 | 0.0% |
Family Income by Famaliy Size in Wilmar
5-person families (22 | 24.4%) account for the highest median family income in Wilmar with $98,571 per family, while 2-person families (39 | 43.3%) have the highest median income of $34,097 per family member.
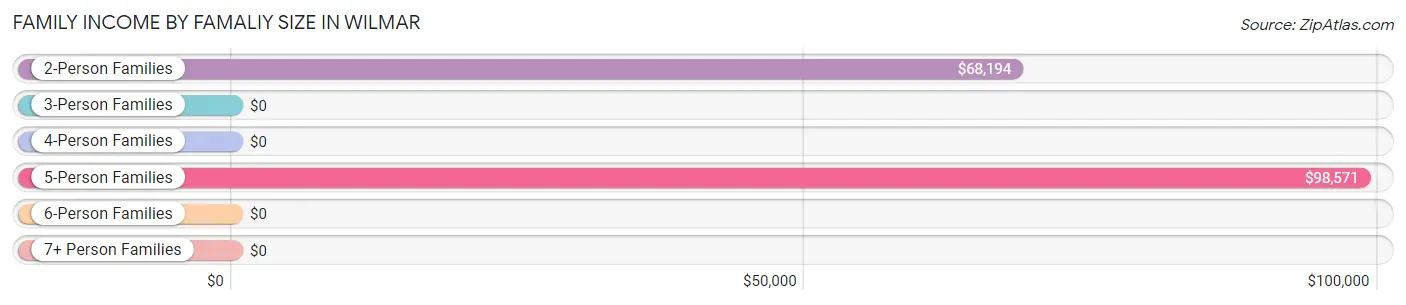
| Income Bracket | # Families | Median Income |
| 2-Person Families | 39 (43.3%) | $68,194 |
| 3-Person Families | 14 (15.6%) | $0 |
| 4-Person Families | 0 (0.0%) | $0 |
| 5-Person Families | 22 (24.4%) | $98,571 |
| 6-Person Families | 15 (16.7%) | $0 |
| 7+ Person Families | 0 (0.0%) | $0 |
| Total | 90 (100.0%) | $82,500 |
Family Income by Number of Earners in Wilmar
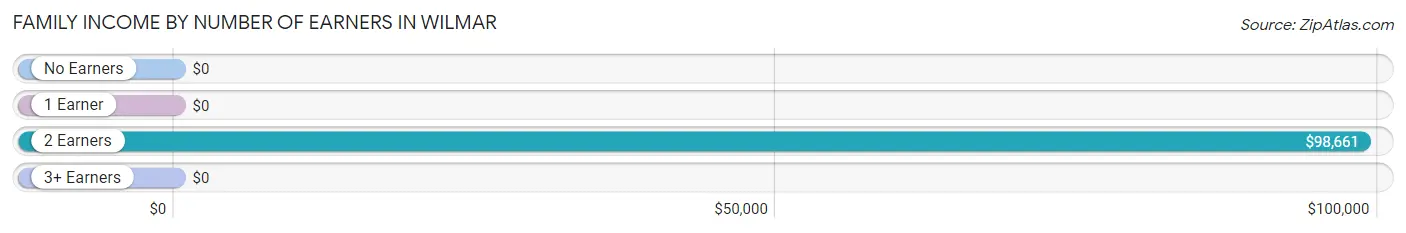
| Number of Earners | # Families | Median Income |
| No Earners | 11 (12.2%) | $0 |
| 1 Earner | 31 (34.4%) | $0 |
| 2 Earners | 45 (50.0%) | $98,661 |
| 3+ Earners | 3 (3.3%) | $0 |
| Total | 90 (100.0%) | $82,500 |
Household Income in Wilmar
Household Income Brackets in Wilmar
With 59 households falling in the category, the $15,000 to $24,999 income range is the most frequent in Wilmar, accounting for 30.3% of all households.
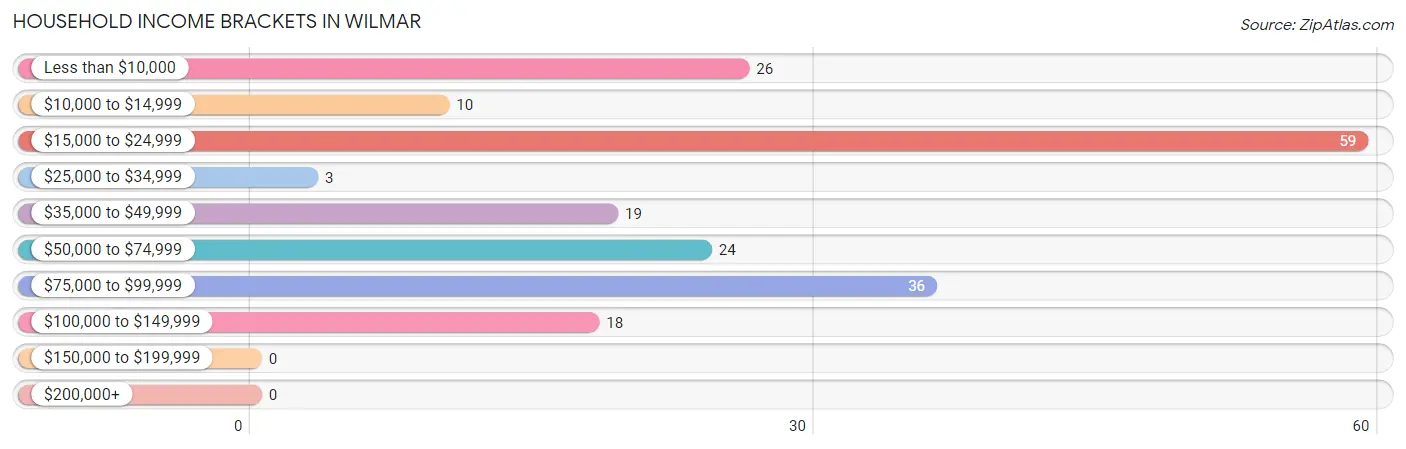
| Income Bracket | # Households | % Households |
| Less than $10,000 | 26 | 13.3% |
| $10,000 to $14,999 | 10 | 5.1% |
| $15,000 to $24,999 | 59 | 30.3% |
| $25,000 to $34,999 | 3 | 1.5% |
| $35,000 to $49,999 | 19 | 9.7% |
| $50,000 to $74,999 | 24 | 12.3% |
| $75,000 to $99,999 | 36 | 18.5% |
| $100,000 to $149,999 | 18 | 9.2% |
| $150,000 to $199,999 | 0 | 0.0% |
| $200,000+ | 0 | 0.0% |
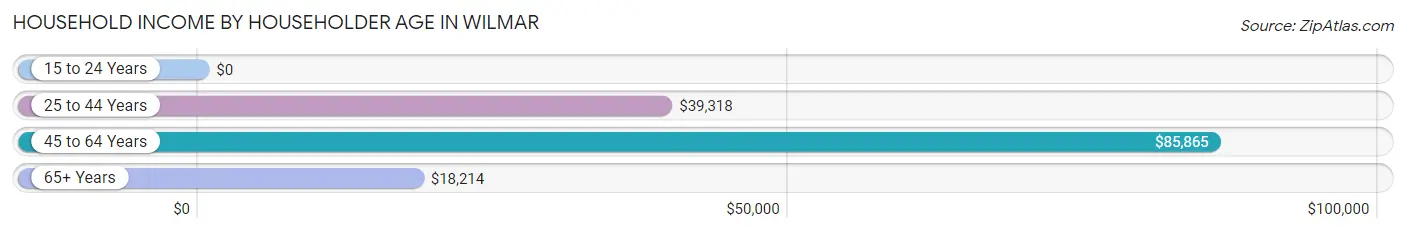
Household Income by Householder Age in Wilmar
The median household income in Wilmar is $0, with the highest median household income of $85,865 found in the 45 to 64 years age bracket for the primary householder. A total of 75 households (38.5%) fall into this category.
| Income Bracket | # Households | Median Income |
| 15 to 24 Years | 0 (0.0%) | $0 |
| 25 to 44 Years | 36 (18.5%) | $39,318 |
| 45 to 64 Years | 75 (38.5%) | $85,865 |
| 65+ Years | 84 (43.1%) | $18,214 |
| Total | 195 (100.0%) | $0 |
Poverty in Wilmar
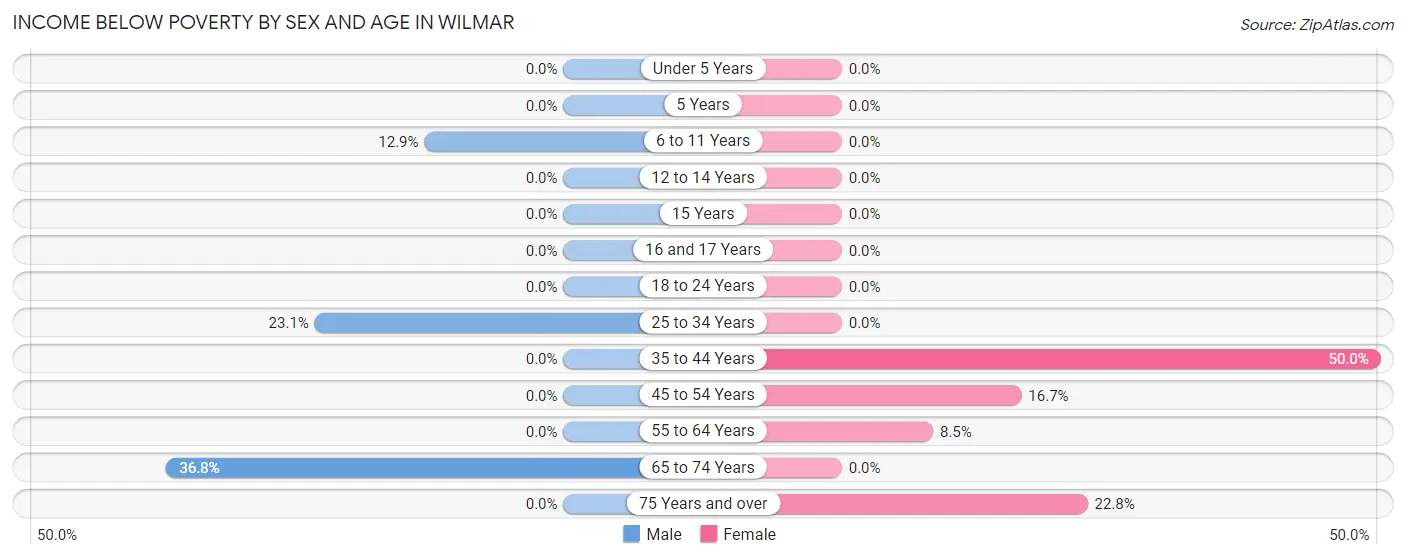
Income Below Poverty by Sex and Age in Wilmar
With 9.0% poverty level for males and 11.4% for females among the residents of Wilmar, 65 to 74 year old males and 35 to 44 year old females are the most vulnerable to poverty, with 7 males (36.8%) and 7 females (50.0%) in their respective age groups living below the poverty level.
| Age Bracket | Male | Female |
| Under 5 Years | 0 (0.0%) | 0 (0.0%) |
| 5 Years | 0 (0.0%) | 0 (0.0%) |
| 6 to 11 Years | 4 (12.9%) | 0 (0.0%) |
| 12 to 14 Years | 0 (0.0%) | 0 (0.0%) |
| 15 Years | 0 (0.0%) | 0 (0.0%) |
| 16 and 17 Years | 0 (0.0%) | 0 (0.0%) |
| 18 to 24 Years | 0 (0.0%) | 0 (0.0%) |
| 25 to 34 Years | 3 (23.1%) | 0 (0.0%) |
| 35 to 44 Years | 0 (0.0%) | 7 (50.0%) |
| 45 to 54 Years | 0 (0.0%) | 1 (16.7%) |
| 55 to 64 Years | 0 (0.0%) | 5 (8.5%) |
| 65 to 74 Years | 7 (36.8%) | 0 (0.0%) |
| 75 Years and over | 0 (0.0%) | 13 (22.8%) |
| Total | 14 (9.0%) | 26 (11.4%) |
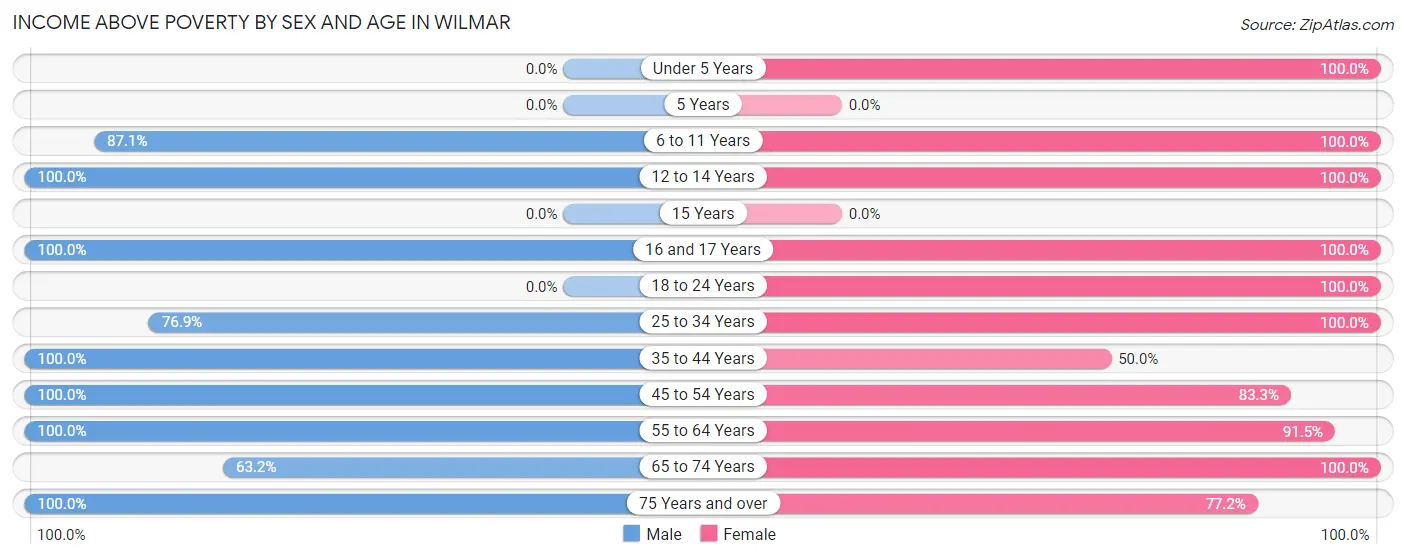
Income Above Poverty by Sex and Age in Wilmar
According to the poverty statistics in Wilmar, males aged 12 to 14 years and females aged under 5 years are the age groups that are most secure financially, with 100.0% of males and 100.0% of females in these age groups living above the poverty line.
| Age Bracket | Male | Female |
| Under 5 Years | 0 (0.0%) | 19 (100.0%) |
| 5 Years | 0 (0.0%) | 0 (0.0%) |
| 6 to 11 Years | 27 (87.1%) | 9 (100.0%) |
| 12 to 14 Years | 4 (100.0%) | 4 (100.0%) |
| 15 Years | 0 (0.0%) | 0 (0.0%) |
| 16 and 17 Years | 23 (100.0%) | 3 (100.0%) |
| 18 to 24 Years | 0 (0.0%) | 4 (100.0%) |
| 25 to 34 Years | 10 (76.9%) | 19 (100.0%) |
| 35 to 44 Years | 13 (100.0%) | 7 (50.0%) |
| 45 to 54 Years | 3 (100.0%) | 5 (83.3%) |
| 55 to 64 Years | 48 (100.0%) | 54 (91.5%) |
| 65 to 74 Years | 12 (63.2%) | 35 (100.0%) |
| 75 Years and over | 1 (100.0%) | 44 (77.2%) |
| Total | 141 (91.0%) | 203 (88.6%) |
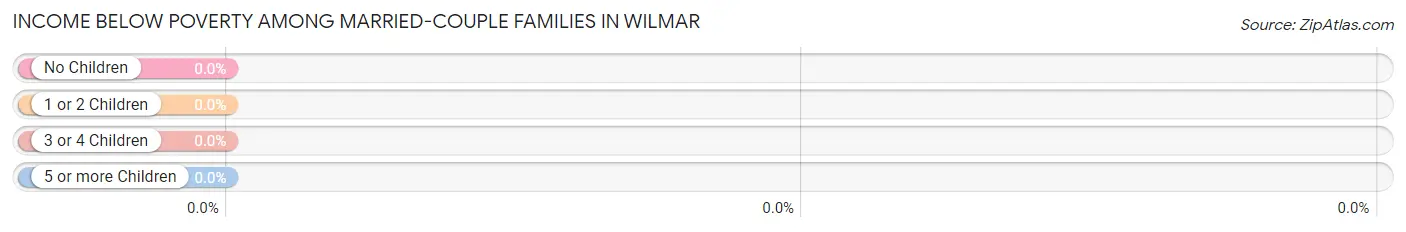
Income Below Poverty Among Married-Couple Families in Wilmar
| Children | Above Poverty | Below Poverty |
| No Children | 16 (100.0%) | 0 (0.0%) |
| 1 or 2 Children | 0 (0.0%) | 0 (0.0%) |
| 3 or 4 Children | 37 (100.0%) | 0 (0.0%) |
| 5 or more Children | 0 (0.0%) | 0 (0.0%) |
| Total | 53 (100.0%) | 0 (0.0%) |
Income Below Poverty Among Single-Parent Households in Wilmar
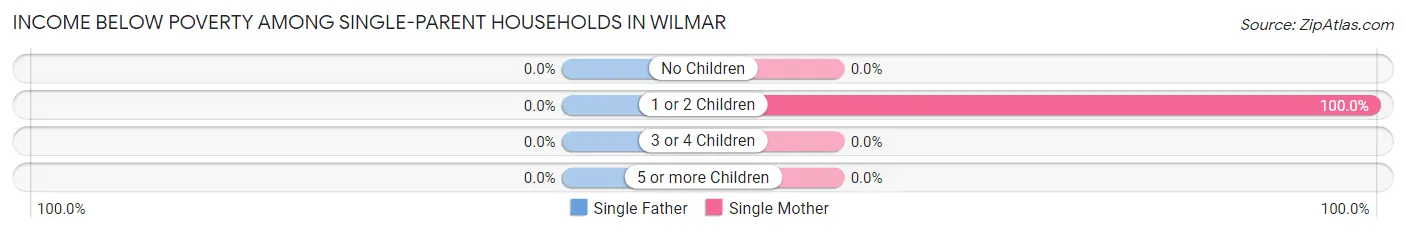
| Children | Single Father | Single Mother |
| No Children | 0 (0.0%) | 0 (0.0%) |
| 1 or 2 Children | 0 (0.0%) | 7 (100.0%) |
| 3 or 4 Children | 0 (0.0%) | 0 (0.0%) |
| 5 or more Children | 0 (0.0%) | 0 (0.0%) |
| Total | 0 (0.0%) | 7 (18.9%) |
Income Below Poverty Among Married-Couple vs Single-Parent Households in Wilmar
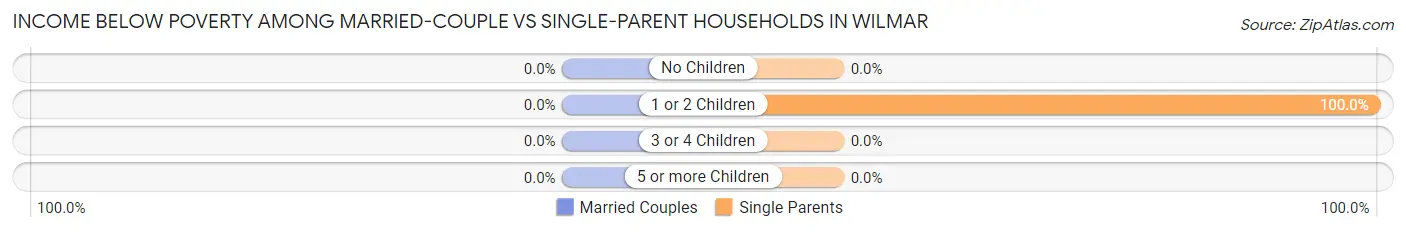
| Children | Married-Couple Families | Single-Parent Households |
| No Children | 0 (0.0%) | 0 (0.0%) |
| 1 or 2 Children | 0 (0.0%) | 7 (100.0%) |
| 3 or 4 Children | 0 (0.0%) | 0 (0.0%) |
| 5 or more Children | 0 (0.0%) | 0 (0.0%) |
| Total | 0 (0.0%) | 7 (18.9%) |
Race in Wilmar
The most populous races in Wilmar are Black / African American (300 | 78.1%), and White / Caucasian (84 | 21.9%).
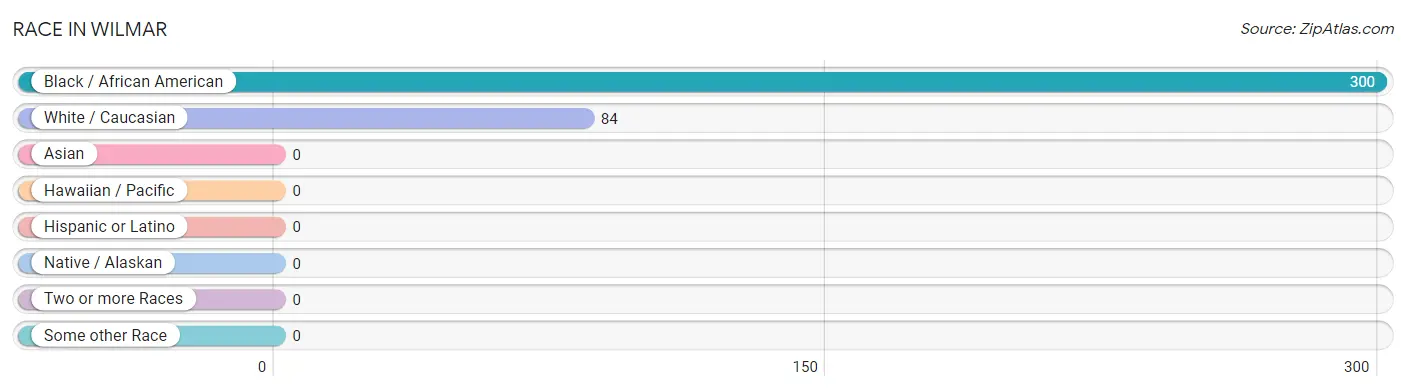
| Race | # Population | % Population |
| Asian | 0 | 0.0% |
| Black / African American | 300 | 78.1% |
| Hawaiian / Pacific | 0 | 0.0% |
| Hispanic or Latino | 0 | 0.0% |
| Native / Alaskan | 0 | 0.0% |
| White / Caucasian | 84 | 21.9% |
| Two or more Races | 0 | 0.0% |
| Some other Race | 0 | 0.0% |
| Total | 384 | 100.0% |
Ancestry in Wilmar
The most populous ancestries reported in Wilmar are African (18 | 4.7%), Subsaharan African (18 | 4.7%), English (5 | 1.3%), German (1 | 0.3%), and Irish (1 | 0.3%), together accounting for 11.2% of all Wilmar residents.
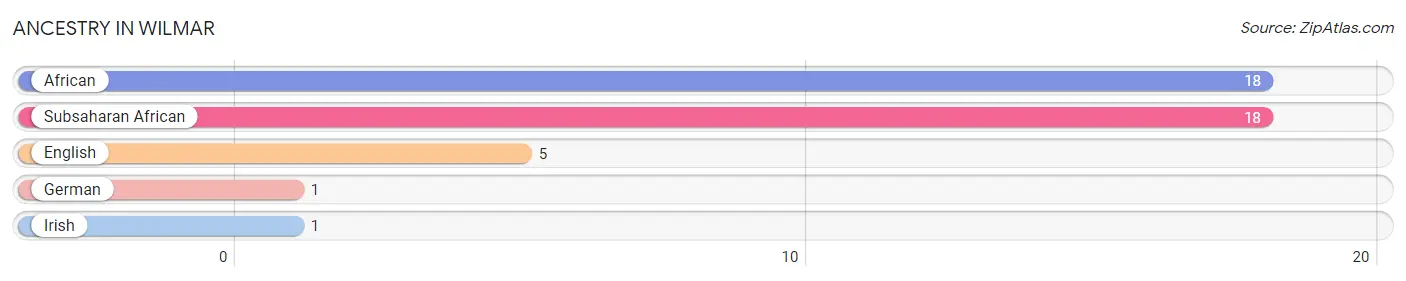
| Ancestry | # Population | % Population |
| African | 18 | 4.7% |
| English | 5 | 1.3% |
| German | 1 | 0.3% |
| Irish | 1 | 0.3% |
| Subsaharan African | 18 | 4.7% | View All 5 Rows |
Immigrants in Wilmar

| Immigration Origin | # Population | % Population | View All 0 Rows |
Sex and Age in Wilmar
Sex and Age in Wilmar
The most populous age groups in Wilmar are 60 to 64 Years (30 | 19.4%) for men and 55 to 59 Years (33 | 14.4%) for women.
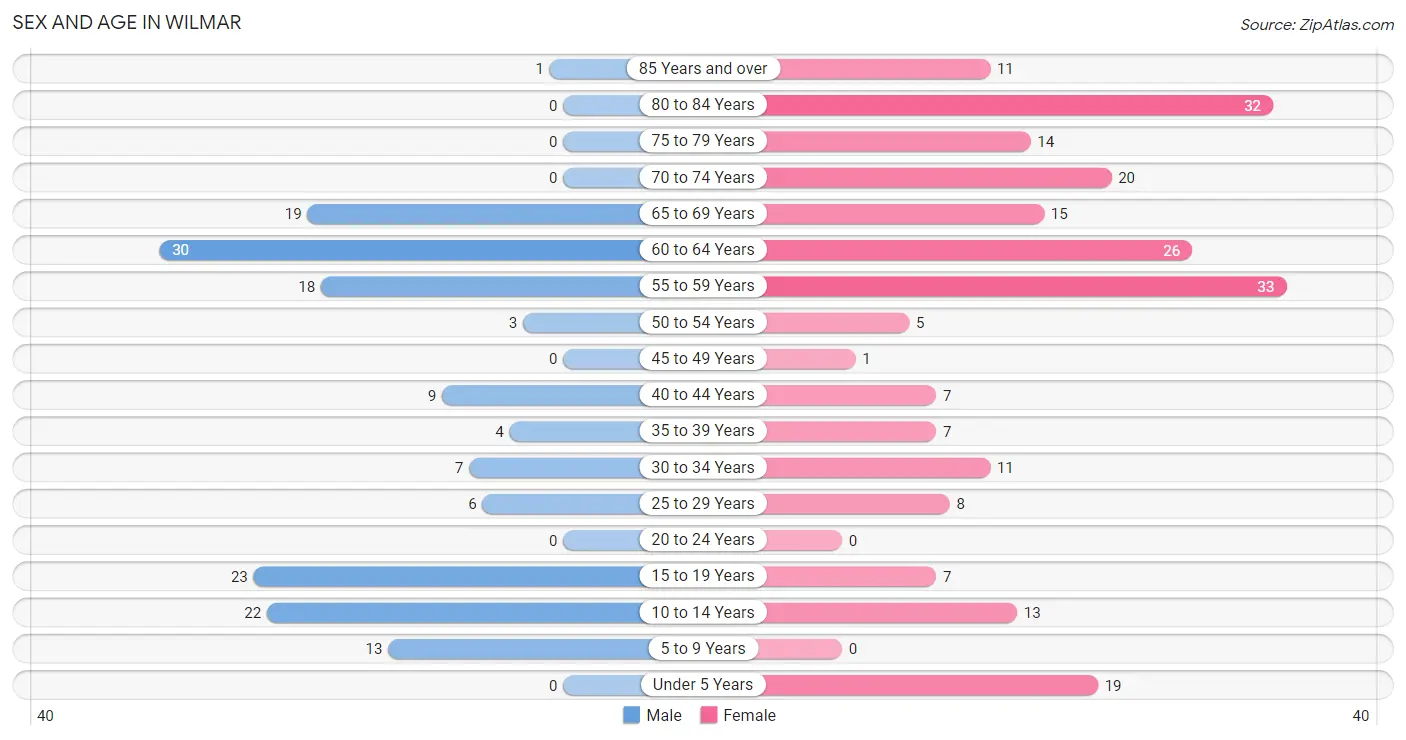
| Age Bracket | Male | Female |
| Under 5 Years | 0 (0.0%) | 19 (8.3%) |
| 5 to 9 Years | 13 (8.4%) | 0 (0.0%) |
| 10 to 14 Years | 22 (14.2%) | 13 (5.7%) |
| 15 to 19 Years | 23 (14.8%) | 7 (3.1%) |
| 20 to 24 Years | 0 (0.0%) | 0 (0.0%) |
| 25 to 29 Years | 6 (3.9%) | 8 (3.5%) |
| 30 to 34 Years | 7 (4.5%) | 11 (4.8%) |
| 35 to 39 Years | 4 (2.6%) | 7 (3.1%) |
| 40 to 44 Years | 9 (5.8%) | 7 (3.1%) |
| 45 to 49 Years | 0 (0.0%) | 1 (0.4%) |
| 50 to 54 Years | 3 (1.9%) | 5 (2.2%) |
| 55 to 59 Years | 18 (11.6%) | 33 (14.4%) |
| 60 to 64 Years | 30 (19.4%) | 26 (11.4%) |
| 65 to 69 Years | 19 (12.3%) | 15 (6.6%) |
| 70 to 74 Years | 0 (0.0%) | 20 (8.7%) |
| 75 to 79 Years | 0 (0.0%) | 14 (6.1%) |
| 80 to 84 Years | 0 (0.0%) | 32 (14.0%) |
| 85 Years and over | 1 (0.6%) | 11 (4.8%) |
| Total | 155 (100.0%) | 229 (100.0%) |
Families and Households in Wilmar
Median Family Size in Wilmar
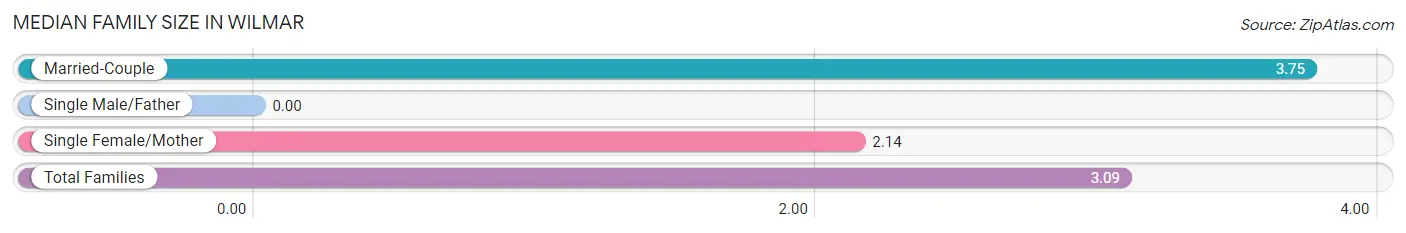
| Family Type | # Families | Family Size |
| Married-Couple | 53 (58.9%) | 3.75 |
| Single Male/Father | 0 (0.0%) | - |
| Single Female/Mother | 37 (41.1%) | 2.14 |
| Total Families | 90 (100.0%) | 3.09 |
Median Household Size in Wilmar
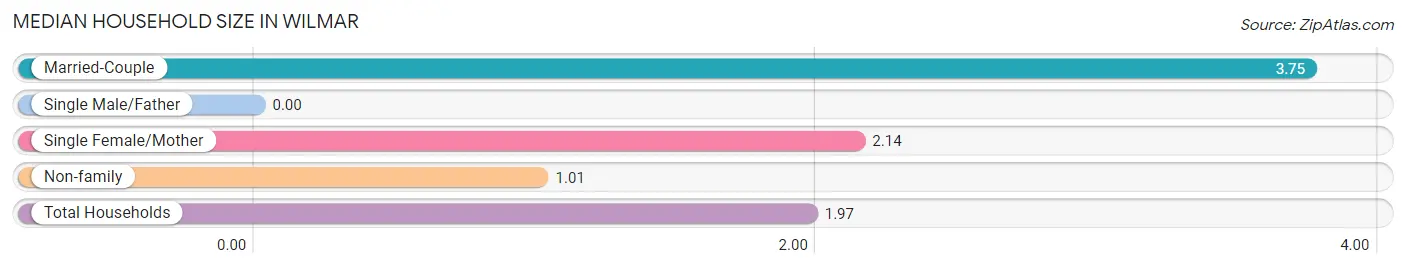
| Household Type | # Households | Household Size |
| Married-Couple | 53 (27.2%) | 3.75 |
| Single Male/Father | 0 (0.0%) | - |
| Single Female/Mother | 37 (19.0%) | 2.14 |
| Non-family | 105 (53.8%) | 1.01 |
| Total Households | 195 (100.0%) | 1.97 |
Household Size by Marriage Status in Wilmar
Out of a total of 195 households in Wilmar, 90 (46.2%) are family households, while 105 (53.8%) are nonfamily households. The most numerous type of family households are 2-person households, comprising 39, and the most common type of nonfamily households are 1-person households, comprising 104.
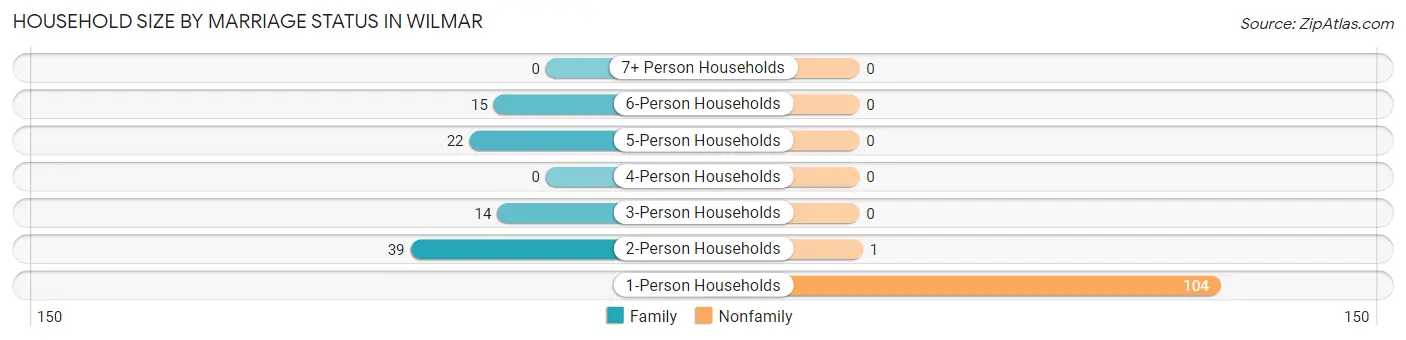
| Household Size | Family Households | Nonfamily Households |
| 1-Person Households | - | 104 (53.3%) |
| 2-Person Households | 39 (20.0%) | 1 (0.5%) |
| 3-Person Households | 14 (7.2%) | 0 (0.0%) |
| 4-Person Households | 0 (0.0%) | 0 (0.0%) |
| 5-Person Households | 22 (11.3%) | 0 (0.0%) |
| 6-Person Households | 15 (7.7%) | 0 (0.0%) |
| 7+ Person Households | 0 (0.0%) | 0 (0.0%) |
| Total | 90 (46.2%) | 105 (53.8%) |
Female Fertility in Wilmar
Fertility by Age in Wilmar
| Age Bracket | Women with Births | Births / 1,000 Women |
| 15 to 19 years | 0 (0.0%) | 0.0 |
| 20 to 34 years | 0 (0.0%) | 0.0 |
| 35 to 50 years | 0 (0.0%) | 0.0 |
| Total | 0 (0.0%) | 0.0 |
Fertility by Age by Marriage Status in Wilmar
| Age Bracket | Married | Unmarried |
| 15 to 19 years | 0 (0.0%) | 0 (0.0%) |
| 20 to 34 years | 0 (0.0%) | 0 (0.0%) |
| 35 to 50 years | 0 (0.0%) | 0 (0.0%) |
| Total | 0 (0.0%) | 0 (0.0%) |
Fertility by Education in Wilmar
| Educational Attainment | Women with Births | Births / 1,000 Women |
| Less than High School | 0 (0.0%) | 0.0 |
| High School Diploma | 0 (0.0%) | 0.0 |
| College or Associate's Degree | 0 (0.0%) | 0.0 |
| Bachelor's Degree | 0 (0.0%) | 0.0 |
| Graduate Degree | 0 (0.0%) | 0.0 |
| Total | 0 (0.0%) | 0.0 |
Fertility by Education by Marriage Status in Wilmar
| Educational Attainment | Married | Unmarried |
| Less than High School | 0 (0.0%) | 0 (0.0%) |
| High School Diploma | 0 (0.0%) | 0 (0.0%) |
| College or Associate's Degree | 0 (0.0%) | 0 (0.0%) |
| Bachelor's Degree | 0 (0.0%) | 0 (0.0%) |
| Graduate Degree | 0 (0.0%) | 0 (0.0%) |
| Total | 0 (0.0%) | 0 (0.0%) |
Employment Characteristics in Wilmar
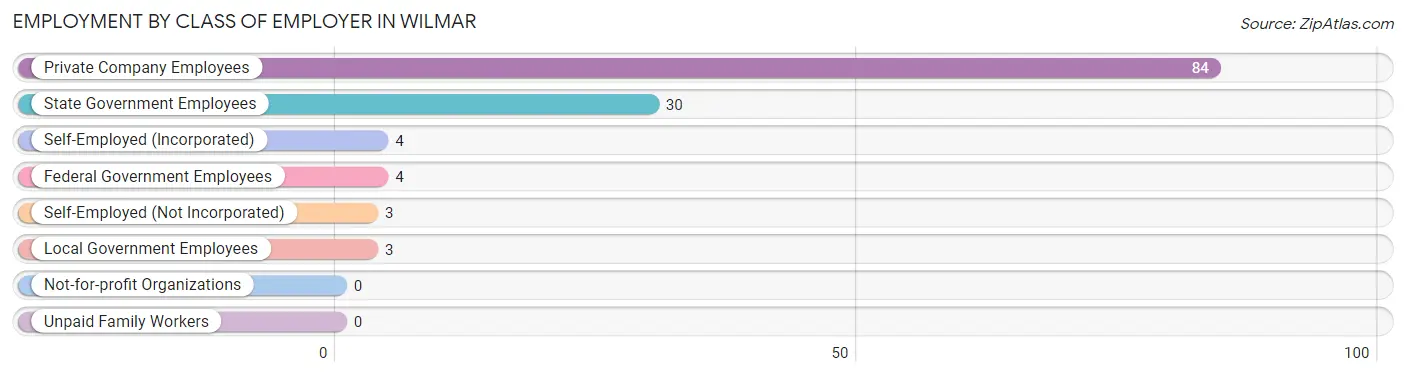
Employment by Class of Employer in Wilmar
Among the 128 employed individuals in Wilmar, private company employees (84 | 65.6%), state government employees (30 | 23.4%), and self-employed (incorporated) (4 | 3.1%) make up the most common classes of employment.
| Employer Class | # Employees | % Employees |
| Private Company Employees | 84 | 65.6% |
| Self-Employed (Incorporated) | 4 | 3.1% |
| Self-Employed (Not Incorporated) | 3 | 2.3% |
| Not-for-profit Organizations | 0 | 0.0% |
| Local Government Employees | 3 | 2.3% |
| State Government Employees | 30 | 23.4% |
| Federal Government Employees | 4 | 3.1% |
| Unpaid Family Workers | 0 | 0.0% |
| Total | 128 | 100.0% |
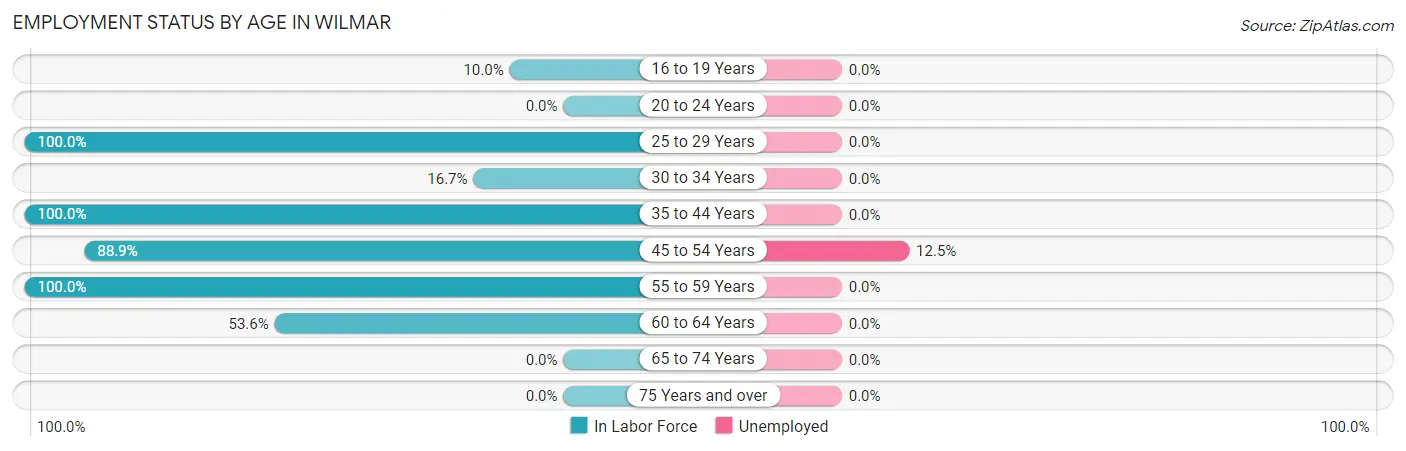
Employment Status by Age in Wilmar
According to the labor force statistics for Wilmar, out of the total population over 16 years of age (317), 42.9% or 136 individuals are in the labor force, with 0.7% or 1 of them unemployed. The age group with the highest labor force participation rate is 25 to 29 years, with 100.0% or 14 individuals in the labor force. Within the labor force, the 45 to 54 years age range has the highest percentage of unemployed individuals, with 12.5% or 1 of them being unemployed.
| Age Bracket | In Labor Force | Unemployed |
| 16 to 19 Years | 3 (10.0%) | 0 (0.0%) |
| 20 to 24 Years | 0 (0.0%) | 0 (0.0%) |
| 25 to 29 Years | 14 (100.0%) | 0 (0.0%) |
| 30 to 34 Years | 3 (16.7%) | 0 (0.0%) |
| 35 to 44 Years | 27 (100.0%) | 0 (0.0%) |
| 45 to 54 Years | 8 (88.9%) | 1 (12.5%) |
| 55 to 59 Years | 51 (100.0%) | 0 (0.0%) |
| 60 to 64 Years | 30 (53.6%) | 0 (0.0%) |
| 65 to 74 Years | 0 (0.0%) | 0 (0.0%) |
| 75 Years and over | 0 (0.0%) | 0 (0.0%) |
| Total | 136 (42.9%) | 1 (0.7%) |
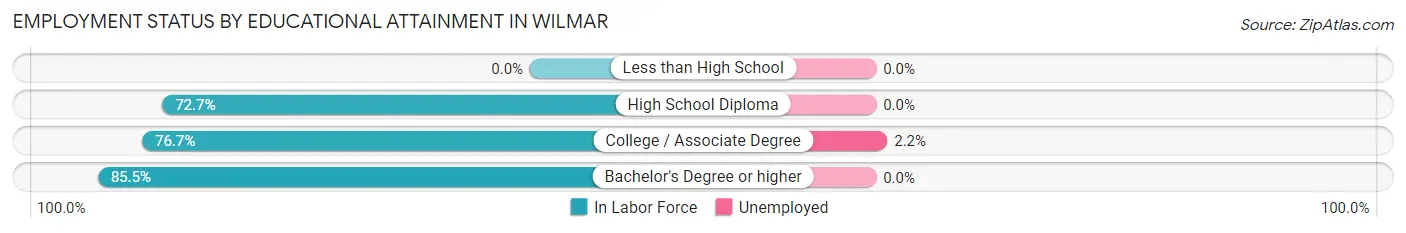
Employment Status by Educational Attainment in Wilmar
According to labor force statistics for Wilmar, 76.0% of individuals (133) out of the total population between 25 and 64 years of age (175) are in the labor force, with 0.8% or 1 of them being unemployed. The group with the highest labor force participation rate are those with the educational attainment of bachelor's degree or higher, with 85.5% or 47 individuals in the labor force. Within the labor force, individuals with college / associate degree education have the highest percentage of unemployment, with 2.2% or 1 of them being unemployed.
| Educational Attainment | In Labor Force | Unemployed |
| Less than High School | 0 (0.0%) | 0 (0.0%) |
| High School Diploma | 40 (72.7%) | 0 (0.0%) |
| College / Associate Degree | 46 (76.7%) | 1 (2.2%) |
| Bachelor's Degree or higher | 47 (85.5%) | 0 (0.0%) |
| Total | 133 (76.0%) | 1 (0.8%) |
Employment Occupations by Sex in Wilmar
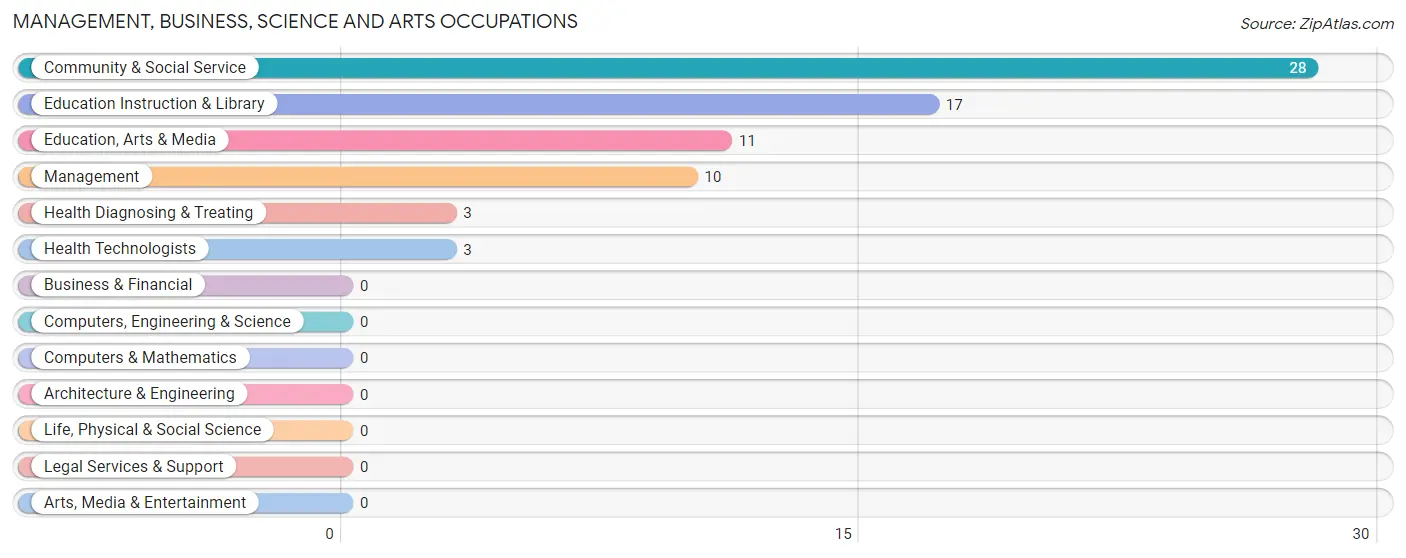
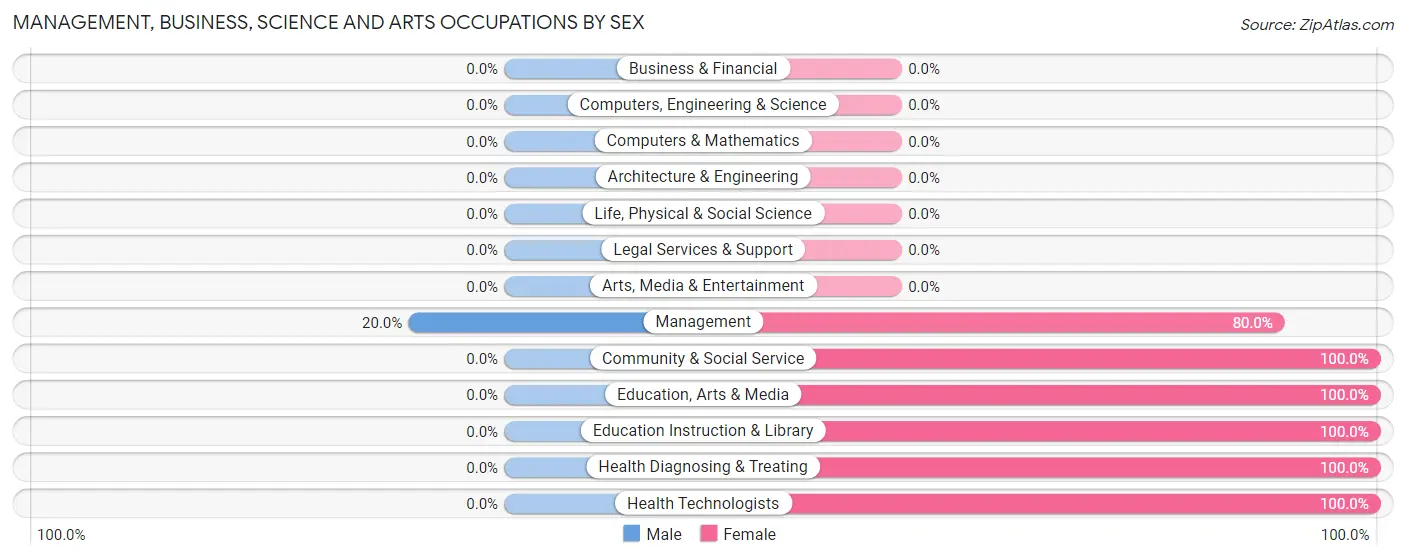
Management, Business, Science and Arts Occupations
The most common Management, Business, Science and Arts occupations in Wilmar are Community & Social Service (28 | 20.7%), Education Instruction & Library (17 | 12.6%), Education, Arts & Media (11 | 8.2%), Management (10 | 7.4%), and Health Diagnosing & Treating (3 | 2.2%).
Management, Business, Science and Arts Occupations by Sex
| Occupation | Male | Female |
| Management | 2 (20.0%) | 8 (80.0%) |
| Business & Financial | 0 (0.0%) | 0 (0.0%) |
| Computers, Engineering & Science | 0 (0.0%) | 0 (0.0%) |
| Computers & Mathematics | 0 (0.0%) | 0 (0.0%) |
| Architecture & Engineering | 0 (0.0%) | 0 (0.0%) |
| Life, Physical & Social Science | 0 (0.0%) | 0 (0.0%) |
| Community & Social Service | 0 (0.0%) | 28 (100.0%) |
| Education, Arts & Media | 0 (0.0%) | 11 (100.0%) |
| Legal Services & Support | 0 (0.0%) | 0 (0.0%) |
| Education Instruction & Library | 0 (0.0%) | 17 (100.0%) |
| Arts, Media & Entertainment | 0 (0.0%) | 0 (0.0%) |
| Health Diagnosing & Treating | 0 (0.0%) | 3 (100.0%) |
| Health Technologists | 0 (0.0%) | 3 (100.0%) |
| Total (Category) | 2 (4.9%) | 39 (95.1%) |
| Total (Overall) | 60 (44.4%) | 75 (55.6%) |
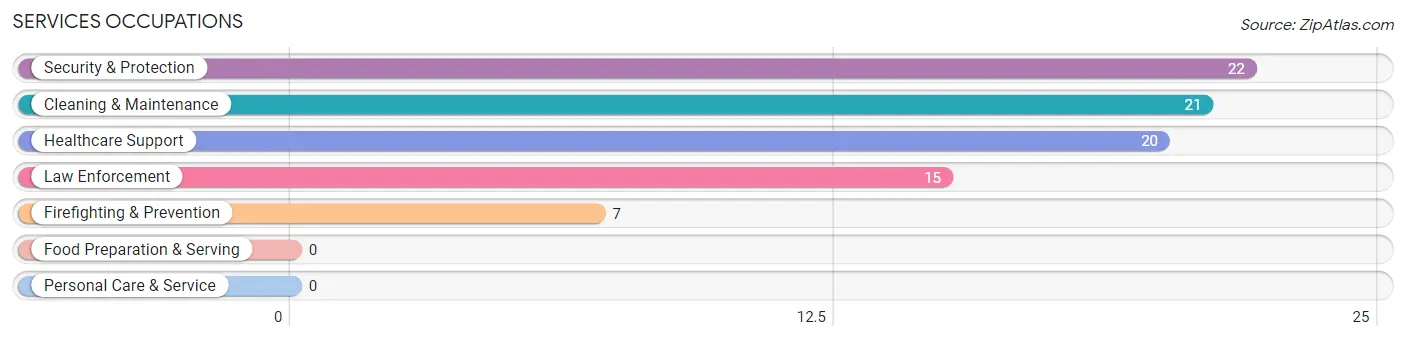
Services Occupations
The most common Services occupations in Wilmar are Security & Protection (22 | 16.3%), Cleaning & Maintenance (21 | 15.6%), Healthcare Support (20 | 14.8%), Law Enforcement (15 | 11.1%), and Firefighting & Prevention (7 | 5.2%).
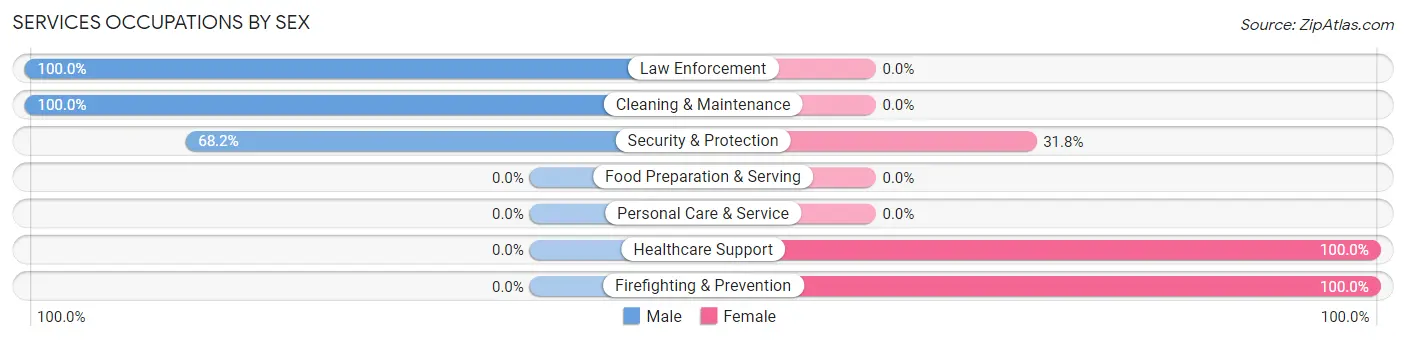
Services Occupations by Sex
Within the Services occupations in Wilmar, the most male-oriented occupations are Law Enforcement (100.0%), Cleaning & Maintenance (100.0%), and Security & Protection (68.2%), while the most female-oriented occupations are Healthcare Support (100.0%), Firefighting & Prevention (100.0%), and Security & Protection (31.8%).
| Occupation | Male | Female |
| Healthcare Support | 0 (0.0%) | 20 (100.0%) |
| Security & Protection | 15 (68.2%) | 7 (31.8%) |
| Firefighting & Prevention | 0 (0.0%) | 7 (100.0%) |
| Law Enforcement | 15 (100.0%) | 0 (0.0%) |
| Food Preparation & Serving | 0 (0.0%) | 0 (0.0%) |
| Cleaning & Maintenance | 21 (100.0%) | 0 (0.0%) |
| Personal Care & Service | 0 (0.0%) | 0 (0.0%) |
| Total (Category) | 36 (57.1%) | 27 (42.9%) |
| Total (Overall) | 60 (44.4%) | 75 (55.6%) |
Sales and Office Occupations
The most common Sales and Office occupations in Wilmar are Office & Administration (5 | 3.7%), and Sales & Related (4 | 3.0%).
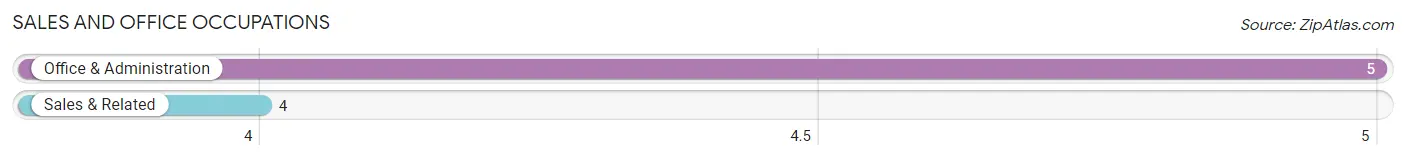
Sales and Office Occupations by Sex
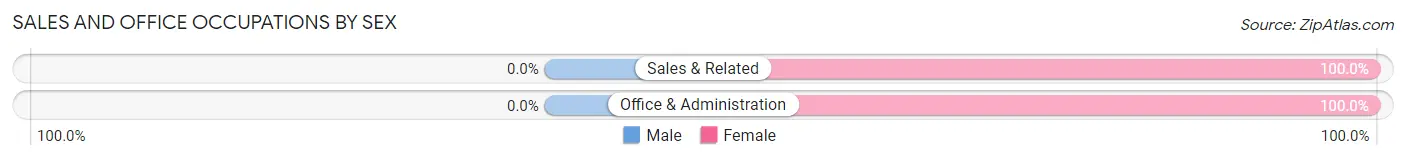
| Occupation | Male | Female |
| Sales & Related | 0 (0.0%) | 4 (100.0%) |
| Office & Administration | 0 (0.0%) | 5 (100.0%) |
| Total (Category) | 0 (0.0%) | 9 (100.0%) |
| Total (Overall) | 60 (44.4%) | 75 (55.6%) |
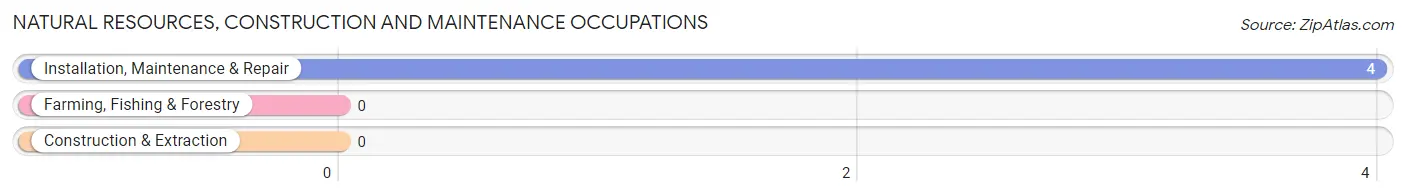
Natural Resources, Construction and Maintenance Occupations
The most common Natural Resources, Construction and Maintenance occupations in Wilmar are , and Installation, Maintenance & Repair (4 | 3.0%).
Natural Resources, Construction and Maintenance Occupations by Sex
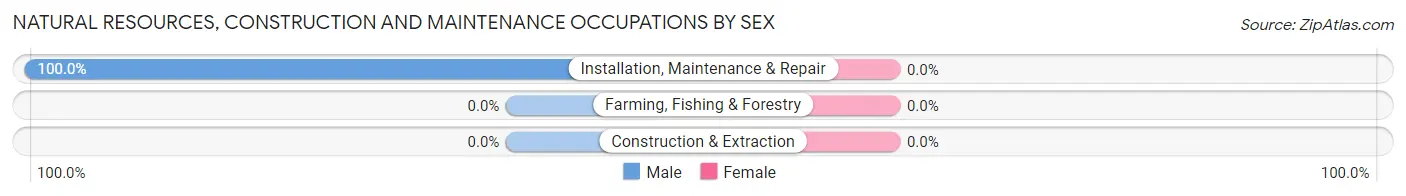
| Occupation | Male | Female |
| Farming, Fishing & Forestry | 0 (0.0%) | 0 (0.0%) |
| Construction & Extraction | 0 (0.0%) | 0 (0.0%) |
| Installation, Maintenance & Repair | 4 (100.0%) | 0 (0.0%) |
| Total (Category) | 4 (100.0%) | 0 (0.0%) |
| Total (Overall) | 60 (44.4%) | 75 (55.6%) |
Production, Transportation and Moving Occupations
The most common Production, Transportation and Moving occupations in Wilmar are Production (12 | 8.9%), and Transportation (6 | 4.4%).
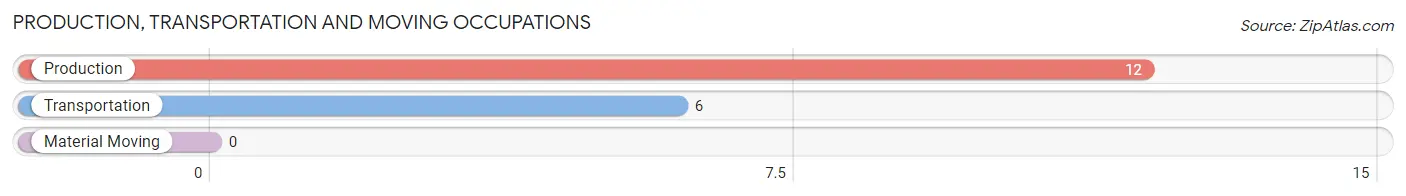
Production, Transportation and Moving Occupations by Sex
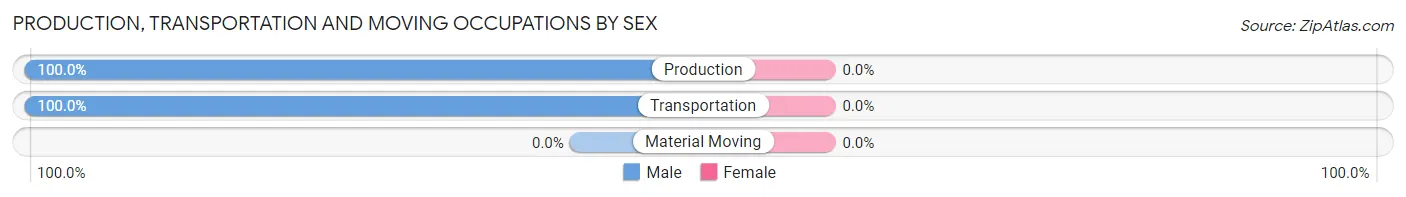
| Occupation | Male | Female |
| Production | 12 (100.0%) | 0 (0.0%) |
| Transportation | 6 (100.0%) | 0 (0.0%) |
| Material Moving | 0 (0.0%) | 0 (0.0%) |
| Total (Category) | 18 (100.0%) | 0 (0.0%) |
| Total (Overall) | 60 (44.4%) | 75 (55.6%) |
Employment Industries by Sex in Wilmar
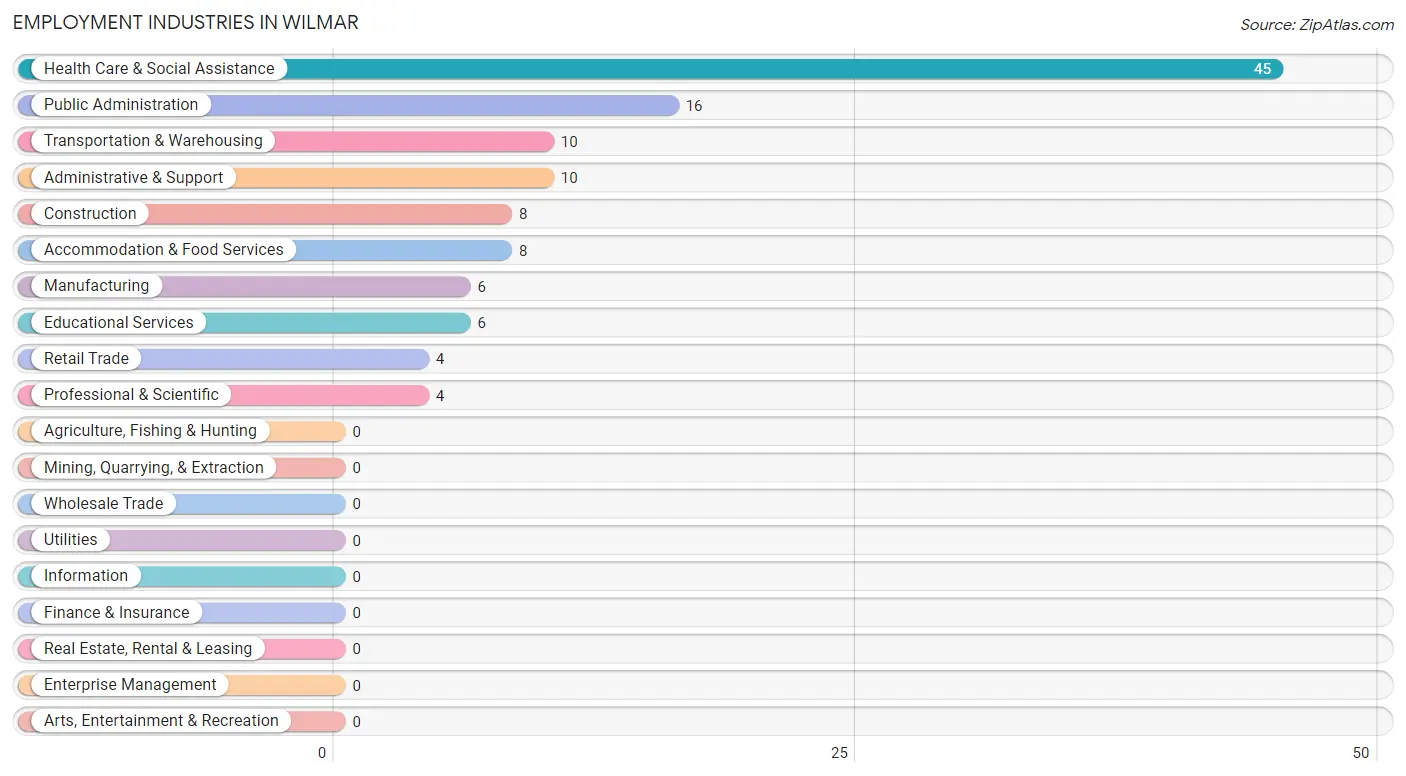
Employment Industries in Wilmar
The major employment industries in Wilmar include Health Care & Social Assistance (45 | 33.3%), Public Administration (16 | 11.8%), Transportation & Warehousing (10 | 7.4%), Administrative & Support (10 | 7.4%), and Construction (8 | 5.9%).
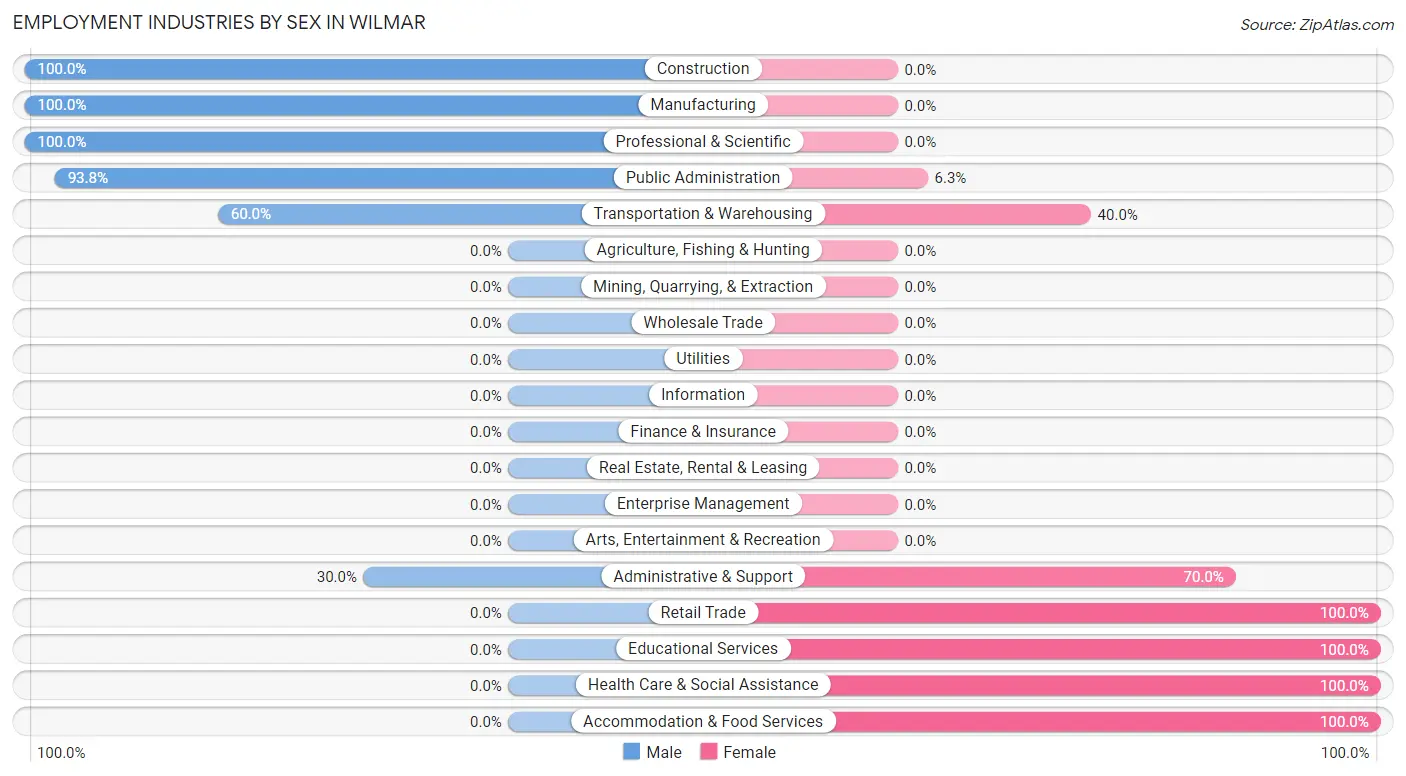
Employment Industries by Sex in Wilmar
The Wilmar industries that see more men than women are Construction (100.0%), Manufacturing (100.0%), and Professional & Scientific (100.0%), whereas the industries that tend to have a higher number of women are Retail Trade (100.0%), Educational Services (100.0%), and Health Care & Social Assistance (100.0%).
| Industry | Male | Female |
| Agriculture, Fishing & Hunting | 0 (0.0%) | 0 (0.0%) |
| Mining, Quarrying, & Extraction | 0 (0.0%) | 0 (0.0%) |
| Construction | 8 (100.0%) | 0 (0.0%) |
| Manufacturing | 6 (100.0%) | 0 (0.0%) |
| Wholesale Trade | 0 (0.0%) | 0 (0.0%) |
| Retail Trade | 0 (0.0%) | 4 (100.0%) |
| Transportation & Warehousing | 6 (60.0%) | 4 (40.0%) |
| Utilities | 0 (0.0%) | 0 (0.0%) |
| Information | 0 (0.0%) | 0 (0.0%) |
| Finance & Insurance | 0 (0.0%) | 0 (0.0%) |
| Real Estate, Rental & Leasing | 0 (0.0%) | 0 (0.0%) |
| Professional & Scientific | 4 (100.0%) | 0 (0.0%) |
| Enterprise Management | 0 (0.0%) | 0 (0.0%) |
| Administrative & Support | 3 (30.0%) | 7 (70.0%) |
| Educational Services | 0 (0.0%) | 6 (100.0%) |
| Health Care & Social Assistance | 0 (0.0%) | 45 (100.0%) |
| Arts, Entertainment & Recreation | 0 (0.0%) | 0 (0.0%) |
| Accommodation & Food Services | 0 (0.0%) | 8 (100.0%) |
| Public Administration | 15 (93.8%) | 1 (6.2%) |
| Total | 60 (44.4%) | 75 (55.6%) |
Education in Wilmar
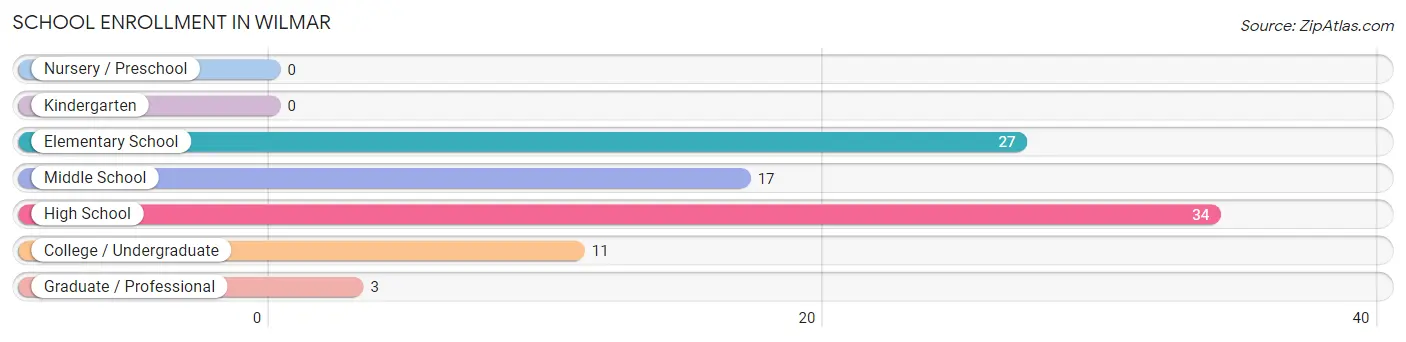
School Enrollment in Wilmar
The most common levels of schooling among the 92 students in Wilmar are high school (34 | 37.0%), elementary school (27 | 29.3%), and middle school (17 | 18.5%).
| School Level | # Students | % Students |
| Nursery / Preschool | 0 | 0.0% |
| Kindergarten | 0 | 0.0% |
| Elementary School | 27 | 29.3% |
| Middle School | 17 | 18.5% |
| High School | 34 | 37.0% |
| College / Undergraduate | 11 | 12.0% |
| Graduate / Professional | 3 | 3.3% |
| Total | 92 | 100.0% |
School Enrollment by Age by Funding Source in Wilmar
Out of a total of 92 students who are enrolled in schools in Wilmar, 10 (10.9%) attend a private institution, while the remaining 82 (89.1%) are enrolled in public schools. The age group of 25 to 34 year olds has the highest likelihood of being enrolled in private schools, with 3 (100.0% in the age bracket) enrolled. Conversely, the age group of 5 to 9 year old has the lowest likelihood of being enrolled in a private school, with 13 (100.0% in the age bracket) attending a public institution.
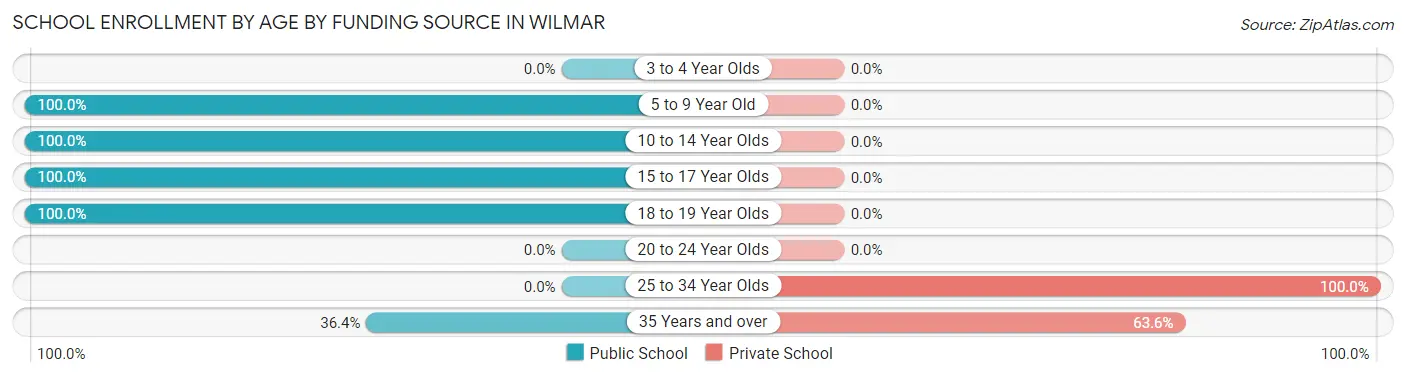
| Age Bracket | Public School | Private School |
| 3 to 4 Year Olds | 0 (0.0%) | 0 (0.0%) |
| 5 to 9 Year Old | 13 (100.0%) | 0 (0.0%) |
| 10 to 14 Year Olds | 35 (100.0%) | 0 (0.0%) |
| 15 to 17 Year Olds | 26 (100.0%) | 0 (0.0%) |
| 18 to 19 Year Olds | 4 (100.0%) | 0 (0.0%) |
| 20 to 24 Year Olds | 0 (0.0%) | 0 (0.0%) |
| 25 to 34 Year Olds | 0 (0.0%) | 3 (100.0%) |
| 35 Years and over | 4 (36.4%) | 7 (63.6%) |
| Total | 82 (89.1%) | 10 (10.9%) |
Educational Attainment by Field of Study in Wilmar
Education (18 | 31.6%), communications (15 | 26.3%), psychology (11 | 19.3%), business (11 | 19.3%), and social sciences (1 | 1.8%) are the most common fields of study among 57 individuals in Wilmar who have obtained a bachelor's degree or higher.
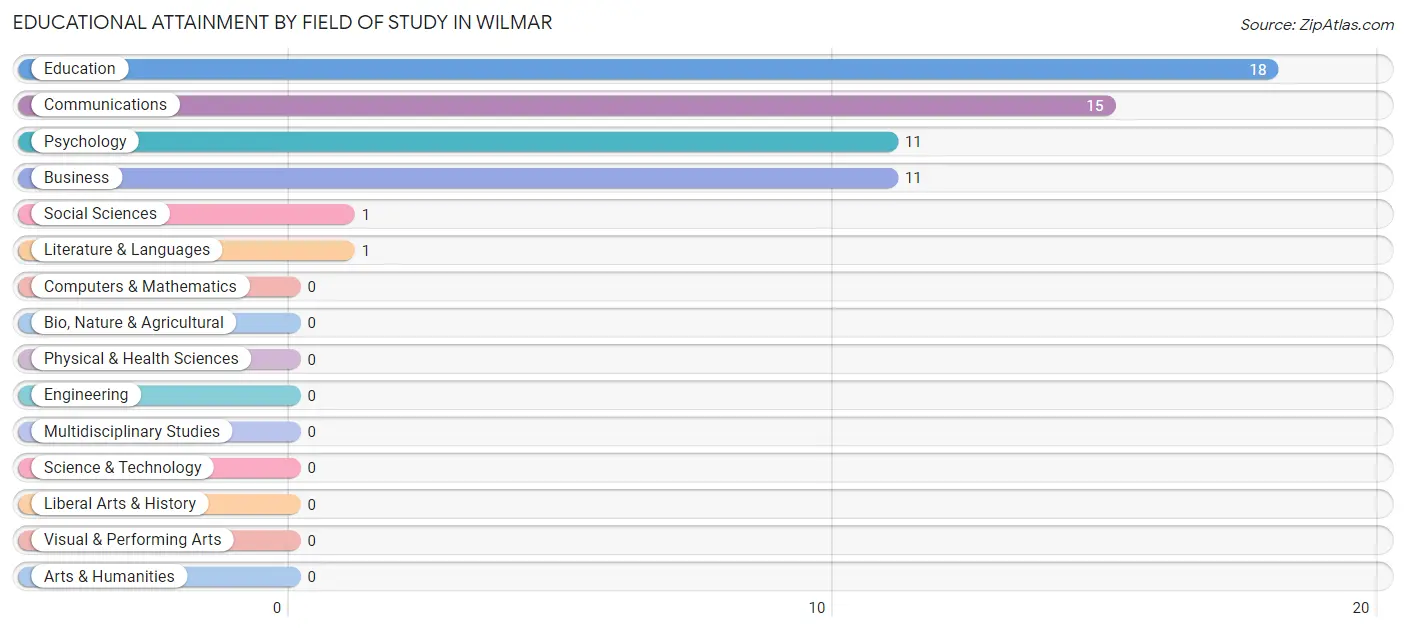
| Field of Study | # Graduates | % Graduates |
| Computers & Mathematics | 0 | 0.0% |
| Bio, Nature & Agricultural | 0 | 0.0% |
| Physical & Health Sciences | 0 | 0.0% |
| Psychology | 11 | 19.3% |
| Social Sciences | 1 | 1.8% |
| Engineering | 0 | 0.0% |
| Multidisciplinary Studies | 0 | 0.0% |
| Science & Technology | 0 | 0.0% |
| Business | 11 | 19.3% |
| Education | 18 | 31.6% |
| Literature & Languages | 1 | 1.8% |
| Liberal Arts & History | 0 | 0.0% |
| Visual & Performing Arts | 0 | 0.0% |
| Communications | 15 | 26.3% |
| Arts & Humanities | 0 | 0.0% |
| Total | 57 | 100.0% |
Transportation & Commute in Wilmar
Vehicle Availability by Sex in Wilmar
The most prevalent vehicle ownership categories in Wilmar are males with 2 vehicles (45, accounting for 75.0%) and females with 2 vehicles (35, making up 66.2%).
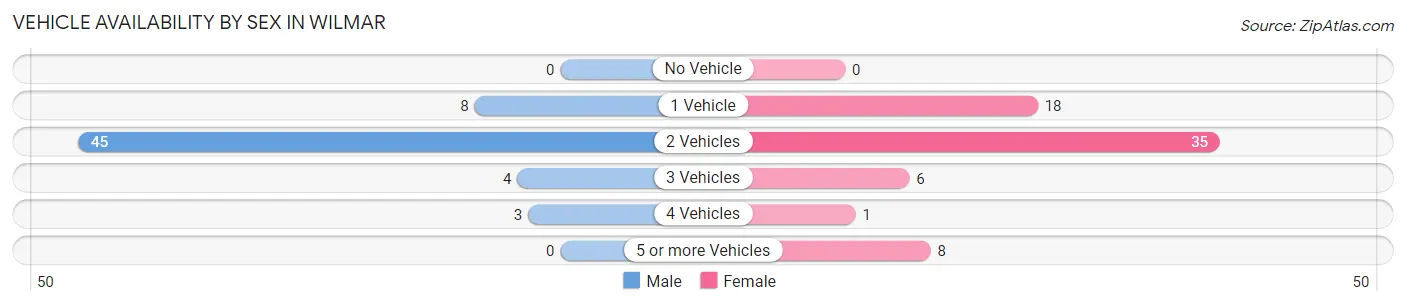
| Vehicles Available | Male | Female |
| No Vehicle | 0 (0.0%) | 0 (0.0%) |
| 1 Vehicle | 8 (13.3%) | 18 (26.5%) |
| 2 Vehicles | 45 (75.0%) | 35 (51.5%) |
| 3 Vehicles | 4 (6.7%) | 6 (8.8%) |
| 4 Vehicles | 3 (5.0%) | 1 (1.5%) |
| 5 or more Vehicles | 0 (0.0%) | 8 (11.8%) |
| Total | 60 (100.0%) | 68 (100.0%) |
Commute Time in Wilmar
The most frequently occuring commute durations in Wilmar are 15 to 19 minutes (75 commuters, 58.6%), 90 or more minutes (15 commuters, 11.7%), and 10 to 14 minutes (13 commuters, 10.2%).
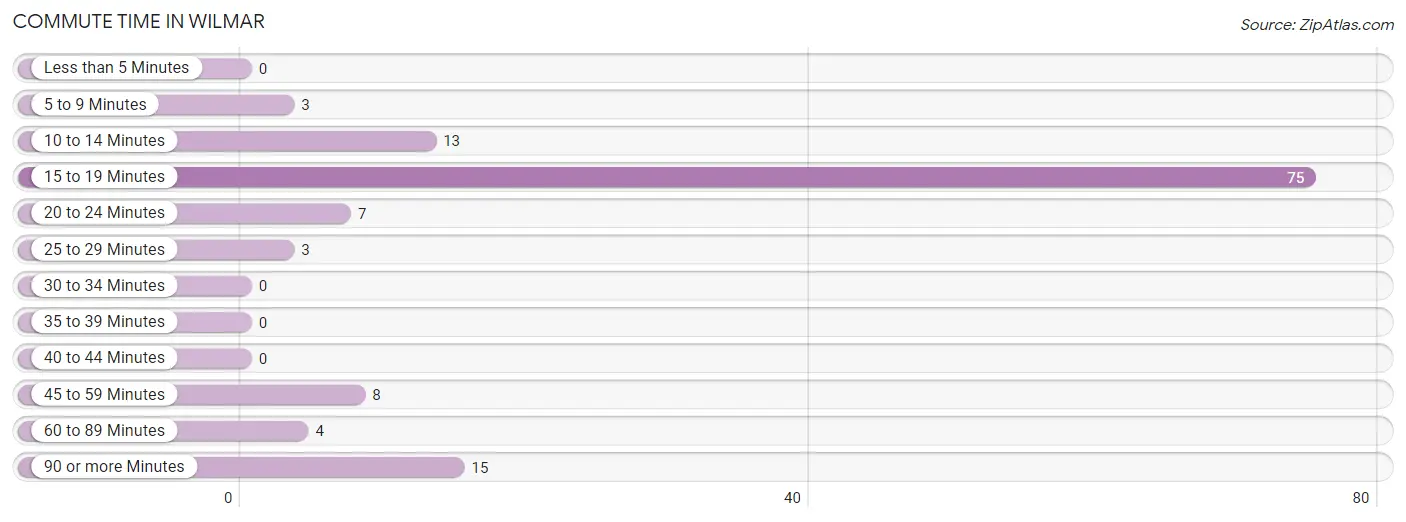
| Commute Time | # Commuters | % Commuters |
| Less than 5 Minutes | 0 | 0.0% |
| 5 to 9 Minutes | 3 | 2.3% |
| 10 to 14 Minutes | 13 | 10.2% |
| 15 to 19 Minutes | 75 | 58.6% |
| 20 to 24 Minutes | 7 | 5.5% |
| 25 to 29 Minutes | 3 | 2.3% |
| 30 to 34 Minutes | 0 | 0.0% |
| 35 to 39 Minutes | 0 | 0.0% |
| 40 to 44 Minutes | 0 | 0.0% |
| 45 to 59 Minutes | 8 | 6.2% |
| 60 to 89 Minutes | 4 | 3.1% |
| 90 or more Minutes | 15 | 11.7% |
Commute Time by Sex in Wilmar
The most common commute times in Wilmar are 15 to 19 minutes (24 commuters, 40.0%) for males and 15 to 19 minutes (51 commuters, 75.0%) for females.
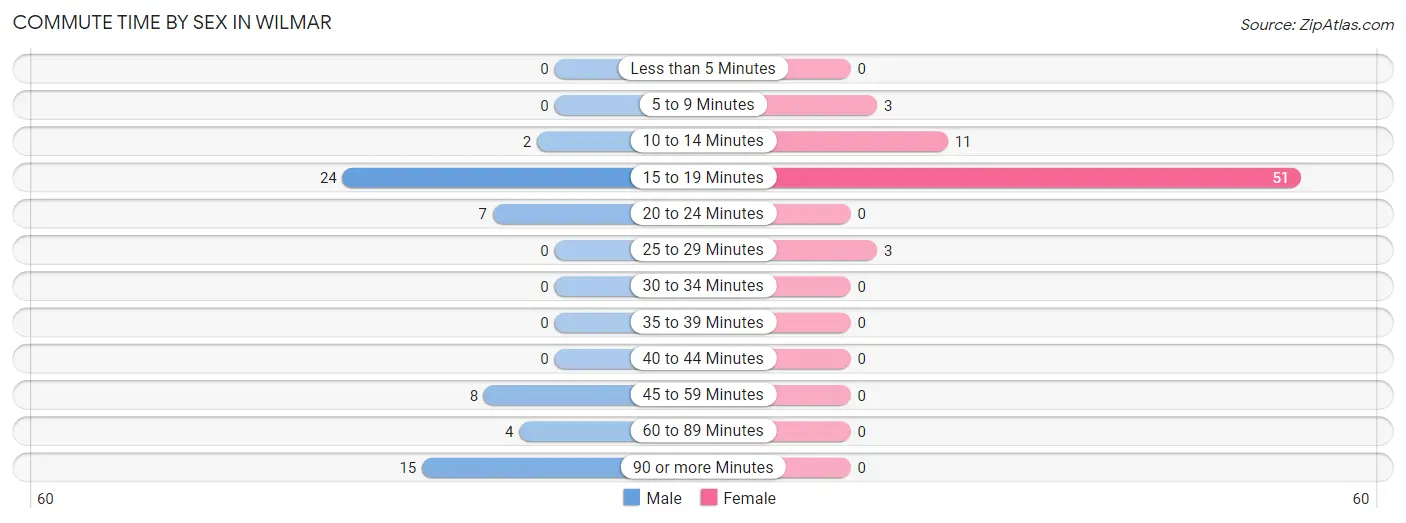
| Commute Time | Male | Female |
| Less than 5 Minutes | 0 (0.0%) | 0 (0.0%) |
| 5 to 9 Minutes | 0 (0.0%) | 3 (4.4%) |
| 10 to 14 Minutes | 2 (3.3%) | 11 (16.2%) |
| 15 to 19 Minutes | 24 (40.0%) | 51 (75.0%) |
| 20 to 24 Minutes | 7 (11.7%) | 0 (0.0%) |
| 25 to 29 Minutes | 0 (0.0%) | 3 (4.4%) |
| 30 to 34 Minutes | 0 (0.0%) | 0 (0.0%) |
| 35 to 39 Minutes | 0 (0.0%) | 0 (0.0%) |
| 40 to 44 Minutes | 0 (0.0%) | 0 (0.0%) |
| 45 to 59 Minutes | 8 (13.3%) | 0 (0.0%) |
| 60 to 89 Minutes | 4 (6.7%) | 0 (0.0%) |
| 90 or more Minutes | 15 (25.0%) | 0 (0.0%) |
Time of Departure to Work by Sex in Wilmar
The most frequent times of departure to work in Wilmar are 6:30 AM to 6:59 AM (25, 41.7%) for males and 7:00 AM to 7:29 AM (23, 33.8%) for females.
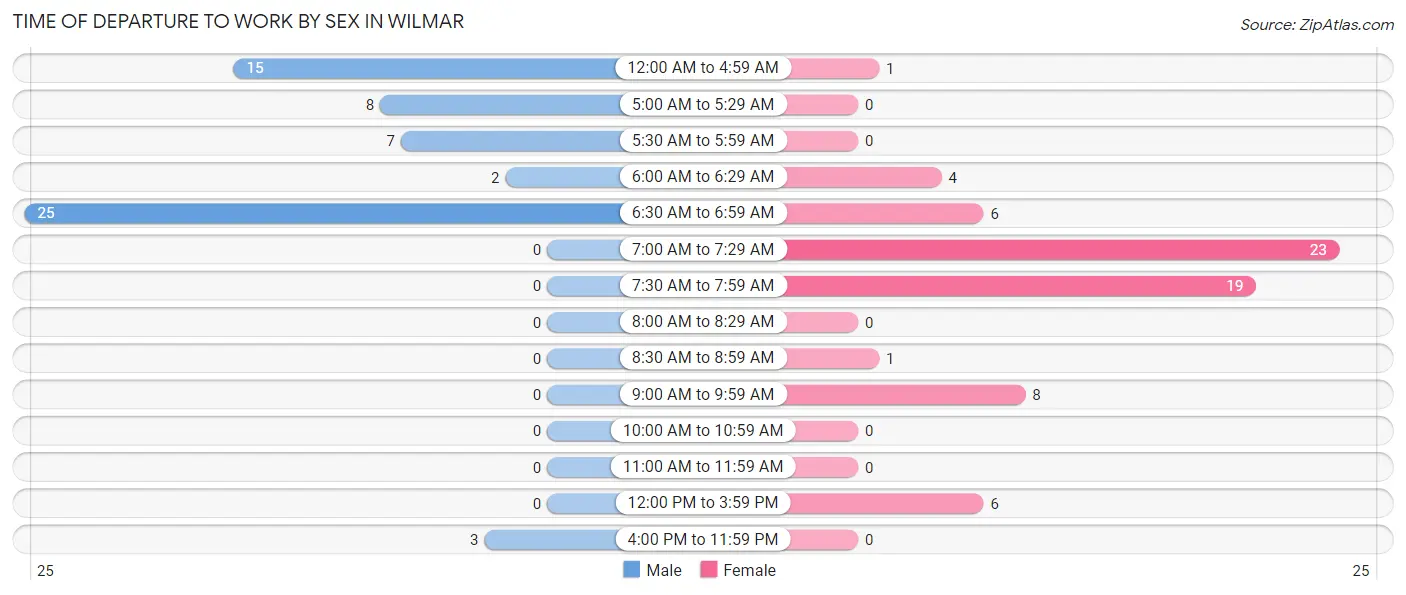
| Time of Departure | Male | Female |
| 12:00 AM to 4:59 AM | 15 (25.0%) | 1 (1.5%) |
| 5:00 AM to 5:29 AM | 8 (13.3%) | 0 (0.0%) |
| 5:30 AM to 5:59 AM | 7 (11.7%) | 0 (0.0%) |
| 6:00 AM to 6:29 AM | 2 (3.3%) | 4 (5.9%) |
| 6:30 AM to 6:59 AM | 25 (41.7%) | 6 (8.8%) |
| 7:00 AM to 7:29 AM | 0 (0.0%) | 23 (33.8%) |
| 7:30 AM to 7:59 AM | 0 (0.0%) | 19 (27.9%) |
| 8:00 AM to 8:29 AM | 0 (0.0%) | 0 (0.0%) |
| 8:30 AM to 8:59 AM | 0 (0.0%) | 1 (1.5%) |
| 9:00 AM to 9:59 AM | 0 (0.0%) | 8 (11.8%) |
| 10:00 AM to 10:59 AM | 0 (0.0%) | 0 (0.0%) |
| 11:00 AM to 11:59 AM | 0 (0.0%) | 0 (0.0%) |
| 12:00 PM to 3:59 PM | 0 (0.0%) | 6 (8.8%) |
| 4:00 PM to 11:59 PM | 3 (5.0%) | 0 (0.0%) |
| Total | 60 (100.0%) | 68 (100.0%) |
Housing Occupancy in Wilmar
Occupancy by Ownership in Wilmar
Of the total 195 dwellings in Wilmar, owner-occupied units account for 160 (82.1%), while renter-occupied units make up 35 (17.9%).
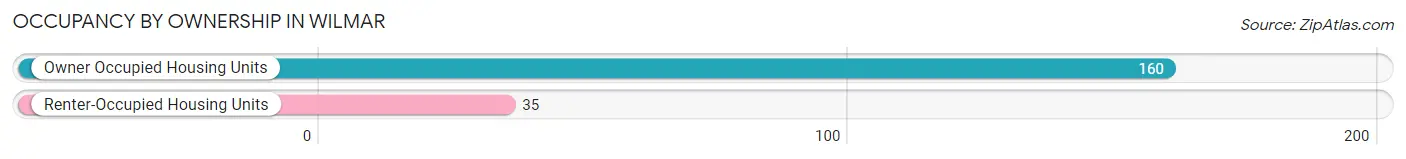
| Occupancy | # Housing Units | % Housing Units |
| Owner Occupied Housing Units | 160 | 82.1% |
| Renter-Occupied Housing Units | 35 | 17.9% |
| Total Occupied Housing Units | 195 | 100.0% |
Occupancy by Household Size in Wilmar
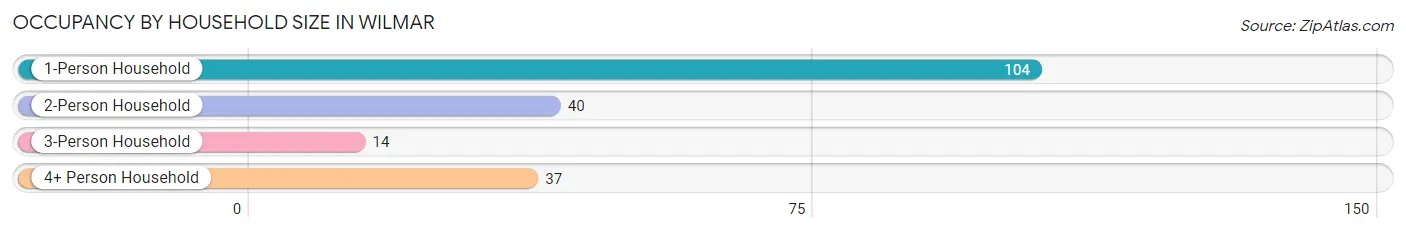
| Household Size | # Housing Units | % Housing Units |
| 1-Person Household | 104 | 53.3% |
| 2-Person Household | 40 | 20.5% |
| 3-Person Household | 14 | 7.2% |
| 4+ Person Household | 37 | 19.0% |
| Total Housing Units | 195 | 100.0% |
Occupancy by Ownership by Household Size in Wilmar
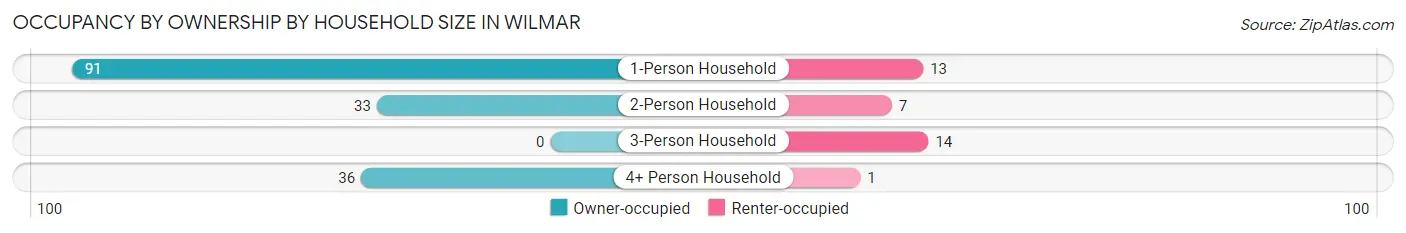
| Household Size | Owner-occupied | Renter-occupied |
| 1-Person Household | 91 (87.5%) | 13 (12.5%) |
| 2-Person Household | 33 (82.5%) | 7 (17.5%) |
| 3-Person Household | 0 (0.0%) | 14 (100.0%) |
| 4+ Person Household | 36 (97.3%) | 1 (2.7%) |
| Total Housing Units | 160 (82.1%) | 35 (17.9%) |
Occupancy by Educational Attainment in Wilmar
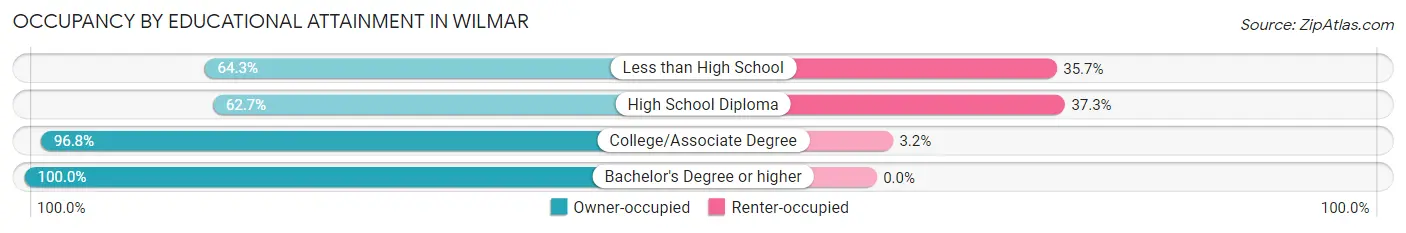
| Household Size | Owner-occupied | Renter-occupied |
| Less than High School | 9 (64.3%) | 5 (35.7%) |
| High School Diploma | 47 (62.7%) | 28 (37.3%) |
| College/Associate Degree | 60 (96.8%) | 2 (3.2%) |
| Bachelor's Degree or higher | 44 (100.0%) | 0 (0.0%) |
Occupancy by Age of Householder in Wilmar
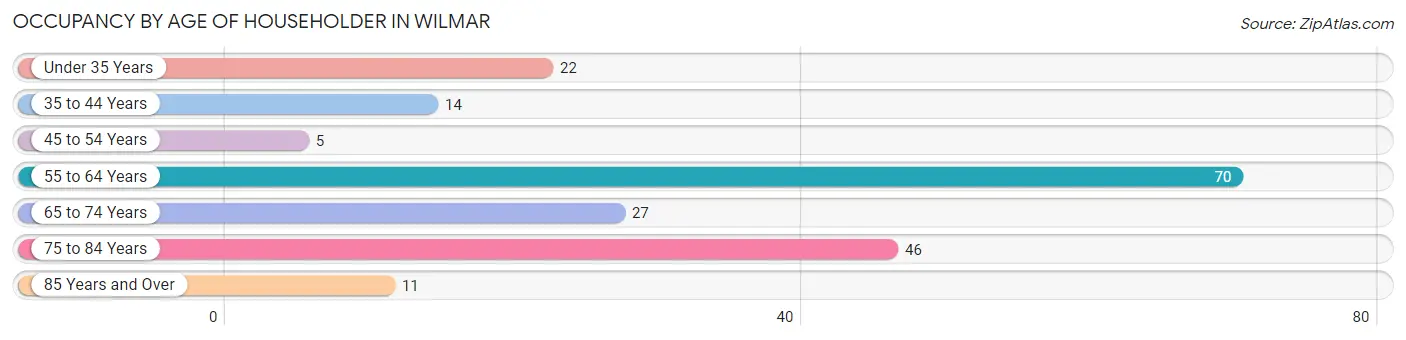
| Age Bracket | # Households | % Households |
| Under 35 Years | 22 | 11.3% |
| 35 to 44 Years | 14 | 7.2% |
| 45 to 54 Years | 5 | 2.6% |
| 55 to 64 Years | 70 | 35.9% |
| 65 to 74 Years | 27 | 13.9% |
| 75 to 84 Years | 46 | 23.6% |
| 85 Years and Over | 11 | 5.6% |
| Total | 195 | 100.0% |
Housing Finances in Wilmar
Median Income by Occupancy in Wilmar
| Occupancy Type | # Households | Median Income |
| Owner-Occupied | 160 (82.1%) | $0 |
| Renter-Occupied | 35 (17.9%) | $0 |
| Average | 195 (100.0%) | $0 |
Occupancy by Householder Income Bracket in Wilmar
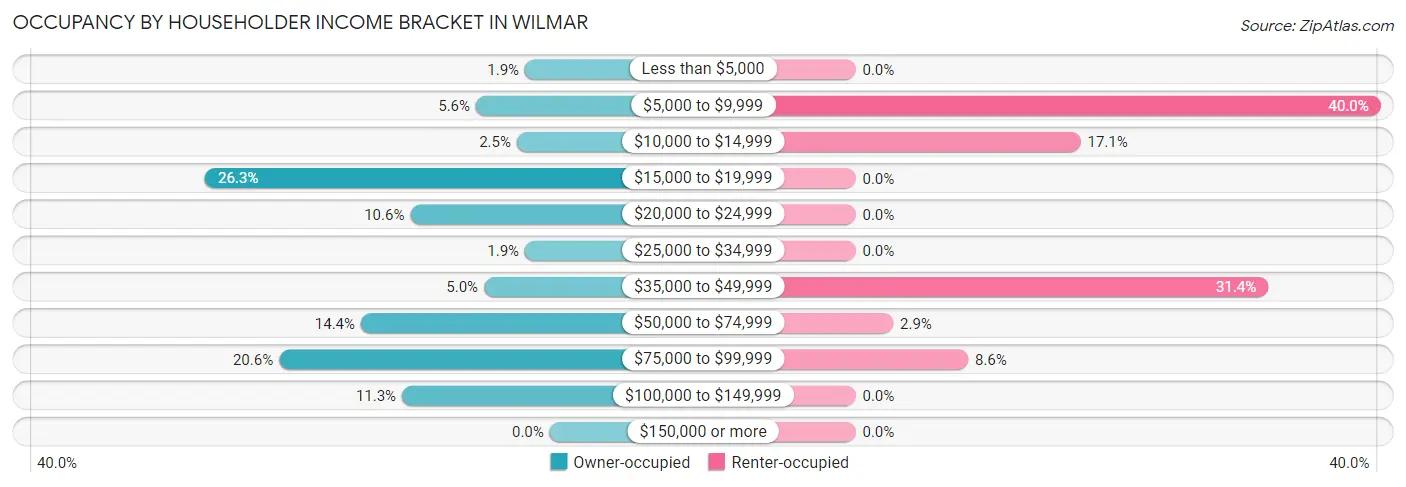
| Income Bracket | Owner-occupied | Renter-occupied |
| Less than $5,000 | 3 (1.9%) | 0 (0.0%) |
| $5,000 to $9,999 | 9 (5.6%) | 14 (40.0%) |
| $10,000 to $14,999 | 4 (2.5%) | 6 (17.1%) |
| $15,000 to $19,999 | 42 (26.3%) | 0 (0.0%) |
| $20,000 to $24,999 | 17 (10.6%) | 0 (0.0%) |
| $25,000 to $34,999 | 3 (1.9%) | 0 (0.0%) |
| $35,000 to $49,999 | 8 (5.0%) | 11 (31.4%) |
| $50,000 to $74,999 | 23 (14.4%) | 1 (2.9%) |
| $75,000 to $99,999 | 33 (20.6%) | 3 (8.6%) |
| $100,000 to $149,999 | 18 (11.3%) | 0 (0.0%) |
| $150,000 or more | 0 (0.0%) | 0 (0.0%) |
| Total | 160 (100.0%) | 35 (100.0%) |
Monthly Housing Cost Tiers in Wilmar
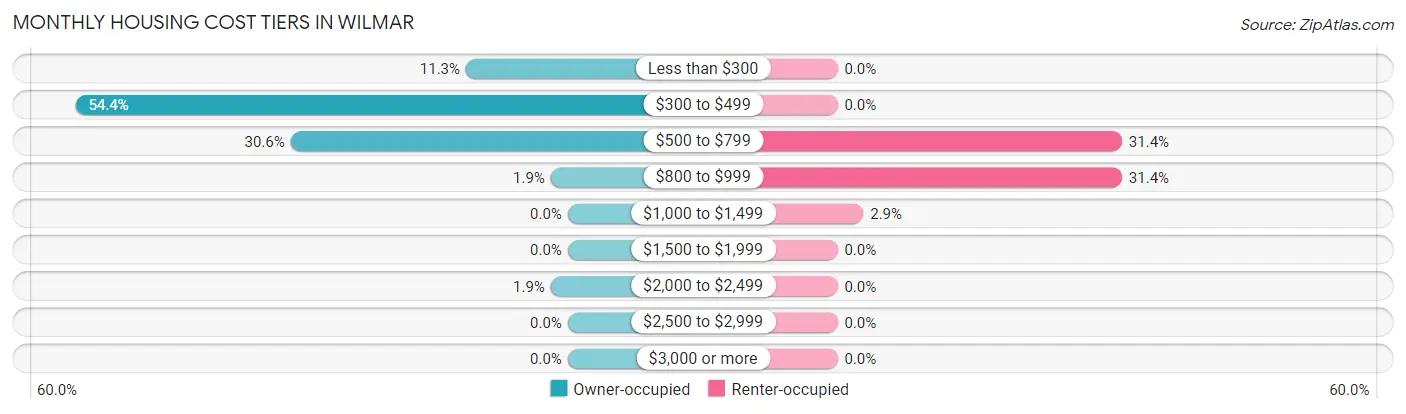
| Monthly Cost | Owner-occupied | Renter-occupied |
| Less than $300 | 18 (11.3%) | 0 (0.0%) |
| $300 to $499 | 87 (54.4%) | 0 (0.0%) |
| $500 to $799 | 49 (30.6%) | 11 (31.4%) |
| $800 to $999 | 3 (1.9%) | 11 (31.4%) |
| $1,000 to $1,499 | 0 (0.0%) | 1 (2.9%) |
| $1,500 to $1,999 | 0 (0.0%) | 0 (0.0%) |
| $2,000 to $2,499 | 3 (1.9%) | 0 (0.0%) |
| $2,500 to $2,999 | 0 (0.0%) | 0 (0.0%) |
| $3,000 or more | 0 (0.0%) | 0 (0.0%) |
| Total | 160 (100.0%) | 35 (100.0%) |
Physical Housing Characteristics in Wilmar
Housing Structures in Wilmar
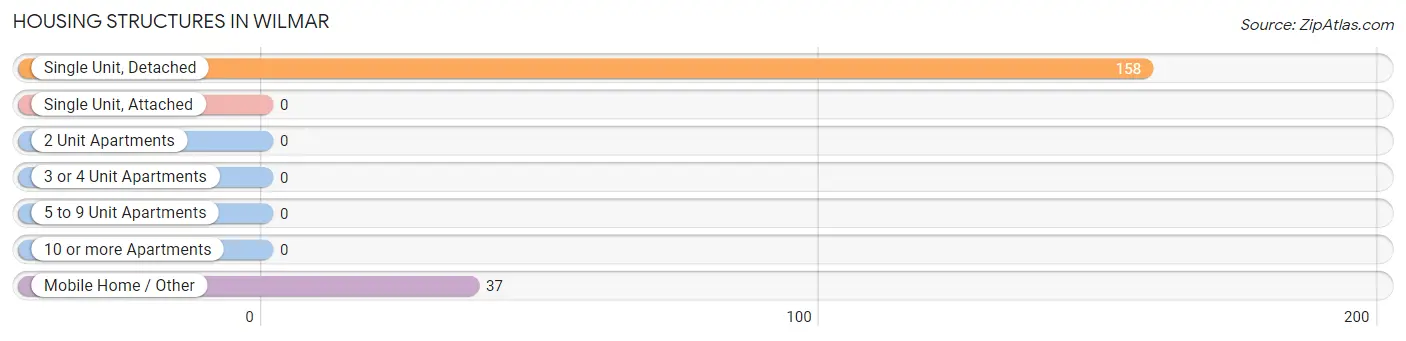
| Structure Type | # Housing Units | % Housing Units |
| Single Unit, Detached | 158 | 81.0% |
| Single Unit, Attached | 0 | 0.0% |
| 2 Unit Apartments | 0 | 0.0% |
| 3 or 4 Unit Apartments | 0 | 0.0% |
| 5 to 9 Unit Apartments | 0 | 0.0% |
| 10 or more Apartments | 0 | 0.0% |
| Mobile Home / Other | 37 | 19.0% |
| Total | 195 | 100.0% |
Housing Structures by Occupancy in Wilmar
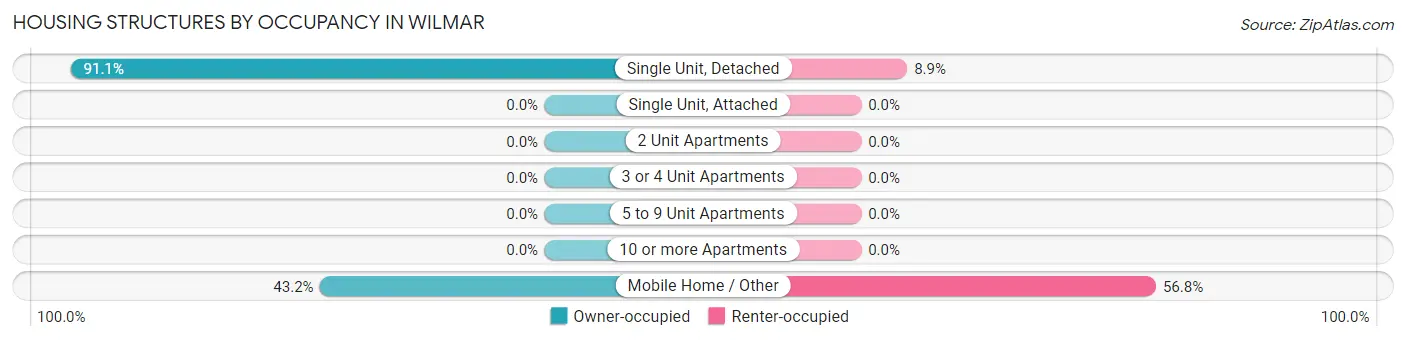
| Structure Type | Owner-occupied | Renter-occupied |
| Single Unit, Detached | 144 (91.1%) | 14 (8.9%) |
| Single Unit, Attached | 0 (0.0%) | 0 (0.0%) |
| 2 Unit Apartments | 0 (0.0%) | 0 (0.0%) |
| 3 or 4 Unit Apartments | 0 (0.0%) | 0 (0.0%) |
| 5 to 9 Unit Apartments | 0 (0.0%) | 0 (0.0%) |
| 10 or more Apartments | 0 (0.0%) | 0 (0.0%) |
| Mobile Home / Other | 16 (43.2%) | 21 (56.8%) |
| Total | 160 (82.1%) | 35 (17.9%) |
Housing Structures by Number of Rooms in Wilmar
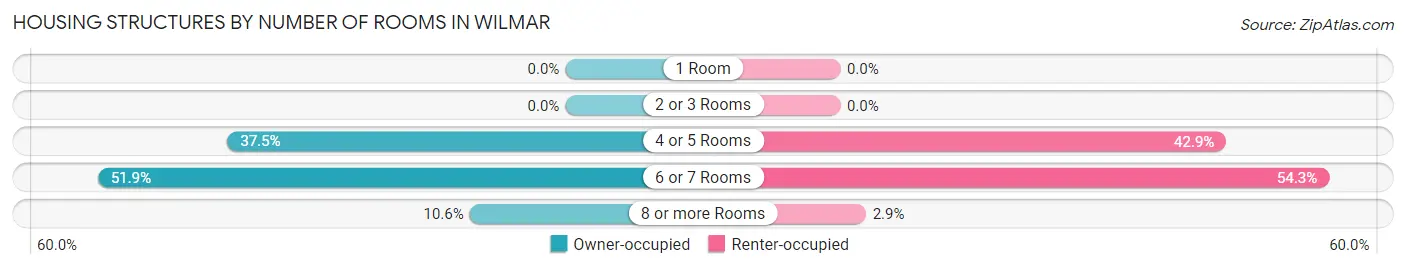
| Number of Rooms | Owner-occupied | Renter-occupied |
| 1 Room | 0 (0.0%) | 0 (0.0%) |
| 2 or 3 Rooms | 0 (0.0%) | 0 (0.0%) |
| 4 or 5 Rooms | 60 (37.5%) | 15 (42.9%) |
| 6 or 7 Rooms | 83 (51.9%) | 19 (54.3%) |
| 8 or more Rooms | 17 (10.6%) | 1 (2.9%) |
| Total | 160 (100.0%) | 35 (100.0%) |
Housing Structure by Heating Type in Wilmar
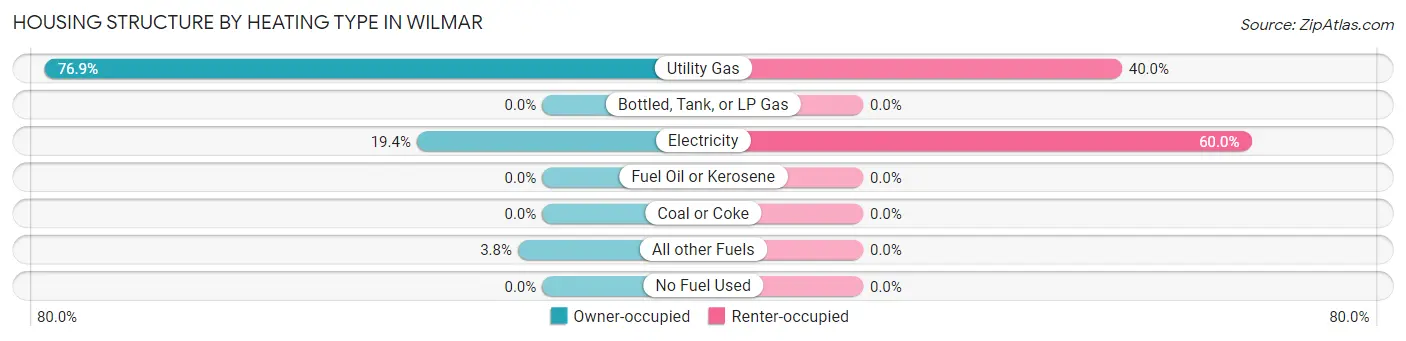
| Heating Type | Owner-occupied | Renter-occupied |
| Utility Gas | 123 (76.9%) | 14 (40.0%) |
| Bottled, Tank, or LP Gas | 0 (0.0%) | 0 (0.0%) |
| Electricity | 31 (19.4%) | 21 (60.0%) |
| Fuel Oil or Kerosene | 0 (0.0%) | 0 (0.0%) |
| Coal or Coke | 0 (0.0%) | 0 (0.0%) |
| All other Fuels | 6 (3.7%) | 0 (0.0%) |
| No Fuel Used | 0 (0.0%) | 0 (0.0%) |
| Total | 160 (100.0%) | 35 (100.0%) |
Household Vehicle Usage in Wilmar
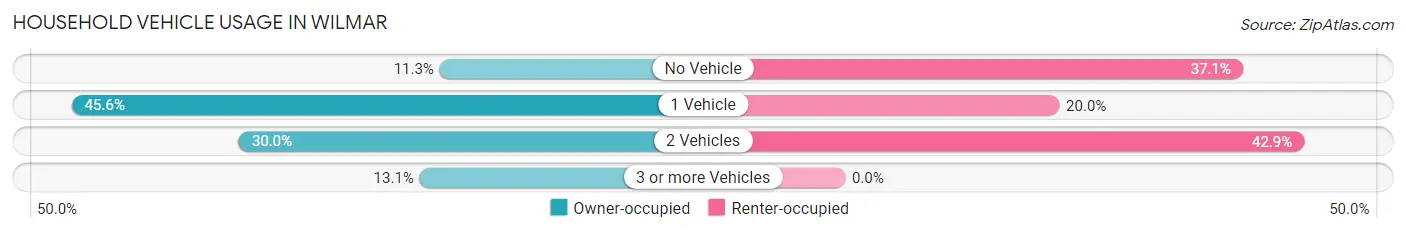
| Vehicles per Household | Owner-occupied | Renter-occupied |
| No Vehicle | 18 (11.3%) | 13 (37.1%) |
| 1 Vehicle | 73 (45.6%) | 7 (20.0%) |
| 2 Vehicles | 48 (30.0%) | 15 (42.9%) |
| 3 or more Vehicles | 21 (13.1%) | 0 (0.0%) |
| Total | 160 (100.0%) | 35 (100.0%) |
Real Estate & Mortgages in Wilmar
Real Estate and Mortgage Overview in Wilmar
| Characteristic | Without Mortgage | With Mortgage |
| Housing Units | 152 | 8 |
| Median Property Value | $93,300 | $0 |
| Median Household Income | - | - |
| Monthly Housing Costs | $433 | $0 |
| Real Estate Taxes | $455 | $2 |
Property Value by Mortgage Status in Wilmar
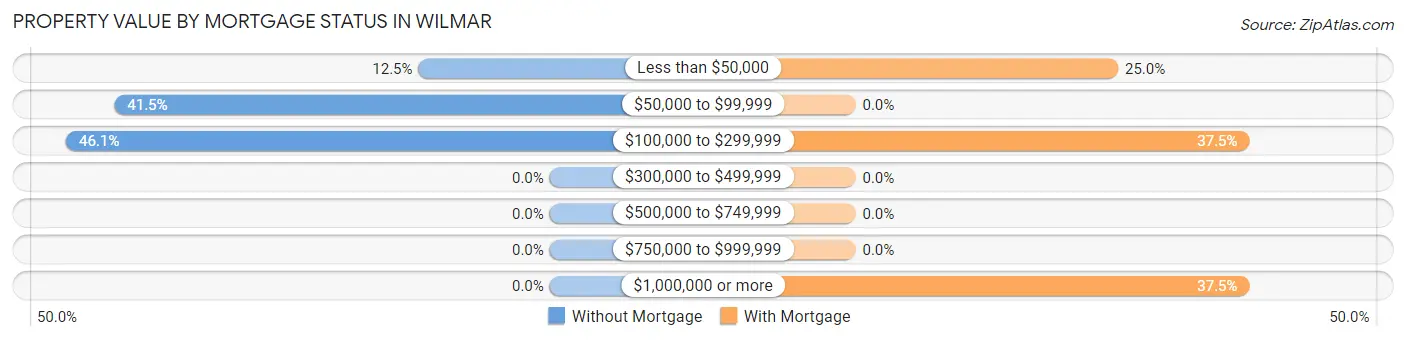
| Property Value | Without Mortgage | With Mortgage |
| Less than $50,000 | 19 (12.5%) | 2 (25.0%) |
| $50,000 to $99,999 | 63 (41.4%) | 0 (0.0%) |
| $100,000 to $299,999 | 70 (46.1%) | 3 (37.5%) |
| $300,000 to $499,999 | 0 (0.0%) | 0 (0.0%) |
| $500,000 to $749,999 | 0 (0.0%) | 0 (0.0%) |
| $750,000 to $999,999 | 0 (0.0%) | 0 (0.0%) |
| $1,000,000 or more | 0 (0.0%) | 3 (37.5%) |
| Total | 152 (100.0%) | 8 (100.0%) |
Household Income by Mortgage Status in Wilmar
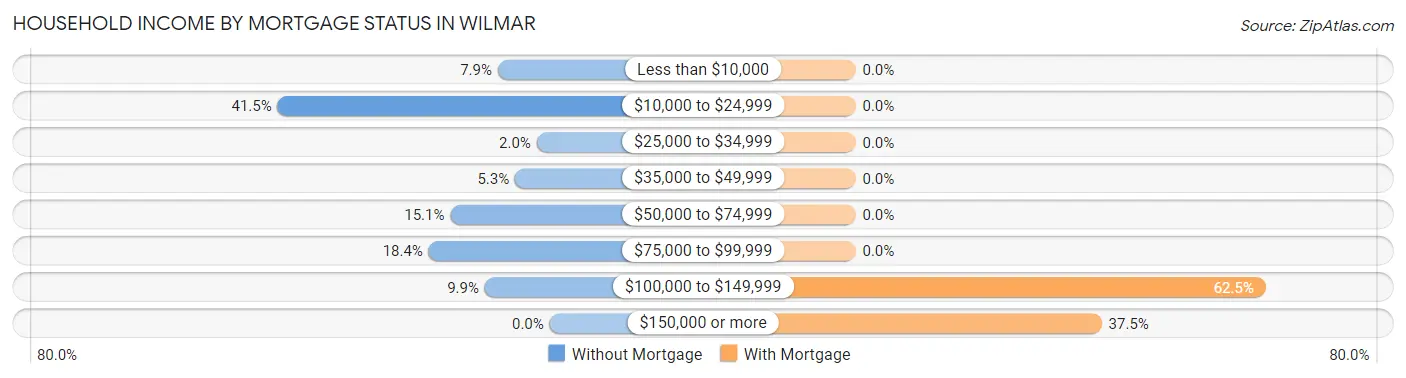
| Household Income | Without Mortgage | With Mortgage |
| Less than $10,000 | 12 (7.9%) | 0 (0.0%) |
| $10,000 to $24,999 | 63 (41.4%) | 0 (0.0%) |
| $25,000 to $34,999 | 3 (2.0%) | 0 (0.0%) |
| $35,000 to $49,999 | 8 (5.3%) | 0 (0.0%) |
| $50,000 to $74,999 | 23 (15.1%) | 0 (0.0%) |
| $75,000 to $99,999 | 28 (18.4%) | 0 (0.0%) |
| $100,000 to $149,999 | 15 (9.9%) | 5 (62.5%) |
| $150,000 or more | 0 (0.0%) | 3 (37.5%) |
| Total | 152 (100.0%) | 8 (100.0%) |
Property Value to Household Income Ratio in Wilmar
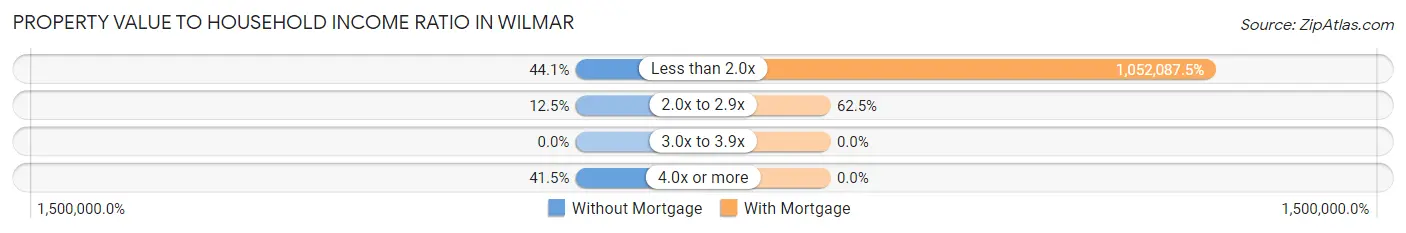
| Value-to-Income Ratio | Without Mortgage | With Mortgage |
| Less than 2.0x | 67 (44.1%) | 84,167 (1,052,087.5%) |
| 2.0x to 2.9x | 19 (12.5%) | 5 (62.5%) |
| 3.0x to 3.9x | 0 (0.0%) | 0 (0.0%) |
| 4.0x or more | 63 (41.4%) | 0 (0.0%) |
| Total | 152 (100.0%) | 8 (100.0%) |
Real Estate Taxes by Mortgage Status in Wilmar
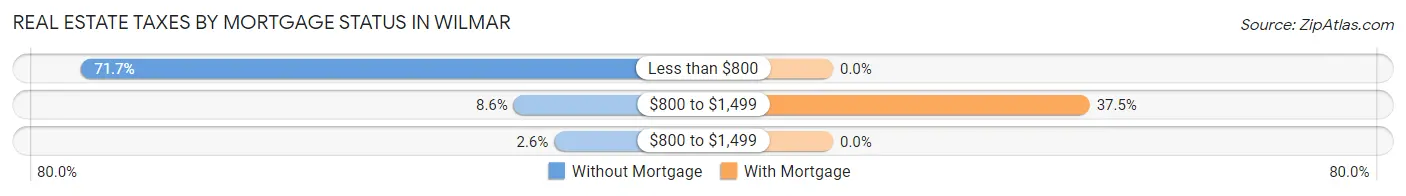
| Property Taxes | Without Mortgage | With Mortgage |
| Less than $800 | 109 (71.7%) | 0 (0.0%) |
| $800 to $1,499 | 13 (8.6%) | 3 (37.5%) |
| $800 to $1,499 | 4 (2.6%) | 0 (0.0%) |
| Total | 152 (100.0%) | 8 (100.0%) |
Health & Disability in Wilmar
Health Insurance Coverage by Age in Wilmar
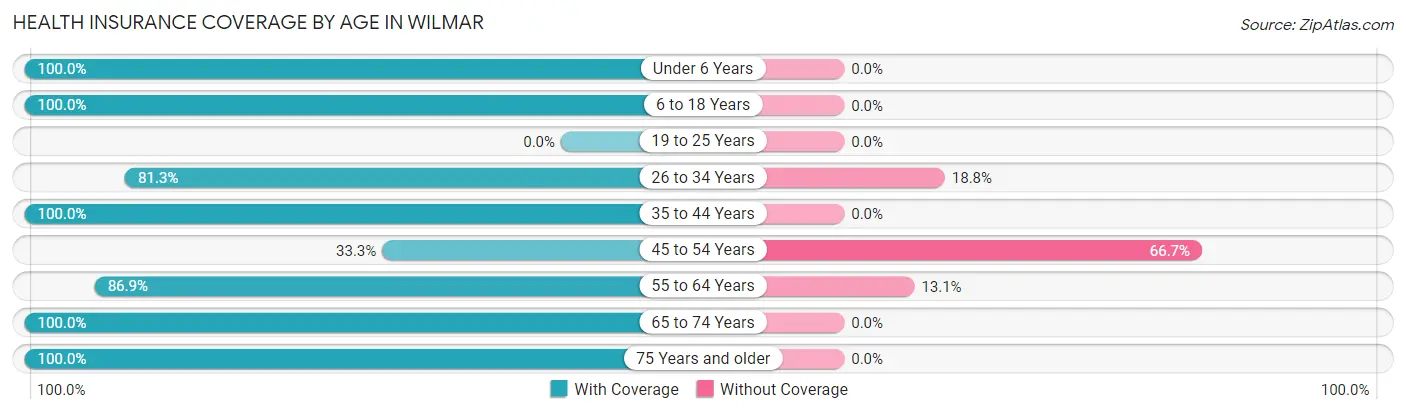
| Age Bracket | With Coverage | Without Coverage |
| Under 6 Years | 19 (100.0%) | 0 (0.0%) |
| 6 to 18 Years | 78 (100.0%) | 0 (0.0%) |
| 19 to 25 Years | 0 (0.0%) | 0 (0.0%) |
| 26 to 34 Years | 26 (81.2%) | 6 (18.8%) |
| 35 to 44 Years | 27 (100.0%) | 0 (0.0%) |
| 45 to 54 Years | 3 (33.3%) | 6 (66.7%) |
| 55 to 64 Years | 93 (86.9%) | 14 (13.1%) |
| 65 to 74 Years | 54 (100.0%) | 0 (0.0%) |
| 75 Years and older | 58 (100.0%) | 0 (0.0%) |
| Total | 358 (93.2%) | 26 (6.8%) |
Health Insurance Coverage by Citizenship Status in Wilmar
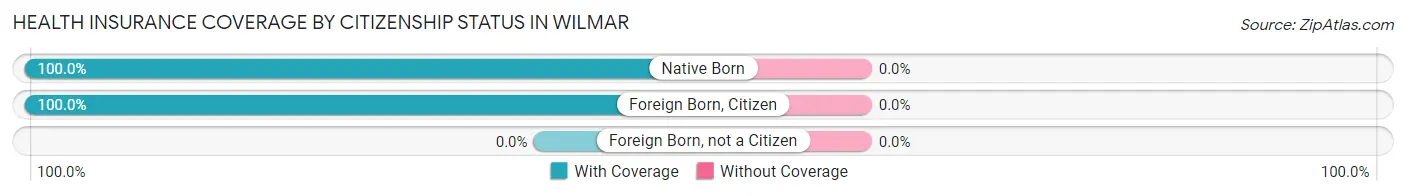
| Citizenship Status | With Coverage | Without Coverage |
| Native Born | 19 (100.0%) | 0 (0.0%) |
| Foreign Born, Citizen | 78 (100.0%) | 0 (0.0%) |
| Foreign Born, not a Citizen | 0 (0.0%) | 0 (0.0%) |
Health Insurance Coverage by Household Income in Wilmar
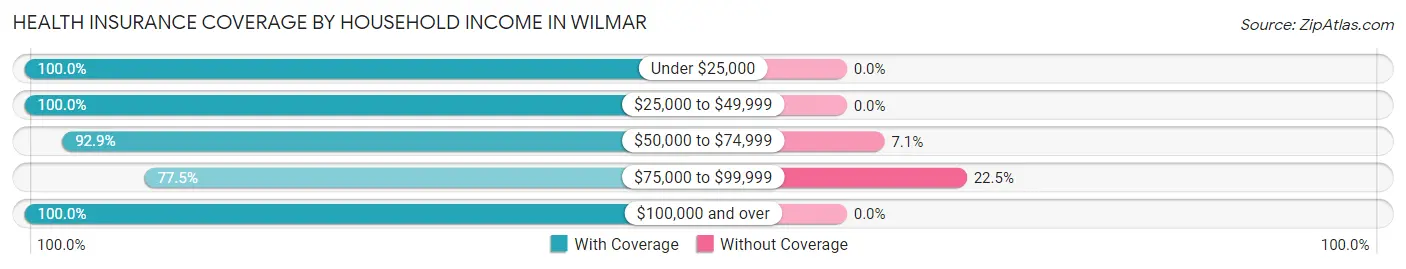
| Household Income | With Coverage | Without Coverage |
| Under $25,000 | 99 (100.0%) | 0 (0.0%) |
| $25,000 to $49,999 | 53 (100.0%) | 0 (0.0%) |
| $50,000 to $74,999 | 79 (92.9%) | 6 (7.1%) |
| $75,000 to $99,999 | 69 (77.5%) | 20 (22.5%) |
| $100,000 and over | 58 (100.0%) | 0 (0.0%) |
Public vs Private Health Insurance Coverage by Age in Wilmar
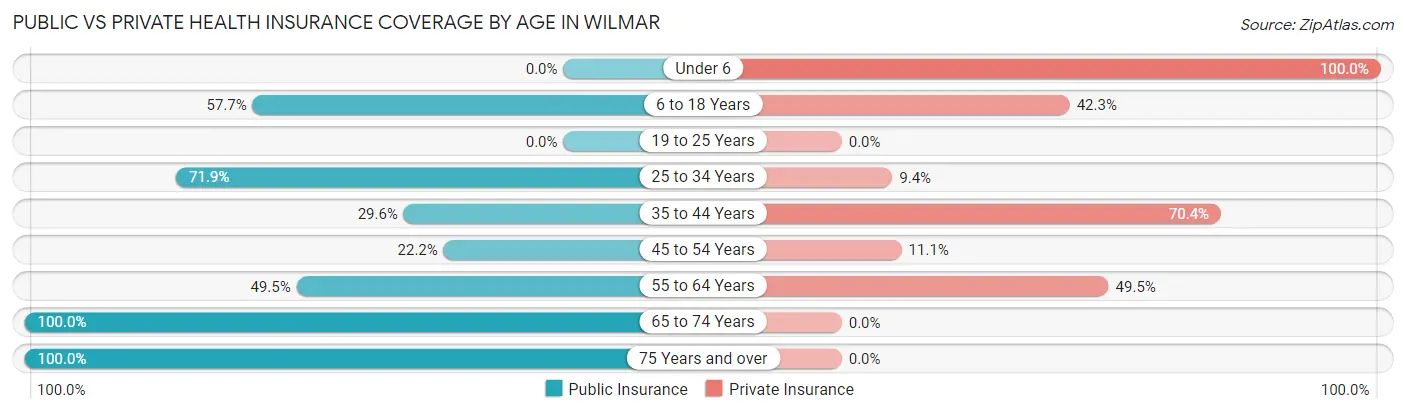
| Age Bracket | Public Insurance | Private Insurance |
| Under 6 | 0 (0.0%) | 19 (100.0%) |
| 6 to 18 Years | 45 (57.7%) | 33 (42.3%) |
| 19 to 25 Years | 0 (0.0%) | 0 (0.0%) |
| 25 to 34 Years | 23 (71.9%) | 3 (9.4%) |
| 35 to 44 Years | 8 (29.6%) | 19 (70.4%) |
| 45 to 54 Years | 2 (22.2%) | 1 (11.1%) |
| 55 to 64 Years | 53 (49.5%) | 53 (49.5%) |
| 65 to 74 Years | 54 (100.0%) | 0 (0.0%) |
| 75 Years and over | 58 (100.0%) | 0 (0.0%) |
| Total | 243 (63.3%) | 128 (33.3%) |
Disability Status by Sex by Age in Wilmar
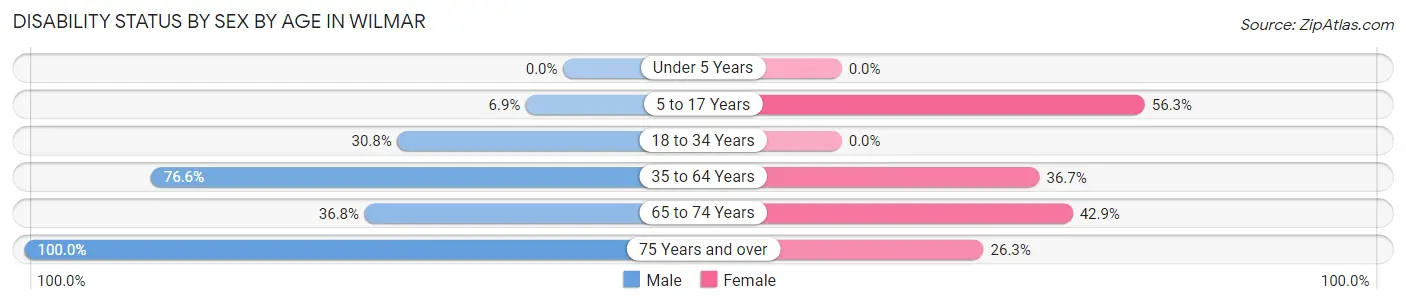
| Age Bracket | Male | Female |
| Under 5 Years | 0 (0.0%) | 0 (0.0%) |
| 5 to 17 Years | 4 (6.9%) | 9 (56.2%) |
| 18 to 34 Years | 4 (30.8%) | 0 (0.0%) |
| 35 to 64 Years | 49 (76.6%) | 29 (36.7%) |
| 65 to 74 Years | 7 (36.8%) | 15 (42.9%) |
| 75 Years and over | 1 (100.0%) | 15 (26.3%) |
Disability Class by Sex by Age in Wilmar
Disability Class: Hearing Difficulty
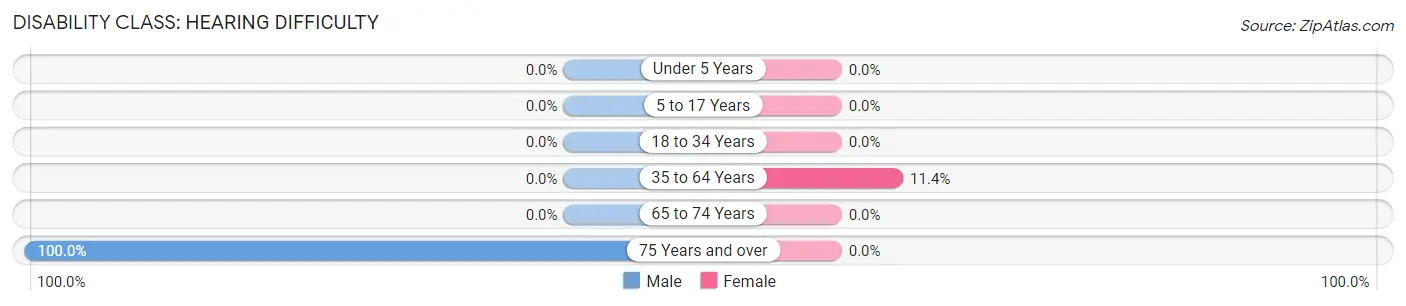
| Age Bracket | Male | Female |
| Under 5 Years | 0 (0.0%) | 0 (0.0%) |
| 5 to 17 Years | 0 (0.0%) | 0 (0.0%) |
| 18 to 34 Years | 0 (0.0%) | 0 (0.0%) |
| 35 to 64 Years | 0 (0.0%) | 9 (11.4%) |
| 65 to 74 Years | 0 (0.0%) | 0 (0.0%) |
| 75 Years and over | 1 (100.0%) | 0 (0.0%) |
Disability Class: Vision Difficulty
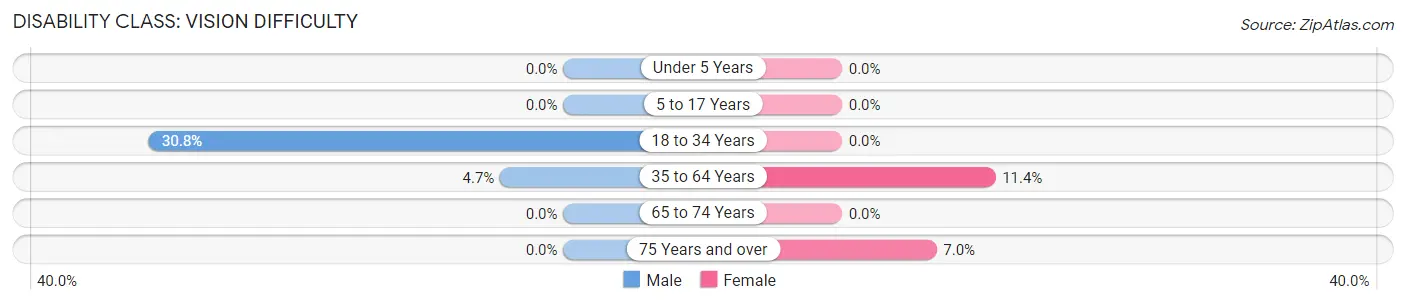
| Age Bracket | Male | Female |
| Under 5 Years | 0 (0.0%) | 0 (0.0%) |
| 5 to 17 Years | 0 (0.0%) | 0 (0.0%) |
| 18 to 34 Years | 4 (30.8%) | 0 (0.0%) |
| 35 to 64 Years | 3 (4.7%) | 9 (11.4%) |
| 65 to 74 Years | 0 (0.0%) | 0 (0.0%) |
| 75 Years and over | 0 (0.0%) | 4 (7.0%) |
Disability Class: Cognitive Difficulty
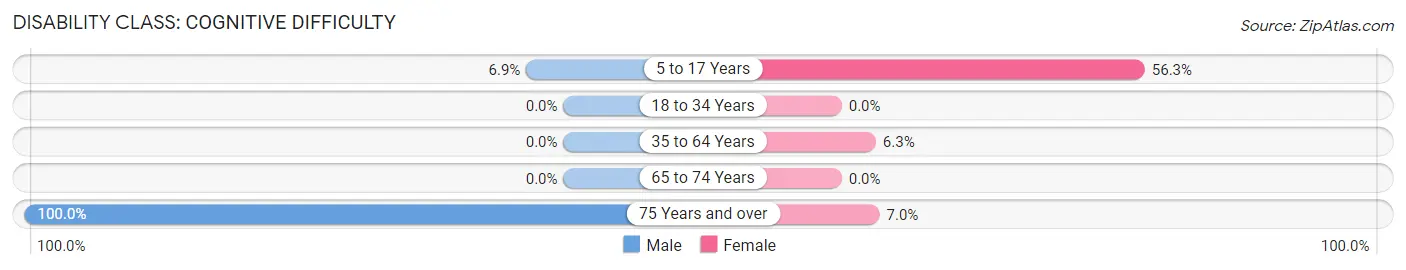
| Age Bracket | Male | Female |
| 5 to 17 Years | 4 (6.9%) | 9 (56.2%) |
| 18 to 34 Years | 0 (0.0%) | 0 (0.0%) |
| 35 to 64 Years | 0 (0.0%) | 5 (6.3%) |
| 65 to 74 Years | 0 (0.0%) | 0 (0.0%) |
| 75 Years and over | 1 (100.0%) | 4 (7.0%) |
Disability Class: Ambulatory Difficulty
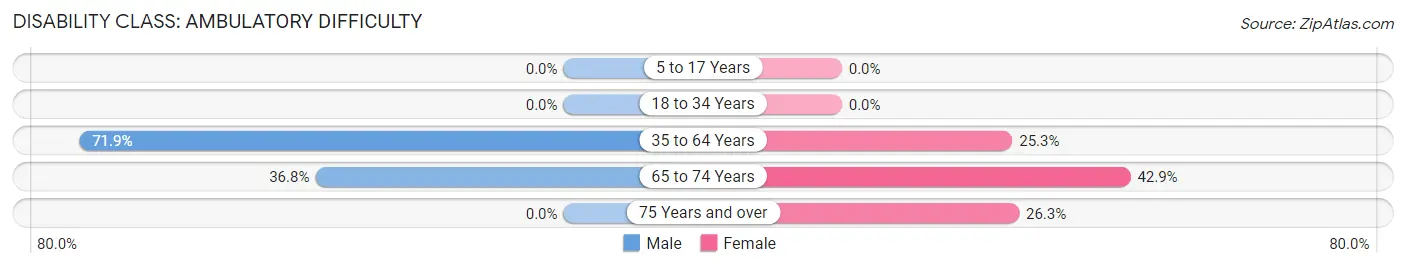
| Age Bracket | Male | Female |
| 5 to 17 Years | 0 (0.0%) | 0 (0.0%) |
| 18 to 34 Years | 0 (0.0%) | 0 (0.0%) |
| 35 to 64 Years | 46 (71.9%) | 20 (25.3%) |
| 65 to 74 Years | 7 (36.8%) | 15 (42.9%) |
| 75 Years and over | 0 (0.0%) | 15 (26.3%) |
Disability Class: Self-Care Difficulty
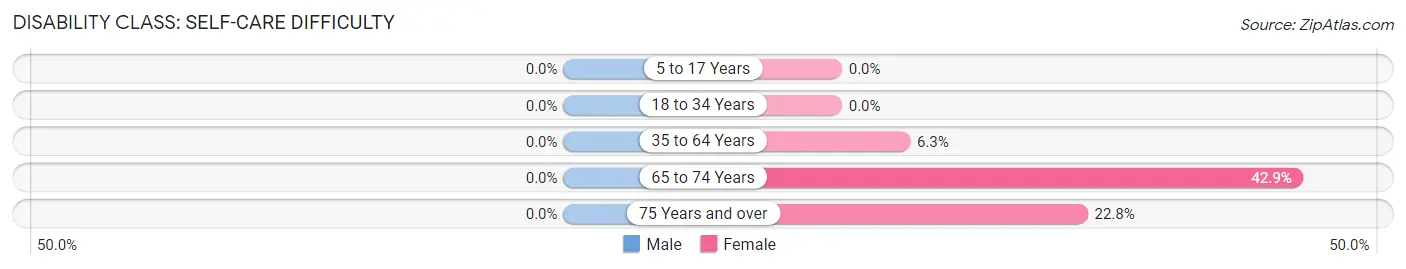
| Age Bracket | Male | Female |
| 5 to 17 Years | 0 (0.0%) | 0 (0.0%) |
| 18 to 34 Years | 0 (0.0%) | 0 (0.0%) |
| 35 to 64 Years | 0 (0.0%) | 5 (6.3%) |
| 65 to 74 Years | 0 (0.0%) | 15 (42.9%) |
| 75 Years and over | 0 (0.0%) | 13 (22.8%) |
Technology Access in Wilmar
Computing Device Access in Wilmar
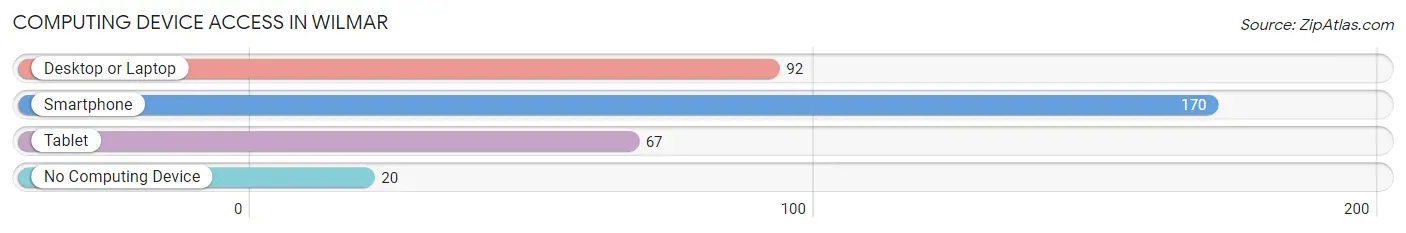
| Device Type | # Households | % Households |
| Desktop or Laptop | 92 | 47.2% |
| Smartphone | 170 | 87.2% |
| Tablet | 67 | 34.4% |
| No Computing Device | 20 | 10.3% |
| Total | 195 | 100.0% |
Internet Access in Wilmar
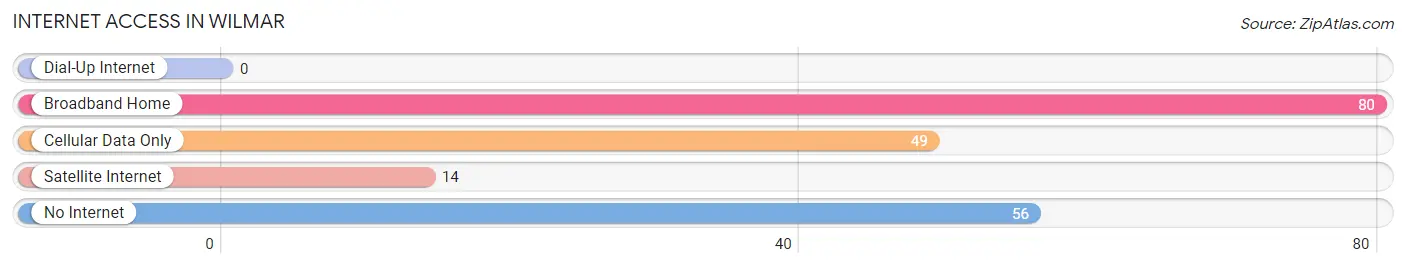
| Internet Type | # Households | % Households |
| Dial-Up Internet | 0 | 0.0% |
| Broadband Home | 80 | 41.0% |
| Cellular Data Only | 49 | 25.1% |
| Satellite Internet | 14 | 7.2% |
| No Internet | 56 | 28.7% |
| Total | 195 | 100.0% |
Wilmar Summary
Wilmar is a small city located in the southeastern corner of Arkansas, in the United States. It is situated in the Arkansas Delta region, and is part of the Pine Bluff Metropolitan Statistical Area. The city has a population of approximately 2,000 people, and is the county seat of Drew County.
History
The area that is now Wilmar was first settled in the early 1800s by settlers from the nearby town of Monticello. The town was originally known as “Crossroads”, due to its location at the intersection of two major roads. In 1883, the town was renamed Wilmar, after the first postmaster, William Marr.
The town was incorporated in 1891, and the first mayor was elected in 1892. The town grew slowly, but steadily, and by the early 1900s, it had become a thriving agricultural center. The town was also home to several businesses, including a cotton gin, a sawmill, and a gristmill.
In the early 20th century, Wilmar began to experience a period of growth and prosperity. The town was connected to the railroad in 1906, and the population began to increase. The town also became a center for education, with the establishment of a high school in 1910.
Geography
Wilmar is located in the southeastern corner of Arkansas, in the Arkansas Delta region. The city is situated at the intersection of two major roads, U.S. Highway 65 and Arkansas Highway 8. The city is located approximately 30 miles south of Pine Bluff, and 40 miles north of Monticello.
The city is situated on the banks of the White River, and is surrounded by a number of small lakes and ponds. The city is located in a flat, low-lying area, and is subject to occasional flooding. The climate in Wilmar is humid subtropical, with hot, humid summers and mild winters.
Economy
The economy of Wilmar is largely based on agriculture. The city is home to several large farms, and the surrounding area is known for its production of cotton, soybeans, and rice. The city is also home to several small businesses, including a lumber mill, a feed store, and a hardware store.
The city is also home to a number of manufacturing companies, including a furniture factory, a plastics factory, and a paper mill. The city is also home to a number of retail stores, including a grocery store, a pharmacy, and a number of clothing stores.
Demographics
As of the 2010 census, the population of Wilmar was 2,000 people. The racial makeup of the city was 79.2% White, 17.7% African American, 0.7% Native American, 0.3% Asian, and 2.1% from other races. The median household income was $30,000, and the median family income was $35,000.
The city is home to a number of churches, including Baptist, Methodist, and Pentecostal congregations. The city is also home to a number of schools, including a public elementary school, a middle school, and a high school. The city is served by the Wilmar Public Library, which offers a variety of books, magazines, and other materials.
Common Questions
What is Per Capita Income in Wilmar?
Per Capita income in Wilmar is $23,721.
What is the Median Family Income in Wilmar?
Median Family Income in Wilmar is $82,500.
What is Income or Wage Gap in Wilmar?
Income or Wage Gap in Wilmar is 5.2%.
Women in Wilmar earn 94.8 cents for every dollar earned by a man.
What is Inequality or Gini Index in Wilmar?
Inequality or Gini Index in Wilmar is 0.43.
What is the Total Population of Wilmar?
Total Population of Wilmar is 384.
What is the Total Male Population of Wilmar?
Total Male Population of Wilmar is 155.
What is the Total Female Population of Wilmar?
Total Female Population of Wilmar is 229.
What is the Ratio of Males per 100 Females in Wilmar?
There are 67.69 Males per 100 Females in Wilmar.
What is the Ratio of Females per 100 Males in Wilmar?
There are 147.74 Females per 100 Males in Wilmar.
What is the Median Population Age in Wilmar?
Median Population Age in Wilmar is 58.3 Years.
What is the Average Family Size in Wilmar
Average Family Size in Wilmar is 3.1 People.
What is the Average Household Size in Wilmar
Average Household Size in Wilmar is 2.0 People.
How Large is the Labor Force in Wilmar?
There are 136 People in the Labor Forcein in Wilmar.
What is the Percentage of People in the Labor Force in Wilmar?
42.9% of People are in the Labor Force in Wilmar.
What is the Unemployment Rate in Wilmar?
Unemployment Rate in Wilmar is 0.7%.