Western Grove, AR Map & Demographics
Western Grove Map
Western Grove Overview
$18,492
PER CAPITA INCOME
$35,577
AVG FAMILY INCOME
$43,750
AVG HOUSEHOLD INCOME
0.42
INEQUALITY / GINI INDEX
461
TOTAL POPULATION
217
MALE POPULATION
244
FEMALE POPULATION
88.93
MALES / 100 FEMALES
112.44
FEMALES / 100 MALES
28.7
MEDIAN AGE
3.5
AVG FAMILY SIZE
3.0
AVG HOUSEHOLD SIZE
178
LABOR FORCE [ PEOPLE ]
53.8%
PERCENT IN LABOR FORCE
4.2%
UNEMPLOYMENT RATE
Western Grove Zip Codes
Western Grove Area Codes
Income in Western Grove
Income Overview in Western Grove
Per Capita Income in Western Grove is $18,492, while median incomes of families and households are $35,577 and $43,750 respectively.
| Characteristic | Number | Measure |
| Per Capita Income | 461 | $18,492 |
| Median Family Income | 104 | $35,577 |
| Mean Family Income | 104 | $48,206 |
| Median Household Income | 153 | $43,750 |
| Mean Household Income | 153 | $49,937 |
| Income Deficit | 104 | $0 |
| Wage / Income Gap (%) | 461 | 0.00% |
| Wage / Income Gap ($) | 461 | 100.00¢ per $1 |
| Gini / Inequality Index | 461 | 0.42 |
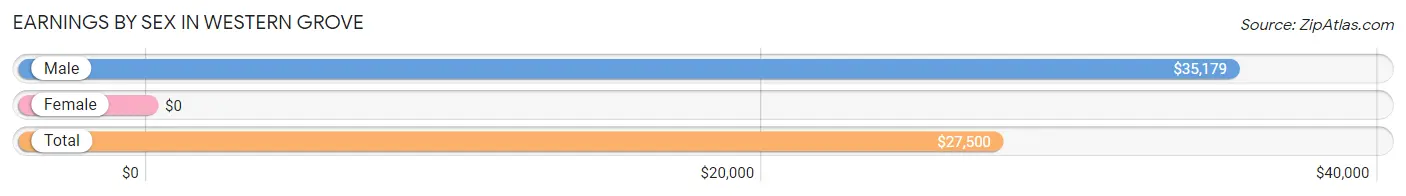
Earnings by Sex in Western Grove
| Sex | Number | Average Earnings |
| Male | 86 (47.2%) | $35,179 |
| Female | 96 (52.7%) | $0 |
| Total | 182 (100.0%) | $27,500 |
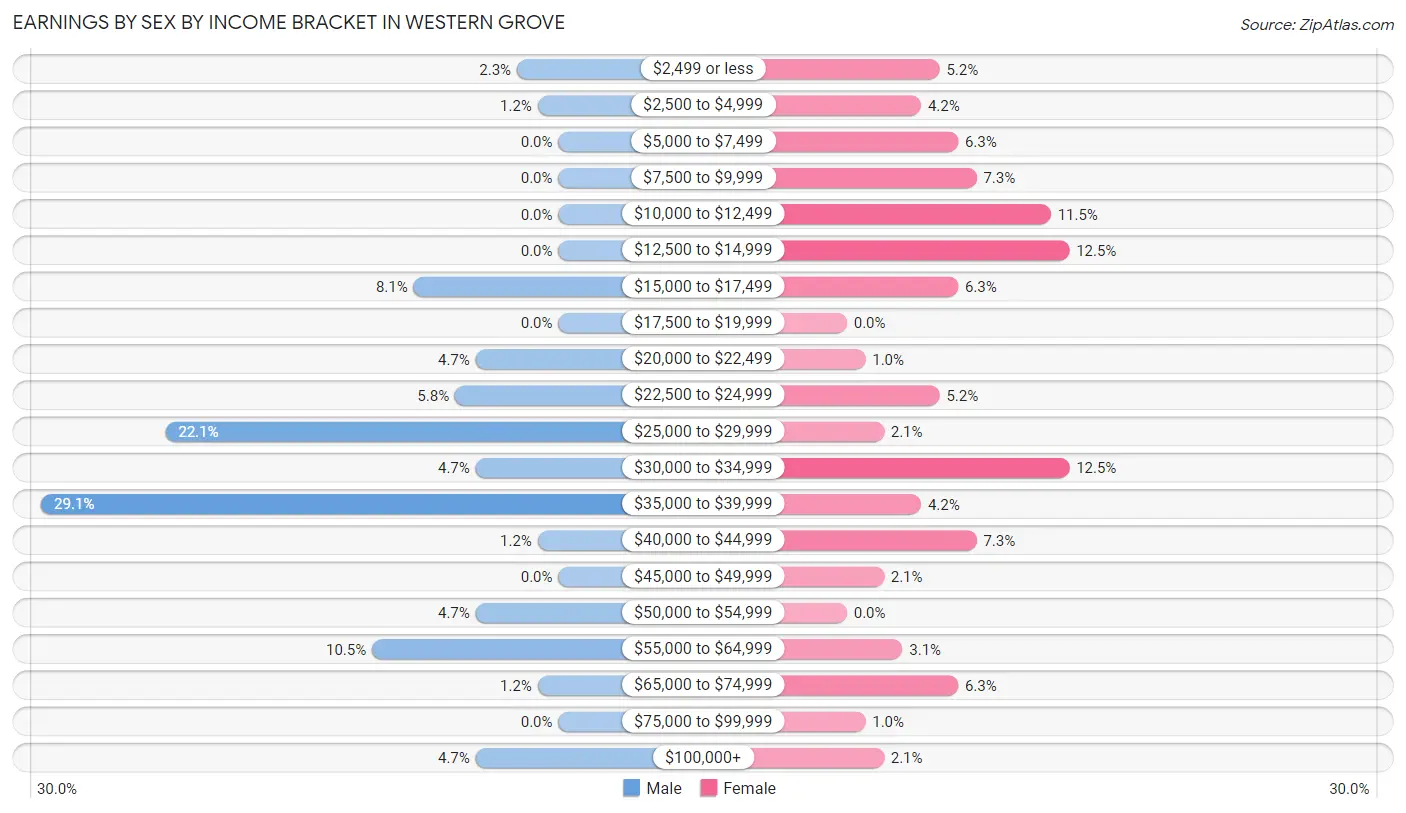
Earnings by Sex by Income Bracket in Western Grove
The most common earnings brackets in Western Grove are $35,000 to $39,999 for men (25 | 29.1%) and $12,500 to $14,999 for women (12 | 12.5%).
| Income | Male | Female |
| $2,499 or less | 2 (2.3%) | 5 (5.2%) |
| $2,500 to $4,999 | 1 (1.2%) | 4 (4.2%) |
| $5,000 to $7,499 | 0 (0.0%) | 6 (6.2%) |
| $7,500 to $9,999 | 0 (0.0%) | 7 (7.3%) |
| $10,000 to $12,499 | 0 (0.0%) | 11 (11.5%) |
| $12,500 to $14,999 | 0 (0.0%) | 12 (12.5%) |
| $15,000 to $17,499 | 7 (8.1%) | 6 (6.2%) |
| $17,500 to $19,999 | 0 (0.0%) | 0 (0.0%) |
| $20,000 to $22,499 | 4 (4.6%) | 1 (1.0%) |
| $22,500 to $24,999 | 5 (5.8%) | 5 (5.2%) |
| $25,000 to $29,999 | 19 (22.1%) | 2 (2.1%) |
| $30,000 to $34,999 | 4 (4.6%) | 12 (12.5%) |
| $35,000 to $39,999 | 25 (29.1%) | 4 (4.2%) |
| $40,000 to $44,999 | 1 (1.2%) | 7 (7.3%) |
| $45,000 to $49,999 | 0 (0.0%) | 2 (2.1%) |
| $50,000 to $54,999 | 4 (4.6%) | 0 (0.0%) |
| $55,000 to $64,999 | 9 (10.5%) | 3 (3.1%) |
| $65,000 to $74,999 | 1 (1.2%) | 6 (6.2%) |
| $75,000 to $99,999 | 0 (0.0%) | 1 (1.0%) |
| $100,000+ | 4 (4.6%) | 2 (2.1%) |
| Total | 86 (100.0%) | 96 (100.0%) |
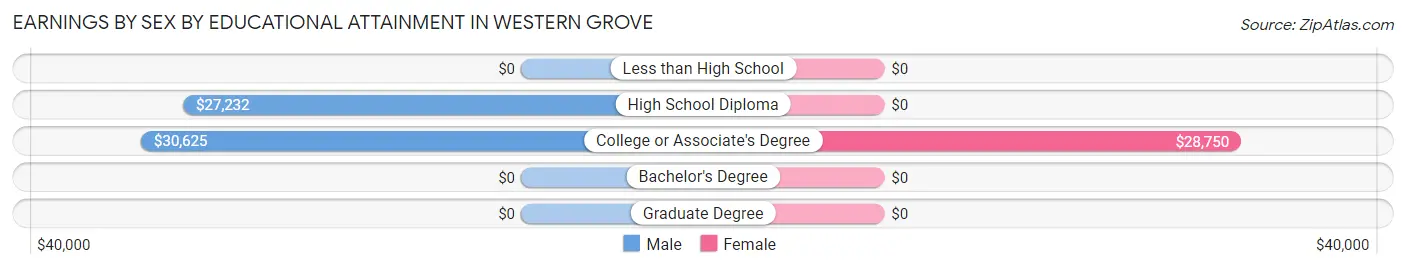
Earnings by Sex by Educational Attainment in Western Grove
| Educational Attainment | Male Income | Female Income |
| Less than High School | - | - |
| High School Diploma | $27,232 | $0 |
| College or Associate's Degree | $30,625 | $28,750 |
| Bachelor's Degree | - | - |
| Graduate Degree | - | - |
| Total | $33,750 | $0 |
Family Income in Western Grove
Family Income Brackets in Western Grove
According to the Western Grove family income data, there are 17 families falling into the $25,000 to $34,999 income range, which is the most common income bracket and makes up 16.4% of all families.
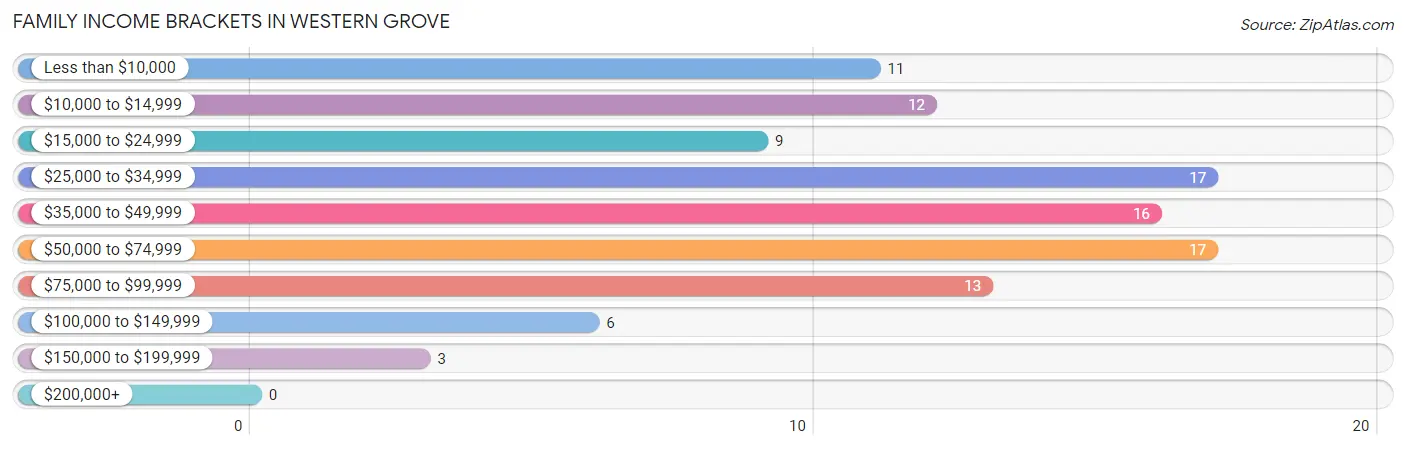
| Income Bracket | # Families | % Families |
| Less than $10,000 | 11 | 10.6% |
| $10,000 to $14,999 | 12 | 11.5% |
| $15,000 to $24,999 | 9 | 8.7% |
| $25,000 to $34,999 | 17 | 16.3% |
| $35,000 to $49,999 | 16 | 15.4% |
| $50,000 to $74,999 | 17 | 16.3% |
| $75,000 to $99,999 | 13 | 12.5% |
| $100,000 to $149,999 | 6 | 5.8% |
| $150,000 to $199,999 | 3 | 2.9% |
| $200,000+ | 0 | 0.0% |
Family Income by Famaliy Size in Western Grove
5-person families (5 | 4.8%) account for the highest median family income in Western Grove with $138,750 per family, while 5-person families (5 | 4.8%) have the highest median income of $27,750 per family member.
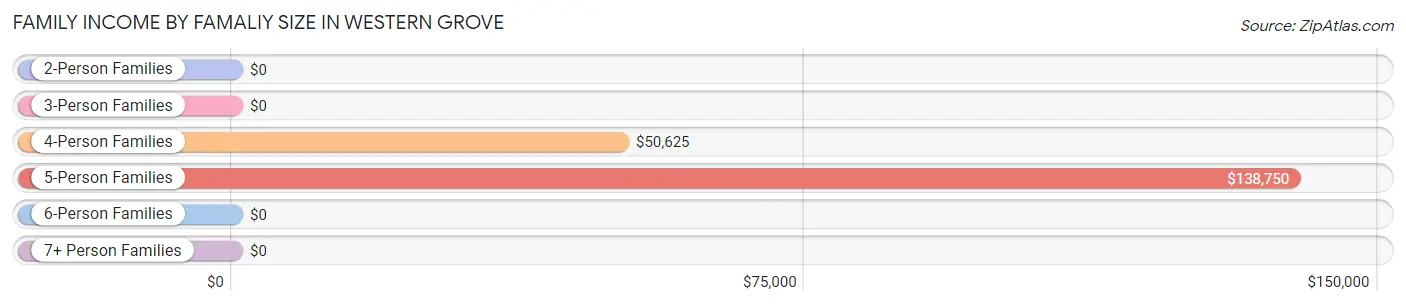
| Income Bracket | # Families | Median Income |
| 2-Person Families | 50 (48.1%) | $0 |
| 3-Person Families | 40 (38.5%) | $0 |
| 4-Person Families | 9 (8.6%) | $50,625 |
| 5-Person Families | 5 (4.8%) | $138,750 |
| 6-Person Families | 0 (0.0%) | $0 |
| 7+ Person Families | 0 (0.0%) | $0 |
| Total | 104 (100.0%) | $35,577 |
Family Income by Number of Earners in Western Grove
The median family income in Western Grove is $35,577, with families comprising 3+ earners (5) having the highest median family income of $114,375, while families with no earners (15) have the lowest median family income of $22,250, accounting for 4.8% and 14.4% of families, respectively.
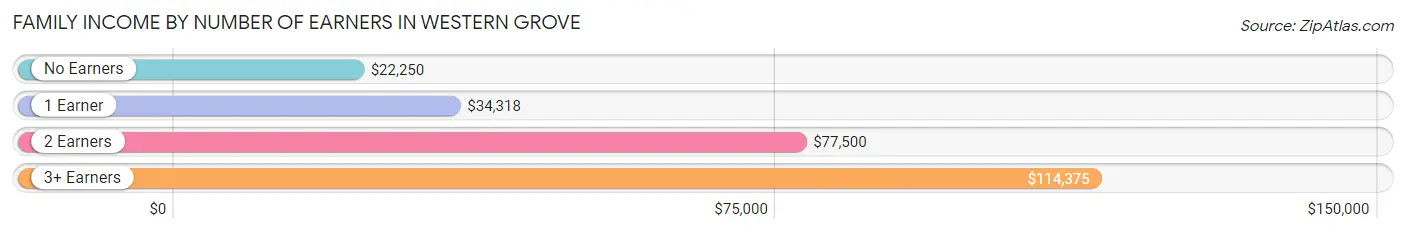
| Number of Earners | # Families | Median Income |
| No Earners | 15 (14.4%) | $22,250 |
| 1 Earner | 64 (61.5%) | $34,318 |
| 2 Earners | 20 (19.2%) | $77,500 |
| 3+ Earners | 5 (4.8%) | $114,375 |
| Total | 104 (100.0%) | $35,577 |
Household Income in Western Grove
Household Income Brackets in Western Grove
With 34 households falling in the category, the $50,000 to $74,999 income range is the most frequent in Western Grove, accounting for 22.2% of all households.
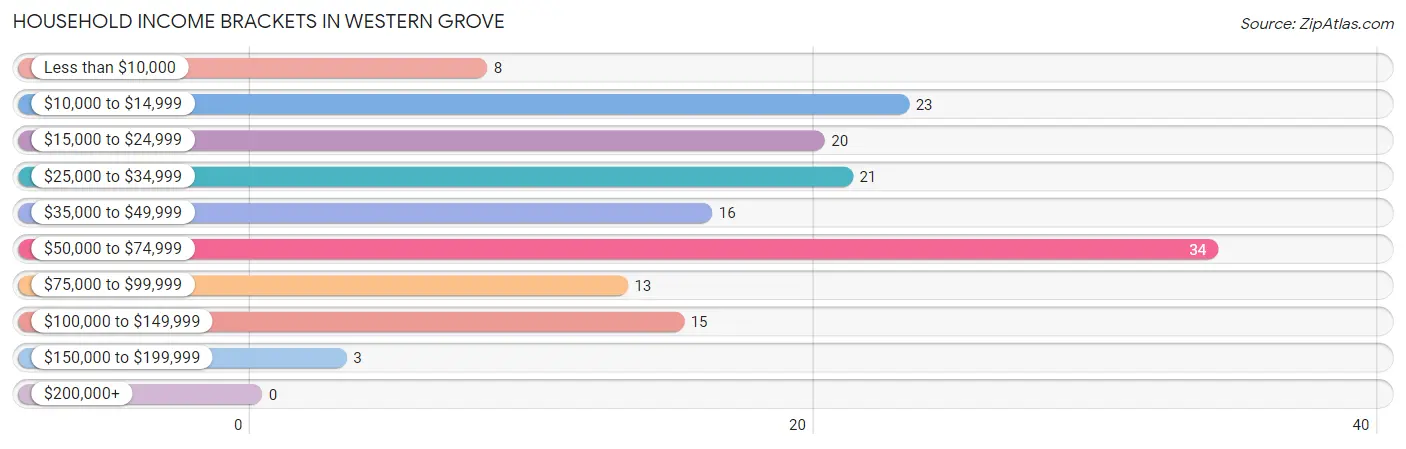
| Income Bracket | # Households | % Households |
| Less than $10,000 | 8 | 5.2% |
| $10,000 to $14,999 | 23 | 15.0% |
| $15,000 to $24,999 | 20 | 13.1% |
| $25,000 to $34,999 | 21 | 13.7% |
| $35,000 to $49,999 | 16 | 10.5% |
| $50,000 to $74,999 | 34 | 22.2% |
| $75,000 to $99,999 | 13 | 8.5% |
| $100,000 to $149,999 | 15 | 9.8% |
| $150,000 to $199,999 | 3 | 2.0% |
| $200,000+ | 0 | 0.0% |
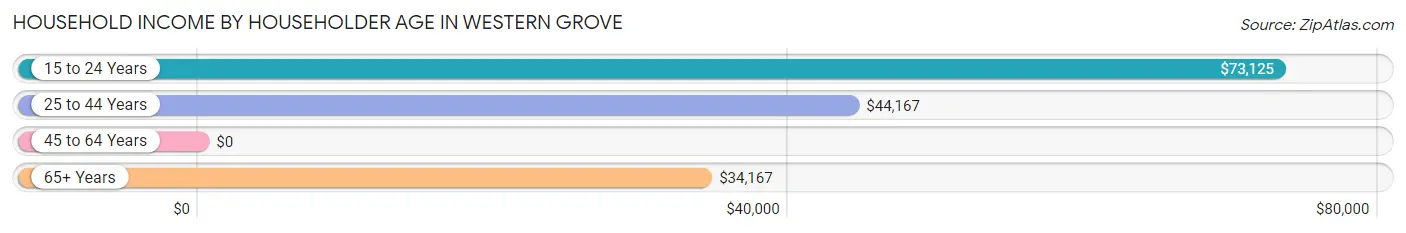
Household Income by Householder Age in Western Grove
The median household income in Western Grove is $43,750, with the highest median household income of $73,125 found in the 15 to 24 years age bracket for the primary householder. A total of 11 households (7.2%) fall into this category. Meanwhile, the 45 to 64 years age bracket for the primary householder has the lowest median household income of $0, with 30 households (19.6%) in this group.
| Income Bracket | # Households | Median Income |
| 15 to 24 Years | 11 (7.2%) | $73,125 |
| 25 to 44 Years | 66 (43.1%) | $44,167 |
| 45 to 64 Years | 30 (19.6%) | $0 |
| 65+ Years | 46 (30.1%) | $34,167 |
| Total | 153 (100.0%) | $43,750 |
Poverty in Western Grove
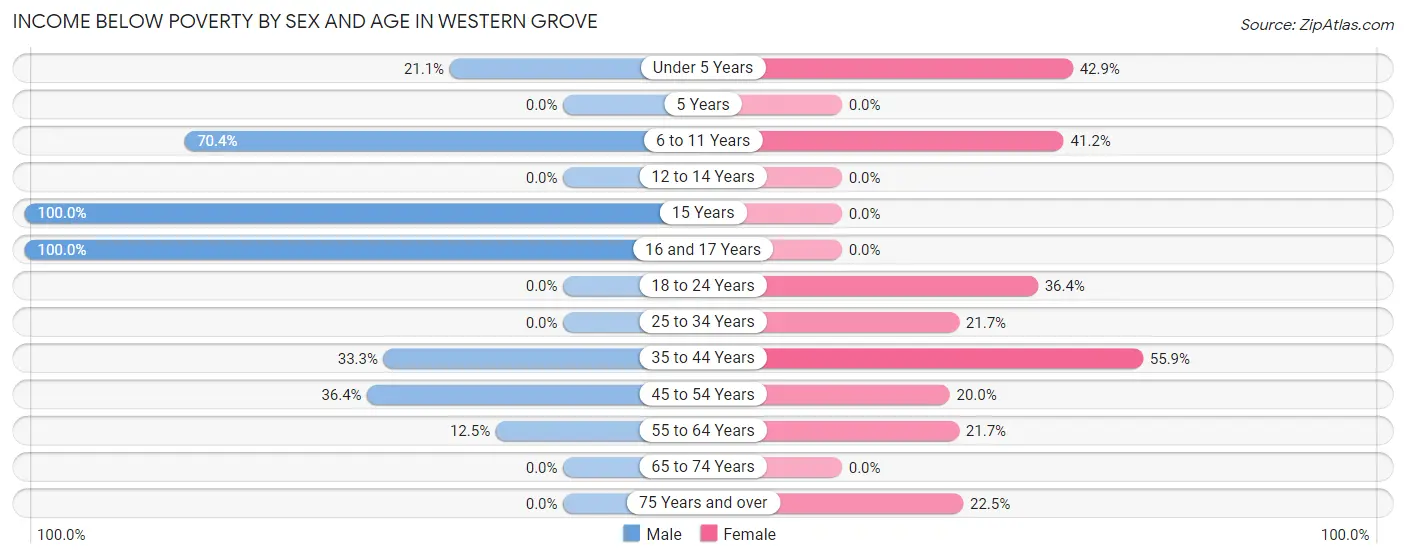
Income Below Poverty by Sex and Age in Western Grove
With 26.7% poverty level for males and 27.9% for females among the residents of Western Grove, 15 year old males and 35 to 44 year old females are the most vulnerable to poverty, with 8 males (100.0%) and 19 females (55.9%) in their respective age groups living below the poverty level.
| Age Bracket | Male | Female |
| Under 5 Years | 4 (21.0%) | 15 (42.9%) |
| 5 Years | 0 (0.0%) | 0 (0.0%) |
| 6 to 11 Years | 19 (70.4%) | 7 (41.2%) |
| 12 to 14 Years | 0 (0.0%) | 0 (0.0%) |
| 15 Years | 8 (100.0%) | 0 (0.0%) |
| 16 and 17 Years | 20 (100.0%) | 0 (0.0%) |
| 18 to 24 Years | 0 (0.0%) | 4 (36.4%) |
| 25 to 34 Years | 0 (0.0%) | 5 (21.7%) |
| 35 to 44 Years | 2 (33.3%) | 19 (55.9%) |
| 45 to 54 Years | 4 (36.4%) | 4 (20.0%) |
| 55 to 64 Years | 1 (12.5%) | 5 (21.7%) |
| 65 to 74 Years | 0 (0.0%) | 0 (0.0%) |
| 75 Years and over | 0 (0.0%) | 9 (22.5%) |
| Total | 58 (26.7%) | 68 (27.9%) |
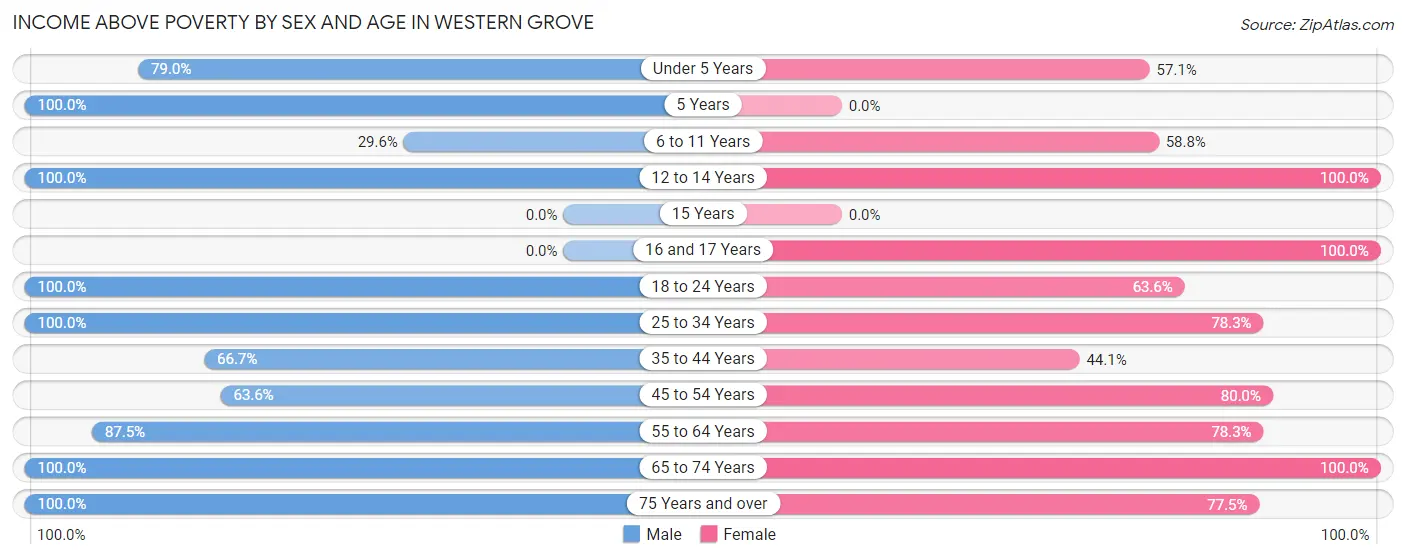
Income Above Poverty by Sex and Age in Western Grove
According to the poverty statistics in Western Grove, males aged 5 years and females aged 12 to 14 years are the age groups that are most secure financially, with 100.0% of males and 100.0% of females in these age groups living above the poverty line.
| Age Bracket | Male | Female |
| Under 5 Years | 15 (78.9%) | 20 (57.1%) |
| 5 Years | 2 (100.0%) | 0 (0.0%) |
| 6 to 11 Years | 8 (29.6%) | 10 (58.8%) |
| 12 to 14 Years | 10 (100.0%) | 12 (100.0%) |
| 15 Years | 0 (0.0%) | 0 (0.0%) |
| 16 and 17 Years | 0 (0.0%) | 15 (100.0%) |
| 18 to 24 Years | 18 (100.0%) | 7 (63.6%) |
| 25 to 34 Years | 58 (100.0%) | 18 (78.3%) |
| 35 to 44 Years | 4 (66.7%) | 15 (44.1%) |
| 45 to 54 Years | 7 (63.6%) | 16 (80.0%) |
| 55 to 64 Years | 7 (87.5%) | 18 (78.3%) |
| 65 to 74 Years | 11 (100.0%) | 14 (100.0%) |
| 75 Years and over | 19 (100.0%) | 31 (77.5%) |
| Total | 159 (73.3%) | 176 (72.1%) |
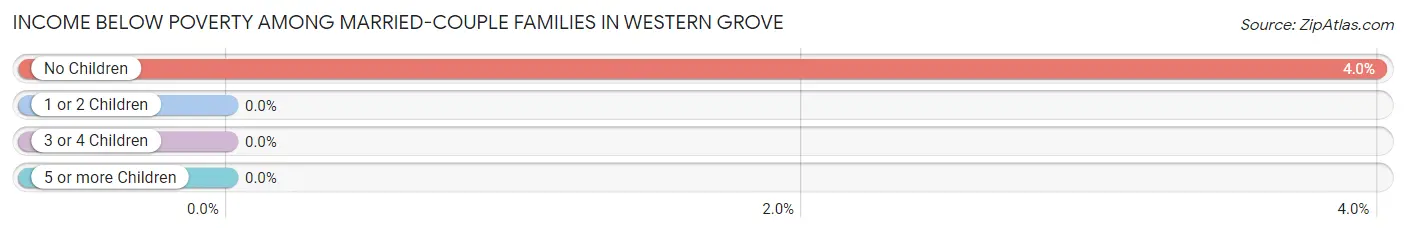
Income Below Poverty Among Married-Couple Families in Western Grove
The poverty statistics for married-couple families in Western Grove show that 2.4% or 1 of the total 42 families live below the poverty line. Families with no children have the highest poverty rate of 4.0%, comprising of 1 families. On the other hand, families with 1 or 2 children have the lowest poverty rate of 0.0%, which includes 0 families.
| Children | Above Poverty | Below Poverty |
| No Children | 24 (96.0%) | 1 (4.0%) |
| 1 or 2 Children | 17 (100.0%) | 0 (0.0%) |
| 3 or 4 Children | 0 (0.0%) | 0 (0.0%) |
| 5 or more Children | 0 (0.0%) | 0 (0.0%) |
| Total | 41 (97.6%) | 1 (2.4%) |
Income Below Poverty Among Single-Parent Households in Western Grove
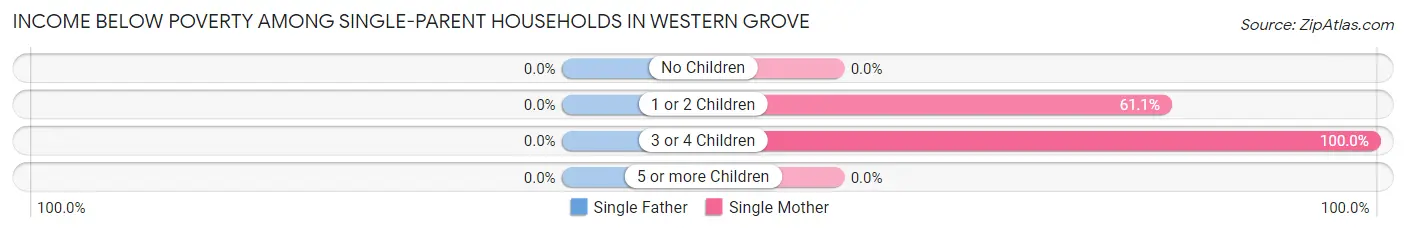
| Children | Single Father | Single Mother |
| No Children | 0 (0.0%) | 0 (0.0%) |
| 1 or 2 Children | 0 (0.0%) | 22 (61.1%) |
| 3 or 4 Children | 0 (0.0%) | 4 (100.0%) |
| 5 or more Children | 0 (0.0%) | 0 (0.0%) |
| Total | 0 (0.0%) | 26 (52.0%) |
Income Below Poverty Among Married-Couple vs Single-Parent Households in Western Grove
The poverty data for Western Grove shows that 1 of the married-couple family households (2.4%) and 26 of the single-parent households (41.9%) are living below the poverty level. Within the married-couple family households, those with no children have the highest poverty rate, with 1 households (4.0%) falling below the poverty line. Among the single-parent households, those with 3 or 4 children have the highest poverty rate, with 4 household (100.0%) living below poverty.
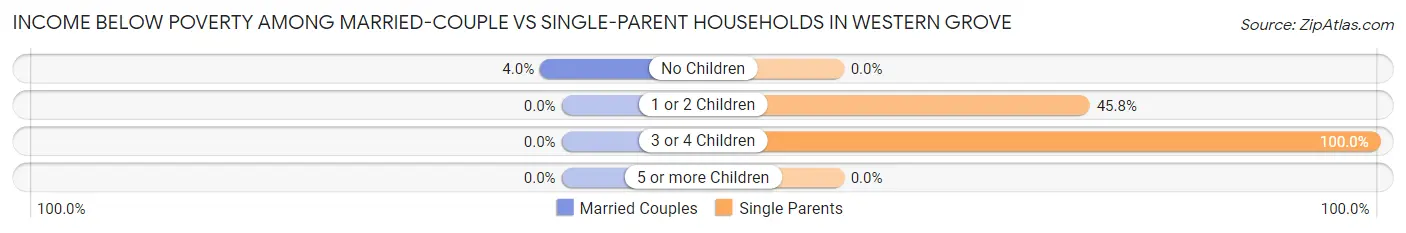
| Children | Married-Couple Families | Single-Parent Households |
| No Children | 1 (4.0%) | 0 (0.0%) |
| 1 or 2 Children | 0 (0.0%) | 22 (45.8%) |
| 3 or 4 Children | 0 (0.0%) | 4 (100.0%) |
| 5 or more Children | 0 (0.0%) | 0 (0.0%) |
| Total | 1 (2.4%) | 26 (41.9%) |
Race in Western Grove
The most populous races in Western Grove are White / Caucasian (429 | 93.1%), Two or more Races (27 | 5.9%), and Native / Alaskan (5 | 1.1%).
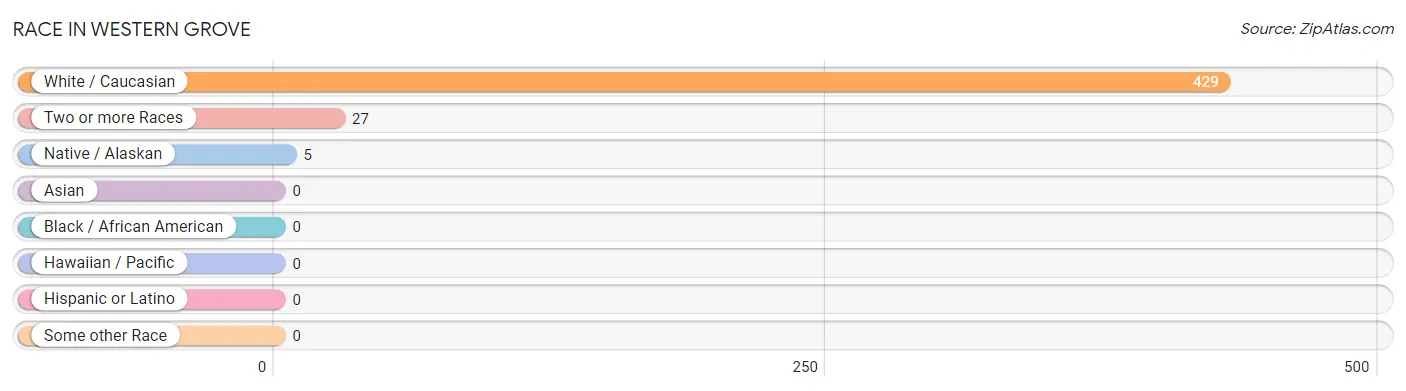
| Race | # Population | % Population |
| Asian | 0 | 0.0% |
| Black / African American | 0 | 0.0% |
| Hawaiian / Pacific | 0 | 0.0% |
| Hispanic or Latino | 0 | 0.0% |
| Native / Alaskan | 5 | 1.1% |
| White / Caucasian | 429 | 93.1% |
| Two or more Races | 27 | 5.9% |
| Some other Race | 0 | 0.0% |
| Total | 461 | 100.0% |
Ancestry in Western Grove
The most populous ancestries reported in Western Grove are German (44 | 9.5%), American (41 | 8.9%), Irish (27 | 5.9%), English (23 | 5.0%), and Cherokee (7 | 1.5%), together accounting for 30.8% of all Western Grove residents.
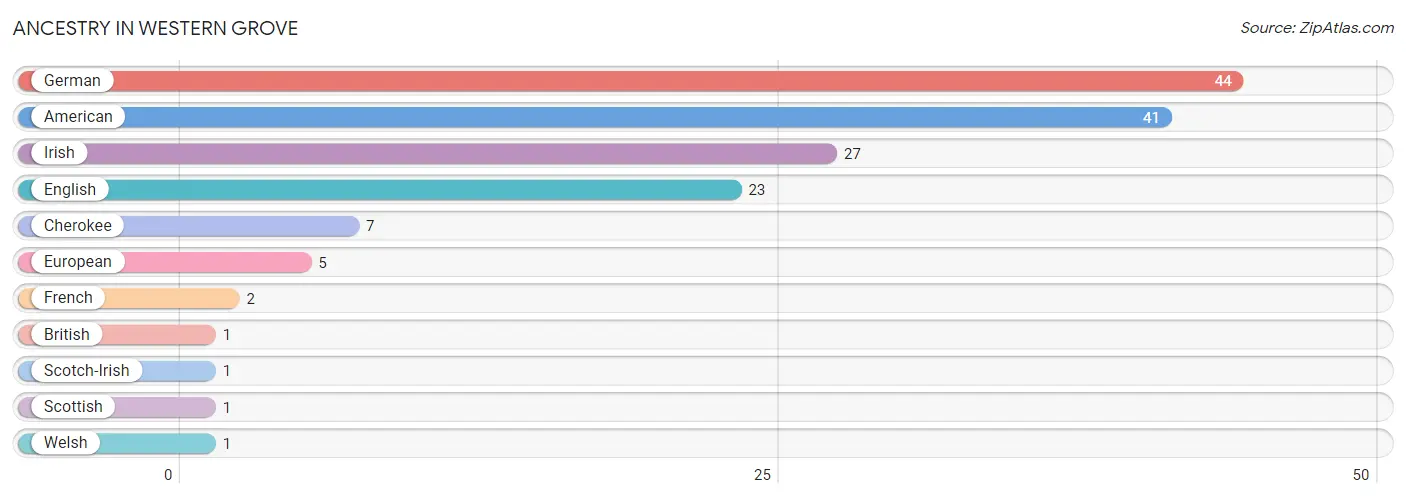
| Ancestry | # Population | % Population |
| American | 41 | 8.9% |
| British | 1 | 0.2% |
| Cherokee | 7 | 1.5% |
| English | 23 | 5.0% |
| European | 5 | 1.1% |
| French | 2 | 0.4% |
| German | 44 | 9.5% |
| Irish | 27 | 5.9% |
| Scotch-Irish | 1 | 0.2% |
| Scottish | 1 | 0.2% |
| Welsh | 1 | 0.2% | View All 11 Rows |
Immigrants in Western Grove

| Immigration Origin | # Population | % Population | View All 0 Rows |
Sex and Age in Western Grove
Sex and Age in Western Grove
The most populous age groups in Western Grove are 25 to 29 Years (36 | 16.6%) for men and Under 5 Years (35 | 14.3%) for women.
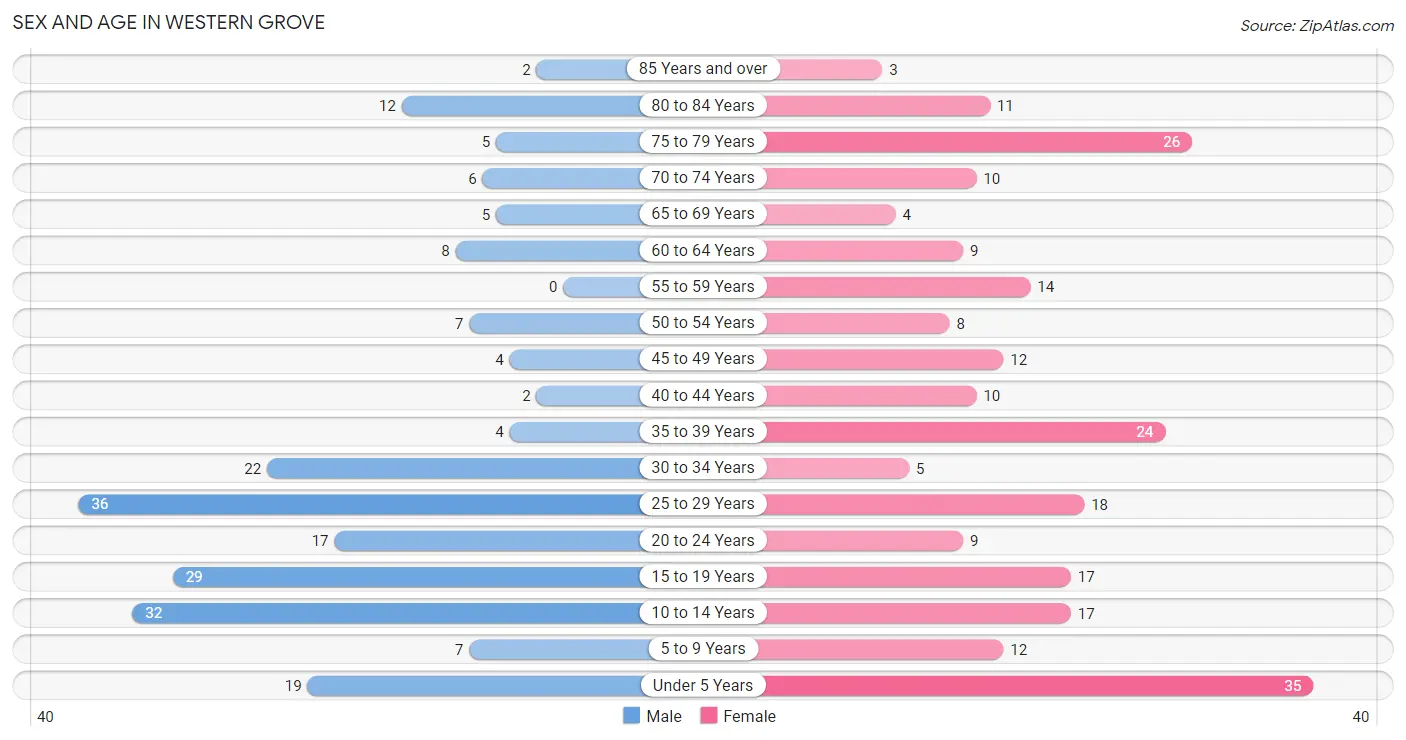
| Age Bracket | Male | Female |
| Under 5 Years | 19 (8.8%) | 35 (14.3%) |
| 5 to 9 Years | 7 (3.2%) | 12 (4.9%) |
| 10 to 14 Years | 32 (14.7%) | 17 (7.0%) |
| 15 to 19 Years | 29 (13.4%) | 17 (7.0%) |
| 20 to 24 Years | 17 (7.8%) | 9 (3.7%) |
| 25 to 29 Years | 36 (16.6%) | 18 (7.4%) |
| 30 to 34 Years | 22 (10.1%) | 5 (2.1%) |
| 35 to 39 Years | 4 (1.8%) | 24 (9.8%) |
| 40 to 44 Years | 2 (0.9%) | 10 (4.1%) |
| 45 to 49 Years | 4 (1.8%) | 12 (4.9%) |
| 50 to 54 Years | 7 (3.2%) | 8 (3.3%) |
| 55 to 59 Years | 0 (0.0%) | 14 (5.7%) |
| 60 to 64 Years | 8 (3.7%) | 9 (3.7%) |
| 65 to 69 Years | 5 (2.3%) | 4 (1.6%) |
| 70 to 74 Years | 6 (2.8%) | 10 (4.1%) |
| 75 to 79 Years | 5 (2.3%) | 26 (10.7%) |
| 80 to 84 Years | 12 (5.5%) | 11 (4.5%) |
| 85 Years and over | 2 (0.9%) | 3 (1.2%) |
| Total | 217 (100.0%) | 244 (100.0%) |
Families and Households in Western Grove
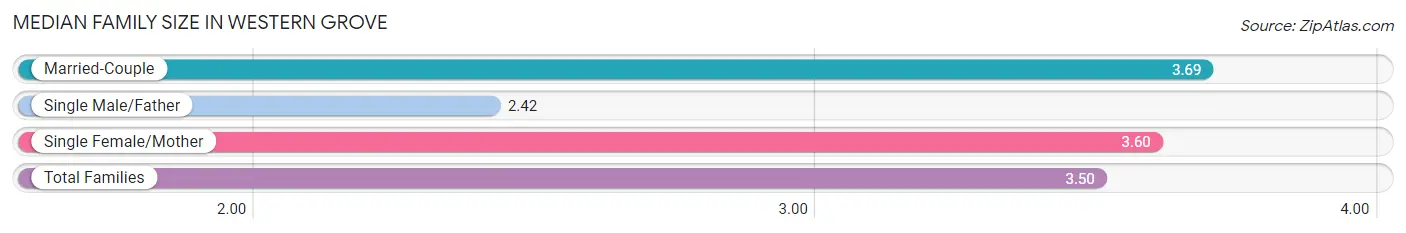
Median Family Size in Western Grove
The median family size in Western Grove is 3.50 persons per family, with married-couple families (42 | 40.4%) accounting for the largest median family size of 3.69 persons per family. On the other hand, single male/father families (12 | 11.5%) represent the smallest median family size with 2.42 persons per family.
| Family Type | # Families | Family Size |
| Married-Couple | 42 (40.4%) | 3.69 |
| Single Male/Father | 12 (11.5%) | 2.42 |
| Single Female/Mother | 50 (48.1%) | 3.60 |
| Total Families | 104 (100.0%) | 3.50 |
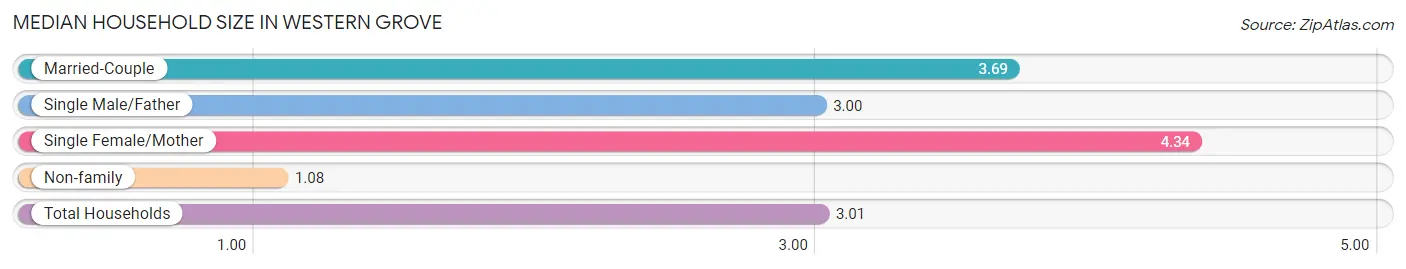
Median Household Size in Western Grove
The median household size in Western Grove is 3.01 persons per household, with single female/mother households (50 | 32.7%) accounting for the largest median household size of 4.34 persons per household. non-family households (49 | 32.0%) represent the smallest median household size with 1.08 persons per household.
| Household Type | # Households | Household Size |
| Married-Couple | 42 (27.5%) | 3.69 |
| Single Male/Father | 12 (7.8%) | 3.00 |
| Single Female/Mother | 50 (32.7%) | 4.34 |
| Non-family | 49 (32.0%) | 1.08 |
| Total Households | 153 (100.0%) | 3.01 |
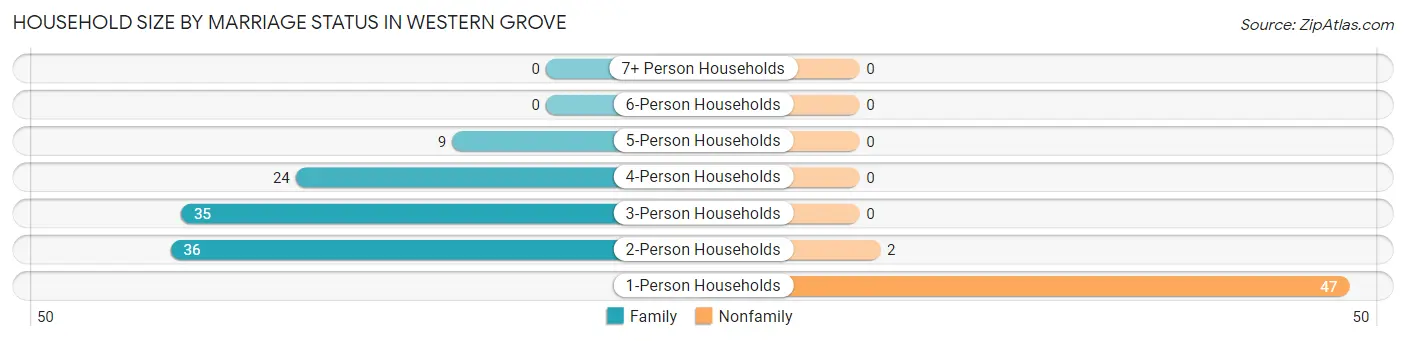
Household Size by Marriage Status in Western Grove
Out of a total of 153 households in Western Grove, 104 (68.0%) are family households, while 49 (32.0%) are nonfamily households. The most numerous type of family households are 2-person households, comprising 36, and the most common type of nonfamily households are 1-person households, comprising 47.
| Household Size | Family Households | Nonfamily Households |
| 1-Person Households | - | 47 (30.7%) |
| 2-Person Households | 36 (23.5%) | 2 (1.3%) |
| 3-Person Households | 35 (22.9%) | 0 (0.0%) |
| 4-Person Households | 24 (15.7%) | 0 (0.0%) |
| 5-Person Households | 9 (5.9%) | 0 (0.0%) |
| 6-Person Households | 0 (0.0%) | 0 (0.0%) |
| 7+ Person Households | 0 (0.0%) | 0 (0.0%) |
| Total | 104 (68.0%) | 49 (32.0%) |
Female Fertility in Western Grove
Fertility by Age in Western Grove
Average fertility rate in Western Grove is 51.0 births per 1,000 women. Women in the age bracket of 20 to 34 years have the highest fertility rate with 125.0 births per 1,000 women. Women in the age bracket of 20 to 34 years acount for 80.0% of all women with births.
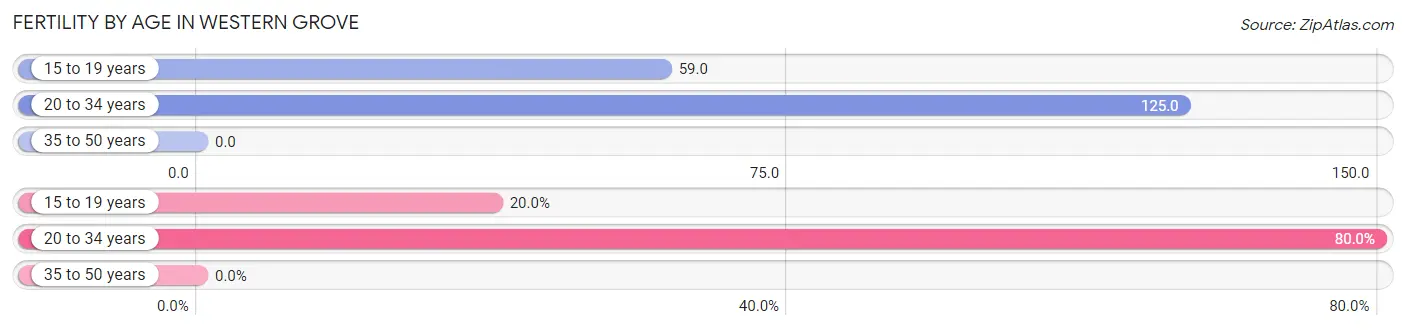
| Age Bracket | Women with Births | Births / 1,000 Women |
| 15 to 19 years | 1 (20.0%) | 59.0 |
| 20 to 34 years | 4 (80.0%) | 125.0 |
| 35 to 50 years | 0 (0.0%) | 0.0 |
| Total | 5 (100.0%) | 51.0 |
Fertility by Age by Marriage Status in Western Grove
20.0% of women with births (5) in Western Grove are married. The highest percentage of unmarried women with births falls into 20 to 34 years age bracket with 100.0% of them unmarried at the time of birth, while the lowest percentage of unmarried women with births belong to 15 to 19 years age bracket with 0.0% of them unmarried.
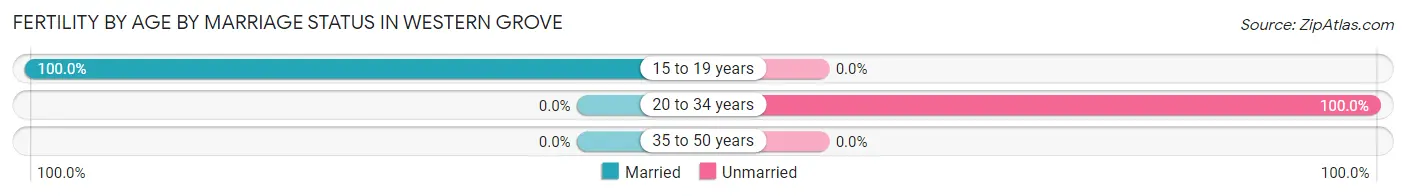
| Age Bracket | Married | Unmarried |
| 15 to 19 years | 1 (100.0%) | 0 (0.0%) |
| 20 to 34 years | 0 (0.0%) | 4 (100.0%) |
| 35 to 50 years | 0 (0.0%) | 0 (0.0%) |
| Total | 1 (20.0%) | 4 (80.0%) |
Fertility by Education in Western Grove
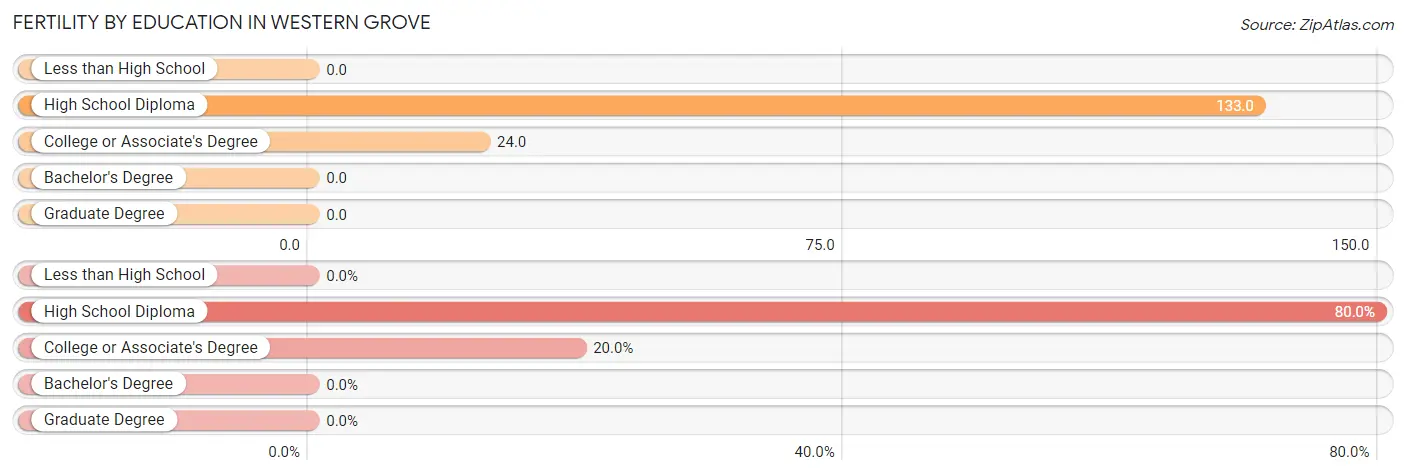
| Educational Attainment | Women with Births | Births / 1,000 Women |
| Less than High School | 0 (0.0%) | 0.0 |
| High School Diploma | 4 (80.0%) | 133.0 |
| College or Associate's Degree | 1 (20.0%) | 24.0 |
| Bachelor's Degree | 0 (0.0%) | 0.0 |
| Graduate Degree | 0 (0.0%) | 0.0 |
| Total | 5 (100.0%) | 51.0 |
Fertility by Education by Marriage Status in Western Grove
80.0% of women with births in Western Grove are unmarried. Women with the educational attainment of college or associate's degree are most likely to be married with 100.0% of them married at childbirth, while women with the educational attainment of high school diploma are least likely to be married with 100.0% of them unmarried at childbirth.
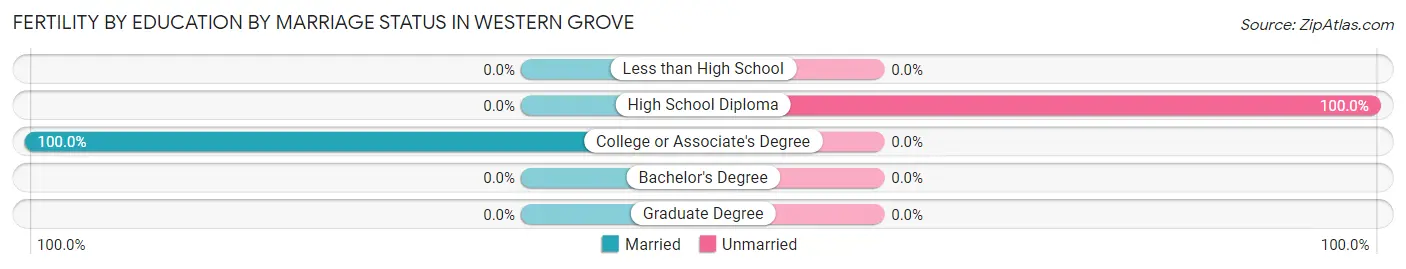
| Educational Attainment | Married | Unmarried |
| Less than High School | 0 (0.0%) | 0 (0.0%) |
| High School Diploma | 0 (0.0%) | 4 (100.0%) |
| College or Associate's Degree | 1 (100.0%) | 0 (0.0%) |
| Bachelor's Degree | 0 (0.0%) | 0 (0.0%) |
| Graduate Degree | 0 (0.0%) | 0 (0.0%) |
| Total | 1 (20.0%) | 4 (80.0%) |
Employment Characteristics in Western Grove
Employment by Class of Employer in Western Grove
Among the 167 employed individuals in Western Grove, private company employees (122 | 73.1%), not-for-profit organizations (13 | 7.8%), and federal government employees (12 | 7.2%) make up the most common classes of employment.
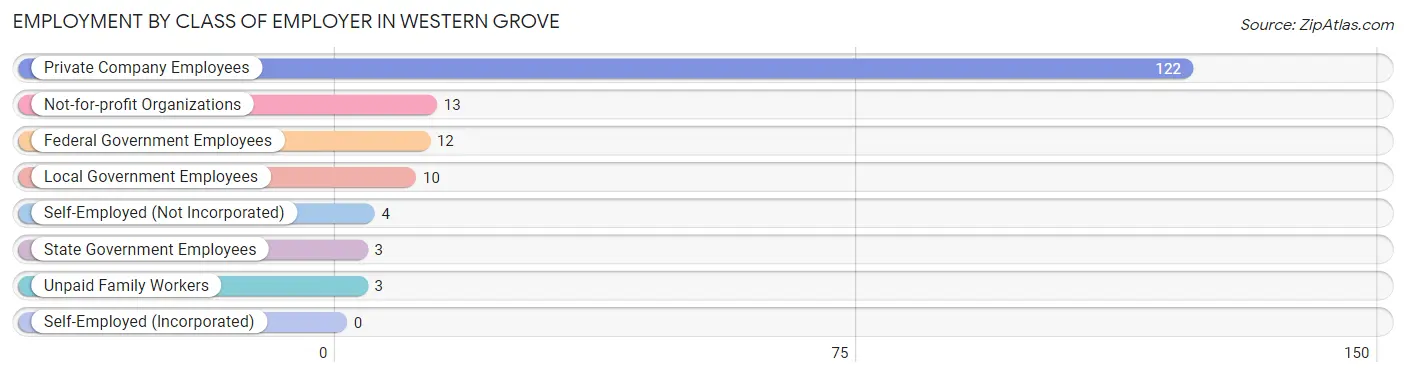
| Employer Class | # Employees | % Employees |
| Private Company Employees | 122 | 73.1% |
| Self-Employed (Incorporated) | 0 | 0.0% |
| Self-Employed (Not Incorporated) | 4 | 2.4% |
| Not-for-profit Organizations | 13 | 7.8% |
| Local Government Employees | 10 | 6.0% |
| State Government Employees | 3 | 1.8% |
| Federal Government Employees | 12 | 7.2% |
| Unpaid Family Workers | 3 | 1.8% |
| Total | 167 | 100.0% |
Employment Status by Age in Western Grove
According to the labor force statistics for Western Grove, out of the total population over 16 years of age (331), 53.8% or 178 individuals are in the labor force, with 4.2% or 7 of them unemployed. The age group with the highest labor force participation rate is 25 to 29 years, with 96.3% or 52 individuals in the labor force. Within the labor force, the 45 to 54 years age range has the highest percentage of unemployed individuals, with 14.3% or 3 of them being unemployed.
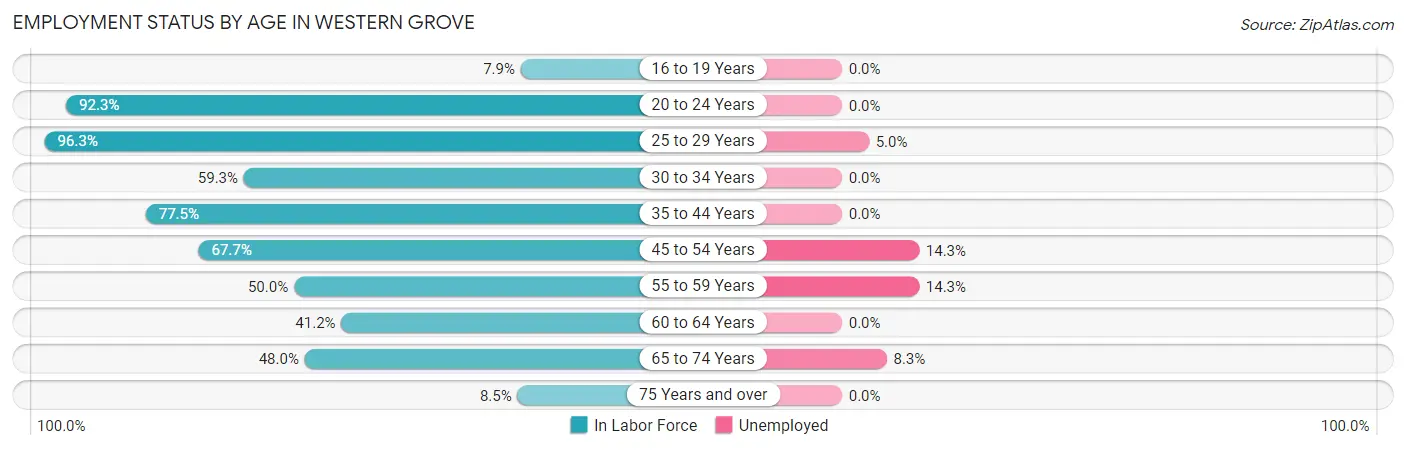
| Age Bracket | In Labor Force | Unemployed |
| 16 to 19 Years | 3 (7.9%) | 0 (0.0%) |
| 20 to 24 Years | 24 (92.3%) | 0 (0.0%) |
| 25 to 29 Years | 52 (96.3%) | 3 (5.0%) |
| 30 to 34 Years | 16 (59.3%) | 0 (0.0%) |
| 35 to 44 Years | 31 (77.5%) | 0 (0.0%) |
| 45 to 54 Years | 21 (67.7%) | 3 (14.3%) |
| 55 to 59 Years | 7 (50.0%) | 1 (14.3%) |
| 60 to 64 Years | 7 (41.2%) | 0 (0.0%) |
| 65 to 74 Years | 12 (48.0%) | 1 (8.3%) |
| 75 Years and over | 5 (8.5%) | 0 (0.0%) |
| Total | 178 (53.8%) | 7 (4.2%) |
Employment Status by Educational Attainment in Western Grove
According to labor force statistics for Western Grove, 73.2% of individuals (134) out of the total population between 25 and 64 years of age (183) are in the labor force, with 4.9% or 7 of them being unemployed. The group with the highest labor force participation rate are those with the educational attainment of bachelor's degree or higher, with 83.3% or 20 individuals in the labor force. Within the labor force, individuals with college / associate degree education have the highest percentage of unemployment, with 9.4% or 6 of them being unemployed.
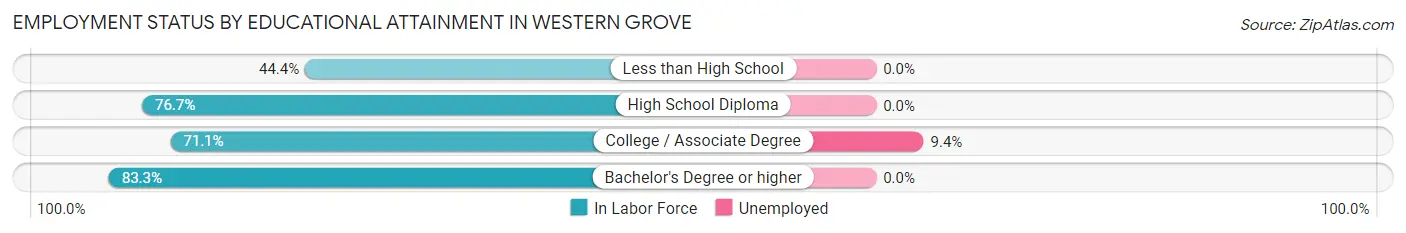
| Educational Attainment | In Labor Force | Unemployed |
| Less than High School | 4 (44.4%) | 0 (0.0%) |
| High School Diploma | 46 (76.7%) | 0 (0.0%) |
| College / Associate Degree | 64 (71.1%) | 8 (9.4%) |
| Bachelor's Degree or higher | 20 (83.3%) | 0 (0.0%) |
| Total | 134 (73.2%) | 9 (4.9%) |
Employment Occupations by Sex in Western Grove
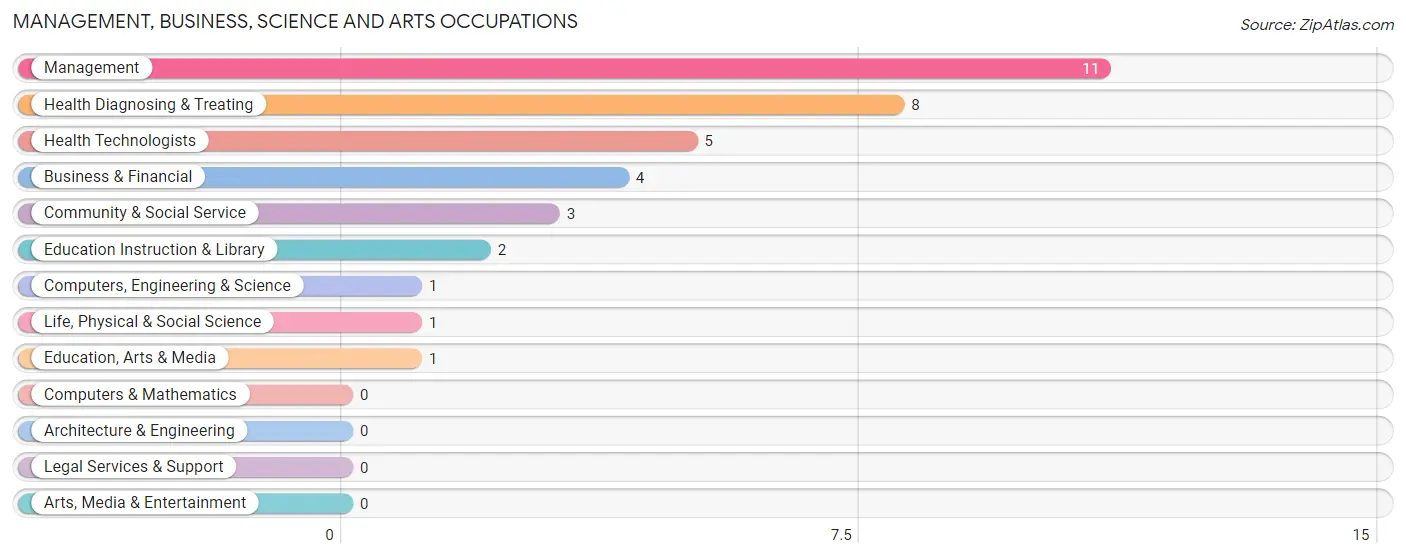
Management, Business, Science and Arts Occupations
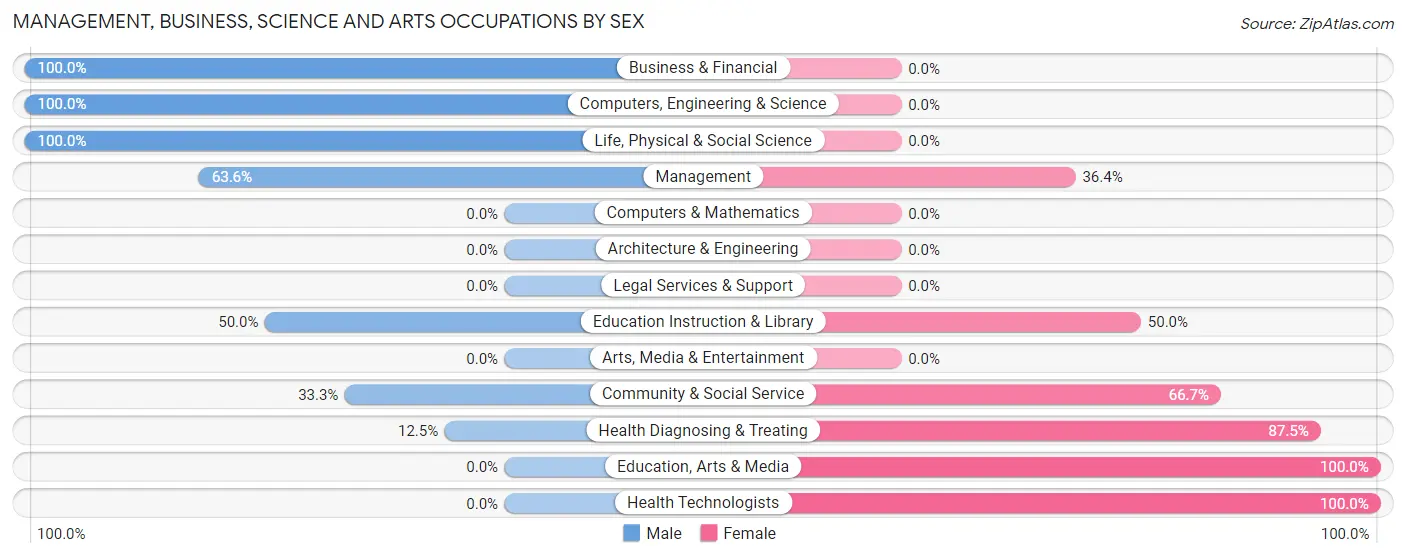
The most common Management, Business, Science and Arts occupations in Western Grove are Management (11 | 6.9%), Health Diagnosing & Treating (8 | 5.0%), Health Technologists (5 | 3.1%), Business & Financial (4 | 2.5%), and Community & Social Service (3 | 1.9%).
Management, Business, Science and Arts Occupations by Sex
Within the Management, Business, Science and Arts occupations in Western Grove, the most male-oriented occupations are Business & Financial (100.0%), Computers, Engineering & Science (100.0%), and Life, Physical & Social Science (100.0%), while the most female-oriented occupations are Education, Arts & Media (100.0%), Health Technologists (100.0%), and Health Diagnosing & Treating (87.5%).
| Occupation | Male | Female |
| Management | 7 (63.6%) | 4 (36.4%) |
| Business & Financial | 4 (100.0%) | 0 (0.0%) |
| Computers, Engineering & Science | 1 (100.0%) | 0 (0.0%) |
| Computers & Mathematics | 0 (0.0%) | 0 (0.0%) |
| Architecture & Engineering | 0 (0.0%) | 0 (0.0%) |
| Life, Physical & Social Science | 1 (100.0%) | 0 (0.0%) |
| Community & Social Service | 1 (33.3%) | 2 (66.7%) |
| Education, Arts & Media | 0 (0.0%) | 1 (100.0%) |
| Legal Services & Support | 0 (0.0%) | 0 (0.0%) |
| Education Instruction & Library | 1 (50.0%) | 1 (50.0%) |
| Arts, Media & Entertainment | 0 (0.0%) | 0 (0.0%) |
| Health Diagnosing & Treating | 1 (12.5%) | 7 (87.5%) |
| Health Technologists | 0 (0.0%) | 5 (100.0%) |
| Total (Category) | 14 (51.8%) | 13 (48.1%) |
| Total (Overall) | 71 (44.7%) | 88 (55.3%) |
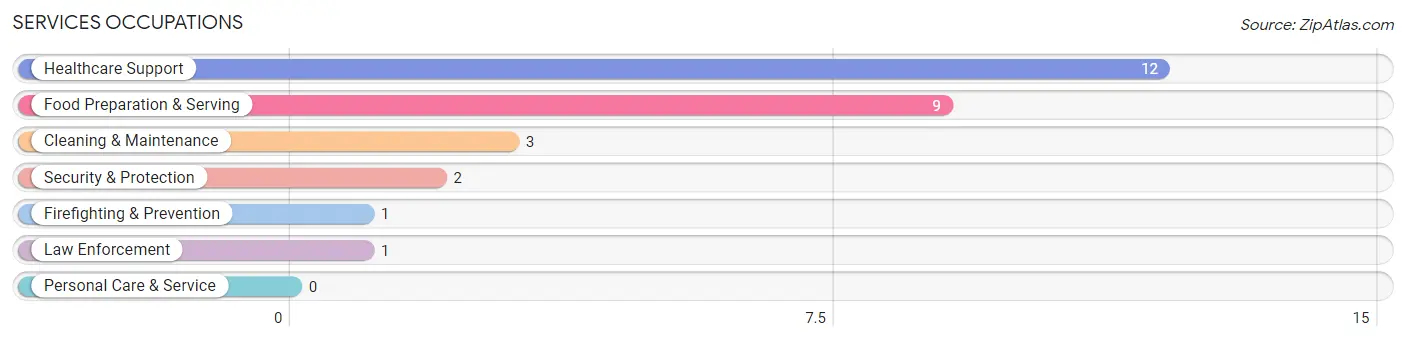
Services Occupations
The most common Services occupations in Western Grove are Healthcare Support (12 | 7.5%), Food Preparation & Serving (9 | 5.7%), Cleaning & Maintenance (3 | 1.9%), Security & Protection (2 | 1.3%), and Firefighting & Prevention (1 | 0.6%).
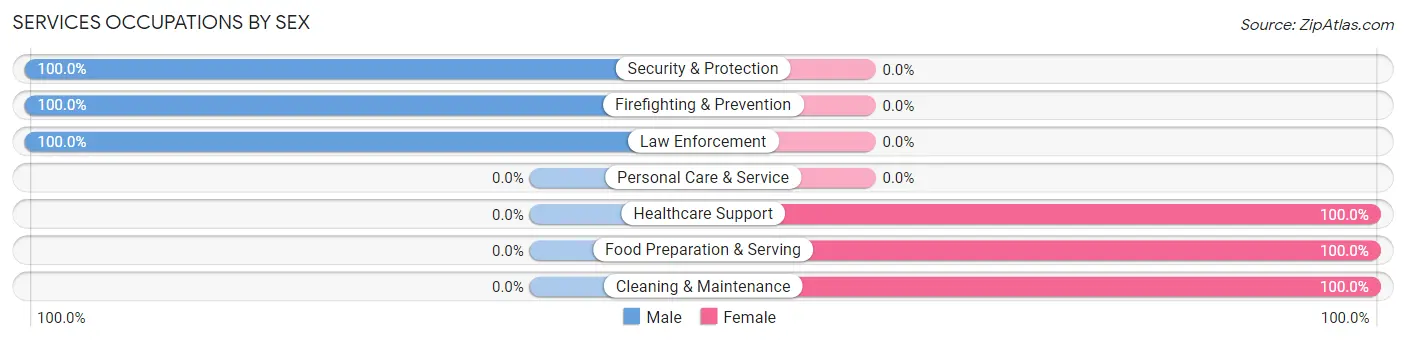
Services Occupations by Sex
Within the Services occupations in Western Grove, the most male-oriented occupations are Security & Protection (100.0%), Firefighting & Prevention (100.0%), and Law Enforcement (100.0%), while the most female-oriented occupations are Healthcare Support (100.0%), Food Preparation & Serving (100.0%), and Cleaning & Maintenance (100.0%).
| Occupation | Male | Female |
| Healthcare Support | 0 (0.0%) | 12 (100.0%) |
| Security & Protection | 2 (100.0%) | 0 (0.0%) |
| Firefighting & Prevention | 1 (100.0%) | 0 (0.0%) |
| Law Enforcement | 1 (100.0%) | 0 (0.0%) |
| Food Preparation & Serving | 0 (0.0%) | 9 (100.0%) |
| Cleaning & Maintenance | 0 (0.0%) | 3 (100.0%) |
| Personal Care & Service | 0 (0.0%) | 0 (0.0%) |
| Total (Category) | 2 (7.7%) | 24 (92.3%) |
| Total (Overall) | 71 (44.7%) | 88 (55.3%) |
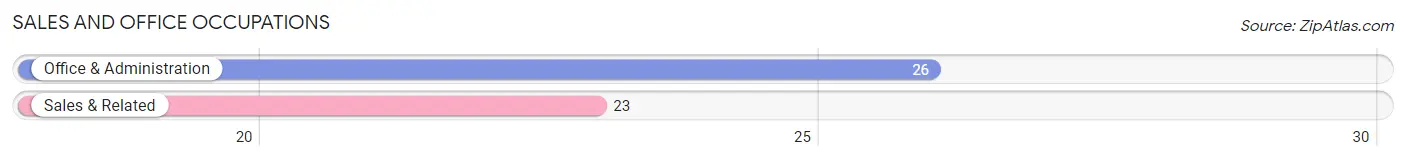
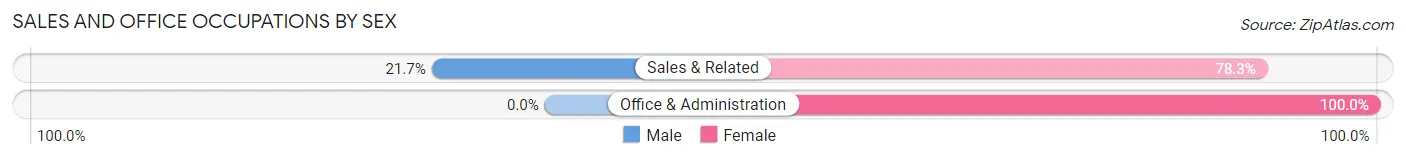
Sales and Office Occupations
The most common Sales and Office occupations in Western Grove are Office & Administration (26 | 16.4%), and Sales & Related (23 | 14.5%).
Sales and Office Occupations by Sex
| Occupation | Male | Female |
| Sales & Related | 5 (21.7%) | 18 (78.3%) |
| Office & Administration | 0 (0.0%) | 26 (100.0%) |
| Total (Category) | 5 (10.2%) | 44 (89.8%) |
| Total (Overall) | 71 (44.7%) | 88 (55.3%) |
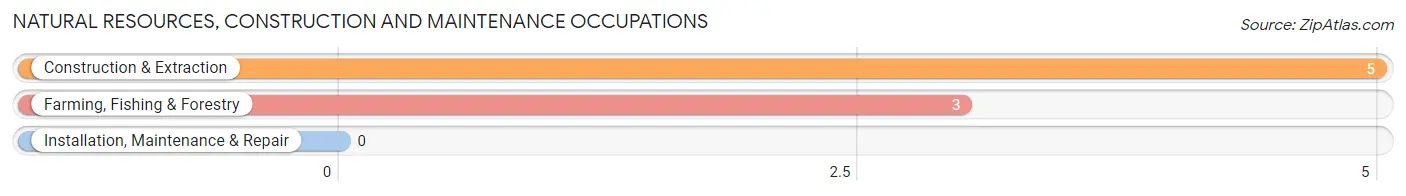
Natural Resources, Construction and Maintenance Occupations
The most common Natural Resources, Construction and Maintenance occupations in Western Grove are Construction & Extraction (5 | 3.1%), and Farming, Fishing & Forestry (3 | 1.9%).
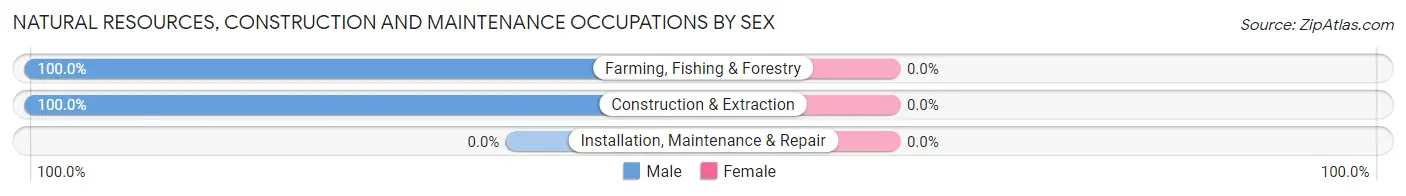
Natural Resources, Construction and Maintenance Occupations by Sex
| Occupation | Male | Female |
| Farming, Fishing & Forestry | 3 (100.0%) | 0 (0.0%) |
| Construction & Extraction | 5 (100.0%) | 0 (0.0%) |
| Installation, Maintenance & Repair | 0 (0.0%) | 0 (0.0%) |
| Total (Category) | 8 (100.0%) | 0 (0.0%) |
| Total (Overall) | 71 (44.7%) | 88 (55.3%) |
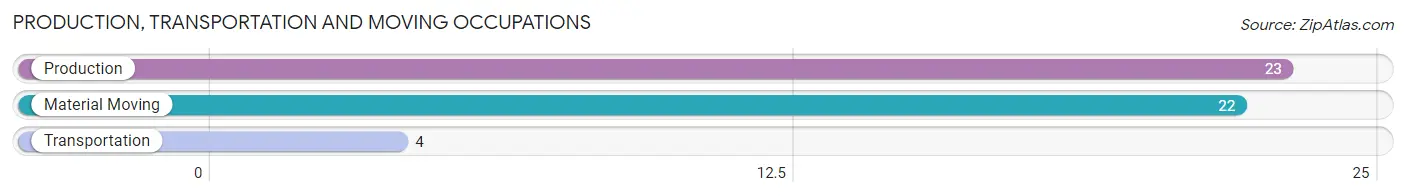
Production, Transportation and Moving Occupations
The most common Production, Transportation and Moving occupations in Western Grove are Production (23 | 14.5%), Material Moving (22 | 13.8%), and Transportation (4 | 2.5%).
Production, Transportation and Moving Occupations by Sex
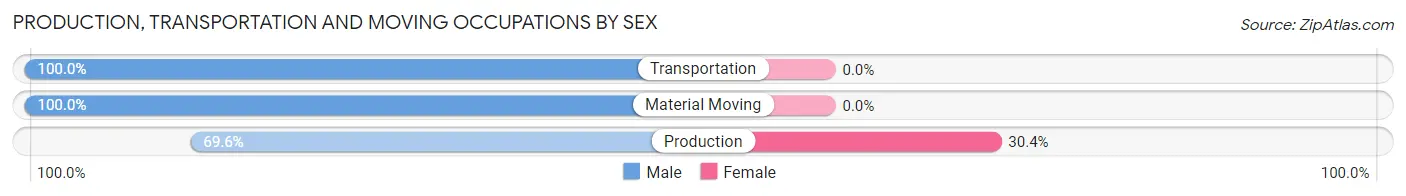
| Occupation | Male | Female |
| Production | 16 (69.6%) | 7 (30.4%) |
| Transportation | 4 (100.0%) | 0 (0.0%) |
| Material Moving | 22 (100.0%) | 0 (0.0%) |
| Total (Category) | 42 (85.7%) | 7 (14.3%) |
| Total (Overall) | 71 (44.7%) | 88 (55.3%) |
Employment Industries by Sex in Western Grove
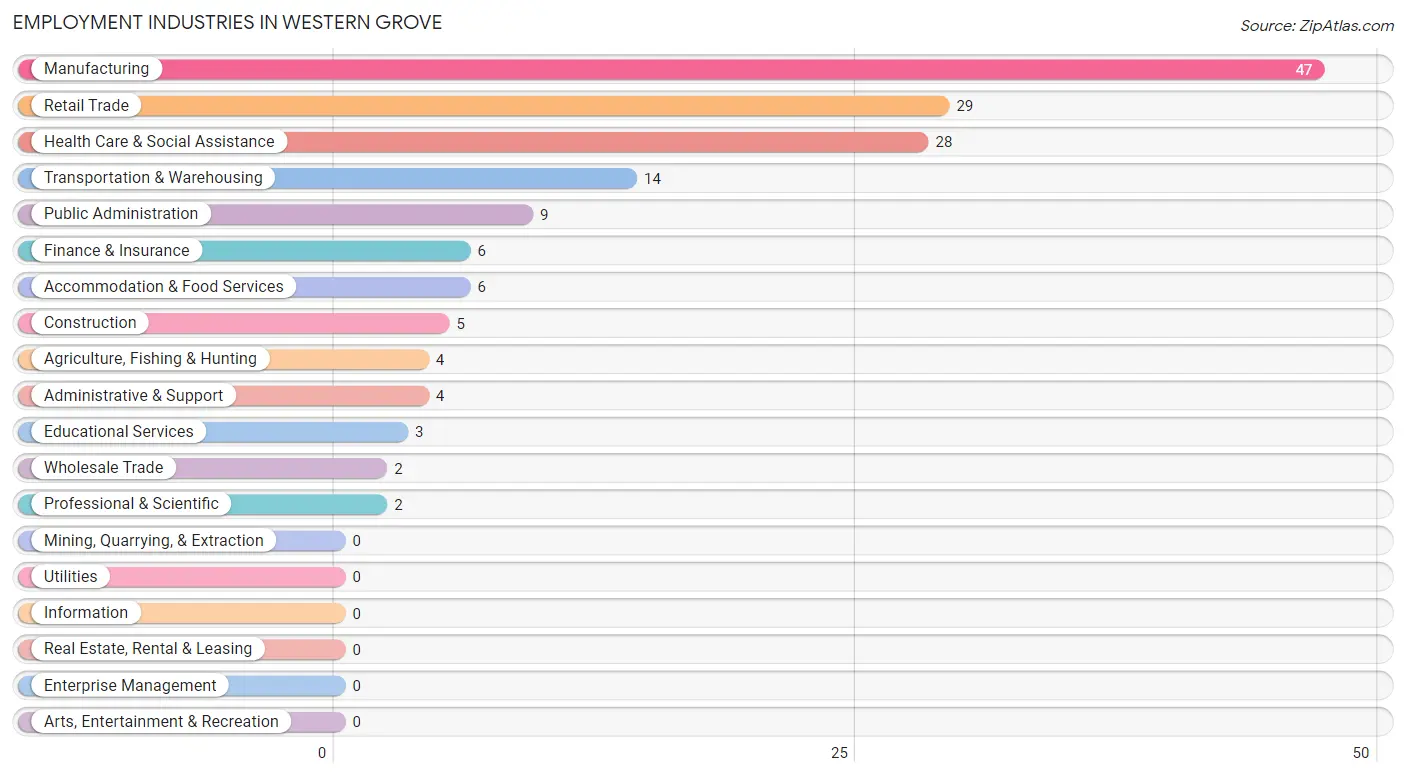
Employment Industries in Western Grove
The major employment industries in Western Grove include Manufacturing (47 | 29.6%), Retail Trade (29 | 18.2%), Health Care & Social Assistance (28 | 17.6%), Transportation & Warehousing (14 | 8.8%), and Public Administration (9 | 5.7%).
Employment Industries by Sex in Western Grove
The Western Grove industries that see more men than women are Agriculture, Fishing & Hunting (100.0%), Construction (100.0%), and Wholesale Trade (100.0%), whereas the industries that tend to have a higher number of women are Finance & Insurance (100.0%), Professional & Scientific (100.0%), and Administrative & Support (100.0%).
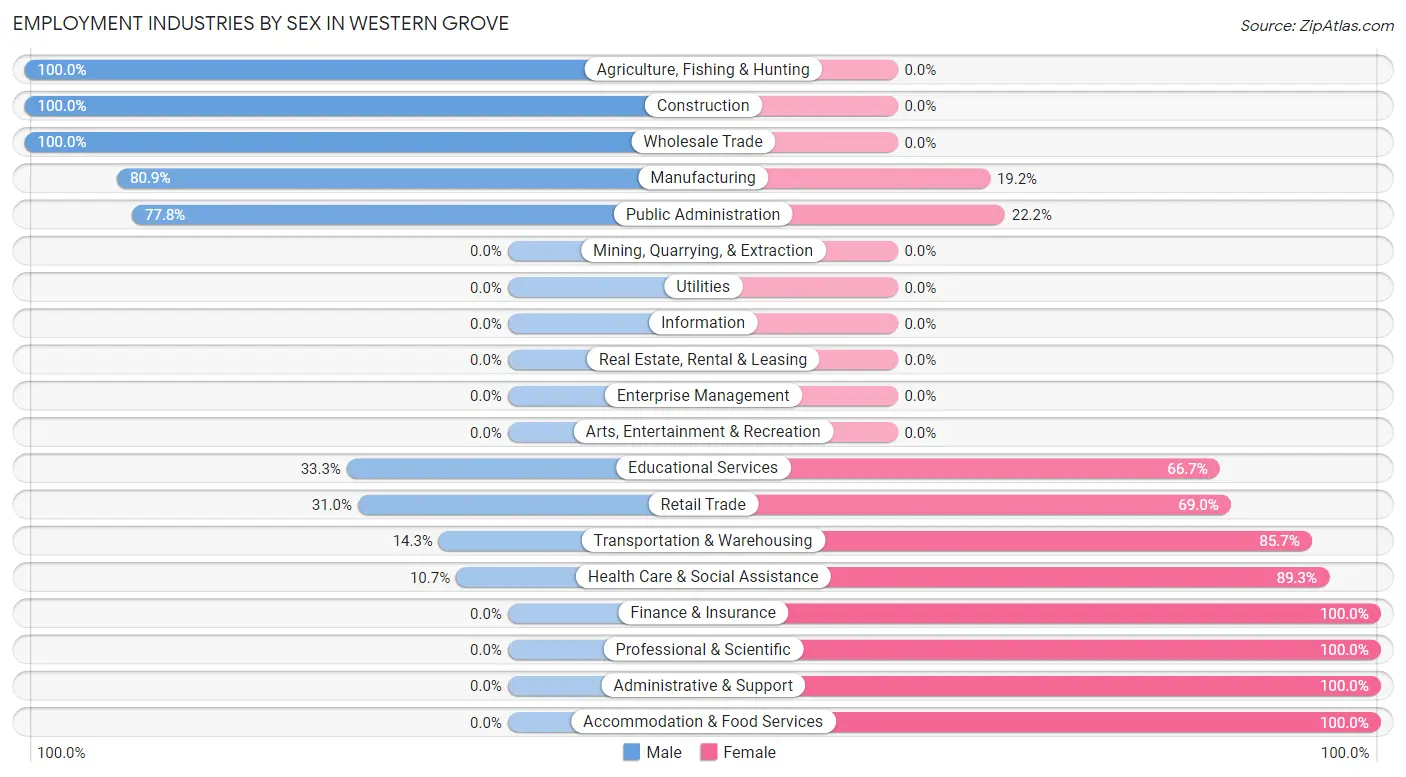
| Industry | Male | Female |
| Agriculture, Fishing & Hunting | 4 (100.0%) | 0 (0.0%) |
| Mining, Quarrying, & Extraction | 0 (0.0%) | 0 (0.0%) |
| Construction | 5 (100.0%) | 0 (0.0%) |
| Manufacturing | 38 (80.8%) | 9 (19.2%) |
| Wholesale Trade | 2 (100.0%) | 0 (0.0%) |
| Retail Trade | 9 (31.0%) | 20 (69.0%) |
| Transportation & Warehousing | 2 (14.3%) | 12 (85.7%) |
| Utilities | 0 (0.0%) | 0 (0.0%) |
| Information | 0 (0.0%) | 0 (0.0%) |
| Finance & Insurance | 0 (0.0%) | 6 (100.0%) |
| Real Estate, Rental & Leasing | 0 (0.0%) | 0 (0.0%) |
| Professional & Scientific | 0 (0.0%) | 2 (100.0%) |
| Enterprise Management | 0 (0.0%) | 0 (0.0%) |
| Administrative & Support | 0 (0.0%) | 4 (100.0%) |
| Educational Services | 1 (33.3%) | 2 (66.7%) |
| Health Care & Social Assistance | 3 (10.7%) | 25 (89.3%) |
| Arts, Entertainment & Recreation | 0 (0.0%) | 0 (0.0%) |
| Accommodation & Food Services | 0 (0.0%) | 6 (100.0%) |
| Public Administration | 7 (77.8%) | 2 (22.2%) |
| Total | 71 (44.7%) | 88 (55.3%) |
Education in Western Grove
School Enrollment in Western Grove
The most common levels of schooling among the 122 students in Western Grove are high school (45 | 36.9%), middle school (40 | 32.8%), and college / undergraduate (19 | 15.6%).
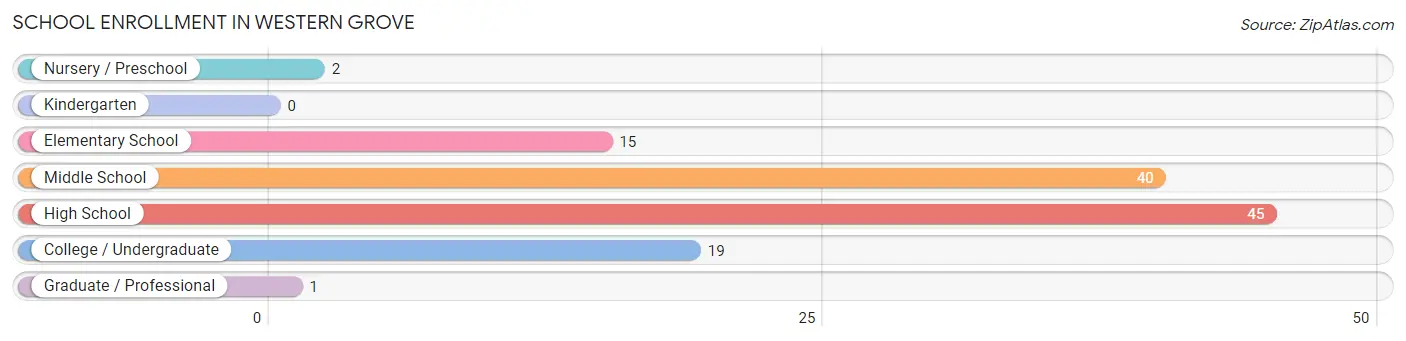
| School Level | # Students | % Students |
| Nursery / Preschool | 2 | 1.6% |
| Kindergarten | 0 | 0.0% |
| Elementary School | 15 | 12.3% |
| Middle School | 40 | 32.8% |
| High School | 45 | 36.9% |
| College / Undergraduate | 19 | 15.6% |
| Graduate / Professional | 1 | 0.8% |
| Total | 122 | 100.0% |
School Enrollment by Age by Funding Source in Western Grove
Out of a total of 122 students who are enrolled in schools in Western Grove, 16 (13.1%) attend a private institution, while the remaining 106 (86.9%) are enrolled in public schools. The age group of 35 years and over has the highest likelihood of being enrolled in private schools, with 3 (100.0% in the age bracket) enrolled. Conversely, the age group of 5 to 9 year old has the lowest likelihood of being enrolled in a private school, with 14 (100.0% in the age bracket) attending a public institution.
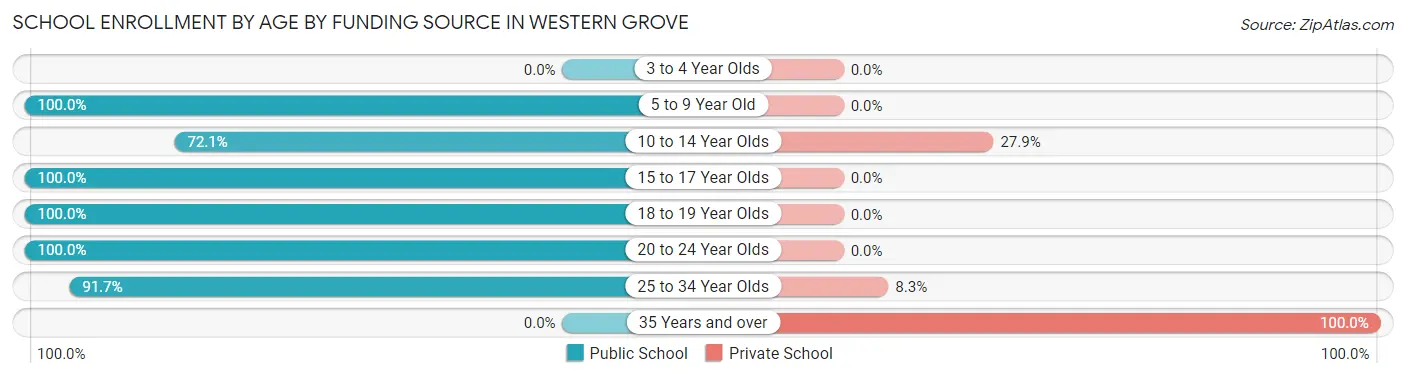
| Age Bracket | Public School | Private School |
| 3 to 4 Year Olds | 0 (0.0%) | 0 (0.0%) |
| 5 to 9 Year Old | 14 (100.0%) | 0 (0.0%) |
| 10 to 14 Year Olds | 31 (72.1%) | 12 (27.9%) |
| 15 to 17 Year Olds | 43 (100.0%) | 0 (0.0%) |
| 18 to 19 Year Olds | 2 (100.0%) | 0 (0.0%) |
| 20 to 24 Year Olds | 5 (100.0%) | 0 (0.0%) |
| 25 to 34 Year Olds | 11 (91.7%) | 1 (8.3%) |
| 35 Years and over | 0 (0.0%) | 3 (100.0%) |
| Total | 106 (86.9%) | 16 (13.1%) |
Educational Attainment by Field of Study in Western Grove
Business (16 | 53.3%), science & technology (6 | 20.0%), psychology (3 | 10.0%), education (3 | 10.0%), and computers & mathematics (1 | 3.3%) are the most common fields of study among 30 individuals in Western Grove who have obtained a bachelor's degree or higher.
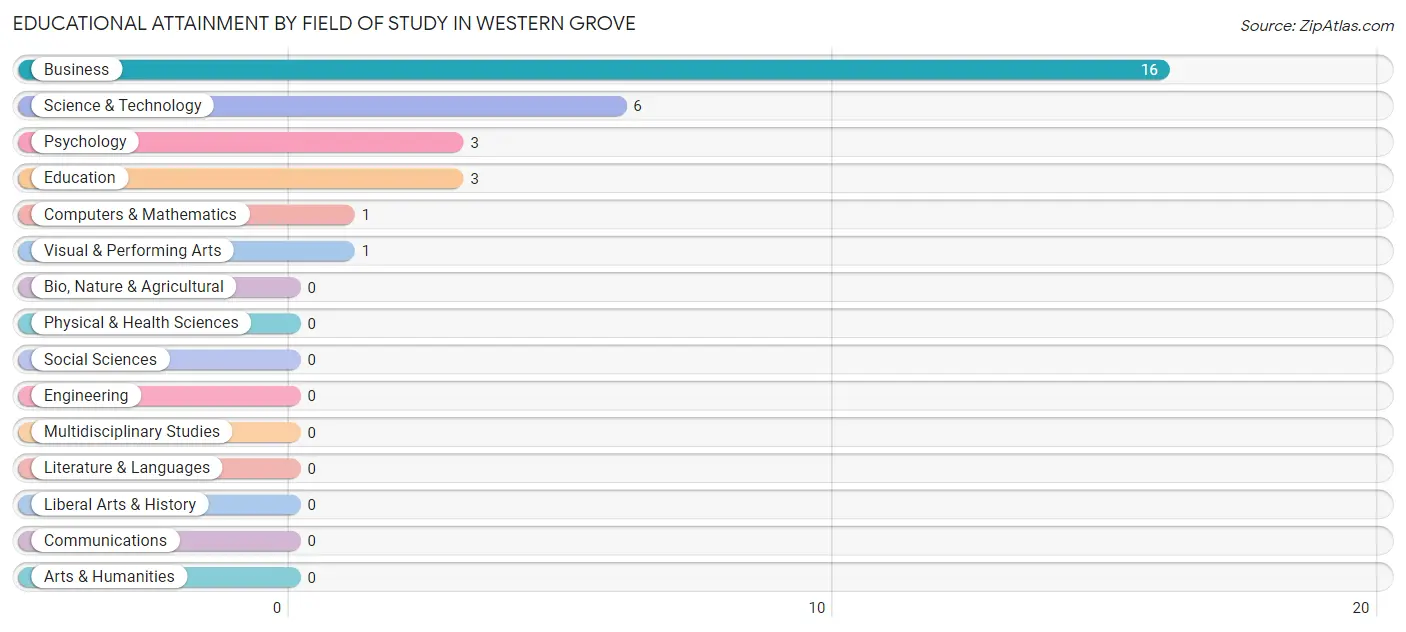
| Field of Study | # Graduates | % Graduates |
| Computers & Mathematics | 1 | 3.3% |
| Bio, Nature & Agricultural | 0 | 0.0% |
| Physical & Health Sciences | 0 | 0.0% |
| Psychology | 3 | 10.0% |
| Social Sciences | 0 | 0.0% |
| Engineering | 0 | 0.0% |
| Multidisciplinary Studies | 0 | 0.0% |
| Science & Technology | 6 | 20.0% |
| Business | 16 | 53.3% |
| Education | 3 | 10.0% |
| Literature & Languages | 0 | 0.0% |
| Liberal Arts & History | 0 | 0.0% |
| Visual & Performing Arts | 1 | 3.3% |
| Communications | 0 | 0.0% |
| Arts & Humanities | 0 | 0.0% |
| Total | 30 | 100.0% |
Transportation & Commute in Western Grove
Vehicle Availability by Sex in Western Grove
The most prevalent vehicle ownership categories in Western Grove are males with 4 vehicles (32, accounting for 38.6%) and females with 4 vehicles (8, making up 38.1%).
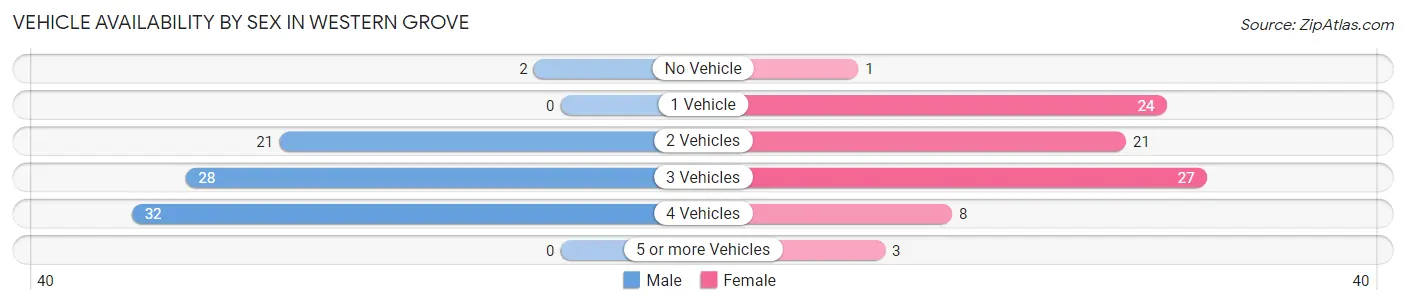
| Vehicles Available | Male | Female |
| No Vehicle | 2 (2.4%) | 1 (1.2%) |
| 1 Vehicle | 0 (0.0%) | 24 (28.6%) |
| 2 Vehicles | 21 (25.3%) | 21 (25.0%) |
| 3 Vehicles | 28 (33.7%) | 27 (32.1%) |
| 4 Vehicles | 32 (38.6%) | 8 (9.5%) |
| 5 or more Vehicles | 0 (0.0%) | 3 (3.6%) |
| Total | 83 (100.0%) | 84 (100.0%) |
Commute Time in Western Grove
The most frequently occuring commute durations in Western Grove are 20 to 24 minutes (47 commuters, 29.4%), 25 to 29 minutes (38 commuters, 23.7%), and 30 to 34 minutes (22 commuters, 13.8%).
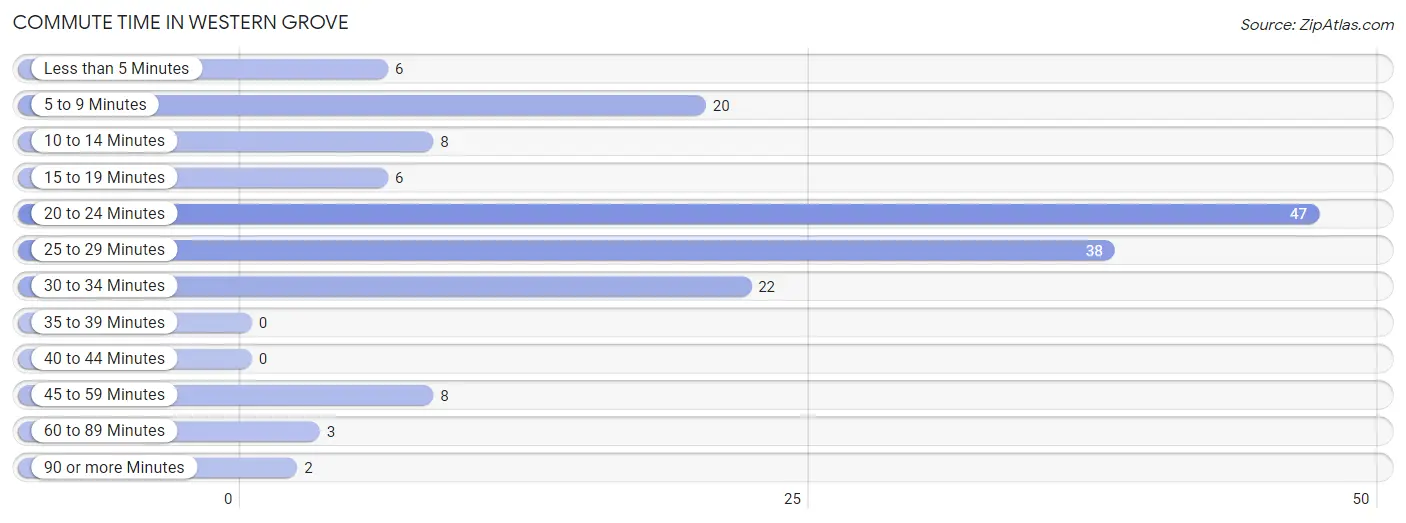
| Commute Time | # Commuters | % Commuters |
| Less than 5 Minutes | 6 | 3.7% |
| 5 to 9 Minutes | 20 | 12.5% |
| 10 to 14 Minutes | 8 | 5.0% |
| 15 to 19 Minutes | 6 | 3.7% |
| 20 to 24 Minutes | 47 | 29.4% |
| 25 to 29 Minutes | 38 | 23.7% |
| 30 to 34 Minutes | 22 | 13.8% |
| 35 to 39 Minutes | 0 | 0.0% |
| 40 to 44 Minutes | 0 | 0.0% |
| 45 to 59 Minutes | 8 | 5.0% |
| 60 to 89 Minutes | 3 | 1.9% |
| 90 or more Minutes | 2 | 1.3% |
Commute Time by Sex in Western Grove
The most common commute times in Western Grove are 20 to 24 minutes (39 commuters, 47.0%) for males and 25 to 29 minutes (26 commuters, 33.8%) for females.
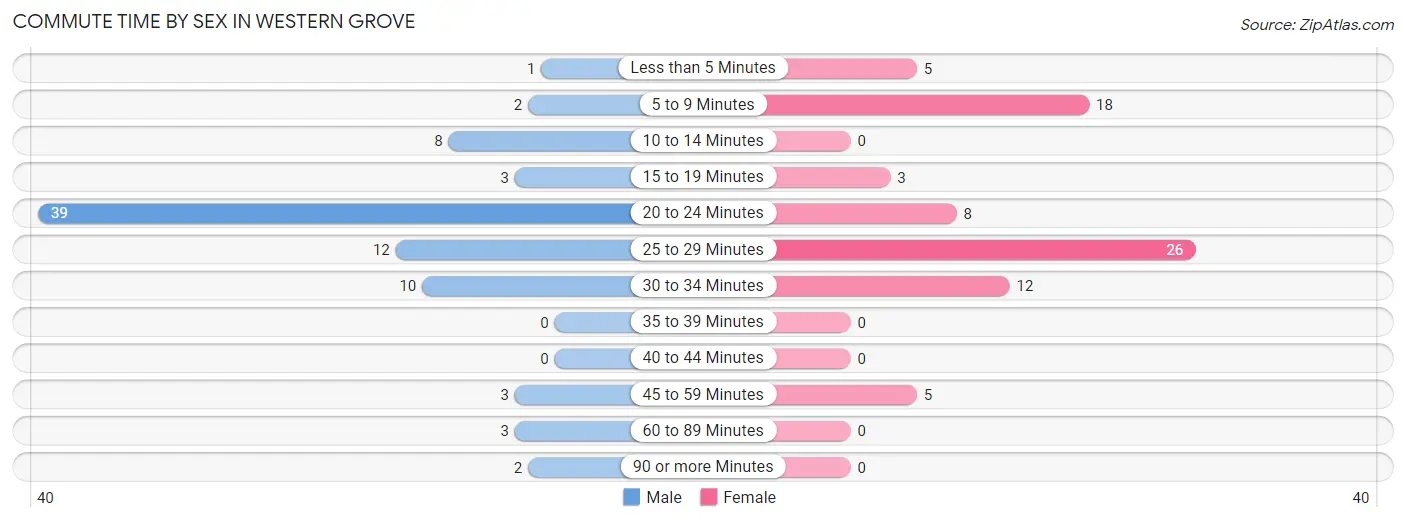
| Commute Time | Male | Female |
| Less than 5 Minutes | 1 (1.2%) | 5 (6.5%) |
| 5 to 9 Minutes | 2 (2.4%) | 18 (23.4%) |
| 10 to 14 Minutes | 8 (9.6%) | 0 (0.0%) |
| 15 to 19 Minutes | 3 (3.6%) | 3 (3.9%) |
| 20 to 24 Minutes | 39 (47.0%) | 8 (10.4%) |
| 25 to 29 Minutes | 12 (14.5%) | 26 (33.8%) |
| 30 to 34 Minutes | 10 (12.0%) | 12 (15.6%) |
| 35 to 39 Minutes | 0 (0.0%) | 0 (0.0%) |
| 40 to 44 Minutes | 0 (0.0%) | 0 (0.0%) |
| 45 to 59 Minutes | 3 (3.6%) | 5 (6.5%) |
| 60 to 89 Minutes | 3 (3.6%) | 0 (0.0%) |
| 90 or more Minutes | 2 (2.4%) | 0 (0.0%) |
Time of Departure to Work by Sex in Western Grove
The most frequent times of departure to work in Western Grove are 5:30 AM to 5:59 AM (18, 21.7%) for males and 6:00 AM to 6:29 AM (22, 28.6%) for females.
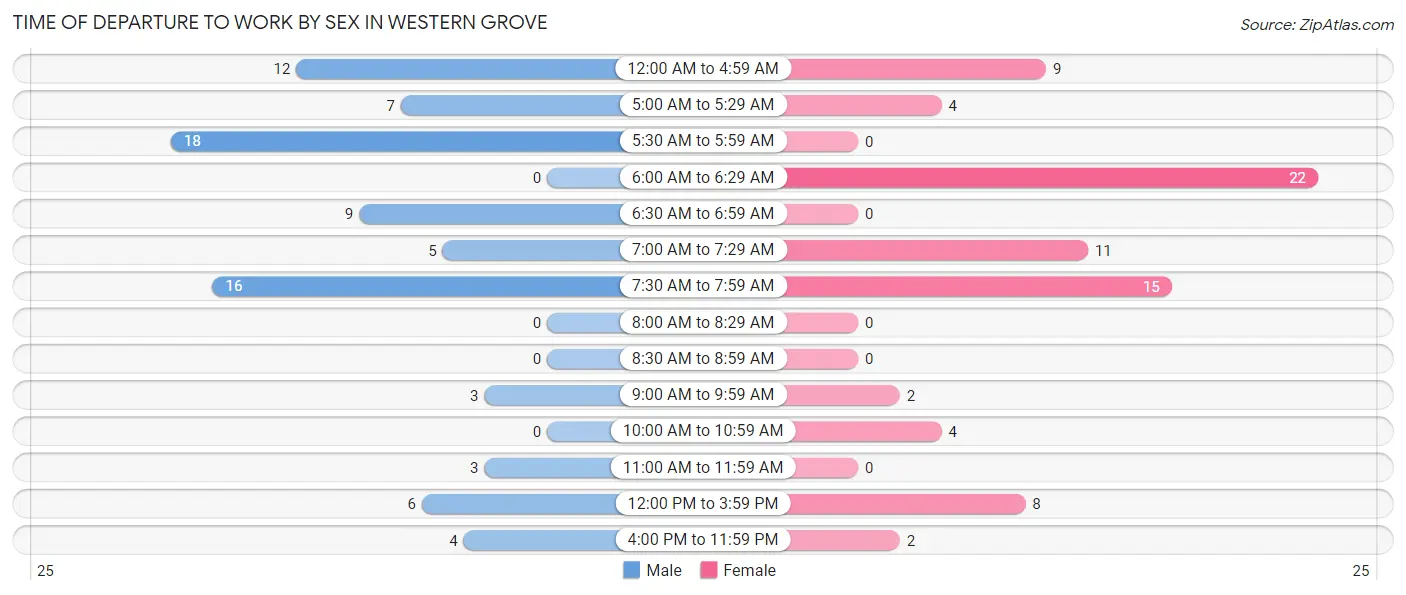
| Time of Departure | Male | Female |
| 12:00 AM to 4:59 AM | 12 (14.5%) | 9 (11.7%) |
| 5:00 AM to 5:29 AM | 7 (8.4%) | 4 (5.2%) |
| 5:30 AM to 5:59 AM | 18 (21.7%) | 0 (0.0%) |
| 6:00 AM to 6:29 AM | 0 (0.0%) | 22 (28.6%) |
| 6:30 AM to 6:59 AM | 9 (10.8%) | 0 (0.0%) |
| 7:00 AM to 7:29 AM | 5 (6.0%) | 11 (14.3%) |
| 7:30 AM to 7:59 AM | 16 (19.3%) | 15 (19.5%) |
| 8:00 AM to 8:29 AM | 0 (0.0%) | 0 (0.0%) |
| 8:30 AM to 8:59 AM | 0 (0.0%) | 0 (0.0%) |
| 9:00 AM to 9:59 AM | 3 (3.6%) | 2 (2.6%) |
| 10:00 AM to 10:59 AM | 0 (0.0%) | 4 (5.2%) |
| 11:00 AM to 11:59 AM | 3 (3.6%) | 0 (0.0%) |
| 12:00 PM to 3:59 PM | 6 (7.2%) | 8 (10.4%) |
| 4:00 PM to 11:59 PM | 4 (4.8%) | 2 (2.6%) |
| Total | 83 (100.0%) | 77 (100.0%) |
Housing Occupancy in Western Grove
Occupancy by Ownership in Western Grove
Of the total 153 dwellings in Western Grove, owner-occupied units account for 101 (66.0%), while renter-occupied units make up 52 (34.0%).
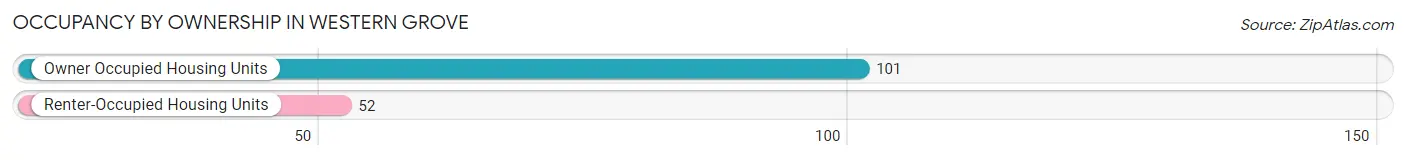
| Occupancy | # Housing Units | % Housing Units |
| Owner Occupied Housing Units | 101 | 66.0% |
| Renter-Occupied Housing Units | 52 | 34.0% |
| Total Occupied Housing Units | 153 | 100.0% |
Occupancy by Household Size in Western Grove
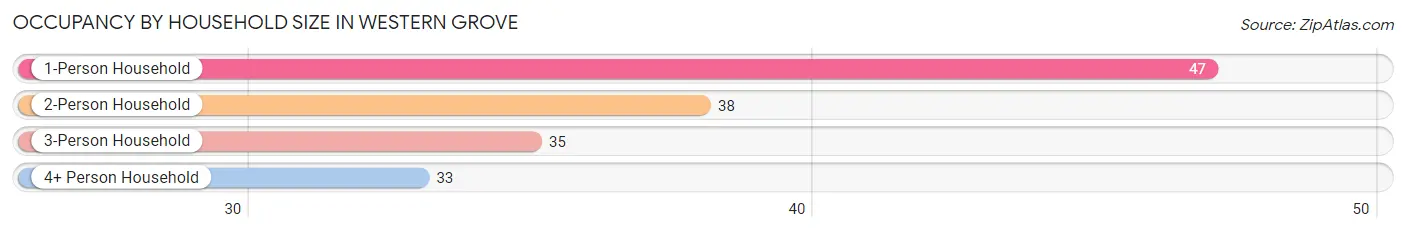
| Household Size | # Housing Units | % Housing Units |
| 1-Person Household | 47 | 30.7% |
| 2-Person Household | 38 | 24.8% |
| 3-Person Household | 35 | 22.9% |
| 4+ Person Household | 33 | 21.6% |
| Total Housing Units | 153 | 100.0% |
Occupancy by Ownership by Household Size in Western Grove
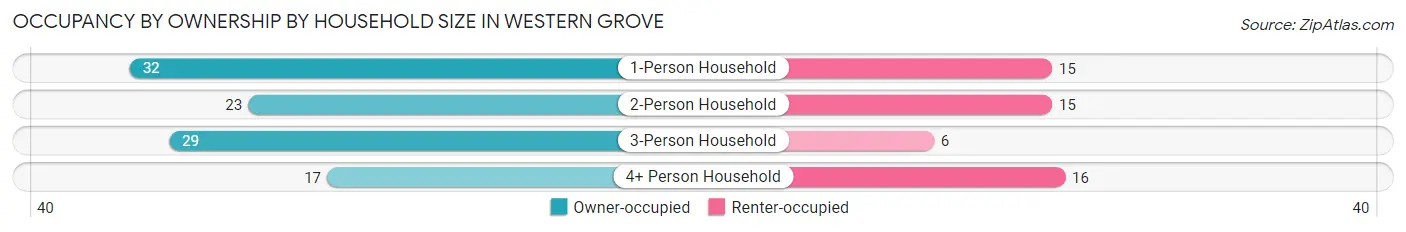
| Household Size | Owner-occupied | Renter-occupied |
| 1-Person Household | 32 (68.1%) | 15 (31.9%) |
| 2-Person Household | 23 (60.5%) | 15 (39.5%) |
| 3-Person Household | 29 (82.9%) | 6 (17.1%) |
| 4+ Person Household | 17 (51.5%) | 16 (48.5%) |
| Total Housing Units | 101 (66.0%) | 52 (34.0%) |
Occupancy by Educational Attainment in Western Grove
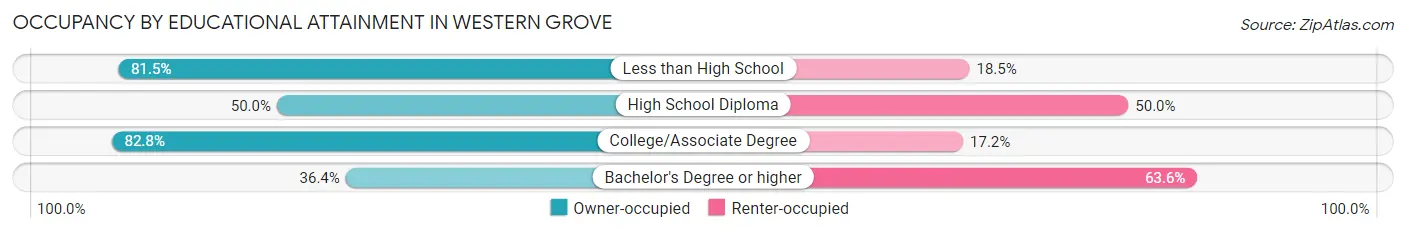
| Household Size | Owner-occupied | Renter-occupied |
| Less than High School | 22 (81.5%) | 5 (18.5%) |
| High School Diploma | 23 (50.0%) | 23 (50.0%) |
| College/Associate Degree | 48 (82.8%) | 10 (17.2%) |
| Bachelor's Degree or higher | 8 (36.4%) | 14 (63.6%) |
Occupancy by Age of Householder in Western Grove
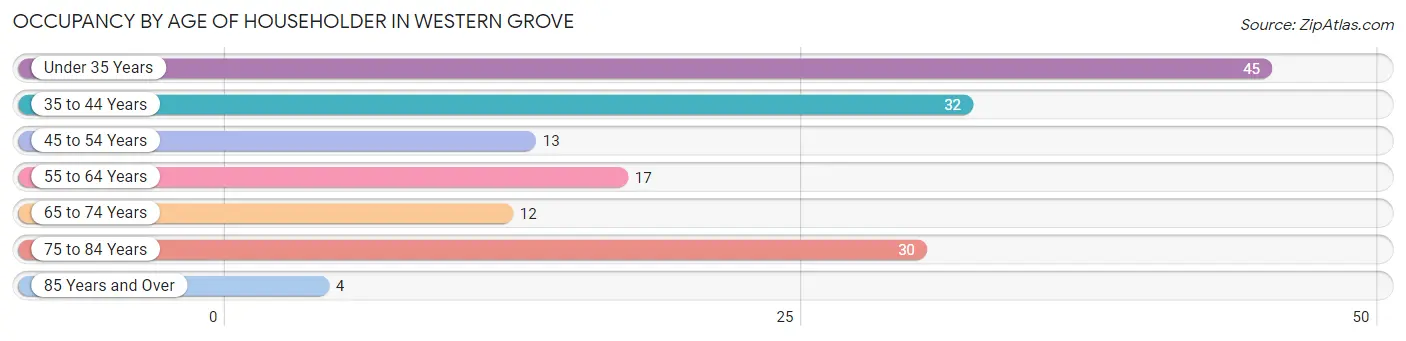
| Age Bracket | # Households | % Households |
| Under 35 Years | 45 | 29.4% |
| 35 to 44 Years | 32 | 20.9% |
| 45 to 54 Years | 13 | 8.5% |
| 55 to 64 Years | 17 | 11.1% |
| 65 to 74 Years | 12 | 7.8% |
| 75 to 84 Years | 30 | 19.6% |
| 85 Years and Over | 4 | 2.6% |
| Total | 153 | 100.0% |
Housing Finances in Western Grove
Median Income by Occupancy in Western Grove
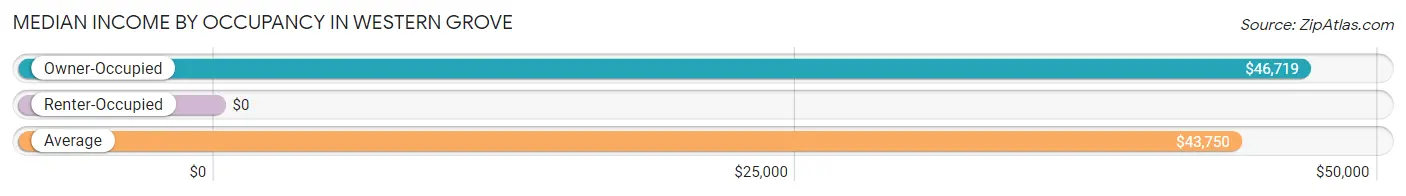
| Occupancy Type | # Households | Median Income |
| Owner-Occupied | 101 (66.0%) | $46,719 |
| Renter-Occupied | 52 (34.0%) | $0 |
| Average | 153 (100.0%) | $43,750 |
Occupancy by Householder Income Bracket in Western Grove
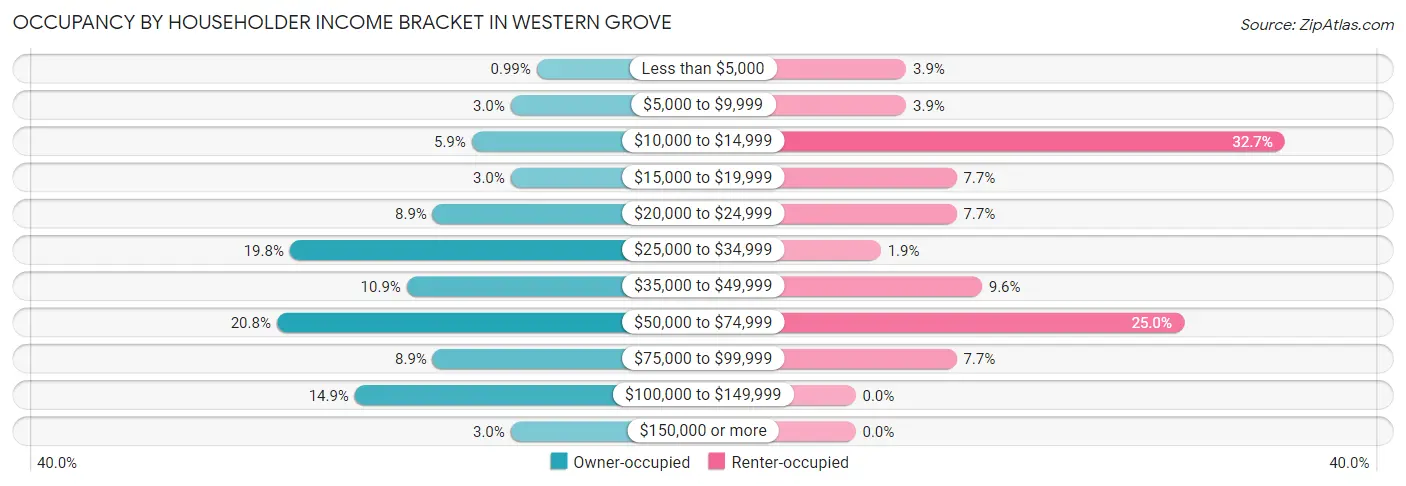
| Income Bracket | Owner-occupied | Renter-occupied |
| Less than $5,000 | 1 (1.0%) | 2 (3.8%) |
| $5,000 to $9,999 | 3 (3.0%) | 2 (3.8%) |
| $10,000 to $14,999 | 6 (5.9%) | 17 (32.7%) |
| $15,000 to $19,999 | 3 (3.0%) | 4 (7.7%) |
| $20,000 to $24,999 | 9 (8.9%) | 4 (7.7%) |
| $25,000 to $34,999 | 20 (19.8%) | 1 (1.9%) |
| $35,000 to $49,999 | 11 (10.9%) | 5 (9.6%) |
| $50,000 to $74,999 | 21 (20.8%) | 13 (25.0%) |
| $75,000 to $99,999 | 9 (8.9%) | 4 (7.7%) |
| $100,000 to $149,999 | 15 (14.8%) | 0 (0.0%) |
| $150,000 or more | 3 (3.0%) | 0 (0.0%) |
| Total | 101 (100.0%) | 52 (100.0%) |
Monthly Housing Cost Tiers in Western Grove
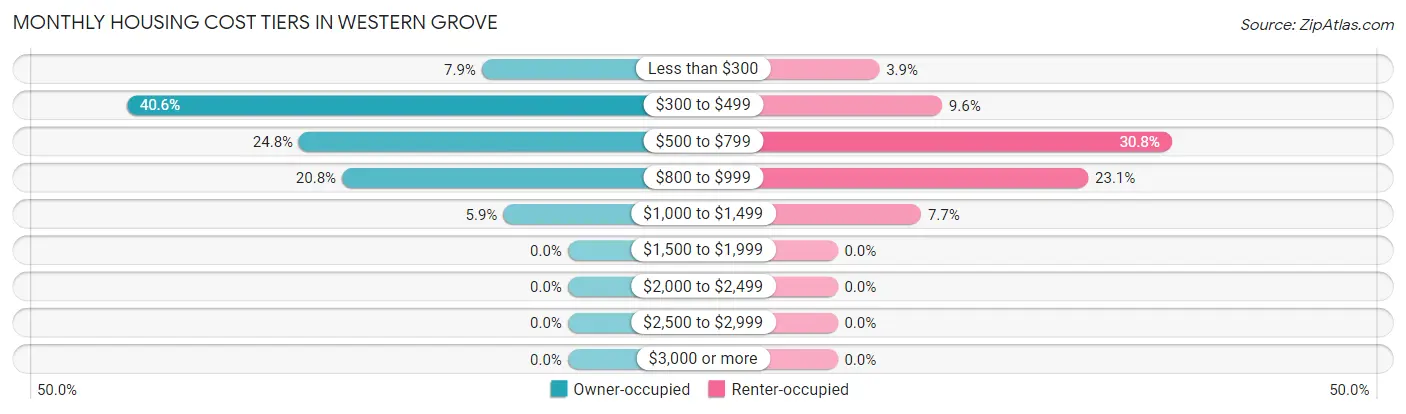
| Monthly Cost | Owner-occupied | Renter-occupied |
| Less than $300 | 8 (7.9%) | 2 (3.8%) |
| $300 to $499 | 41 (40.6%) | 5 (9.6%) |
| $500 to $799 | 25 (24.7%) | 16 (30.8%) |
| $800 to $999 | 21 (20.8%) | 12 (23.1%) |
| $1,000 to $1,499 | 6 (5.9%) | 4 (7.7%) |
| $1,500 to $1,999 | 0 (0.0%) | 0 (0.0%) |
| $2,000 to $2,499 | 0 (0.0%) | 0 (0.0%) |
| $2,500 to $2,999 | 0 (0.0%) | 0 (0.0%) |
| $3,000 or more | 0 (0.0%) | 0 (0.0%) |
| Total | 101 (100.0%) | 52 (100.0%) |
Physical Housing Characteristics in Western Grove
Housing Structures in Western Grove
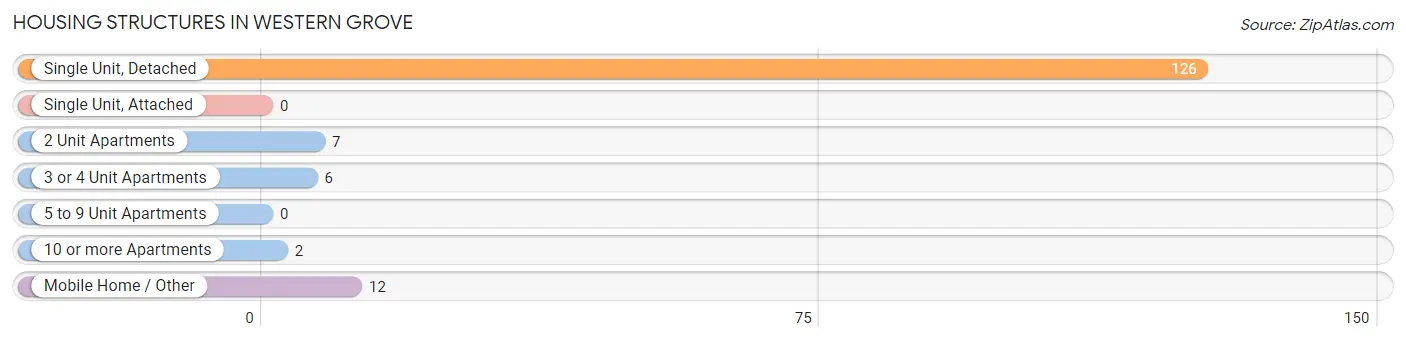
| Structure Type | # Housing Units | % Housing Units |
| Single Unit, Detached | 126 | 82.4% |
| Single Unit, Attached | 0 | 0.0% |
| 2 Unit Apartments | 7 | 4.6% |
| 3 or 4 Unit Apartments | 6 | 3.9% |
| 5 to 9 Unit Apartments | 0 | 0.0% |
| 10 or more Apartments | 2 | 1.3% |
| Mobile Home / Other | 12 | 7.8% |
| Total | 153 | 100.0% |
Housing Structures by Occupancy in Western Grove
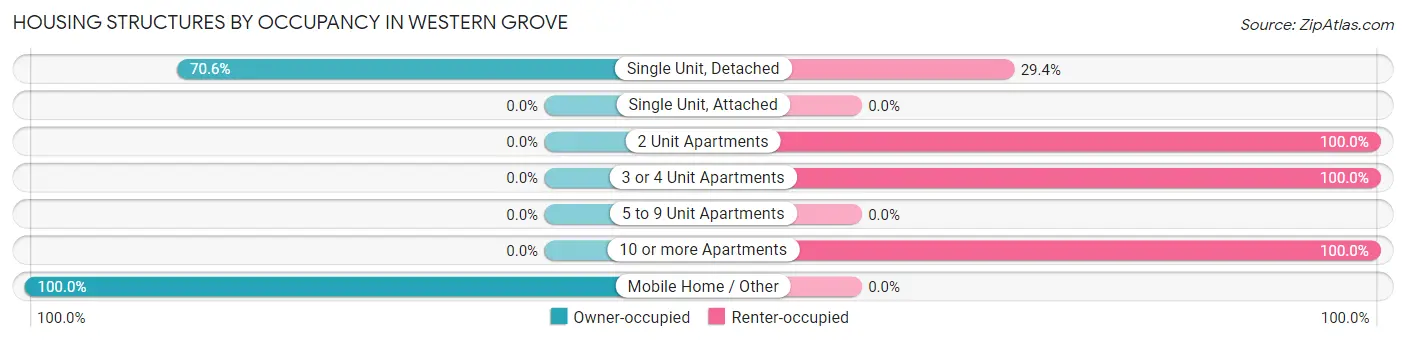
| Structure Type | Owner-occupied | Renter-occupied |
| Single Unit, Detached | 89 (70.6%) | 37 (29.4%) |
| Single Unit, Attached | 0 (0.0%) | 0 (0.0%) |
| 2 Unit Apartments | 0 (0.0%) | 7 (100.0%) |
| 3 or 4 Unit Apartments | 0 (0.0%) | 6 (100.0%) |
| 5 to 9 Unit Apartments | 0 (0.0%) | 0 (0.0%) |
| 10 or more Apartments | 0 (0.0%) | 2 (100.0%) |
| Mobile Home / Other | 12 (100.0%) | 0 (0.0%) |
| Total | 101 (66.0%) | 52 (34.0%) |
Housing Structures by Number of Rooms in Western Grove
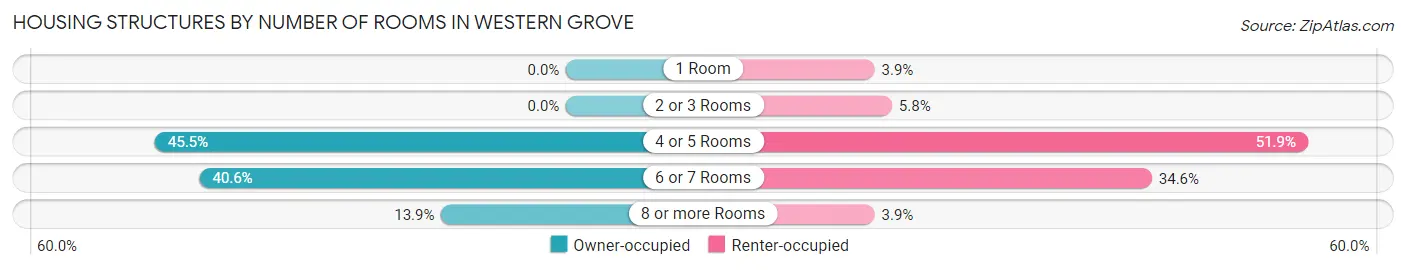
| Number of Rooms | Owner-occupied | Renter-occupied |
| 1 Room | 0 (0.0%) | 2 (3.8%) |
| 2 or 3 Rooms | 0 (0.0%) | 3 (5.8%) |
| 4 or 5 Rooms | 46 (45.5%) | 27 (51.9%) |
| 6 or 7 Rooms | 41 (40.6%) | 18 (34.6%) |
| 8 or more Rooms | 14 (13.9%) | 2 (3.8%) |
| Total | 101 (100.0%) | 52 (100.0%) |
Housing Structure by Heating Type in Western Grove
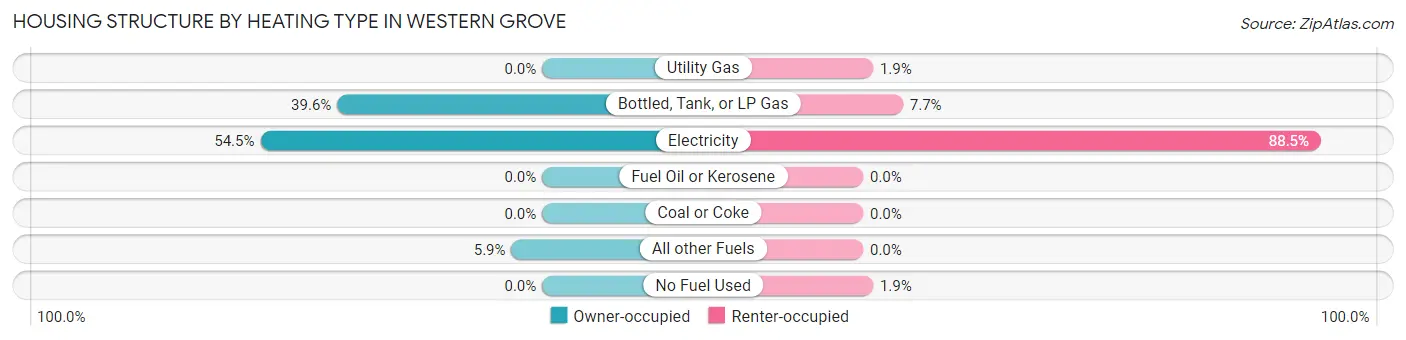
| Heating Type | Owner-occupied | Renter-occupied |
| Utility Gas | 0 (0.0%) | 1 (1.9%) |
| Bottled, Tank, or LP Gas | 40 (39.6%) | 4 (7.7%) |
| Electricity | 55 (54.5%) | 46 (88.5%) |
| Fuel Oil or Kerosene | 0 (0.0%) | 0 (0.0%) |
| Coal or Coke | 0 (0.0%) | 0 (0.0%) |
| All other Fuels | 6 (5.9%) | 0 (0.0%) |
| No Fuel Used | 0 (0.0%) | 1 (1.9%) |
| Total | 101 (100.0%) | 52 (100.0%) |
Household Vehicle Usage in Western Grove
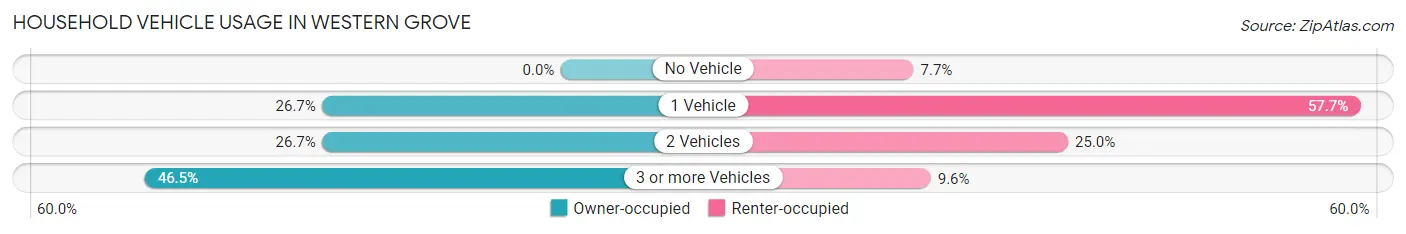
| Vehicles per Household | Owner-occupied | Renter-occupied |
| No Vehicle | 0 (0.0%) | 4 (7.7%) |
| 1 Vehicle | 27 (26.7%) | 30 (57.7%) |
| 2 Vehicles | 27 (26.7%) | 13 (25.0%) |
| 3 or more Vehicles | 47 (46.5%) | 5 (9.6%) |
| Total | 101 (100.0%) | 52 (100.0%) |
Real Estate & Mortgages in Western Grove
Real Estate and Mortgage Overview in Western Grove
| Characteristic | Without Mortgage | With Mortgage |
| Housing Units | 64 | 37 |
| Median Property Value | $137,500 | $105,700 |
| Median Household Income | $34,545 | $3 |
| Monthly Housing Costs | $432 | $0 |
| Real Estate Taxes | $494 | $1 |
Property Value by Mortgage Status in Western Grove
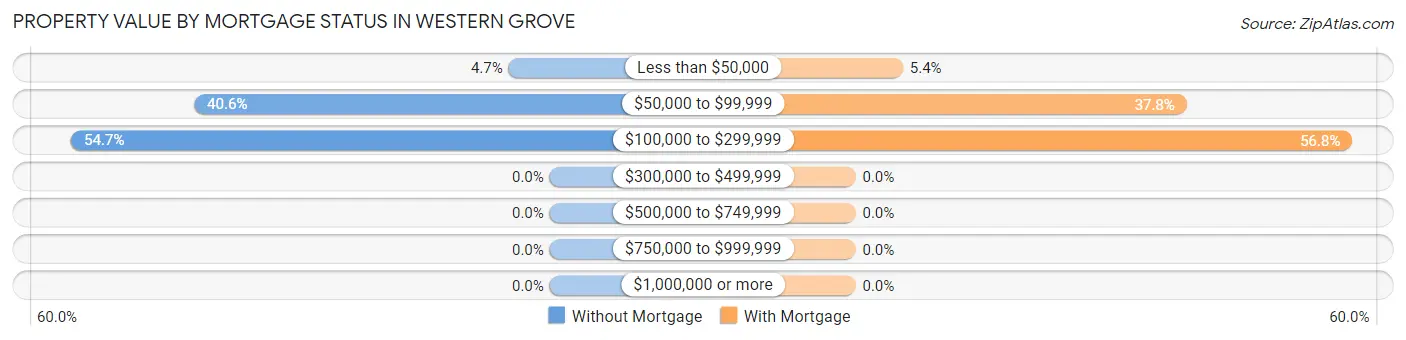
| Property Value | Without Mortgage | With Mortgage |
| Less than $50,000 | 3 (4.7%) | 2 (5.4%) |
| $50,000 to $99,999 | 26 (40.6%) | 14 (37.8%) |
| $100,000 to $299,999 | 35 (54.7%) | 21 (56.8%) |
| $300,000 to $499,999 | 0 (0.0%) | 0 (0.0%) |
| $500,000 to $749,999 | 0 (0.0%) | 0 (0.0%) |
| $750,000 to $999,999 | 0 (0.0%) | 0 (0.0%) |
| $1,000,000 or more | 0 (0.0%) | 0 (0.0%) |
| Total | 64 (100.0%) | 37 (100.0%) |
Household Income by Mortgage Status in Western Grove
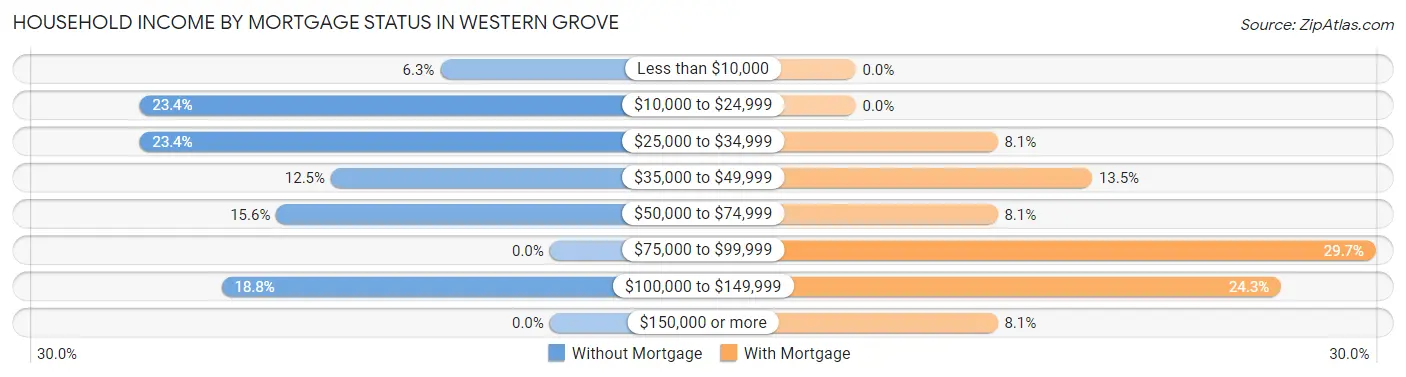
| Household Income | Without Mortgage | With Mortgage |
| Less than $10,000 | 4 (6.2%) | 0 (0.0%) |
| $10,000 to $24,999 | 15 (23.4%) | 0 (0.0%) |
| $25,000 to $34,999 | 15 (23.4%) | 3 (8.1%) |
| $35,000 to $49,999 | 8 (12.5%) | 5 (13.5%) |
| $50,000 to $74,999 | 10 (15.6%) | 3 (8.1%) |
| $75,000 to $99,999 | 0 (0.0%) | 11 (29.7%) |
| $100,000 to $149,999 | 12 (18.8%) | 9 (24.3%) |
| $150,000 or more | 0 (0.0%) | 3 (8.1%) |
| Total | 64 (100.0%) | 37 (100.0%) |
Property Value to Household Income Ratio in Western Grove
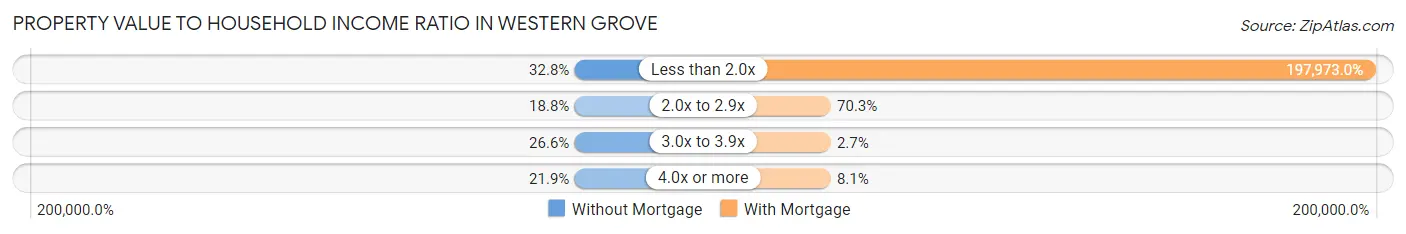
| Value-to-Income Ratio | Without Mortgage | With Mortgage |
| Less than 2.0x | 21 (32.8%) | 73,250 (197,973.0%) |
| 2.0x to 2.9x | 12 (18.8%) | 26 (70.3%) |
| 3.0x to 3.9x | 17 (26.6%) | 1 (2.7%) |
| 4.0x or more | 14 (21.9%) | 3 (8.1%) |
| Total | 64 (100.0%) | 37 (100.0%) |
Real Estate Taxes by Mortgage Status in Western Grove
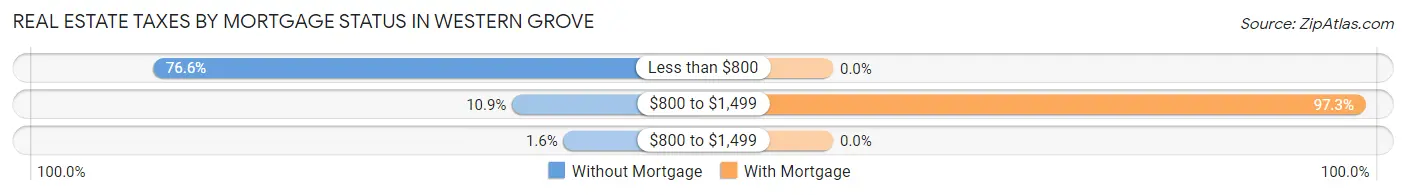
| Property Taxes | Without Mortgage | With Mortgage |
| Less than $800 | 49 (76.6%) | 0 (0.0%) |
| $800 to $1,499 | 7 (10.9%) | 36 (97.3%) |
| $800 to $1,499 | 1 (1.6%) | 0 (0.0%) |
| Total | 64 (100.0%) | 37 (100.0%) |
Health & Disability in Western Grove
Health Insurance Coverage by Age in Western Grove
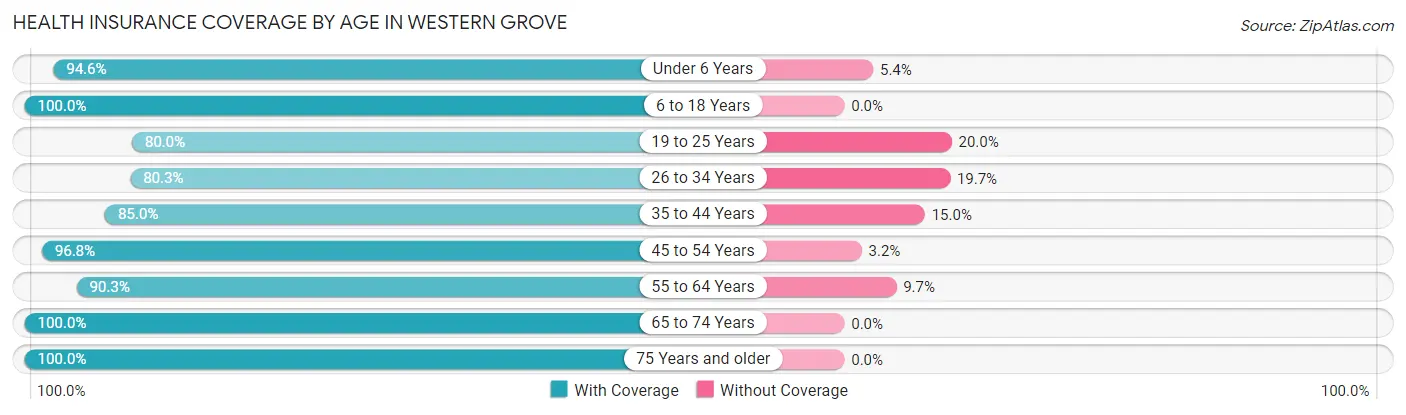
| Age Bracket | With Coverage | Without Coverage |
| Under 6 Years | 53 (94.6%) | 3 (5.4%) |
| 6 to 18 Years | 111 (100.0%) | 0 (0.0%) |
| 19 to 25 Years | 24 (80.0%) | 6 (20.0%) |
| 26 to 34 Years | 53 (80.3%) | 13 (19.7%) |
| 35 to 44 Years | 34 (85.0%) | 6 (15.0%) |
| 45 to 54 Years | 30 (96.8%) | 1 (3.2%) |
| 55 to 64 Years | 28 (90.3%) | 3 (9.7%) |
| 65 to 74 Years | 25 (100.0%) | 0 (0.0%) |
| 75 Years and older | 59 (100.0%) | 0 (0.0%) |
| Total | 417 (92.9%) | 32 (7.1%) |
Health Insurance Coverage by Citizenship Status in Western Grove
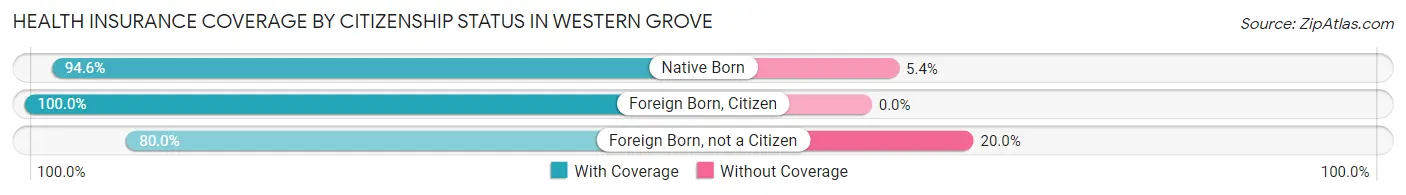
| Citizenship Status | With Coverage | Without Coverage |
| Native Born | 53 (94.6%) | 3 (5.4%) |
| Foreign Born, Citizen | 111 (100.0%) | 0 (0.0%) |
| Foreign Born, not a Citizen | 24 (80.0%) | 6 (20.0%) |
Health Insurance Coverage by Household Income in Western Grove
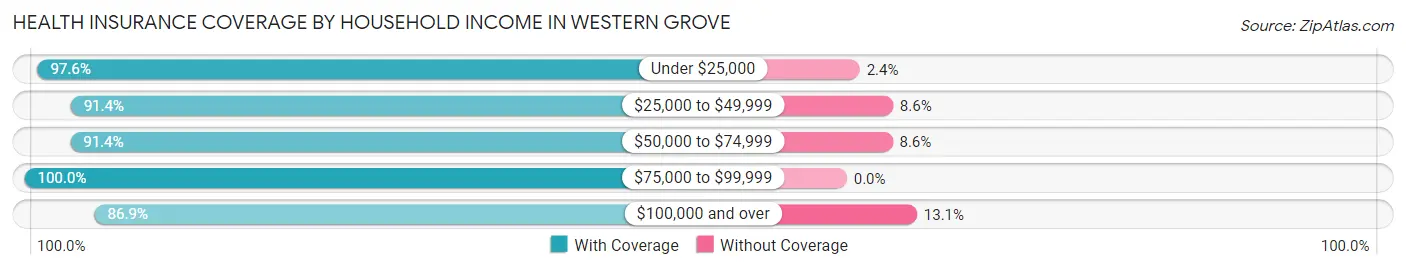
| Household Income | With Coverage | Without Coverage |
| Under $25,000 | 121 (97.6%) | 3 (2.4%) |
| $25,000 to $49,999 | 74 (91.4%) | 7 (8.6%) |
| $50,000 to $74,999 | 96 (91.4%) | 9 (8.6%) |
| $75,000 to $99,999 | 40 (100.0%) | 0 (0.0%) |
| $100,000 and over | 86 (86.9%) | 13 (13.1%) |
Public vs Private Health Insurance Coverage by Age in Western Grove
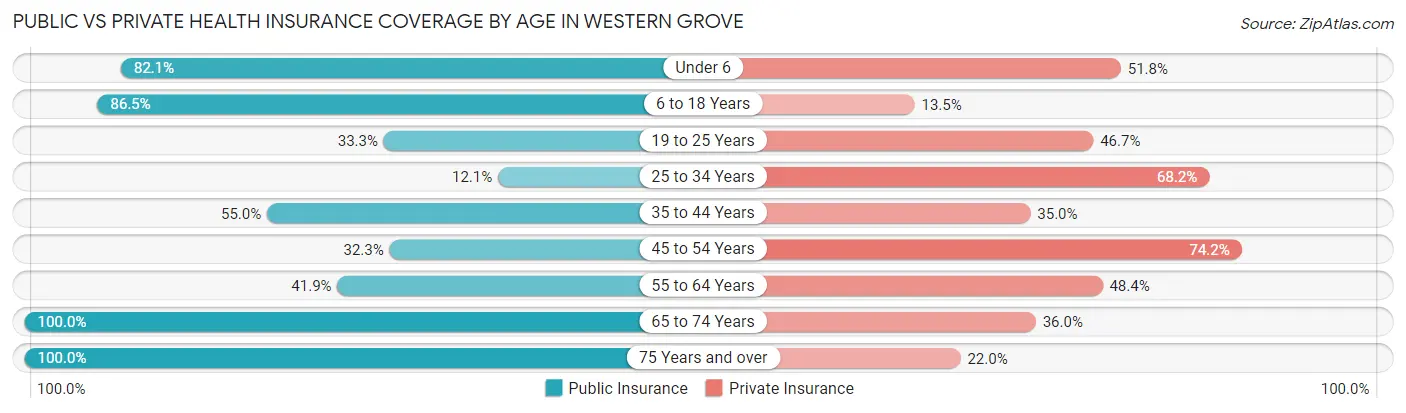
| Age Bracket | Public Insurance | Private Insurance |
| Under 6 | 46 (82.1%) | 29 (51.8%) |
| 6 to 18 Years | 96 (86.5%) | 15 (13.5%) |
| 19 to 25 Years | 10 (33.3%) | 14 (46.7%) |
| 25 to 34 Years | 8 (12.1%) | 45 (68.2%) |
| 35 to 44 Years | 22 (55.0%) | 14 (35.0%) |
| 45 to 54 Years | 10 (32.3%) | 23 (74.2%) |
| 55 to 64 Years | 13 (41.9%) | 15 (48.4%) |
| 65 to 74 Years | 25 (100.0%) | 9 (36.0%) |
| 75 Years and over | 59 (100.0%) | 13 (22.0%) |
| Total | 289 (64.4%) | 177 (39.4%) |
Disability Status by Sex by Age in Western Grove
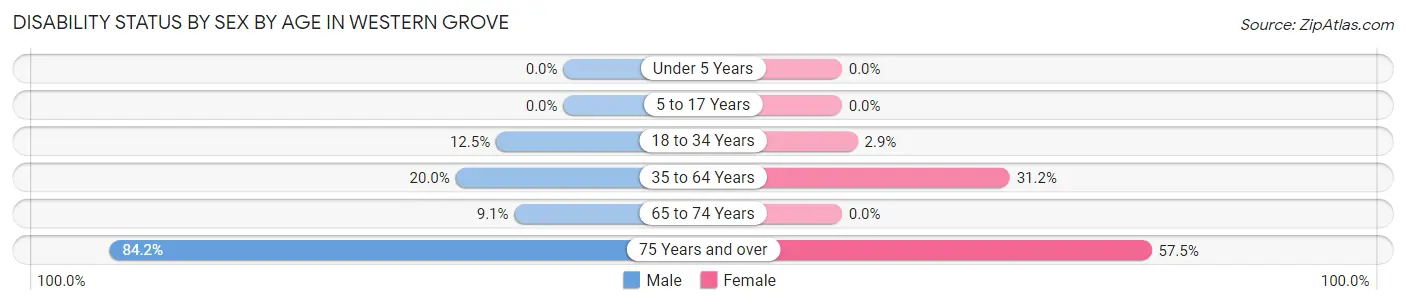
| Age Bracket | Male | Female |
| Under 5 Years | 0 (0.0%) | 0 (0.0%) |
| 5 to 17 Years | 0 (0.0%) | 0 (0.0%) |
| 18 to 34 Years | 8 (12.5%) | 1 (2.9%) |
| 35 to 64 Years | 5 (20.0%) | 24 (31.2%) |
| 65 to 74 Years | 1 (9.1%) | 0 (0.0%) |
| 75 Years and over | 16 (84.2%) | 23 (57.5%) |
Disability Class by Sex by Age in Western Grove
Disability Class: Hearing Difficulty
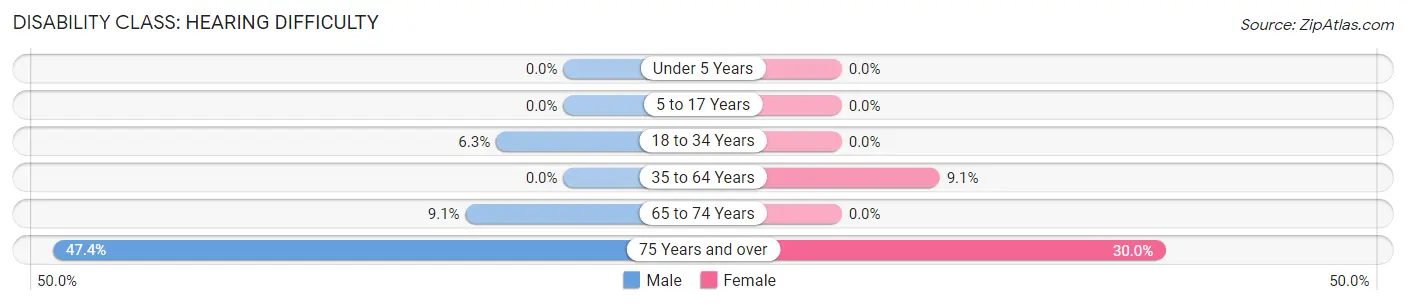
| Age Bracket | Male | Female |
| Under 5 Years | 0 (0.0%) | 0 (0.0%) |
| 5 to 17 Years | 0 (0.0%) | 0 (0.0%) |
| 18 to 34 Years | 4 (6.2%) | 0 (0.0%) |
| 35 to 64 Years | 0 (0.0%) | 7 (9.1%) |
| 65 to 74 Years | 1 (9.1%) | 0 (0.0%) |
| 75 Years and over | 9 (47.4%) | 12 (30.0%) |
Disability Class: Vision Difficulty
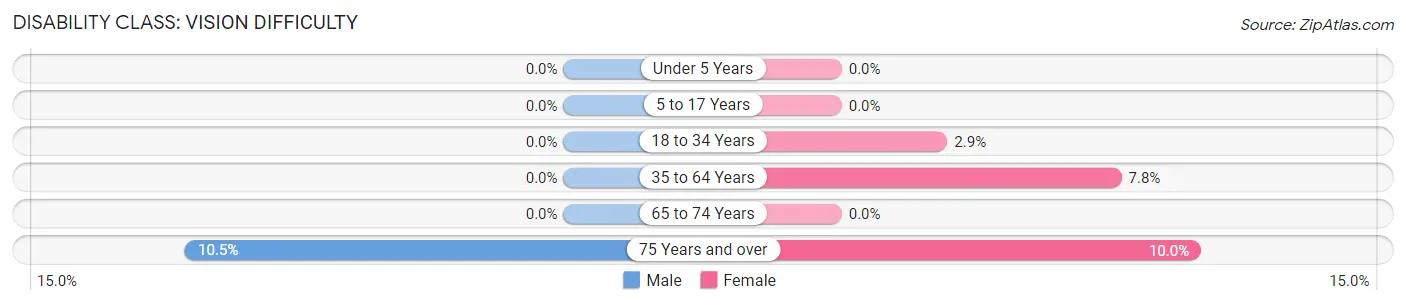
| Age Bracket | Male | Female |
| Under 5 Years | 0 (0.0%) | 0 (0.0%) |
| 5 to 17 Years | 0 (0.0%) | 0 (0.0%) |
| 18 to 34 Years | 0 (0.0%) | 1 (2.9%) |
| 35 to 64 Years | 0 (0.0%) | 6 (7.8%) |
| 65 to 74 Years | 0 (0.0%) | 0 (0.0%) |
| 75 Years and over | 2 (10.5%) | 4 (10.0%) |
Disability Class: Cognitive Difficulty
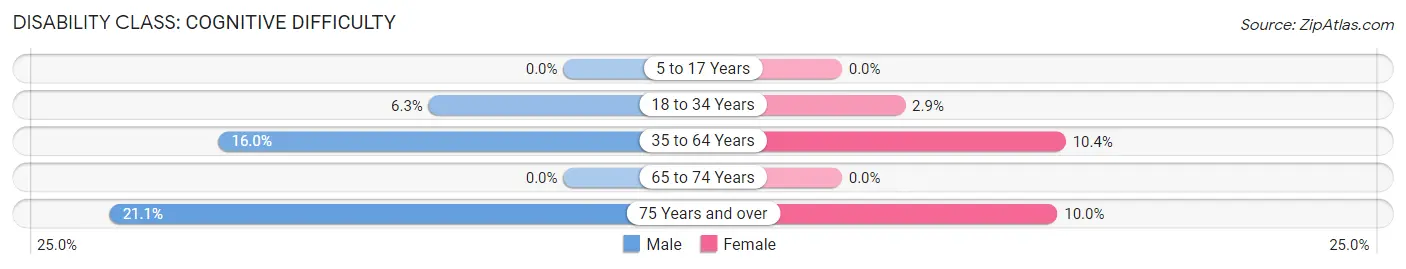
| Age Bracket | Male | Female |
| 5 to 17 Years | 0 (0.0%) | 0 (0.0%) |
| 18 to 34 Years | 4 (6.2%) | 1 (2.9%) |
| 35 to 64 Years | 4 (16.0%) | 8 (10.4%) |
| 65 to 74 Years | 0 (0.0%) | 0 (0.0%) |
| 75 Years and over | 4 (21.0%) | 4 (10.0%) |
Disability Class: Ambulatory Difficulty
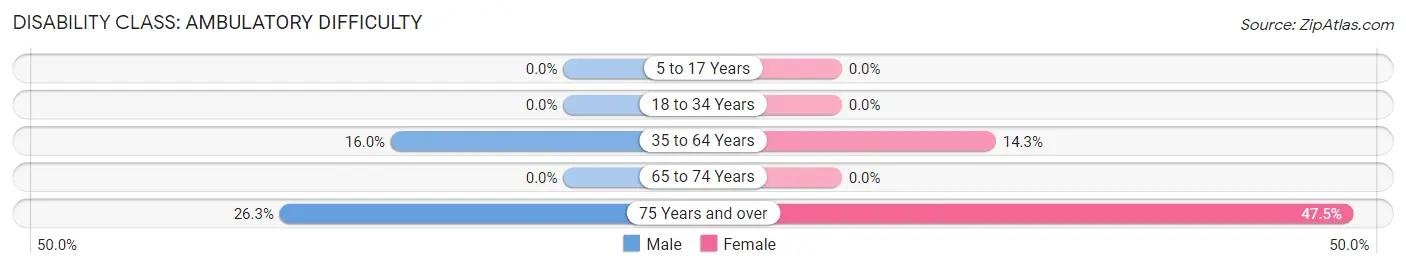
| Age Bracket | Male | Female |
| 5 to 17 Years | 0 (0.0%) | 0 (0.0%) |
| 18 to 34 Years | 0 (0.0%) | 0 (0.0%) |
| 35 to 64 Years | 4 (16.0%) | 11 (14.3%) |
| 65 to 74 Years | 0 (0.0%) | 0 (0.0%) |
| 75 Years and over | 5 (26.3%) | 19 (47.5%) |
Disability Class: Self-Care Difficulty
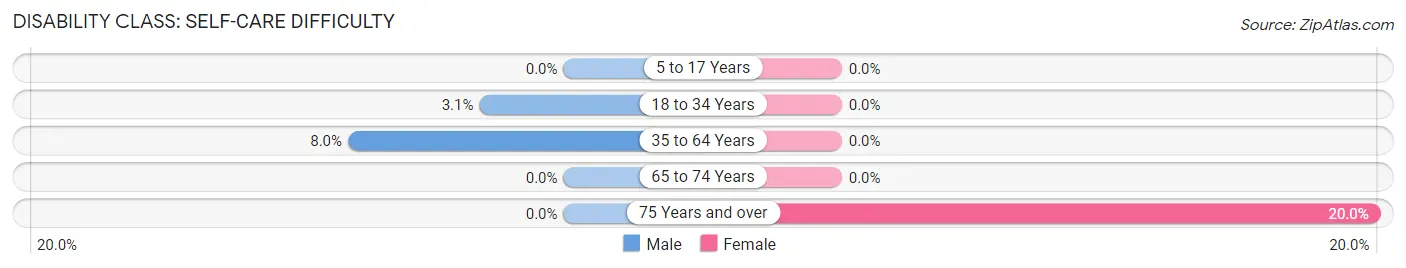
| Age Bracket | Male | Female |
| 5 to 17 Years | 0 (0.0%) | 0 (0.0%) |
| 18 to 34 Years | 2 (3.1%) | 0 (0.0%) |
| 35 to 64 Years | 2 (8.0%) | 0 (0.0%) |
| 65 to 74 Years | 0 (0.0%) | 0 (0.0%) |
| 75 Years and over | 0 (0.0%) | 8 (20.0%) |
Technology Access in Western Grove
Computing Device Access in Western Grove
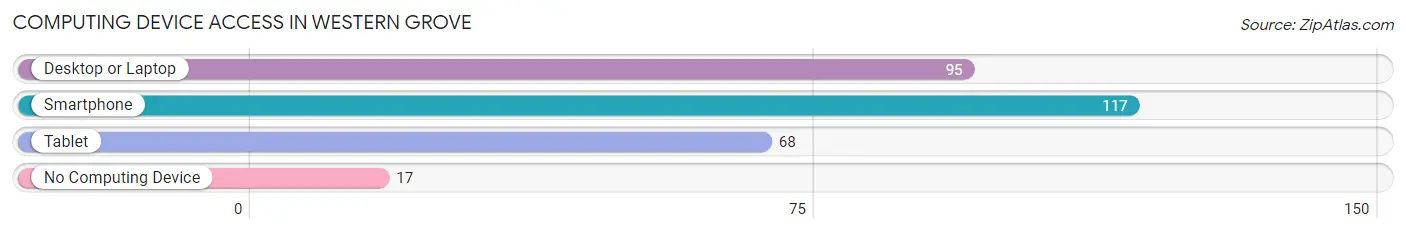
| Device Type | # Households | % Households |
| Desktop or Laptop | 95 | 62.1% |
| Smartphone | 117 | 76.5% |
| Tablet | 68 | 44.4% |
| No Computing Device | 17 | 11.1% |
| Total | 153 | 100.0% |
Internet Access in Western Grove
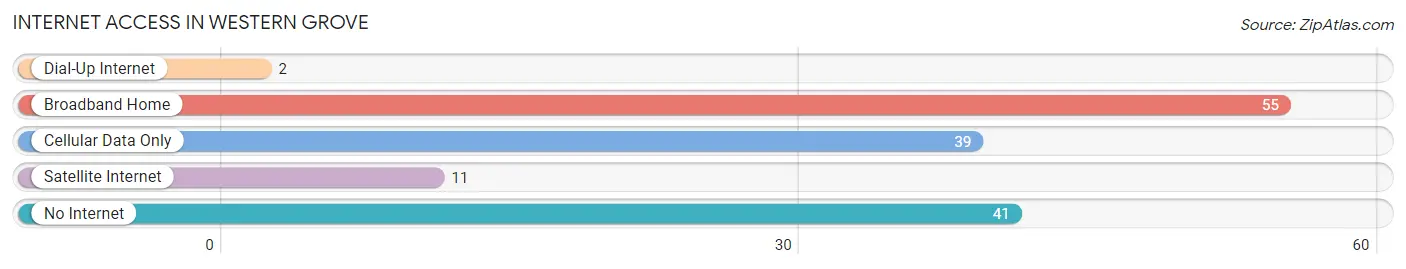
| Internet Type | # Households | % Households |
| Dial-Up Internet | 2 | 1.3% |
| Broadband Home | 55 | 35.9% |
| Cellular Data Only | 39 | 25.5% |
| Satellite Internet | 11 | 7.2% |
| No Internet | 41 | 26.8% |
| Total | 153 | 100.0% |
Western Grove Summary
History
The town of Western Grove, Arkansas is located in Newton County in the Ozark Mountains. It was founded in 1883 by a group of settlers from the nearby town of Harrison. The town was named after the nearby Western Grove Creek, which was named for the grove of trees that grew along its banks.
The first settlers in Western Grove were mostly farmers and ranchers, and the town quickly grew to become a thriving agricultural community. The town was home to several stores, a post office, a school, and a church. In the early 1900s, the town was also home to a sawmill and a gristmill.
In the 1920s, the town began to experience a decline in population as many of the farmers and ranchers moved away in search of better opportunities. However, the town was able to remain a viable community due to its proximity to the larger cities of Harrison and Jasper.
In the 1950s, the town experienced a resurgence in population as the timber industry began to boom in the area. The town was home to several sawmills and lumber companies, and the population grew to over 500 people.
In the 1970s, the timber industry began to decline, and the population of Western Grove began to decline as well. However, the town was able to remain a viable community due to its proximity to the larger cities of Harrison and Jasper.
Geography
Western Grove is located in the Ozark Mountains of northern Arkansas. The town is situated in the foothills of the Ozarks, and is surrounded by rolling hills and forests. The town is located near the Buffalo National River, which is a popular destination for outdoor recreation.
The town is located at an elevation of 1,000 feet above sea level, and has a total area of 1.2 square miles. The town is located approximately 30 miles from the larger cities of Harrison and Jasper.
Economy
The economy of Western Grove is largely based on agriculture and tourism. The town is home to several farms and ranches, and the surrounding area is known for its production of cattle, hay, and timber.
The town is also home to several tourist attractions, including the Buffalo National River, which is a popular destination for outdoor recreation. The town is also home to several restaurants, shops, and other businesses that cater to tourists.
Demographics
As of the 2010 census, the population of Western Grove was 441 people. The town has a total area of 1.2 square miles, and a population density of 368 people per square mile.
The racial makeup of the town is 97.3% White, 0.2% African American, 0.2% Native American, 0.2% Asian, 0.2% from other races, and 1.9% from two or more races. The median household income in the town is $30,000, and the median age is 44 years.
Common Questions
What is Per Capita Income in Western Grove?
Per Capita income in Western Grove is $18,492.
What is the Median Family Income in Western Grove?
Median Family Income in Western Grove is $35,577.
What is the Median Household income in Western Grove?
Median Household Income in Western Grove is $43,750.
What is Inequality or Gini Index in Western Grove?
Inequality or Gini Index in Western Grove is 0.42.
What is the Total Population of Western Grove?
Total Population of Western Grove is 461.
What is the Total Male Population of Western Grove?
Total Male Population of Western Grove is 217.
What is the Total Female Population of Western Grove?
Total Female Population of Western Grove is 244.
What is the Ratio of Males per 100 Females in Western Grove?
There are 88.93 Males per 100 Females in Western Grove.
What is the Ratio of Females per 100 Males in Western Grove?
There are 112.44 Females per 100 Males in Western Grove.
What is the Median Population Age in Western Grove?
Median Population Age in Western Grove is 28.7 Years.
What is the Average Family Size in Western Grove
Average Family Size in Western Grove is 3.5 People.
What is the Average Household Size in Western Grove
Average Household Size in Western Grove is 3.0 People.
How Large is the Labor Force in Western Grove?
There are 178 People in the Labor Forcein in Western Grove.
What is the Percentage of People in the Labor Force in Western Grove?
53.8% of People are in the Labor Force in Western Grove.
What is the Unemployment Rate in Western Grove?
Unemployment Rate in Western Grove is 4.2%.