West Point, AR Map & Demographics
West Point Map
West Point Overview
$15,463
PER CAPITA INCOME
$24,063
AVG HOUSEHOLD INCOME
0.42
INEQUALITY / GINI INDEX
145
TOTAL POPULATION
43
MALE POPULATION
102
FEMALE POPULATION
42.16
MALES / 100 FEMALES
237.21
FEMALES / 100 MALES
47.6
MEDIAN AGE
2.8
AVG FAMILY SIZE
2.4
AVG HOUSEHOLD SIZE
44
LABOR FORCE [ PEOPLE ]
34.4%
PERCENT IN LABOR FORCE
6.8%
UNEMPLOYMENT RATE
West Point Zip Codes
West Point Area Codes
Income in West Point
Income Overview in West Point
| Characteristic | Number | Measure |
| Per Capita Income | 145 | $15,463 |
| Median Family Income | 27 | $0 |
| Mean Family Income | 27 | $55,700 |
| Median Household Income | 40 | $24,063 |
| Mean Household Income | 40 | $47,765 |
| Income Deficit | 27 | $0 |
| Wage / Income Gap (%) | 145 | 0.00% |
| Wage / Income Gap ($) | 145 | 100.00¢ per $1 |
| Gini / Inequality Index | 145 | 0.42 |
Earnings by Sex in West Point
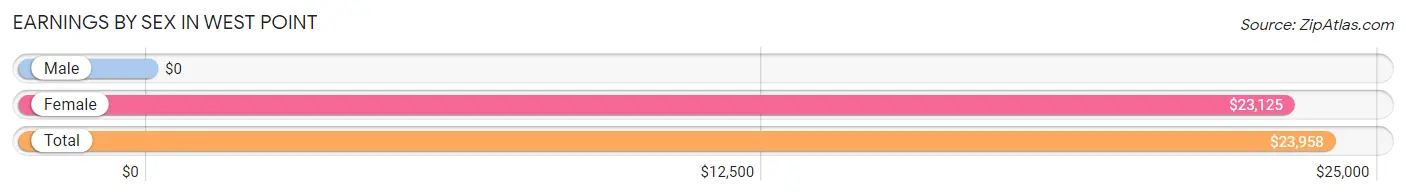
| Sex | Number | Average Earnings |
| Male | 25 (55.6%) | $0 |
| Female | 20 (44.4%) | $23,125 |
| Total | 45 (100.0%) | $23,958 |
Earnings by Sex by Income Bracket in West Point
The most common earnings brackets in West Point are $75,000 to $99,999 for men (6 | 24.0%) and $17,500 to $19,999 for women (8 | 40.0%).
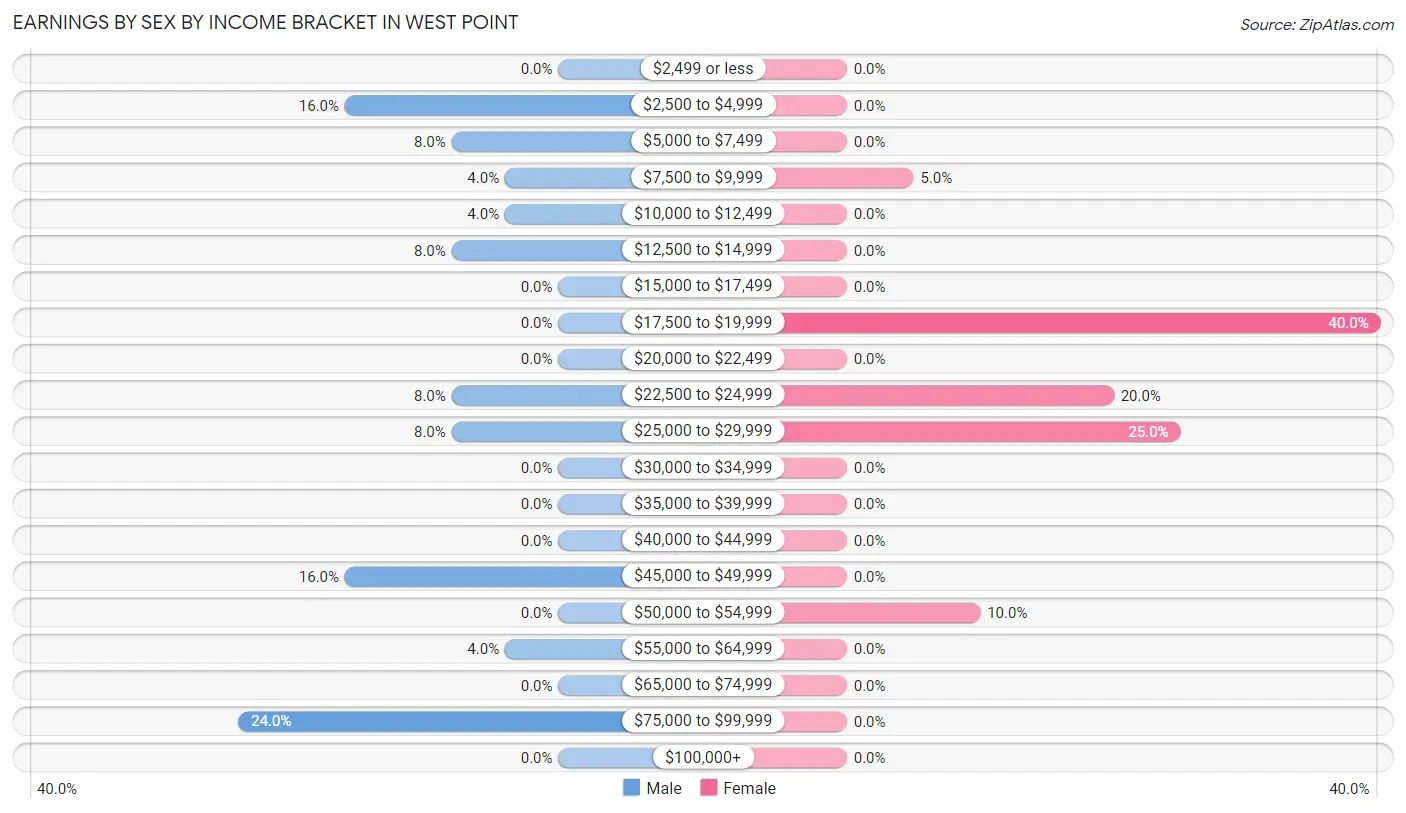
| Income | Male | Female |
| $2,499 or less | 0 (0.0%) | 0 (0.0%) |
| $2,500 to $4,999 | 4 (16.0%) | 0 (0.0%) |
| $5,000 to $7,499 | 2 (8.0%) | 0 (0.0%) |
| $7,500 to $9,999 | 1 (4.0%) | 1 (5.0%) |
| $10,000 to $12,499 | 1 (4.0%) | 0 (0.0%) |
| $12,500 to $14,999 | 2 (8.0%) | 0 (0.0%) |
| $15,000 to $17,499 | 0 (0.0%) | 0 (0.0%) |
| $17,500 to $19,999 | 0 (0.0%) | 8 (40.0%) |
| $20,000 to $22,499 | 0 (0.0%) | 0 (0.0%) |
| $22,500 to $24,999 | 2 (8.0%) | 4 (20.0%) |
| $25,000 to $29,999 | 2 (8.0%) | 5 (25.0%) |
| $30,000 to $34,999 | 0 (0.0%) | 0 (0.0%) |
| $35,000 to $39,999 | 0 (0.0%) | 0 (0.0%) |
| $40,000 to $44,999 | 0 (0.0%) | 0 (0.0%) |
| $45,000 to $49,999 | 4 (16.0%) | 0 (0.0%) |
| $50,000 to $54,999 | 0 (0.0%) | 2 (10.0%) |
| $55,000 to $64,999 | 1 (4.0%) | 0 (0.0%) |
| $65,000 to $74,999 | 0 (0.0%) | 0 (0.0%) |
| $75,000 to $99,999 | 6 (24.0%) | 0 (0.0%) |
| $100,000+ | 0 (0.0%) | 0 (0.0%) |
| Total | 25 (100.0%) | 20 (100.0%) |
Earnings by Sex by Educational Attainment in West Point
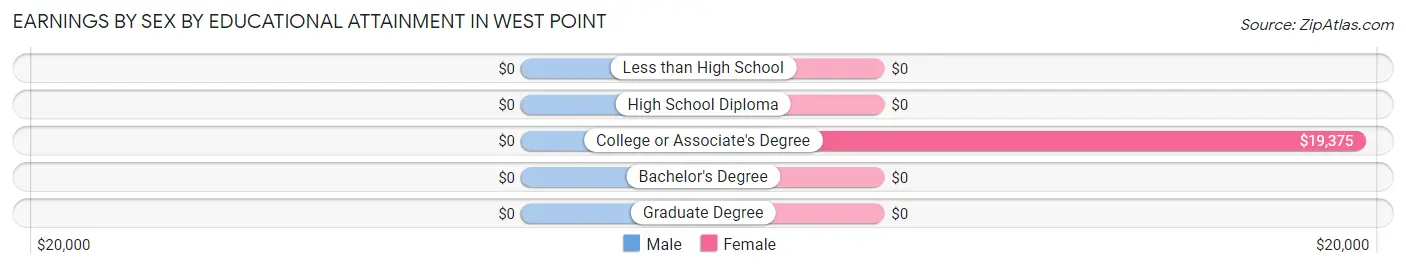
| Educational Attainment | Male Income | Female Income |
| Less than High School | - | - |
| High School Diploma | - | - |
| College or Associate's Degree | - | - |
| Bachelor's Degree | - | - |
| Graduate Degree | - | - |
| Total | - | - |
Family Income in West Point
Family Income Brackets in West Point
According to the West Point family income data, there are 14 families falling into the $15,000 to $24,999 income range, which is the most common income bracket and makes up 51.8% of all families.
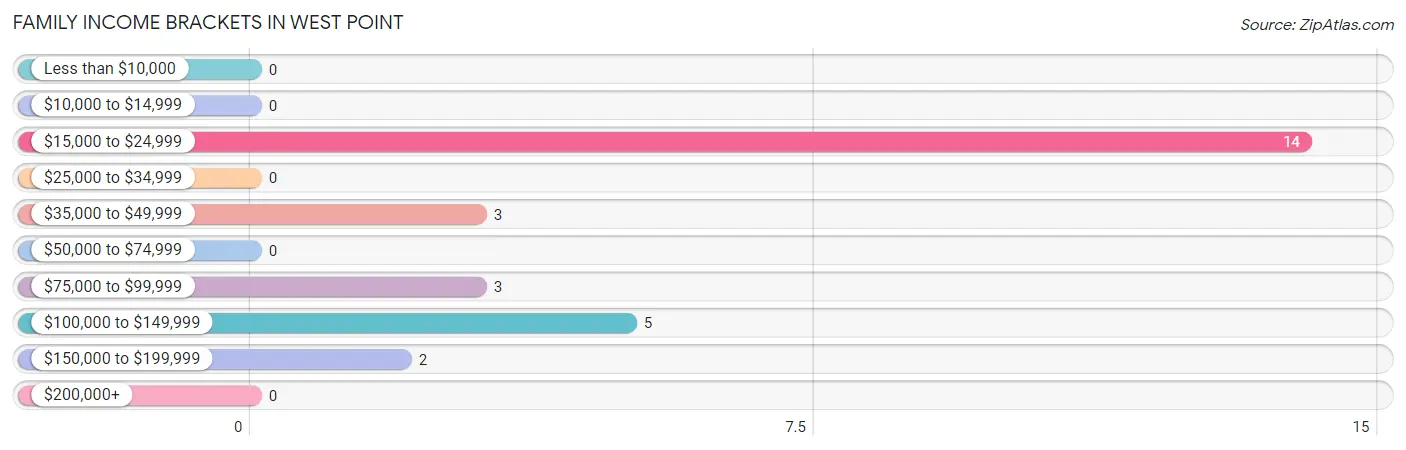
| Income Bracket | # Families | % Families |
| Less than $10,000 | 0 | 0.0% |
| $10,000 to $14,999 | 0 | 0.0% |
| $15,000 to $24,999 | 14 | 51.9% |
| $25,000 to $34,999 | 0 | 0.0% |
| $35,000 to $49,999 | 3 | 11.1% |
| $50,000 to $74,999 | 0 | 0.0% |
| $75,000 to $99,999 | 3 | 11.1% |
| $100,000 to $149,999 | 5 | 18.5% |
| $150,000 to $199,999 | 2 | 7.4% |
| $200,000+ | 0 | 0.0% |
Family Income by Famaliy Size in West Point
2-person families (9 | 33.3%) account for the highest median family income in West Point with $110,250 per family, while 2-person families (9 | 33.3%) have the highest median income of $55,125 per family member.
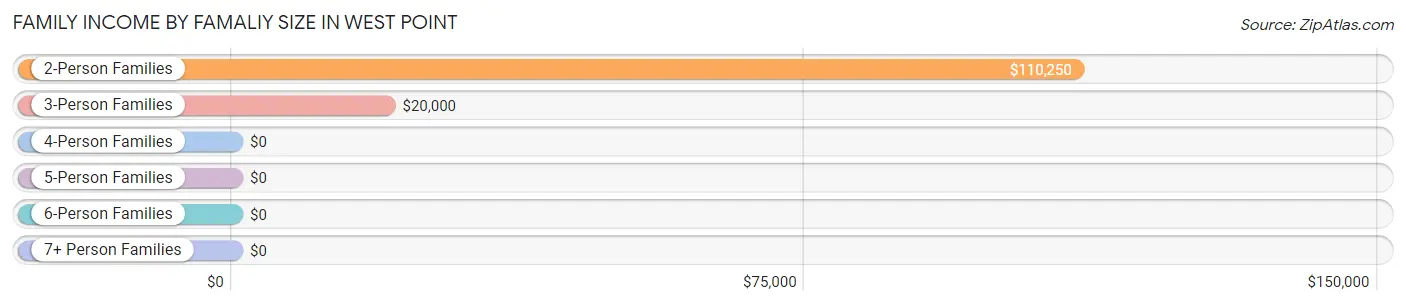
| Income Bracket | # Families | Median Income |
| 2-Person Families | 9 (33.3%) | $110,250 |
| 3-Person Families | 16 (59.3%) | $20,000 |
| 4-Person Families | 0 (0.0%) | $0 |
| 5-Person Families | 2 (7.4%) | $0 |
| 6-Person Families | 0 (0.0%) | $0 |
| 7+ Person Families | 0 (0.0%) | $0 |
| Total | 27 (100.0%) | $0 |
Family Income by Number of Earners in West Point
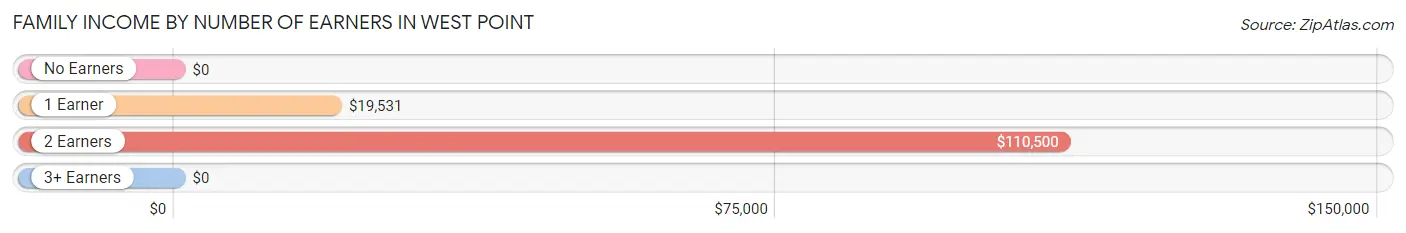
| Number of Earners | # Families | Median Income |
| No Earners | 4 (14.8%) | $0 |
| 1 Earner | 13 (48.1%) | $19,531 |
| 2 Earners | 8 (29.6%) | $110,500 |
| 3+ Earners | 2 (7.4%) | $0 |
| Total | 27 (100.0%) | $0 |
Household Income in West Point
Household Income Brackets in West Point
With 21 households falling in the category, the $15,000 to $24,999 income range is the most frequent in West Point, accounting for 52.5% of all households.
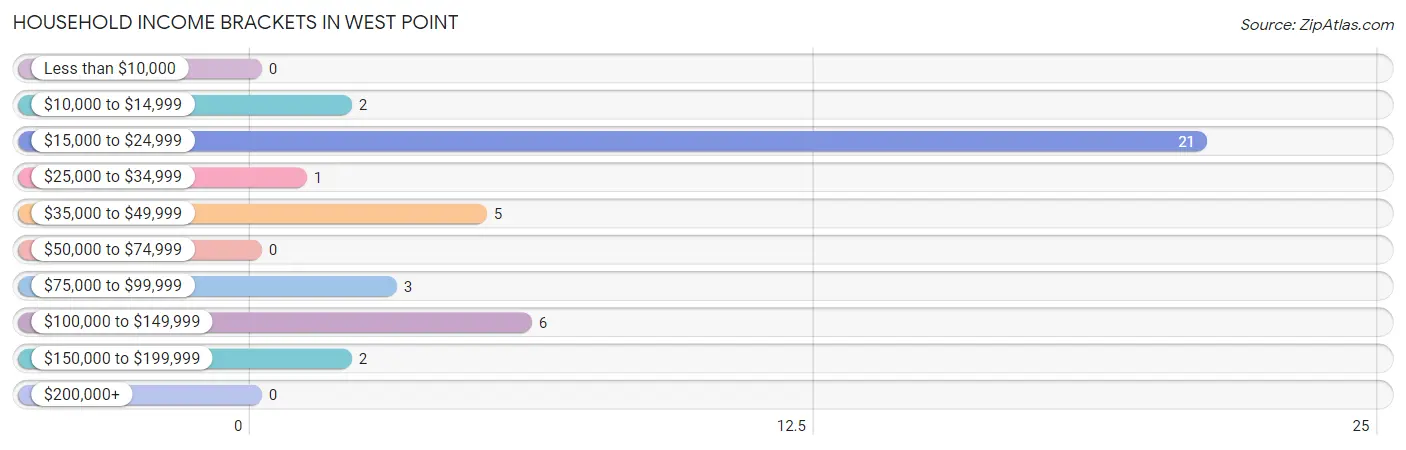
| Income Bracket | # Households | % Households |
| Less than $10,000 | 0 | 0.0% |
| $10,000 to $14,999 | 2 | 5.0% |
| $15,000 to $24,999 | 21 | 52.5% |
| $25,000 to $34,999 | 1 | 2.5% |
| $35,000 to $49,999 | 5 | 12.5% |
| $50,000 to $74,999 | 0 | 0.0% |
| $75,000 to $99,999 | 3 | 7.5% |
| $100,000 to $149,999 | 6 | 15.0% |
| $150,000 to $199,999 | 2 | 5.0% |
| $200,000+ | 0 | 0.0% |
Household Income by Householder Age in West Point
The median household income in West Point is $24,063, with the highest median household income of $23,750 found in the 65+ years age bracket for the primary householder. A total of 14 households (35.0%) fall into this category. Meanwhile, the 15 to 24 years age bracket for the primary householder has the lowest median household income of $0, with 1 households (2.5%) in this group.
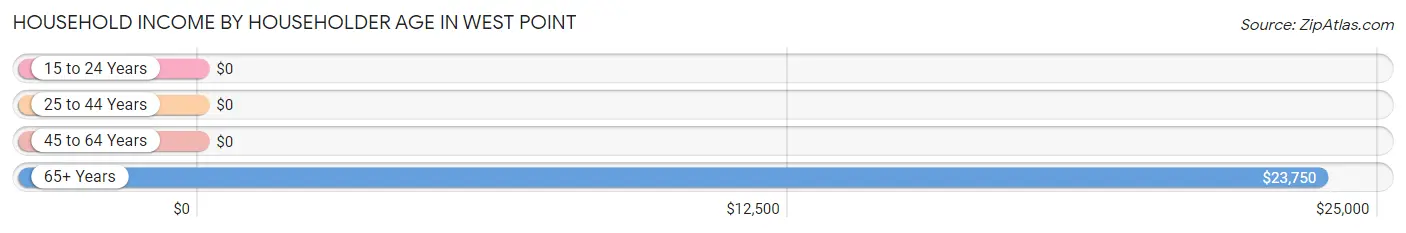
| Income Bracket | # Households | Median Income |
| 15 to 24 Years | 1 (2.5%) | $0 |
| 25 to 44 Years | 11 (27.5%) | $0 |
| 45 to 64 Years | 14 (35.0%) | $0 |
| 65+ Years | 14 (35.0%) | $23,750 |
| Total | 40 (100.0%) | $24,063 |
Poverty in West Point
Income Below Poverty by Sex and Age in West Point
With 41.9% poverty level for males and 59.8% for females among the residents of West Point, 6 to 11 year old males and 12 to 14 year old females are the most vulnerable to poverty, with 7 males (100.0%) and 6 females (100.0%) in their respective age groups living below the poverty level.
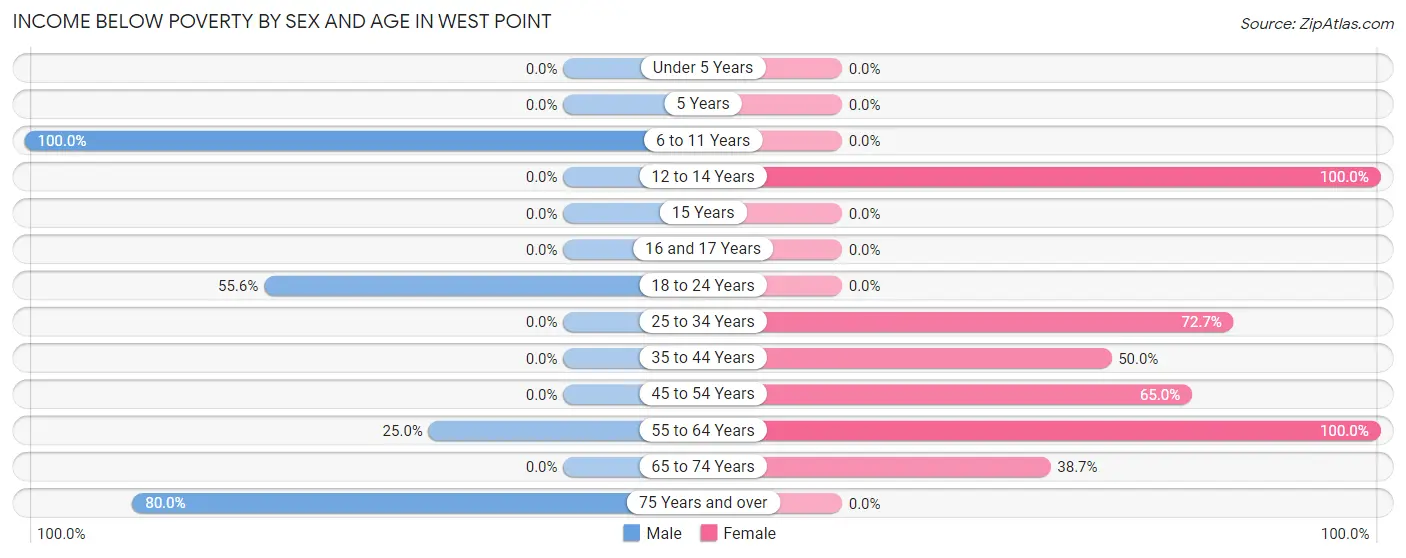
| Age Bracket | Male | Female |
| Under 5 Years | 0 (0.0%) | 0 (0.0%) |
| 5 Years | 0 (0.0%) | 0 (0.0%) |
| 6 to 11 Years | 7 (100.0%) | 0 (0.0%) |
| 12 to 14 Years | 0 (0.0%) | 6 (100.0%) |
| 15 Years | 0 (0.0%) | 0 (0.0%) |
| 16 and 17 Years | 0 (0.0%) | 0 (0.0%) |
| 18 to 24 Years | 5 (55.6%) | 0 (0.0%) |
| 25 to 34 Years | 0 (0.0%) | 8 (72.7%) |
| 35 to 44 Years | 0 (0.0%) | 6 (50.0%) |
| 45 to 54 Years | 0 (0.0%) | 13 (65.0%) |
| 55 to 64 Years | 2 (25.0%) | 16 (100.0%) |
| 65 to 74 Years | 0 (0.0%) | 12 (38.7%) |
| 75 Years and over | 4 (80.0%) | 0 (0.0%) |
| Total | 18 (41.9%) | 61 (59.8%) |
Income Above Poverty by Sex and Age in West Point
According to the poverty statistics in West Point, males aged 25 to 34 years and females aged 6 to 11 years are the age groups that are most secure financially, with 100.0% of males and 100.0% of females in these age groups living above the poverty line.
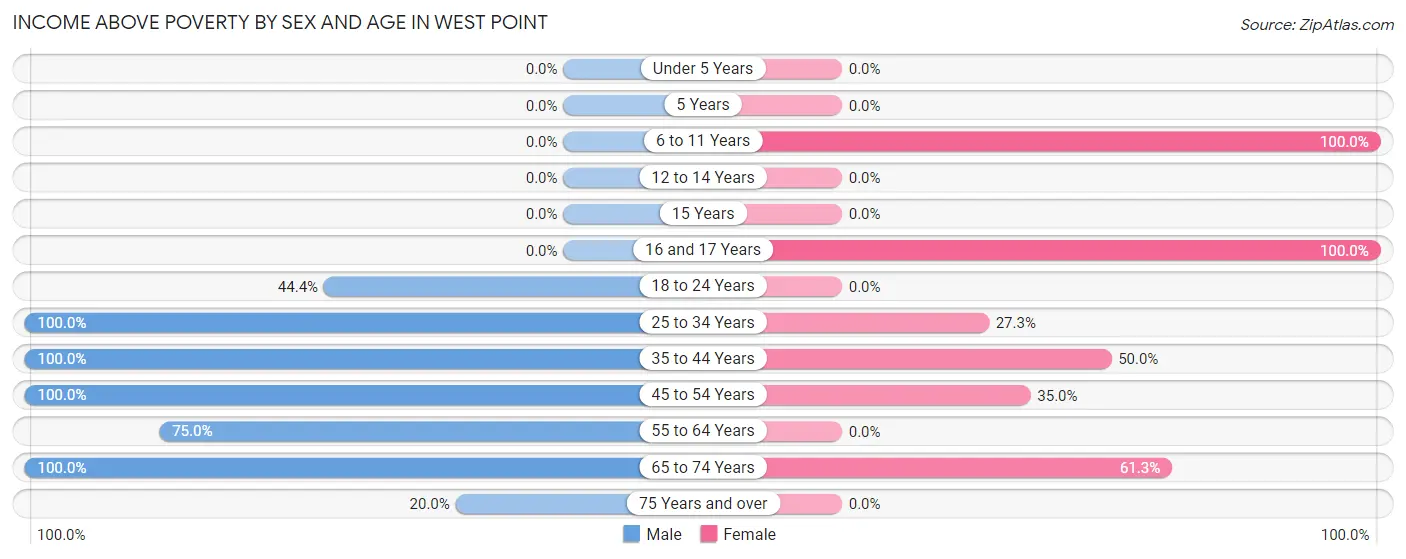
| Age Bracket | Male | Female |
| Under 5 Years | 0 (0.0%) | 0 (0.0%) |
| 5 Years | 0 (0.0%) | 0 (0.0%) |
| 6 to 11 Years | 0 (0.0%) | 4 (100.0%) |
| 12 to 14 Years | 0 (0.0%) | 0 (0.0%) |
| 15 Years | 0 (0.0%) | 0 (0.0%) |
| 16 and 17 Years | 0 (0.0%) | 2 (100.0%) |
| 18 to 24 Years | 4 (44.4%) | 0 (0.0%) |
| 25 to 34 Years | 2 (100.0%) | 3 (27.3%) |
| 35 to 44 Years | 5 (100.0%) | 6 (50.0%) |
| 45 to 54 Years | 4 (100.0%) | 7 (35.0%) |
| 55 to 64 Years | 6 (75.0%) | 0 (0.0%) |
| 65 to 74 Years | 3 (100.0%) | 19 (61.3%) |
| 75 Years and over | 1 (20.0%) | 0 (0.0%) |
| Total | 25 (58.1%) | 41 (40.2%) |
Income Below Poverty Among Married-Couple Families in West Point
The poverty statistics for married-couple families in West Point show that 23.5% or 4 of the total 17 families live below the poverty line. Families with no children have the highest poverty rate of 30.8%, comprising of 4 families. On the other hand, families with 1 or 2 children have the lowest poverty rate of 0.0%, which includes 0 families.
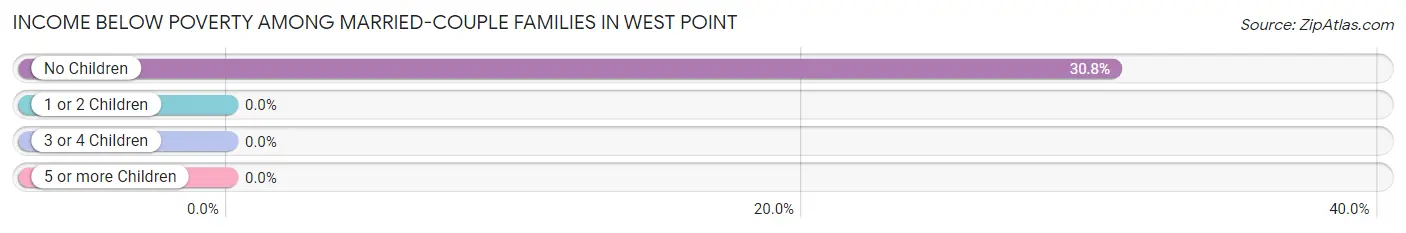
| Children | Above Poverty | Below Poverty |
| No Children | 9 (69.2%) | 4 (30.8%) |
| 1 or 2 Children | 4 (100.0%) | 0 (0.0%) |
| 3 or 4 Children | 0 (0.0%) | 0 (0.0%) |
| 5 or more Children | 0 (0.0%) | 0 (0.0%) |
| Total | 13 (76.5%) | 4 (23.5%) |
Income Below Poverty Among Single-Parent Households in West Point
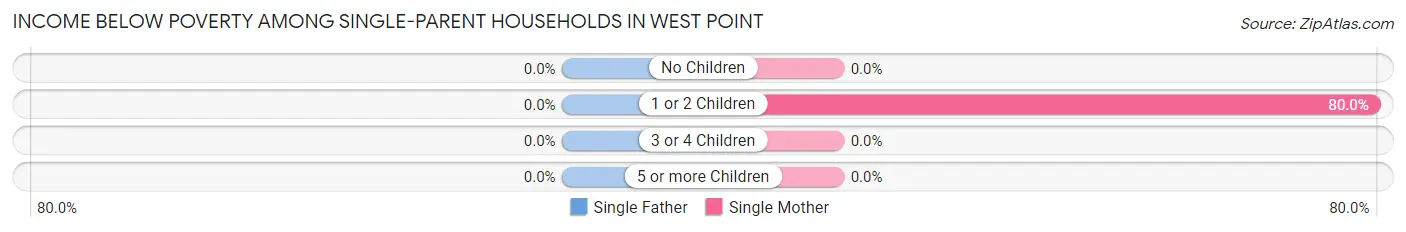
| Children | Single Father | Single Mother |
| No Children | 0 (0.0%) | 0 (0.0%) |
| 1 or 2 Children | 0 (0.0%) | 8 (80.0%) |
| 3 or 4 Children | 0 (0.0%) | 0 (0.0%) |
| 5 or more Children | 0 (0.0%) | 0 (0.0%) |
| Total | 0 (0.0%) | 8 (80.0%) |
Income Below Poverty Among Married-Couple vs Single-Parent Households in West Point
The poverty data for West Point shows that 4 of the married-couple family households (23.5%) and 8 of the single-parent households (80.0%) are living below the poverty level. Within the married-couple family households, those with no children have the highest poverty rate, with 4 households (30.8%) falling below the poverty line. Among the single-parent households, those with 1 or 2 children have the highest poverty rate, with 8 household (80.0%) living below poverty.
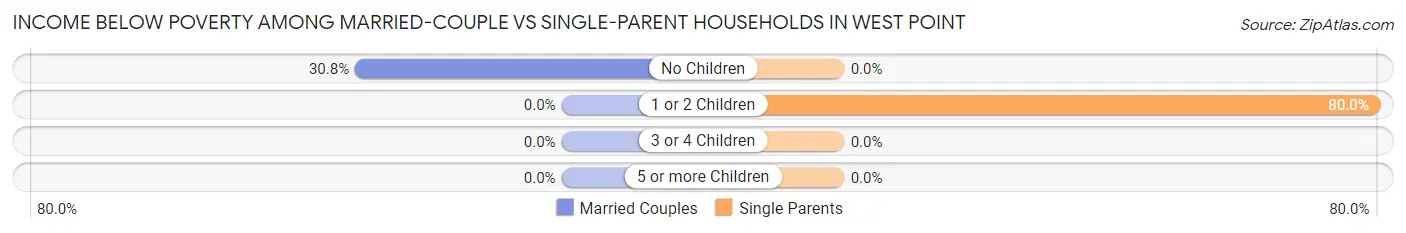
| Children | Married-Couple Families | Single-Parent Households |
| No Children | 4 (30.8%) | 0 (0.0%) |
| 1 or 2 Children | 0 (0.0%) | 8 (80.0%) |
| 3 or 4 Children | 0 (0.0%) | 0 (0.0%) |
| 5 or more Children | 0 (0.0%) | 0 (0.0%) |
| Total | 4 (23.5%) | 8 (80.0%) |
Race in West Point
The most populous races in West Point are White / Caucasian (122 | 84.1%), Black / African American (22 | 15.2%), and Two or more Races (1 | 0.7%).
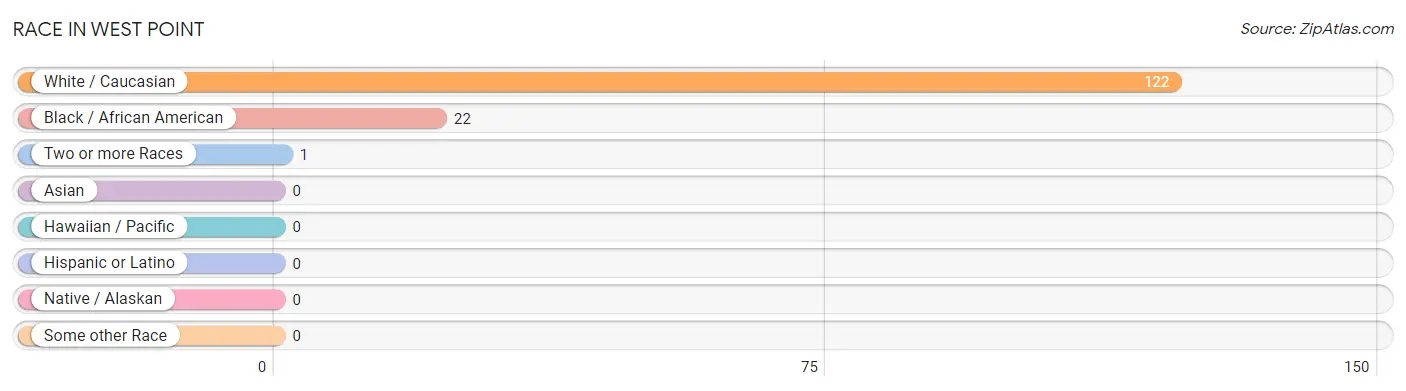
| Race | # Population | % Population |
| Asian | 0 | 0.0% |
| Black / African American | 22 | 15.2% |
| Hawaiian / Pacific | 0 | 0.0% |
| Hispanic or Latino | 0 | 0.0% |
| Native / Alaskan | 0 | 0.0% |
| White / Caucasian | 122 | 84.1% |
| Two or more Races | 1 | 0.7% |
| Some other Race | 0 | 0.0% |
| Total | 145 | 100.0% |
Ancestry in West Point
The most populous ancestries reported in West Point are American (14 | 9.7%), English (14 | 9.7%), Italian (12 | 8.3%), German (10 | 6.9%), and Cherokee (1 | 0.7%), together accounting for 35.2% of all West Point residents.
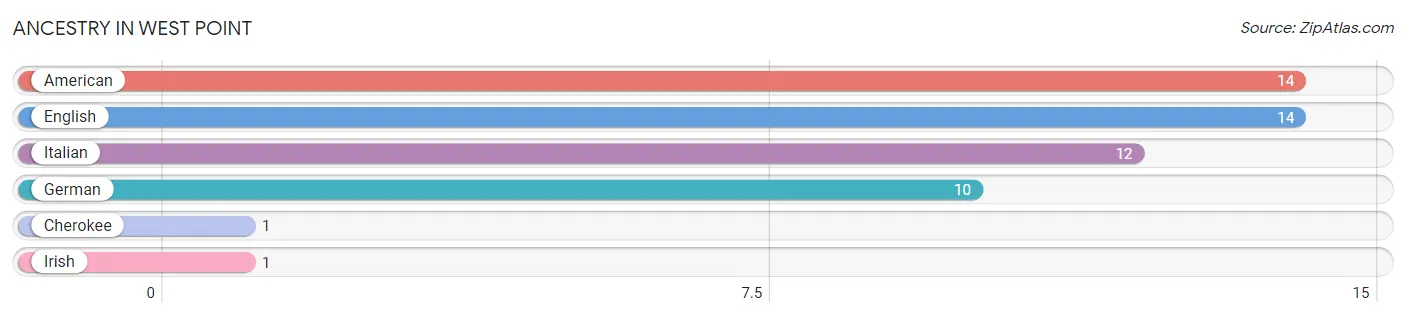
| Ancestry | # Population | % Population |
| American | 14 | 9.7% |
| Cherokee | 1 | 0.7% |
| English | 14 | 9.7% |
| German | 10 | 6.9% |
| Irish | 1 | 0.7% |
| Italian | 12 | 8.3% | View All 6 Rows |
Immigrants in West Point

| Immigration Origin | # Population | % Population | View All 0 Rows |
Sex and Age in West Point
Sex and Age in West Point
The most populous age groups in West Point are 20 to 24 Years (9 | 20.9%) for men and 70 to 74 Years (26 | 25.5%) for women.
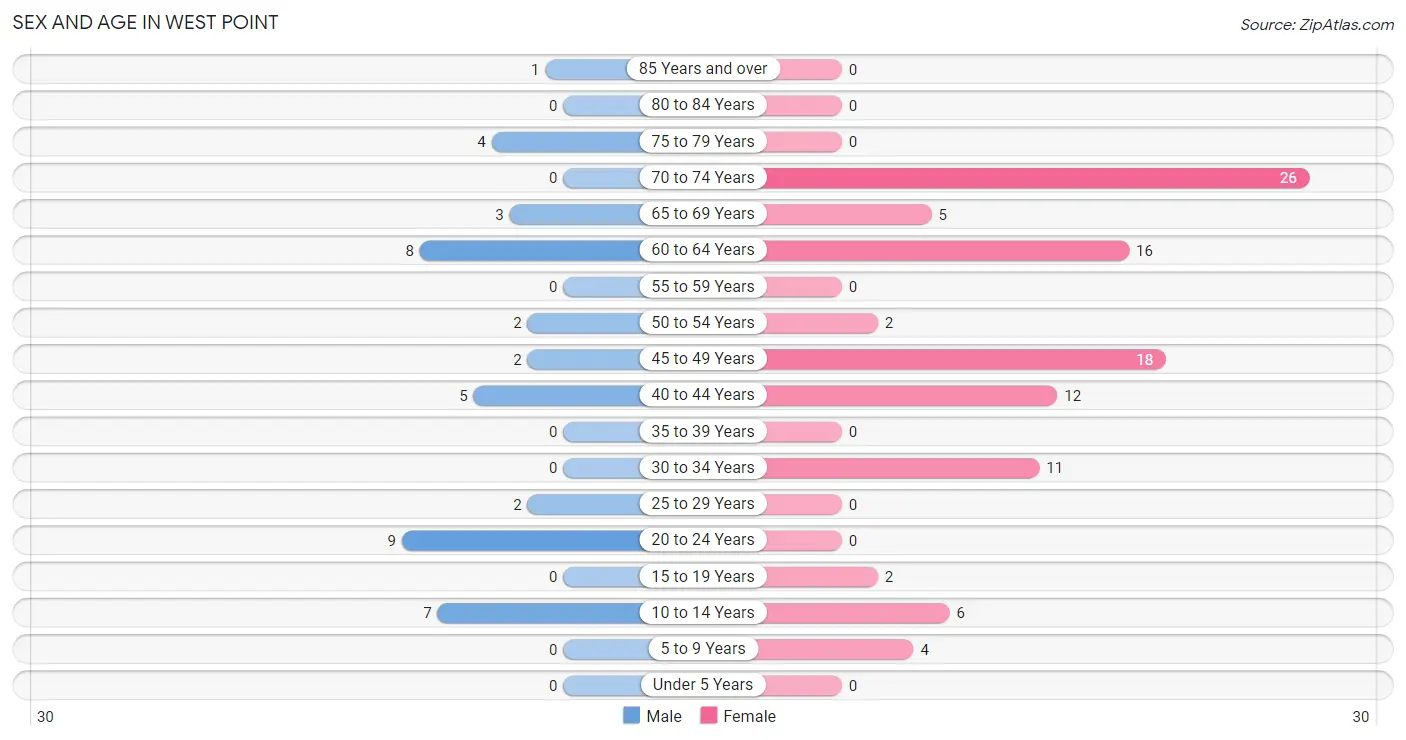
| Age Bracket | Male | Female |
| Under 5 Years | 0 (0.0%) | 0 (0.0%) |
| 5 to 9 Years | 0 (0.0%) | 4 (3.9%) |
| 10 to 14 Years | 7 (16.3%) | 6 (5.9%) |
| 15 to 19 Years | 0 (0.0%) | 2 (2.0%) |
| 20 to 24 Years | 9 (20.9%) | 0 (0.0%) |
| 25 to 29 Years | 2 (4.6%) | 0 (0.0%) |
| 30 to 34 Years | 0 (0.0%) | 11 (10.8%) |
| 35 to 39 Years | 0 (0.0%) | 0 (0.0%) |
| 40 to 44 Years | 5 (11.6%) | 12 (11.8%) |
| 45 to 49 Years | 2 (4.6%) | 18 (17.6%) |
| 50 to 54 Years | 2 (4.6%) | 2 (2.0%) |
| 55 to 59 Years | 0 (0.0%) | 0 (0.0%) |
| 60 to 64 Years | 8 (18.6%) | 16 (15.7%) |
| 65 to 69 Years | 3 (7.0%) | 5 (4.9%) |
| 70 to 74 Years | 0 (0.0%) | 26 (25.5%) |
| 75 to 79 Years | 4 (9.3%) | 0 (0.0%) |
| 80 to 84 Years | 0 (0.0%) | 0 (0.0%) |
| 85 Years and over | 1 (2.3%) | 0 (0.0%) |
| Total | 43 (100.0%) | 102 (100.0%) |
Families and Households in West Point
Median Family Size in West Point
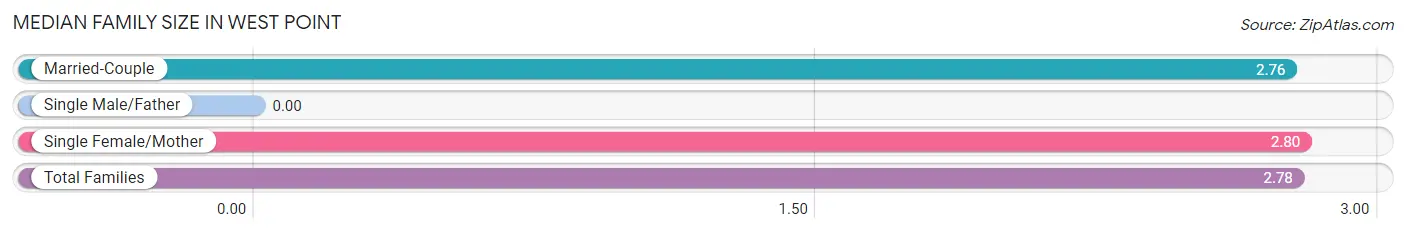
| Family Type | # Families | Family Size |
| Married-Couple | 17 (63.0%) | 2.76 |
| Single Male/Father | 0 (0.0%) | - |
| Single Female/Mother | 10 (37.0%) | 2.80 |
| Total Families | 27 (100.0%) | 2.78 |
Median Household Size in West Point
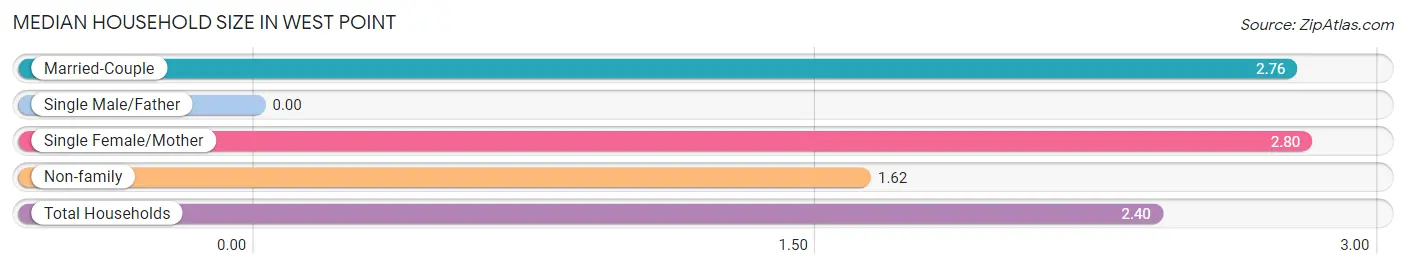
| Household Type | # Households | Household Size |
| Married-Couple | 17 (42.5%) | 2.76 |
| Single Male/Father | 0 (0.0%) | - |
| Single Female/Mother | 10 (25.0%) | 2.80 |
| Non-family | 13 (32.5%) | 1.62 |
| Total Households | 40 (100.0%) | 2.40 |
Household Size by Marriage Status in West Point
Out of a total of 40 households in West Point, 27 (67.5%) are family households, while 13 (32.5%) are nonfamily households. The most numerous type of family households are 3-person households, comprising 16, and the most common type of nonfamily households are 1-person households, comprising 12.
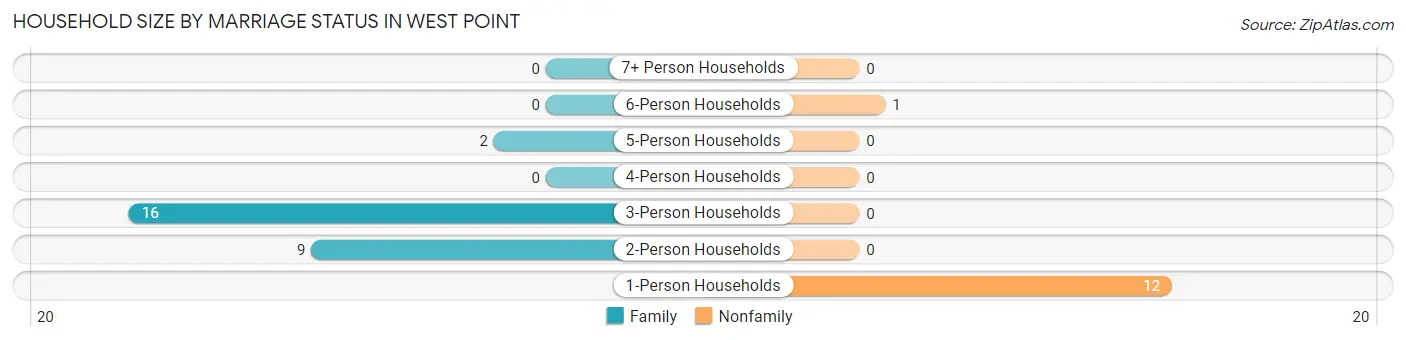
| Household Size | Family Households | Nonfamily Households |
| 1-Person Households | - | 12 (30.0%) |
| 2-Person Households | 9 (22.5%) | 0 (0.0%) |
| 3-Person Households | 16 (40.0%) | 0 (0.0%) |
| 4-Person Households | 0 (0.0%) | 0 (0.0%) |
| 5-Person Households | 2 (5.0%) | 0 (0.0%) |
| 6-Person Households | 0 (0.0%) | 1 (2.5%) |
| 7+ Person Households | 0 (0.0%) | 0 (0.0%) |
| Total | 27 (67.5%) | 13 (32.5%) |
Female Fertility in West Point
Fertility by Age in West Point
| Age Bracket | Women with Births | Births / 1,000 Women |
| 15 to 19 years | 0 (0.0%) | 0.0 |
| 20 to 34 years | 0 (0.0%) | 0.0 |
| 35 to 50 years | 0 (0.0%) | 0.0 |
| Total | 0 (0.0%) | 0.0 |
Fertility by Age by Marriage Status in West Point
| Age Bracket | Married | Unmarried |
| 15 to 19 years | 0 (0.0%) | 0 (0.0%) |
| 20 to 34 years | 0 (0.0%) | 0 (0.0%) |
| 35 to 50 years | 0 (0.0%) | 0 (0.0%) |
| Total | 0 (0.0%) | 0 (0.0%) |
Fertility by Education in West Point
| Educational Attainment | Women with Births | Births / 1,000 Women |
| Less than High School | 0 (0.0%) | 0.0 |
| High School Diploma | 0 (0.0%) | 0.0 |
| College or Associate's Degree | 0 (0.0%) | 0.0 |
| Bachelor's Degree | 0 (0.0%) | 0.0 |
| Graduate Degree | 0 (0.0%) | 0.0 |
| Total | 0 (0.0%) | 0.0 |
Fertility by Education by Marriage Status in West Point
| Educational Attainment | Married | Unmarried |
| Less than High School | 0 (0.0%) | 0 (0.0%) |
| High School Diploma | 0 (0.0%) | 0 (0.0%) |
| College or Associate's Degree | 0 (0.0%) | 0 (0.0%) |
| Bachelor's Degree | 0 (0.0%) | 0 (0.0%) |
| Graduate Degree | 0 (0.0%) | 0 (0.0%) |
| Total | 0 (0.0%) | 0 (0.0%) |
Employment Characteristics in West Point
Employment by Class of Employer in West Point
Among the 37 employed individuals in West Point, private company employees (25 | 67.6%), state government employees (8 | 21.6%), and not-for-profit organizations (3 | 8.1%) make up the most common classes of employment.
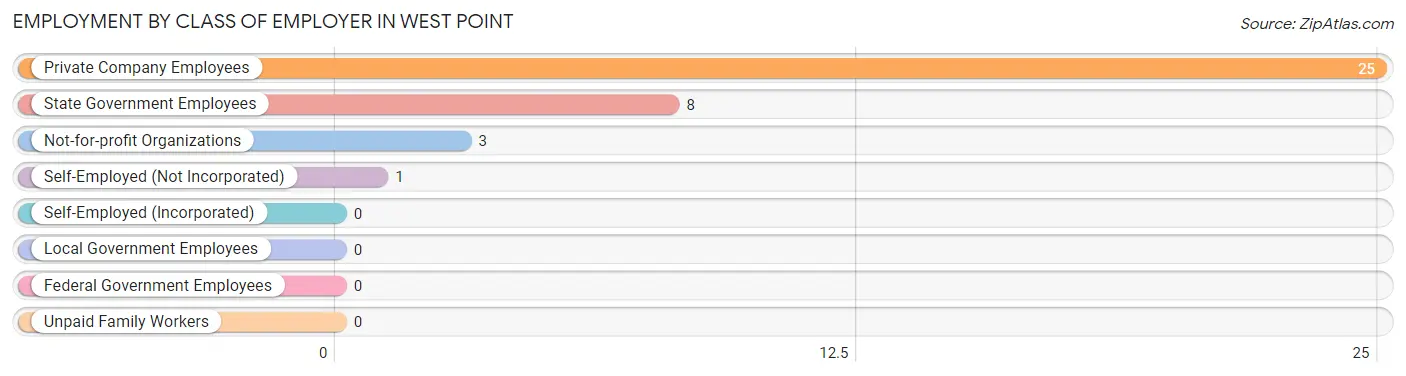
| Employer Class | # Employees | % Employees |
| Private Company Employees | 25 | 67.6% |
| Self-Employed (Incorporated) | 0 | 0.0% |
| Self-Employed (Not Incorporated) | 1 | 2.7% |
| Not-for-profit Organizations | 3 | 8.1% |
| Local Government Employees | 0 | 0.0% |
| State Government Employees | 8 | 21.6% |
| Federal Government Employees | 0 | 0.0% |
| Unpaid Family Workers | 0 | 0.0% |
| Total | 37 | 100.0% |
Employment Status by Age in West Point
According to the labor force statistics for West Point, out of the total population over 16 years of age (128), 34.4% or 44 individuals are in the labor force, with 6.8% or 3 of them unemployed. The age group with the highest labor force participation rate is 16 to 19 years, with 100.0% or 2 individuals in the labor force. Within the labor force, the 16 to 19 years age range has the highest percentage of unemployed individuals, with 100.0% or 2 of them being unemployed.
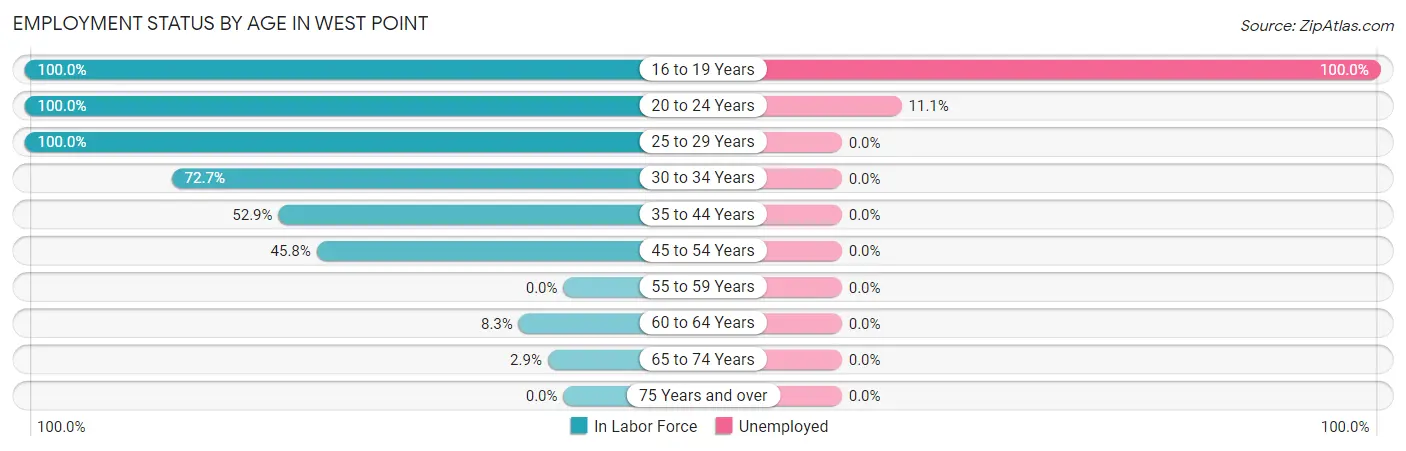
| Age Bracket | In Labor Force | Unemployed |
| 16 to 19 Years | 2 (100.0%) | 2 (100.0%) |
| 20 to 24 Years | 9 (100.0%) | 1 (11.1%) |
| 25 to 29 Years | 2 (100.0%) | 0 (0.0%) |
| 30 to 34 Years | 8 (72.7%) | 0 (0.0%) |
| 35 to 44 Years | 9 (52.9%) | 0 (0.0%) |
| 45 to 54 Years | 11 (45.8%) | 0 (0.0%) |
| 55 to 59 Years | 0 (0.0%) | 0 (0.0%) |
| 60 to 64 Years | 2 (8.3%) | 0 (0.0%) |
| 65 to 74 Years | 1 (2.9%) | 0 (0.0%) |
| 75 Years and over | 0 (0.0%) | 0 (0.0%) |
| Total | 44 (34.4%) | 3 (6.8%) |
Employment Status by Educational Attainment in West Point
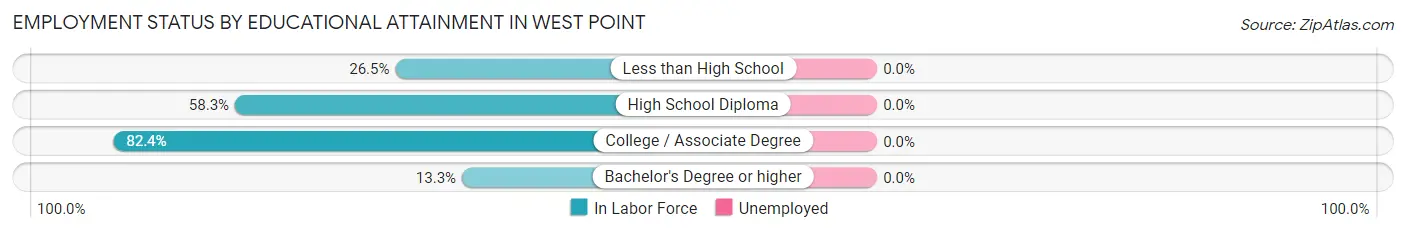
| Educational Attainment | In Labor Force | Unemployed |
| Less than High School | 9 (26.5%) | 0 (0.0%) |
| High School Diploma | 7 (58.3%) | 0 (0.0%) |
| College / Associate Degree | 14 (82.4%) | 0 (0.0%) |
| Bachelor's Degree or higher | 2 (13.3%) | 0 (0.0%) |
| Total | 32 (41.0%) | 0 (0.0%) |
Employment Occupations by Sex in West Point
Management, Business, Science and Arts Occupations
The most common Management, Business, Science and Arts occupations in West Point are Community & Social Service (9 | 22.0%), Education Instruction & Library (9 | 22.0%), Management (6 | 14.6%), Business & Financial (2 | 4.9%), and Computers, Engineering & Science (1 | 2.4%).
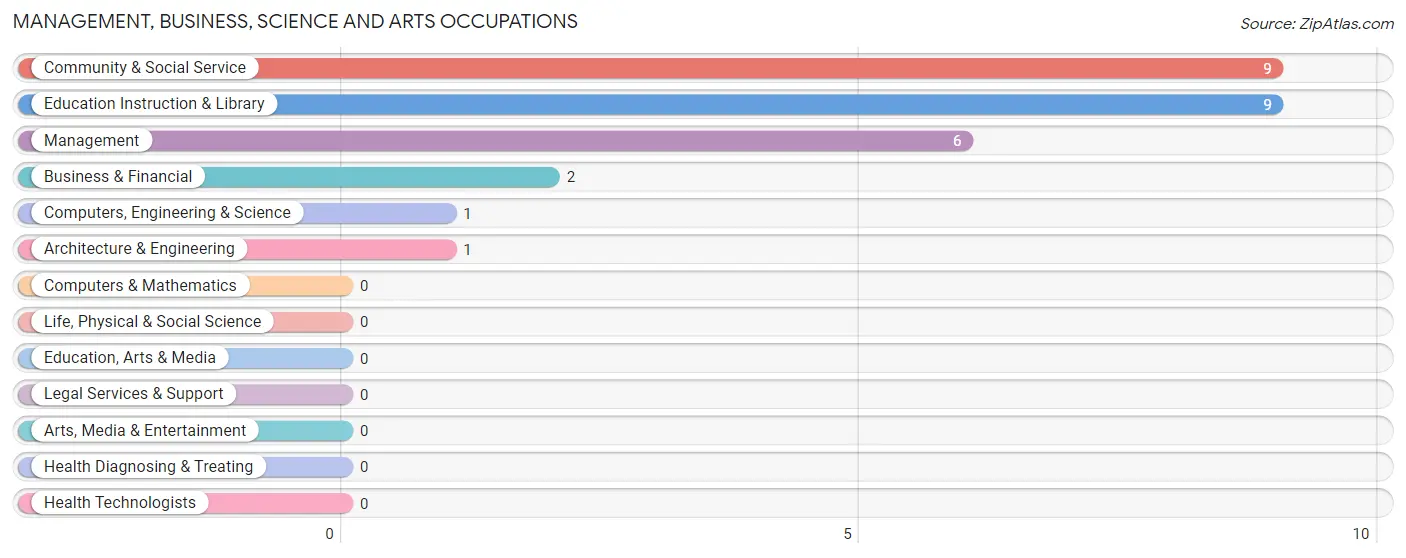
Management, Business, Science and Arts Occupations by Sex
Within the Management, Business, Science and Arts occupations in West Point, the most male-oriented occupations are Computers, Engineering & Science (100.0%), Architecture & Engineering (100.0%), and Management (16.7%), while the most female-oriented occupations are Business & Financial (100.0%), Community & Social Service (88.9%), and Education Instruction & Library (88.9%).
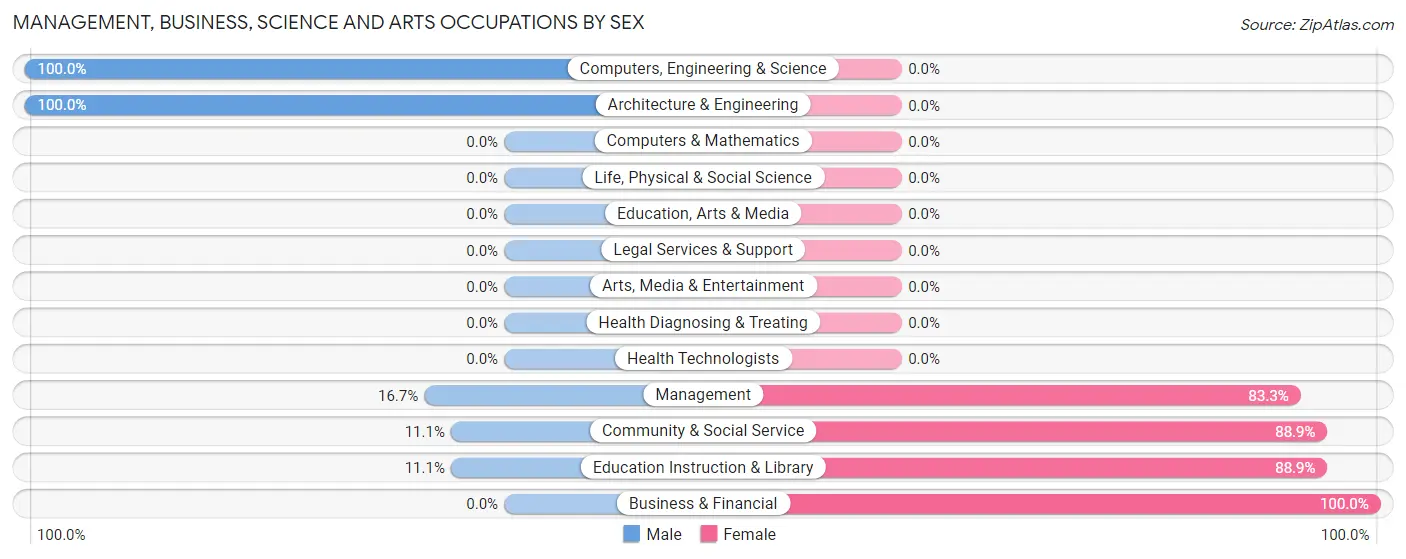
| Occupation | Male | Female |
| Management | 1 (16.7%) | 5 (83.3%) |
| Business & Financial | 0 (0.0%) | 2 (100.0%) |
| Computers, Engineering & Science | 1 (100.0%) | 0 (0.0%) |
| Computers & Mathematics | 0 (0.0%) | 0 (0.0%) |
| Architecture & Engineering | 1 (100.0%) | 0 (0.0%) |
| Life, Physical & Social Science | 0 (0.0%) | 0 (0.0%) |
| Community & Social Service | 1 (11.1%) | 8 (88.9%) |
| Education, Arts & Media | 0 (0.0%) | 0 (0.0%) |
| Legal Services & Support | 0 (0.0%) | 0 (0.0%) |
| Education Instruction & Library | 1 (11.1%) | 8 (88.9%) |
| Arts, Media & Entertainment | 0 (0.0%) | 0 (0.0%) |
| Health Diagnosing & Treating | 0 (0.0%) | 0 (0.0%) |
| Health Technologists | 0 (0.0%) | 0 (0.0%) |
| Total (Category) | 3 (16.7%) | 15 (83.3%) |
| Total (Overall) | 21 (51.2%) | 20 (48.8%) |
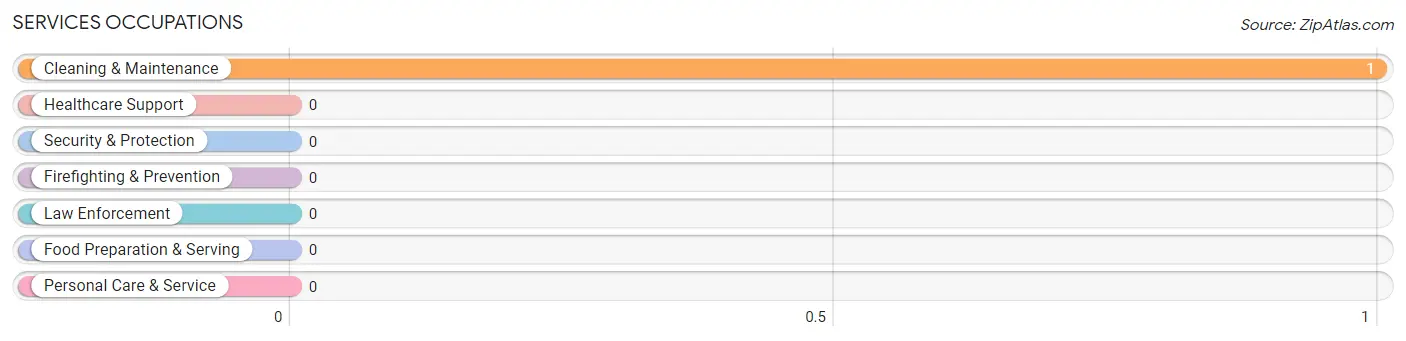
Services Occupations
The most common Services occupations in West Point are , and Cleaning & Maintenance (1 | 2.4%).
Services Occupations by Sex
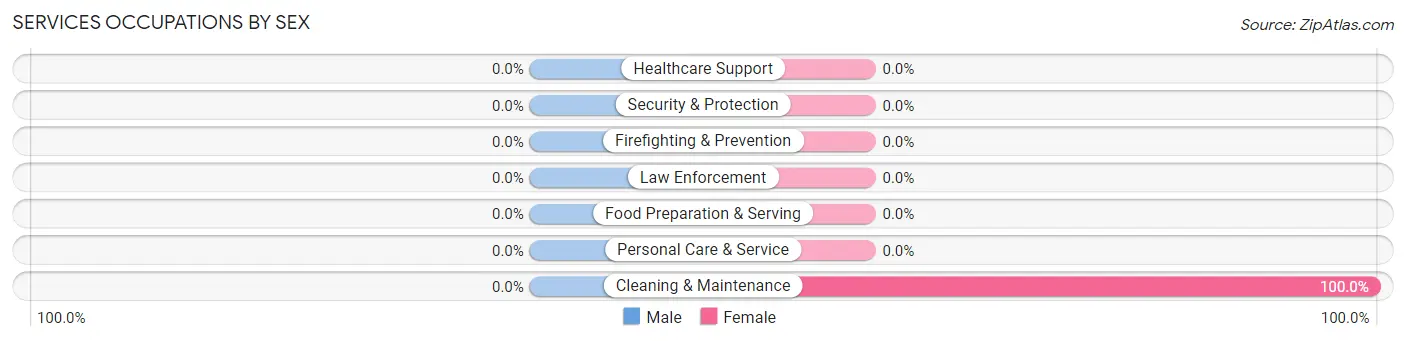
| Occupation | Male | Female |
| Healthcare Support | 0 (0.0%) | 0 (0.0%) |
| Security & Protection | 0 (0.0%) | 0 (0.0%) |
| Firefighting & Prevention | 0 (0.0%) | 0 (0.0%) |
| Law Enforcement | 0 (0.0%) | 0 (0.0%) |
| Food Preparation & Serving | 0 (0.0%) | 0 (0.0%) |
| Cleaning & Maintenance | 0 (0.0%) | 1 (100.0%) |
| Personal Care & Service | 0 (0.0%) | 0 (0.0%) |
| Total (Category) | 0 (0.0%) | 1 (100.0%) |
| Total (Overall) | 21 (51.2%) | 20 (48.8%) |
Sales and Office Occupations
The most common Sales and Office occupations in West Point are Sales & Related (2 | 4.9%), and Office & Administration (2 | 4.9%).
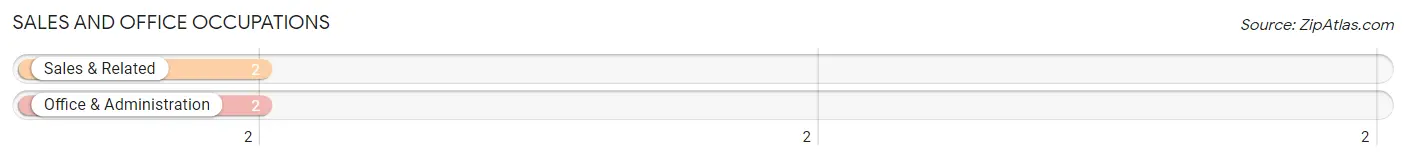
Sales and Office Occupations by Sex
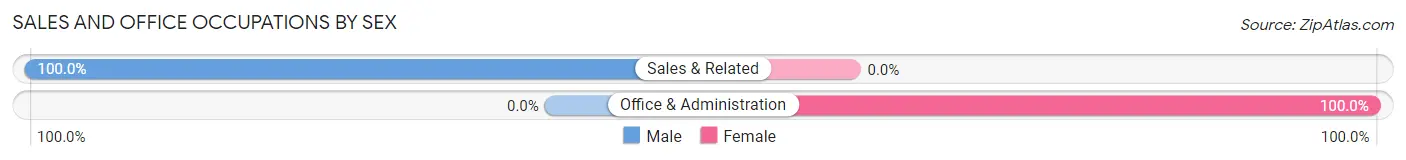
| Occupation | Male | Female |
| Sales & Related | 2 (100.0%) | 0 (0.0%) |
| Office & Administration | 0 (0.0%) | 2 (100.0%) |
| Total (Category) | 2 (50.0%) | 2 (50.0%) |
| Total (Overall) | 21 (51.2%) | 20 (48.8%) |
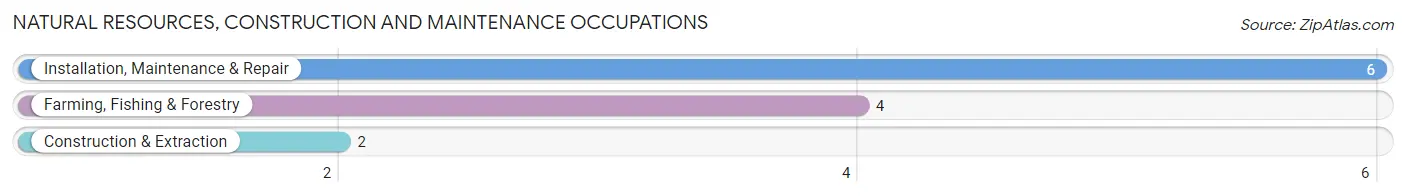
Natural Resources, Construction and Maintenance Occupations
The most common Natural Resources, Construction and Maintenance occupations in West Point are Installation, Maintenance & Repair (6 | 14.6%), Farming, Fishing & Forestry (4 | 9.8%), and Construction & Extraction (2 | 4.9%).
Natural Resources, Construction and Maintenance Occupations by Sex
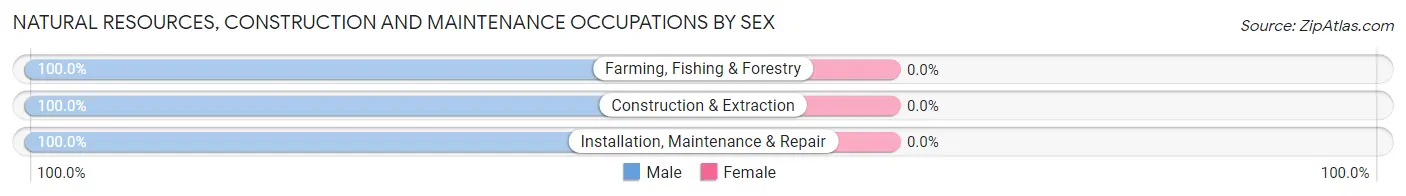
| Occupation | Male | Female |
| Farming, Fishing & Forestry | 4 (100.0%) | 0 (0.0%) |
| Construction & Extraction | 2 (100.0%) | 0 (0.0%) |
| Installation, Maintenance & Repair | 6 (100.0%) | 0 (0.0%) |
| Total (Category) | 12 (100.0%) | 0 (0.0%) |
| Total (Overall) | 21 (51.2%) | 20 (48.8%) |
Production, Transportation and Moving Occupations
The most common Production, Transportation and Moving occupations in West Point are , and Production (6 | 14.6%).
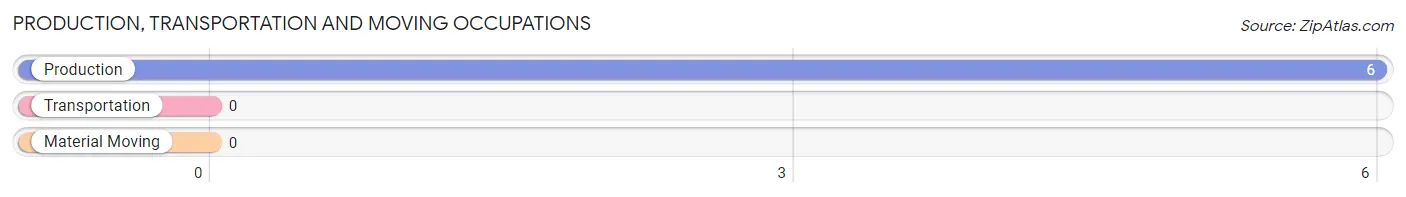
Production, Transportation and Moving Occupations by Sex
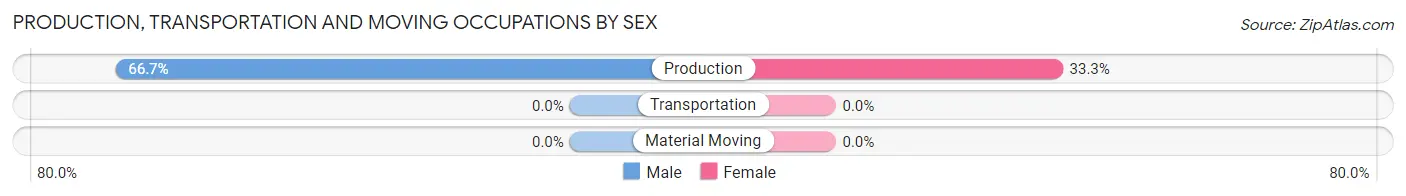
| Occupation | Male | Female |
| Production | 4 (66.7%) | 2 (33.3%) |
| Transportation | 0 (0.0%) | 0 (0.0%) |
| Material Moving | 0 (0.0%) | 0 (0.0%) |
| Total (Category) | 4 (66.7%) | 2 (33.3%) |
| Total (Overall) | 21 (51.2%) | 20 (48.8%) |
Employment Industries by Sex in West Point
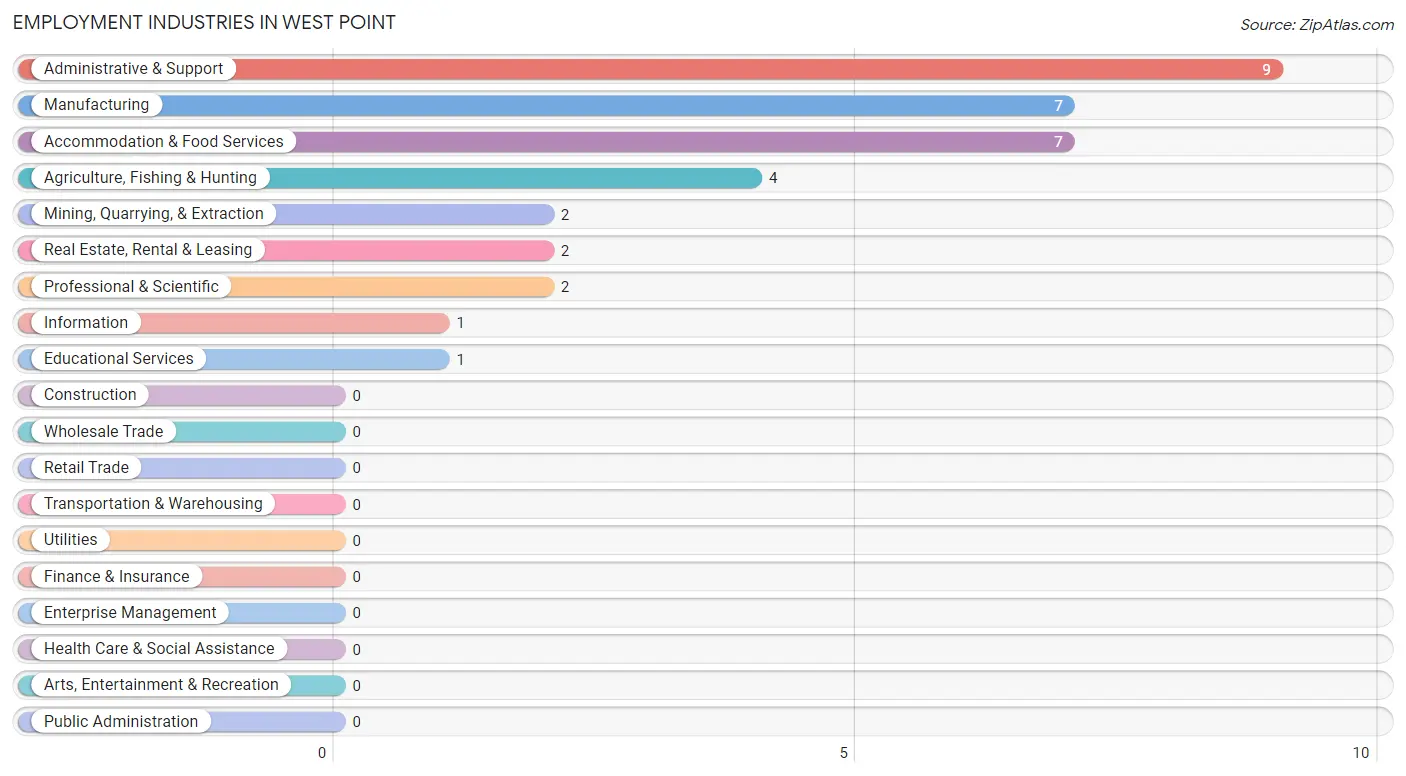
Employment Industries in West Point
The major employment industries in West Point include Administrative & Support (9 | 22.0%), Manufacturing (7 | 17.1%), Accommodation & Food Services (7 | 17.1%), Agriculture, Fishing & Hunting (4 | 9.8%), and Mining, Quarrying, & Extraction (2 | 4.9%).
Employment Industries by Sex in West Point
The West Point industries that see more men than women are Agriculture, Fishing & Hunting (100.0%), Mining, Quarrying, & Extraction (100.0%), and Information (100.0%), whereas the industries that tend to have a higher number of women are Real Estate, Rental & Leasing (100.0%), Professional & Scientific (100.0%), and Administrative & Support (100.0%).
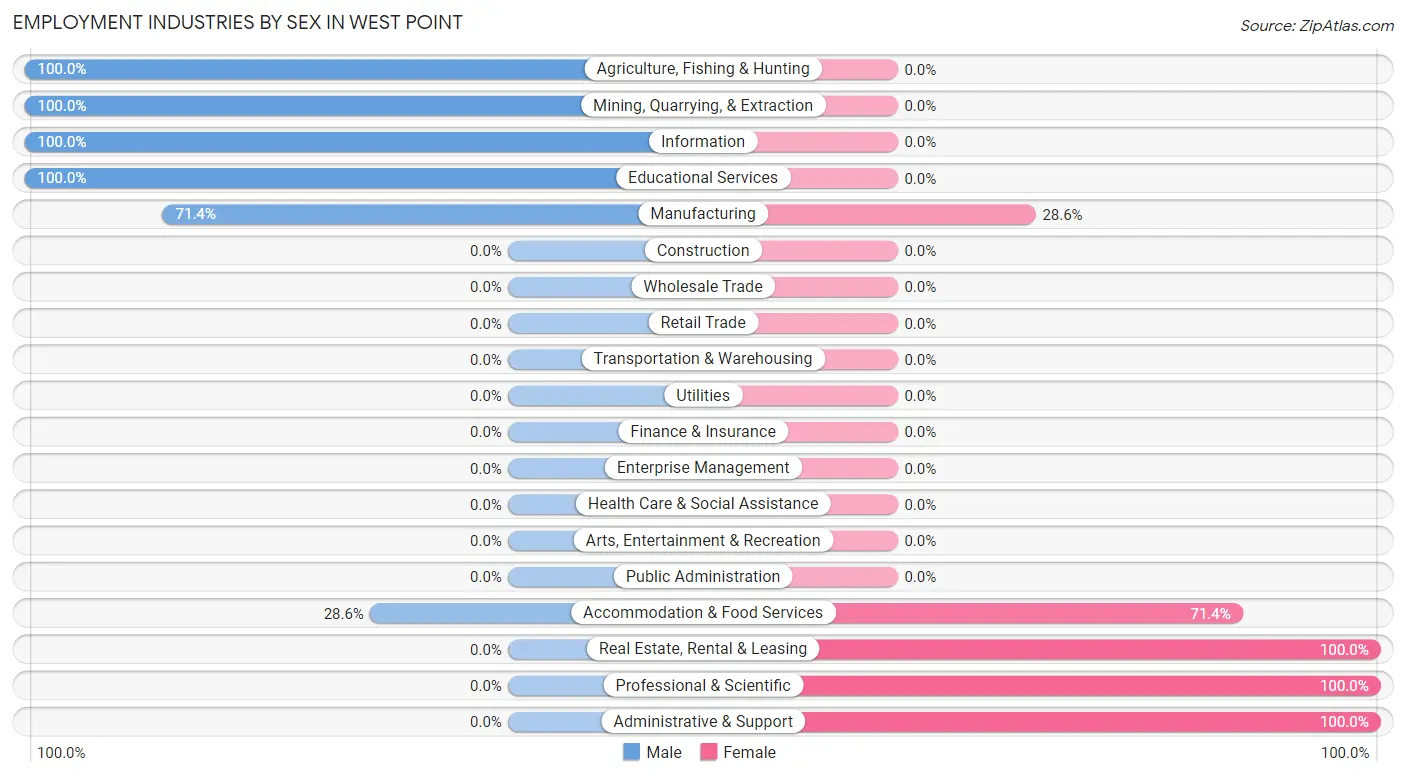
| Industry | Male | Female |
| Agriculture, Fishing & Hunting | 4 (100.0%) | 0 (0.0%) |
| Mining, Quarrying, & Extraction | 2 (100.0%) | 0 (0.0%) |
| Construction | 0 (0.0%) | 0 (0.0%) |
| Manufacturing | 5 (71.4%) | 2 (28.6%) |
| Wholesale Trade | 0 (0.0%) | 0 (0.0%) |
| Retail Trade | 0 (0.0%) | 0 (0.0%) |
| Transportation & Warehousing | 0 (0.0%) | 0 (0.0%) |
| Utilities | 0 (0.0%) | 0 (0.0%) |
| Information | 1 (100.0%) | 0 (0.0%) |
| Finance & Insurance | 0 (0.0%) | 0 (0.0%) |
| Real Estate, Rental & Leasing | 0 (0.0%) | 2 (100.0%) |
| Professional & Scientific | 0 (0.0%) | 2 (100.0%) |
| Enterprise Management | 0 (0.0%) | 0 (0.0%) |
| Administrative & Support | 0 (0.0%) | 9 (100.0%) |
| Educational Services | 1 (100.0%) | 0 (0.0%) |
| Health Care & Social Assistance | 0 (0.0%) | 0 (0.0%) |
| Arts, Entertainment & Recreation | 0 (0.0%) | 0 (0.0%) |
| Accommodation & Food Services | 2 (28.6%) | 5 (71.4%) |
| Public Administration | 0 (0.0%) | 0 (0.0%) |
| Total | 21 (51.2%) | 20 (48.8%) |
Education in West Point
School Enrollment in West Point
The most common levels of schooling among the 24 students in West Point are middle school (13 | 54.2%), college / undergraduate (5 | 20.8%), and elementary school (2 | 8.3%).
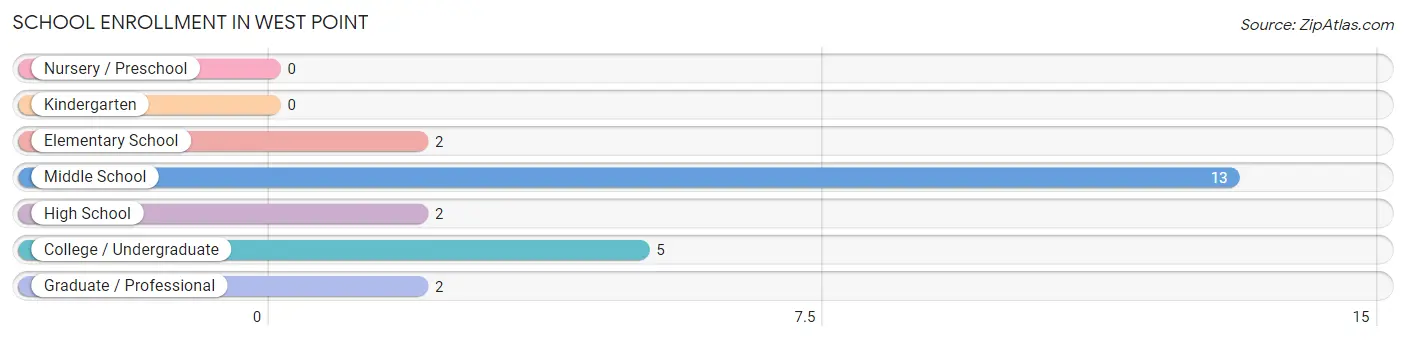
| School Level | # Students | % Students |
| Nursery / Preschool | 0 | 0.0% |
| Kindergarten | 0 | 0.0% |
| Elementary School | 2 | 8.3% |
| Middle School | 13 | 54.2% |
| High School | 2 | 8.3% |
| College / Undergraduate | 5 | 20.8% |
| Graduate / Professional | 2 | 8.3% |
| Total | 24 | 100.0% |
School Enrollment by Age by Funding Source in West Point
Out of a total of 24 students who are enrolled in schools in West Point, 9 (37.5%) attend a private institution, while the remaining 15 (62.5%) are enrolled in public schools. The age group of 5 to 9 year old has the highest likelihood of being enrolled in private schools, with 2 (100.0% in the age bracket) enrolled. Conversely, the age group of 10 to 14 year olds has the lowest likelihood of being enrolled in a private school, with 13 (100.0% in the age bracket) attending a public institution.
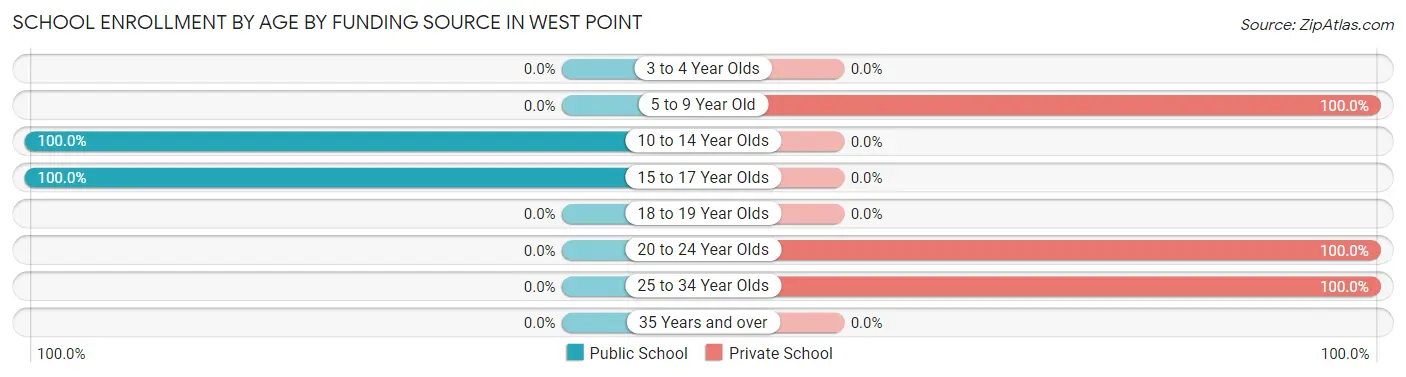
| Age Bracket | Public School | Private School |
| 3 to 4 Year Olds | 0 (0.0%) | 0 (0.0%) |
| 5 to 9 Year Old | 0 (0.0%) | 2 (100.0%) |
| 10 to 14 Year Olds | 13 (100.0%) | 0 (0.0%) |
| 15 to 17 Year Olds | 2 (100.0%) | 0 (0.0%) |
| 18 to 19 Year Olds | 0 (0.0%) | 0 (0.0%) |
| 20 to 24 Year Olds | 0 (0.0%) | 5 (100.0%) |
| 25 to 34 Year Olds | 0 (0.0%) | 2 (100.0%) |
| 35 Years and over | 0 (0.0%) | 0 (0.0%) |
| Total | 15 (62.5%) | 9 (37.5%) |
Educational Attainment by Field of Study in West Point
Engineering (13 | 86.7%), and liberal arts & history (2 | 13.3%) are the most common fields of study among 15 individuals in West Point who have obtained a bachelor's degree or higher.
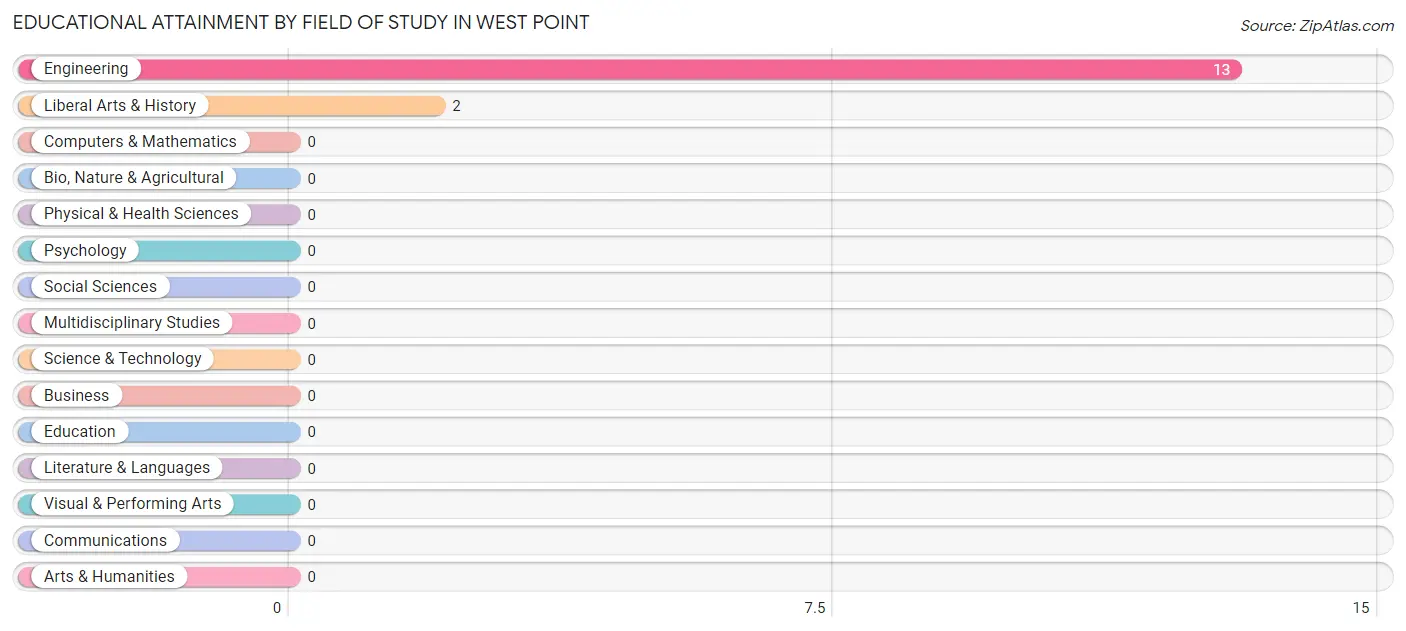
| Field of Study | # Graduates | % Graduates |
| Computers & Mathematics | 0 | 0.0% |
| Bio, Nature & Agricultural | 0 | 0.0% |
| Physical & Health Sciences | 0 | 0.0% |
| Psychology | 0 | 0.0% |
| Social Sciences | 0 | 0.0% |
| Engineering | 13 | 86.7% |
| Multidisciplinary Studies | 0 | 0.0% |
| Science & Technology | 0 | 0.0% |
| Business | 0 | 0.0% |
| Education | 0 | 0.0% |
| Literature & Languages | 0 | 0.0% |
| Liberal Arts & History | 2 | 13.3% |
| Visual & Performing Arts | 0 | 0.0% |
| Communications | 0 | 0.0% |
| Arts & Humanities | 0 | 0.0% |
| Total | 15 | 100.0% |
Transportation & Commute in West Point
Vehicle Availability by Sex in West Point
The most prevalent vehicle ownership categories in West Point are males with 5 or more vehicles (12, accounting for 70.6%) and females with 5 or more vehicles (0, making up 60.0%).
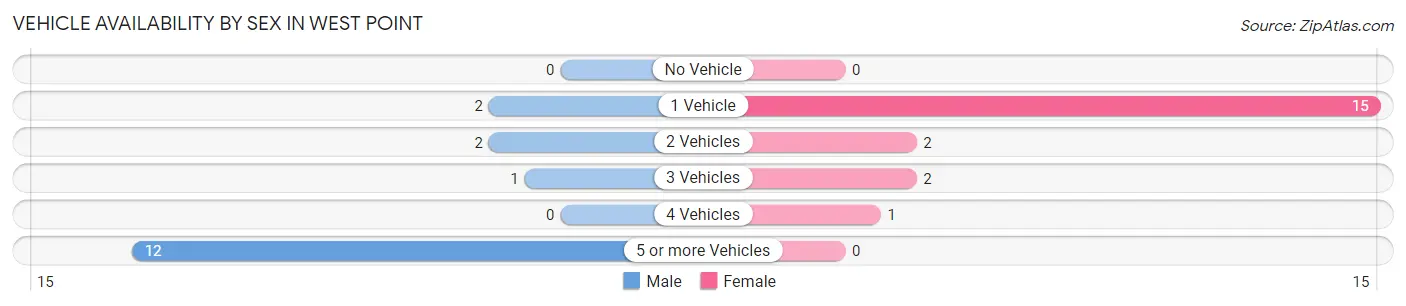
| Vehicles Available | Male | Female |
| No Vehicle | 0 (0.0%) | 0 (0.0%) |
| 1 Vehicle | 2 (11.8%) | 15 (75.0%) |
| 2 Vehicles | 2 (11.8%) | 2 (10.0%) |
| 3 Vehicles | 1 (5.9%) | 2 (10.0%) |
| 4 Vehicles | 0 (0.0%) | 1 (5.0%) |
| 5 or more Vehicles | 12 (70.6%) | 0 (0.0%) |
| Total | 17 (100.0%) | 20 (100.0%) |
Commute Time in West Point
The most frequently occuring commute durations in West Point are less than 5 minutes (13 commuters, 35.1%), 15 to 19 minutes (10 commuters, 27.0%), and 5 to 9 minutes (9 commuters, 24.3%).
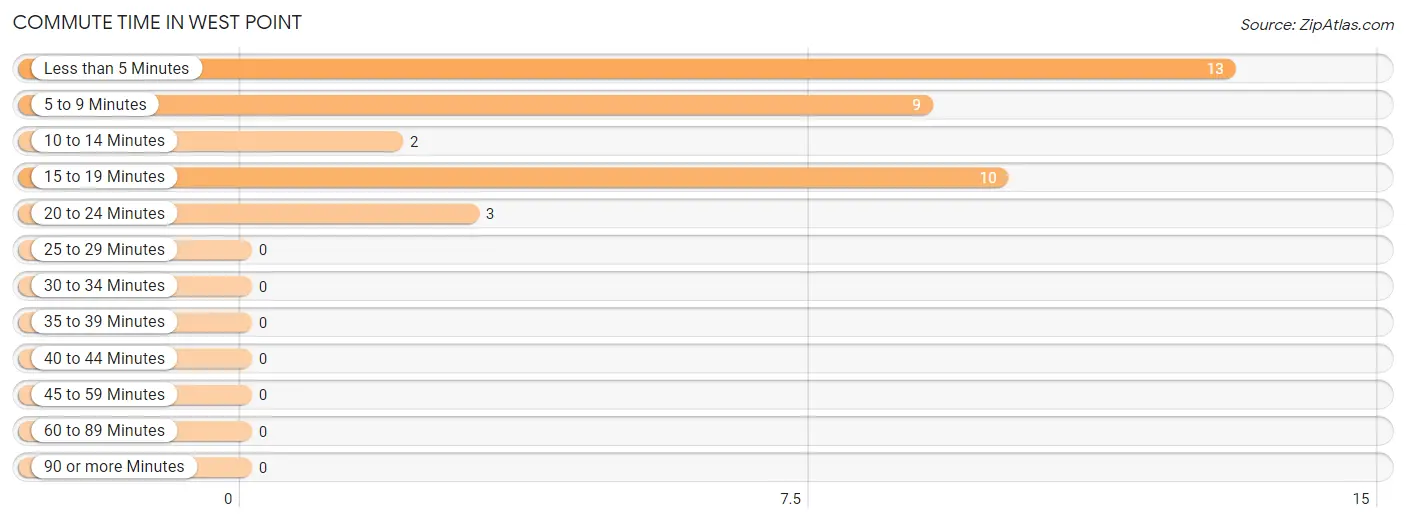
| Commute Time | # Commuters | % Commuters |
| Less than 5 Minutes | 13 | 35.1% |
| 5 to 9 Minutes | 9 | 24.3% |
| 10 to 14 Minutes | 2 | 5.4% |
| 15 to 19 Minutes | 10 | 27.0% |
| 20 to 24 Minutes | 3 | 8.1% |
| 25 to 29 Minutes | 0 | 0.0% |
| 30 to 34 Minutes | 0 | 0.0% |
| 35 to 39 Minutes | 0 | 0.0% |
| 40 to 44 Minutes | 0 | 0.0% |
| 45 to 59 Minutes | 0 | 0.0% |
| 60 to 89 Minutes | 0 | 0.0% |
| 90 or more Minutes | 0 | 0.0% |
Commute Time by Sex in West Point
The most common commute times in West Point are 5 to 9 minutes (7 commuters, 41.2%) for males and less than 5 minutes (10 commuters, 50.0%) for females.
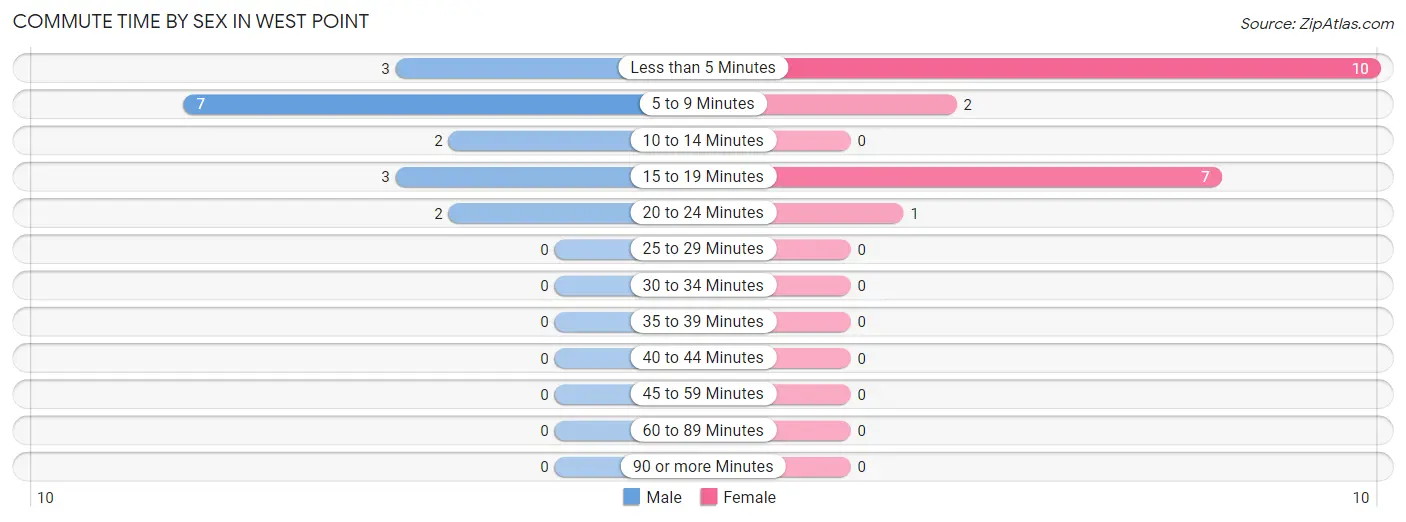
| Commute Time | Male | Female |
| Less than 5 Minutes | 3 (17.6%) | 10 (50.0%) |
| 5 to 9 Minutes | 7 (41.2%) | 2 (10.0%) |
| 10 to 14 Minutes | 2 (11.8%) | 0 (0.0%) |
| 15 to 19 Minutes | 3 (17.6%) | 7 (35.0%) |
| 20 to 24 Minutes | 2 (11.8%) | 1 (5.0%) |
| 25 to 29 Minutes | 0 (0.0%) | 0 (0.0%) |
| 30 to 34 Minutes | 0 (0.0%) | 0 (0.0%) |
| 35 to 39 Minutes | 0 (0.0%) | 0 (0.0%) |
| 40 to 44 Minutes | 0 (0.0%) | 0 (0.0%) |
| 45 to 59 Minutes | 0 (0.0%) | 0 (0.0%) |
| 60 to 89 Minutes | 0 (0.0%) | 0 (0.0%) |
| 90 or more Minutes | 0 (0.0%) | 0 (0.0%) |
Time of Departure to Work by Sex in West Point
The most frequent times of departure to work in West Point are 7:30 AM to 7:59 AM (4, 23.5%) for males and 4:00 PM to 11:59 PM (10, 50.0%) for females.
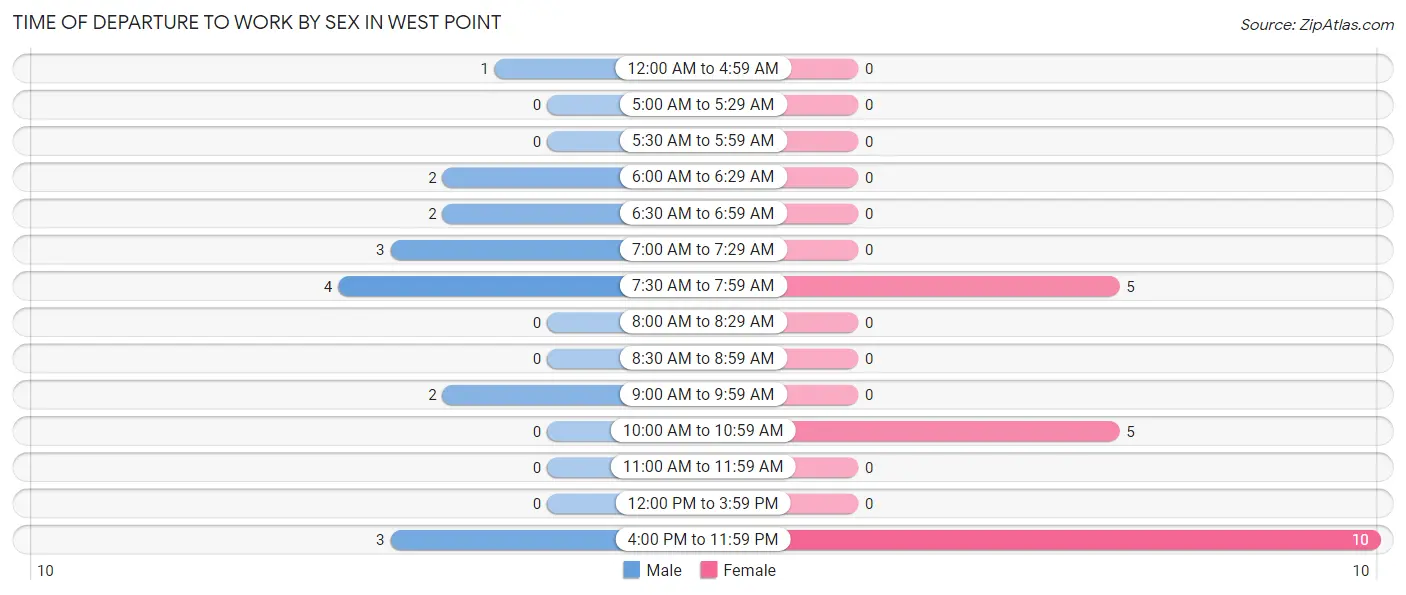
| Time of Departure | Male | Female |
| 12:00 AM to 4:59 AM | 1 (5.9%) | 0 (0.0%) |
| 5:00 AM to 5:29 AM | 0 (0.0%) | 0 (0.0%) |
| 5:30 AM to 5:59 AM | 0 (0.0%) | 0 (0.0%) |
| 6:00 AM to 6:29 AM | 2 (11.8%) | 0 (0.0%) |
| 6:30 AM to 6:59 AM | 2 (11.8%) | 0 (0.0%) |
| 7:00 AM to 7:29 AM | 3 (17.6%) | 0 (0.0%) |
| 7:30 AM to 7:59 AM | 4 (23.5%) | 5 (25.0%) |
| 8:00 AM to 8:29 AM | 0 (0.0%) | 0 (0.0%) |
| 8:30 AM to 8:59 AM | 0 (0.0%) | 0 (0.0%) |
| 9:00 AM to 9:59 AM | 2 (11.8%) | 0 (0.0%) |
| 10:00 AM to 10:59 AM | 0 (0.0%) | 5 (25.0%) |
| 11:00 AM to 11:59 AM | 0 (0.0%) | 0 (0.0%) |
| 12:00 PM to 3:59 PM | 0 (0.0%) | 0 (0.0%) |
| 4:00 PM to 11:59 PM | 3 (17.6%) | 10 (50.0%) |
| Total | 17 (100.0%) | 20 (100.0%) |
Housing Occupancy in West Point
Occupancy by Ownership in West Point
Of the total 40 dwellings in West Point, owner-occupied units account for 29 (72.5%), while renter-occupied units make up 11 (27.5%).
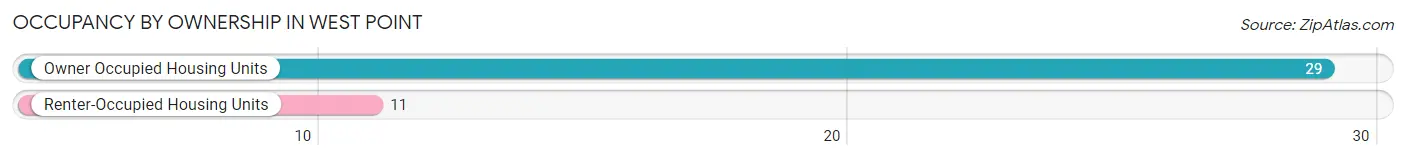
| Occupancy | # Housing Units | % Housing Units |
| Owner Occupied Housing Units | 29 | 72.5% |
| Renter-Occupied Housing Units | 11 | 27.5% |
| Total Occupied Housing Units | 40 | 100.0% |
Occupancy by Household Size in West Point
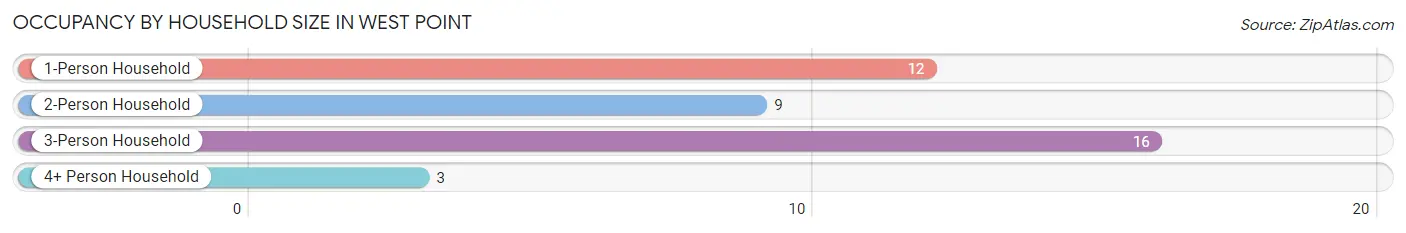
| Household Size | # Housing Units | % Housing Units |
| 1-Person Household | 12 | 30.0% |
| 2-Person Household | 9 | 22.5% |
| 3-Person Household | 16 | 40.0% |
| 4+ Person Household | 3 | 7.5% |
| Total Housing Units | 40 | 100.0% |
Occupancy by Ownership by Household Size in West Point
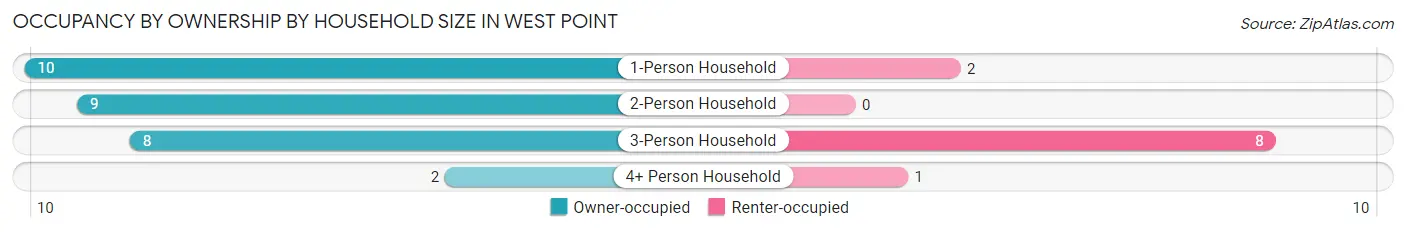
| Household Size | Owner-occupied | Renter-occupied |
| 1-Person Household | 10 (83.3%) | 2 (16.7%) |
| 2-Person Household | 9 (100.0%) | 0 (0.0%) |
| 3-Person Household | 8 (50.0%) | 8 (50.0%) |
| 4+ Person Household | 2 (66.7%) | 1 (33.3%) |
| Total Housing Units | 29 (72.5%) | 11 (27.5%) |
Occupancy by Educational Attainment in West Point
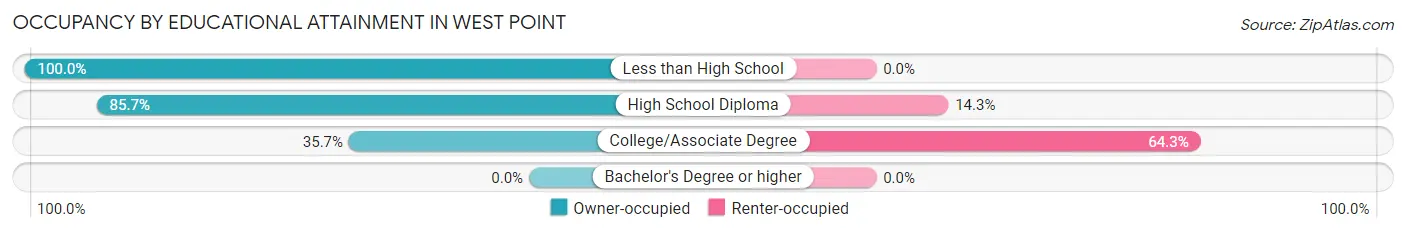
| Household Size | Owner-occupied | Renter-occupied |
| Less than High School | 12 (100.0%) | 0 (0.0%) |
| High School Diploma | 12 (85.7%) | 2 (14.3%) |
| College/Associate Degree | 5 (35.7%) | 9 (64.3%) |
| Bachelor's Degree or higher | 0 (0.0%) | 0 (0.0%) |
Occupancy by Age of Householder in West Point
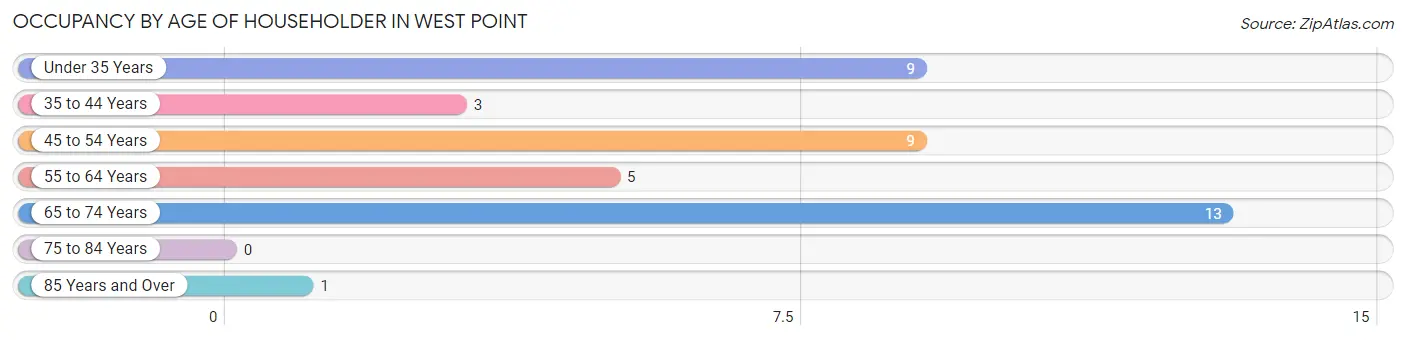
| Age Bracket | # Households | % Households |
| Under 35 Years | 9 | 22.5% |
| 35 to 44 Years | 3 | 7.5% |
| 45 to 54 Years | 9 | 22.5% |
| 55 to 64 Years | 5 | 12.5% |
| 65 to 74 Years | 13 | 32.5% |
| 75 to 84 Years | 0 | 0.0% |
| 85 Years and Over | 1 | 2.5% |
| Total | 40 | 100.0% |
Housing Finances in West Point
Median Income by Occupancy in West Point
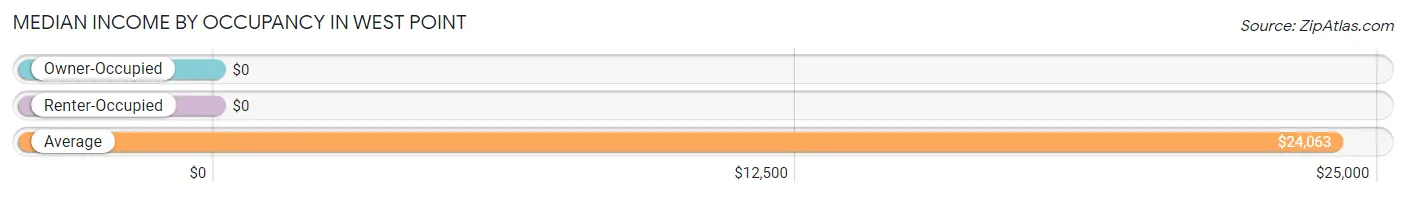
| Occupancy Type | # Households | Median Income |
| Owner-Occupied | 29 (72.5%) | $0 |
| Renter-Occupied | 11 (27.5%) | $0 |
| Average | 40 (100.0%) | $24,063 |
Occupancy by Householder Income Bracket in West Point
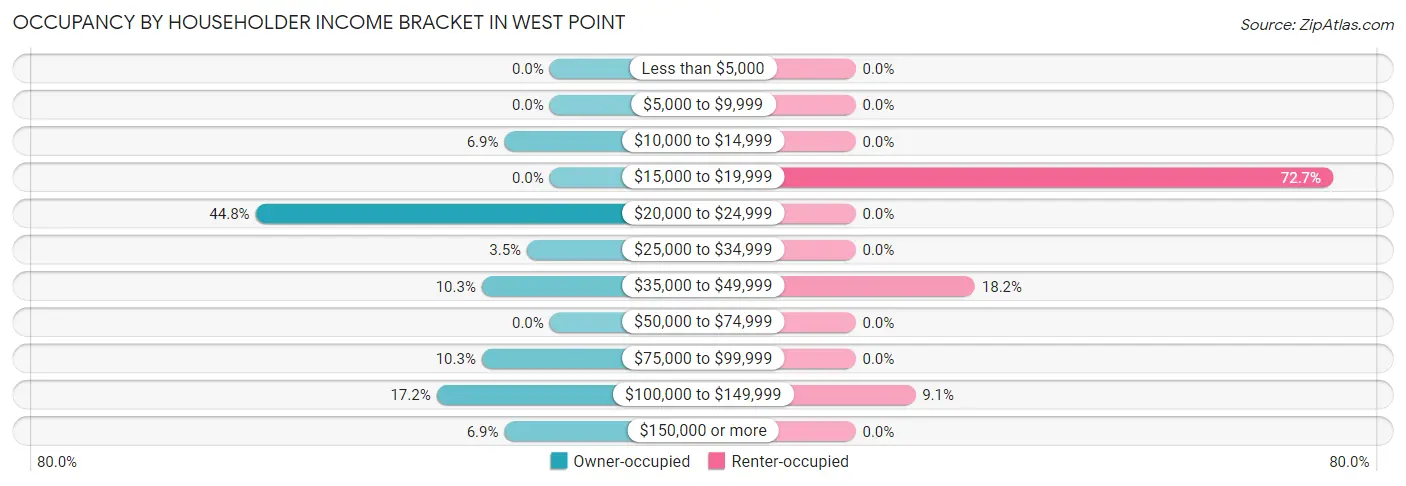
| Income Bracket | Owner-occupied | Renter-occupied |
| Less than $5,000 | 0 (0.0%) | 0 (0.0%) |
| $5,000 to $9,999 | 0 (0.0%) | 0 (0.0%) |
| $10,000 to $14,999 | 2 (6.9%) | 0 (0.0%) |
| $15,000 to $19,999 | 0 (0.0%) | 8 (72.7%) |
| $20,000 to $24,999 | 13 (44.8%) | 0 (0.0%) |
| $25,000 to $34,999 | 1 (3.5%) | 0 (0.0%) |
| $35,000 to $49,999 | 3 (10.3%) | 2 (18.2%) |
| $50,000 to $74,999 | 0 (0.0%) | 0 (0.0%) |
| $75,000 to $99,999 | 3 (10.3%) | 0 (0.0%) |
| $100,000 to $149,999 | 5 (17.2%) | 1 (9.1%) |
| $150,000 or more | 2 (6.9%) | 0 (0.0%) |
| Total | 29 (100.0%) | 11 (100.0%) |
Monthly Housing Cost Tiers in West Point
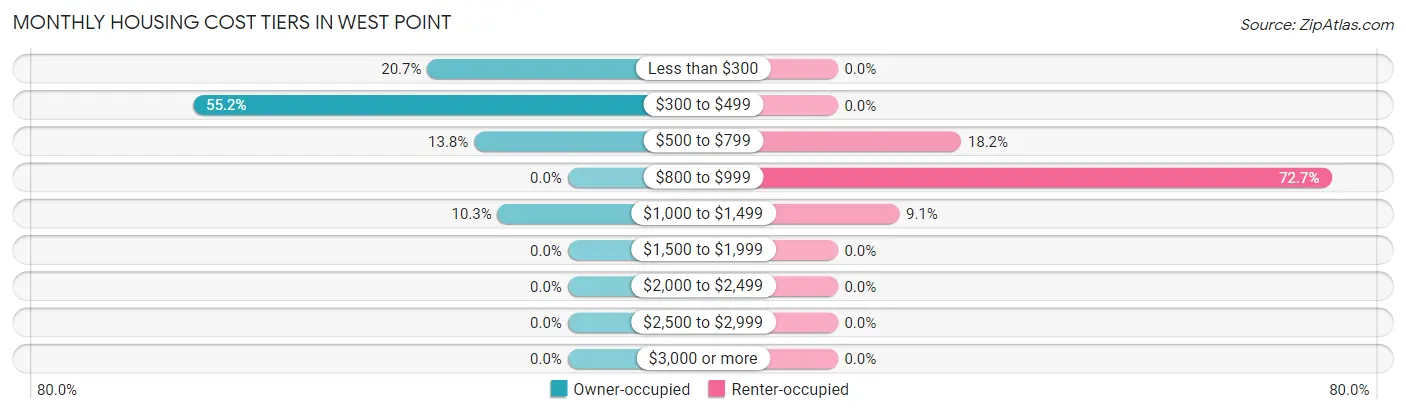
| Monthly Cost | Owner-occupied | Renter-occupied |
| Less than $300 | 6 (20.7%) | 0 (0.0%) |
| $300 to $499 | 16 (55.2%) | 0 (0.0%) |
| $500 to $799 | 4 (13.8%) | 2 (18.2%) |
| $800 to $999 | 0 (0.0%) | 8 (72.7%) |
| $1,000 to $1,499 | 3 (10.3%) | 1 (9.1%) |
| $1,500 to $1,999 | 0 (0.0%) | 0 (0.0%) |
| $2,000 to $2,499 | 0 (0.0%) | 0 (0.0%) |
| $2,500 to $2,999 | 0 (0.0%) | 0 (0.0%) |
| $3,000 or more | 0 (0.0%) | 0 (0.0%) |
| Total | 29 (100.0%) | 11 (100.0%) |
Physical Housing Characteristics in West Point
Housing Structures in West Point
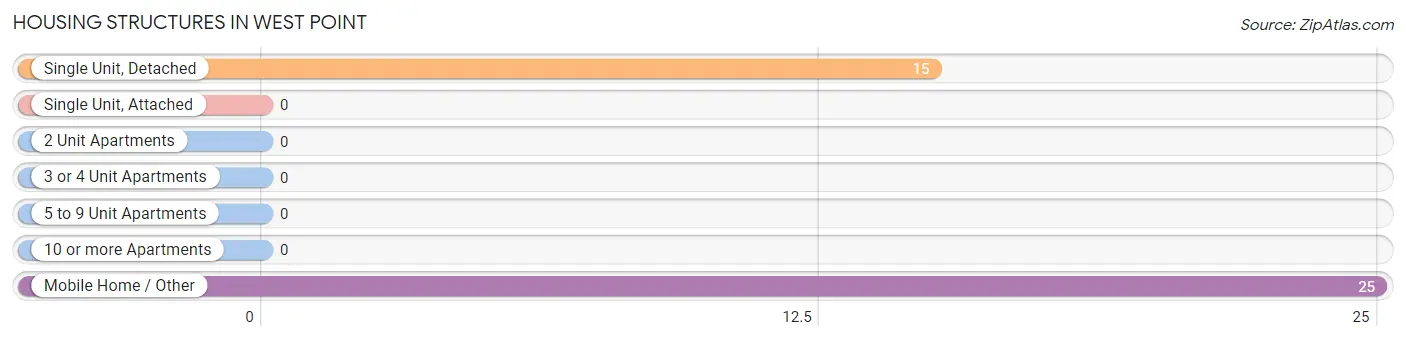
| Structure Type | # Housing Units | % Housing Units |
| Single Unit, Detached | 15 | 37.5% |
| Single Unit, Attached | 0 | 0.0% |
| 2 Unit Apartments | 0 | 0.0% |
| 3 or 4 Unit Apartments | 0 | 0.0% |
| 5 to 9 Unit Apartments | 0 | 0.0% |
| 10 or more Apartments | 0 | 0.0% |
| Mobile Home / Other | 25 | 62.5% |
| Total | 40 | 100.0% |
Housing Structures by Occupancy in West Point
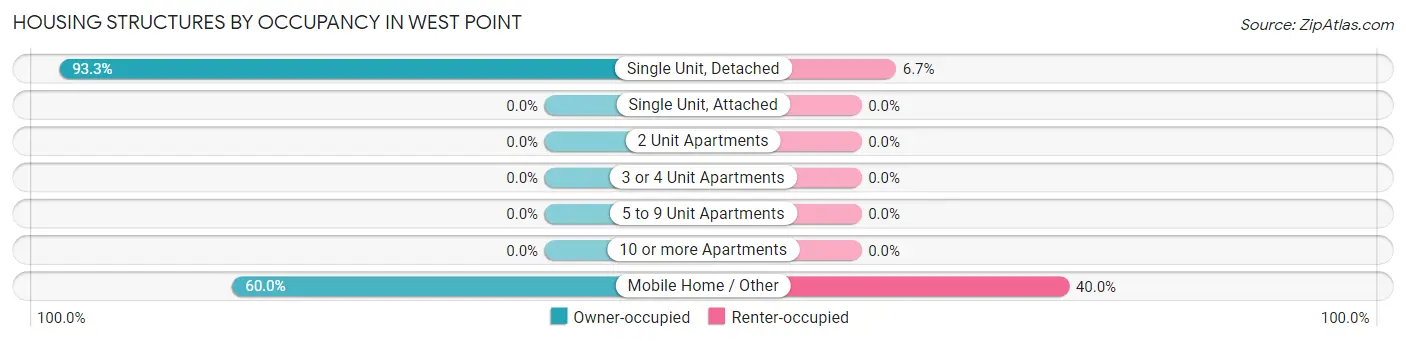
| Structure Type | Owner-occupied | Renter-occupied |
| Single Unit, Detached | 14 (93.3%) | 1 (6.7%) |
| Single Unit, Attached | 0 (0.0%) | 0 (0.0%) |
| 2 Unit Apartments | 0 (0.0%) | 0 (0.0%) |
| 3 or 4 Unit Apartments | 0 (0.0%) | 0 (0.0%) |
| 5 to 9 Unit Apartments | 0 (0.0%) | 0 (0.0%) |
| 10 or more Apartments | 0 (0.0%) | 0 (0.0%) |
| Mobile Home / Other | 15 (60.0%) | 10 (40.0%) |
| Total | 29 (72.5%) | 11 (27.5%) |
Housing Structures by Number of Rooms in West Point
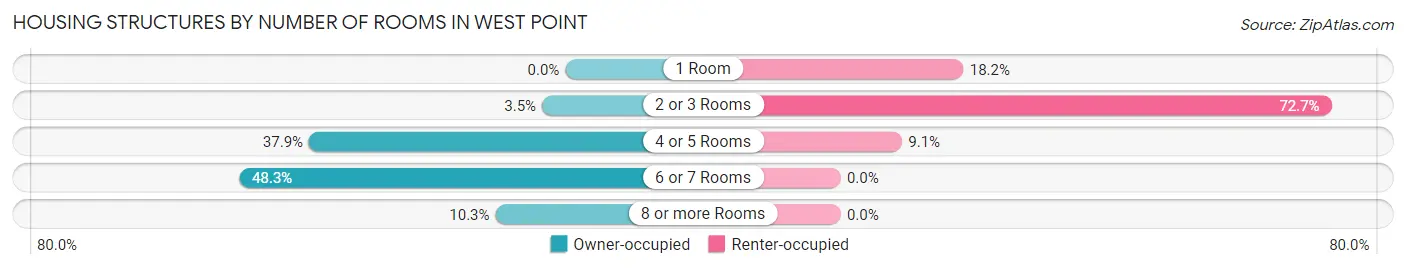
| Number of Rooms | Owner-occupied | Renter-occupied |
| 1 Room | 0 (0.0%) | 2 (18.2%) |
| 2 or 3 Rooms | 1 (3.5%) | 8 (72.7%) |
| 4 or 5 Rooms | 11 (37.9%) | 1 (9.1%) |
| 6 or 7 Rooms | 14 (48.3%) | 0 (0.0%) |
| 8 or more Rooms | 3 (10.3%) | 0 (0.0%) |
| Total | 29 (100.0%) | 11 (100.0%) |
Housing Structure by Heating Type in West Point
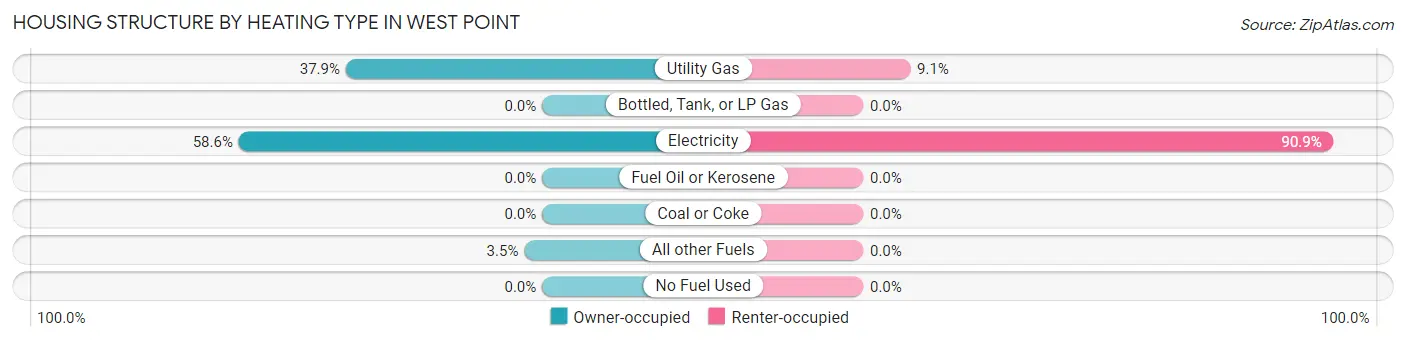
| Heating Type | Owner-occupied | Renter-occupied |
| Utility Gas | 11 (37.9%) | 1 (9.1%) |
| Bottled, Tank, or LP Gas | 0 (0.0%) | 0 (0.0%) |
| Electricity | 17 (58.6%) | 10 (90.9%) |
| Fuel Oil or Kerosene | 0 (0.0%) | 0 (0.0%) |
| Coal or Coke | 0 (0.0%) | 0 (0.0%) |
| All other Fuels | 1 (3.5%) | 0 (0.0%) |
| No Fuel Used | 0 (0.0%) | 0 (0.0%) |
| Total | 29 (100.0%) | 11 (100.0%) |
Household Vehicle Usage in West Point
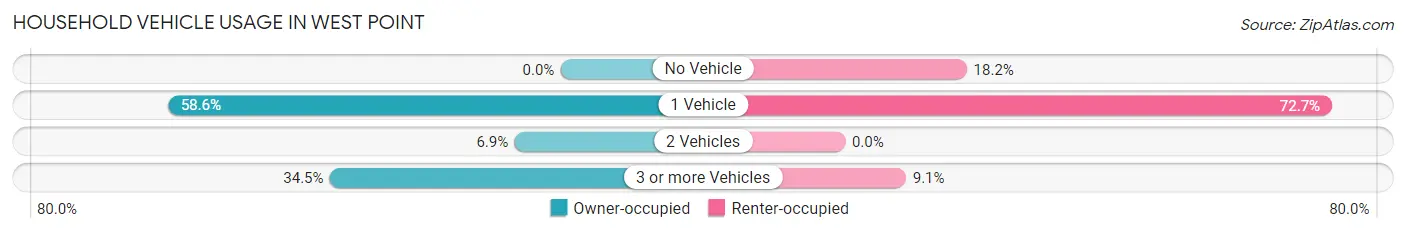
| Vehicles per Household | Owner-occupied | Renter-occupied |
| No Vehicle | 0 (0.0%) | 2 (18.2%) |
| 1 Vehicle | 17 (58.6%) | 8 (72.7%) |
| 2 Vehicles | 2 (6.9%) | 0 (0.0%) |
| 3 or more Vehicles | 10 (34.5%) | 1 (9.1%) |
| Total | 29 (100.0%) | 11 (100.0%) |
Real Estate & Mortgages in West Point
Real Estate and Mortgage Overview in West Point
| Characteristic | Without Mortgage | With Mortgage |
| Housing Units | 22 | 7 |
| Median Property Value | $66,700 | $87,500 |
| Median Household Income | - | - |
| Monthly Housing Costs | $357 | $0 |
| Real Estate Taxes | $333 | $0 |
Property Value by Mortgage Status in West Point
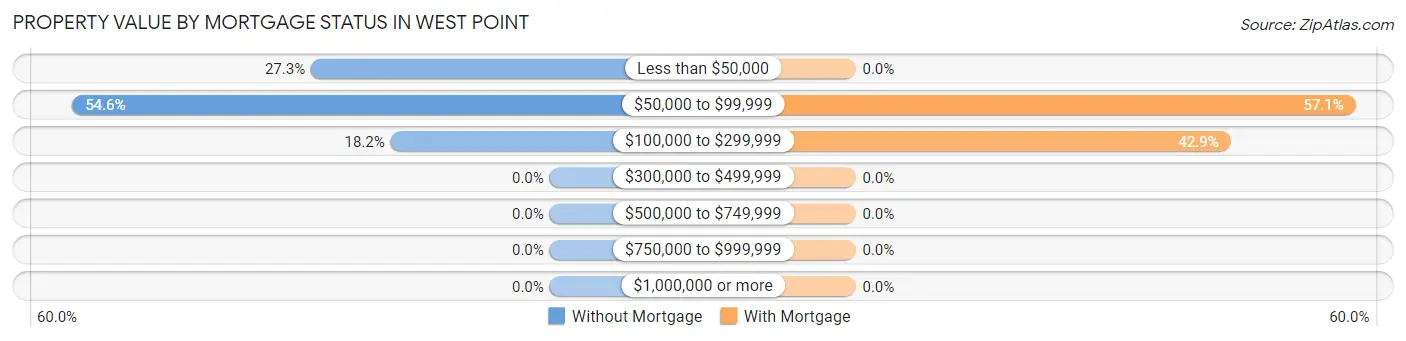
| Property Value | Without Mortgage | With Mortgage |
| Less than $50,000 | 6 (27.3%) | 0 (0.0%) |
| $50,000 to $99,999 | 12 (54.5%) | 4 (57.1%) |
| $100,000 to $299,999 | 4 (18.2%) | 3 (42.9%) |
| $300,000 to $499,999 | 0 (0.0%) | 0 (0.0%) |
| $500,000 to $749,999 | 0 (0.0%) | 0 (0.0%) |
| $750,000 to $999,999 | 0 (0.0%) | 0 (0.0%) |
| $1,000,000 or more | 0 (0.0%) | 0 (0.0%) |
| Total | 22 (100.0%) | 7 (100.0%) |
Household Income by Mortgage Status in West Point
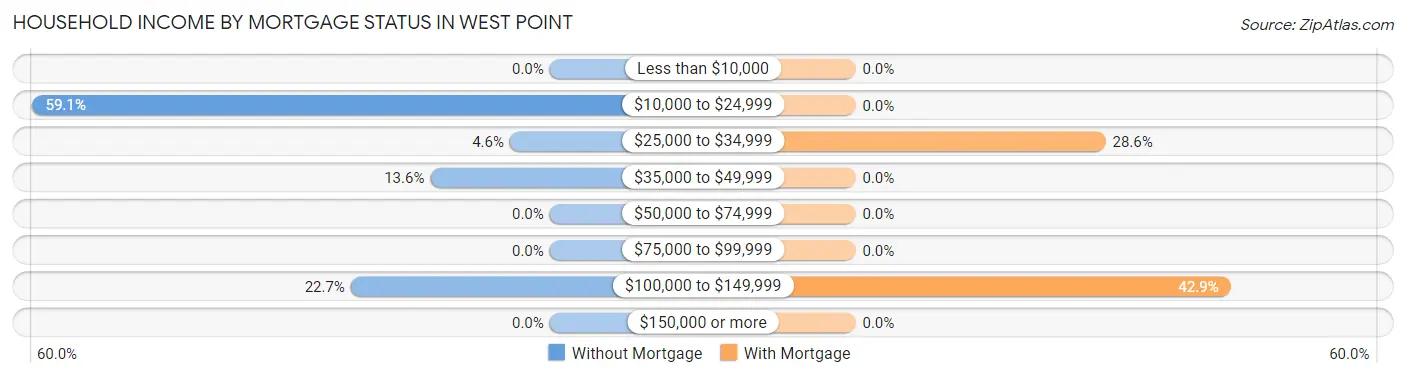
| Household Income | Without Mortgage | With Mortgage |
| Less than $10,000 | 0 (0.0%) | 0 (0.0%) |
| $10,000 to $24,999 | 13 (59.1%) | 0 (0.0%) |
| $25,000 to $34,999 | 1 (4.5%) | 2 (28.6%) |
| $35,000 to $49,999 | 3 (13.6%) | 0 (0.0%) |
| $50,000 to $74,999 | 0 (0.0%) | 0 (0.0%) |
| $75,000 to $99,999 | 0 (0.0%) | 0 (0.0%) |
| $100,000 to $149,999 | 5 (22.7%) | 3 (42.9%) |
| $150,000 or more | 0 (0.0%) | 0 (0.0%) |
| Total | 22 (100.0%) | 7 (100.0%) |
Property Value to Household Income Ratio in West Point
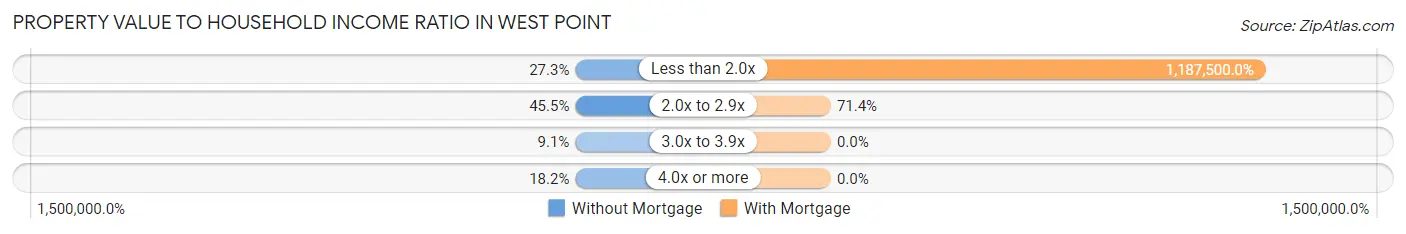
| Value-to-Income Ratio | Without Mortgage | With Mortgage |
| Less than 2.0x | 6 (27.3%) | 83,125 (1,187,500.0%) |
| 2.0x to 2.9x | 10 (45.5%) | 5 (71.4%) |
| 3.0x to 3.9x | 2 (9.1%) | 0 (0.0%) |
| 4.0x or more | 4 (18.2%) | 0 (0.0%) |
| Total | 22 (100.0%) | 7 (100.0%) |
Real Estate Taxes by Mortgage Status in West Point
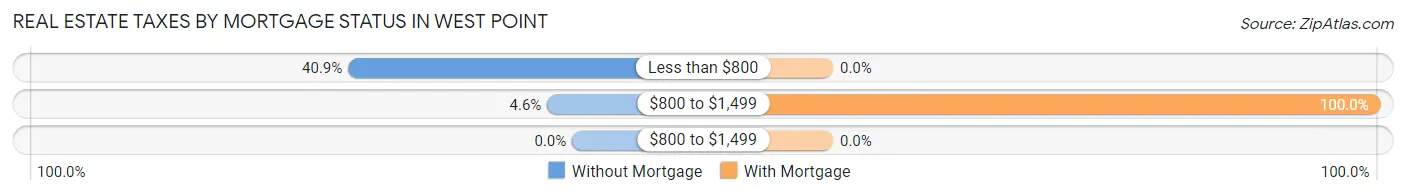
| Property Taxes | Without Mortgage | With Mortgage |
| Less than $800 | 9 (40.9%) | 0 (0.0%) |
| $800 to $1,499 | 1 (4.5%) | 7 (100.0%) |
| $800 to $1,499 | 0 (0.0%) | 0 (0.0%) |
| Total | 22 (100.0%) | 7 (100.0%) |
Health & Disability in West Point
Health Insurance Coverage by Age in West Point
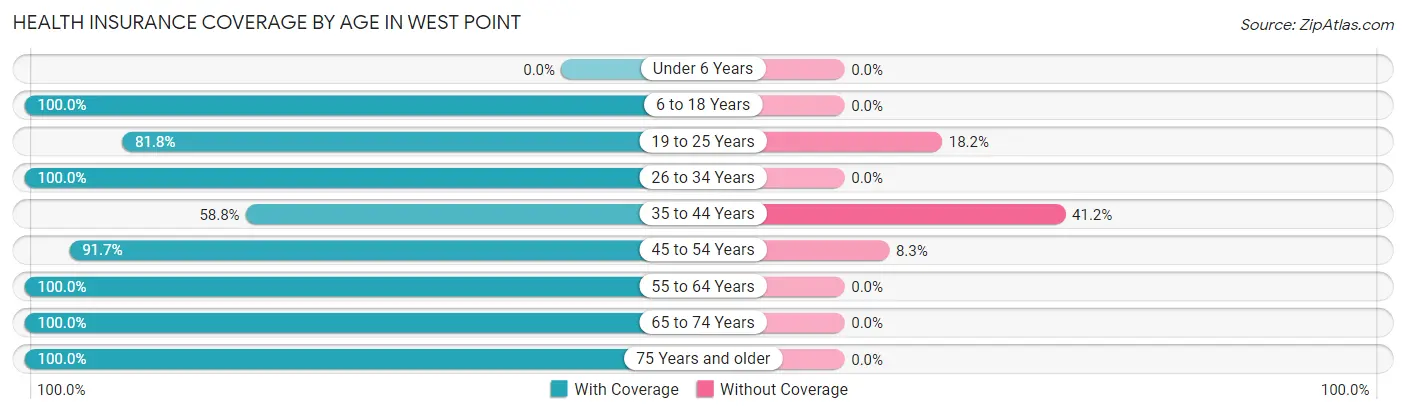
| Age Bracket | With Coverage | Without Coverage |
| Under 6 Years | 0 (0.0%) | 0 (0.0%) |
| 6 to 18 Years | 19 (100.0%) | 0 (0.0%) |
| 19 to 25 Years | 9 (81.8%) | 2 (18.2%) |
| 26 to 34 Years | 11 (100.0%) | 0 (0.0%) |
| 35 to 44 Years | 10 (58.8%) | 7 (41.2%) |
| 45 to 54 Years | 22 (91.7%) | 2 (8.3%) |
| 55 to 64 Years | 24 (100.0%) | 0 (0.0%) |
| 65 to 74 Years | 34 (100.0%) | 0 (0.0%) |
| 75 Years and older | 5 (100.0%) | 0 (0.0%) |
| Total | 134 (92.4%) | 11 (7.6%) |
Health Insurance Coverage by Citizenship Status in West Point
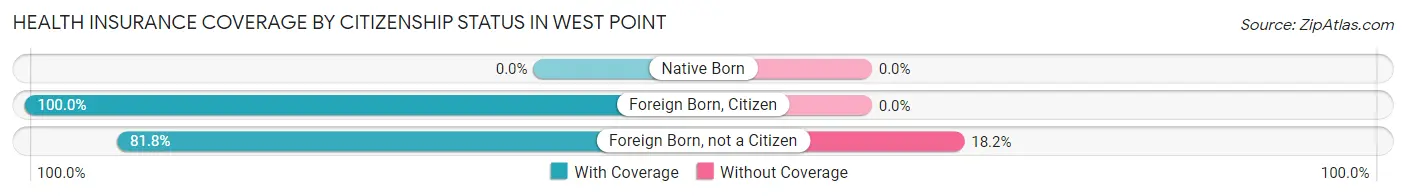
| Citizenship Status | With Coverage | Without Coverage |
| Native Born | 0 (0.0%) | 0 (0.0%) |
| Foreign Born, Citizen | 19 (100.0%) | 0 (0.0%) |
| Foreign Born, not a Citizen | 9 (81.8%) | 2 (18.2%) |
Health Insurance Coverage by Household Income in West Point
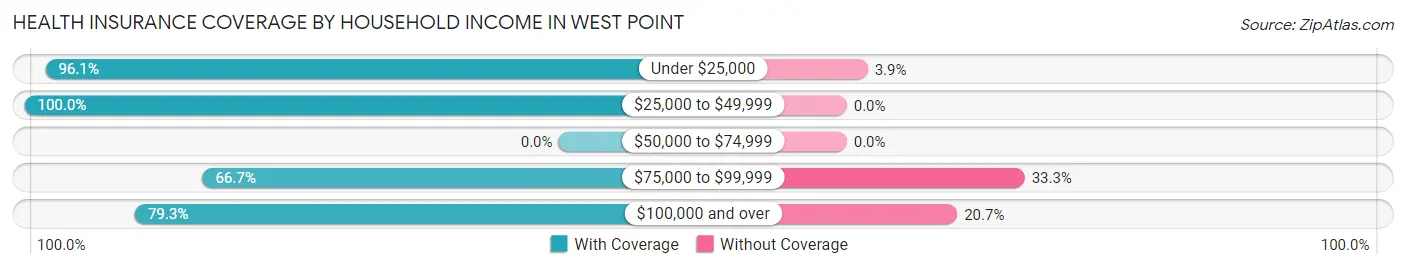
| Household Income | With Coverage | Without Coverage |
| Under $25,000 | 49 (96.1%) | 2 (3.9%) |
| $25,000 to $49,999 | 7 (100.0%) | 0 (0.0%) |
| $50,000 to $74,999 | 0 (0.0%) | 0 (0.0%) |
| $75,000 to $99,999 | 6 (66.7%) | 3 (33.3%) |
| $100,000 and over | 23 (79.3%) | 6 (20.7%) |
Public vs Private Health Insurance Coverage by Age in West Point
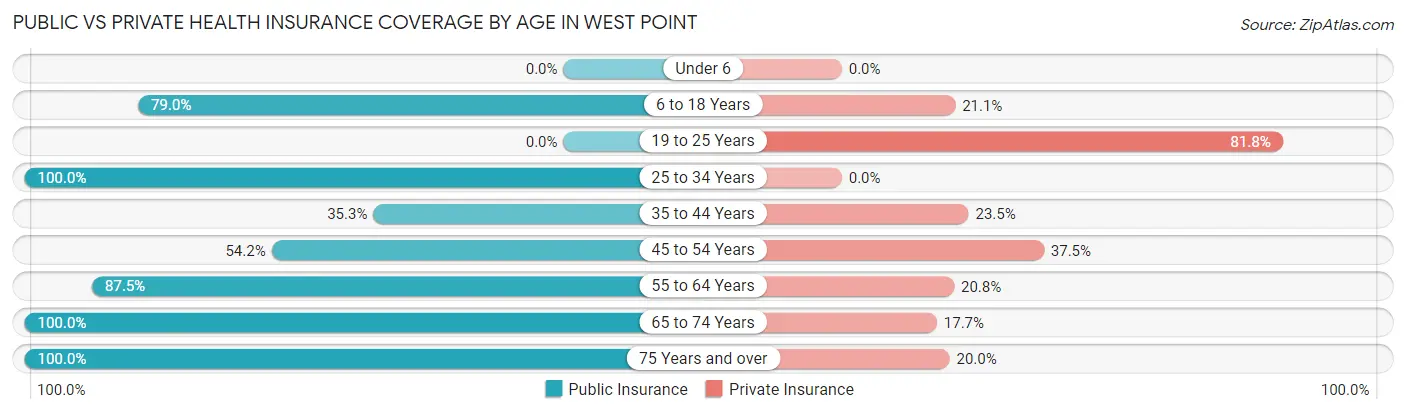
| Age Bracket | Public Insurance | Private Insurance |
| Under 6 | 0 (0.0%) | 0 (0.0%) |
| 6 to 18 Years | 15 (78.9%) | 4 (21.0%) |
| 19 to 25 Years | 0 (0.0%) | 9 (81.8%) |
| 25 to 34 Years | 11 (100.0%) | 0 (0.0%) |
| 35 to 44 Years | 6 (35.3%) | 4 (23.5%) |
| 45 to 54 Years | 13 (54.2%) | 9 (37.5%) |
| 55 to 64 Years | 21 (87.5%) | 5 (20.8%) |
| 65 to 74 Years | 34 (100.0%) | 6 (17.6%) |
| 75 Years and over | 5 (100.0%) | 1 (20.0%) |
| Total | 105 (72.4%) | 38 (26.2%) |
Disability Status by Sex by Age in West Point
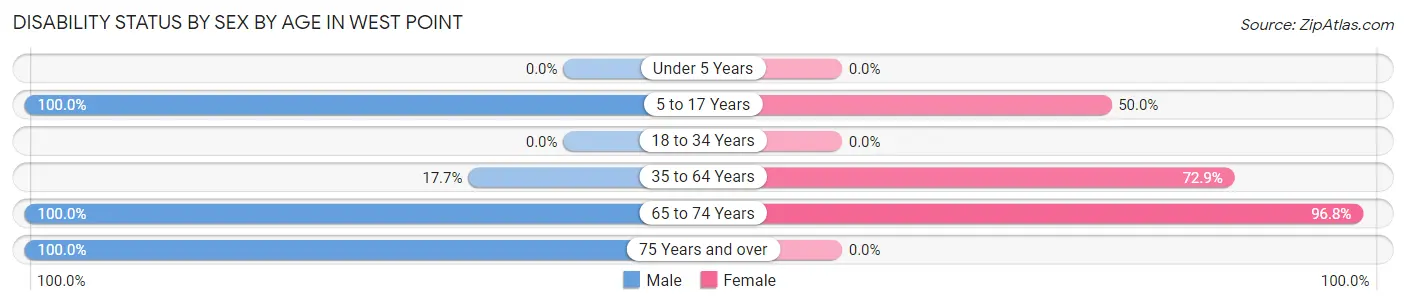
| Age Bracket | Male | Female |
| Under 5 Years | 0 (0.0%) | 0 (0.0%) |
| 5 to 17 Years | 7 (100.0%) | 6 (50.0%) |
| 18 to 34 Years | 0 (0.0%) | 0 (0.0%) |
| 35 to 64 Years | 3 (17.6%) | 35 (72.9%) |
| 65 to 74 Years | 3 (100.0%) | 30 (96.8%) |
| 75 Years and over | 5 (100.0%) | 0 (0.0%) |
Disability Class by Sex by Age in West Point
Disability Class: Hearing Difficulty
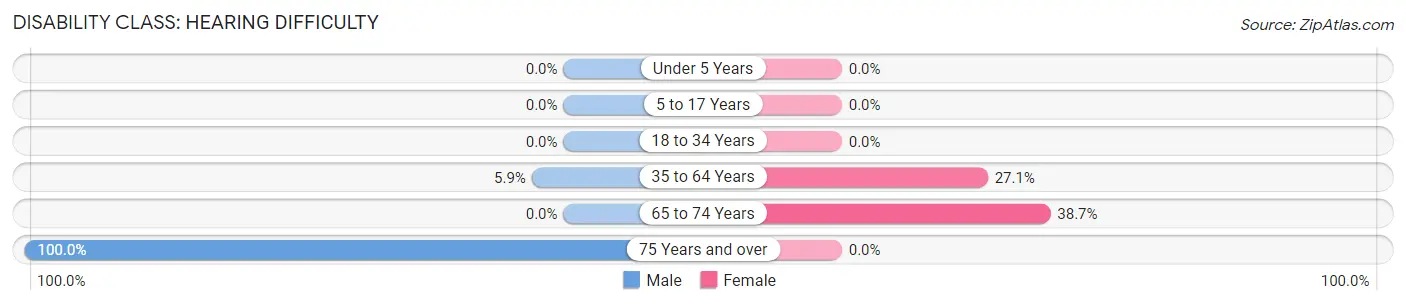
| Age Bracket | Male | Female |
| Under 5 Years | 0 (0.0%) | 0 (0.0%) |
| 5 to 17 Years | 0 (0.0%) | 0 (0.0%) |
| 18 to 34 Years | 0 (0.0%) | 0 (0.0%) |
| 35 to 64 Years | 1 (5.9%) | 13 (27.1%) |
| 65 to 74 Years | 0 (0.0%) | 12 (38.7%) |
| 75 Years and over | 5 (100.0%) | 0 (0.0%) |
Disability Class: Vision Difficulty
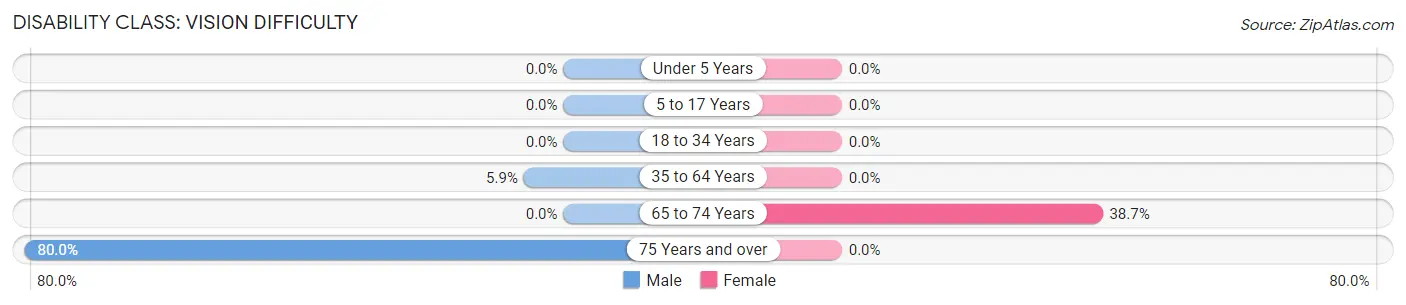
| Age Bracket | Male | Female |
| Under 5 Years | 0 (0.0%) | 0 (0.0%) |
| 5 to 17 Years | 0 (0.0%) | 0 (0.0%) |
| 18 to 34 Years | 0 (0.0%) | 0 (0.0%) |
| 35 to 64 Years | 1 (5.9%) | 0 (0.0%) |
| 65 to 74 Years | 0 (0.0%) | 12 (38.7%) |
| 75 Years and over | 4 (80.0%) | 0 (0.0%) |
Disability Class: Cognitive Difficulty
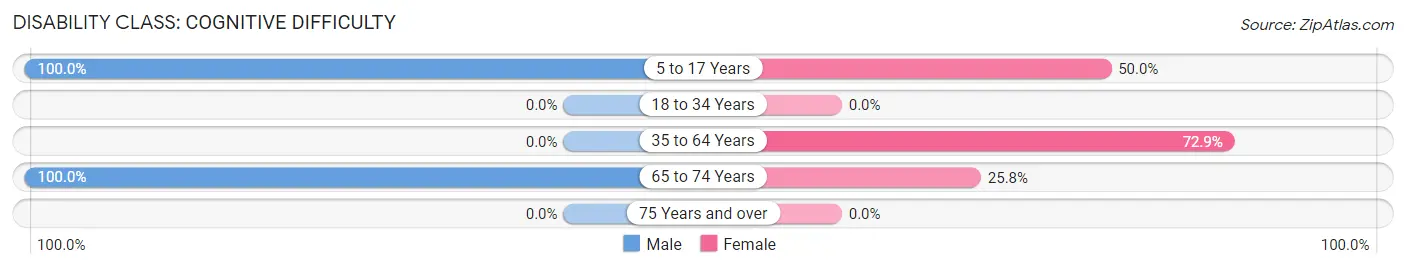
| Age Bracket | Male | Female |
| 5 to 17 Years | 7 (100.0%) | 6 (50.0%) |
| 18 to 34 Years | 0 (0.0%) | 0 (0.0%) |
| 35 to 64 Years | 0 (0.0%) | 35 (72.9%) |
| 65 to 74 Years | 3 (100.0%) | 8 (25.8%) |
| 75 Years and over | 0 (0.0%) | 0 (0.0%) |
Disability Class: Ambulatory Difficulty
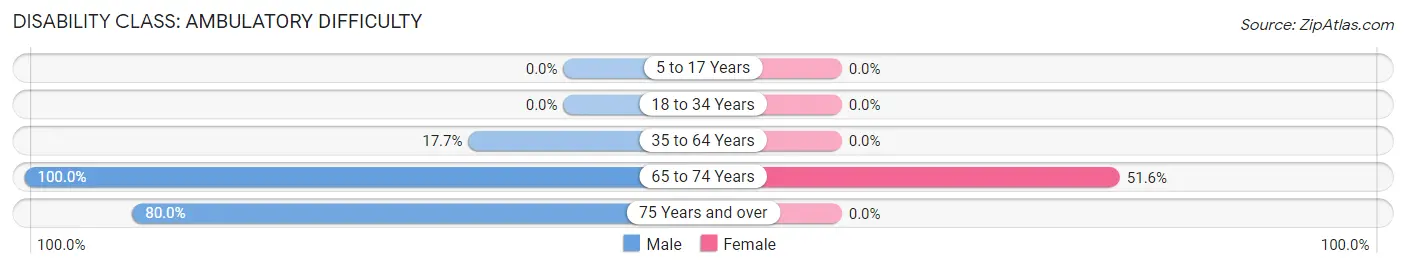
| Age Bracket | Male | Female |
| 5 to 17 Years | 0 (0.0%) | 0 (0.0%) |
| 18 to 34 Years | 0 (0.0%) | 0 (0.0%) |
| 35 to 64 Years | 3 (17.6%) | 0 (0.0%) |
| 65 to 74 Years | 3 (100.0%) | 16 (51.6%) |
| 75 Years and over | 4 (80.0%) | 0 (0.0%) |
Disability Class: Self-Care Difficulty
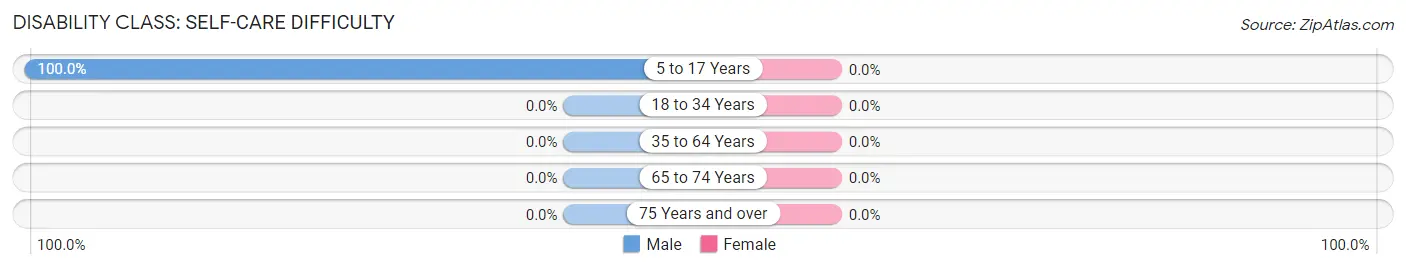
| Age Bracket | Male | Female |
| 5 to 17 Years | 7 (100.0%) | 0 (0.0%) |
| 18 to 34 Years | 0 (0.0%) | 0 (0.0%) |
| 35 to 64 Years | 0 (0.0%) | 0 (0.0%) |
| 65 to 74 Years | 0 (0.0%) | 0 (0.0%) |
| 75 Years and over | 0 (0.0%) | 0 (0.0%) |
Technology Access in West Point
Computing Device Access in West Point
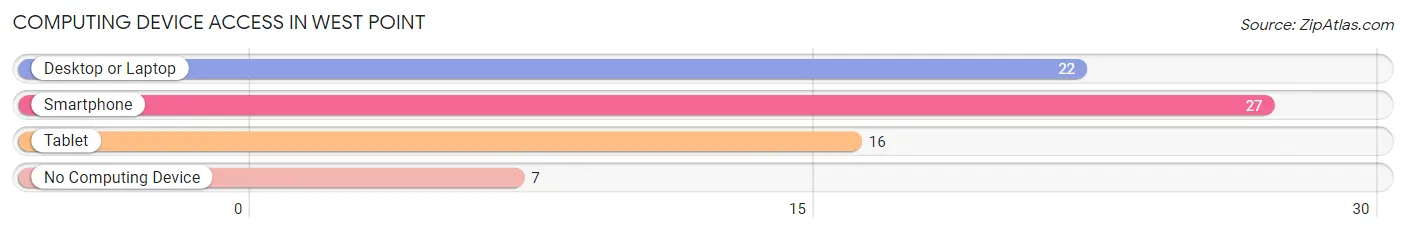
| Device Type | # Households | % Households |
| Desktop or Laptop | 22 | 55.0% |
| Smartphone | 27 | 67.5% |
| Tablet | 16 | 40.0% |
| No Computing Device | 7 | 17.5% |
| Total | 40 | 100.0% |
Internet Access in West Point
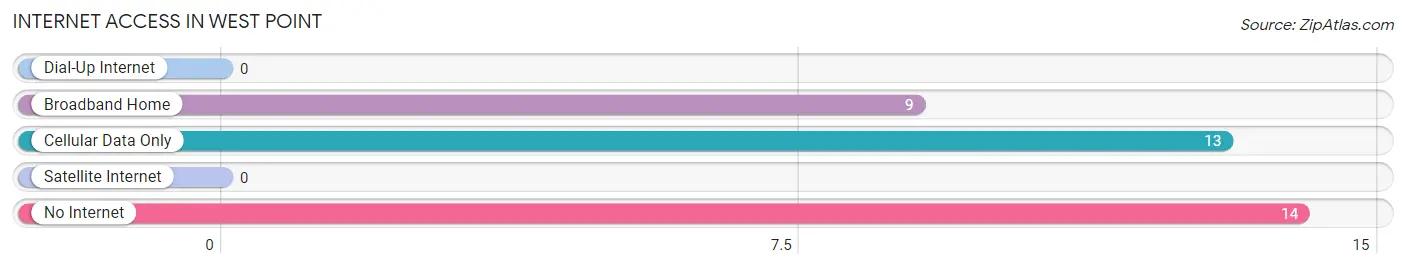
| Internet Type | # Households | % Households |
| Dial-Up Internet | 0 | 0.0% |
| Broadband Home | 9 | 22.5% |
| Cellular Data Only | 13 | 32.5% |
| Satellite Internet | 0 | 0.0% |
| No Internet | 14 | 35.0% |
| Total | 40 | 100.0% |
West Point Summary
West Point is a small city located in the state of Arkansas, in the United States. It is situated in the foothills of the Ozark Mountains, in the northwest corner of the state. The city is located in the county of Clay, and is the county seat. West Point has a population of approximately 1,500 people, and is part of the Little Rock-North Little Rock-Conway Metropolitan Statistical Area.
History
West Point was founded in 1873, when the St. Louis and Iron Mountain Railroad was built through the area. The city was named after the nearby West Point Plantation, which was owned by the prominent local family of the same name. The city was incorporated in 1876, and the first mayor was elected in 1877.
In the late 19th century, West Point was a thriving agricultural center, with cotton, corn, and wheat being the main crops. The city also had a number of sawmills and gristmills, as well as a brickyard. In the early 20th century, the city began to diversify its economy, with the establishment of a number of manufacturing plants, including a cotton mill, a furniture factory, and a canning factory.
Geography
West Point is located in the northwest corner of Arkansas, in the foothills of the Ozark Mountains. The city is situated at the intersection of two major highways, US Highway 67 and Arkansas Highway 5. The city is located in the county of Clay, and is the county seat.
The city has a total area of 2.3 square miles, all of which is land. The city is located at an elevation of 845 feet above sea level. The climate is humid subtropical, with hot, humid summers and mild winters.
Economy
West Point’s economy is largely based on agriculture and manufacturing. The city is home to a number of manufacturing plants, including a cotton mill, a furniture factory, and a canning factory. The city also has a number of sawmills and gristmills.
The city is also home to a number of retail stores, restaurants, and other businesses. The city is served by the West Point School District, which includes two elementary schools, a middle school, and a high school.
Demographics
As of the 2010 census, West Point had a population of 1,500 people. The racial makeup of the city was 95.3% White, 0.7% African American, 0.7% Native American, 0.3% Asian, 0.3% from other races, and 2.7% from two or more races. Hispanic or Latino of any race were 1.3% of the population.
The median household income in West Point was $31,250, and the median family income was $37,500. The per capita income for the city was $15,945. About 17.3% of families and 20.3% of the population were below the poverty line, including 28.3% of those under age 18 and 11.3% of those age 65 or over.
Common Questions
What is Per Capita Income in West Point?
Per Capita income in West Point is $15,463.
What is the Median Household income in West Point?
Median Household Income in West Point is $24,063.
What is Inequality or Gini Index in West Point?
Inequality or Gini Index in West Point is 0.42.
What is the Total Population of West Point?
Total Population of West Point is 145.
What is the Total Male Population of West Point?
Total Male Population of West Point is 43.
What is the Total Female Population of West Point?
Total Female Population of West Point is 102.
What is the Ratio of Males per 100 Females in West Point?
There are 42.16 Males per 100 Females in West Point.
What is the Ratio of Females per 100 Males in West Point?
There are 237.21 Females per 100 Males in West Point.
What is the Median Population Age in West Point?
Median Population Age in West Point is 47.6 Years.
What is the Average Family Size in West Point
Average Family Size in West Point is 2.8 People.
What is the Average Household Size in West Point
Average Household Size in West Point is 2.4 People.
How Large is the Labor Force in West Point?
There are 44 People in the Labor Forcein in West Point.
What is the Percentage of People in the Labor Force in West Point?
34.4% of People are in the Labor Force in West Point.
What is the Unemployment Rate in West Point?
Unemployment Rate in West Point is 6.8%.