Waldenburg, AR Map & Demographics
Waldenburg Map
Waldenburg Overview
$16,163
PER CAPITA INCOME
$47,750
AVG FAMILY INCOME
$48,000
AVG HOUSEHOLD INCOME
0.28
INEQUALITY / GINI INDEX
57
TOTAL POPULATION
28
MALE POPULATION
29
FEMALE POPULATION
96.55
MALES / 100 FEMALES
103.57
FEMALES / 100 MALES
24.9
MEDIAN AGE
3.3
AVG FAMILY SIZE
3.2
AVG HOUSEHOLD SIZE
29
LABOR FORCE [ PEOPLE ]
78.4%
PERCENT IN LABOR FORCE
Waldenburg Area Codes
Income in Waldenburg
Income Overview in Waldenburg
Per Capita Income in Waldenburg is $16,163, while median incomes of families and households are $47,750 and $48,000 respectively.
| Characteristic | Number | Measure |
| Per Capita Income | 57 | $16,163 |
| Median Family Income | 15 | $47,750 |
| Mean Family Income | 15 | $41,787 |
| Median Household Income | 18 | $48,000 |
| Mean Household Income | 18 | $50,267 |
| Income Deficit | 15 | $0 |
| Wage / Income Gap (%) | 57 | 0.00% |
| Wage / Income Gap ($) | 57 | 100.00¢ per $1 |
| Gini / Inequality Index | 57 | 0.28 |
Earnings by Sex in Waldenburg
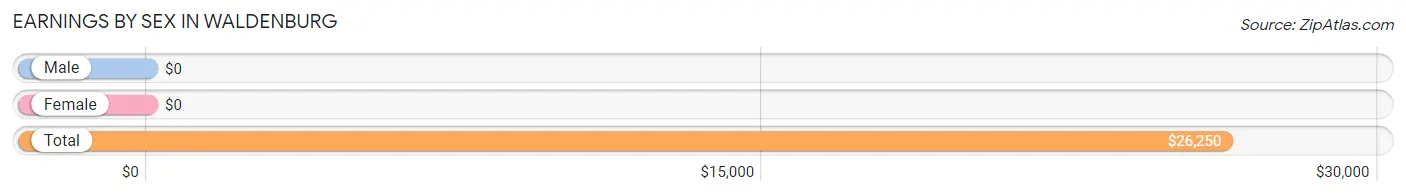
| Sex | Number | Average Earnings |
| Male | 18 (62.1%) | $0 |
| Female | 11 (37.9%) | $0 |
| Total | 29 (100.0%) | $26,250 |
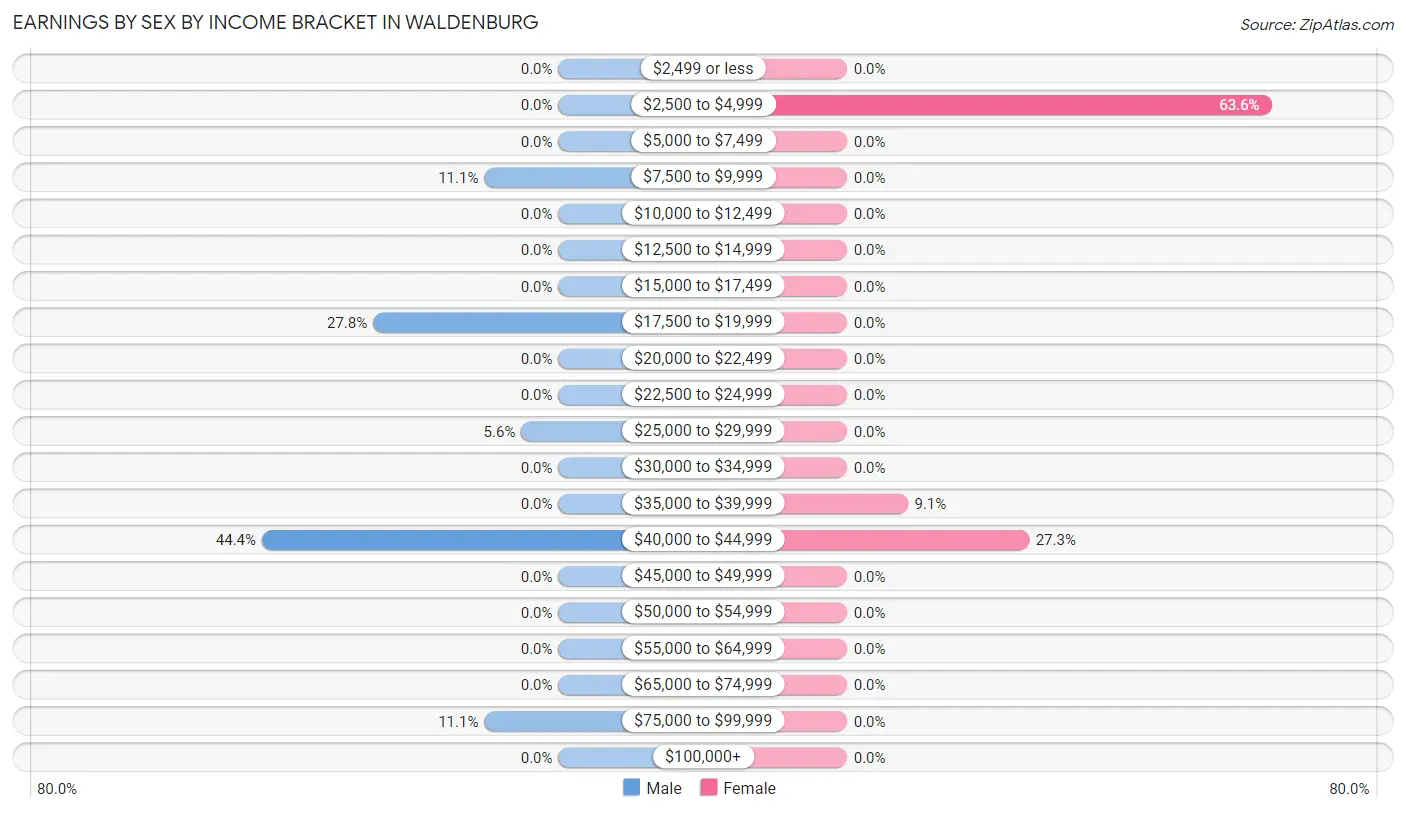
Earnings by Sex by Income Bracket in Waldenburg
The most common earnings brackets in Waldenburg are $40,000 to $44,999 for men (8 | 44.4%) and $2,500 to $4,999 for women (7 | 63.6%).
| Income | Male | Female |
| $2,499 or less | 0 (0.0%) | 0 (0.0%) |
| $2,500 to $4,999 | 0 (0.0%) | 7 (63.6%) |
| $5,000 to $7,499 | 0 (0.0%) | 0 (0.0%) |
| $7,500 to $9,999 | 2 (11.1%) | 0 (0.0%) |
| $10,000 to $12,499 | 0 (0.0%) | 0 (0.0%) |
| $12,500 to $14,999 | 0 (0.0%) | 0 (0.0%) |
| $15,000 to $17,499 | 0 (0.0%) | 0 (0.0%) |
| $17,500 to $19,999 | 5 (27.8%) | 0 (0.0%) |
| $20,000 to $22,499 | 0 (0.0%) | 0 (0.0%) |
| $22,500 to $24,999 | 0 (0.0%) | 0 (0.0%) |
| $25,000 to $29,999 | 1 (5.6%) | 0 (0.0%) |
| $30,000 to $34,999 | 0 (0.0%) | 0 (0.0%) |
| $35,000 to $39,999 | 0 (0.0%) | 1 (9.1%) |
| $40,000 to $44,999 | 8 (44.4%) | 3 (27.3%) |
| $45,000 to $49,999 | 0 (0.0%) | 0 (0.0%) |
| $50,000 to $54,999 | 0 (0.0%) | 0 (0.0%) |
| $55,000 to $64,999 | 0 (0.0%) | 0 (0.0%) |
| $65,000 to $74,999 | 0 (0.0%) | 0 (0.0%) |
| $75,000 to $99,999 | 2 (11.1%) | 0 (0.0%) |
| $100,000+ | 0 (0.0%) | 0 (0.0%) |
| Total | 18 (100.0%) | 11 (100.0%) |
Earnings by Sex by Educational Attainment in Waldenburg
| Educational Attainment | Male Income | Female Income |
| Less than High School | - | - |
| High School Diploma | - | - |
| College or Associate's Degree | - | - |
| Bachelor's Degree | - | - |
| Graduate Degree | - | - |
| Total | $42,500 | $0 |
Family Income in Waldenburg
Family Income Brackets in Waldenburg
According to the Waldenburg family income data, there are 8 families falling into the $35,000 to $49,999 income range, which is the most common income bracket and makes up 53.3% of all families.
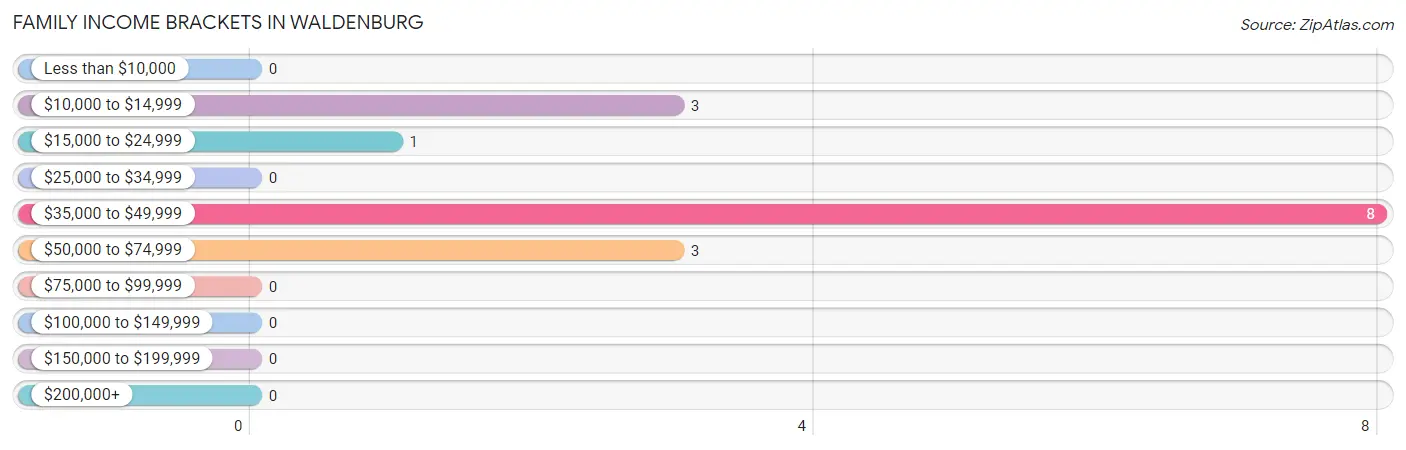
| Income Bracket | # Families | % Families |
| Less than $10,000 | 0 | 0.0% |
| $10,000 to $14,999 | 3 | 20.0% |
| $15,000 to $24,999 | 1 | 6.7% |
| $25,000 to $34,999 | 0 | 0.0% |
| $35,000 to $49,999 | 8 | 53.3% |
| $50,000 to $74,999 | 3 | 20.0% |
| $75,000 to $99,999 | 0 | 0.0% |
| $100,000 to $149,999 | 0 | 0.0% |
| $150,000 to $199,999 | 0 | 0.0% |
| $200,000+ | 0 | 0.0% |
Family Income by Famaliy Size in Waldenburg
| Income Bracket | # Families | Median Income |
| 2-Person Families | 7 (46.7%) | $0 |
| 3-Person Families | 3 (20.0%) | $0 |
| 4-Person Families | 5 (33.3%) | $0 |
| 5-Person Families | 0 (0.0%) | $0 |
| 6-Person Families | 0 (0.0%) | $0 |
| 7+ Person Families | 0 (0.0%) | $0 |
| Total | 15 (100.0%) | $47,750 |
Family Income by Number of Earners in Waldenburg
| Number of Earners | # Families | Median Income |
| No Earners | 4 (26.7%) | $0 |
| 1 Earner | 3 (20.0%) | $0 |
| 2 Earners | 8 (53.3%) | $0 |
| 3+ Earners | 0 (0.0%) | $0 |
| Total | 15 (100.0%) | $47,750 |
Household Income in Waldenburg
Household Income Brackets in Waldenburg
With 8 households falling in the category, the $35,000 to $49,999 income range is the most frequent in Waldenburg, accounting for 44.4% of all households.
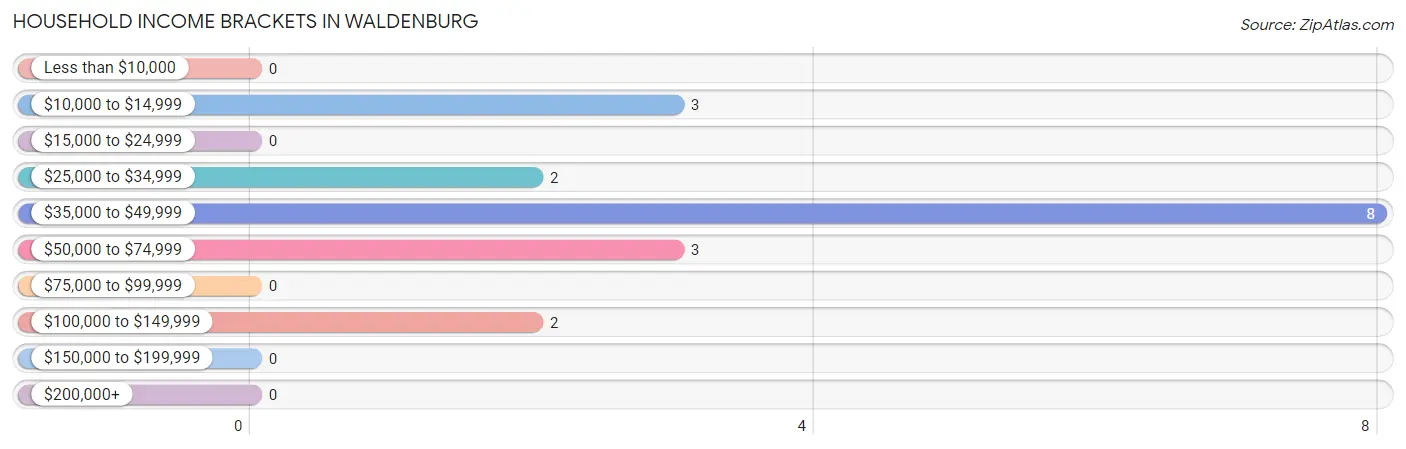
| Income Bracket | # Households | % Households |
| Less than $10,000 | 0 | 0.0% |
| $10,000 to $14,999 | 3 | 16.7% |
| $15,000 to $24,999 | 0 | 0.0% |
| $25,000 to $34,999 | 2 | 11.1% |
| $35,000 to $49,999 | 8 | 44.4% |
| $50,000 to $74,999 | 3 | 16.7% |
| $75,000 to $99,999 | 0 | 0.0% |
| $100,000 to $149,999 | 2 | 11.1% |
| $150,000 to $199,999 | 0 | 0.0% |
| $200,000+ | 0 | 0.0% |
Household Income by Householder Age in Waldenburg
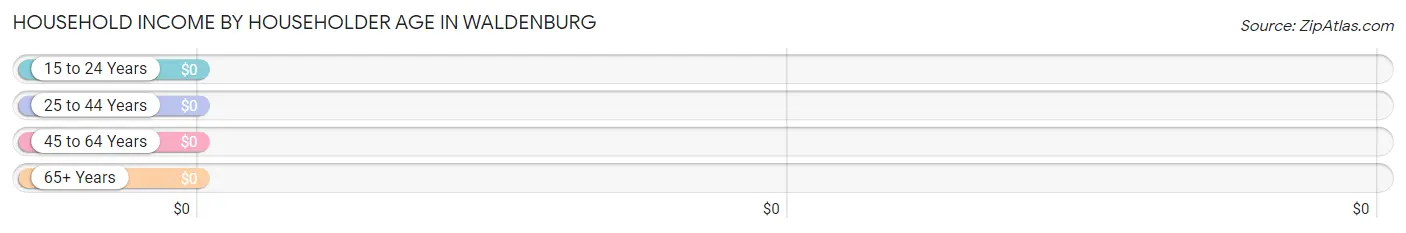
| Income Bracket | # Households | Median Income |
| 15 to 24 Years | 3 (16.7%) | $0 |
| 25 to 44 Years | 8 (44.4%) | $0 |
| 45 to 64 Years | 6 (33.3%) | $0 |
| 65+ Years | 1 (5.6%) | $0 |
| Total | 18 (100.0%) | $48,000 |
Poverty in Waldenburg
Income Below Poverty by Sex and Age in Waldenburg
With 21.4% poverty level for males and 17.2% for females among the residents of Waldenburg, 65 to 74 year old males and 55 to 64 year old females are the most vulnerable to poverty, with 1 males (100.0%) and 3 females (100.0%) in their respective age groups living below the poverty level.
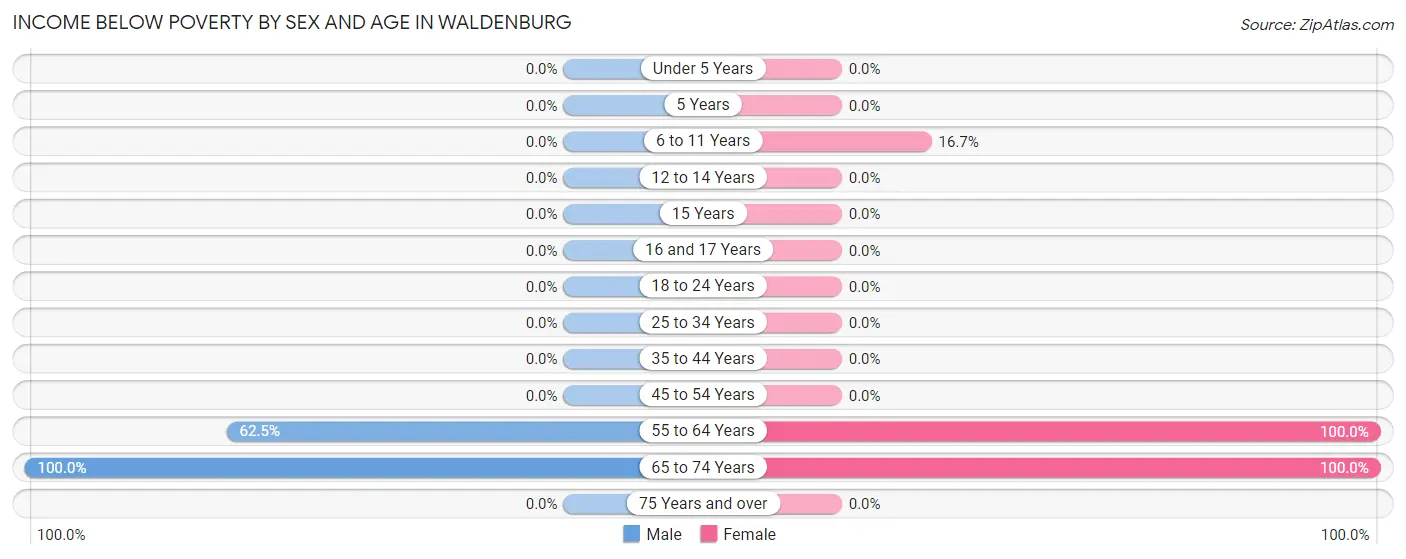
| Age Bracket | Male | Female |
| Under 5 Years | 0 (0.0%) | 0 (0.0%) |
| 5 Years | 0 (0.0%) | 0 (0.0%) |
| 6 to 11 Years | 0 (0.0%) | 1 (16.7%) |
| 12 to 14 Years | 0 (0.0%) | 0 (0.0%) |
| 15 Years | 0 (0.0%) | 0 (0.0%) |
| 16 and 17 Years | 0 (0.0%) | 0 (0.0%) |
| 18 to 24 Years | 0 (0.0%) | 0 (0.0%) |
| 25 to 34 Years | 0 (0.0%) | 0 (0.0%) |
| 35 to 44 Years | 0 (0.0%) | 0 (0.0%) |
| 45 to 54 Years | 0 (0.0%) | 0 (0.0%) |
| 55 to 64 Years | 5 (62.5%) | 3 (100.0%) |
| 65 to 74 Years | 1 (100.0%) | 1 (100.0%) |
| 75 Years and over | 0 (0.0%) | 0 (0.0%) |
| Total | 6 (21.4%) | 5 (17.2%) |
Income Above Poverty by Sex and Age in Waldenburg
According to the poverty statistics in Waldenburg, males aged 6 to 11 years and females aged under 5 years are the age groups that are most secure financially, with 100.0% of males and 100.0% of females in these age groups living above the poverty line.
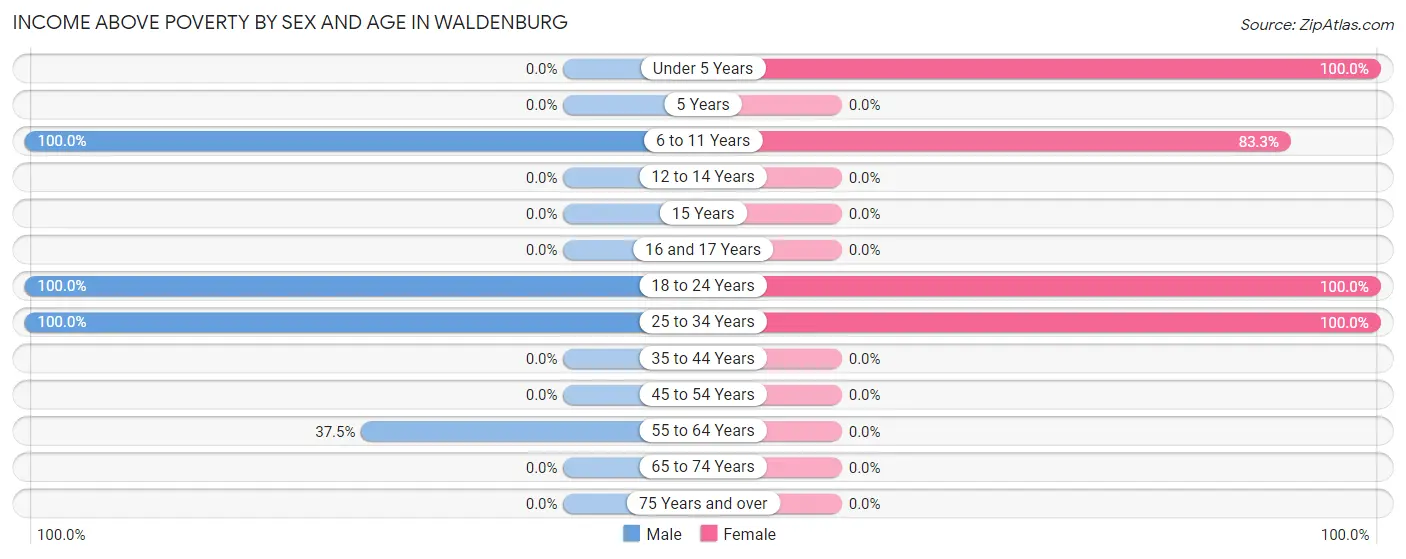
| Age Bracket | Male | Female |
| Under 5 Years | 0 (0.0%) | 8 (100.0%) |
| 5 Years | 0 (0.0%) | 0 (0.0%) |
| 6 to 11 Years | 6 (100.0%) | 5 (83.3%) |
| 12 to 14 Years | 0 (0.0%) | 0 (0.0%) |
| 15 Years | 0 (0.0%) | 0 (0.0%) |
| 16 and 17 Years | 0 (0.0%) | 0 (0.0%) |
| 18 to 24 Years | 8 (100.0%) | 1 (100.0%) |
| 25 to 34 Years | 5 (100.0%) | 10 (100.0%) |
| 35 to 44 Years | 0 (0.0%) | 0 (0.0%) |
| 45 to 54 Years | 0 (0.0%) | 0 (0.0%) |
| 55 to 64 Years | 3 (37.5%) | 0 (0.0%) |
| 65 to 74 Years | 0 (0.0%) | 0 (0.0%) |
| 75 Years and over | 0 (0.0%) | 0 (0.0%) |
| Total | 22 (78.6%) | 24 (82.8%) |
Income Below Poverty Among Married-Couple Families in Waldenburg
The poverty statistics for married-couple families in Waldenburg show that 37.5% or 3 of the total 8 families live below the poverty line. Families with no children have the highest poverty rate of 100.0%, comprising of 3 families. On the other hand, families with 1 or 2 children have the lowest poverty rate of 0.0%, which includes 0 families.
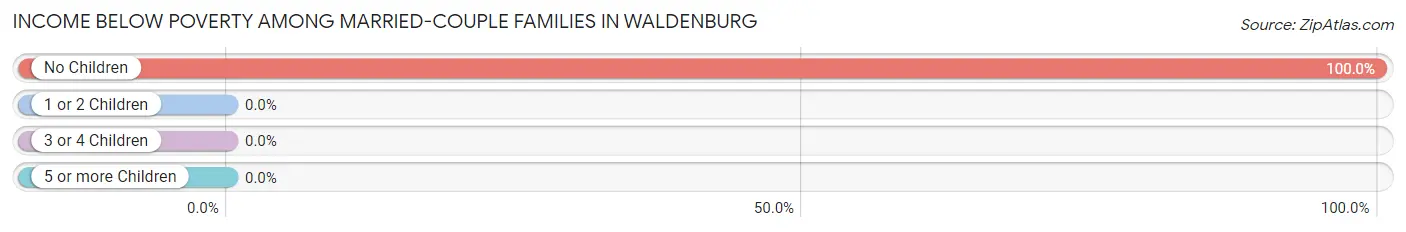
| Children | Above Poverty | Below Poverty |
| No Children | 0 (0.0%) | 3 (100.0%) |
| 1 or 2 Children | 5 (100.0%) | 0 (0.0%) |
| 3 or 4 Children | 0 (0.0%) | 0 (0.0%) |
| 5 or more Children | 0 (0.0%) | 0 (0.0%) |
| Total | 5 (62.5%) | 3 (37.5%) |
Income Below Poverty Among Single-Parent Households in Waldenburg
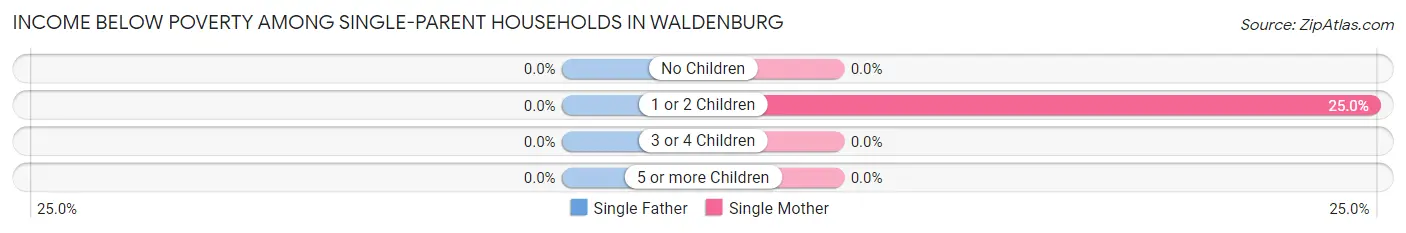
| Children | Single Father | Single Mother |
| No Children | 0 (0.0%) | 0 (0.0%) |
| 1 or 2 Children | 0 (0.0%) | 1 (25.0%) |
| 3 or 4 Children | 0 (0.0%) | 0 (0.0%) |
| 5 or more Children | 0 (0.0%) | 0 (0.0%) |
| Total | 0 (0.0%) | 1 (25.0%) |
Income Below Poverty Among Married-Couple vs Single-Parent Households in Waldenburg
The poverty data for Waldenburg shows that 3 of the married-couple family households (37.5%) and 1 of the single-parent households (14.3%) are living below the poverty level. Within the married-couple family households, those with no children have the highest poverty rate, with 3 households (100.0%) falling below the poverty line. Among the single-parent households, those with 1 or 2 children have the highest poverty rate, with 1 household (25.0%) living below poverty.
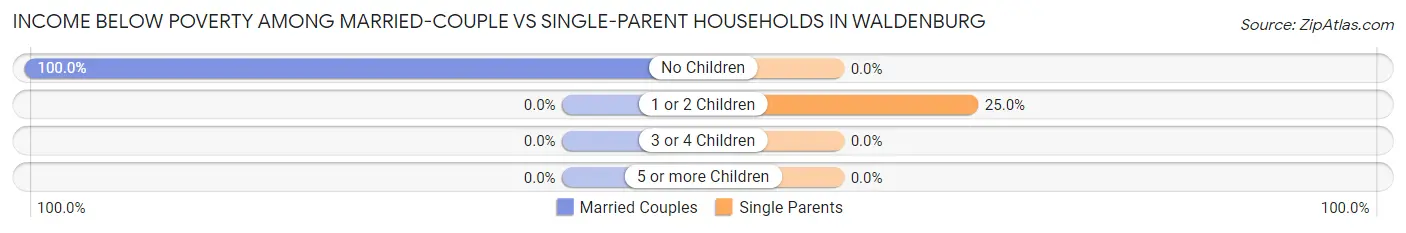
| Children | Married-Couple Families | Single-Parent Households |
| No Children | 3 (100.0%) | 0 (0.0%) |
| 1 or 2 Children | 0 (0.0%) | 1 (25.0%) |
| 3 or 4 Children | 0 (0.0%) | 0 (0.0%) |
| 5 or more Children | 0 (0.0%) | 0 (0.0%) |
| Total | 3 (37.5%) | 1 (14.3%) |
Race in Waldenburg
The most populous races in Waldenburg are White / Caucasian (49 | 86.0%), and Two or more Races (8 | 14.0%).
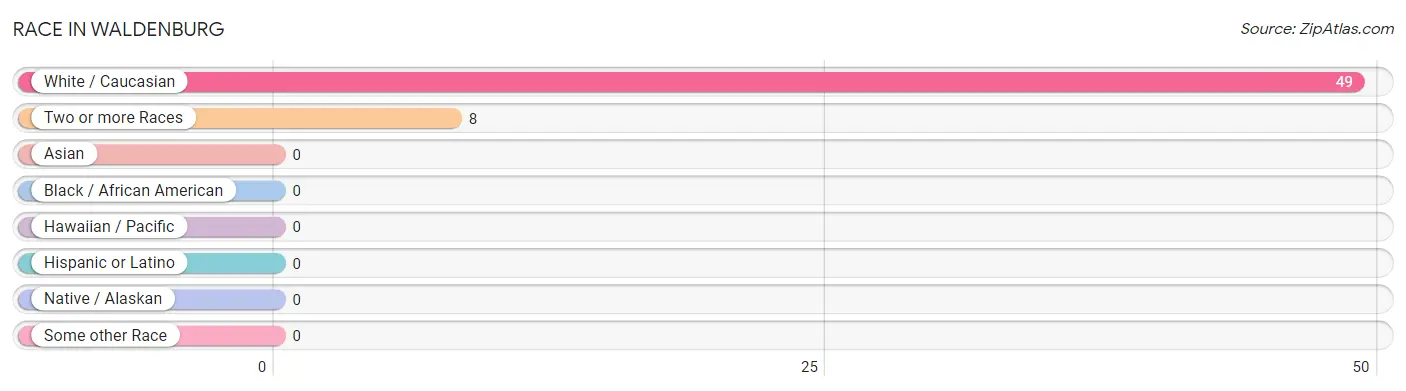
| Race | # Population | % Population |
| Asian | 0 | 0.0% |
| Black / African American | 0 | 0.0% |
| Hawaiian / Pacific | 0 | 0.0% |
| Hispanic or Latino | 0 | 0.0% |
| Native / Alaskan | 0 | 0.0% |
| White / Caucasian | 49 | 86.0% |
| Two or more Races | 8 | 14.0% |
| Some other Race | 0 | 0.0% |
| Total | 57 | 100.0% |
Ancestry in Waldenburg
The most populous ancestries reported in Waldenburg are Irish (26 | 45.6%), Cherokee (8 | 14.0%), English (6 | 10.5%), German (3 | 5.3%), and Dutch (2 | 3.5%), together accounting for 78.9% of all Waldenburg residents.
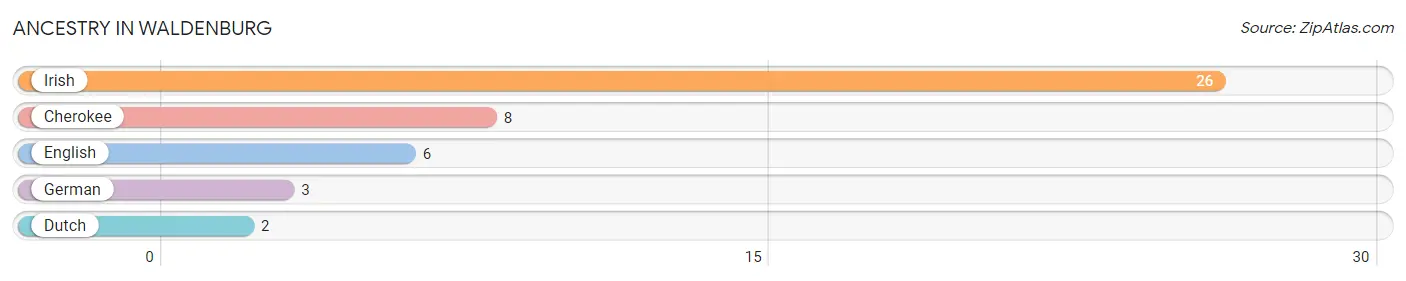
| Ancestry | # Population | % Population |
| Cherokee | 8 | 14.0% |
| Dutch | 2 | 3.5% |
| English | 6 | 10.5% |
| German | 3 | 5.3% |
| Irish | 26 | 45.6% | View All 5 Rows |
Immigrants in Waldenburg

| Immigration Origin | # Population | % Population | View All 0 Rows |
Sex and Age in Waldenburg
Sex and Age in Waldenburg
The most populous age groups in Waldenburg are 55 to 59 Years (8 | 28.6%) for men and 25 to 29 Years (10 | 34.5%) for women.
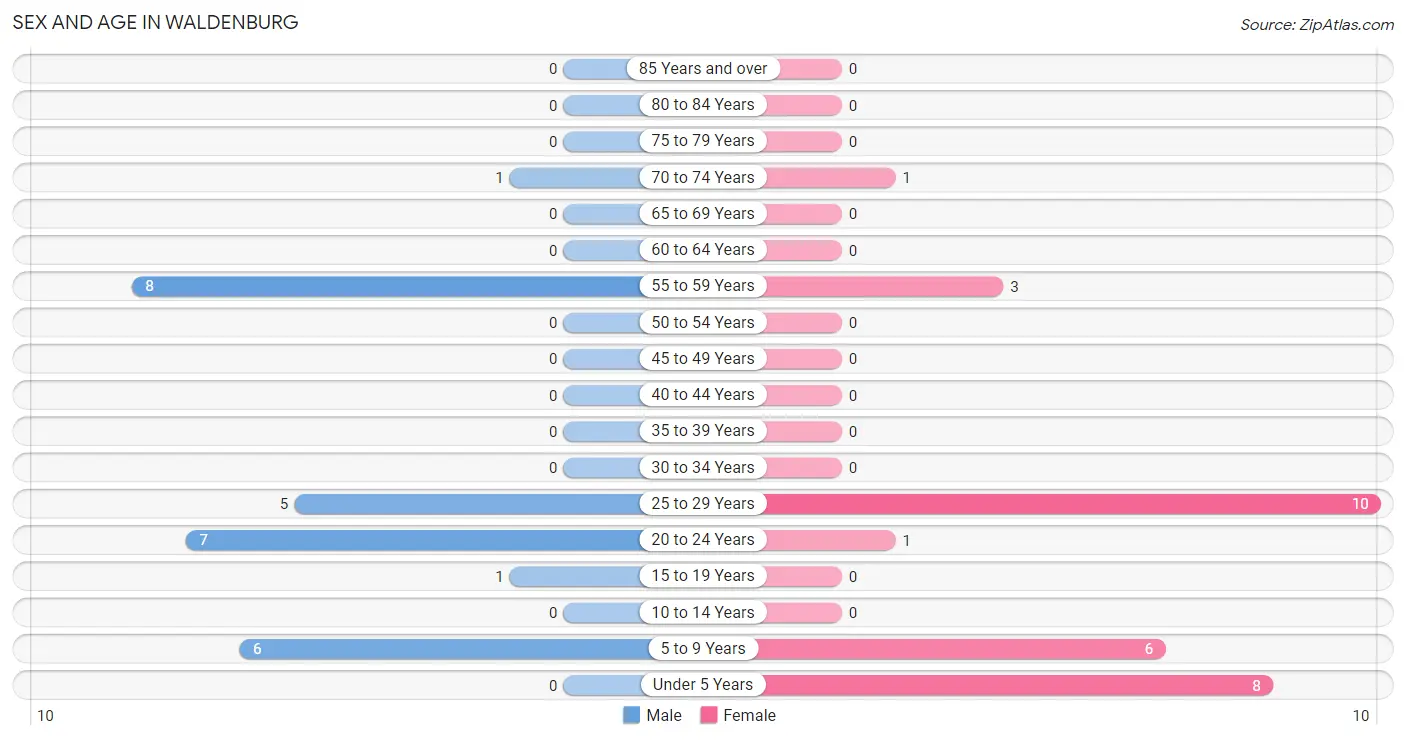
| Age Bracket | Male | Female |
| Under 5 Years | 0 (0.0%) | 8 (27.6%) |
| 5 to 9 Years | 6 (21.4%) | 6 (20.7%) |
| 10 to 14 Years | 0 (0.0%) | 0 (0.0%) |
| 15 to 19 Years | 1 (3.6%) | 0 (0.0%) |
| 20 to 24 Years | 7 (25.0%) | 1 (3.5%) |
| 25 to 29 Years | 5 (17.9%) | 10 (34.5%) |
| 30 to 34 Years | 0 (0.0%) | 0 (0.0%) |
| 35 to 39 Years | 0 (0.0%) | 0 (0.0%) |
| 40 to 44 Years | 0 (0.0%) | 0 (0.0%) |
| 45 to 49 Years | 0 (0.0%) | 0 (0.0%) |
| 50 to 54 Years | 0 (0.0%) | 0 (0.0%) |
| 55 to 59 Years | 8 (28.6%) | 3 (10.3%) |
| 60 to 64 Years | 0 (0.0%) | 0 (0.0%) |
| 65 to 69 Years | 0 (0.0%) | 0 (0.0%) |
| 70 to 74 Years | 1 (3.6%) | 1 (3.5%) |
| 75 to 79 Years | 0 (0.0%) | 0 (0.0%) |
| 80 to 84 Years | 0 (0.0%) | 0 (0.0%) |
| 85 Years and over | 0 (0.0%) | 0 (0.0%) |
| Total | 28 (100.0%) | 29 (100.0%) |
Families and Households in Waldenburg
Median Family Size in Waldenburg
The median family size in Waldenburg is 3.33 persons per family, with married-couple families (8 | 53.3%) accounting for the largest median family size of 4 persons per family. On the other hand, single female/mother families (4 | 26.7%) represent the smallest median family size with 2.50 persons per family.
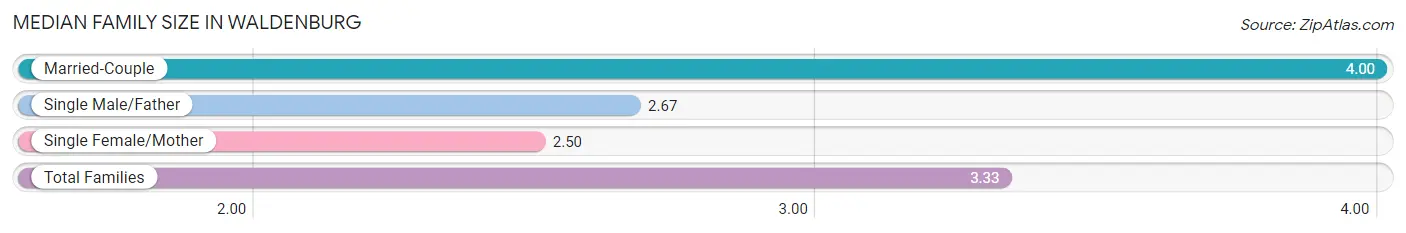
| Family Type | # Families | Family Size |
| Married-Couple | 8 (53.3%) | 4.00 |
| Single Male/Father | 3 (20.0%) | 2.67 |
| Single Female/Mother | 4 (26.7%) | 2.50 |
| Total Families | 15 (100.0%) | 3.33 |
Median Household Size in Waldenburg
The median household size in Waldenburg is 3.17 persons per household, with married-couple households (8 | 44.4%) accounting for the largest median household size of 4 persons per household. non-family households (3 | 16.7%) represent the smallest median household size with 1.33 persons per household.
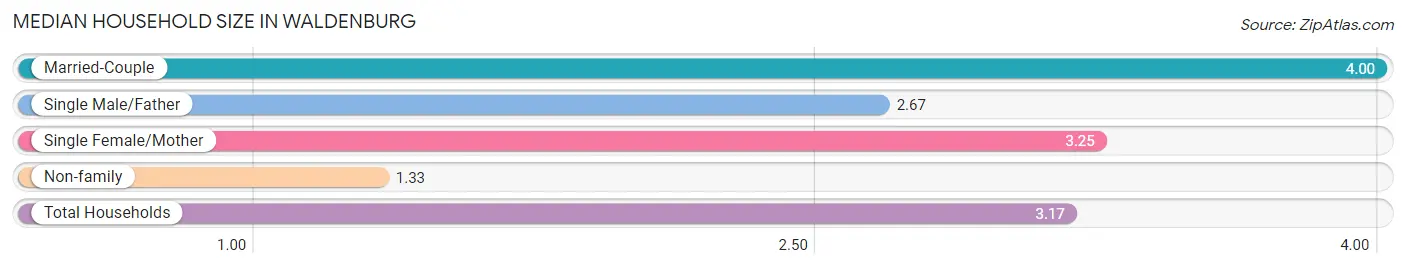
| Household Type | # Households | Household Size |
| Married-Couple | 8 (44.4%) | 4.00 |
| Single Male/Father | 3 (16.7%) | 2.67 |
| Single Female/Mother | 4 (22.2%) | 3.25 |
| Non-family | 3 (16.7%) | 1.33 |
| Total Households | 18 (100.0%) | 3.17 |
Household Size by Marriage Status in Waldenburg
Out of a total of 18 households in Waldenburg, 15 (83.3%) are family households, while 3 (16.7%) are nonfamily households. The most numerous type of family households are 2-person households, comprising 6, and the most common type of nonfamily households are 2-person households, comprising 2.
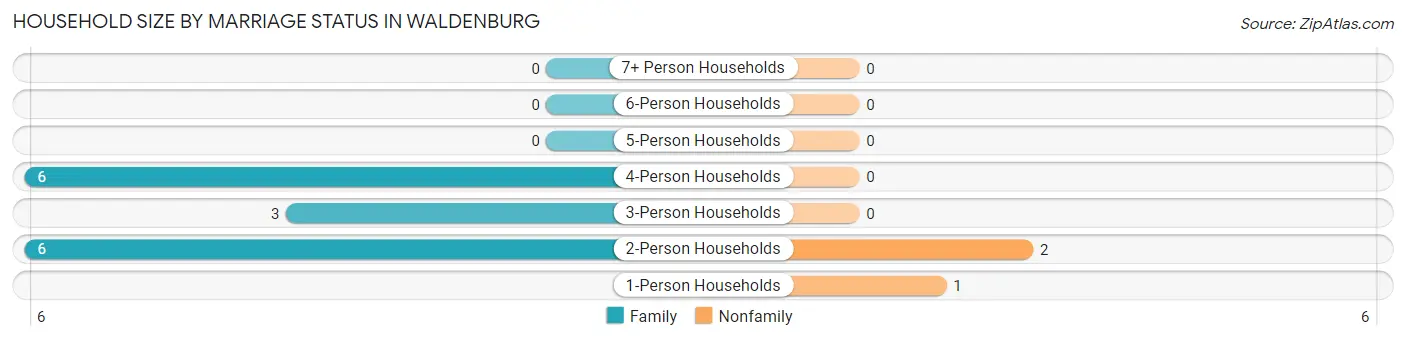
| Household Size | Family Households | Nonfamily Households |
| 1-Person Households | - | 1 (5.6%) |
| 2-Person Households | 6 (33.3%) | 2 (11.1%) |
| 3-Person Households | 3 (16.7%) | 0 (0.0%) |
| 4-Person Households | 6 (33.3%) | 0 (0.0%) |
| 5-Person Households | 0 (0.0%) | 0 (0.0%) |
| 6-Person Households | 0 (0.0%) | 0 (0.0%) |
| 7+ Person Households | 0 (0.0%) | 0 (0.0%) |
| Total | 15 (83.3%) | 3 (16.7%) |
Female Fertility in Waldenburg
Fertility by Age in Waldenburg
Average fertility rate in Waldenburg is 636.0 births per 1,000 women. Women in the age bracket of 20 to 34 years have the highest fertility rate with 636.0 births per 1,000 women. Women in the age bracket of 20 to 34 years acount for 100.0% of all women with births.
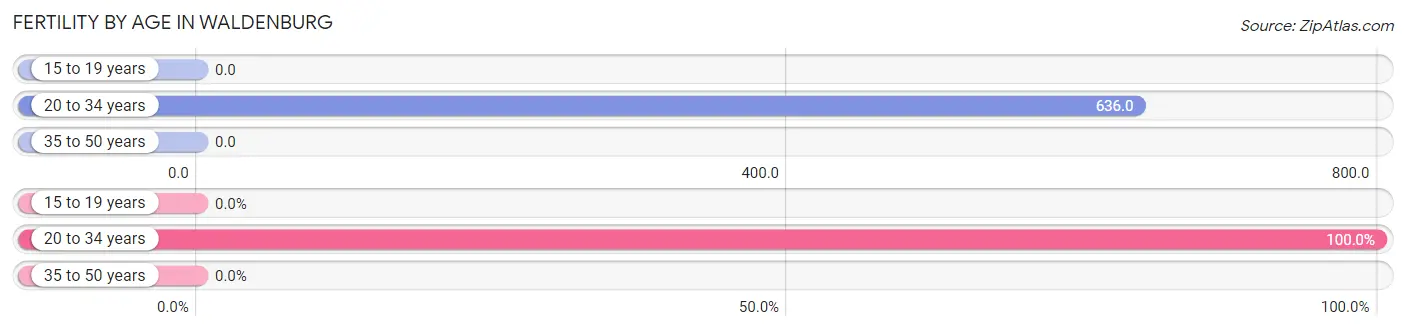
| Age Bracket | Women with Births | Births / 1,000 Women |
| 15 to 19 years | 0 (0.0%) | 0.0 |
| 20 to 34 years | 7 (100.0%) | 636.0 |
| 35 to 50 years | 0 (0.0%) | 0.0 |
| Total | 7 (100.0%) | 636.0 |
Fertility by Age by Marriage Status in Waldenburg
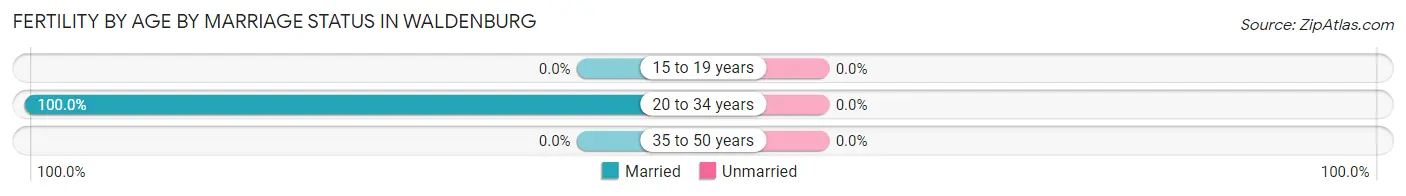
| Age Bracket | Married | Unmarried |
| 15 to 19 years | 0 (0.0%) | 0 (0.0%) |
| 20 to 34 years | 7 (100.0%) | 0 (0.0%) |
| 35 to 50 years | 0 (0.0%) | 0 (0.0%) |
| Total | 7 (100.0%) | 0 (0.0%) |
Fertility by Education in Waldenburg
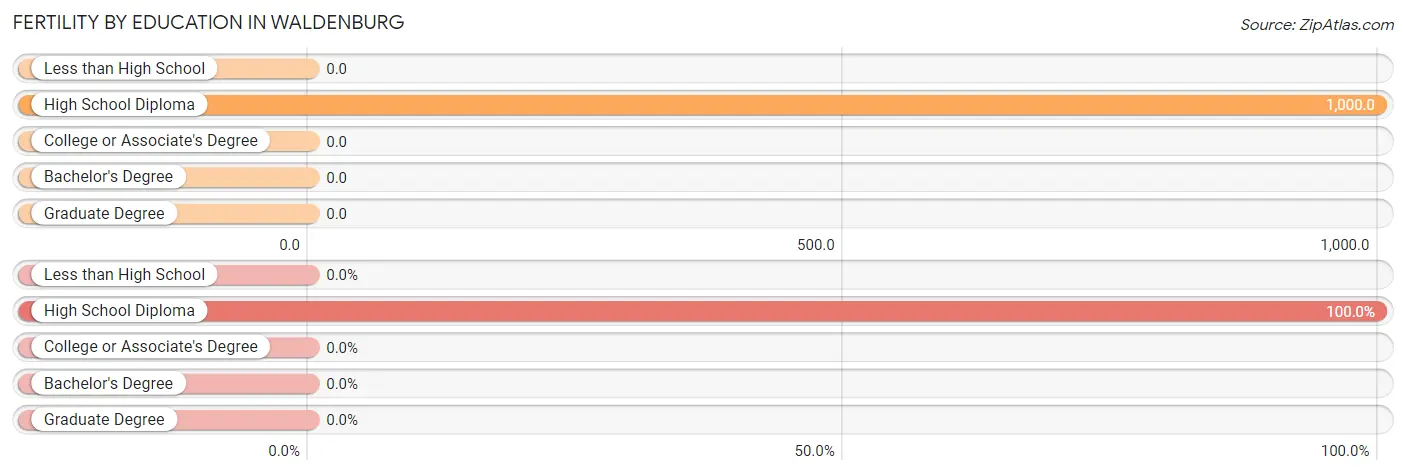
| Educational Attainment | Women with Births | Births / 1,000 Women |
| Less than High School | 0 (0.0%) | 0.0 |
| High School Diploma | 7 (100.0%) | 1,000.0 |
| College or Associate's Degree | 0 (0.0%) | 0.0 |
| Bachelor's Degree | 0 (0.0%) | 0.0 |
| Graduate Degree | 0 (0.0%) | 0.0 |
| Total | 7 (100.0%) | 636.0 |
Fertility by Education by Marriage Status in Waldenburg
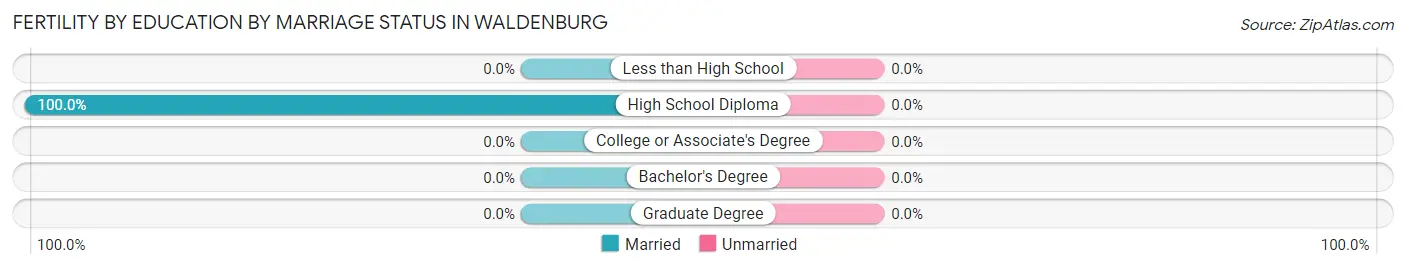
| Educational Attainment | Married | Unmarried |
| Less than High School | 0 (0.0%) | 0 (0.0%) |
| High School Diploma | 7 (100.0%) | 0 (0.0%) |
| College or Associate's Degree | 0 (0.0%) | 0 (0.0%) |
| Bachelor's Degree | 0 (0.0%) | 0 (0.0%) |
| Graduate Degree | 0 (0.0%) | 0 (0.0%) |
| Total | 7 (100.0%) | 0 (0.0%) |
Employment Characteristics in Waldenburg
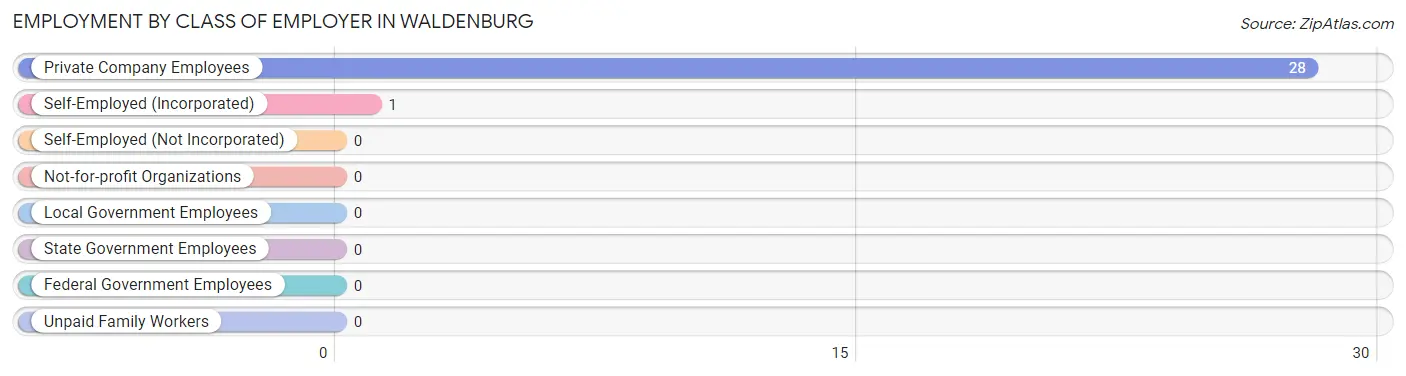
Employment by Class of Employer in Waldenburg
Among the 29 employed individuals in Waldenburg, private company employees (28 | 96.6%), and self-employed (incorporated) (1 | 3.5%) make up the most common classes of employment.
| Employer Class | # Employees | % Employees |
| Private Company Employees | 28 | 96.6% |
| Self-Employed (Incorporated) | 1 | 3.5% |
| Self-Employed (Not Incorporated) | 0 | 0.0% |
| Not-for-profit Organizations | 0 | 0.0% |
| Local Government Employees | 0 | 0.0% |
| State Government Employees | 0 | 0.0% |
| Federal Government Employees | 0 | 0.0% |
| Unpaid Family Workers | 0 | 0.0% |
| Total | 29 | 100.0% |
Employment Status by Age in Waldenburg
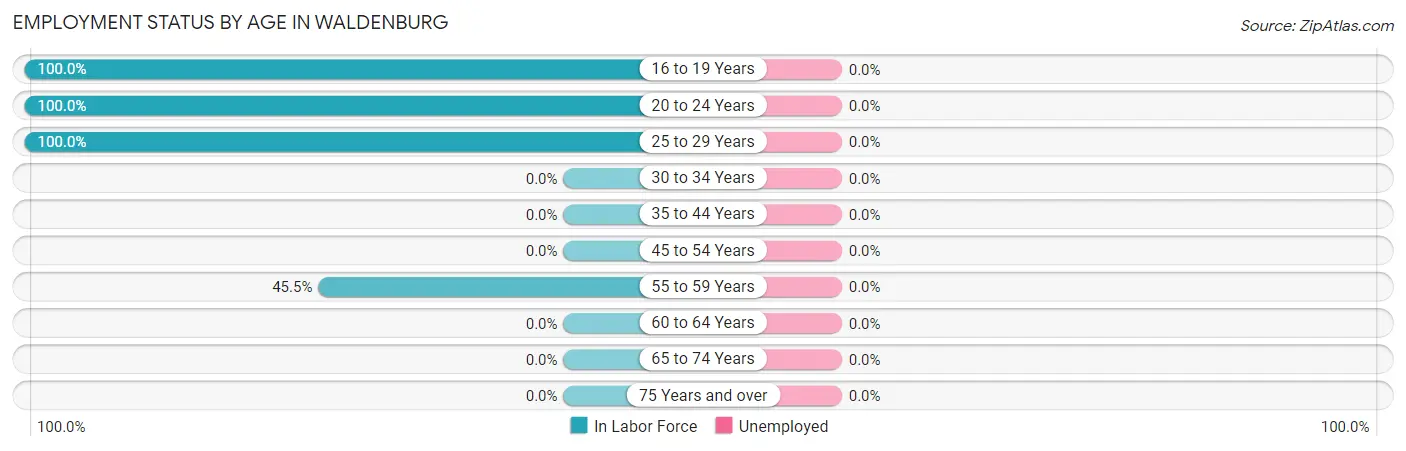
| Age Bracket | In Labor Force | Unemployed |
| 16 to 19 Years | 1 (100.0%) | 0 (0.0%) |
| 20 to 24 Years | 8 (100.0%) | 0 (0.0%) |
| 25 to 29 Years | 15 (100.0%) | 0 (0.0%) |
| 30 to 34 Years | 0 (0.0%) | 0 (0.0%) |
| 35 to 44 Years | 0 (0.0%) | 0 (0.0%) |
| 45 to 54 Years | 0 (0.0%) | 0 (0.0%) |
| 55 to 59 Years | 5 (45.5%) | 0 (0.0%) |
| 60 to 64 Years | 0 (0.0%) | 0 (0.0%) |
| 65 to 74 Years | 0 (0.0%) | 0 (0.0%) |
| 75 Years and over | 0 (0.0%) | 0 (0.0%) |
| Total | 29 (78.4%) | 0 (0.0%) |
Employment Status by Educational Attainment in Waldenburg
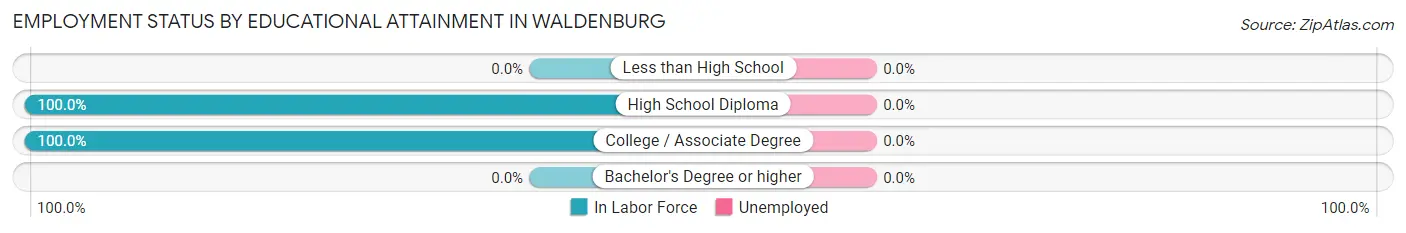
| Educational Attainment | In Labor Force | Unemployed |
| Less than High School | 0 (0.0%) | 0 (0.0%) |
| High School Diploma | 12 (100.0%) | 0 (0.0%) |
| College / Associate Degree | 8 (100.0%) | 0 (0.0%) |
| Bachelor's Degree or higher | 0 (0.0%) | 0 (0.0%) |
| Total | 20 (76.9%) | 0 (0.0%) |
Employment Occupations by Sex in Waldenburg
Management, Business, Science and Arts Occupations
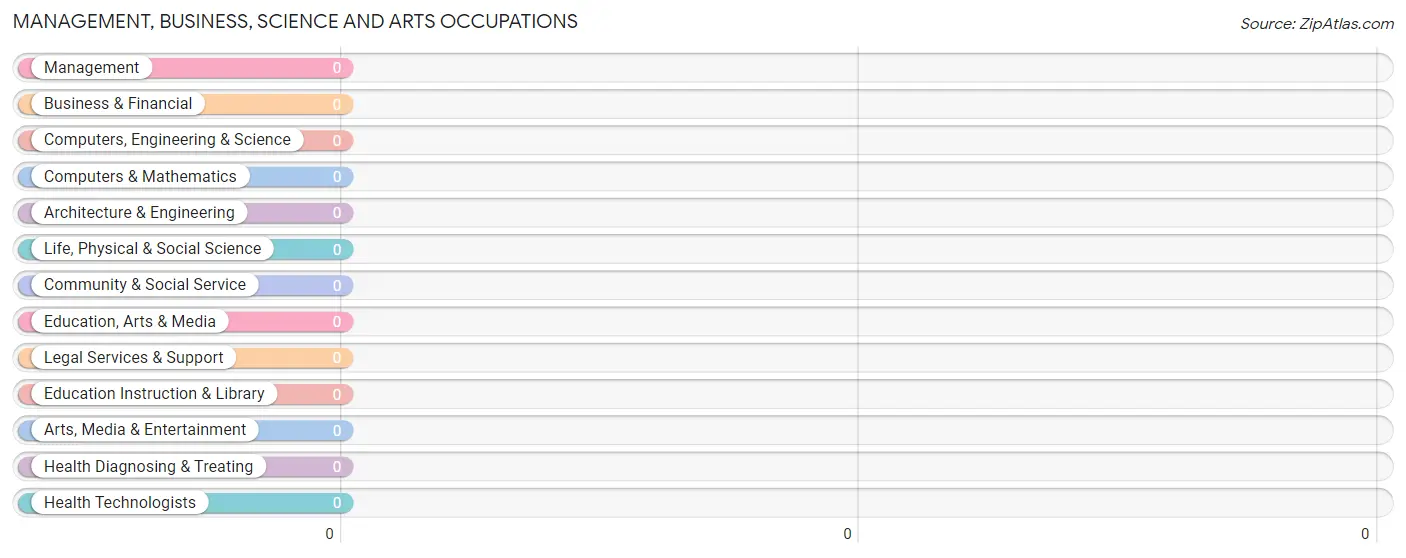
Management, Business, Science and Arts Occupations by Sex
| Occupation | Male | Female |
| Management | 0 (0.0%) | 0 (0.0%) |
| Business & Financial | 0 (0.0%) | 0 (0.0%) |
| Computers, Engineering & Science | 0 (0.0%) | 0 (0.0%) |
| Computers & Mathematics | 0 (0.0%) | 0 (0.0%) |
| Architecture & Engineering | 0 (0.0%) | 0 (0.0%) |
| Life, Physical & Social Science | 0 (0.0%) | 0 (0.0%) |
| Community & Social Service | 0 (0.0%) | 0 (0.0%) |
| Education, Arts & Media | 0 (0.0%) | 0 (0.0%) |
| Legal Services & Support | 0 (0.0%) | 0 (0.0%) |
| Education Instruction & Library | 0 (0.0%) | 0 (0.0%) |
| Arts, Media & Entertainment | 0 (0.0%) | 0 (0.0%) |
| Health Diagnosing & Treating | 0 (0.0%) | 0 (0.0%) |
| Health Technologists | 0 (0.0%) | 0 (0.0%) |
| Total (Category) | 0 (0.0%) | 0 (0.0%) |
| Total (Overall) | 18 (62.1%) | 11 (37.9%) |
Services Occupations
The most common Services occupations in Waldenburg are , and Cleaning & Maintenance (8 | 27.6%).
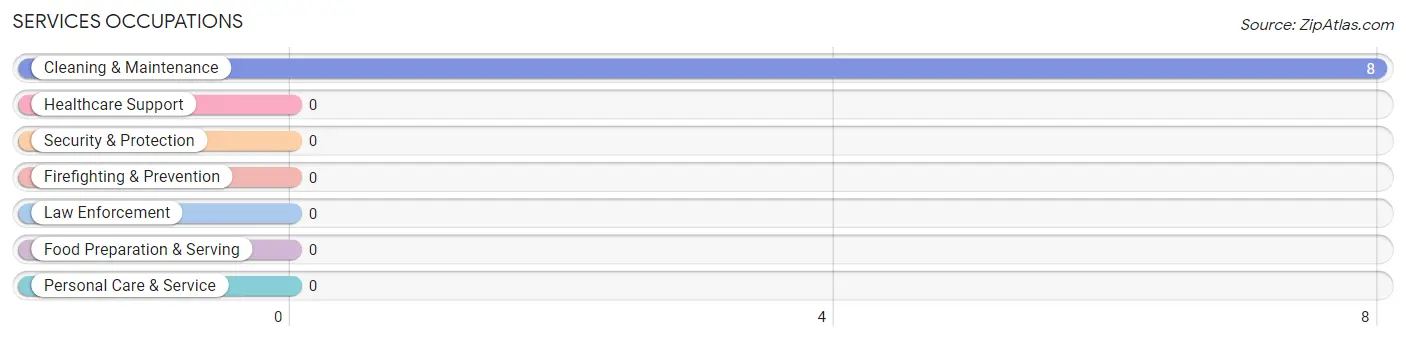
Services Occupations by Sex
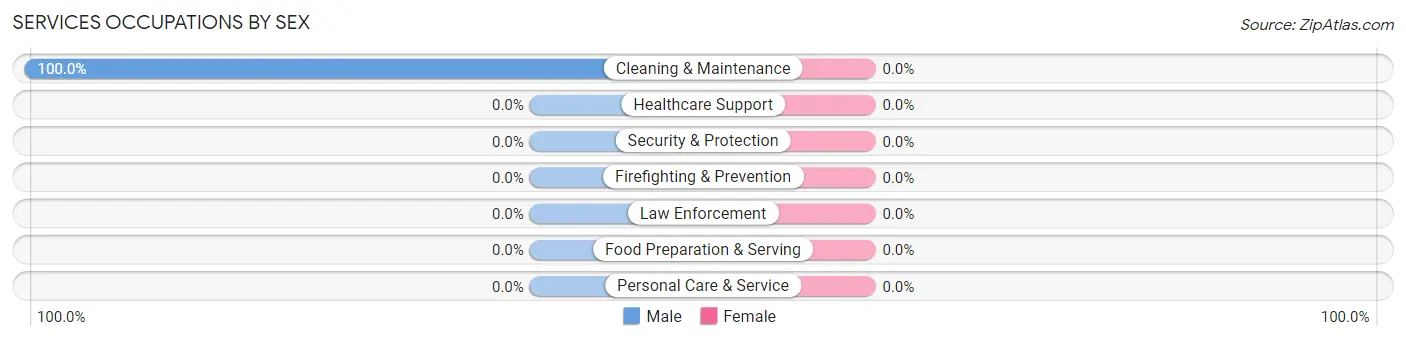
| Occupation | Male | Female |
| Healthcare Support | 0 (0.0%) | 0 (0.0%) |
| Security & Protection | 0 (0.0%) | 0 (0.0%) |
| Firefighting & Prevention | 0 (0.0%) | 0 (0.0%) |
| Law Enforcement | 0 (0.0%) | 0 (0.0%) |
| Food Preparation & Serving | 0 (0.0%) | 0 (0.0%) |
| Cleaning & Maintenance | 8 (100.0%) | 0 (0.0%) |
| Personal Care & Service | 0 (0.0%) | 0 (0.0%) |
| Total (Category) | 8 (100.0%) | 0 (0.0%) |
| Total (Overall) | 18 (62.1%) | 11 (37.9%) |
Sales and Office Occupations
The most common Sales and Office occupations in Waldenburg are Office & Administration (7 | 24.1%), and Sales & Related (5 | 17.2%).
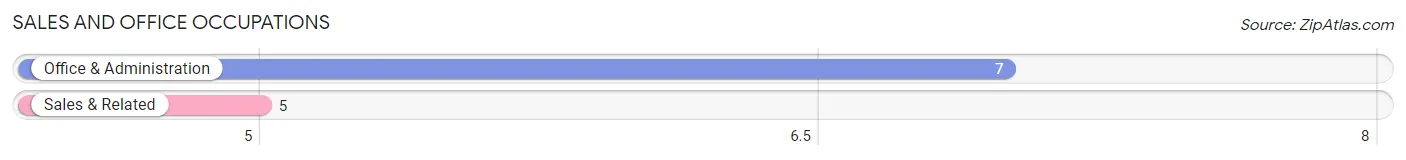
Sales and Office Occupations by Sex

| Occupation | Male | Female |
| Sales & Related | 2 (40.0%) | 3 (60.0%) |
| Office & Administration | 0 (0.0%) | 7 (100.0%) |
| Total (Category) | 2 (16.7%) | 10 (83.3%) |
| Total (Overall) | 18 (62.1%) | 11 (37.9%) |
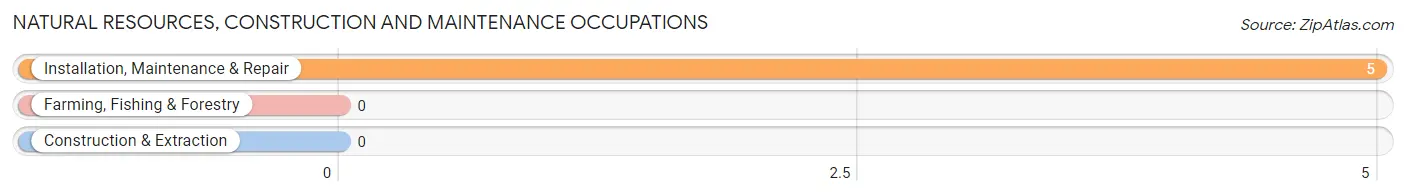
Natural Resources, Construction and Maintenance Occupations
The most common Natural Resources, Construction and Maintenance occupations in Waldenburg are , and Installation, Maintenance & Repair (5 | 17.2%).
Natural Resources, Construction and Maintenance Occupations by Sex
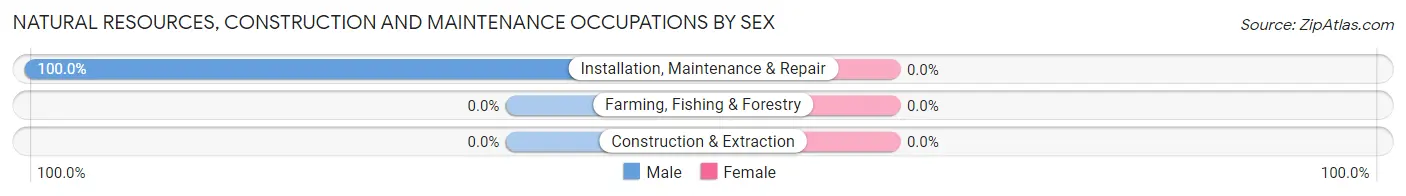
| Occupation | Male | Female |
| Farming, Fishing & Forestry | 0 (0.0%) | 0 (0.0%) |
| Construction & Extraction | 0 (0.0%) | 0 (0.0%) |
| Installation, Maintenance & Repair | 5 (100.0%) | 0 (0.0%) |
| Total (Category) | 5 (100.0%) | 0 (0.0%) |
| Total (Overall) | 18 (62.1%) | 11 (37.9%) |
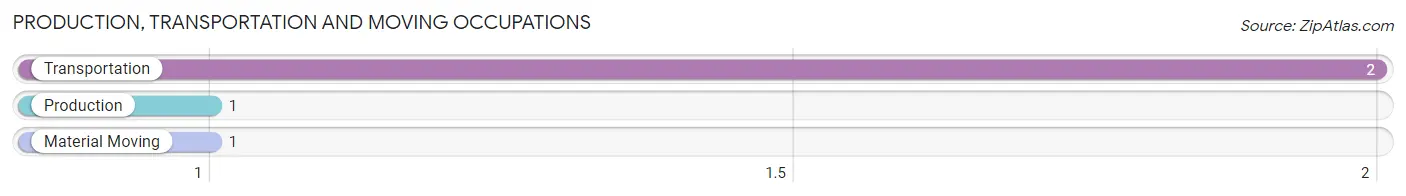
Production, Transportation and Moving Occupations
The most common Production, Transportation and Moving occupations in Waldenburg are Transportation (2 | 6.9%), Production (1 | 3.5%), and Material Moving (1 | 3.5%).
Production, Transportation and Moving Occupations by Sex
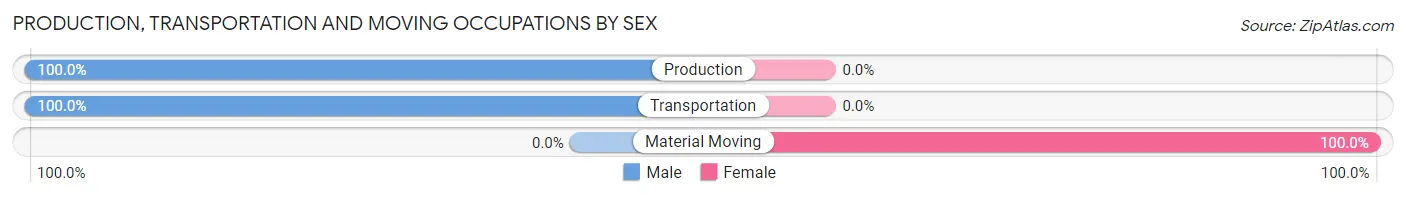
| Occupation | Male | Female |
| Production | 1 (100.0%) | 0 (0.0%) |
| Transportation | 2 (100.0%) | 0 (0.0%) |
| Material Moving | 0 (0.0%) | 1 (100.0%) |
| Total (Category) | 3 (75.0%) | 1 (25.0%) |
| Total (Overall) | 18 (62.1%) | 11 (37.9%) |
Employment Industries by Sex in Waldenburg
Employment Industries in Waldenburg
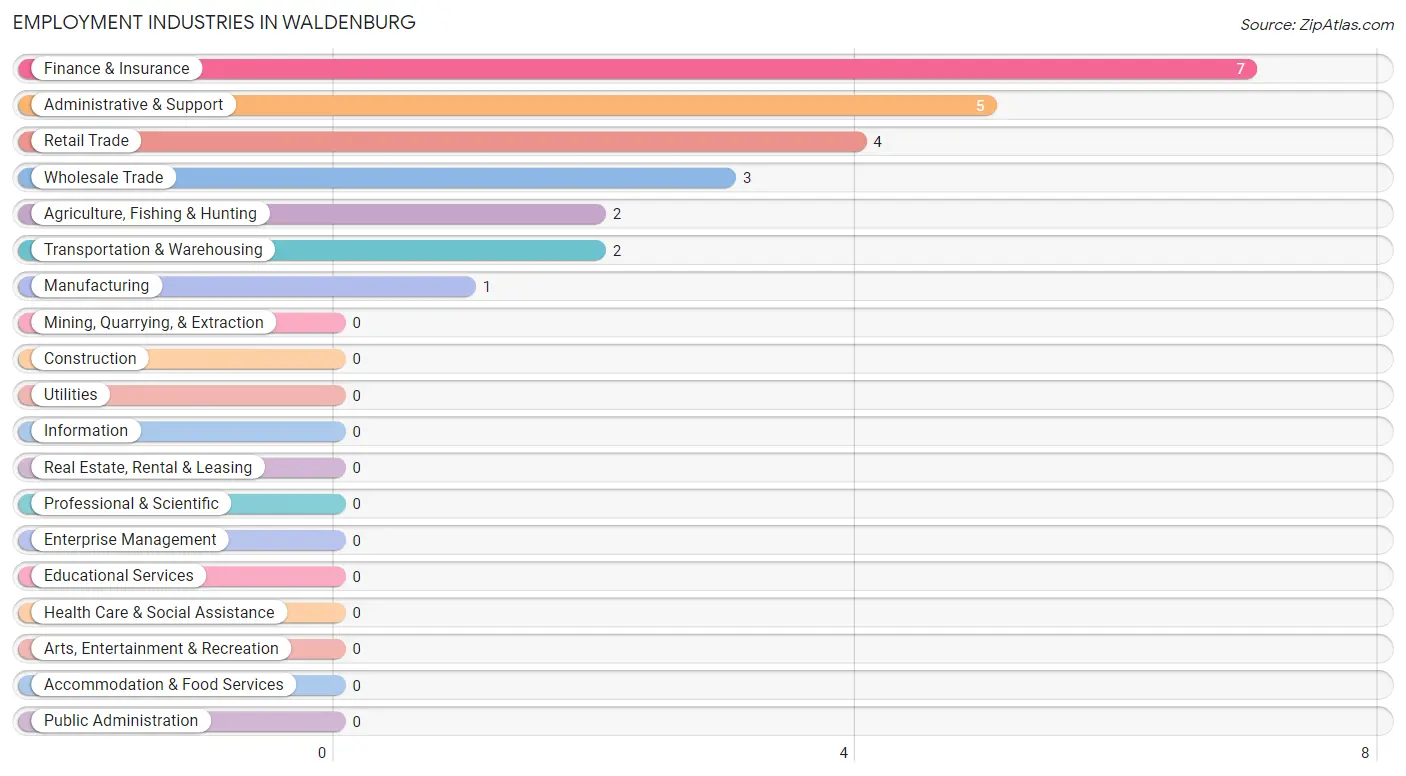
The major employment industries in Waldenburg include Finance & Insurance (7 | 24.1%), Administrative & Support (5 | 17.2%), Retail Trade (4 | 13.8%), Wholesale Trade (3 | 10.3%), and Agriculture, Fishing & Hunting (2 | 6.9%).
Employment Industries by Sex in Waldenburg
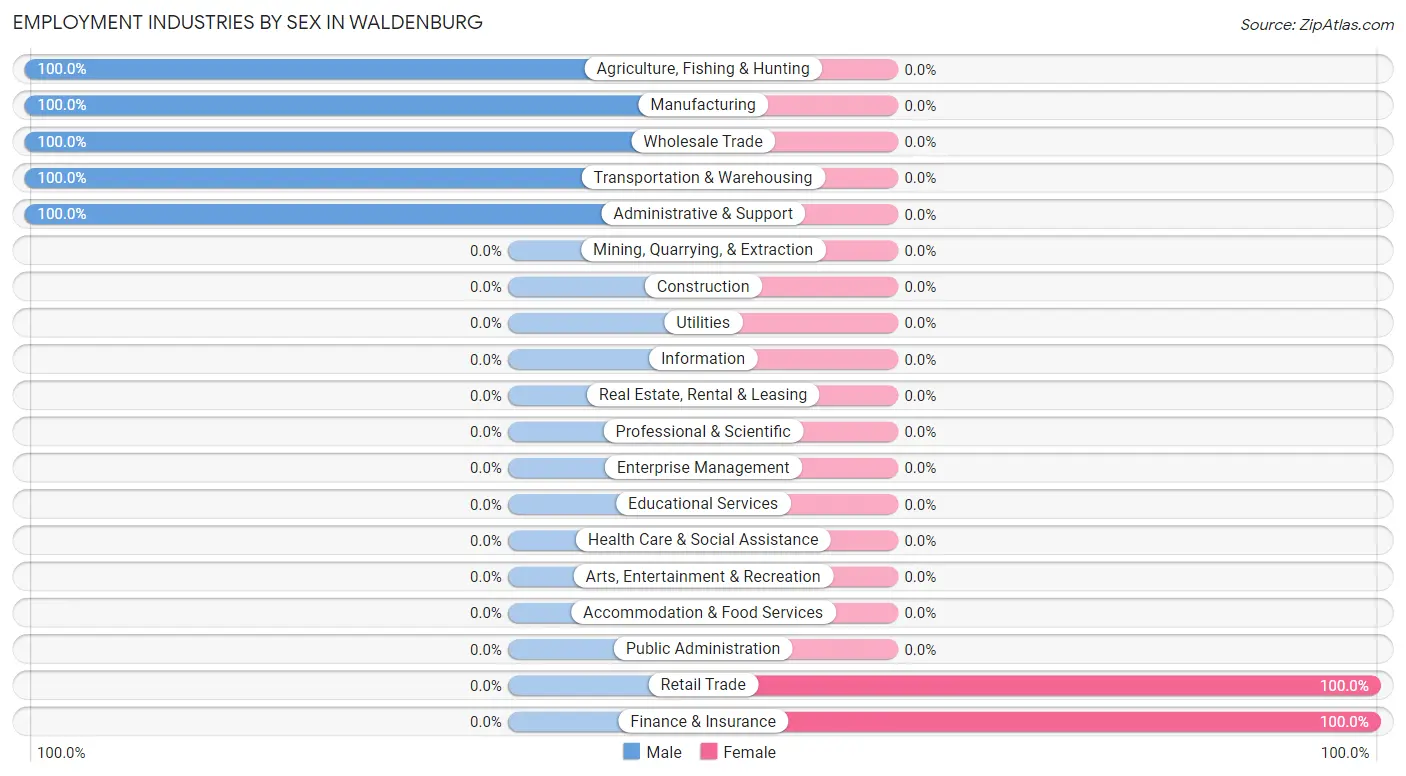
The Waldenburg industries that see more men than women are Agriculture, Fishing & Hunting (100.0%), Manufacturing (100.0%), and Wholesale Trade (100.0%), whereas the industries that tend to have a higher number of women are Retail Trade (100.0%), and Finance & Insurance (100.0%).
| Industry | Male | Female |
| Agriculture, Fishing & Hunting | 2 (100.0%) | 0 (0.0%) |
| Mining, Quarrying, & Extraction | 0 (0.0%) | 0 (0.0%) |
| Construction | 0 (0.0%) | 0 (0.0%) |
| Manufacturing | 1 (100.0%) | 0 (0.0%) |
| Wholesale Trade | 3 (100.0%) | 0 (0.0%) |
| Retail Trade | 0 (0.0%) | 4 (100.0%) |
| Transportation & Warehousing | 2 (100.0%) | 0 (0.0%) |
| Utilities | 0 (0.0%) | 0 (0.0%) |
| Information | 0 (0.0%) | 0 (0.0%) |
| Finance & Insurance | 0 (0.0%) | 7 (100.0%) |
| Real Estate, Rental & Leasing | 0 (0.0%) | 0 (0.0%) |
| Professional & Scientific | 0 (0.0%) | 0 (0.0%) |
| Enterprise Management | 0 (0.0%) | 0 (0.0%) |
| Administrative & Support | 5 (100.0%) | 0 (0.0%) |
| Educational Services | 0 (0.0%) | 0 (0.0%) |
| Health Care & Social Assistance | 0 (0.0%) | 0 (0.0%) |
| Arts, Entertainment & Recreation | 0 (0.0%) | 0 (0.0%) |
| Accommodation & Food Services | 0 (0.0%) | 0 (0.0%) |
| Public Administration | 0 (0.0%) | 0 (0.0%) |
| Total | 18 (62.1%) | 11 (37.9%) |
Education in Waldenburg
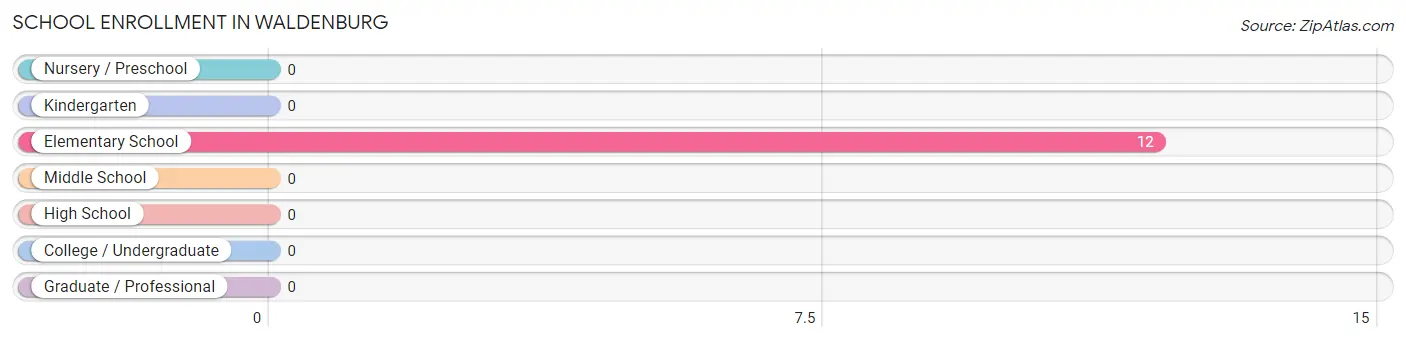
School Enrollment in Waldenburg
| School Level | # Students | % Students |
| Nursery / Preschool | 0 | 0.0% |
| Kindergarten | 0 | 0.0% |
| Elementary School | 12 | 100.0% |
| Middle School | 0 | 0.0% |
| High School | 0 | 0.0% |
| College / Undergraduate | 0 | 0.0% |
| Graduate / Professional | 0 | 0.0% |
| Total | 12 | 100.0% |
School Enrollment by Age by Funding Source in Waldenburg
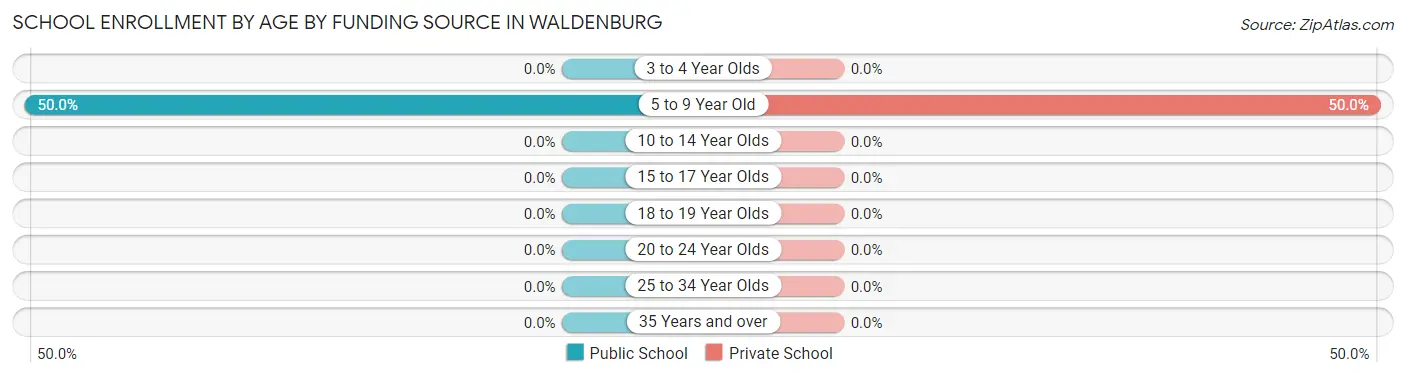
Out of a total of 12 students who are enrolled in schools in Waldenburg, 6 (50.0%) attend a private institution, while the remaining 6 (50.0%) are enrolled in public schools. The age group of 5 to 9 year old has the highest likelihood of being enrolled in private schools, with 6 (50.0% in the age bracket) enrolled. Conversely, the age group of 5 to 9 year old has the lowest likelihood of being enrolled in a private school, with 6 (50.0% in the age bracket) attending a public institution.
| Age Bracket | Public School | Private School |
| 3 to 4 Year Olds | 0 (0.0%) | 0 (0.0%) |
| 5 to 9 Year Old | 6 (50.0%) | 6 (50.0%) |
| 10 to 14 Year Olds | 0 (0.0%) | 0 (0.0%) |
| 15 to 17 Year Olds | 0 (0.0%) | 0 (0.0%) |
| 18 to 19 Year Olds | 0 (0.0%) | 0 (0.0%) |
| 20 to 24 Year Olds | 0 (0.0%) | 0 (0.0%) |
| 25 to 34 Year Olds | 0 (0.0%) | 0 (0.0%) |
| 35 Years and over | 0 (0.0%) | 0 (0.0%) |
| Total | 6 (50.0%) | 6 (50.0%) |
Educational Attainment by Field of Study in Waldenburg
| Field of Study | # Graduates | % Graduates |
| Computers & Mathematics | 0 | 0.0% |
| Bio, Nature & Agricultural | 0 | 0.0% |
| Physical & Health Sciences | 0 | 0.0% |
| Psychology | 0 | 0.0% |
| Social Sciences | 0 | 0.0% |
| Engineering | 0 | 0.0% |
| Multidisciplinary Studies | 0 | 0.0% |
| Science & Technology | 0 | 0.0% |
| Business | 0 | 0.0% |
| Education | 0 | 0.0% |
| Literature & Languages | 0 | 0.0% |
| Liberal Arts & History | 0 | 0.0% |
| Visual & Performing Arts | 0 | 0.0% |
| Communications | 0 | 0.0% |
| Arts & Humanities | 0 | 0.0% |
| Total | 0 | 0.0% |
Transportation & Commute in Waldenburg
Vehicle Availability by Sex in Waldenburg
The most prevalent vehicle ownership categories in Waldenburg are males with 2 vehicles (15, accounting for 83.3%) and females with 2 vehicles (7, making up 136.4%).
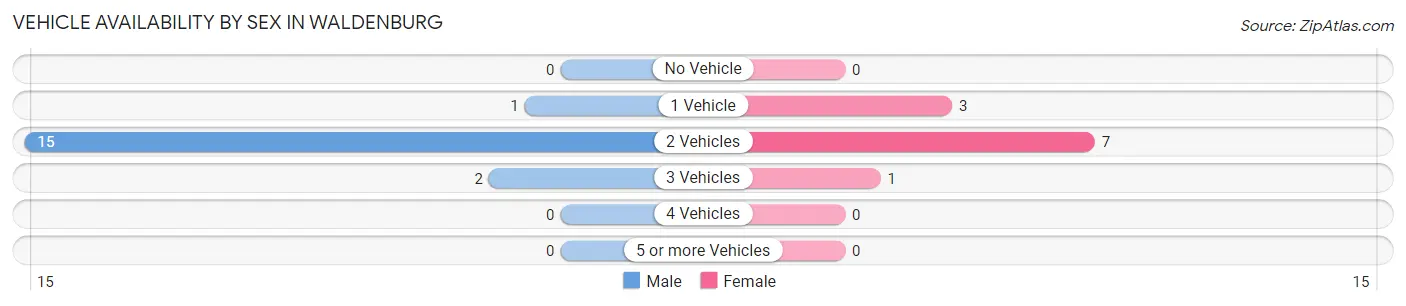
| Vehicles Available | Male | Female |
| No Vehicle | 0 (0.0%) | 0 (0.0%) |
| 1 Vehicle | 1 (5.6%) | 3 (27.3%) |
| 2 Vehicles | 15 (83.3%) | 7 (63.6%) |
| 3 Vehicles | 2 (11.1%) | 1 (9.1%) |
| 4 Vehicles | 0 (0.0%) | 0 (0.0%) |
| 5 or more Vehicles | 0 (0.0%) | 0 (0.0%) |
| Total | 18 (100.0%) | 11 (100.0%) |
Commute Time in Waldenburg
The most frequently occuring commute durations in Waldenburg are 40 to 44 minutes (10 commuters, 45.5%), 10 to 14 minutes (5 commuters, 22.7%), and less than 5 minutes (3 commuters, 13.6%).
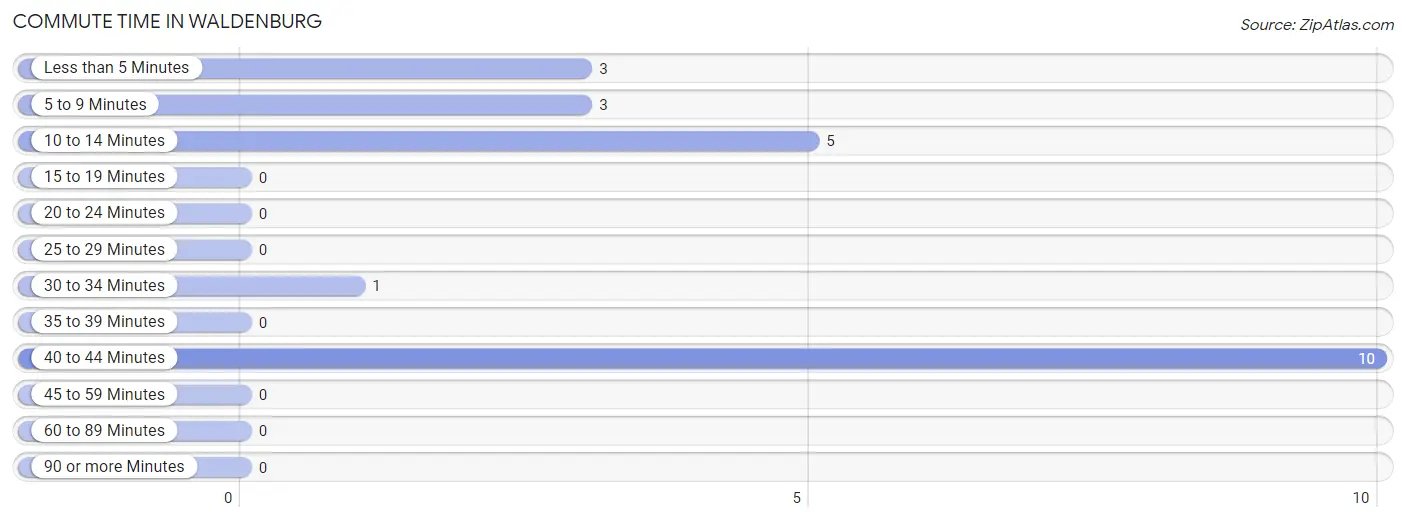
| Commute Time | # Commuters | % Commuters |
| Less than 5 Minutes | 3 | 13.6% |
| 5 to 9 Minutes | 3 | 13.6% |
| 10 to 14 Minutes | 5 | 22.7% |
| 15 to 19 Minutes | 0 | 0.0% |
| 20 to 24 Minutes | 0 | 0.0% |
| 25 to 29 Minutes | 0 | 0.0% |
| 30 to 34 Minutes | 1 | 4.5% |
| 35 to 39 Minutes | 0 | 0.0% |
| 40 to 44 Minutes | 10 | 45.5% |
| 45 to 59 Minutes | 0 | 0.0% |
| 60 to 89 Minutes | 0 | 0.0% |
| 90 or more Minutes | 0 | 0.0% |
Commute Time by Sex in Waldenburg
The most common commute times in Waldenburg are 40 to 44 minutes (10 commuters, 55.6%) for males and 10 to 14 minutes (3 commuters, 75.0%) for females.
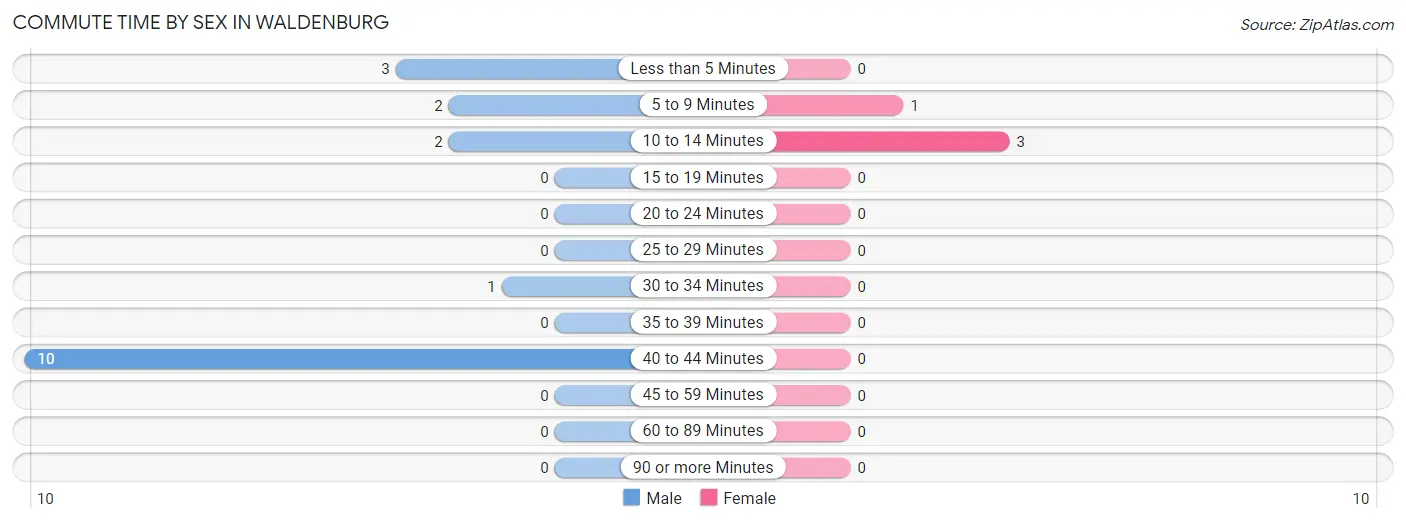
| Commute Time | Male | Female |
| Less than 5 Minutes | 3 (16.7%) | 0 (0.0%) |
| 5 to 9 Minutes | 2 (11.1%) | 1 (25.0%) |
| 10 to 14 Minutes | 2 (11.1%) | 3 (75.0%) |
| 15 to 19 Minutes | 0 (0.0%) | 0 (0.0%) |
| 20 to 24 Minutes | 0 (0.0%) | 0 (0.0%) |
| 25 to 29 Minutes | 0 (0.0%) | 0 (0.0%) |
| 30 to 34 Minutes | 1 (5.6%) | 0 (0.0%) |
| 35 to 39 Minutes | 0 (0.0%) | 0 (0.0%) |
| 40 to 44 Minutes | 10 (55.6%) | 0 (0.0%) |
| 45 to 59 Minutes | 0 (0.0%) | 0 (0.0%) |
| 60 to 89 Minutes | 0 (0.0%) | 0 (0.0%) |
| 90 or more Minutes | 0 (0.0%) | 0 (0.0%) |
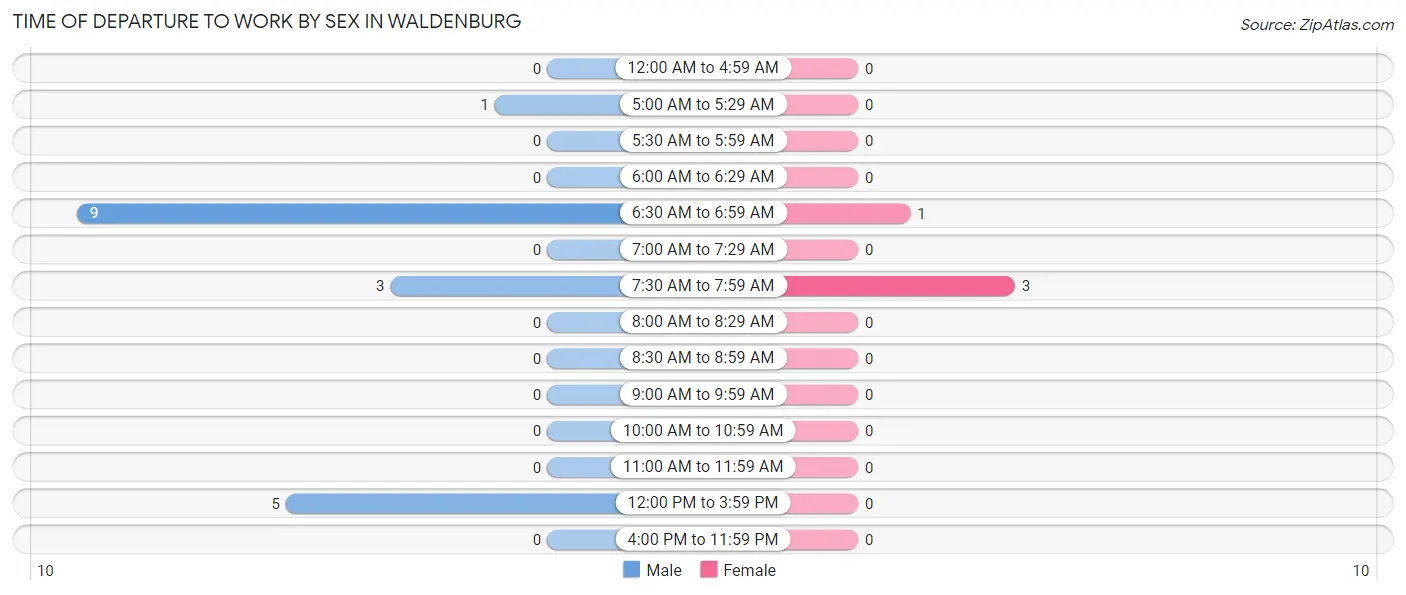
Time of Departure to Work by Sex in Waldenburg
The most frequent times of departure to work in Waldenburg are 6:30 AM to 6:59 AM (9, 50.0%) for males and 7:30 AM to 7:59 AM (3, 75.0%) for females.
| Time of Departure | Male | Female |
| 12:00 AM to 4:59 AM | 0 (0.0%) | 0 (0.0%) |
| 5:00 AM to 5:29 AM | 1 (5.6%) | 0 (0.0%) |
| 5:30 AM to 5:59 AM | 0 (0.0%) | 0 (0.0%) |
| 6:00 AM to 6:29 AM | 0 (0.0%) | 0 (0.0%) |
| 6:30 AM to 6:59 AM | 9 (50.0%) | 1 (25.0%) |
| 7:00 AM to 7:29 AM | 0 (0.0%) | 0 (0.0%) |
| 7:30 AM to 7:59 AM | 3 (16.7%) | 3 (75.0%) |
| 8:00 AM to 8:29 AM | 0 (0.0%) | 0 (0.0%) |
| 8:30 AM to 8:59 AM | 0 (0.0%) | 0 (0.0%) |
| 9:00 AM to 9:59 AM | 0 (0.0%) | 0 (0.0%) |
| 10:00 AM to 10:59 AM | 0 (0.0%) | 0 (0.0%) |
| 11:00 AM to 11:59 AM | 0 (0.0%) | 0 (0.0%) |
| 12:00 PM to 3:59 PM | 5 (27.8%) | 0 (0.0%) |
| 4:00 PM to 11:59 PM | 0 (0.0%) | 0 (0.0%) |
| Total | 18 (100.0%) | 4 (100.0%) |
Housing Occupancy in Waldenburg
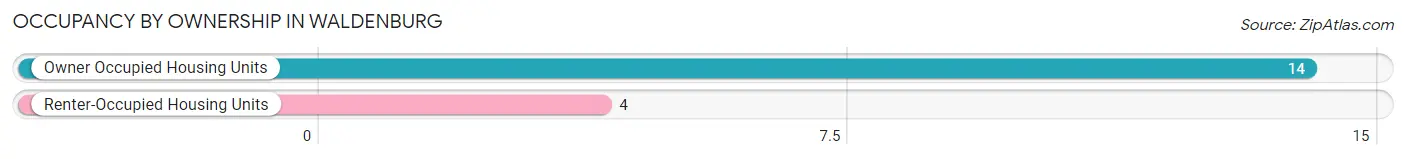
Occupancy by Ownership in Waldenburg
Of the total 18 dwellings in Waldenburg, owner-occupied units account for 14 (77.8%), while renter-occupied units make up 4 (22.2%).
| Occupancy | # Housing Units | % Housing Units |
| Owner Occupied Housing Units | 14 | 77.8% |
| Renter-Occupied Housing Units | 4 | 22.2% |
| Total Occupied Housing Units | 18 | 100.0% |
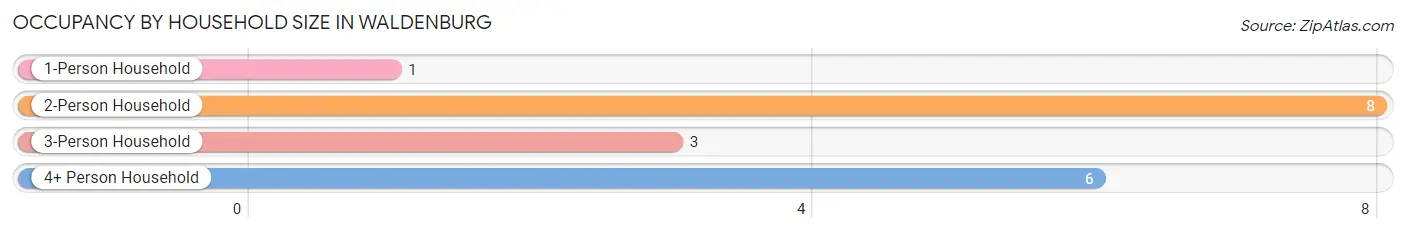
Occupancy by Household Size in Waldenburg
| Household Size | # Housing Units | % Housing Units |
| 1-Person Household | 1 | 5.6% |
| 2-Person Household | 8 | 44.4% |
| 3-Person Household | 3 | 16.7% |
| 4+ Person Household | 6 | 33.3% |
| Total Housing Units | 18 | 100.0% |
Occupancy by Ownership by Household Size in Waldenburg
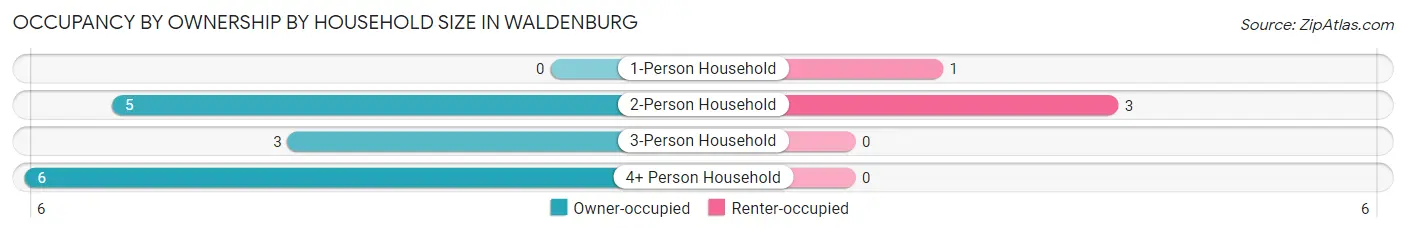
| Household Size | Owner-occupied | Renter-occupied |
| 1-Person Household | 0 (0.0%) | 1 (100.0%) |
| 2-Person Household | 5 (62.5%) | 3 (37.5%) |
| 3-Person Household | 3 (100.0%) | 0 (0.0%) |
| 4+ Person Household | 6 (100.0%) | 0 (0.0%) |
| Total Housing Units | 14 (77.8%) | 4 (22.2%) |
Occupancy by Educational Attainment in Waldenburg
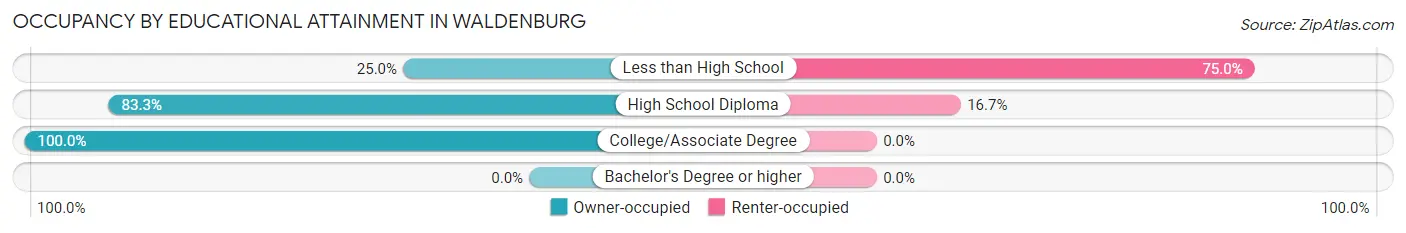
| Household Size | Owner-occupied | Renter-occupied |
| Less than High School | 1 (25.0%) | 3 (75.0%) |
| High School Diploma | 5 (83.3%) | 1 (16.7%) |
| College/Associate Degree | 8 (100.0%) | 0 (0.0%) |
| Bachelor's Degree or higher | 0 (0.0%) | 0 (0.0%) |
Occupancy by Age of Householder in Waldenburg
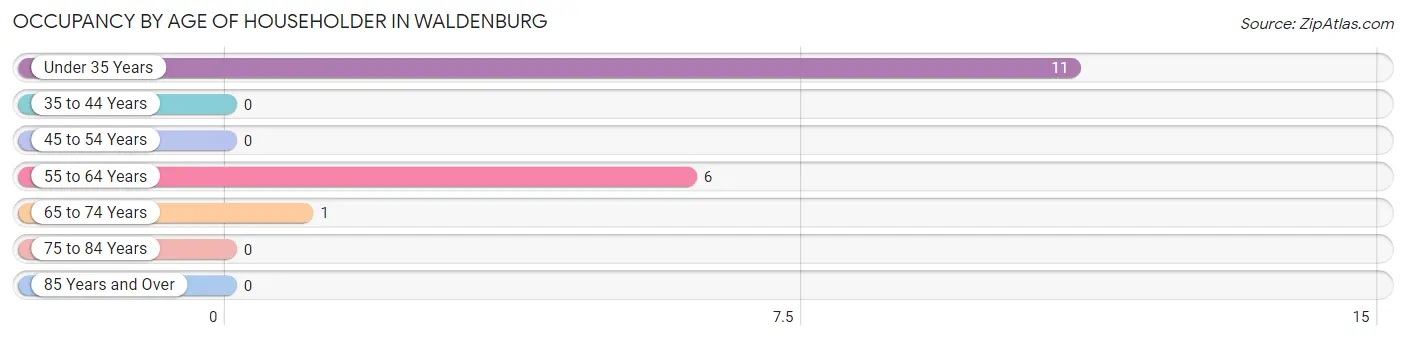
| Age Bracket | # Households | % Households |
| Under 35 Years | 11 | 61.1% |
| 35 to 44 Years | 0 | 0.0% |
| 45 to 54 Years | 0 | 0.0% |
| 55 to 64 Years | 6 | 33.3% |
| 65 to 74 Years | 1 | 5.6% |
| 75 to 84 Years | 0 | 0.0% |
| 85 Years and Over | 0 | 0.0% |
| Total | 18 | 100.0% |
Housing Finances in Waldenburg
Median Income by Occupancy in Waldenburg
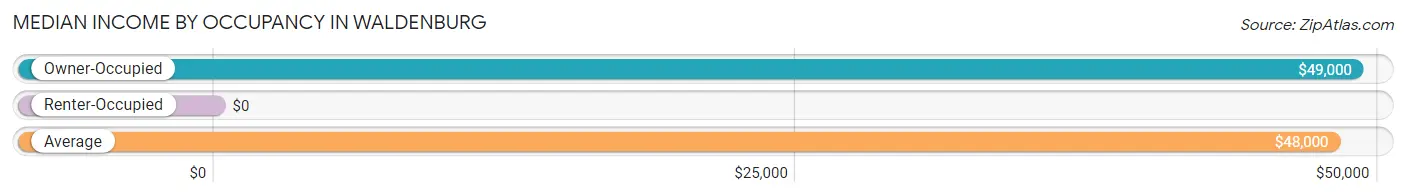
| Occupancy Type | # Households | Median Income |
| Owner-Occupied | 14 (77.8%) | $49,000 |
| Renter-Occupied | 4 (22.2%) | $0 |
| Average | 18 (100.0%) | $48,000 |
Occupancy by Householder Income Bracket in Waldenburg
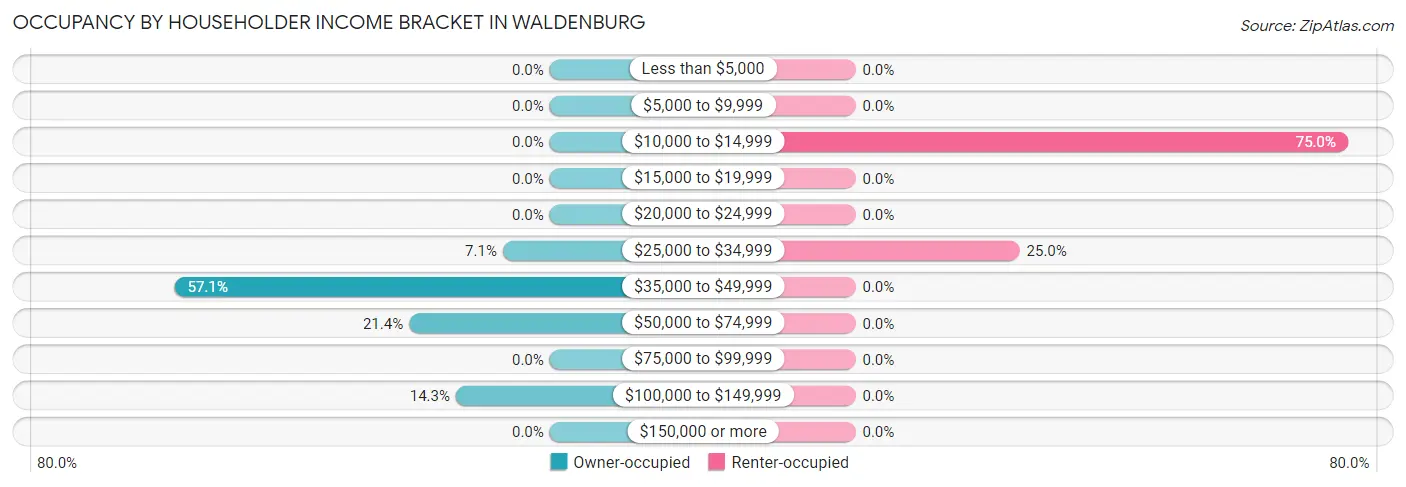
| Income Bracket | Owner-occupied | Renter-occupied |
| Less than $5,000 | 0 (0.0%) | 0 (0.0%) |
| $5,000 to $9,999 | 0 (0.0%) | 0 (0.0%) |
| $10,000 to $14,999 | 0 (0.0%) | 3 (75.0%) |
| $15,000 to $19,999 | 0 (0.0%) | 0 (0.0%) |
| $20,000 to $24,999 | 0 (0.0%) | 0 (0.0%) |
| $25,000 to $34,999 | 1 (7.1%) | 1 (25.0%) |
| $35,000 to $49,999 | 8 (57.1%) | 0 (0.0%) |
| $50,000 to $74,999 | 3 (21.4%) | 0 (0.0%) |
| $75,000 to $99,999 | 0 (0.0%) | 0 (0.0%) |
| $100,000 to $149,999 | 2 (14.3%) | 0 (0.0%) |
| $150,000 or more | 0 (0.0%) | 0 (0.0%) |
| Total | 14 (100.0%) | 4 (100.0%) |
Monthly Housing Cost Tiers in Waldenburg
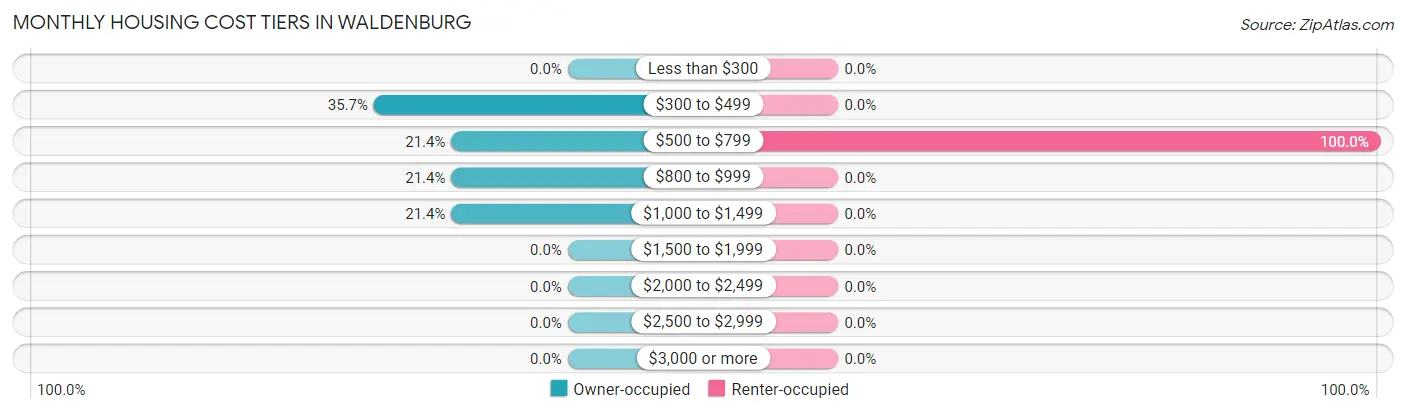
| Monthly Cost | Owner-occupied | Renter-occupied |
| Less than $300 | 0 (0.0%) | 0 (0.0%) |
| $300 to $499 | 5 (35.7%) | 0 (0.0%) |
| $500 to $799 | 3 (21.4%) | 4 (100.0%) |
| $800 to $999 | 3 (21.4%) | 0 (0.0%) |
| $1,000 to $1,499 | 3 (21.4%) | 0 (0.0%) |
| $1,500 to $1,999 | 0 (0.0%) | 0 (0.0%) |
| $2,000 to $2,499 | 0 (0.0%) | 0 (0.0%) |
| $2,500 to $2,999 | 0 (0.0%) | 0 (0.0%) |
| $3,000 or more | 0 (0.0%) | 0 (0.0%) |
| Total | 14 (100.0%) | 4 (100.0%) |
Physical Housing Characteristics in Waldenburg
Housing Structures in Waldenburg
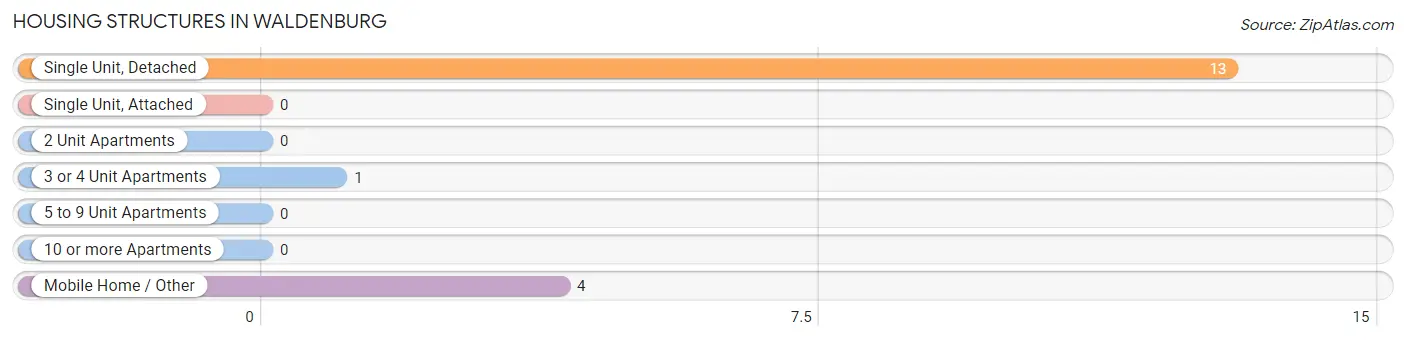
| Structure Type | # Housing Units | % Housing Units |
| Single Unit, Detached | 13 | 72.2% |
| Single Unit, Attached | 0 | 0.0% |
| 2 Unit Apartments | 0 | 0.0% |
| 3 or 4 Unit Apartments | 1 | 5.6% |
| 5 to 9 Unit Apartments | 0 | 0.0% |
| 10 or more Apartments | 0 | 0.0% |
| Mobile Home / Other | 4 | 22.2% |
| Total | 18 | 100.0% |
Housing Structures by Occupancy in Waldenburg
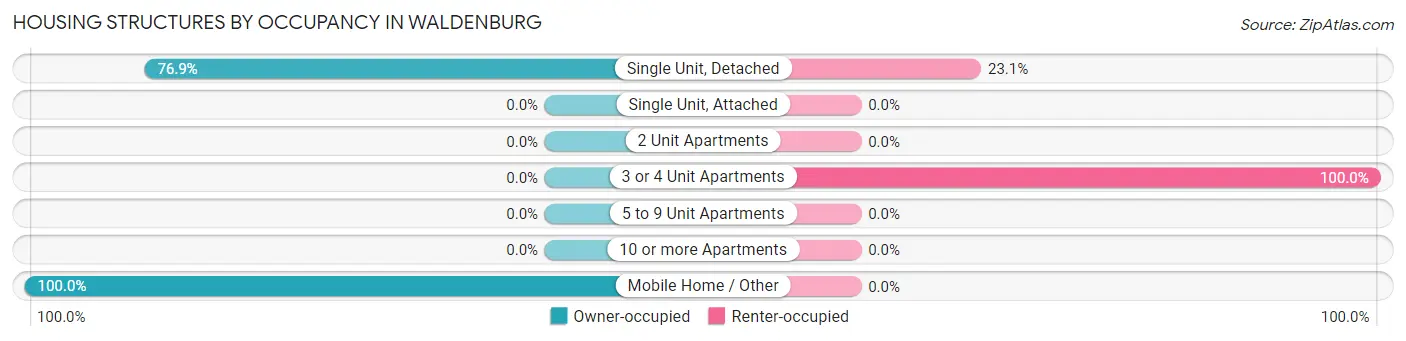
| Structure Type | Owner-occupied | Renter-occupied |
| Single Unit, Detached | 10 (76.9%) | 3 (23.1%) |
| Single Unit, Attached | 0 (0.0%) | 0 (0.0%) |
| 2 Unit Apartments | 0 (0.0%) | 0 (0.0%) |
| 3 or 4 Unit Apartments | 0 (0.0%) | 1 (100.0%) |
| 5 to 9 Unit Apartments | 0 (0.0%) | 0 (0.0%) |
| 10 or more Apartments | 0 (0.0%) | 0 (0.0%) |
| Mobile Home / Other | 4 (100.0%) | 0 (0.0%) |
| Total | 14 (77.8%) | 4 (22.2%) |
Housing Structures by Number of Rooms in Waldenburg
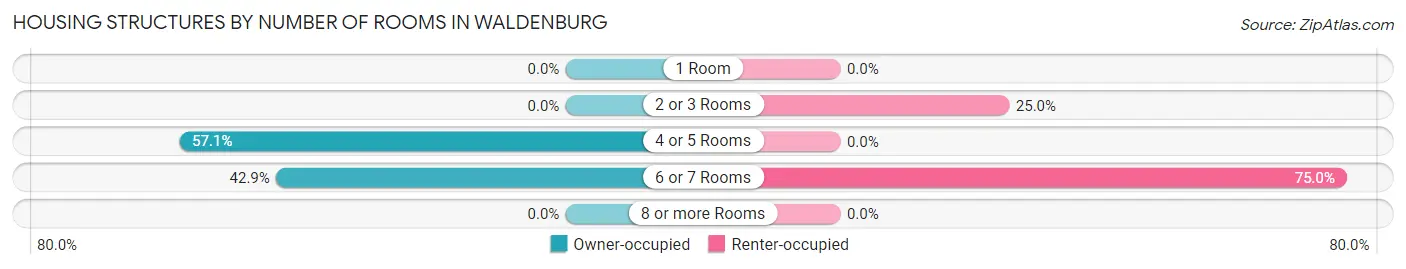
| Number of Rooms | Owner-occupied | Renter-occupied |
| 1 Room | 0 (0.0%) | 0 (0.0%) |
| 2 or 3 Rooms | 0 (0.0%) | 1 (25.0%) |
| 4 or 5 Rooms | 8 (57.1%) | 0 (0.0%) |
| 6 or 7 Rooms | 6 (42.9%) | 3 (75.0%) |
| 8 or more Rooms | 0 (0.0%) | 0 (0.0%) |
| Total | 14 (100.0%) | 4 (100.0%) |
Housing Structure by Heating Type in Waldenburg
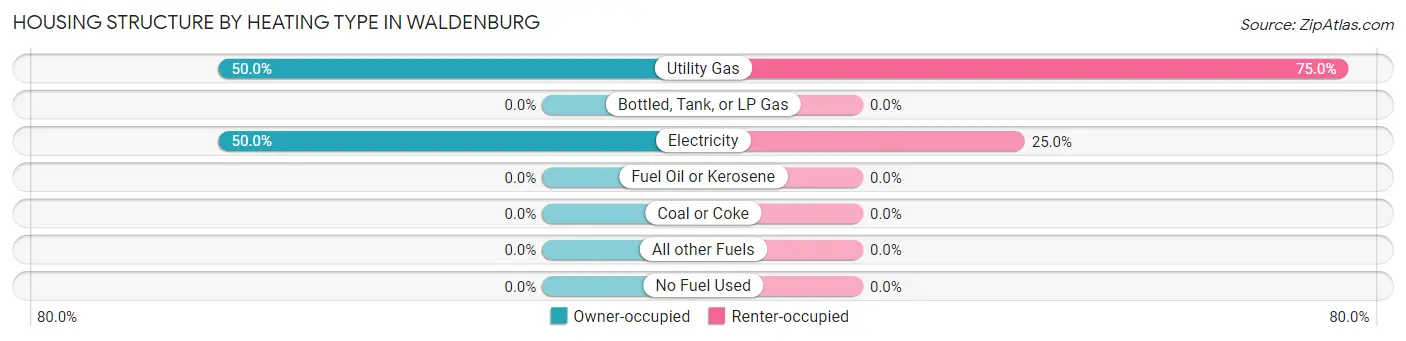
| Heating Type | Owner-occupied | Renter-occupied |
| Utility Gas | 7 (50.0%) | 3 (75.0%) |
| Bottled, Tank, or LP Gas | 0 (0.0%) | 0 (0.0%) |
| Electricity | 7 (50.0%) | 1 (25.0%) |
| Fuel Oil or Kerosene | 0 (0.0%) | 0 (0.0%) |
| Coal or Coke | 0 (0.0%) | 0 (0.0%) |
| All other Fuels | 0 (0.0%) | 0 (0.0%) |
| No Fuel Used | 0 (0.0%) | 0 (0.0%) |
| Total | 14 (100.0%) | 4 (100.0%) |
Household Vehicle Usage in Waldenburg
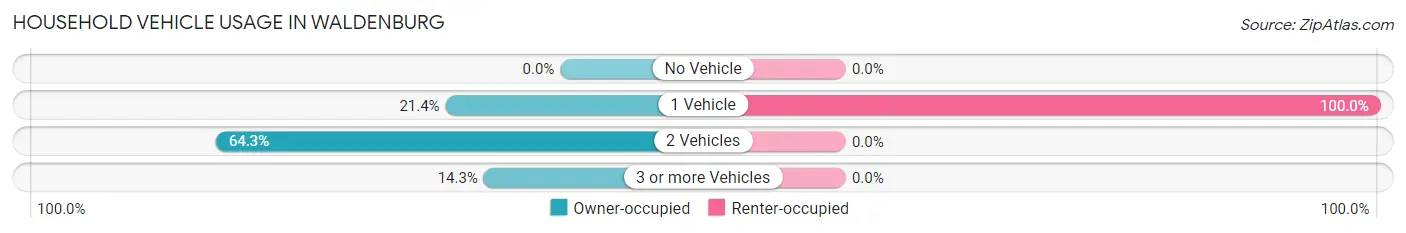
| Vehicles per Household | Owner-occupied | Renter-occupied |
| No Vehicle | 0 (0.0%) | 0 (0.0%) |
| 1 Vehicle | 3 (21.4%) | 4 (100.0%) |
| 2 Vehicles | 9 (64.3%) | 0 (0.0%) |
| 3 or more Vehicles | 2 (14.3%) | 0 (0.0%) |
| Total | 14 (100.0%) | 4 (100.0%) |
Real Estate & Mortgages in Waldenburg
Real Estate and Mortgage Overview in Waldenburg
| Characteristic | Without Mortgage | With Mortgage |
| Housing Units | 5 | 9 |
| Median Property Value | - | - |
| Median Household Income | - | - |
| Monthly Housing Costs | - | - |
| Real Estate Taxes | - | - |
Property Value by Mortgage Status in Waldenburg
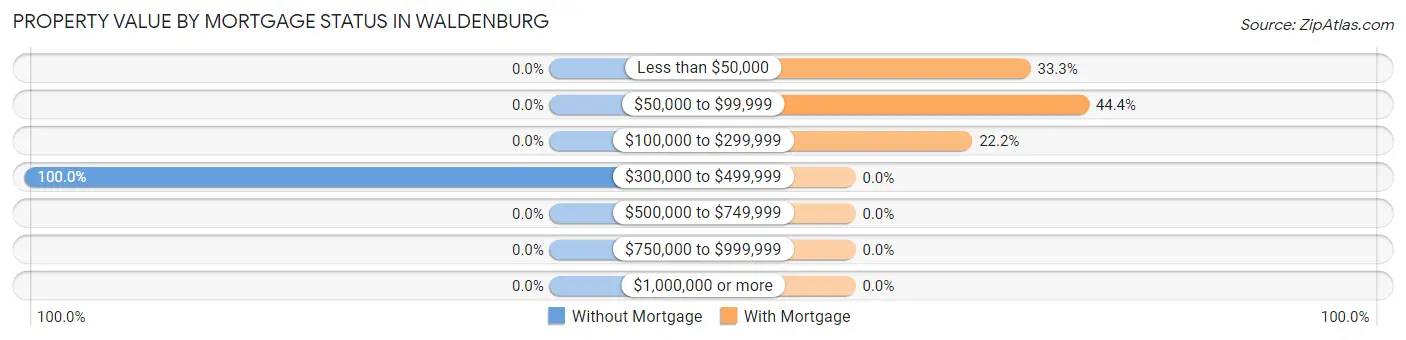
| Property Value | Without Mortgage | With Mortgage |
| Less than $50,000 | 0 (0.0%) | 3 (33.3%) |
| $50,000 to $99,999 | 0 (0.0%) | 4 (44.4%) |
| $100,000 to $299,999 | 0 (0.0%) | 2 (22.2%) |
| $300,000 to $499,999 | 5 (100.0%) | 0 (0.0%) |
| $500,000 to $749,999 | 0 (0.0%) | 0 (0.0%) |
| $750,000 to $999,999 | 0 (0.0%) | 0 (0.0%) |
| $1,000,000 or more | 0 (0.0%) | 0 (0.0%) |
| Total | 5 (100.0%) | 9 (100.0%) |
Household Income by Mortgage Status in Waldenburg
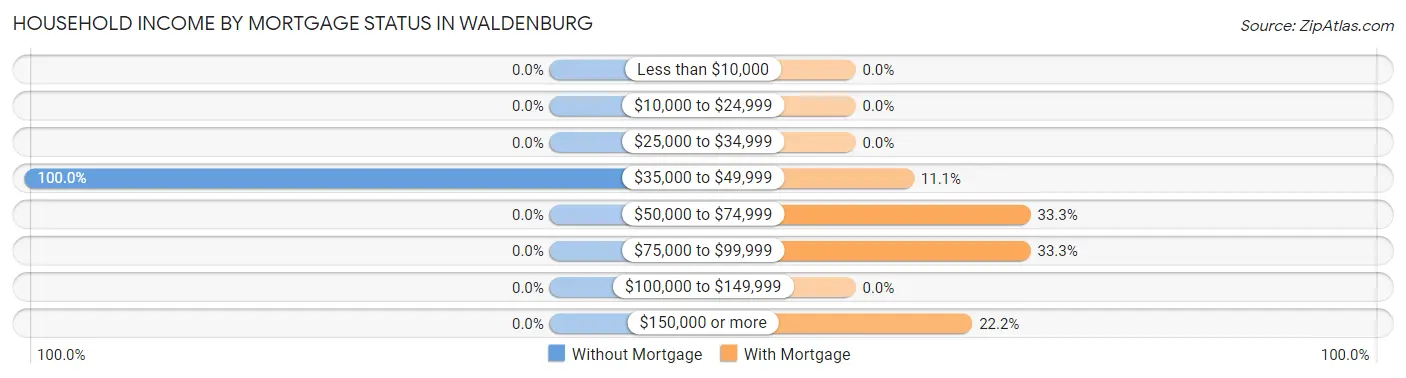
| Household Income | Without Mortgage | With Mortgage |
| Less than $10,000 | 0 (0.0%) | 0 (0.0%) |
| $10,000 to $24,999 | 0 (0.0%) | 0 (0.0%) |
| $25,000 to $34,999 | 0 (0.0%) | 0 (0.0%) |
| $35,000 to $49,999 | 5 (100.0%) | 1 (11.1%) |
| $50,000 to $74,999 | 0 (0.0%) | 3 (33.3%) |
| $75,000 to $99,999 | 0 (0.0%) | 3 (33.3%) |
| $100,000 to $149,999 | 0 (0.0%) | 0 (0.0%) |
| $150,000 or more | 0 (0.0%) | 2 (22.2%) |
| Total | 5 (100.0%) | 9 (100.0%) |
Property Value to Household Income Ratio in Waldenburg
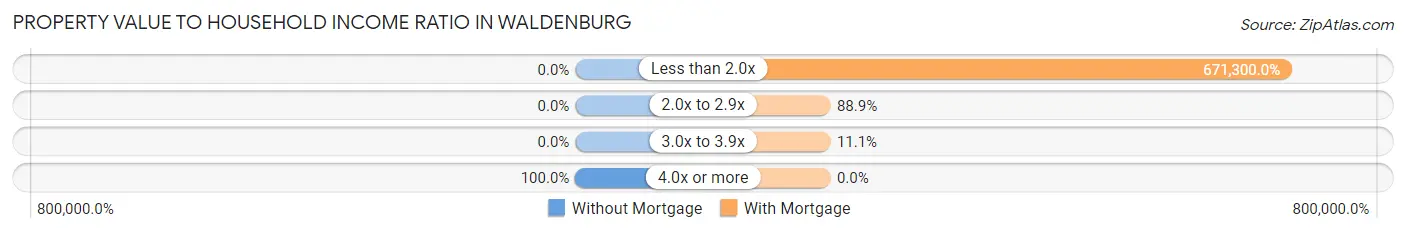
| Value-to-Income Ratio | Without Mortgage | With Mortgage |
| Less than 2.0x | 0 (0.0%) | 60,417 (671,300.0%) |
| 2.0x to 2.9x | 0 (0.0%) | 8 (88.9%) |
| 3.0x to 3.9x | 0 (0.0%) | 1 (11.1%) |
| 4.0x or more | 5 (100.0%) | 0 (0.0%) |
| Total | 5 (100.0%) | 9 (100.0%) |
Real Estate Taxes by Mortgage Status in Waldenburg
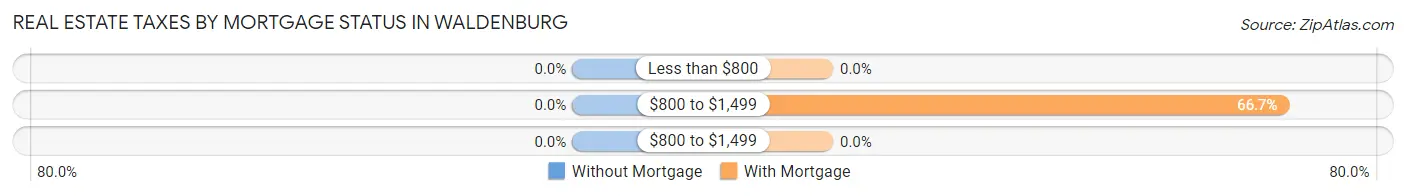
| Property Taxes | Without Mortgage | With Mortgage |
| Less than $800 | 0 (0.0%) | 0 (0.0%) |
| $800 to $1,499 | 0 (0.0%) | 6 (66.7%) |
| $800 to $1,499 | 0 (0.0%) | 0 (0.0%) |
| Total | 5 (100.0%) | 9 (100.0%) |
Health & Disability in Waldenburg
Health Insurance Coverage by Age in Waldenburg
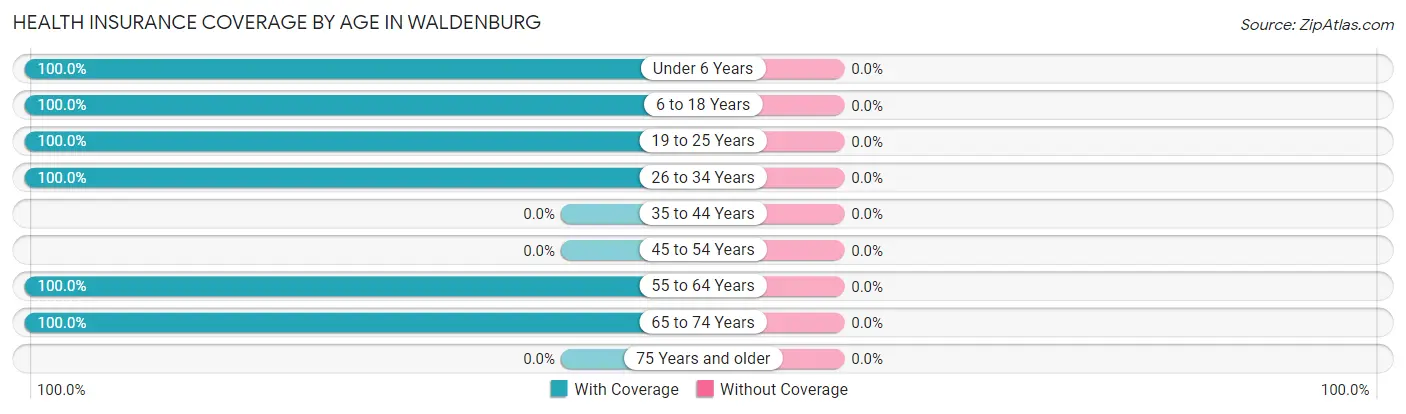
| Age Bracket | With Coverage | Without Coverage |
| Under 6 Years | 8 (100.0%) | 0 (0.0%) |
| 6 to 18 Years | 12 (100.0%) | 0 (0.0%) |
| 19 to 25 Years | 9 (100.0%) | 0 (0.0%) |
| 26 to 34 Years | 15 (100.0%) | 0 (0.0%) |
| 35 to 44 Years | 0 (0.0%) | 0 (0.0%) |
| 45 to 54 Years | 0 (0.0%) | 0 (0.0%) |
| 55 to 64 Years | 11 (100.0%) | 0 (0.0%) |
| 65 to 74 Years | 2 (100.0%) | 0 (0.0%) |
| 75 Years and older | 0 (0.0%) | 0 (0.0%) |
| Total | 57 (100.0%) | 0 (0.0%) |
Health Insurance Coverage by Citizenship Status in Waldenburg

| Citizenship Status | With Coverage | Without Coverage |
| Native Born | 8 (100.0%) | 0 (0.0%) |
| Foreign Born, Citizen | 12 (100.0%) | 0 (0.0%) |
| Foreign Born, not a Citizen | 9 (100.0%) | 0 (0.0%) |
Health Insurance Coverage by Household Income in Waldenburg
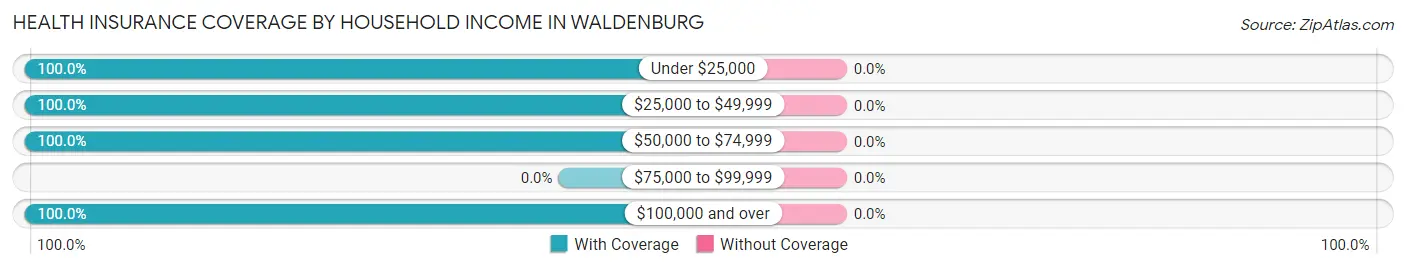
| Household Income | With Coverage | Without Coverage |
| Under $25,000 | 6 (100.0%) | 0 (0.0%) |
| $25,000 to $49,999 | 40 (100.0%) | 0 (0.0%) |
| $50,000 to $74,999 | 8 (100.0%) | 0 (0.0%) |
| $75,000 to $99,999 | 0 (0.0%) | 0 (0.0%) |
| $100,000 and over | 3 (100.0%) | 0 (0.0%) |
Public vs Private Health Insurance Coverage by Age in Waldenburg
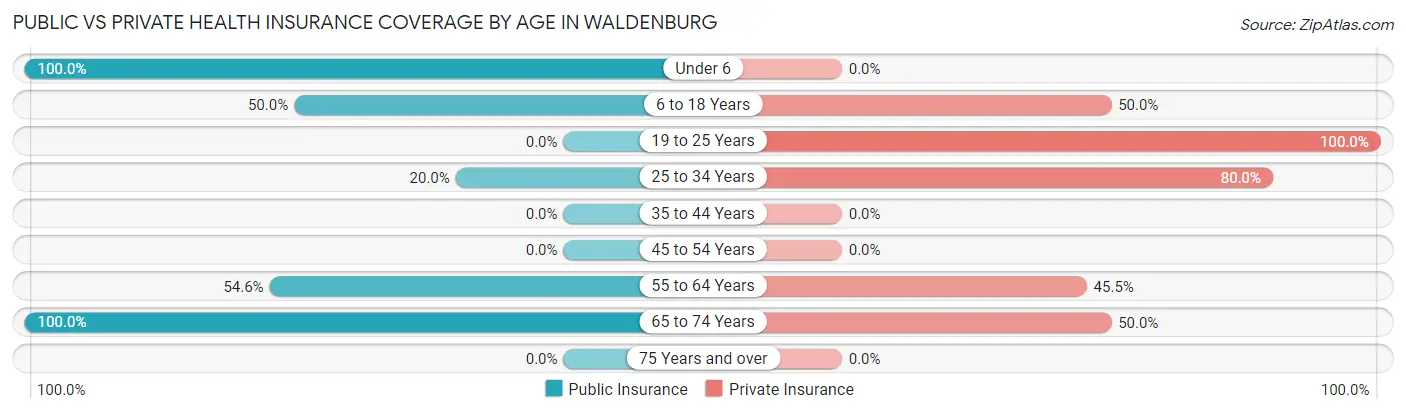
| Age Bracket | Public Insurance | Private Insurance |
| Under 6 | 8 (100.0%) | 0 (0.0%) |
| 6 to 18 Years | 6 (50.0%) | 6 (50.0%) |
| 19 to 25 Years | 0 (0.0%) | 9 (100.0%) |
| 25 to 34 Years | 3 (20.0%) | 12 (80.0%) |
| 35 to 44 Years | 0 (0.0%) | 0 (0.0%) |
| 45 to 54 Years | 0 (0.0%) | 0 (0.0%) |
| 55 to 64 Years | 6 (54.5%) | 5 (45.5%) |
| 65 to 74 Years | 2 (100.0%) | 1 (50.0%) |
| 75 Years and over | 0 (0.0%) | 0 (0.0%) |
| Total | 25 (43.9%) | 33 (57.9%) |
Disability Status by Sex by Age in Waldenburg
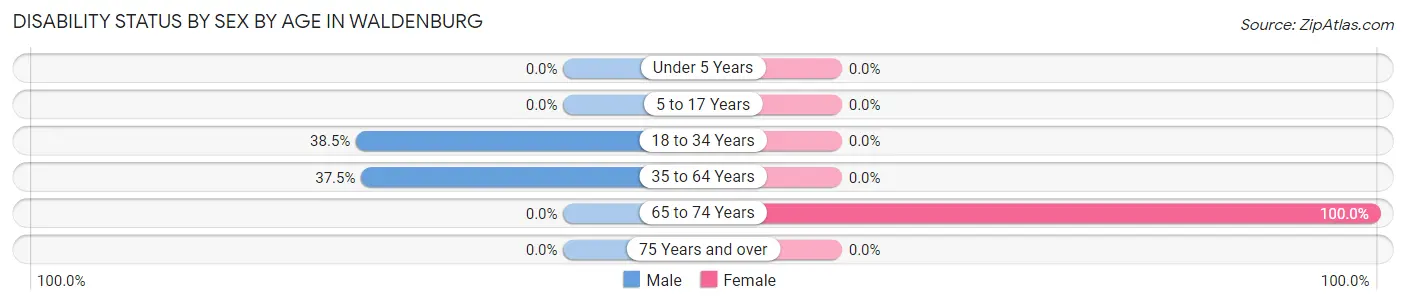
| Age Bracket | Male | Female |
| Under 5 Years | 0 (0.0%) | 0 (0.0%) |
| 5 to 17 Years | 0 (0.0%) | 0 (0.0%) |
| 18 to 34 Years | 5 (38.5%) | 0 (0.0%) |
| 35 to 64 Years | 3 (37.5%) | 0 (0.0%) |
| 65 to 74 Years | 0 (0.0%) | 1 (100.0%) |
| 75 Years and over | 0 (0.0%) | 0 (0.0%) |
Disability Class by Sex by Age in Waldenburg
Disability Class: Hearing Difficulty
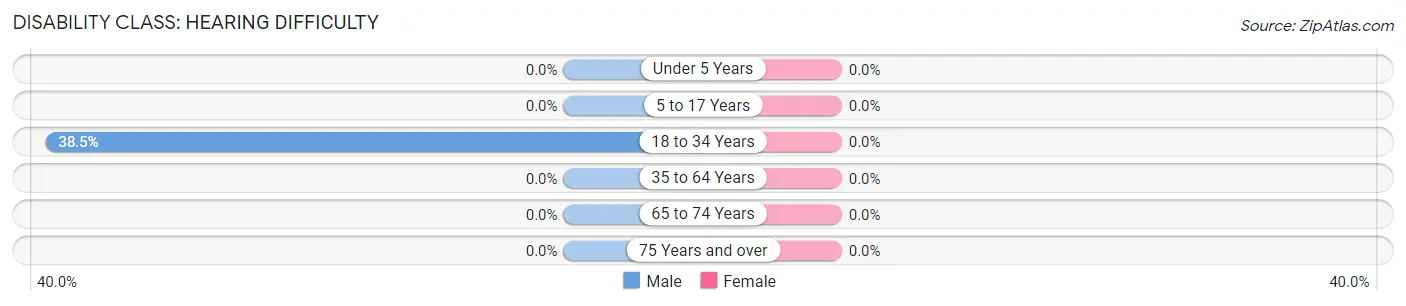
| Age Bracket | Male | Female |
| Under 5 Years | 0 (0.0%) | 0 (0.0%) |
| 5 to 17 Years | 0 (0.0%) | 0 (0.0%) |
| 18 to 34 Years | 5 (38.5%) | 0 (0.0%) |
| 35 to 64 Years | 0 (0.0%) | 0 (0.0%) |
| 65 to 74 Years | 0 (0.0%) | 0 (0.0%) |
| 75 Years and over | 0 (0.0%) | 0 (0.0%) |
Disability Class: Vision Difficulty
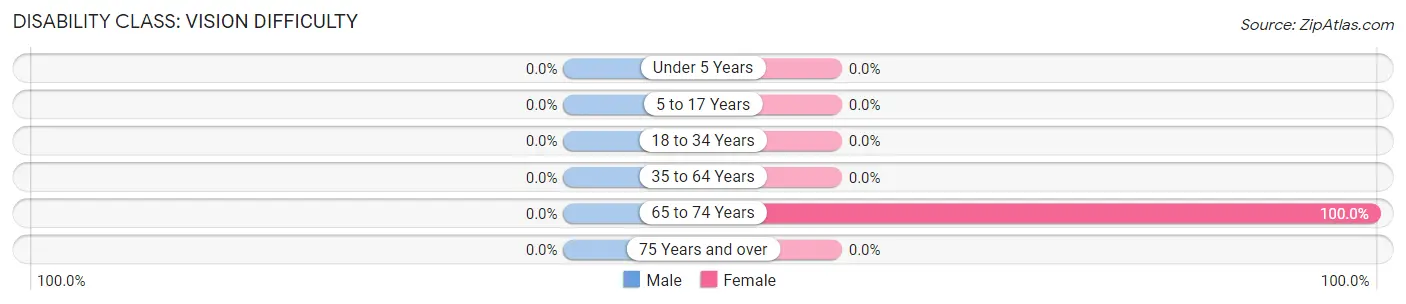
| Age Bracket | Male | Female |
| Under 5 Years | 0 (0.0%) | 0 (0.0%) |
| 5 to 17 Years | 0 (0.0%) | 0 (0.0%) |
| 18 to 34 Years | 0 (0.0%) | 0 (0.0%) |
| 35 to 64 Years | 0 (0.0%) | 0 (0.0%) |
| 65 to 74 Years | 0 (0.0%) | 1 (100.0%) |
| 75 Years and over | 0 (0.0%) | 0 (0.0%) |
Disability Class: Cognitive Difficulty
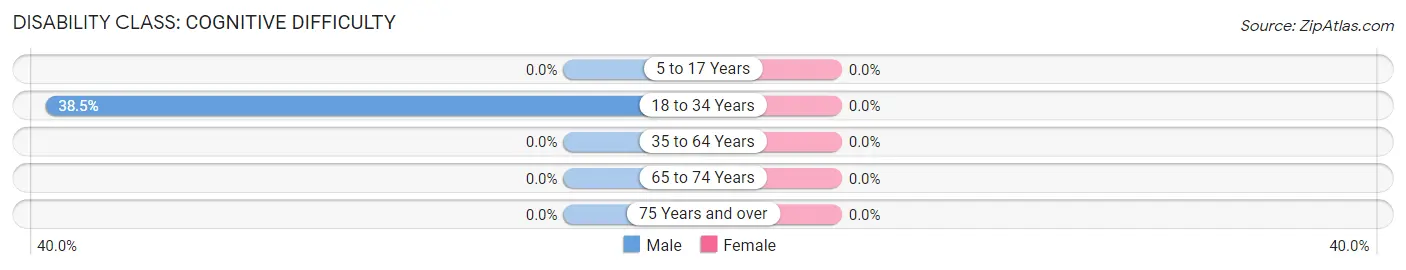
| Age Bracket | Male | Female |
| 5 to 17 Years | 0 (0.0%) | 0 (0.0%) |
| 18 to 34 Years | 5 (38.5%) | 0 (0.0%) |
| 35 to 64 Years | 0 (0.0%) | 0 (0.0%) |
| 65 to 74 Years | 0 (0.0%) | 0 (0.0%) |
| 75 Years and over | 0 (0.0%) | 0 (0.0%) |
Disability Class: Ambulatory Difficulty
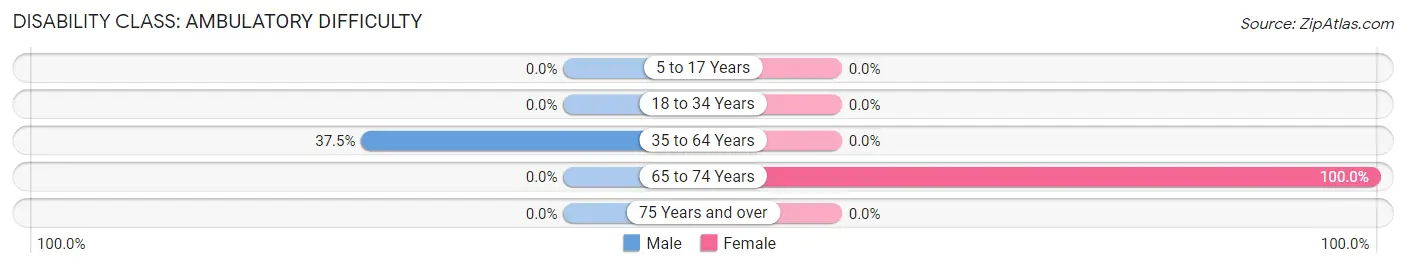
| Age Bracket | Male | Female |
| 5 to 17 Years | 0 (0.0%) | 0 (0.0%) |
| 18 to 34 Years | 0 (0.0%) | 0 (0.0%) |
| 35 to 64 Years | 3 (37.5%) | 0 (0.0%) |
| 65 to 74 Years | 0 (0.0%) | 1 (100.0%) |
| 75 Years and over | 0 (0.0%) | 0 (0.0%) |
Disability Class: Self-Care Difficulty
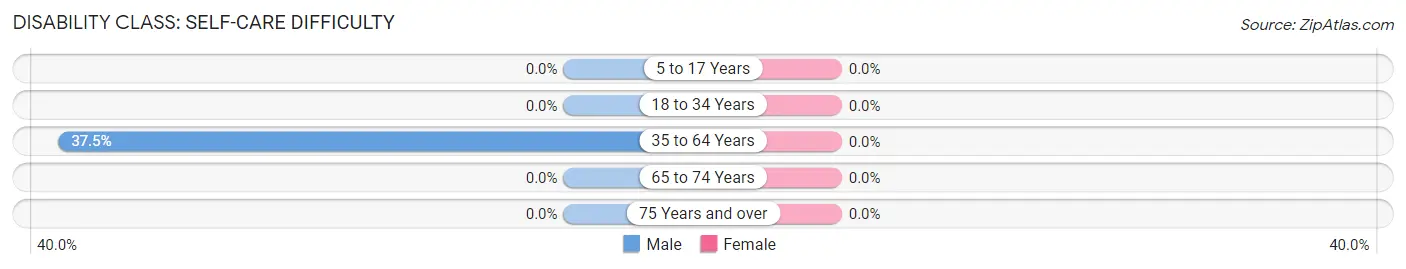
| Age Bracket | Male | Female |
| 5 to 17 Years | 0 (0.0%) | 0 (0.0%) |
| 18 to 34 Years | 0 (0.0%) | 0 (0.0%) |
| 35 to 64 Years | 3 (37.5%) | 0 (0.0%) |
| 65 to 74 Years | 0 (0.0%) | 0 (0.0%) |
| 75 Years and over | 0 (0.0%) | 0 (0.0%) |
Technology Access in Waldenburg
Computing Device Access in Waldenburg
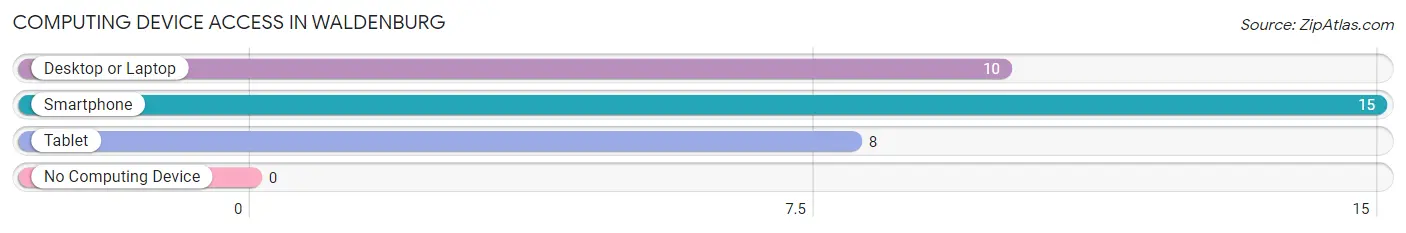
| Device Type | # Households | % Households |
| Desktop or Laptop | 10 | 55.6% |
| Smartphone | 15 | 83.3% |
| Tablet | 8 | 44.4% |
| No Computing Device | 0 | 0.0% |
| Total | 18 | 100.0% |
Internet Access in Waldenburg
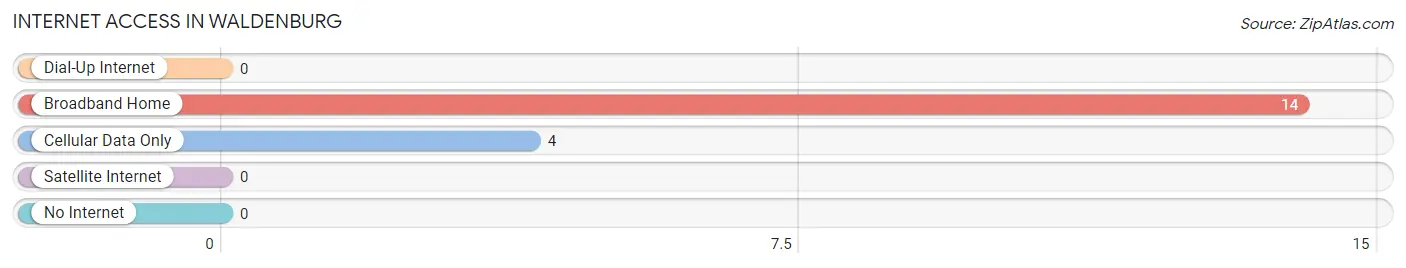
| Internet Type | # Households | % Households |
| Dial-Up Internet | 0 | 0.0% |
| Broadband Home | 14 | 77.8% |
| Cellular Data Only | 4 | 22.2% |
| Satellite Internet | 0 | 0.0% |
| No Internet | 0 | 0.0% |
| Total | 18 | 100.0% |
Waldenburg Summary
Waldenburg is a small town located in Poinsett County, Arkansas. It is situated in the northeast corner of the state, near the Mississippi River. The town was founded in 1883 and has a population of approximately 500 people.
Geography
Waldenburg is located in the northeast corner of Arkansas, near the Mississippi River. The town is situated in the foothills of the Ozark Mountains, and is surrounded by rolling hills and forests. The town is located in the St. Francis National Forest, which is home to a variety of wildlife, including deer, turkey, and black bear. The town is also located near the White River, which provides a variety of recreational activities, such as fishing and boating.
Economy
The economy of Waldenburg is largely based on agriculture. The town is home to several farms, which produce a variety of crops, including corn, soybeans, and cotton. The town also has a small manufacturing sector, which produces a variety of products, including furniture and clothing. The town also has a few small businesses, such as restaurants, grocery stores, and gas stations.
Demographics
As of the 2010 census, the population of Waldenburg was 498 people. The racial makeup of the town was 97.2% White, 0.2% African American, 0.2% Native American, 0.2% Asian, 0.2% from other races, and 1.8% from two or more races. The median household income was $30,000, and the median family income was $35,000.
History
Waldenburg was founded in 1883 by German immigrants. The town was named after the German city of Waldenburg, which is located in the state of Saxony. The town was originally a farming community, and the first settlers grew cotton, corn, and soybeans. The town was also home to a few small businesses, such as a general store and a blacksmith shop.
In the early 1900s, the town began to grow and develop. The town was home to a variety of businesses, including a bank, a hotel, and a movie theater. The town also had a school, which was built in 1910.
In the 1950s, the town began to decline, as many of the businesses closed and the population began to decline. The town was revitalized in the late 1990s, when a new school was built and several businesses opened. Today, Waldenburg is a small, rural town with a population of approximately 500 people.
Common Questions
What is Per Capita Income in Waldenburg?
Per Capita income in Waldenburg is $16,163.
What is the Median Family Income in Waldenburg?
Median Family Income in Waldenburg is $47,750.
What is the Median Household income in Waldenburg?
Median Household Income in Waldenburg is $48,000.
What is Inequality or Gini Index in Waldenburg?
Inequality or Gini Index in Waldenburg is 0.28.
What is the Total Population of Waldenburg?
Total Population of Waldenburg is 57.
What is the Total Male Population of Waldenburg?
Total Male Population of Waldenburg is 28.
What is the Total Female Population of Waldenburg?
Total Female Population of Waldenburg is 29.
What is the Ratio of Males per 100 Females in Waldenburg?
There are 96.55 Males per 100 Females in Waldenburg.
What is the Ratio of Females per 100 Males in Waldenburg?
There are 103.57 Females per 100 Males in Waldenburg.
What is the Median Population Age in Waldenburg?
Median Population Age in Waldenburg is 24.9 Years.
What is the Average Family Size in Waldenburg
Average Family Size in Waldenburg is 3.3 People.
What is the Average Household Size in Waldenburg
Average Household Size in Waldenburg is 3.2 People.
How Large is the Labor Force in Waldenburg?
There are 29 People in the Labor Forcein in Waldenburg.
What is the Percentage of People in the Labor Force in Waldenburg?
78.4% of People are in the Labor Force in Waldenburg.