Sulphur Rock, AR Map & Demographics
Sulphur Rock Map
Sulphur Rock Overview
$23,370
PER CAPITA INCOME
$44,583
AVG FAMILY INCOME
$44,735
AVG HOUSEHOLD INCOME
23.8%
WAGE / INCOME GAP [ % ]
76.2¢/ $1
WAGE / INCOME GAP [ $ ]
$7,811
FAMILY INCOME DEFICIT
0.39
INEQUALITY / GINI INDEX
634
TOTAL POPULATION
312
MALE POPULATION
322
FEMALE POPULATION
96.89
MALES / 100 FEMALES
103.21
FEMALES / 100 MALES
34.6
MEDIAN AGE
3.0
AVG FAMILY SIZE
2.5
AVG HOUSEHOLD SIZE
271
LABOR FORCE [ PEOPLE ]
56.0%
PERCENT IN LABOR FORCE
3.3%
UNEMPLOYMENT RATE
Sulphur Rock Zip Codes
Income in Sulphur Rock
Income Overview in Sulphur Rock
Per Capita Income in Sulphur Rock is $23,370, while median incomes of families and households are $44,583 and $44,735 respectively.
| Characteristic | Number | Measure |
| Per Capita Income | 634 | $23,370 |
| Median Family Income | 173 | $44,583 |
| Mean Family Income | 173 | $57,845 |
| Median Household Income | 259 | $44,735 |
| Mean Household Income | 259 | $58,356 |
| Income Deficit | 173 | $7,811 |
| Wage / Income Gap (%) | 634 | 23.83% |
| Wage / Income Gap ($) | 634 | 76.17¢ per $1 |
| Gini / Inequality Index | 634 | 0.39 |
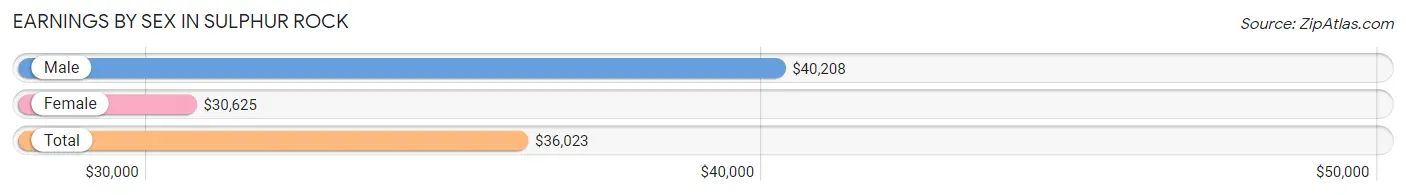
Earnings by Sex in Sulphur Rock
Average Earnings in Sulphur Rock are $36,023, $40,208 for men and $30,625 for women, a difference of 23.8%.
| Sex | Number | Average Earnings |
| Male | 147 (50.5%) | $40,208 |
| Female | 144 (49.5%) | $30,625 |
| Total | 291 (100.0%) | $36,023 |
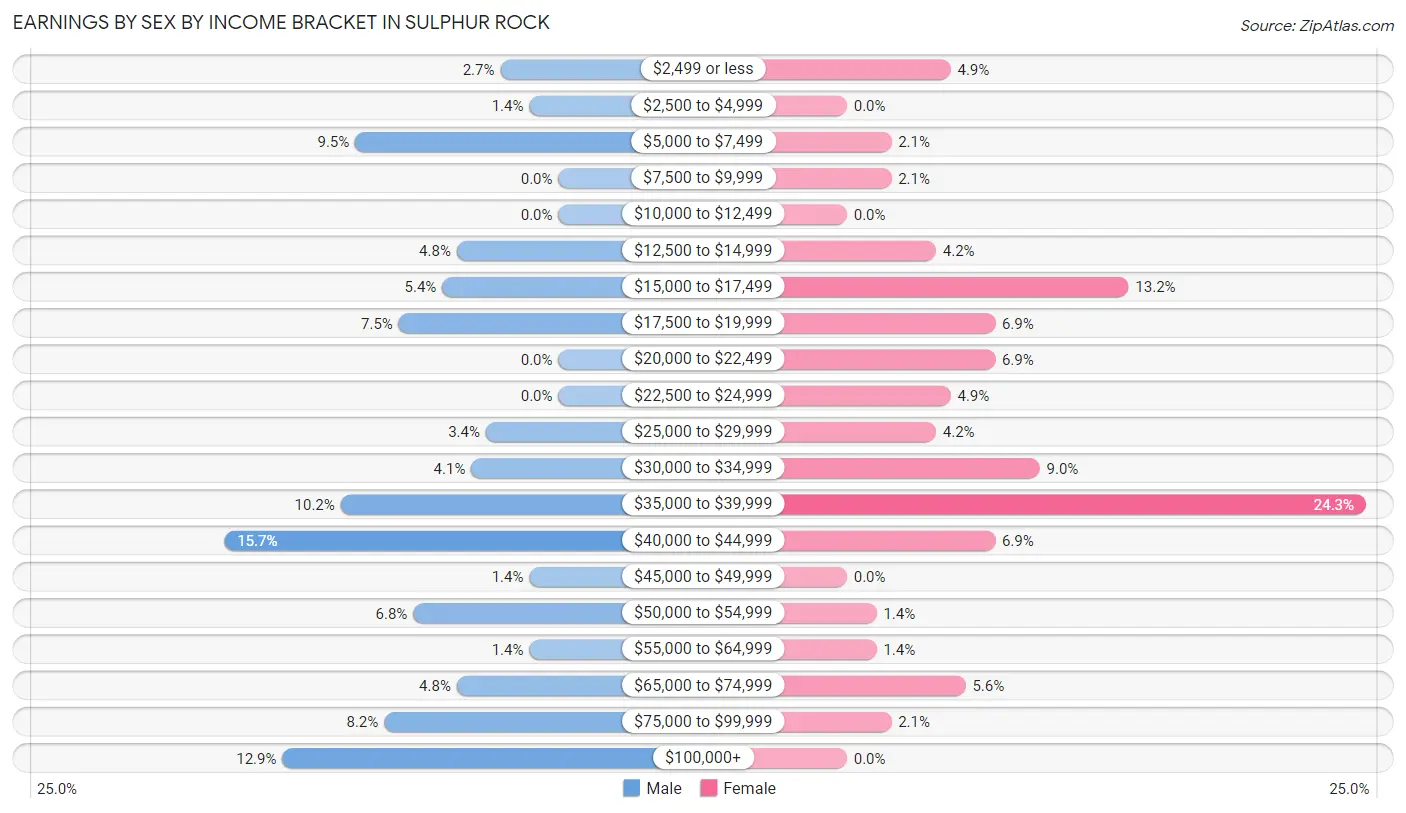
Earnings by Sex by Income Bracket in Sulphur Rock
The most common earnings brackets in Sulphur Rock are $40,000 to $44,999 for men (23 | 15.7%) and $35,000 to $39,999 for women (35 | 24.3%).
| Income | Male | Female |
| $2,499 or less | 4 (2.7%) | 7 (4.9%) |
| $2,500 to $4,999 | 2 (1.4%) | 0 (0.0%) |
| $5,000 to $7,499 | 14 (9.5%) | 3 (2.1%) |
| $7,500 to $9,999 | 0 (0.0%) | 3 (2.1%) |
| $10,000 to $12,499 | 0 (0.0%) | 0 (0.0%) |
| $12,500 to $14,999 | 7 (4.8%) | 6 (4.2%) |
| $15,000 to $17,499 | 8 (5.4%) | 19 (13.2%) |
| $17,500 to $19,999 | 11 (7.5%) | 10 (6.9%) |
| $20,000 to $22,499 | 0 (0.0%) | 10 (6.9%) |
| $22,500 to $24,999 | 0 (0.0%) | 7 (4.9%) |
| $25,000 to $29,999 | 5 (3.4%) | 6 (4.2%) |
| $30,000 to $34,999 | 6 (4.1%) | 13 (9.0%) |
| $35,000 to $39,999 | 15 (10.2%) | 35 (24.3%) |
| $40,000 to $44,999 | 23 (15.7%) | 10 (6.9%) |
| $45,000 to $49,999 | 2 (1.4%) | 0 (0.0%) |
| $50,000 to $54,999 | 10 (6.8%) | 2 (1.4%) |
| $55,000 to $64,999 | 2 (1.4%) | 2 (1.4%) |
| $65,000 to $74,999 | 7 (4.8%) | 8 (5.6%) |
| $75,000 to $99,999 | 12 (8.2%) | 3 (2.1%) |
| $100,000+ | 19 (12.9%) | 0 (0.0%) |
| Total | 147 (100.0%) | 144 (100.0%) |
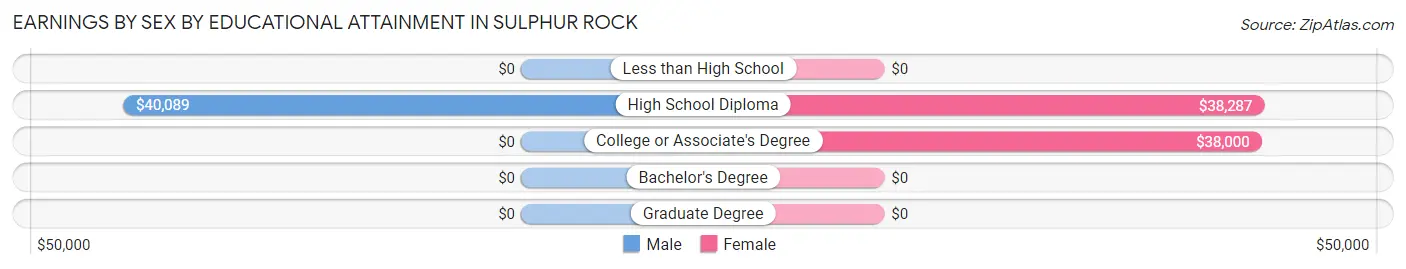
Earnings by Sex by Educational Attainment in Sulphur Rock
Average earnings in Sulphur Rock are $41,042 for men and $37,930 for women, a difference of 7.6%. Men with an educational attainment of high school diploma enjoy the highest average annual earnings of $40,089, while those with high school diploma education earn the least with $40,089. Women with an educational attainment of high school diploma earn the most with the average annual earnings of $38,287, while those with college or associate's degree education have the smallest earnings of $38,000.
| Educational Attainment | Male Income | Female Income |
| Less than High School | - | - |
| High School Diploma | $40,089 | $38,287 |
| College or Associate's Degree | - | - |
| Bachelor's Degree | - | - |
| Graduate Degree | - | - |
| Total | $41,042 | $37,930 |
Family Income in Sulphur Rock
Family Income Brackets in Sulphur Rock
According to the Sulphur Rock family income data, there are 58 families falling into the $35,000 to $49,999 income range, which is the most common income bracket and makes up 33.5% of all families. Conversely, the $150,000 to $199,999 income bracket is the least frequent group with only 1 families (0.6%) belonging to this category.
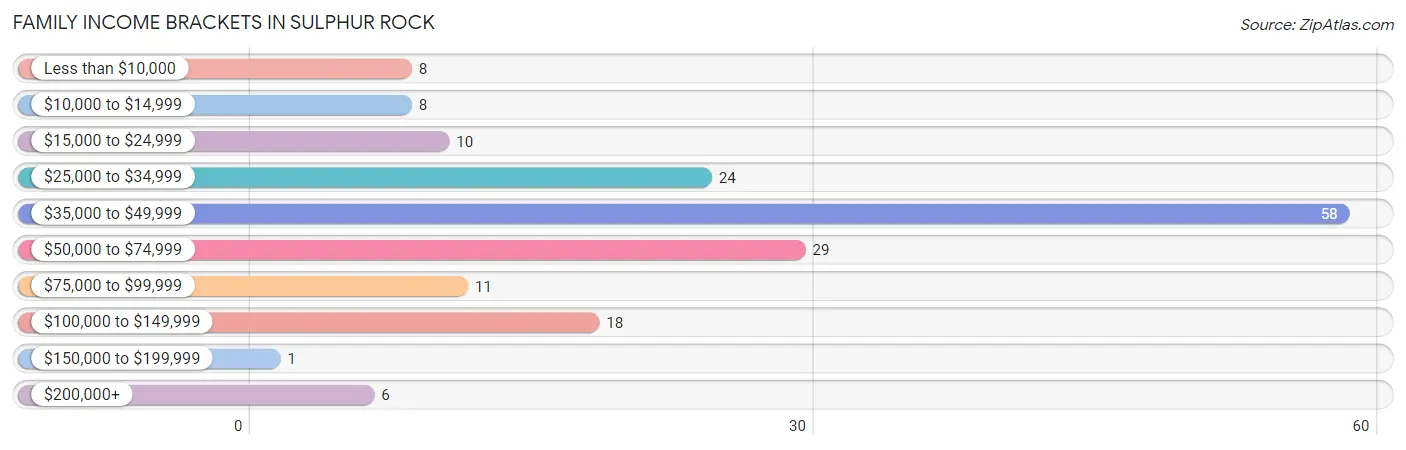
| Income Bracket | # Families | % Families |
| Less than $10,000 | 8 | 4.6% |
| $10,000 to $14,999 | 8 | 4.6% |
| $15,000 to $24,999 | 10 | 5.8% |
| $25,000 to $34,999 | 24 | 13.9% |
| $35,000 to $49,999 | 58 | 33.5% |
| $50,000 to $74,999 | 29 | 16.8% |
| $75,000 to $99,999 | 11 | 6.4% |
| $100,000 to $149,999 | 18 | 10.4% |
| $150,000 to $199,999 | 1 | 0.6% |
| $200,000+ | 6 | 3.5% |
Family Income by Famaliy Size in Sulphur Rock
4-person families (42 | 24.3%) account for the highest median family income in Sulphur Rock with $47,917 per family, while 2-person families (77 | 44.5%) have the highest median income of $21,968 per family member.
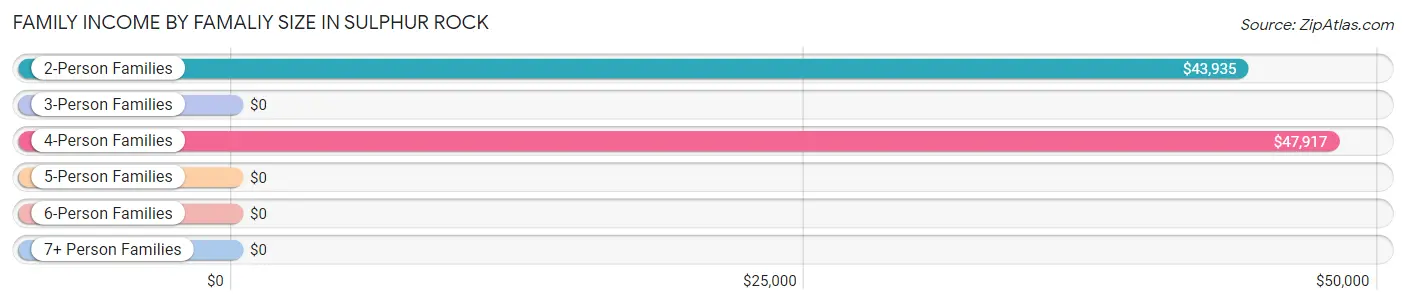
| Income Bracket | # Families | Median Income |
| 2-Person Families | 77 (44.5%) | $43,935 |
| 3-Person Families | 37 (21.4%) | $0 |
| 4-Person Families | 42 (24.3%) | $47,917 |
| 5-Person Families | 6 (3.5%) | $0 |
| 6-Person Families | 11 (6.4%) | $0 |
| 7+ Person Families | 0 (0.0%) | $0 |
| Total | 173 (100.0%) | $44,583 |
Family Income by Number of Earners in Sulphur Rock
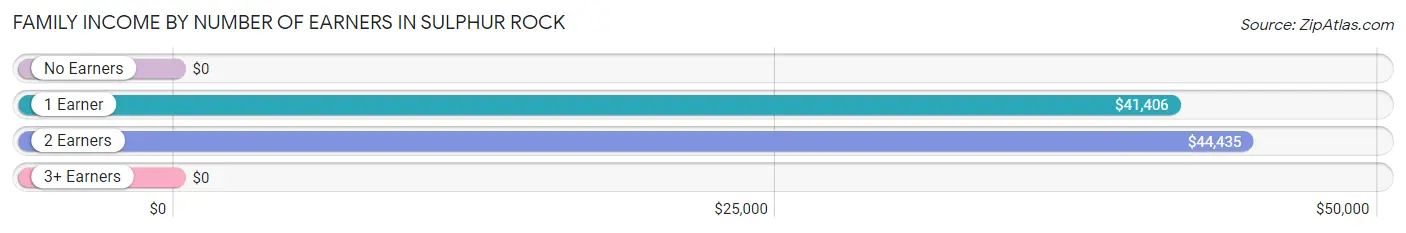
| Number of Earners | # Families | Median Income |
| No Earners | 19 (11.0%) | $0 |
| 1 Earner | 79 (45.7%) | $41,406 |
| 2 Earners | 50 (28.9%) | $44,435 |
| 3+ Earners | 25 (14.4%) | $0 |
| Total | 173 (100.0%) | $44,583 |
Household Income in Sulphur Rock
Household Income Brackets in Sulphur Rock
With 68 households falling in the category, the $35,000 to $49,999 income range is the most frequent in Sulphur Rock, accounting for 26.3% of all households. In contrast, only 1 households (0.4%) fall into the $150,000 to $199,999 income bracket, making it the least populous group.
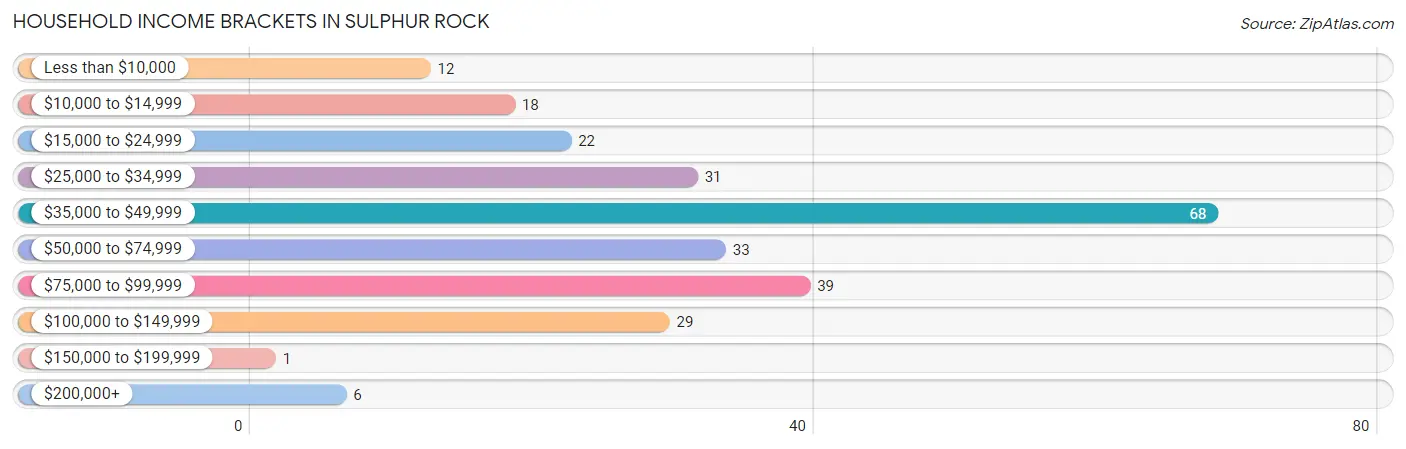
| Income Bracket | # Households | % Households |
| Less than $10,000 | 12 | 4.6% |
| $10,000 to $14,999 | 18 | 6.9% |
| $15,000 to $24,999 | 22 | 8.5% |
| $25,000 to $34,999 | 31 | 12.0% |
| $35,000 to $49,999 | 68 | 26.3% |
| $50,000 to $74,999 | 33 | 12.7% |
| $75,000 to $99,999 | 39 | 15.1% |
| $100,000 to $149,999 | 29 | 11.2% |
| $150,000 to $199,999 | 1 | 0.4% |
| $200,000+ | 6 | 2.3% |
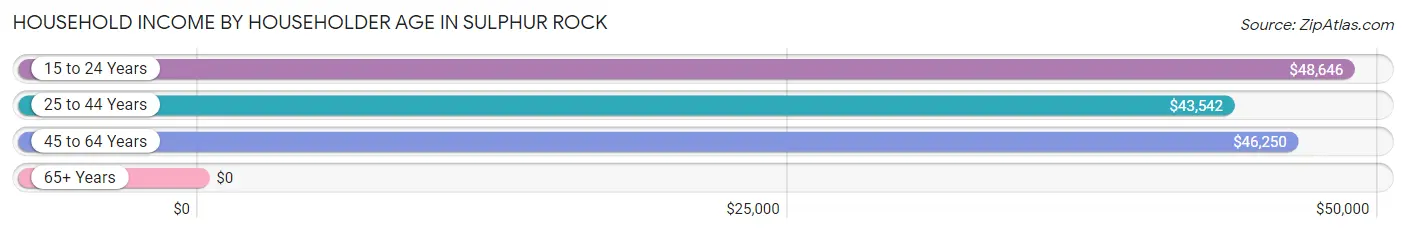
Household Income by Householder Age in Sulphur Rock
The median household income in Sulphur Rock is $44,735, with the highest median household income of $48,646 found in the 15 to 24 years age bracket for the primary householder. A total of 17 households (6.6%) fall into this category. Meanwhile, the 65+ years age bracket for the primary householder has the lowest median household income of $0, with 39 households (15.1%) in this group.
| Income Bracket | # Households | Median Income |
| 15 to 24 Years | 17 (6.6%) | $48,646 |
| 25 to 44 Years | 69 (26.6%) | $43,542 |
| 45 to 64 Years | 134 (51.7%) | $46,250 |
| 65+ Years | 39 (15.1%) | $0 |
| Total | 259 (100.0%) | $44,735 |
Poverty in Sulphur Rock
Income Below Poverty by Sex and Age in Sulphur Rock
With 22.8% poverty level for males and 28.0% for females among the residents of Sulphur Rock, 15 year old males and 6 to 11 year old females are the most vulnerable to poverty, with 7 males (100.0%) and 22 females (71.0%) in their respective age groups living below the poverty level.
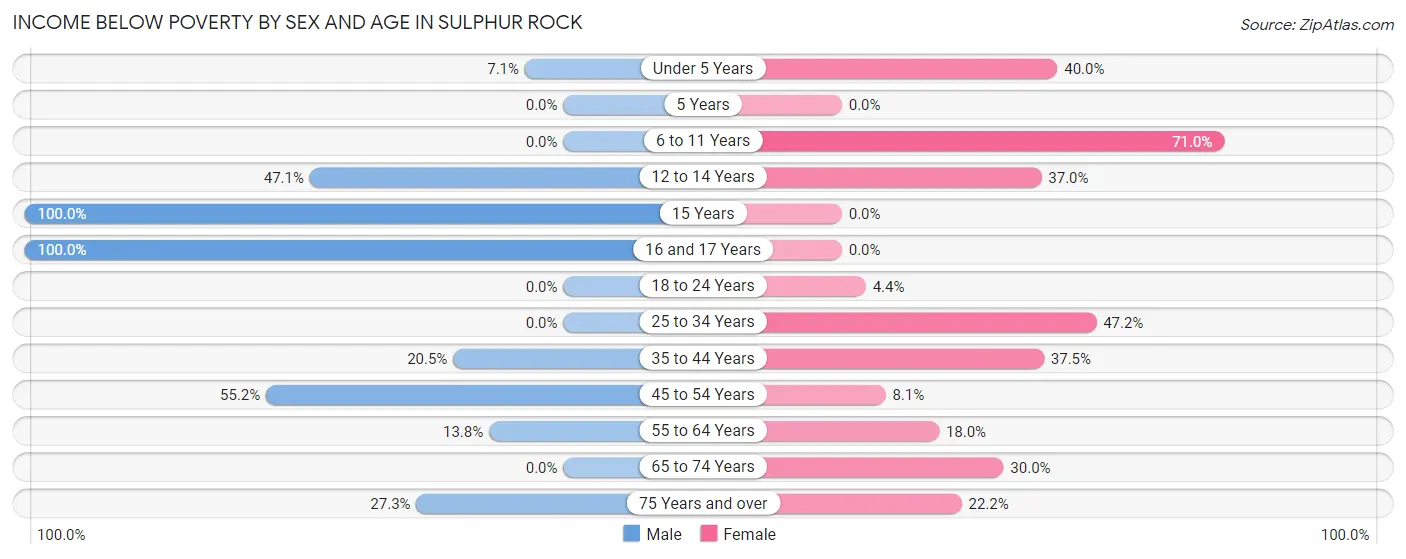
| Age Bracket | Male | Female |
| Under 5 Years | 2 (7.1%) | 6 (40.0%) |
| 5 Years | 0 (0.0%) | 0 (0.0%) |
| 6 to 11 Years | 0 (0.0%) | 22 (71.0%) |
| 12 to 14 Years | 16 (47.1%) | 10 (37.0%) |
| 15 Years | 7 (100.0%) | 0 (0.0%) |
| 16 and 17 Years | 10 (100.0%) | 0 (0.0%) |
| 18 to 24 Years | 0 (0.0%) | 2 (4.4%) |
| 25 to 34 Years | 0 (0.0%) | 17 (47.2%) |
| 35 to 44 Years | 9 (20.4%) | 6 (37.5%) |
| 45 to 54 Years | 16 (55.2%) | 3 (8.1%) |
| 55 to 64 Years | 8 (13.8%) | 11 (18.0%) |
| 65 to 74 Years | 0 (0.0%) | 9 (30.0%) |
| 75 Years and over | 3 (27.3%) | 4 (22.2%) |
| Total | 71 (22.8%) | 90 (28.0%) |
Income Above Poverty by Sex and Age in Sulphur Rock
According to the poverty statistics in Sulphur Rock, males aged 6 to 11 years and females aged 16 and 17 years are the age groups that are most secure financially, with 100.0% of males and 100.0% of females in these age groups living above the poverty line.
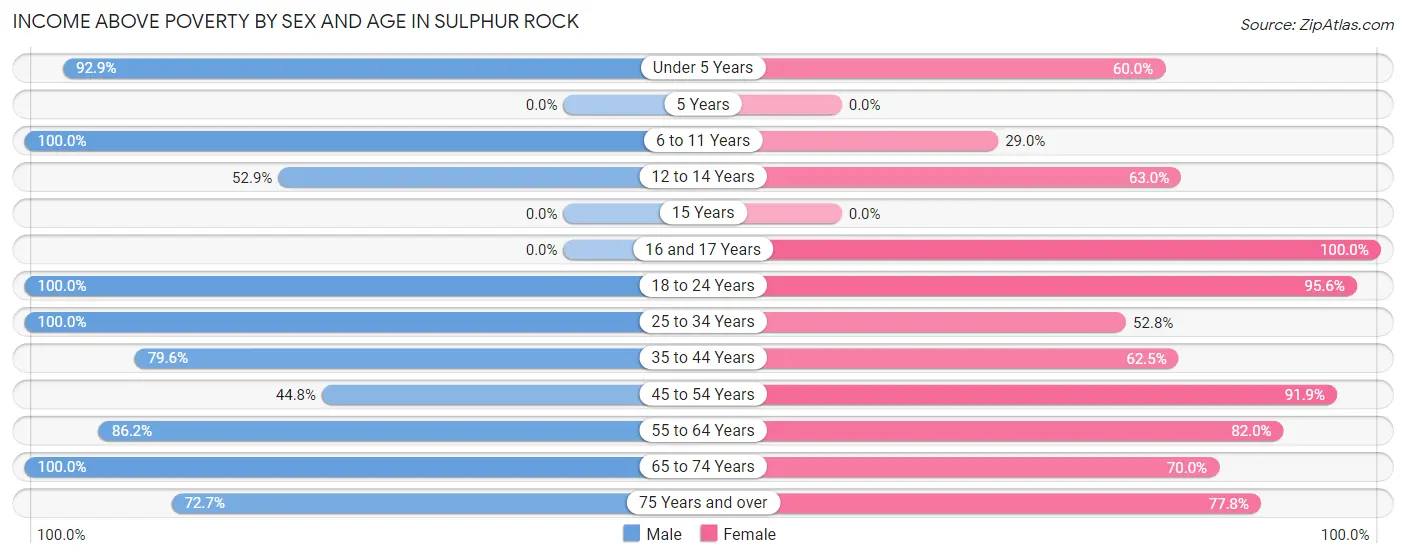
| Age Bracket | Male | Female |
| Under 5 Years | 26 (92.9%) | 9 (60.0%) |
| 5 Years | 0 (0.0%) | 0 (0.0%) |
| 6 to 11 Years | 8 (100.0%) | 9 (29.0%) |
| 12 to 14 Years | 18 (52.9%) | 17 (63.0%) |
| 15 Years | 0 (0.0%) | 0 (0.0%) |
| 16 and 17 Years | 0 (0.0%) | 6 (100.0%) |
| 18 to 24 Years | 44 (100.0%) | 43 (95.6%) |
| 25 to 34 Years | 35 (100.0%) | 19 (52.8%) |
| 35 to 44 Years | 35 (79.5%) | 10 (62.5%) |
| 45 to 54 Years | 13 (44.8%) | 34 (91.9%) |
| 55 to 64 Years | 50 (86.2%) | 50 (82.0%) |
| 65 to 74 Years | 4 (100.0%) | 21 (70.0%) |
| 75 Years and over | 8 (72.7%) | 14 (77.8%) |
| Total | 241 (77.2%) | 232 (72.1%) |
Income Below Poverty Among Married-Couple Families in Sulphur Rock
The poverty statistics for married-couple families in Sulphur Rock show that 9.1% or 6 of the total 66 families live below the poverty line. Families with 3 or 4 children have the highest poverty rate of 75.0%, comprising of 3 families. On the other hand, families with 1 or 2 children have the lowest poverty rate of 0.0%, which includes 0 families.
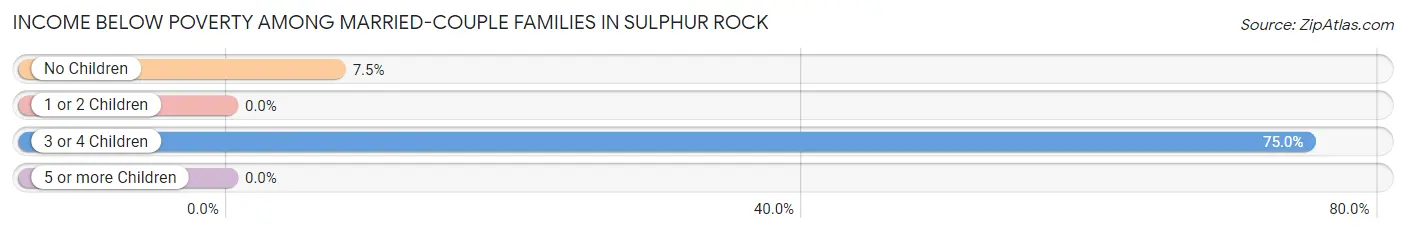
| Children | Above Poverty | Below Poverty |
| No Children | 37 (92.5%) | 3 (7.5%) |
| 1 or 2 Children | 22 (100.0%) | 0 (0.0%) |
| 3 or 4 Children | 1 (25.0%) | 3 (75.0%) |
| 5 or more Children | 0 (0.0%) | 0 (0.0%) |
| Total | 60 (90.9%) | 6 (9.1%) |
Income Below Poverty Among Single-Parent Households in Sulphur Rock
According to the poverty data in Sulphur Rock, 60.0% or 21 single-father households and 15.3% or 11 single-mother households are living below the poverty line. Among single-father households, those with 3 or 4 children have the highest poverty rate, with 7 households (100.0%) experiencing poverty. Likewise, among single-mother households, those with 3 or 4 children have the highest poverty rate, with 4 households (33.3%) falling below the poverty line.
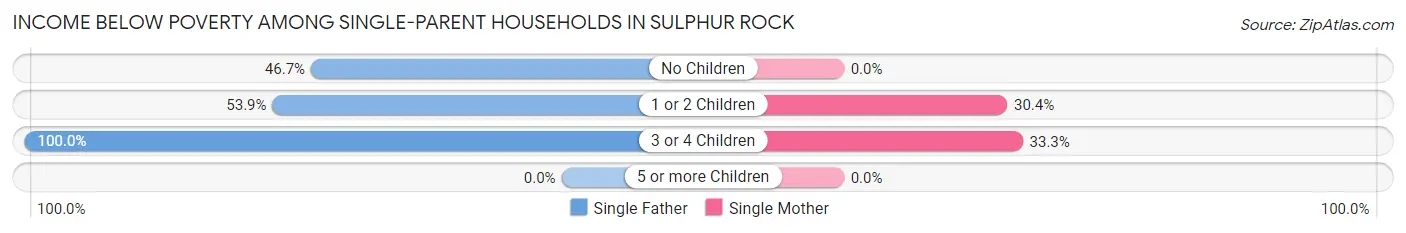
| Children | Single Father | Single Mother |
| No Children | 7 (46.7%) | 0 (0.0%) |
| 1 or 2 Children | 7 (53.8%) | 7 (30.4%) |
| 3 or 4 Children | 7 (100.0%) | 4 (33.3%) |
| 5 or more Children | 0 (0.0%) | 0 (0.0%) |
| Total | 21 (60.0%) | 11 (15.3%) |
Income Below Poverty Among Married-Couple vs Single-Parent Households in Sulphur Rock
The poverty data for Sulphur Rock shows that 6 of the married-couple family households (9.1%) and 32 of the single-parent households (29.9%) are living below the poverty level. Within the married-couple family households, those with 3 or 4 children have the highest poverty rate, with 3 households (75.0%) falling below the poverty line. Among the single-parent households, those with 3 or 4 children have the highest poverty rate, with 11 household (57.9%) living below poverty.
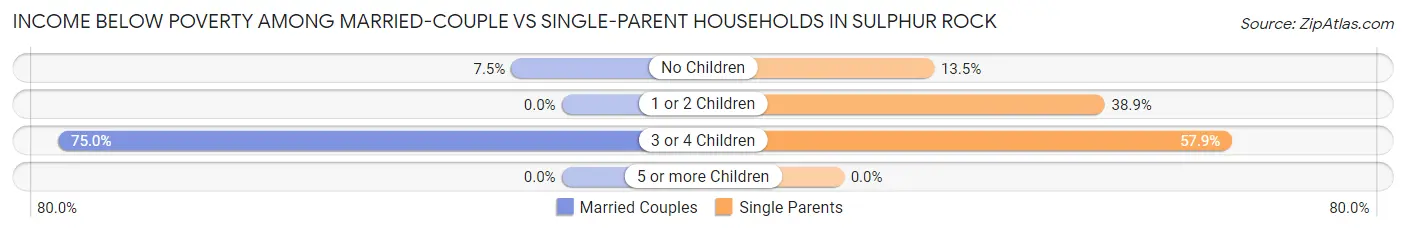
| Children | Married-Couple Families | Single-Parent Households |
| No Children | 3 (7.5%) | 7 (13.5%) |
| 1 or 2 Children | 0 (0.0%) | 14 (38.9%) |
| 3 or 4 Children | 3 (75.0%) | 11 (57.9%) |
| 5 or more Children | 0 (0.0%) | 0 (0.0%) |
| Total | 6 (9.1%) | 32 (29.9%) |
Race in Sulphur Rock
The most populous races in Sulphur Rock are White / Caucasian (533 | 84.1%), Two or more Races (78 | 12.3%), and Hispanic or Latino (32 | 5.1%).
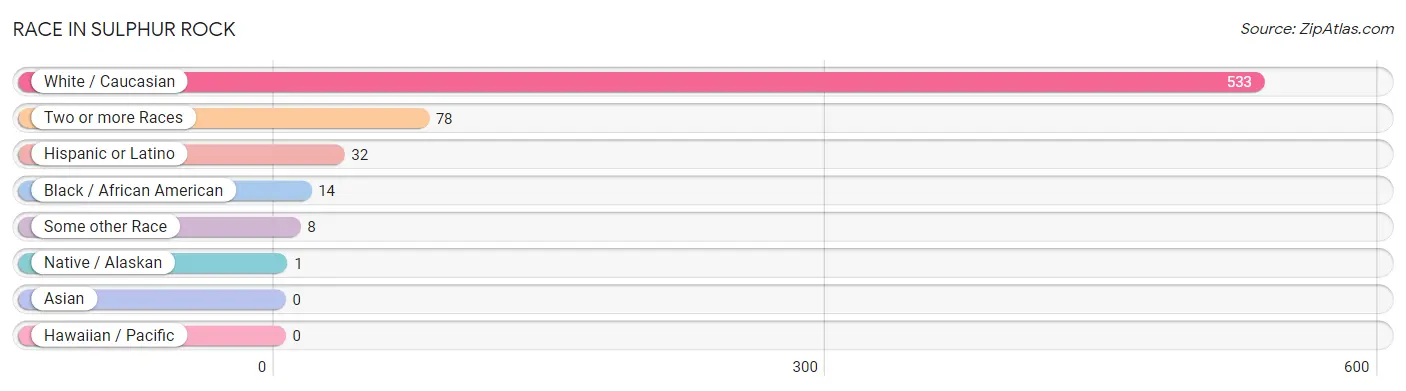
| Race | # Population | % Population |
| Asian | 0 | 0.0% |
| Black / African American | 14 | 2.2% |
| Hawaiian / Pacific | 0 | 0.0% |
| Hispanic or Latino | 32 | 5.1% |
| Native / Alaskan | 1 | 0.2% |
| White / Caucasian | 533 | 84.1% |
| Two or more Races | 78 | 12.3% |
| Some other Race | 8 | 1.3% |
| Total | 634 | 100.0% |
Ancestry in Sulphur Rock
The most populous ancestries reported in Sulphur Rock are German (165 | 26.0%), English (106 | 16.7%), Irish (51 | 8.0%), Italian (47 | 7.4%), and American (29 | 4.6%), together accounting for 62.8% of all Sulphur Rock residents.
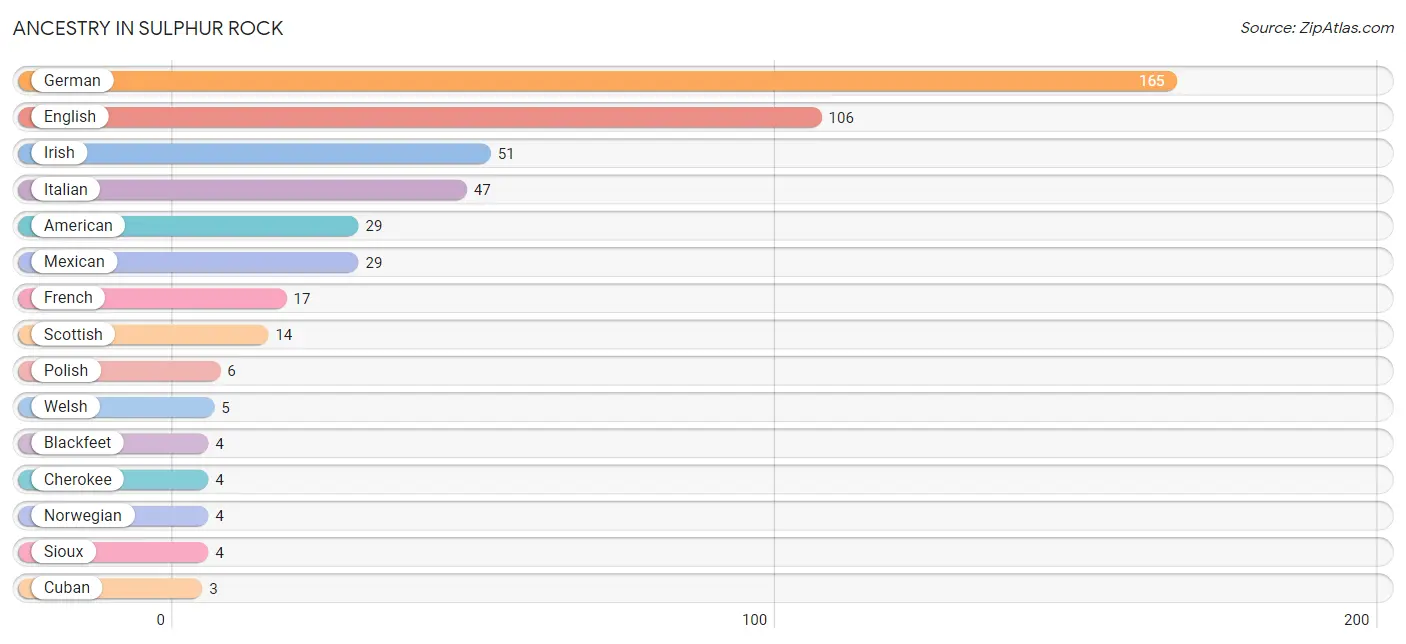
| Ancestry | # Population | % Population |
| American | 29 | 4.6% |
| Austrian | 2 | 0.3% |
| Blackfeet | 4 | 0.6% |
| Cherokee | 4 | 0.6% |
| Choctaw | 1 | 0.2% |
| Croatian | 2 | 0.3% |
| Cuban | 3 | 0.5% |
| Eastern European | 2 | 0.3% |
| English | 106 | 16.7% |
| French | 17 | 2.7% |
| German | 165 | 26.0% |
| Irish | 51 | 8.0% |
| Italian | 47 | 7.4% |
| Mexican | 29 | 4.6% |
| Norwegian | 4 | 0.6% |
| Polish | 6 | 0.9% |
| Scotch-Irish | 1 | 0.2% |
| Scottish | 14 | 2.2% |
| Sioux | 4 | 0.6% |
| Welsh | 5 | 0.8% | View All 20 Rows |
Immigrants in Sulphur Rock
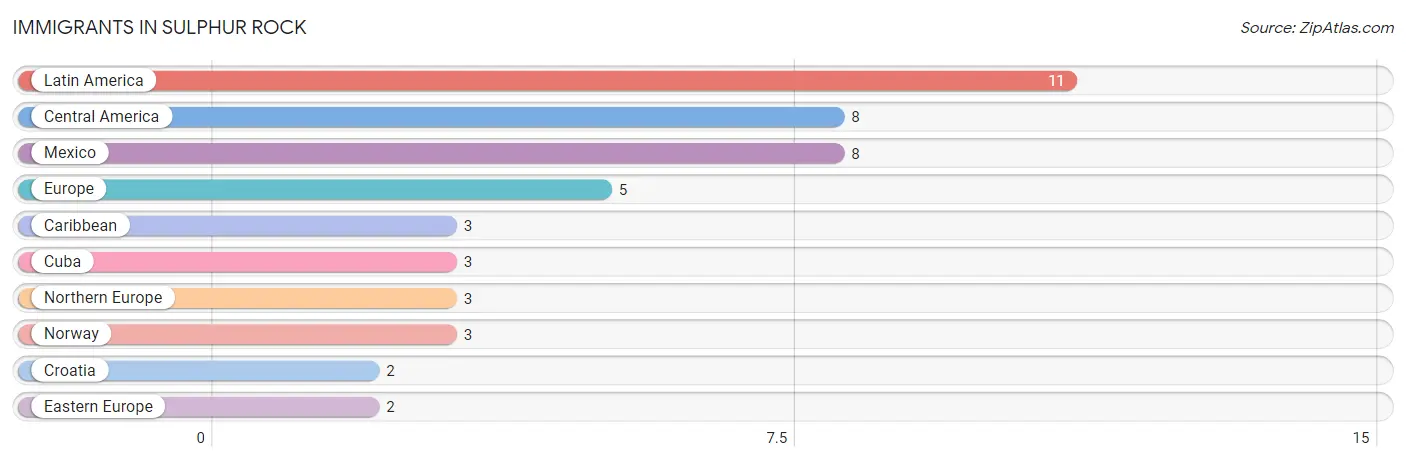
The most numerous immigrant groups reported in Sulphur Rock came from Latin America (11 | 1.7%), Central America (8 | 1.3%), Mexico (8 | 1.3%), Europe (5 | 0.8%), and Caribbean (3 | 0.5%), together accounting for 5.5% of all Sulphur Rock residents.
| Immigration Origin | # Population | % Population |
| Caribbean | 3 | 0.5% |
| Central America | 8 | 1.3% |
| Croatia | 2 | 0.3% |
| Cuba | 3 | 0.5% |
| Eastern Europe | 2 | 0.3% |
| Europe | 5 | 0.8% |
| Latin America | 11 | 1.7% |
| Mexico | 8 | 1.3% |
| Northern Europe | 3 | 0.5% |
| Norway | 3 | 0.5% | View All 10 Rows |
Sex and Age in Sulphur Rock
Sex and Age in Sulphur Rock
The most populous age groups in Sulphur Rock are 20 to 24 Years (41 | 13.1%) for men and 55 to 59 Years (52 | 16.2%) for women.
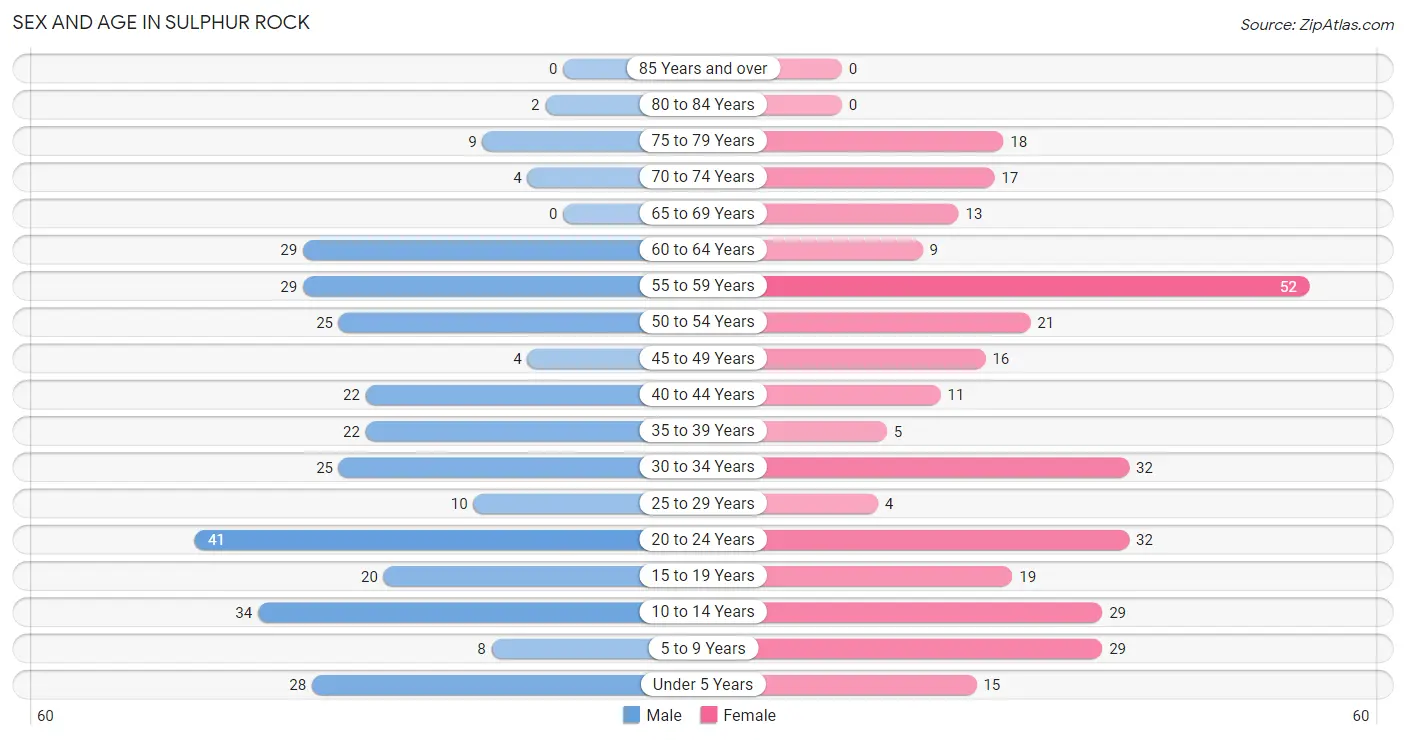
| Age Bracket | Male | Female |
| Under 5 Years | 28 (9.0%) | 15 (4.7%) |
| 5 to 9 Years | 8 (2.6%) | 29 (9.0%) |
| 10 to 14 Years | 34 (10.9%) | 29 (9.0%) |
| 15 to 19 Years | 20 (6.4%) | 19 (5.9%) |
| 20 to 24 Years | 41 (13.1%) | 32 (9.9%) |
| 25 to 29 Years | 10 (3.2%) | 4 (1.2%) |
| 30 to 34 Years | 25 (8.0%) | 32 (9.9%) |
| 35 to 39 Years | 22 (7.0%) | 5 (1.5%) |
| 40 to 44 Years | 22 (7.0%) | 11 (3.4%) |
| 45 to 49 Years | 4 (1.3%) | 16 (5.0%) |
| 50 to 54 Years | 25 (8.0%) | 21 (6.5%) |
| 55 to 59 Years | 29 (9.3%) | 52 (16.2%) |
| 60 to 64 Years | 29 (9.3%) | 9 (2.8%) |
| 65 to 69 Years | 0 (0.0%) | 13 (4.0%) |
| 70 to 74 Years | 4 (1.3%) | 17 (5.3%) |
| 75 to 79 Years | 9 (2.9%) | 18 (5.6%) |
| 80 to 84 Years | 2 (0.6%) | 0 (0.0%) |
| 85 Years and over | 0 (0.0%) | 0 (0.0%) |
| Total | 312 (100.0%) | 322 (100.0%) |
Families and Households in Sulphur Rock
Median Family Size in Sulphur Rock
The median family size in Sulphur Rock is 3.04 persons per family, with single male/father families (35 | 20.2%) accounting for the largest median family size of 4.31 persons per family. On the other hand, single female/mother families (72 | 41.6%) represent the smallest median family size with 2.33 persons per family.
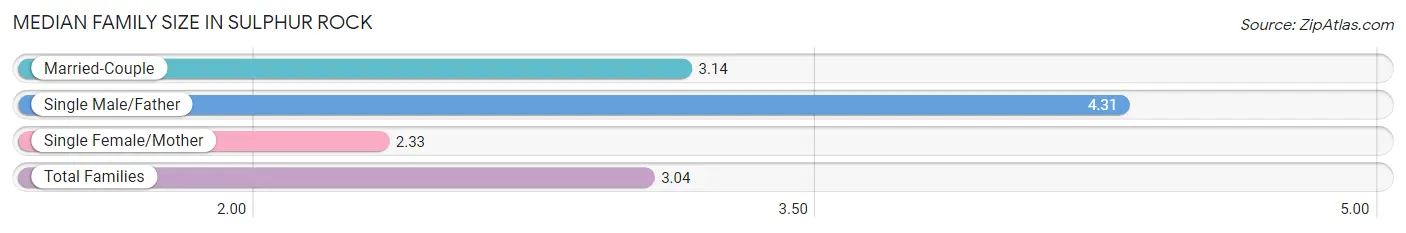
| Family Type | # Families | Family Size |
| Married-Couple | 66 (38.2%) | 3.14 |
| Single Male/Father | 35 (20.2%) | 4.31 |
| Single Female/Mother | 72 (41.6%) | 2.33 |
| Total Families | 173 (100.0%) | 3.04 |
Median Household Size in Sulphur Rock
The median household size in Sulphur Rock is 2.45 persons per household, with single male/father households (35 | 13.5%) accounting for the largest median household size of 4.49 persons per household. non-family households (86 | 33.2%) represent the smallest median household size with 1.19 persons per household.
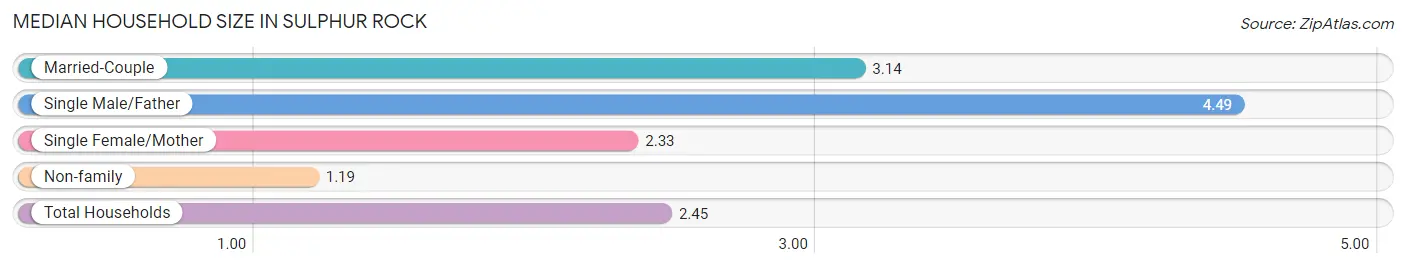
| Household Type | # Households | Household Size |
| Married-Couple | 66 (25.5%) | 3.14 |
| Single Male/Father | 35 (13.5%) | 4.49 |
| Single Female/Mother | 72 (27.8%) | 2.33 |
| Non-family | 86 (33.2%) | 1.19 |
| Total Households | 259 (100.0%) | 2.45 |
Household Size by Marriage Status in Sulphur Rock
Out of a total of 259 households in Sulphur Rock, 173 (66.8%) are family households, while 86 (33.2%) are nonfamily households. The most numerous type of family households are 2-person households, comprising 77, and the most common type of nonfamily households are 1-person households, comprising 68.
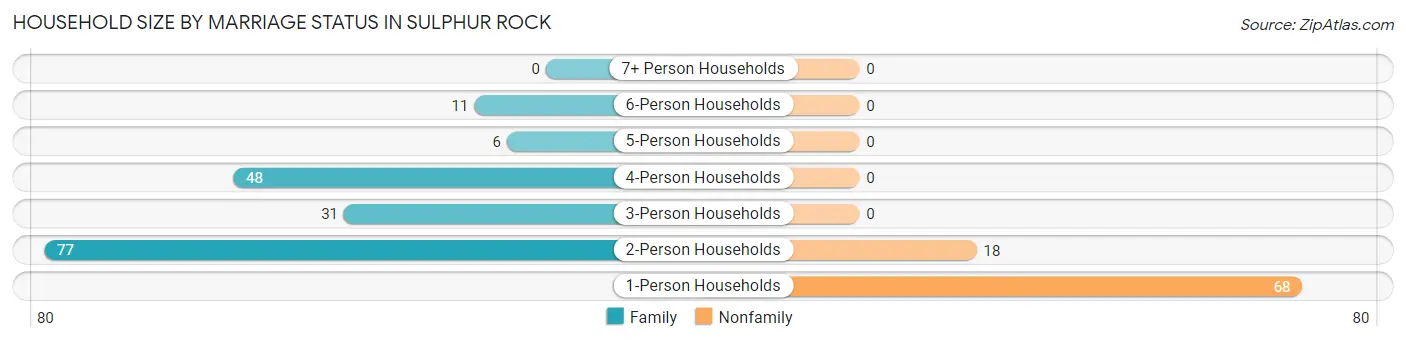
| Household Size | Family Households | Nonfamily Households |
| 1-Person Households | - | 68 (26.3%) |
| 2-Person Households | 77 (29.7%) | 18 (7.0%) |
| 3-Person Households | 31 (12.0%) | 0 (0.0%) |
| 4-Person Households | 48 (18.5%) | 0 (0.0%) |
| 5-Person Households | 6 (2.3%) | 0 (0.0%) |
| 6-Person Households | 11 (4.3%) | 0 (0.0%) |
| 7+ Person Households | 0 (0.0%) | 0 (0.0%) |
| Total | 173 (66.8%) | 86 (33.2%) |
Female Fertility in Sulphur Rock
Fertility by Age in Sulphur Rock
Average fertility rate in Sulphur Rock is 74.0 births per 1,000 women. Women in the age bracket of 15 to 19 years have the highest fertility rate with 316.0 births per 1,000 women. Women in the age bracket of 15 to 19 years acount for 66.7% of all women with births.
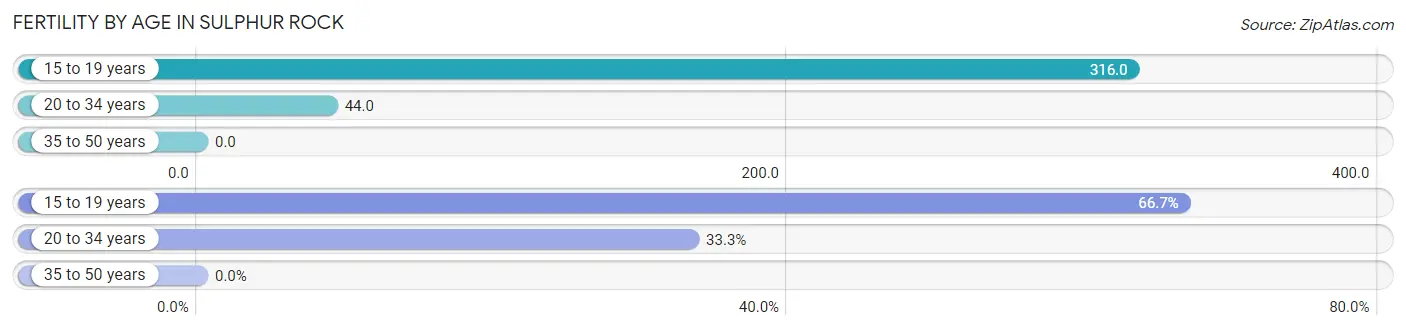
| Age Bracket | Women with Births | Births / 1,000 Women |
| 15 to 19 years | 6 (66.7%) | 316.0 |
| 20 to 34 years | 3 (33.3%) | 44.0 |
| 35 to 50 years | 0 (0.0%) | 0.0 |
| Total | 9 (100.0%) | 74.0 |
Fertility by Age by Marriage Status in Sulphur Rock
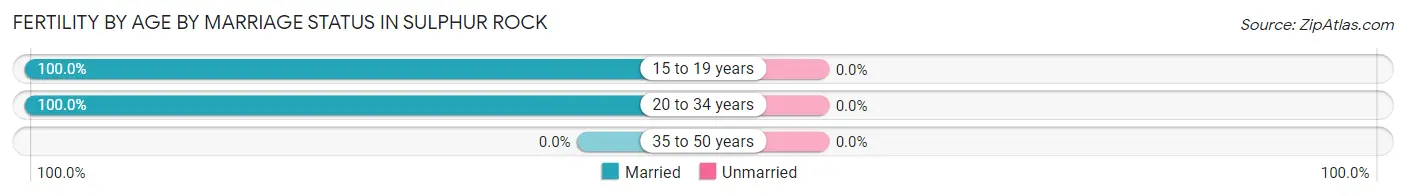
| Age Bracket | Married | Unmarried |
| 15 to 19 years | 6 (100.0%) | 0 (0.0%) |
| 20 to 34 years | 3 (100.0%) | 0 (0.0%) |
| 35 to 50 years | 0 (0.0%) | 0 (0.0%) |
| Total | 9 (100.0%) | 0 (0.0%) |
Fertility by Education in Sulphur Rock
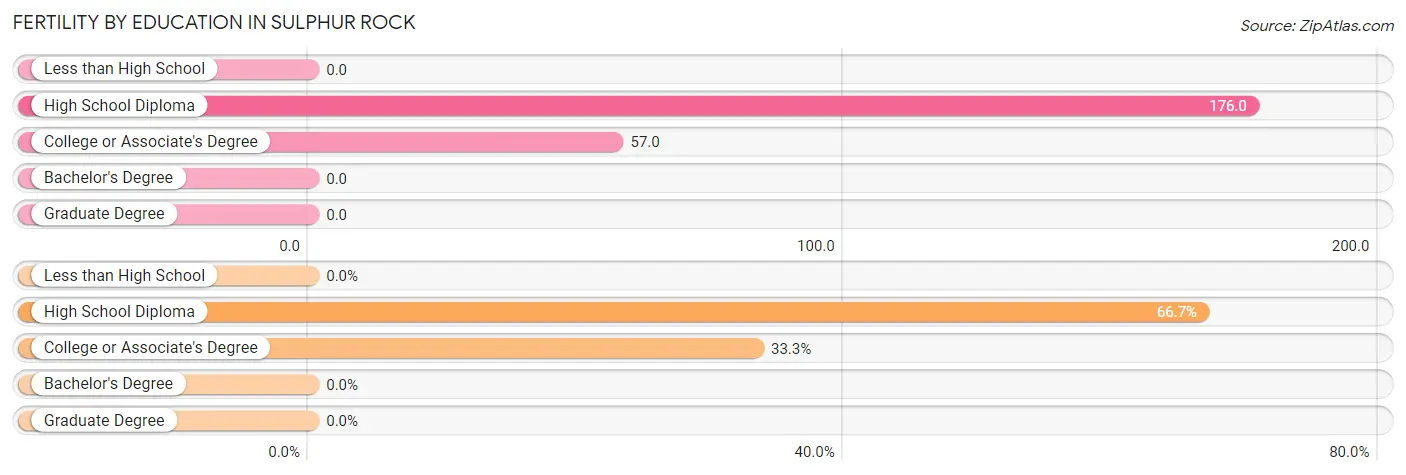
| Educational Attainment | Women with Births | Births / 1,000 Women |
| Less than High School | 0 (0.0%) | 0.0 |
| High School Diploma | 6 (66.7%) | 176.0 |
| College or Associate's Degree | 3 (33.3%) | 57.0 |
| Bachelor's Degree | 0 (0.0%) | 0.0 |
| Graduate Degree | 0 (0.0%) | 0.0 |
| Total | 9 (100.0%) | 74.0 |
Fertility by Education by Marriage Status in Sulphur Rock
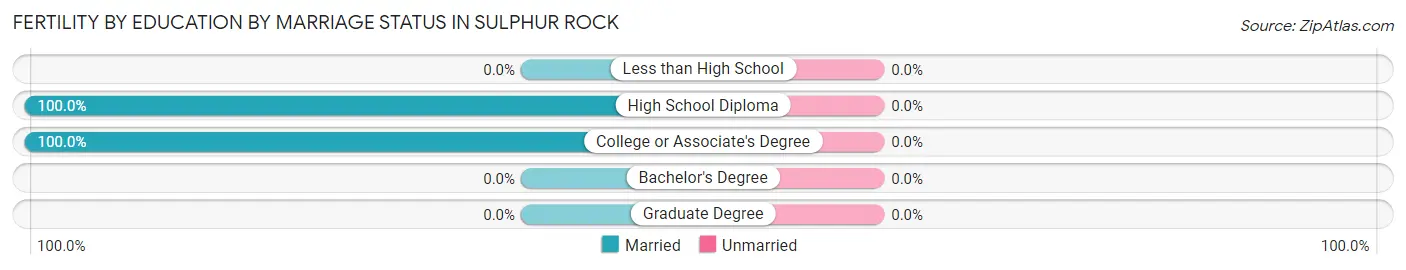
| Educational Attainment | Married | Unmarried |
| Less than High School | 0 (0.0%) | 0 (0.0%) |
| High School Diploma | 6 (100.0%) | 0 (0.0%) |
| College or Associate's Degree | 3 (100.0%) | 0 (0.0%) |
| Bachelor's Degree | 0 (0.0%) | 0 (0.0%) |
| Graduate Degree | 0 (0.0%) | 0 (0.0%) |
| Total | 9 (100.0%) | 0 (0.0%) |
Employment Characteristics in Sulphur Rock
Employment by Class of Employer in Sulphur Rock
Among the 256 employed individuals in Sulphur Rock, private company employees (205 | 80.1%), state government employees (14 | 5.5%), and self-employed (incorporated) (12 | 4.7%) make up the most common classes of employment.
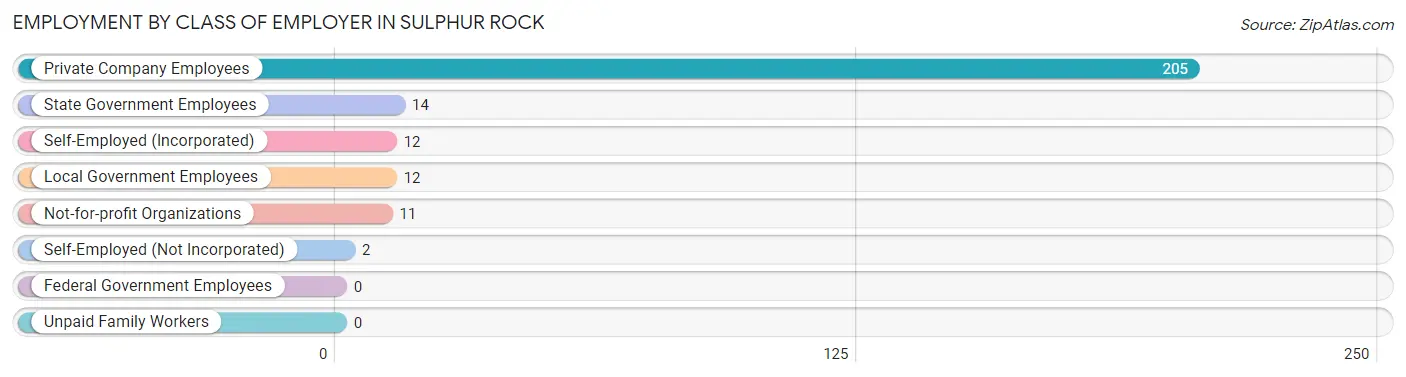
| Employer Class | # Employees | % Employees |
| Private Company Employees | 205 | 80.1% |
| Self-Employed (Incorporated) | 12 | 4.7% |
| Self-Employed (Not Incorporated) | 2 | 0.8% |
| Not-for-profit Organizations | 11 | 4.3% |
| Local Government Employees | 12 | 4.7% |
| State Government Employees | 14 | 5.5% |
| Federal Government Employees | 0 | 0.0% |
| Unpaid Family Workers | 0 | 0.0% |
| Total | 256 | 100.0% |
Employment Status by Age in Sulphur Rock
According to the labor force statistics for Sulphur Rock, out of the total population over 16 years of age (484), 56.0% or 271 individuals are in the labor force, with 3.3% or 9 of them unemployed. The age group with the highest labor force participation rate is 25 to 29 years, with 100.0% or 14 individuals in the labor force. Within the labor force, the 16 to 19 years age range has the highest percentage of unemployed individuals, with 40.0% or 4 of them being unemployed.
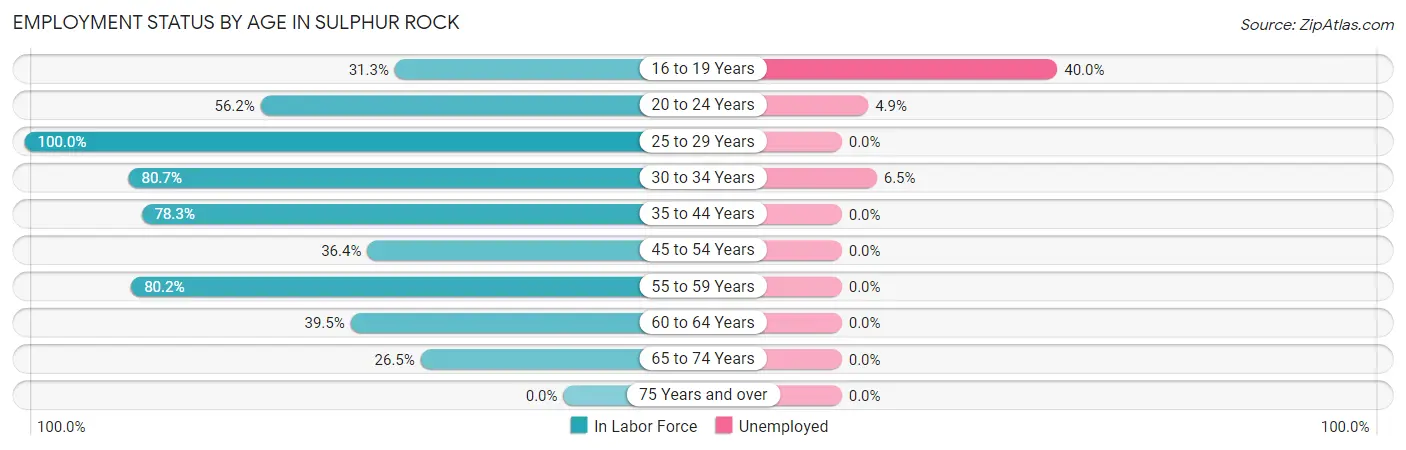
| Age Bracket | In Labor Force | Unemployed |
| 16 to 19 Years | 10 (31.3%) | 4 (40.0%) |
| 20 to 24 Years | 41 (56.2%) | 2 (4.9%) |
| 25 to 29 Years | 14 (100.0%) | 0 (0.0%) |
| 30 to 34 Years | 46 (80.7%) | 3 (6.5%) |
| 35 to 44 Years | 47 (78.3%) | 0 (0.0%) |
| 45 to 54 Years | 24 (36.4%) | 0 (0.0%) |
| 55 to 59 Years | 65 (80.2%) | 0 (0.0%) |
| 60 to 64 Years | 15 (39.5%) | 0 (0.0%) |
| 65 to 74 Years | 9 (26.5%) | 0 (0.0%) |
| 75 Years and over | 0 (0.0%) | 0 (0.0%) |
| Total | 271 (56.0%) | 9 (3.3%) |
Employment Status by Educational Attainment in Sulphur Rock
According to labor force statistics for Sulphur Rock, 66.8% of individuals (211) out of the total population between 25 and 64 years of age (316) are in the labor force, with 1.4% or 3 of them being unemployed. The group with the highest labor force participation rate are those with the educational attainment of bachelor's degree or higher, with 83.7% or 36 individuals in the labor force. Within the labor force, individuals with college / associate degree education have the highest percentage of unemployment, with 5.7% or 3 of them being unemployed.
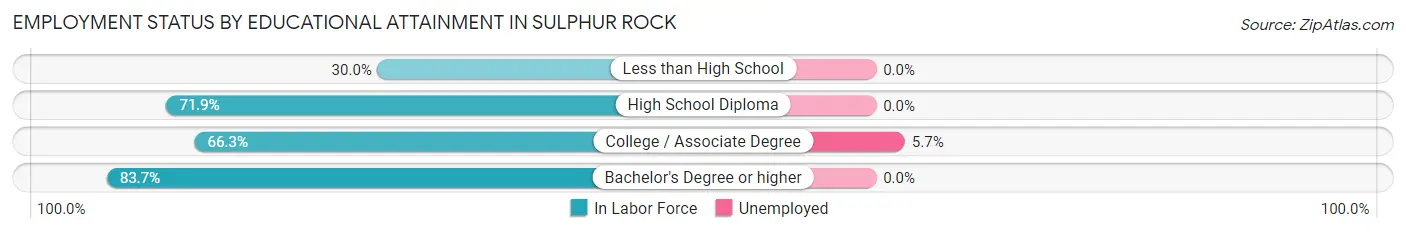
| Educational Attainment | In Labor Force | Unemployed |
| Less than High School | 12 (30.0%) | 0 (0.0%) |
| High School Diploma | 110 (71.9%) | 0 (0.0%) |
| College / Associate Degree | 53 (66.3%) | 5 (5.7%) |
| Bachelor's Degree or higher | 36 (83.7%) | 0 (0.0%) |
| Total | 211 (66.8%) | 4 (1.4%) |
Employment Occupations by Sex in Sulphur Rock
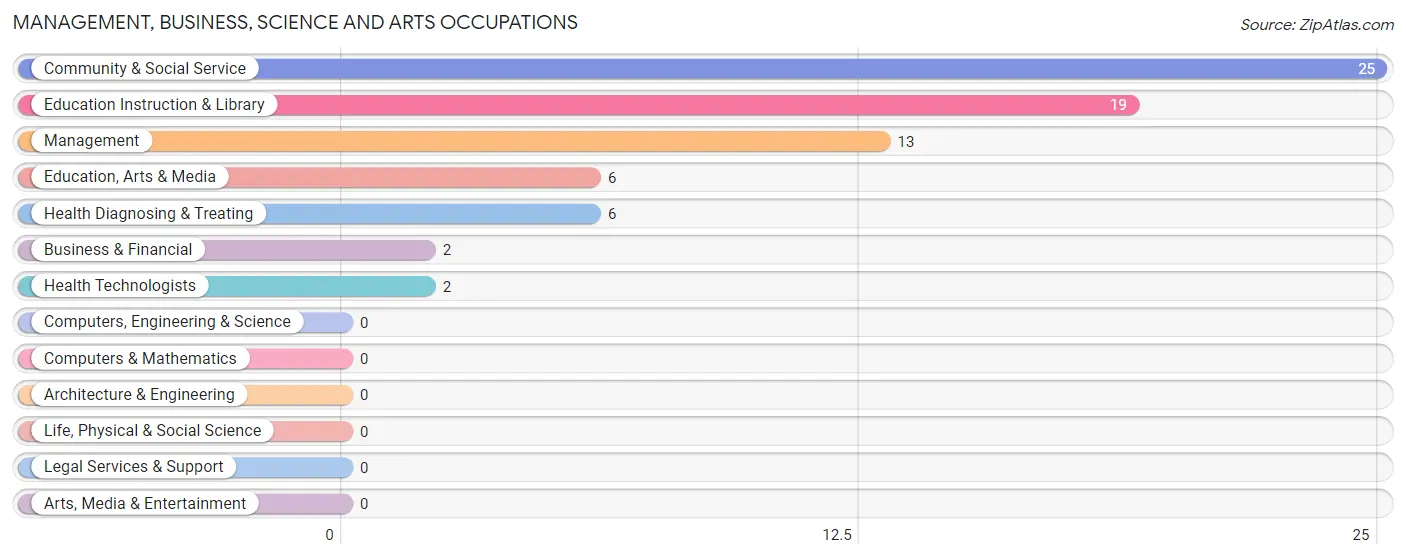
Management, Business, Science and Arts Occupations
The most common Management, Business, Science and Arts occupations in Sulphur Rock are Community & Social Service (25 | 9.5%), Education Instruction & Library (19 | 7.2%), Management (13 | 5.0%), Education, Arts & Media (6 | 2.3%), and Health Diagnosing & Treating (6 | 2.3%).
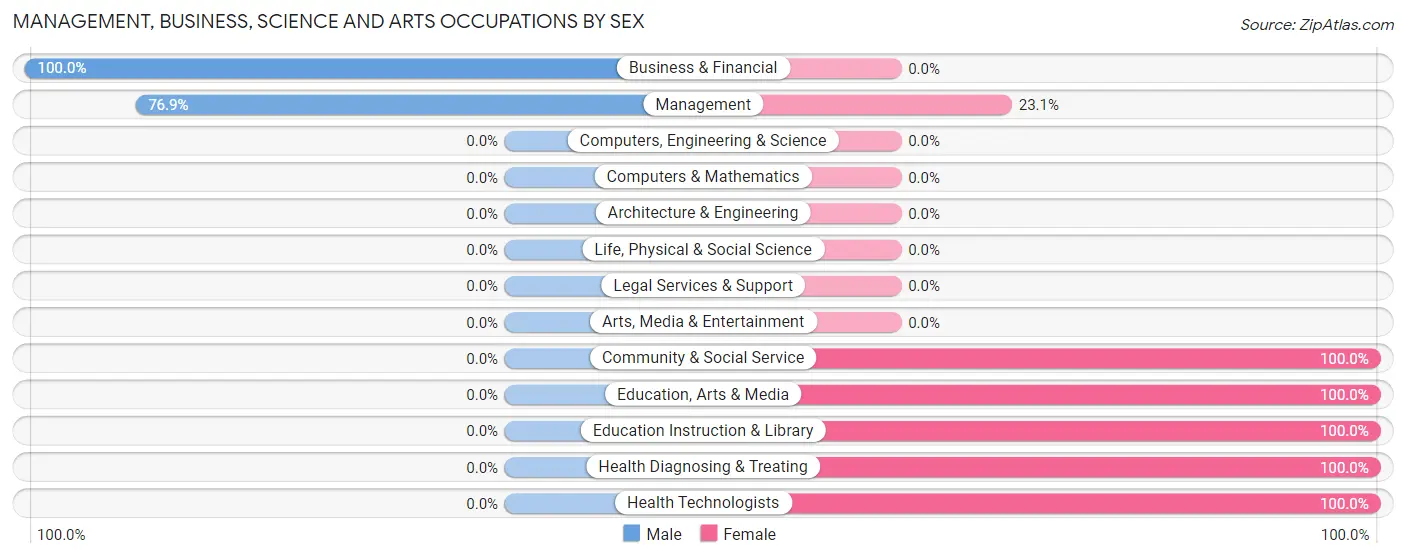
Management, Business, Science and Arts Occupations by Sex
Within the Management, Business, Science and Arts occupations in Sulphur Rock, the most male-oriented occupations are Business & Financial (100.0%), and Management (76.9%), while the most female-oriented occupations are Community & Social Service (100.0%), Education, Arts & Media (100.0%), and Education Instruction & Library (100.0%).
| Occupation | Male | Female |
| Management | 10 (76.9%) | 3 (23.1%) |
| Business & Financial | 2 (100.0%) | 0 (0.0%) |
| Computers, Engineering & Science | 0 (0.0%) | 0 (0.0%) |
| Computers & Mathematics | 0 (0.0%) | 0 (0.0%) |
| Architecture & Engineering | 0 (0.0%) | 0 (0.0%) |
| Life, Physical & Social Science | 0 (0.0%) | 0 (0.0%) |
| Community & Social Service | 0 (0.0%) | 25 (100.0%) |
| Education, Arts & Media | 0 (0.0%) | 6 (100.0%) |
| Legal Services & Support | 0 (0.0%) | 0 (0.0%) |
| Education Instruction & Library | 0 (0.0%) | 19 (100.0%) |
| Arts, Media & Entertainment | 0 (0.0%) | 0 (0.0%) |
| Health Diagnosing & Treating | 0 (0.0%) | 6 (100.0%) |
| Health Technologists | 0 (0.0%) | 2 (100.0%) |
| Total (Category) | 12 (26.1%) | 34 (73.9%) |
| Total (Overall) | 133 (50.8%) | 129 (49.2%) |
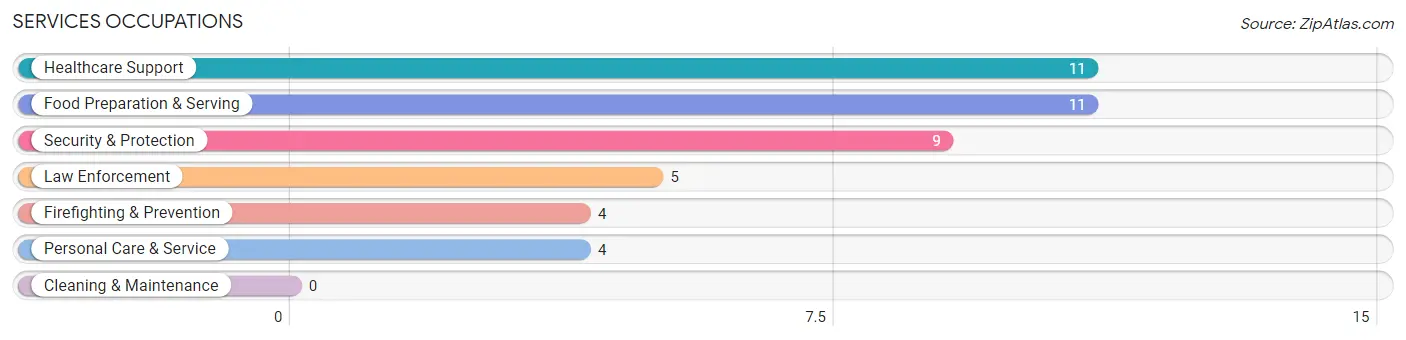
Services Occupations
The most common Services occupations in Sulphur Rock are Healthcare Support (11 | 4.2%), Food Preparation & Serving (11 | 4.2%), Security & Protection (9 | 3.4%), Law Enforcement (5 | 1.9%), and Firefighting & Prevention (4 | 1.5%).
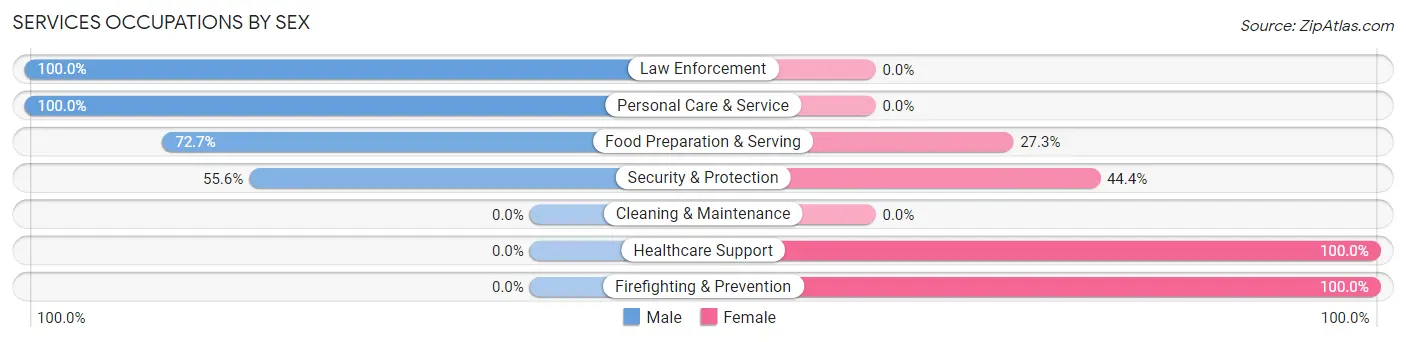
Services Occupations by Sex
Within the Services occupations in Sulphur Rock, the most male-oriented occupations are Law Enforcement (100.0%), Personal Care & Service (100.0%), and Food Preparation & Serving (72.7%), while the most female-oriented occupations are Healthcare Support (100.0%), Firefighting & Prevention (100.0%), and Security & Protection (44.4%).
| Occupation | Male | Female |
| Healthcare Support | 0 (0.0%) | 11 (100.0%) |
| Security & Protection | 5 (55.6%) | 4 (44.4%) |
| Firefighting & Prevention | 0 (0.0%) | 4 (100.0%) |
| Law Enforcement | 5 (100.0%) | 0 (0.0%) |
| Food Preparation & Serving | 8 (72.7%) | 3 (27.3%) |
| Cleaning & Maintenance | 0 (0.0%) | 0 (0.0%) |
| Personal Care & Service | 4 (100.0%) | 0 (0.0%) |
| Total (Category) | 17 (48.6%) | 18 (51.4%) |
| Total (Overall) | 133 (50.8%) | 129 (49.2%) |
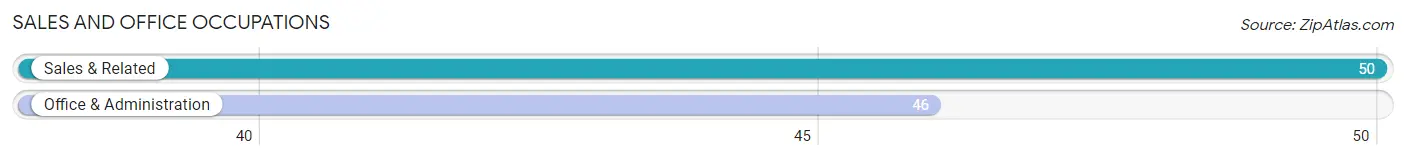
Sales and Office Occupations
The most common Sales and Office occupations in Sulphur Rock are Sales & Related (50 | 19.1%), and Office & Administration (46 | 17.6%).
Sales and Office Occupations by Sex
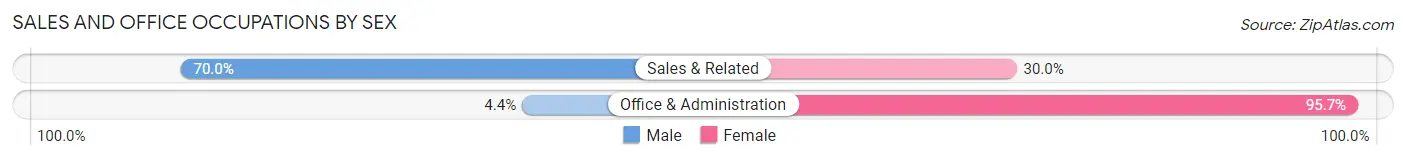
| Occupation | Male | Female |
| Sales & Related | 35 (70.0%) | 15 (30.0%) |
| Office & Administration | 2 (4.3%) | 44 (95.7%) |
| Total (Category) | 37 (38.5%) | 59 (61.5%) |
| Total (Overall) | 133 (50.8%) | 129 (49.2%) |
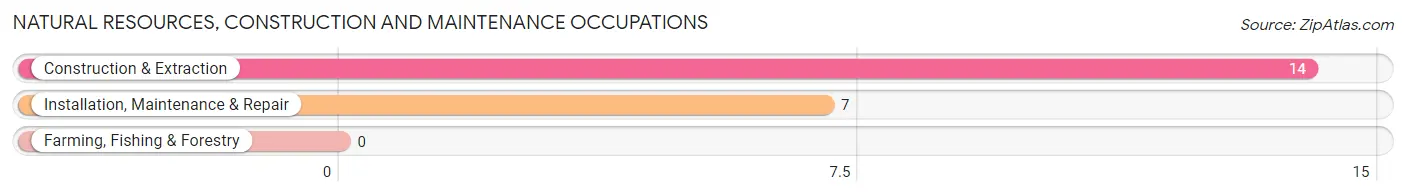
Natural Resources, Construction and Maintenance Occupations
The most common Natural Resources, Construction and Maintenance occupations in Sulphur Rock are Construction & Extraction (14 | 5.3%), and Installation, Maintenance & Repair (7 | 2.7%).
Natural Resources, Construction and Maintenance Occupations by Sex
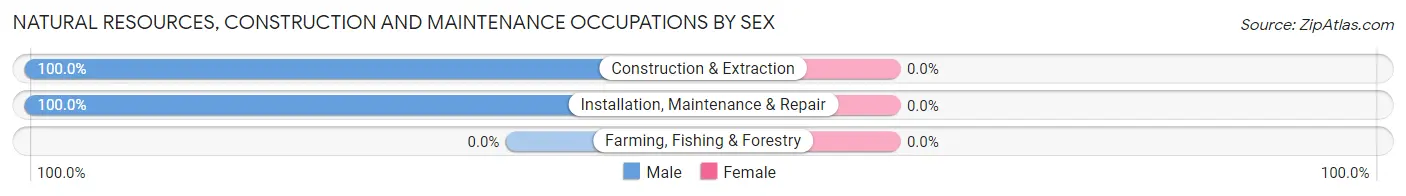
| Occupation | Male | Female |
| Farming, Fishing & Forestry | 0 (0.0%) | 0 (0.0%) |
| Construction & Extraction | 14 (100.0%) | 0 (0.0%) |
| Installation, Maintenance & Repair | 7 (100.0%) | 0 (0.0%) |
| Total (Category) | 21 (100.0%) | 0 (0.0%) |
| Total (Overall) | 133 (50.8%) | 129 (49.2%) |
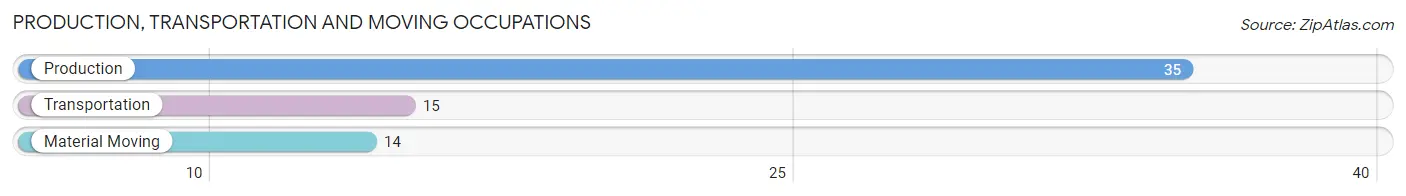
Production, Transportation and Moving Occupations
The most common Production, Transportation and Moving occupations in Sulphur Rock are Production (35 | 13.4%), Transportation (15 | 5.7%), and Material Moving (14 | 5.3%).
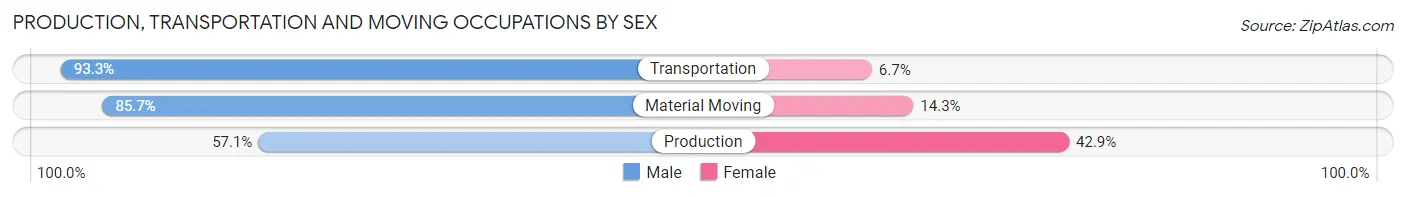
Production, Transportation and Moving Occupations by Sex
| Occupation | Male | Female |
| Production | 20 (57.1%) | 15 (42.9%) |
| Transportation | 14 (93.3%) | 1 (6.7%) |
| Material Moving | 12 (85.7%) | 2 (14.3%) |
| Total (Category) | 46 (71.9%) | 18 (28.1%) |
| Total (Overall) | 133 (50.8%) | 129 (49.2%) |
Employment Industries by Sex in Sulphur Rock
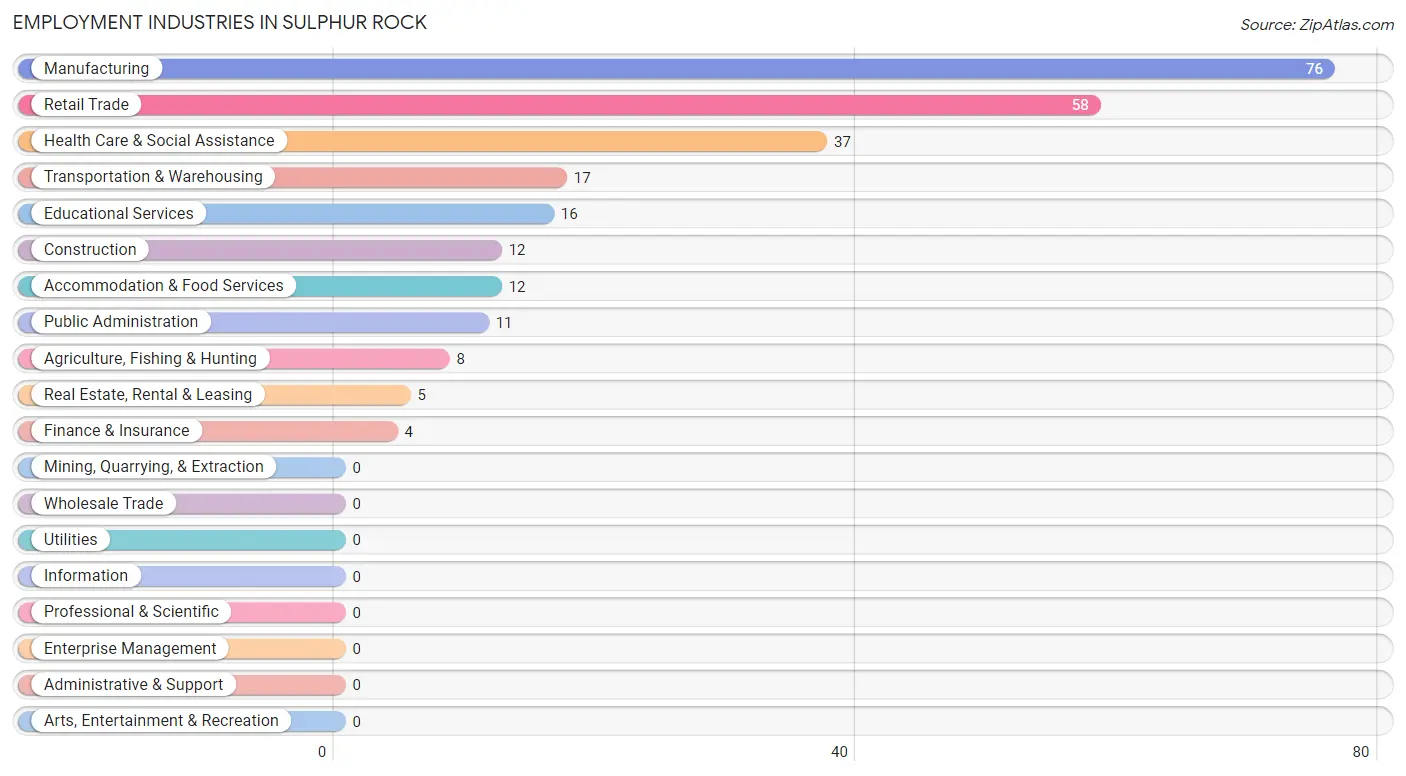
Employment Industries in Sulphur Rock
The major employment industries in Sulphur Rock include Manufacturing (76 | 29.0%), Retail Trade (58 | 22.1%), Health Care & Social Assistance (37 | 14.1%), Transportation & Warehousing (17 | 6.5%), and Educational Services (16 | 6.1%).
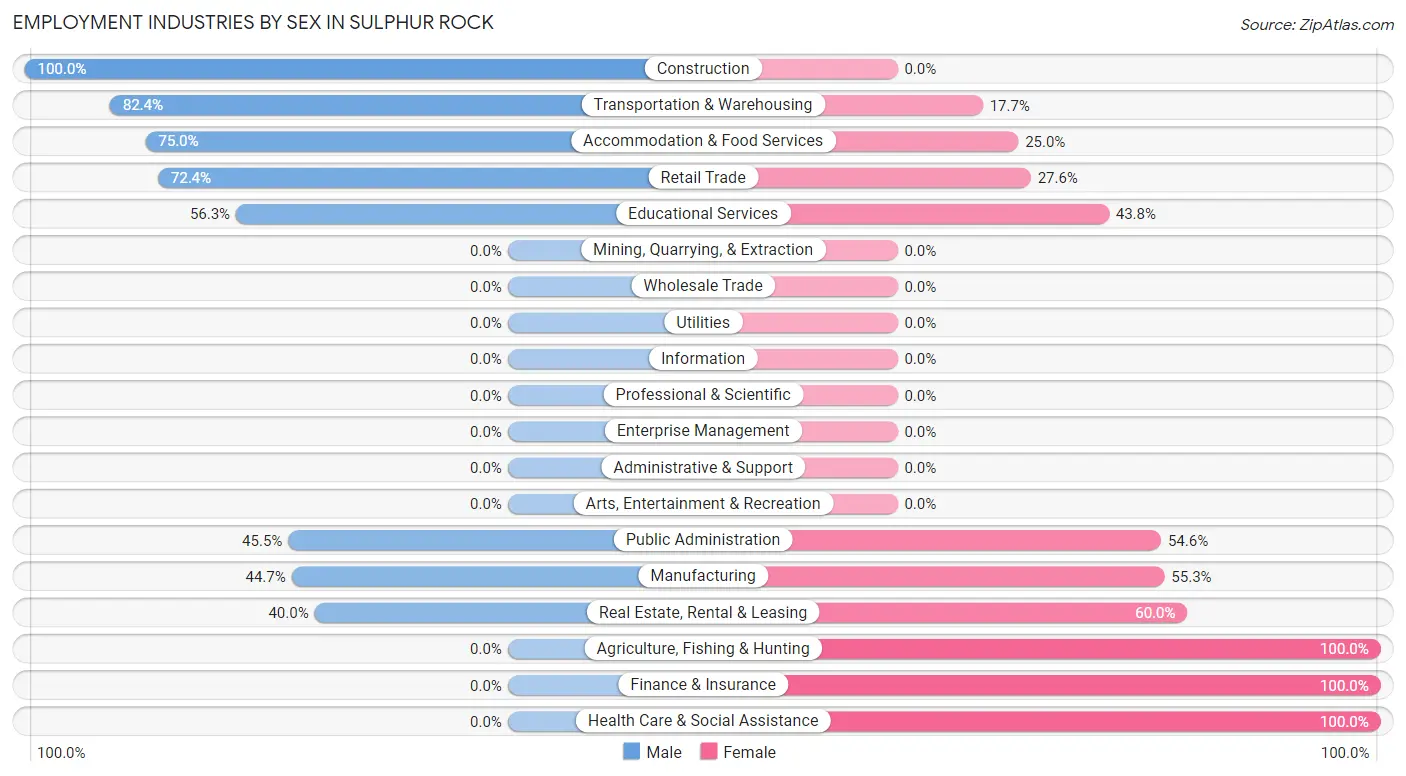
Employment Industries by Sex in Sulphur Rock
The Sulphur Rock industries that see more men than women are Construction (100.0%), Transportation & Warehousing (82.4%), and Accommodation & Food Services (75.0%), whereas the industries that tend to have a higher number of women are Agriculture, Fishing & Hunting (100.0%), Finance & Insurance (100.0%), and Health Care & Social Assistance (100.0%).
| Industry | Male | Female |
| Agriculture, Fishing & Hunting | 0 (0.0%) | 8 (100.0%) |
| Mining, Quarrying, & Extraction | 0 (0.0%) | 0 (0.0%) |
| Construction | 12 (100.0%) | 0 (0.0%) |
| Manufacturing | 34 (44.7%) | 42 (55.3%) |
| Wholesale Trade | 0 (0.0%) | 0 (0.0%) |
| Retail Trade | 42 (72.4%) | 16 (27.6%) |
| Transportation & Warehousing | 14 (82.4%) | 3 (17.6%) |
| Utilities | 0 (0.0%) | 0 (0.0%) |
| Information | 0 (0.0%) | 0 (0.0%) |
| Finance & Insurance | 0 (0.0%) | 4 (100.0%) |
| Real Estate, Rental & Leasing | 2 (40.0%) | 3 (60.0%) |
| Professional & Scientific | 0 (0.0%) | 0 (0.0%) |
| Enterprise Management | 0 (0.0%) | 0 (0.0%) |
| Administrative & Support | 0 (0.0%) | 0 (0.0%) |
| Educational Services | 9 (56.2%) | 7 (43.8%) |
| Health Care & Social Assistance | 0 (0.0%) | 37 (100.0%) |
| Arts, Entertainment & Recreation | 0 (0.0%) | 0 (0.0%) |
| Accommodation & Food Services | 9 (75.0%) | 3 (25.0%) |
| Public Administration | 5 (45.5%) | 6 (54.5%) |
| Total | 133 (50.8%) | 129 (49.2%) |
Education in Sulphur Rock
School Enrollment in Sulphur Rock
The most common levels of schooling among the 190 students in Sulphur Rock are middle school (50 | 26.3%), college / undergraduate (47 | 24.7%), and elementary school (31 | 16.3%).
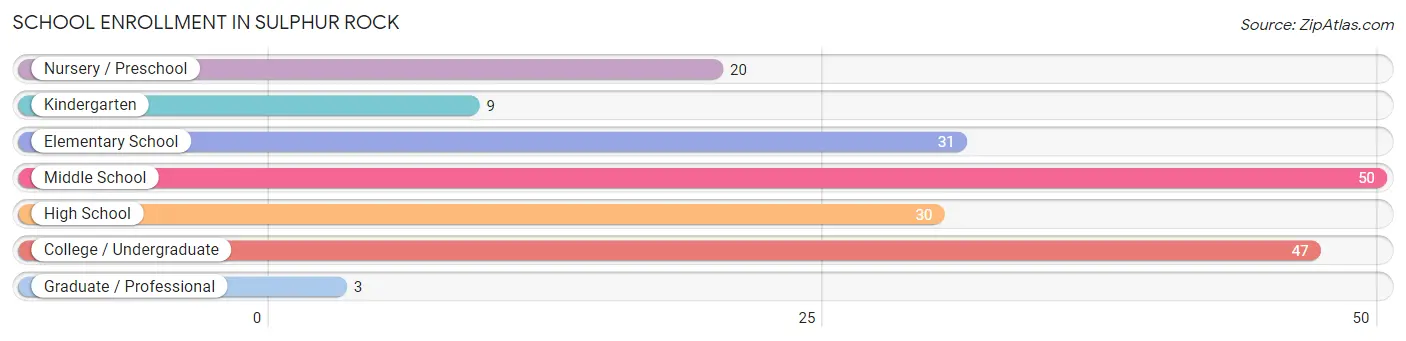
| School Level | # Students | % Students |
| Nursery / Preschool | 20 | 10.5% |
| Kindergarten | 9 | 4.7% |
| Elementary School | 31 | 16.3% |
| Middle School | 50 | 26.3% |
| High School | 30 | 15.8% |
| College / Undergraduate | 47 | 24.7% |
| Graduate / Professional | 3 | 1.6% |
| Total | 190 | 100.0% |
School Enrollment by Age by Funding Source in Sulphur Rock
Out of a total of 190 students who are enrolled in schools in Sulphur Rock, 22 (11.6%) attend a private institution, while the remaining 168 (88.4%) are enrolled in public schools. The age group of 25 to 34 year olds has the highest likelihood of being enrolled in private schools, with 2 (100.0% in the age bracket) enrolled. Conversely, the age group of 5 to 9 year old has the lowest likelihood of being enrolled in a private school, with 37 (100.0% in the age bracket) attending a public institution.
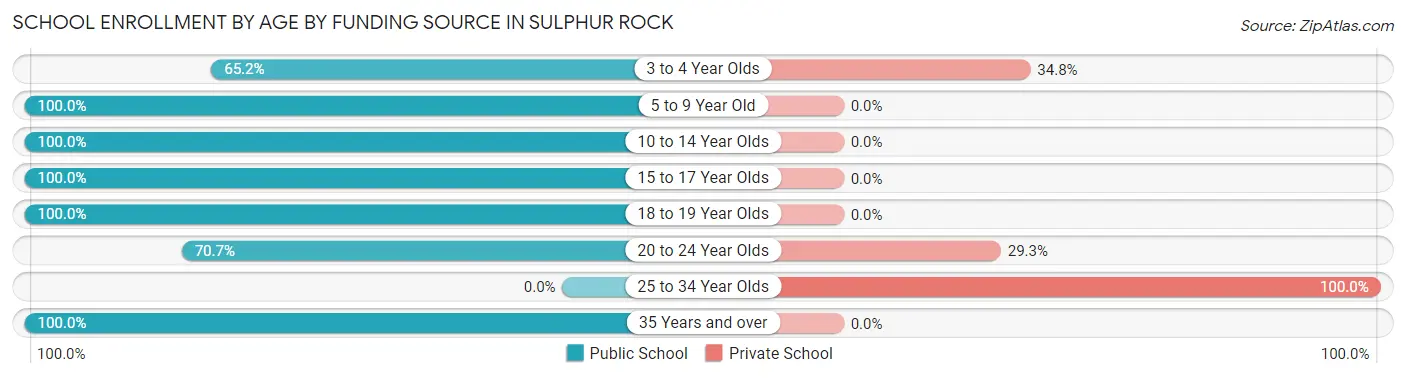
| Age Bracket | Public School | Private School |
| 3 to 4 Year Olds | 15 (65.2%) | 8 (34.8%) |
| 5 to 9 Year Old | 37 (100.0%) | 0 (0.0%) |
| 10 to 14 Year Olds | 57 (100.0%) | 0 (0.0%) |
| 15 to 17 Year Olds | 23 (100.0%) | 0 (0.0%) |
| 18 to 19 Year Olds | 5 (100.0%) | 0 (0.0%) |
| 20 to 24 Year Olds | 29 (70.7%) | 12 (29.3%) |
| 25 to 34 Year Olds | 0 (0.0%) | 2 (100.0%) |
| 35 Years and over | 2 (100.0%) | 0 (0.0%) |
| Total | 168 (88.4%) | 22 (11.6%) |
Educational Attainment by Field of Study in Sulphur Rock
Business (14 | 28.6%), social sciences (11 | 22.5%), education (9 | 18.4%), psychology (7 | 14.3%), and multidisciplinary studies (3 | 6.1%) are the most common fields of study among 49 individuals in Sulphur Rock who have obtained a bachelor's degree or higher.
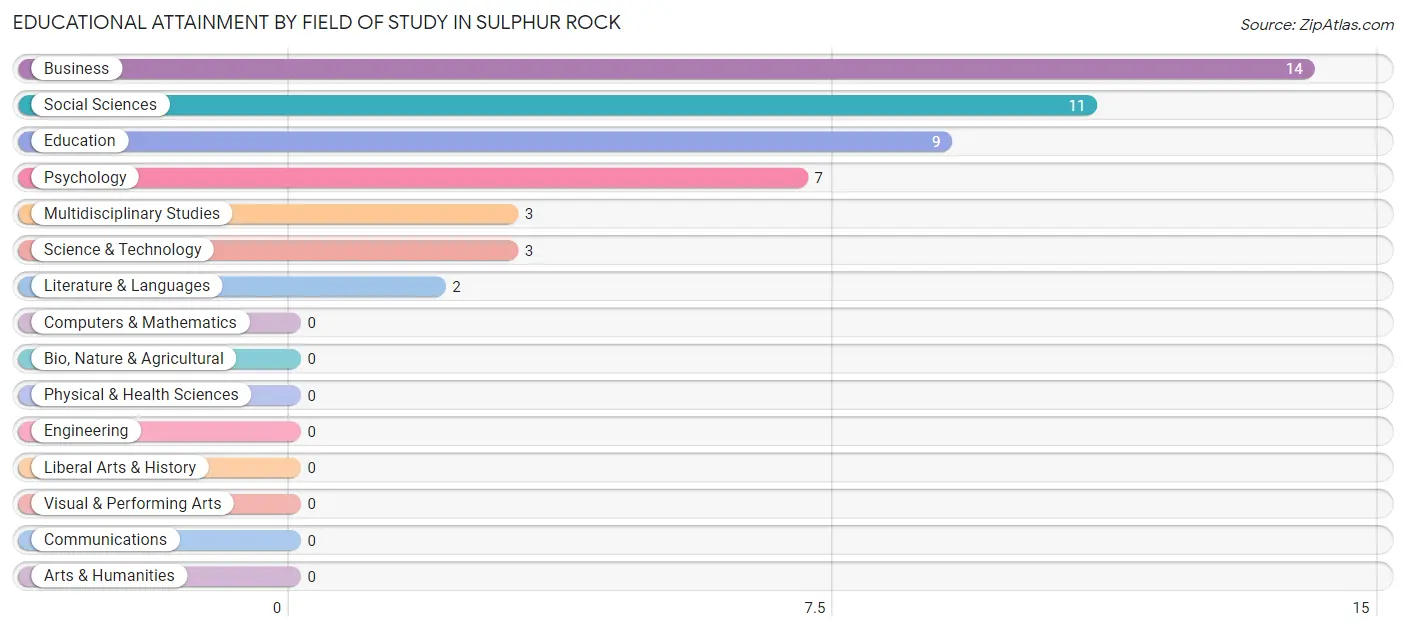
| Field of Study | # Graduates | % Graduates |
| Computers & Mathematics | 0 | 0.0% |
| Bio, Nature & Agricultural | 0 | 0.0% |
| Physical & Health Sciences | 0 | 0.0% |
| Psychology | 7 | 14.3% |
| Social Sciences | 11 | 22.5% |
| Engineering | 0 | 0.0% |
| Multidisciplinary Studies | 3 | 6.1% |
| Science & Technology | 3 | 6.1% |
| Business | 14 | 28.6% |
| Education | 9 | 18.4% |
| Literature & Languages | 2 | 4.1% |
| Liberal Arts & History | 0 | 0.0% |
| Visual & Performing Arts | 0 | 0.0% |
| Communications | 0 | 0.0% |
| Arts & Humanities | 0 | 0.0% |
| Total | 49 | 100.0% |
Transportation & Commute in Sulphur Rock
Vehicle Availability by Sex in Sulphur Rock
The most prevalent vehicle ownership categories in Sulphur Rock are males with 2 vehicles (53, accounting for 41.7%) and females with 2 vehicles (59, making up 41.1%).
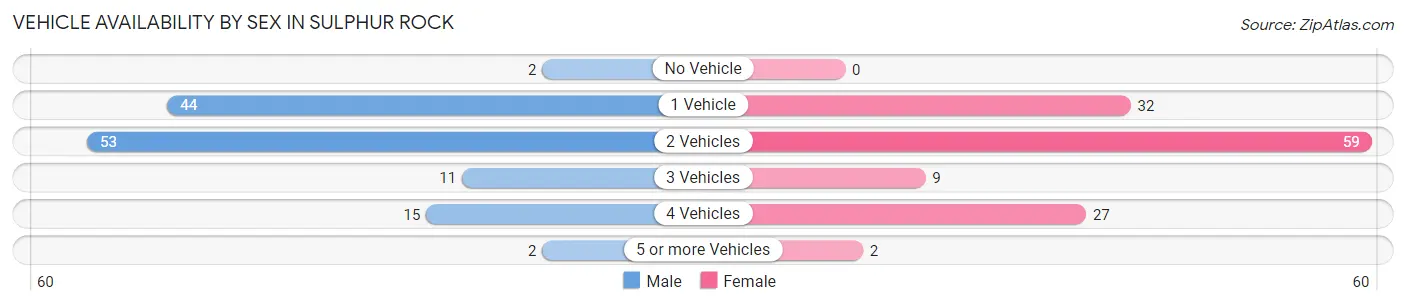
| Vehicles Available | Male | Female |
| No Vehicle | 2 (1.6%) | 0 (0.0%) |
| 1 Vehicle | 44 (34.6%) | 32 (24.8%) |
| 2 Vehicles | 53 (41.7%) | 59 (45.7%) |
| 3 Vehicles | 11 (8.7%) | 9 (7.0%) |
| 4 Vehicles | 15 (11.8%) | 27 (20.9%) |
| 5 or more Vehicles | 2 (1.6%) | 2 (1.5%) |
| Total | 127 (100.0%) | 129 (100.0%) |
Commute Time in Sulphur Rock
The most frequently occuring commute durations in Sulphur Rock are 20 to 24 minutes (75 commuters, 29.5%), 15 to 19 minutes (66 commuters, 26.0%), and 30 to 34 minutes (33 commuters, 13.0%).
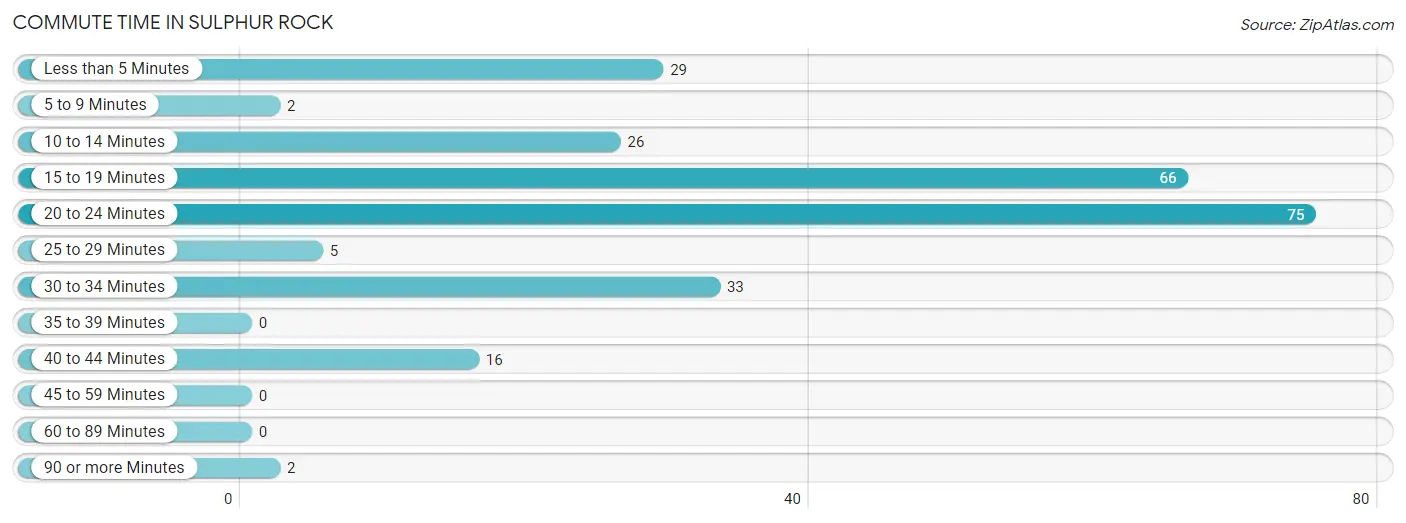
| Commute Time | # Commuters | % Commuters |
| Less than 5 Minutes | 29 | 11.4% |
| 5 to 9 Minutes | 2 | 0.8% |
| 10 to 14 Minutes | 26 | 10.2% |
| 15 to 19 Minutes | 66 | 26.0% |
| 20 to 24 Minutes | 75 | 29.5% |
| 25 to 29 Minutes | 5 | 2.0% |
| 30 to 34 Minutes | 33 | 13.0% |
| 35 to 39 Minutes | 0 | 0.0% |
| 40 to 44 Minutes | 16 | 6.3% |
| 45 to 59 Minutes | 0 | 0.0% |
| 60 to 89 Minutes | 0 | 0.0% |
| 90 or more Minutes | 2 | 0.8% |
Commute Time by Sex in Sulphur Rock
The most common commute times in Sulphur Rock are 20 to 24 minutes (26 commuters, 20.5%) for males and 20 to 24 minutes (49 commuters, 38.6%) for females.
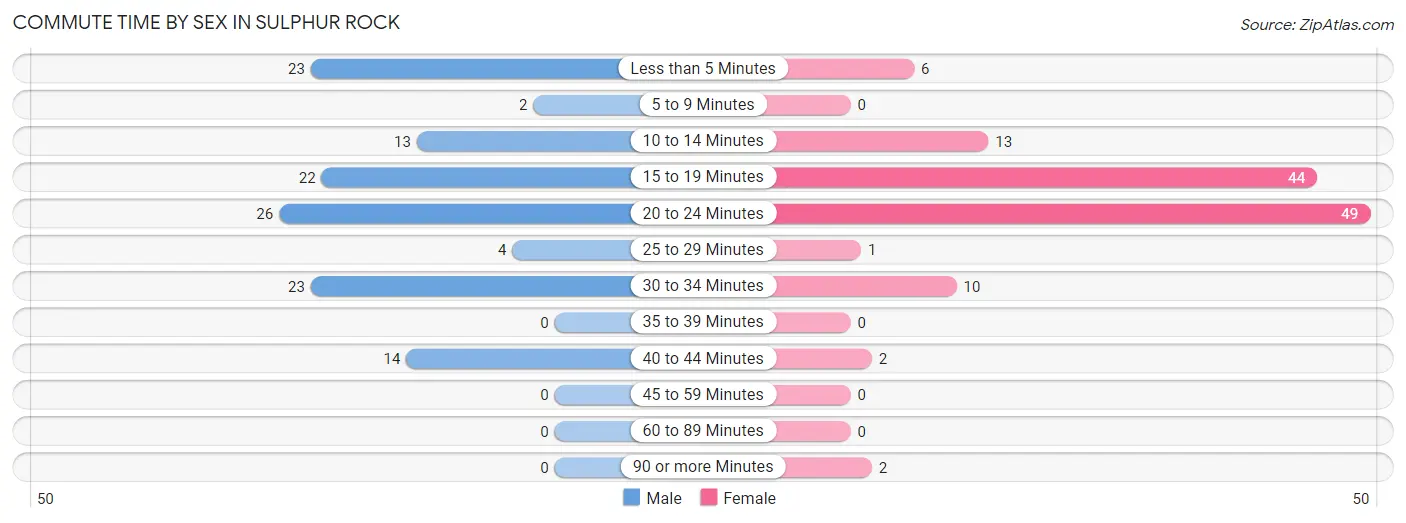
| Commute Time | Male | Female |
| Less than 5 Minutes | 23 (18.1%) | 6 (4.7%) |
| 5 to 9 Minutes | 2 (1.6%) | 0 (0.0%) |
| 10 to 14 Minutes | 13 (10.2%) | 13 (10.2%) |
| 15 to 19 Minutes | 22 (17.3%) | 44 (34.6%) |
| 20 to 24 Minutes | 26 (20.5%) | 49 (38.6%) |
| 25 to 29 Minutes | 4 (3.2%) | 1 (0.8%) |
| 30 to 34 Minutes | 23 (18.1%) | 10 (7.9%) |
| 35 to 39 Minutes | 0 (0.0%) | 0 (0.0%) |
| 40 to 44 Minutes | 14 (11.0%) | 2 (1.6%) |
| 45 to 59 Minutes | 0 (0.0%) | 0 (0.0%) |
| 60 to 89 Minutes | 0 (0.0%) | 0 (0.0%) |
| 90 or more Minutes | 0 (0.0%) | 2 (1.6%) |
Time of Departure to Work by Sex in Sulphur Rock
The most frequent times of departure to work in Sulphur Rock are 4:00 PM to 11:59 PM (28, 22.1%) for males and 12:00 AM to 4:59 AM (31, 24.4%) for females.
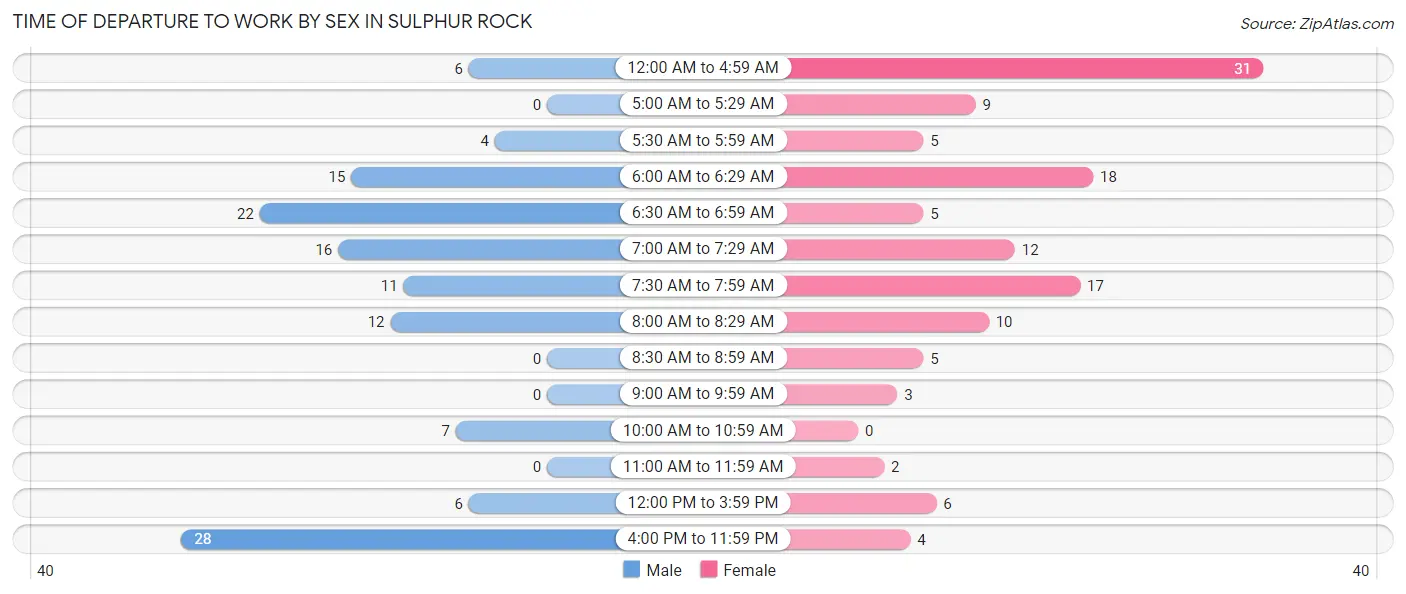
| Time of Departure | Male | Female |
| 12:00 AM to 4:59 AM | 6 (4.7%) | 31 (24.4%) |
| 5:00 AM to 5:29 AM | 0 (0.0%) | 9 (7.1%) |
| 5:30 AM to 5:59 AM | 4 (3.2%) | 5 (3.9%) |
| 6:00 AM to 6:29 AM | 15 (11.8%) | 18 (14.2%) |
| 6:30 AM to 6:59 AM | 22 (17.3%) | 5 (3.9%) |
| 7:00 AM to 7:29 AM | 16 (12.6%) | 12 (9.5%) |
| 7:30 AM to 7:59 AM | 11 (8.7%) | 17 (13.4%) |
| 8:00 AM to 8:29 AM | 12 (9.5%) | 10 (7.9%) |
| 8:30 AM to 8:59 AM | 0 (0.0%) | 5 (3.9%) |
| 9:00 AM to 9:59 AM | 0 (0.0%) | 3 (2.4%) |
| 10:00 AM to 10:59 AM | 7 (5.5%) | 0 (0.0%) |
| 11:00 AM to 11:59 AM | 0 (0.0%) | 2 (1.6%) |
| 12:00 PM to 3:59 PM | 6 (4.7%) | 6 (4.7%) |
| 4:00 PM to 11:59 PM | 28 (22.1%) | 4 (3.2%) |
| Total | 127 (100.0%) | 127 (100.0%) |
Housing Occupancy in Sulphur Rock
Occupancy by Ownership in Sulphur Rock
Of the total 259 dwellings in Sulphur Rock, owner-occupied units account for 105 (40.5%), while renter-occupied units make up 154 (59.5%).
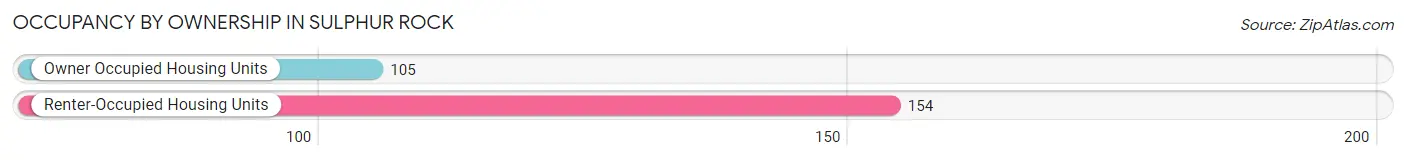
| Occupancy | # Housing Units | % Housing Units |
| Owner Occupied Housing Units | 105 | 40.5% |
| Renter-Occupied Housing Units | 154 | 59.5% |
| Total Occupied Housing Units | 259 | 100.0% |
Occupancy by Household Size in Sulphur Rock
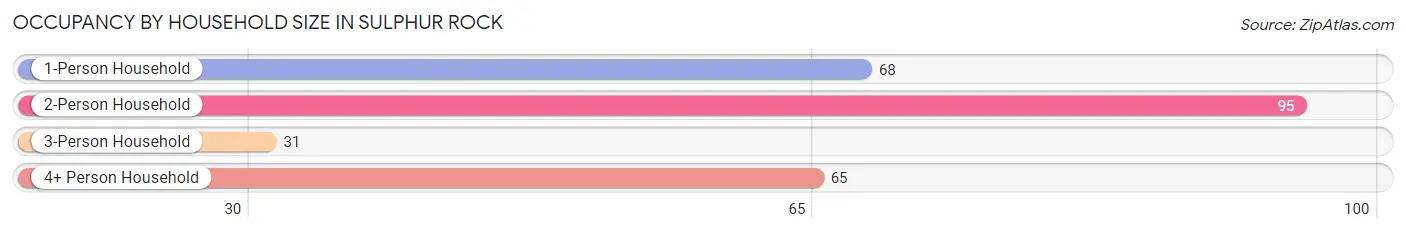
| Household Size | # Housing Units | % Housing Units |
| 1-Person Household | 68 | 26.3% |
| 2-Person Household | 95 | 36.7% |
| 3-Person Household | 31 | 12.0% |
| 4+ Person Household | 65 | 25.1% |
| Total Housing Units | 259 | 100.0% |
Occupancy by Ownership by Household Size in Sulphur Rock
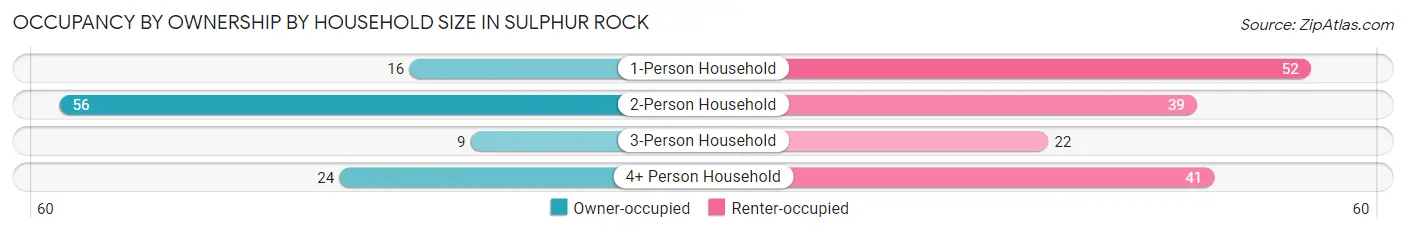
| Household Size | Owner-occupied | Renter-occupied |
| 1-Person Household | 16 (23.5%) | 52 (76.5%) |
| 2-Person Household | 56 (59.0%) | 39 (41.0%) |
| 3-Person Household | 9 (29.0%) | 22 (71.0%) |
| 4+ Person Household | 24 (36.9%) | 41 (63.1%) |
| Total Housing Units | 105 (40.5%) | 154 (59.5%) |
Occupancy by Educational Attainment in Sulphur Rock
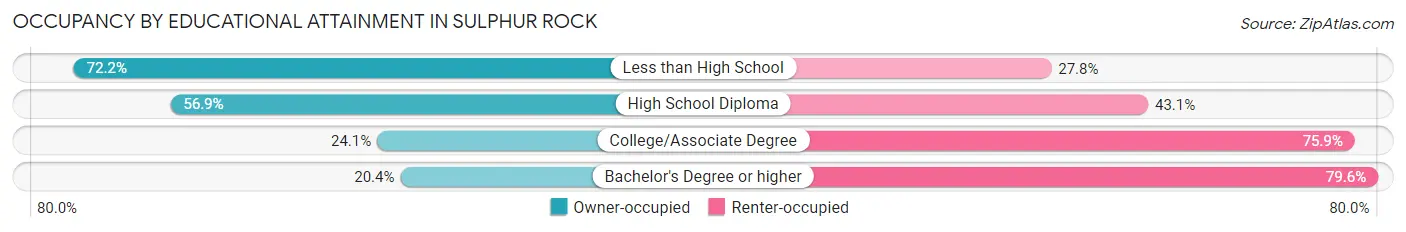
| Household Size | Owner-occupied | Renter-occupied |
| Less than High School | 13 (72.2%) | 5 (27.8%) |
| High School Diploma | 62 (56.9%) | 47 (43.1%) |
| College/Associate Degree | 20 (24.1%) | 63 (75.9%) |
| Bachelor's Degree or higher | 10 (20.4%) | 39 (79.6%) |
Occupancy by Age of Householder in Sulphur Rock
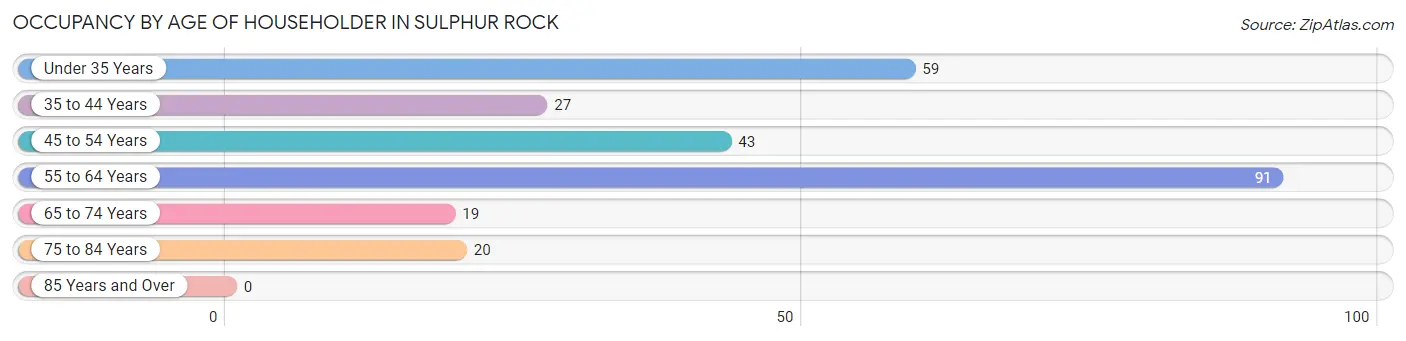
| Age Bracket | # Households | % Households |
| Under 35 Years | 59 | 22.8% |
| 35 to 44 Years | 27 | 10.4% |
| 45 to 54 Years | 43 | 16.6% |
| 55 to 64 Years | 91 | 35.1% |
| 65 to 74 Years | 19 | 7.3% |
| 75 to 84 Years | 20 | 7.7% |
| 85 Years and Over | 0 | 0.0% |
| Total | 259 | 100.0% |
Housing Finances in Sulphur Rock
Median Income by Occupancy in Sulphur Rock
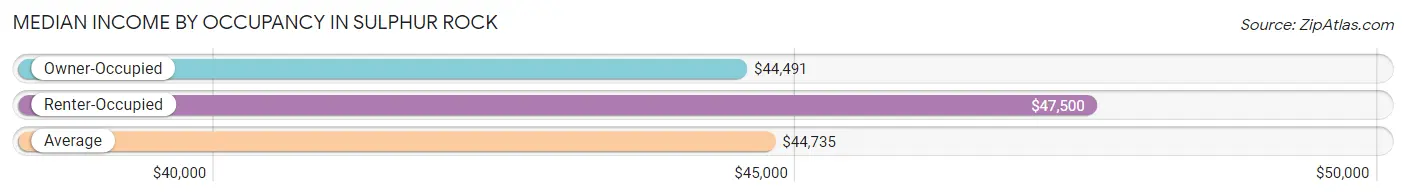
| Occupancy Type | # Households | Median Income |
| Owner-Occupied | 105 (40.5%) | $44,491 |
| Renter-Occupied | 154 (59.5%) | $47,500 |
| Average | 259 (100.0%) | $44,735 |
Occupancy by Householder Income Bracket in Sulphur Rock
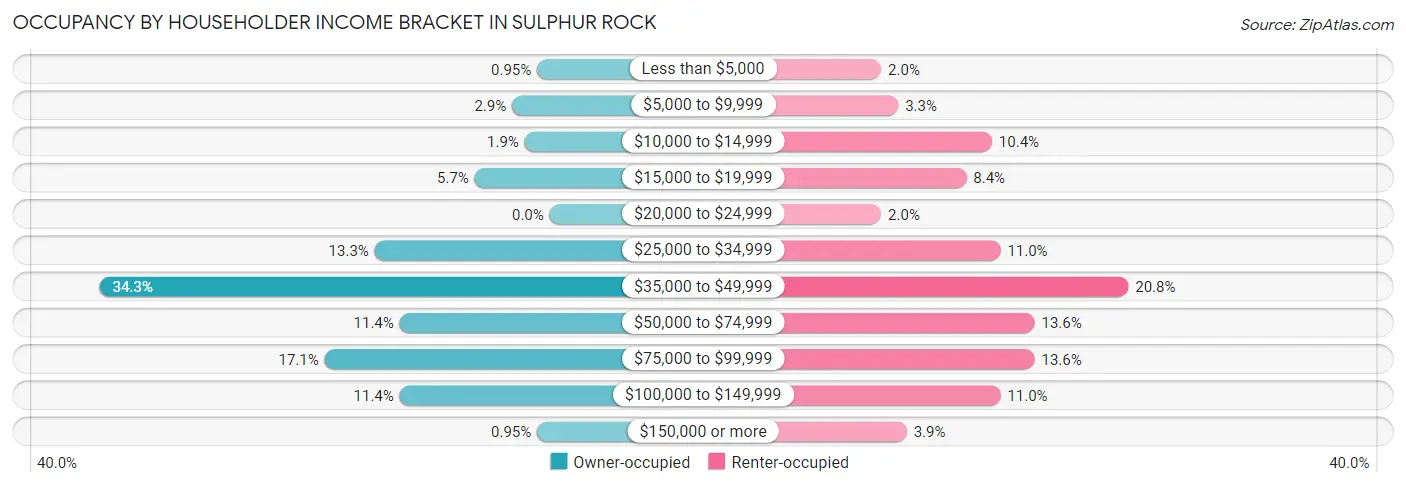
| Income Bracket | Owner-occupied | Renter-occupied |
| Less than $5,000 | 1 (0.9%) | 3 (1.9%) |
| $5,000 to $9,999 | 3 (2.9%) | 5 (3.3%) |
| $10,000 to $14,999 | 2 (1.9%) | 16 (10.4%) |
| $15,000 to $19,999 | 6 (5.7%) | 13 (8.4%) |
| $20,000 to $24,999 | 0 (0.0%) | 3 (1.9%) |
| $25,000 to $34,999 | 14 (13.3%) | 17 (11.0%) |
| $35,000 to $49,999 | 36 (34.3%) | 32 (20.8%) |
| $50,000 to $74,999 | 12 (11.4%) | 21 (13.6%) |
| $75,000 to $99,999 | 18 (17.1%) | 21 (13.6%) |
| $100,000 to $149,999 | 12 (11.4%) | 17 (11.0%) |
| $150,000 or more | 1 (0.9%) | 6 (3.9%) |
| Total | 105 (100.0%) | 154 (100.0%) |
Monthly Housing Cost Tiers in Sulphur Rock
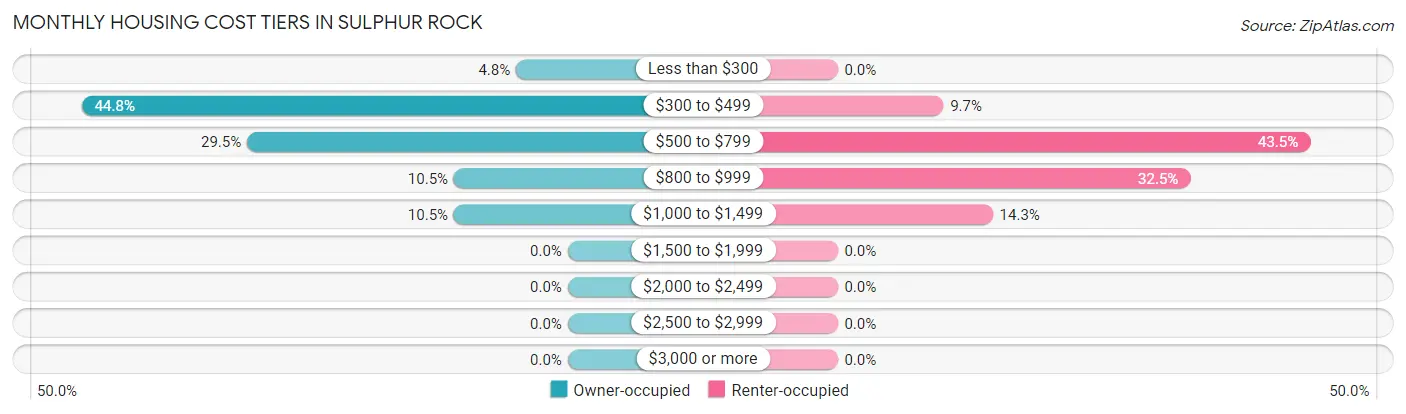
| Monthly Cost | Owner-occupied | Renter-occupied |
| Less than $300 | 5 (4.8%) | 0 (0.0%) |
| $300 to $499 | 47 (44.8%) | 15 (9.7%) |
| $500 to $799 | 31 (29.5%) | 67 (43.5%) |
| $800 to $999 | 11 (10.5%) | 50 (32.5%) |
| $1,000 to $1,499 | 11 (10.5%) | 22 (14.3%) |
| $1,500 to $1,999 | 0 (0.0%) | 0 (0.0%) |
| $2,000 to $2,499 | 0 (0.0%) | 0 (0.0%) |
| $2,500 to $2,999 | 0 (0.0%) | 0 (0.0%) |
| $3,000 or more | 0 (0.0%) | 0 (0.0%) |
| Total | 105 (100.0%) | 154 (100.0%) |
Physical Housing Characteristics in Sulphur Rock
Housing Structures in Sulphur Rock
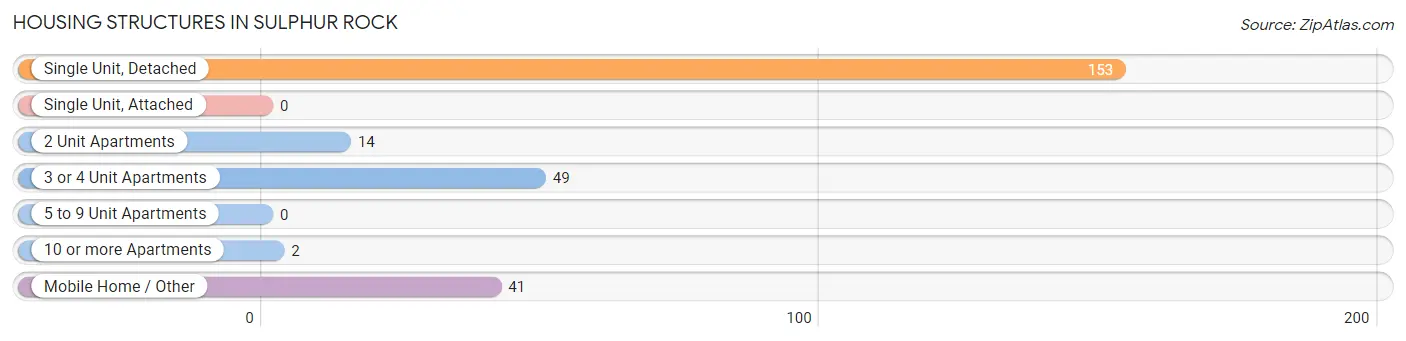
| Structure Type | # Housing Units | % Housing Units |
| Single Unit, Detached | 153 | 59.1% |
| Single Unit, Attached | 0 | 0.0% |
| 2 Unit Apartments | 14 | 5.4% |
| 3 or 4 Unit Apartments | 49 | 18.9% |
| 5 to 9 Unit Apartments | 0 | 0.0% |
| 10 or more Apartments | 2 | 0.8% |
| Mobile Home / Other | 41 | 15.8% |
| Total | 259 | 100.0% |
Housing Structures by Occupancy in Sulphur Rock
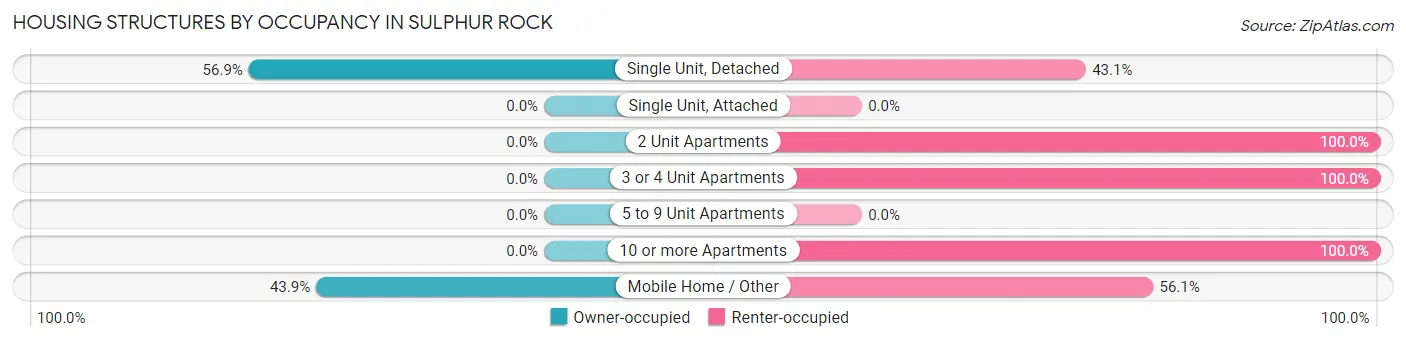
| Structure Type | Owner-occupied | Renter-occupied |
| Single Unit, Detached | 87 (56.9%) | 66 (43.1%) |
| Single Unit, Attached | 0 (0.0%) | 0 (0.0%) |
| 2 Unit Apartments | 0 (0.0%) | 14 (100.0%) |
| 3 or 4 Unit Apartments | 0 (0.0%) | 49 (100.0%) |
| 5 to 9 Unit Apartments | 0 (0.0%) | 0 (0.0%) |
| 10 or more Apartments | 0 (0.0%) | 2 (100.0%) |
| Mobile Home / Other | 18 (43.9%) | 23 (56.1%) |
| Total | 105 (40.5%) | 154 (59.5%) |
Housing Structures by Number of Rooms in Sulphur Rock
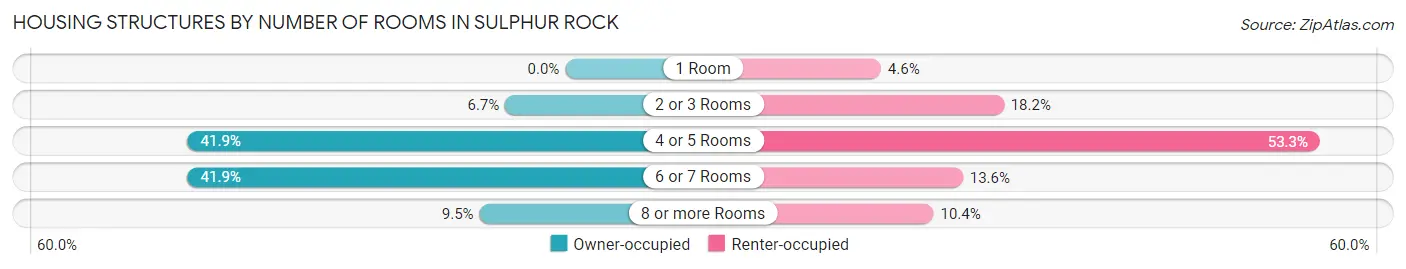
| Number of Rooms | Owner-occupied | Renter-occupied |
| 1 Room | 0 (0.0%) | 7 (4.5%) |
| 2 or 3 Rooms | 7 (6.7%) | 28 (18.2%) |
| 4 or 5 Rooms | 44 (41.9%) | 82 (53.2%) |
| 6 or 7 Rooms | 44 (41.9%) | 21 (13.6%) |
| 8 or more Rooms | 10 (9.5%) | 16 (10.4%) |
| Total | 105 (100.0%) | 154 (100.0%) |
Housing Structure by Heating Type in Sulphur Rock
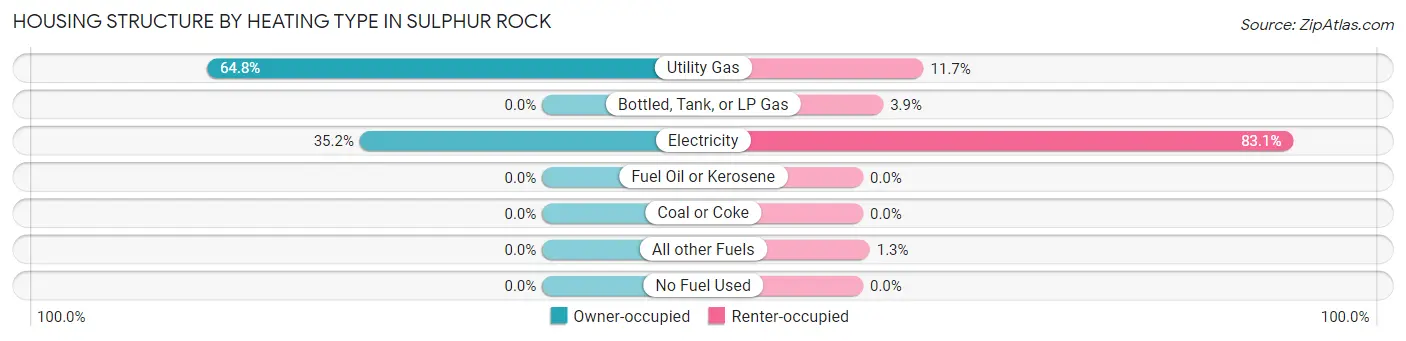
| Heating Type | Owner-occupied | Renter-occupied |
| Utility Gas | 68 (64.8%) | 18 (11.7%) |
| Bottled, Tank, or LP Gas | 0 (0.0%) | 6 (3.9%) |
| Electricity | 37 (35.2%) | 128 (83.1%) |
| Fuel Oil or Kerosene | 0 (0.0%) | 0 (0.0%) |
| Coal or Coke | 0 (0.0%) | 0 (0.0%) |
| All other Fuels | 0 (0.0%) | 2 (1.3%) |
| No Fuel Used | 0 (0.0%) | 0 (0.0%) |
| Total | 105 (100.0%) | 154 (100.0%) |
Household Vehicle Usage in Sulphur Rock
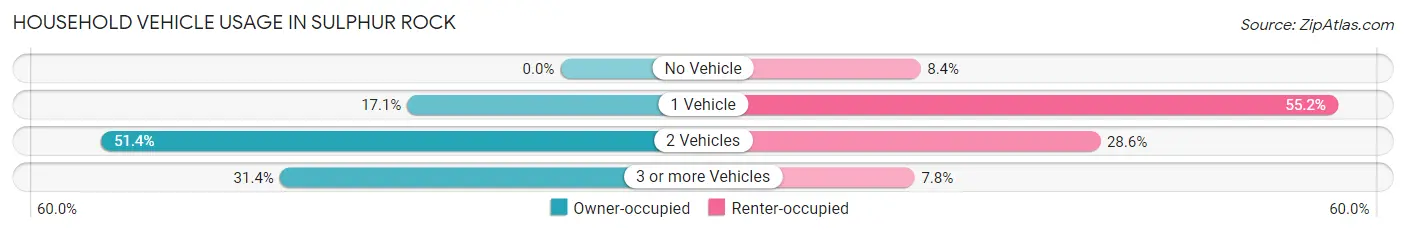
| Vehicles per Household | Owner-occupied | Renter-occupied |
| No Vehicle | 0 (0.0%) | 13 (8.4%) |
| 1 Vehicle | 18 (17.1%) | 85 (55.2%) |
| 2 Vehicles | 54 (51.4%) | 44 (28.6%) |
| 3 or more Vehicles | 33 (31.4%) | 12 (7.8%) |
| Total | 105 (100.0%) | 154 (100.0%) |
Real Estate & Mortgages in Sulphur Rock
Real Estate and Mortgage Overview in Sulphur Rock
| Characteristic | Without Mortgage | With Mortgage |
| Housing Units | 58 | 47 |
| Median Property Value | $138,800 | $75,600 |
| Median Household Income | $43,889 | $1 |
| Monthly Housing Costs | $439 | $0 |
| Real Estate Taxes | $719 | $10 |
Property Value by Mortgage Status in Sulphur Rock
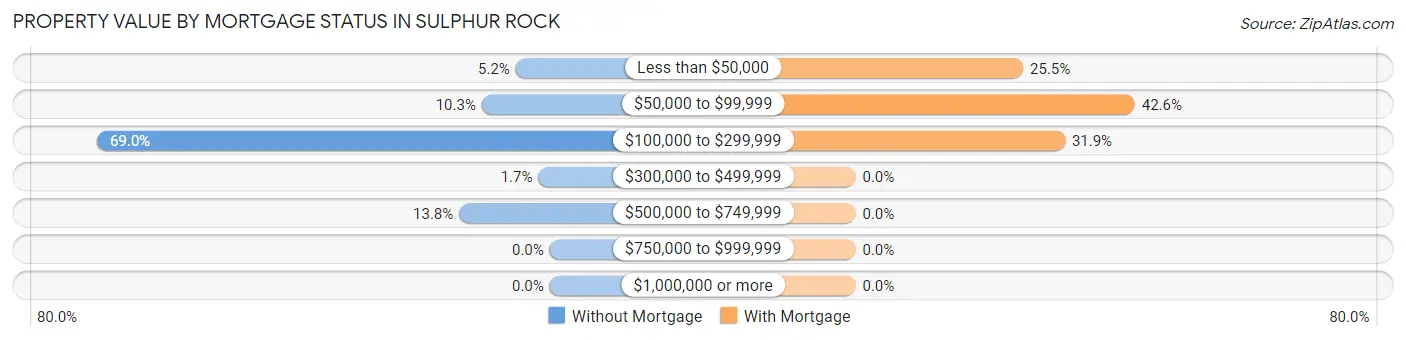
| Property Value | Without Mortgage | With Mortgage |
| Less than $50,000 | 3 (5.2%) | 12 (25.5%) |
| $50,000 to $99,999 | 6 (10.3%) | 20 (42.5%) |
| $100,000 to $299,999 | 40 (69.0%) | 15 (31.9%) |
| $300,000 to $499,999 | 1 (1.7%) | 0 (0.0%) |
| $500,000 to $749,999 | 8 (13.8%) | 0 (0.0%) |
| $750,000 to $999,999 | 0 (0.0%) | 0 (0.0%) |
| $1,000,000 or more | 0 (0.0%) | 0 (0.0%) |
| Total | 58 (100.0%) | 47 (100.0%) |
Household Income by Mortgage Status in Sulphur Rock
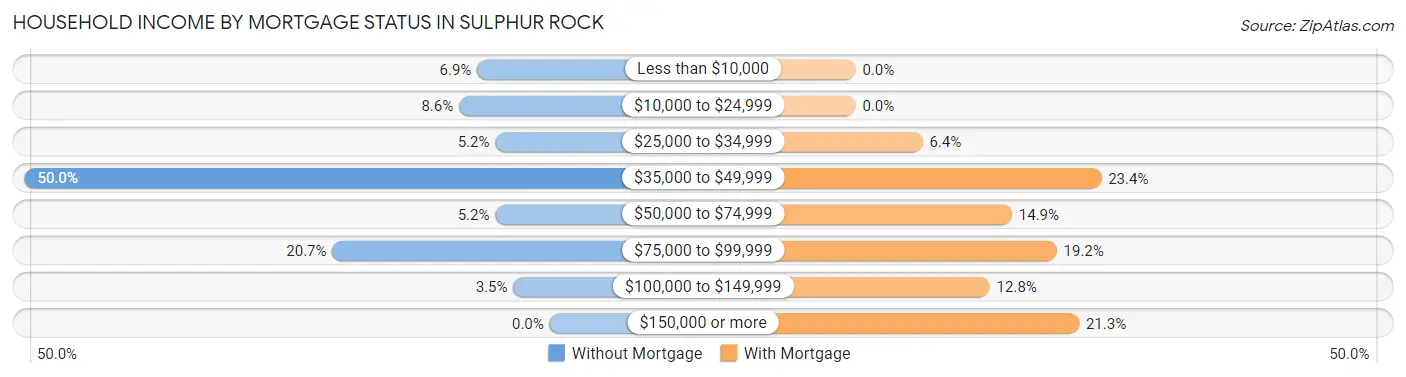
| Household Income | Without Mortgage | With Mortgage |
| Less than $10,000 | 4 (6.9%) | 0 (0.0%) |
| $10,000 to $24,999 | 5 (8.6%) | 0 (0.0%) |
| $25,000 to $34,999 | 3 (5.2%) | 3 (6.4%) |
| $35,000 to $49,999 | 29 (50.0%) | 11 (23.4%) |
| $50,000 to $74,999 | 3 (5.2%) | 7 (14.9%) |
| $75,000 to $99,999 | 12 (20.7%) | 9 (19.2%) |
| $100,000 to $149,999 | 2 (3.5%) | 6 (12.8%) |
| $150,000 or more | 0 (0.0%) | 10 (21.3%) |
| Total | 58 (100.0%) | 47 (100.0%) |
Property Value to Household Income Ratio in Sulphur Rock
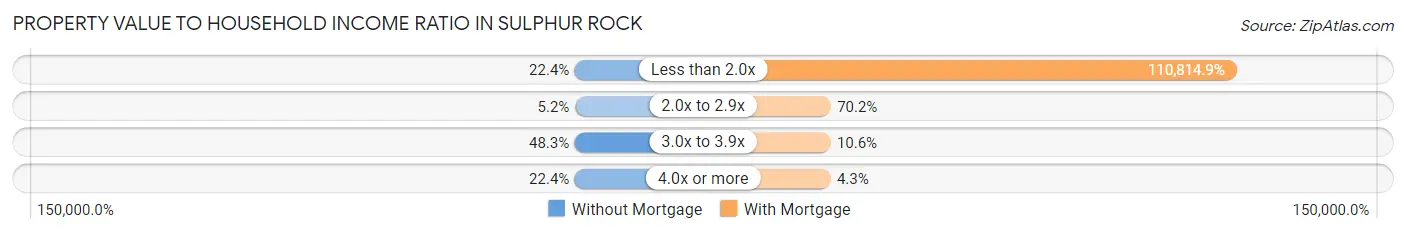
| Value-to-Income Ratio | Without Mortgage | With Mortgage |
| Less than 2.0x | 13 (22.4%) | 52,083 (110,814.9%) |
| 2.0x to 2.9x | 3 (5.2%) | 33 (70.2%) |
| 3.0x to 3.9x | 28 (48.3%) | 5 (10.6%) |
| 4.0x or more | 13 (22.4%) | 2 (4.3%) |
| Total | 58 (100.0%) | 47 (100.0%) |
Real Estate Taxes by Mortgage Status in Sulphur Rock
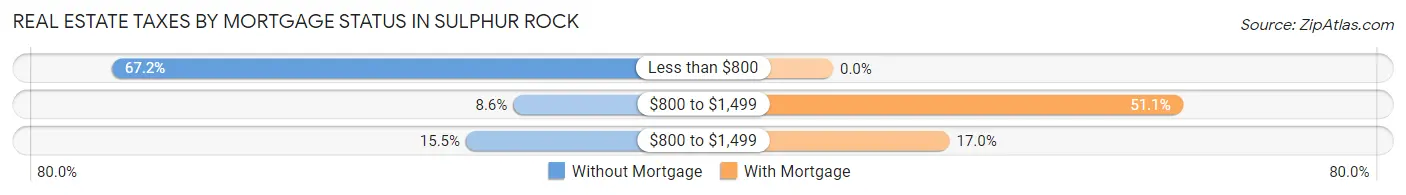
| Property Taxes | Without Mortgage | With Mortgage |
| Less than $800 | 39 (67.2%) | 0 (0.0%) |
| $800 to $1,499 | 5 (8.6%) | 24 (51.1%) |
| $800 to $1,499 | 9 (15.5%) | 8 (17.0%) |
| Total | 58 (100.0%) | 47 (100.0%) |
Health & Disability in Sulphur Rock
Health Insurance Coverage by Age in Sulphur Rock
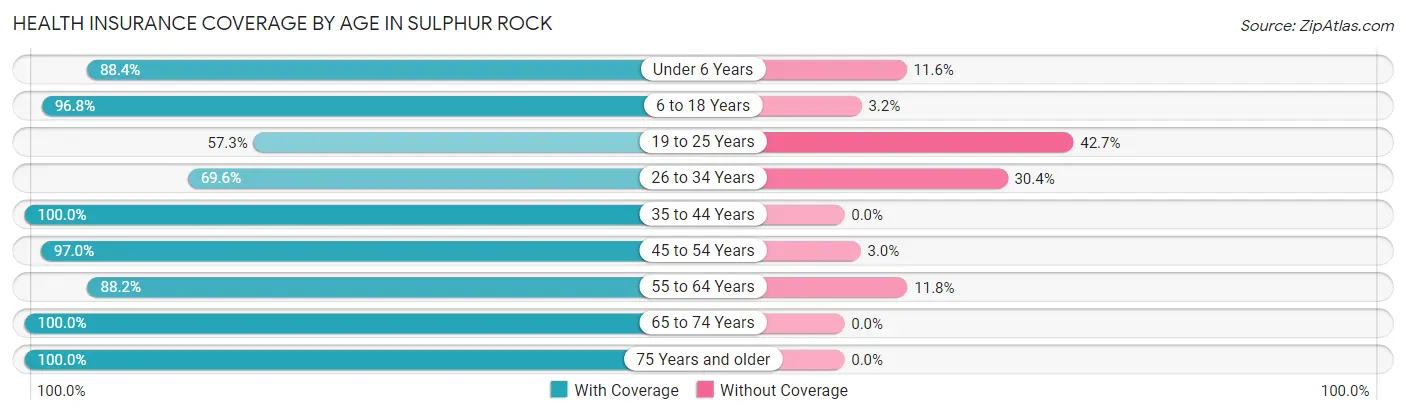
| Age Bracket | With Coverage | Without Coverage |
| Under 6 Years | 38 (88.4%) | 5 (11.6%) |
| 6 to 18 Years | 121 (96.8%) | 4 (3.2%) |
| 19 to 25 Years | 51 (57.3%) | 38 (42.7%) |
| 26 to 34 Years | 48 (69.6%) | 21 (30.4%) |
| 35 to 44 Years | 60 (100.0%) | 0 (0.0%) |
| 45 to 54 Years | 64 (97.0%) | 2 (3.0%) |
| 55 to 64 Years | 105 (88.2%) | 14 (11.8%) |
| 65 to 74 Years | 34 (100.0%) | 0 (0.0%) |
| 75 Years and older | 29 (100.0%) | 0 (0.0%) |
| Total | 550 (86.8%) | 84 (13.3%) |
Health Insurance Coverage by Citizenship Status in Sulphur Rock
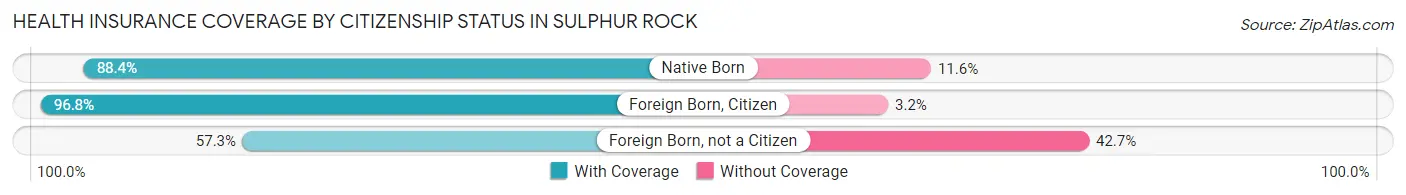
| Citizenship Status | With Coverage | Without Coverage |
| Native Born | 38 (88.4%) | 5 (11.6%) |
| Foreign Born, Citizen | 121 (96.8%) | 4 (3.2%) |
| Foreign Born, not a Citizen | 51 (57.3%) | 38 (42.7%) |
Health Insurance Coverage by Household Income in Sulphur Rock
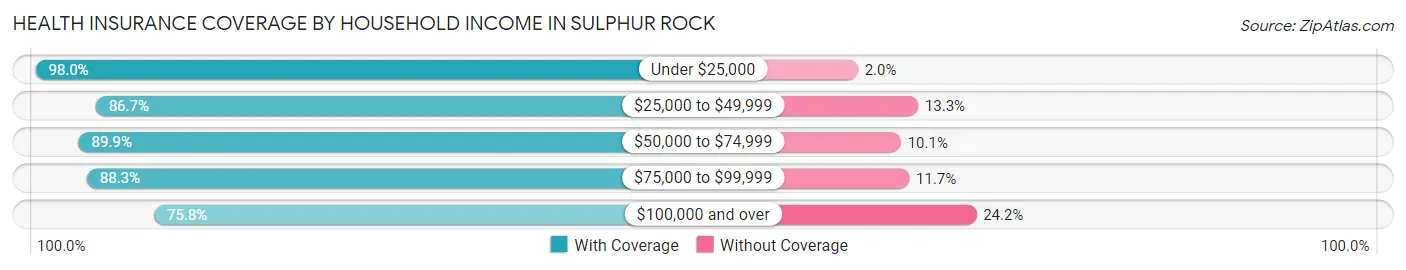
| Household Income | With Coverage | Without Coverage |
| Under $25,000 | 96 (98.0%) | 2 (2.0%) |
| $25,000 to $49,999 | 221 (86.7%) | 34 (13.3%) |
| $50,000 to $74,999 | 80 (89.9%) | 9 (10.1%) |
| $75,000 to $99,999 | 53 (88.3%) | 7 (11.7%) |
| $100,000 and over | 100 (75.8%) | 32 (24.2%) |
Public vs Private Health Insurance Coverage by Age in Sulphur Rock
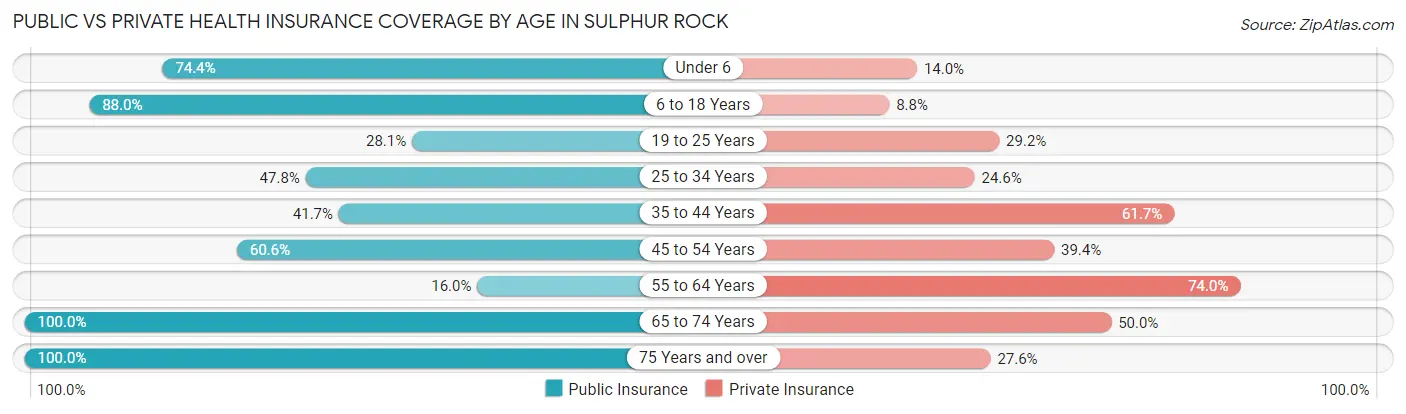
| Age Bracket | Public Insurance | Private Insurance |
| Under 6 | 32 (74.4%) | 6 (14.0%) |
| 6 to 18 Years | 110 (88.0%) | 11 (8.8%) |
| 19 to 25 Years | 25 (28.1%) | 26 (29.2%) |
| 25 to 34 Years | 33 (47.8%) | 17 (24.6%) |
| 35 to 44 Years | 25 (41.7%) | 37 (61.7%) |
| 45 to 54 Years | 40 (60.6%) | 26 (39.4%) |
| 55 to 64 Years | 19 (16.0%) | 88 (74.0%) |
| 65 to 74 Years | 34 (100.0%) | 17 (50.0%) |
| 75 Years and over | 29 (100.0%) | 8 (27.6%) |
| Total | 347 (54.7%) | 236 (37.2%) |
Disability Status by Sex by Age in Sulphur Rock
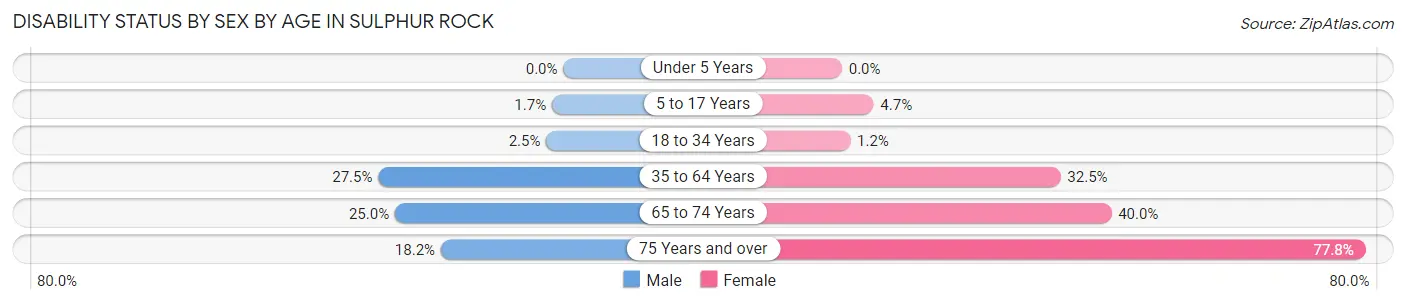
| Age Bracket | Male | Female |
| Under 5 Years | 0 (0.0%) | 0 (0.0%) |
| 5 to 17 Years | 1 (1.7%) | 3 (4.7%) |
| 18 to 34 Years | 2 (2.5%) | 1 (1.2%) |
| 35 to 64 Years | 36 (27.5%) | 37 (32.5%) |
| 65 to 74 Years | 1 (25.0%) | 12 (40.0%) |
| 75 Years and over | 2 (18.2%) | 14 (77.8%) |
Disability Class by Sex by Age in Sulphur Rock
Disability Class: Hearing Difficulty
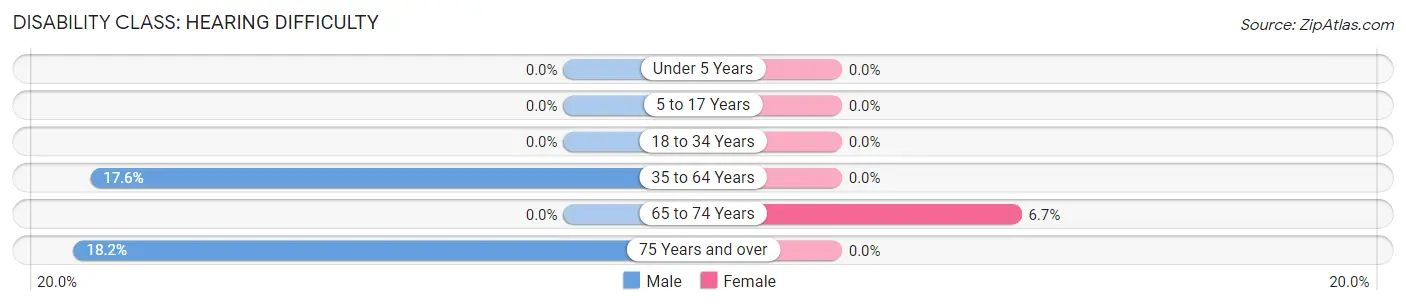
| Age Bracket | Male | Female |
| Under 5 Years | 0 (0.0%) | 0 (0.0%) |
| 5 to 17 Years | 0 (0.0%) | 0 (0.0%) |
| 18 to 34 Years | 0 (0.0%) | 0 (0.0%) |
| 35 to 64 Years | 23 (17.6%) | 0 (0.0%) |
| 65 to 74 Years | 0 (0.0%) | 2 (6.7%) |
| 75 Years and over | 2 (18.2%) | 0 (0.0%) |
Disability Class: Vision Difficulty
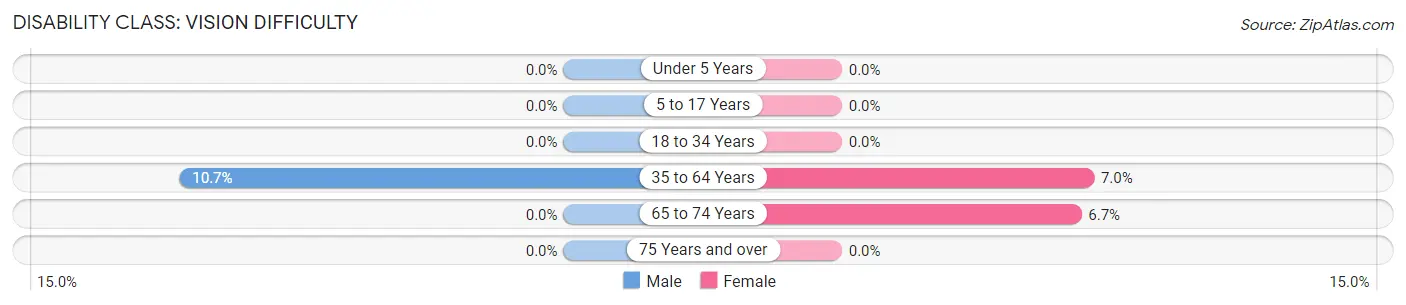
| Age Bracket | Male | Female |
| Under 5 Years | 0 (0.0%) | 0 (0.0%) |
| 5 to 17 Years | 0 (0.0%) | 0 (0.0%) |
| 18 to 34 Years | 0 (0.0%) | 0 (0.0%) |
| 35 to 64 Years | 14 (10.7%) | 8 (7.0%) |
| 65 to 74 Years | 0 (0.0%) | 2 (6.7%) |
| 75 Years and over | 0 (0.0%) | 0 (0.0%) |
Disability Class: Cognitive Difficulty
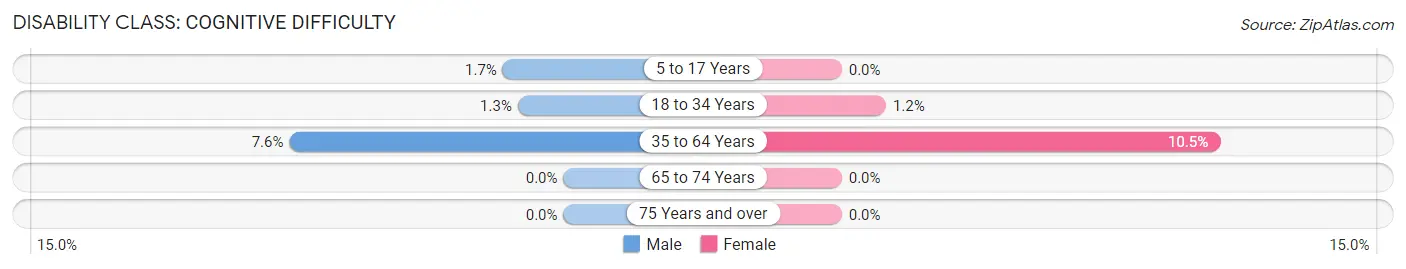
| Age Bracket | Male | Female |
| 5 to 17 Years | 1 (1.7%) | 0 (0.0%) |
| 18 to 34 Years | 1 (1.3%) | 1 (1.2%) |
| 35 to 64 Years | 10 (7.6%) | 12 (10.5%) |
| 65 to 74 Years | 0 (0.0%) | 0 (0.0%) |
| 75 Years and over | 0 (0.0%) | 0 (0.0%) |
Disability Class: Ambulatory Difficulty
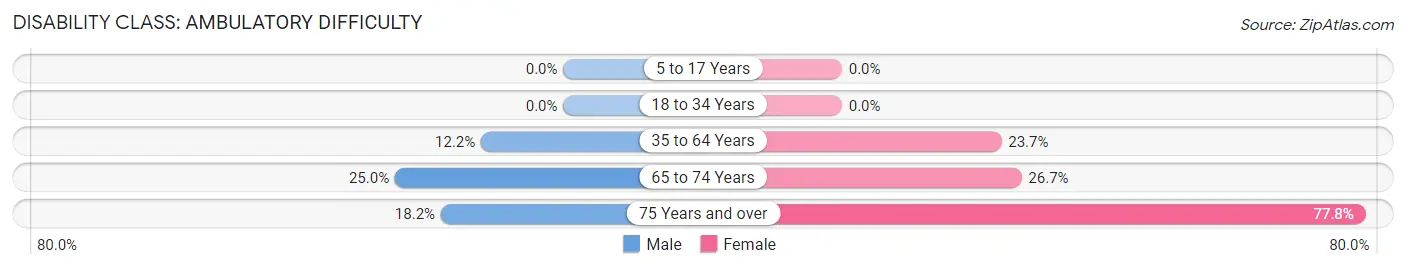
| Age Bracket | Male | Female |
| 5 to 17 Years | 0 (0.0%) | 0 (0.0%) |
| 18 to 34 Years | 0 (0.0%) | 0 (0.0%) |
| 35 to 64 Years | 16 (12.2%) | 27 (23.7%) |
| 65 to 74 Years | 1 (25.0%) | 8 (26.7%) |
| 75 Years and over | 2 (18.2%) | 14 (77.8%) |
Disability Class: Self-Care Difficulty
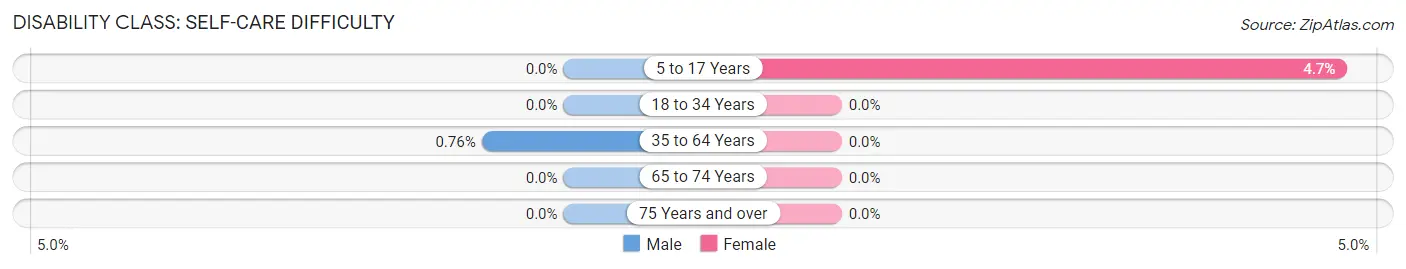
| Age Bracket | Male | Female |
| 5 to 17 Years | 0 (0.0%) | 3 (4.7%) |
| 18 to 34 Years | 0 (0.0%) | 0 (0.0%) |
| 35 to 64 Years | 1 (0.8%) | 0 (0.0%) |
| 65 to 74 Years | 0 (0.0%) | 0 (0.0%) |
| 75 Years and over | 0 (0.0%) | 0 (0.0%) |
Technology Access in Sulphur Rock
Computing Device Access in Sulphur Rock
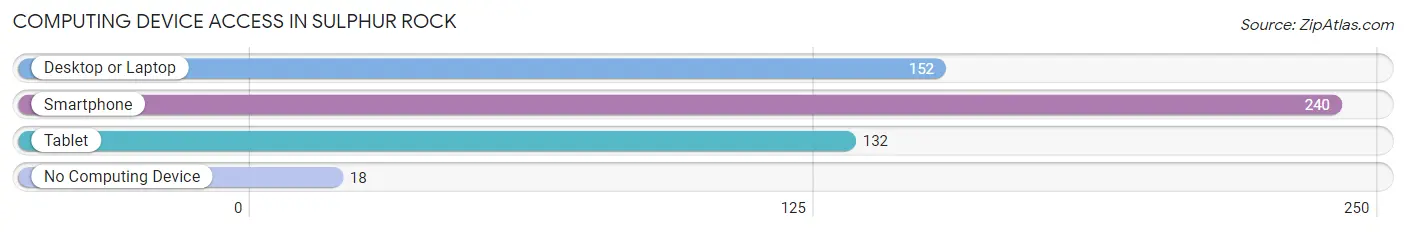
| Device Type | # Households | % Households |
| Desktop or Laptop | 152 | 58.7% |
| Smartphone | 240 | 92.7% |
| Tablet | 132 | 51.0% |
| No Computing Device | 18 | 7.0% |
| Total | 259 | 100.0% |
Internet Access in Sulphur Rock
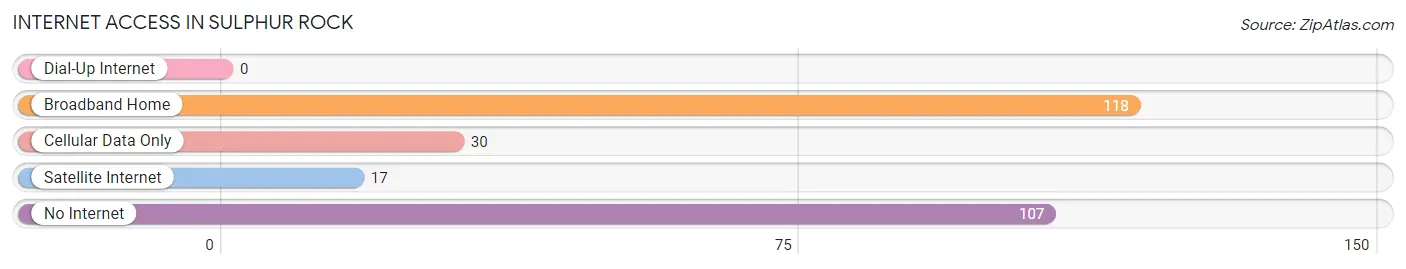
| Internet Type | # Households | % Households |
| Dial-Up Internet | 0 | 0.0% |
| Broadband Home | 118 | 45.6% |
| Cellular Data Only | 30 | 11.6% |
| Satellite Internet | 17 | 6.6% |
| No Internet | 107 | 41.3% |
| Total | 259 | 100.0% |
Sulphur Rock Summary
Sulphur Rock is a small town located in Independence County, Arkansas. It is situated in the foothills of the Ozark Mountains, approximately 20 miles south of Batesville. The town was founded in 1883 and has a population of approximately 500 people.
Geography
Sulphur Rock is located in the foothills of the Ozark Mountains, approximately 20 miles south of Batesville. The town is situated on the banks of the White River, which is a major tributary of the Mississippi River. The town is surrounded by rolling hills and forests, and is home to a variety of wildlife. The climate in Sulphur Rock is mild, with temperatures ranging from the mid-50s in the winter to the mid-80s in the summer.
Economy
The economy of Sulphur Rock is largely based on agriculture and tourism. The town is home to several small farms, which produce a variety of crops, including corn, soybeans, and cotton. The town also has a number of small businesses, including restaurants, stores, and a few small manufacturing plants. Tourism is also an important part of the local economy, as the town is home to several popular attractions, including the Sulphur Rock Museum and the White River Wildlife Refuge.
Demographics
As of the 2010 census, the population of Sulphur Rock was 498 people. The racial makeup of the town was 97.2% White, 0.6% African American, 0.2% Native American, 0.2% Asian, 0.2% from other races, and 1.8% from two or more races. The median household income was $30,938, and the median family income was $37,500. The per capita income was $17,845.
History
Sulphur Rock was founded in 1883 by a group of settlers from Tennessee. The town was named after the nearby Sulphur Springs, which were believed to have healing properties. The town quickly grew, and by the early 1900s, it had become a popular destination for tourists. The town was also home to a number of businesses, including a hotel, a general store, and a sawmill.
In the early 1900s, the town was also home to a number of churches, including the First Baptist Church, the Methodist Church, and the Presbyterian Church. The town also had a school, which was attended by students from the surrounding area.
In the late 1900s, the town began to decline, as many of the businesses and churches closed. The town also suffered from a lack of investment, as the local economy struggled. However, in recent years, the town has seen a resurgence, as new businesses have opened and the town has become a popular tourist destination.
Common Questions
What is Per Capita Income in Sulphur Rock?
Per Capita income in Sulphur Rock is $23,370.
What is the Median Family Income in Sulphur Rock?
Median Family Income in Sulphur Rock is $44,583.
What is the Median Household income in Sulphur Rock?
Median Household Income in Sulphur Rock is $44,735.
What is Income or Wage Gap in Sulphur Rock?
Income or Wage Gap in Sulphur Rock is 23.8%.
Women in Sulphur Rock earn 76.2 cents for every dollar earned by a man.
What is Family Income Deficit in Sulphur Rock?
Family Income Deficit in Sulphur Rock is $7,811.
Families that are below poverty line in Sulphur Rock earn $7,811 less on average than the poverty threshold level.
What is Inequality or Gini Index in Sulphur Rock?
Inequality or Gini Index in Sulphur Rock is 0.39.
What is the Total Population of Sulphur Rock?
Total Population of Sulphur Rock is 634.
What is the Total Male Population of Sulphur Rock?
Total Male Population of Sulphur Rock is 312.
What is the Total Female Population of Sulphur Rock?
Total Female Population of Sulphur Rock is 322.
What is the Ratio of Males per 100 Females in Sulphur Rock?
There are 96.89 Males per 100 Females in Sulphur Rock.
What is the Ratio of Females per 100 Males in Sulphur Rock?
There are 103.21 Females per 100 Males in Sulphur Rock.
What is the Median Population Age in Sulphur Rock?
Median Population Age in Sulphur Rock is 34.6 Years.
What is the Average Family Size in Sulphur Rock
Average Family Size in Sulphur Rock is 3.0 People.
What is the Average Household Size in Sulphur Rock
Average Household Size in Sulphur Rock is 2.5 People.
How Large is the Labor Force in Sulphur Rock?
There are 271 People in the Labor Forcein in Sulphur Rock.
What is the Percentage of People in the Labor Force in Sulphur Rock?
56.0% of People are in the Labor Force in Sulphur Rock.
What is the Unemployment Rate in Sulphur Rock?
Unemployment Rate in Sulphur Rock is 3.3%.