Stamps, AR Map & Demographics
Stamps Map
Stamps Overview
$19,400
PER CAPITA INCOME
$47,946
AVG FAMILY INCOME
$28,720
AVG HOUSEHOLD INCOME
5.2%
WAGE / INCOME GAP [ % ]
94.8¢/ $1
WAGE / INCOME GAP [ $ ]
$9,879
FAMILY INCOME DEFICIT
0.52
INEQUALITY / GINI INDEX
1,481
TOTAL POPULATION
669
MALE POPULATION
812
FEMALE POPULATION
82.39
MALES / 100 FEMALES
121.38
FEMALES / 100 MALES
39.6
MEDIAN AGE
3.6
AVG FAMILY SIZE
2.3
AVG HOUSEHOLD SIZE
554
LABOR FORCE [ PEOPLE ]
45.6%
PERCENT IN LABOR FORCE
19.7%
UNEMPLOYMENT RATE
Stamps Zip Codes
Stamps Area Codes
Income in Stamps
Income Overview in Stamps
Per Capita Income in Stamps is $19,400, while median incomes of families and households are $47,946 and $28,720 respectively.
| Characteristic | Number | Measure |
| Per Capita Income | 1,481 | $19,400 |
| Median Family Income | 286 | $47,946 |
| Mean Family Income | 286 | $57,563 |
| Median Household Income | 628 | $28,720 |
| Mean Household Income | 628 | $42,501 |
| Income Deficit | 286 | $9,879 |
| Wage / Income Gap (%) | 1,481 | 5.19% |
| Wage / Income Gap ($) | 1,481 | 94.81¢ per $1 |
| Gini / Inequality Index | 1,481 | 0.52 |
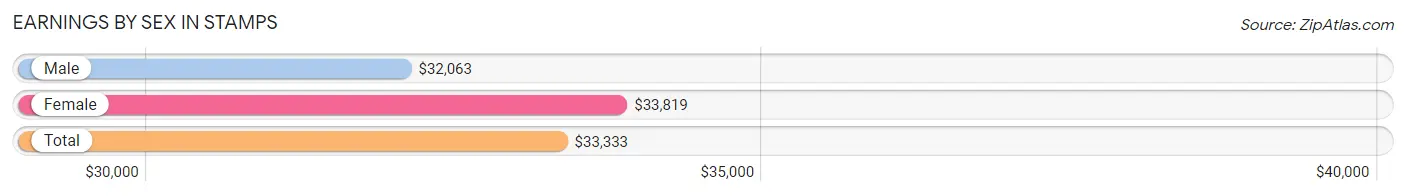
Earnings by Sex in Stamps
Average Earnings in Stamps are $33,333, $32,063 for men and $33,819 for women, a difference of 5.2%.
| Sex | Number | Average Earnings |
| Male | 237 (48.6%) | $32,063 |
| Female | 251 (51.4%) | $33,819 |
| Total | 488 (100.0%) | $33,333 |
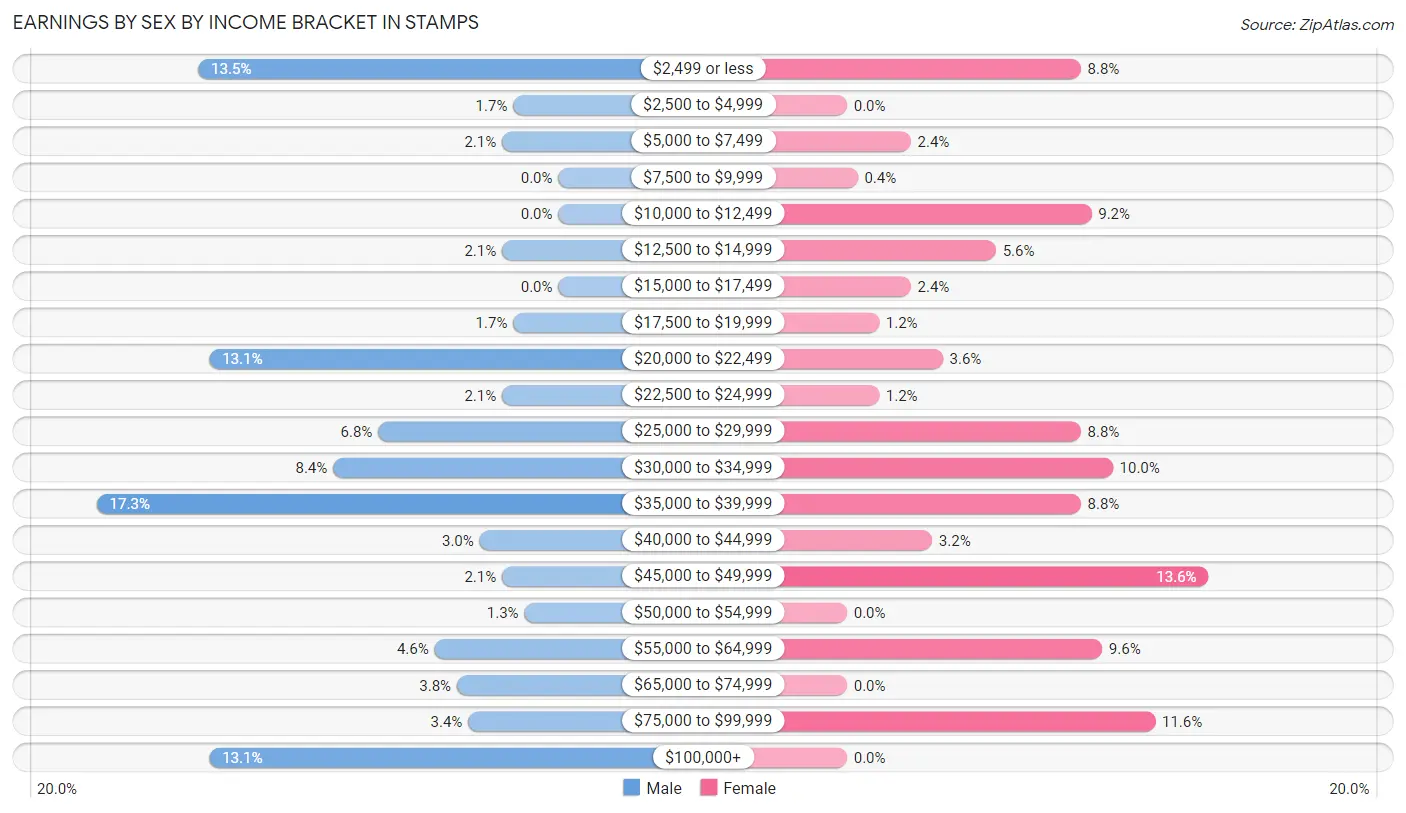
Earnings by Sex by Income Bracket in Stamps
The most common earnings brackets in Stamps are $35,000 to $39,999 for men (41 | 17.3%) and $45,000 to $49,999 for women (34 | 13.6%).
| Income | Male | Female |
| $2,499 or less | 32 (13.5%) | 22 (8.8%) |
| $2,500 to $4,999 | 4 (1.7%) | 0 (0.0%) |
| $5,000 to $7,499 | 5 (2.1%) | 6 (2.4%) |
| $7,500 to $9,999 | 0 (0.0%) | 1 (0.4%) |
| $10,000 to $12,499 | 0 (0.0%) | 23 (9.2%) |
| $12,500 to $14,999 | 5 (2.1%) | 14 (5.6%) |
| $15,000 to $17,499 | 0 (0.0%) | 6 (2.4%) |
| $17,500 to $19,999 | 4 (1.7%) | 3 (1.2%) |
| $20,000 to $22,499 | 31 (13.1%) | 9 (3.6%) |
| $22,500 to $24,999 | 5 (2.1%) | 3 (1.2%) |
| $25,000 to $29,999 | 16 (6.8%) | 22 (8.8%) |
| $30,000 to $34,999 | 20 (8.4%) | 25 (10.0%) |
| $35,000 to $39,999 | 41 (17.3%) | 22 (8.8%) |
| $40,000 to $44,999 | 7 (2.9%) | 8 (3.2%) |
| $45,000 to $49,999 | 5 (2.1%) | 34 (13.6%) |
| $50,000 to $54,999 | 3 (1.3%) | 0 (0.0%) |
| $55,000 to $64,999 | 11 (4.6%) | 24 (9.6%) |
| $65,000 to $74,999 | 9 (3.8%) | 0 (0.0%) |
| $75,000 to $99,999 | 8 (3.4%) | 29 (11.6%) |
| $100,000+ | 31 (13.1%) | 0 (0.0%) |
| Total | 237 (100.0%) | 251 (100.0%) |
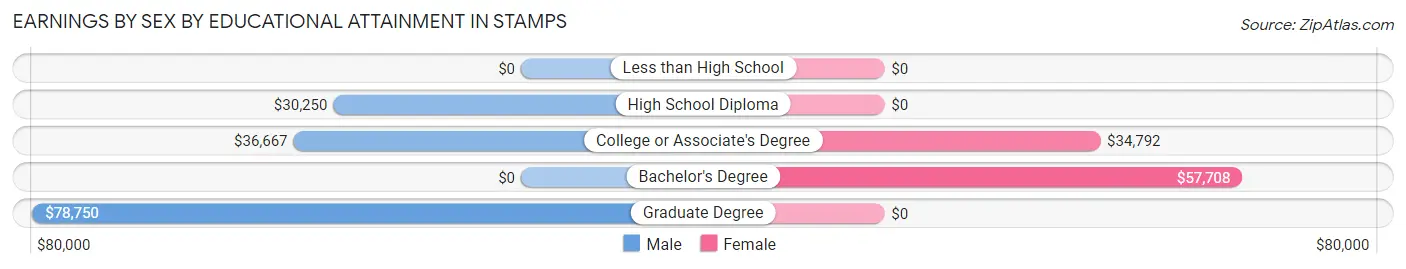
Earnings by Sex by Educational Attainment in Stamps
Average earnings in Stamps are $35,583 for men and $33,958 for women, a difference of 4.6%. Men with an educational attainment of graduate degree enjoy the highest average annual earnings of $78,750, while those with high school diploma education earn the least with $30,250. Women with an educational attainment of bachelor's degree earn the most with the average annual earnings of $57,708, while those with college or associate's degree education have the smallest earnings of $34,792.
| Educational Attainment | Male Income | Female Income |
| Less than High School | - | - |
| High School Diploma | $30,250 | $0 |
| College or Associate's Degree | $36,667 | $34,792 |
| Bachelor's Degree | - | - |
| Graduate Degree | $78,750 | $0 |
| Total | $35,583 | $33,958 |
Family Income in Stamps
Family Income Brackets in Stamps
According to the Stamps family income data, there are 48 families falling into the $35,000 to $49,999 income range, which is the most common income bracket and makes up 16.8% of all families. Conversely, the $150,000 to $199,999 income bracket is the least frequent group with only 3 families (1.1%) belonging to this category.
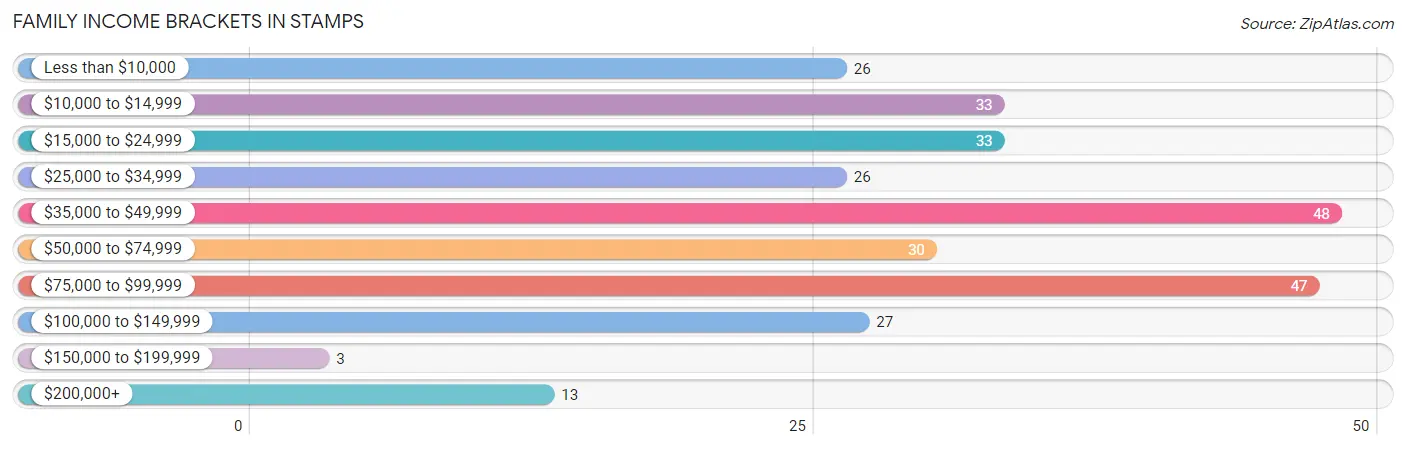
| Income Bracket | # Families | % Families |
| Less than $10,000 | 26 | 9.1% |
| $10,000 to $14,999 | 33 | 11.5% |
| $15,000 to $24,999 | 33 | 11.5% |
| $25,000 to $34,999 | 26 | 9.1% |
| $35,000 to $49,999 | 48 | 16.8% |
| $50,000 to $74,999 | 30 | 10.5% |
| $75,000 to $99,999 | 47 | 16.4% |
| $100,000 to $149,999 | 27 | 9.4% |
| $150,000 to $199,999 | 3 | 1.0% |
| $200,000+ | 13 | 4.5% |
Family Income by Famaliy Size in Stamps
5-person families (18 | 6.3%) account for the highest median family income in Stamps with $138,269 per family, while 5-person families (18 | 6.3%) have the highest median income of $27,654 per family member.
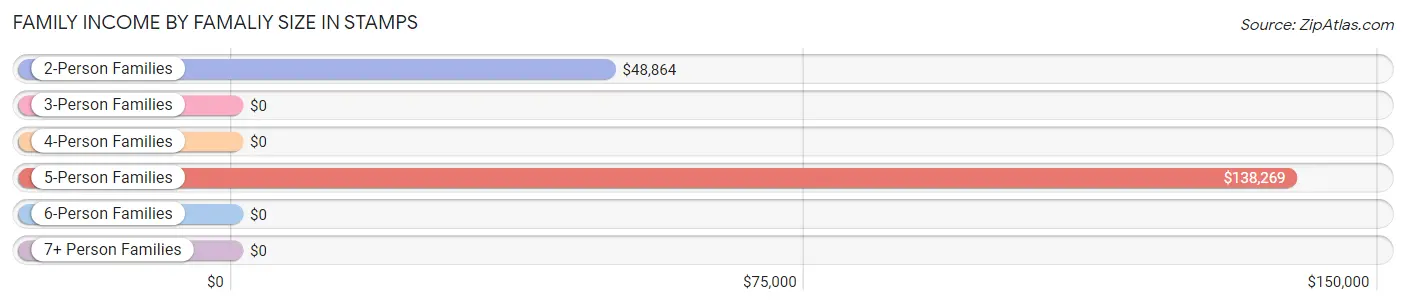
| Income Bracket | # Families | Median Income |
| 2-Person Families | 166 (58.0%) | $48,864 |
| 3-Person Families | 76 (26.6%) | $0 |
| 4-Person Families | 13 (4.5%) | $0 |
| 5-Person Families | 18 (6.3%) | $138,269 |
| 6-Person Families | 5 (1.8%) | $0 |
| 7+ Person Families | 8 (2.8%) | $0 |
| Total | 286 (100.0%) | $47,946 |
Family Income by Number of Earners in Stamps
The median family income in Stamps is $47,946, with families comprising 3+ earners (20) having the highest median family income of $138,077, while families with no earners (85) have the lowest median family income of $12,750, accounting for 7.0% and 29.7% of families, respectively.
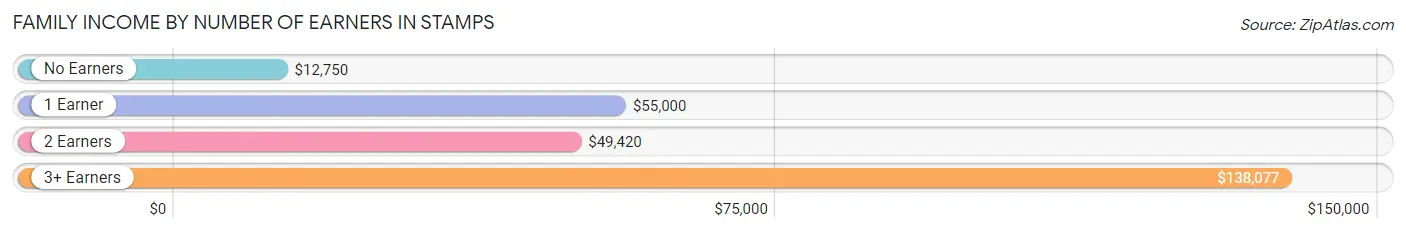
| Number of Earners | # Families | Median Income |
| No Earners | 85 (29.7%) | $12,750 |
| 1 Earner | 94 (32.9%) | $55,000 |
| 2 Earners | 87 (30.4%) | $49,420 |
| 3+ Earners | 20 (7.0%) | $138,077 |
| Total | 286 (100.0%) | $47,946 |
Household Income in Stamps
Household Income Brackets in Stamps
With 114 households falling in the category, the $10,000 to $14,999 income range is the most frequent in Stamps, accounting for 18.1% of all households. In contrast, only 3 households (0.5%) fall into the $150,000 to $199,999 income bracket, making it the least populous group.
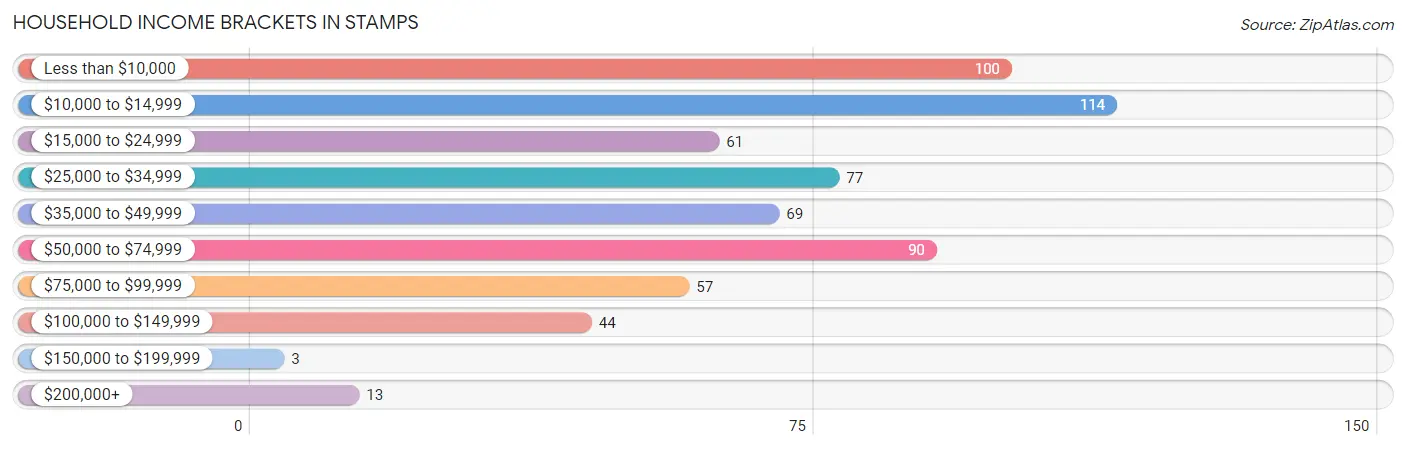
| Income Bracket | # Households | % Households |
| Less than $10,000 | 100 | 15.9% |
| $10,000 to $14,999 | 114 | 18.2% |
| $15,000 to $24,999 | 61 | 9.7% |
| $25,000 to $34,999 | 77 | 12.3% |
| $35,000 to $49,999 | 69 | 11.0% |
| $50,000 to $74,999 | 90 | 14.3% |
| $75,000 to $99,999 | 57 | 9.1% |
| $100,000 to $149,999 | 44 | 7.0% |
| $150,000 to $199,999 | 3 | 0.5% |
| $200,000+ | 13 | 2.1% |
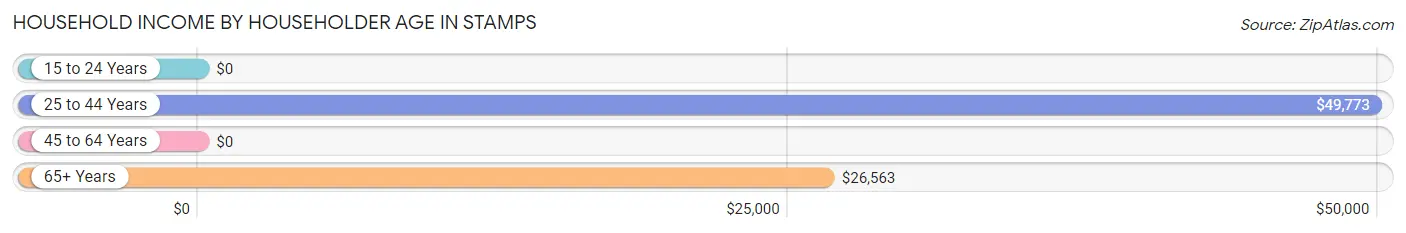
Household Income by Householder Age in Stamps
The median household income in Stamps is $28,720, with the highest median household income of $49,773 found in the 25 to 44 years age bracket for the primary householder. A total of 176 households (28.0%) fall into this category. Meanwhile, the 15 to 24 years age bracket for the primary householder has the lowest median household income of $0, with 28 households (4.5%) in this group.
| Income Bracket | # Households | Median Income |
| 15 to 24 Years | 28 (4.5%) | $0 |
| 25 to 44 Years | 176 (28.0%) | $49,773 |
| 45 to 64 Years | 190 (30.2%) | $0 |
| 65+ Years | 234 (37.3%) | $26,563 |
| Total | 628 (100.0%) | $28,720 |
Poverty in Stamps
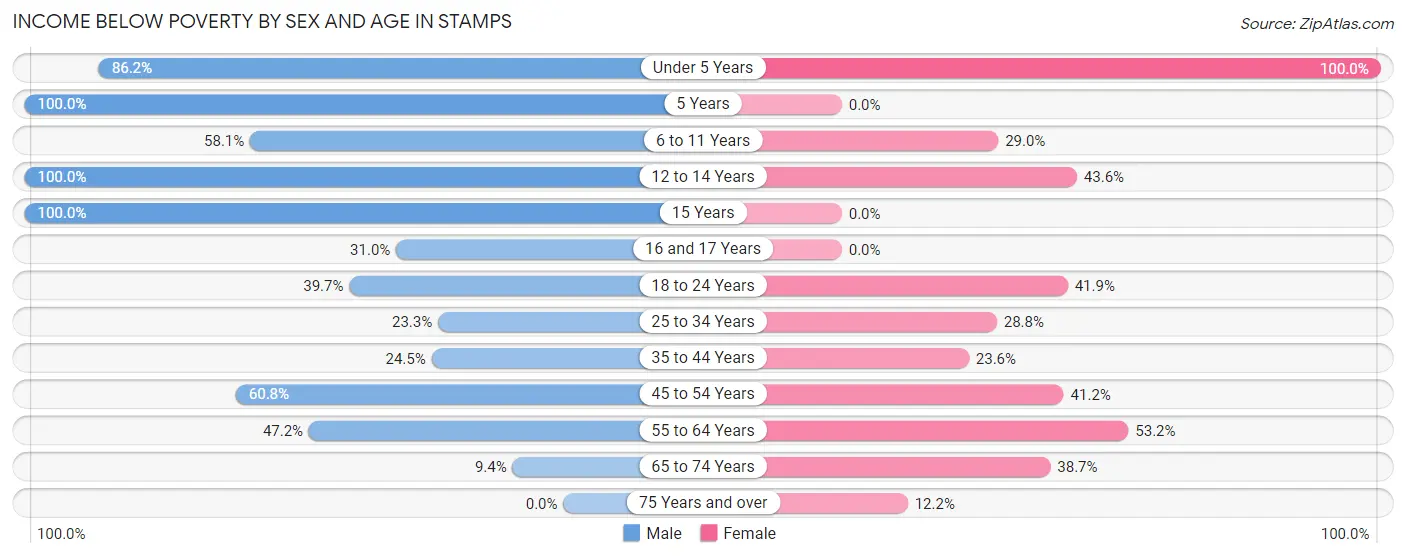
Income Below Poverty by Sex and Age in Stamps
With 38.2% poverty level for males and 36.9% for females among the residents of Stamps, 5 year old males and under 5 year old females are the most vulnerable to poverty, with 2 males (100.0%) and 27 females (100.0%) in their respective age groups living below the poverty level.
| Age Bracket | Male | Female |
| Under 5 Years | 25 (86.2%) | 27 (100.0%) |
| 5 Years | 2 (100.0%) | 0 (0.0%) |
| 6 to 11 Years | 50 (58.1%) | 9 (29.0%) |
| 12 to 14 Years | 5 (100.0%) | 24 (43.6%) |
| 15 Years | 7 (100.0%) | 0 (0.0%) |
| 16 and 17 Years | 9 (31.0%) | 0 (0.0%) |
| 18 to 24 Years | 31 (39.7%) | 39 (41.9%) |
| 25 to 34 Years | 10 (23.3%) | 21 (28.8%) |
| 35 to 44 Years | 34 (24.5%) | 29 (23.6%) |
| 45 to 54 Years | 31 (60.8%) | 42 (41.2%) |
| 55 to 64 Years | 34 (47.2%) | 25 (53.2%) |
| 65 to 74 Years | 5 (9.4%) | 60 (38.7%) |
| 75 Years and over | 0 (0.0%) | 6 (12.2%) |
| Total | 243 (38.2%) | 282 (36.9%) |
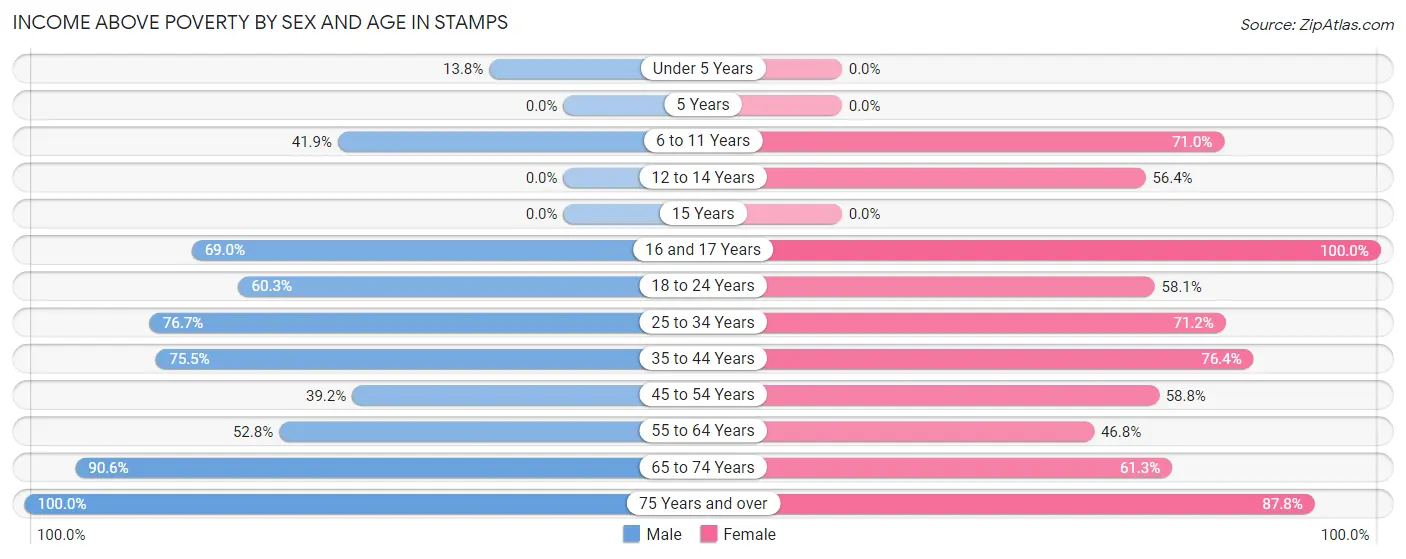
Income Above Poverty by Sex and Age in Stamps
According to the poverty statistics in Stamps, males aged 75 years and over and females aged 16 and 17 years are the age groups that are most secure financially, with 100.0% of males and 100.0% of females in these age groups living above the poverty line.
| Age Bracket | Male | Female |
| Under 5 Years | 4 (13.8%) | 0 (0.0%) |
| 5 Years | 0 (0.0%) | 0 (0.0%) |
| 6 to 11 Years | 36 (41.9%) | 22 (71.0%) |
| 12 to 14 Years | 0 (0.0%) | 31 (56.4%) |
| 15 Years | 0 (0.0%) | 0 (0.0%) |
| 16 and 17 Years | 20 (69.0%) | 9 (100.0%) |
| 18 to 24 Years | 47 (60.3%) | 54 (58.1%) |
| 25 to 34 Years | 33 (76.7%) | 52 (71.2%) |
| 35 to 44 Years | 105 (75.5%) | 94 (76.4%) |
| 45 to 54 Years | 20 (39.2%) | 60 (58.8%) |
| 55 to 64 Years | 38 (52.8%) | 22 (46.8%) |
| 65 to 74 Years | 48 (90.6%) | 95 (61.3%) |
| 75 Years and over | 43 (100.0%) | 43 (87.8%) |
| Total | 394 (61.9%) | 482 (63.1%) |
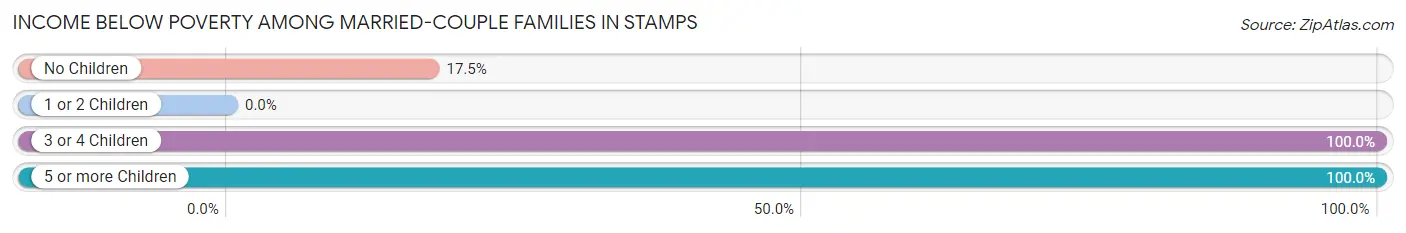
Income Below Poverty Among Married-Couple Families in Stamps
The poverty statistics for married-couple families in Stamps show that 17.9% or 26 of the total 145 families live below the poverty line. Families with 3 or 4 children have the highest poverty rate of 100.0%, comprising of 1 families. On the other hand, families with 1 or 2 children have the lowest poverty rate of 0.0%, which includes 0 families.
| Children | Above Poverty | Below Poverty |
| No Children | 94 (82.5%) | 20 (17.5%) |
| 1 or 2 Children | 25 (100.0%) | 0 (0.0%) |
| 3 or 4 Children | 0 (0.0%) | 1 (100.0%) |
| 5 or more Children | 0 (0.0%) | 5 (100.0%) |
| Total | 119 (82.1%) | 26 (17.9%) |
Income Below Poverty Among Single-Parent Households in Stamps
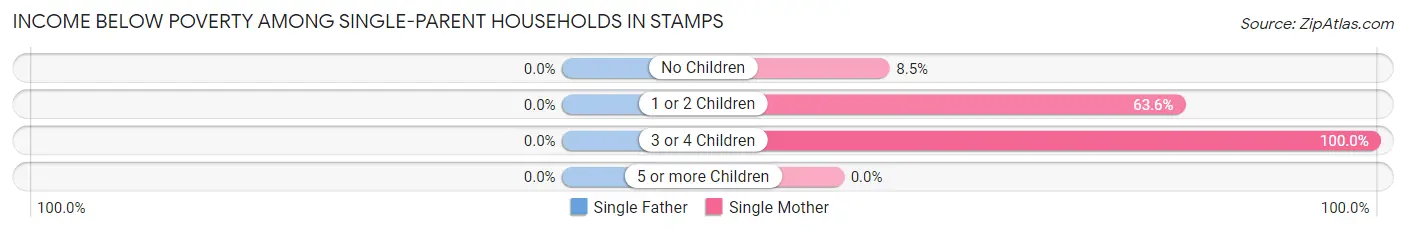
| Children | Single Father | Single Mother |
| No Children | 0 (0.0%) | 4 (8.5%) |
| 1 or 2 Children | 0 (0.0%) | 49 (63.6%) |
| 3 or 4 Children | 0 (0.0%) | 2 (100.0%) |
| 5 or more Children | 0 (0.0%) | 0 (0.0%) |
| Total | 0 (0.0%) | 55 (43.6%) |
Income Below Poverty Among Married-Couple vs Single-Parent Households in Stamps
The poverty data for Stamps shows that 26 of the married-couple family households (17.9%) and 55 of the single-parent households (39.0%) are living below the poverty level. Within the married-couple family households, those with 3 or 4 children have the highest poverty rate, with 1 households (100.0%) falling below the poverty line. Among the single-parent households, those with 3 or 4 children have the highest poverty rate, with 2 household (100.0%) living below poverty.
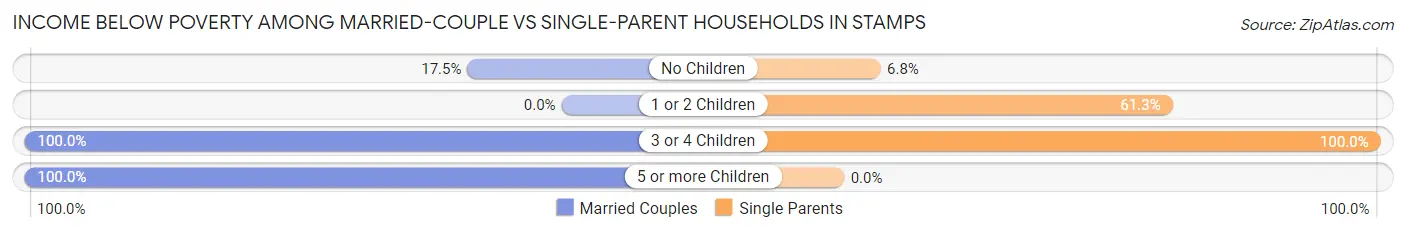
| Children | Married-Couple Families | Single-Parent Households |
| No Children | 20 (17.5%) | 4 (6.8%) |
| 1 or 2 Children | 0 (0.0%) | 49 (61.3%) |
| 3 or 4 Children | 1 (100.0%) | 2 (100.0%) |
| 5 or more Children | 5 (100.0%) | 0 (0.0%) |
| Total | 26 (17.9%) | 55 (39.0%) |
Race in Stamps
The most populous races in Stamps are Black / African American (907 | 61.2%), White / Caucasian (441 | 29.8%), and Two or more Races (82 | 5.5%).
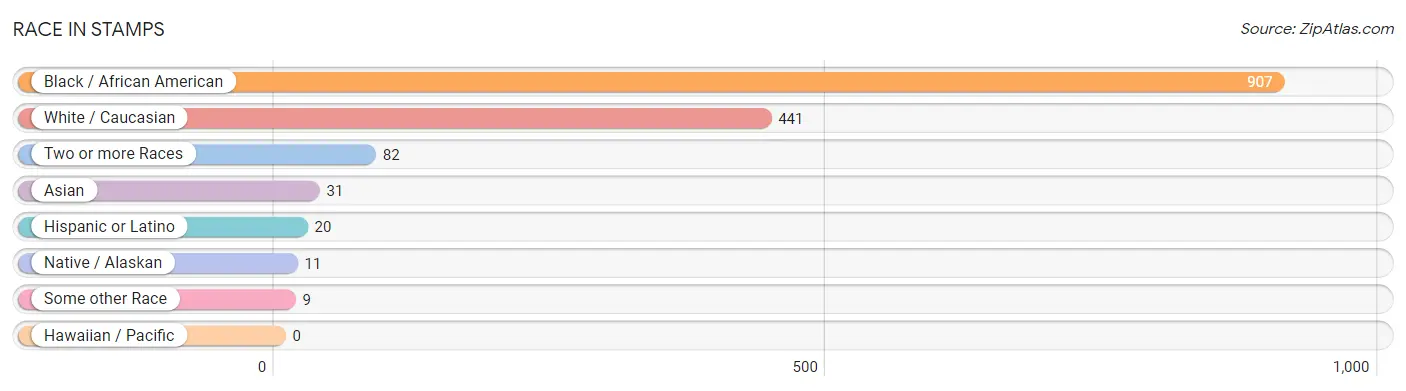
| Race | # Population | % Population |
| Asian | 31 | 2.1% |
| Black / African American | 907 | 61.2% |
| Hawaiian / Pacific | 0 | 0.0% |
| Hispanic or Latino | 20 | 1.3% |
| Native / Alaskan | 11 | 0.7% |
| White / Caucasian | 441 | 29.8% |
| Two or more Races | 82 | 5.5% |
| Some other Race | 9 | 0.6% |
| Total | 1,481 | 100.0% |
Ancestry in Stamps
The most populous ancestries reported in Stamps are American (243 | 16.4%), English (52 | 3.5%), German (31 | 2.1%), Japanese (31 | 2.1%), and Irish (26 | 1.8%), together accounting for 25.9% of all Stamps residents.
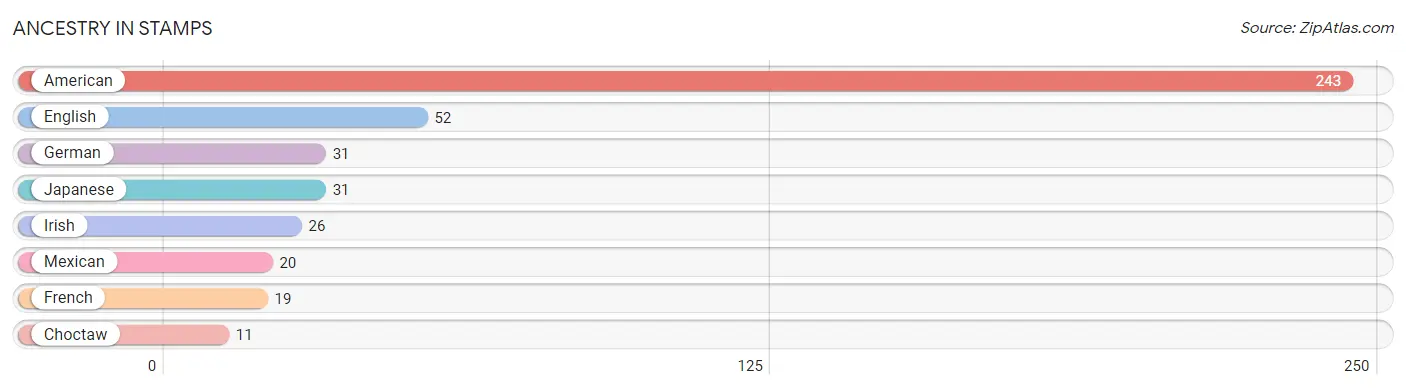
| Ancestry | # Population | % Population |
| American | 243 | 16.4% |
| Choctaw | 11 | 0.7% |
| English | 52 | 3.5% |
| French | 19 | 1.3% |
| German | 31 | 2.1% |
| Irish | 26 | 1.8% |
| Japanese | 31 | 2.1% |
| Mexican | 20 | 1.3% | View All 8 Rows |
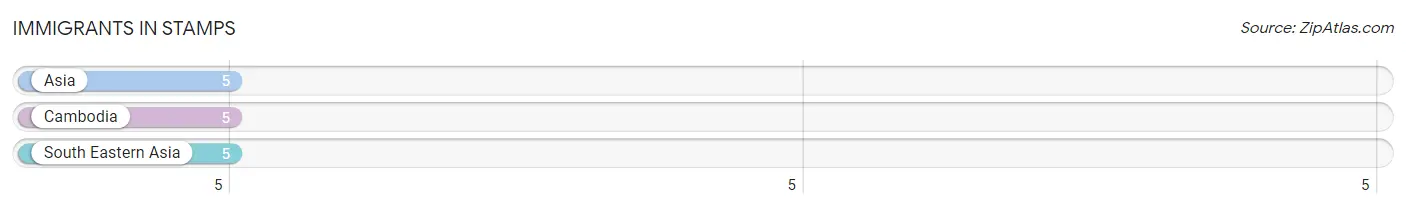
Immigrants in Stamps
The most numerous immigrant groups reported in Stamps came from Asia (5 | 0.3%), Cambodia (5 | 0.3%), and South Eastern Asia (5 | 0.3%), together accounting for 1.0% of all Stamps residents.
| Immigration Origin | # Population | % Population |
| Asia | 5 | 0.3% |
| Cambodia | 5 | 0.3% |
| South Eastern Asia | 5 | 0.3% | View All 3 Rows |
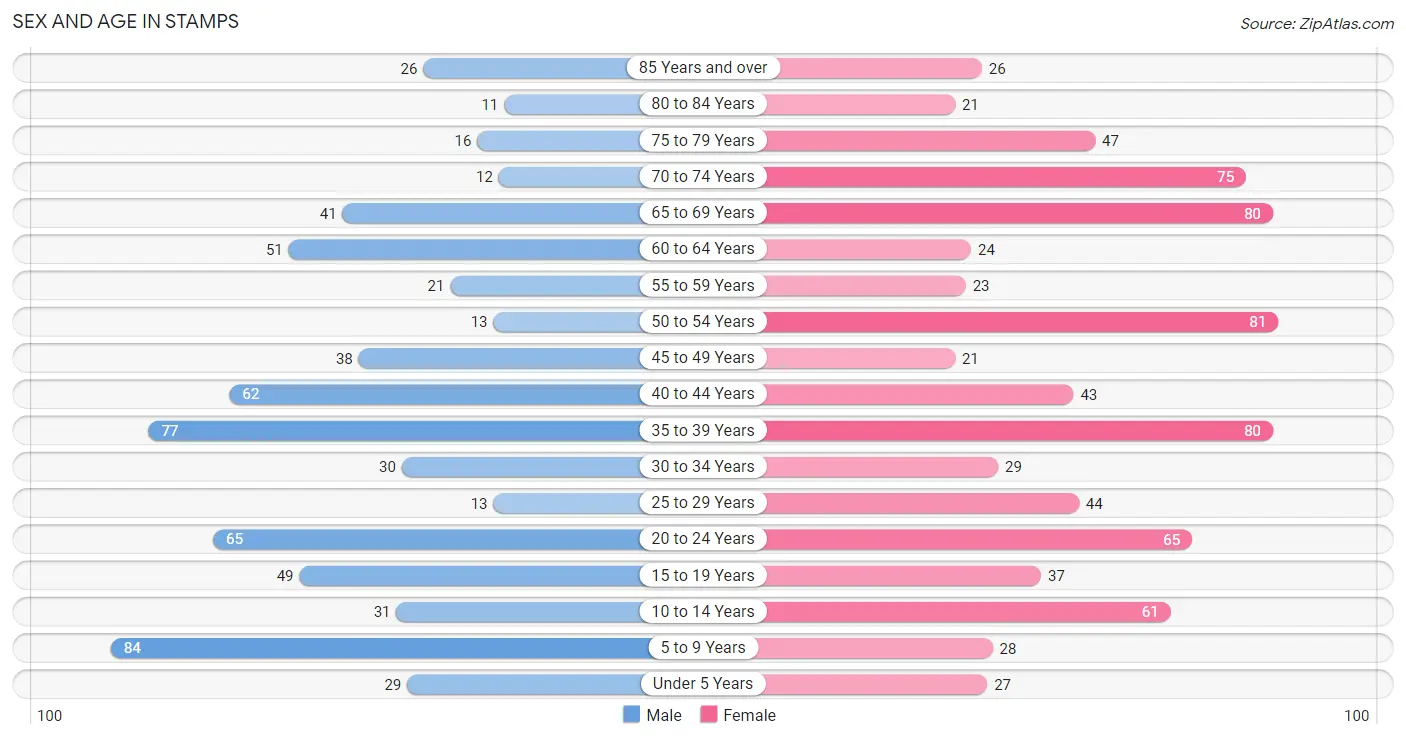
Sex and Age in Stamps
Sex and Age in Stamps
The most populous age groups in Stamps are 5 to 9 Years (84 | 12.6%) for men and 50 to 54 Years (81 | 10.0%) for women.
| Age Bracket | Male | Female |
| Under 5 Years | 29 (4.3%) | 27 (3.3%) |
| 5 to 9 Years | 84 (12.6%) | 28 (3.5%) |
| 10 to 14 Years | 31 (4.6%) | 61 (7.5%) |
| 15 to 19 Years | 49 (7.3%) | 37 (4.6%) |
| 20 to 24 Years | 65 (9.7%) | 65 (8.0%) |
| 25 to 29 Years | 13 (1.9%) | 44 (5.4%) |
| 30 to 34 Years | 30 (4.5%) | 29 (3.6%) |
| 35 to 39 Years | 77 (11.5%) | 80 (9.9%) |
| 40 to 44 Years | 62 (9.3%) | 43 (5.3%) |
| 45 to 49 Years | 38 (5.7%) | 21 (2.6%) |
| 50 to 54 Years | 13 (1.9%) | 81 (10.0%) |
| 55 to 59 Years | 21 (3.1%) | 23 (2.8%) |
| 60 to 64 Years | 51 (7.6%) | 24 (3.0%) |
| 65 to 69 Years | 41 (6.1%) | 80 (9.9%) |
| 70 to 74 Years | 12 (1.8%) | 75 (9.2%) |
| 75 to 79 Years | 16 (2.4%) | 47 (5.8%) |
| 80 to 84 Years | 11 (1.6%) | 21 (2.6%) |
| 85 Years and over | 26 (3.9%) | 26 (3.2%) |
| Total | 669 (100.0%) | 812 (100.0%) |
Families and Households in Stamps
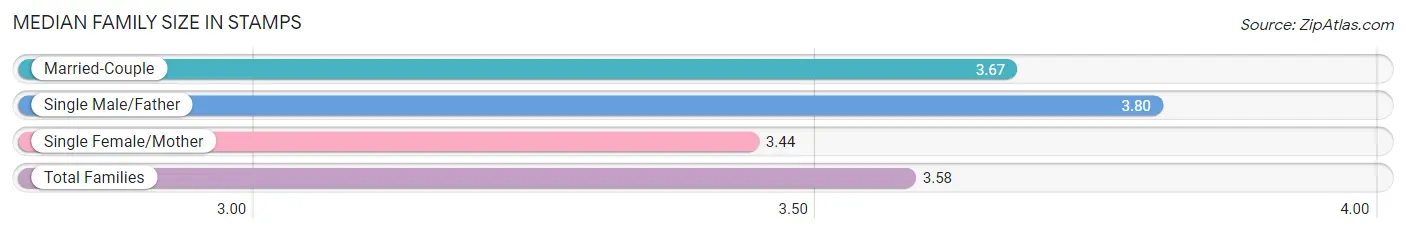
Median Family Size in Stamps
The median family size in Stamps is 3.58 persons per family, with single male/father families (15 | 5.2%) accounting for the largest median family size of 3.8 persons per family. On the other hand, single female/mother families (126 | 44.1%) represent the smallest median family size with 3.44 persons per family.
| Family Type | # Families | Family Size |
| Married-Couple | 145 (50.7%) | 3.67 |
| Single Male/Father | 15 (5.2%) | 3.80 |
| Single Female/Mother | 126 (44.1%) | 3.44 |
| Total Families | 286 (100.0%) | 3.58 |
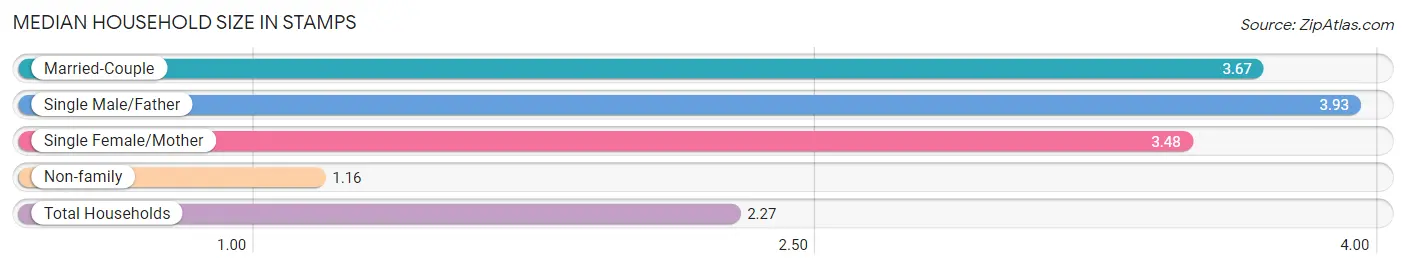
Median Household Size in Stamps
The median household size in Stamps is 2.27 persons per household, with single male/father households (15 | 2.4%) accounting for the largest median household size of 3.93 persons per household. non-family households (342 | 54.5%) represent the smallest median household size with 1.16 persons per household.
| Household Type | # Households | Household Size |
| Married-Couple | 145 (23.1%) | 3.67 |
| Single Male/Father | 15 (2.4%) | 3.93 |
| Single Female/Mother | 126 (20.1%) | 3.48 |
| Non-family | 342 (54.5%) | 1.16 |
| Total Households | 628 (100.0%) | 2.27 |
Household Size by Marriage Status in Stamps
Out of a total of 628 households in Stamps, 286 (45.5%) are family households, while 342 (54.5%) are nonfamily households. The most numerous type of family households are 2-person households, comprising 159, and the most common type of nonfamily households are 1-person households, comprising 311.
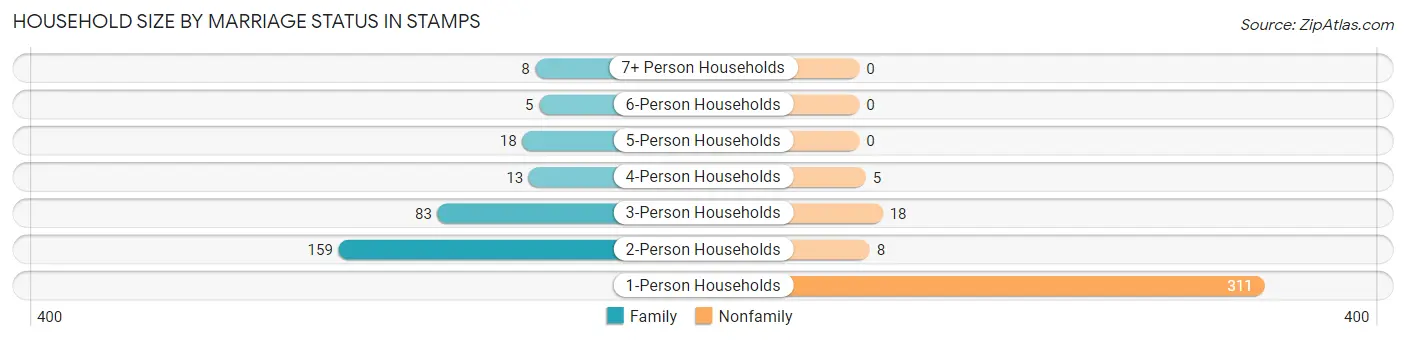
| Household Size | Family Households | Nonfamily Households |
| 1-Person Households | - | 311 (49.5%) |
| 2-Person Households | 159 (25.3%) | 8 (1.3%) |
| 3-Person Households | 83 (13.2%) | 18 (2.9%) |
| 4-Person Households | 13 (2.1%) | 5 (0.8%) |
| 5-Person Households | 18 (2.9%) | 0 (0.0%) |
| 6-Person Households | 5 (0.8%) | 0 (0.0%) |
| 7+ Person Households | 8 (1.3%) | 0 (0.0%) |
| Total | 286 (45.5%) | 342 (54.5%) |
Female Fertility in Stamps
Fertility by Age in Stamps
Average fertility rate in Stamps is 88.0 births per 1,000 women. Women in the age bracket of 35 to 50 years have the highest fertility rate with 128.0 births per 1,000 women. Women in the age bracket of 35 to 50 years acount for 75.0% of all women with births.
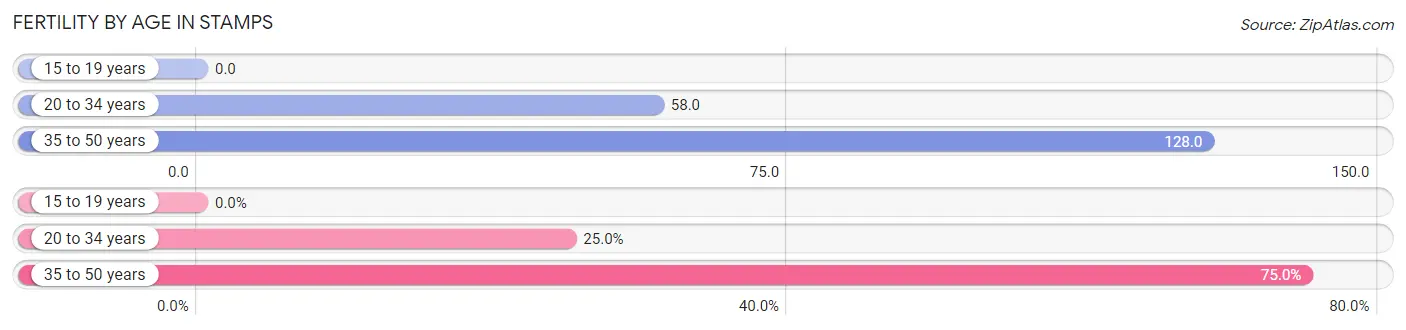
| Age Bracket | Women with Births | Births / 1,000 Women |
| 15 to 19 years | 0 (0.0%) | 0.0 |
| 20 to 34 years | 8 (25.0%) | 58.0 |
| 35 to 50 years | 24 (75.0%) | 128.0 |
| Total | 32 (100.0%) | 88.0 |
Fertility by Age by Marriage Status in Stamps
25.0% of women with births (32) in Stamps are married. The highest percentage of unmarried women with births falls into 20 to 34 years age bracket with 75.0% of them unmarried at the time of birth, while the lowest percentage of unmarried women with births belong to 20 to 34 years age bracket with 75.0% of them unmarried.
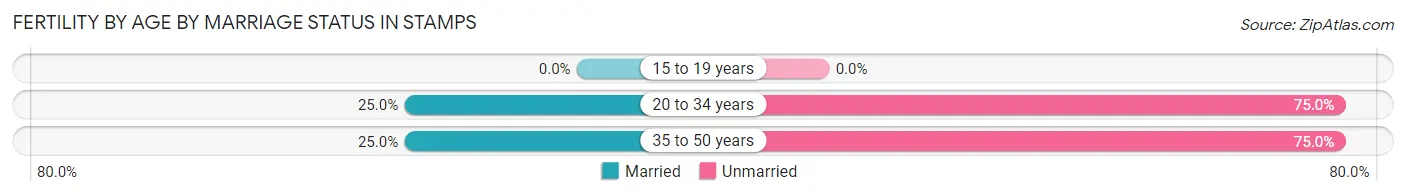
| Age Bracket | Married | Unmarried |
| 15 to 19 years | 0 (0.0%) | 0 (0.0%) |
| 20 to 34 years | 2 (25.0%) | 6 (75.0%) |
| 35 to 50 years | 6 (25.0%) | 18 (75.0%) |
| Total | 8 (25.0%) | 24 (75.0%) |
Fertility by Education in Stamps
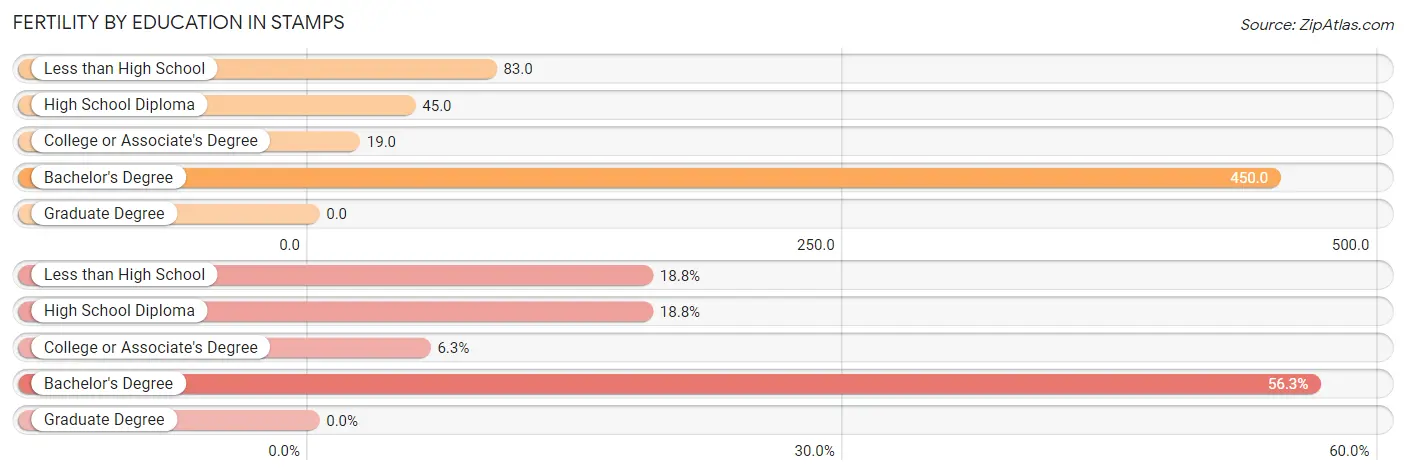
| Educational Attainment | Women with Births | Births / 1,000 Women |
| Less than High School | 6 (18.8%) | 83.0 |
| High School Diploma | 6 (18.8%) | 45.0 |
| College or Associate's Degree | 2 (6.2%) | 19.0 |
| Bachelor's Degree | 18 (56.2%) | 450.0 |
| Graduate Degree | 0 (0.0%) | 0.0 |
| Total | 32 (100.0%) | 88.0 |
Fertility by Education by Marriage Status in Stamps
75.0% of women with births in Stamps are unmarried. Women with the educational attainment of high school diploma are most likely to be married with 100.0% of them married at childbirth, while women with the educational attainment of less than high school are least likely to be married with 100.0% of them unmarried at childbirth.
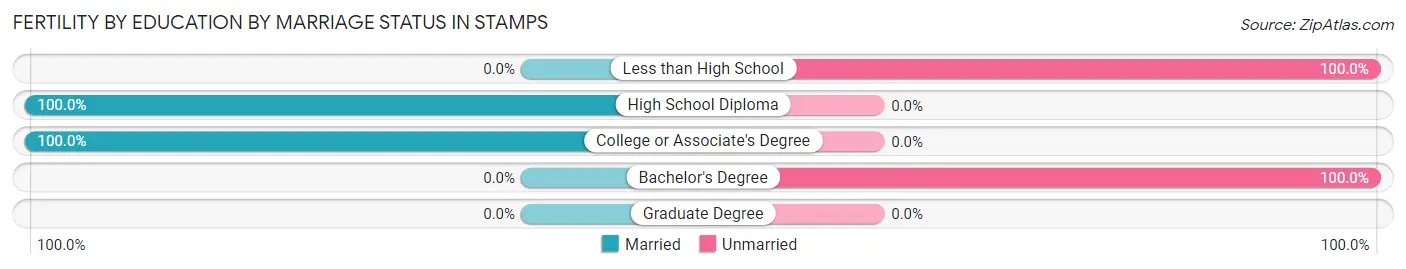
| Educational Attainment | Married | Unmarried |
| Less than High School | 0 (0.0%) | 6 (100.0%) |
| High School Diploma | 6 (100.0%) | 0 (0.0%) |
| College or Associate's Degree | 2 (100.0%) | 0 (0.0%) |
| Bachelor's Degree | 0 (0.0%) | 18 (100.0%) |
| Graduate Degree | 0 (0.0%) | 0 (0.0%) |
| Total | 8 (25.0%) | 24 (75.0%) |
Employment Characteristics in Stamps
Employment by Class of Employer in Stamps
Among the 425 employed individuals in Stamps, private company employees (324 | 76.2%), local government employees (36 | 8.5%), and not-for-profit organizations (35 | 8.2%) make up the most common classes of employment.
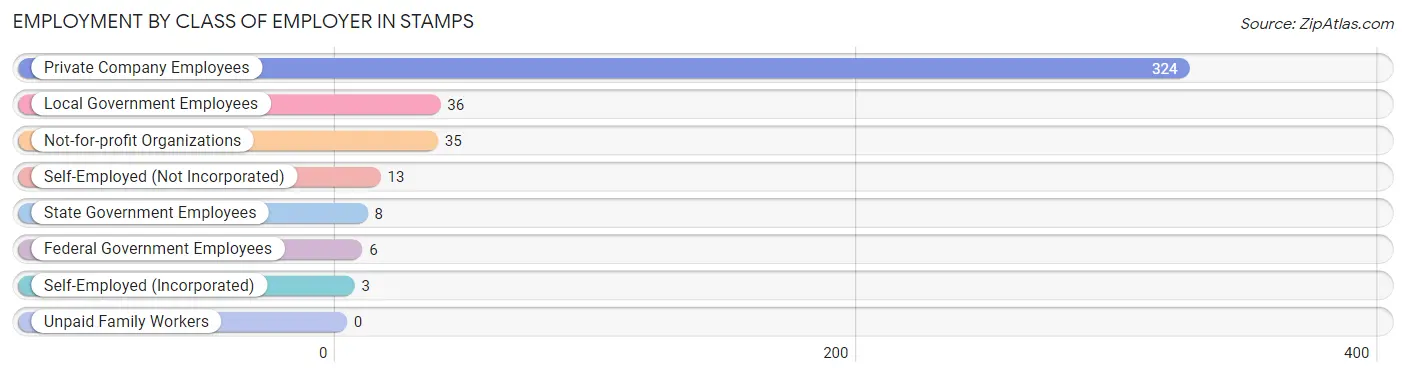
| Employer Class | # Employees | % Employees |
| Private Company Employees | 324 | 76.2% |
| Self-Employed (Incorporated) | 3 | 0.7% |
| Self-Employed (Not Incorporated) | 13 | 3.1% |
| Not-for-profit Organizations | 35 | 8.2% |
| Local Government Employees | 36 | 8.5% |
| State Government Employees | 8 | 1.9% |
| Federal Government Employees | 6 | 1.4% |
| Unpaid Family Workers | 0 | 0.0% |
| Total | 425 | 100.0% |
Employment Status by Age in Stamps
According to the labor force statistics for Stamps, out of the total population over 16 years of age (1,214), 45.6% or 554 individuals are in the labor force, with 19.7% or 109 of them unemployed. The age group with the highest labor force participation rate is 35 to 44 years, with 77.9% or 204 individuals in the labor force. Within the labor force, the 30 to 34 years age range has the highest percentage of unemployed individuals, with 37.5% or 15 of them being unemployed.
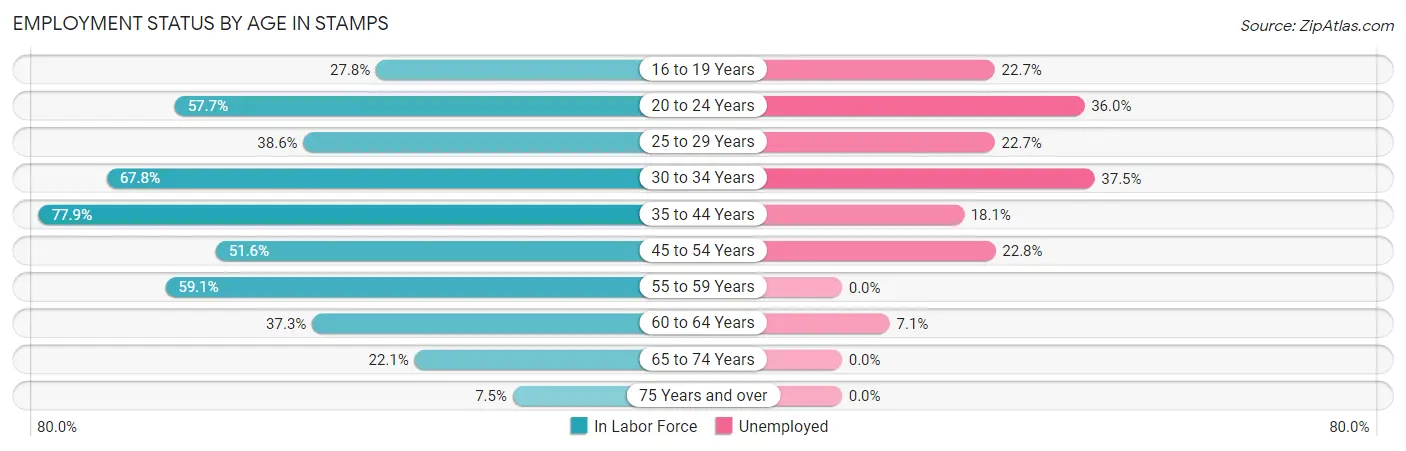
| Age Bracket | In Labor Force | Unemployed |
| 16 to 19 Years | 22 (27.8%) | 5 (22.7%) |
| 20 to 24 Years | 75 (57.7%) | 27 (36.0%) |
| 25 to 29 Years | 22 (38.6%) | 5 (22.7%) |
| 30 to 34 Years | 40 (67.8%) | 15 (37.5%) |
| 35 to 44 Years | 204 (77.9%) | 37 (18.1%) |
| 45 to 54 Years | 79 (51.6%) | 18 (22.8%) |
| 55 to 59 Years | 26 (59.1%) | 0 (0.0%) |
| 60 to 64 Years | 28 (37.3%) | 2 (7.1%) |
| 65 to 74 Years | 46 (22.1%) | 0 (0.0%) |
| 75 Years and over | 11 (7.5%) | 0 (0.0%) |
| Total | 554 (45.6%) | 109 (19.7%) |
Employment Status by Educational Attainment in Stamps
According to labor force statistics for Stamps, 61.4% of individuals (399) out of the total population between 25 and 64 years of age (650) are in the labor force, with 19.3% or 77 of them being unemployed. The group with the highest labor force participation rate are those with the educational attainment of college / associate degree, with 90.5% or 191 individuals in the labor force. Within the labor force, individuals with college / associate degree education have the highest percentage of unemployment, with 23.6% or 45 of them being unemployed.
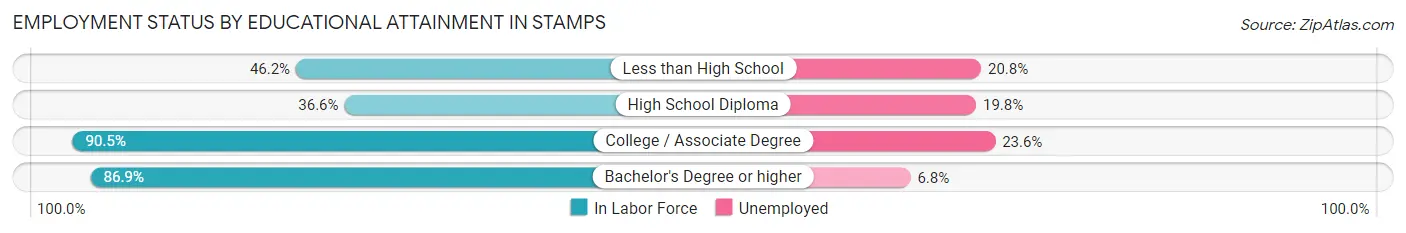
| Educational Attainment | In Labor Force | Unemployed |
| Less than High School | 24 (46.2%) | 11 (20.8%) |
| High School Diploma | 111 (36.6%) | 60 (19.8%) |
| College / Associate Degree | 191 (90.5%) | 50 (23.6%) |
| Bachelor's Degree or higher | 73 (86.9%) | 6 (6.8%) |
| Total | 399 (61.4%) | 125 (19.3%) |
Employment Occupations by Sex in Stamps
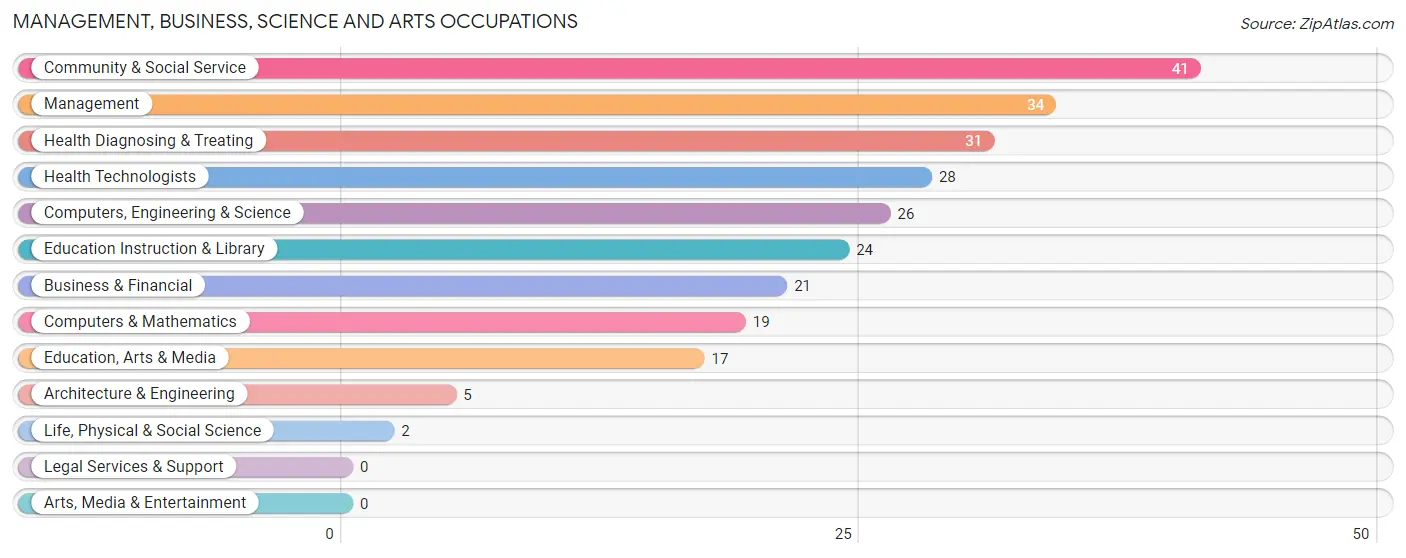
Management, Business, Science and Arts Occupations
The most common Management, Business, Science and Arts occupations in Stamps are Community & Social Service (41 | 9.2%), Management (34 | 7.7%), Health Diagnosing & Treating (31 | 7.0%), Health Technologists (28 | 6.3%), and Computers, Engineering & Science (26 | 5.9%).
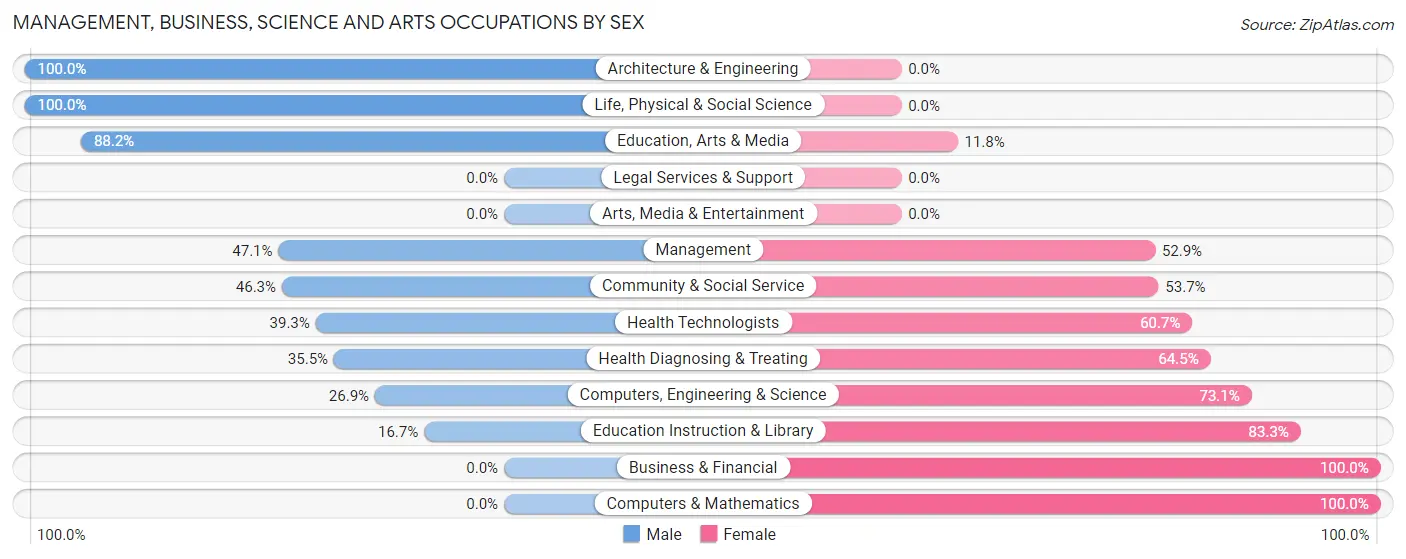
Management, Business, Science and Arts Occupations by Sex
Within the Management, Business, Science and Arts occupations in Stamps, the most male-oriented occupations are Architecture & Engineering (100.0%), Life, Physical & Social Science (100.0%), and Education, Arts & Media (88.2%), while the most female-oriented occupations are Business & Financial (100.0%), Computers & Mathematics (100.0%), and Education Instruction & Library (83.3%).
| Occupation | Male | Female |
| Management | 16 (47.1%) | 18 (52.9%) |
| Business & Financial | 0 (0.0%) | 21 (100.0%) |
| Computers, Engineering & Science | 7 (26.9%) | 19 (73.1%) |
| Computers & Mathematics | 0 (0.0%) | 19 (100.0%) |
| Architecture & Engineering | 5 (100.0%) | 0 (0.0%) |
| Life, Physical & Social Science | 2 (100.0%) | 0 (0.0%) |
| Community & Social Service | 19 (46.3%) | 22 (53.7%) |
| Education, Arts & Media | 15 (88.2%) | 2 (11.8%) |
| Legal Services & Support | 0 (0.0%) | 0 (0.0%) |
| Education Instruction & Library | 4 (16.7%) | 20 (83.3%) |
| Arts, Media & Entertainment | 0 (0.0%) | 0 (0.0%) |
| Health Diagnosing & Treating | 11 (35.5%) | 20 (64.5%) |
| Health Technologists | 11 (39.3%) | 17 (60.7%) |
| Total (Category) | 53 (34.6%) | 100 (65.4%) |
| Total (Overall) | 204 (46.0%) | 240 (54.0%) |
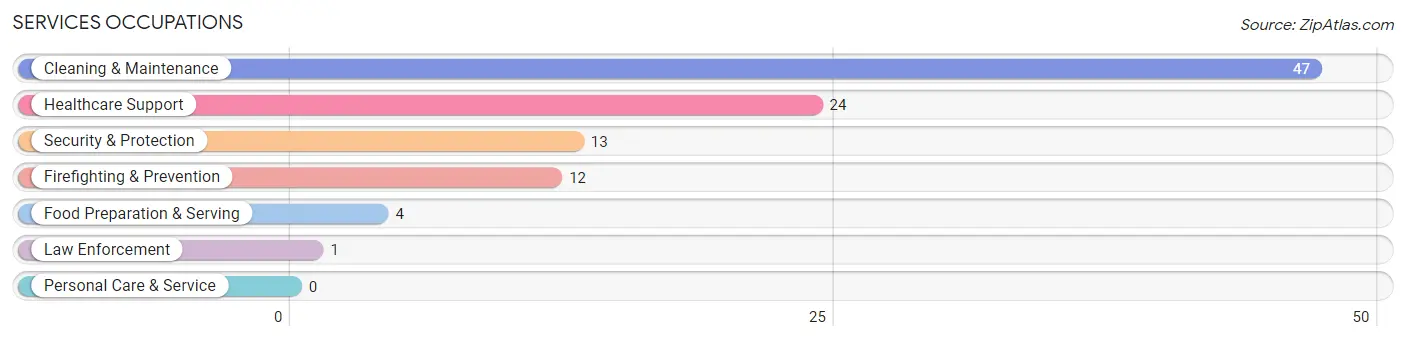
Services Occupations
The most common Services occupations in Stamps are Cleaning & Maintenance (47 | 10.6%), Healthcare Support (24 | 5.4%), Security & Protection (13 | 2.9%), Firefighting & Prevention (12 | 2.7%), and Food Preparation & Serving (4 | 0.9%).
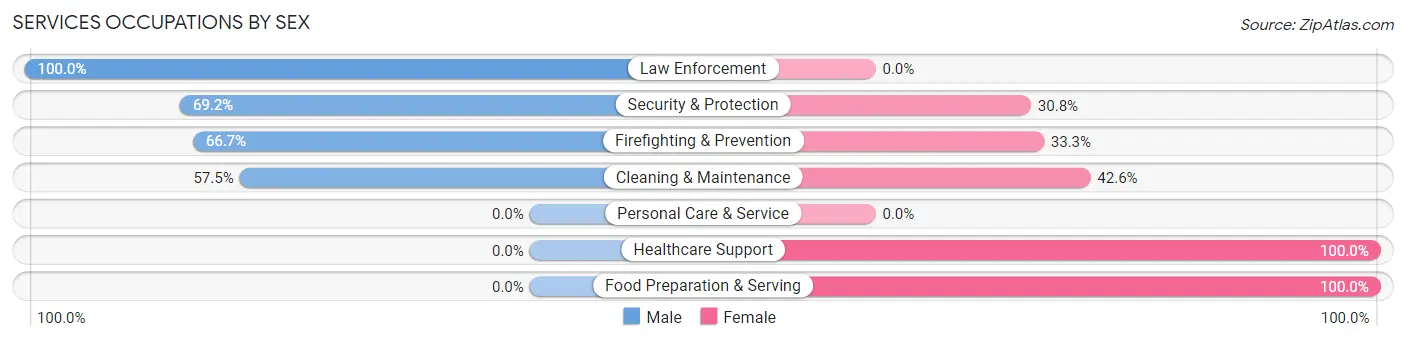
Services Occupations by Sex
Within the Services occupations in Stamps, the most male-oriented occupations are Law Enforcement (100.0%), Security & Protection (69.2%), and Firefighting & Prevention (66.7%), while the most female-oriented occupations are Healthcare Support (100.0%), Food Preparation & Serving (100.0%), and Cleaning & Maintenance (42.5%).
| Occupation | Male | Female |
| Healthcare Support | 0 (0.0%) | 24 (100.0%) |
| Security & Protection | 9 (69.2%) | 4 (30.8%) |
| Firefighting & Prevention | 8 (66.7%) | 4 (33.3%) |
| Law Enforcement | 1 (100.0%) | 0 (0.0%) |
| Food Preparation & Serving | 0 (0.0%) | 4 (100.0%) |
| Cleaning & Maintenance | 27 (57.5%) | 20 (42.5%) |
| Personal Care & Service | 0 (0.0%) | 0 (0.0%) |
| Total (Category) | 36 (40.9%) | 52 (59.1%) |
| Total (Overall) | 204 (46.0%) | 240 (54.0%) |
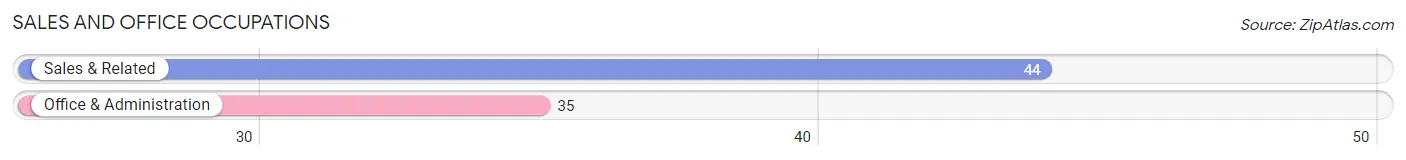
Sales and Office Occupations
The most common Sales and Office occupations in Stamps are Sales & Related (44 | 9.9%), and Office & Administration (35 | 7.9%).
Sales and Office Occupations by Sex
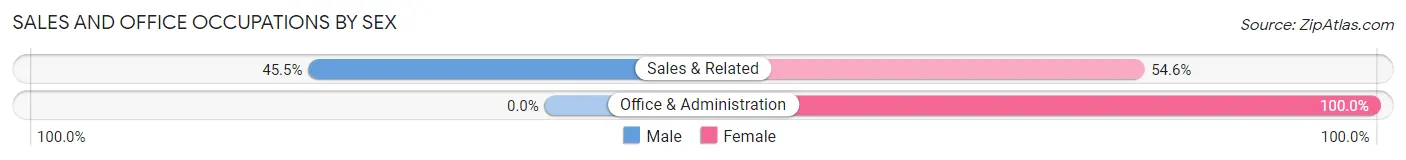
| Occupation | Male | Female |
| Sales & Related | 20 (45.5%) | 24 (54.5%) |
| Office & Administration | 0 (0.0%) | 35 (100.0%) |
| Total (Category) | 20 (25.3%) | 59 (74.7%) |
| Total (Overall) | 204 (46.0%) | 240 (54.0%) |
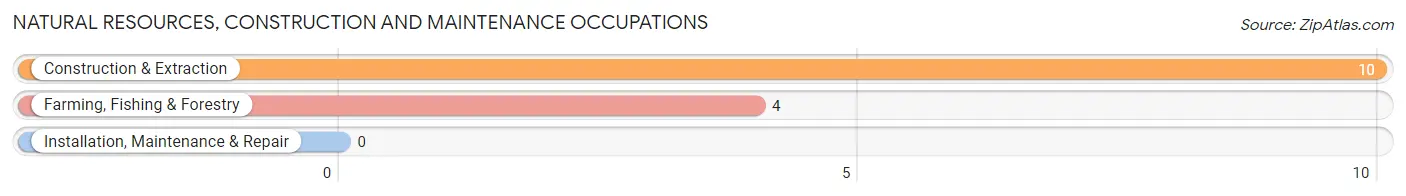
Natural Resources, Construction and Maintenance Occupations
The most common Natural Resources, Construction and Maintenance occupations in Stamps are Construction & Extraction (10 | 2.2%), and Farming, Fishing & Forestry (4 | 0.9%).
Natural Resources, Construction and Maintenance Occupations by Sex
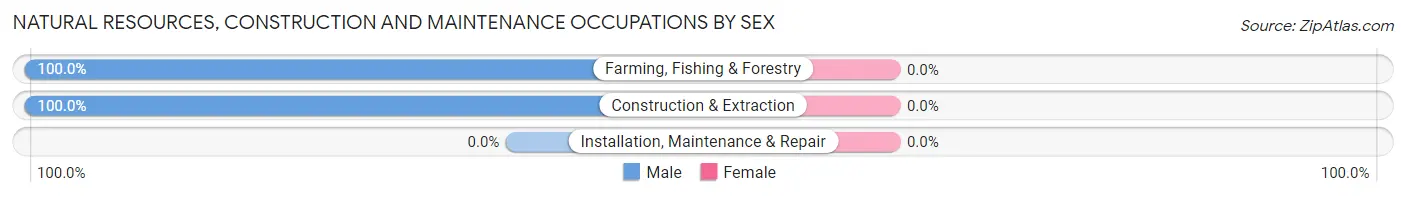
| Occupation | Male | Female |
| Farming, Fishing & Forestry | 4 (100.0%) | 0 (0.0%) |
| Construction & Extraction | 10 (100.0%) | 0 (0.0%) |
| Installation, Maintenance & Repair | 0 (0.0%) | 0 (0.0%) |
| Total (Category) | 14 (100.0%) | 0 (0.0%) |
| Total (Overall) | 204 (46.0%) | 240 (54.0%) |
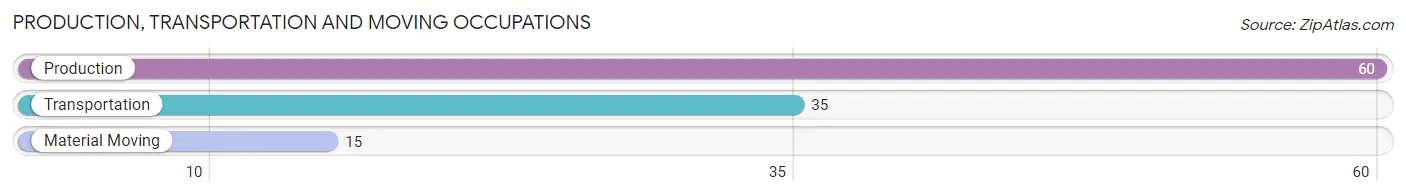
Production, Transportation and Moving Occupations
The most common Production, Transportation and Moving occupations in Stamps are Production (60 | 13.5%), Transportation (35 | 7.9%), and Material Moving (15 | 3.4%).
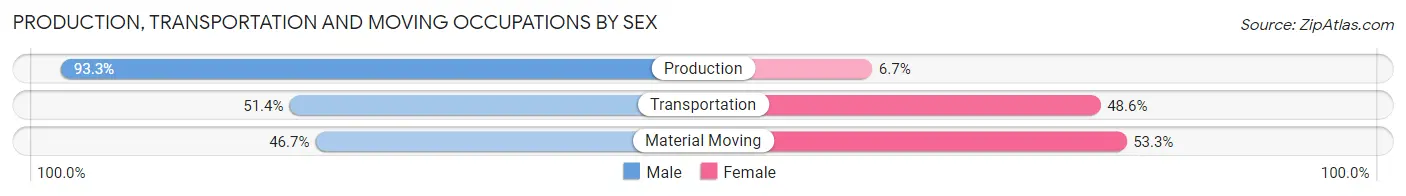
Production, Transportation and Moving Occupations by Sex
| Occupation | Male | Female |
| Production | 56 (93.3%) | 4 (6.7%) |
| Transportation | 18 (51.4%) | 17 (48.6%) |
| Material Moving | 7 (46.7%) | 8 (53.3%) |
| Total (Category) | 81 (73.6%) | 29 (26.4%) |
| Total (Overall) | 204 (46.0%) | 240 (54.0%) |
Employment Industries by Sex in Stamps
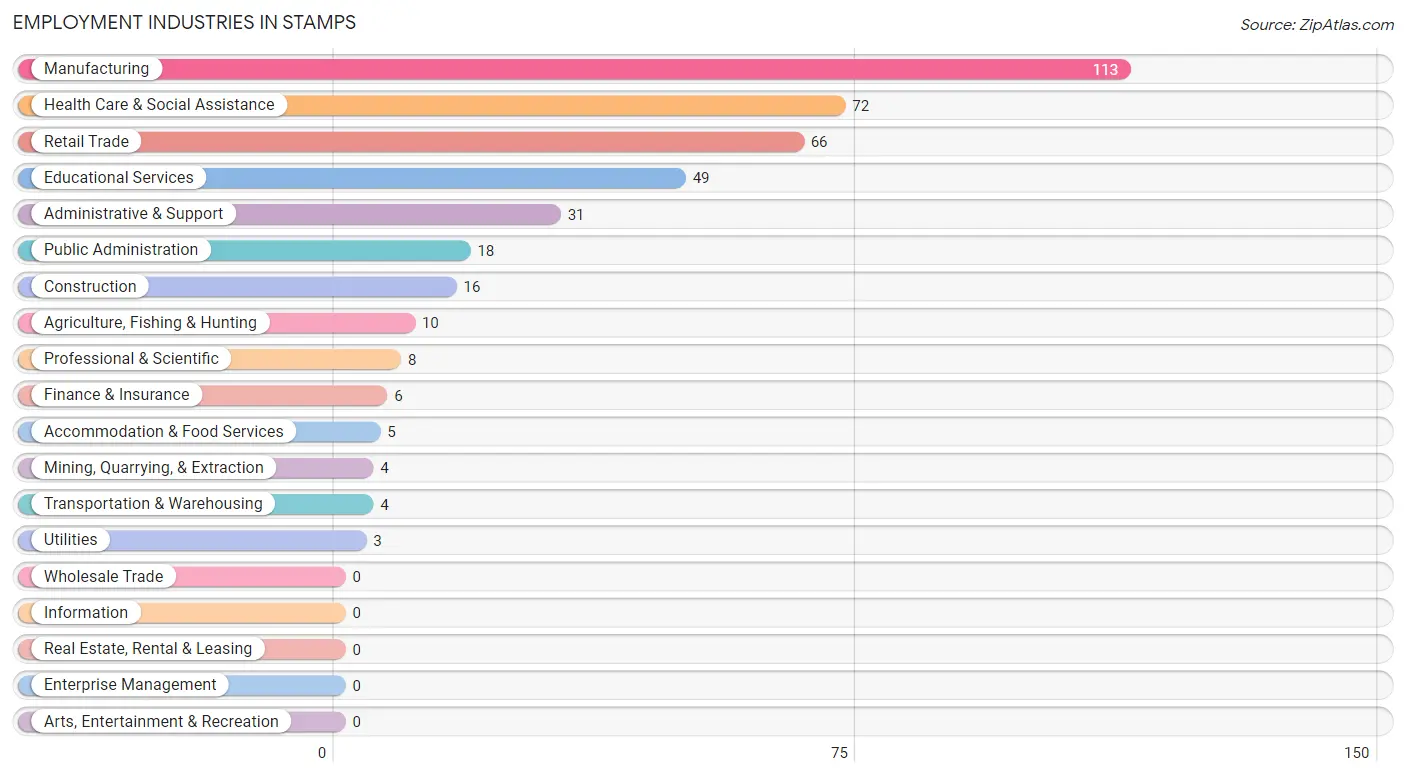
Employment Industries in Stamps
The major employment industries in Stamps include Manufacturing (113 | 25.5%), Health Care & Social Assistance (72 | 16.2%), Retail Trade (66 | 14.9%), Educational Services (49 | 11.0%), and Administrative & Support (31 | 7.0%).
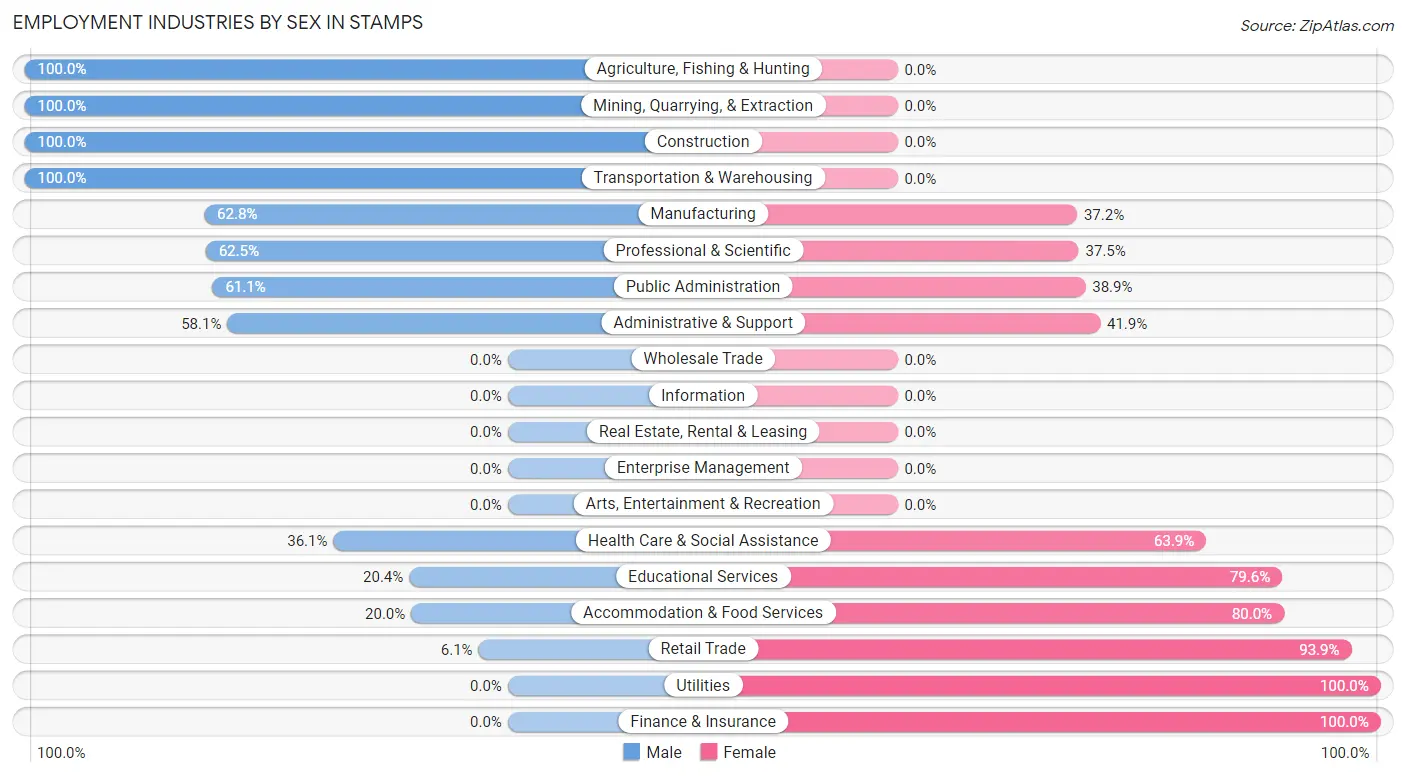
Employment Industries by Sex in Stamps
The Stamps industries that see more men than women are Agriculture, Fishing & Hunting (100.0%), Mining, Quarrying, & Extraction (100.0%), and Construction (100.0%), whereas the industries that tend to have a higher number of women are Utilities (100.0%), Finance & Insurance (100.0%), and Retail Trade (93.9%).
| Industry | Male | Female |
| Agriculture, Fishing & Hunting | 10 (100.0%) | 0 (0.0%) |
| Mining, Quarrying, & Extraction | 4 (100.0%) | 0 (0.0%) |
| Construction | 16 (100.0%) | 0 (0.0%) |
| Manufacturing | 71 (62.8%) | 42 (37.2%) |
| Wholesale Trade | 0 (0.0%) | 0 (0.0%) |
| Retail Trade | 4 (6.1%) | 62 (93.9%) |
| Transportation & Warehousing | 4 (100.0%) | 0 (0.0%) |
| Utilities | 0 (0.0%) | 3 (100.0%) |
| Information | 0 (0.0%) | 0 (0.0%) |
| Finance & Insurance | 0 (0.0%) | 6 (100.0%) |
| Real Estate, Rental & Leasing | 0 (0.0%) | 0 (0.0%) |
| Professional & Scientific | 5 (62.5%) | 3 (37.5%) |
| Enterprise Management | 0 (0.0%) | 0 (0.0%) |
| Administrative & Support | 18 (58.1%) | 13 (41.9%) |
| Educational Services | 10 (20.4%) | 39 (79.6%) |
| Health Care & Social Assistance | 26 (36.1%) | 46 (63.9%) |
| Arts, Entertainment & Recreation | 0 (0.0%) | 0 (0.0%) |
| Accommodation & Food Services | 1 (20.0%) | 4 (80.0%) |
| Public Administration | 11 (61.1%) | 7 (38.9%) |
| Total | 204 (46.0%) | 240 (54.0%) |
Education in Stamps
School Enrollment in Stamps
The most common levels of schooling among the 297 students in Stamps are elementary school (105 | 35.3%), middle school (89 | 30.0%), and high school (73 | 24.6%).
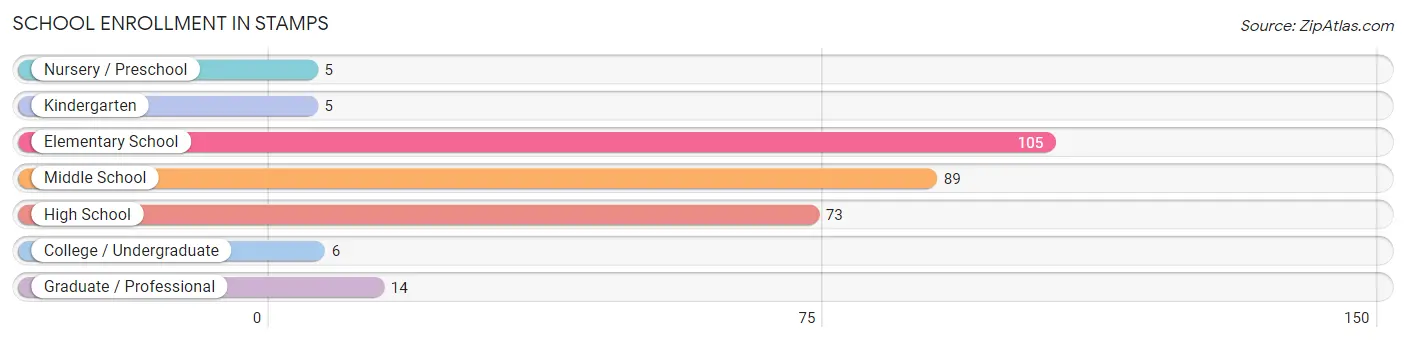
| School Level | # Students | % Students |
| Nursery / Preschool | 5 | 1.7% |
| Kindergarten | 5 | 1.7% |
| Elementary School | 105 | 35.3% |
| Middle School | 89 | 30.0% |
| High School | 73 | 24.6% |
| College / Undergraduate | 6 | 2.0% |
| Graduate / Professional | 14 | 4.7% |
| Total | 297 | 100.0% |
School Enrollment by Age by Funding Source in Stamps
Out of a total of 297 students who are enrolled in schools in Stamps, 8 (2.7%) attend a private institution, while the remaining 289 (97.3%) are enrolled in public schools. The age group of 3 to 4 year olds has the highest likelihood of being enrolled in private schools, with 5 (100.0% in the age bracket) enrolled. Conversely, the age group of 5 to 9 year old has the lowest likelihood of being enrolled in a private school, with 110 (100.0% in the age bracket) attending a public institution.
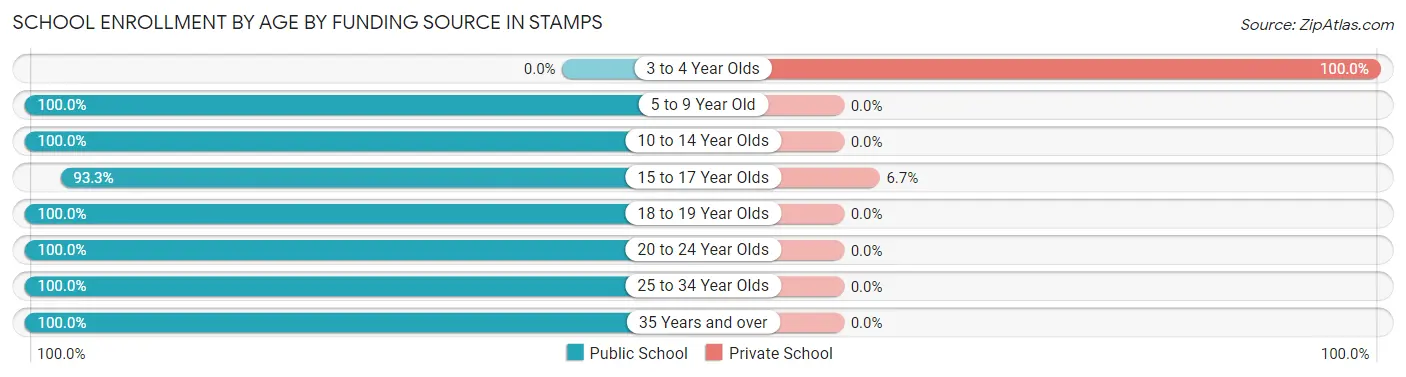
| Age Bracket | Public School | Private School |
| 3 to 4 Year Olds | 0 (0.0%) | 5 (100.0%) |
| 5 to 9 Year Old | 110 (100.0%) | 0 (0.0%) |
| 10 to 14 Year Olds | 89 (100.0%) | 0 (0.0%) |
| 15 to 17 Year Olds | 42 (93.3%) | 3 (6.7%) |
| 18 to 19 Year Olds | 31 (100.0%) | 0 (0.0%) |
| 20 to 24 Year Olds | 9 (100.0%) | 0 (0.0%) |
| 25 to 34 Year Olds | 5 (100.0%) | 0 (0.0%) |
| 35 Years and over | 3 (100.0%) | 0 (0.0%) |
| Total | 289 (97.3%) | 8 (2.7%) |
Educational Attainment by Field of Study in Stamps
Education (67 | 44.7%), business (33 | 22.0%), arts & humanities (16 | 10.7%), psychology (11 | 7.3%), and science & technology (10 | 6.7%) are the most common fields of study among 150 individuals in Stamps who have obtained a bachelor's degree or higher.
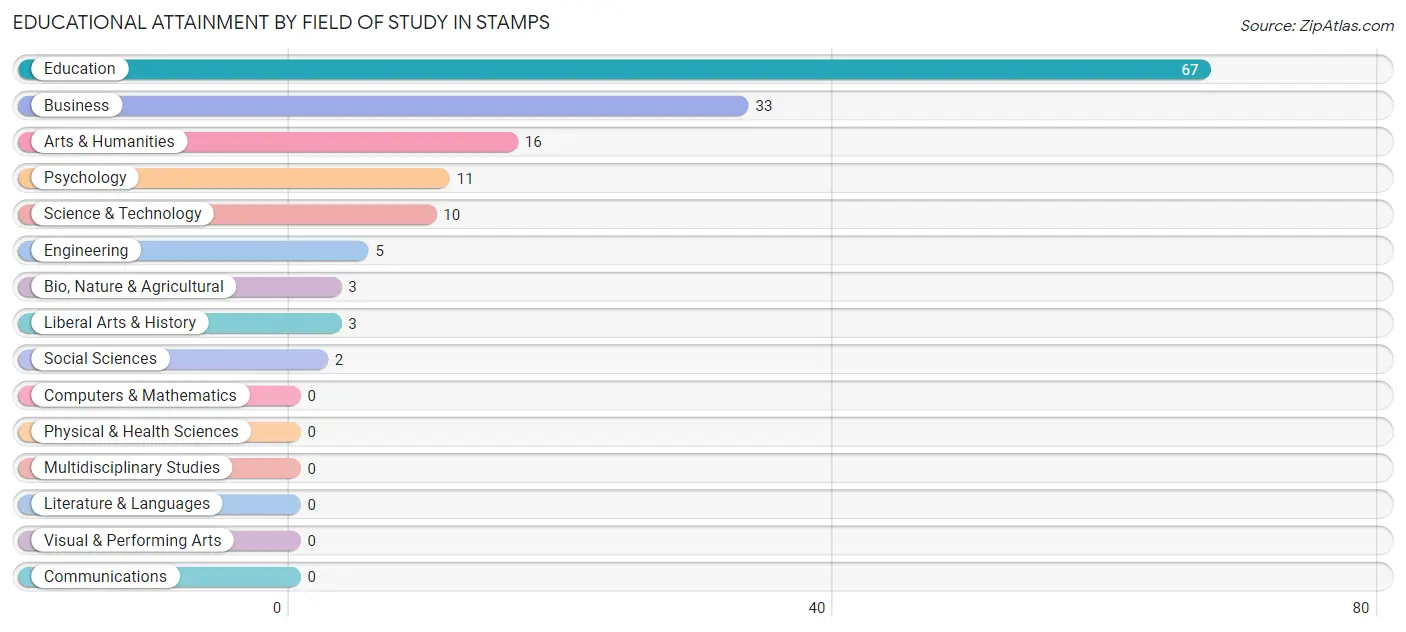
| Field of Study | # Graduates | % Graduates |
| Computers & Mathematics | 0 | 0.0% |
| Bio, Nature & Agricultural | 3 | 2.0% |
| Physical & Health Sciences | 0 | 0.0% |
| Psychology | 11 | 7.3% |
| Social Sciences | 2 | 1.3% |
| Engineering | 5 | 3.3% |
| Multidisciplinary Studies | 0 | 0.0% |
| Science & Technology | 10 | 6.7% |
| Business | 33 | 22.0% |
| Education | 67 | 44.7% |
| Literature & Languages | 0 | 0.0% |
| Liberal Arts & History | 3 | 2.0% |
| Visual & Performing Arts | 0 | 0.0% |
| Communications | 0 | 0.0% |
| Arts & Humanities | 16 | 10.7% |
| Total | 150 | 100.0% |
Transportation & Commute in Stamps
Vehicle Availability by Sex in Stamps
The most prevalent vehicle ownership categories in Stamps are males with 2 vehicles (104, accounting for 53.9%) and females with 2 vehicles (86, making up 44.8%).
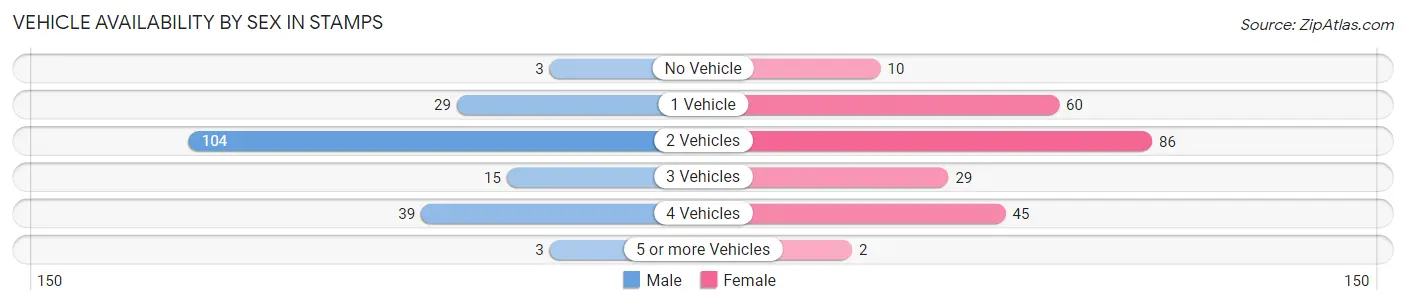
| Vehicles Available | Male | Female |
| No Vehicle | 3 (1.5%) | 10 (4.3%) |
| 1 Vehicle | 29 (15.0%) | 60 (25.9%) |
| 2 Vehicles | 104 (53.9%) | 86 (37.1%) |
| 3 Vehicles | 15 (7.8%) | 29 (12.5%) |
| 4 Vehicles | 39 (20.2%) | 45 (19.4%) |
| 5 or more Vehicles | 3 (1.5%) | 2 (0.9%) |
| Total | 193 (100.0%) | 232 (100.0%) |
Commute Time in Stamps
The most frequently occuring commute durations in Stamps are 10 to 14 minutes (86 commuters, 20.9%), 45 to 59 minutes (61 commuters, 14.8%), and less than 5 minutes (56 commuters, 13.6%).
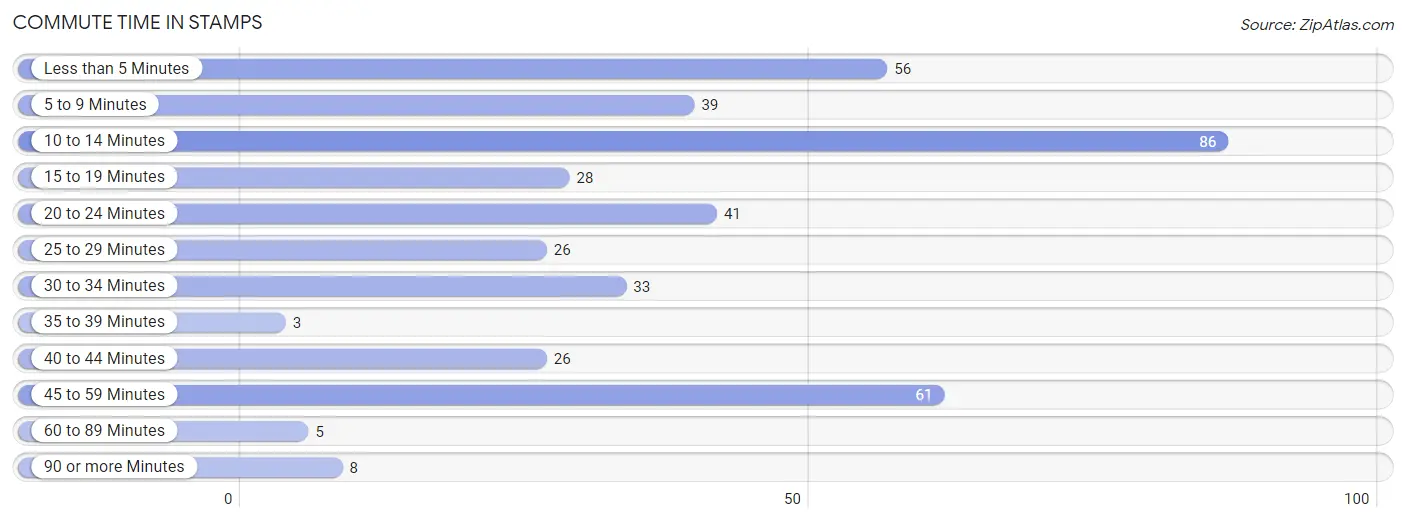
| Commute Time | # Commuters | % Commuters |
| Less than 5 Minutes | 56 | 13.6% |
| 5 to 9 Minutes | 39 | 9.5% |
| 10 to 14 Minutes | 86 | 20.9% |
| 15 to 19 Minutes | 28 | 6.8% |
| 20 to 24 Minutes | 41 | 10.0% |
| 25 to 29 Minutes | 26 | 6.3% |
| 30 to 34 Minutes | 33 | 8.0% |
| 35 to 39 Minutes | 3 | 0.7% |
| 40 to 44 Minutes | 26 | 6.3% |
| 45 to 59 Minutes | 61 | 14.8% |
| 60 to 89 Minutes | 5 | 1.2% |
| 90 or more Minutes | 8 | 1.9% |
Commute Time by Sex in Stamps
The most common commute times in Stamps are 10 to 14 minutes (41 commuters, 21.2%) for males and 10 to 14 minutes (45 commuters, 20.5%) for females.
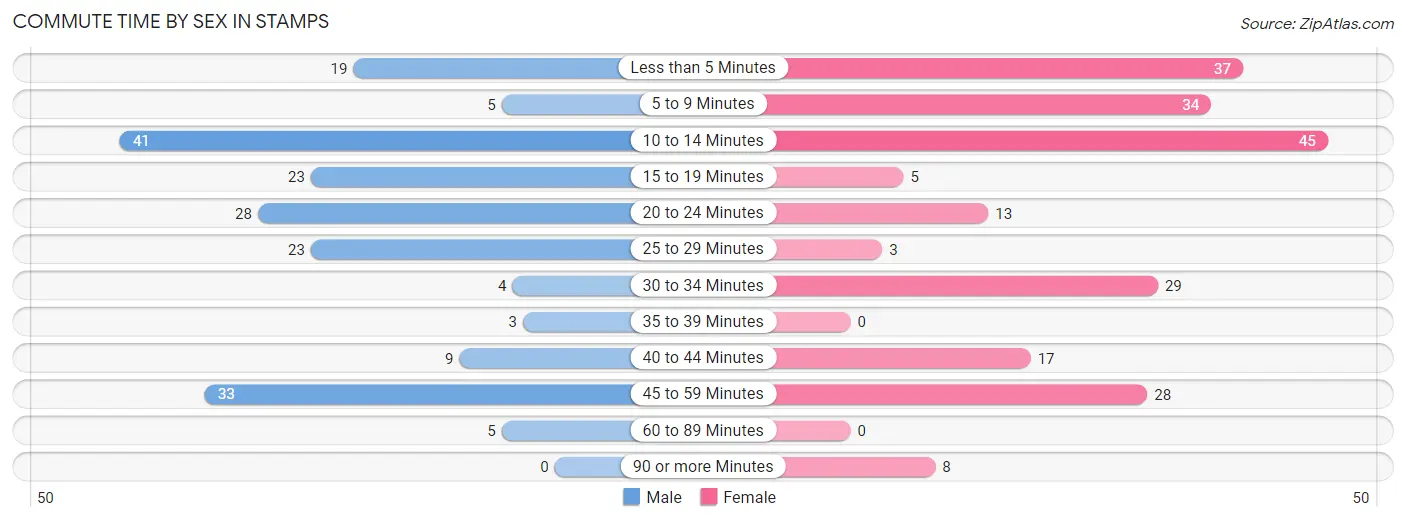
| Commute Time | Male | Female |
| Less than 5 Minutes | 19 (9.8%) | 37 (16.9%) |
| 5 to 9 Minutes | 5 (2.6%) | 34 (15.5%) |
| 10 to 14 Minutes | 41 (21.2%) | 45 (20.5%) |
| 15 to 19 Minutes | 23 (11.9%) | 5 (2.3%) |
| 20 to 24 Minutes | 28 (14.5%) | 13 (5.9%) |
| 25 to 29 Minutes | 23 (11.9%) | 3 (1.4%) |
| 30 to 34 Minutes | 4 (2.1%) | 29 (13.2%) |
| 35 to 39 Minutes | 3 (1.5%) | 0 (0.0%) |
| 40 to 44 Minutes | 9 (4.7%) | 17 (7.8%) |
| 45 to 59 Minutes | 33 (17.1%) | 28 (12.8%) |
| 60 to 89 Minutes | 5 (2.6%) | 0 (0.0%) |
| 90 or more Minutes | 0 (0.0%) | 8 (3.6%) |
Time of Departure to Work by Sex in Stamps
The most frequent times of departure to work in Stamps are 7:00 AM to 7:29 AM (42, 21.8%) for males and 7:30 AM to 7:59 AM (46, 21.0%) for females.
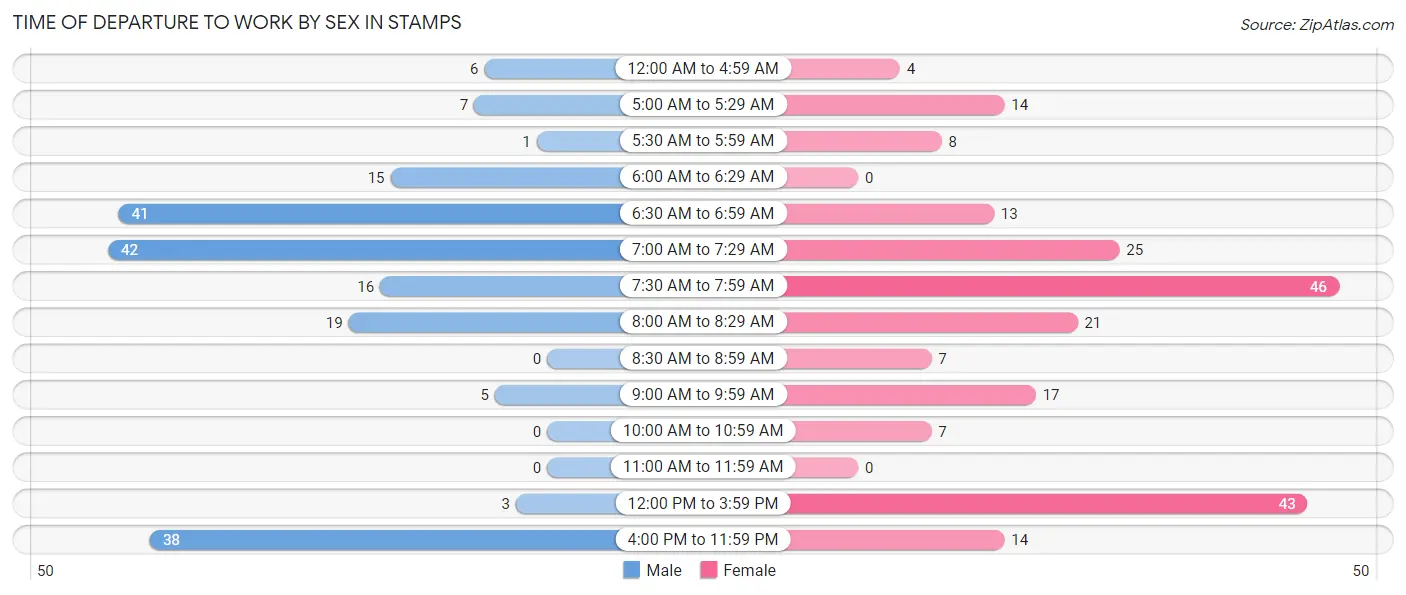
| Time of Departure | Male | Female |
| 12:00 AM to 4:59 AM | 6 (3.1%) | 4 (1.8%) |
| 5:00 AM to 5:29 AM | 7 (3.6%) | 14 (6.4%) |
| 5:30 AM to 5:59 AM | 1 (0.5%) | 8 (3.6%) |
| 6:00 AM to 6:29 AM | 15 (7.8%) | 0 (0.0%) |
| 6:30 AM to 6:59 AM | 41 (21.2%) | 13 (5.9%) |
| 7:00 AM to 7:29 AM | 42 (21.8%) | 25 (11.4%) |
| 7:30 AM to 7:59 AM | 16 (8.3%) | 46 (21.0%) |
| 8:00 AM to 8:29 AM | 19 (9.8%) | 21 (9.6%) |
| 8:30 AM to 8:59 AM | 0 (0.0%) | 7 (3.2%) |
| 9:00 AM to 9:59 AM | 5 (2.6%) | 17 (7.8%) |
| 10:00 AM to 10:59 AM | 0 (0.0%) | 7 (3.2%) |
| 11:00 AM to 11:59 AM | 0 (0.0%) | 0 (0.0%) |
| 12:00 PM to 3:59 PM | 3 (1.5%) | 43 (19.6%) |
| 4:00 PM to 11:59 PM | 38 (19.7%) | 14 (6.4%) |
| Total | 193 (100.0%) | 219 (100.0%) |
Housing Occupancy in Stamps
Occupancy by Ownership in Stamps
Of the total 628 dwellings in Stamps, owner-occupied units account for 437 (69.6%), while renter-occupied units make up 191 (30.4%).
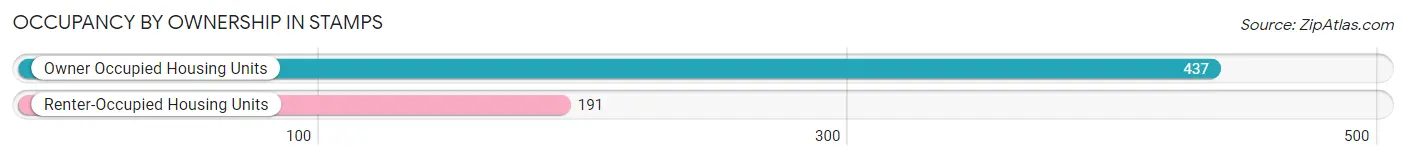
| Occupancy | # Housing Units | % Housing Units |
| Owner Occupied Housing Units | 437 | 69.6% |
| Renter-Occupied Housing Units | 191 | 30.4% |
| Total Occupied Housing Units | 628 | 100.0% |
Occupancy by Household Size in Stamps
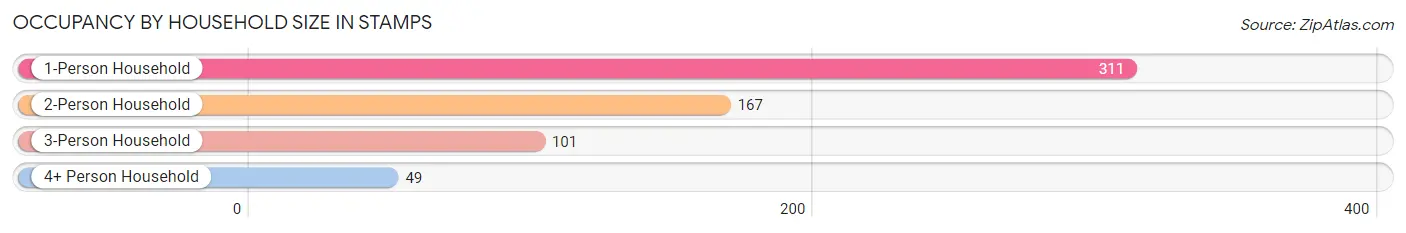
| Household Size | # Housing Units | % Housing Units |
| 1-Person Household | 311 | 49.5% |
| 2-Person Household | 167 | 26.6% |
| 3-Person Household | 101 | 16.1% |
| 4+ Person Household | 49 | 7.8% |
| Total Housing Units | 628 | 100.0% |
Occupancy by Ownership by Household Size in Stamps
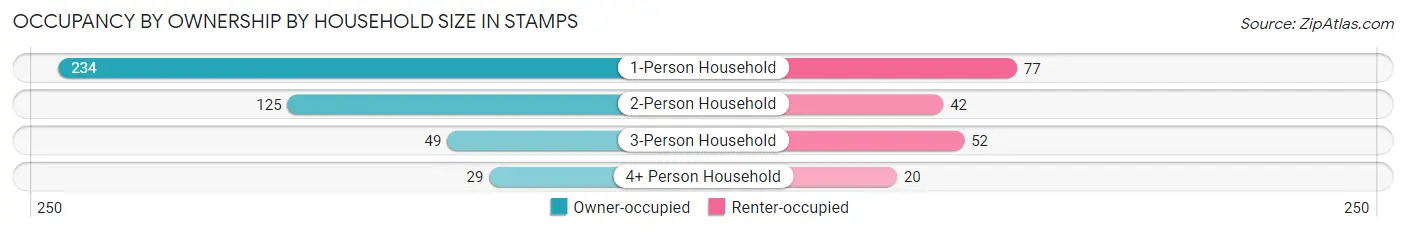
| Household Size | Owner-occupied | Renter-occupied |
| 1-Person Household | 234 (75.2%) | 77 (24.8%) |
| 2-Person Household | 125 (74.9%) | 42 (25.2%) |
| 3-Person Household | 49 (48.5%) | 52 (51.5%) |
| 4+ Person Household | 29 (59.2%) | 20 (40.8%) |
| Total Housing Units | 437 (69.6%) | 191 (30.4%) |
Occupancy by Educational Attainment in Stamps
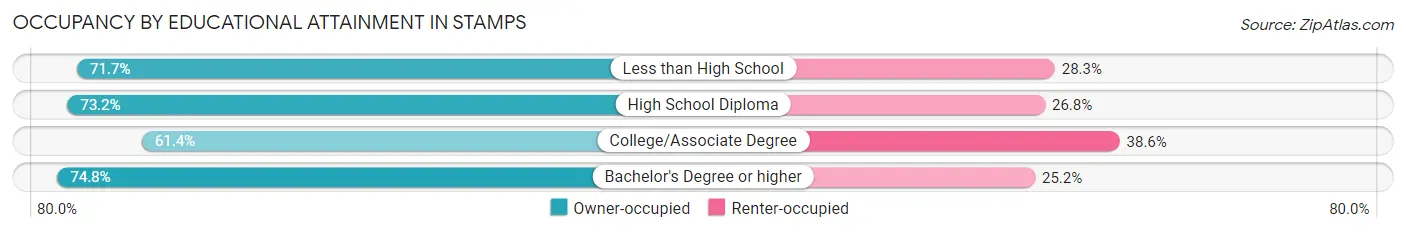
| Household Size | Owner-occupied | Renter-occupied |
| Less than High School | 43 (71.7%) | 17 (28.3%) |
| High School Diploma | 175 (73.2%) | 64 (26.8%) |
| College/Associate Degree | 124 (61.4%) | 78 (38.6%) |
| Bachelor's Degree or higher | 95 (74.8%) | 32 (25.2%) |
Occupancy by Age of Householder in Stamps
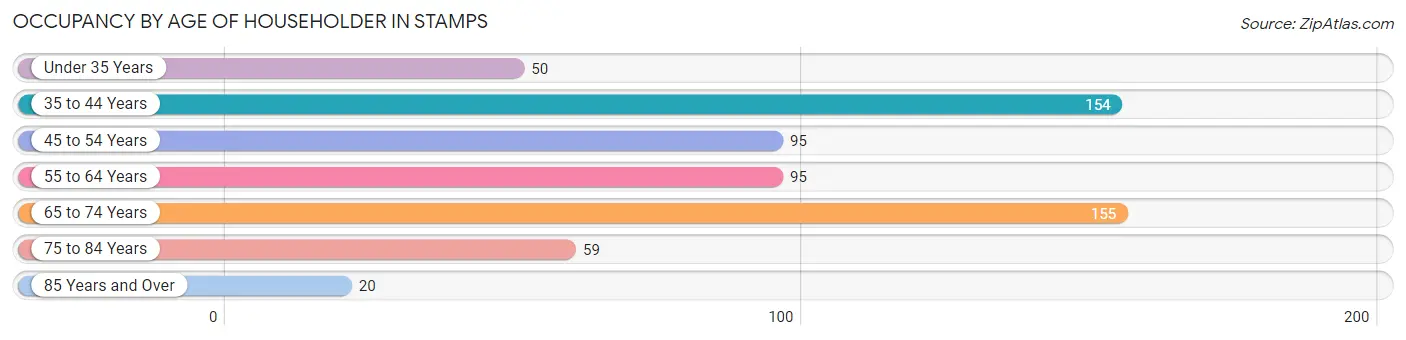
| Age Bracket | # Households | % Households |
| Under 35 Years | 50 | 8.0% |
| 35 to 44 Years | 154 | 24.5% |
| 45 to 54 Years | 95 | 15.1% |
| 55 to 64 Years | 95 | 15.1% |
| 65 to 74 Years | 155 | 24.7% |
| 75 to 84 Years | 59 | 9.4% |
| 85 Years and Over | 20 | 3.2% |
| Total | 628 | 100.0% |
Housing Finances in Stamps
Median Income by Occupancy in Stamps
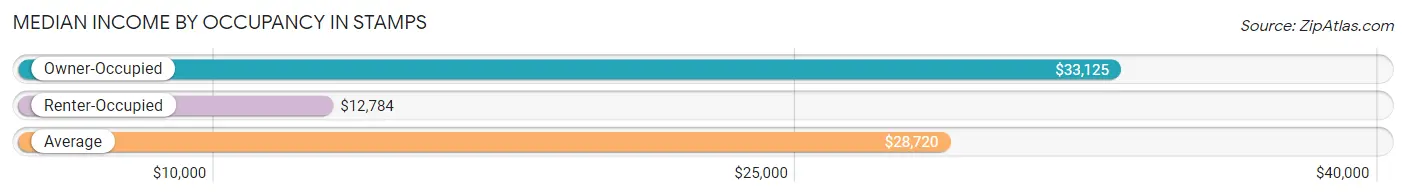
| Occupancy Type | # Households | Median Income |
| Owner-Occupied | 437 (69.6%) | $33,125 |
| Renter-Occupied | 191 (30.4%) | $12,784 |
| Average | 628 (100.0%) | $28,720 |
Occupancy by Householder Income Bracket in Stamps
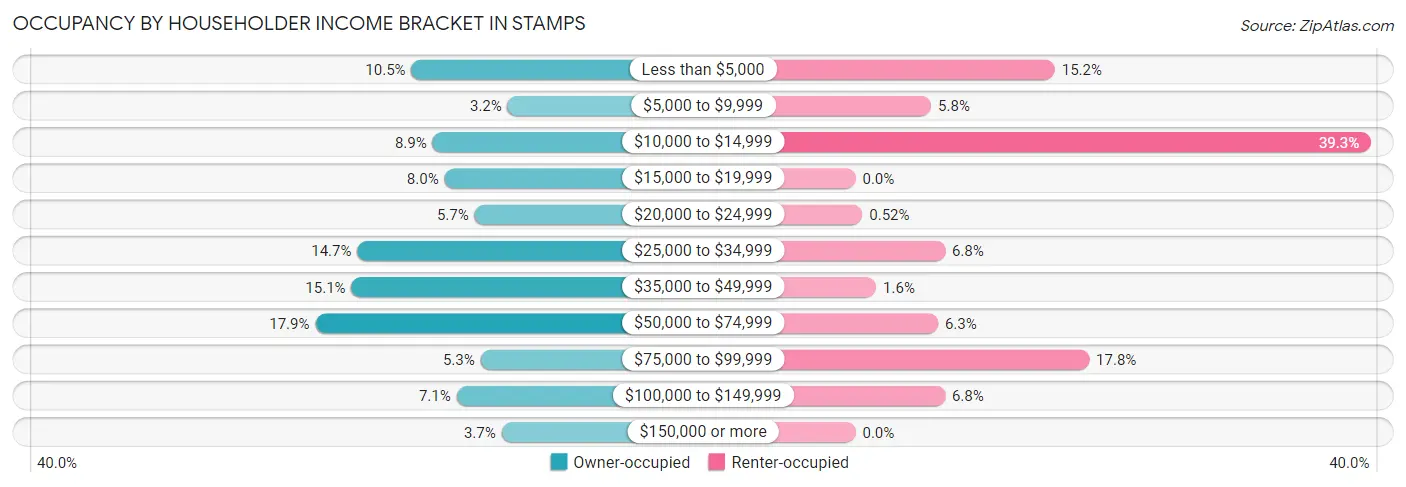
| Income Bracket | Owner-occupied | Renter-occupied |
| Less than $5,000 | 46 (10.5%) | 29 (15.2%) |
| $5,000 to $9,999 | 14 (3.2%) | 11 (5.8%) |
| $10,000 to $14,999 | 39 (8.9%) | 75 (39.3%) |
| $15,000 to $19,999 | 35 (8.0%) | 0 (0.0%) |
| $20,000 to $24,999 | 25 (5.7%) | 1 (0.5%) |
| $25,000 to $34,999 | 64 (14.6%) | 13 (6.8%) |
| $35,000 to $49,999 | 66 (15.1%) | 3 (1.6%) |
| $50,000 to $74,999 | 78 (17.8%) | 12 (6.3%) |
| $75,000 to $99,999 | 23 (5.3%) | 34 (17.8%) |
| $100,000 to $149,999 | 31 (7.1%) | 13 (6.8%) |
| $150,000 or more | 16 (3.7%) | 0 (0.0%) |
| Total | 437 (100.0%) | 191 (100.0%) |
Monthly Housing Cost Tiers in Stamps
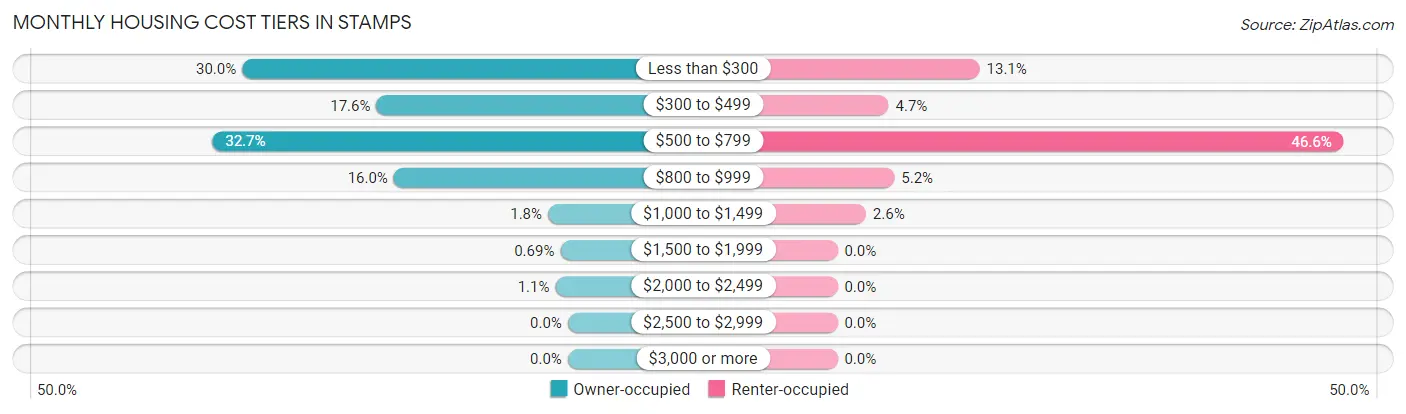
| Monthly Cost | Owner-occupied | Renter-occupied |
| Less than $300 | 131 (30.0%) | 25 (13.1%) |
| $300 to $499 | 77 (17.6%) | 9 (4.7%) |
| $500 to $799 | 143 (32.7%) | 89 (46.6%) |
| $800 to $999 | 70 (16.0%) | 10 (5.2%) |
| $1,000 to $1,499 | 8 (1.8%) | 5 (2.6%) |
| $1,500 to $1,999 | 3 (0.7%) | 0 (0.0%) |
| $2,000 to $2,499 | 5 (1.1%) | 0 (0.0%) |
| $2,500 to $2,999 | 0 (0.0%) | 0 (0.0%) |
| $3,000 or more | 0 (0.0%) | 0 (0.0%) |
| Total | 437 (100.0%) | 191 (100.0%) |
Physical Housing Characteristics in Stamps
Housing Structures in Stamps
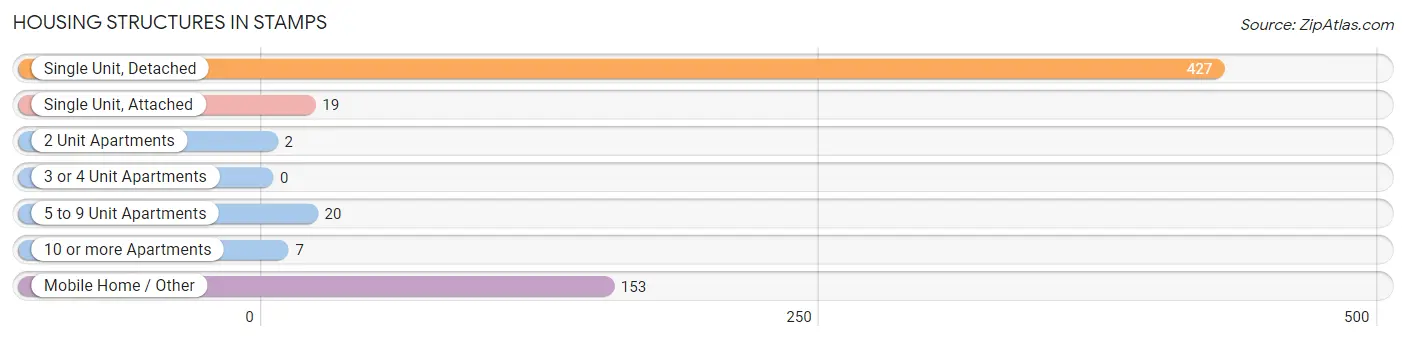
| Structure Type | # Housing Units | % Housing Units |
| Single Unit, Detached | 427 | 68.0% |
| Single Unit, Attached | 19 | 3.0% |
| 2 Unit Apartments | 2 | 0.3% |
| 3 or 4 Unit Apartments | 0 | 0.0% |
| 5 to 9 Unit Apartments | 20 | 3.2% |
| 10 or more Apartments | 7 | 1.1% |
| Mobile Home / Other | 153 | 24.4% |
| Total | 628 | 100.0% |
Housing Structures by Occupancy in Stamps
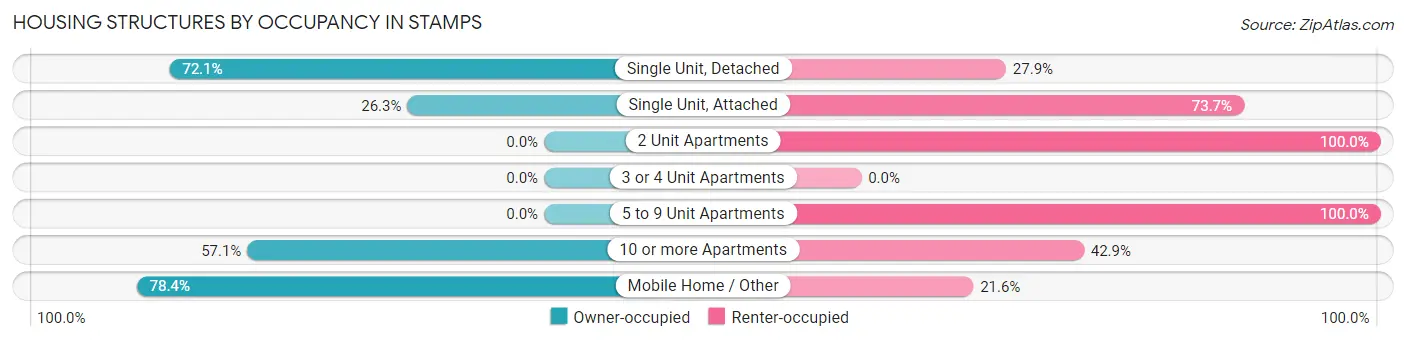
| Structure Type | Owner-occupied | Renter-occupied |
| Single Unit, Detached | 308 (72.1%) | 119 (27.9%) |
| Single Unit, Attached | 5 (26.3%) | 14 (73.7%) |
| 2 Unit Apartments | 0 (0.0%) | 2 (100.0%) |
| 3 or 4 Unit Apartments | 0 (0.0%) | 0 (0.0%) |
| 5 to 9 Unit Apartments | 0 (0.0%) | 20 (100.0%) |
| 10 or more Apartments | 4 (57.1%) | 3 (42.9%) |
| Mobile Home / Other | 120 (78.4%) | 33 (21.6%) |
| Total | 437 (69.6%) | 191 (30.4%) |
Housing Structures by Number of Rooms in Stamps
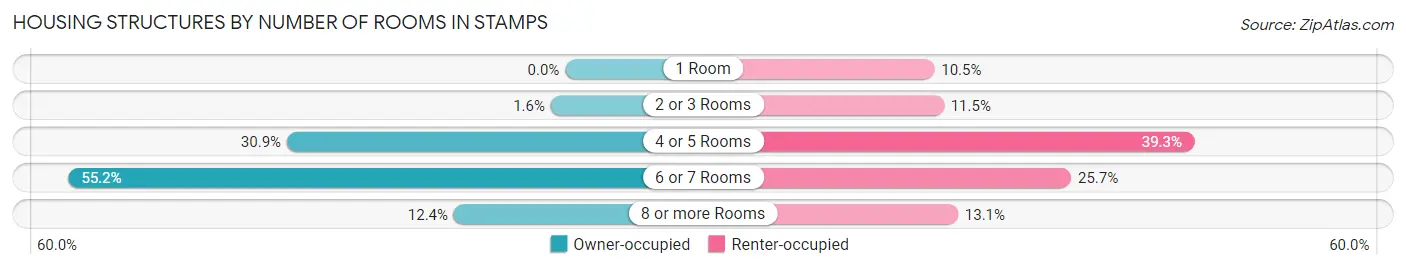
| Number of Rooms | Owner-occupied | Renter-occupied |
| 1 Room | 0 (0.0%) | 20 (10.5%) |
| 2 or 3 Rooms | 7 (1.6%) | 22 (11.5%) |
| 4 or 5 Rooms | 135 (30.9%) | 75 (39.3%) |
| 6 or 7 Rooms | 241 (55.1%) | 49 (25.7%) |
| 8 or more Rooms | 54 (12.4%) | 25 (13.1%) |
| Total | 437 (100.0%) | 191 (100.0%) |
Housing Structure by Heating Type in Stamps
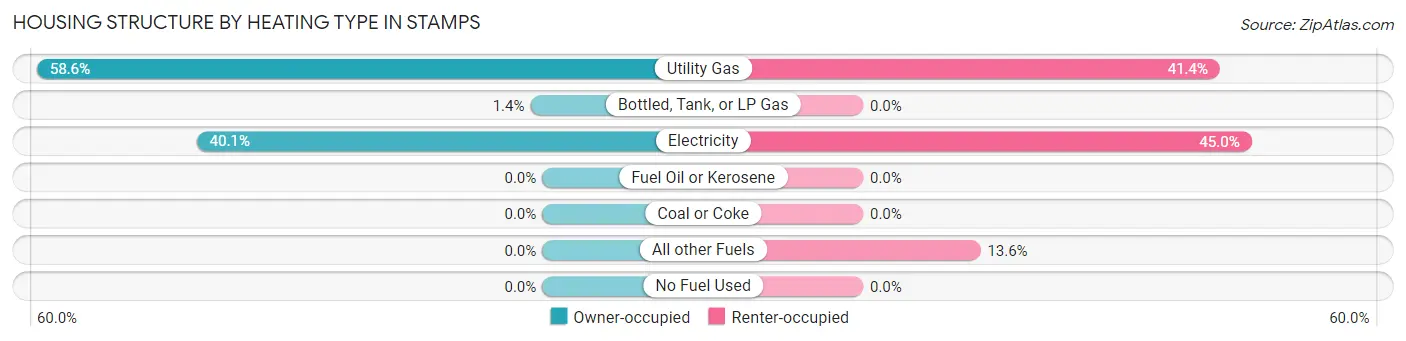
| Heating Type | Owner-occupied | Renter-occupied |
| Utility Gas | 256 (58.6%) | 79 (41.4%) |
| Bottled, Tank, or LP Gas | 6 (1.4%) | 0 (0.0%) |
| Electricity | 175 (40.1%) | 86 (45.0%) |
| Fuel Oil or Kerosene | 0 (0.0%) | 0 (0.0%) |
| Coal or Coke | 0 (0.0%) | 0 (0.0%) |
| All other Fuels | 0 (0.0%) | 26 (13.6%) |
| No Fuel Used | 0 (0.0%) | 0 (0.0%) |
| Total | 437 (100.0%) | 191 (100.0%) |
Household Vehicle Usage in Stamps
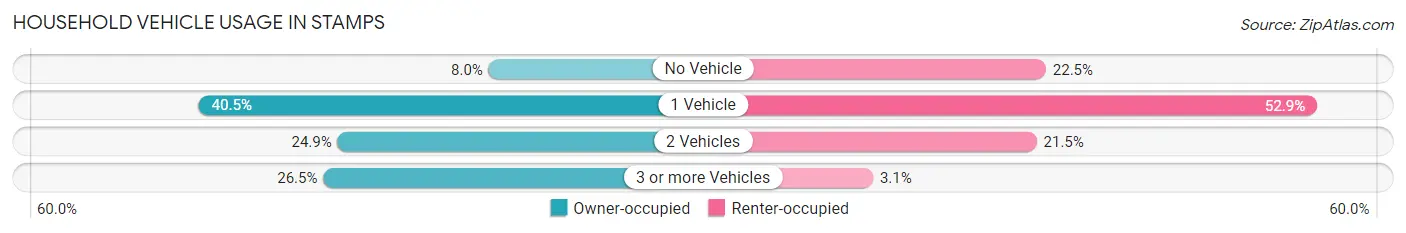
| Vehicles per Household | Owner-occupied | Renter-occupied |
| No Vehicle | 35 (8.0%) | 43 (22.5%) |
| 1 Vehicle | 177 (40.5%) | 101 (52.9%) |
| 2 Vehicles | 109 (24.9%) | 41 (21.5%) |
| 3 or more Vehicles | 116 (26.5%) | 6 (3.1%) |
| Total | 437 (100.0%) | 191 (100.0%) |
Real Estate & Mortgages in Stamps
Real Estate and Mortgage Overview in Stamps
| Characteristic | Without Mortgage | With Mortgage |
| Housing Units | 273 | 164 |
| Median Property Value | $37,700 | $73,800 |
| Median Household Income | $22,917 | $0 |
| Monthly Housing Costs | $325 | $0 |
| Real Estate Taxes | $199 | $41 |
Property Value by Mortgage Status in Stamps
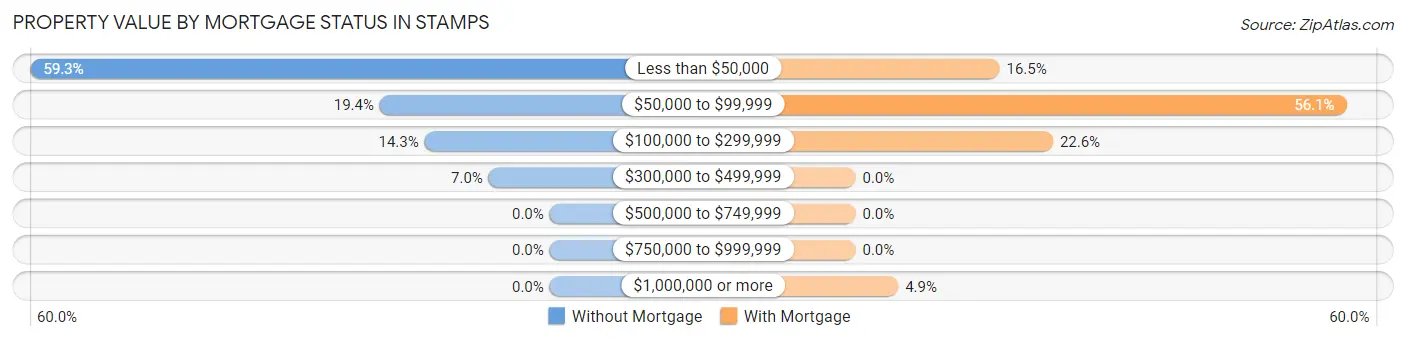
| Property Value | Without Mortgage | With Mortgage |
| Less than $50,000 | 162 (59.3%) | 27 (16.5%) |
| $50,000 to $99,999 | 53 (19.4%) | 92 (56.1%) |
| $100,000 to $299,999 | 39 (14.3%) | 37 (22.6%) |
| $300,000 to $499,999 | 19 (7.0%) | 0 (0.0%) |
| $500,000 to $749,999 | 0 (0.0%) | 0 (0.0%) |
| $750,000 to $999,999 | 0 (0.0%) | 0 (0.0%) |
| $1,000,000 or more | 0 (0.0%) | 8 (4.9%) |
| Total | 273 (100.0%) | 164 (100.0%) |
Household Income by Mortgage Status in Stamps
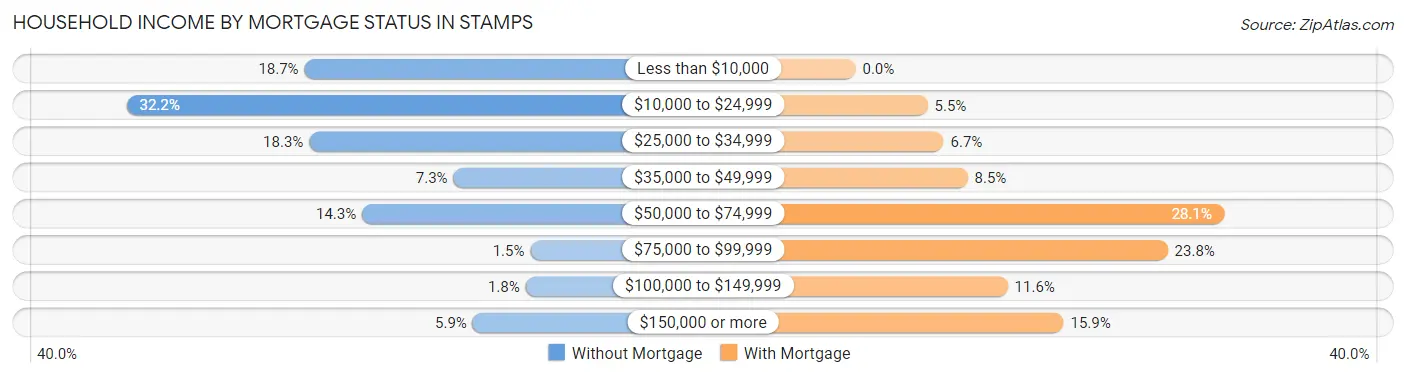
| Household Income | Without Mortgage | With Mortgage |
| Less than $10,000 | 51 (18.7%) | 0 (0.0%) |
| $10,000 to $24,999 | 88 (32.2%) | 9 (5.5%) |
| $25,000 to $34,999 | 50 (18.3%) | 11 (6.7%) |
| $35,000 to $49,999 | 20 (7.3%) | 14 (8.5%) |
| $50,000 to $74,999 | 39 (14.3%) | 46 (28.1%) |
| $75,000 to $99,999 | 4 (1.5%) | 39 (23.8%) |
| $100,000 to $149,999 | 5 (1.8%) | 19 (11.6%) |
| $150,000 or more | 16 (5.9%) | 26 (15.9%) |
| Total | 273 (100.0%) | 164 (100.0%) |
Property Value to Household Income Ratio in Stamps
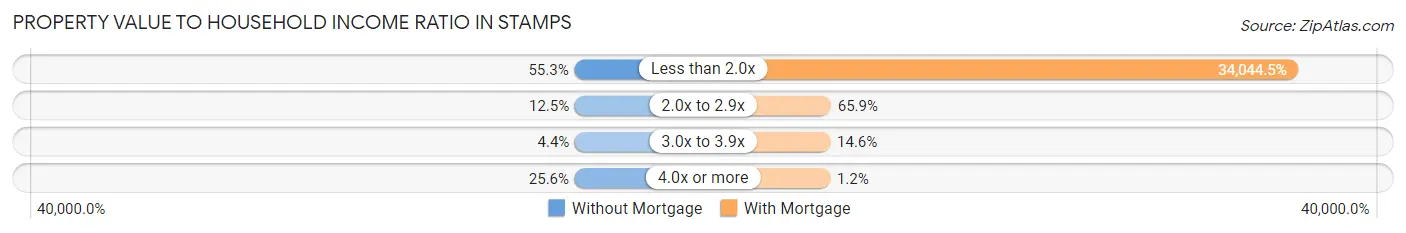
| Value-to-Income Ratio | Without Mortgage | With Mortgage |
| Less than 2.0x | 151 (55.3%) | 55,833 (34,044.5%) |
| 2.0x to 2.9x | 34 (12.4%) | 108 (65.8%) |
| 3.0x to 3.9x | 12 (4.4%) | 24 (14.6%) |
| 4.0x or more | 70 (25.6%) | 2 (1.2%) |
| Total | 273 (100.0%) | 164 (100.0%) |
Real Estate Taxes by Mortgage Status in Stamps
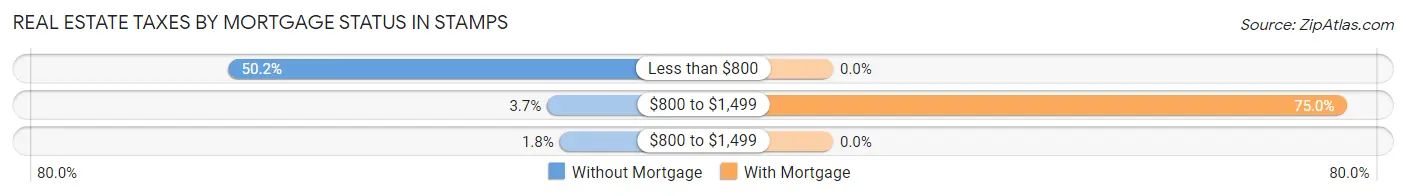
| Property Taxes | Without Mortgage | With Mortgage |
| Less than $800 | 137 (50.2%) | 0 (0.0%) |
| $800 to $1,499 | 10 (3.7%) | 123 (75.0%) |
| $800 to $1,499 | 5 (1.8%) | 0 (0.0%) |
| Total | 273 (100.0%) | 164 (100.0%) |
Health & Disability in Stamps
Health Insurance Coverage by Age in Stamps
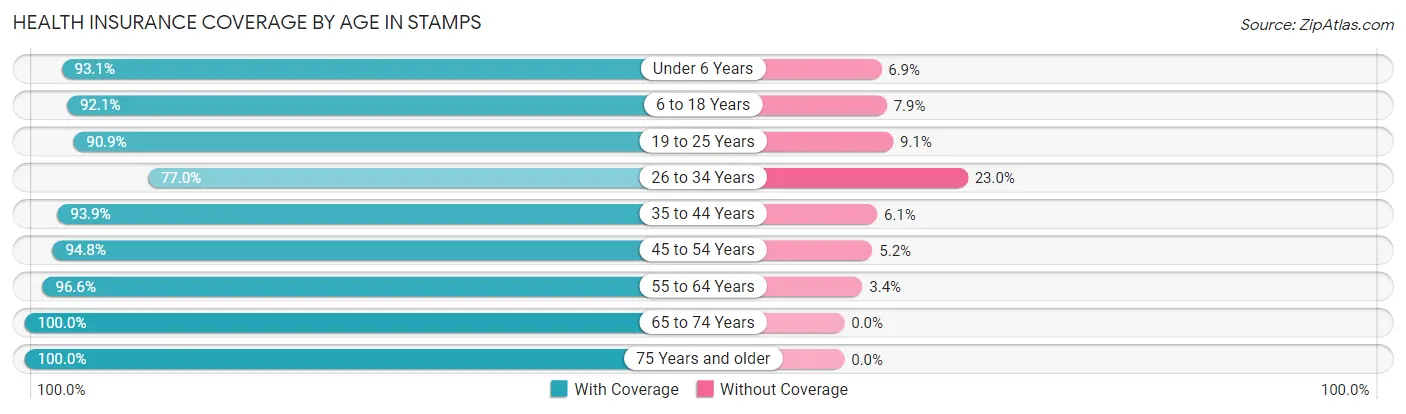
| Age Bracket | With Coverage | Without Coverage |
| Under 6 Years | 54 (93.1%) | 4 (6.9%) |
| 6 to 18 Years | 256 (92.1%) | 22 (7.9%) |
| 19 to 25 Years | 130 (90.9%) | 13 (9.1%) |
| 26 to 34 Years | 87 (77.0%) | 26 (23.0%) |
| 35 to 44 Years | 246 (93.9%) | 16 (6.1%) |
| 45 to 54 Years | 145 (94.8%) | 8 (5.2%) |
| 55 to 64 Years | 115 (96.6%) | 4 (3.4%) |
| 65 to 74 Years | 208 (100.0%) | 0 (0.0%) |
| 75 Years and older | 92 (100.0%) | 0 (0.0%) |
| Total | 1,333 (93.5%) | 93 (6.5%) |
Health Insurance Coverage by Citizenship Status in Stamps
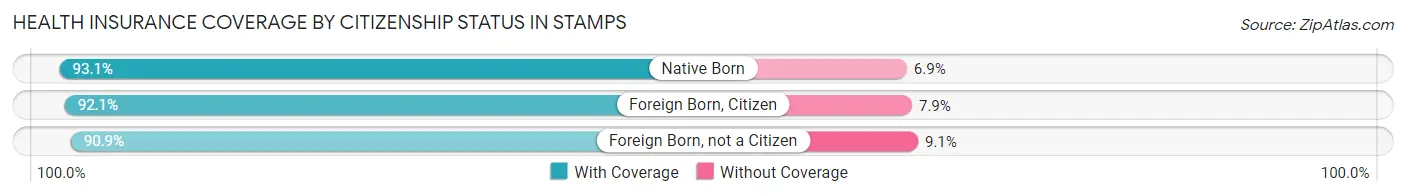
| Citizenship Status | With Coverage | Without Coverage |
| Native Born | 54 (93.1%) | 4 (6.9%) |
| Foreign Born, Citizen | 256 (92.1%) | 22 (7.9%) |
| Foreign Born, not a Citizen | 130 (90.9%) | 13 (9.1%) |
Health Insurance Coverage by Household Income in Stamps
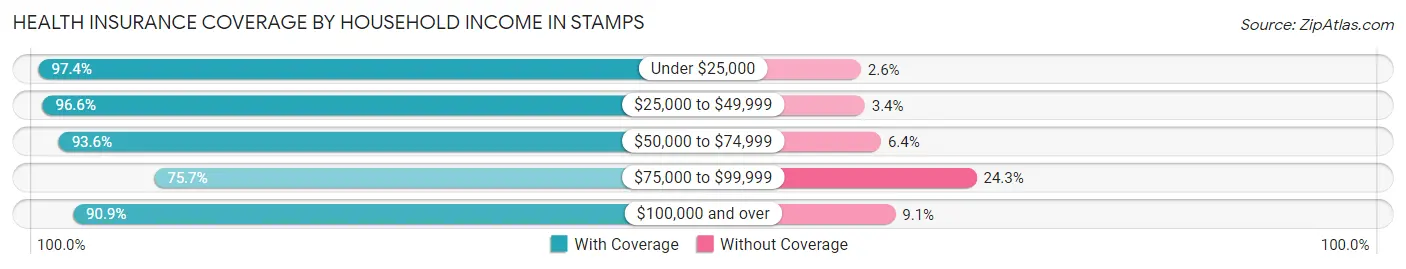
| Household Income | With Coverage | Without Coverage |
| Under $25,000 | 519 (97.4%) | 14 (2.6%) |
| $25,000 to $49,999 | 315 (96.6%) | 11 (3.4%) |
| $50,000 to $74,999 | 190 (93.6%) | 13 (6.4%) |
| $75,000 to $99,999 | 109 (75.7%) | 35 (24.3%) |
| $100,000 and over | 200 (90.9%) | 20 (9.1%) |
Public vs Private Health Insurance Coverage by Age in Stamps
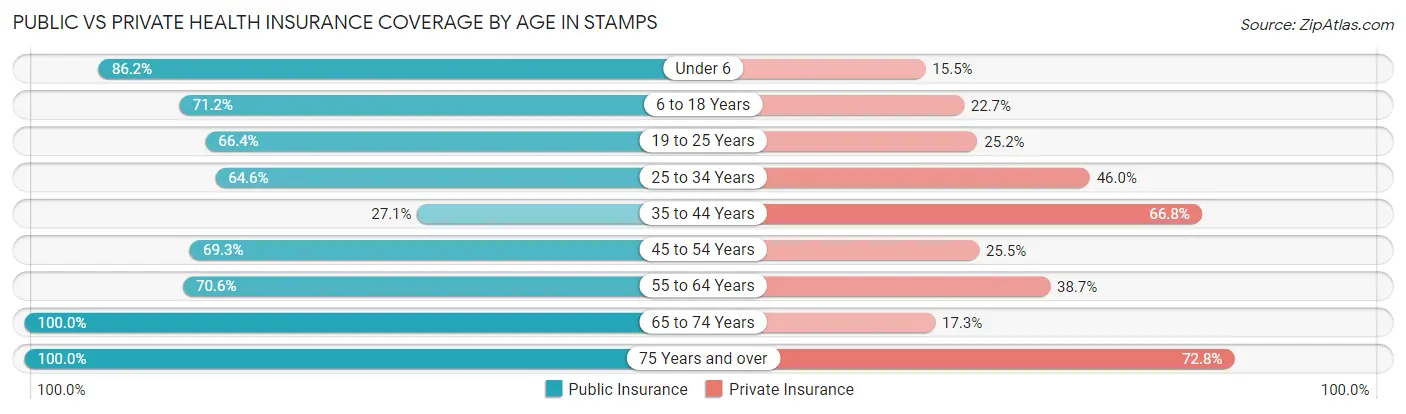
| Age Bracket | Public Insurance | Private Insurance |
| Under 6 | 50 (86.2%) | 9 (15.5%) |
| 6 to 18 Years | 198 (71.2%) | 63 (22.7%) |
| 19 to 25 Years | 95 (66.4%) | 36 (25.2%) |
| 25 to 34 Years | 73 (64.6%) | 52 (46.0%) |
| 35 to 44 Years | 71 (27.1%) | 175 (66.8%) |
| 45 to 54 Years | 106 (69.3%) | 39 (25.5%) |
| 55 to 64 Years | 84 (70.6%) | 46 (38.7%) |
| 65 to 74 Years | 208 (100.0%) | 36 (17.3%) |
| 75 Years and over | 92 (100.0%) | 67 (72.8%) |
| Total | 977 (68.5%) | 523 (36.7%) |
Disability Status by Sex by Age in Stamps
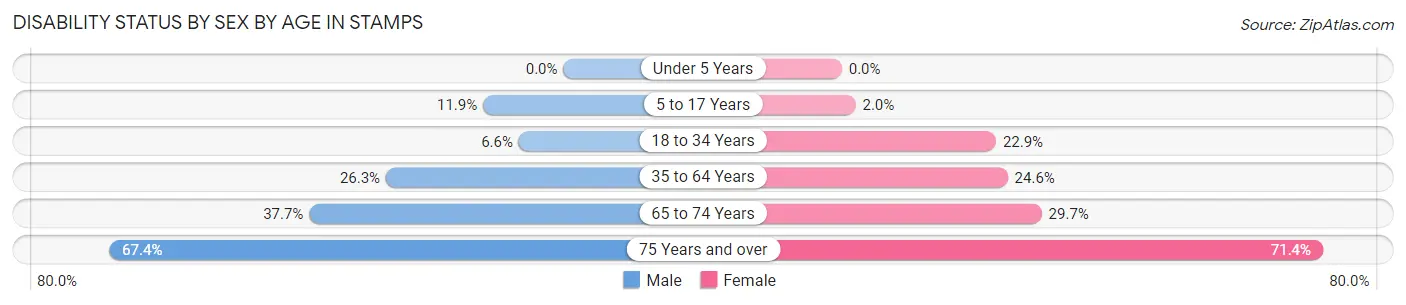
| Age Bracket | Male | Female |
| Under 5 Years | 0 (0.0%) | 0 (0.0%) |
| 5 to 17 Years | 18 (11.9%) | 2 (2.0%) |
| 18 to 34 Years | 8 (6.6%) | 38 (22.9%) |
| 35 to 64 Years | 69 (26.3%) | 67 (24.6%) |
| 65 to 74 Years | 20 (37.7%) | 46 (29.7%) |
| 75 Years and over | 29 (67.4%) | 35 (71.4%) |
Disability Class by Sex by Age in Stamps
Disability Class: Hearing Difficulty
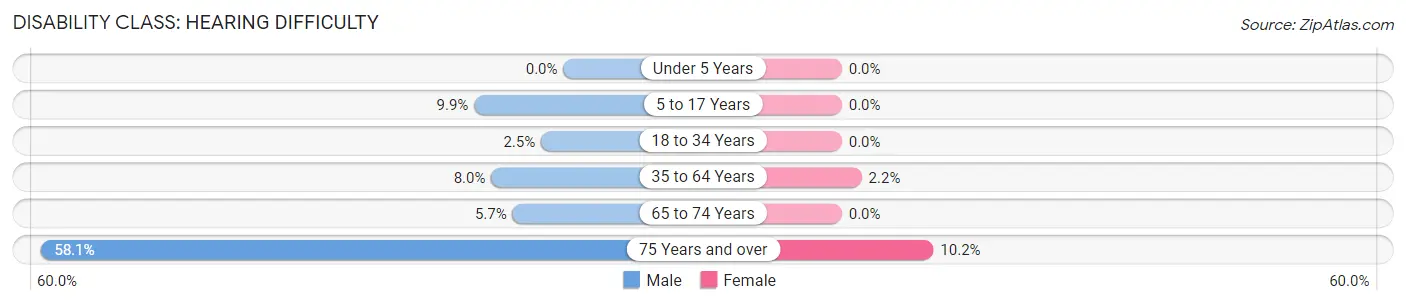
| Age Bracket | Male | Female |
| Under 5 Years | 0 (0.0%) | 0 (0.0%) |
| 5 to 17 Years | 15 (9.9%) | 0 (0.0%) |
| 18 to 34 Years | 3 (2.5%) | 0 (0.0%) |
| 35 to 64 Years | 21 (8.0%) | 6 (2.2%) |
| 65 to 74 Years | 3 (5.7%) | 0 (0.0%) |
| 75 Years and over | 25 (58.1%) | 5 (10.2%) |
Disability Class: Vision Difficulty
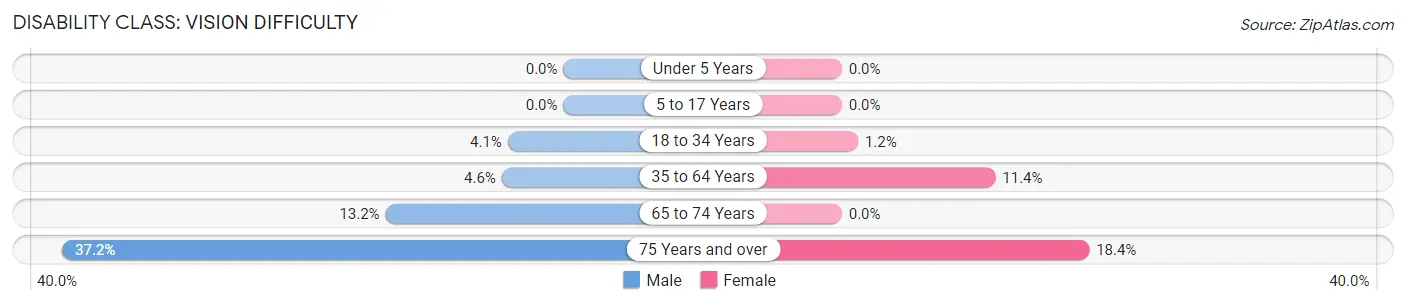
| Age Bracket | Male | Female |
| Under 5 Years | 0 (0.0%) | 0 (0.0%) |
| 5 to 17 Years | 0 (0.0%) | 0 (0.0%) |
| 18 to 34 Years | 5 (4.1%) | 2 (1.2%) |
| 35 to 64 Years | 12 (4.6%) | 31 (11.4%) |
| 65 to 74 Years | 7 (13.2%) | 0 (0.0%) |
| 75 Years and over | 16 (37.2%) | 9 (18.4%) |
Disability Class: Cognitive Difficulty
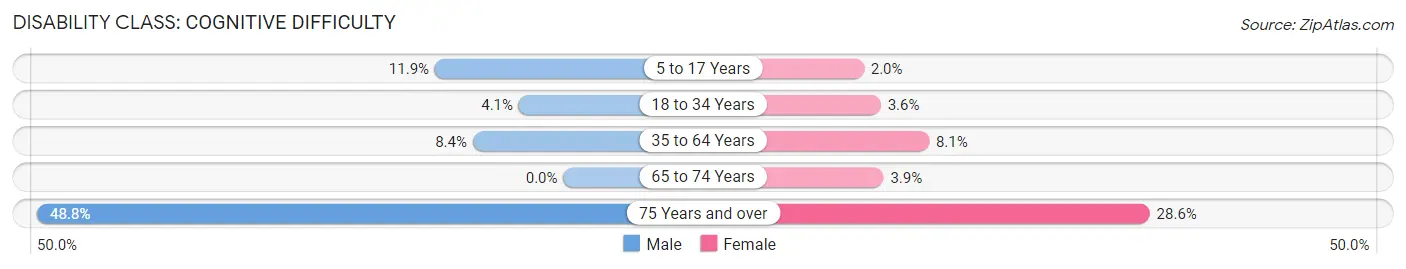
| Age Bracket | Male | Female |
| 5 to 17 Years | 18 (11.9%) | 2 (2.0%) |
| 18 to 34 Years | 5 (4.1%) | 6 (3.6%) |
| 35 to 64 Years | 22 (8.4%) | 22 (8.1%) |
| 65 to 74 Years | 0 (0.0%) | 6 (3.9%) |
| 75 Years and over | 21 (48.8%) | 14 (28.6%) |
Disability Class: Ambulatory Difficulty
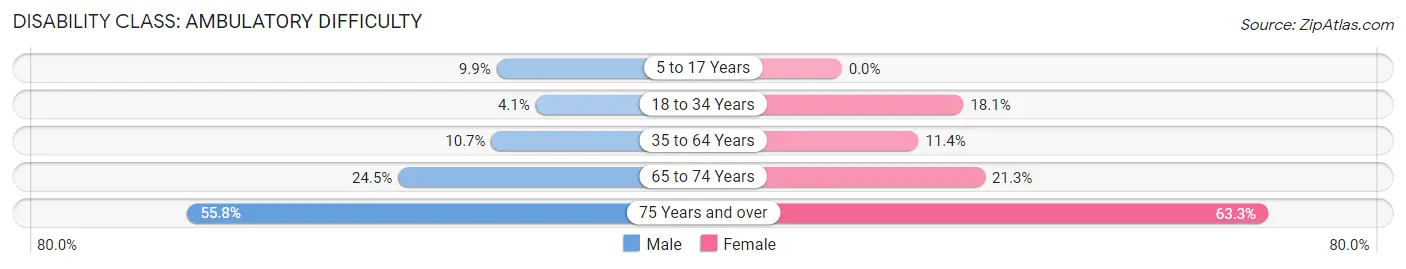
| Age Bracket | Male | Female |
| 5 to 17 Years | 15 (9.9%) | 0 (0.0%) |
| 18 to 34 Years | 5 (4.1%) | 30 (18.1%) |
| 35 to 64 Years | 28 (10.7%) | 31 (11.4%) |
| 65 to 74 Years | 13 (24.5%) | 33 (21.3%) |
| 75 Years and over | 24 (55.8%) | 31 (63.3%) |
Disability Class: Self-Care Difficulty
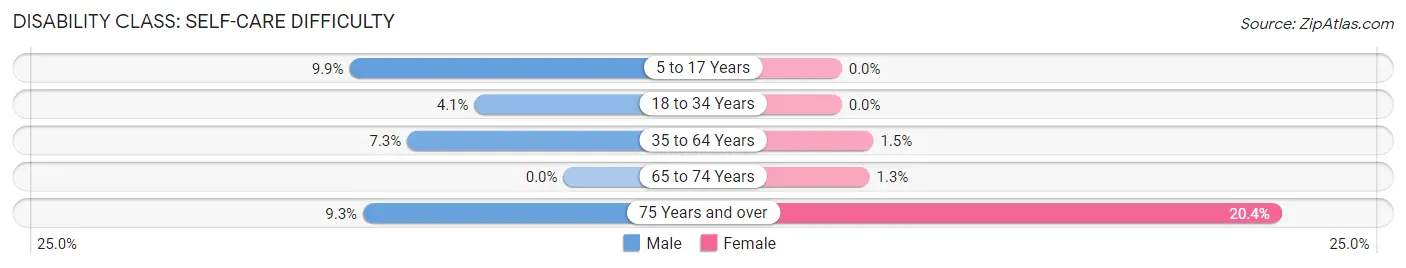
| Age Bracket | Male | Female |
| 5 to 17 Years | 15 (9.9%) | 0 (0.0%) |
| 18 to 34 Years | 5 (4.1%) | 0 (0.0%) |
| 35 to 64 Years | 19 (7.2%) | 4 (1.5%) |
| 65 to 74 Years | 0 (0.0%) | 2 (1.3%) |
| 75 Years and over | 4 (9.3%) | 10 (20.4%) |
Technology Access in Stamps
Computing Device Access in Stamps
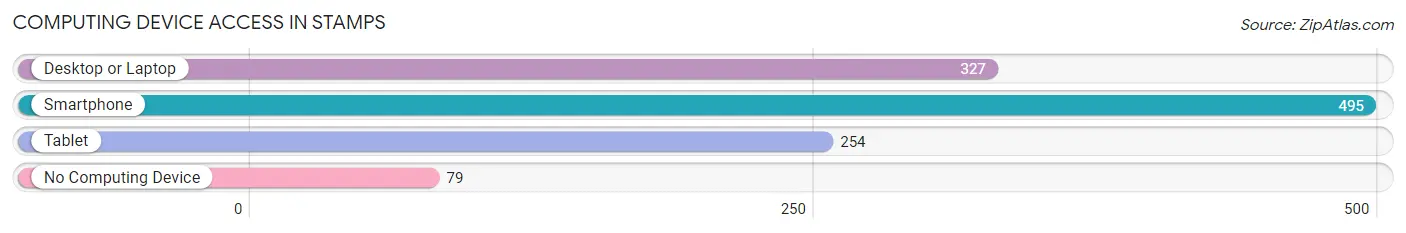
| Device Type | # Households | % Households |
| Desktop or Laptop | 327 | 52.1% |
| Smartphone | 495 | 78.8% |
| Tablet | 254 | 40.5% |
| No Computing Device | 79 | 12.6% |
| Total | 628 | 100.0% |
Internet Access in Stamps
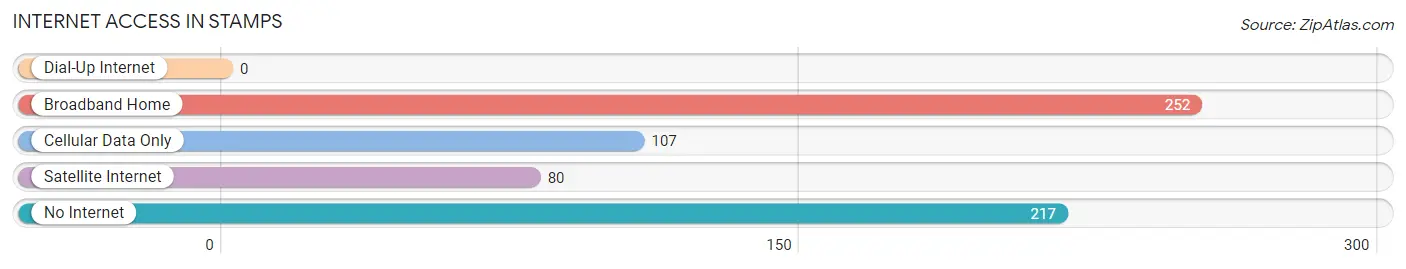
| Internet Type | # Households | % Households |
| Dial-Up Internet | 0 | 0.0% |
| Broadband Home | 252 | 40.1% |
| Cellular Data Only | 107 | 17.0% |
| Satellite Internet | 80 | 12.7% |
| No Internet | 217 | 34.5% |
| Total | 628 | 100.0% |
Stamps Summary
Stamps
Stamps are a form of currency used to pay for goods and services. They are issued by governments and are used to pay for postage, taxes, and other fees. Stamps are also used to commemorate special occasions, such as anniversaries, birthdays, and holidays. In the United States, stamps are issued by the United States Postal Service (USPS).
The first stamps were issued in the United States in 1847. The first stamps were called “Postage Stamps” and were used to pay for the cost of mailing a letter. The first stamps were printed in black and white and featured a profile of Benjamin Franklin. Over the years, stamps have become more colorful and feature a variety of images, including presidents, famous people, animals, and landscapes.
In addition to postage stamps, the USPS also issues commemorative stamps. These stamps are issued to honor special events, people, and places. The USPS has issued stamps to commemorate the 100th anniversary of the Statue of Liberty, the 50th anniversary of the Apollo 11 moon landing, and the 200th anniversary of the signing of the Declaration of Independence.
The USPS also issues special stamps for holidays, such as Christmas, Hanukkah, and Kwanzaa. These stamps feature festive images and are often used to decorate holiday cards and packages.
AR History
Arkansas is a state located in the southern United States. It is bordered by Missouri, Tennessee, Mississippi, Louisiana, Texas, and Oklahoma. Arkansas was admitted to the Union as the 25th state on June 15, 1836.
The first inhabitants of Arkansas were Native American tribes, including the Caddo, Osage, and Quapaw. The first Europeans to explore the area were Spanish explorers in the 16th century. The French later established settlements in the area, and the region became part of the United States in 1803 as part of the Louisiana Purchase.
Arkansas was a slave state during the Civil War, and it was the site of several battles. After the war, the state was readmitted to the Union in 1868. During the Reconstruction era, Arkansas was the first state to ratify the 15th Amendment, which granted African Americans the right to vote.
In the 20th century, Arkansas was a major producer of cotton and timber. The state also became a center for the poultry industry. In the 21st century, Arkansas has become a major center for technology and manufacturing.
Geography
Arkansas is located in the south-central United States. It is bordered by Missouri to the north, Tennessee and Mississippi to the east, Louisiana to the south, and Texas and Oklahoma to the west.
The state is divided into four distinct geographic regions: the Ozark Mountains in the northwest, the Ouachita Mountains in the west, the Arkansas Delta in the east, and the Arkansas Timberlands in the south.
The Ozark Mountains are a rugged, heavily forested region of the state. The highest point in Arkansas is Mount Magazine, which is located in the Ozarks.
The Ouachita Mountains are a range of low, rolling hills in the west. The highest point in the Ouachitas is Magazine Mountain.
The Arkansas Delta is a flat, fertile region in the east. The Arkansas River runs through the Delta, and it is a major source of irrigation for the region’s agricultural industry.
The Arkansas Timberlands are a region of dense forests in the south. The region is home to a variety of wildlife, including black bears, deer, and wild turkeys.
Economy
Arkansas’s economy is largely based on agriculture, manufacturing, and tourism. The state’s agricultural industry is the largest in the nation, and it produces a variety of crops, including cotton, soybeans, rice, and wheat.
The state’s manufacturing sector is also important, and it produces a variety of products, including chemicals, paper products, and food products.
Tourism is also an important part of the state’s economy. Arkansas is home to a variety of attractions, including Hot Springs National Park, the Ozark National Forest, and the Buffalo National River.
Demographics
As of 2020, the population of Arkansas was estimated to be 3.017 million. The state’s population is largely concentrated in the cities of Little Rock, Fort Smith, and Fayetteville.
The majority of the state’s population is white (76.2%), followed by African American (15.7%), Hispanic or Latino (6.2%), and Asian (1.7%). The state’s median household income is $48,919, and the poverty rate is 17.2%.
Common Questions
What is Per Capita Income in Stamps?
Per Capita income in Stamps is $19,400.
What is the Median Family Income in Stamps?
Median Family Income in Stamps is $47,946.
What is the Median Household income in Stamps?
Median Household Income in Stamps is $28,720.
What is Income or Wage Gap in Stamps?
Income or Wage Gap in Stamps is 5.2%.
Women in Stamps earn 94.8 cents for every dollar earned by a man.
What is Family Income Deficit in Stamps?
Family Income Deficit in Stamps is $9,879.
Families that are below poverty line in Stamps earn $9,879 less on average than the poverty threshold level.
What is Inequality or Gini Index in Stamps?
Inequality or Gini Index in Stamps is 0.52.
What is the Total Population of Stamps?
Total Population of Stamps is 1,481.
What is the Total Male Population of Stamps?
Total Male Population of Stamps is 669.
What is the Total Female Population of Stamps?
Total Female Population of Stamps is 812.
What is the Ratio of Males per 100 Females in Stamps?
There are 82.39 Males per 100 Females in Stamps.
What is the Ratio of Females per 100 Males in Stamps?
There are 121.38 Females per 100 Males in Stamps.
What is the Median Population Age in Stamps?
Median Population Age in Stamps is 39.6 Years.
What is the Average Family Size in Stamps
Average Family Size in Stamps is 3.6 People.
What is the Average Household Size in Stamps
Average Household Size in Stamps is 2.3 People.
How Large is the Labor Force in Stamps?
There are 554 People in the Labor Forcein in Stamps.
What is the Percentage of People in the Labor Force in Stamps?
45.6% of People are in the Labor Force in Stamps.
What is the Unemployment Rate in Stamps?
Unemployment Rate in Stamps is 19.7%.