Sparkman, AR Map & Demographics
Sparkman Map
Sparkman Overview
$22,077
PER CAPITA INCOME
$44,375
AVG FAMILY INCOME
$35,870
AVG HOUSEHOLD INCOME
16.5%
WAGE / INCOME GAP [ % ]
83.5¢/ $1
WAGE / INCOME GAP [ $ ]
$8,971
FAMILY INCOME DEFICIT
0.45
INEQUALITY / GINI INDEX
523
TOTAL POPULATION
253
MALE POPULATION
270
FEMALE POPULATION
93.70
MALES / 100 FEMALES
106.72
FEMALES / 100 MALES
42.4
MEDIAN AGE
3.8
AVG FAMILY SIZE
3.1
AVG HOUSEHOLD SIZE
197
LABOR FORCE [ PEOPLE ]
45.8%
PERCENT IN LABOR FORCE
4.6%
UNEMPLOYMENT RATE
Sparkman Zip Codes
Sparkman Area Codes
Income in Sparkman
Income Overview in Sparkman
Per Capita Income in Sparkman is $22,077, while median incomes of families and households are $44,375 and $35,870 respectively.
| Characteristic | Number | Measure |
| Per Capita Income | 523 | $22,077 |
| Median Family Income | 117 | $44,375 |
| Mean Family Income | 117 | $60,840 |
| Median Household Income | 166 | $35,870 |
| Mean Household Income | 166 | $50,087 |
| Income Deficit | 117 | $8,971 |
| Wage / Income Gap (%) | 523 | 16.52% |
| Wage / Income Gap ($) | 523 | 83.48¢ per $1 |
| Gini / Inequality Index | 523 | 0.45 |
Earnings by Sex in Sparkman
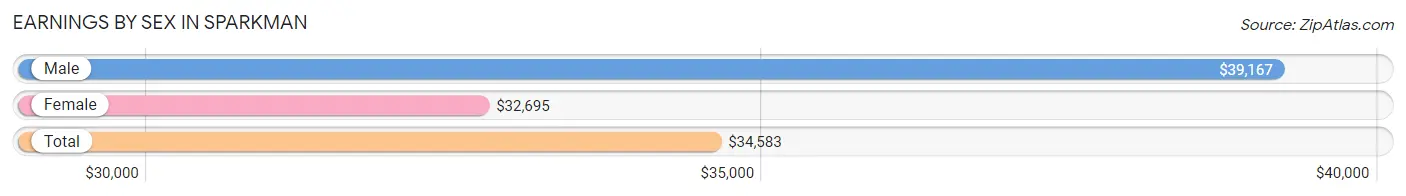
Average Earnings in Sparkman are $34,583, $39,167 for men and $32,695 for women, a difference of 16.5%.
| Sex | Number | Average Earnings |
| Male | 96 (48.7%) | $39,167 |
| Female | 101 (51.3%) | $32,695 |
| Total | 197 (100.0%) | $34,583 |
Earnings by Sex by Income Bracket in Sparkman
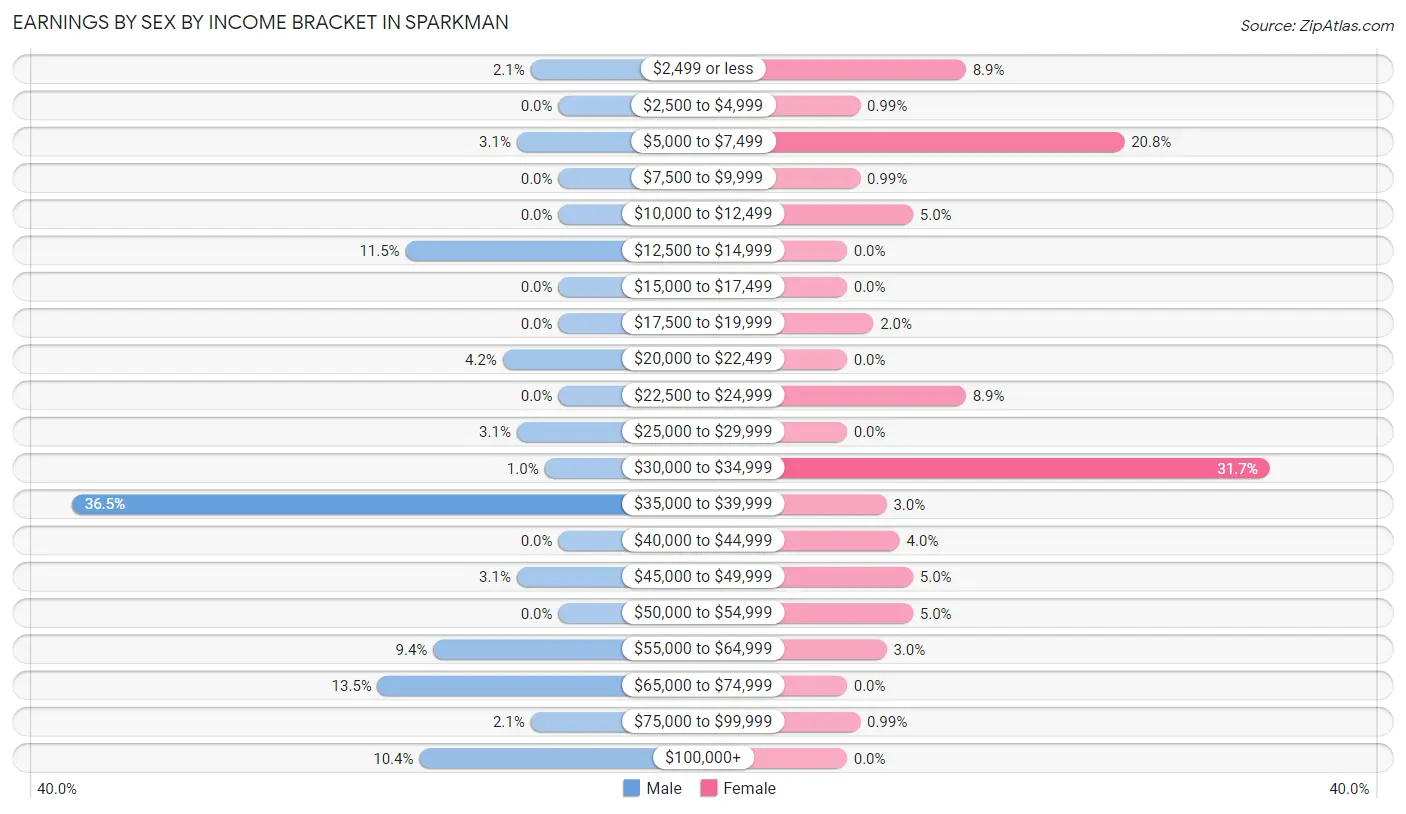
The most common earnings brackets in Sparkman are $35,000 to $39,999 for men (35 | 36.5%) and $30,000 to $34,999 for women (32 | 31.7%).
| Income | Male | Female |
| $2,499 or less | 2 (2.1%) | 9 (8.9%) |
| $2,500 to $4,999 | 0 (0.0%) | 1 (1.0%) |
| $5,000 to $7,499 | 3 (3.1%) | 21 (20.8%) |
| $7,500 to $9,999 | 0 (0.0%) | 1 (1.0%) |
| $10,000 to $12,499 | 0 (0.0%) | 5 (5.0%) |
| $12,500 to $14,999 | 11 (11.5%) | 0 (0.0%) |
| $15,000 to $17,499 | 0 (0.0%) | 0 (0.0%) |
| $17,500 to $19,999 | 0 (0.0%) | 2 (2.0%) |
| $20,000 to $22,499 | 4 (4.2%) | 0 (0.0%) |
| $22,500 to $24,999 | 0 (0.0%) | 9 (8.9%) |
| $25,000 to $29,999 | 3 (3.1%) | 0 (0.0%) |
| $30,000 to $34,999 | 1 (1.0%) | 32 (31.7%) |
| $35,000 to $39,999 | 35 (36.5%) | 3 (3.0%) |
| $40,000 to $44,999 | 0 (0.0%) | 4 (4.0%) |
| $45,000 to $49,999 | 3 (3.1%) | 5 (5.0%) |
| $50,000 to $54,999 | 0 (0.0%) | 5 (5.0%) |
| $55,000 to $64,999 | 9 (9.4%) | 3 (3.0%) |
| $65,000 to $74,999 | 13 (13.5%) | 0 (0.0%) |
| $75,000 to $99,999 | 2 (2.1%) | 1 (1.0%) |
| $100,000+ | 10 (10.4%) | 0 (0.0%) |
| Total | 96 (100.0%) | 101 (100.0%) |
Earnings by Sex by Educational Attainment in Sparkman
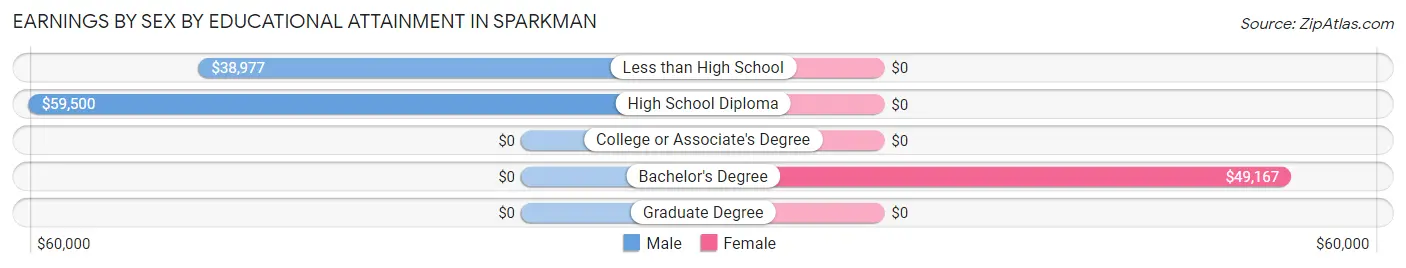
Average earnings in Sparkman are $39,280 for men and $32,930 for women, a difference of 16.2%. Men with an educational attainment of high school diploma enjoy the highest average annual earnings of $59,500, while those with less than high school education earn the least with $38,977. Women with an educational attainment of bachelor's degree earn the most with the average annual earnings of $49,167, while those with bachelor's degree education have the smallest earnings of $49,167.
| Educational Attainment | Male Income | Female Income |
| Less than High School | $38,977 | $0 |
| High School Diploma | $59,500 | $0 |
| College or Associate's Degree | - | - |
| Bachelor's Degree | - | - |
| Graduate Degree | - | - |
| Total | $39,280 | $32,930 |
Family Income in Sparkman
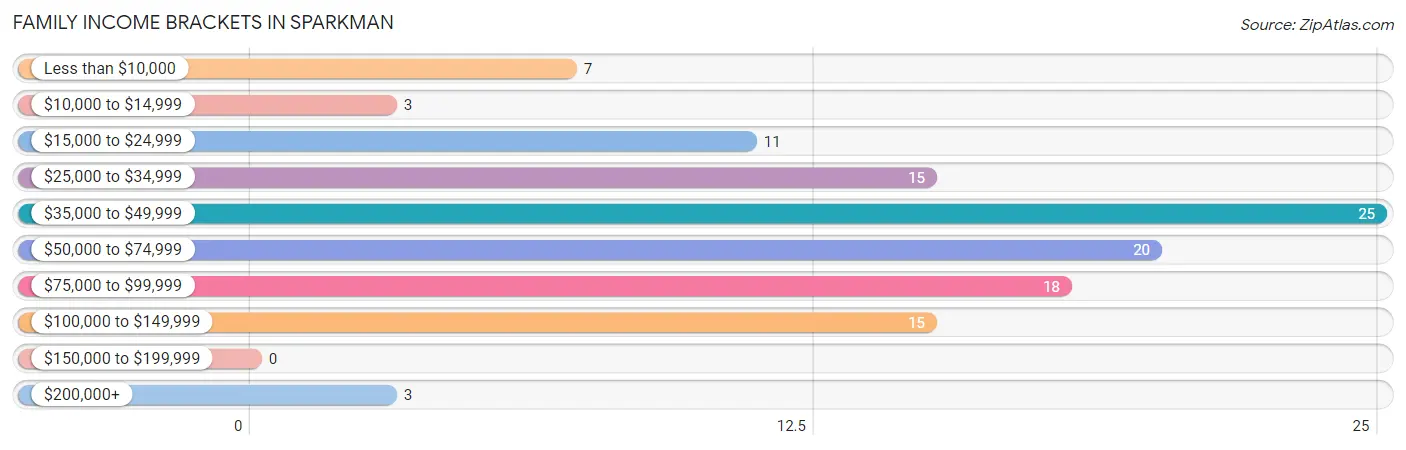
Family Income Brackets in Sparkman
According to the Sparkman family income data, there are 25 families falling into the $35,000 to $49,999 income range, which is the most common income bracket and makes up 21.4% of all families.
| Income Bracket | # Families | % Families |
| Less than $10,000 | 7 | 6.0% |
| $10,000 to $14,999 | 3 | 2.6% |
| $15,000 to $24,999 | 11 | 9.4% |
| $25,000 to $34,999 | 15 | 12.8% |
| $35,000 to $49,999 | 25 | 21.4% |
| $50,000 to $74,999 | 20 | 17.1% |
| $75,000 to $99,999 | 18 | 15.4% |
| $100,000 to $149,999 | 15 | 12.8% |
| $150,000 to $199,999 | 0 | 0.0% |
| $200,000+ | 3 | 2.6% |
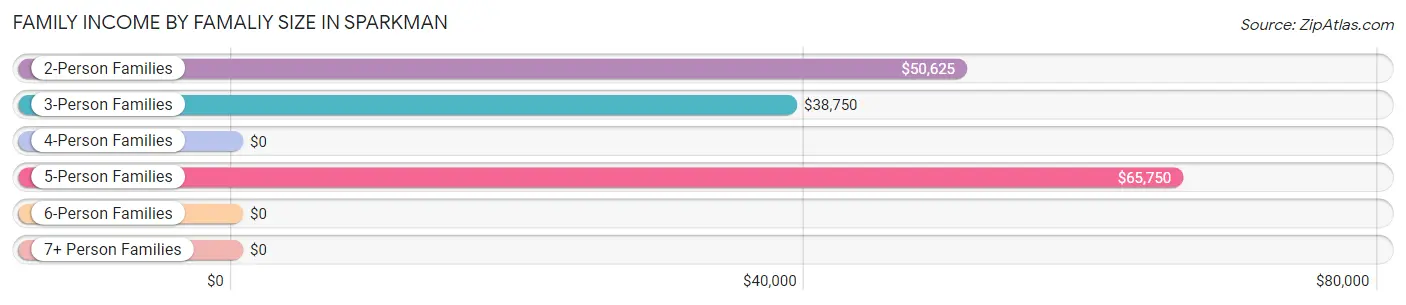
Family Income by Famaliy Size in Sparkman
5-person families (9 | 7.7%) account for the highest median family income in Sparkman with $65,750 per family, while 2-person families (73 | 62.4%) have the highest median income of $25,312 per family member.
| Income Bracket | # Families | Median Income |
| 2-Person Families | 73 (62.4%) | $50,625 |
| 3-Person Families | 27 (23.1%) | $38,750 |
| 4-Person Families | 5 (4.3%) | $0 |
| 5-Person Families | 9 (7.7%) | $65,750 |
| 6-Person Families | 0 (0.0%) | $0 |
| 7+ Person Families | 3 (2.6%) | $0 |
| Total | 117 (100.0%) | $44,375 |
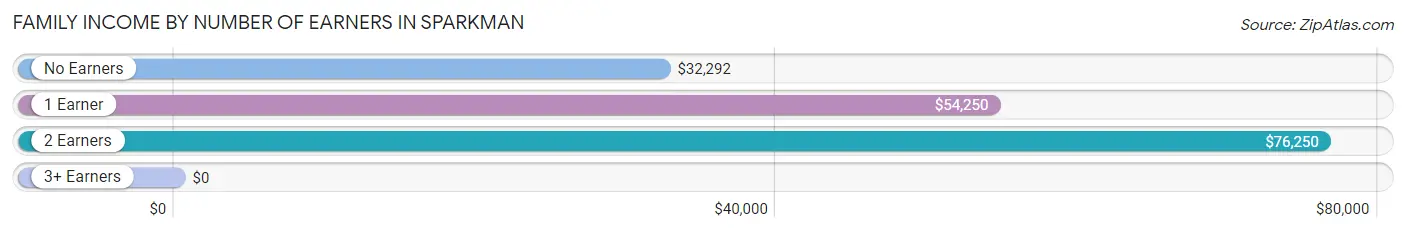
Family Income by Number of Earners in Sparkman
| Number of Earners | # Families | Median Income |
| No Earners | 37 (31.6%) | $32,292 |
| 1 Earner | 47 (40.2%) | $54,250 |
| 2 Earners | 32 (27.4%) | $76,250 |
| 3+ Earners | 1 (0.9%) | $0 |
| Total | 117 (100.0%) | $44,375 |
Household Income in Sparkman
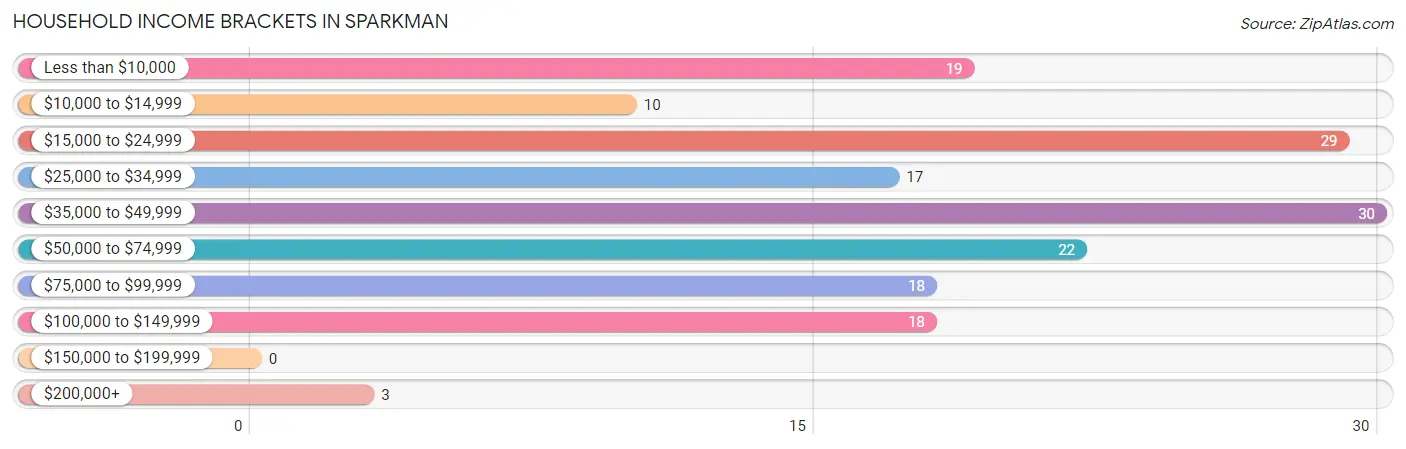
Household Income Brackets in Sparkman
With 30 households falling in the category, the $35,000 to $49,999 income range is the most frequent in Sparkman, accounting for 18.1% of all households.
| Income Bracket | # Households | % Households |
| Less than $10,000 | 19 | 11.4% |
| $10,000 to $14,999 | 10 | 6.0% |
| $15,000 to $24,999 | 29 | 17.5% |
| $25,000 to $34,999 | 17 | 10.2% |
| $35,000 to $49,999 | 30 | 18.1% |
| $50,000 to $74,999 | 22 | 13.3% |
| $75,000 to $99,999 | 18 | 10.8% |
| $100,000 to $149,999 | 18 | 10.8% |
| $150,000 to $199,999 | 0 | 0.0% |
| $200,000+ | 3 | 1.8% |
Household Income by Householder Age in Sparkman
The median household income in Sparkman is $35,870, with the highest median household income of $60,500 found in the 25 to 44 years age bracket for the primary householder. A total of 40 households (24.1%) fall into this category. Meanwhile, the 15 to 24 years age bracket for the primary householder has the lowest median household income of $0, with 5 households (3.0%) in this group.
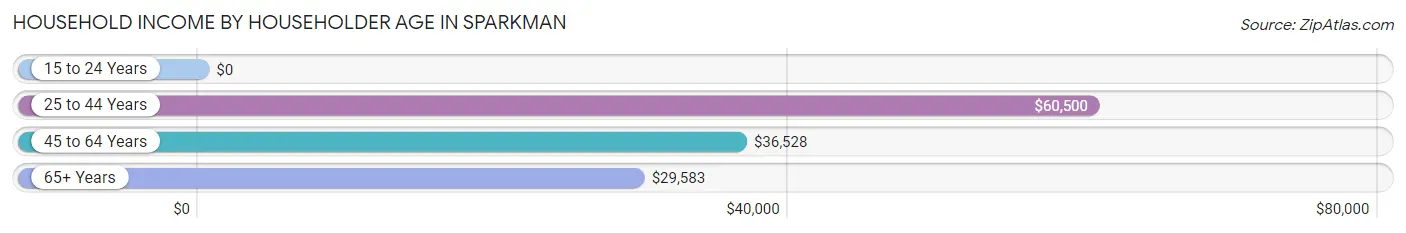
| Income Bracket | # Households | Median Income |
| 15 to 24 Years | 5 (3.0%) | $0 |
| 25 to 44 Years | 40 (24.1%) | $60,500 |
| 45 to 64 Years | 64 (38.6%) | $36,528 |
| 65+ Years | 57 (34.3%) | $29,583 |
| Total | 166 (100.0%) | $35,870 |
Poverty in Sparkman
Income Below Poverty by Sex and Age in Sparkman
With 25.3% poverty level for males and 25.9% for females among the residents of Sparkman, 12 to 14 year old males and 5 year old females are the most vulnerable to poverty, with 4 males (100.0%) and 2 females (100.0%) in their respective age groups living below the poverty level.
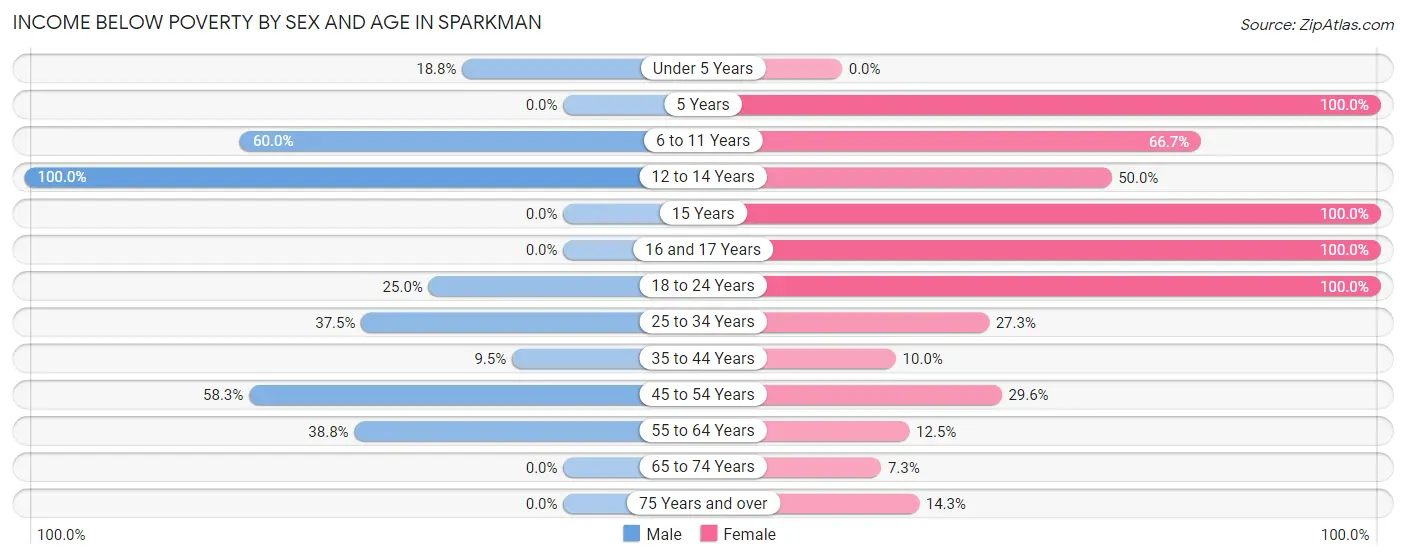
| Age Bracket | Male | Female |
| Under 5 Years | 6 (18.8%) | 0 (0.0%) |
| 5 Years | 0 (0.0%) | 2 (100.0%) |
| 6 to 11 Years | 18 (60.0%) | 6 (66.7%) |
| 12 to 14 Years | 4 (100.0%) | 1 (50.0%) |
| 15 Years | 0 (0.0%) | 1 (100.0%) |
| 16 and 17 Years | 0 (0.0%) | 1 (100.0%) |
| 18 to 24 Years | 1 (25.0%) | 26 (100.0%) |
| 25 to 34 Years | 3 (37.5%) | 9 (27.3%) |
| 35 to 44 Years | 6 (9.5%) | 4 (10.0%) |
| 45 to 54 Years | 7 (58.3%) | 8 (29.6%) |
| 55 to 64 Years | 19 (38.8%) | 5 (12.5%) |
| 65 to 74 Years | 0 (0.0%) | 4 (7.3%) |
| 75 Years and over | 0 (0.0%) | 3 (14.3%) |
| Total | 64 (25.3%) | 70 (25.9%) |
Income Above Poverty by Sex and Age in Sparkman
According to the poverty statistics in Sparkman, males aged 65 to 74 years and females aged under 5 years are the age groups that are most secure financially, with 100.0% of males and 100.0% of females in these age groups living above the poverty line.
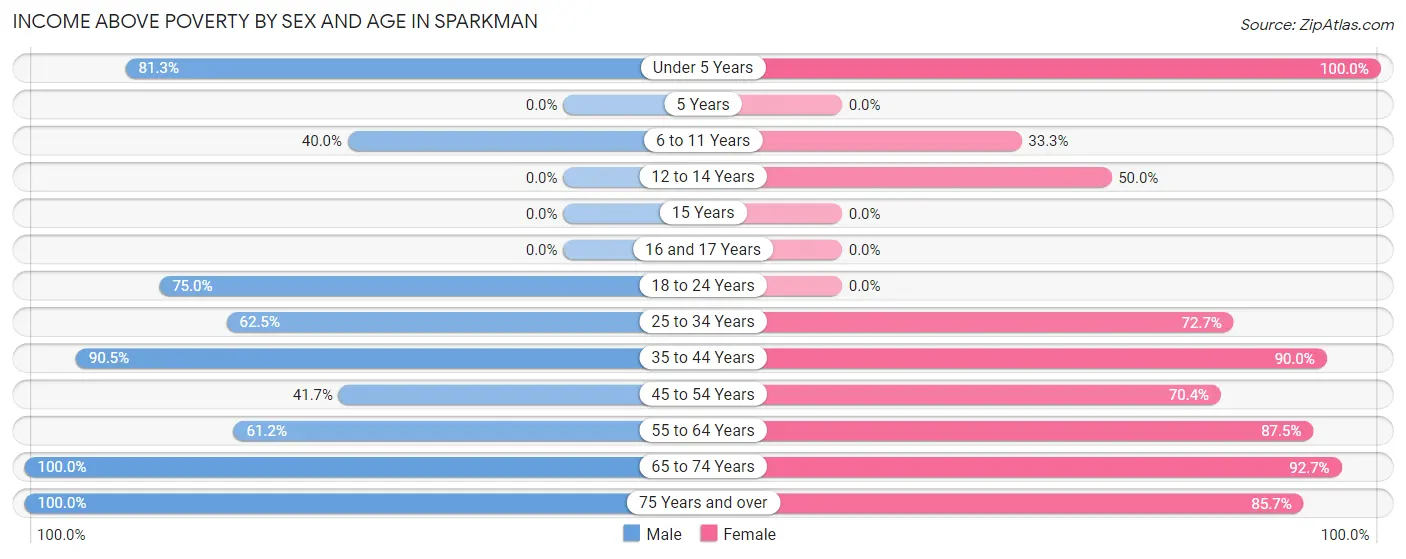
| Age Bracket | Male | Female |
| Under 5 Years | 26 (81.2%) | 13 (100.0%) |
| 5 Years | 0 (0.0%) | 0 (0.0%) |
| 6 to 11 Years | 12 (40.0%) | 3 (33.3%) |
| 12 to 14 Years | 0 (0.0%) | 1 (50.0%) |
| 15 Years | 0 (0.0%) | 0 (0.0%) |
| 16 and 17 Years | 0 (0.0%) | 0 (0.0%) |
| 18 to 24 Years | 3 (75.0%) | 0 (0.0%) |
| 25 to 34 Years | 5 (62.5%) | 24 (72.7%) |
| 35 to 44 Years | 57 (90.5%) | 36 (90.0%) |
| 45 to 54 Years | 5 (41.7%) | 19 (70.4%) |
| 55 to 64 Years | 30 (61.2%) | 35 (87.5%) |
| 65 to 74 Years | 49 (100.0%) | 51 (92.7%) |
| 75 Years and over | 2 (100.0%) | 18 (85.7%) |
| Total | 189 (74.7%) | 200 (74.1%) |
Income Below Poverty Among Married-Couple Families in Sparkman
The poverty statistics for married-couple families in Sparkman show that 14.6% or 12 of the total 82 families live below the poverty line. Families with 3 or 4 children have the highest poverty rate of 100.0%, comprising of 3 families. On the other hand, families with 1 or 2 children have the lowest poverty rate of 0.0%, which includes 0 families.
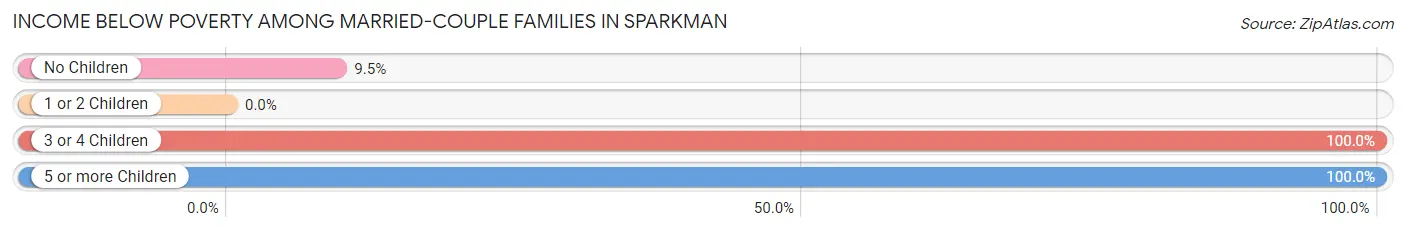
| Children | Above Poverty | Below Poverty |
| No Children | 57 (90.5%) | 6 (9.5%) |
| 1 or 2 Children | 13 (100.0%) | 0 (0.0%) |
| 3 or 4 Children | 0 (0.0%) | 3 (100.0%) |
| 5 or more Children | 0 (0.0%) | 3 (100.0%) |
| Total | 70 (85.4%) | 12 (14.6%) |
Income Below Poverty Among Single-Parent Households in Sparkman
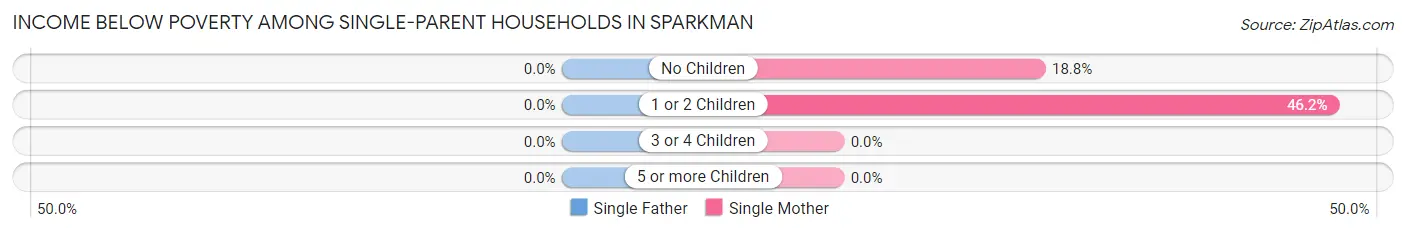
| Children | Single Father | Single Mother |
| No Children | 0 (0.0%) | 3 (18.8%) |
| 1 or 2 Children | 0 (0.0%) | 6 (46.2%) |
| 3 or 4 Children | 0 (0.0%) | 0 (0.0%) |
| 5 or more Children | 0 (0.0%) | 0 (0.0%) |
| Total | 0 (0.0%) | 9 (31.0%) |
Income Below Poverty Among Married-Couple vs Single-Parent Households in Sparkman
The poverty data for Sparkman shows that 12 of the married-couple family households (14.6%) and 9 of the single-parent households (25.7%) are living below the poverty level. Within the married-couple family households, those with 3 or 4 children have the highest poverty rate, with 3 households (100.0%) falling below the poverty line. Among the single-parent households, those with 1 or 2 children have the highest poverty rate, with 6 household (46.2%) living below poverty.
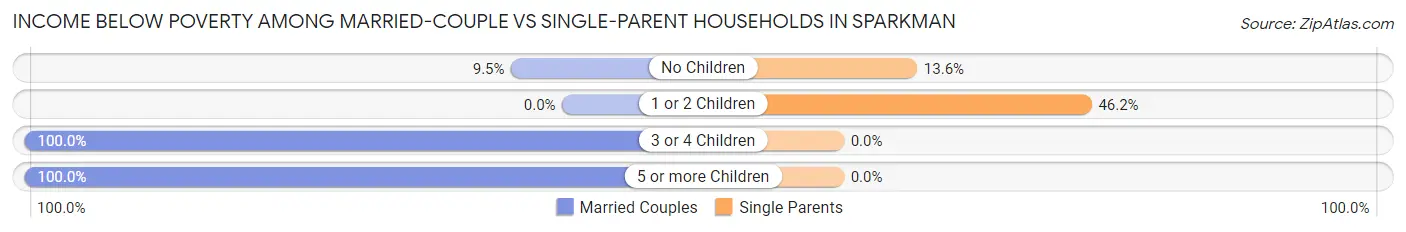
| Children | Married-Couple Families | Single-Parent Households |
| No Children | 6 (9.5%) | 3 (13.6%) |
| 1 or 2 Children | 0 (0.0%) | 6 (46.2%) |
| 3 or 4 Children | 3 (100.0%) | 0 (0.0%) |
| 5 or more Children | 3 (100.0%) | 0 (0.0%) |
| Total | 12 (14.6%) | 9 (25.7%) |
Race in Sparkman
The most populous races in Sparkman are White / Caucasian (401 | 76.7%), Black / African American (110 | 21.0%), and Two or more Races (12 | 2.3%).
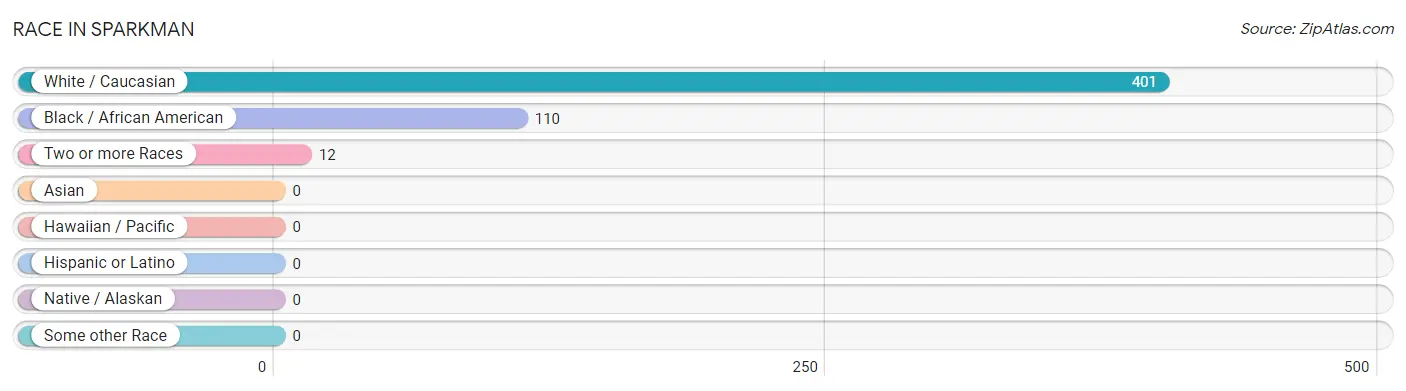
| Race | # Population | % Population |
| Asian | 0 | 0.0% |
| Black / African American | 110 | 21.0% |
| Hawaiian / Pacific | 0 | 0.0% |
| Hispanic or Latino | 0 | 0.0% |
| Native / Alaskan | 0 | 0.0% |
| White / Caucasian | 401 | 76.7% |
| Two or more Races | 12 | 2.3% |
| Some other Race | 0 | 0.0% |
| Total | 523 | 100.0% |
Ancestry in Sparkman
The most populous ancestries reported in Sparkman are English (35 | 6.7%), German (35 | 6.7%), Irish (29 | 5.5%), European (9 | 1.7%), and African (7 | 1.3%), together accounting for 22.0% of all Sparkman residents.
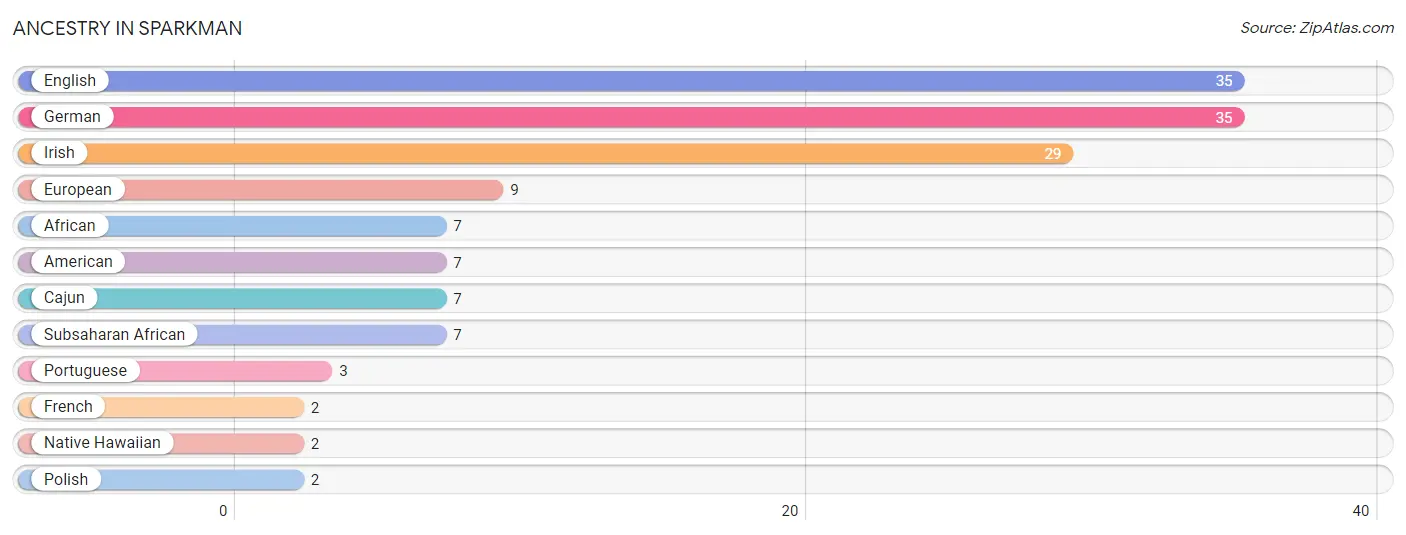
| Ancestry | # Population | % Population |
| African | 7 | 1.3% |
| American | 7 | 1.3% |
| Cajun | 7 | 1.3% |
| English | 35 | 6.7% |
| European | 9 | 1.7% |
| French | 2 | 0.4% |
| German | 35 | 6.7% |
| Irish | 29 | 5.5% |
| Native Hawaiian | 2 | 0.4% |
| Polish | 2 | 0.4% |
| Portuguese | 3 | 0.6% |
| Subsaharan African | 7 | 1.3% | View All 12 Rows |
Immigrants in Sparkman

| Immigration Origin | # Population | % Population | View All 0 Rows |
Sex and Age in Sparkman
Sex and Age in Sparkman
The most populous age groups in Sparkman are 35 to 39 Years (58 | 22.9%) for men and 65 to 69 Years (48 | 17.8%) for women.
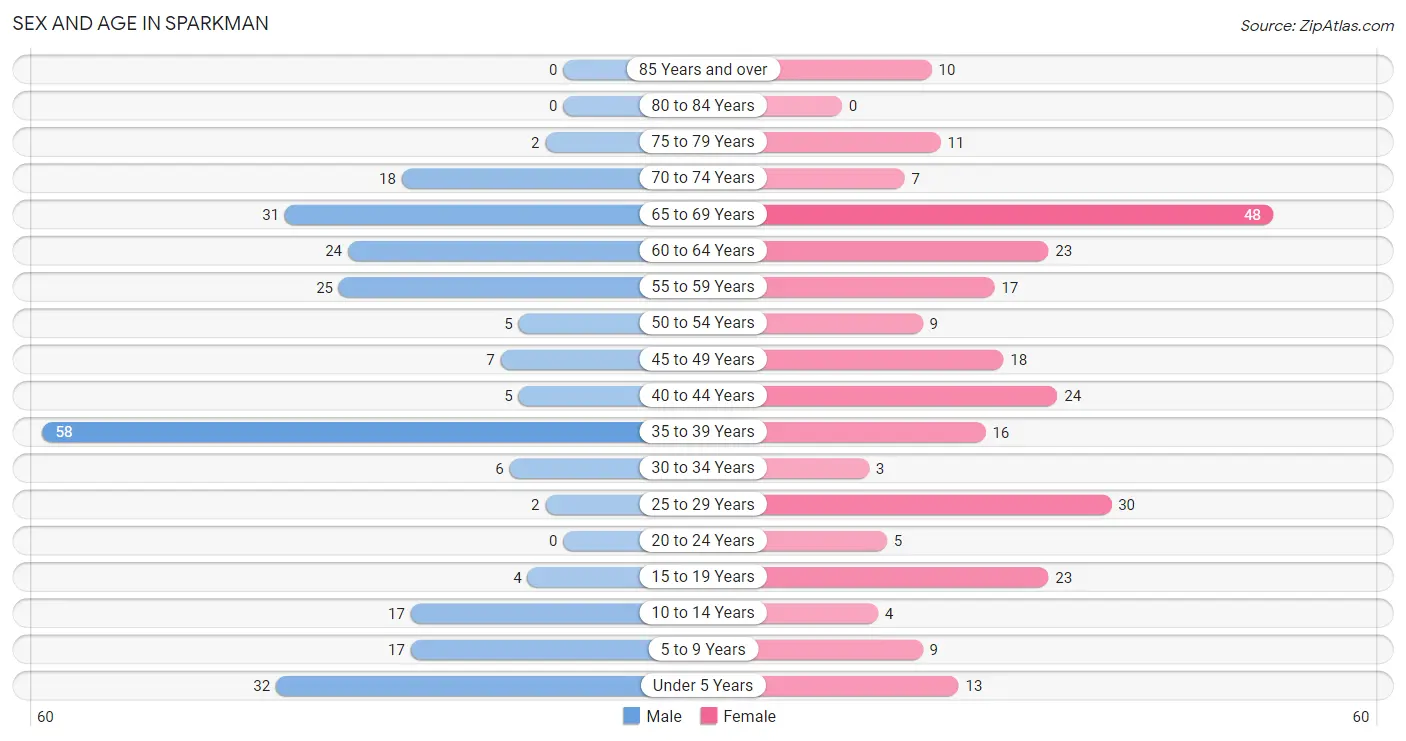
| Age Bracket | Male | Female |
| Under 5 Years | 32 (12.7%) | 13 (4.8%) |
| 5 to 9 Years | 17 (6.7%) | 9 (3.3%) |
| 10 to 14 Years | 17 (6.7%) | 4 (1.5%) |
| 15 to 19 Years | 4 (1.6%) | 23 (8.5%) |
| 20 to 24 Years | 0 (0.0%) | 5 (1.8%) |
| 25 to 29 Years | 2 (0.8%) | 30 (11.1%) |
| 30 to 34 Years | 6 (2.4%) | 3 (1.1%) |
| 35 to 39 Years | 58 (22.9%) | 16 (5.9%) |
| 40 to 44 Years | 5 (2.0%) | 24 (8.9%) |
| 45 to 49 Years | 7 (2.8%) | 18 (6.7%) |
| 50 to 54 Years | 5 (2.0%) | 9 (3.3%) |
| 55 to 59 Years | 25 (9.9%) | 17 (6.3%) |
| 60 to 64 Years | 24 (9.5%) | 23 (8.5%) |
| 65 to 69 Years | 31 (12.2%) | 48 (17.8%) |
| 70 to 74 Years | 18 (7.1%) | 7 (2.6%) |
| 75 to 79 Years | 2 (0.8%) | 11 (4.1%) |
| 80 to 84 Years | 0 (0.0%) | 0 (0.0%) |
| 85 Years and over | 0 (0.0%) | 10 (3.7%) |
| Total | 253 (100.0%) | 270 (100.0%) |
Families and Households in Sparkman
Median Family Size in Sparkman
The median family size in Sparkman is 3.83 persons per family, with single female/mother families (29 | 24.8%) accounting for the largest median family size of 5.52 persons per family. On the other hand, married-couple families (82 | 70.1%) represent the smallest median family size with 3.17 persons per family.
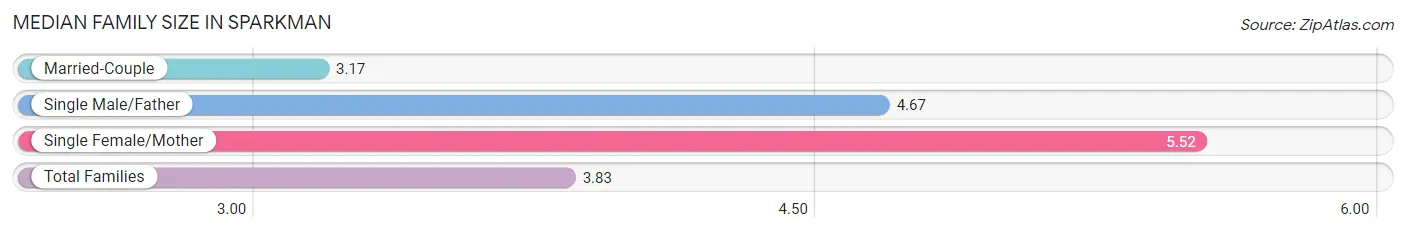
| Family Type | # Families | Family Size |
| Married-Couple | 82 (70.1%) | 3.17 |
| Single Male/Father | 6 (5.1%) | 4.67 |
| Single Female/Mother | 29 (24.8%) | 5.52 |
| Total Families | 117 (100.0%) | 3.83 |
Median Household Size in Sparkman
The median household size in Sparkman is 3.15 persons per household, with single female/mother households (29 | 17.5%) accounting for the largest median household size of 5.52 persons per household. non-family households (49 | 29.5%) represent the smallest median household size with 1.10 persons per household.
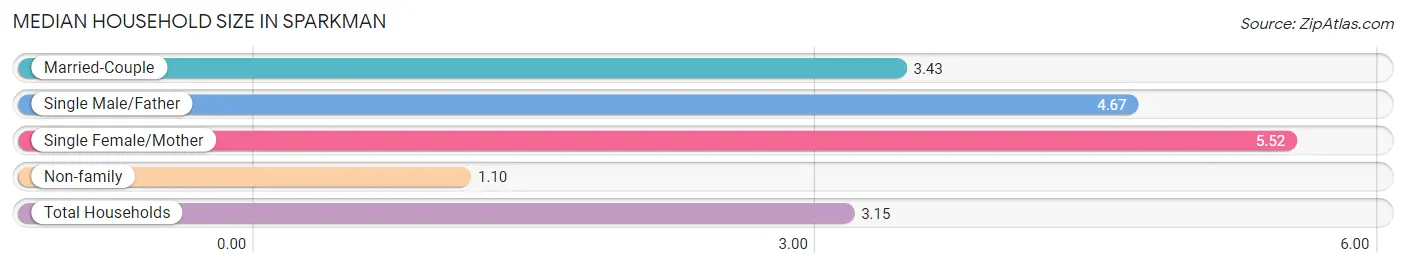
| Household Type | # Households | Household Size |
| Married-Couple | 82 (49.4%) | 3.43 |
| Single Male/Father | 6 (3.6%) | 4.67 |
| Single Female/Mother | 29 (17.5%) | 5.52 |
| Non-family | 49 (29.5%) | 1.10 |
| Total Households | 166 (100.0%) | 3.15 |
Household Size by Marriage Status in Sparkman
Out of a total of 166 households in Sparkman, 117 (70.5%) are family households, while 49 (29.5%) are nonfamily households. The most numerous type of family households are 2-person households, comprising 73, and the most common type of nonfamily households are 1-person households, comprising 44.
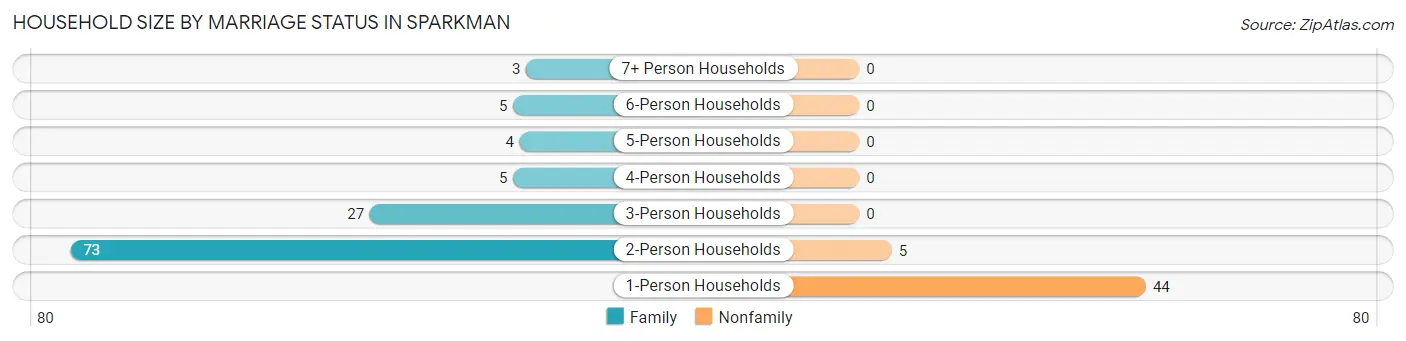
| Household Size | Family Households | Nonfamily Households |
| 1-Person Households | - | 44 (26.5%) |
| 2-Person Households | 73 (44.0%) | 5 (3.0%) |
| 3-Person Households | 27 (16.3%) | 0 (0.0%) |
| 4-Person Households | 5 (3.0%) | 0 (0.0%) |
| 5-Person Households | 4 (2.4%) | 0 (0.0%) |
| 6-Person Households | 5 (3.0%) | 0 (0.0%) |
| 7+ Person Households | 3 (1.8%) | 0 (0.0%) |
| Total | 117 (70.5%) | 49 (29.5%) |
Female Fertility in Sparkman
Fertility by Age in Sparkman
Average fertility rate in Sparkman is 95.0 births per 1,000 women. Women in the age bracket of 20 to 34 years have the highest fertility rate with 184.0 births per 1,000 women. Women in the age bracket of 20 to 34 years acount for 58.3% of all women with births.
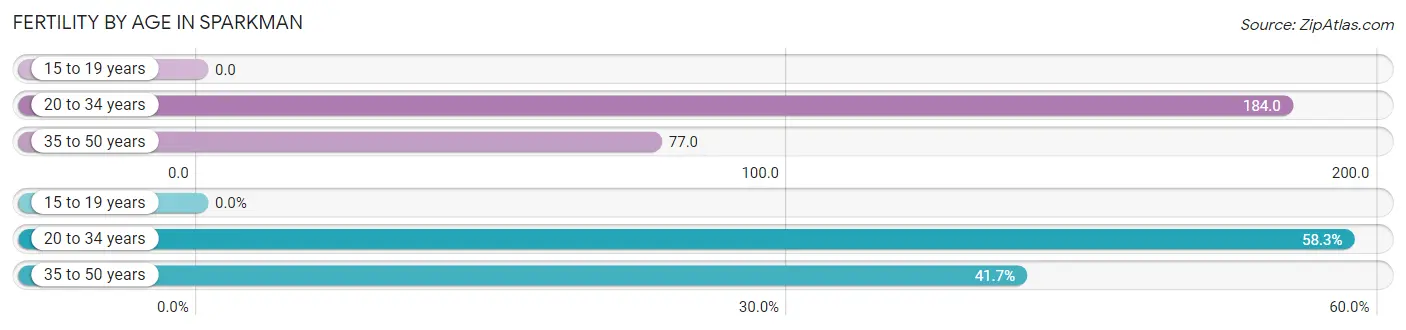
| Age Bracket | Women with Births | Births / 1,000 Women |
| 15 to 19 years | 0 (0.0%) | 0.0 |
| 20 to 34 years | 7 (58.3%) | 184.0 |
| 35 to 50 years | 5 (41.7%) | 77.0 |
| Total | 12 (100.0%) | 95.0 |
Fertility by Age by Marriage Status in Sparkman
33.3% of women with births (12) in Sparkman are married. The highest percentage of unmarried women with births falls into 20 to 34 years age bracket with 71.4% of them unmarried at the time of birth, while the lowest percentage of unmarried women with births belong to 35 to 50 years age bracket with 60.0% of them unmarried.
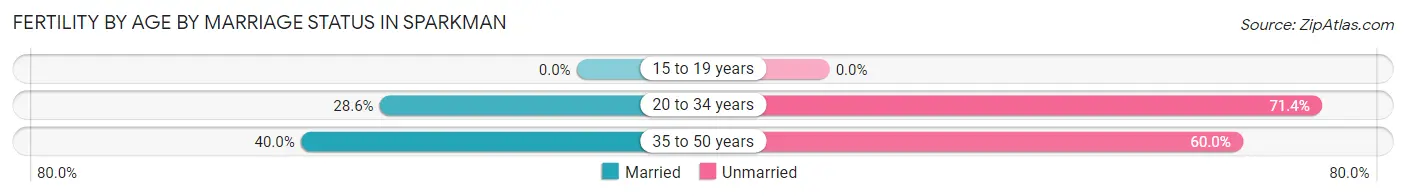
| Age Bracket | Married | Unmarried |
| 15 to 19 years | 0 (0.0%) | 0 (0.0%) |
| 20 to 34 years | 2 (28.6%) | 5 (71.4%) |
| 35 to 50 years | 2 (40.0%) | 3 (60.0%) |
| Total | 4 (33.3%) | 8 (66.7%) |
Fertility by Education in Sparkman
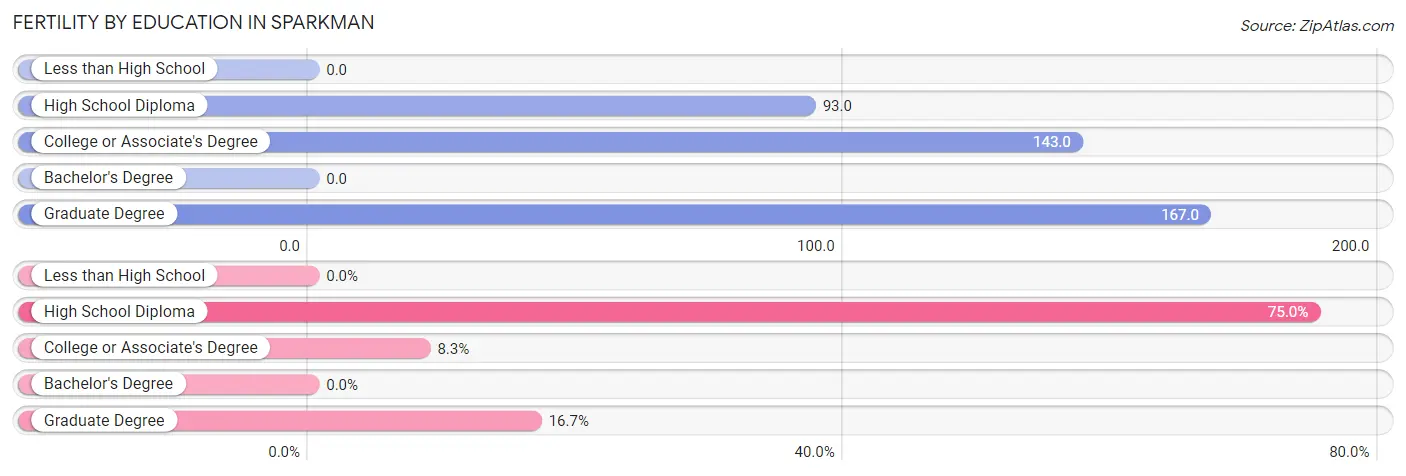
| Educational Attainment | Women with Births | Births / 1,000 Women |
| Less than High School | 0 (0.0%) | 0.0 |
| High School Diploma | 9 (75.0%) | 93.0 |
| College or Associate's Degree | 1 (8.3%) | 143.0 |
| Bachelor's Degree | 0 (0.0%) | 0.0 |
| Graduate Degree | 2 (16.7%) | 167.0 |
| Total | 12 (100.0%) | 95.0 |
Fertility by Education by Marriage Status in Sparkman
66.7% of women with births in Sparkman are unmarried. Women with the educational attainment of college or associate's degree are most likely to be married with 100.0% of them married at childbirth, while women with the educational attainment of high school diploma are least likely to be married with 88.9% of them unmarried at childbirth.
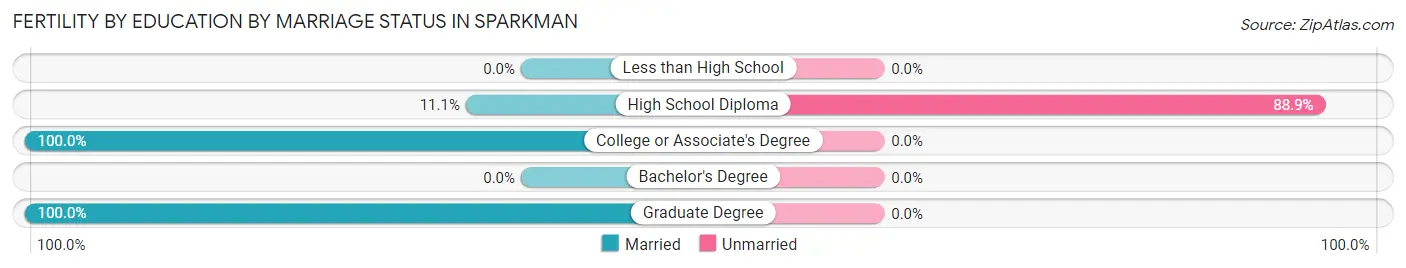
| Educational Attainment | Married | Unmarried |
| Less than High School | 0 (0.0%) | 0 (0.0%) |
| High School Diploma | 1 (11.1%) | 8 (88.9%) |
| College or Associate's Degree | 1 (100.0%) | 0 (0.0%) |
| Bachelor's Degree | 0 (0.0%) | 0 (0.0%) |
| Graduate Degree | 2 (100.0%) | 0 (0.0%) |
| Total | 4 (33.3%) | 8 (66.7%) |
Employment Characteristics in Sparkman
Employment by Class of Employer in Sparkman
Among the 188 employed individuals in Sparkman, private company employees (133 | 70.7%), local government employees (38 | 20.2%), and federal government employees (8 | 4.3%) make up the most common classes of employment.
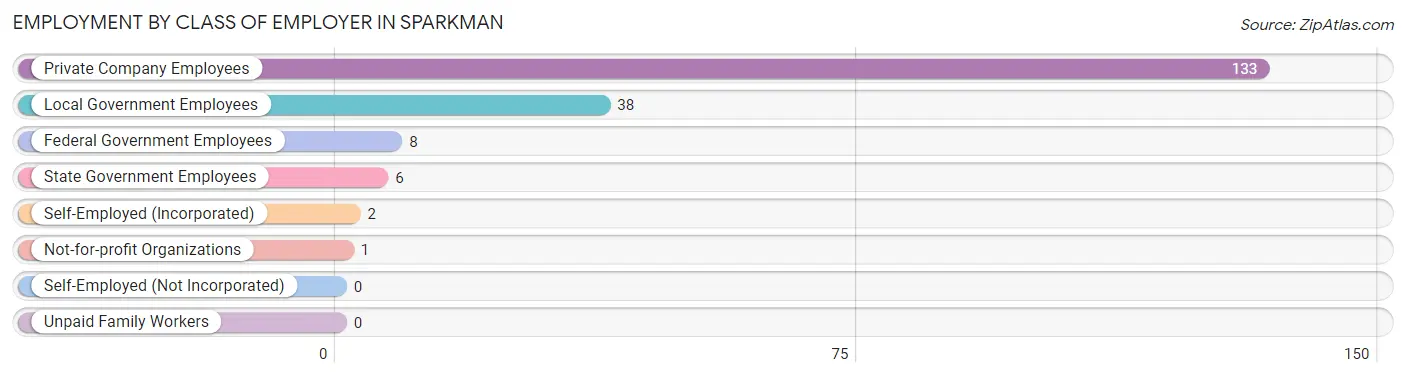
| Employer Class | # Employees | % Employees |
| Private Company Employees | 133 | 70.7% |
| Self-Employed (Incorporated) | 2 | 1.1% |
| Self-Employed (Not Incorporated) | 0 | 0.0% |
| Not-for-profit Organizations | 1 | 0.5% |
| Local Government Employees | 38 | 20.2% |
| State Government Employees | 6 | 3.2% |
| Federal Government Employees | 8 | 4.3% |
| Unpaid Family Workers | 0 | 0.0% |
| Total | 188 | 100.0% |
Employment Status by Age in Sparkman
According to the labor force statistics for Sparkman, out of the total population over 16 years of age (430), 45.8% or 197 individuals are in the labor force, with 4.6% or 9 of them unemployed. The age group with the highest labor force participation rate is 20 to 24 years, with 100.0% or 5 individuals in the labor force. Within the labor force, the 20 to 24 years age range has the highest percentage of unemployed individuals, with 100.0% or 5 of them being unemployed.
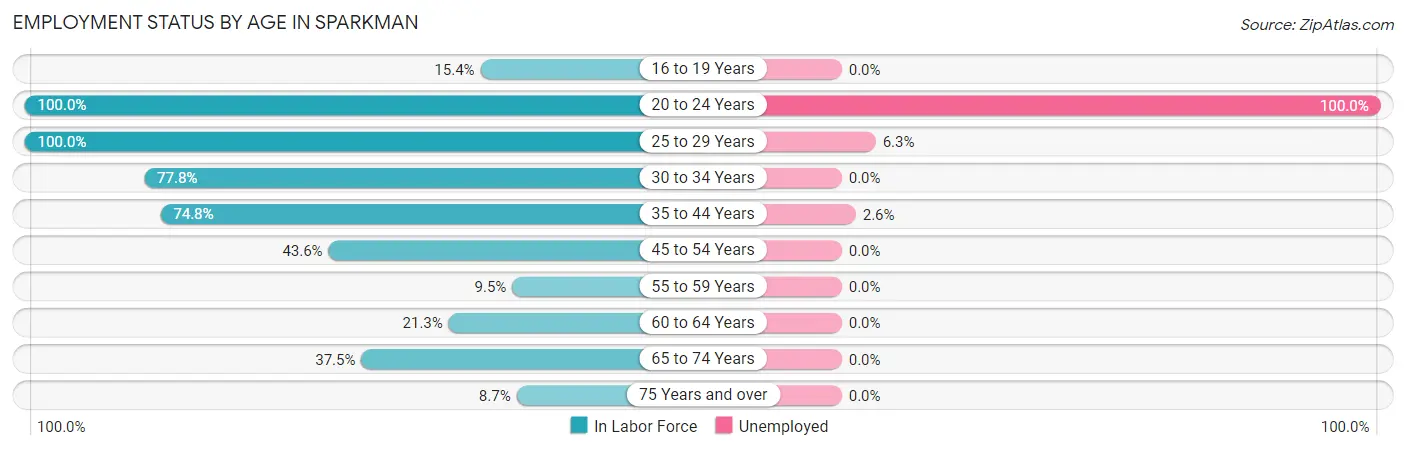
| Age Bracket | In Labor Force | Unemployed |
| 16 to 19 Years | 4 (15.4%) | 0 (0.0%) |
| 20 to 24 Years | 5 (100.0%) | 5 (100.0%) |
| 25 to 29 Years | 32 (100.0%) | 2 (6.3%) |
| 30 to 34 Years | 7 (77.8%) | 0 (0.0%) |
| 35 to 44 Years | 77 (74.8%) | 2 (2.6%) |
| 45 to 54 Years | 17 (43.6%) | 0 (0.0%) |
| 55 to 59 Years | 4 (9.5%) | 0 (0.0%) |
| 60 to 64 Years | 10 (21.3%) | 0 (0.0%) |
| 65 to 74 Years | 39 (37.5%) | 0 (0.0%) |
| 75 Years and over | 2 (8.7%) | 0 (0.0%) |
| Total | 197 (45.8%) | 9 (4.6%) |
Employment Status by Educational Attainment in Sparkman
According to labor force statistics for Sparkman, 54.0% of individuals (147) out of the total population between 25 and 64 years of age (272) are in the labor force, with 2.7% or 4 of them being unemployed. The group with the highest labor force participation rate are those with the educational attainment of college / associate degree, with 87.5% or 28 individuals in the labor force. Within the labor force, individuals with college / associate degree education have the highest percentage of unemployment, with 7.1% or 2 of them being unemployed.
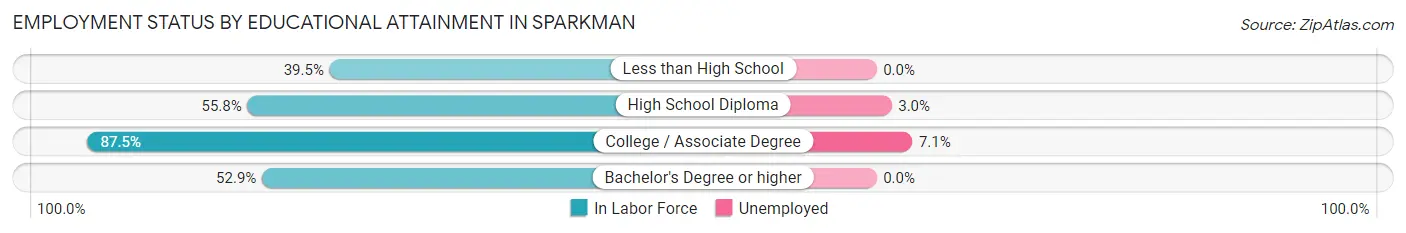
| Educational Attainment | In Labor Force | Unemployed |
| Less than High School | 34 (39.5%) | 0 (0.0%) |
| High School Diploma | 67 (55.8%) | 4 (3.0%) |
| College / Associate Degree | 28 (87.5%) | 2 (7.1%) |
| Bachelor's Degree or higher | 18 (52.9%) | 0 (0.0%) |
| Total | 147 (54.0%) | 7 (2.7%) |
Employment Occupations by Sex in Sparkman
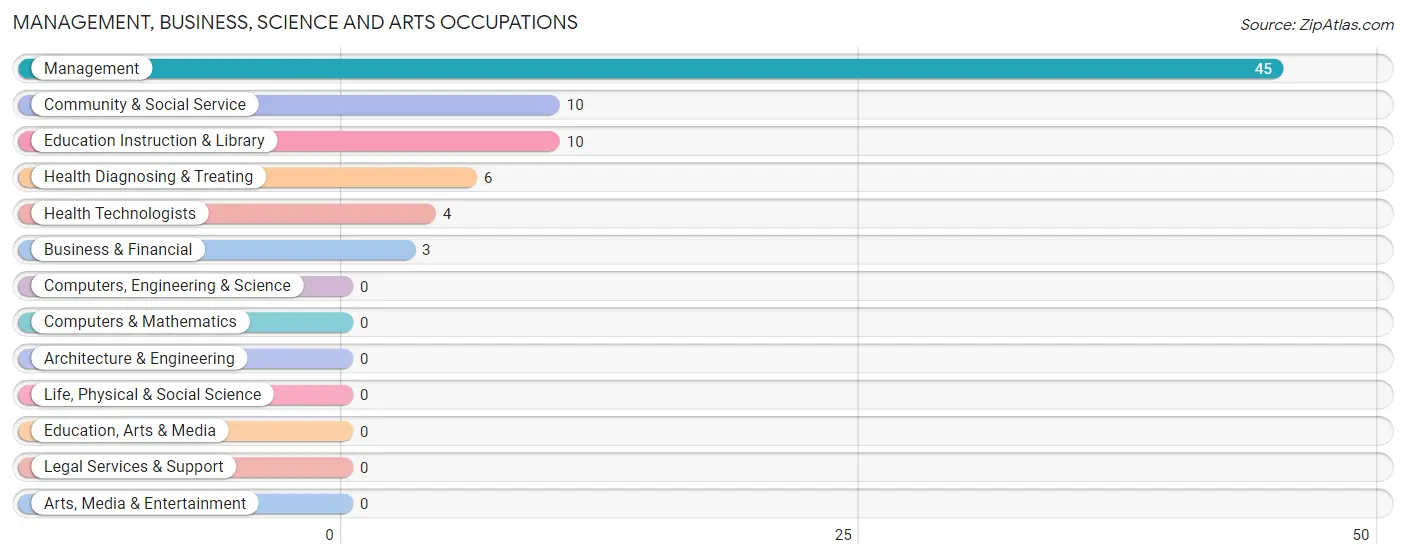
Management, Business, Science and Arts Occupations
The most common Management, Business, Science and Arts occupations in Sparkman are Management (45 | 23.9%), Community & Social Service (10 | 5.3%), Education Instruction & Library (10 | 5.3%), Health Diagnosing & Treating (6 | 3.2%), and Health Technologists (4 | 2.1%).
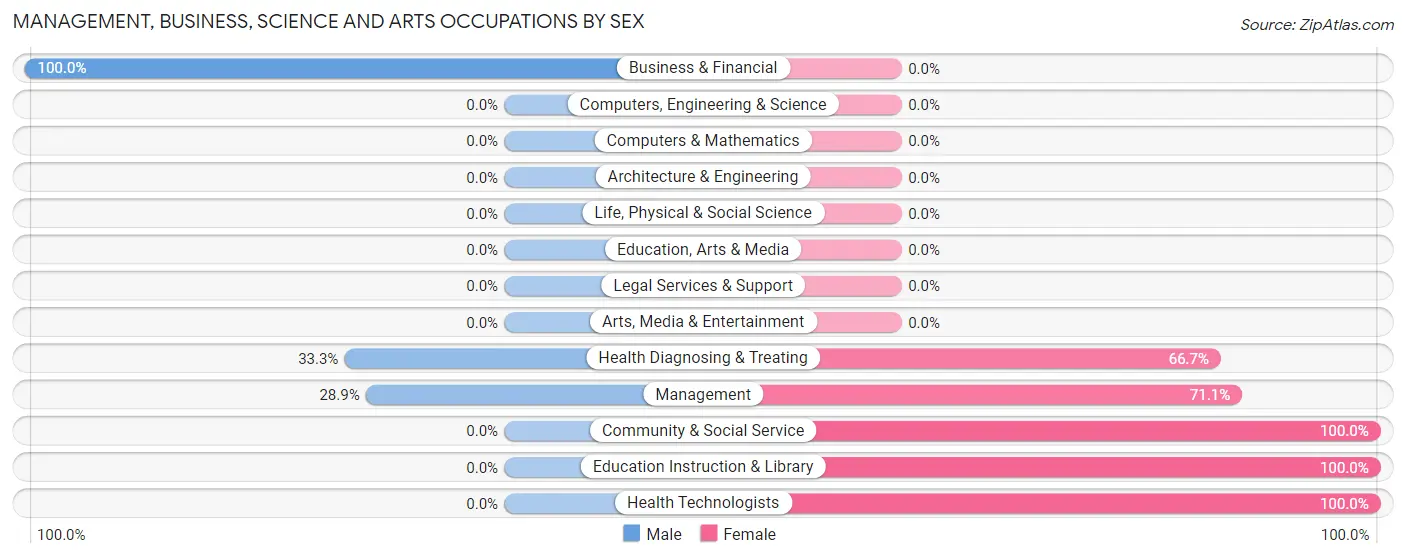
Management, Business, Science and Arts Occupations by Sex
Within the Management, Business, Science and Arts occupations in Sparkman, the most male-oriented occupations are Business & Financial (100.0%), Health Diagnosing & Treating (33.3%), and Management (28.9%), while the most female-oriented occupations are Community & Social Service (100.0%), Education Instruction & Library (100.0%), and Health Technologists (100.0%).
| Occupation | Male | Female |
| Management | 13 (28.9%) | 32 (71.1%) |
| Business & Financial | 3 (100.0%) | 0 (0.0%) |
| Computers, Engineering & Science | 0 (0.0%) | 0 (0.0%) |
| Computers & Mathematics | 0 (0.0%) | 0 (0.0%) |
| Architecture & Engineering | 0 (0.0%) | 0 (0.0%) |
| Life, Physical & Social Science | 0 (0.0%) | 0 (0.0%) |
| Community & Social Service | 0 (0.0%) | 10 (100.0%) |
| Education, Arts & Media | 0 (0.0%) | 0 (0.0%) |
| Legal Services & Support | 0 (0.0%) | 0 (0.0%) |
| Education Instruction & Library | 0 (0.0%) | 10 (100.0%) |
| Arts, Media & Entertainment | 0 (0.0%) | 0 (0.0%) |
| Health Diagnosing & Treating | 2 (33.3%) | 4 (66.7%) |
| Health Technologists | 0 (0.0%) | 4 (100.0%) |
| Total (Category) | 18 (28.1%) | 46 (71.9%) |
| Total (Overall) | 96 (51.1%) | 92 (48.9%) |
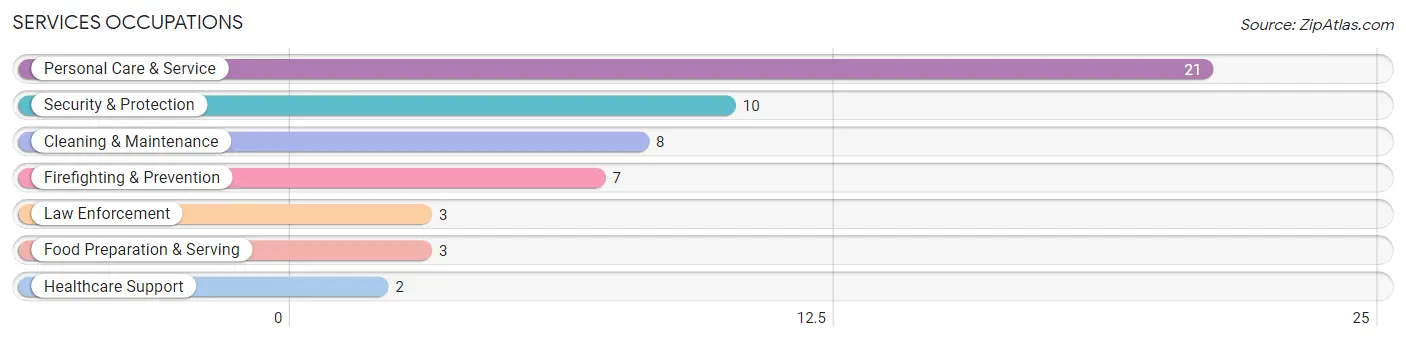
Services Occupations
The most common Services occupations in Sparkman are Personal Care & Service (21 | 11.2%), Security & Protection (10 | 5.3%), Cleaning & Maintenance (8 | 4.3%), Firefighting & Prevention (7 | 3.7%), and Law Enforcement (3 | 1.6%).
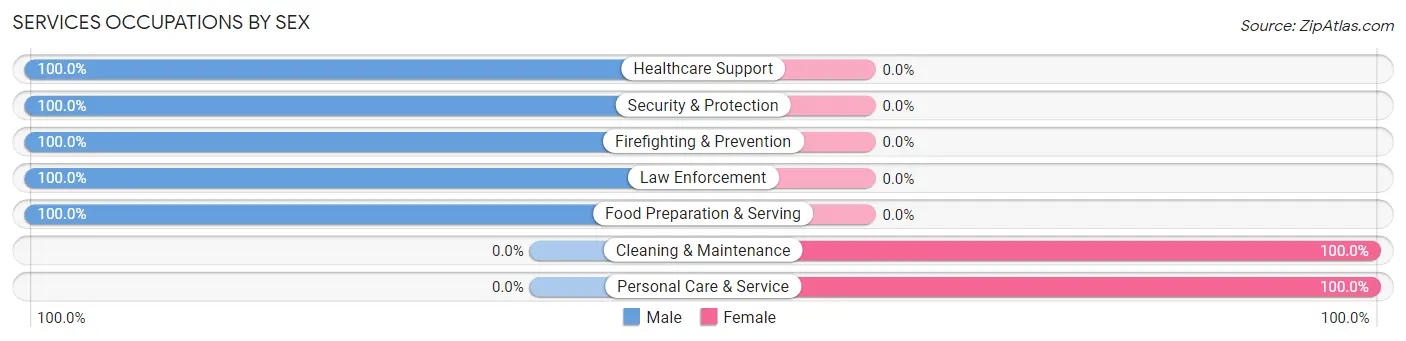
Services Occupations by Sex
Within the Services occupations in Sparkman, the most male-oriented occupations are Healthcare Support (100.0%), Security & Protection (100.0%), and Firefighting & Prevention (100.0%), while the most female-oriented occupations are Cleaning & Maintenance (100.0%), and Personal Care & Service (100.0%).
| Occupation | Male | Female |
| Healthcare Support | 2 (100.0%) | 0 (0.0%) |
| Security & Protection | 10 (100.0%) | 0 (0.0%) |
| Firefighting & Prevention | 7 (100.0%) | 0 (0.0%) |
| Law Enforcement | 3 (100.0%) | 0 (0.0%) |
| Food Preparation & Serving | 3 (100.0%) | 0 (0.0%) |
| Cleaning & Maintenance | 0 (0.0%) | 8 (100.0%) |
| Personal Care & Service | 0 (0.0%) | 21 (100.0%) |
| Total (Category) | 15 (34.1%) | 29 (65.9%) |
| Total (Overall) | 96 (51.1%) | 92 (48.9%) |
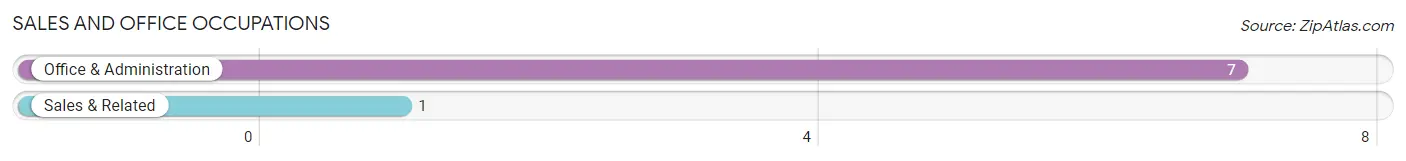
Sales and Office Occupations
The most common Sales and Office occupations in Sparkman are Office & Administration (7 | 3.7%), and Sales & Related (1 | 0.5%).
Sales and Office Occupations by Sex
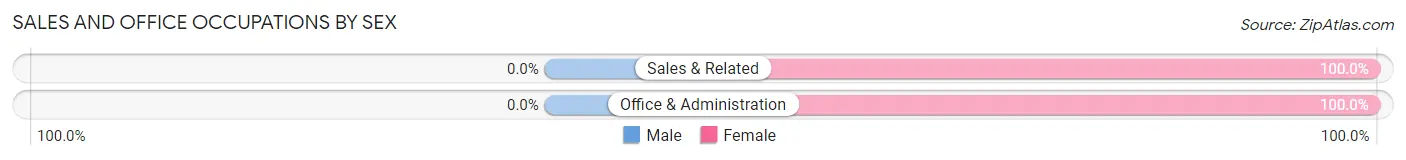
| Occupation | Male | Female |
| Sales & Related | 0 (0.0%) | 1 (100.0%) |
| Office & Administration | 0 (0.0%) | 7 (100.0%) |
| Total (Category) | 0 (0.0%) | 8 (100.0%) |
| Total (Overall) | 96 (51.1%) | 92 (48.9%) |
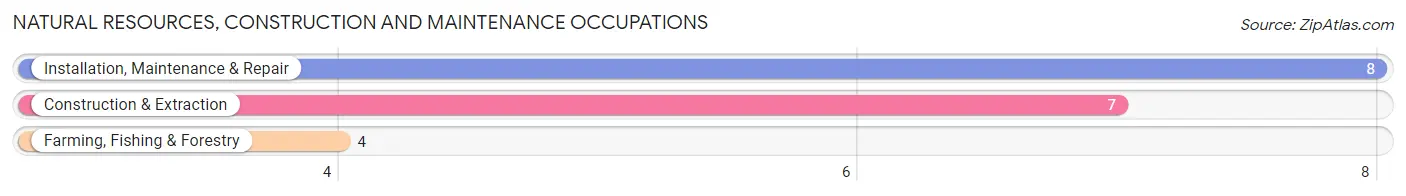
Natural Resources, Construction and Maintenance Occupations
The most common Natural Resources, Construction and Maintenance occupations in Sparkman are Installation, Maintenance & Repair (8 | 4.3%), Construction & Extraction (7 | 3.7%), and Farming, Fishing & Forestry (4 | 2.1%).
Natural Resources, Construction and Maintenance Occupations by Sex
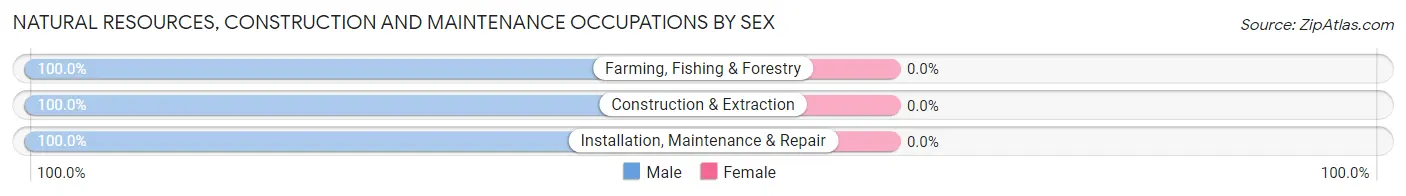
| Occupation | Male | Female |
| Farming, Fishing & Forestry | 4 (100.0%) | 0 (0.0%) |
| Construction & Extraction | 7 (100.0%) | 0 (0.0%) |
| Installation, Maintenance & Repair | 8 (100.0%) | 0 (0.0%) |
| Total (Category) | 19 (100.0%) | 0 (0.0%) |
| Total (Overall) | 96 (51.1%) | 92 (48.9%) |
Production, Transportation and Moving Occupations
The most common Production, Transportation and Moving occupations in Sparkman are Production (45 | 23.9%), Transportation (5 | 2.7%), and Material Moving (3 | 1.6%).
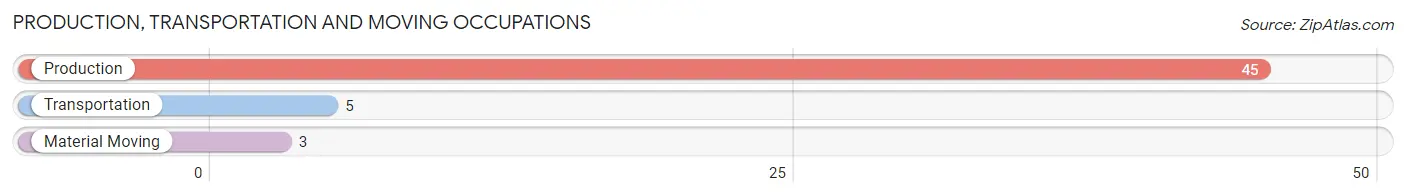
Production, Transportation and Moving Occupations by Sex
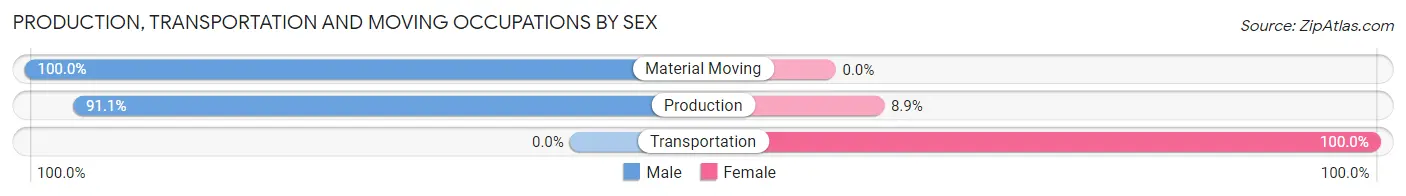
| Occupation | Male | Female |
| Production | 41 (91.1%) | 4 (8.9%) |
| Transportation | 0 (0.0%) | 5 (100.0%) |
| Material Moving | 3 (100.0%) | 0 (0.0%) |
| Total (Category) | 44 (83.0%) | 9 (17.0%) |
| Total (Overall) | 96 (51.1%) | 92 (48.9%) |
Employment Industries by Sex in Sparkman
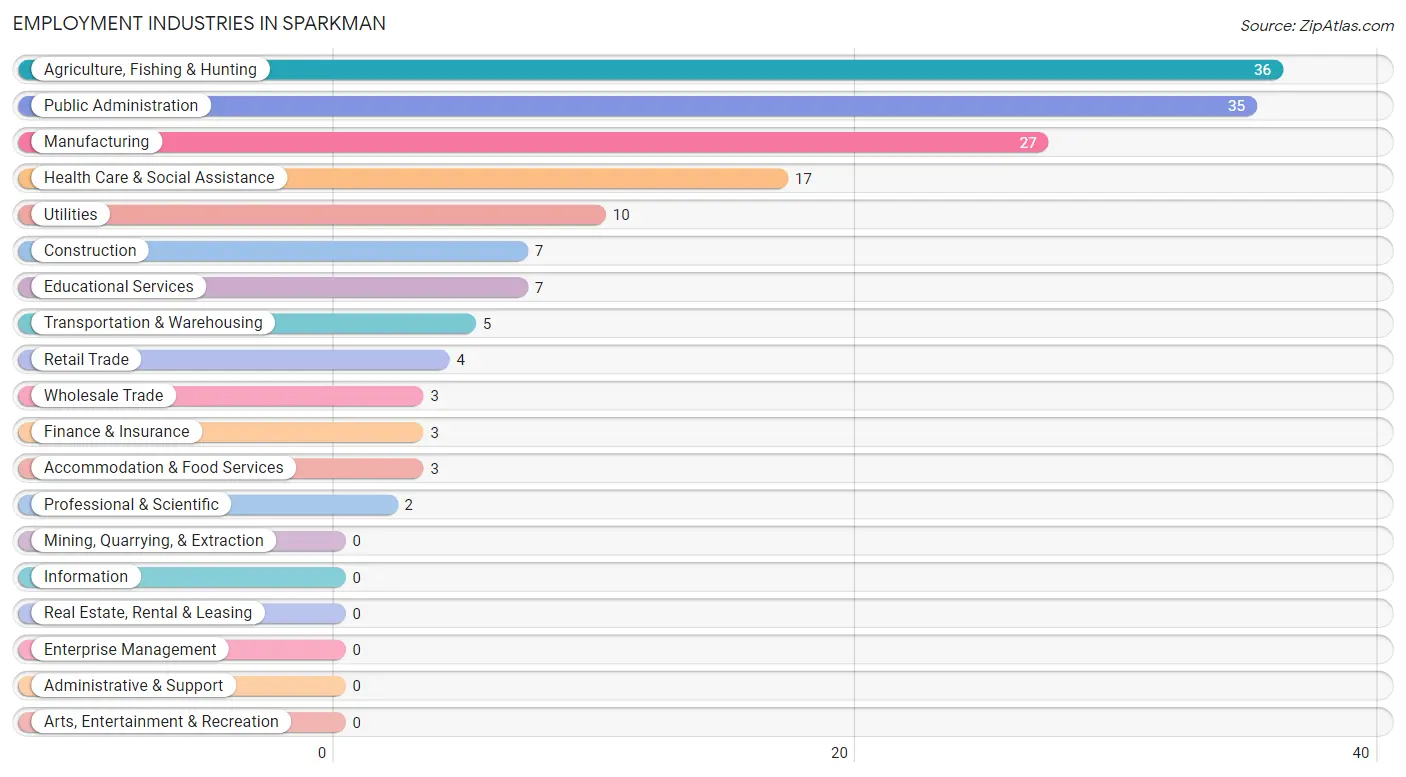
Employment Industries in Sparkman
The major employment industries in Sparkman include Agriculture, Fishing & Hunting (36 | 19.2%), Public Administration (35 | 18.6%), Manufacturing (27 | 14.4%), Health Care & Social Assistance (17 | 9.0%), and Utilities (10 | 5.3%).
Employment Industries by Sex in Sparkman
The Sparkman industries that see more men than women are Agriculture, Fishing & Hunting (100.0%), Construction (100.0%), and Utilities (100.0%), whereas the industries that tend to have a higher number of women are Wholesale Trade (100.0%), Transportation & Warehousing (100.0%), and Professional & Scientific (100.0%).
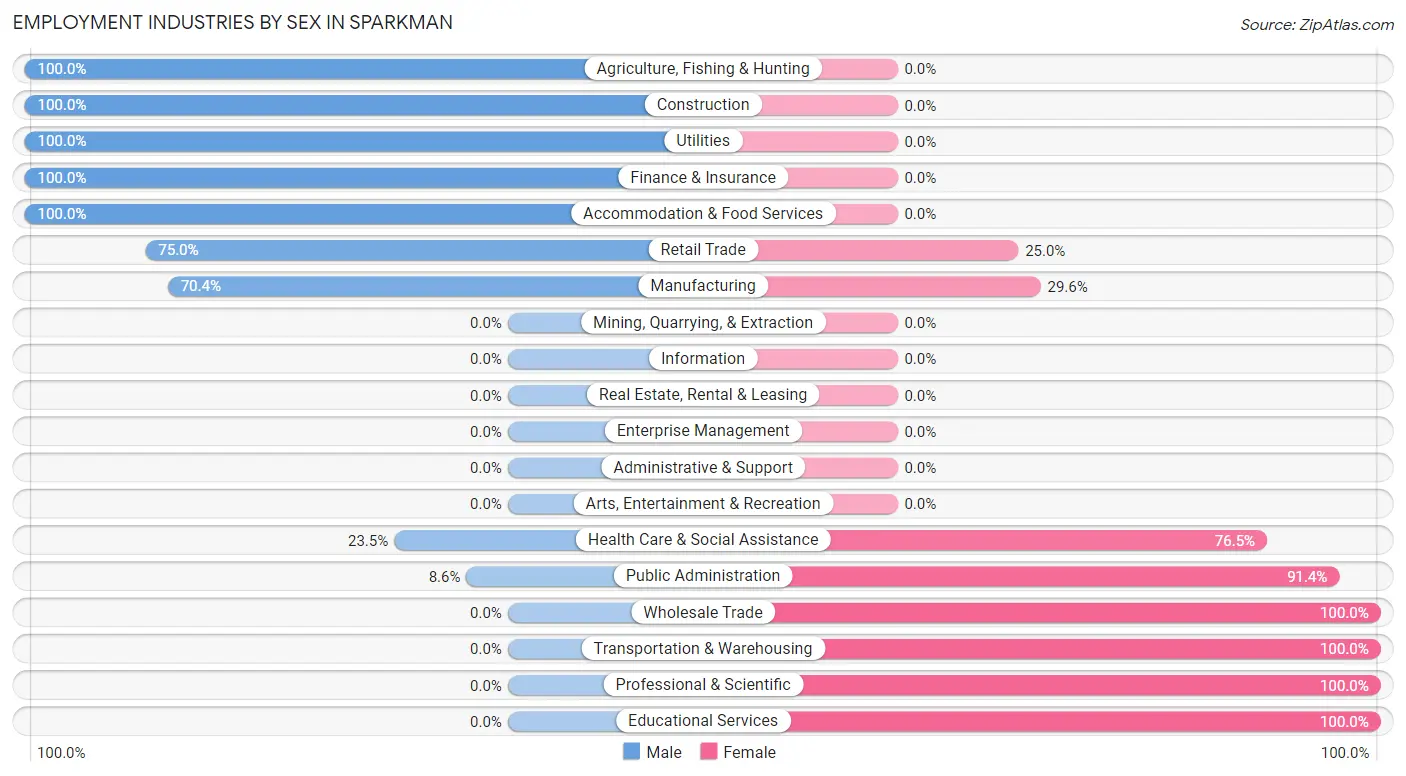
| Industry | Male | Female |
| Agriculture, Fishing & Hunting | 36 (100.0%) | 0 (0.0%) |
| Mining, Quarrying, & Extraction | 0 (0.0%) | 0 (0.0%) |
| Construction | 7 (100.0%) | 0 (0.0%) |
| Manufacturing | 19 (70.4%) | 8 (29.6%) |
| Wholesale Trade | 0 (0.0%) | 3 (100.0%) |
| Retail Trade | 3 (75.0%) | 1 (25.0%) |
| Transportation & Warehousing | 0 (0.0%) | 5 (100.0%) |
| Utilities | 10 (100.0%) | 0 (0.0%) |
| Information | 0 (0.0%) | 0 (0.0%) |
| Finance & Insurance | 3 (100.0%) | 0 (0.0%) |
| Real Estate, Rental & Leasing | 0 (0.0%) | 0 (0.0%) |
| Professional & Scientific | 0 (0.0%) | 2 (100.0%) |
| Enterprise Management | 0 (0.0%) | 0 (0.0%) |
| Administrative & Support | 0 (0.0%) | 0 (0.0%) |
| Educational Services | 0 (0.0%) | 7 (100.0%) |
| Health Care & Social Assistance | 4 (23.5%) | 13 (76.5%) |
| Arts, Entertainment & Recreation | 0 (0.0%) | 0 (0.0%) |
| Accommodation & Food Services | 3 (100.0%) | 0 (0.0%) |
| Public Administration | 3 (8.6%) | 32 (91.4%) |
| Total | 96 (51.1%) | 92 (48.9%) |
Education in Sparkman
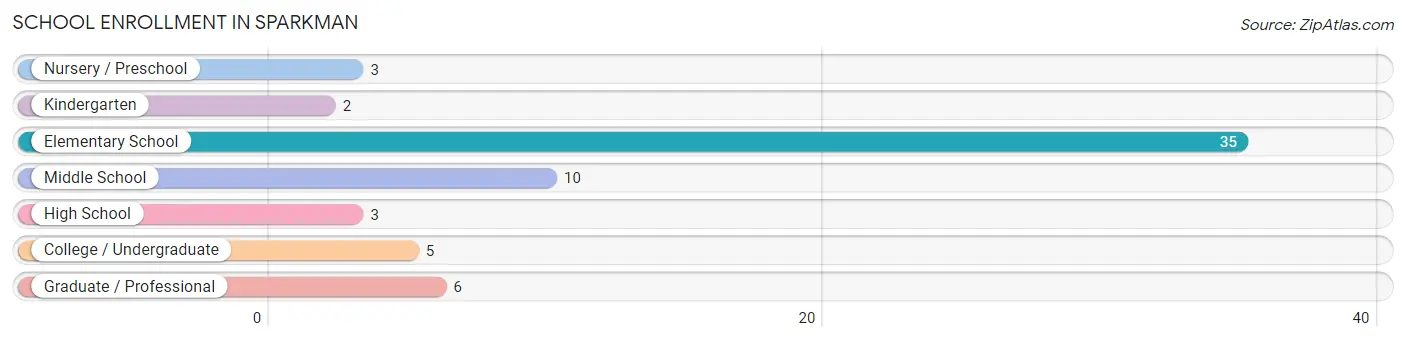
School Enrollment in Sparkman
The most common levels of schooling among the 64 students in Sparkman are elementary school (35 | 54.7%), middle school (10 | 15.6%), and graduate / professional (6 | 9.4%).
| School Level | # Students | % Students |
| Nursery / Preschool | 3 | 4.7% |
| Kindergarten | 2 | 3.1% |
| Elementary School | 35 | 54.7% |
| Middle School | 10 | 15.6% |
| High School | 3 | 4.7% |
| College / Undergraduate | 5 | 7.8% |
| Graduate / Professional | 6 | 9.4% |
| Total | 64 | 100.0% |
School Enrollment by Age by Funding Source in Sparkman
Out of a total of 64 students who are enrolled in schools in Sparkman, 13 (20.3%) attend a private institution, while the remaining 51 (79.7%) are enrolled in public schools. The age group of 10 to 14 year olds has the highest likelihood of being enrolled in private schools, with 9 (42.9% in the age bracket) enrolled. Conversely, the age group of 3 to 4 year olds has the lowest likelihood of being enrolled in a private school, with 3 (100.0% in the age bracket) attending a public institution.
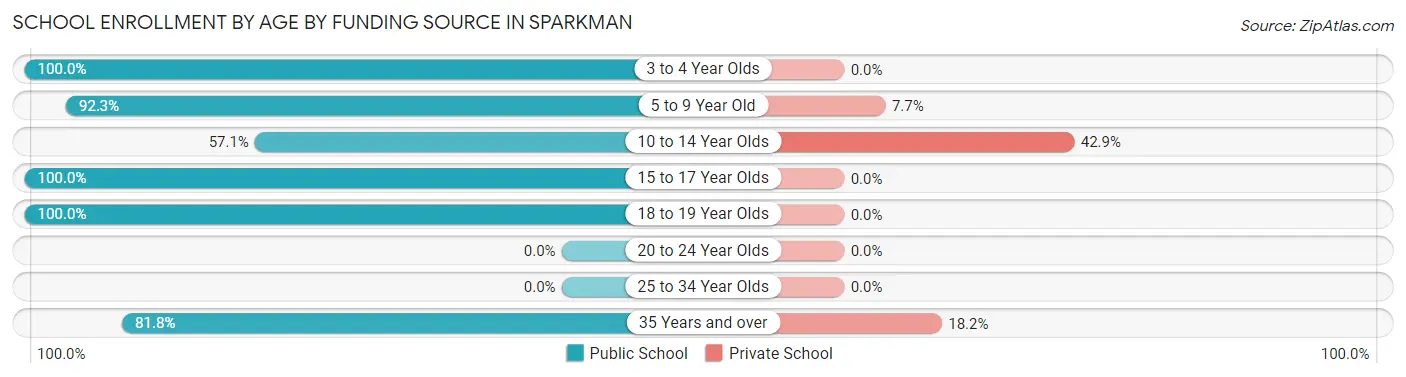
| Age Bracket | Public School | Private School |
| 3 to 4 Year Olds | 3 (100.0%) | 0 (0.0%) |
| 5 to 9 Year Old | 24 (92.3%) | 2 (7.7%) |
| 10 to 14 Year Olds | 12 (57.1%) | 9 (42.9%) |
| 15 to 17 Year Olds | 2 (100.0%) | 0 (0.0%) |
| 18 to 19 Year Olds | 1 (100.0%) | 0 (0.0%) |
| 20 to 24 Year Olds | 0 (0.0%) | 0 (0.0%) |
| 25 to 34 Year Olds | 0 (0.0%) | 0 (0.0%) |
| 35 Years and over | 9 (81.8%) | 2 (18.2%) |
| Total | 51 (79.7%) | 13 (20.3%) |
Educational Attainment by Field of Study in Sparkman
Education (19 | 44.2%), business (7 | 16.3%), social sciences (4 | 9.3%), science & technology (4 | 9.3%), and arts & humanities (4 | 9.3%) are the most common fields of study among 43 individuals in Sparkman who have obtained a bachelor's degree or higher.
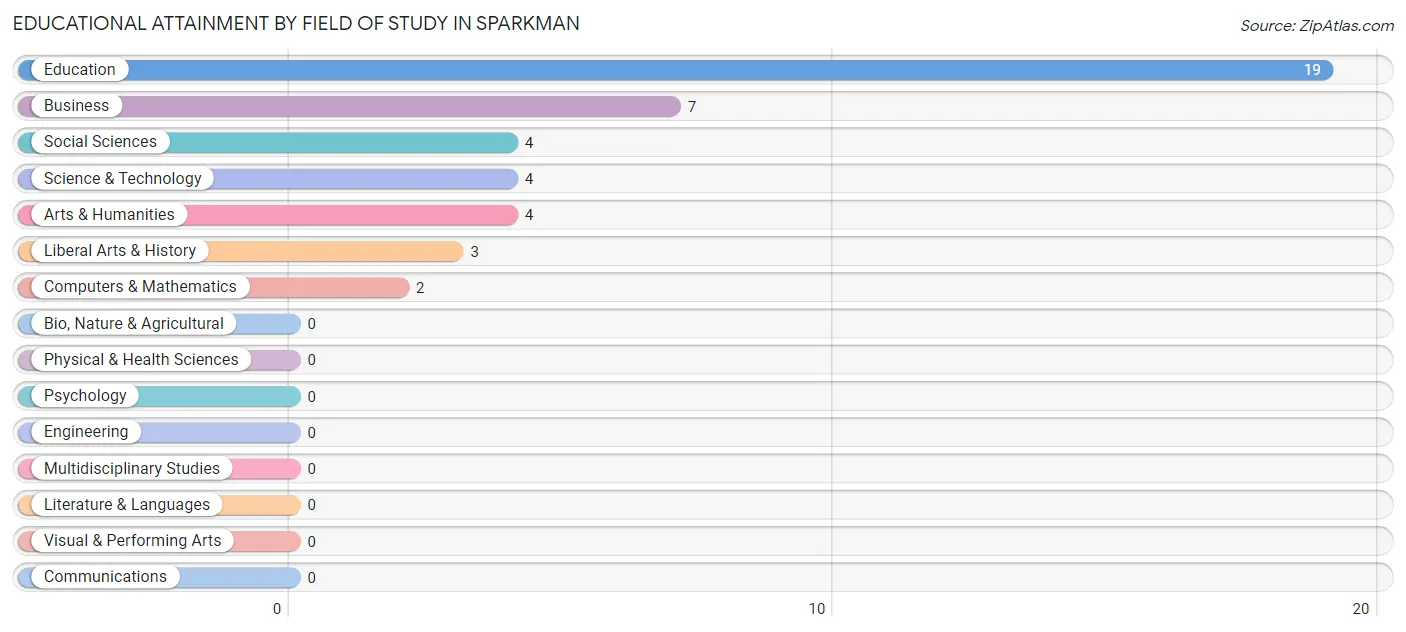
| Field of Study | # Graduates | % Graduates |
| Computers & Mathematics | 2 | 4.6% |
| Bio, Nature & Agricultural | 0 | 0.0% |
| Physical & Health Sciences | 0 | 0.0% |
| Psychology | 0 | 0.0% |
| Social Sciences | 4 | 9.3% |
| Engineering | 0 | 0.0% |
| Multidisciplinary Studies | 0 | 0.0% |
| Science & Technology | 4 | 9.3% |
| Business | 7 | 16.3% |
| Education | 19 | 44.2% |
| Literature & Languages | 0 | 0.0% |
| Liberal Arts & History | 3 | 7.0% |
| Visual & Performing Arts | 0 | 0.0% |
| Communications | 0 | 0.0% |
| Arts & Humanities | 4 | 9.3% |
| Total | 43 | 100.0% |
Transportation & Commute in Sparkman
Vehicle Availability by Sex in Sparkman
The most prevalent vehicle ownership categories in Sparkman are males with 2 vehicles (53, accounting for 55.2%) and females with 2 vehicles (44, making up 57.6%).
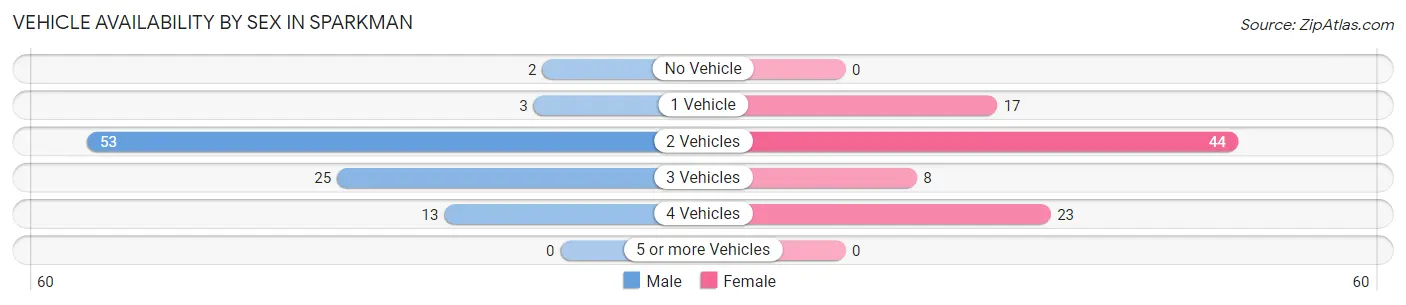
| Vehicles Available | Male | Female |
| No Vehicle | 2 (2.1%) | 0 (0.0%) |
| 1 Vehicle | 3 (3.1%) | 17 (18.5%) |
| 2 Vehicles | 53 (55.2%) | 44 (47.8%) |
| 3 Vehicles | 25 (26.0%) | 8 (8.7%) |
| 4 Vehicles | 13 (13.5%) | 23 (25.0%) |
| 5 or more Vehicles | 0 (0.0%) | 0 (0.0%) |
| Total | 96 (100.0%) | 92 (100.0%) |
Commute Time in Sparkman
The most frequently occuring commute durations in Sparkman are 5 to 9 minutes (74 commuters, 39.4%), less than 5 minutes (46 commuters, 24.5%), and 30 to 34 minutes (19 commuters, 10.1%).
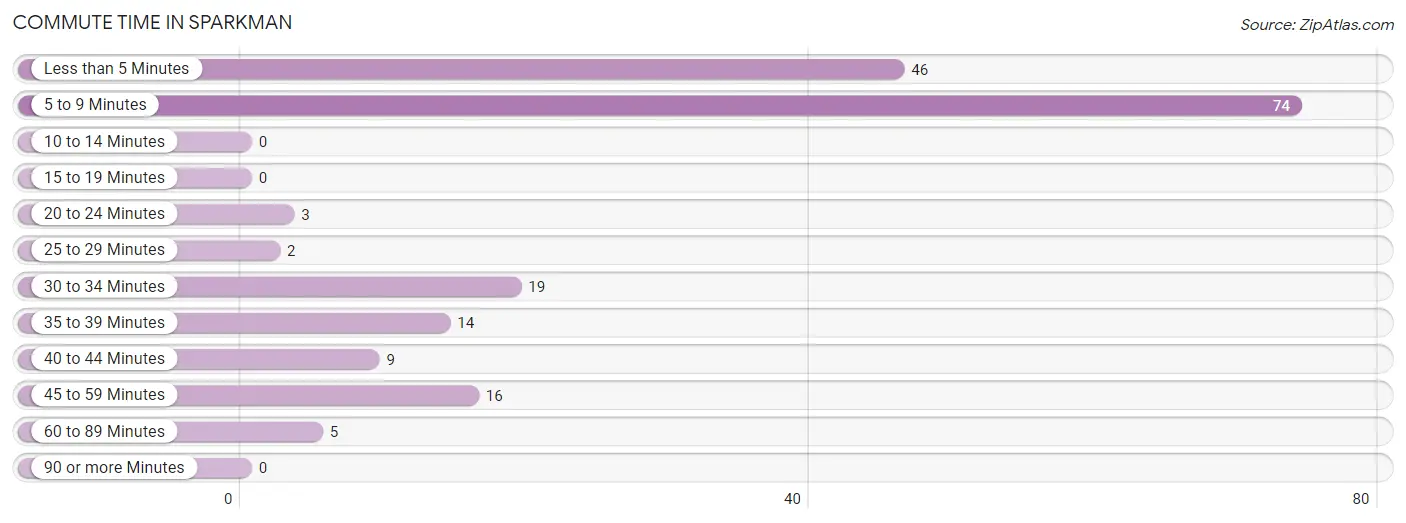
| Commute Time | # Commuters | % Commuters |
| Less than 5 Minutes | 46 | 24.5% |
| 5 to 9 Minutes | 74 | 39.4% |
| 10 to 14 Minutes | 0 | 0.0% |
| 15 to 19 Minutes | 0 | 0.0% |
| 20 to 24 Minutes | 3 | 1.6% |
| 25 to 29 Minutes | 2 | 1.1% |
| 30 to 34 Minutes | 19 | 10.1% |
| 35 to 39 Minutes | 14 | 7.4% |
| 40 to 44 Minutes | 9 | 4.8% |
| 45 to 59 Minutes | 16 | 8.5% |
| 60 to 89 Minutes | 5 | 2.7% |
| 90 or more Minutes | 0 | 0.0% |
Commute Time by Sex in Sparkman
The most common commute times in Sparkman are less than 5 minutes (42 commuters, 43.8%) for males and 5 to 9 minutes (56 commuters, 60.9%) for females.
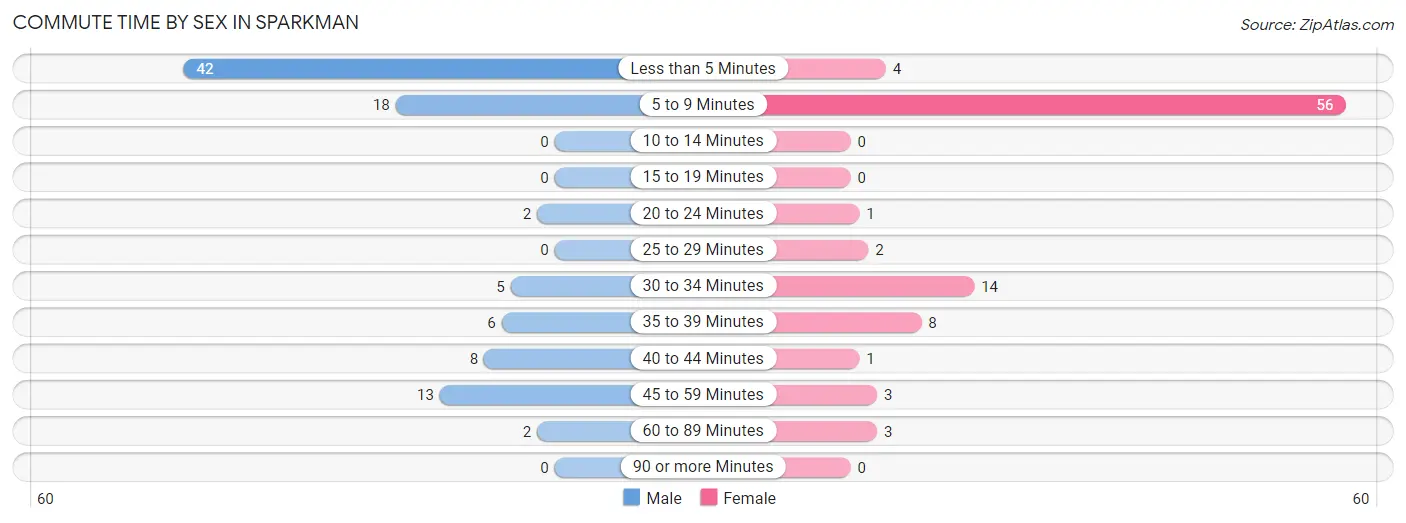
| Commute Time | Male | Female |
| Less than 5 Minutes | 42 (43.8%) | 4 (4.3%) |
| 5 to 9 Minutes | 18 (18.8%) | 56 (60.9%) |
| 10 to 14 Minutes | 0 (0.0%) | 0 (0.0%) |
| 15 to 19 Minutes | 0 (0.0%) | 0 (0.0%) |
| 20 to 24 Minutes | 2 (2.1%) | 1 (1.1%) |
| 25 to 29 Minutes | 0 (0.0%) | 2 (2.2%) |
| 30 to 34 Minutes | 5 (5.2%) | 14 (15.2%) |
| 35 to 39 Minutes | 6 (6.2%) | 8 (8.7%) |
| 40 to 44 Minutes | 8 (8.3%) | 1 (1.1%) |
| 45 to 59 Minutes | 13 (13.5%) | 3 (3.3%) |
| 60 to 89 Minutes | 2 (2.1%) | 3 (3.3%) |
| 90 or more Minutes | 0 (0.0%) | 0 (0.0%) |
Time of Departure to Work by Sex in Sparkman
The most frequent times of departure to work in Sparkman are 5:00 AM to 5:29 AM (34, 35.4%) for males and 8:30 AM to 8:59 AM (32, 34.8%) for females.
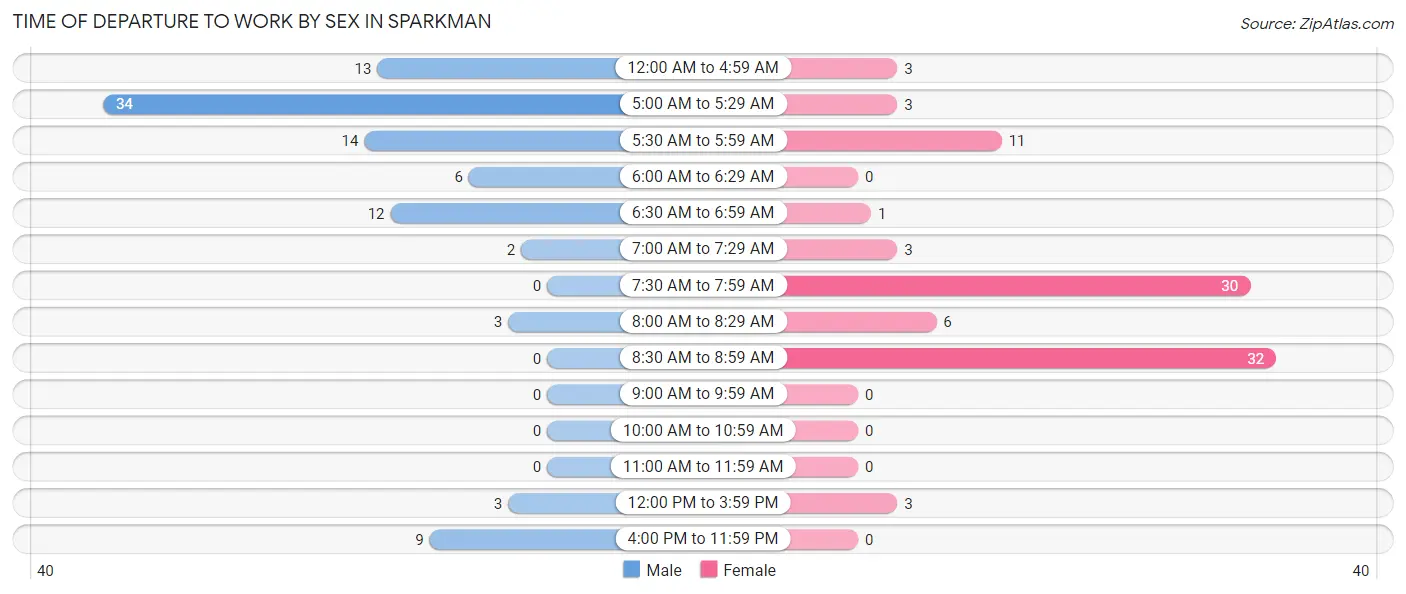
| Time of Departure | Male | Female |
| 12:00 AM to 4:59 AM | 13 (13.5%) | 3 (3.3%) |
| 5:00 AM to 5:29 AM | 34 (35.4%) | 3 (3.3%) |
| 5:30 AM to 5:59 AM | 14 (14.6%) | 11 (12.0%) |
| 6:00 AM to 6:29 AM | 6 (6.2%) | 0 (0.0%) |
| 6:30 AM to 6:59 AM | 12 (12.5%) | 1 (1.1%) |
| 7:00 AM to 7:29 AM | 2 (2.1%) | 3 (3.3%) |
| 7:30 AM to 7:59 AM | 0 (0.0%) | 30 (32.6%) |
| 8:00 AM to 8:29 AM | 3 (3.1%) | 6 (6.5%) |
| 8:30 AM to 8:59 AM | 0 (0.0%) | 32 (34.8%) |
| 9:00 AM to 9:59 AM | 0 (0.0%) | 0 (0.0%) |
| 10:00 AM to 10:59 AM | 0 (0.0%) | 0 (0.0%) |
| 11:00 AM to 11:59 AM | 0 (0.0%) | 0 (0.0%) |
| 12:00 PM to 3:59 PM | 3 (3.1%) | 3 (3.3%) |
| 4:00 PM to 11:59 PM | 9 (9.4%) | 0 (0.0%) |
| Total | 96 (100.0%) | 92 (100.0%) |
Housing Occupancy in Sparkman
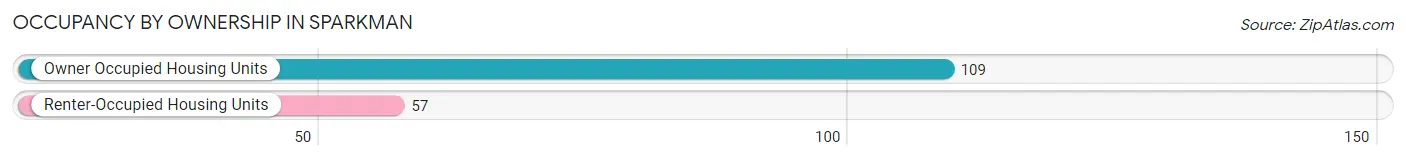
Occupancy by Ownership in Sparkman
Of the total 166 dwellings in Sparkman, owner-occupied units account for 109 (65.7%), while renter-occupied units make up 57 (34.3%).
| Occupancy | # Housing Units | % Housing Units |
| Owner Occupied Housing Units | 109 | 65.7% |
| Renter-Occupied Housing Units | 57 | 34.3% |
| Total Occupied Housing Units | 166 | 100.0% |
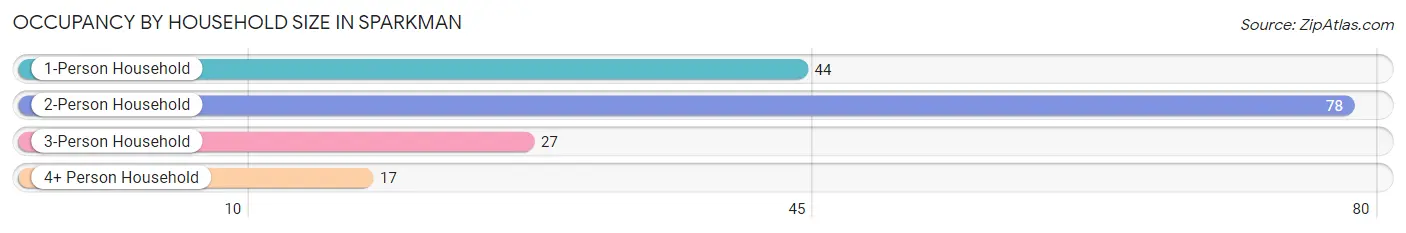
Occupancy by Household Size in Sparkman
| Household Size | # Housing Units | % Housing Units |
| 1-Person Household | 44 | 26.5% |
| 2-Person Household | 78 | 47.0% |
| 3-Person Household | 27 | 16.3% |
| 4+ Person Household | 17 | 10.2% |
| Total Housing Units | 166 | 100.0% |
Occupancy by Ownership by Household Size in Sparkman
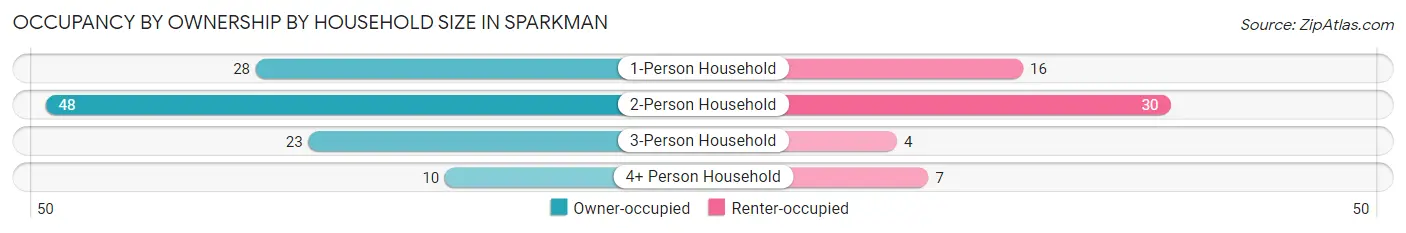
| Household Size | Owner-occupied | Renter-occupied |
| 1-Person Household | 28 (63.6%) | 16 (36.4%) |
| 2-Person Household | 48 (61.5%) | 30 (38.5%) |
| 3-Person Household | 23 (85.2%) | 4 (14.8%) |
| 4+ Person Household | 10 (58.8%) | 7 (41.2%) |
| Total Housing Units | 109 (65.7%) | 57 (34.3%) |
Occupancy by Educational Attainment in Sparkman
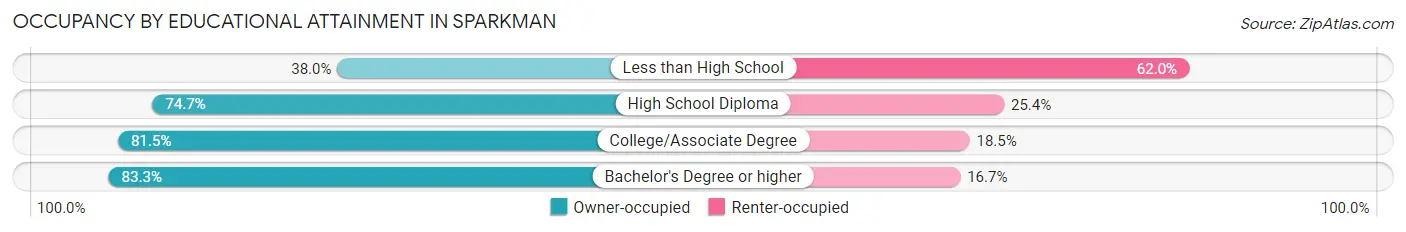
| Household Size | Owner-occupied | Renter-occupied |
| Less than High School | 19 (38.0%) | 31 (62.0%) |
| High School Diploma | 53 (74.7%) | 18 (25.4%) |
| College/Associate Degree | 22 (81.5%) | 5 (18.5%) |
| Bachelor's Degree or higher | 15 (83.3%) | 3 (16.7%) |
Occupancy by Age of Householder in Sparkman
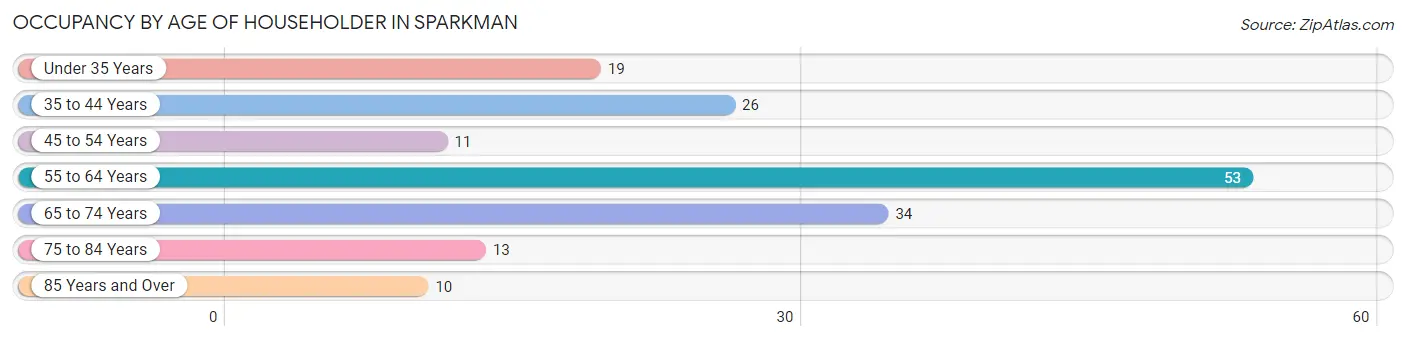
| Age Bracket | # Households | % Households |
| Under 35 Years | 19 | 11.5% |
| 35 to 44 Years | 26 | 15.7% |
| 45 to 54 Years | 11 | 6.6% |
| 55 to 64 Years | 53 | 31.9% |
| 65 to 74 Years | 34 | 20.5% |
| 75 to 84 Years | 13 | 7.8% |
| 85 Years and Over | 10 | 6.0% |
| Total | 166 | 100.0% |
Housing Finances in Sparkman
Median Income by Occupancy in Sparkman
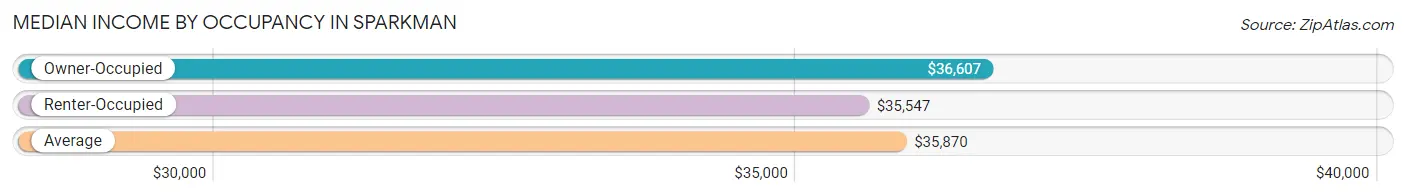
| Occupancy Type | # Households | Median Income |
| Owner-Occupied | 109 (65.7%) | $36,607 |
| Renter-Occupied | 57 (34.3%) | $35,547 |
| Average | 166 (100.0%) | $35,870 |
Occupancy by Householder Income Bracket in Sparkman
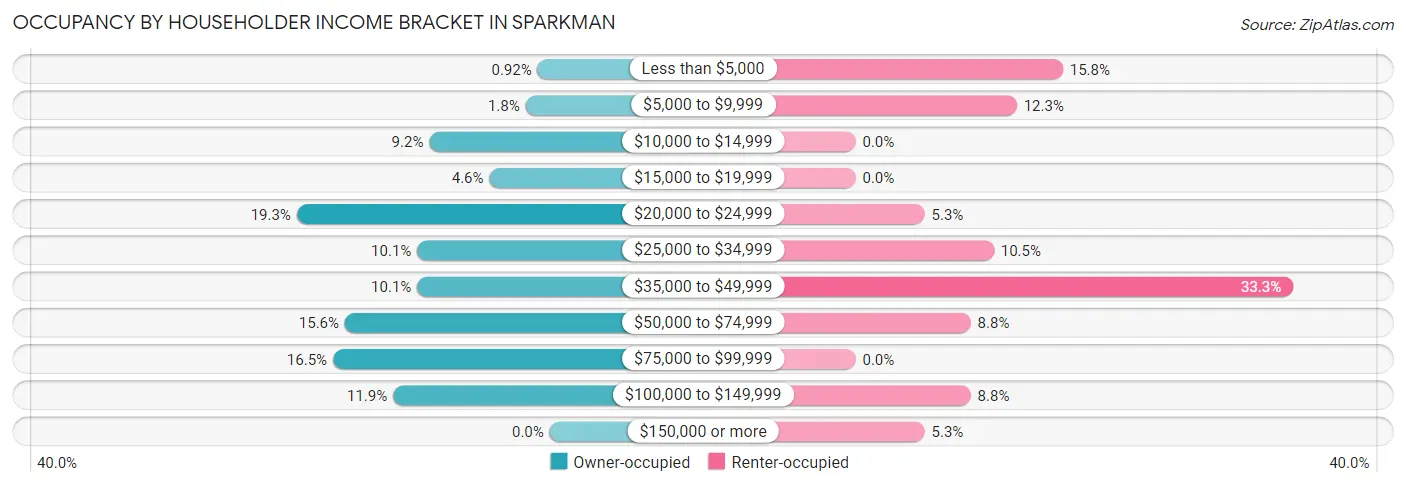
| Income Bracket | Owner-occupied | Renter-occupied |
| Less than $5,000 | 1 (0.9%) | 9 (15.8%) |
| $5,000 to $9,999 | 2 (1.8%) | 7 (12.3%) |
| $10,000 to $14,999 | 10 (9.2%) | 0 (0.0%) |
| $15,000 to $19,999 | 5 (4.6%) | 0 (0.0%) |
| $20,000 to $24,999 | 21 (19.3%) | 3 (5.3%) |
| $25,000 to $34,999 | 11 (10.1%) | 6 (10.5%) |
| $35,000 to $49,999 | 11 (10.1%) | 19 (33.3%) |
| $50,000 to $74,999 | 17 (15.6%) | 5 (8.8%) |
| $75,000 to $99,999 | 18 (16.5%) | 0 (0.0%) |
| $100,000 to $149,999 | 13 (11.9%) | 5 (8.8%) |
| $150,000 or more | 0 (0.0%) | 3 (5.3%) |
| Total | 109 (100.0%) | 57 (100.0%) |
Monthly Housing Cost Tiers in Sparkman
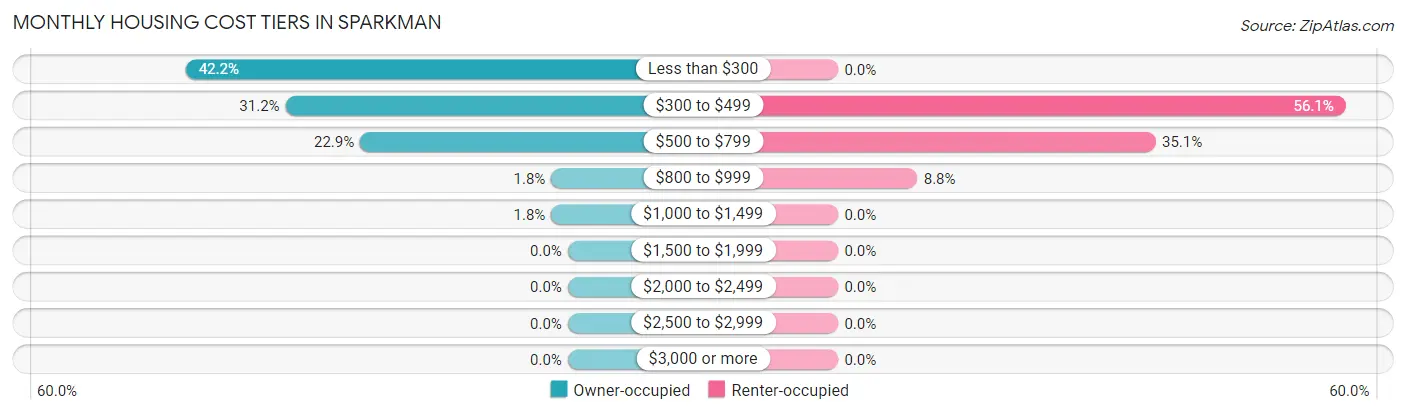
| Monthly Cost | Owner-occupied | Renter-occupied |
| Less than $300 | 46 (42.2%) | 0 (0.0%) |
| $300 to $499 | 34 (31.2%) | 32 (56.1%) |
| $500 to $799 | 25 (22.9%) | 20 (35.1%) |
| $800 to $999 | 2 (1.8%) | 5 (8.8%) |
| $1,000 to $1,499 | 2 (1.8%) | 0 (0.0%) |
| $1,500 to $1,999 | 0 (0.0%) | 0 (0.0%) |
| $2,000 to $2,499 | 0 (0.0%) | 0 (0.0%) |
| $2,500 to $2,999 | 0 (0.0%) | 0 (0.0%) |
| $3,000 or more | 0 (0.0%) | 0 (0.0%) |
| Total | 109 (100.0%) | 57 (100.0%) |
Physical Housing Characteristics in Sparkman
Housing Structures in Sparkman
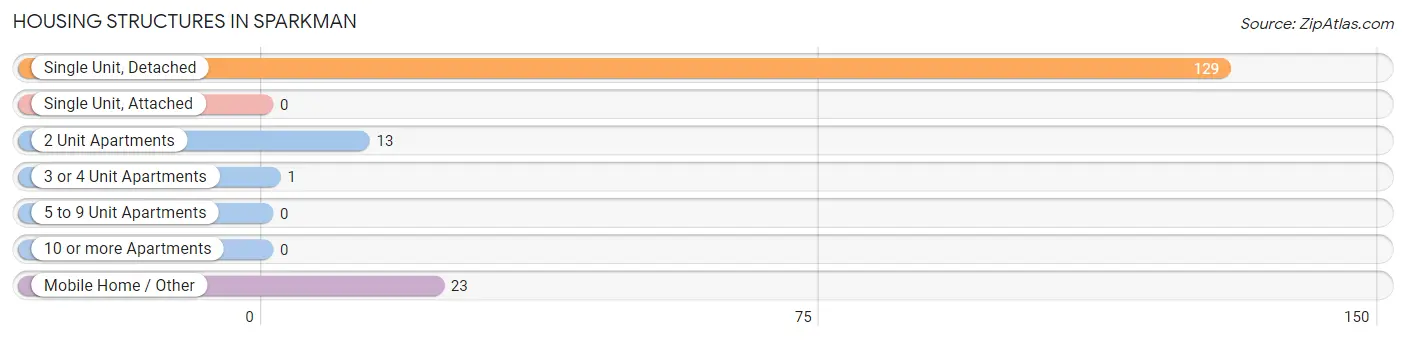
| Structure Type | # Housing Units | % Housing Units |
| Single Unit, Detached | 129 | 77.7% |
| Single Unit, Attached | 0 | 0.0% |
| 2 Unit Apartments | 13 | 7.8% |
| 3 or 4 Unit Apartments | 1 | 0.6% |
| 5 to 9 Unit Apartments | 0 | 0.0% |
| 10 or more Apartments | 0 | 0.0% |
| Mobile Home / Other | 23 | 13.9% |
| Total | 166 | 100.0% |
Housing Structures by Occupancy in Sparkman
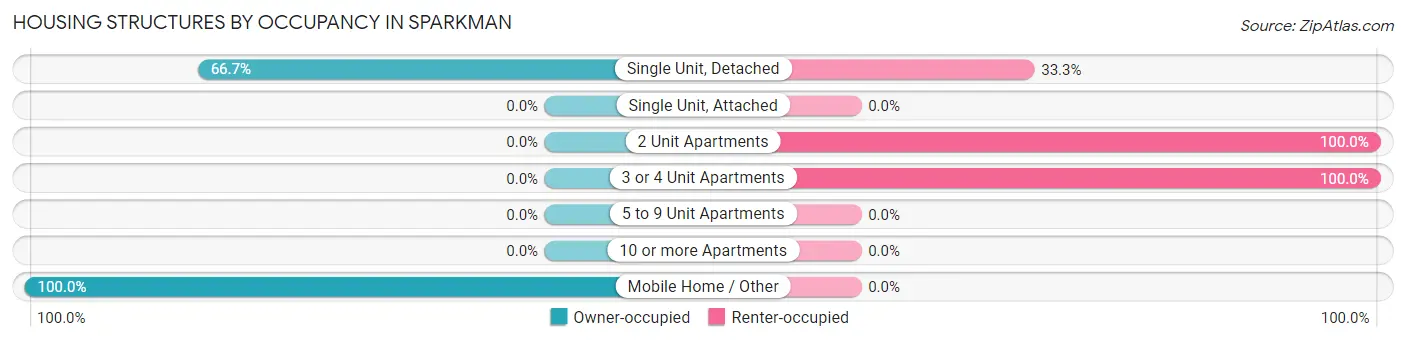
| Structure Type | Owner-occupied | Renter-occupied |
| Single Unit, Detached | 86 (66.7%) | 43 (33.3%) |
| Single Unit, Attached | 0 (0.0%) | 0 (0.0%) |
| 2 Unit Apartments | 0 (0.0%) | 13 (100.0%) |
| 3 or 4 Unit Apartments | 0 (0.0%) | 1 (100.0%) |
| 5 to 9 Unit Apartments | 0 (0.0%) | 0 (0.0%) |
| 10 or more Apartments | 0 (0.0%) | 0 (0.0%) |
| Mobile Home / Other | 23 (100.0%) | 0 (0.0%) |
| Total | 109 (65.7%) | 57 (34.3%) |
Housing Structures by Number of Rooms in Sparkman
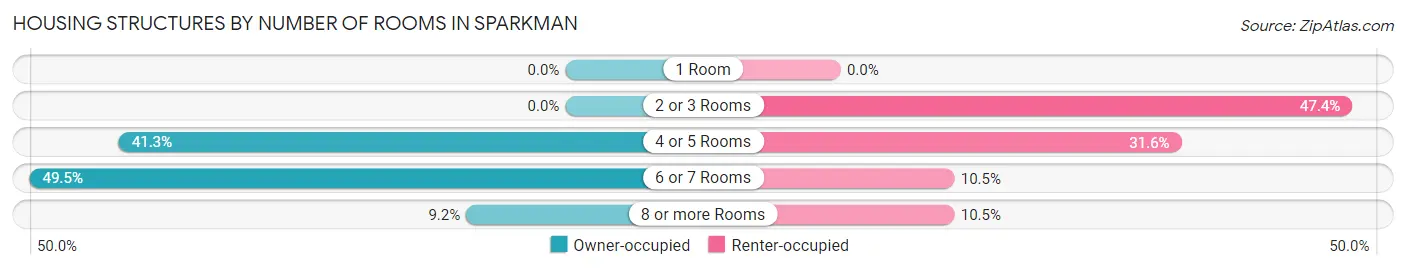
| Number of Rooms | Owner-occupied | Renter-occupied |
| 1 Room | 0 (0.0%) | 0 (0.0%) |
| 2 or 3 Rooms | 0 (0.0%) | 27 (47.4%) |
| 4 or 5 Rooms | 45 (41.3%) | 18 (31.6%) |
| 6 or 7 Rooms | 54 (49.5%) | 6 (10.5%) |
| 8 or more Rooms | 10 (9.2%) | 6 (10.5%) |
| Total | 109 (100.0%) | 57 (100.0%) |
Housing Structure by Heating Type in Sparkman
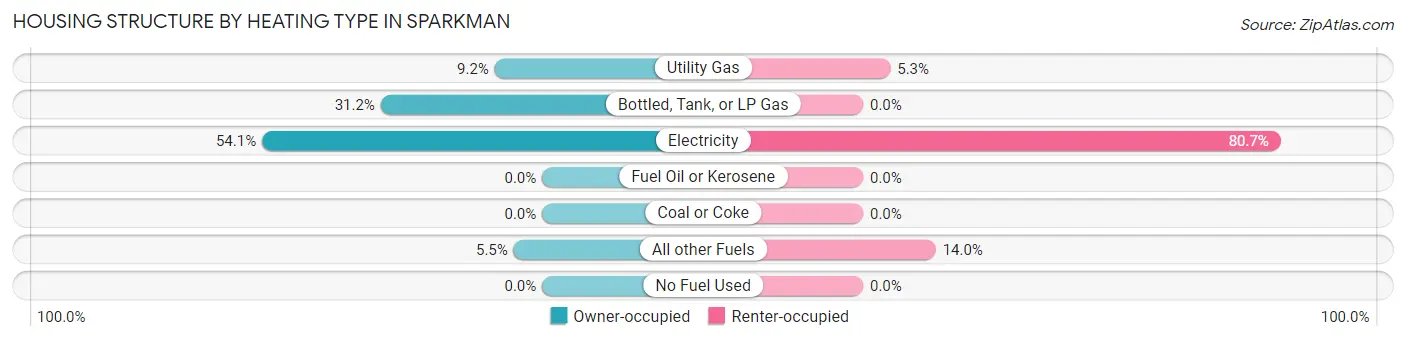
| Heating Type | Owner-occupied | Renter-occupied |
| Utility Gas | 10 (9.2%) | 3 (5.3%) |
| Bottled, Tank, or LP Gas | 34 (31.2%) | 0 (0.0%) |
| Electricity | 59 (54.1%) | 46 (80.7%) |
| Fuel Oil or Kerosene | 0 (0.0%) | 0 (0.0%) |
| Coal or Coke | 0 (0.0%) | 0 (0.0%) |
| All other Fuels | 6 (5.5%) | 8 (14.0%) |
| No Fuel Used | 0 (0.0%) | 0 (0.0%) |
| Total | 109 (100.0%) | 57 (100.0%) |
Household Vehicle Usage in Sparkman
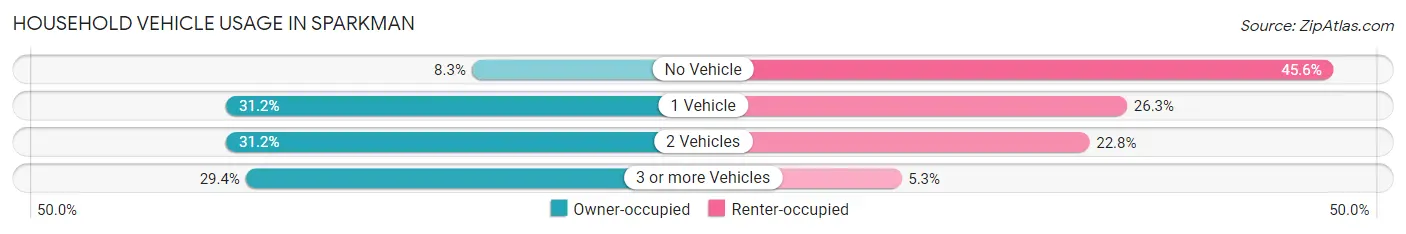
| Vehicles per Household | Owner-occupied | Renter-occupied |
| No Vehicle | 9 (8.3%) | 26 (45.6%) |
| 1 Vehicle | 34 (31.2%) | 15 (26.3%) |
| 2 Vehicles | 34 (31.2%) | 13 (22.8%) |
| 3 or more Vehicles | 32 (29.4%) | 3 (5.3%) |
| Total | 109 (100.0%) | 57 (100.0%) |
Real Estate & Mortgages in Sparkman
Real Estate and Mortgage Overview in Sparkman
| Characteristic | Without Mortgage | With Mortgage |
| Housing Units | 94 | 15 |
| Median Property Value | - | - |
| Median Household Income | $35,714 | $0 |
| Monthly Housing Costs | $305 | $0 |
| Real Estate Taxes | $199 | $0 |
Property Value by Mortgage Status in Sparkman
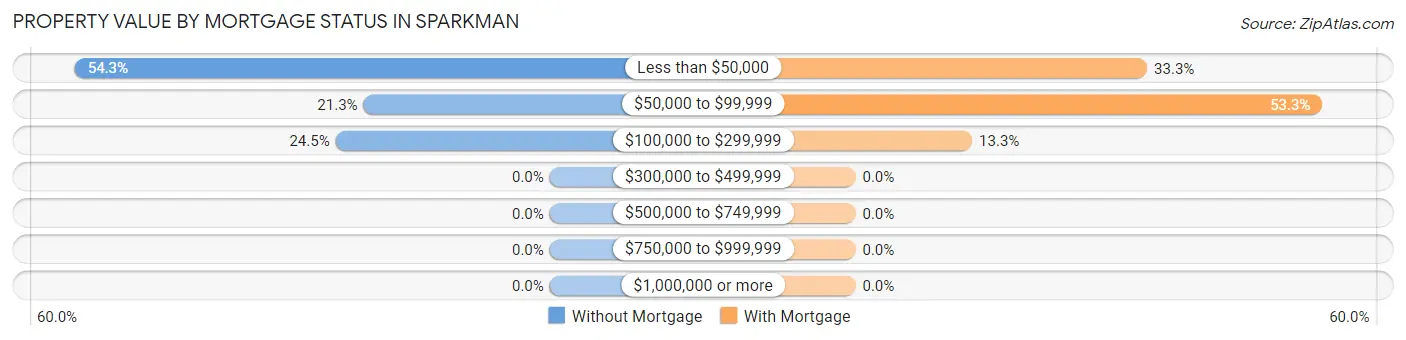
| Property Value | Without Mortgage | With Mortgage |
| Less than $50,000 | 51 (54.3%) | 5 (33.3%) |
| $50,000 to $99,999 | 20 (21.3%) | 8 (53.3%) |
| $100,000 to $299,999 | 23 (24.5%) | 2 (13.3%) |
| $300,000 to $499,999 | 0 (0.0%) | 0 (0.0%) |
| $500,000 to $749,999 | 0 (0.0%) | 0 (0.0%) |
| $750,000 to $999,999 | 0 (0.0%) | 0 (0.0%) |
| $1,000,000 or more | 0 (0.0%) | 0 (0.0%) |
| Total | 94 (100.0%) | 15 (100.0%) |
Household Income by Mortgage Status in Sparkman
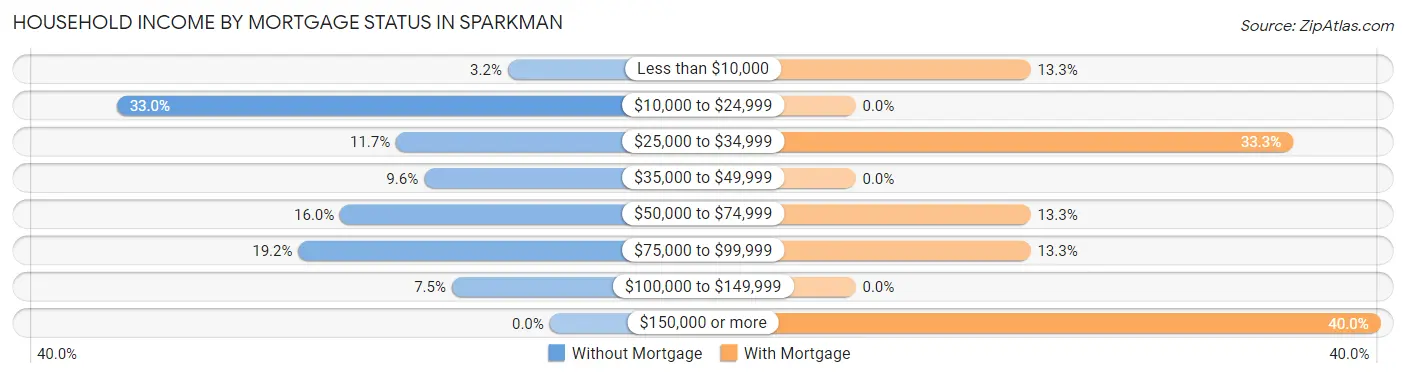
| Household Income | Without Mortgage | With Mortgage |
| Less than $10,000 | 3 (3.2%) | 2 (13.3%) |
| $10,000 to $24,999 | 31 (33.0%) | 0 (0.0%) |
| $25,000 to $34,999 | 11 (11.7%) | 5 (33.3%) |
| $35,000 to $49,999 | 9 (9.6%) | 0 (0.0%) |
| $50,000 to $74,999 | 15 (16.0%) | 2 (13.3%) |
| $75,000 to $99,999 | 18 (19.2%) | 2 (13.3%) |
| $100,000 to $149,999 | 7 (7.4%) | 0 (0.0%) |
| $150,000 or more | 0 (0.0%) | 6 (40.0%) |
| Total | 94 (100.0%) | 15 (100.0%) |
Property Value to Household Income Ratio in Sparkman
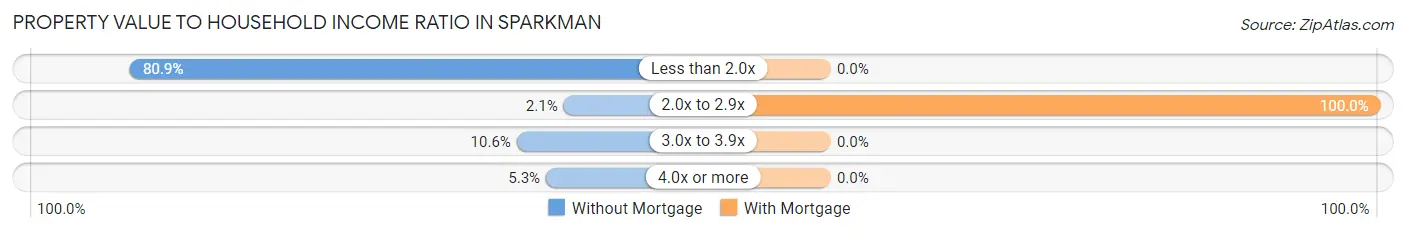
| Value-to-Income Ratio | Without Mortgage | With Mortgage |
| Less than 2.0x | 76 (80.8%) | 0 (0.0%) |
| 2.0x to 2.9x | 2 (2.1%) | 15 (100.0%) |
| 3.0x to 3.9x | 10 (10.6%) | 0 (0.0%) |
| 4.0x or more | 5 (5.3%) | 0 (0.0%) |
| Total | 94 (100.0%) | 15 (100.0%) |
Real Estate Taxes by Mortgage Status in Sparkman
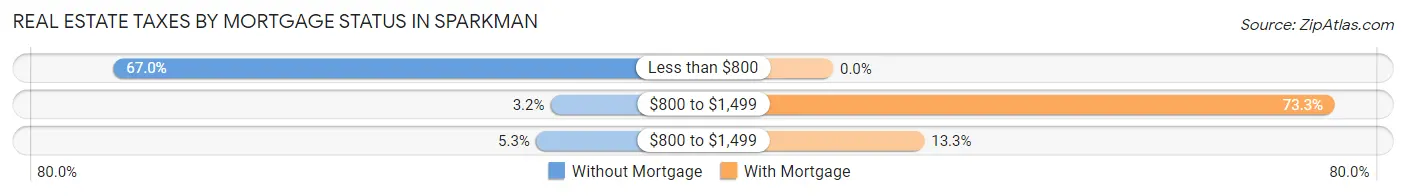
| Property Taxes | Without Mortgage | With Mortgage |
| Less than $800 | 63 (67.0%) | 0 (0.0%) |
| $800 to $1,499 | 3 (3.2%) | 11 (73.3%) |
| $800 to $1,499 | 5 (5.3%) | 2 (13.3%) |
| Total | 94 (100.0%) | 15 (100.0%) |
Health & Disability in Sparkman
Health Insurance Coverage by Age in Sparkman
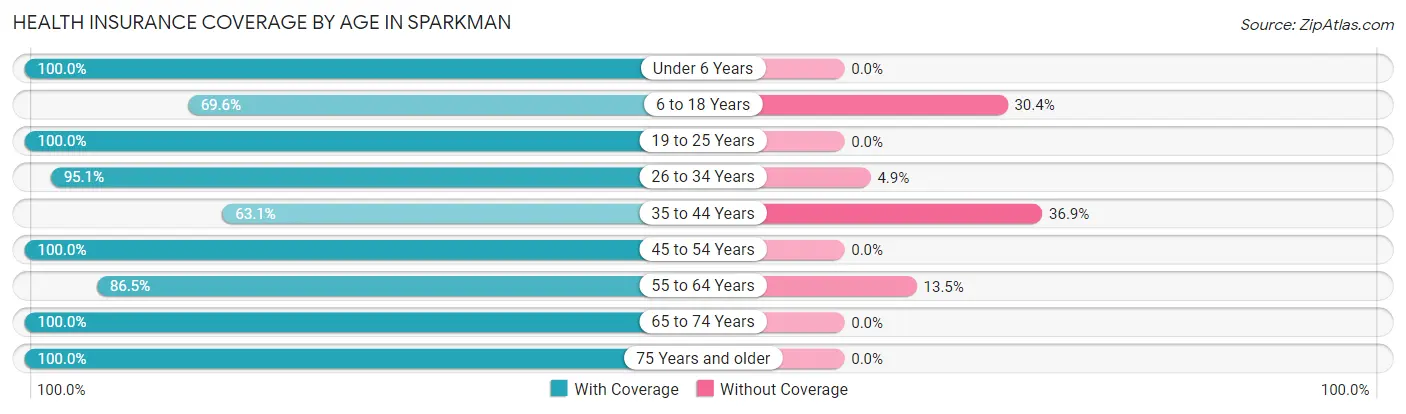
| Age Bracket | With Coverage | Without Coverage |
| Under 6 Years | 47 (100.0%) | 0 (0.0%) |
| 6 to 18 Years | 48 (69.6%) | 21 (30.4%) |
| 19 to 25 Years | 8 (100.0%) | 0 (0.0%) |
| 26 to 34 Years | 39 (95.1%) | 2 (4.9%) |
| 35 to 44 Years | 65 (63.1%) | 38 (36.9%) |
| 45 to 54 Years | 39 (100.0%) | 0 (0.0%) |
| 55 to 64 Years | 77 (86.5%) | 12 (13.5%) |
| 65 to 74 Years | 104 (100.0%) | 0 (0.0%) |
| 75 Years and older | 23 (100.0%) | 0 (0.0%) |
| Total | 450 (86.0%) | 73 (14.0%) |
Health Insurance Coverage by Citizenship Status in Sparkman
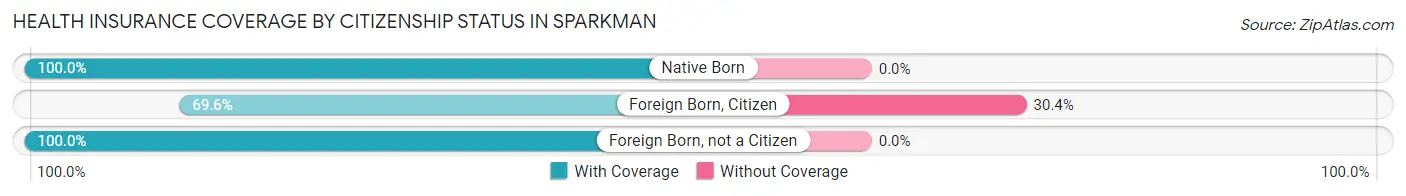
| Citizenship Status | With Coverage | Without Coverage |
| Native Born | 47 (100.0%) | 0 (0.0%) |
| Foreign Born, Citizen | 48 (69.6%) | 21 (30.4%) |
| Foreign Born, not a Citizen | 8 (100.0%) | 0 (0.0%) |
Health Insurance Coverage by Household Income in Sparkman
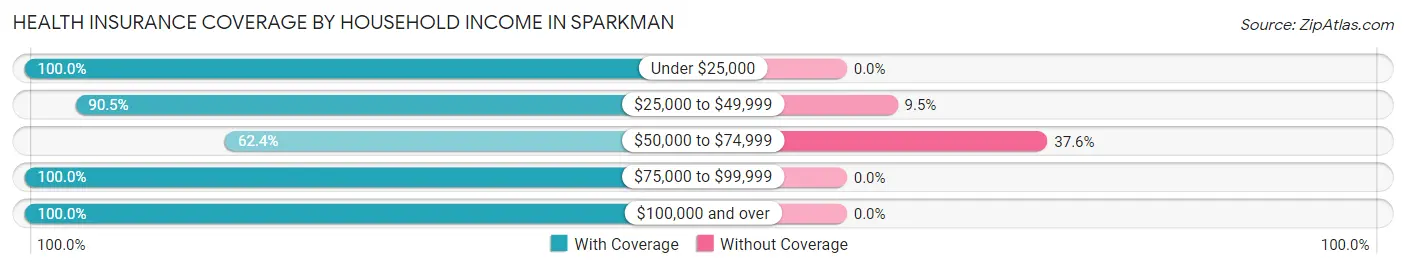
| Household Income | With Coverage | Without Coverage |
| Under $25,000 | 99 (100.0%) | 0 (0.0%) |
| $25,000 to $49,999 | 133 (90.5%) | 14 (9.5%) |
| $50,000 to $74,999 | 98 (62.4%) | 59 (37.6%) |
| $75,000 to $99,999 | 58 (100.0%) | 0 (0.0%) |
| $100,000 and over | 62 (100.0%) | 0 (0.0%) |
Public vs Private Health Insurance Coverage by Age in Sparkman
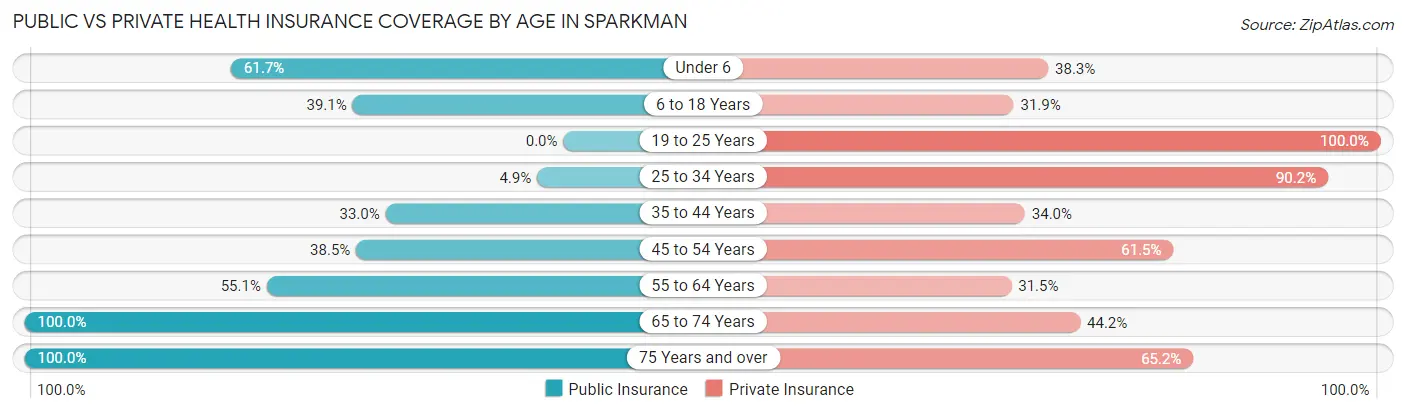
| Age Bracket | Public Insurance | Private Insurance |
| Under 6 | 29 (61.7%) | 18 (38.3%) |
| 6 to 18 Years | 27 (39.1%) | 22 (31.9%) |
| 19 to 25 Years | 0 (0.0%) | 8 (100.0%) |
| 25 to 34 Years | 2 (4.9%) | 37 (90.2%) |
| 35 to 44 Years | 34 (33.0%) | 35 (34.0%) |
| 45 to 54 Years | 15 (38.5%) | 24 (61.5%) |
| 55 to 64 Years | 49 (55.1%) | 28 (31.5%) |
| 65 to 74 Years | 104 (100.0%) | 46 (44.2%) |
| 75 Years and over | 23 (100.0%) | 15 (65.2%) |
| Total | 283 (54.1%) | 233 (44.6%) |
Disability Status by Sex by Age in Sparkman
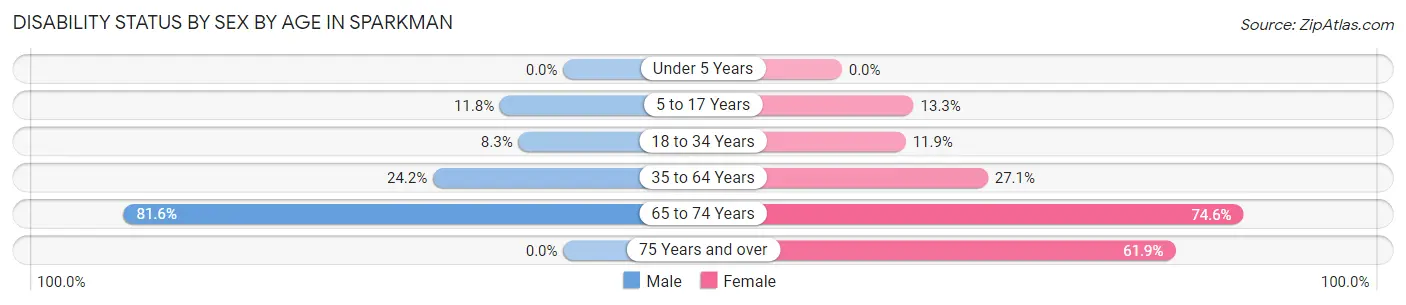
| Age Bracket | Male | Female |
| Under 5 Years | 0 (0.0%) | 0 (0.0%) |
| 5 to 17 Years | 4 (11.8%) | 2 (13.3%) |
| 18 to 34 Years | 1 (8.3%) | 7 (11.9%) |
| 35 to 64 Years | 30 (24.2%) | 29 (27.1%) |
| 65 to 74 Years | 40 (81.6%) | 41 (74.6%) |
| 75 Years and over | 0 (0.0%) | 13 (61.9%) |
Disability Class by Sex by Age in Sparkman
Disability Class: Hearing Difficulty
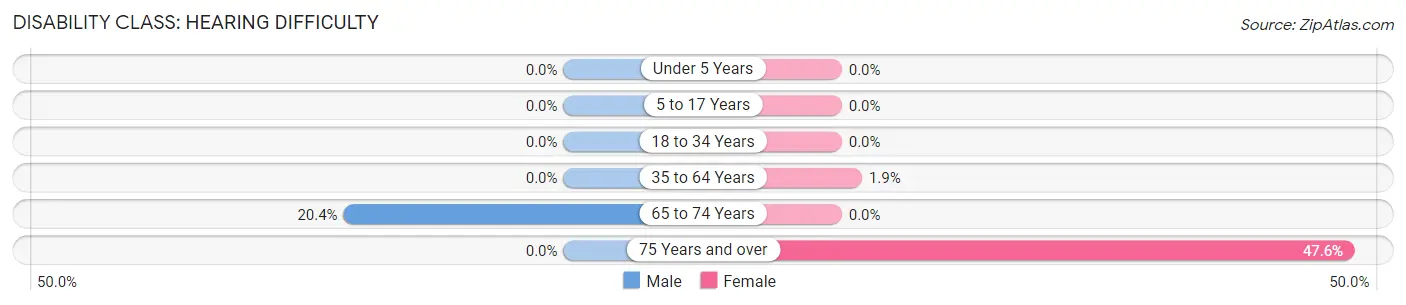
| Age Bracket | Male | Female |
| Under 5 Years | 0 (0.0%) | 0 (0.0%) |
| 5 to 17 Years | 0 (0.0%) | 0 (0.0%) |
| 18 to 34 Years | 0 (0.0%) | 0 (0.0%) |
| 35 to 64 Years | 0 (0.0%) | 2 (1.9%) |
| 65 to 74 Years | 10 (20.4%) | 0 (0.0%) |
| 75 Years and over | 0 (0.0%) | 10 (47.6%) |
Disability Class: Vision Difficulty
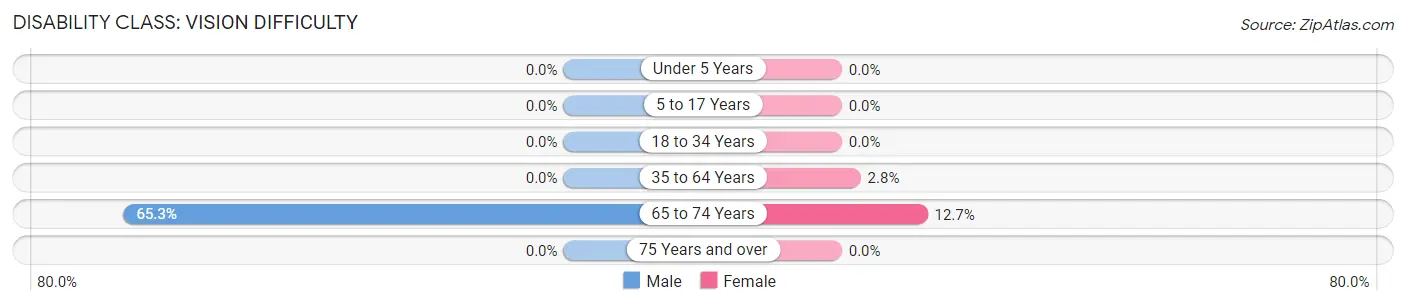
| Age Bracket | Male | Female |
| Under 5 Years | 0 (0.0%) | 0 (0.0%) |
| 5 to 17 Years | 0 (0.0%) | 0 (0.0%) |
| 18 to 34 Years | 0 (0.0%) | 0 (0.0%) |
| 35 to 64 Years | 0 (0.0%) | 3 (2.8%) |
| 65 to 74 Years | 32 (65.3%) | 7 (12.7%) |
| 75 Years and over | 0 (0.0%) | 0 (0.0%) |
Disability Class: Cognitive Difficulty
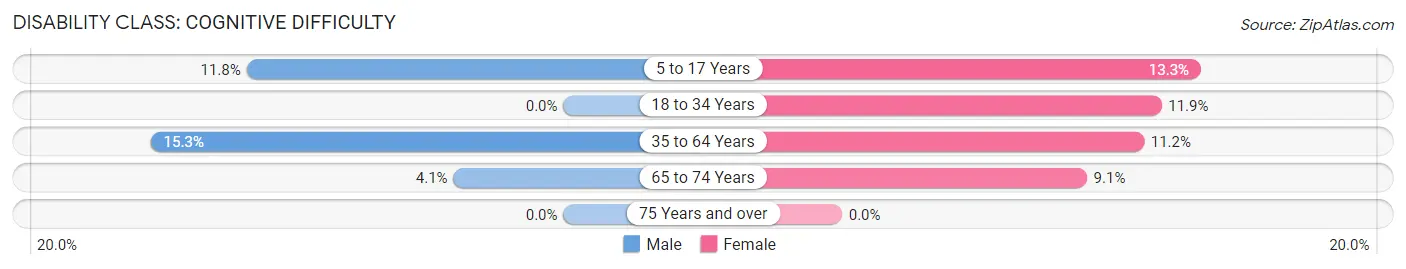
| Age Bracket | Male | Female |
| 5 to 17 Years | 4 (11.8%) | 2 (13.3%) |
| 18 to 34 Years | 0 (0.0%) | 7 (11.9%) |
| 35 to 64 Years | 19 (15.3%) | 12 (11.2%) |
| 65 to 74 Years | 2 (4.1%) | 5 (9.1%) |
| 75 Years and over | 0 (0.0%) | 0 (0.0%) |
Disability Class: Ambulatory Difficulty
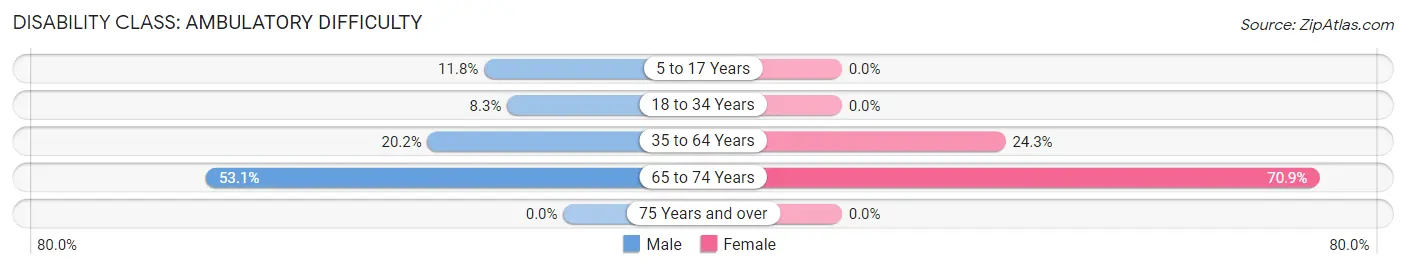
| Age Bracket | Male | Female |
| 5 to 17 Years | 4 (11.8%) | 0 (0.0%) |
| 18 to 34 Years | 1 (8.3%) | 0 (0.0%) |
| 35 to 64 Years | 25 (20.2%) | 26 (24.3%) |
| 65 to 74 Years | 26 (53.1%) | 39 (70.9%) |
| 75 Years and over | 0 (0.0%) | 0 (0.0%) |
Disability Class: Self-Care Difficulty
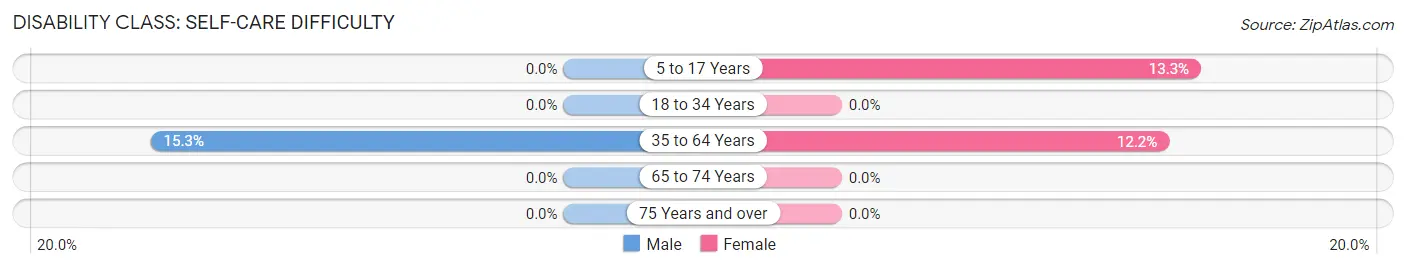
| Age Bracket | Male | Female |
| 5 to 17 Years | 0 (0.0%) | 2 (13.3%) |
| 18 to 34 Years | 0 (0.0%) | 0 (0.0%) |
| 35 to 64 Years | 19 (15.3%) | 13 (12.1%) |
| 65 to 74 Years | 0 (0.0%) | 0 (0.0%) |
| 75 Years and over | 0 (0.0%) | 0 (0.0%) |
Technology Access in Sparkman
Computing Device Access in Sparkman
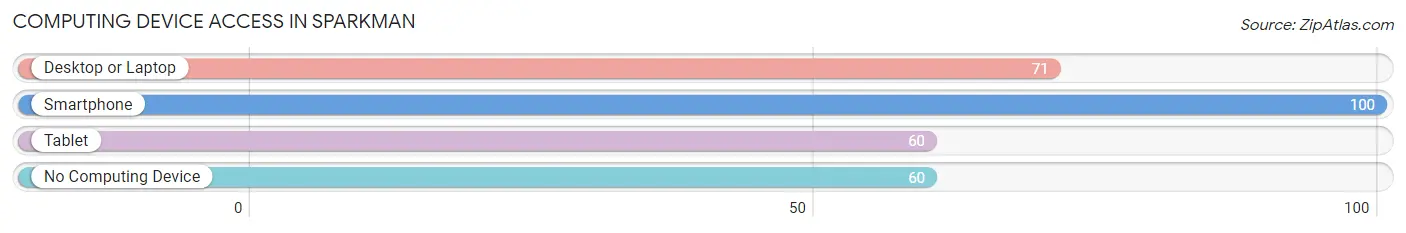
| Device Type | # Households | % Households |
| Desktop or Laptop | 71 | 42.8% |
| Smartphone | 100 | 60.2% |
| Tablet | 60 | 36.1% |
| No Computing Device | 60 | 36.1% |
| Total | 166 | 100.0% |
Internet Access in Sparkman
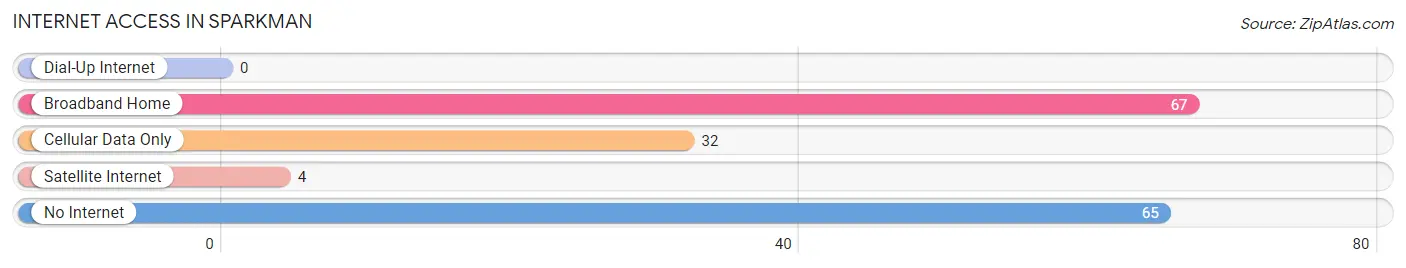
| Internet Type | # Households | % Households |
| Dial-Up Internet | 0 | 0.0% |
| Broadband Home | 67 | 40.4% |
| Cellular Data Only | 32 | 19.3% |
| Satellite Internet | 4 | 2.4% |
| No Internet | 65 | 39.2% |
| Total | 166 | 100.0% |
Sparkman Summary
Sparkman is a small town located in the southwestern corner of Arkansas, in the foothills of the Ouachita Mountains. It is situated in the county of Dallas, and is part of the Texarkana metropolitan area. The town has a population of just over 1,000 people, and is known for its rural charm and friendly atmosphere.
History
The area that is now Sparkman was first settled in the early 1800s by a group of settlers from Tennessee. The town was originally known as “Sparkman’s Station”, named after the first settler, William Sparkman. The town was officially incorporated in 1883, and the first post office was established in 1884.
In the early 1900s, the town began to grow and prosper. The railroad came to town in 1906, and the town was connected to the rest of the state by the Arkansas and Louisiana Railway. This allowed for the growth of the local economy, as well as the population.
In the 1920s, the town was home to a number of businesses, including a cotton gin, a sawmill, and a grist mill. The town also had a number of churches, including the First Baptist Church, which was established in 1883.
Geography
Sparkman is located in the southwestern corner of Arkansas, in the foothills of the Ouachita Mountains. The town is situated in the county of Dallas, and is part of the Texarkana metropolitan area. The town is located at the intersection of Arkansas Highway 8 and Arkansas Highway 24.
The town is surrounded by rolling hills and forests, and is located near the Ouachita National Forest. The town is also located near the Little Missouri River, which provides a scenic backdrop for the town.
Economy
The economy of Sparkman is largely based on agriculture and forestry. The town is home to a number of farms, and the surrounding area is home to a number of timber companies. The town is also home to a number of small businesses, including a grocery store, a hardware store, and a few restaurants.
The town is also home to a number of manufacturing companies, including a furniture factory and a plastics factory. The town is also home to a number of service-based businesses, including a number of auto repair shops and a few medical offices.
Demographics
As of the 2010 census, the population of Sparkman was 1,072. The racial makeup of the town was 95.3% White, 0.7% African American, 0.3% Native American, 0.2% Asian, 0.1% Pacific Islander, and 3.4% from two or more races. The median household income was $31,250, and the median family income was $37,500.
The town is home to a number of churches, including the First Baptist Church, which was established in 1883. The town is also home to a number of schools, including Sparkman Elementary School, Sparkman Middle School, and Sparkman High School.
Conclusion
Sparkman is a small town located in the southwestern corner of Arkansas, in the foothills of the Ouachita Mountains. The town has a population of just over 1,000 people, and is known for its rural charm and friendly atmosphere. The economy of the town is largely based on agriculture and forestry, and the town is home to a number of small businesses. The town is also home to a number of churches and schools, and is part of the Texarkana metropolitan area.
Common Questions
What is Per Capita Income in Sparkman?
Per Capita income in Sparkman is $22,077.
What is the Median Family Income in Sparkman?
Median Family Income in Sparkman is $44,375.
What is the Median Household income in Sparkman?
Median Household Income in Sparkman is $35,870.
What is Income or Wage Gap in Sparkman?
Income or Wage Gap in Sparkman is 16.5%.
Women in Sparkman earn 83.5 cents for every dollar earned by a man.
What is Family Income Deficit in Sparkman?
Family Income Deficit in Sparkman is $8,971.
Families that are below poverty line in Sparkman earn $8,971 less on average than the poverty threshold level.
What is Inequality or Gini Index in Sparkman?
Inequality or Gini Index in Sparkman is 0.45.
What is the Total Population of Sparkman?
Total Population of Sparkman is 523.
What is the Total Male Population of Sparkman?
Total Male Population of Sparkman is 253.
What is the Total Female Population of Sparkman?
Total Female Population of Sparkman is 270.
What is the Ratio of Males per 100 Females in Sparkman?
There are 93.70 Males per 100 Females in Sparkman.
What is the Ratio of Females per 100 Males in Sparkman?
There are 106.72 Females per 100 Males in Sparkman.
What is the Median Population Age in Sparkman?
Median Population Age in Sparkman is 42.4 Years.
What is the Average Family Size in Sparkman
Average Family Size in Sparkman is 3.8 People.
What is the Average Household Size in Sparkman
Average Household Size in Sparkman is 3.1 People.
How Large is the Labor Force in Sparkman?
There are 197 People in the Labor Forcein in Sparkman.
What is the Percentage of People in the Labor Force in Sparkman?
45.8% of People are in the Labor Force in Sparkman.
What is the Unemployment Rate in Sparkman?
Unemployment Rate in Sparkman is 4.6%.