Smackover, AR Map & Demographics
Smackover Map
Smackover Overview
$26,611
PER CAPITA INCOME
$71,442
AVG FAMILY INCOME
$52,500
AVG HOUSEHOLD INCOME
56.6%
WAGE / INCOME GAP [ % ]
43.4¢/ $1
WAGE / INCOME GAP [ $ ]
0.45
INEQUALITY / GINI INDEX
1,975
TOTAL POPULATION
1,011
MALE POPULATION
964
FEMALE POPULATION
104.88
MALES / 100 FEMALES
95.35
FEMALES / 100 MALES
43.3
MEDIAN AGE
3.0
AVG FAMILY SIZE
2.5
AVG HOUSEHOLD SIZE
955
LABOR FORCE [ PEOPLE ]
60.3%
PERCENT IN LABOR FORCE
4.4%
UNEMPLOYMENT RATE
Smackover Zip Codes
Smackover Area Codes
Income in Smackover
Income Overview in Smackover
Per Capita Income in Smackover is $26,611, while median incomes of families and households are $71,442 and $52,500 respectively.
| Characteristic | Number | Measure |
| Per Capita Income | 1,975 | $26,611 |
| Median Family Income | 539 | $71,442 |
| Mean Family Income | 539 | $79,403 |
| Median Household Income | 776 | $52,500 |
| Mean Household Income | 776 | $66,320 |
| Income Deficit | 539 | $0 |
| Wage / Income Gap (%) | 1,975 | 56.64% |
| Wage / Income Gap ($) | 1,975 | 43.36¢ per $1 |
| Gini / Inequality Index | 1,975 | 0.45 |
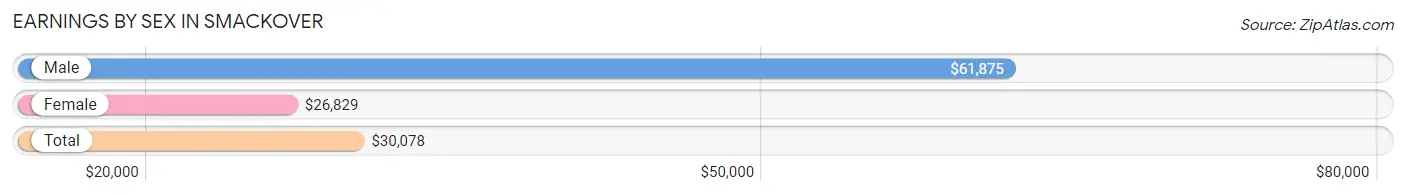
Earnings by Sex in Smackover
Average Earnings in Smackover are $30,078, $61,875 for men and $26,829 for women, a difference of 56.6%.
| Sex | Number | Average Earnings |
| Male | 424 (44.5%) | $61,875 |
| Female | 529 (55.5%) | $26,829 |
| Total | 953 (100.0%) | $30,078 |
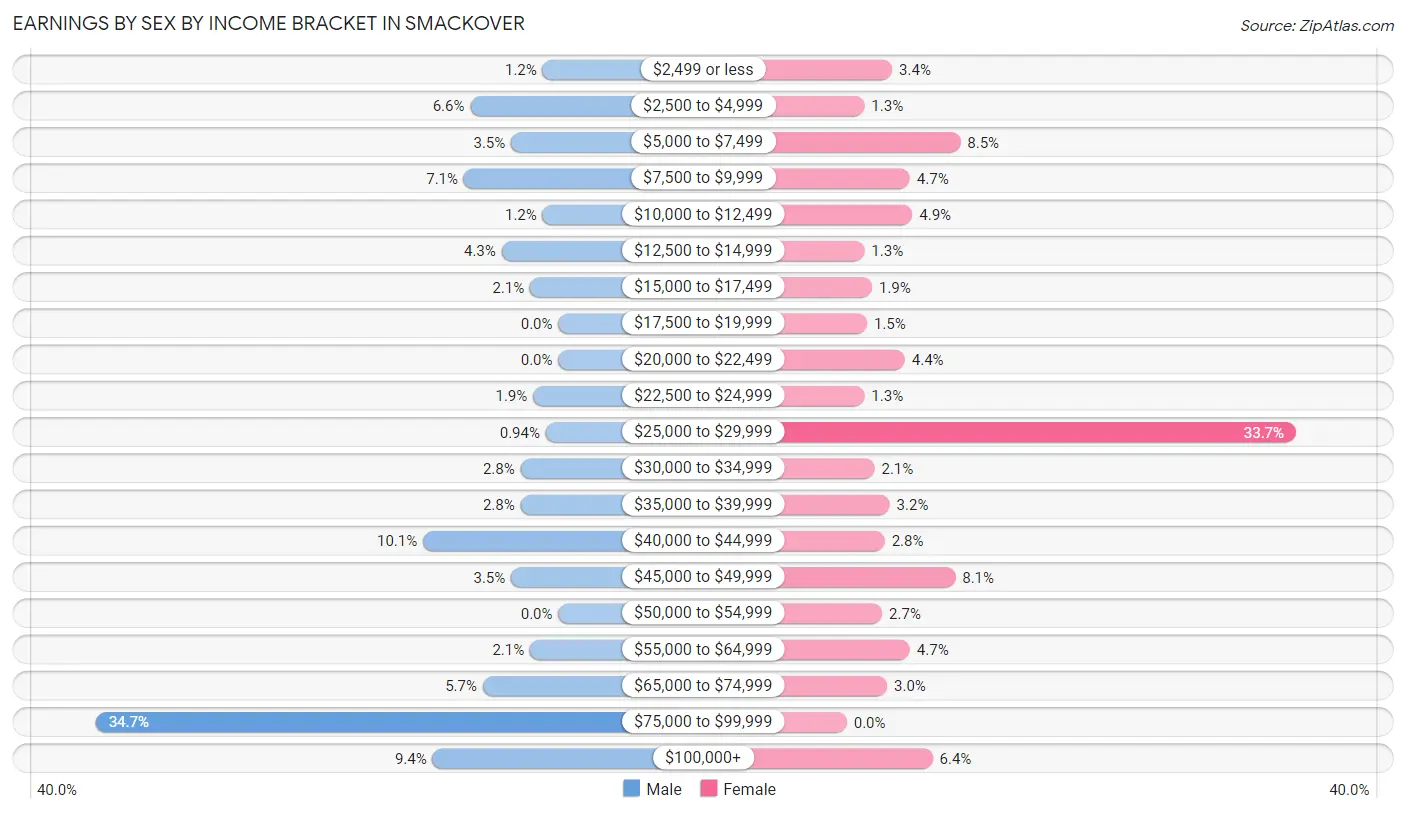
Earnings by Sex by Income Bracket in Smackover
The most common earnings brackets in Smackover are $75,000 to $99,999 for men (147 | 34.7%) and $25,000 to $29,999 for women (178 | 33.7%).
| Income | Male | Female |
| $2,499 or less | 5 (1.2%) | 18 (3.4%) |
| $2,500 to $4,999 | 28 (6.6%) | 7 (1.3%) |
| $5,000 to $7,499 | 15 (3.5%) | 45 (8.5%) |
| $7,500 to $9,999 | 30 (7.1%) | 25 (4.7%) |
| $10,000 to $12,499 | 5 (1.2%) | 26 (4.9%) |
| $12,500 to $14,999 | 18 (4.3%) | 7 (1.3%) |
| $15,000 to $17,499 | 9 (2.1%) | 10 (1.9%) |
| $17,500 to $19,999 | 0 (0.0%) | 8 (1.5%) |
| $20,000 to $22,499 | 0 (0.0%) | 23 (4.3%) |
| $22,500 to $24,999 | 8 (1.9%) | 7 (1.3%) |
| $25,000 to $29,999 | 4 (0.9%) | 178 (33.7%) |
| $30,000 to $34,999 | 12 (2.8%) | 11 (2.1%) |
| $35,000 to $39,999 | 12 (2.8%) | 17 (3.2%) |
| $40,000 to $44,999 | 43 (10.1%) | 15 (2.8%) |
| $45,000 to $49,999 | 15 (3.5%) | 43 (8.1%) |
| $50,000 to $54,999 | 0 (0.0%) | 14 (2.6%) |
| $55,000 to $64,999 | 9 (2.1%) | 25 (4.7%) |
| $65,000 to $74,999 | 24 (5.7%) | 16 (3.0%) |
| $75,000 to $99,999 | 147 (34.7%) | 0 (0.0%) |
| $100,000+ | 40 (9.4%) | 34 (6.4%) |
| Total | 424 (100.0%) | 529 (100.0%) |
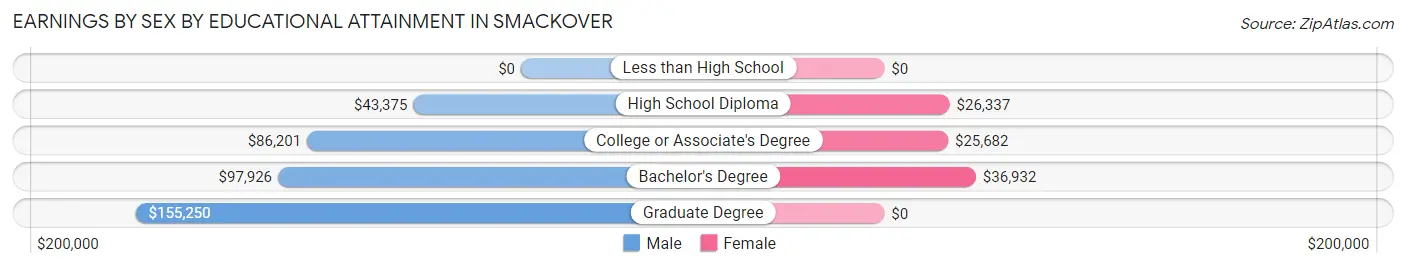
Earnings by Sex by Educational Attainment in Smackover
Average earnings in Smackover are $68,889 for men and $27,417 for women, a difference of 60.2%. Men with an educational attainment of graduate degree enjoy the highest average annual earnings of $155,250, while those with high school diploma education earn the least with $43,375. Women with an educational attainment of bachelor's degree earn the most with the average annual earnings of $36,932, while those with college or associate's degree education have the smallest earnings of $25,682.
| Educational Attainment | Male Income | Female Income |
| Less than High School | - | - |
| High School Diploma | $43,375 | $26,337 |
| College or Associate's Degree | $86,201 | $25,682 |
| Bachelor's Degree | $97,926 | $36,932 |
| Graduate Degree | $155,250 | $0 |
| Total | $68,889 | $27,417 |
Family Income in Smackover
Family Income Brackets in Smackover
According to the Smackover family income data, there are 153 families falling into the $100,000 to $149,999 income range, which is the most common income bracket and makes up 28.4% of all families. Conversely, the $200,000+ income bracket is the least frequent group with only 10 families (1.9%) belonging to this category.
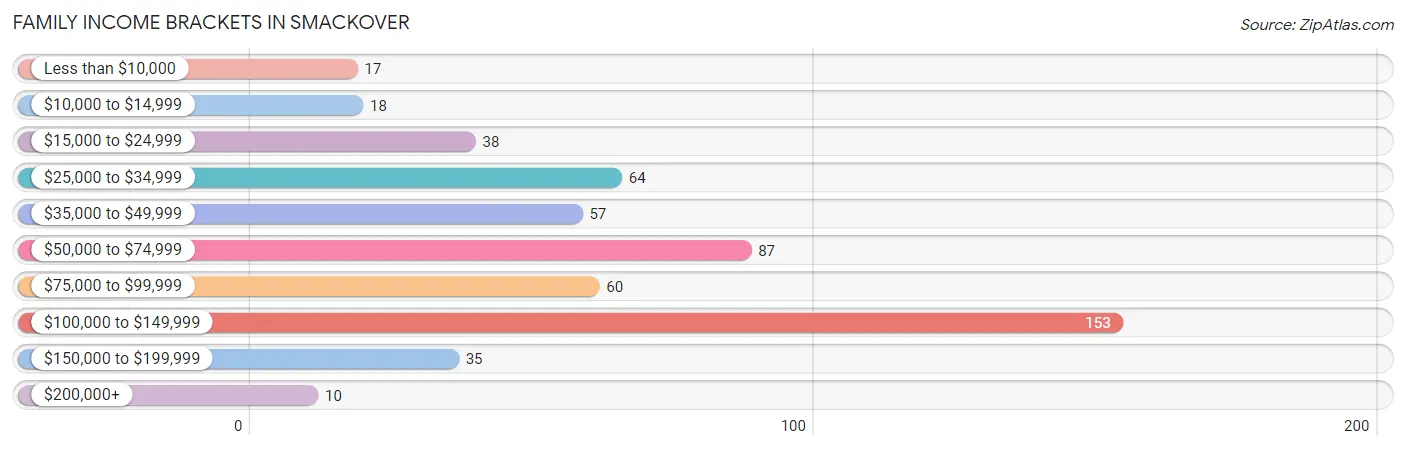
| Income Bracket | # Families | % Families |
| Less than $10,000 | 17 | 3.2% |
| $10,000 to $14,999 | 18 | 3.3% |
| $15,000 to $24,999 | 38 | 7.1% |
| $25,000 to $34,999 | 64 | 11.9% |
| $35,000 to $49,999 | 57 | 10.6% |
| $50,000 to $74,999 | 87 | 16.1% |
| $75,000 to $99,999 | 60 | 11.1% |
| $100,000 to $149,999 | 153 | 28.4% |
| $150,000 to $199,999 | 35 | 6.5% |
| $200,000+ | 10 | 1.9% |
Family Income by Famaliy Size in Smackover
3-person families (143 | 26.5%) account for the highest median family income in Smackover with $99,417 per family, while 3-person families (143 | 26.5%) have the highest median income of $33,139 per family member.
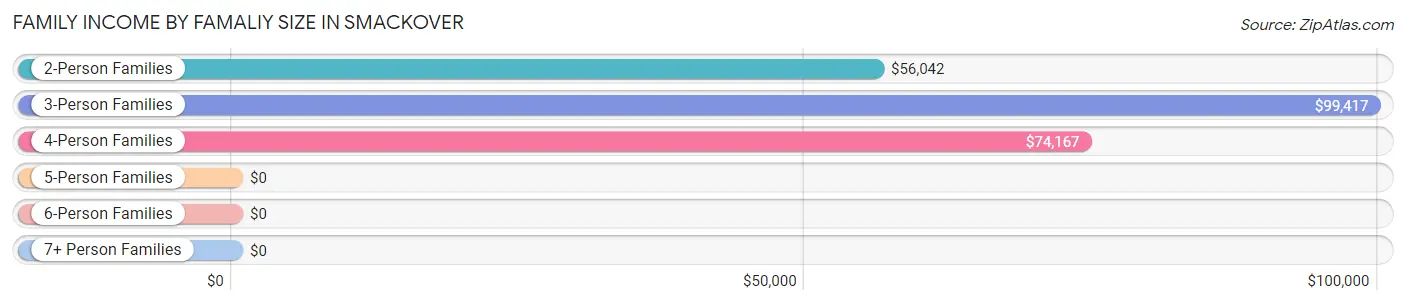
| Income Bracket | # Families | Median Income |
| 2-Person Families | 326 (60.5%) | $56,042 |
| 3-Person Families | 143 (26.5%) | $99,417 |
| 4-Person Families | 46 (8.5%) | $74,167 |
| 5-Person Families | 19 (3.5%) | $0 |
| 6-Person Families | 5 (0.9%) | $0 |
| 7+ Person Families | 0 (0.0%) | $0 |
| Total | 539 (100.0%) | $71,442 |
Family Income by Number of Earners in Smackover
The median family income in Smackover is $71,442, with families comprising 2 earners (245) having the highest median family income of $113,103, while families with no earners (99) have the lowest median family income of $26,531, accounting for 45.5% and 18.4% of families, respectively.
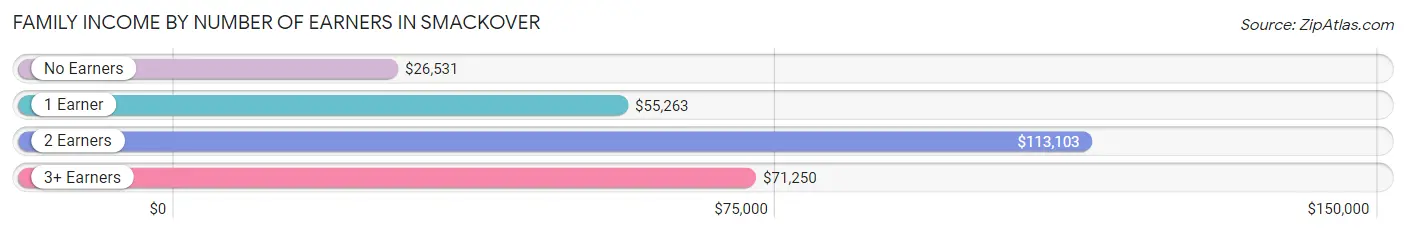
| Number of Earners | # Families | Median Income |
| No Earners | 99 (18.4%) | $26,531 |
| 1 Earner | 166 (30.8%) | $55,263 |
| 2 Earners | 245 (45.5%) | $113,103 |
| 3+ Earners | 29 (5.4%) | $71,250 |
| Total | 539 (100.0%) | $71,442 |
Household Income in Smackover
Household Income Brackets in Smackover
With 166 households falling in the category, the $100,000 to $149,999 income range is the most frequent in Smackover, accounting for 21.4% of all households. In contrast, only 10 households (1.3%) fall into the $200,000+ income bracket, making it the least populous group.
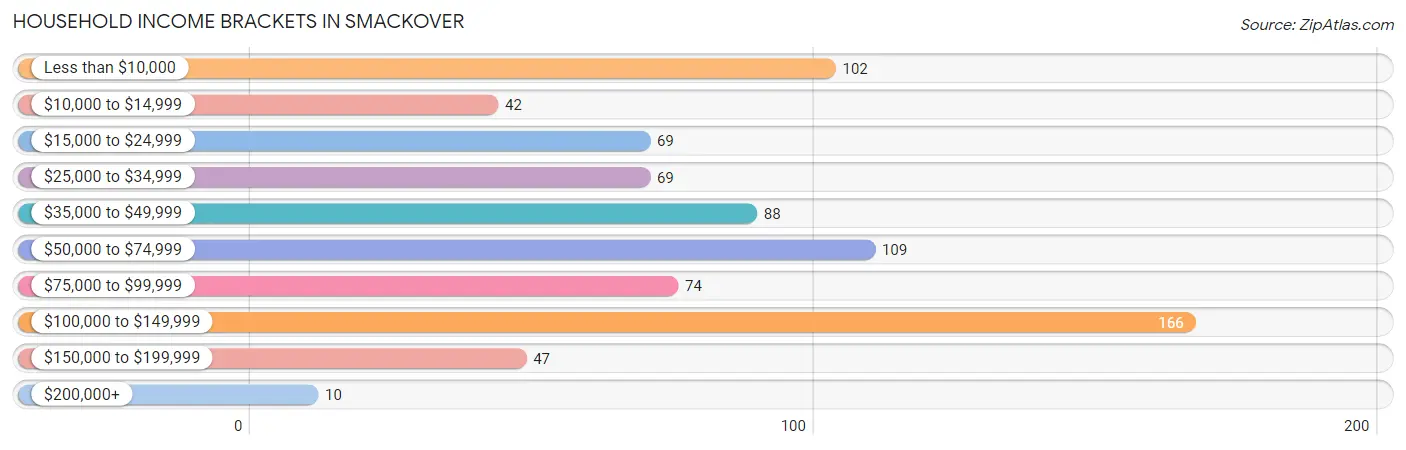
| Income Bracket | # Households | % Households |
| Less than $10,000 | 102 | 13.1% |
| $10,000 to $14,999 | 42 | 5.4% |
| $15,000 to $24,999 | 69 | 8.9% |
| $25,000 to $34,999 | 69 | 8.9% |
| $35,000 to $49,999 | 88 | 11.3% |
| $50,000 to $74,999 | 109 | 14.0% |
| $75,000 to $99,999 | 74 | 9.5% |
| $100,000 to $149,999 | 166 | 21.4% |
| $150,000 to $199,999 | 47 | 6.1% |
| $200,000+ | 10 | 1.3% |
Household Income by Householder Age in Smackover
The median household income in Smackover is $52,500, with the highest median household income of $100,114 found in the 25 to 44 years age bracket for the primary householder. A total of 201 households (25.9%) fall into this category. Meanwhile, the 15 to 24 years age bracket for the primary householder has the lowest median household income of $0, with 17 households (2.2%) in this group.
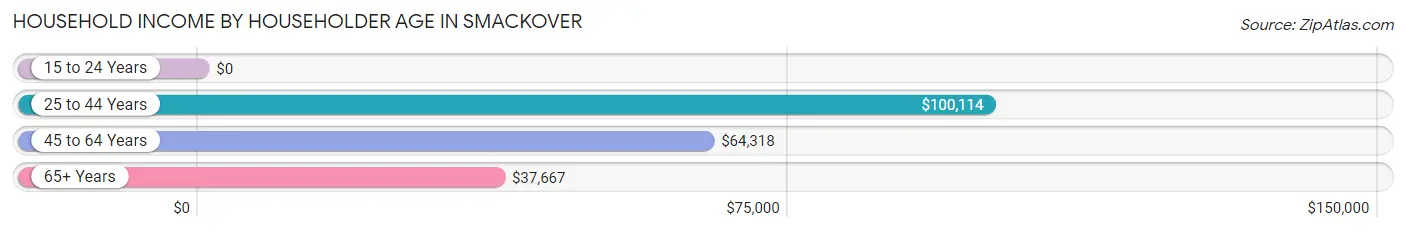
| Income Bracket | # Households | Median Income |
| 15 to 24 Years | 17 (2.2%) | $0 |
| 25 to 44 Years | 201 (25.9%) | $100,114 |
| 45 to 64 Years | 346 (44.6%) | $64,318 |
| 65+ Years | 212 (27.3%) | $37,667 |
| Total | 776 (100.0%) | $52,500 |
Poverty in Smackover
Income Below Poverty by Sex and Age in Smackover
With 19.1% poverty level for males and 21.2% for females among the residents of Smackover, 5 year old males and 25 to 34 year old females are the most vulnerable to poverty, with 4 males (66.7%) and 52 females (72.2%) in their respective age groups living below the poverty level.
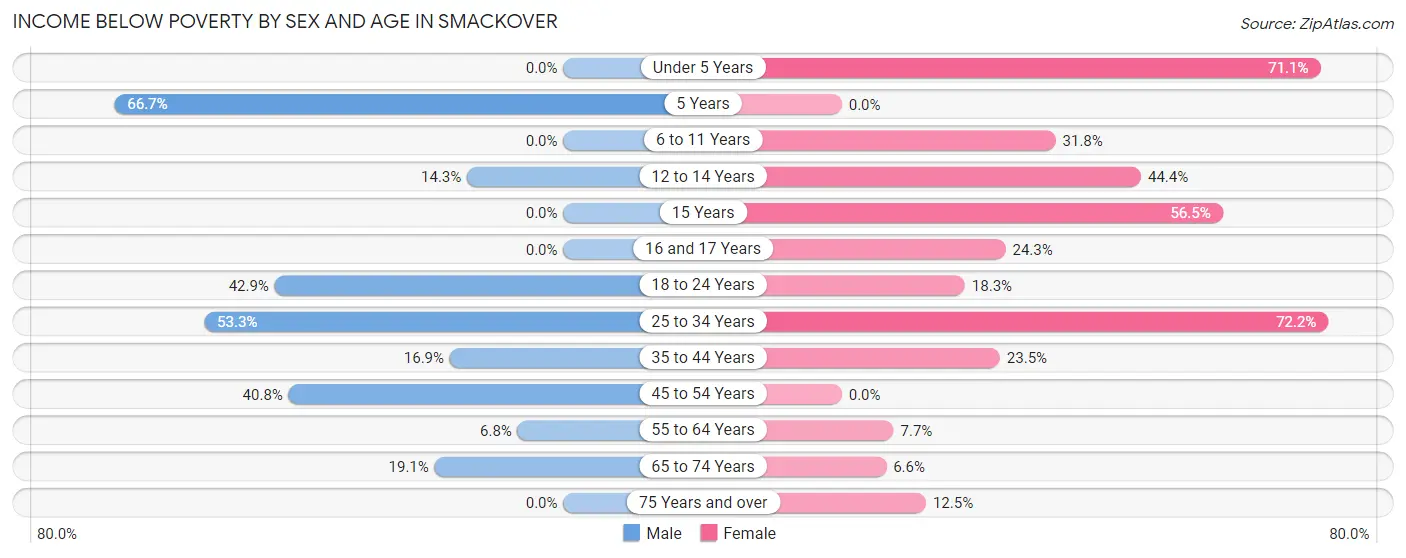
| Age Bracket | Male | Female |
| Under 5 Years | 0 (0.0%) | 27 (71.1%) |
| 5 Years | 4 (66.7%) | 0 (0.0%) |
| 6 to 11 Years | 0 (0.0%) | 20 (31.8%) |
| 12 to 14 Years | 9 (14.3%) | 4 (44.4%) |
| 15 Years | 0 (0.0%) | 13 (56.5%) |
| 16 and 17 Years | 0 (0.0%) | 9 (24.3%) |
| 18 to 24 Years | 42 (42.9%) | 17 (18.3%) |
| 25 to 34 Years | 32 (53.3%) | 52 (72.2%) |
| 35 to 44 Years | 30 (16.9%) | 31 (23.5%) |
| 45 to 54 Years | 31 (40.8%) | 0 (0.0%) |
| 55 to 64 Years | 12 (6.8%) | 10 (7.7%) |
| 65 to 74 Years | 26 (19.1%) | 12 (6.6%) |
| 75 Years and over | 0 (0.0%) | 6 (12.5%) |
| Total | 186 (19.1%) | 201 (21.2%) |
Income Above Poverty by Sex and Age in Smackover
According to the poverty statistics in Smackover, males aged under 5 years and females aged 45 to 54 years are the age groups that are most secure financially, with 100.0% of males and 100.0% of females in these age groups living above the poverty line.
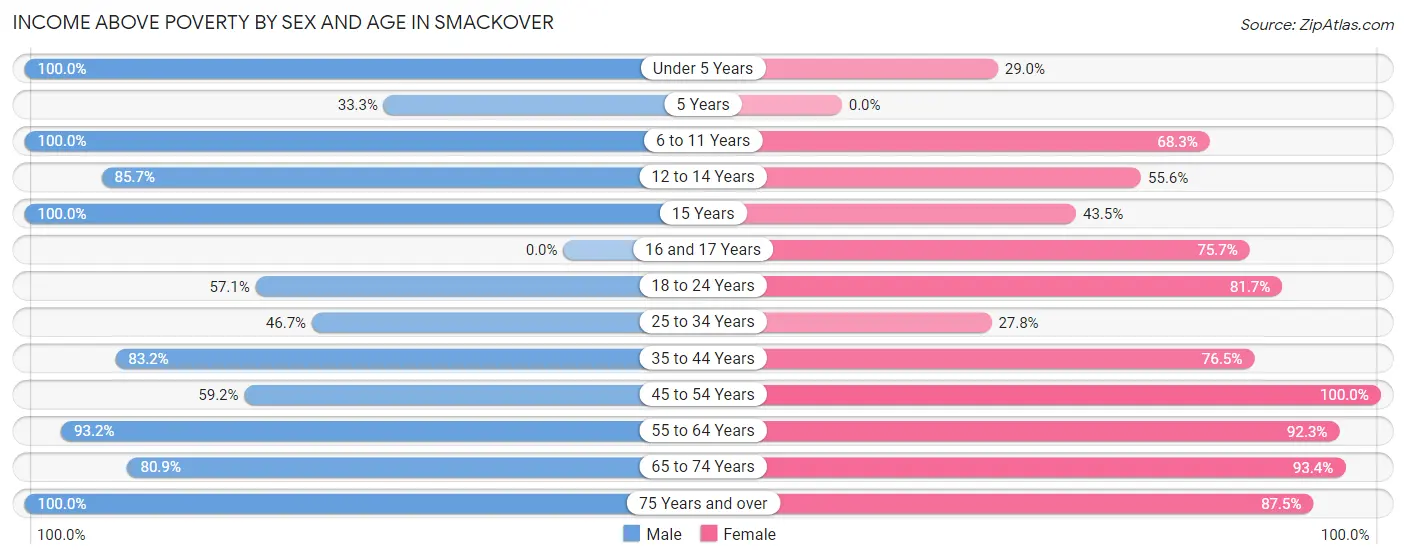
| Age Bracket | Male | Female |
| Under 5 Years | 17 (100.0%) | 11 (28.9%) |
| 5 Years | 2 (33.3%) | 0 (0.0%) |
| 6 to 11 Years | 115 (100.0%) | 43 (68.2%) |
| 12 to 14 Years | 54 (85.7%) | 5 (55.6%) |
| 15 Years | 6 (100.0%) | 10 (43.5%) |
| 16 and 17 Years | 0 (0.0%) | 28 (75.7%) |
| 18 to 24 Years | 56 (57.1%) | 76 (81.7%) |
| 25 to 34 Years | 28 (46.7%) | 20 (27.8%) |
| 35 to 44 Years | 148 (83.2%) | 101 (76.5%) |
| 45 to 54 Years | 45 (59.2%) | 120 (100.0%) |
| 55 to 64 Years | 165 (93.2%) | 120 (92.3%) |
| 65 to 74 Years | 110 (80.9%) | 170 (93.4%) |
| 75 Years and over | 44 (100.0%) | 42 (87.5%) |
| Total | 790 (80.9%) | 746 (78.8%) |
Income Below Poverty Among Married-Couple Families in Smackover
The poverty statistics for married-couple families in Smackover show that 3.4% or 12 of the total 353 families live below the poverty line. Families with 1 or 2 children have the highest poverty rate of 9.0%, comprising of 12 families. On the other hand, families with no children have the lowest poverty rate of 0.0%, which includes 0 families.
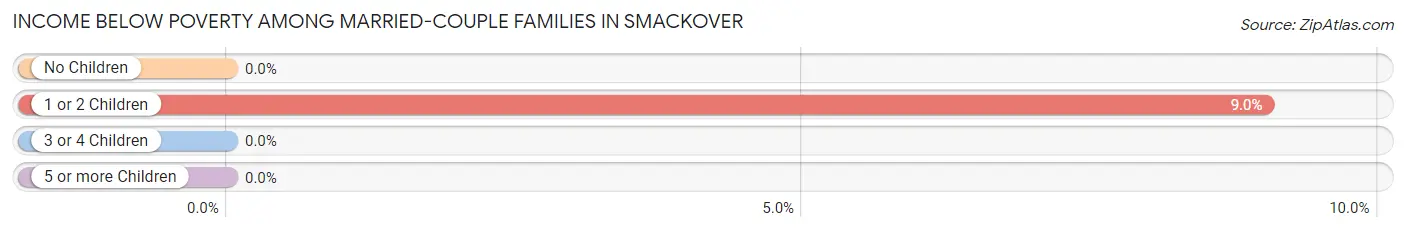
| Children | Above Poverty | Below Poverty |
| No Children | 208 (100.0%) | 0 (0.0%) |
| 1 or 2 Children | 121 (91.0%) | 12 (9.0%) |
| 3 or 4 Children | 12 (100.0%) | 0 (0.0%) |
| 5 or more Children | 0 (0.0%) | 0 (0.0%) |
| Total | 341 (96.6%) | 12 (3.4%) |
Income Below Poverty Among Single-Parent Households in Smackover
According to the poverty data in Smackover, 8.6% or 7 single-father households and 40.0% or 42 single-mother households are living below the poverty line. Among single-father households, those with 1 or 2 children have the highest poverty rate, with 7 households (21.9%) experiencing poverty. Likewise, among single-mother households, those with 1 or 2 children have the highest poverty rate, with 28 households (50.0%) falling below the poverty line.
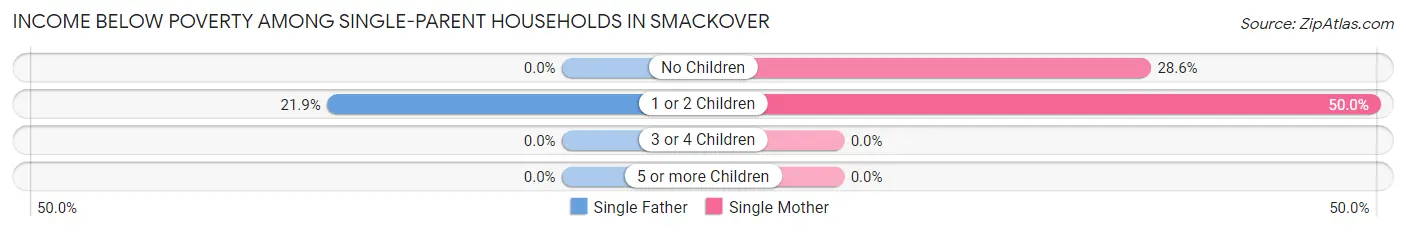
| Children | Single Father | Single Mother |
| No Children | 0 (0.0%) | 14 (28.6%) |
| 1 or 2 Children | 7 (21.9%) | 28 (50.0%) |
| 3 or 4 Children | 0 (0.0%) | 0 (0.0%) |
| 5 or more Children | 0 (0.0%) | 0 (0.0%) |
| Total | 7 (8.6%) | 42 (40.0%) |
Income Below Poverty Among Married-Couple vs Single-Parent Households in Smackover
The poverty data for Smackover shows that 12 of the married-couple family households (3.4%) and 49 of the single-parent households (26.3%) are living below the poverty level. Within the married-couple family households, those with 1 or 2 children have the highest poverty rate, with 12 households (9.0%) falling below the poverty line. Among the single-parent households, those with 1 or 2 children have the highest poverty rate, with 35 household (39.8%) living below poverty.
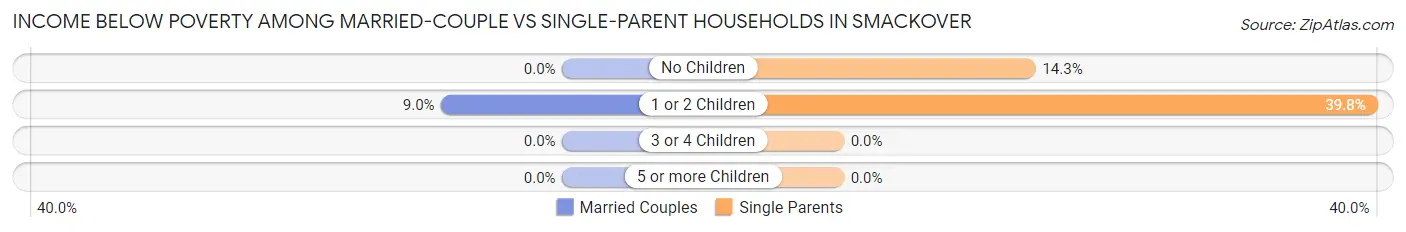
| Children | Married-Couple Families | Single-Parent Households |
| No Children | 0 (0.0%) | 14 (14.3%) |
| 1 or 2 Children | 12 (9.0%) | 35 (39.8%) |
| 3 or 4 Children | 0 (0.0%) | 0 (0.0%) |
| 5 or more Children | 0 (0.0%) | 0 (0.0%) |
| Total | 12 (3.4%) | 49 (26.3%) |
Race in Smackover
The most populous races in Smackover are White / Caucasian (1,357 | 68.7%), Black / African American (523 | 26.5%), and Two or more Races (95 | 4.8%).
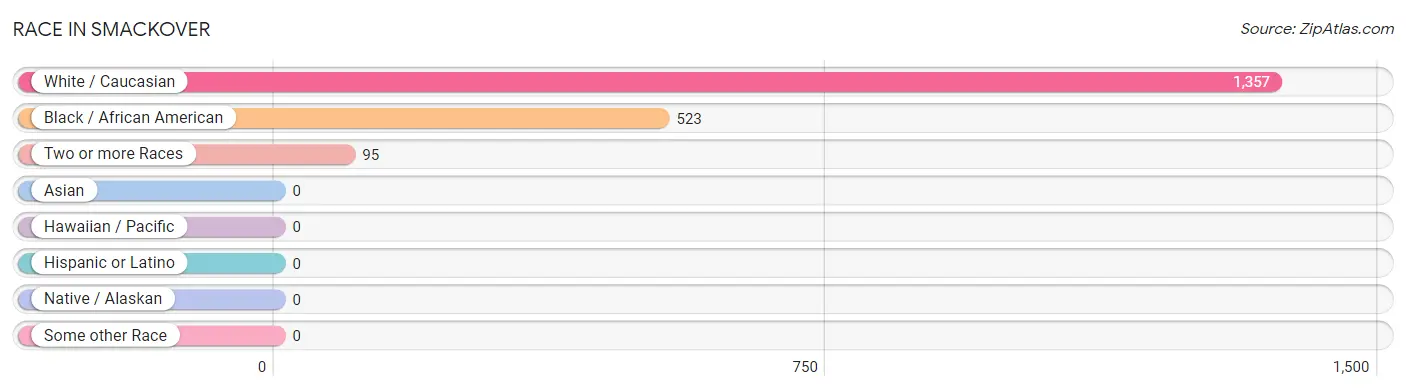
| Race | # Population | % Population |
| Asian | 0 | 0.0% |
| Black / African American | 523 | 26.5% |
| Hawaiian / Pacific | 0 | 0.0% |
| Hispanic or Latino | 0 | 0.0% |
| Native / Alaskan | 0 | 0.0% |
| White / Caucasian | 1,357 | 68.7% |
| Two or more Races | 95 | 4.8% |
| Some other Race | 0 | 0.0% |
| Total | 1,975 | 100.0% |
Ancestry in Smackover
The most populous ancestries reported in Smackover are English (279 | 14.1%), American (190 | 9.6%), Scotch-Irish (149 | 7.5%), Irish (146 | 7.4%), and German (77 | 3.9%), together accounting for 42.6% of all Smackover residents.
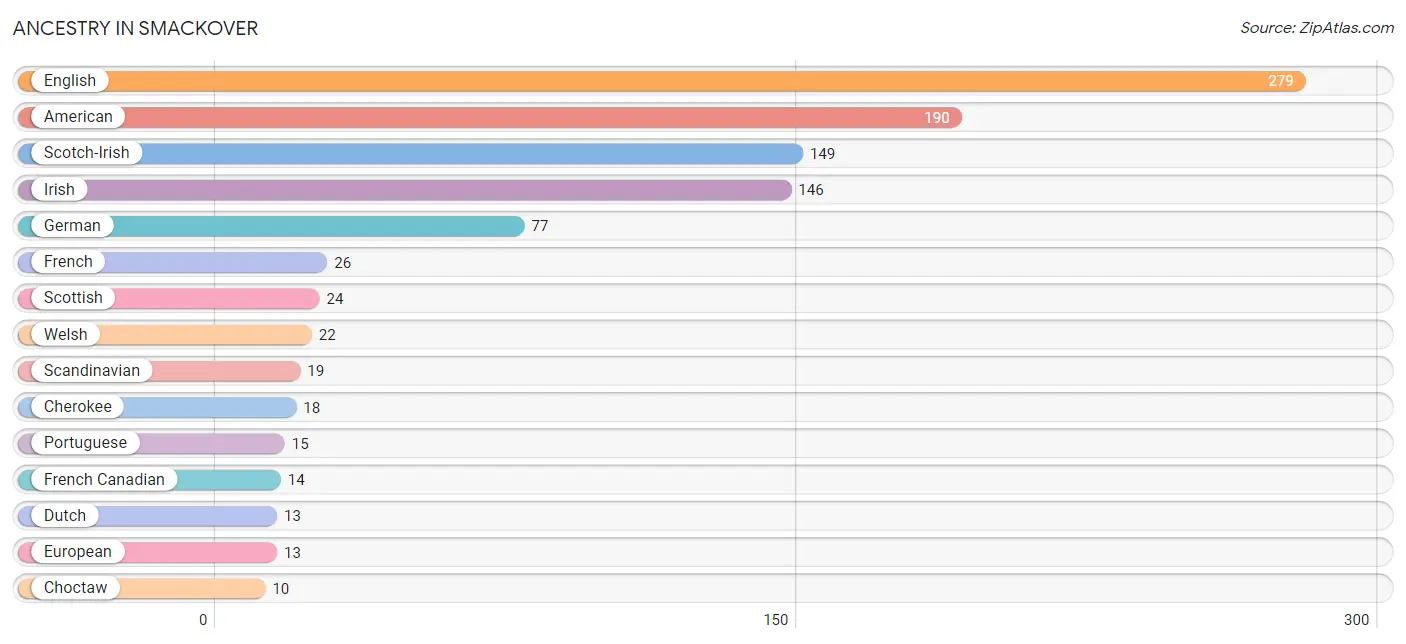
| Ancestry | # Population | % Population |
| African | 3 | 0.2% |
| American | 190 | 9.6% |
| Arab | 4 | 0.2% |
| Cherokee | 18 | 0.9% |
| Choctaw | 10 | 0.5% |
| Dutch | 13 | 0.7% |
| Egyptian | 4 | 0.2% |
| English | 279 | 14.1% |
| European | 13 | 0.7% |
| French | 26 | 1.3% |
| French Canadian | 14 | 0.7% |
| German | 77 | 3.9% |
| Irish | 146 | 7.4% |
| Italian | 7 | 0.4% |
| Native Hawaiian | 2 | 0.1% |
| Portuguese | 15 | 0.8% |
| Scandinavian | 19 | 1.0% |
| Scotch-Irish | 149 | 7.5% |
| Scottish | 24 | 1.2% |
| Subsaharan African | 3 | 0.2% |
| Swedish | 4 | 0.2% |
| Welsh | 22 | 1.1% | View All 22 Rows |
Immigrants in Smackover
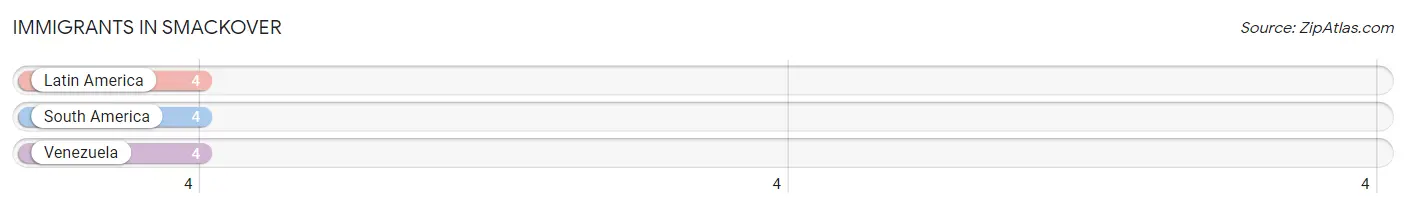
The most numerous immigrant groups reported in Smackover came from Latin America (4 | 0.2%), South America (4 | 0.2%), and Venezuela (4 | 0.2%), together accounting for 0.6% of all Smackover residents.
| Immigration Origin | # Population | % Population |
| Latin America | 4 | 0.2% |
| South America | 4 | 0.2% |
| Venezuela | 4 | 0.2% | View All 3 Rows |
Sex and Age in Smackover
Sex and Age in Smackover
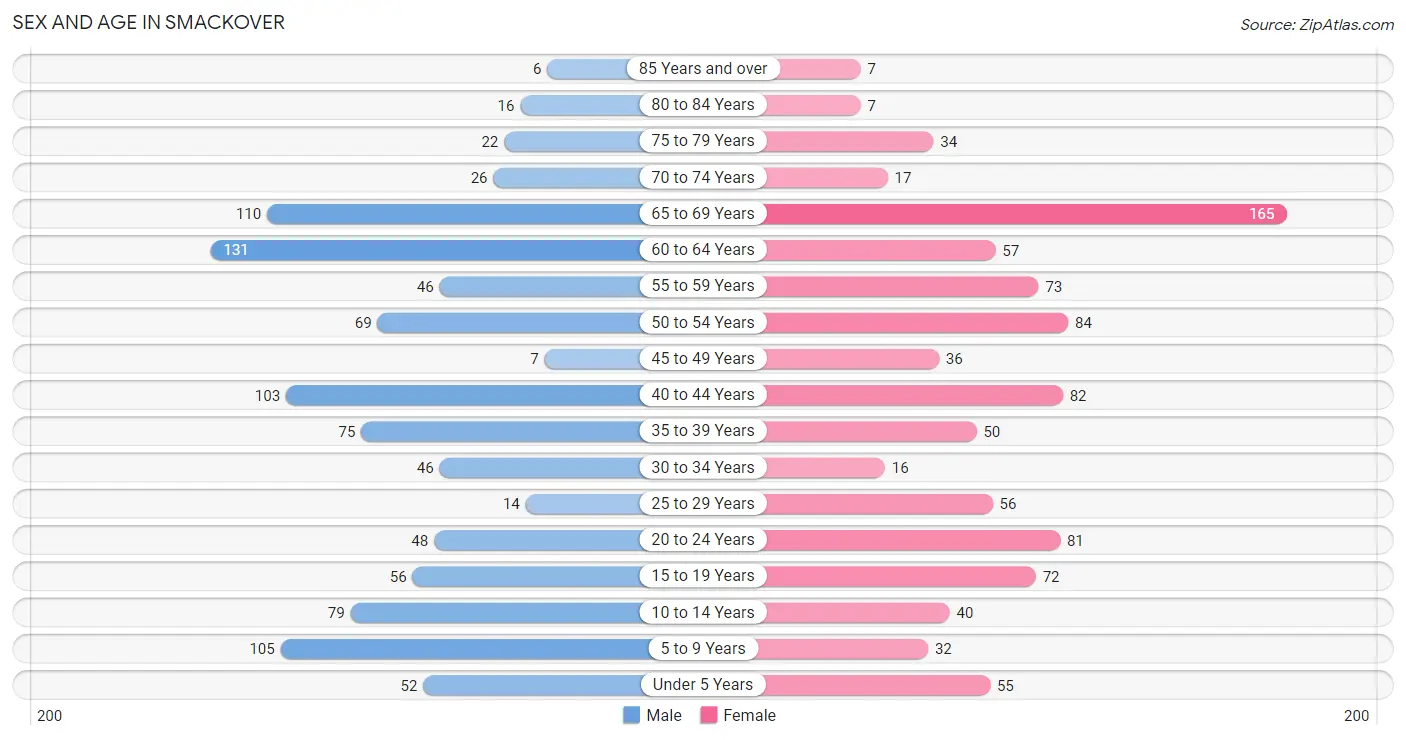
The most populous age groups in Smackover are 60 to 64 Years (131 | 13.0%) for men and 65 to 69 Years (165 | 17.1%) for women.
| Age Bracket | Male | Female |
| Under 5 Years | 52 (5.1%) | 55 (5.7%) |
| 5 to 9 Years | 105 (10.4%) | 32 (3.3%) |
| 10 to 14 Years | 79 (7.8%) | 40 (4.2%) |
| 15 to 19 Years | 56 (5.5%) | 72 (7.5%) |
| 20 to 24 Years | 48 (4.8%) | 81 (8.4%) |
| 25 to 29 Years | 14 (1.4%) | 56 (5.8%) |
| 30 to 34 Years | 46 (4.5%) | 16 (1.7%) |
| 35 to 39 Years | 75 (7.4%) | 50 (5.2%) |
| 40 to 44 Years | 103 (10.2%) | 82 (8.5%) |
| 45 to 49 Years | 7 (0.7%) | 36 (3.7%) |
| 50 to 54 Years | 69 (6.8%) | 84 (8.7%) |
| 55 to 59 Years | 46 (4.5%) | 73 (7.6%) |
| 60 to 64 Years | 131 (13.0%) | 57 (5.9%) |
| 65 to 69 Years | 110 (10.9%) | 165 (17.1%) |
| 70 to 74 Years | 26 (2.6%) | 17 (1.8%) |
| 75 to 79 Years | 22 (2.2%) | 34 (3.5%) |
| 80 to 84 Years | 16 (1.6%) | 7 (0.7%) |
| 85 Years and over | 6 (0.6%) | 7 (0.7%) |
| Total | 1,011 (100.0%) | 964 (100.0%) |
Families and Households in Smackover
Median Family Size in Smackover
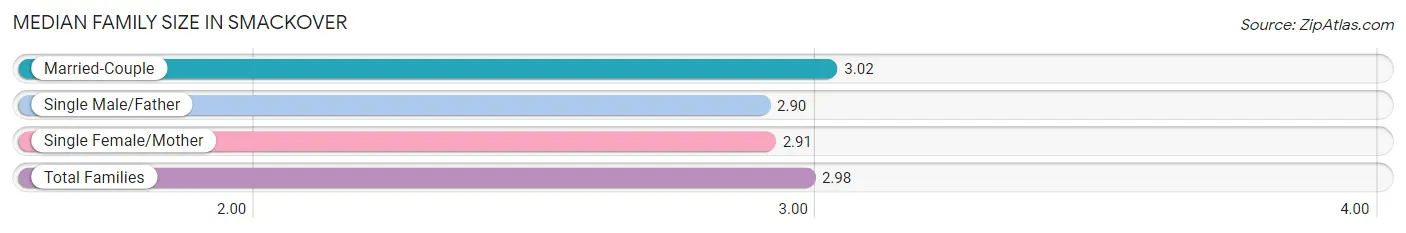
The median family size in Smackover is 2.98 persons per family, with married-couple families (353 | 65.5%) accounting for the largest median family size of 3.02 persons per family. On the other hand, single male/father families (81 | 15.0%) represent the smallest median family size with 2.90 persons per family.
| Family Type | # Families | Family Size |
| Married-Couple | 353 (65.5%) | 3.02 |
| Single Male/Father | 81 (15.0%) | 2.90 |
| Single Female/Mother | 105 (19.5%) | 2.91 |
| Total Families | 539 (100.0%) | 2.98 |
Median Household Size in Smackover
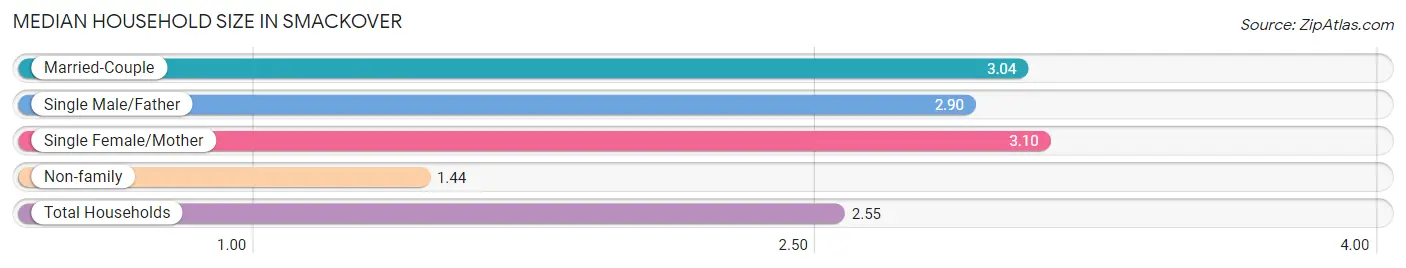
The median household size in Smackover is 2.55 persons per household, with single female/mother households (105 | 13.5%) accounting for the largest median household size of 3.1 persons per household. non-family households (237 | 30.5%) represent the smallest median household size with 1.44 persons per household.
| Household Type | # Households | Household Size |
| Married-Couple | 353 (45.5%) | 3.04 |
| Single Male/Father | 81 (10.4%) | 2.90 |
| Single Female/Mother | 105 (13.5%) | 3.10 |
| Non-family | 237 (30.5%) | 1.44 |
| Total Households | 776 (100.0%) | 2.55 |
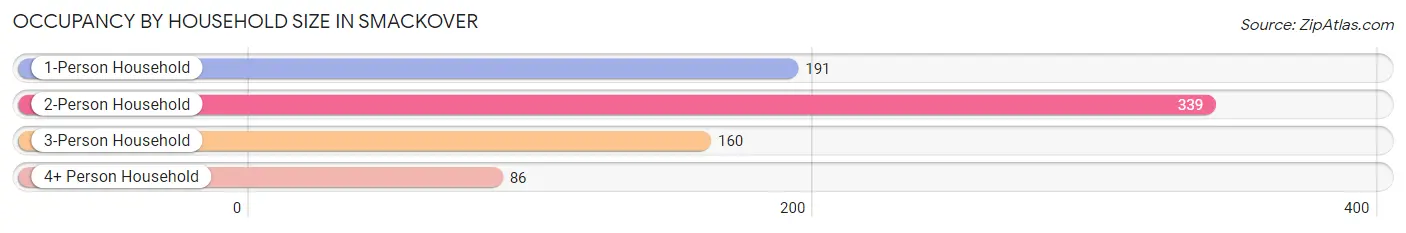
Household Size by Marriage Status in Smackover
Out of a total of 776 households in Smackover, 539 (69.5%) are family households, while 237 (30.5%) are nonfamily households. The most numerous type of family households are 2-person households, comprising 309, and the most common type of nonfamily households are 1-person households, comprising 191.
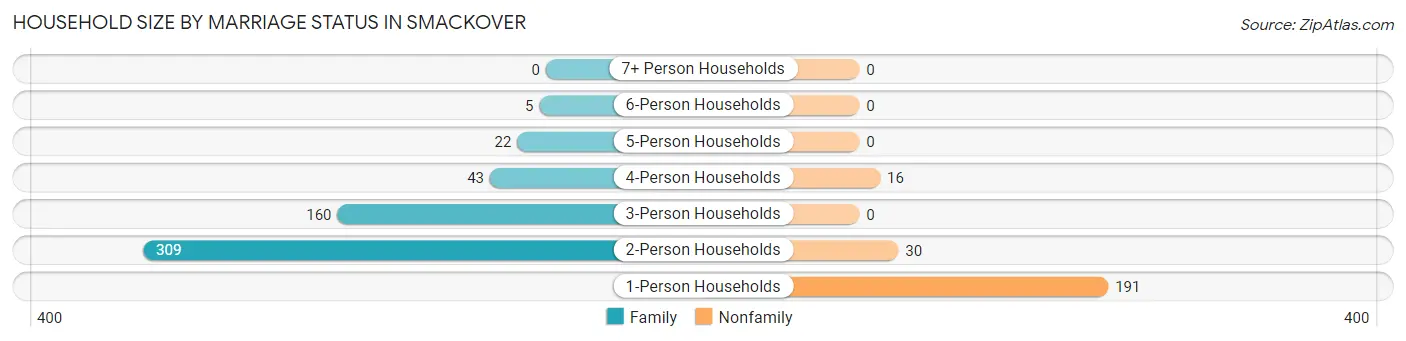
| Household Size | Family Households | Nonfamily Households |
| 1-Person Households | - | 191 (24.6%) |
| 2-Person Households | 309 (39.8%) | 30 (3.9%) |
| 3-Person Households | 160 (20.6%) | 0 (0.0%) |
| 4-Person Households | 43 (5.5%) | 16 (2.1%) |
| 5-Person Households | 22 (2.8%) | 0 (0.0%) |
| 6-Person Households | 5 (0.6%) | 0 (0.0%) |
| 7+ Person Households | 0 (0.0%) | 0 (0.0%) |
| Total | 539 (69.5%) | 237 (30.5%) |
Female Fertility in Smackover
Fertility by Age in Smackover
Average fertility rate in Smackover is 61.0 births per 1,000 women. Women in the age bracket of 20 to 34 years have the highest fertility rate with 144.0 births per 1,000 women. Women in the age bracket of 20 to 34 years acount for 88.0% of all women with births.
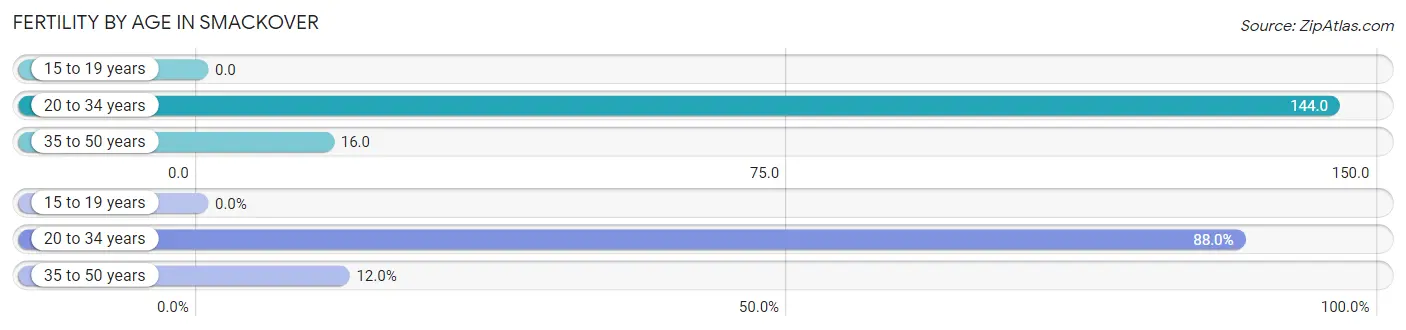
| Age Bracket | Women with Births | Births / 1,000 Women |
| 15 to 19 years | 0 (0.0%) | 0.0 |
| 20 to 34 years | 22 (88.0%) | 144.0 |
| 35 to 50 years | 3 (12.0%) | 16.0 |
| Total | 25 (100.0%) | 61.0 |
Fertility by Age by Marriage Status in Smackover
32.0% of women with births (25) in Smackover are married. The highest percentage of unmarried women with births falls into 20 to 34 years age bracket with 77.3% of them unmarried at the time of birth, while the lowest percentage of unmarried women with births belong to 35 to 50 years age bracket with 0.0% of them unmarried.
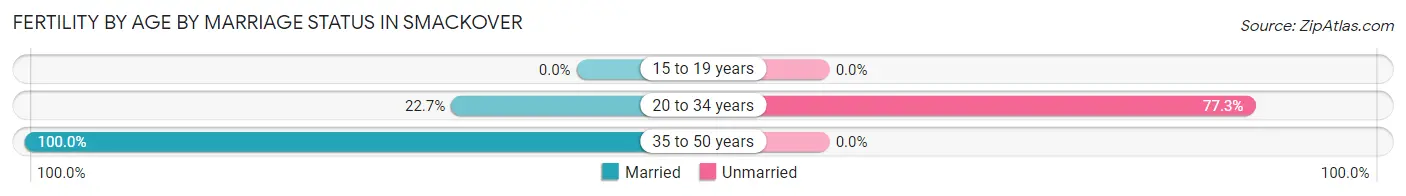
| Age Bracket | Married | Unmarried |
| 15 to 19 years | 0 (0.0%) | 0 (0.0%) |
| 20 to 34 years | 5 (22.7%) | 17 (77.3%) |
| 35 to 50 years | 3 (100.0%) | 0 (0.0%) |
| Total | 8 (32.0%) | 17 (68.0%) |
Fertility by Education in Smackover
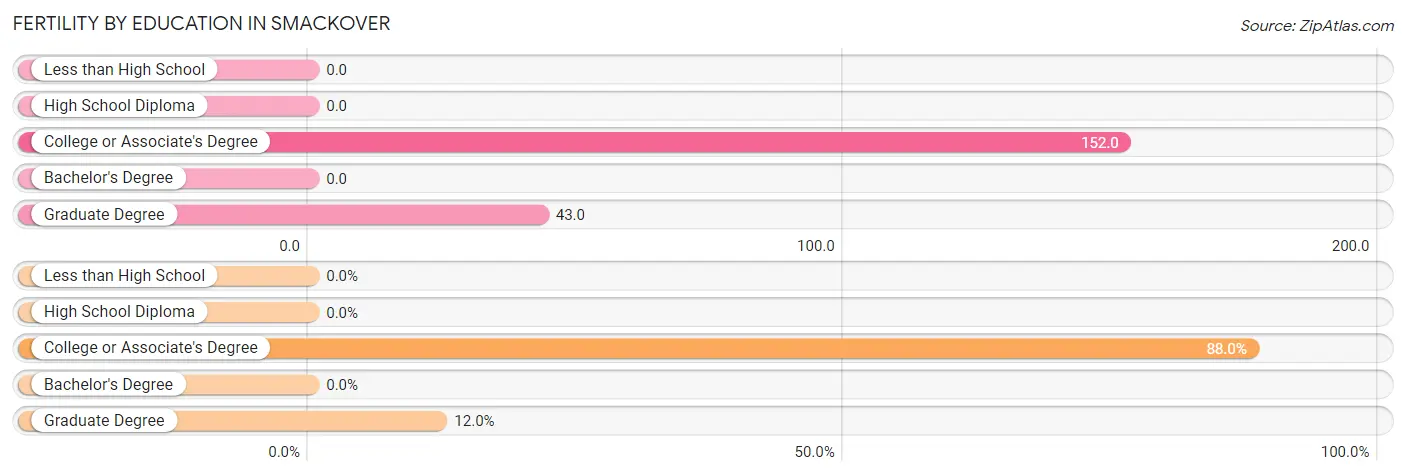
| Educational Attainment | Women with Births | Births / 1,000 Women |
| Less than High School | 0 (0.0%) | 0.0 |
| High School Diploma | 0 (0.0%) | 0.0 |
| College or Associate's Degree | 22 (88.0%) | 152.0 |
| Bachelor's Degree | 0 (0.0%) | 0.0 |
| Graduate Degree | 3 (12.0%) | 43.0 |
| Total | 25 (100.0%) | 61.0 |
Fertility by Education by Marriage Status in Smackover
68.0% of women with births in Smackover are unmarried. Women with the educational attainment of graduate degree are most likely to be married with 100.0% of them married at childbirth, while women with the educational attainment of college or associate's degree are least likely to be married with 77.3% of them unmarried at childbirth.
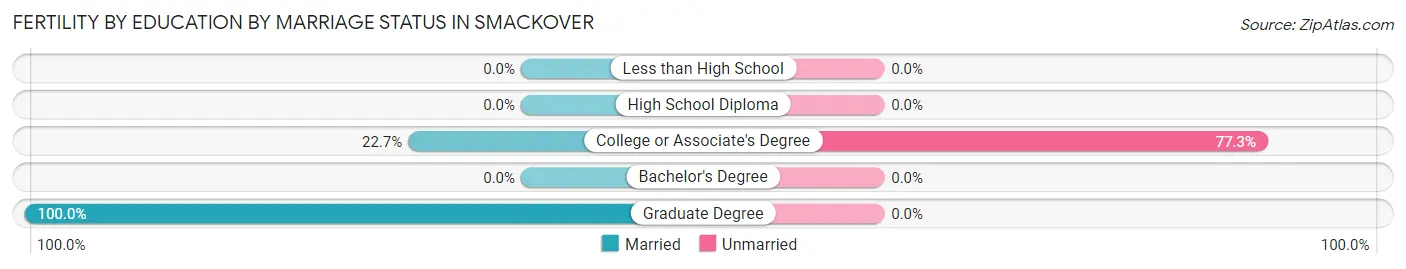
| Educational Attainment | Married | Unmarried |
| Less than High School | 0 (0.0%) | 0 (0.0%) |
| High School Diploma | 0 (0.0%) | 0 (0.0%) |
| College or Associate's Degree | 5 (22.7%) | 17 (77.3%) |
| Bachelor's Degree | 0 (0.0%) | 0 (0.0%) |
| Graduate Degree | 3 (100.0%) | 0 (0.0%) |
| Total | 8 (32.0%) | 17 (68.0%) |
Employment Characteristics in Smackover
Employment by Class of Employer in Smackover
Among the 908 employed individuals in Smackover, private company employees (580 | 63.9%), self-employed (not incorporated) (113 | 12.4%), and state government employees (104 | 11.5%) make up the most common classes of employment.
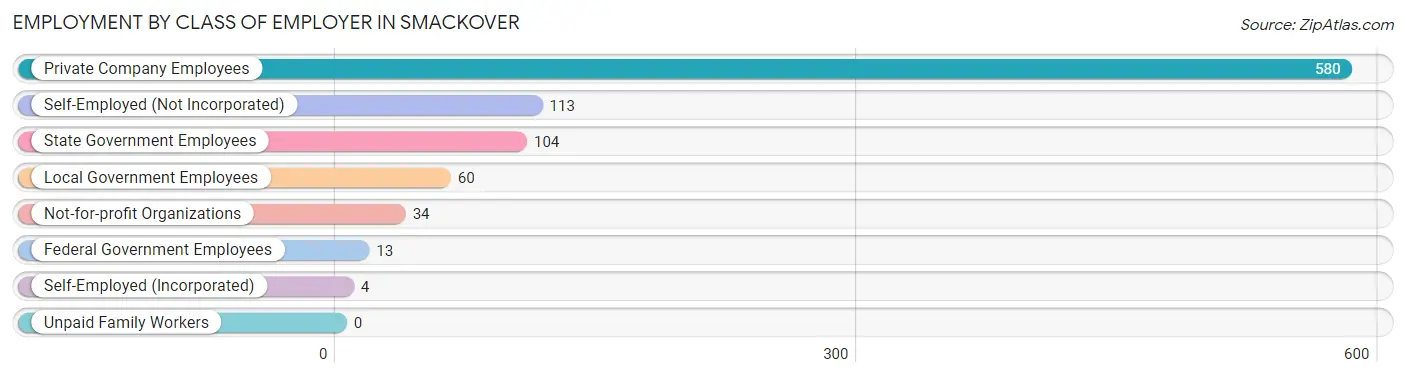
| Employer Class | # Employees | % Employees |
| Private Company Employees | 580 | 63.9% |
| Self-Employed (Incorporated) | 4 | 0.4% |
| Self-Employed (Not Incorporated) | 113 | 12.4% |
| Not-for-profit Organizations | 34 | 3.7% |
| Local Government Employees | 60 | 6.6% |
| State Government Employees | 104 | 11.5% |
| Federal Government Employees | 13 | 1.4% |
| Unpaid Family Workers | 0 | 0.0% |
| Total | 908 | 100.0% |
Employment Status by Age in Smackover
According to the labor force statistics for Smackover, out of the total population over 16 years of age (1,583), 60.3% or 955 individuals are in the labor force, with 4.4% or 42 of them unemployed. The age group with the highest labor force participation rate is 45 to 54 years, with 82.7% or 162 individuals in the labor force. Within the labor force, the 20 to 24 years age range has the highest percentage of unemployed individuals, with 12.5% or 12 of them being unemployed.
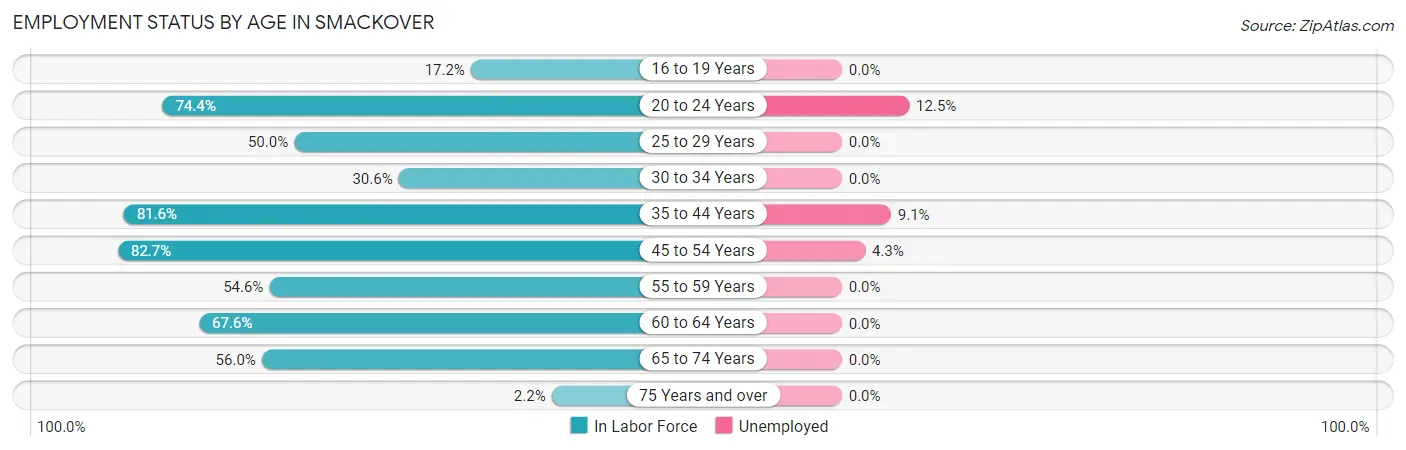
| Age Bracket | In Labor Force | Unemployed |
| 16 to 19 Years | 17 (17.2%) | 0 (0.0%) |
| 20 to 24 Years | 96 (74.4%) | 12 (12.5%) |
| 25 to 29 Years | 35 (50.0%) | 0 (0.0%) |
| 30 to 34 Years | 19 (30.6%) | 0 (0.0%) |
| 35 to 44 Years | 253 (81.6%) | 23 (9.1%) |
| 45 to 54 Years | 162 (82.7%) | 7 (4.3%) |
| 55 to 59 Years | 65 (54.6%) | 0 (0.0%) |
| 60 to 64 Years | 127 (67.6%) | 0 (0.0%) |
| 65 to 74 Years | 178 (56.0%) | 0 (0.0%) |
| 75 Years and over | 2 (2.2%) | 0 (0.0%) |
| Total | 955 (60.3%) | 42 (4.4%) |
Employment Status by Educational Attainment in Smackover
According to labor force statistics for Smackover, 69.9% of individuals (661) out of the total population between 25 and 64 years of age (945) are in the labor force, with 4.5% or 30 of them being unemployed. The group with the highest labor force participation rate are those with the educational attainment of bachelor's degree or higher, with 95.4% or 249 individuals in the labor force. Within the labor force, individuals with high school diploma education have the highest percentage of unemployment, with 14.7% or 23 of them being unemployed.
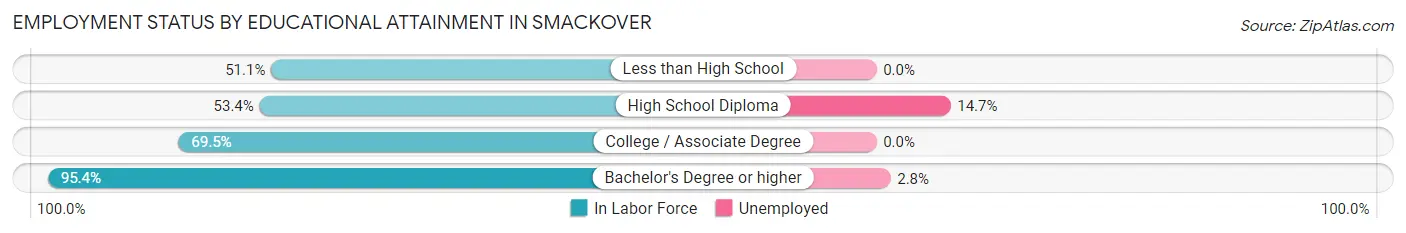
| Educational Attainment | In Labor Force | Unemployed |
| Less than High School | 46 (51.1%) | 0 (0.0%) |
| High School Diploma | 156 (53.4%) | 43 (14.7%) |
| College / Associate Degree | 210 (69.5%) | 0 (0.0%) |
| Bachelor's Degree or higher | 249 (95.4%) | 7 (2.8%) |
| Total | 661 (69.9%) | 43 (4.5%) |
Employment Occupations by Sex in Smackover
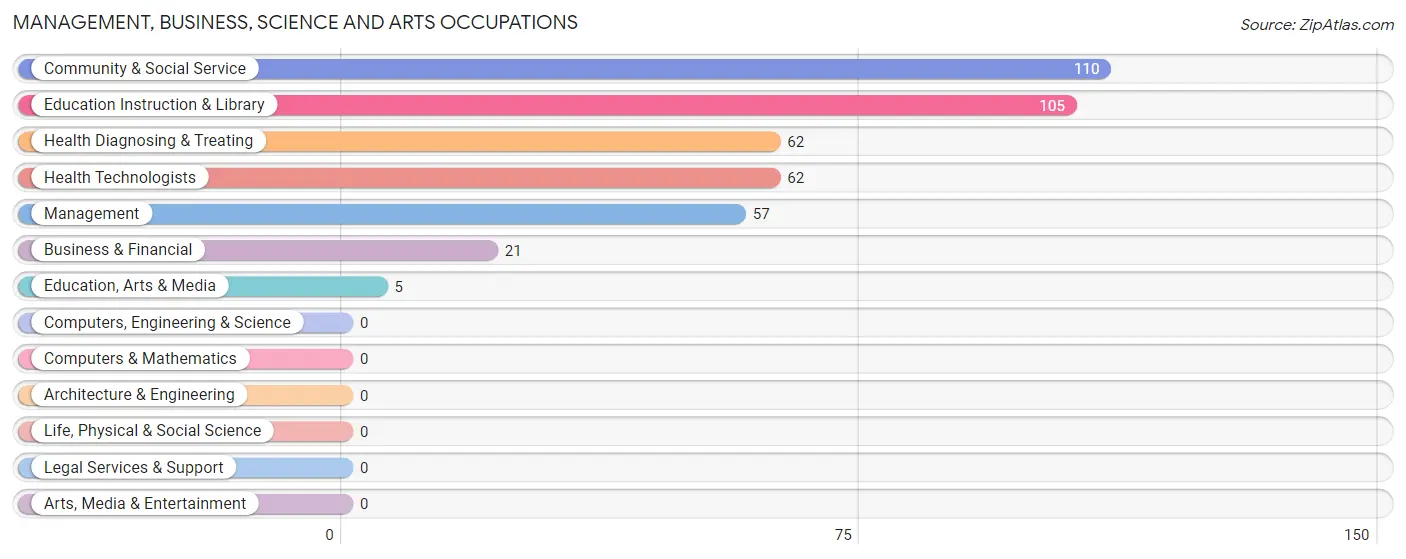
Management, Business, Science and Arts Occupations
The most common Management, Business, Science and Arts occupations in Smackover are Community & Social Service (110 | 12.1%), Education Instruction & Library (105 | 11.5%), Health Diagnosing & Treating (62 | 6.8%), Health Technologists (62 | 6.8%), and Management (57 | 6.2%).
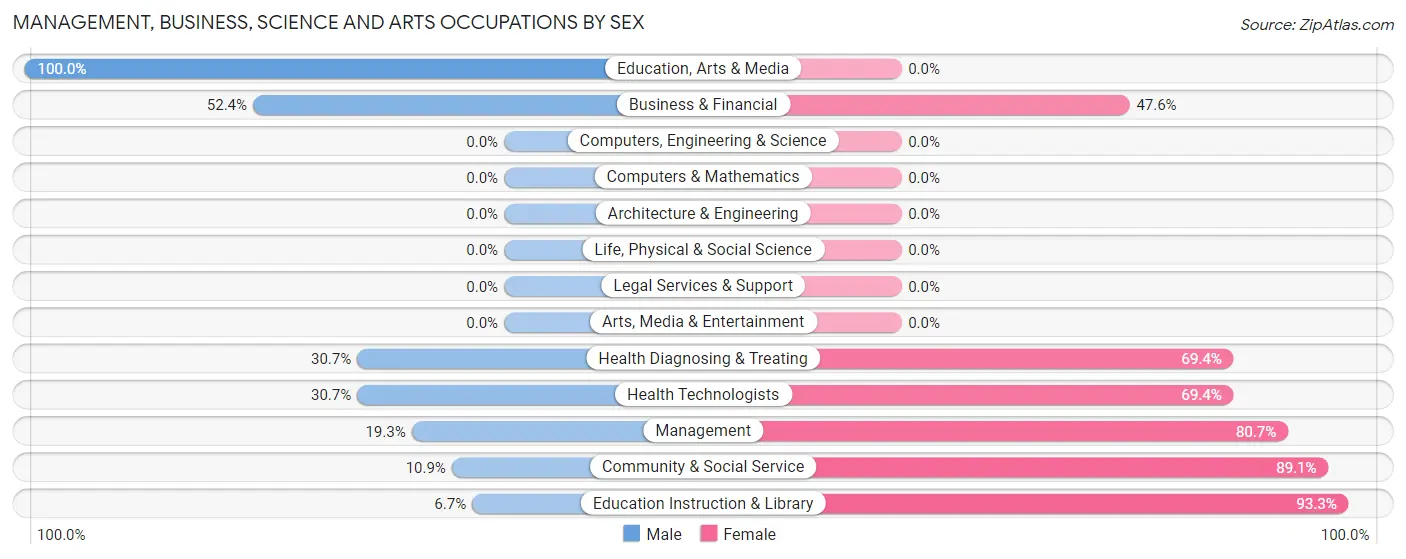
Management, Business, Science and Arts Occupations by Sex
Within the Management, Business, Science and Arts occupations in Smackover, the most male-oriented occupations are Education, Arts & Media (100.0%), Business & Financial (52.4%), and Health Diagnosing & Treating (30.6%), while the most female-oriented occupations are Education Instruction & Library (93.3%), Community & Social Service (89.1%), and Management (80.7%).
| Occupation | Male | Female |
| Management | 11 (19.3%) | 46 (80.7%) |
| Business & Financial | 11 (52.4%) | 10 (47.6%) |
| Computers, Engineering & Science | 0 (0.0%) | 0 (0.0%) |
| Computers & Mathematics | 0 (0.0%) | 0 (0.0%) |
| Architecture & Engineering | 0 (0.0%) | 0 (0.0%) |
| Life, Physical & Social Science | 0 (0.0%) | 0 (0.0%) |
| Community & Social Service | 12 (10.9%) | 98 (89.1%) |
| Education, Arts & Media | 5 (100.0%) | 0 (0.0%) |
| Legal Services & Support | 0 (0.0%) | 0 (0.0%) |
| Education Instruction & Library | 7 (6.7%) | 98 (93.3%) |
| Arts, Media & Entertainment | 0 (0.0%) | 0 (0.0%) |
| Health Diagnosing & Treating | 19 (30.6%) | 43 (69.4%) |
| Health Technologists | 19 (30.6%) | 43 (69.4%) |
| Total (Category) | 53 (21.2%) | 197 (78.8%) |
| Total (Overall) | 419 (45.9%) | 493 (54.1%) |
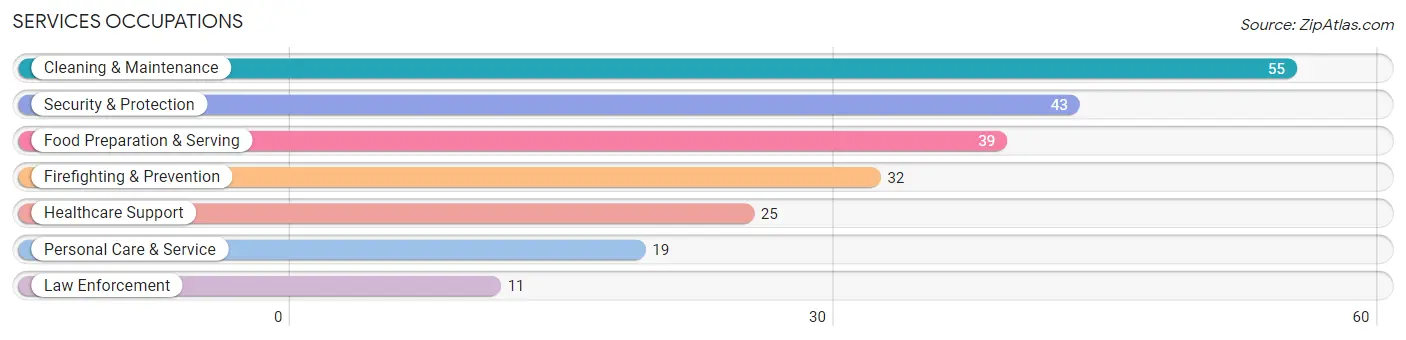
Services Occupations
The most common Services occupations in Smackover are Cleaning & Maintenance (55 | 6.0%), Security & Protection (43 | 4.7%), Food Preparation & Serving (39 | 4.3%), Firefighting & Prevention (32 | 3.5%), and Healthcare Support (25 | 2.7%).
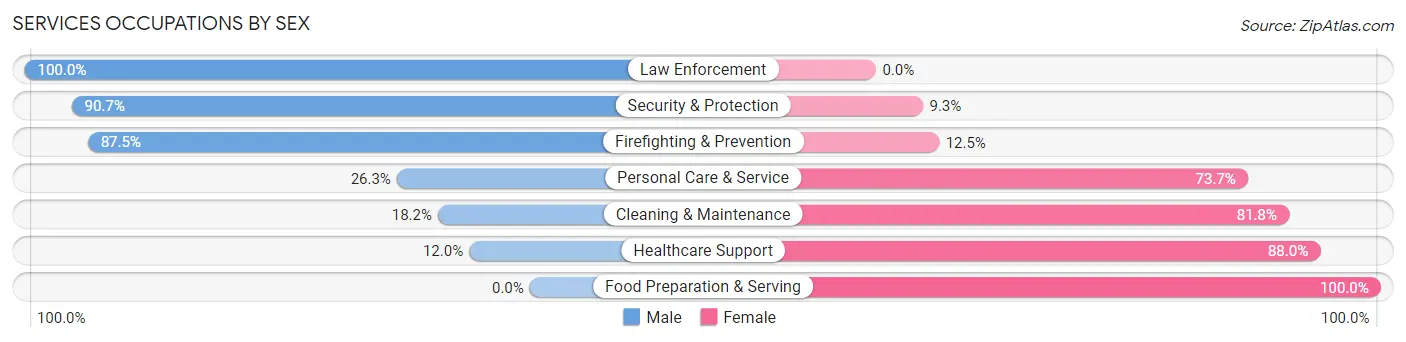
Services Occupations by Sex
Within the Services occupations in Smackover, the most male-oriented occupations are Law Enforcement (100.0%), Security & Protection (90.7%), and Firefighting & Prevention (87.5%), while the most female-oriented occupations are Food Preparation & Serving (100.0%), Healthcare Support (88.0%), and Cleaning & Maintenance (81.8%).
| Occupation | Male | Female |
| Healthcare Support | 3 (12.0%) | 22 (88.0%) |
| Security & Protection | 39 (90.7%) | 4 (9.3%) |
| Firefighting & Prevention | 28 (87.5%) | 4 (12.5%) |
| Law Enforcement | 11 (100.0%) | 0 (0.0%) |
| Food Preparation & Serving | 0 (0.0%) | 39 (100.0%) |
| Cleaning & Maintenance | 10 (18.2%) | 45 (81.8%) |
| Personal Care & Service | 5 (26.3%) | 14 (73.7%) |
| Total (Category) | 57 (31.5%) | 124 (68.5%) |
| Total (Overall) | 419 (45.9%) | 493 (54.1%) |
Sales and Office Occupations
The most common Sales and Office occupations in Smackover are Office & Administration (170 | 18.6%), and Sales & Related (70 | 7.7%).
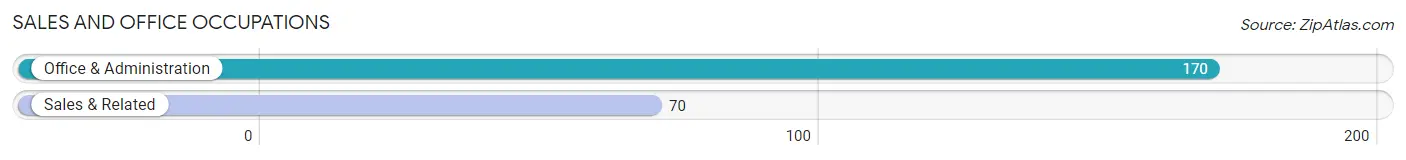
Sales and Office Occupations by Sex
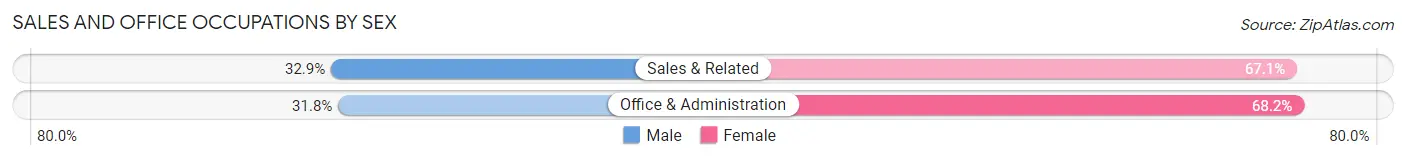
| Occupation | Male | Female |
| Sales & Related | 23 (32.9%) | 47 (67.1%) |
| Office & Administration | 54 (31.8%) | 116 (68.2%) |
| Total (Category) | 77 (32.1%) | 163 (67.9%) |
| Total (Overall) | 419 (45.9%) | 493 (54.1%) |
Natural Resources, Construction and Maintenance Occupations
The most common Natural Resources, Construction and Maintenance occupations in Smackover are Construction & Extraction (57 | 6.2%), Installation, Maintenance & Repair (25 | 2.7%), and Farming, Fishing & Forestry (14 | 1.5%).
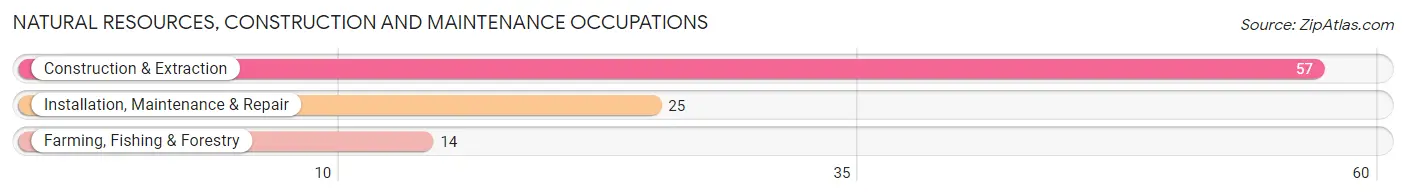
Natural Resources, Construction and Maintenance Occupations by Sex
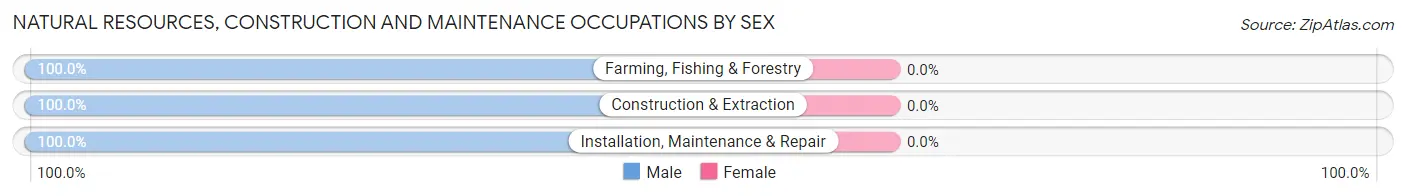
| Occupation | Male | Female |
| Farming, Fishing & Forestry | 14 (100.0%) | 0 (0.0%) |
| Construction & Extraction | 57 (100.0%) | 0 (0.0%) |
| Installation, Maintenance & Repair | 25 (100.0%) | 0 (0.0%) |
| Total (Category) | 96 (100.0%) | 0 (0.0%) |
| Total (Overall) | 419 (45.9%) | 493 (54.1%) |
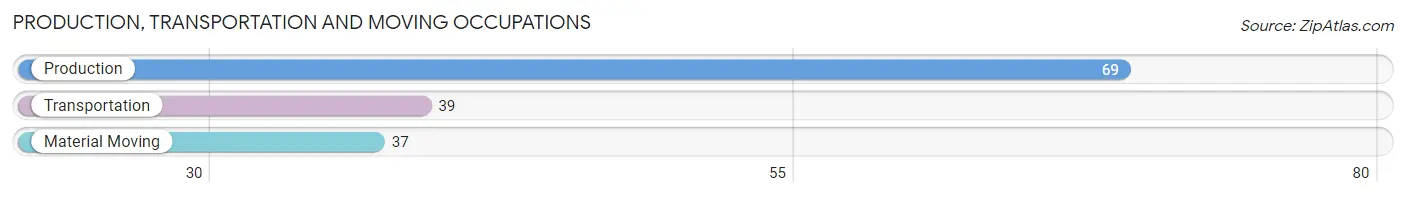
Production, Transportation and Moving Occupations
The most common Production, Transportation and Moving occupations in Smackover are Production (69 | 7.6%), Transportation (39 | 4.3%), and Material Moving (37 | 4.1%).
Production, Transportation and Moving Occupations by Sex
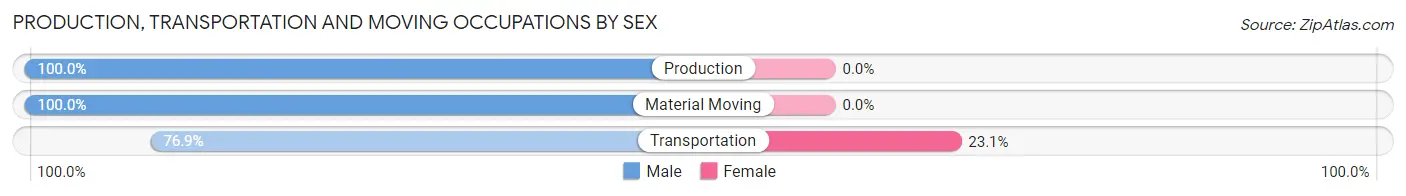
| Occupation | Male | Female |
| Production | 69 (100.0%) | 0 (0.0%) |
| Transportation | 30 (76.9%) | 9 (23.1%) |
| Material Moving | 37 (100.0%) | 0 (0.0%) |
| Total (Category) | 136 (93.8%) | 9 (6.2%) |
| Total (Overall) | 419 (45.9%) | 493 (54.1%) |
Employment Industries by Sex in Smackover
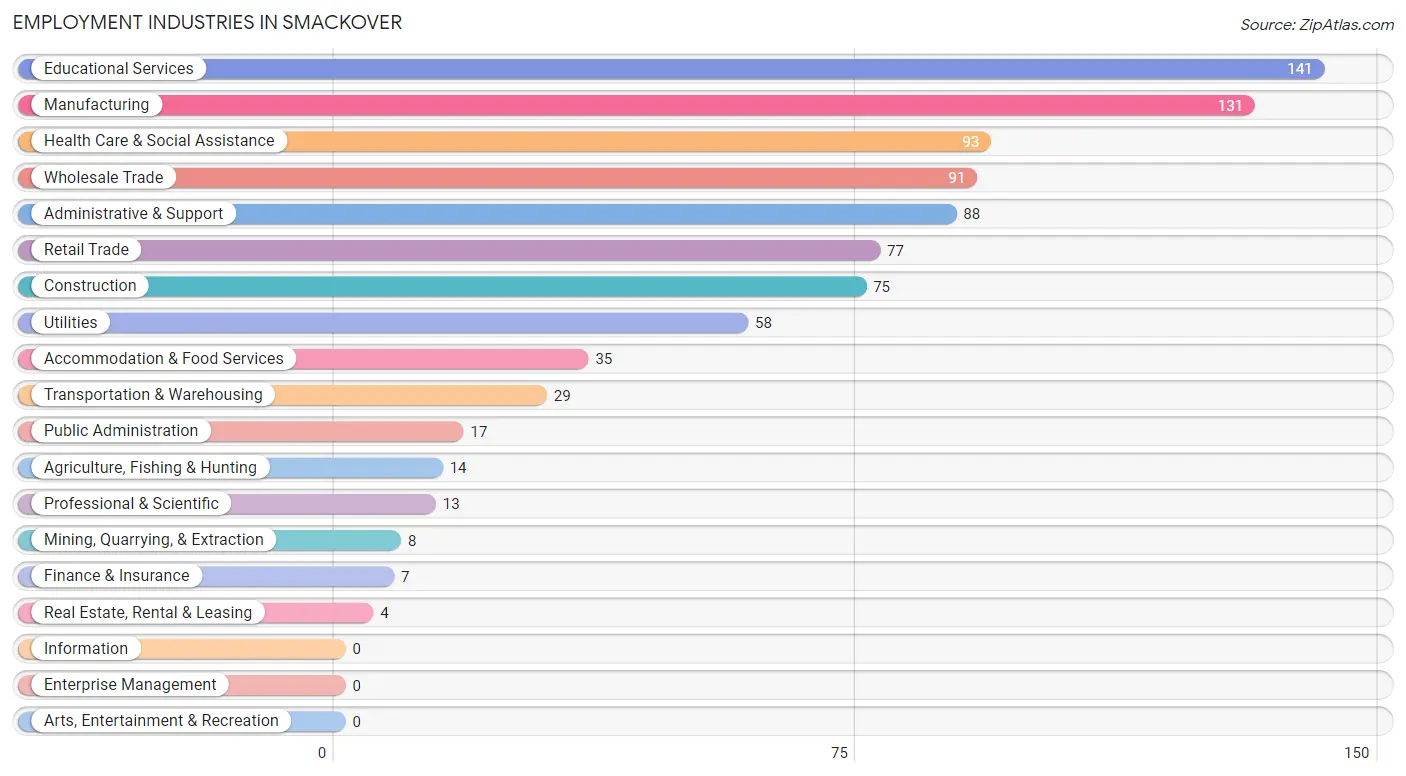
Employment Industries in Smackover
The major employment industries in Smackover include Educational Services (141 | 15.5%), Manufacturing (131 | 14.4%), Health Care & Social Assistance (93 | 10.2%), Wholesale Trade (91 | 10.0%), and Administrative & Support (88 | 9.7%).
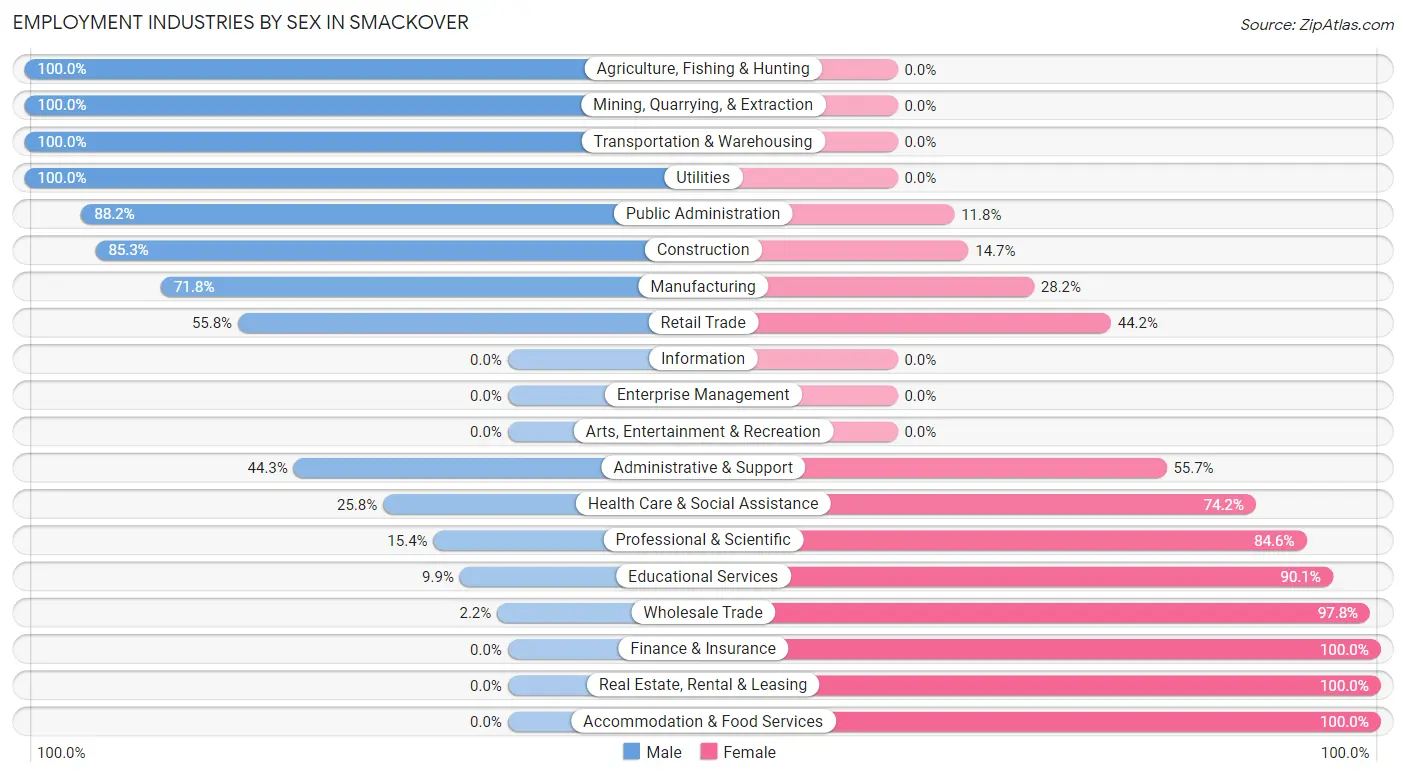
Employment Industries by Sex in Smackover
The Smackover industries that see more men than women are Agriculture, Fishing & Hunting (100.0%), Mining, Quarrying, & Extraction (100.0%), and Transportation & Warehousing (100.0%), whereas the industries that tend to have a higher number of women are Finance & Insurance (100.0%), Real Estate, Rental & Leasing (100.0%), and Accommodation & Food Services (100.0%).
| Industry | Male | Female |
| Agriculture, Fishing & Hunting | 14 (100.0%) | 0 (0.0%) |
| Mining, Quarrying, & Extraction | 8 (100.0%) | 0 (0.0%) |
| Construction | 64 (85.3%) | 11 (14.7%) |
| Manufacturing | 94 (71.8%) | 37 (28.2%) |
| Wholesale Trade | 2 (2.2%) | 89 (97.8%) |
| Retail Trade | 43 (55.8%) | 34 (44.2%) |
| Transportation & Warehousing | 29 (100.0%) | 0 (0.0%) |
| Utilities | 58 (100.0%) | 0 (0.0%) |
| Information | 0 (0.0%) | 0 (0.0%) |
| Finance & Insurance | 0 (0.0%) | 7 (100.0%) |
| Real Estate, Rental & Leasing | 0 (0.0%) | 4 (100.0%) |
| Professional & Scientific | 2 (15.4%) | 11 (84.6%) |
| Enterprise Management | 0 (0.0%) | 0 (0.0%) |
| Administrative & Support | 39 (44.3%) | 49 (55.7%) |
| Educational Services | 14 (9.9%) | 127 (90.1%) |
| Health Care & Social Assistance | 24 (25.8%) | 69 (74.2%) |
| Arts, Entertainment & Recreation | 0 (0.0%) | 0 (0.0%) |
| Accommodation & Food Services | 0 (0.0%) | 35 (100.0%) |
| Public Administration | 15 (88.2%) | 2 (11.8%) |
| Total | 419 (45.9%) | 493 (54.1%) |
Education in Smackover
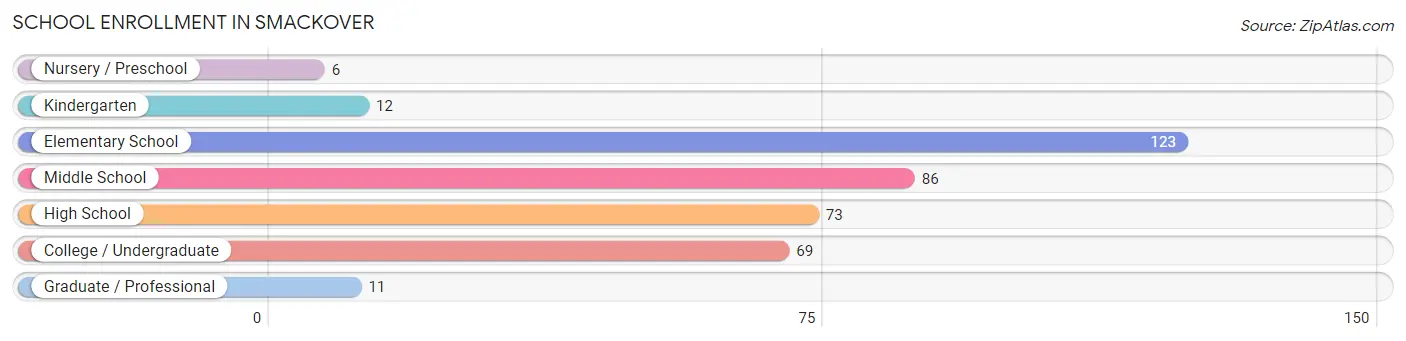
School Enrollment in Smackover
The most common levels of schooling among the 380 students in Smackover are elementary school (123 | 32.4%), middle school (86 | 22.6%), and high school (73 | 19.2%).
| School Level | # Students | % Students |
| Nursery / Preschool | 6 | 1.6% |
| Kindergarten | 12 | 3.2% |
| Elementary School | 123 | 32.4% |
| Middle School | 86 | 22.6% |
| High School | 73 | 19.2% |
| College / Undergraduate | 69 | 18.2% |
| Graduate / Professional | 11 | 2.9% |
| Total | 380 | 100.0% |
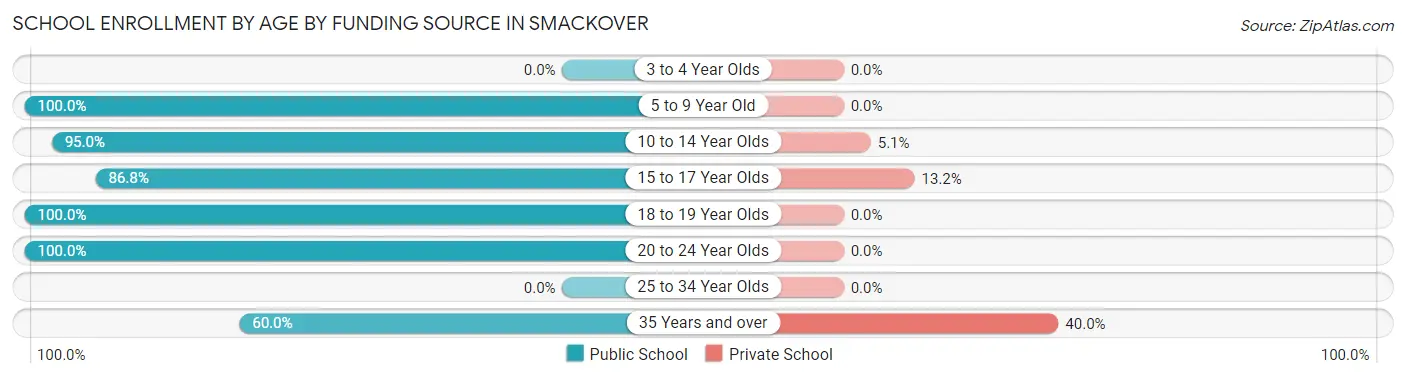
School Enrollment by Age by Funding Source in Smackover
Out of a total of 380 students who are enrolled in schools in Smackover, 22 (5.8%) attend a private institution, while the remaining 358 (94.2%) are enrolled in public schools. The age group of 35 years and over has the highest likelihood of being enrolled in private schools, with 10 (40.0% in the age bracket) enrolled. Conversely, the age group of 5 to 9 year old has the lowest likelihood of being enrolled in a private school, with 137 (100.0% in the age bracket) attending a public institution.
| Age Bracket | Public School | Private School |
| 3 to 4 Year Olds | 0 (0.0%) | 0 (0.0%) |
| 5 to 9 Year Old | 137 (100.0%) | 0 (0.0%) |
| 10 to 14 Year Olds | 94 (95.0%) | 5 (5.1%) |
| 15 to 17 Year Olds | 46 (86.8%) | 7 (13.2%) |
| 18 to 19 Year Olds | 34 (100.0%) | 0 (0.0%) |
| 20 to 24 Year Olds | 32 (100.0%) | 0 (0.0%) |
| 25 to 34 Year Olds | 0 (0.0%) | 0 (0.0%) |
| 35 Years and over | 15 (60.0%) | 10 (40.0%) |
| Total | 358 (94.2%) | 22 (5.8%) |
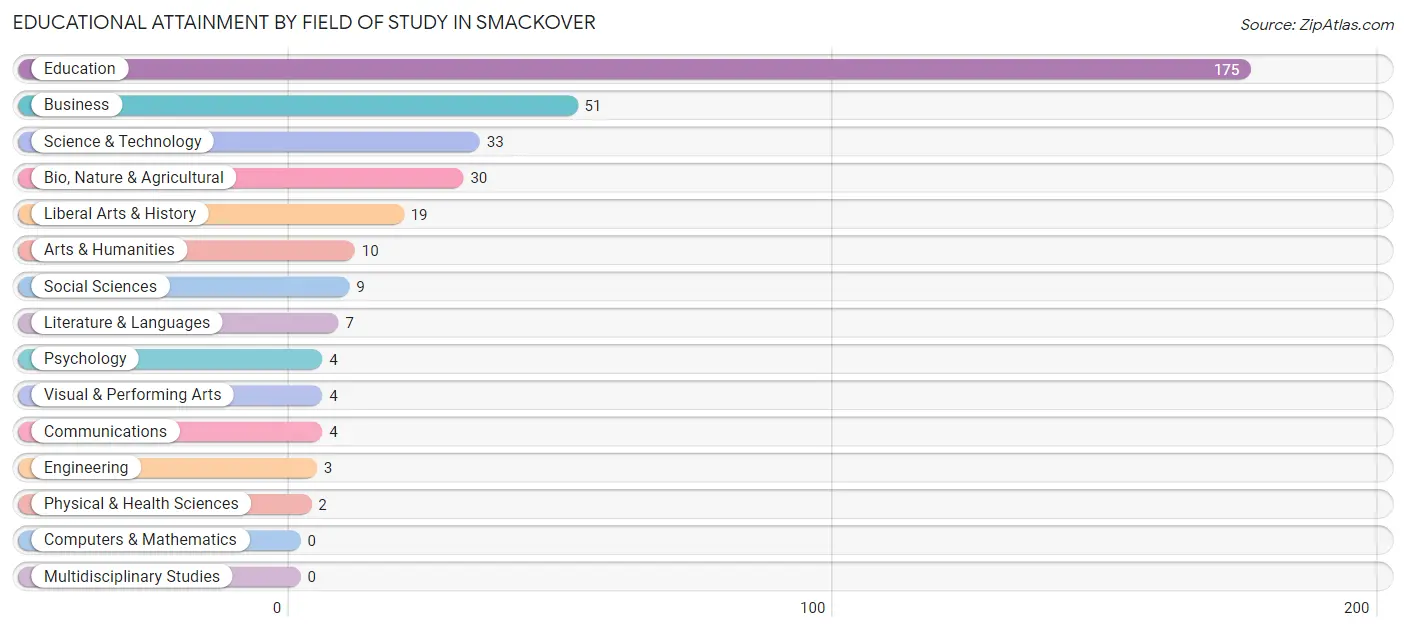
Educational Attainment by Field of Study in Smackover
Education (175 | 49.9%), business (51 | 14.5%), science & technology (33 | 9.4%), bio, nature & agricultural (30 | 8.6%), and liberal arts & history (19 | 5.4%) are the most common fields of study among 351 individuals in Smackover who have obtained a bachelor's degree or higher.
| Field of Study | # Graduates | % Graduates |
| Computers & Mathematics | 0 | 0.0% |
| Bio, Nature & Agricultural | 30 | 8.6% |
| Physical & Health Sciences | 2 | 0.6% |
| Psychology | 4 | 1.1% |
| Social Sciences | 9 | 2.6% |
| Engineering | 3 | 0.9% |
| Multidisciplinary Studies | 0 | 0.0% |
| Science & Technology | 33 | 9.4% |
| Business | 51 | 14.5% |
| Education | 175 | 49.9% |
| Literature & Languages | 7 | 2.0% |
| Liberal Arts & History | 19 | 5.4% |
| Visual & Performing Arts | 4 | 1.1% |
| Communications | 4 | 1.1% |
| Arts & Humanities | 10 | 2.9% |
| Total | 351 | 100.0% |
Transportation & Commute in Smackover
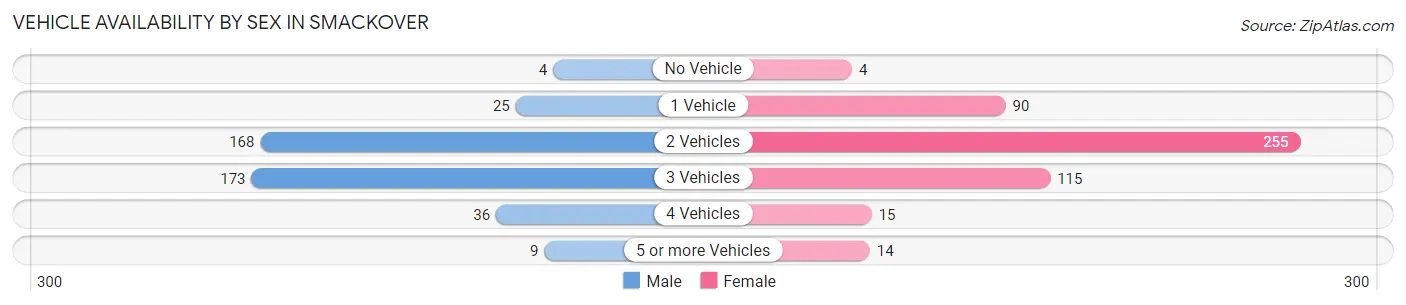
Vehicle Availability by Sex in Smackover
The most prevalent vehicle ownership categories in Smackover are males with 3 vehicles (173, accounting for 41.7%) and females with 3 vehicles (115, making up 35.1%).
| Vehicles Available | Male | Female |
| No Vehicle | 4 (1.0%) | 4 (0.8%) |
| 1 Vehicle | 25 (6.0%) | 90 (18.3%) |
| 2 Vehicles | 168 (40.5%) | 255 (51.7%) |
| 3 Vehicles | 173 (41.7%) | 115 (23.3%) |
| 4 Vehicles | 36 (8.7%) | 15 (3.0%) |
| 5 or more Vehicles | 9 (2.2%) | 14 (2.8%) |
| Total | 415 (100.0%) | 493 (100.0%) |
Commute Time in Smackover
The most frequently occuring commute durations in Smackover are 20 to 24 minutes (353 commuters, 40.3%), less than 5 minutes (167 commuters, 19.1%), and 30 to 34 minutes (115 commuters, 13.1%).
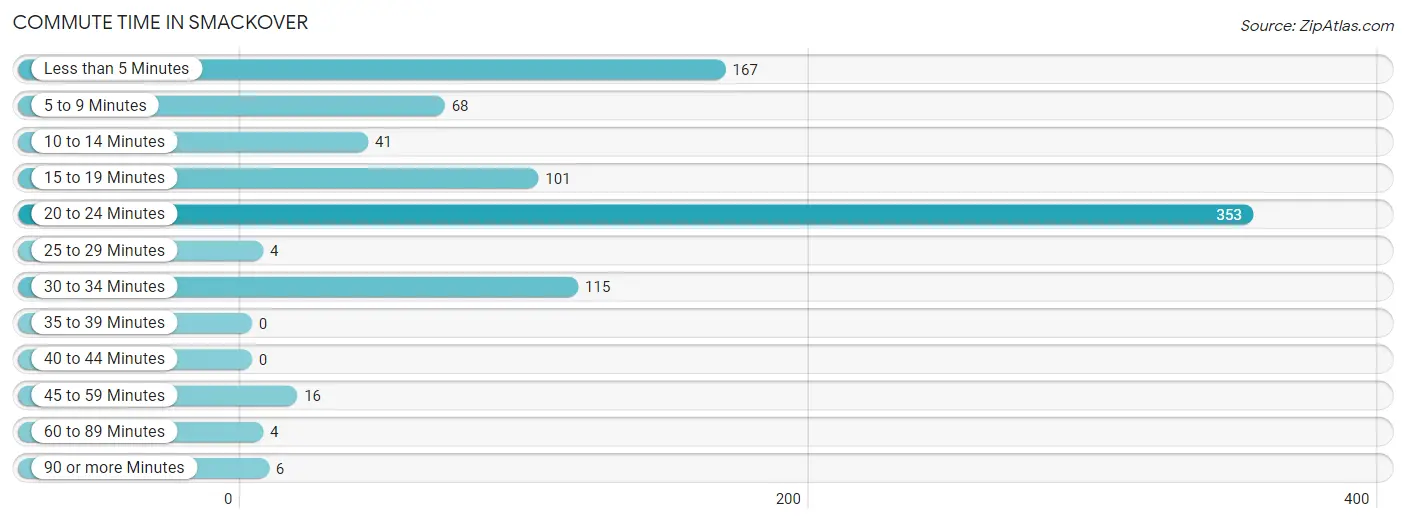
| Commute Time | # Commuters | % Commuters |
| Less than 5 Minutes | 167 | 19.1% |
| 5 to 9 Minutes | 68 | 7.8% |
| 10 to 14 Minutes | 41 | 4.7% |
| 15 to 19 Minutes | 101 | 11.5% |
| 20 to 24 Minutes | 353 | 40.3% |
| 25 to 29 Minutes | 4 | 0.5% |
| 30 to 34 Minutes | 115 | 13.1% |
| 35 to 39 Minutes | 0 | 0.0% |
| 40 to 44 Minutes | 0 | 0.0% |
| 45 to 59 Minutes | 16 | 1.8% |
| 60 to 89 Minutes | 4 | 0.5% |
| 90 or more Minutes | 6 | 0.7% |
Commute Time by Sex in Smackover
The most common commute times in Smackover are 20 to 24 minutes (185 commuters, 46.5%) for males and 20 to 24 minutes (168 commuters, 35.2%) for females.
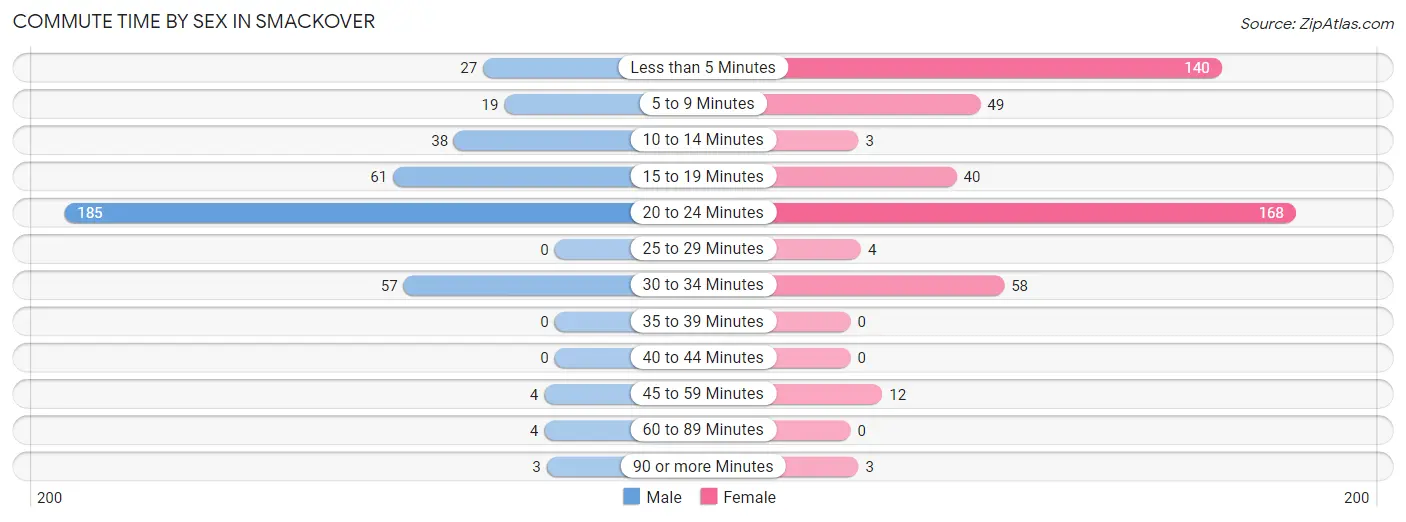
| Commute Time | Male | Female |
| Less than 5 Minutes | 27 (6.8%) | 140 (29.3%) |
| 5 to 9 Minutes | 19 (4.8%) | 49 (10.3%) |
| 10 to 14 Minutes | 38 (9.6%) | 3 (0.6%) |
| 15 to 19 Minutes | 61 (15.3%) | 40 (8.4%) |
| 20 to 24 Minutes | 185 (46.5%) | 168 (35.2%) |
| 25 to 29 Minutes | 0 (0.0%) | 4 (0.8%) |
| 30 to 34 Minutes | 57 (14.3%) | 58 (12.2%) |
| 35 to 39 Minutes | 0 (0.0%) | 0 (0.0%) |
| 40 to 44 Minutes | 0 (0.0%) | 0 (0.0%) |
| 45 to 59 Minutes | 4 (1.0%) | 12 (2.5%) |
| 60 to 89 Minutes | 4 (1.0%) | 0 (0.0%) |
| 90 or more Minutes | 3 (0.7%) | 3 (0.6%) |
Time of Departure to Work by Sex in Smackover
The most frequent times of departure to work in Smackover are 8:00 AM to 8:29 AM (114, 28.6%) for males and 7:30 AM to 7:59 AM (145, 30.4%) for females.
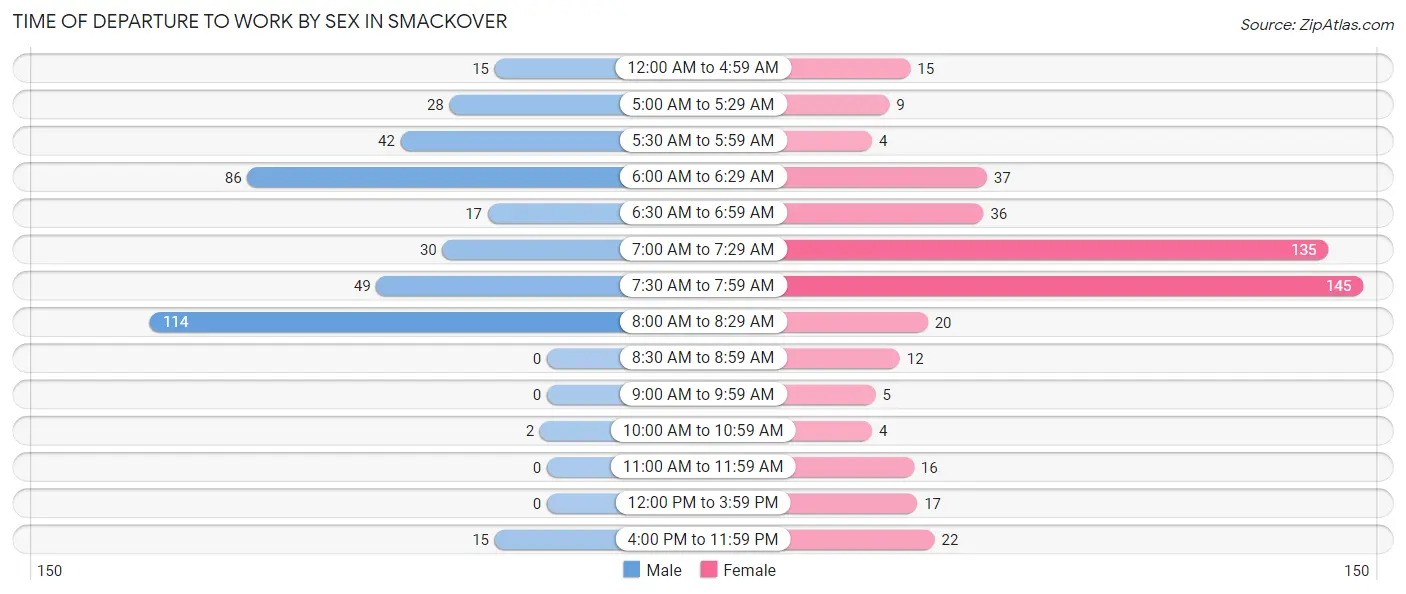
| Time of Departure | Male | Female |
| 12:00 AM to 4:59 AM | 15 (3.8%) | 15 (3.1%) |
| 5:00 AM to 5:29 AM | 28 (7.0%) | 9 (1.9%) |
| 5:30 AM to 5:59 AM | 42 (10.5%) | 4 (0.8%) |
| 6:00 AM to 6:29 AM | 86 (21.6%) | 37 (7.8%) |
| 6:30 AM to 6:59 AM | 17 (4.3%) | 36 (7.5%) |
| 7:00 AM to 7:29 AM | 30 (7.5%) | 135 (28.3%) |
| 7:30 AM to 7:59 AM | 49 (12.3%) | 145 (30.4%) |
| 8:00 AM to 8:29 AM | 114 (28.6%) | 20 (4.2%) |
| 8:30 AM to 8:59 AM | 0 (0.0%) | 12 (2.5%) |
| 9:00 AM to 9:59 AM | 0 (0.0%) | 5 (1.1%) |
| 10:00 AM to 10:59 AM | 2 (0.5%) | 4 (0.8%) |
| 11:00 AM to 11:59 AM | 0 (0.0%) | 16 (3.4%) |
| 12:00 PM to 3:59 PM | 0 (0.0%) | 17 (3.6%) |
| 4:00 PM to 11:59 PM | 15 (3.8%) | 22 (4.6%) |
| Total | 398 (100.0%) | 477 (100.0%) |
Housing Occupancy in Smackover
Occupancy by Ownership in Smackover
Of the total 776 dwellings in Smackover, owner-occupied units account for 498 (64.2%), while renter-occupied units make up 278 (35.8%).
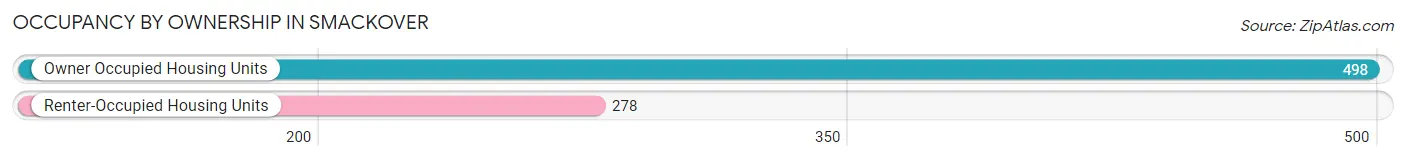
| Occupancy | # Housing Units | % Housing Units |
| Owner Occupied Housing Units | 498 | 64.2% |
| Renter-Occupied Housing Units | 278 | 35.8% |
| Total Occupied Housing Units | 776 | 100.0% |
Occupancy by Household Size in Smackover
| Household Size | # Housing Units | % Housing Units |
| 1-Person Household | 191 | 24.6% |
| 2-Person Household | 339 | 43.7% |
| 3-Person Household | 160 | 20.6% |
| 4+ Person Household | 86 | 11.1% |
| Total Housing Units | 776 | 100.0% |
Occupancy by Ownership by Household Size in Smackover
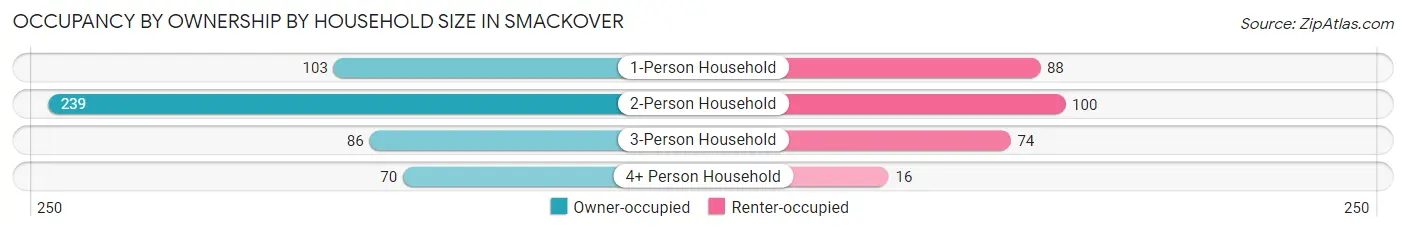
| Household Size | Owner-occupied | Renter-occupied |
| 1-Person Household | 103 (53.9%) | 88 (46.1%) |
| 2-Person Household | 239 (70.5%) | 100 (29.5%) |
| 3-Person Household | 86 (53.7%) | 74 (46.3%) |
| 4+ Person Household | 70 (81.4%) | 16 (18.6%) |
| Total Housing Units | 498 (64.2%) | 278 (35.8%) |
Occupancy by Educational Attainment in Smackover
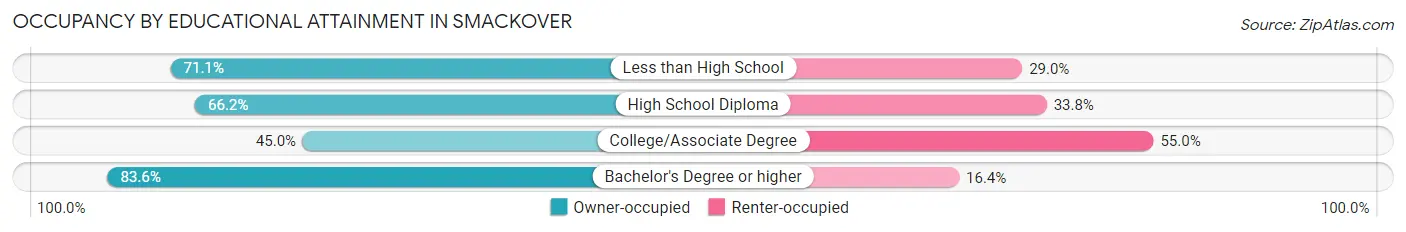
| Household Size | Owner-occupied | Renter-occupied |
| Less than High School | 54 (71.1%) | 22 (28.9%) |
| High School Diploma | 139 (66.2%) | 71 (33.8%) |
| College/Associate Degree | 122 (45.0%) | 149 (55.0%) |
| Bachelor's Degree or higher | 183 (83.6%) | 36 (16.4%) |
Occupancy by Age of Householder in Smackover
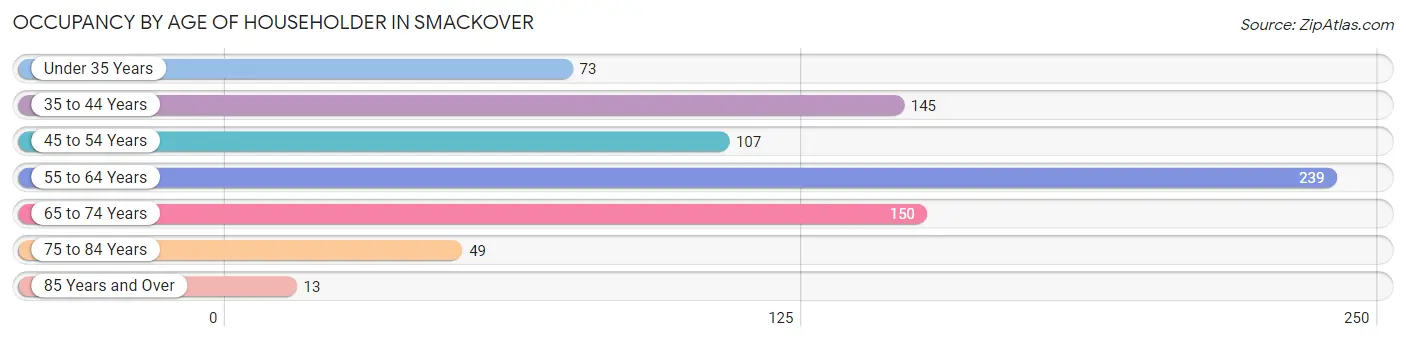
| Age Bracket | # Households | % Households |
| Under 35 Years | 73 | 9.4% |
| 35 to 44 Years | 145 | 18.7% |
| 45 to 54 Years | 107 | 13.8% |
| 55 to 64 Years | 239 | 30.8% |
| 65 to 74 Years | 150 | 19.3% |
| 75 to 84 Years | 49 | 6.3% |
| 85 Years and Over | 13 | 1.7% |
| Total | 776 | 100.0% |
Housing Finances in Smackover
Median Income by Occupancy in Smackover
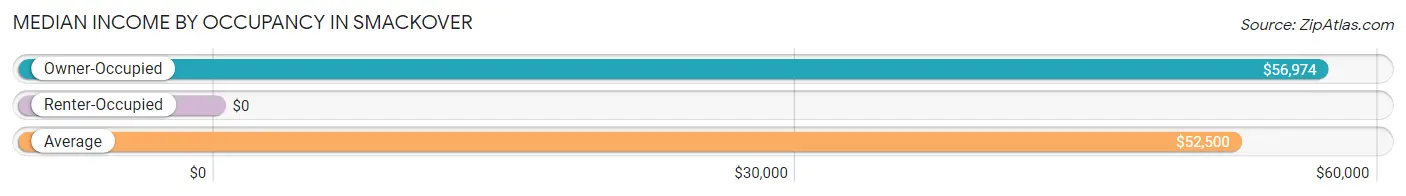
| Occupancy Type | # Households | Median Income |
| Owner-Occupied | 498 (64.2%) | $56,974 |
| Renter-Occupied | 278 (35.8%) | $0 |
| Average | 776 (100.0%) | $52,500 |
Occupancy by Householder Income Bracket in Smackover
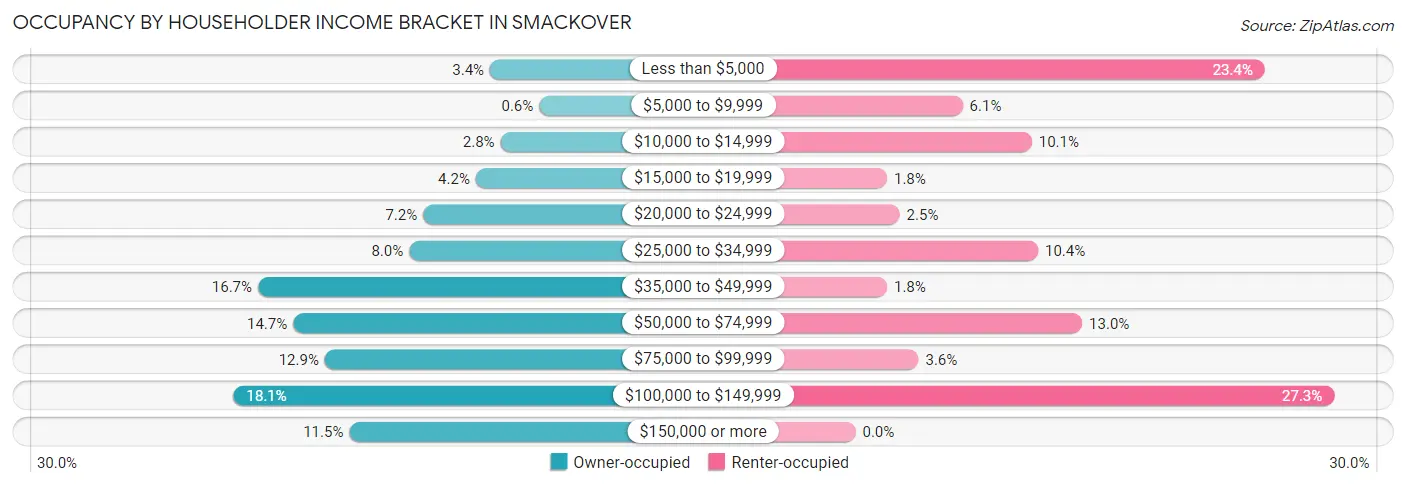
| Income Bracket | Owner-occupied | Renter-occupied |
| Less than $5,000 | 17 (3.4%) | 65 (23.4%) |
| $5,000 to $9,999 | 3 (0.6%) | 17 (6.1%) |
| $10,000 to $14,999 | 14 (2.8%) | 28 (10.1%) |
| $15,000 to $19,999 | 21 (4.2%) | 5 (1.8%) |
| $20,000 to $24,999 | 36 (7.2%) | 7 (2.5%) |
| $25,000 to $34,999 | 40 (8.0%) | 29 (10.4%) |
| $35,000 to $49,999 | 83 (16.7%) | 5 (1.8%) |
| $50,000 to $74,999 | 73 (14.7%) | 36 (13.0%) |
| $75,000 to $99,999 | 64 (12.9%) | 10 (3.6%) |
| $100,000 to $149,999 | 90 (18.1%) | 76 (27.3%) |
| $150,000 or more | 57 (11.5%) | 0 (0.0%) |
| Total | 498 (100.0%) | 278 (100.0%) |
Monthly Housing Cost Tiers in Smackover
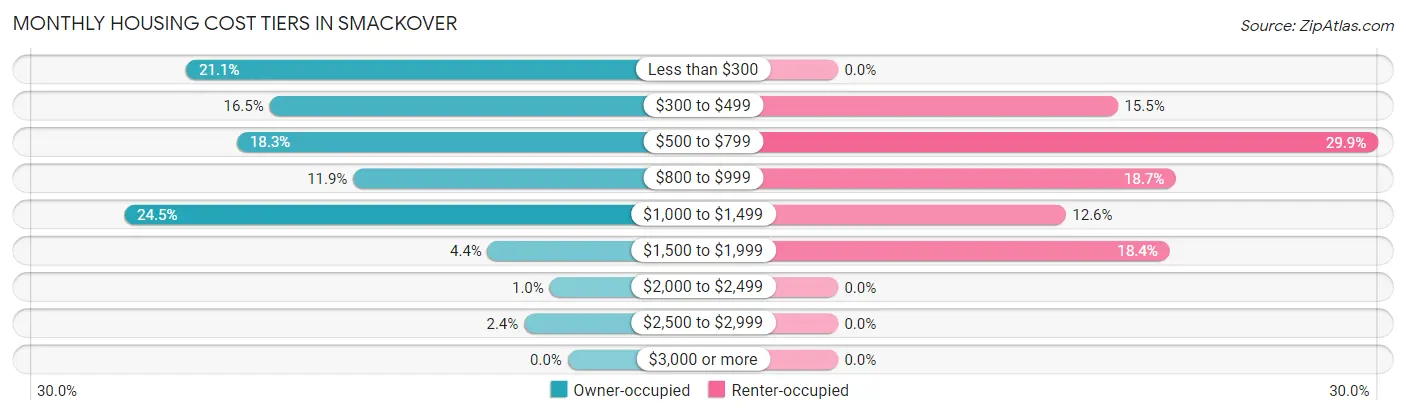
| Monthly Cost | Owner-occupied | Renter-occupied |
| Less than $300 | 105 (21.1%) | 0 (0.0%) |
| $300 to $499 | 82 (16.5%) | 43 (15.5%) |
| $500 to $799 | 91 (18.3%) | 83 (29.9%) |
| $800 to $999 | 59 (11.8%) | 52 (18.7%) |
| $1,000 to $1,499 | 122 (24.5%) | 35 (12.6%) |
| $1,500 to $1,999 | 22 (4.4%) | 51 (18.3%) |
| $2,000 to $2,499 | 5 (1.0%) | 0 (0.0%) |
| $2,500 to $2,999 | 12 (2.4%) | 0 (0.0%) |
| $3,000 or more | 0 (0.0%) | 0 (0.0%) |
| Total | 498 (100.0%) | 278 (100.0%) |
Physical Housing Characteristics in Smackover
Housing Structures in Smackover
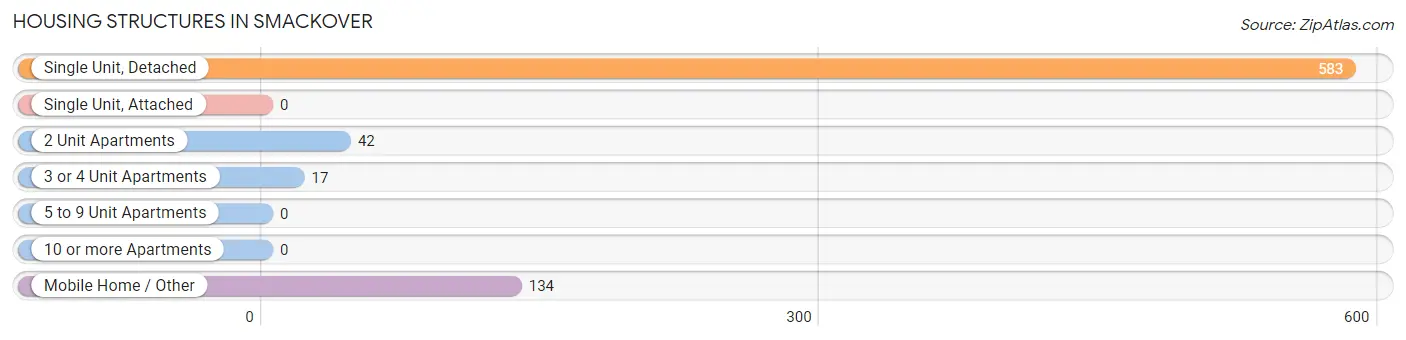
| Structure Type | # Housing Units | % Housing Units |
| Single Unit, Detached | 583 | 75.1% |
| Single Unit, Attached | 0 | 0.0% |
| 2 Unit Apartments | 42 | 5.4% |
| 3 or 4 Unit Apartments | 17 | 2.2% |
| 5 to 9 Unit Apartments | 0 | 0.0% |
| 10 or more Apartments | 0 | 0.0% |
| Mobile Home / Other | 134 | 17.3% |
| Total | 776 | 100.0% |
Housing Structures by Occupancy in Smackover
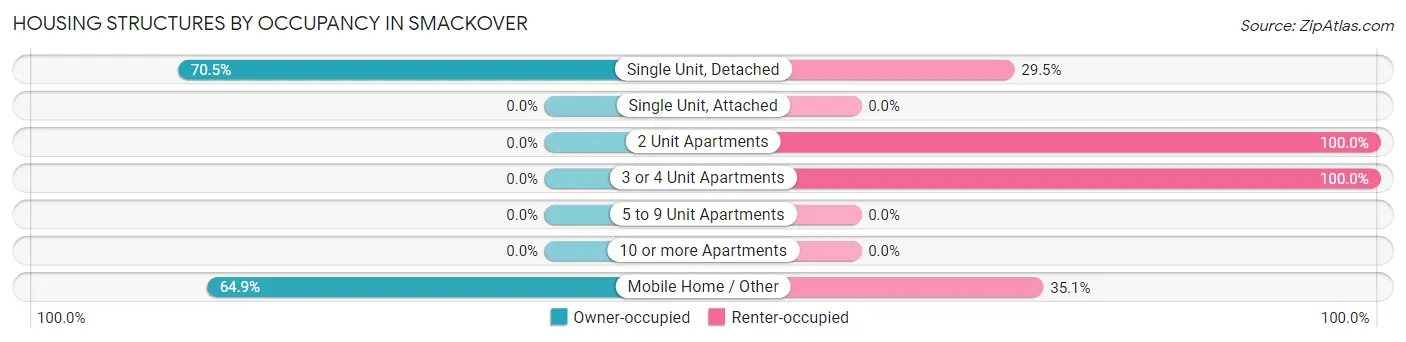
| Structure Type | Owner-occupied | Renter-occupied |
| Single Unit, Detached | 411 (70.5%) | 172 (29.5%) |
| Single Unit, Attached | 0 (0.0%) | 0 (0.0%) |
| 2 Unit Apartments | 0 (0.0%) | 42 (100.0%) |
| 3 or 4 Unit Apartments | 0 (0.0%) | 17 (100.0%) |
| 5 to 9 Unit Apartments | 0 (0.0%) | 0 (0.0%) |
| 10 or more Apartments | 0 (0.0%) | 0 (0.0%) |
| Mobile Home / Other | 87 (64.9%) | 47 (35.1%) |
| Total | 498 (64.2%) | 278 (35.8%) |
Housing Structures by Number of Rooms in Smackover
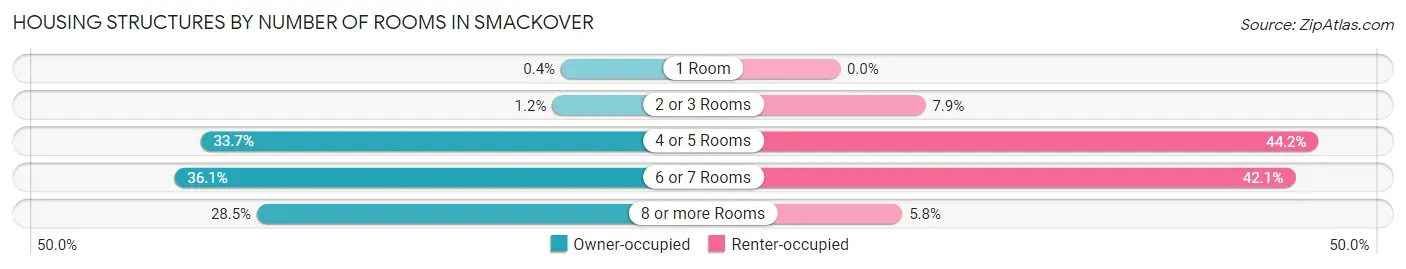
| Number of Rooms | Owner-occupied | Renter-occupied |
| 1 Room | 2 (0.4%) | 0 (0.0%) |
| 2 or 3 Rooms | 6 (1.2%) | 22 (7.9%) |
| 4 or 5 Rooms | 168 (33.7%) | 123 (44.2%) |
| 6 or 7 Rooms | 180 (36.1%) | 117 (42.1%) |
| 8 or more Rooms | 142 (28.5%) | 16 (5.8%) |
| Total | 498 (100.0%) | 278 (100.0%) |
Housing Structure by Heating Type in Smackover
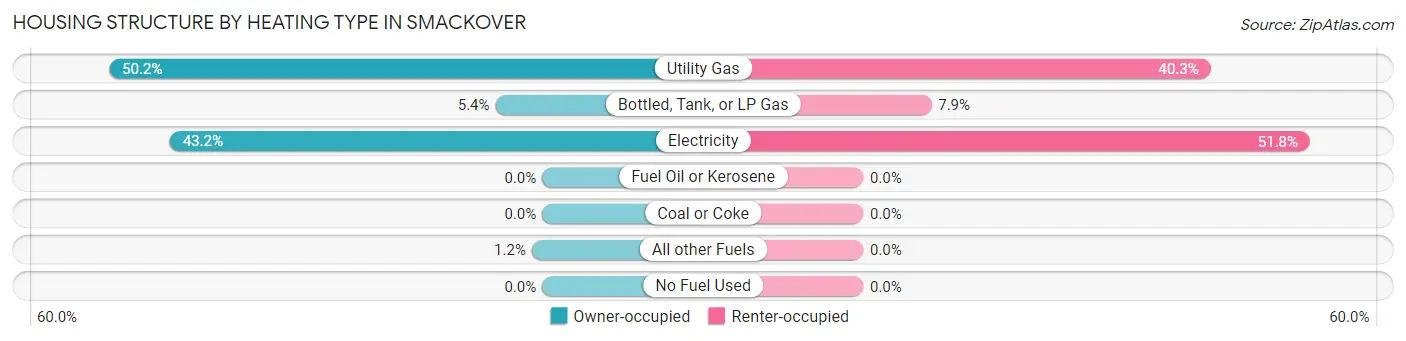
| Heating Type | Owner-occupied | Renter-occupied |
| Utility Gas | 250 (50.2%) | 112 (40.3%) |
| Bottled, Tank, or LP Gas | 27 (5.4%) | 22 (7.9%) |
| Electricity | 215 (43.2%) | 144 (51.8%) |
| Fuel Oil or Kerosene | 0 (0.0%) | 0 (0.0%) |
| Coal or Coke | 0 (0.0%) | 0 (0.0%) |
| All other Fuels | 6 (1.2%) | 0 (0.0%) |
| No Fuel Used | 0 (0.0%) | 0 (0.0%) |
| Total | 498 (100.0%) | 278 (100.0%) |
Household Vehicle Usage in Smackover
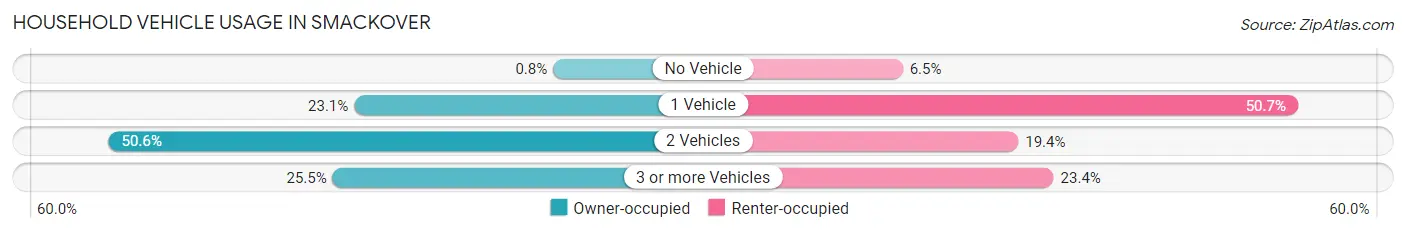
| Vehicles per Household | Owner-occupied | Renter-occupied |
| No Vehicle | 4 (0.8%) | 18 (6.5%) |
| 1 Vehicle | 115 (23.1%) | 141 (50.7%) |
| 2 Vehicles | 252 (50.6%) | 54 (19.4%) |
| 3 or more Vehicles | 127 (25.5%) | 65 (23.4%) |
| Total | 498 (100.0%) | 278 (100.0%) |
Real Estate & Mortgages in Smackover
Real Estate and Mortgage Overview in Smackover
| Characteristic | Without Mortgage | With Mortgage |
| Housing Units | 254 | 244 |
| Median Property Value | $95,000 | $152,900 |
| Median Household Income | $41,548 | $39 |
| Monthly Housing Costs | $334 | $0 |
| Real Estate Taxes | $603 | $6 |
Property Value by Mortgage Status in Smackover
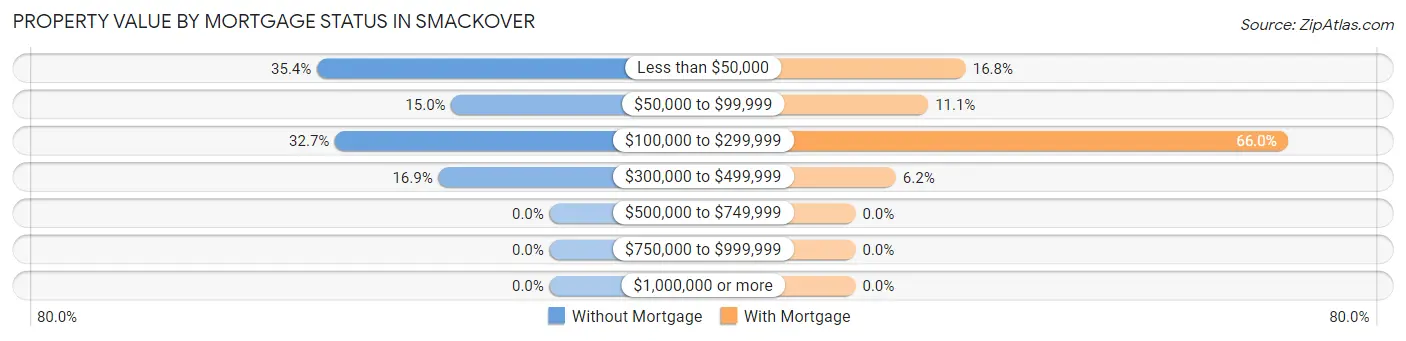
| Property Value | Without Mortgage | With Mortgage |
| Less than $50,000 | 90 (35.4%) | 41 (16.8%) |
| $50,000 to $99,999 | 38 (15.0%) | 27 (11.1%) |
| $100,000 to $299,999 | 83 (32.7%) | 161 (66.0%) |
| $300,000 to $499,999 | 43 (16.9%) | 15 (6.1%) |
| $500,000 to $749,999 | 0 (0.0%) | 0 (0.0%) |
| $750,000 to $999,999 | 0 (0.0%) | 0 (0.0%) |
| $1,000,000 or more | 0 (0.0%) | 0 (0.0%) |
| Total | 254 (100.0%) | 244 (100.0%) |
Household Income by Mortgage Status in Smackover
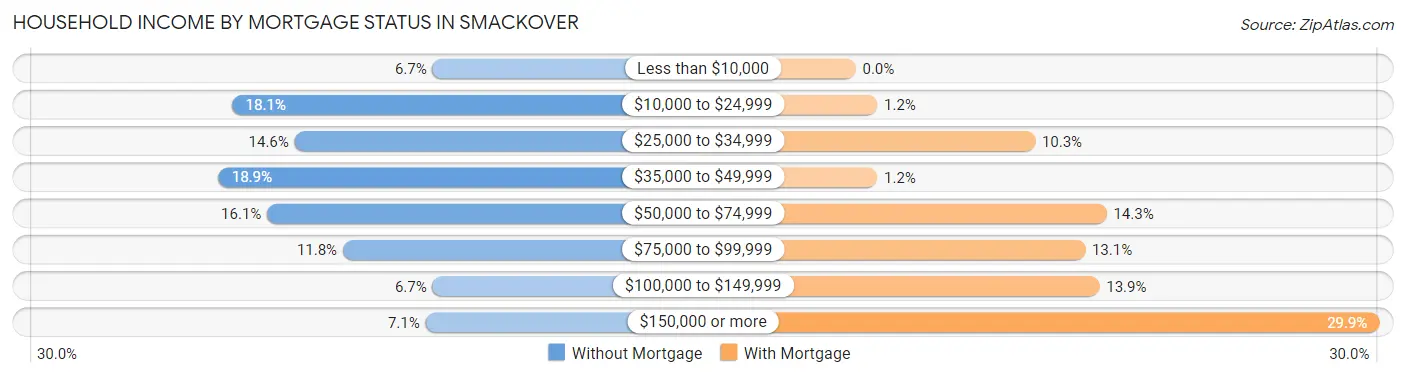
| Household Income | Without Mortgage | With Mortgage |
| Less than $10,000 | 17 (6.7%) | 0 (0.0%) |
| $10,000 to $24,999 | 46 (18.1%) | 3 (1.2%) |
| $25,000 to $34,999 | 37 (14.6%) | 25 (10.2%) |
| $35,000 to $49,999 | 48 (18.9%) | 3 (1.2%) |
| $50,000 to $74,999 | 41 (16.1%) | 35 (14.3%) |
| $75,000 to $99,999 | 30 (11.8%) | 32 (13.1%) |
| $100,000 to $149,999 | 17 (6.7%) | 34 (13.9%) |
| $150,000 or more | 18 (7.1%) | 73 (29.9%) |
| Total | 254 (100.0%) | 244 (100.0%) |
Property Value to Household Income Ratio in Smackover
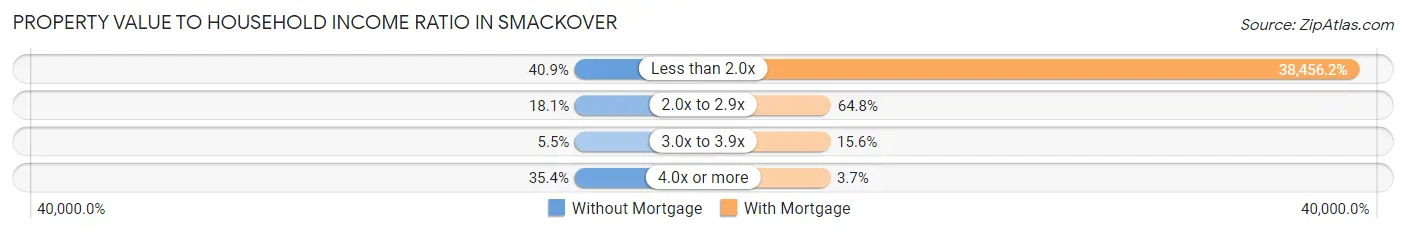
| Value-to-Income Ratio | Without Mortgage | With Mortgage |
| Less than 2.0x | 104 (40.9%) | 93,833 (38,456.2%) |
| 2.0x to 2.9x | 46 (18.1%) | 158 (64.7%) |
| 3.0x to 3.9x | 14 (5.5%) | 38 (15.6%) |
| 4.0x or more | 90 (35.4%) | 9 (3.7%) |
| Total | 254 (100.0%) | 244 (100.0%) |
Real Estate Taxes by Mortgage Status in Smackover
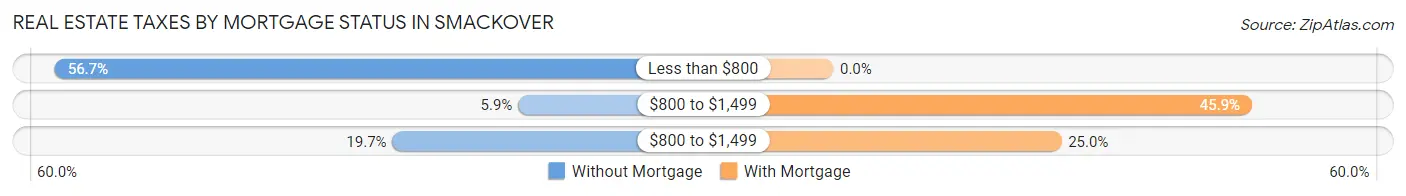
| Property Taxes | Without Mortgage | With Mortgage |
| Less than $800 | 144 (56.7%) | 0 (0.0%) |
| $800 to $1,499 | 15 (5.9%) | 112 (45.9%) |
| $800 to $1,499 | 50 (19.7%) | 61 (25.0%) |
| Total | 254 (100.0%) | 244 (100.0%) |
Health & Disability in Smackover
Health Insurance Coverage by Age in Smackover
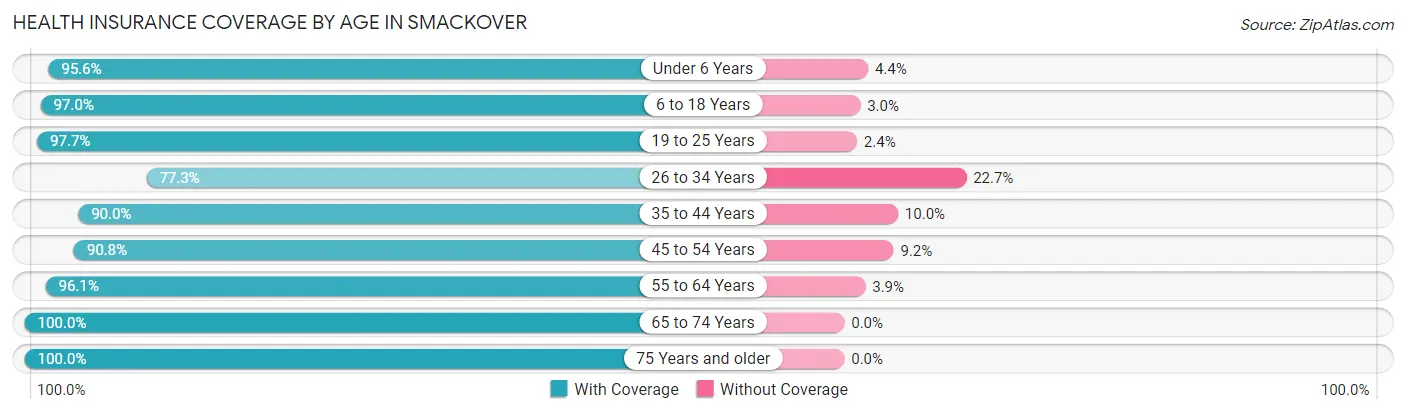
| Age Bracket | With Coverage | Without Coverage |
| Under 6 Years | 108 (95.6%) | 5 (4.4%) |
| 6 to 18 Years | 327 (97.0%) | 10 (3.0%) |
| 19 to 25 Years | 166 (97.7%) | 4 (2.4%) |
| 26 to 34 Years | 102 (77.3%) | 30 (22.7%) |
| 35 to 44 Years | 279 (90.0%) | 31 (10.0%) |
| 45 to 54 Years | 178 (90.8%) | 18 (9.2%) |
| 55 to 64 Years | 295 (96.1%) | 12 (3.9%) |
| 65 to 74 Years | 318 (100.0%) | 0 (0.0%) |
| 75 Years and older | 92 (100.0%) | 0 (0.0%) |
| Total | 1,865 (94.4%) | 110 (5.6%) |
Health Insurance Coverage by Citizenship Status in Smackover
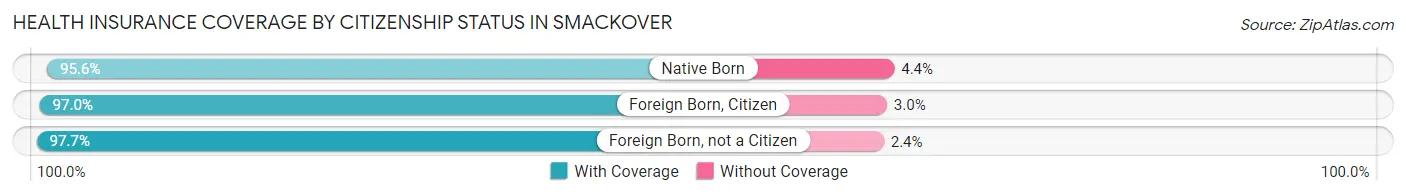
| Citizenship Status | With Coverage | Without Coverage |
| Native Born | 108 (95.6%) | 5 (4.4%) |
| Foreign Born, Citizen | 327 (97.0%) | 10 (3.0%) |
| Foreign Born, not a Citizen | 166 (97.7%) | 4 (2.4%) |
Health Insurance Coverage by Household Income in Smackover
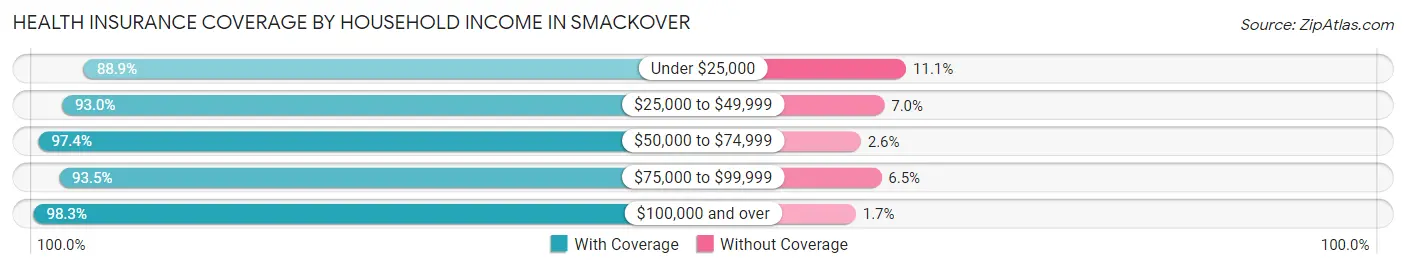
| Household Income | With Coverage | Without Coverage |
| Under $25,000 | 424 (88.9%) | 53 (11.1%) |
| $25,000 to $49,999 | 318 (93.0%) | 24 (7.0%) |
| $50,000 to $74,999 | 335 (97.4%) | 9 (2.6%) |
| $75,000 to $99,999 | 202 (93.5%) | 14 (6.5%) |
| $100,000 and over | 586 (98.3%) | 10 (1.7%) |
Public vs Private Health Insurance Coverage by Age in Smackover
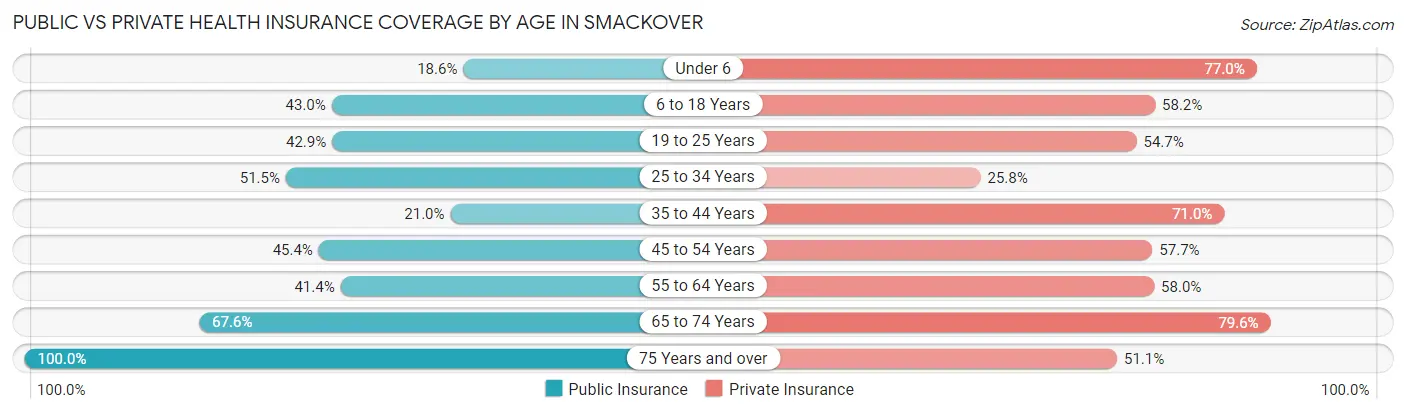
| Age Bracket | Public Insurance | Private Insurance |
| Under 6 | 21 (18.6%) | 87 (77.0%) |
| 6 to 18 Years | 145 (43.0%) | 196 (58.2%) |
| 19 to 25 Years | 73 (42.9%) | 93 (54.7%) |
| 25 to 34 Years | 68 (51.5%) | 34 (25.8%) |
| 35 to 44 Years | 65 (21.0%) | 220 (71.0%) |
| 45 to 54 Years | 89 (45.4%) | 113 (57.7%) |
| 55 to 64 Years | 127 (41.4%) | 178 (58.0%) |
| 65 to 74 Years | 215 (67.6%) | 253 (79.6%) |
| 75 Years and over | 92 (100.0%) | 47 (51.1%) |
| Total | 895 (45.3%) | 1,221 (61.8%) |
Disability Status by Sex by Age in Smackover
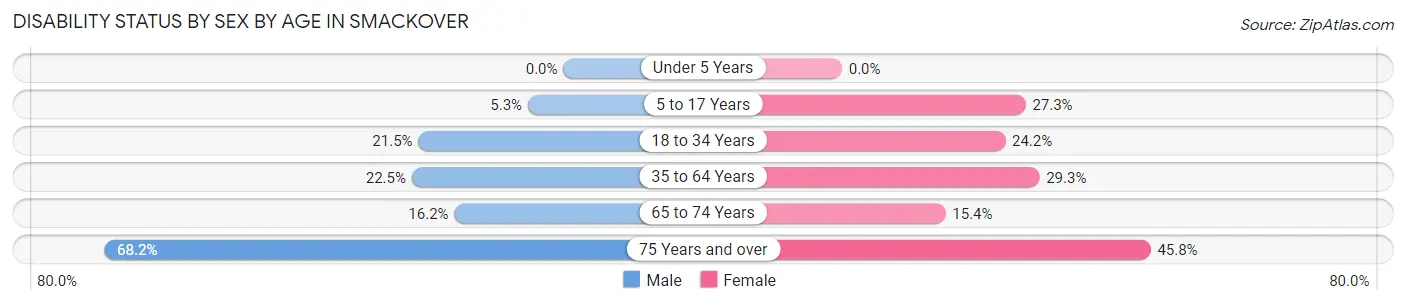
| Age Bracket | Male | Female |
| Under 5 Years | 0 (0.0%) | 0 (0.0%) |
| 5 to 17 Years | 10 (5.3%) | 36 (27.3%) |
| 18 to 34 Years | 34 (21.5%) | 40 (24.2%) |
| 35 to 64 Years | 97 (22.5%) | 112 (29.3%) |
| 65 to 74 Years | 22 (16.2%) | 28 (15.4%) |
| 75 Years and over | 30 (68.2%) | 22 (45.8%) |
Disability Class by Sex by Age in Smackover
Disability Class: Hearing Difficulty
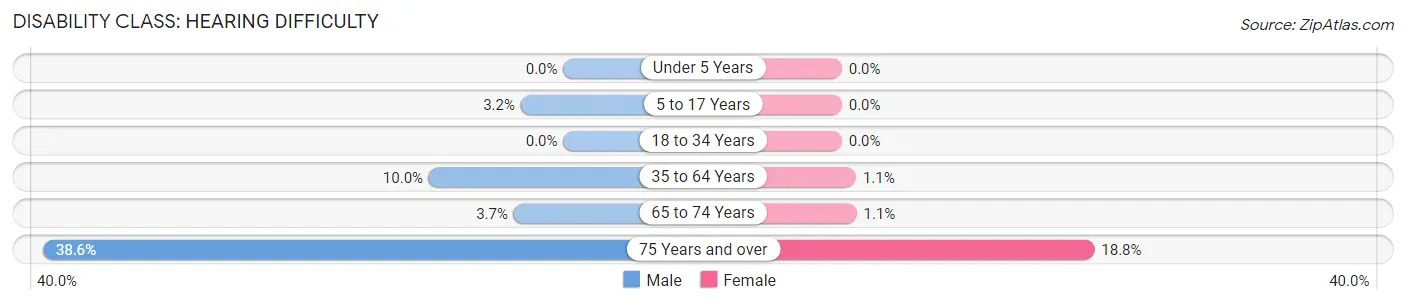
| Age Bracket | Male | Female |
| Under 5 Years | 0 (0.0%) | 0 (0.0%) |
| 5 to 17 Years | 6 (3.2%) | 0 (0.0%) |
| 18 to 34 Years | 0 (0.0%) | 0 (0.0%) |
| 35 to 64 Years | 43 (10.0%) | 4 (1.1%) |
| 65 to 74 Years | 5 (3.7%) | 2 (1.1%) |
| 75 Years and over | 17 (38.6%) | 9 (18.8%) |
Disability Class: Vision Difficulty
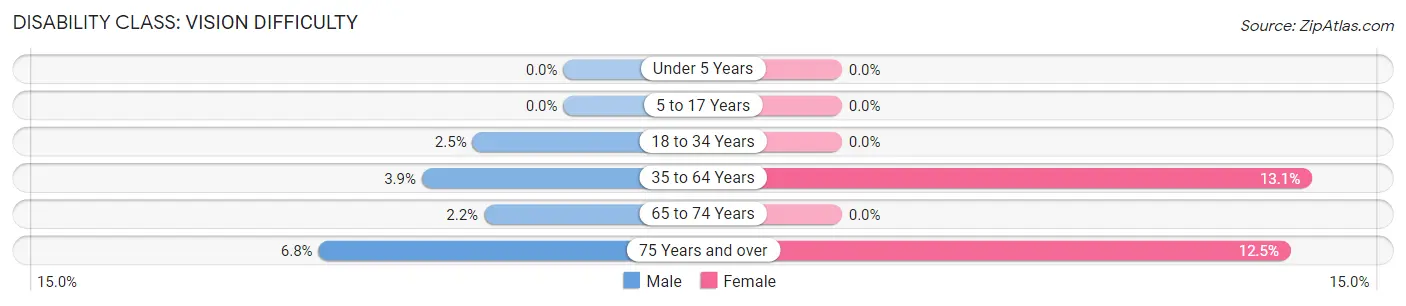
| Age Bracket | Male | Female |
| Under 5 Years | 0 (0.0%) | 0 (0.0%) |
| 5 to 17 Years | 0 (0.0%) | 0 (0.0%) |
| 18 to 34 Years | 4 (2.5%) | 0 (0.0%) |
| 35 to 64 Years | 17 (3.9%) | 50 (13.1%) |
| 65 to 74 Years | 3 (2.2%) | 0 (0.0%) |
| 75 Years and over | 3 (6.8%) | 6 (12.5%) |
Disability Class: Cognitive Difficulty
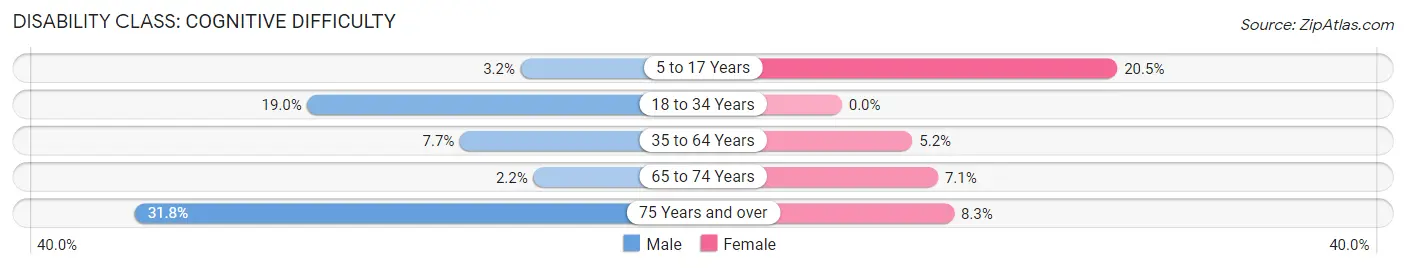
| Age Bracket | Male | Female |
| 5 to 17 Years | 6 (3.2%) | 27 (20.4%) |
| 18 to 34 Years | 30 (19.0%) | 0 (0.0%) |
| 35 to 64 Years | 33 (7.7%) | 20 (5.2%) |
| 65 to 74 Years | 3 (2.2%) | 13 (7.1%) |
| 75 Years and over | 14 (31.8%) | 4 (8.3%) |
Disability Class: Ambulatory Difficulty
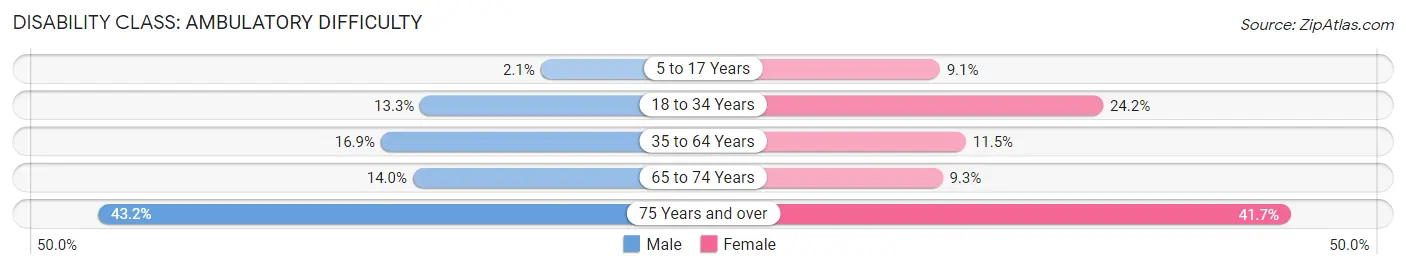
| Age Bracket | Male | Female |
| 5 to 17 Years | 4 (2.1%) | 12 (9.1%) |
| 18 to 34 Years | 21 (13.3%) | 40 (24.2%) |
| 35 to 64 Years | 73 (16.9%) | 44 (11.5%) |
| 65 to 74 Years | 19 (14.0%) | 17 (9.3%) |
| 75 Years and over | 19 (43.2%) | 20 (41.7%) |
Disability Class: Self-Care Difficulty
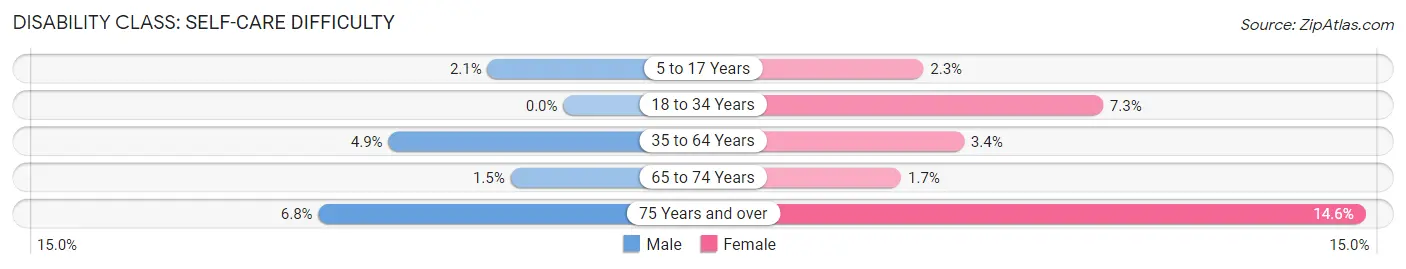
| Age Bracket | Male | Female |
| 5 to 17 Years | 4 (2.1%) | 3 (2.3%) |
| 18 to 34 Years | 0 (0.0%) | 12 (7.3%) |
| 35 to 64 Years | 21 (4.9%) | 13 (3.4%) |
| 65 to 74 Years | 2 (1.5%) | 3 (1.7%) |
| 75 Years and over | 3 (6.8%) | 7 (14.6%) |
Technology Access in Smackover
Computing Device Access in Smackover
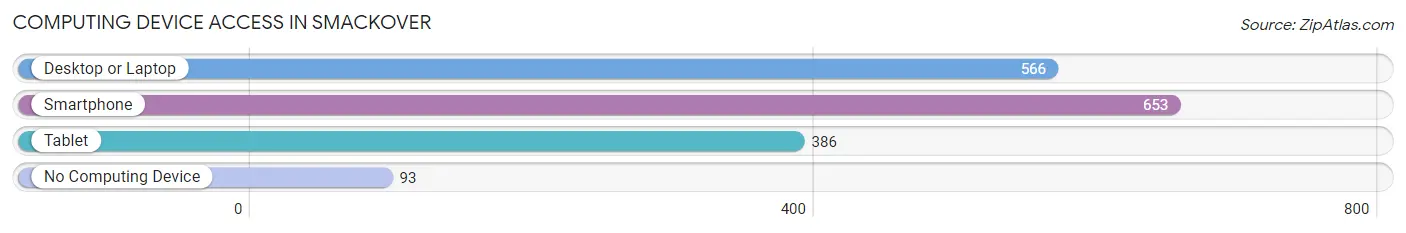
| Device Type | # Households | % Households |
| Desktop or Laptop | 566 | 72.9% |
| Smartphone | 653 | 84.2% |
| Tablet | 386 | 49.7% |
| No Computing Device | 93 | 12.0% |
| Total | 776 | 100.0% |
Internet Access in Smackover
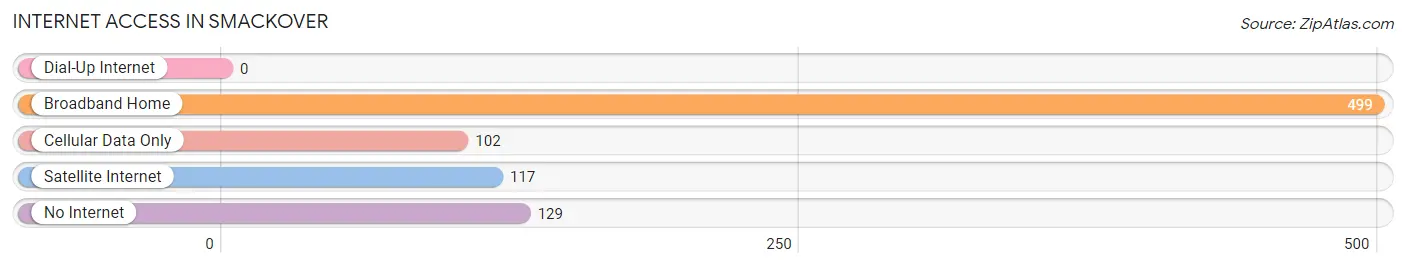
| Internet Type | # Households | % Households |
| Dial-Up Internet | 0 | 0.0% |
| Broadband Home | 499 | 64.3% |
| Cellular Data Only | 102 | 13.1% |
| Satellite Internet | 117 | 15.1% |
| No Internet | 129 | 16.6% |
| Total | 776 | 100.0% |
Smackover Summary
Smackover is a city located in Union County, Arkansas, United States. The population was 2,839 at the 2010 census. It is part of the El Dorado, Arkansas Micropolitan Statistical Area.
History
The city of Smackover was founded in 1895 by the Smackover Oil and Mining Company. The company was formed by a group of investors from El Dorado, Arkansas, who had heard of the potential for oil in the area. The town was named after the Smackover Creek, which was named by early settlers who heard the sound of a large fish slapping the water.
The first oil well was drilled in the area in 1921, and the town quickly grew as a result. By the mid-1920s, Smackover was the largest oil field in the world. The oil boom brought in thousands of people, and the population of the town grew to over 10,000 by the end of the decade.
The oil industry in Smackover declined in the 1930s, and the population dropped to around 4,000 by 1940. The town continued to decline until the late 1950s, when the oil industry began to revive. The population of Smackover has remained relatively stable since then, and the town is now home to around 2,800 people.
Geography
Smackover is located at 33°30'25" North, 92°45'17" West (33.506944, -92.754722). The city is situated in the foothills of the Ouachita Mountains, and is located about 10 miles south of El Dorado, Arkansas.
The city has a total area of 4.2 square miles, all of which is land. The city is located in the Central Arkansas region, and is part of the El Dorado, Arkansas Micropolitan Statistical Area.
Economy
The economy of Smackover is largely based on the oil industry. The city is home to several oil companies, including Murphy Oil Corporation, which is headquartered in the city. The city is also home to several other businesses, including a lumber mill, a furniture factory, and a number of retail stores.
The city is also home to a number of tourist attractions, including the Smackover Oil Museum, which is located in the old Smackover Oil and Mining Company building. The museum features exhibits on the history of the oil industry in the area, as well as a number of artifacts from the early days of the industry.
Demographics
As of the 2010 census, there were 2,839 people, 1,093 households, and 745 families residing in the city. The population density was 677.2 people per square mile. There were 1,223 housing units at an average density of 291.7 per square mile.
The racial makeup of the city was 79.2% White, 17.3% African American, 0.3% Native American, 0.4% Asian, 0.1% Pacific Islander, 0.7% from other races, and 2.1% from two or more races. Hispanic or Latino of any race were 2.2% of the population.
There were 1,093 households, out of which 28.3% had children under the age of 18 living with them, 48.2% were married couples living together, 14.3% had a female householder with no husband present, and 33.2% were non-families. 28.7% of all households were made up of individuals, and 13.2% had someone living alone who was 65 years of age or older. The average household size was 2.45 and the average family size was 3.00.
In the city, the population was spread out, with 24.2% under the age of 18, 8.2% from 18 to 24, 25.2% from 25 to 44, 25.2% from 45 to 64, and 17.2% who were 65 years of age or older. The median age was 39 years. For every 100 females, there were 87.3 males. For every 100 females age 18 and over, there were 83.2 males.
The median income for a household in the city was $30,938, and the median income for a family was $37,917. Males had a median income of $31,250 versus $20,000 for females. The per capita income for the city was $15,945. About 13.2% of families and 16.2% of the population were below the poverty line, including 22.2% of those under age 18 and 14.2% of those age 65 or over.
Common Questions
What is Per Capita Income in Smackover?
Per Capita income in Smackover is $26,611.
What is the Median Family Income in Smackover?
Median Family Income in Smackover is $71,442.
What is the Median Household income in Smackover?
Median Household Income in Smackover is $52,500.
What is Income or Wage Gap in Smackover?
Income or Wage Gap in Smackover is 56.6%.
Women in Smackover earn 43.4 cents for every dollar earned by a man.
What is Inequality or Gini Index in Smackover?
Inequality or Gini Index in Smackover is 0.45.
What is the Total Population of Smackover?
Total Population of Smackover is 1,975.
What is the Total Male Population of Smackover?
Total Male Population of Smackover is 1,011.
What is the Total Female Population of Smackover?
Total Female Population of Smackover is 964.
What is the Ratio of Males per 100 Females in Smackover?
There are 104.88 Males per 100 Females in Smackover.
What is the Ratio of Females per 100 Males in Smackover?
There are 95.35 Females per 100 Males in Smackover.
What is the Median Population Age in Smackover?
Median Population Age in Smackover is 43.3 Years.
What is the Average Family Size in Smackover
Average Family Size in Smackover is 3.0 People.
What is the Average Household Size in Smackover
Average Household Size in Smackover is 2.5 People.
How Large is the Labor Force in Smackover?
There are 955 People in the Labor Forcein in Smackover.
What is the Percentage of People in the Labor Force in Smackover?
60.3% of People are in the Labor Force in Smackover.
What is the Unemployment Rate in Smackover?
Unemployment Rate in Smackover is 4.4%.