Zip Codes with the Highest Percentage of Population with a Degree in Engineering in Rogers, AR
RELATED REPORTS & OPTIONS
Engineering
Rogers
Compare Zip Codes
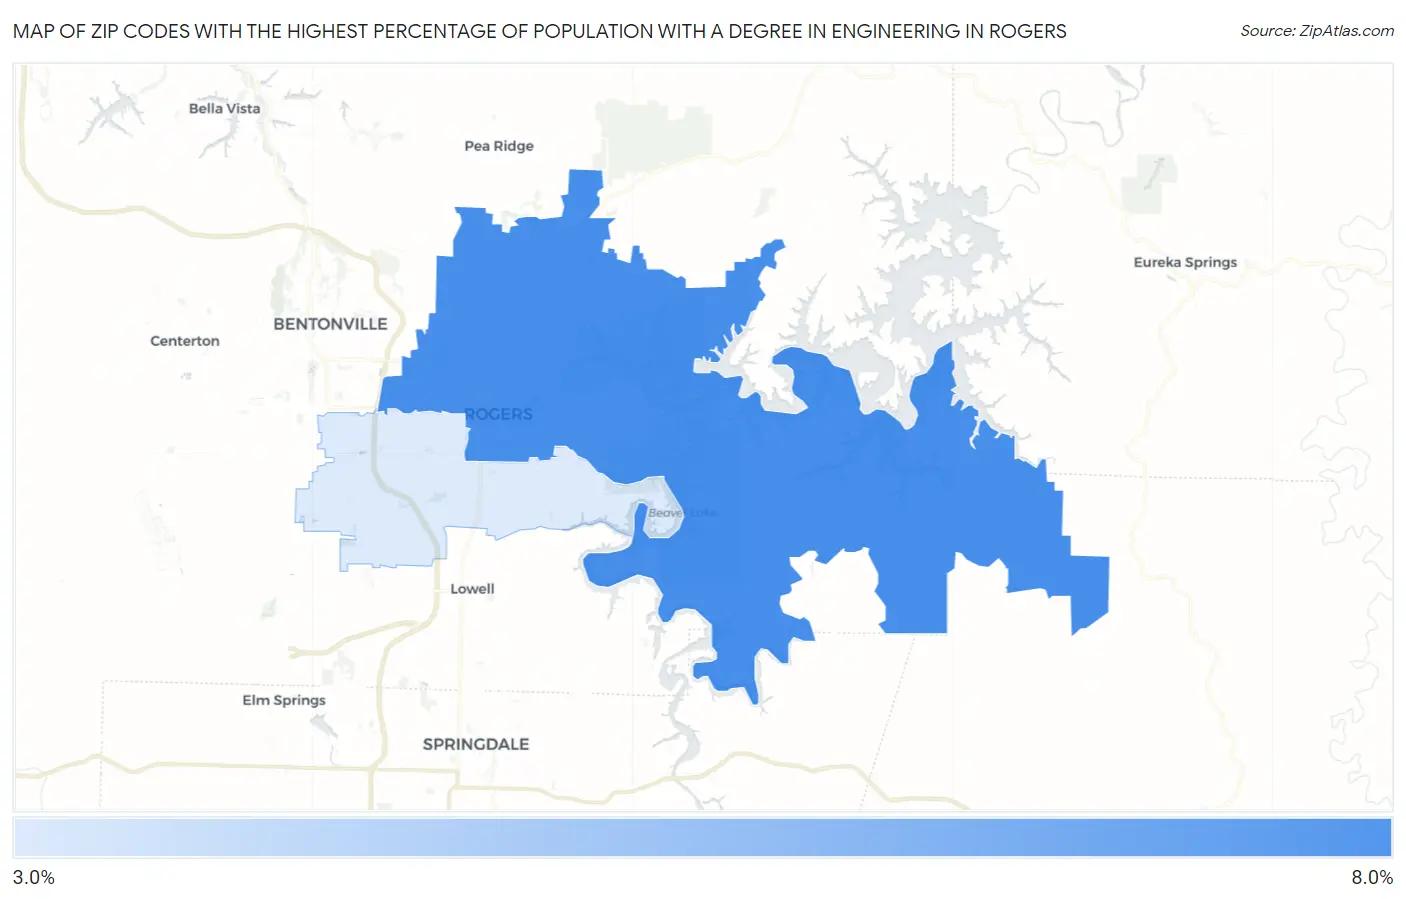
Map of Zip Codes with the Highest Percentage of Population with a Degree in Engineering in Rogers
3.6%
7.0%
Zip Codes with the Highest Percentage of Population with a Degree in Engineering in Rogers, AR
| Zip Code | % Graduates | vs State | vs National | |
| 1. | 72756 | 7.0% | 4.7%(+2.29)#77 | 7.6%(-0.676)#9,053 |
| 2. | 72758 | 3.6% | 4.7%(-1.12)#165 | 7.6%(-4.09)#17,525 |
1
Common Questions
What are the Top Zip Codes with the Highest Percentage of Population with a Degree in Engineering in Rogers, AR?
Top Zip Codes with the Highest Percentage of Population with a Degree in Engineering in Rogers, AR are:
What zip code has the Highest Percentage of Population with a Degree in Engineering in Rogers, AR?
72756 has the Highest Percentage of Population with a Degree in Engineering in Rogers, AR with 7.0%.
What is the Percentage of Population with a Degree in Engineering in Rogers, AR?
Percentage of Population with a Degree in Engineering in Rogers is 3.9%.
What is the Percentage of Population with a Degree in Engineering in Arkansas?
Percentage of Population with a Degree in Engineering in Arkansas is 4.7%.
What is the Percentage of Population with a Degree in Engineering in the United States?
Percentage of Population with a Degree in Engineering in the United States is 7.6%.