Roe, AR Map & Demographics
Roe Map
Roe Overview
$47,377
PER CAPITA INCOME
$93,393
AVG FAMILY INCOME
0.63
INEQUALITY / GINI INDEX
138
TOTAL POPULATION
62
MALE POPULATION
76
FEMALE POPULATION
81.58
MALES / 100 FEMALES
122.58
FEMALES / 100 MALES
33.9
MEDIAN AGE
3.7
AVG FAMILY SIZE
3.1
AVG HOUSEHOLD SIZE
55
LABOR FORCE [ PEOPLE ]
57.9%
PERCENT IN LABOR FORCE
14.5%
UNEMPLOYMENT RATE
Roe Zip Codes
Roe Area Codes
Income in Roe
Income Overview in Roe
| Characteristic | Number | Measure |
| Per Capita Income | 138 | $47,377 |
| Median Family Income | 33 | $93,393 |
| Mean Family Income | 33 | $177,409 |
| Median Household Income | 45 | $0 |
| Mean Household Income | 45 | $142,624 |
| Income Deficit | 33 | $0 |
| Wage / Income Gap (%) | 138 | 0.00% |
| Wage / Income Gap ($) | 138 | 100.00¢ per $1 |
| Gini / Inequality Index | 138 | 0.63 |
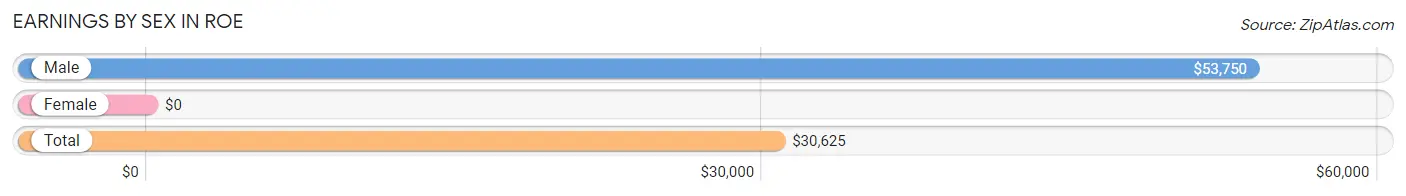
Earnings by Sex in Roe
| Sex | Number | Average Earnings |
| Male | 39 (59.1%) | $53,750 |
| Female | 27 (40.9%) | $0 |
| Total | 66 (100.0%) | $30,625 |
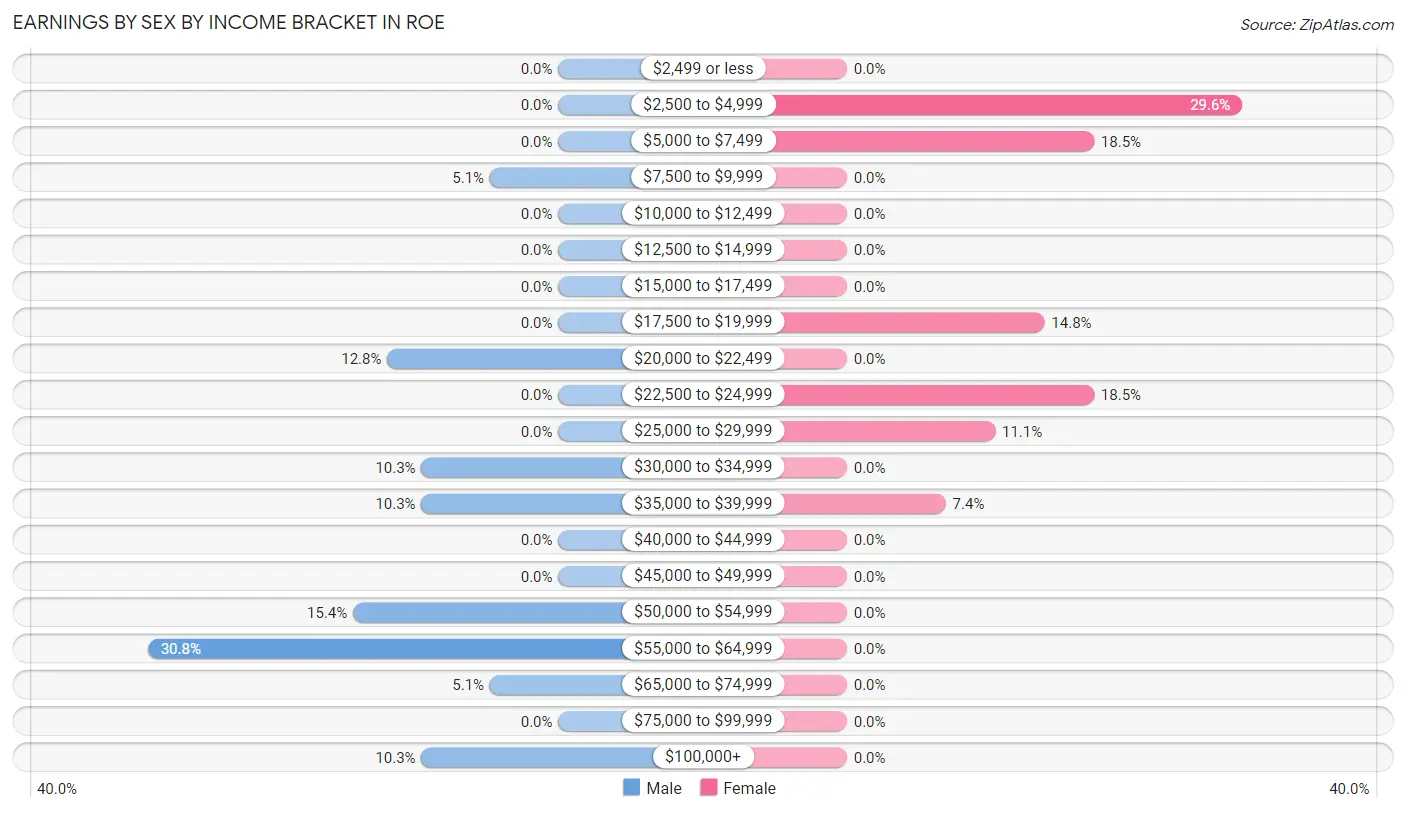
Earnings by Sex by Income Bracket in Roe
The most common earnings brackets in Roe are $55,000 to $64,999 for men (12 | 30.8%) and $2,500 to $4,999 for women (8 | 29.6%).
| Income | Male | Female |
| $2,499 or less | 0 (0.0%) | 0 (0.0%) |
| $2,500 to $4,999 | 0 (0.0%) | 8 (29.6%) |
| $5,000 to $7,499 | 0 (0.0%) | 5 (18.5%) |
| $7,500 to $9,999 | 2 (5.1%) | 0 (0.0%) |
| $10,000 to $12,499 | 0 (0.0%) | 0 (0.0%) |
| $12,500 to $14,999 | 0 (0.0%) | 0 (0.0%) |
| $15,000 to $17,499 | 0 (0.0%) | 0 (0.0%) |
| $17,500 to $19,999 | 0 (0.0%) | 4 (14.8%) |
| $20,000 to $22,499 | 5 (12.8%) | 0 (0.0%) |
| $22,500 to $24,999 | 0 (0.0%) | 5 (18.5%) |
| $25,000 to $29,999 | 0 (0.0%) | 3 (11.1%) |
| $30,000 to $34,999 | 4 (10.3%) | 0 (0.0%) |
| $35,000 to $39,999 | 4 (10.3%) | 2 (7.4%) |
| $40,000 to $44,999 | 0 (0.0%) | 0 (0.0%) |
| $45,000 to $49,999 | 0 (0.0%) | 0 (0.0%) |
| $50,000 to $54,999 | 6 (15.4%) | 0 (0.0%) |
| $55,000 to $64,999 | 12 (30.8%) | 0 (0.0%) |
| $65,000 to $74,999 | 2 (5.1%) | 0 (0.0%) |
| $75,000 to $99,999 | 0 (0.0%) | 0 (0.0%) |
| $100,000+ | 4 (10.3%) | 0 (0.0%) |
| Total | 39 (100.0%) | 27 (100.0%) |
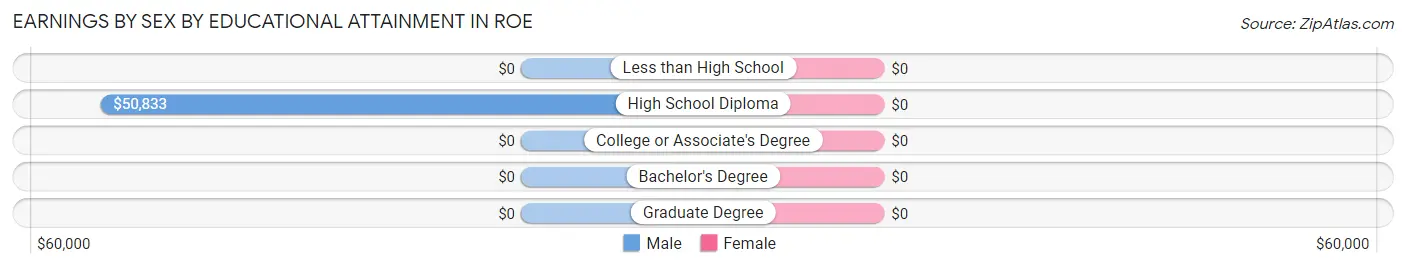
Earnings by Sex by Educational Attainment in Roe
| Educational Attainment | Male Income | Female Income |
| Less than High School | - | - |
| High School Diploma | $50,833 | $0 |
| College or Associate's Degree | - | - |
| Bachelor's Degree | - | - |
| Graduate Degree | - | - |
| Total | $58,125 | $0 |
Family Income in Roe
Family Income Brackets in Roe
According to the Roe family income data, there are 9 families falling into the $100,000 to $149,999 income range, which is the most common income bracket and makes up 27.3% of all families.
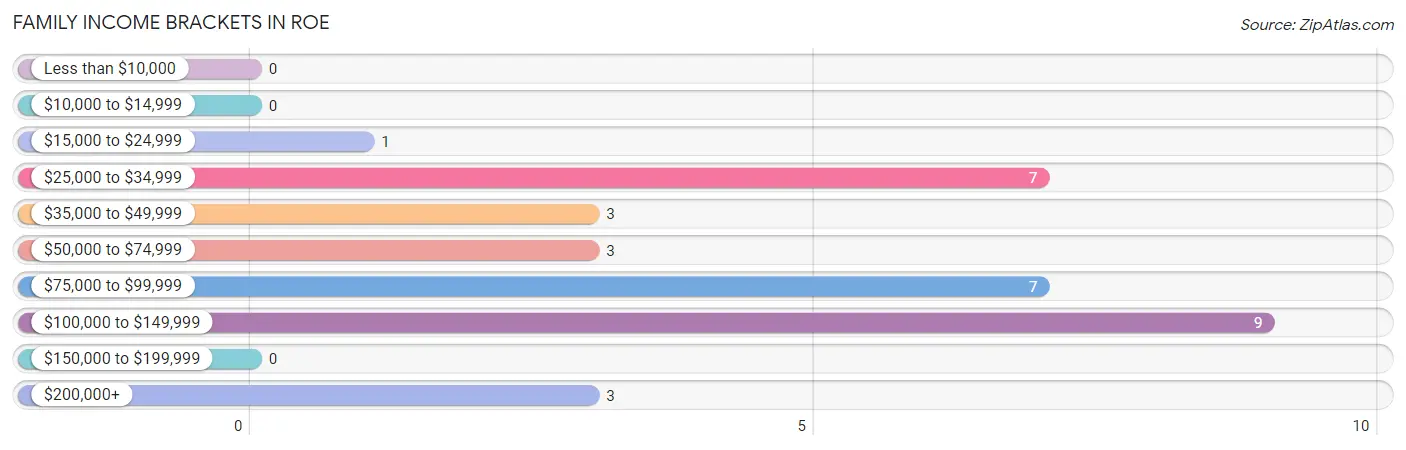
| Income Bracket | # Families | % Families |
| Less than $10,000 | 0 | 0.0% |
| $10,000 to $14,999 | 0 | 0.0% |
| $15,000 to $24,999 | 1 | 3.0% |
| $25,000 to $34,999 | 7 | 21.2% |
| $35,000 to $49,999 | 3 | 9.1% |
| $50,000 to $74,999 | 3 | 9.1% |
| $75,000 to $99,999 | 7 | 21.2% |
| $100,000 to $149,999 | 9 | 27.3% |
| $150,000 to $199,999 | 0 | 0.0% |
| $200,000+ | 3 | 9.1% |
Family Income by Famaliy Size in Roe
2-person families (17 | 51.5%) account for the highest median family income in Roe with $93,393 per family, while 2-person families (17 | 51.5%) have the highest median income of $46,696 per family member.
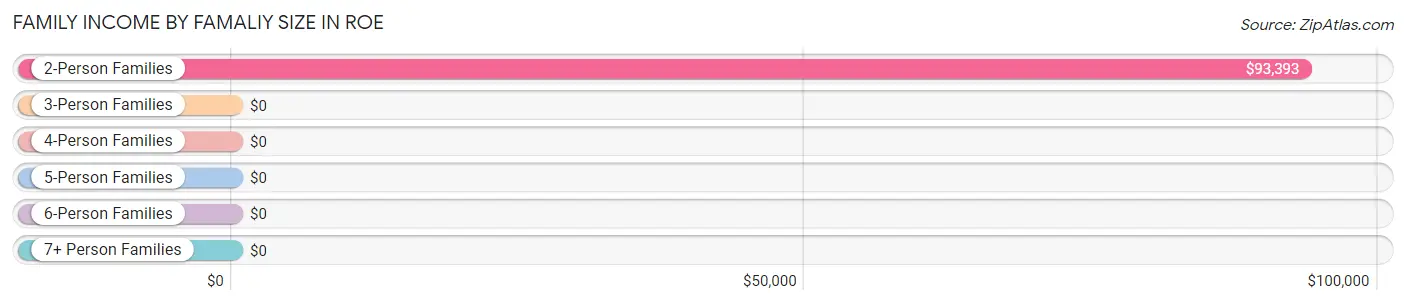
| Income Bracket | # Families | Median Income |
| 2-Person Families | 17 (51.5%) | $93,393 |
| 3-Person Families | 9 (27.3%) | $0 |
| 4-Person Families | 4 (12.1%) | $0 |
| 5-Person Families | 3 (9.1%) | $0 |
| 6-Person Families | 0 (0.0%) | $0 |
| 7+ Person Families | 0 (0.0%) | $0 |
| Total | 33 (100.0%) | $93,393 |
Family Income by Number of Earners in Roe
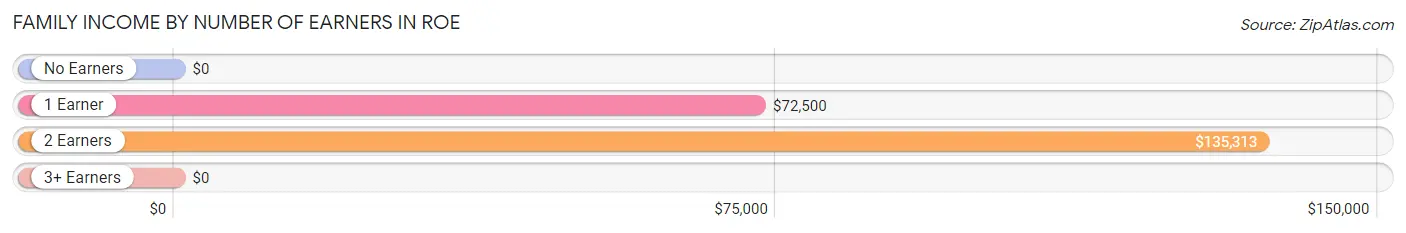
| Number of Earners | # Families | Median Income |
| No Earners | 3 (9.1%) | $0 |
| 1 Earner | 14 (42.4%) | $72,500 |
| 2 Earners | 13 (39.4%) | $135,313 |
| 3+ Earners | 3 (9.1%) | $0 |
| Total | 33 (100.0%) | $93,393 |
Household Income in Roe
Household Income Brackets in Roe
With 12 households falling in the category, the $25,000 to $34,999 income range is the most frequent in Roe, accounting for 26.7% of all households.
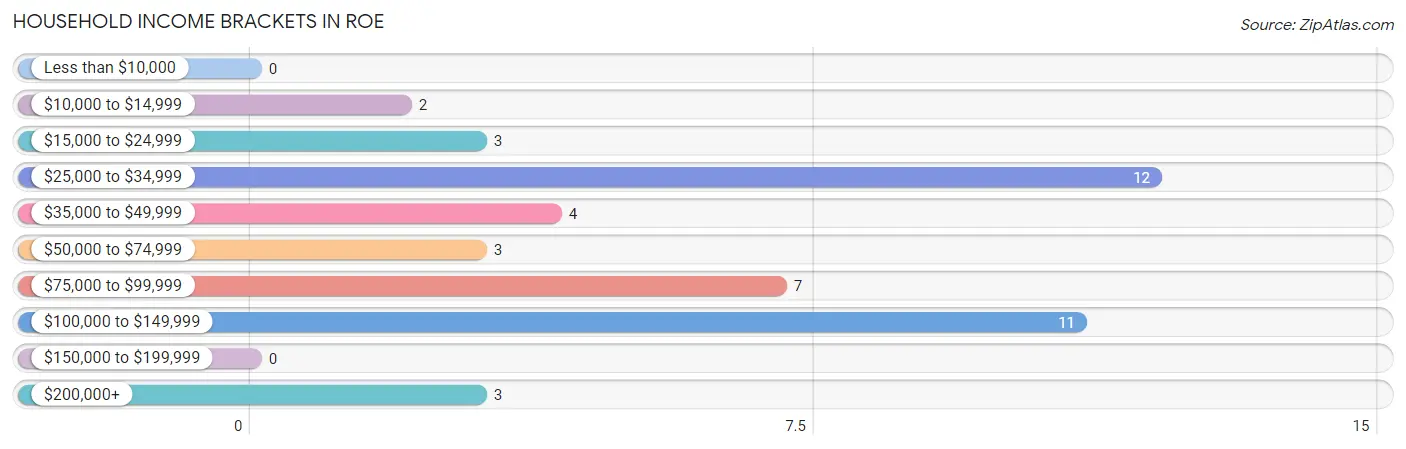
| Income Bracket | # Households | % Households |
| Less than $10,000 | 0 | 0.0% |
| $10,000 to $14,999 | 2 | 4.4% |
| $15,000 to $24,999 | 3 | 6.7% |
| $25,000 to $34,999 | 12 | 26.7% |
| $35,000 to $49,999 | 4 | 8.9% |
| $50,000 to $74,999 | 3 | 6.7% |
| $75,000 to $99,999 | 7 | 15.6% |
| $100,000 to $149,999 | 11 | 24.4% |
| $150,000 to $199,999 | 0 | 0.0% |
| $200,000+ | 3 | 6.7% |
Household Income by Householder Age in Roe
| Income Bracket | # Households | Median Income |
| 15 to 24 Years | 0 (0.0%) | $0 |
| 25 to 44 Years | 12 (26.7%) | $0 |
| 45 to 64 Years | 15 (33.3%) | $0 |
| 65+ Years | 18 (40.0%) | $0 |
| Total | 45 (100.0%) | $0 |
Poverty in Roe
Income Below Poverty by Sex and Age in Roe
With 5.1% poverty level for males and 4.0% for females among the residents of Roe, 18 to 24 year old males and 65 to 74 year old females are the most vulnerable to poverty, with 2 males (28.6%) and 2 females (50.0%) in their respective age groups living below the poverty level.
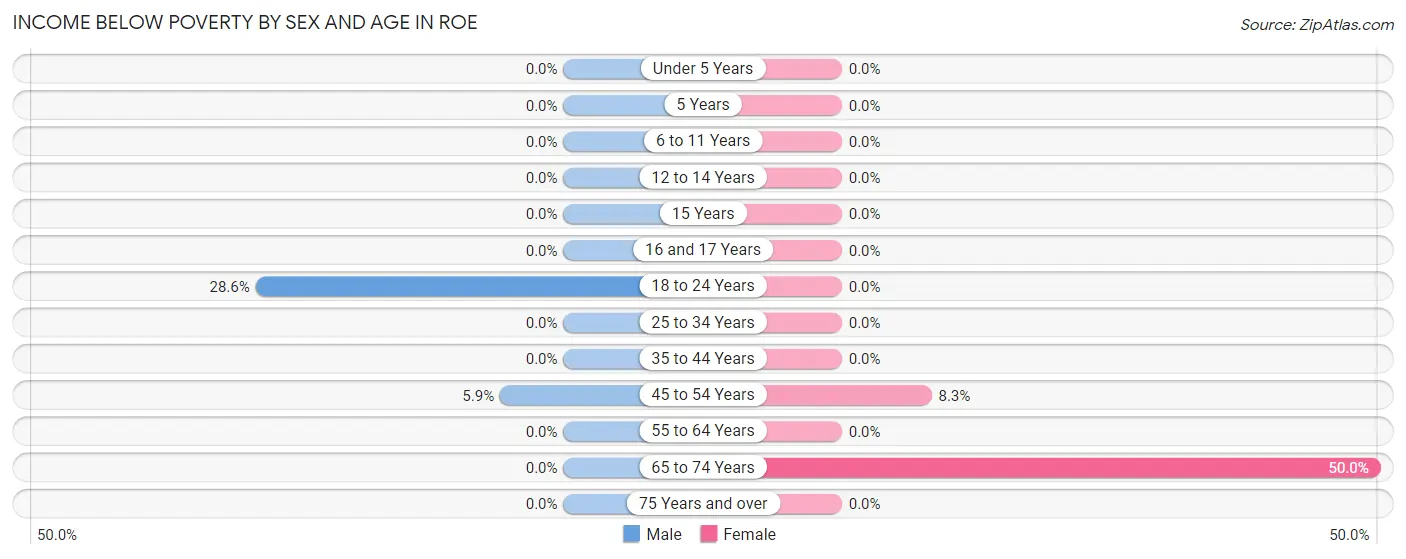
| Age Bracket | Male | Female |
| Under 5 Years | 0 (0.0%) | 0 (0.0%) |
| 5 Years | 0 (0.0%) | 0 (0.0%) |
| 6 to 11 Years | 0 (0.0%) | 0 (0.0%) |
| 12 to 14 Years | 0 (0.0%) | 0 (0.0%) |
| 15 Years | 0 (0.0%) | 0 (0.0%) |
| 16 and 17 Years | 0 (0.0%) | 0 (0.0%) |
| 18 to 24 Years | 2 (28.6%) | 0 (0.0%) |
| 25 to 34 Years | 0 (0.0%) | 0 (0.0%) |
| 35 to 44 Years | 0 (0.0%) | 0 (0.0%) |
| 45 to 54 Years | 1 (5.9%) | 1 (8.3%) |
| 55 to 64 Years | 0 (0.0%) | 0 (0.0%) |
| 65 to 74 Years | 0 (0.0%) | 2 (50.0%) |
| 75 Years and over | 0 (0.0%) | 0 (0.0%) |
| Total | 3 (5.1%) | 3 (4.0%) |
Income Above Poverty by Sex and Age in Roe
According to the poverty statistics in Roe, males aged 6 to 11 years and females aged under 5 years are the age groups that are most secure financially, with 100.0% of males and 100.0% of females in these age groups living above the poverty line.
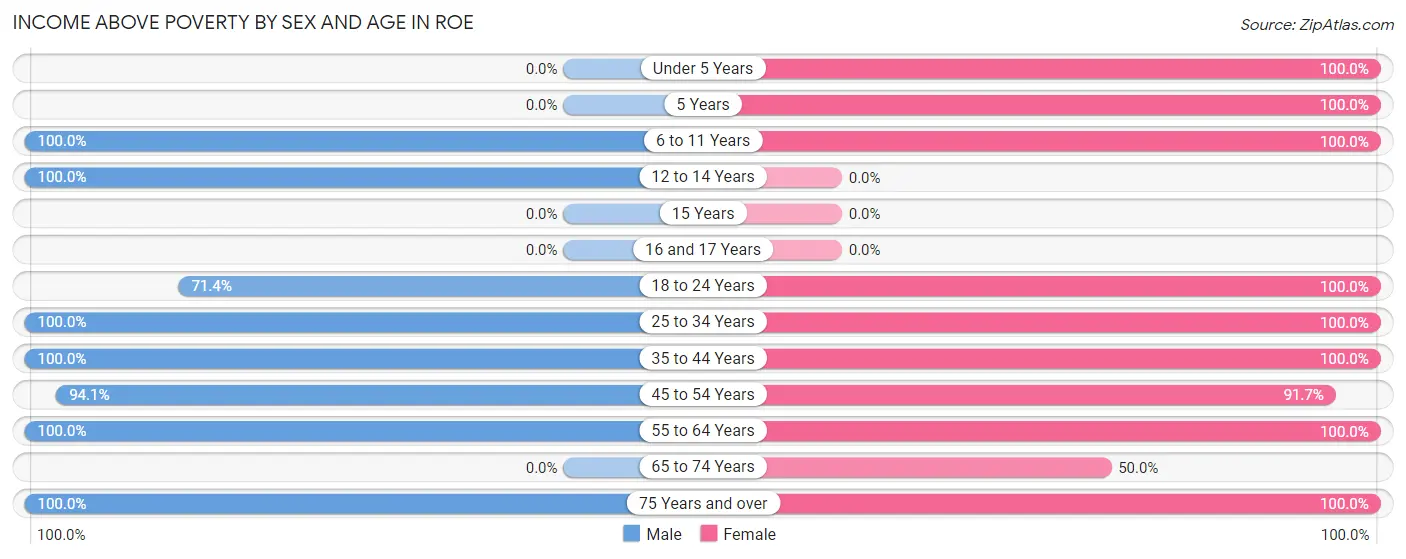
| Age Bracket | Male | Female |
| Under 5 Years | 0 (0.0%) | 4 (100.0%) |
| 5 Years | 0 (0.0%) | 7 (100.0%) |
| 6 to 11 Years | 2 (100.0%) | 18 (100.0%) |
| 12 to 14 Years | 9 (100.0%) | 0 (0.0%) |
| 15 Years | 0 (0.0%) | 0 (0.0%) |
| 16 and 17 Years | 0 (0.0%) | 0 (0.0%) |
| 18 to 24 Years | 5 (71.4%) | 5 (100.0%) |
| 25 to 34 Years | 6 (100.0%) | 12 (100.0%) |
| 35 to 44 Years | 6 (100.0%) | 2 (100.0%) |
| 45 to 54 Years | 16 (94.1%) | 11 (91.7%) |
| 55 to 64 Years | 7 (100.0%) | 3 (100.0%) |
| 65 to 74 Years | 0 (0.0%) | 2 (50.0%) |
| 75 Years and over | 5 (100.0%) | 9 (100.0%) |
| Total | 56 (94.9%) | 73 (96.1%) |
Income Below Poverty Among Married-Couple Families in Roe
The poverty statistics for married-couple families in Roe show that 5.3% or 1 of the total 19 families live below the poverty line. Families with no children have the highest poverty rate of 6.2%, comprising of 1 families. On the other hand, families with 3 or 4 children have the lowest poverty rate of 0.0%, which includes 0 families.
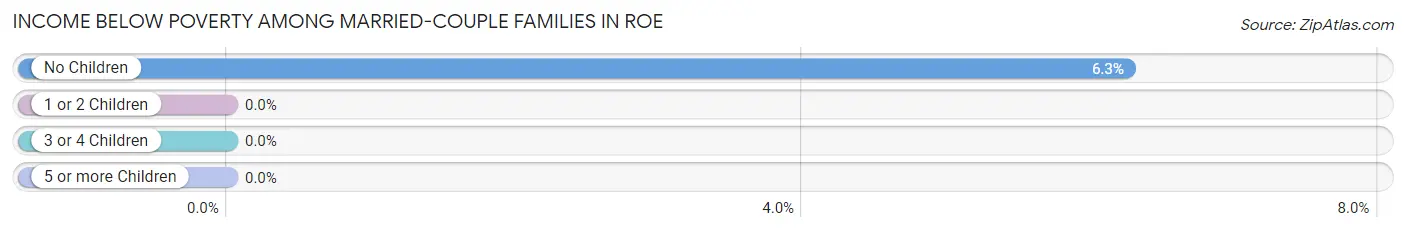
| Children | Above Poverty | Below Poverty |
| No Children | 15 (93.8%) | 1 (6.2%) |
| 1 or 2 Children | 0 (0.0%) | 0 (0.0%) |
| 3 or 4 Children | 3 (100.0%) | 0 (0.0%) |
| 5 or more Children | 0 (0.0%) | 0 (0.0%) |
| Total | 18 (94.7%) | 1 (5.3%) |
Income Below Poverty Among Single-Parent Households in Roe
| Children | Single Father | Single Mother |
| No Children | 0 (0.0%) | 0 (0.0%) |
| 1 or 2 Children | 0 (0.0%) | 0 (0.0%) |
| 3 or 4 Children | 0 (0.0%) | 0 (0.0%) |
| 5 or more Children | 0 (0.0%) | 0 (0.0%) |
| Total | 0 (0.0%) | 0 (0.0%) |
Income Below Poverty Among Married-Couple vs Single-Parent Households in Roe
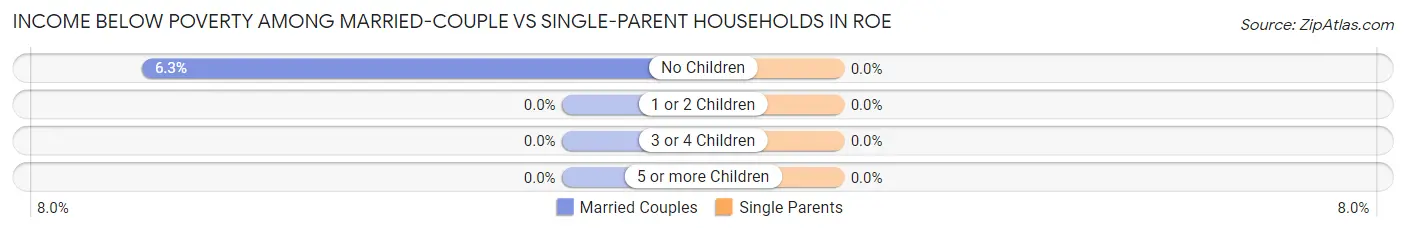
| Children | Married-Couple Families | Single-Parent Households |
| No Children | 1 (6.2%) | 0 (0.0%) |
| 1 or 2 Children | 0 (0.0%) | 0 (0.0%) |
| 3 or 4 Children | 0 (0.0%) | 0 (0.0%) |
| 5 or more Children | 0 (0.0%) | 0 (0.0%) |
| Total | 1 (5.3%) | 0 (0.0%) |
Race in Roe
The most populous races in Roe are White / Caucasian (103 | 74.6%), Two or more Races (23 | 16.7%), and Black / African American (12 | 8.7%).
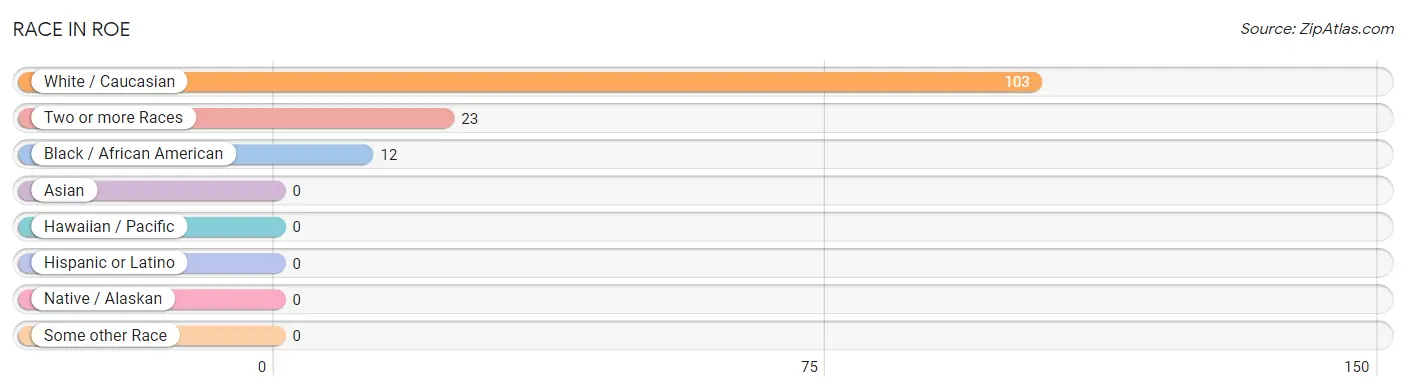
| Race | # Population | % Population |
| Asian | 0 | 0.0% |
| Black / African American | 12 | 8.7% |
| Hawaiian / Pacific | 0 | 0.0% |
| Hispanic or Latino | 0 | 0.0% |
| Native / Alaskan | 0 | 0.0% |
| White / Caucasian | 103 | 74.6% |
| Two or more Races | 23 | 16.7% |
| Some other Race | 0 | 0.0% |
| Total | 138 | 100.0% |
Ancestry in Roe
The most populous ancestries reported in Roe are Irish (33 | 23.9%), German (21 | 15.2%), English (13 | 9.4%), French (13 | 9.4%), and European (2 | 1.5%), together accounting for 59.4% of all Roe residents.
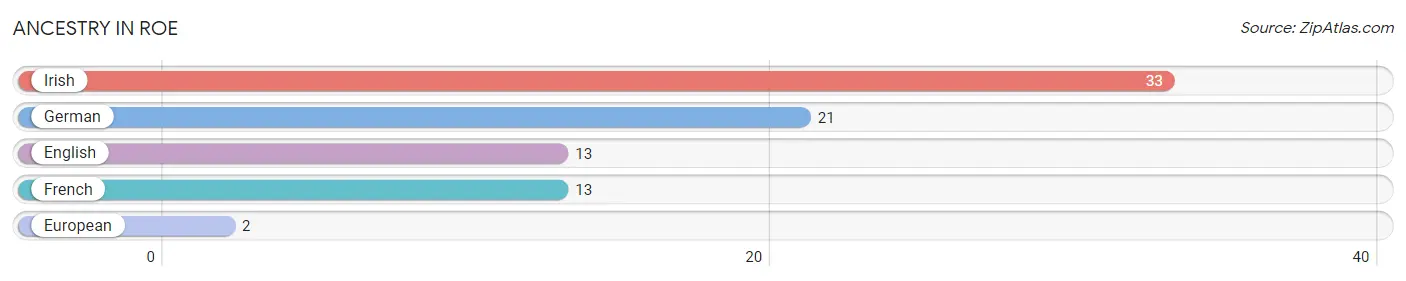
| Ancestry | # Population | % Population |
| English | 13 | 9.4% |
| European | 2 | 1.5% |
| French | 13 | 9.4% |
| German | 21 | 15.2% |
| Irish | 33 | 23.9% | View All 5 Rows |
Immigrants in Roe

| Immigration Origin | # Population | % Population | View All 0 Rows |
Sex and Age in Roe
Sex and Age in Roe
The most populous age groups in Roe are 10 to 14 Years (12 | 19.4%) for men and 5 to 9 Years (25 | 32.9%) for women.
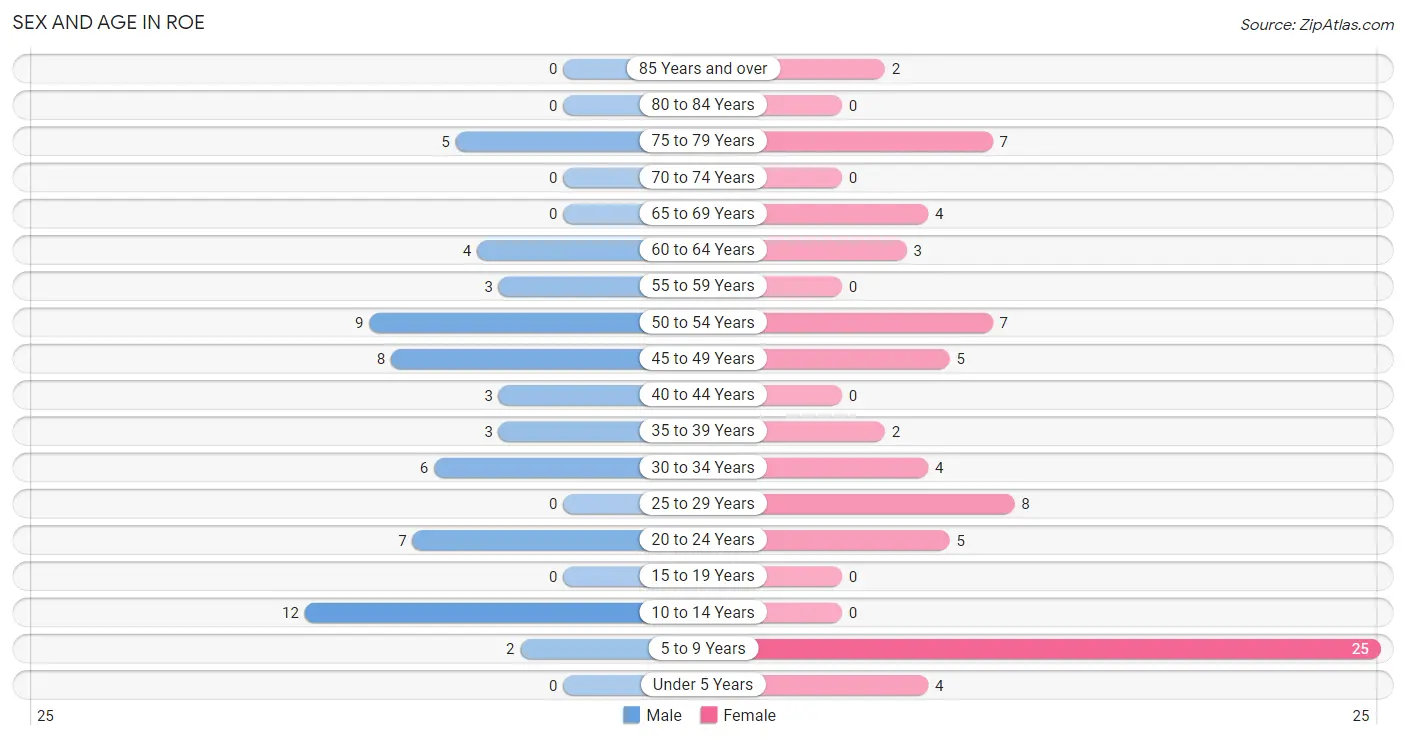
| Age Bracket | Male | Female |
| Under 5 Years | 0 (0.0%) | 4 (5.3%) |
| 5 to 9 Years | 2 (3.2%) | 25 (32.9%) |
| 10 to 14 Years | 12 (19.4%) | 0 (0.0%) |
| 15 to 19 Years | 0 (0.0%) | 0 (0.0%) |
| 20 to 24 Years | 7 (11.3%) | 5 (6.6%) |
| 25 to 29 Years | 0 (0.0%) | 8 (10.5%) |
| 30 to 34 Years | 6 (9.7%) | 4 (5.3%) |
| 35 to 39 Years | 3 (4.8%) | 2 (2.6%) |
| 40 to 44 Years | 3 (4.8%) | 0 (0.0%) |
| 45 to 49 Years | 8 (12.9%) | 5 (6.6%) |
| 50 to 54 Years | 9 (14.5%) | 7 (9.2%) |
| 55 to 59 Years | 3 (4.8%) | 0 (0.0%) |
| 60 to 64 Years | 4 (6.5%) | 3 (4.0%) |
| 65 to 69 Years | 0 (0.0%) | 4 (5.3%) |
| 70 to 74 Years | 0 (0.0%) | 0 (0.0%) |
| 75 to 79 Years | 5 (8.1%) | 7 (9.2%) |
| 80 to 84 Years | 0 (0.0%) | 0 (0.0%) |
| 85 Years and over | 0 (0.0%) | 2 (2.6%) |
| Total | 62 (100.0%) | 76 (100.0%) |
Families and Households in Roe
Median Family Size in Roe
The median family size in Roe is 3.67 persons per family, with single male/father families (7 | 21.2%) accounting for the largest median family size of 5.86 persons per family. On the other hand, single female/mother families (7 | 21.2%) represent the smallest median family size with 2.14 persons per family.
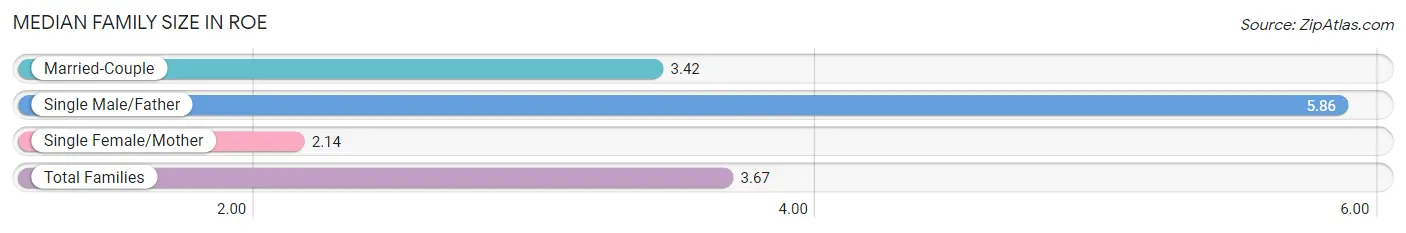
| Family Type | # Families | Family Size |
| Married-Couple | 19 (57.6%) | 3.42 |
| Single Male/Father | 7 (21.2%) | 5.86 |
| Single Female/Mother | 7 (21.2%) | 2.14 |
| Total Families | 33 (100.0%) | 3.67 |
Median Household Size in Roe
The median household size in Roe is 3.07 persons per household, with single male/father households (7 | 15.6%) accounting for the largest median household size of 5.86 persons per household. non-family households (12 | 26.7%) represent the smallest median household size with 1.42 persons per household.
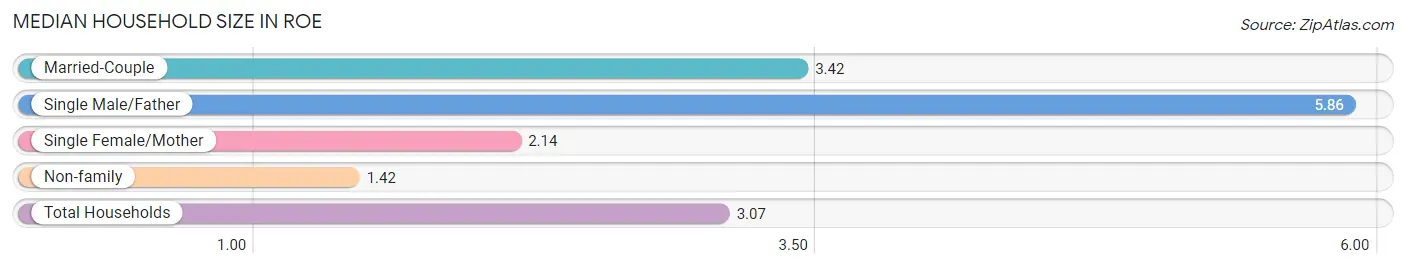
| Household Type | # Households | Household Size |
| Married-Couple | 19 (42.2%) | 3.42 |
| Single Male/Father | 7 (15.6%) | 5.86 |
| Single Female/Mother | 7 (15.6%) | 2.14 |
| Non-family | 12 (26.7%) | 1.42 |
| Total Households | 45 (100.0%) | 3.07 |
Household Size by Marriage Status in Roe
Out of a total of 45 households in Roe, 33 (73.3%) are family households, while 12 (26.7%) are nonfamily households. The most numerous type of family households are 2-person households, comprising 17, and the most common type of nonfamily households are 1-person households, comprising 10.
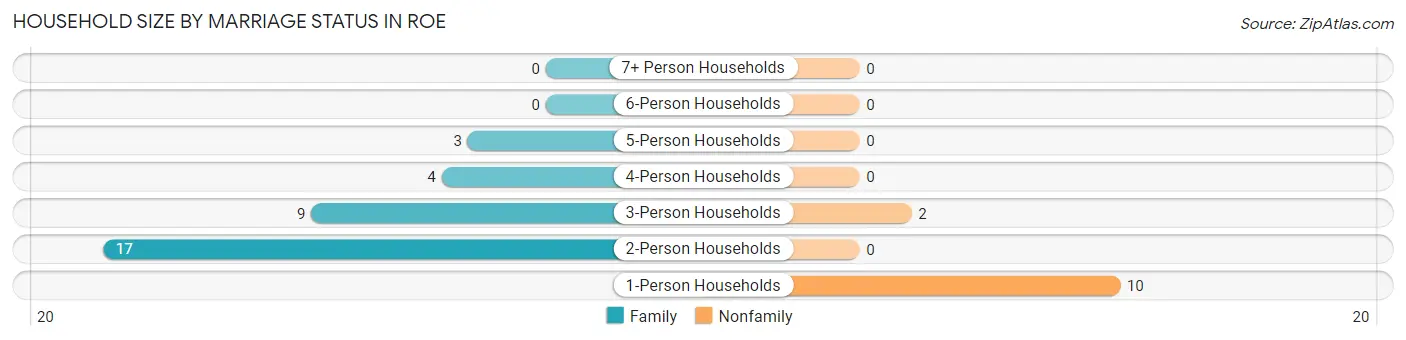
| Household Size | Family Households | Nonfamily Households |
| 1-Person Households | - | 10 (22.2%) |
| 2-Person Households | 17 (37.8%) | 0 (0.0%) |
| 3-Person Households | 9 (20.0%) | 2 (4.4%) |
| 4-Person Households | 4 (8.9%) | 0 (0.0%) |
| 5-Person Households | 3 (6.7%) | 0 (0.0%) |
| 6-Person Households | 0 (0.0%) | 0 (0.0%) |
| 7+ Person Households | 0 (0.0%) | 0 (0.0%) |
| Total | 33 (73.3%) | 12 (26.7%) |
Female Fertility in Roe
Fertility by Age in Roe
| Age Bracket | Women with Births | Births / 1,000 Women |
| 15 to 19 years | 0 (0.0%) | 0.0 |
| 20 to 34 years | 0 (0.0%) | 0.0 |
| 35 to 50 years | 0 (0.0%) | 0.0 |
| Total | 0 (0.0%) | 0.0 |
Fertility by Age by Marriage Status in Roe
| Age Bracket | Married | Unmarried |
| 15 to 19 years | 0 (0.0%) | 0 (0.0%) |
| 20 to 34 years | 0 (0.0%) | 0 (0.0%) |
| 35 to 50 years | 0 (0.0%) | 0 (0.0%) |
| Total | 0 (0.0%) | 0 (0.0%) |
Fertility by Education in Roe
| Educational Attainment | Women with Births | Births / 1,000 Women |
| Less than High School | 0 (0.0%) | 0.0 |
| High School Diploma | 0 (0.0%) | 0.0 |
| College or Associate's Degree | 0 (0.0%) | 0.0 |
| Bachelor's Degree | 0 (0.0%) | 0.0 |
| Graduate Degree | 0 (0.0%) | 0.0 |
| Total | 0 (0.0%) | 0.0 |
Fertility by Education by Marriage Status in Roe
| Educational Attainment | Married | Unmarried |
| Less than High School | 0 (0.0%) | 0 (0.0%) |
| High School Diploma | 0 (0.0%) | 0 (0.0%) |
| College or Associate's Degree | 0 (0.0%) | 0 (0.0%) |
| Bachelor's Degree | 0 (0.0%) | 0 (0.0%) |
| Graduate Degree | 0 (0.0%) | 0 (0.0%) |
| Total | 0 (0.0%) | 0 (0.0%) |
Employment Characteristics in Roe
Employment by Class of Employer in Roe
Among the 39 employed individuals in Roe, private company employees (29 | 74.4%), state government employees (5 | 12.8%), and self-employed (not incorporated) (4 | 10.3%) make up the most common classes of employment.
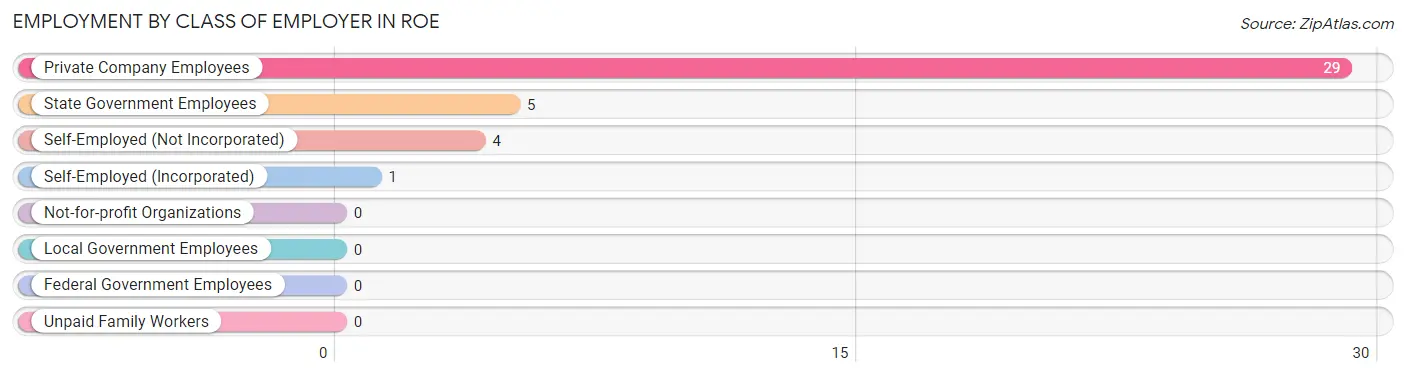
| Employer Class | # Employees | % Employees |
| Private Company Employees | 29 | 74.4% |
| Self-Employed (Incorporated) | 1 | 2.6% |
| Self-Employed (Not Incorporated) | 4 | 10.3% |
| Not-for-profit Organizations | 0 | 0.0% |
| Local Government Employees | 0 | 0.0% |
| State Government Employees | 5 | 12.8% |
| Federal Government Employees | 0 | 0.0% |
| Unpaid Family Workers | 0 | 0.0% |
| Total | 39 | 100.0% |
Employment Status by Age in Roe
According to the labor force statistics for Roe, out of the total population over 16 years of age (95), 57.9% or 55 individuals are in the labor force, with 14.5% or 8 of them unemployed. The age group with the highest labor force participation rate is 25 to 29 years, with 100.0% or 8 individuals in the labor force. Within the labor force, the 30 to 34 years age range has the highest percentage of unemployed individuals, with 42.9% or 3 of them being unemployed.
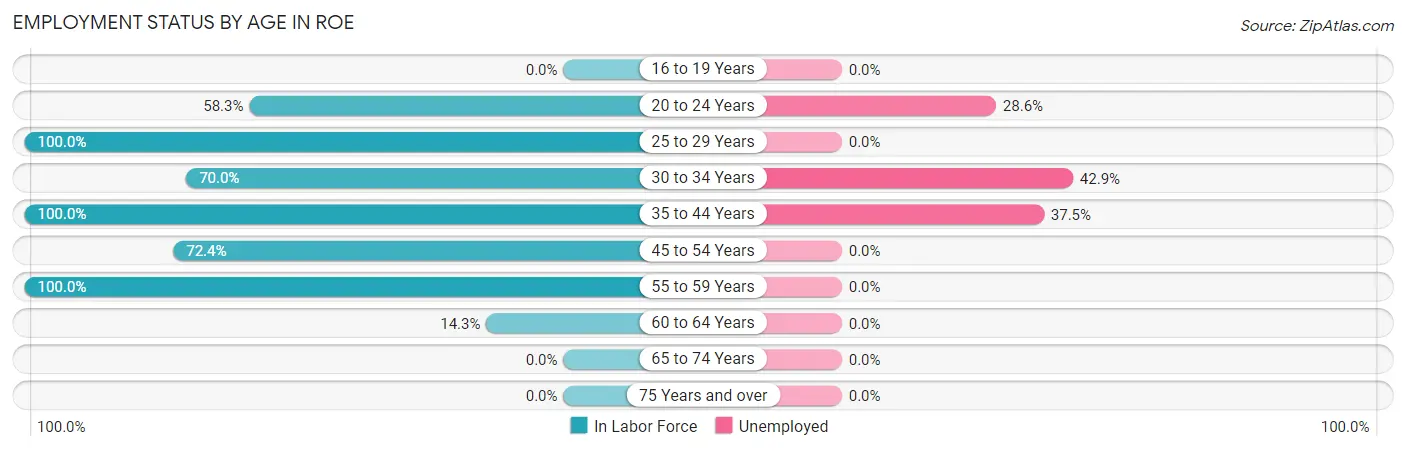
| Age Bracket | In Labor Force | Unemployed |
| 16 to 19 Years | 0 (0.0%) | 0 (0.0%) |
| 20 to 24 Years | 7 (58.3%) | 2 (28.6%) |
| 25 to 29 Years | 8 (100.0%) | 0 (0.0%) |
| 30 to 34 Years | 7 (70.0%) | 3 (42.9%) |
| 35 to 44 Years | 8 (100.0%) | 3 (37.5%) |
| 45 to 54 Years | 21 (72.4%) | 0 (0.0%) |
| 55 to 59 Years | 3 (100.0%) | 0 (0.0%) |
| 60 to 64 Years | 1 (14.3%) | 0 (0.0%) |
| 65 to 74 Years | 0 (0.0%) | 0 (0.0%) |
| 75 Years and over | 0 (0.0%) | 0 (0.0%) |
| Total | 55 (57.9%) | 8 (14.5%) |
Employment Status by Educational Attainment in Roe
According to labor force statistics for Roe, 73.8% of individuals (48) out of the total population between 25 and 64 years of age (65) are in the labor force, with 12.5% or 6 of them being unemployed. The group with the highest labor force participation rate are those with the educational attainment of college / associate degree, with 84.2% or 16 individuals in the labor force. Within the labor force, individuals with high school diploma education have the highest percentage of unemployment, with 37.5% or 6 of them being unemployed.
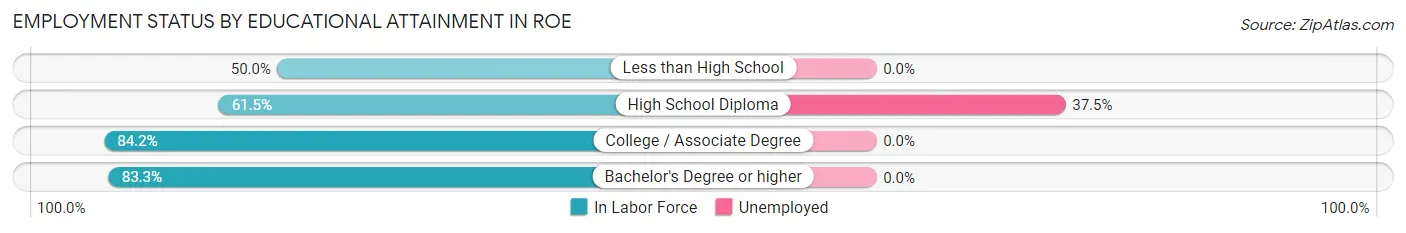
| Educational Attainment | In Labor Force | Unemployed |
| Less than High School | 1 (50.0%) | 0 (0.0%) |
| High School Diploma | 16 (61.5%) | 10 (37.5%) |
| College / Associate Degree | 16 (84.2%) | 0 (0.0%) |
| Bachelor's Degree or higher | 15 (83.3%) | 0 (0.0%) |
| Total | 48 (73.8%) | 8 (12.5%) |
Employment Occupations by Sex in Roe
Management, Business, Science and Arts Occupations
The most common Management, Business, Science and Arts occupations in Roe are Computers, Engineering & Science (8 | 17.0%), Computers & Mathematics (8 | 17.0%), Community & Social Service (5 | 10.6%), Education Instruction & Library (5 | 10.6%), and Management (4 | 8.5%).
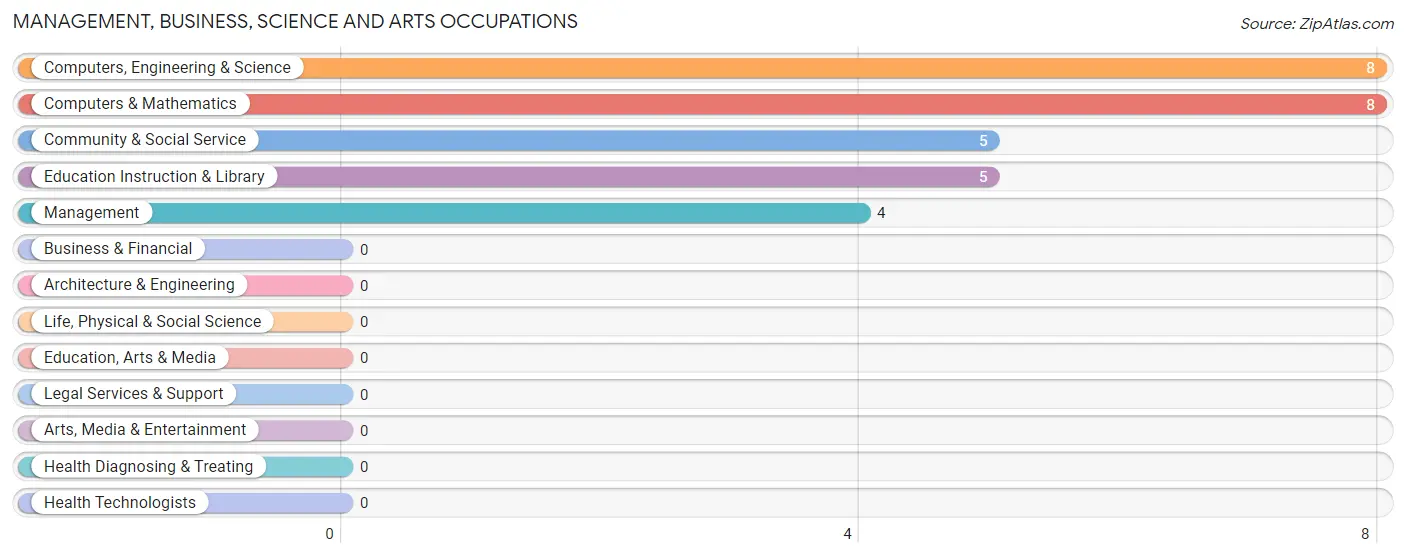
Management, Business, Science and Arts Occupations by Sex
Within the Management, Business, Science and Arts occupations in Roe, the most male-oriented occupations are Management (100.0%), Computers, Engineering & Science (100.0%), and Computers & Mathematics (100.0%), while the most female-oriented occupations are Community & Social Service (100.0%), and Education Instruction & Library (100.0%).
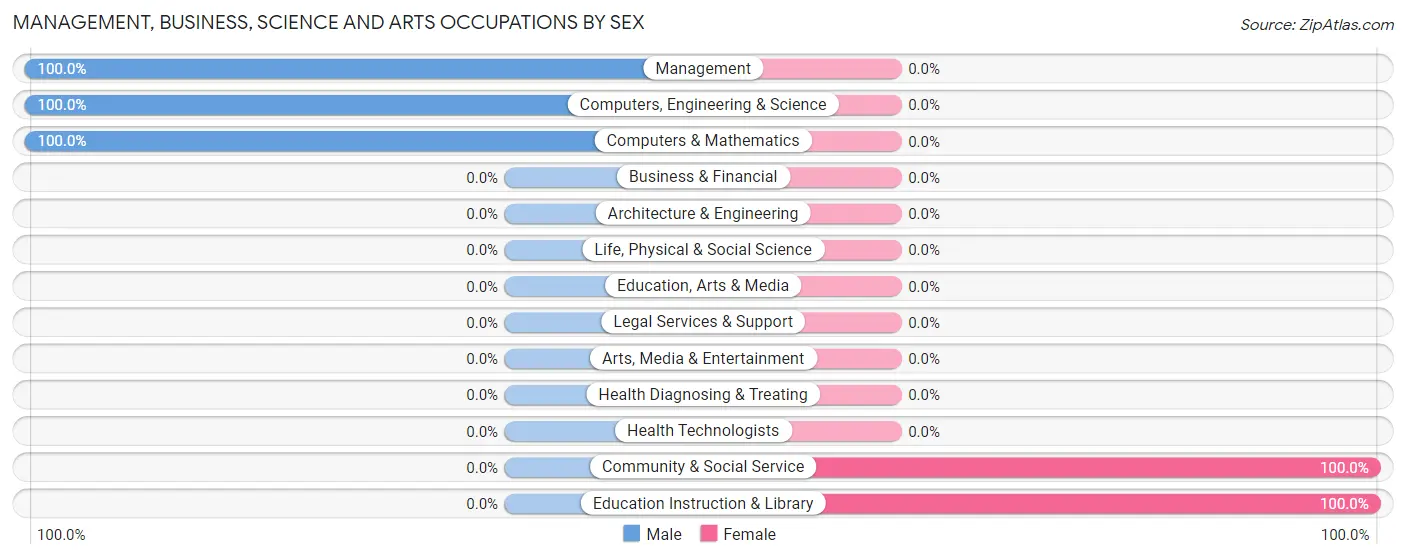
| Occupation | Male | Female |
| Management | 4 (100.0%) | 0 (0.0%) |
| Business & Financial | 0 (0.0%) | 0 (0.0%) |
| Computers, Engineering & Science | 8 (100.0%) | 0 (0.0%) |
| Computers & Mathematics | 8 (100.0%) | 0 (0.0%) |
| Architecture & Engineering | 0 (0.0%) | 0 (0.0%) |
| Life, Physical & Social Science | 0 (0.0%) | 0 (0.0%) |
| Community & Social Service | 0 (0.0%) | 5 (100.0%) |
| Education, Arts & Media | 0 (0.0%) | 0 (0.0%) |
| Legal Services & Support | 0 (0.0%) | 0 (0.0%) |
| Education Instruction & Library | 0 (0.0%) | 5 (100.0%) |
| Arts, Media & Entertainment | 0 (0.0%) | 0 (0.0%) |
| Health Diagnosing & Treating | 0 (0.0%) | 0 (0.0%) |
| Health Technologists | 0 (0.0%) | 0 (0.0%) |
| Total (Category) | 12 (70.6%) | 5 (29.4%) |
| Total (Overall) | 23 (48.9%) | 24 (51.1%) |
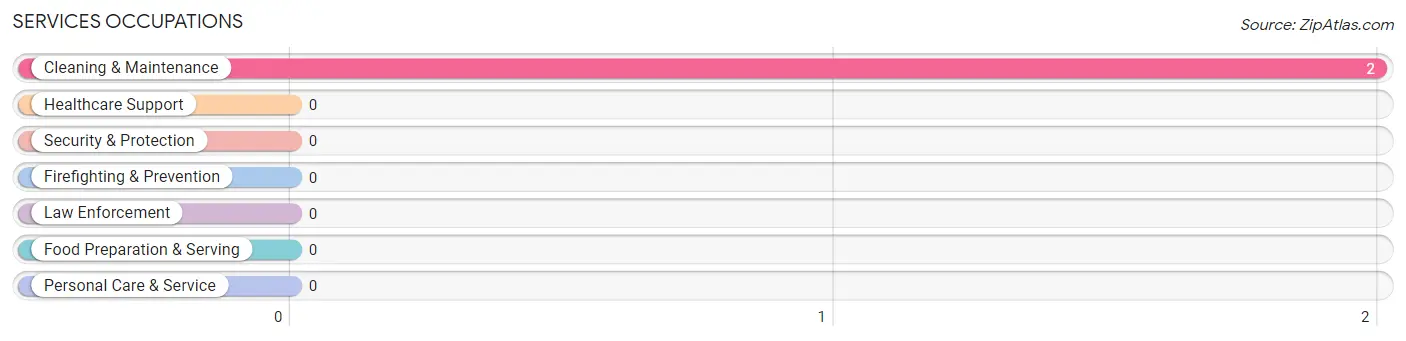
Services Occupations
The most common Services occupations in Roe are , and Cleaning & Maintenance (2 | 4.3%).
Services Occupations by Sex
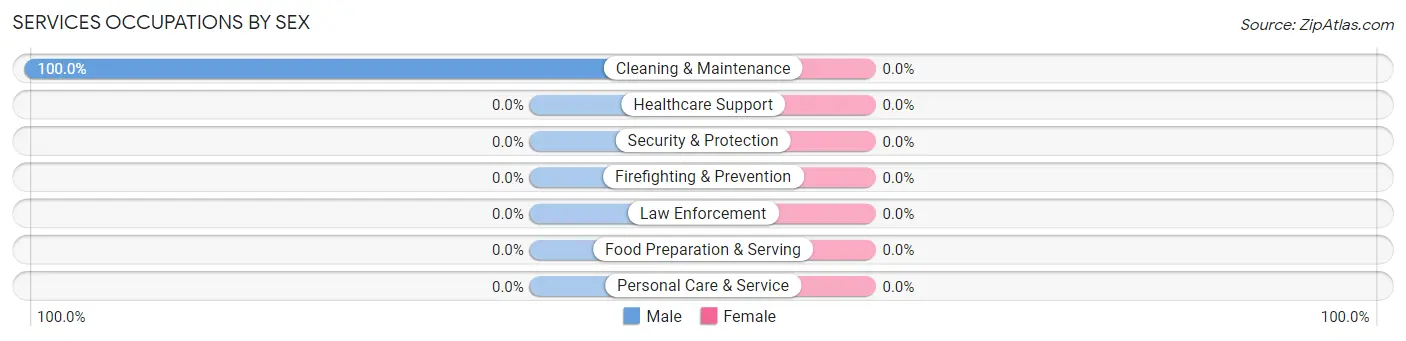
| Occupation | Male | Female |
| Healthcare Support | 0 (0.0%) | 0 (0.0%) |
| Security & Protection | 0 (0.0%) | 0 (0.0%) |
| Firefighting & Prevention | 0 (0.0%) | 0 (0.0%) |
| Law Enforcement | 0 (0.0%) | 0 (0.0%) |
| Food Preparation & Serving | 0 (0.0%) | 0 (0.0%) |
| Cleaning & Maintenance | 2 (100.0%) | 0 (0.0%) |
| Personal Care & Service | 0 (0.0%) | 0 (0.0%) |
| Total (Category) | 2 (100.0%) | 0 (0.0%) |
| Total (Overall) | 23 (48.9%) | 24 (51.1%) |
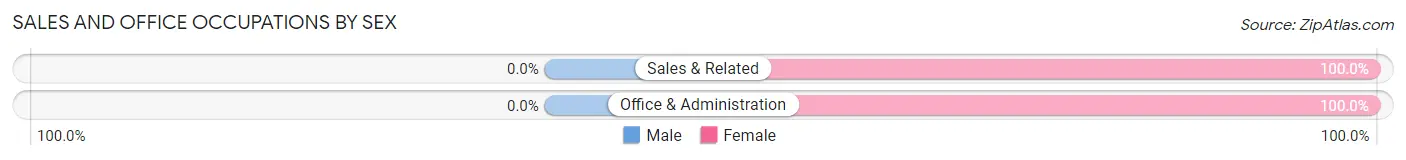
Sales and Office Occupations
The most common Sales and Office occupations in Roe are Sales & Related (13 | 27.7%), and Office & Administration (4 | 8.5%).

Sales and Office Occupations by Sex
| Occupation | Male | Female |
| Sales & Related | 0 (0.0%) | 13 (100.0%) |
| Office & Administration | 0 (0.0%) | 4 (100.0%) |
| Total (Category) | 0 (0.0%) | 17 (100.0%) |
| Total (Overall) | 23 (48.9%) | 24 (51.1%) |
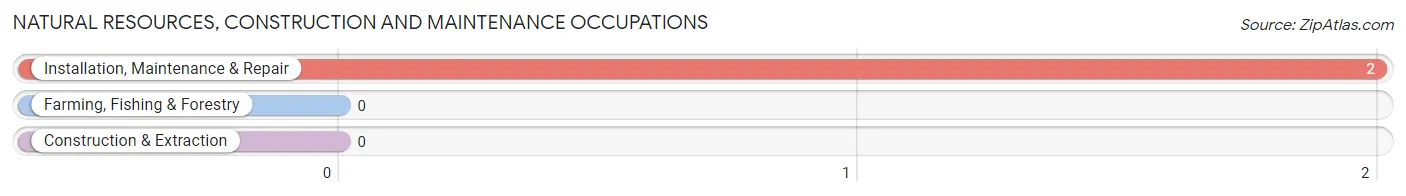
Natural Resources, Construction and Maintenance Occupations
The most common Natural Resources, Construction and Maintenance occupations in Roe are , and Installation, Maintenance & Repair (2 | 4.3%).
Natural Resources, Construction and Maintenance Occupations by Sex
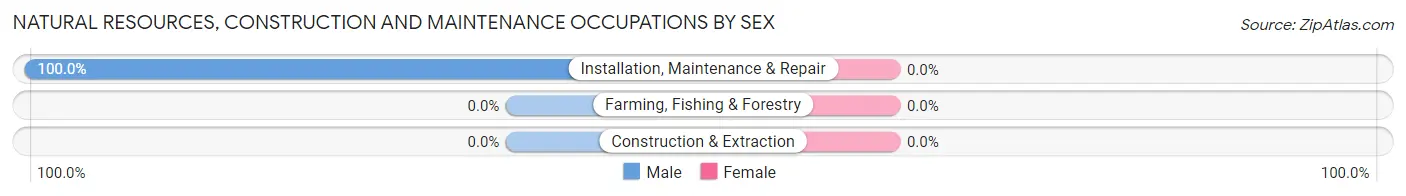
| Occupation | Male | Female |
| Farming, Fishing & Forestry | 0 (0.0%) | 0 (0.0%) |
| Construction & Extraction | 0 (0.0%) | 0 (0.0%) |
| Installation, Maintenance & Repair | 2 (100.0%) | 0 (0.0%) |
| Total (Category) | 2 (100.0%) | 0 (0.0%) |
| Total (Overall) | 23 (48.9%) | 24 (51.1%) |
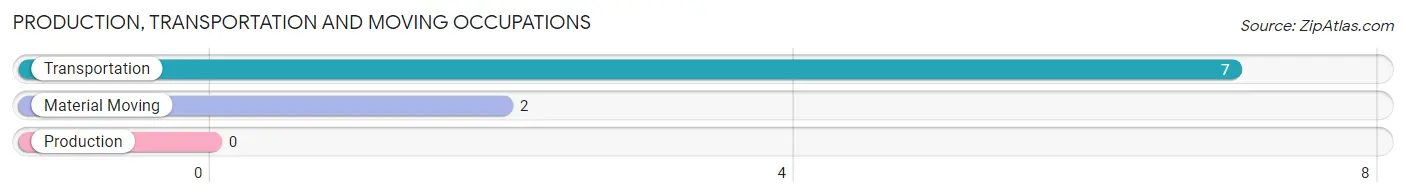
Production, Transportation and Moving Occupations
The most common Production, Transportation and Moving occupations in Roe are Transportation (7 | 14.9%), and Material Moving (2 | 4.3%).
Production, Transportation and Moving Occupations by Sex
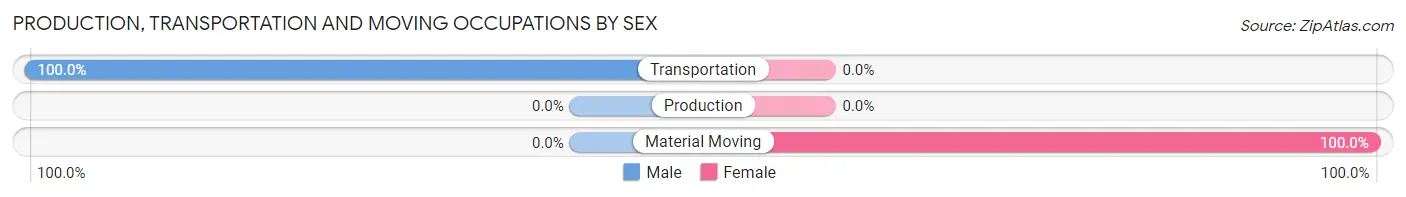
| Occupation | Male | Female |
| Production | 0 (0.0%) | 0 (0.0%) |
| Transportation | 7 (100.0%) | 0 (0.0%) |
| Material Moving | 0 (0.0%) | 2 (100.0%) |
| Total (Category) | 7 (77.8%) | 2 (22.2%) |
| Total (Overall) | 23 (48.9%) | 24 (51.1%) |
Employment Industries by Sex in Roe
Employment Industries in Roe
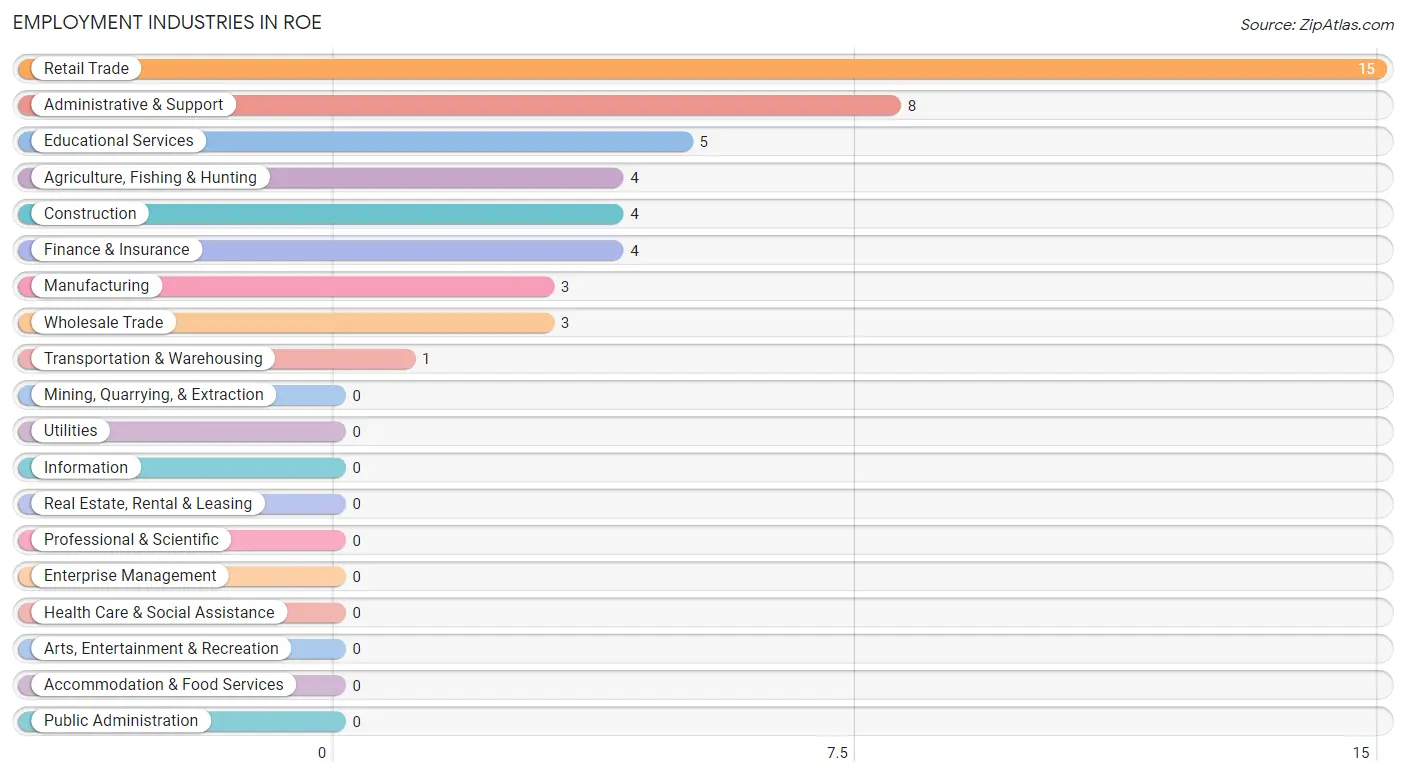
The major employment industries in Roe include Retail Trade (15 | 31.9%), Administrative & Support (8 | 17.0%), Educational Services (5 | 10.6%), Agriculture, Fishing & Hunting (4 | 8.5%), and Construction (4 | 8.5%).
Employment Industries by Sex in Roe
The Roe industries that see more men than women are Agriculture, Fishing & Hunting (100.0%), Construction (100.0%), and Manufacturing (100.0%), whereas the industries that tend to have a higher number of women are Retail Trade (100.0%), Finance & Insurance (100.0%), and Educational Services (100.0%).
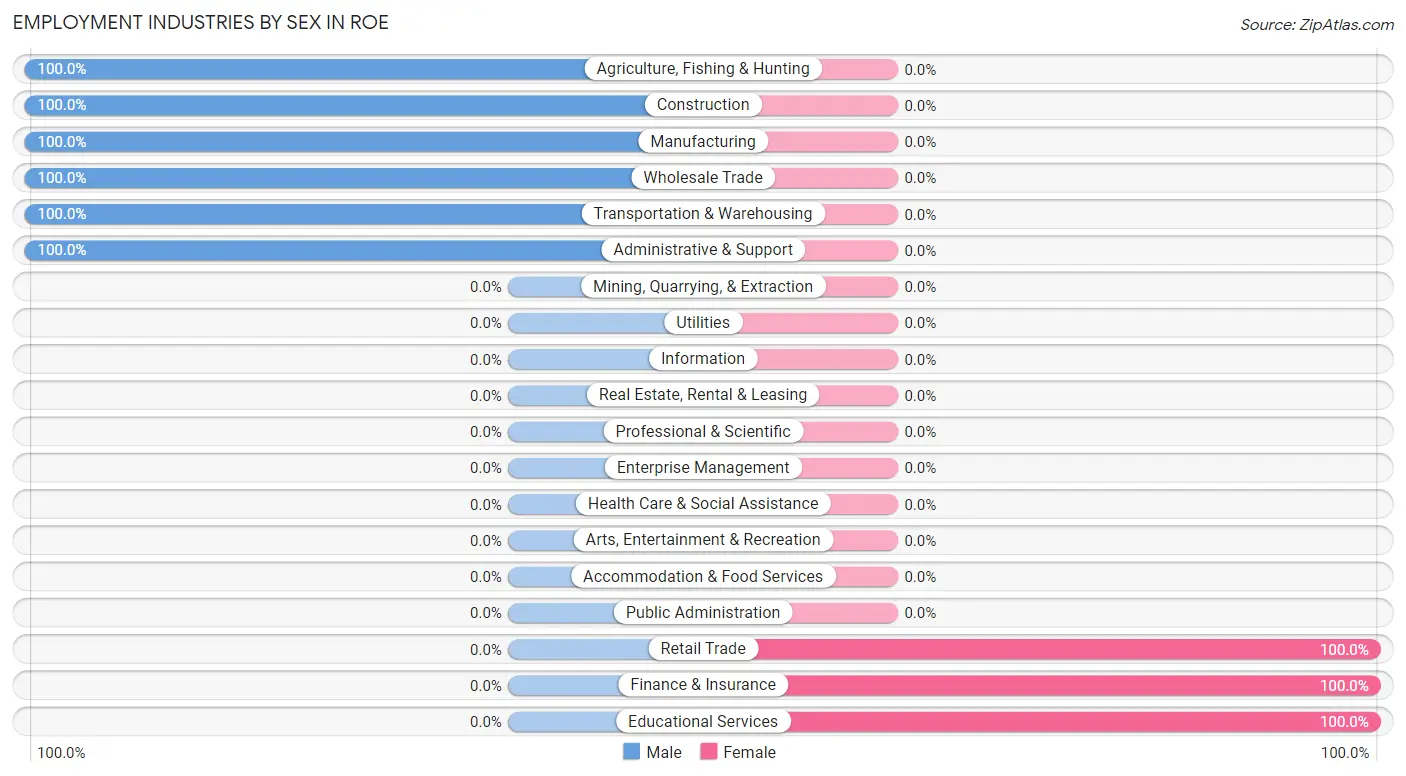
| Industry | Male | Female |
| Agriculture, Fishing & Hunting | 4 (100.0%) | 0 (0.0%) |
| Mining, Quarrying, & Extraction | 0 (0.0%) | 0 (0.0%) |
| Construction | 4 (100.0%) | 0 (0.0%) |
| Manufacturing | 3 (100.0%) | 0 (0.0%) |
| Wholesale Trade | 3 (100.0%) | 0 (0.0%) |
| Retail Trade | 0 (0.0%) | 15 (100.0%) |
| Transportation & Warehousing | 1 (100.0%) | 0 (0.0%) |
| Utilities | 0 (0.0%) | 0 (0.0%) |
| Information | 0 (0.0%) | 0 (0.0%) |
| Finance & Insurance | 0 (0.0%) | 4 (100.0%) |
| Real Estate, Rental & Leasing | 0 (0.0%) | 0 (0.0%) |
| Professional & Scientific | 0 (0.0%) | 0 (0.0%) |
| Enterprise Management | 0 (0.0%) | 0 (0.0%) |
| Administrative & Support | 8 (100.0%) | 0 (0.0%) |
| Educational Services | 0 (0.0%) | 5 (100.0%) |
| Health Care & Social Assistance | 0 (0.0%) | 0 (0.0%) |
| Arts, Entertainment & Recreation | 0 (0.0%) | 0 (0.0%) |
| Accommodation & Food Services | 0 (0.0%) | 0 (0.0%) |
| Public Administration | 0 (0.0%) | 0 (0.0%) |
| Total | 23 (48.9%) | 24 (51.1%) |
Education in Roe
School Enrollment in Roe
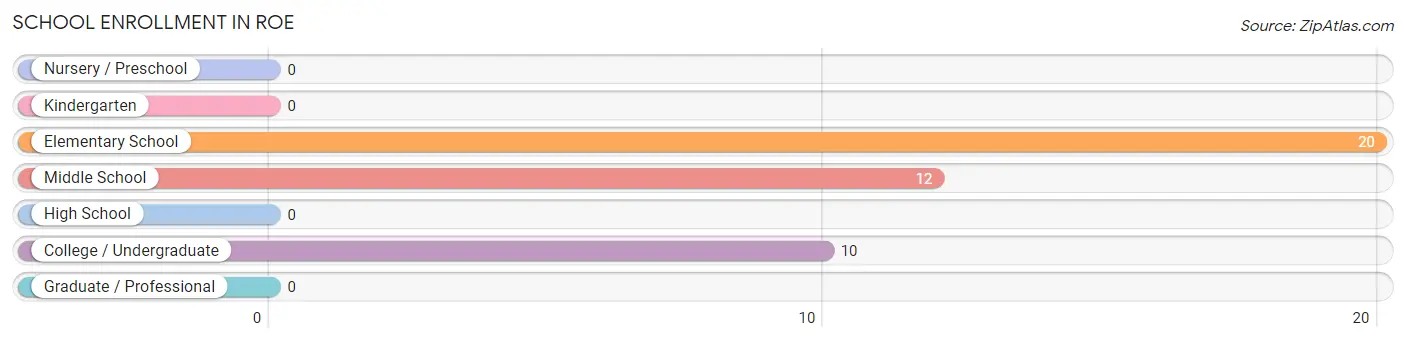
The most common levels of schooling among the 42 students in Roe are elementary school (20 | 47.6%), middle school (12 | 28.6%), and college / undergraduate (10 | 23.8%).
| School Level | # Students | % Students |
| Nursery / Preschool | 0 | 0.0% |
| Kindergarten | 0 | 0.0% |
| Elementary School | 20 | 47.6% |
| Middle School | 12 | 28.6% |
| High School | 0 | 0.0% |
| College / Undergraduate | 10 | 23.8% |
| Graduate / Professional | 0 | 0.0% |
| Total | 42 | 100.0% |
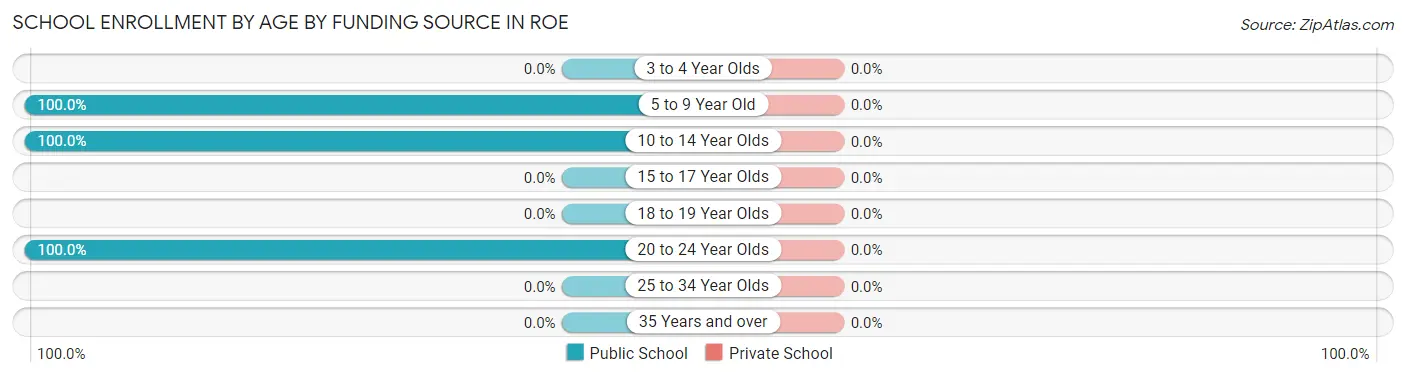
School Enrollment by Age by Funding Source in Roe
| Age Bracket | Public School | Private School |
| 3 to 4 Year Olds | 0 (0.0%) | 0 (0.0%) |
| 5 to 9 Year Old | 20 (100.0%) | 0 (0.0%) |
| 10 to 14 Year Olds | 12 (100.0%) | 0 (0.0%) |
| 15 to 17 Year Olds | 0 (0.0%) | 0 (0.0%) |
| 18 to 19 Year Olds | 0 (0.0%) | 0 (0.0%) |
| 20 to 24 Year Olds | 10 (100.0%) | 0 (0.0%) |
| 25 to 34 Year Olds | 0 (0.0%) | 0 (0.0%) |
| 35 Years and over | 0 (0.0%) | 0 (0.0%) |
| Total | 42 (100.0%) | 0 (0.0%) |
Educational Attainment by Field of Study in Roe
Computers & mathematics (8 | 32.0%), literature & languages (7 | 28.0%), education (5 | 20.0%), and arts & humanities (5 | 20.0%) are the most common fields of study among 25 individuals in Roe who have obtained a bachelor's degree or higher.
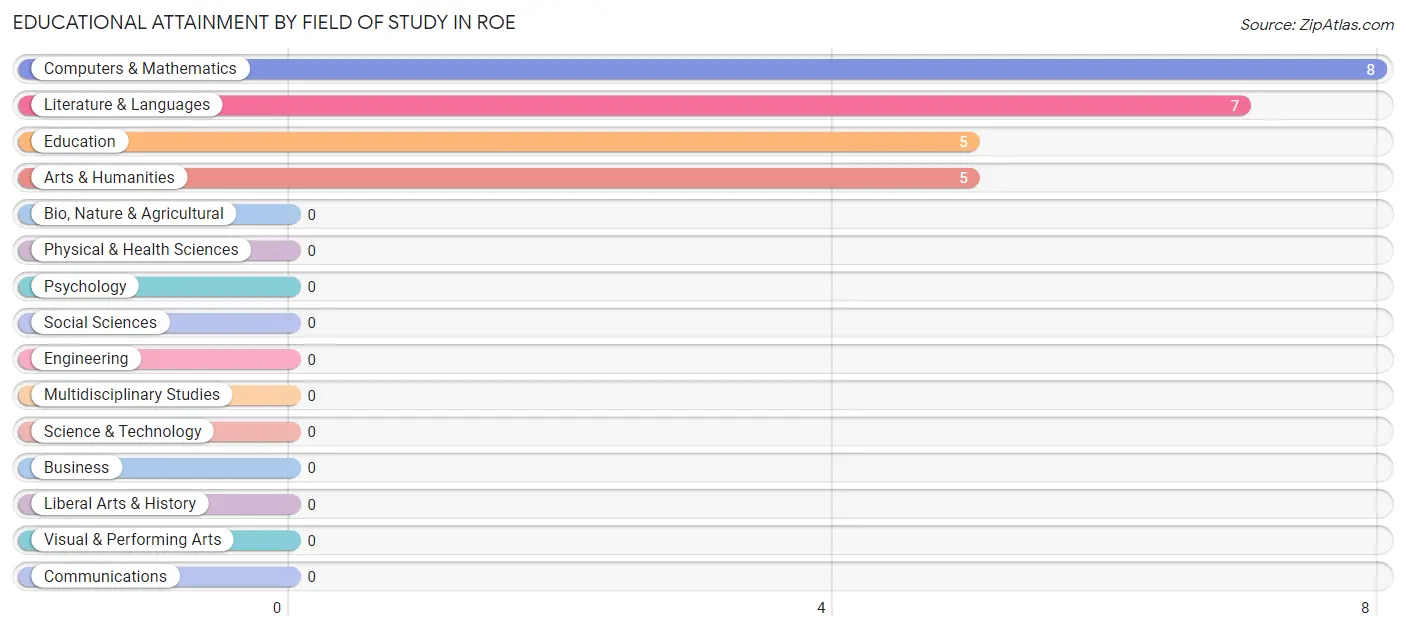
| Field of Study | # Graduates | % Graduates |
| Computers & Mathematics | 8 | 32.0% |
| Bio, Nature & Agricultural | 0 | 0.0% |
| Physical & Health Sciences | 0 | 0.0% |
| Psychology | 0 | 0.0% |
| Social Sciences | 0 | 0.0% |
| Engineering | 0 | 0.0% |
| Multidisciplinary Studies | 0 | 0.0% |
| Science & Technology | 0 | 0.0% |
| Business | 0 | 0.0% |
| Education | 5 | 20.0% |
| Literature & Languages | 7 | 28.0% |
| Liberal Arts & History | 0 | 0.0% |
| Visual & Performing Arts | 0 | 0.0% |
| Communications | 0 | 0.0% |
| Arts & Humanities | 5 | 20.0% |
| Total | 25 | 100.0% |
Transportation & Commute in Roe
Vehicle Availability by Sex in Roe
The most prevalent vehicle ownership categories in Roe are males with 3 vehicles (11, accounting for 47.8%) and females with 3 vehicles (7, making up 68.8%).
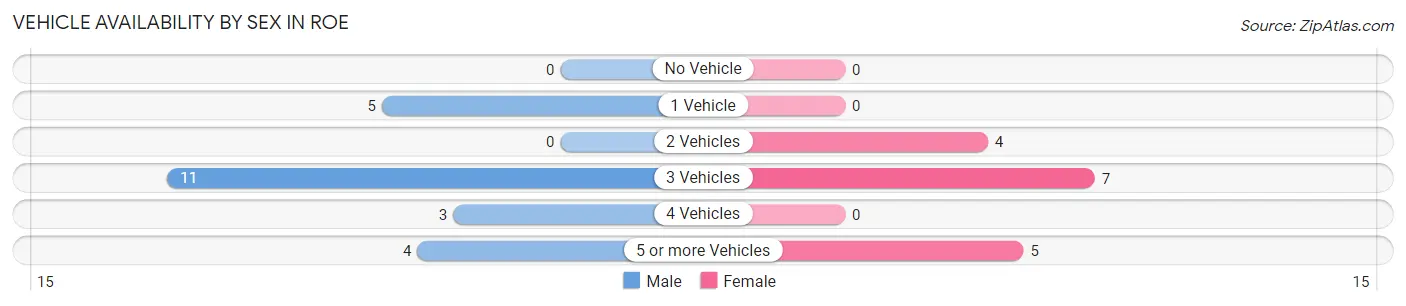
| Vehicles Available | Male | Female |
| No Vehicle | 0 (0.0%) | 0 (0.0%) |
| 1 Vehicle | 5 (21.7%) | 0 (0.0%) |
| 2 Vehicles | 0 (0.0%) | 4 (25.0%) |
| 3 Vehicles | 11 (47.8%) | 7 (43.8%) |
| 4 Vehicles | 3 (13.0%) | 0 (0.0%) |
| 5 or more Vehicles | 4 (17.4%) | 5 (31.2%) |
| Total | 23 (100.0%) | 16 (100.0%) |
Commute Time in Roe
The most frequently occuring commute durations in Roe are 20 to 24 minutes (8 commuters, 25.8%), 15 to 19 minutes (7 commuters, 22.6%), and 90 or more minutes (6 commuters, 19.4%).
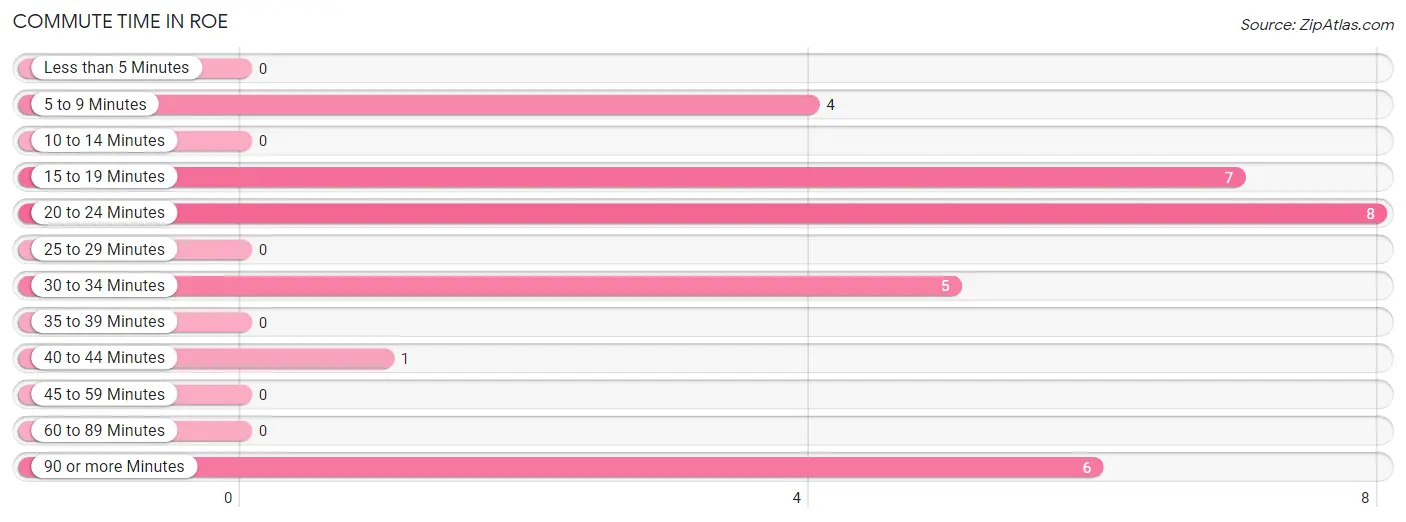
| Commute Time | # Commuters | % Commuters |
| Less than 5 Minutes | 0 | 0.0% |
| 5 to 9 Minutes | 4 | 12.9% |
| 10 to 14 Minutes | 0 | 0.0% |
| 15 to 19 Minutes | 7 | 22.6% |
| 20 to 24 Minutes | 8 | 25.8% |
| 25 to 29 Minutes | 0 | 0.0% |
| 30 to 34 Minutes | 5 | 16.1% |
| 35 to 39 Minutes | 0 | 0.0% |
| 40 to 44 Minutes | 1 | 3.2% |
| 45 to 59 Minutes | 0 | 0.0% |
| 60 to 89 Minutes | 0 | 0.0% |
| 90 or more Minutes | 6 | 19.4% |
Commute Time by Sex in Roe
The most common commute times in Roe are 5 to 9 minutes (4 commuters, 26.7%) for males and 20 to 24 minutes (5 commuters, 31.2%) for females.
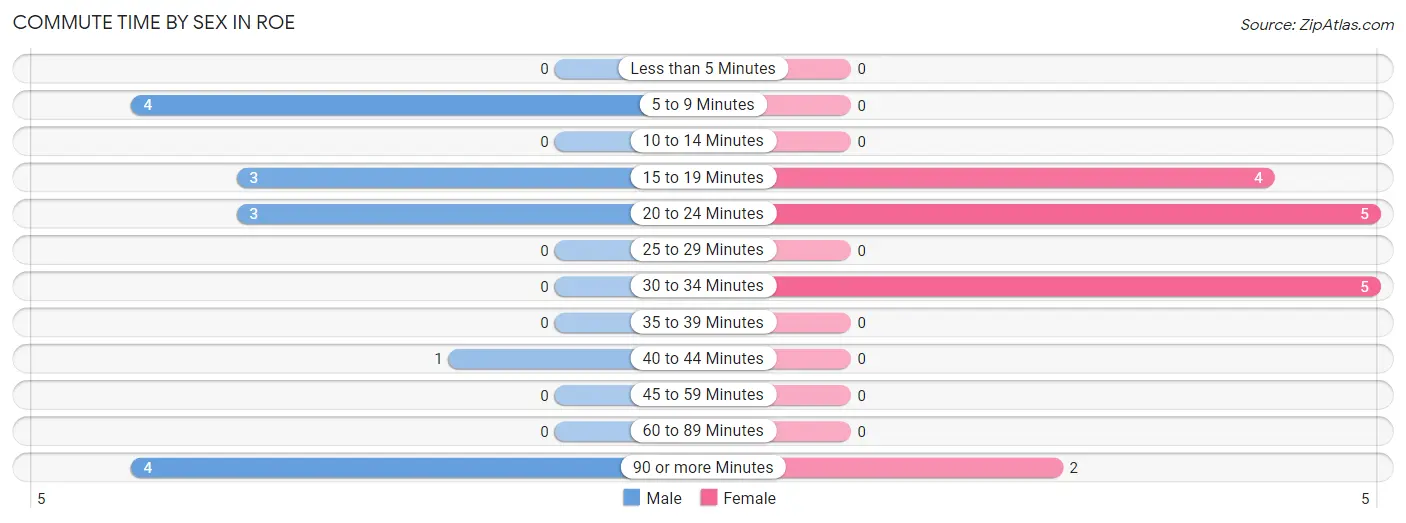
| Commute Time | Male | Female |
| Less than 5 Minutes | 0 (0.0%) | 0 (0.0%) |
| 5 to 9 Minutes | 4 (26.7%) | 0 (0.0%) |
| 10 to 14 Minutes | 0 (0.0%) | 0 (0.0%) |
| 15 to 19 Minutes | 3 (20.0%) | 4 (25.0%) |
| 20 to 24 Minutes | 3 (20.0%) | 5 (31.2%) |
| 25 to 29 Minutes | 0 (0.0%) | 0 (0.0%) |
| 30 to 34 Minutes | 0 (0.0%) | 5 (31.2%) |
| 35 to 39 Minutes | 0 (0.0%) | 0 (0.0%) |
| 40 to 44 Minutes | 1 (6.7%) | 0 (0.0%) |
| 45 to 59 Minutes | 0 (0.0%) | 0 (0.0%) |
| 60 to 89 Minutes | 0 (0.0%) | 0 (0.0%) |
| 90 or more Minutes | 4 (26.7%) | 2 (12.5%) |
Time of Departure to Work by Sex in Roe
The most frequent times of departure to work in Roe are 6:00 AM to 6:29 AM (5, 33.3%) for males and 7:00 AM to 7:29 AM (9, 56.2%) for females.
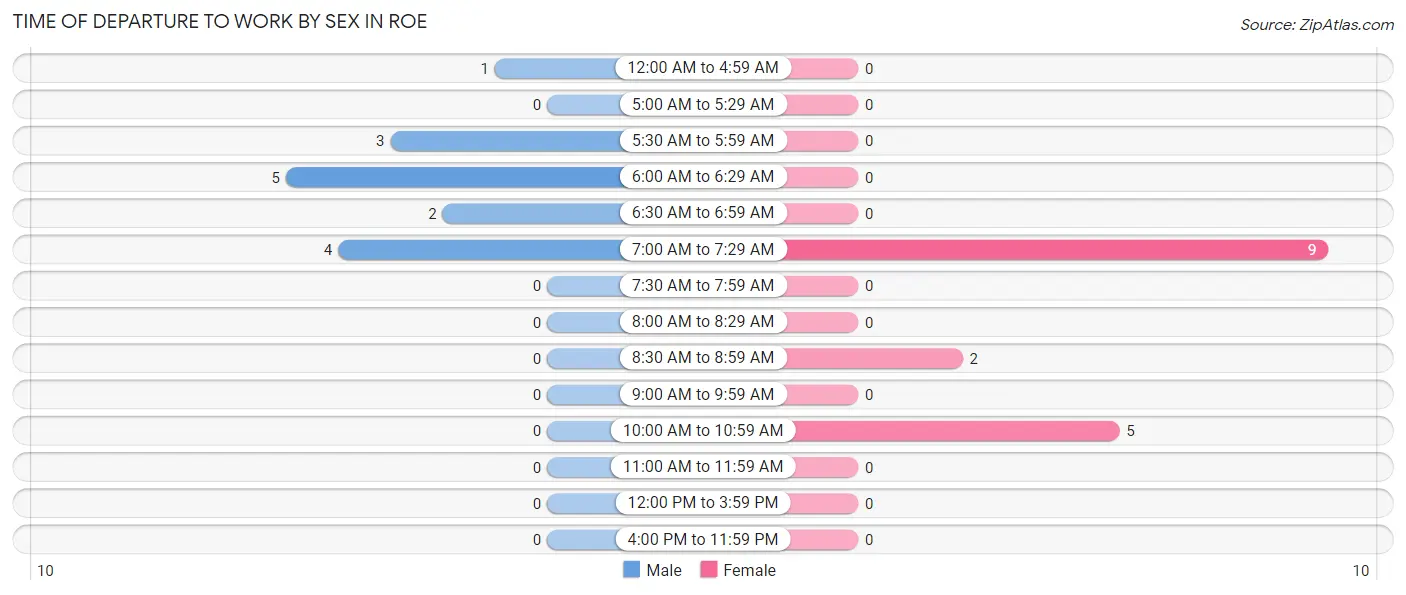
| Time of Departure | Male | Female |
| 12:00 AM to 4:59 AM | 1 (6.7%) | 0 (0.0%) |
| 5:00 AM to 5:29 AM | 0 (0.0%) | 0 (0.0%) |
| 5:30 AM to 5:59 AM | 3 (20.0%) | 0 (0.0%) |
| 6:00 AM to 6:29 AM | 5 (33.3%) | 0 (0.0%) |
| 6:30 AM to 6:59 AM | 2 (13.3%) | 0 (0.0%) |
| 7:00 AM to 7:29 AM | 4 (26.7%) | 9 (56.2%) |
| 7:30 AM to 7:59 AM | 0 (0.0%) | 0 (0.0%) |
| 8:00 AM to 8:29 AM | 0 (0.0%) | 0 (0.0%) |
| 8:30 AM to 8:59 AM | 0 (0.0%) | 2 (12.5%) |
| 9:00 AM to 9:59 AM | 0 (0.0%) | 0 (0.0%) |
| 10:00 AM to 10:59 AM | 0 (0.0%) | 5 (31.2%) |
| 11:00 AM to 11:59 AM | 0 (0.0%) | 0 (0.0%) |
| 12:00 PM to 3:59 PM | 0 (0.0%) | 0 (0.0%) |
| 4:00 PM to 11:59 PM | 0 (0.0%) | 0 (0.0%) |
| Total | 15 (100.0%) | 16 (100.0%) |
Housing Occupancy in Roe
Occupancy by Ownership in Roe
Of the total 45 dwellings in Roe, owner-occupied units account for 44 (97.8%), while renter-occupied units make up 1 (2.2%).
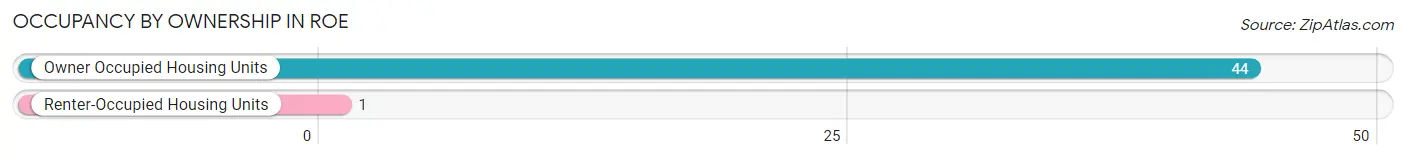
| Occupancy | # Housing Units | % Housing Units |
| Owner Occupied Housing Units | 44 | 97.8% |
| Renter-Occupied Housing Units | 1 | 2.2% |
| Total Occupied Housing Units | 45 | 100.0% |
Occupancy by Household Size in Roe
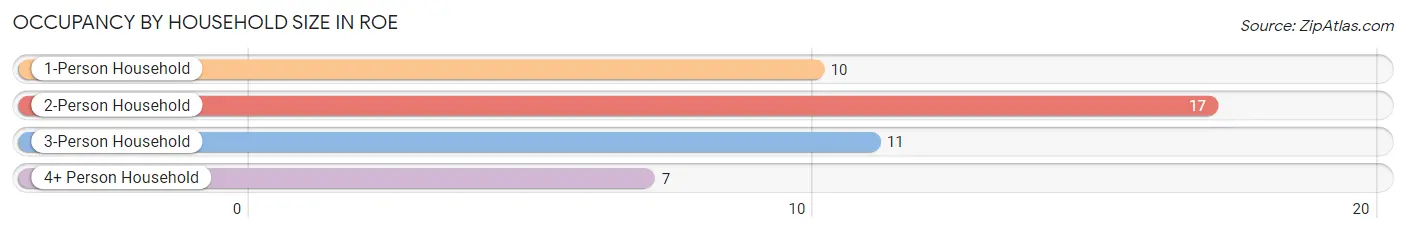
| Household Size | # Housing Units | % Housing Units |
| 1-Person Household | 10 | 22.2% |
| 2-Person Household | 17 | 37.8% |
| 3-Person Household | 11 | 24.4% |
| 4+ Person Household | 7 | 15.6% |
| Total Housing Units | 45 | 100.0% |
Occupancy by Ownership by Household Size in Roe
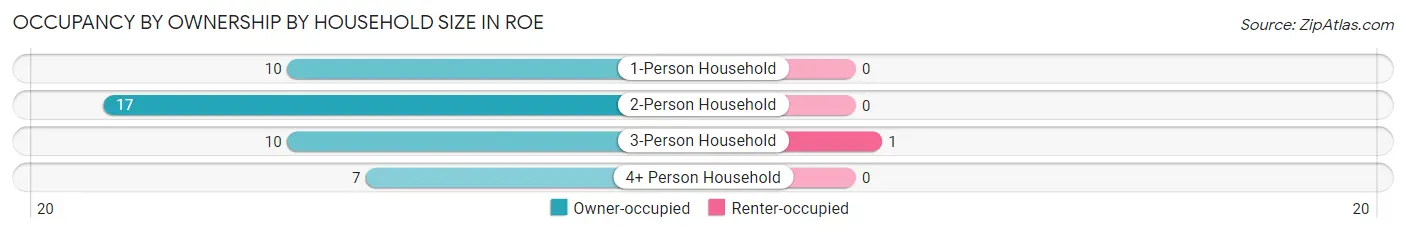
| Household Size | Owner-occupied | Renter-occupied |
| 1-Person Household | 10 (100.0%) | 0 (0.0%) |
| 2-Person Household | 17 (100.0%) | 0 (0.0%) |
| 3-Person Household | 10 (90.9%) | 1 (9.1%) |
| 4+ Person Household | 7 (100.0%) | 0 (0.0%) |
| Total Housing Units | 44 (97.8%) | 1 (2.2%) |
Occupancy by Educational Attainment in Roe
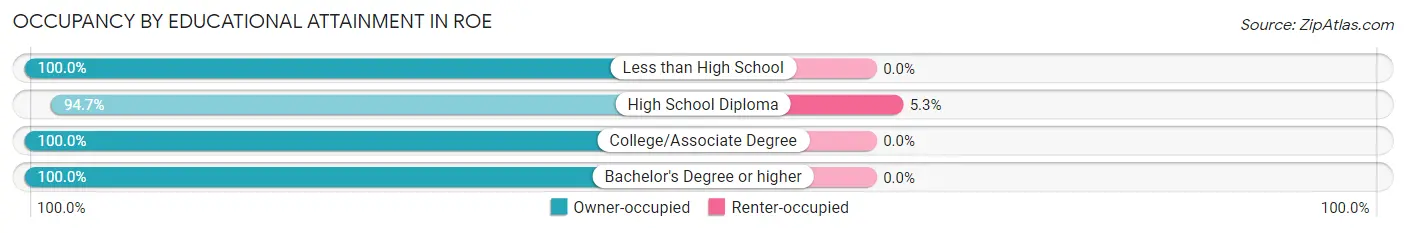
| Household Size | Owner-occupied | Renter-occupied |
| Less than High School | 3 (100.0%) | 0 (0.0%) |
| High School Diploma | 18 (94.7%) | 1 (5.3%) |
| College/Associate Degree | 16 (100.0%) | 0 (0.0%) |
| Bachelor's Degree or higher | 7 (100.0%) | 0 (0.0%) |
Occupancy by Age of Householder in Roe
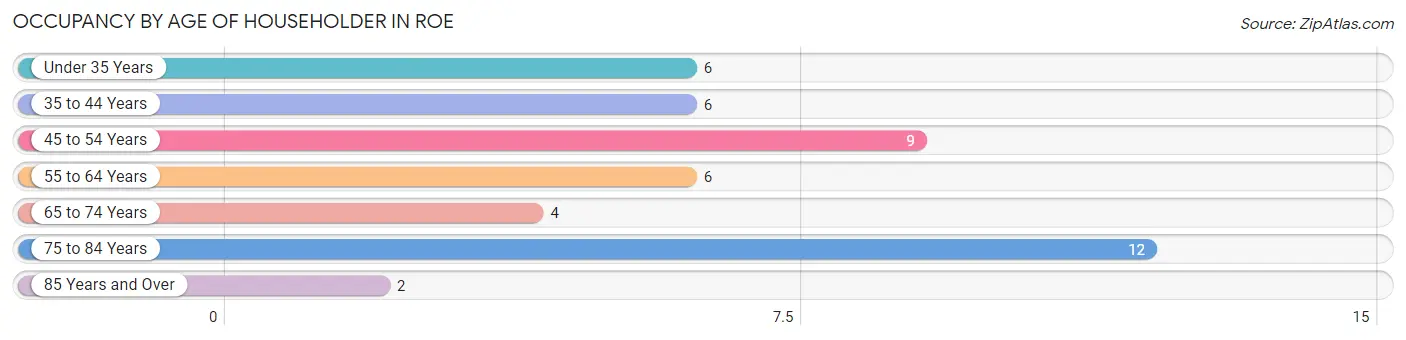
| Age Bracket | # Households | % Households |
| Under 35 Years | 6 | 13.3% |
| 35 to 44 Years | 6 | 13.3% |
| 45 to 54 Years | 9 | 20.0% |
| 55 to 64 Years | 6 | 13.3% |
| 65 to 74 Years | 4 | 8.9% |
| 75 to 84 Years | 12 | 26.7% |
| 85 Years and Over | 2 | 4.4% |
| Total | 45 | 100.0% |
Housing Finances in Roe
Median Income by Occupancy in Roe
| Occupancy Type | # Households | Median Income |
| Owner-Occupied | 44 (97.8%) | $0 |
| Renter-Occupied | 1 (2.2%) | $0 |
| Average | 45 (100.0%) | $0 |
Occupancy by Householder Income Bracket in Roe
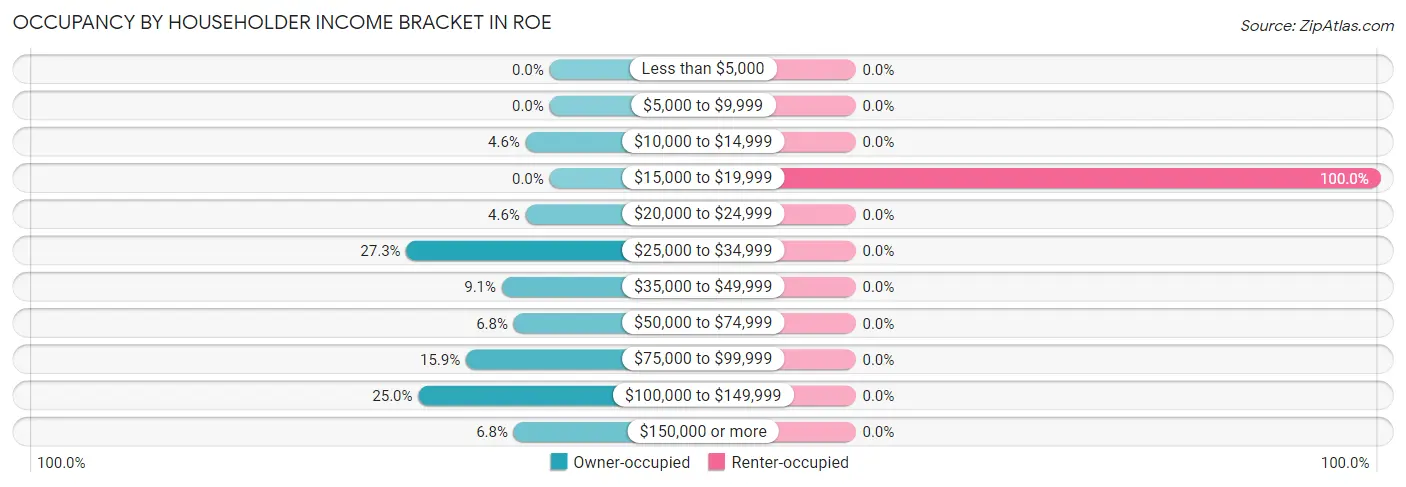
| Income Bracket | Owner-occupied | Renter-occupied |
| Less than $5,000 | 0 (0.0%) | 0 (0.0%) |
| $5,000 to $9,999 | 0 (0.0%) | 0 (0.0%) |
| $10,000 to $14,999 | 2 (4.5%) | 0 (0.0%) |
| $15,000 to $19,999 | 0 (0.0%) | 1 (100.0%) |
| $20,000 to $24,999 | 2 (4.5%) | 0 (0.0%) |
| $25,000 to $34,999 | 12 (27.3%) | 0 (0.0%) |
| $35,000 to $49,999 | 4 (9.1%) | 0 (0.0%) |
| $50,000 to $74,999 | 3 (6.8%) | 0 (0.0%) |
| $75,000 to $99,999 | 7 (15.9%) | 0 (0.0%) |
| $100,000 to $149,999 | 11 (25.0%) | 0 (0.0%) |
| $150,000 or more | 3 (6.8%) | 0 (0.0%) |
| Total | 44 (100.0%) | 1 (100.0%) |
Monthly Housing Cost Tiers in Roe
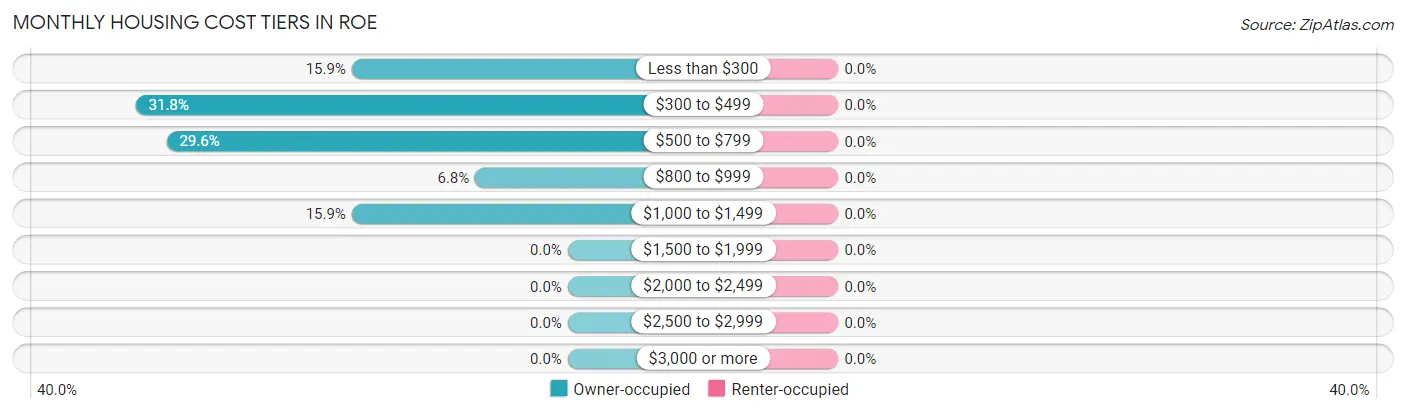
| Monthly Cost | Owner-occupied | Renter-occupied |
| Less than $300 | 7 (15.9%) | 0 (0.0%) |
| $300 to $499 | 14 (31.8%) | 0 (0.0%) |
| $500 to $799 | 13 (29.5%) | 0 (0.0%) |
| $800 to $999 | 3 (6.8%) | 0 (0.0%) |
| $1,000 to $1,499 | 7 (15.9%) | 0 (0.0%) |
| $1,500 to $1,999 | 0 (0.0%) | 0 (0.0%) |
| $2,000 to $2,499 | 0 (0.0%) | 0 (0.0%) |
| $2,500 to $2,999 | 0 (0.0%) | 0 (0.0%) |
| $3,000 or more | 0 (0.0%) | 0 (0.0%) |
| Total | 44 (100.0%) | 1 (100.0%) |
Physical Housing Characteristics in Roe
Housing Structures in Roe
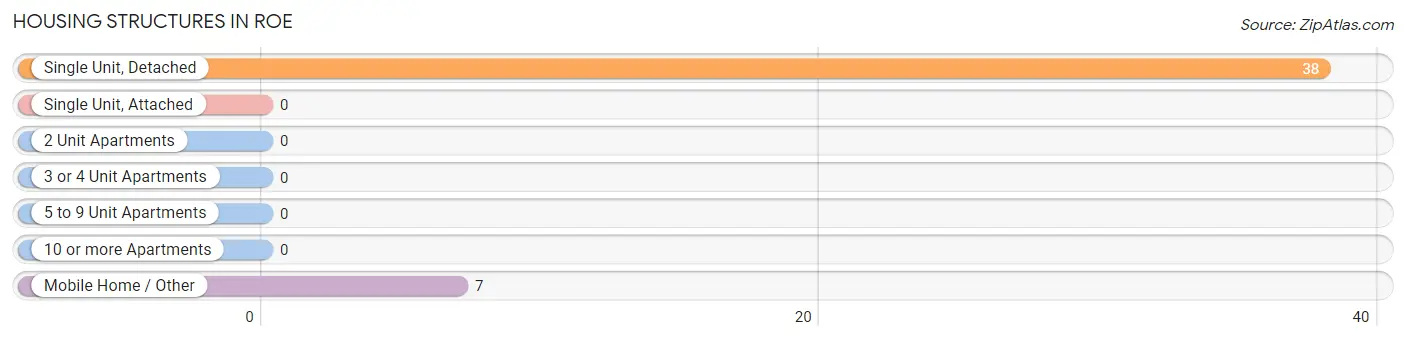
| Structure Type | # Housing Units | % Housing Units |
| Single Unit, Detached | 38 | 84.4% |
| Single Unit, Attached | 0 | 0.0% |
| 2 Unit Apartments | 0 | 0.0% |
| 3 or 4 Unit Apartments | 0 | 0.0% |
| 5 to 9 Unit Apartments | 0 | 0.0% |
| 10 or more Apartments | 0 | 0.0% |
| Mobile Home / Other | 7 | 15.6% |
| Total | 45 | 100.0% |
Housing Structures by Occupancy in Roe
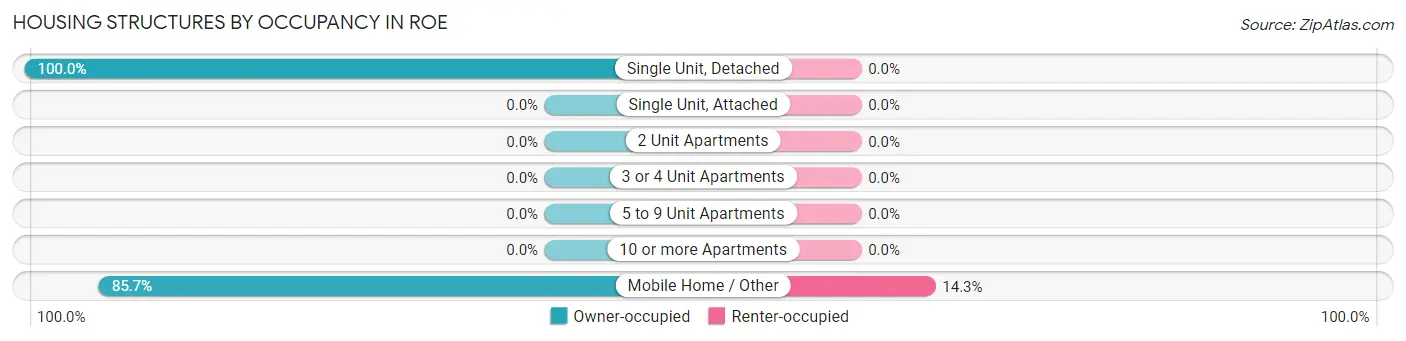
| Structure Type | Owner-occupied | Renter-occupied |
| Single Unit, Detached | 38 (100.0%) | 0 (0.0%) |
| Single Unit, Attached | 0 (0.0%) | 0 (0.0%) |
| 2 Unit Apartments | 0 (0.0%) | 0 (0.0%) |
| 3 or 4 Unit Apartments | 0 (0.0%) | 0 (0.0%) |
| 5 to 9 Unit Apartments | 0 (0.0%) | 0 (0.0%) |
| 10 or more Apartments | 0 (0.0%) | 0 (0.0%) |
| Mobile Home / Other | 6 (85.7%) | 1 (14.3%) |
| Total | 44 (97.8%) | 1 (2.2%) |
Housing Structures by Number of Rooms in Roe
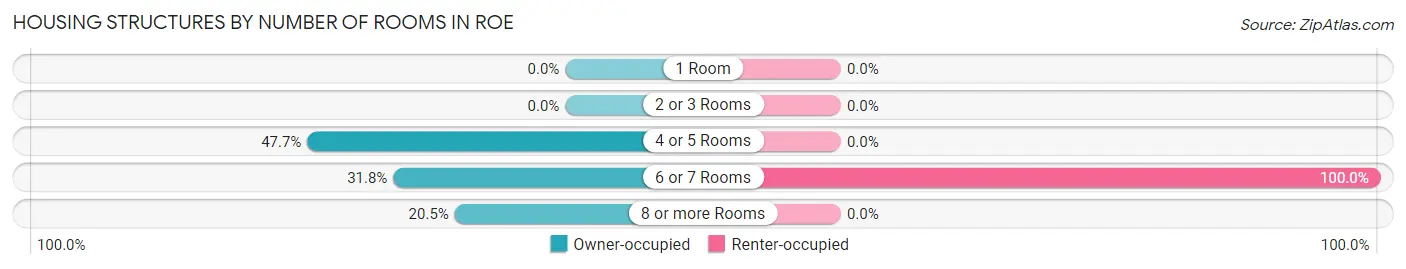
| Number of Rooms | Owner-occupied | Renter-occupied |
| 1 Room | 0 (0.0%) | 0 (0.0%) |
| 2 or 3 Rooms | 0 (0.0%) | 0 (0.0%) |
| 4 or 5 Rooms | 21 (47.7%) | 0 (0.0%) |
| 6 or 7 Rooms | 14 (31.8%) | 1 (100.0%) |
| 8 or more Rooms | 9 (20.4%) | 0 (0.0%) |
| Total | 44 (100.0%) | 1 (100.0%) |
Housing Structure by Heating Type in Roe
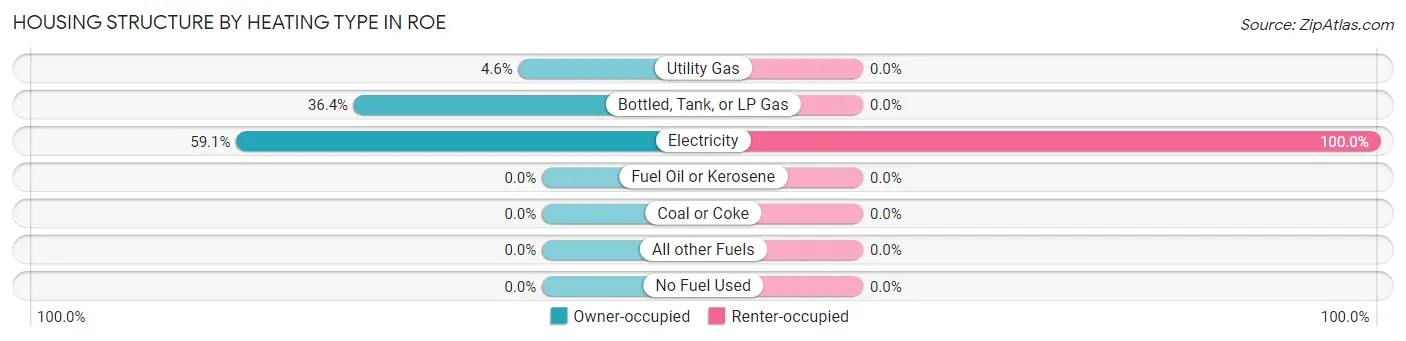
| Heating Type | Owner-occupied | Renter-occupied |
| Utility Gas | 2 (4.5%) | 0 (0.0%) |
| Bottled, Tank, or LP Gas | 16 (36.4%) | 0 (0.0%) |
| Electricity | 26 (59.1%) | 1 (100.0%) |
| Fuel Oil or Kerosene | 0 (0.0%) | 0 (0.0%) |
| Coal or Coke | 0 (0.0%) | 0 (0.0%) |
| All other Fuels | 0 (0.0%) | 0 (0.0%) |
| No Fuel Used | 0 (0.0%) | 0 (0.0%) |
| Total | 44 (100.0%) | 1 (100.0%) |
Household Vehicle Usage in Roe
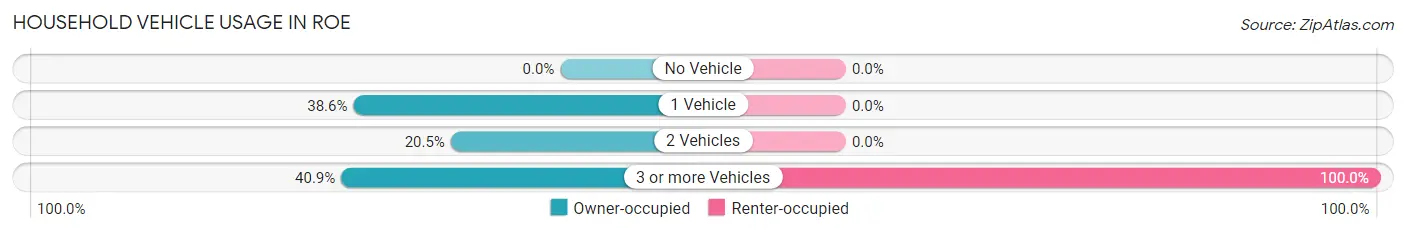
| Vehicles per Household | Owner-occupied | Renter-occupied |
| No Vehicle | 0 (0.0%) | 0 (0.0%) |
| 1 Vehicle | 17 (38.6%) | 0 (0.0%) |
| 2 Vehicles | 9 (20.4%) | 0 (0.0%) |
| 3 or more Vehicles | 18 (40.9%) | 1 (100.0%) |
| Total | 44 (100.0%) | 1 (100.0%) |
Real Estate & Mortgages in Roe
Real Estate and Mortgage Overview in Roe
| Characteristic | Without Mortgage | With Mortgage |
| Housing Units | 34 | 10 |
| Median Property Value | - | - |
| Median Household Income | - | - |
| Monthly Housing Costs | $345 | $0 |
| Real Estate Taxes | $279 | $3 |
Property Value by Mortgage Status in Roe
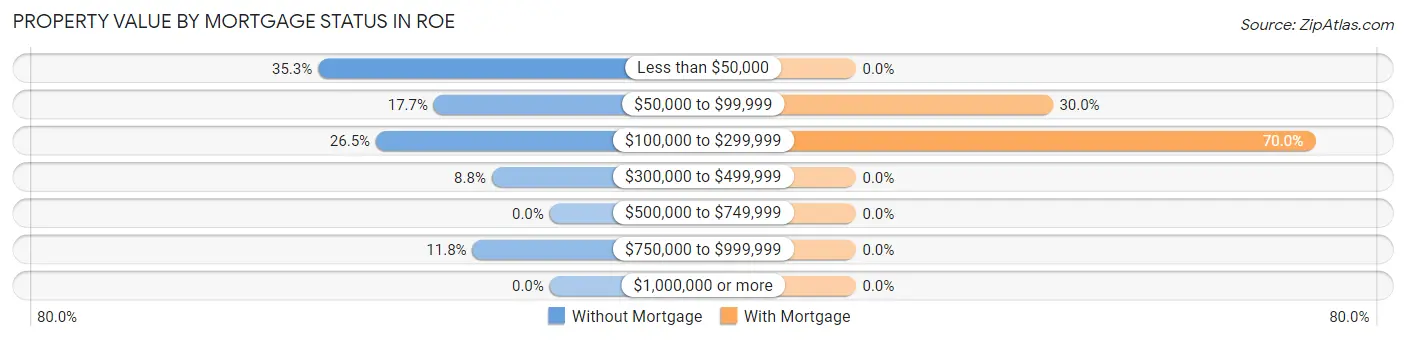
| Property Value | Without Mortgage | With Mortgage |
| Less than $50,000 | 12 (35.3%) | 0 (0.0%) |
| $50,000 to $99,999 | 6 (17.6%) | 3 (30.0%) |
| $100,000 to $299,999 | 9 (26.5%) | 7 (70.0%) |
| $300,000 to $499,999 | 3 (8.8%) | 0 (0.0%) |
| $500,000 to $749,999 | 0 (0.0%) | 0 (0.0%) |
| $750,000 to $999,999 | 4 (11.8%) | 0 (0.0%) |
| $1,000,000 or more | 0 (0.0%) | 0 (0.0%) |
| Total | 34 (100.0%) | 10 (100.0%) |
Household Income by Mortgage Status in Roe
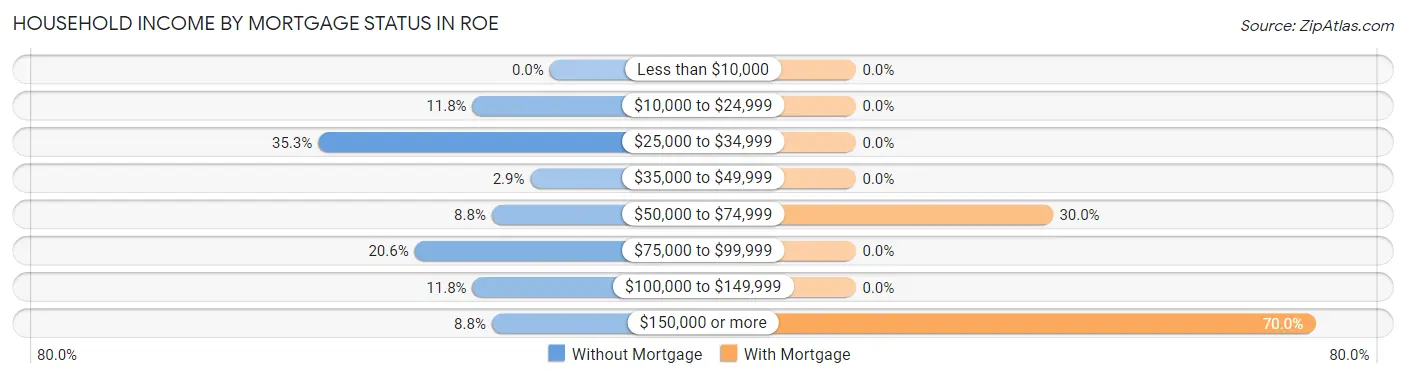
| Household Income | Without Mortgage | With Mortgage |
| Less than $10,000 | 0 (0.0%) | 0 (0.0%) |
| $10,000 to $24,999 | 4 (11.8%) | 0 (0.0%) |
| $25,000 to $34,999 | 12 (35.3%) | 0 (0.0%) |
| $35,000 to $49,999 | 1 (2.9%) | 0 (0.0%) |
| $50,000 to $74,999 | 3 (8.8%) | 3 (30.0%) |
| $75,000 to $99,999 | 7 (20.6%) | 0 (0.0%) |
| $100,000 to $149,999 | 4 (11.8%) | 0 (0.0%) |
| $150,000 or more | 3 (8.8%) | 7 (70.0%) |
| Total | 34 (100.0%) | 10 (100.0%) |
Property Value to Household Income Ratio in Roe
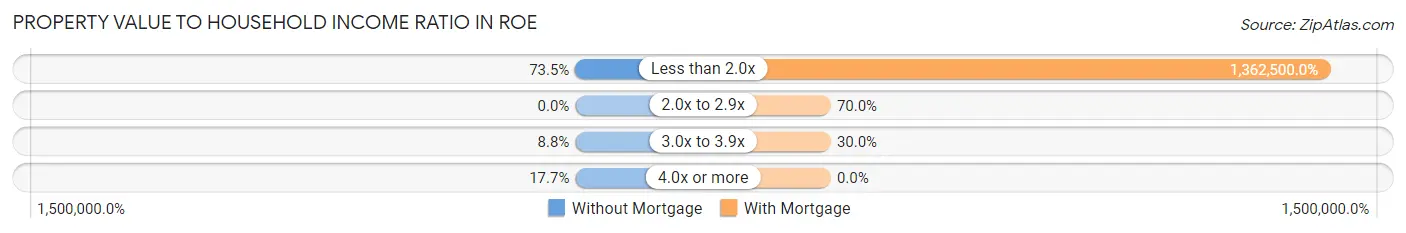
| Value-to-Income Ratio | Without Mortgage | With Mortgage |
| Less than 2.0x | 25 (73.5%) | 136,250 (1,362,500.0%) |
| 2.0x to 2.9x | 0 (0.0%) | 7 (70.0%) |
| 3.0x to 3.9x | 3 (8.8%) | 3 (30.0%) |
| 4.0x or more | 6 (17.6%) | 0 (0.0%) |
| Total | 34 (100.0%) | 10 (100.0%) |
Real Estate Taxes by Mortgage Status in Roe
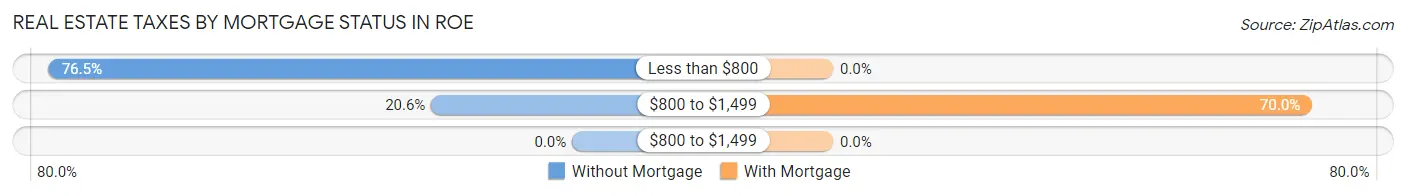
| Property Taxes | Without Mortgage | With Mortgage |
| Less than $800 | 26 (76.5%) | 0 (0.0%) |
| $800 to $1,499 | 7 (20.6%) | 7 (70.0%) |
| $800 to $1,499 | 0 (0.0%) | 0 (0.0%) |
| Total | 34 (100.0%) | 10 (100.0%) |
Health & Disability in Roe
Health Insurance Coverage by Age in Roe
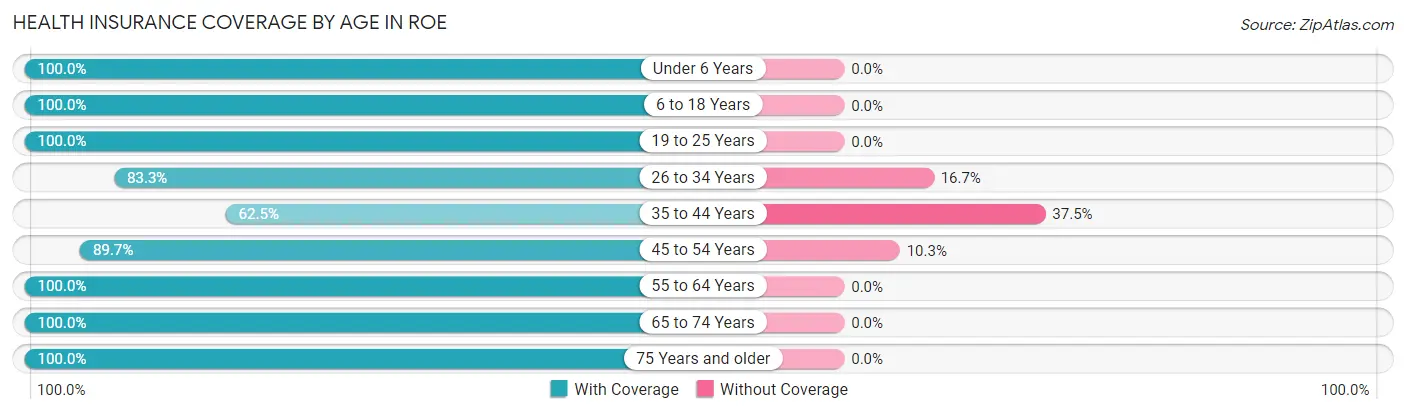
| Age Bracket | With Coverage | Without Coverage |
| Under 6 Years | 11 (100.0%) | 0 (0.0%) |
| 6 to 18 Years | 32 (100.0%) | 0 (0.0%) |
| 19 to 25 Years | 12 (100.0%) | 0 (0.0%) |
| 26 to 34 Years | 15 (83.3%) | 3 (16.7%) |
| 35 to 44 Years | 5 (62.5%) | 3 (37.5%) |
| 45 to 54 Years | 26 (89.7%) | 3 (10.3%) |
| 55 to 64 Years | 10 (100.0%) | 0 (0.0%) |
| 65 to 74 Years | 4 (100.0%) | 0 (0.0%) |
| 75 Years and older | 14 (100.0%) | 0 (0.0%) |
| Total | 129 (93.5%) | 9 (6.5%) |
Health Insurance Coverage by Citizenship Status in Roe
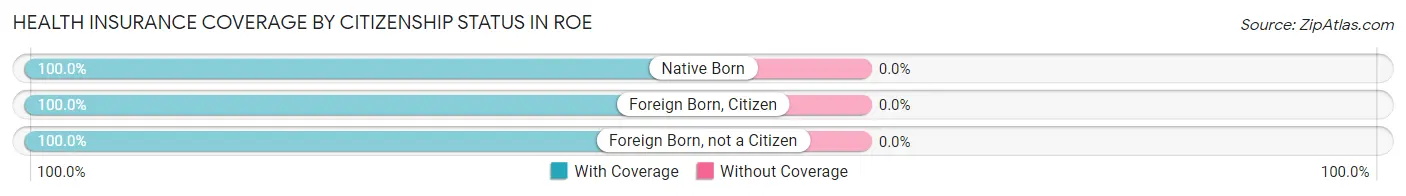
| Citizenship Status | With Coverage | Without Coverage |
| Native Born | 11 (100.0%) | 0 (0.0%) |
| Foreign Born, Citizen | 32 (100.0%) | 0 (0.0%) |
| Foreign Born, not a Citizen | 12 (100.0%) | 0 (0.0%) |
Health Insurance Coverage by Household Income in Roe
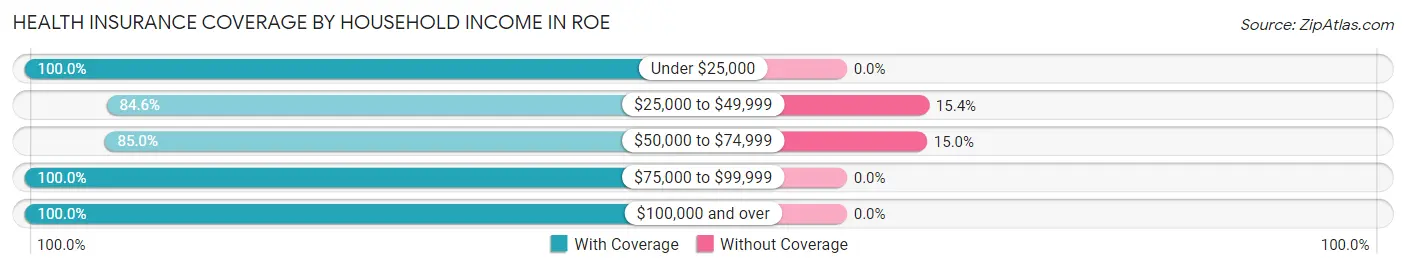
| Household Income | With Coverage | Without Coverage |
| Under $25,000 | 8 (100.0%) | 0 (0.0%) |
| $25,000 to $49,999 | 33 (84.6%) | 6 (15.4%) |
| $50,000 to $74,999 | 17 (85.0%) | 3 (15.0%) |
| $75,000 to $99,999 | 15 (100.0%) | 0 (0.0%) |
| $100,000 and over | 56 (100.0%) | 0 (0.0%) |
Public vs Private Health Insurance Coverage by Age in Roe
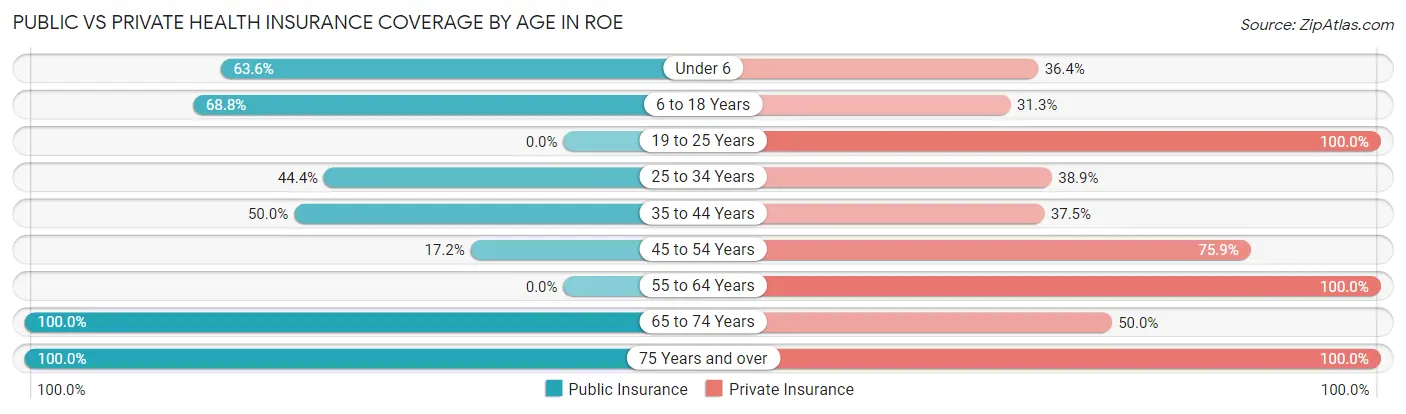
| Age Bracket | Public Insurance | Private Insurance |
| Under 6 | 7 (63.6%) | 4 (36.4%) |
| 6 to 18 Years | 22 (68.8%) | 10 (31.2%) |
| 19 to 25 Years | 0 (0.0%) | 12 (100.0%) |
| 25 to 34 Years | 8 (44.4%) | 7 (38.9%) |
| 35 to 44 Years | 4 (50.0%) | 3 (37.5%) |
| 45 to 54 Years | 5 (17.2%) | 22 (75.9%) |
| 55 to 64 Years | 0 (0.0%) | 10 (100.0%) |
| 65 to 74 Years | 4 (100.0%) | 2 (50.0%) |
| 75 Years and over | 14 (100.0%) | 14 (100.0%) |
| Total | 64 (46.4%) | 84 (60.9%) |
Disability Status by Sex by Age in Roe
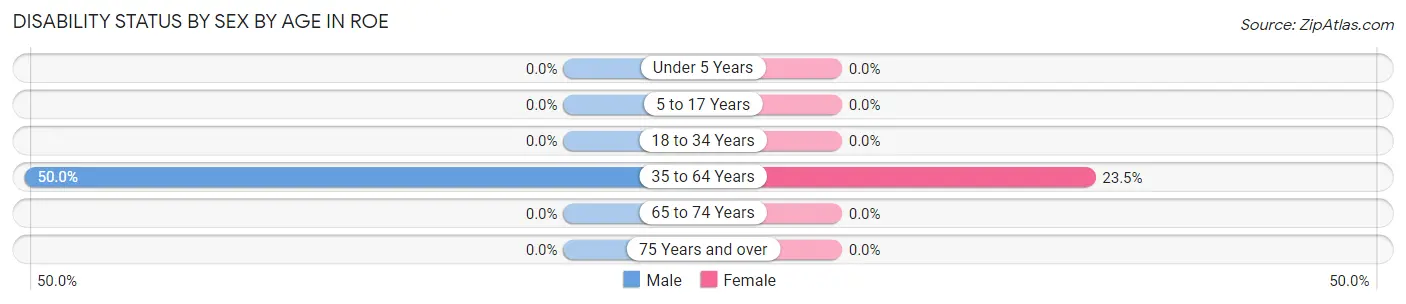
| Age Bracket | Male | Female |
| Under 5 Years | 0 (0.0%) | 0 (0.0%) |
| 5 to 17 Years | 0 (0.0%) | 0 (0.0%) |
| 18 to 34 Years | 0 (0.0%) | 0 (0.0%) |
| 35 to 64 Years | 15 (50.0%) | 4 (23.5%) |
| 65 to 74 Years | 0 (0.0%) | 0 (0.0%) |
| 75 Years and over | 0 (0.0%) | 0 (0.0%) |
Disability Class by Sex by Age in Roe
Disability Class: Hearing Difficulty
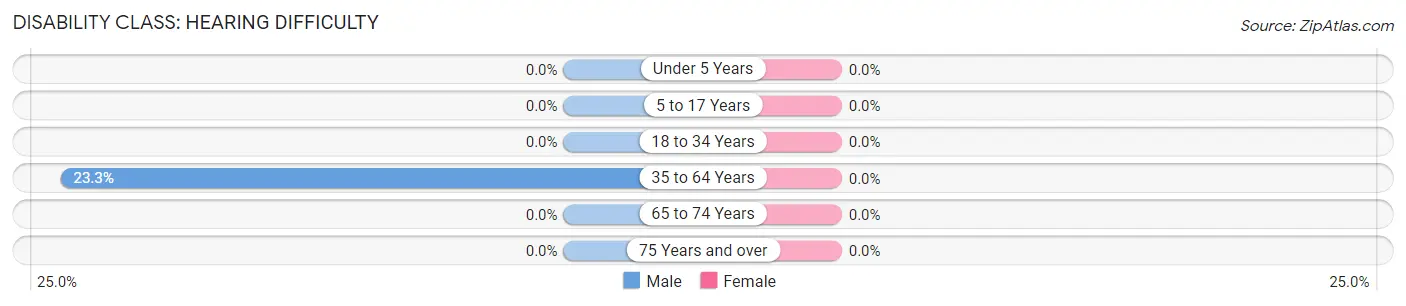
| Age Bracket | Male | Female |
| Under 5 Years | 0 (0.0%) | 0 (0.0%) |
| 5 to 17 Years | 0 (0.0%) | 0 (0.0%) |
| 18 to 34 Years | 0 (0.0%) | 0 (0.0%) |
| 35 to 64 Years | 7 (23.3%) | 0 (0.0%) |
| 65 to 74 Years | 0 (0.0%) | 0 (0.0%) |
| 75 Years and over | 0 (0.0%) | 0 (0.0%) |
Disability Class: Vision Difficulty
| Age Bracket | Male | Female |
| Under 5 Years | 0 (0.0%) | 0 (0.0%) |
| 5 to 17 Years | 0 (0.0%) | 0 (0.0%) |
| 18 to 34 Years | 0 (0.0%) | 0 (0.0%) |
| 35 to 64 Years | 0 (0.0%) | 0 (0.0%) |
| 65 to 74 Years | 0 (0.0%) | 0 (0.0%) |
| 75 Years and over | 0 (0.0%) | 0 (0.0%) |
Disability Class: Cognitive Difficulty
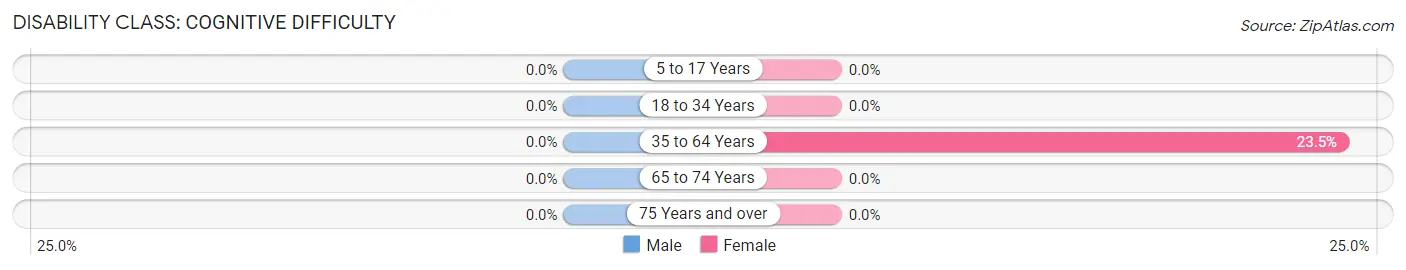
| Age Bracket | Male | Female |
| 5 to 17 Years | 0 (0.0%) | 0 (0.0%) |
| 18 to 34 Years | 0 (0.0%) | 0 (0.0%) |
| 35 to 64 Years | 0 (0.0%) | 4 (23.5%) |
| 65 to 74 Years | 0 (0.0%) | 0 (0.0%) |
| 75 Years and over | 0 (0.0%) | 0 (0.0%) |
Disability Class: Ambulatory Difficulty
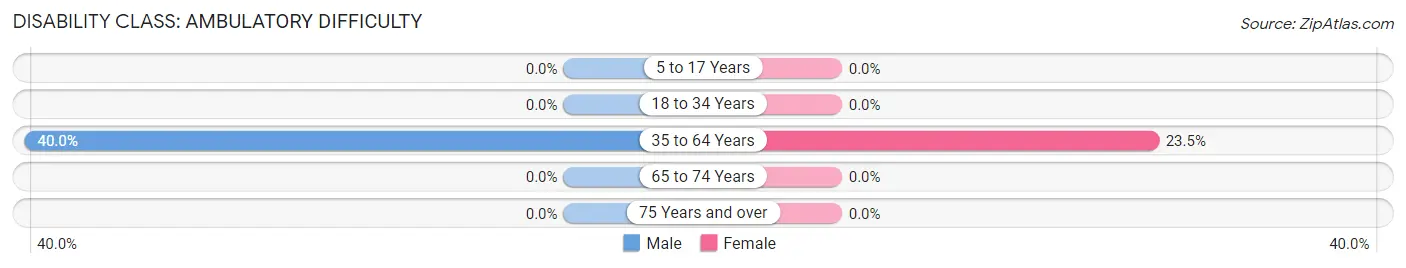
| Age Bracket | Male | Female |
| 5 to 17 Years | 0 (0.0%) | 0 (0.0%) |
| 18 to 34 Years | 0 (0.0%) | 0 (0.0%) |
| 35 to 64 Years | 12 (40.0%) | 4 (23.5%) |
| 65 to 74 Years | 0 (0.0%) | 0 (0.0%) |
| 75 Years and over | 0 (0.0%) | 0 (0.0%) |
Disability Class: Self-Care Difficulty
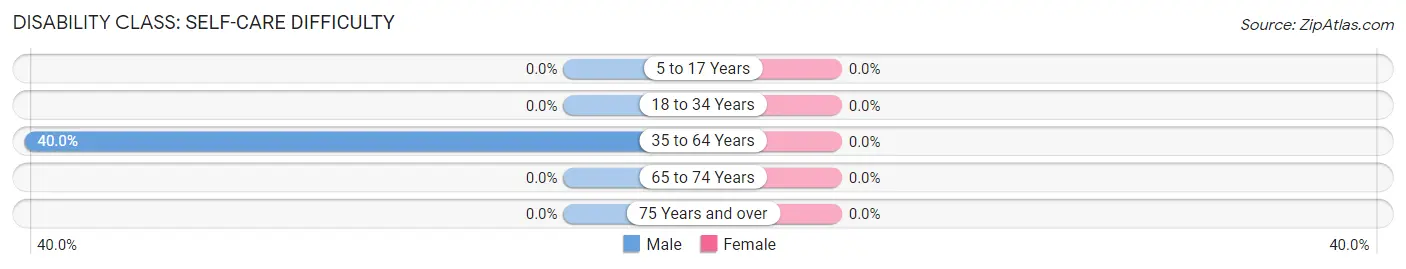
| Age Bracket | Male | Female |
| 5 to 17 Years | 0 (0.0%) | 0 (0.0%) |
| 18 to 34 Years | 0 (0.0%) | 0 (0.0%) |
| 35 to 64 Years | 12 (40.0%) | 0 (0.0%) |
| 65 to 74 Years | 0 (0.0%) | 0 (0.0%) |
| 75 Years and over | 0 (0.0%) | 0 (0.0%) |
Technology Access in Roe
Computing Device Access in Roe
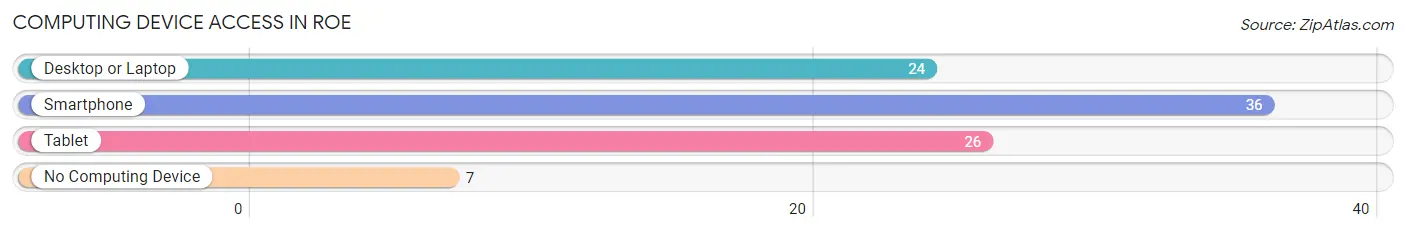
| Device Type | # Households | % Households |
| Desktop or Laptop | 24 | 53.3% |
| Smartphone | 36 | 80.0% |
| Tablet | 26 | 57.8% |
| No Computing Device | 7 | 15.6% |
| Total | 45 | 100.0% |
Internet Access in Roe
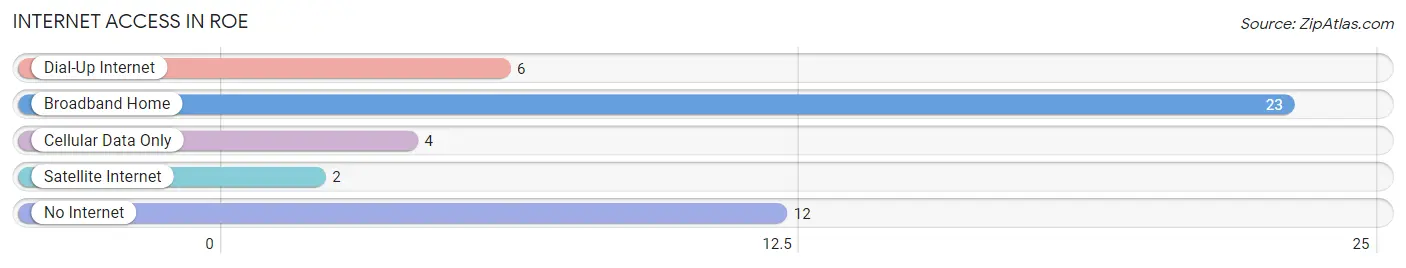
| Internet Type | # Households | % Households |
| Dial-Up Internet | 6 | 13.3% |
| Broadband Home | 23 | 51.1% |
| Cellular Data Only | 4 | 8.9% |
| Satellite Internet | 2 | 4.4% |
| No Internet | 12 | 26.7% |
| Total | 45 | 100.0% |
Roe Summary
Roe is a small town located in the Ozark Mountains of Arkansas. It is situated in the northwest corner of the state, near the Oklahoma border. The town has a population of just over 500 people, and is part of the larger Boone County. Roe is known for its rural charm and its close-knit community.
History
Roe was founded in 1883 by a group of settlers from Missouri. The town was named after a local creek, which was named after a man named Roe. The town was originally a farming community, and the settlers grew cotton, corn, and other crops. As the town grew, it became a center for timber and coal mining. The town also had a sawmill and a gristmill.
In the early 1900s, Roe was a thriving community. It had a post office, a bank, a hotel, a general store, and several churches. The town also had a school, which was attended by students from the surrounding area.
In the 1950s, the coal and timber industries began to decline, and the town's population began to decline as well. By the 1970s, the town had become a virtual ghost town. However, in the 1980s, the town began to experience a resurgence. The town was revitalized by the opening of a new sawmill and the construction of a new school.
Geography
Roe is located in the Ozark Mountains of Arkansas. The town is situated in the northwest corner of the state, near the Oklahoma border. The town is surrounded by rolling hills and forests. The town is located at the intersection of two major highways, US Highway 412 and Arkansas Highway 43.
The climate in Roe is mild and humid. Summers are hot and humid, with temperatures reaching into the 90s. Winters are mild, with temperatures rarely dropping below freezing. The town receives an average of 45 inches of rain per year.
Economy
Roe's economy is largely based on agriculture and tourism. The town is home to several farms, which produce a variety of crops, including cotton, corn, soybeans, and wheat. The town also has a sawmill, which produces lumber for the local market.
Tourism is an important part of the town's economy. The town is home to several attractions, including the Ozark National Forest, the Buffalo National River, and the Ozark Folk Center. The town also hosts several festivals throughout the year, including the Roe Days Festival and the Ozark Folk Festival.
Demographics
Roe has a population of just over 500 people. The town is predominantly white, with a small African American population. The median household income is $35,000, and the median home value is $90,000. The town has a low unemployment rate, and the poverty rate is below the national average.
Roe is a small town with a close-knit community. The town is known for its rural charm and its friendly atmosphere. The town is a great place to live, work, and raise a family.
Common Questions
What is Per Capita Income in Roe?
Per Capita income in Roe is $47,377.
What is the Median Family Income in Roe?
Median Family Income in Roe is $93,393.
What is Inequality or Gini Index in Roe?
Inequality or Gini Index in Roe is 0.63.
What is the Total Population of Roe?
Total Population of Roe is 138.
What is the Total Male Population of Roe?
Total Male Population of Roe is 62.
What is the Total Female Population of Roe?
Total Female Population of Roe is 76.
What is the Ratio of Males per 100 Females in Roe?
There are 81.58 Males per 100 Females in Roe.
What is the Ratio of Females per 100 Males in Roe?
There are 122.58 Females per 100 Males in Roe.
What is the Median Population Age in Roe?
Median Population Age in Roe is 33.9 Years.
What is the Average Family Size in Roe
Average Family Size in Roe is 3.7 People.
What is the Average Household Size in Roe
Average Household Size in Roe is 3.1 People.
How Large is the Labor Force in Roe?
There are 55 People in the Labor Forcein in Roe.
What is the Percentage of People in the Labor Force in Roe?
57.9% of People are in the Labor Force in Roe.
What is the Unemployment Rate in Roe?
Unemployment Rate in Roe is 14.5%.