Quitman, AR Map & Demographics
Quitman Map
Quitman Overview
$20,806
PER CAPITA INCOME
$41,667
AVG FAMILY INCOME
$34,423
AVG HOUSEHOLD INCOME
8.7%
WAGE / INCOME GAP [ % ]
91.3¢/ $1
WAGE / INCOME GAP [ $ ]
0.44
INEQUALITY / GINI INDEX
730
TOTAL POPULATION
388
MALE POPULATION
342
FEMALE POPULATION
113.45
MALES / 100 FEMALES
88.14
FEMALES / 100 MALES
40.5
MEDIAN AGE
2.7
AVG FAMILY SIZE
2.2
AVG HOUSEHOLD SIZE
337
LABOR FORCE [ PEOPLE ]
56.4%
PERCENT IN LABOR FORCE
13.9%
UNEMPLOYMENT RATE
Quitman Zip Codes
Quitman Area Codes
Income in Quitman
Income Overview in Quitman
Per Capita Income in Quitman is $20,806, while median incomes of families and households are $41,667 and $34,423 respectively.
| Characteristic | Number | Measure |
| Per Capita Income | 730 | $20,806 |
| Median Family Income | 228 | $41,667 |
| Mean Family Income | 228 | $52,224 |
| Median Household Income | 328 | $34,423 |
| Mean Household Income | 328 | $45,361 |
| Income Deficit | 228 | $0 |
| Wage / Income Gap (%) | 730 | 8.66% |
| Wage / Income Gap ($) | 730 | 91.34¢ per $1 |
| Gini / Inequality Index | 730 | 0.44 |
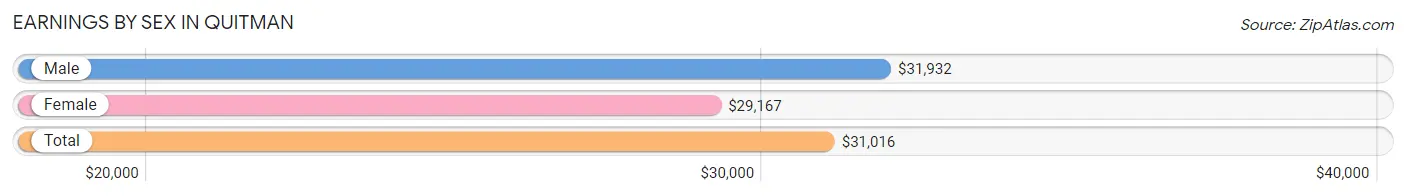
Earnings by Sex in Quitman
Average Earnings in Quitman are $31,016, $31,932 for men and $29,167 for women, a difference of 8.7%.
| Sex | Number | Average Earnings |
| Male | 185 (55.6%) | $31,932 |
| Female | 148 (44.4%) | $29,167 |
| Total | 333 (100.0%) | $31,016 |
Earnings by Sex by Income Bracket in Quitman
The most common earnings brackets in Quitman are $12,500 to $14,999 for men (31 | 16.8%) and $30,000 to $34,999 for women (23 | 15.5%).
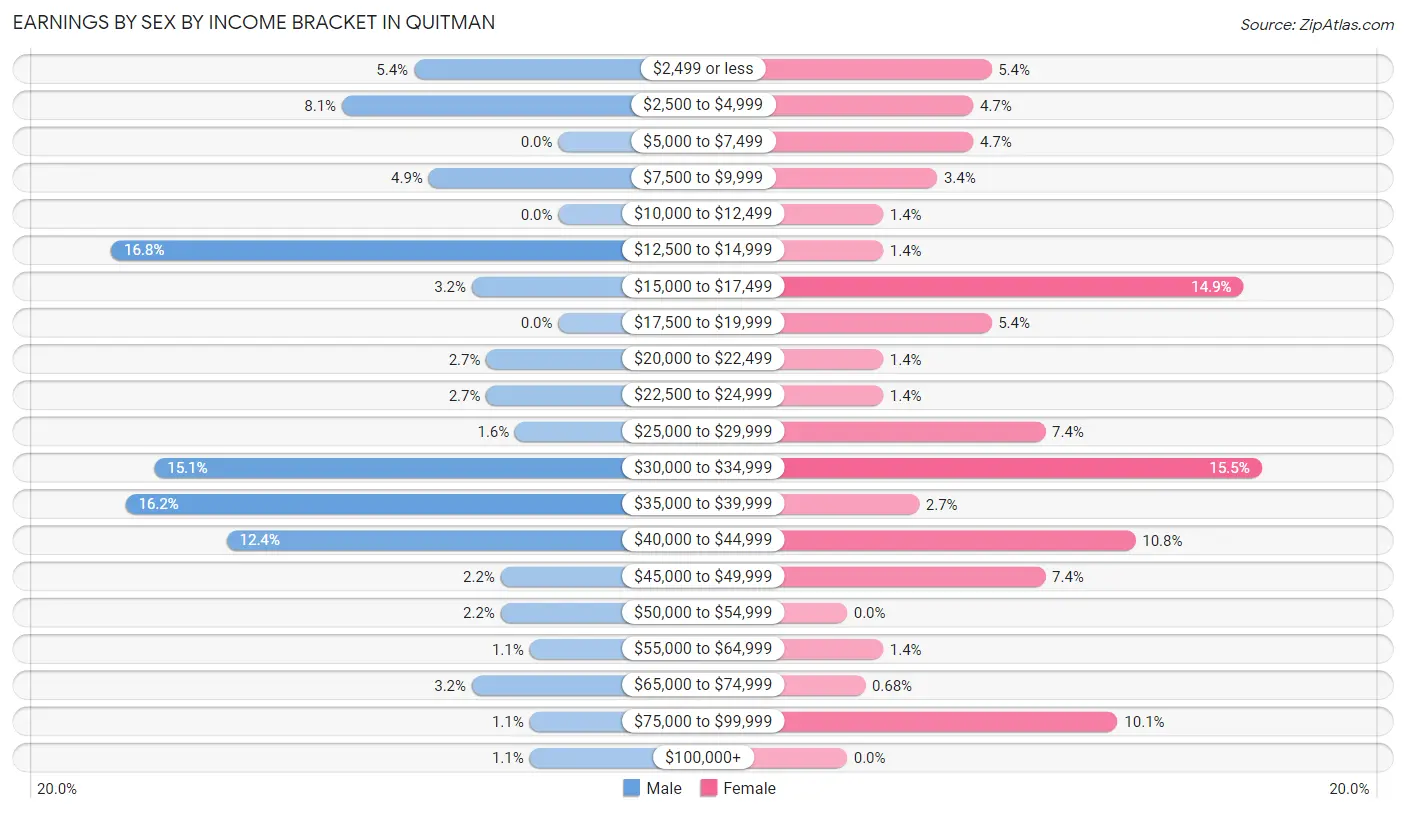
| Income | Male | Female |
| $2,499 or less | 10 (5.4%) | 8 (5.4%) |
| $2,500 to $4,999 | 15 (8.1%) | 7 (4.7%) |
| $5,000 to $7,499 | 0 (0.0%) | 7 (4.7%) |
| $7,500 to $9,999 | 9 (4.9%) | 5 (3.4%) |
| $10,000 to $12,499 | 0 (0.0%) | 2 (1.3%) |
| $12,500 to $14,999 | 31 (16.8%) | 2 (1.3%) |
| $15,000 to $17,499 | 6 (3.2%) | 22 (14.9%) |
| $17,500 to $19,999 | 0 (0.0%) | 8 (5.4%) |
| $20,000 to $22,499 | 5 (2.7%) | 2 (1.3%) |
| $22,500 to $24,999 | 5 (2.7%) | 2 (1.3%) |
| $25,000 to $29,999 | 3 (1.6%) | 11 (7.4%) |
| $30,000 to $34,999 | 28 (15.1%) | 23 (15.5%) |
| $35,000 to $39,999 | 30 (16.2%) | 4 (2.7%) |
| $40,000 to $44,999 | 23 (12.4%) | 16 (10.8%) |
| $45,000 to $49,999 | 4 (2.2%) | 11 (7.4%) |
| $50,000 to $54,999 | 4 (2.2%) | 0 (0.0%) |
| $55,000 to $64,999 | 2 (1.1%) | 2 (1.3%) |
| $65,000 to $74,999 | 6 (3.2%) | 1 (0.7%) |
| $75,000 to $99,999 | 2 (1.1%) | 15 (10.1%) |
| $100,000+ | 2 (1.1%) | 0 (0.0%) |
| Total | 185 (100.0%) | 148 (100.0%) |
Earnings by Sex by Educational Attainment in Quitman
Average earnings in Quitman are $24,000 for men and $25,500 for women, a difference of 5.9%. Men with an educational attainment of bachelor's degree enjoy the highest average annual earnings of $37,614, while those with high school diploma education earn the least with $14,113. Women with an educational attainment of graduate degree earn the most with the average annual earnings of $93,083, while those with less than high school education have the smallest earnings of $2,499.
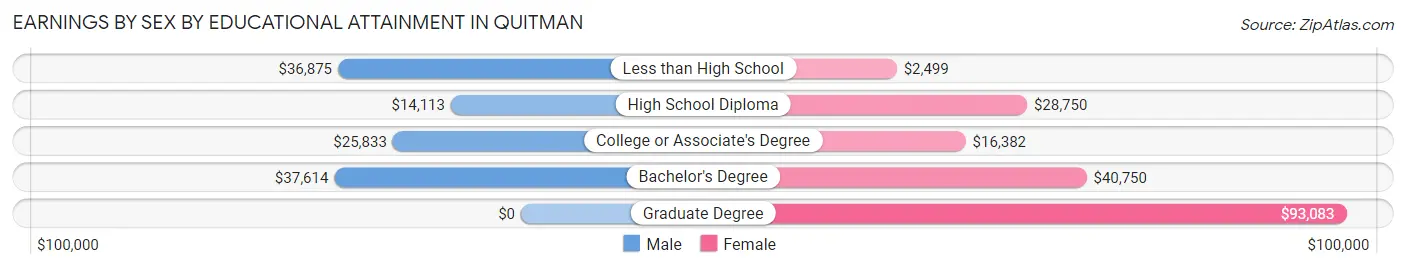
| Educational Attainment | Male Income | Female Income |
| Less than High School | $36,875 | $2,499 |
| High School Diploma | $14,113 | $28,750 |
| College or Associate's Degree | $25,833 | $16,382 |
| Bachelor's Degree | $37,614 | $40,750 |
| Graduate Degree | - | - |
| Total | $24,000 | $25,500 |
Family Income in Quitman
Family Income Brackets in Quitman
According to the Quitman family income data, there are 51 families falling into the $35,000 to $49,999 income range, which is the most common income bracket and makes up 22.4% of all families. Conversely, the $10,000 to $14,999 income bracket is the least frequent group with only 4 families (1.8%) belonging to this category.
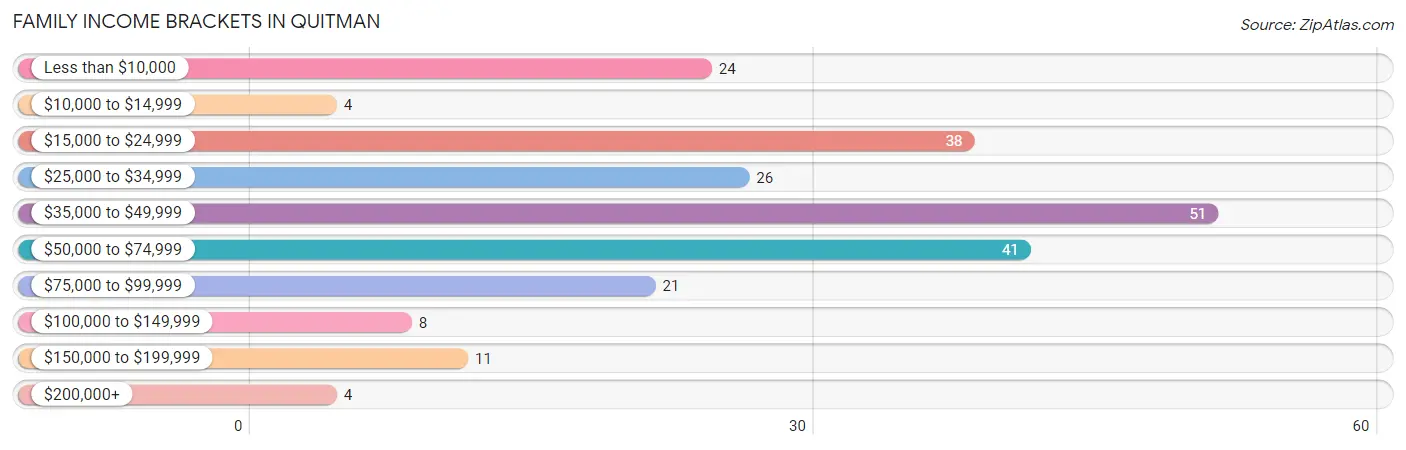
| Income Bracket | # Families | % Families |
| Less than $10,000 | 24 | 10.5% |
| $10,000 to $14,999 | 4 | 1.8% |
| $15,000 to $24,999 | 38 | 16.7% |
| $25,000 to $34,999 | 26 | 11.4% |
| $35,000 to $49,999 | 51 | 22.4% |
| $50,000 to $74,999 | 41 | 18.0% |
| $75,000 to $99,999 | 21 | 9.2% |
| $100,000 to $149,999 | 8 | 3.5% |
| $150,000 to $199,999 | 11 | 4.8% |
| $200,000+ | 4 | 1.8% |
Family Income by Famaliy Size in Quitman
4-person families (18 | 7.9%) account for the highest median family income in Quitman with $78,333 per family, while 4-person families (18 | 7.9%) have the highest median income of $19,583 per family member.
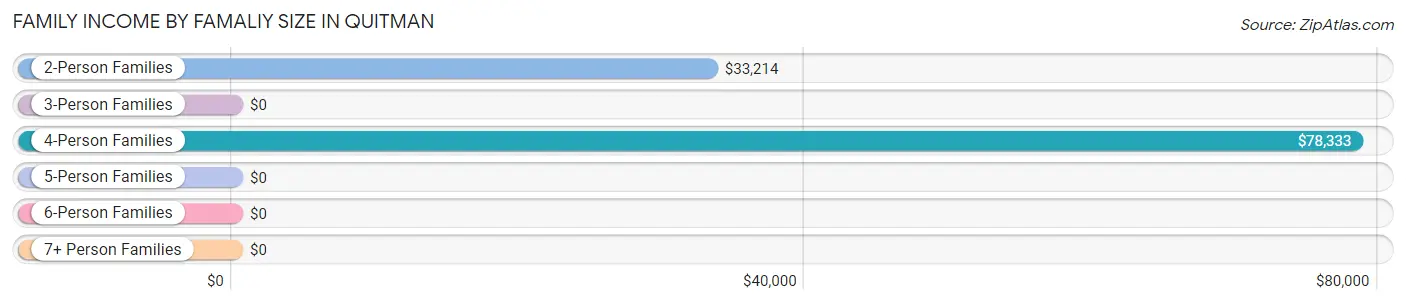
| Income Bracket | # Families | Median Income |
| 2-Person Families | 136 (59.7%) | $33,214 |
| 3-Person Families | 47 (20.6%) | $0 |
| 4-Person Families | 18 (7.9%) | $78,333 |
| 5-Person Families | 13 (5.7%) | $0 |
| 6-Person Families | 14 (6.1%) | $0 |
| 7+ Person Families | 0 (0.0%) | $0 |
| Total | 228 (100.0%) | $41,667 |
Family Income by Number of Earners in Quitman
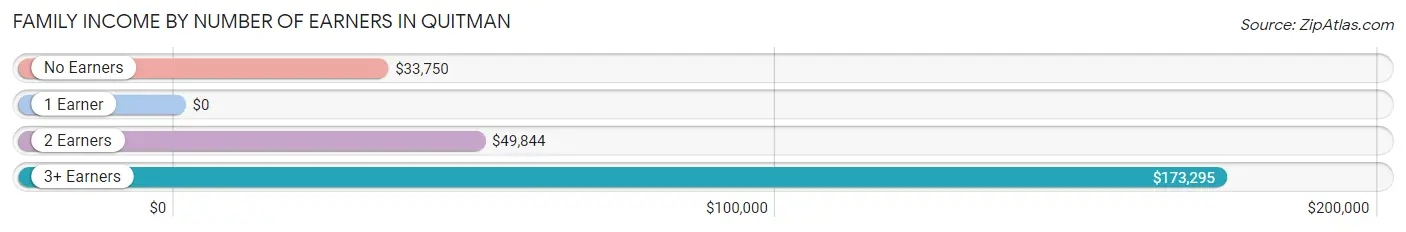
| Number of Earners | # Families | Median Income |
| No Earners | 49 (21.5%) | $33,750 |
| 1 Earner | 100 (43.9%) | $0 |
| 2 Earners | 64 (28.1%) | $49,844 |
| 3+ Earners | 15 (6.6%) | $173,295 |
| Total | 228 (100.0%) | $41,667 |
Household Income in Quitman
Household Income Brackets in Quitman
With 65 households falling in the category, the $15,000 to $24,999 income range is the most frequent in Quitman, accounting for 19.8% of all households. In contrast, only 4 households (1.2%) fall into the $200,000+ income bracket, making it the least populous group.
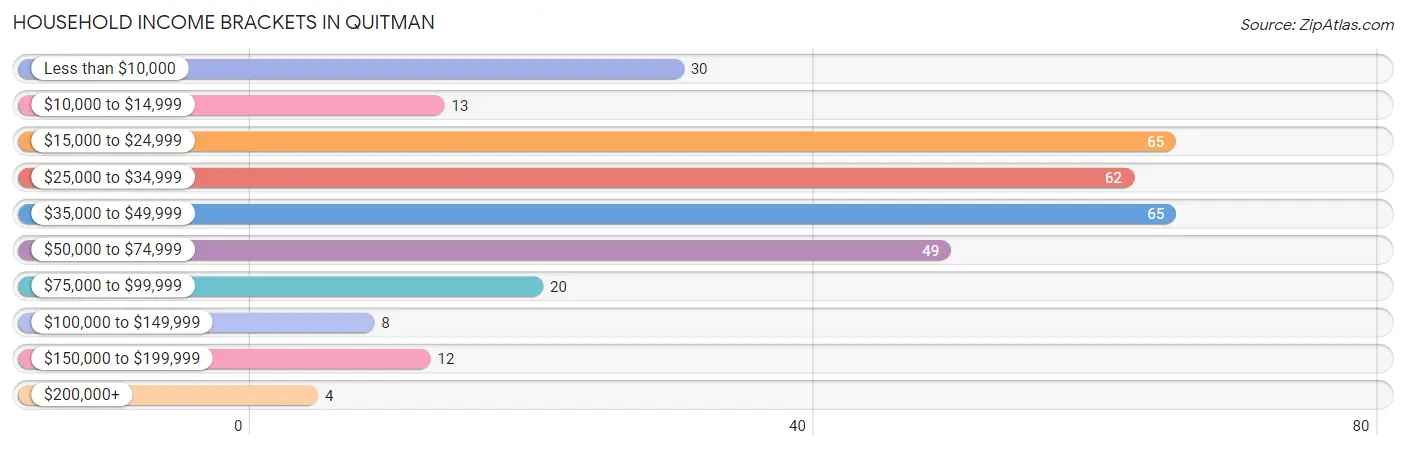
| Income Bracket | # Households | % Households |
| Less than $10,000 | 30 | 9.1% |
| $10,000 to $14,999 | 13 | 4.0% |
| $15,000 to $24,999 | 65 | 19.8% |
| $25,000 to $34,999 | 62 | 18.9% |
| $35,000 to $49,999 | 65 | 19.8% |
| $50,000 to $74,999 | 49 | 14.9% |
| $75,000 to $99,999 | 20 | 6.1% |
| $100,000 to $149,999 | 8 | 2.4% |
| $150,000 to $199,999 | 12 | 3.7% |
| $200,000+ | 4 | 1.2% |
Household Income by Householder Age in Quitman
The median household income in Quitman is $34,423, with the highest median household income of $49,464 found in the 15 to 24 years age bracket for the primary householder. A total of 11 households (3.4%) fall into this category. Meanwhile, the 65+ years age bracket for the primary householder has the lowest median household income of $31,563, with 98 households (29.9%) in this group.
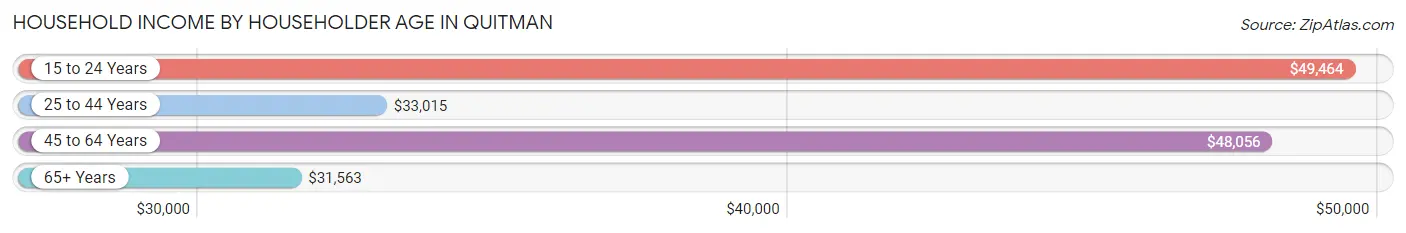
| Income Bracket | # Households | Median Income |
| 15 to 24 Years | 11 (3.4%) | $49,464 |
| 25 to 44 Years | 121 (36.9%) | $33,015 |
| 45 to 64 Years | 98 (29.9%) | $48,056 |
| 65+ Years | 98 (29.9%) | $31,563 |
| Total | 328 (100.0%) | $34,423 |
Poverty in Quitman
Income Below Poverty by Sex and Age in Quitman
With 24.5% poverty level for males and 19.6% for females among the residents of Quitman, 12 to 14 year old males and 16 and 17 year old females are the most vulnerable to poverty, with 4 males (66.7%) and 1 females (100.0%) in their respective age groups living below the poverty level.
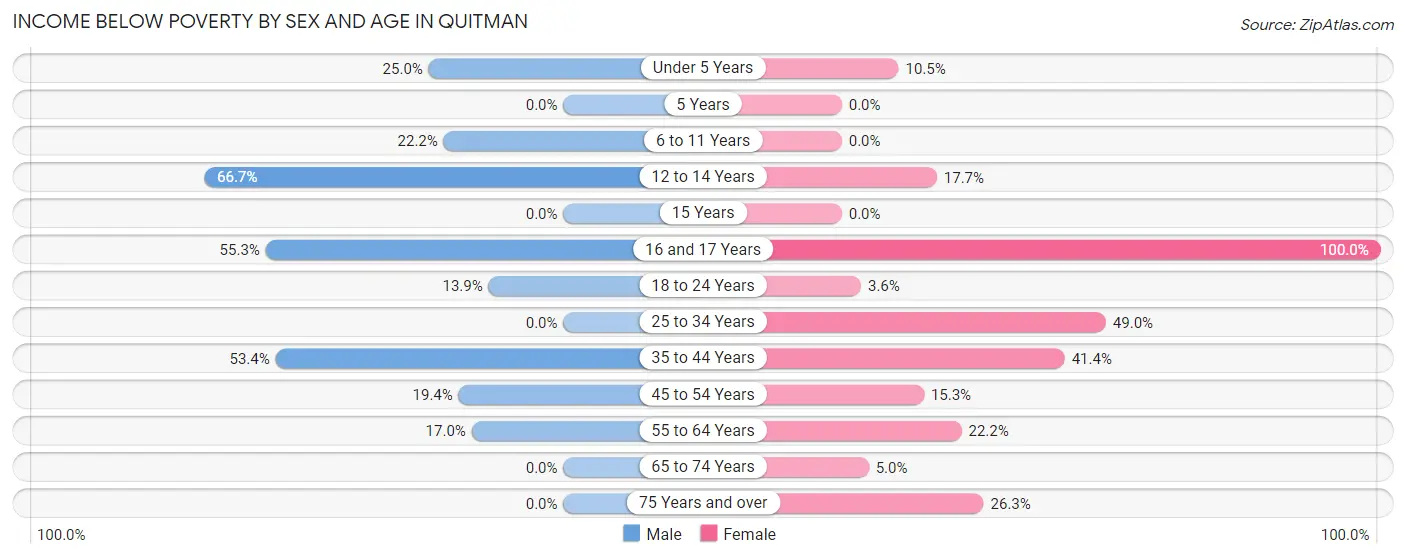
| Age Bracket | Male | Female |
| Under 5 Years | 7 (25.0%) | 2 (10.5%) |
| 5 Years | 0 (0.0%) | 0 (0.0%) |
| 6 to 11 Years | 4 (22.2%) | 0 (0.0%) |
| 12 to 14 Years | 4 (66.7%) | 3 (17.6%) |
| 15 Years | 0 (0.0%) | 0 (0.0%) |
| 16 and 17 Years | 21 (55.3%) | 1 (100.0%) |
| 18 to 24 Years | 5 (13.9%) | 1 (3.6%) |
| 25 to 34 Years | 0 (0.0%) | 25 (49.0%) |
| 35 to 44 Years | 39 (53.4%) | 12 (41.4%) |
| 45 to 54 Years | 7 (19.4%) | 9 (15.2%) |
| 55 to 64 Years | 8 (17.0%) | 6 (22.2%) |
| 65 to 74 Years | 0 (0.0%) | 3 (5.0%) |
| 75 Years and over | 0 (0.0%) | 5 (26.3%) |
| Total | 95 (24.5%) | 67 (19.6%) |
Income Above Poverty by Sex and Age in Quitman
According to the poverty statistics in Quitman, males aged 5 years and females aged 6 to 11 years are the age groups that are most secure financially, with 100.0% of males and 100.0% of females in these age groups living above the poverty line.
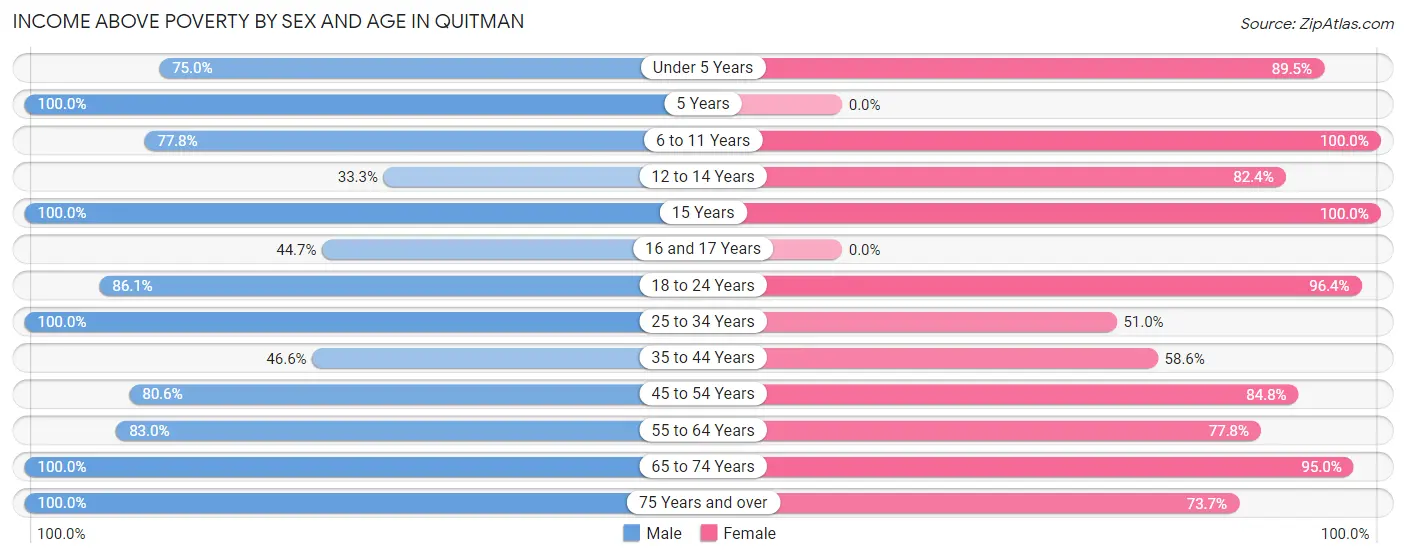
| Age Bracket | Male | Female |
| Under 5 Years | 21 (75.0%) | 17 (89.5%) |
| 5 Years | 8 (100.0%) | 0 (0.0%) |
| 6 to 11 Years | 14 (77.8%) | 27 (100.0%) |
| 12 to 14 Years | 2 (33.3%) | 14 (82.4%) |
| 15 Years | 4 (100.0%) | 5 (100.0%) |
| 16 and 17 Years | 17 (44.7%) | 0 (0.0%) |
| 18 to 24 Years | 31 (86.1%) | 27 (96.4%) |
| 25 to 34 Years | 29 (100.0%) | 26 (51.0%) |
| 35 to 44 Years | 34 (46.6%) | 17 (58.6%) |
| 45 to 54 Years | 29 (80.6%) | 50 (84.8%) |
| 55 to 64 Years | 39 (83.0%) | 21 (77.8%) |
| 65 to 74 Years | 42 (100.0%) | 57 (95.0%) |
| 75 Years and over | 23 (100.0%) | 14 (73.7%) |
| Total | 293 (75.5%) | 275 (80.4%) |
Income Below Poverty Among Married-Couple Families in Quitman
The poverty statistics for married-couple families in Quitman show that 10.1% or 15 of the total 149 families live below the poverty line. Families with 1 or 2 children have the highest poverty rate of 17.2%, comprising of 5 families. On the other hand, families with 3 or 4 children have the lowest poverty rate of 0.0%, which includes 0 families.
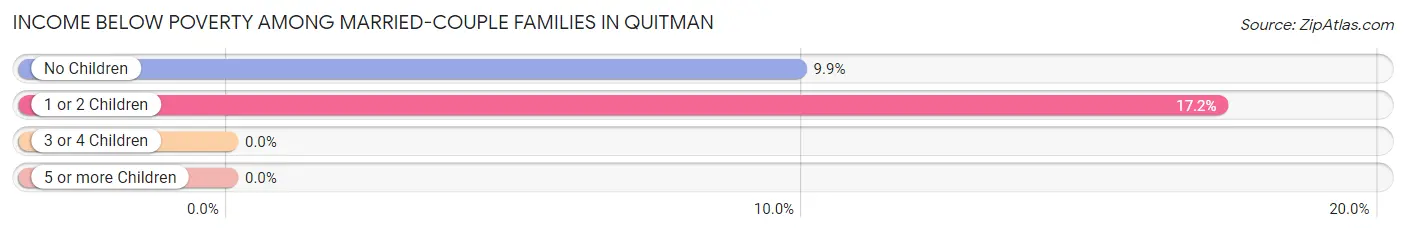
| Children | Above Poverty | Below Poverty |
| No Children | 91 (90.1%) | 10 (9.9%) |
| 1 or 2 Children | 24 (82.8%) | 5 (17.2%) |
| 3 or 4 Children | 19 (100.0%) | 0 (0.0%) |
| 5 or more Children | 0 (0.0%) | 0 (0.0%) |
| Total | 134 (89.9%) | 15 (10.1%) |
Income Below Poverty Among Single-Parent Households in Quitman
According to the poverty data in Quitman, 74.4% or 29 single-father households and 55.0% or 22 single-mother households are living below the poverty line. Among single-father households, those with 1 or 2 children have the highest poverty rate, with 28 households (82.4%) experiencing poverty. Likewise, among single-mother households, those with 5 or more children have the highest poverty rate, with 7 households (100.0%) falling below the poverty line.
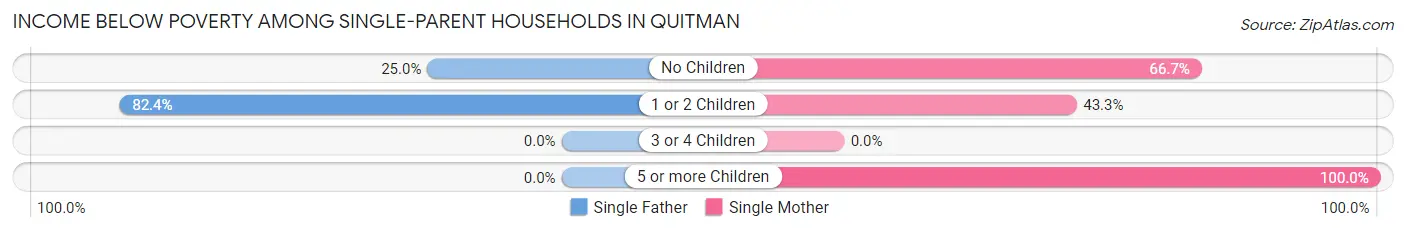
| Children | Single Father | Single Mother |
| No Children | 1 (25.0%) | 2 (66.7%) |
| 1 or 2 Children | 28 (82.4%) | 13 (43.3%) |
| 3 or 4 Children | 0 (0.0%) | 0 (0.0%) |
| 5 or more Children | 0 (0.0%) | 7 (100.0%) |
| Total | 29 (74.4%) | 22 (55.0%) |
Income Below Poverty Among Married-Couple vs Single-Parent Households in Quitman
The poverty data for Quitman shows that 15 of the married-couple family households (10.1%) and 51 of the single-parent households (64.6%) are living below the poverty level. Within the married-couple family households, those with 1 or 2 children have the highest poverty rate, with 5 households (17.2%) falling below the poverty line. Among the single-parent households, those with 5 or more children have the highest poverty rate, with 7 household (100.0%) living below poverty.
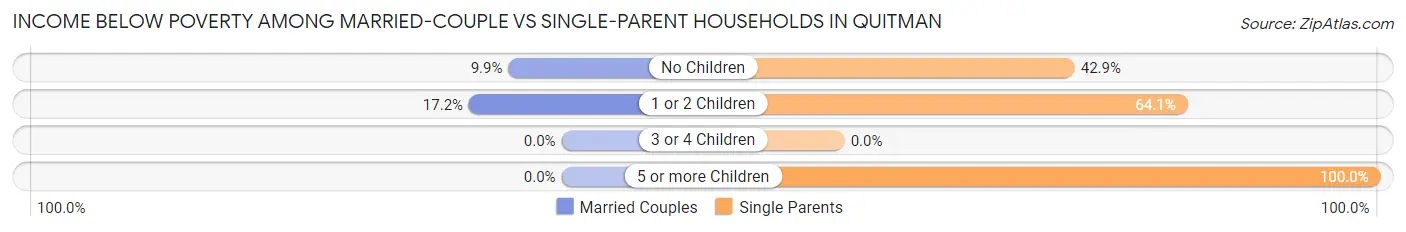
| Children | Married-Couple Families | Single-Parent Households |
| No Children | 10 (9.9%) | 3 (42.9%) |
| 1 or 2 Children | 5 (17.2%) | 41 (64.1%) |
| 3 or 4 Children | 0 (0.0%) | 0 (0.0%) |
| 5 or more Children | 0 (0.0%) | 7 (100.0%) |
| Total | 15 (10.1%) | 51 (64.6%) |
Race in Quitman
The most populous races in Quitman are White / Caucasian (701 | 96.0%), Two or more Races (27 | 3.7%), and Hispanic or Latino (8 | 1.1%).
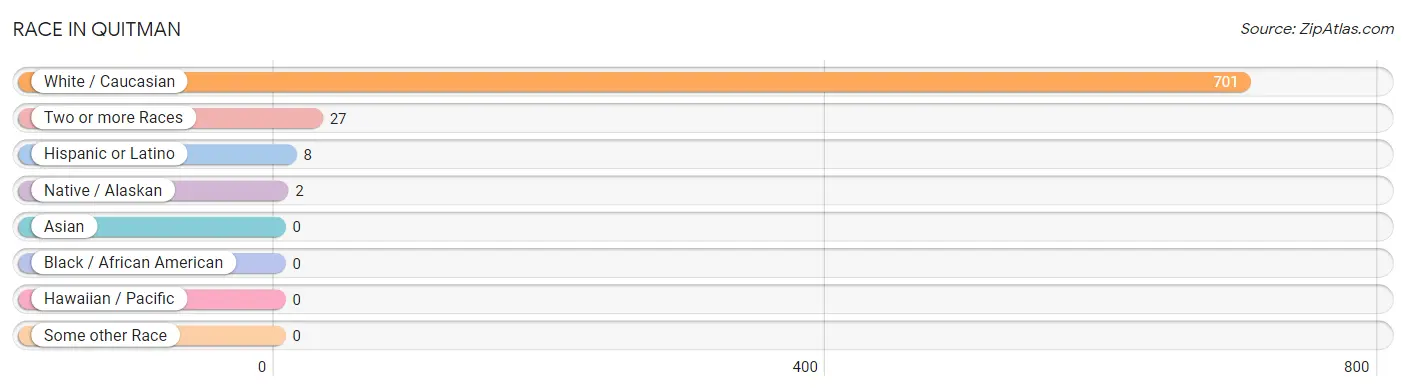
| Race | # Population | % Population |
| Asian | 0 | 0.0% |
| Black / African American | 0 | 0.0% |
| Hawaiian / Pacific | 0 | 0.0% |
| Hispanic or Latino | 8 | 1.1% |
| Native / Alaskan | 2 | 0.3% |
| White / Caucasian | 701 | 96.0% |
| Two or more Races | 27 | 3.7% |
| Some other Race | 0 | 0.0% |
| Total | 730 | 100.0% |
Ancestry in Quitman
The most populous ancestries reported in Quitman are American (96 | 13.2%), Irish (73 | 10.0%), English (50 | 6.9%), German (32 | 4.4%), and Polish (14 | 1.9%), together accounting for 36.3% of all Quitman residents.
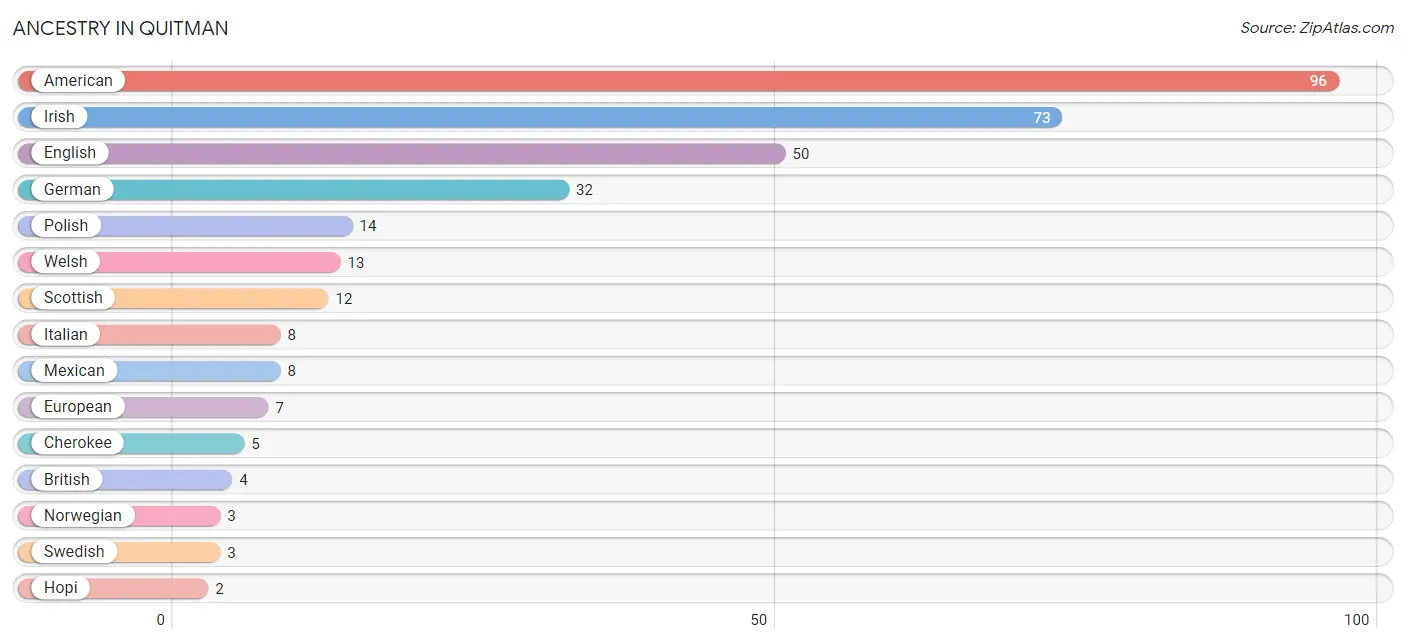
| Ancestry | # Population | % Population |
| American | 96 | 13.2% |
| British | 4 | 0.5% |
| Cherokee | 5 | 0.7% |
| English | 50 | 6.9% |
| European | 7 | 1.0% |
| German | 32 | 4.4% |
| Hopi | 2 | 0.3% |
| Irish | 73 | 10.0% |
| Italian | 8 | 1.1% |
| Mexican | 8 | 1.1% |
| Norwegian | 3 | 0.4% |
| Polish | 14 | 1.9% |
| Scottish | 12 | 1.6% |
| Sioux | 1 | 0.1% |
| Swedish | 3 | 0.4% |
| Welsh | 13 | 1.8% | View All 16 Rows |
Immigrants in Quitman

| Immigration Origin | # Population | % Population | View All 0 Rows |
Sex and Age in Quitman
Sex and Age in Quitman
The most populous age groups in Quitman are 40 to 44 Years (53 | 13.7%) for men and 25 to 29 Years (38 | 11.1%) for women.
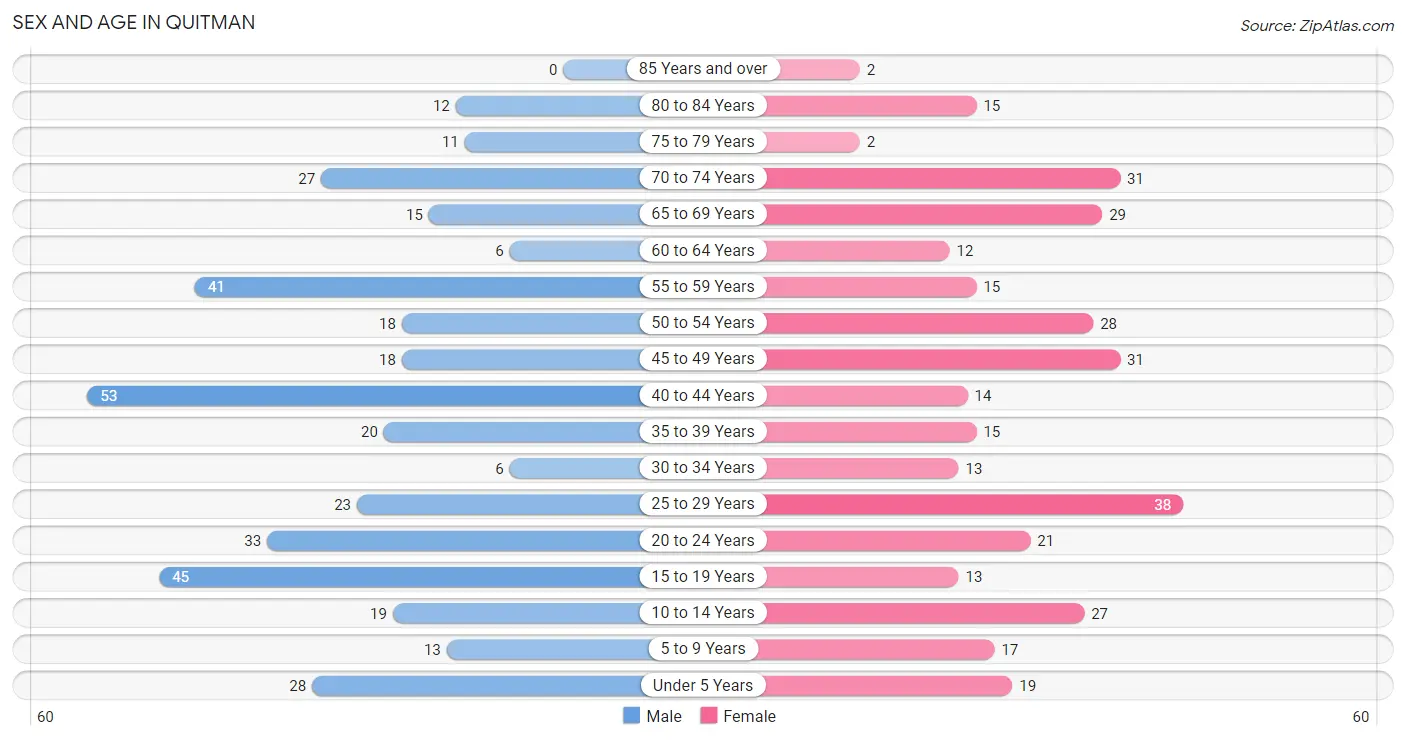
| Age Bracket | Male | Female |
| Under 5 Years | 28 (7.2%) | 19 (5.6%) |
| 5 to 9 Years | 13 (3.4%) | 17 (5.0%) |
| 10 to 14 Years | 19 (4.9%) | 27 (7.9%) |
| 15 to 19 Years | 45 (11.6%) | 13 (3.8%) |
| 20 to 24 Years | 33 (8.5%) | 21 (6.1%) |
| 25 to 29 Years | 23 (5.9%) | 38 (11.1%) |
| 30 to 34 Years | 6 (1.5%) | 13 (3.8%) |
| 35 to 39 Years | 20 (5.1%) | 15 (4.4%) |
| 40 to 44 Years | 53 (13.7%) | 14 (4.1%) |
| 45 to 49 Years | 18 (4.6%) | 31 (9.1%) |
| 50 to 54 Years | 18 (4.6%) | 28 (8.2%) |
| 55 to 59 Years | 41 (10.6%) | 15 (4.4%) |
| 60 to 64 Years | 6 (1.5%) | 12 (3.5%) |
| 65 to 69 Years | 15 (3.9%) | 29 (8.5%) |
| 70 to 74 Years | 27 (7.0%) | 31 (9.1%) |
| 75 to 79 Years | 11 (2.8%) | 2 (0.6%) |
| 80 to 84 Years | 12 (3.1%) | 15 (4.4%) |
| 85 Years and over | 0 (0.0%) | 2 (0.6%) |
| Total | 388 (100.0%) | 342 (100.0%) |
Families and Households in Quitman
Median Family Size in Quitman
The median family size in Quitman is 2.68 persons per family, with married-couple families (149 | 65.3%) accounting for the largest median family size of 2.85 persons per family. On the other hand, single male/father families (39 | 17.1%) represent the smallest median family size with 2.26 persons per family.
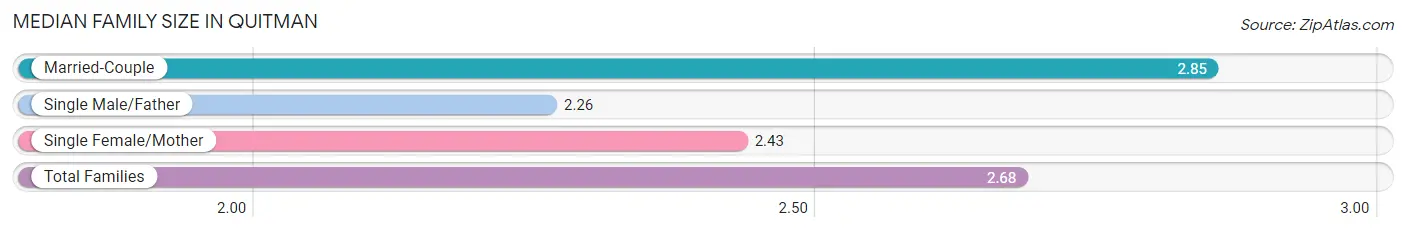
| Family Type | # Families | Family Size |
| Married-Couple | 149 (65.3%) | 2.85 |
| Single Male/Father | 39 (17.1%) | 2.26 |
| Single Female/Mother | 40 (17.5%) | 2.43 |
| Total Families | 228 (100.0%) | 2.68 |
Median Household Size in Quitman
The median household size in Quitman is 2.23 persons per household, with married-couple households (149 | 45.4%) accounting for the largest median household size of 2.87 persons per household. non-family households (100 | 30.5%) represent the smallest median household size with 1.05 persons per household.
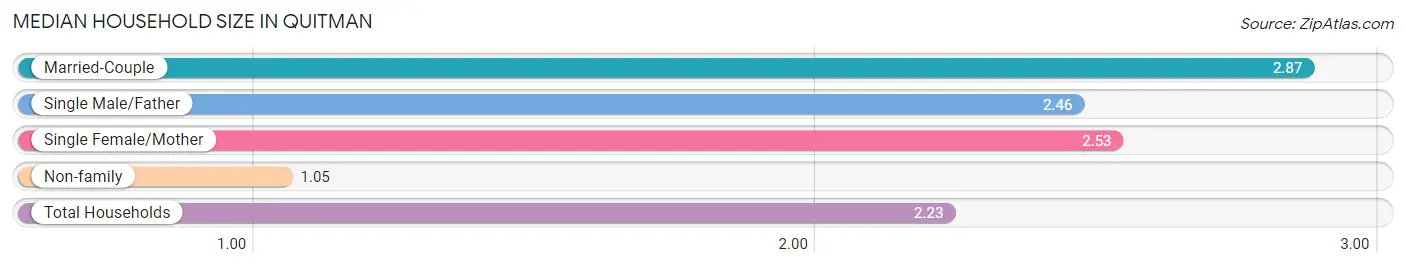
| Household Type | # Households | Household Size |
| Married-Couple | 149 (45.4%) | 2.87 |
| Single Male/Father | 39 (11.9%) | 2.46 |
| Single Female/Mother | 40 (12.2%) | 2.53 |
| Non-family | 100 (30.5%) | 1.05 |
| Total Households | 328 (100.0%) | 2.23 |
Household Size by Marriage Status in Quitman
Out of a total of 328 households in Quitman, 228 (69.5%) are family households, while 100 (30.5%) are nonfamily households. The most numerous type of family households are 2-person households, comprising 132, and the most common type of nonfamily households are 1-person households, comprising 91.
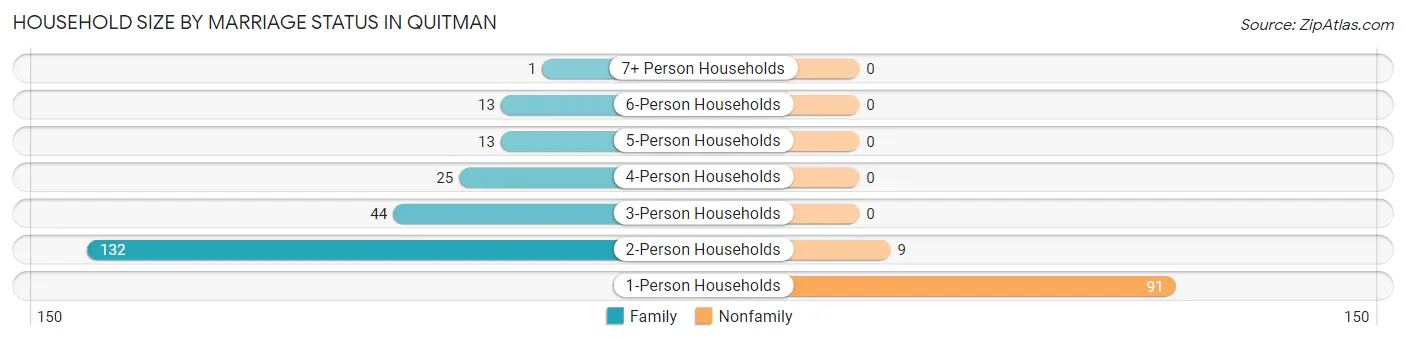
| Household Size | Family Households | Nonfamily Households |
| 1-Person Households | - | 91 (27.7%) |
| 2-Person Households | 132 (40.2%) | 9 (2.7%) |
| 3-Person Households | 44 (13.4%) | 0 (0.0%) |
| 4-Person Households | 25 (7.6%) | 0 (0.0%) |
| 5-Person Households | 13 (4.0%) | 0 (0.0%) |
| 6-Person Households | 13 (4.0%) | 0 (0.0%) |
| 7+ Person Households | 1 (0.3%) | 0 (0.0%) |
| Total | 228 (69.5%) | 100 (30.5%) |
Female Fertility in Quitman
Fertility by Age in Quitman
Average fertility rate in Quitman is 61.0 births per 1,000 women. Women in the age bracket of 20 to 34 years have the highest fertility rate with 125.0 births per 1,000 women. Women in the age bracket of 20 to 34 years acount for 100.0% of all women with births.
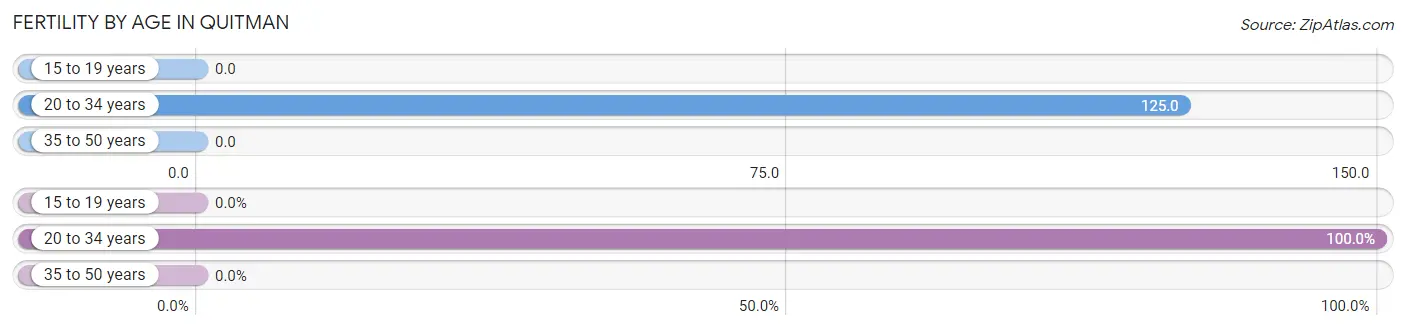
| Age Bracket | Women with Births | Births / 1,000 Women |
| 15 to 19 years | 0 (0.0%) | 0.0 |
| 20 to 34 years | 9 (100.0%) | 125.0 |
| 35 to 50 years | 0 (0.0%) | 0.0 |
| Total | 9 (100.0%) | 61.0 |
Fertility by Age by Marriage Status in Quitman
22.2% of women with births (9) in Quitman are married. The highest percentage of unmarried women with births falls into 20 to 34 years age bracket with 77.8% of them unmarried at the time of birth, while the lowest percentage of unmarried women with births belong to 20 to 34 years age bracket with 77.8% of them unmarried.
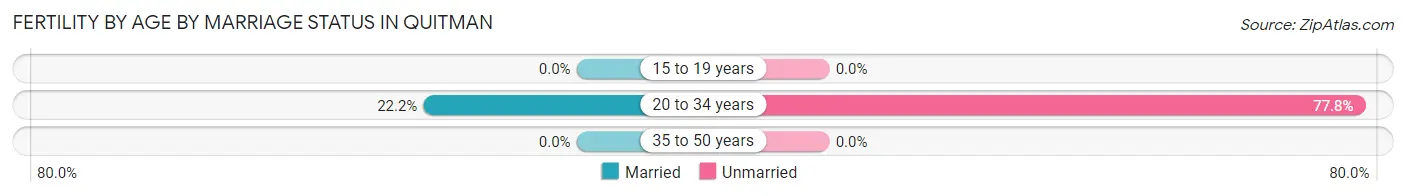
| Age Bracket | Married | Unmarried |
| 15 to 19 years | 0 (0.0%) | 0 (0.0%) |
| 20 to 34 years | 2 (22.2%) | 7 (77.8%) |
| 35 to 50 years | 0 (0.0%) | 0 (0.0%) |
| Total | 2 (22.2%) | 7 (77.8%) |
Fertility by Education in Quitman
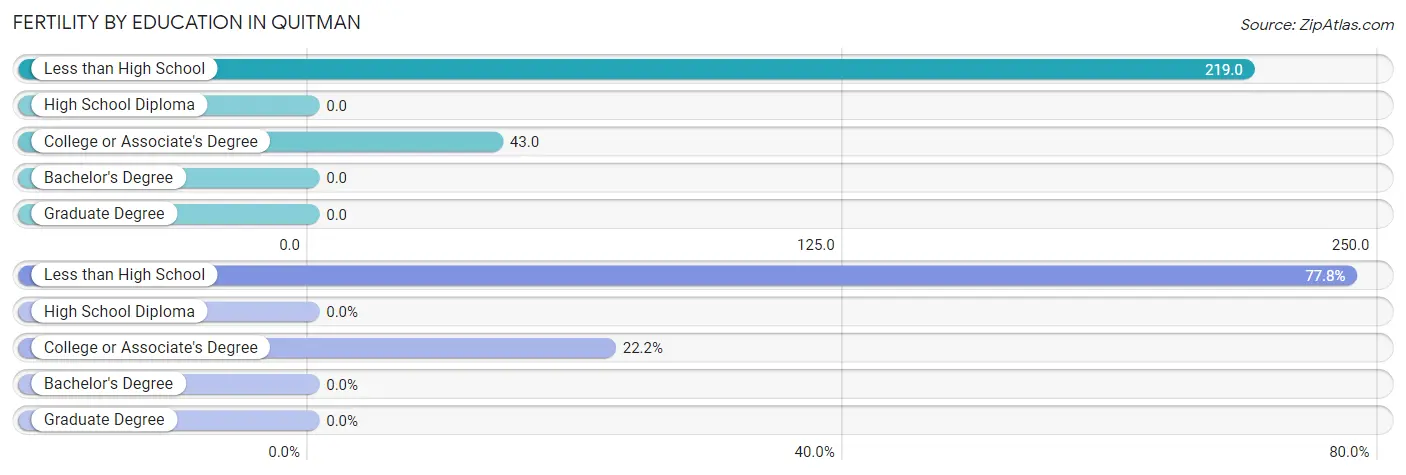
| Educational Attainment | Women with Births | Births / 1,000 Women |
| Less than High School | 7 (77.8%) | 219.0 |
| High School Diploma | 0 (0.0%) | 0.0 |
| College or Associate's Degree | 2 (22.2%) | 43.0 |
| Bachelor's Degree | 0 (0.0%) | 0.0 |
| Graduate Degree | 0 (0.0%) | 0.0 |
| Total | 9 (100.0%) | 61.0 |
Fertility by Education by Marriage Status in Quitman
77.8% of women with births in Quitman are unmarried. Women with the educational attainment of college or associate's degree are most likely to be married with 100.0% of them married at childbirth, while women with the educational attainment of less than high school are least likely to be married with 100.0% of them unmarried at childbirth.
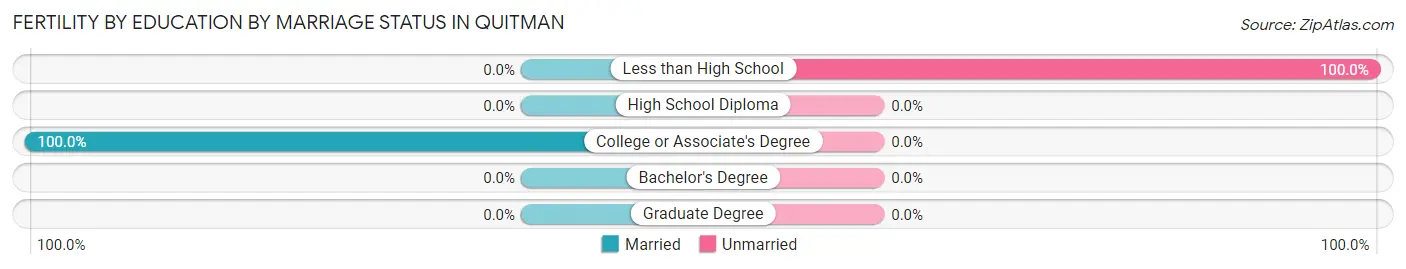
| Educational Attainment | Married | Unmarried |
| Less than High School | 0 (0.0%) | 7 (100.0%) |
| High School Diploma | 0 (0.0%) | 0 (0.0%) |
| College or Associate's Degree | 2 (100.0%) | 0 (0.0%) |
| Bachelor's Degree | 0 (0.0%) | 0 (0.0%) |
| Graduate Degree | 0 (0.0%) | 0 (0.0%) |
| Total | 2 (22.2%) | 7 (77.8%) |
Employment Characteristics in Quitman
Employment by Class of Employer in Quitman
Among the 290 employed individuals in Quitman, private company employees (207 | 71.4%), state government employees (33 | 11.4%), and self-employed (incorporated) (16 | 5.5%) make up the most common classes of employment.
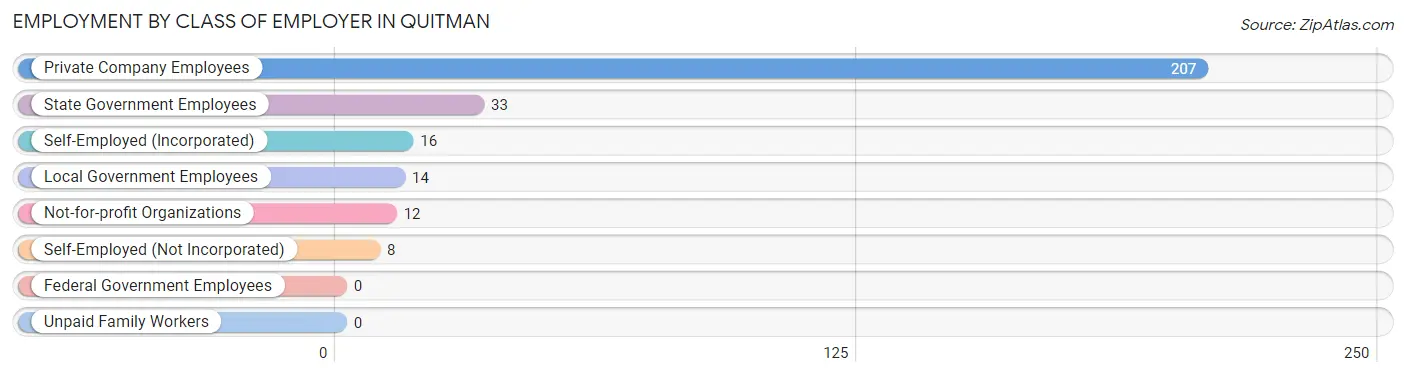
| Employer Class | # Employees | % Employees |
| Private Company Employees | 207 | 71.4% |
| Self-Employed (Incorporated) | 16 | 5.5% |
| Self-Employed (Not Incorporated) | 8 | 2.8% |
| Not-for-profit Organizations | 12 | 4.1% |
| Local Government Employees | 14 | 4.8% |
| State Government Employees | 33 | 11.4% |
| Federal Government Employees | 0 | 0.0% |
| Unpaid Family Workers | 0 | 0.0% |
| Total | 290 | 100.0% |
Employment Status by Age in Quitman
According to the labor force statistics for Quitman, out of the total population over 16 years of age (598), 56.4% or 337 individuals are in the labor force, with 13.9% or 47 of them unemployed. The age group with the highest labor force participation rate is 20 to 24 years, with 94.4% or 51 individuals in the labor force. Within the labor force, the 16 to 19 years age range has the highest percentage of unemployed individuals, with 91.3% or 21 of them being unemployed.
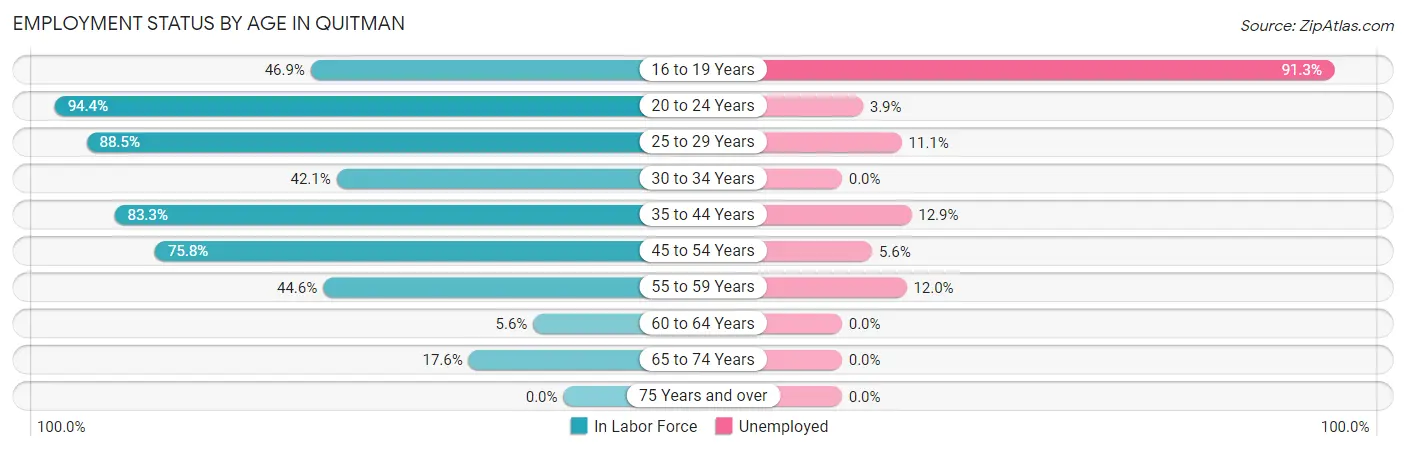
| Age Bracket | In Labor Force | Unemployed |
| 16 to 19 Years | 23 (46.9%) | 21 (91.3%) |
| 20 to 24 Years | 51 (94.4%) | 2 (3.9%) |
| 25 to 29 Years | 54 (88.5%) | 6 (11.1%) |
| 30 to 34 Years | 8 (42.1%) | 0 (0.0%) |
| 35 to 44 Years | 85 (83.3%) | 11 (12.9%) |
| 45 to 54 Years | 72 (75.8%) | 4 (5.6%) |
| 55 to 59 Years | 25 (44.6%) | 3 (12.0%) |
| 60 to 64 Years | 1 (5.6%) | 0 (0.0%) |
| 65 to 74 Years | 18 (17.6%) | 0 (0.0%) |
| 75 Years and over | 0 (0.0%) | 0 (0.0%) |
| Total | 337 (56.4%) | 47 (13.9%) |
Employment Status by Educational Attainment in Quitman
According to labor force statistics for Quitman, 69.8% of individuals (245) out of the total population between 25 and 64 years of age (351) are in the labor force, with 9.8% or 24 of them being unemployed. The group with the highest labor force participation rate are those with the educational attainment of bachelor's degree or higher, with 100.0% or 59 individuals in the labor force. Within the labor force, individuals with high school diploma education have the highest percentage of unemployment, with 18.6% or 18 of them being unemployed.
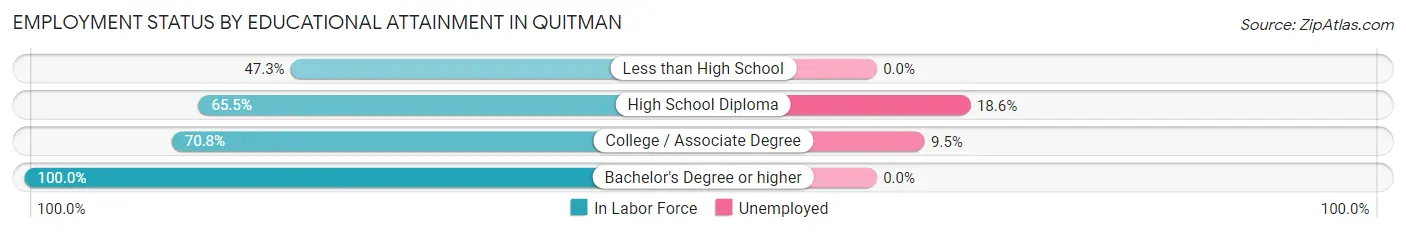
| Educational Attainment | In Labor Force | Unemployed |
| Less than High School | 26 (47.3%) | 0 (0.0%) |
| High School Diploma | 97 (65.5%) | 28 (18.6%) |
| College / Associate Degree | 63 (70.8%) | 8 (9.5%) |
| Bachelor's Degree or higher | 59 (100.0%) | 0 (0.0%) |
| Total | 245 (69.8%) | 34 (9.8%) |
Employment Occupations by Sex in Quitman
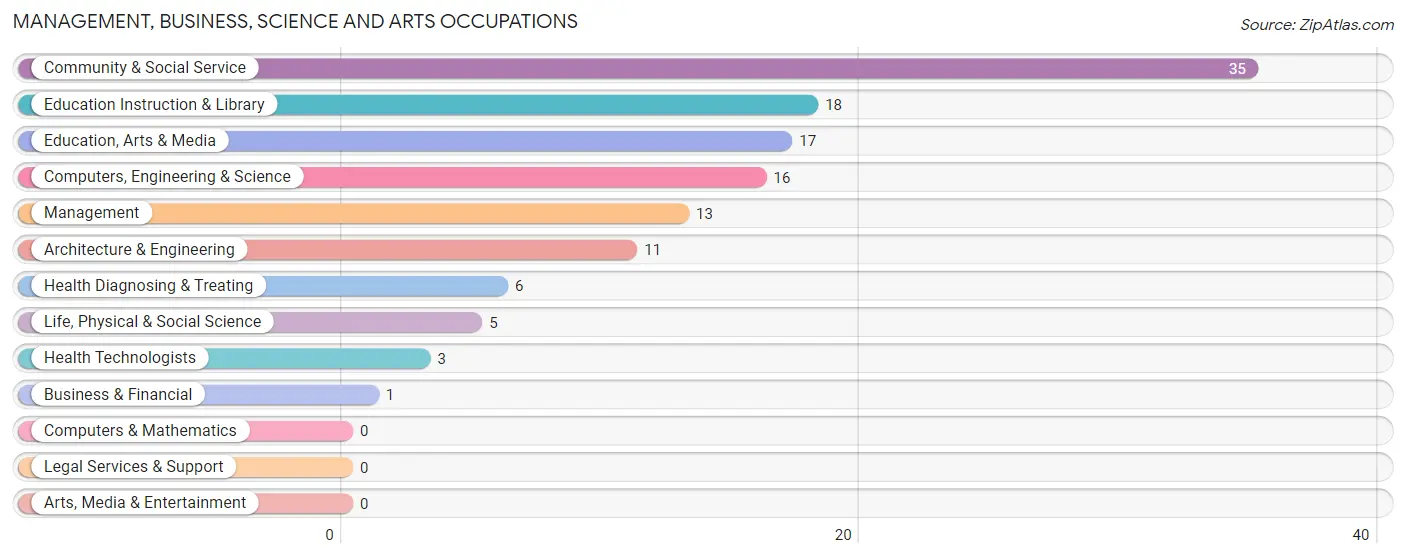
Management, Business, Science and Arts Occupations
The most common Management, Business, Science and Arts occupations in Quitman are Community & Social Service (35 | 12.1%), Education Instruction & Library (18 | 6.2%), Education, Arts & Media (17 | 5.9%), Computers, Engineering & Science (16 | 5.5%), and Management (13 | 4.5%).
Management, Business, Science and Arts Occupations by Sex
Within the Management, Business, Science and Arts occupations in Quitman, the most male-oriented occupations are Business & Financial (100.0%), Architecture & Engineering (100.0%), and Management (84.6%), while the most female-oriented occupations are Life, Physical & Social Science (100.0%), Education, Arts & Media (100.0%), and Health Technologists (100.0%).
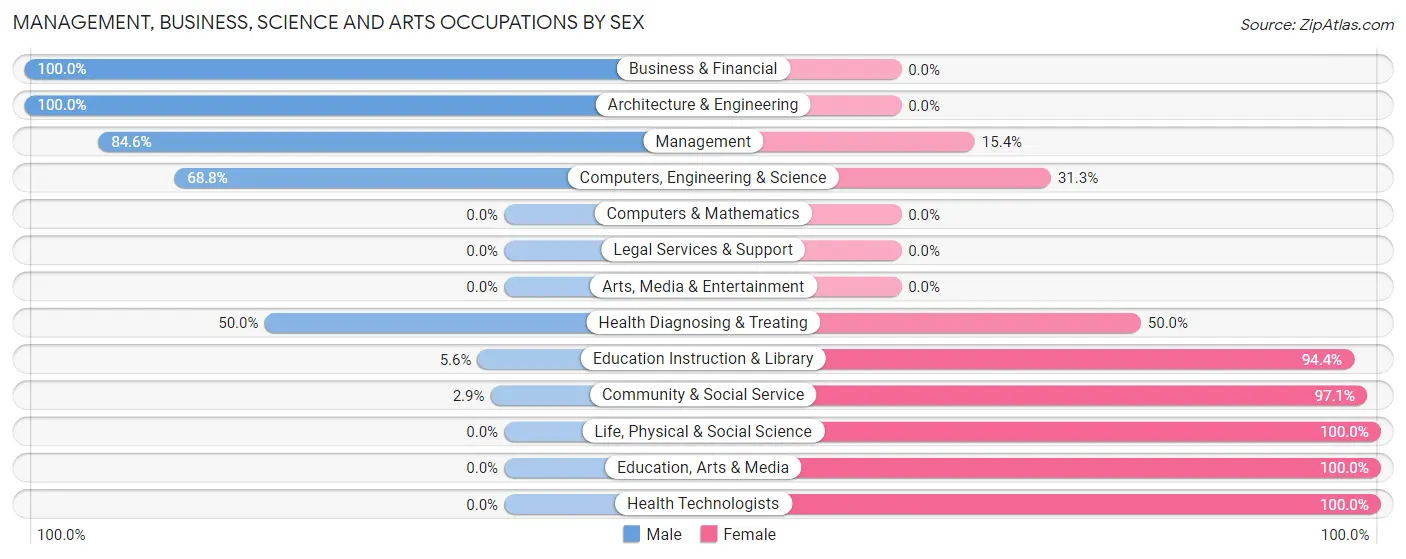
| Occupation | Male | Female |
| Management | 11 (84.6%) | 2 (15.4%) |
| Business & Financial | 1 (100.0%) | 0 (0.0%) |
| Computers, Engineering & Science | 11 (68.8%) | 5 (31.2%) |
| Computers & Mathematics | 0 (0.0%) | 0 (0.0%) |
| Architecture & Engineering | 11 (100.0%) | 0 (0.0%) |
| Life, Physical & Social Science | 0 (0.0%) | 5 (100.0%) |
| Community & Social Service | 1 (2.9%) | 34 (97.1%) |
| Education, Arts & Media | 0 (0.0%) | 17 (100.0%) |
| Legal Services & Support | 0 (0.0%) | 0 (0.0%) |
| Education Instruction & Library | 1 (5.6%) | 17 (94.4%) |
| Arts, Media & Entertainment | 0 (0.0%) | 0 (0.0%) |
| Health Diagnosing & Treating | 3 (50.0%) | 3 (50.0%) |
| Health Technologists | 0 (0.0%) | 3 (100.0%) |
| Total (Category) | 27 (38.0%) | 44 (62.0%) |
| Total (Overall) | 159 (54.8%) | 131 (45.2%) |
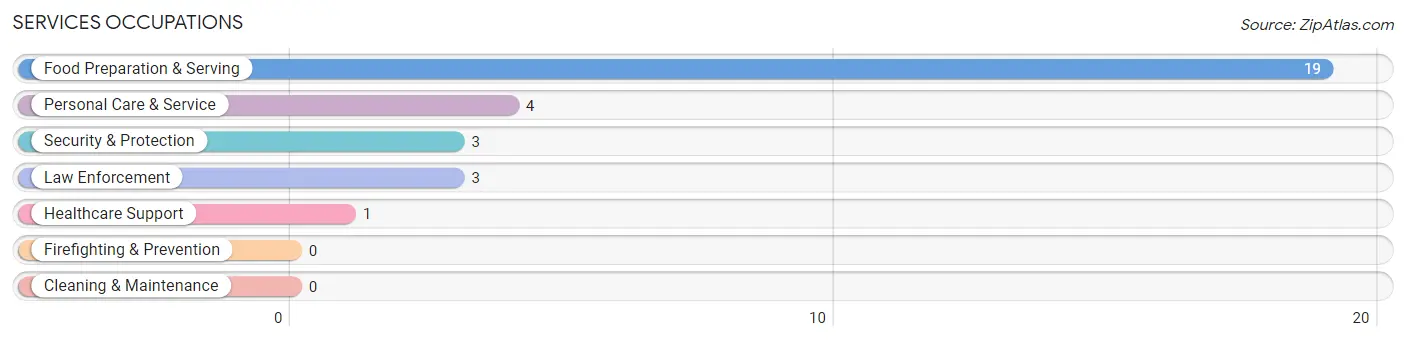
Services Occupations
The most common Services occupations in Quitman are Food Preparation & Serving (19 | 6.6%), Personal Care & Service (4 | 1.4%), Security & Protection (3 | 1.0%), Law Enforcement (3 | 1.0%), and Healthcare Support (1 | 0.3%).
Services Occupations by Sex
Within the Services occupations in Quitman, the most male-oriented occupations are Security & Protection (100.0%), and Law Enforcement (100.0%), while the most female-oriented occupations are Healthcare Support (100.0%), Food Preparation & Serving (100.0%), and Personal Care & Service (100.0%).
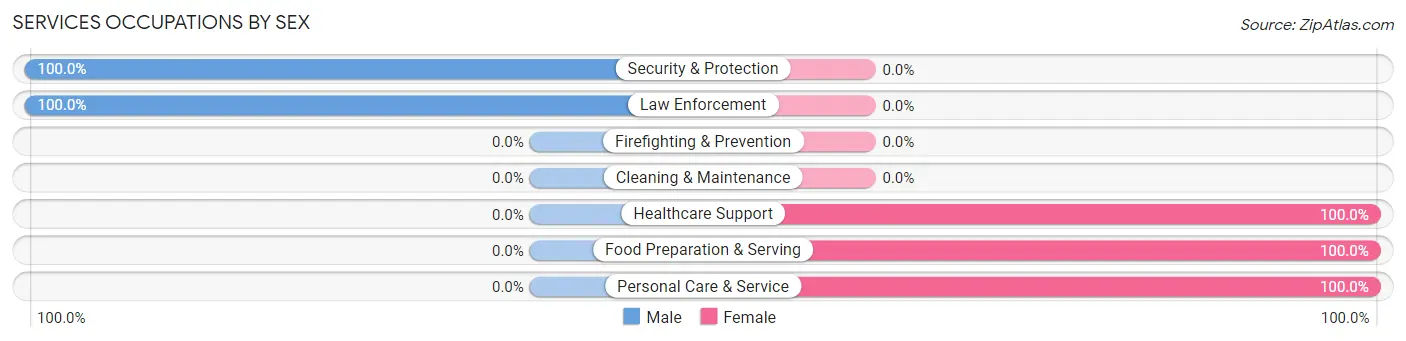
| Occupation | Male | Female |
| Healthcare Support | 0 (0.0%) | 1 (100.0%) |
| Security & Protection | 3 (100.0%) | 0 (0.0%) |
| Firefighting & Prevention | 0 (0.0%) | 0 (0.0%) |
| Law Enforcement | 3 (100.0%) | 0 (0.0%) |
| Food Preparation & Serving | 0 (0.0%) | 19 (100.0%) |
| Cleaning & Maintenance | 0 (0.0%) | 0 (0.0%) |
| Personal Care & Service | 0 (0.0%) | 4 (100.0%) |
| Total (Category) | 3 (11.1%) | 24 (88.9%) |
| Total (Overall) | 159 (54.8%) | 131 (45.2%) |
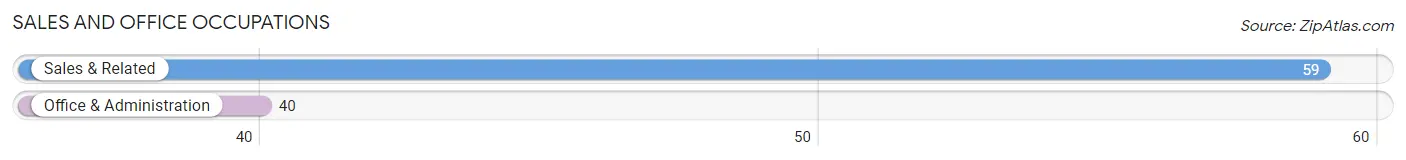
Sales and Office Occupations
The most common Sales and Office occupations in Quitman are Sales & Related (59 | 20.3%), and Office & Administration (40 | 13.8%).
Sales and Office Occupations by Sex
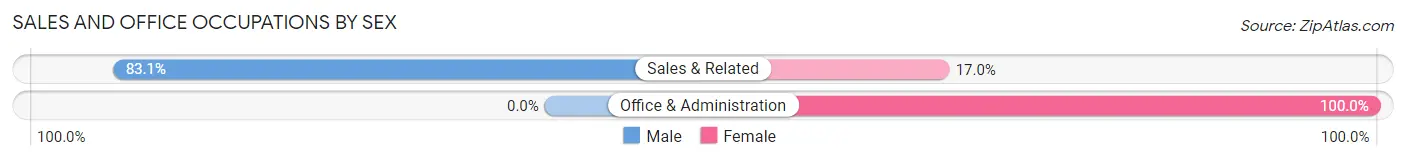
| Occupation | Male | Female |
| Sales & Related | 49 (83.1%) | 10 (17.0%) |
| Office & Administration | 0 (0.0%) | 40 (100.0%) |
| Total (Category) | 49 (49.5%) | 50 (50.5%) |
| Total (Overall) | 159 (54.8%) | 131 (45.2%) |
Natural Resources, Construction and Maintenance Occupations
The most common Natural Resources, Construction and Maintenance occupations in Quitman are Construction & Extraction (27 | 9.3%), and Installation, Maintenance & Repair (23 | 7.9%).
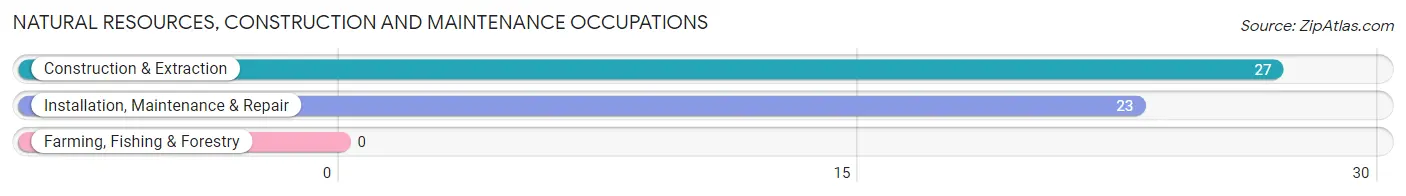
Natural Resources, Construction and Maintenance Occupations by Sex
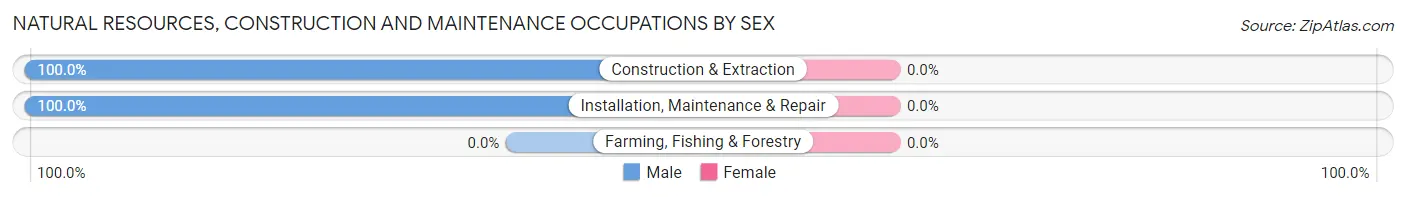
| Occupation | Male | Female |
| Farming, Fishing & Forestry | 0 (0.0%) | 0 (0.0%) |
| Construction & Extraction | 27 (100.0%) | 0 (0.0%) |
| Installation, Maintenance & Repair | 23 (100.0%) | 0 (0.0%) |
| Total (Category) | 50 (100.0%) | 0 (0.0%) |
| Total (Overall) | 159 (54.8%) | 131 (45.2%) |
Production, Transportation and Moving Occupations
The most common Production, Transportation and Moving occupations in Quitman are Production (32 | 11.0%), Transportation (6 | 2.1%), and Material Moving (5 | 1.7%).
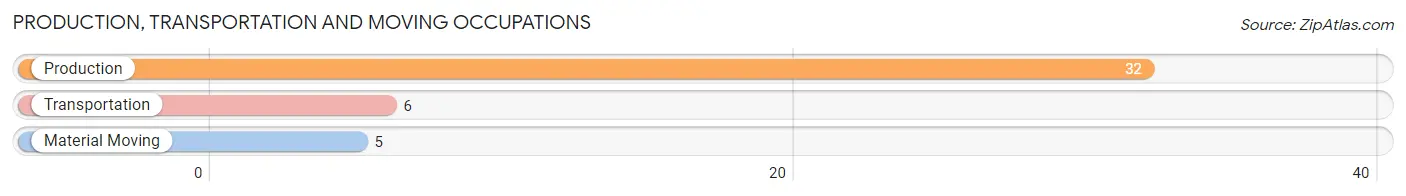
Production, Transportation and Moving Occupations by Sex
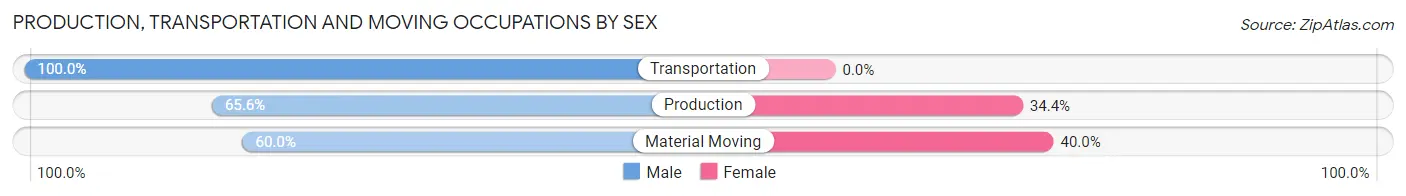
| Occupation | Male | Female |
| Production | 21 (65.6%) | 11 (34.4%) |
| Transportation | 6 (100.0%) | 0 (0.0%) |
| Material Moving | 3 (60.0%) | 2 (40.0%) |
| Total (Category) | 30 (69.8%) | 13 (30.2%) |
| Total (Overall) | 159 (54.8%) | 131 (45.2%) |
Employment Industries by Sex in Quitman
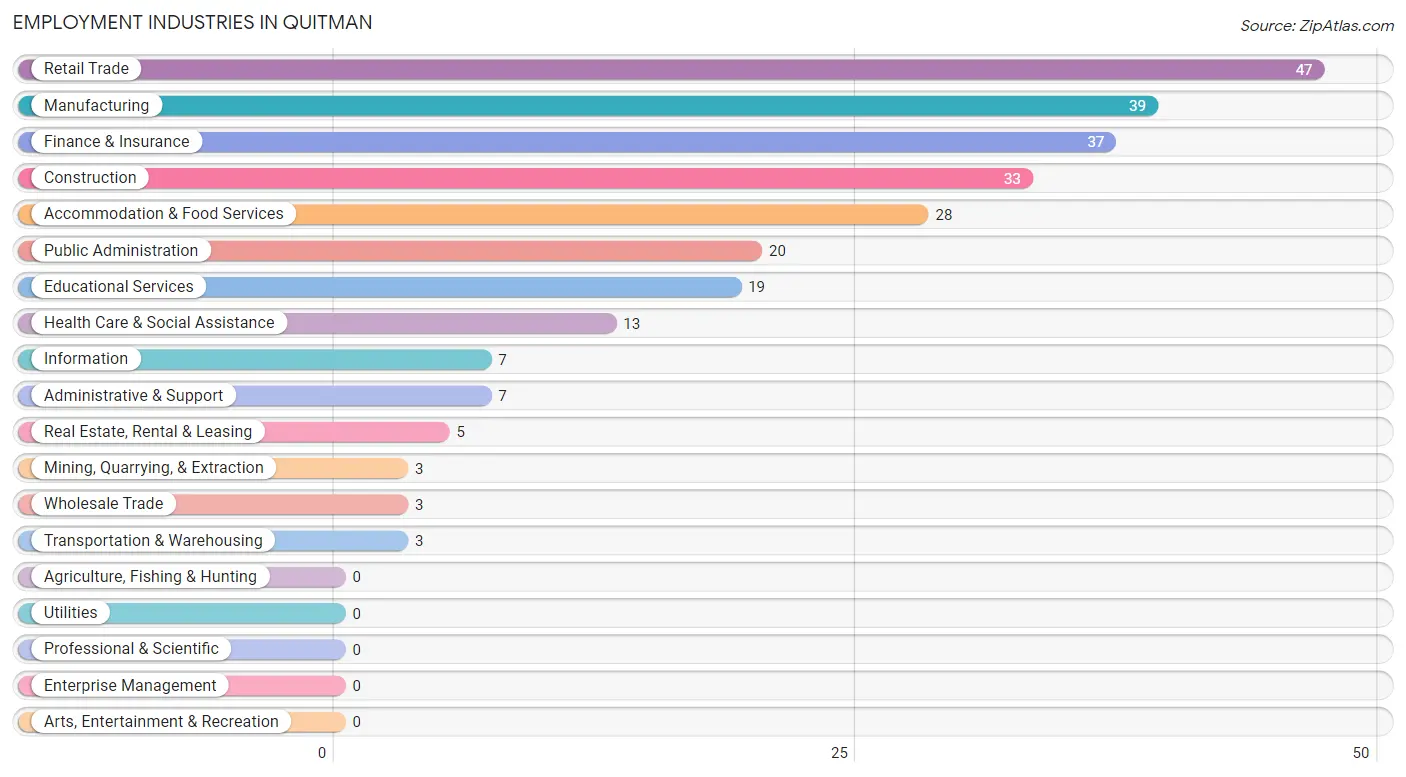
Employment Industries in Quitman
The major employment industries in Quitman include Retail Trade (47 | 16.2%), Manufacturing (39 | 13.5%), Finance & Insurance (37 | 12.8%), Construction (33 | 11.4%), and Accommodation & Food Services (28 | 9.7%).
Employment Industries by Sex in Quitman
The Quitman industries that see more men than women are Mining, Quarrying, & Extraction (100.0%), Construction (100.0%), and Transportation & Warehousing (100.0%), whereas the industries that tend to have a higher number of women are Information (85.7%), Public Administration (85.0%), and Educational Services (84.2%).
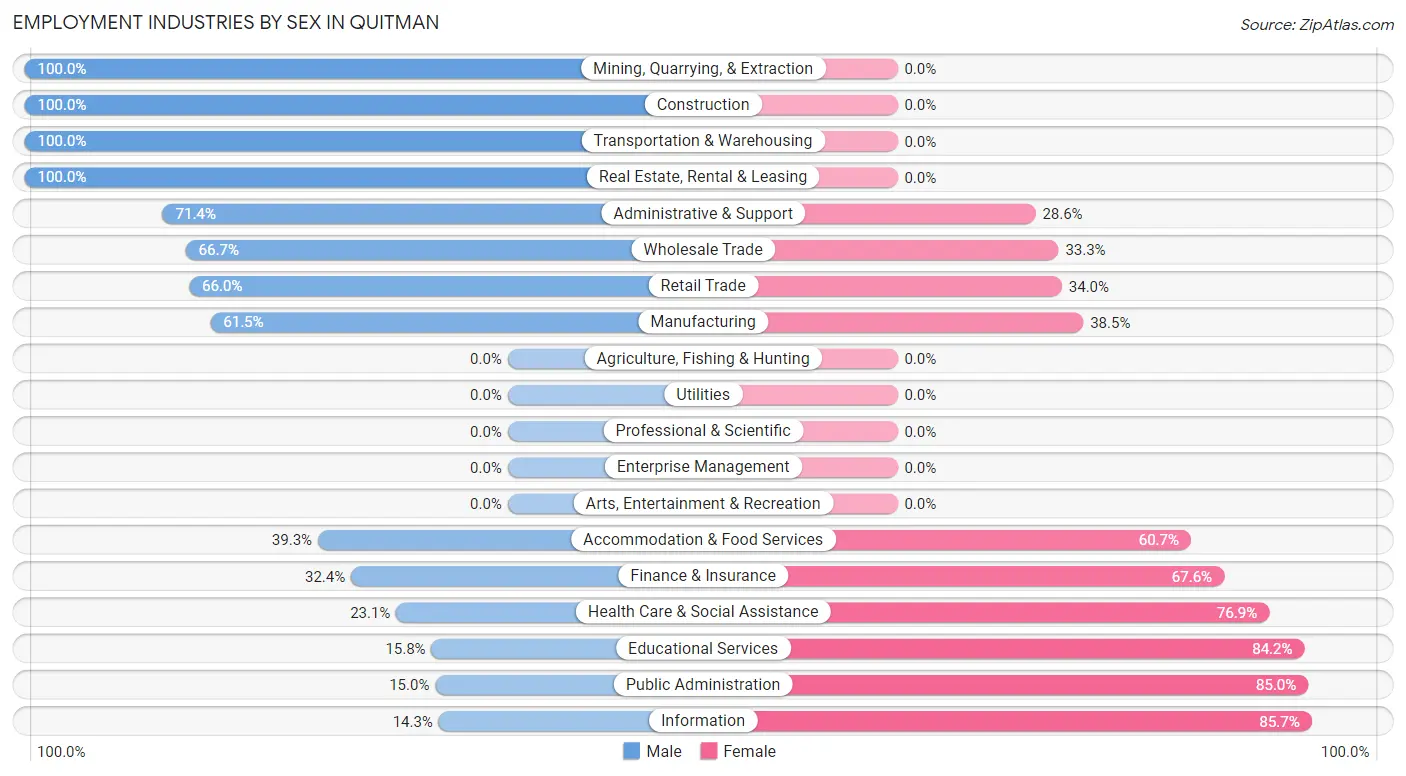
| Industry | Male | Female |
| Agriculture, Fishing & Hunting | 0 (0.0%) | 0 (0.0%) |
| Mining, Quarrying, & Extraction | 3 (100.0%) | 0 (0.0%) |
| Construction | 33 (100.0%) | 0 (0.0%) |
| Manufacturing | 24 (61.5%) | 15 (38.5%) |
| Wholesale Trade | 2 (66.7%) | 1 (33.3%) |
| Retail Trade | 31 (66.0%) | 16 (34.0%) |
| Transportation & Warehousing | 3 (100.0%) | 0 (0.0%) |
| Utilities | 0 (0.0%) | 0 (0.0%) |
| Information | 1 (14.3%) | 6 (85.7%) |
| Finance & Insurance | 12 (32.4%) | 25 (67.6%) |
| Real Estate, Rental & Leasing | 5 (100.0%) | 0 (0.0%) |
| Professional & Scientific | 0 (0.0%) | 0 (0.0%) |
| Enterprise Management | 0 (0.0%) | 0 (0.0%) |
| Administrative & Support | 5 (71.4%) | 2 (28.6%) |
| Educational Services | 3 (15.8%) | 16 (84.2%) |
| Health Care & Social Assistance | 3 (23.1%) | 10 (76.9%) |
| Arts, Entertainment & Recreation | 0 (0.0%) | 0 (0.0%) |
| Accommodation & Food Services | 11 (39.3%) | 17 (60.7%) |
| Public Administration | 3 (15.0%) | 17 (85.0%) |
| Total | 159 (54.8%) | 131 (45.2%) |
Education in Quitman
School Enrollment in Quitman
The most common levels of schooling among the 117 students in Quitman are high school (36 | 30.8%), middle school (32 | 27.4%), and elementary school (25 | 21.4%).
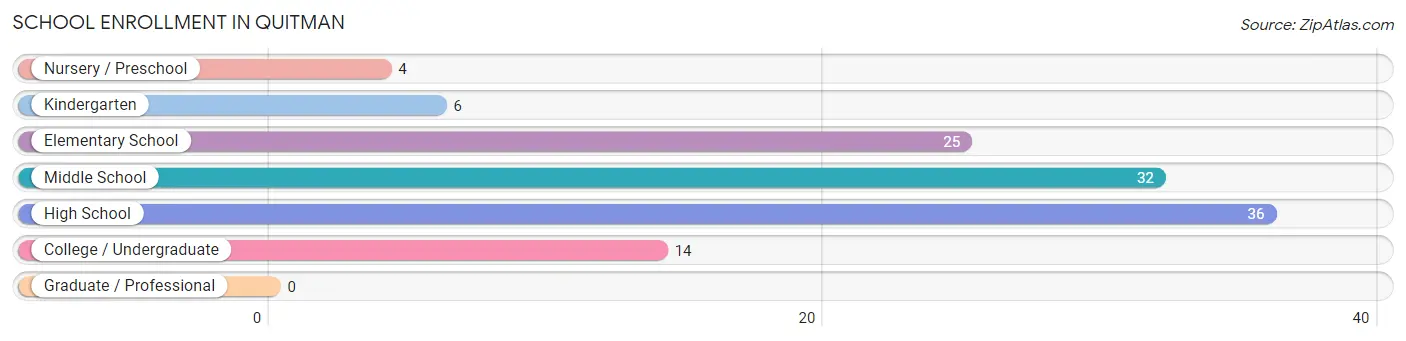
| School Level | # Students | % Students |
| Nursery / Preschool | 4 | 3.4% |
| Kindergarten | 6 | 5.1% |
| Elementary School | 25 | 21.4% |
| Middle School | 32 | 27.4% |
| High School | 36 | 30.8% |
| College / Undergraduate | 14 | 12.0% |
| Graduate / Professional | 0 | 0.0% |
| Total | 117 | 100.0% |
School Enrollment by Age by Funding Source in Quitman
Out of a total of 117 students who are enrolled in schools in Quitman, 2 (1.7%) attend a private institution, while the remaining 115 (98.3%) are enrolled in public schools. The age group of 35 years and over has the highest likelihood of being enrolled in private schools, with 2 (50.0% in the age bracket) enrolled. Conversely, the age group of 3 to 4 year olds has the lowest likelihood of being enrolled in a private school, with 2 (100.0% in the age bracket) attending a public institution.
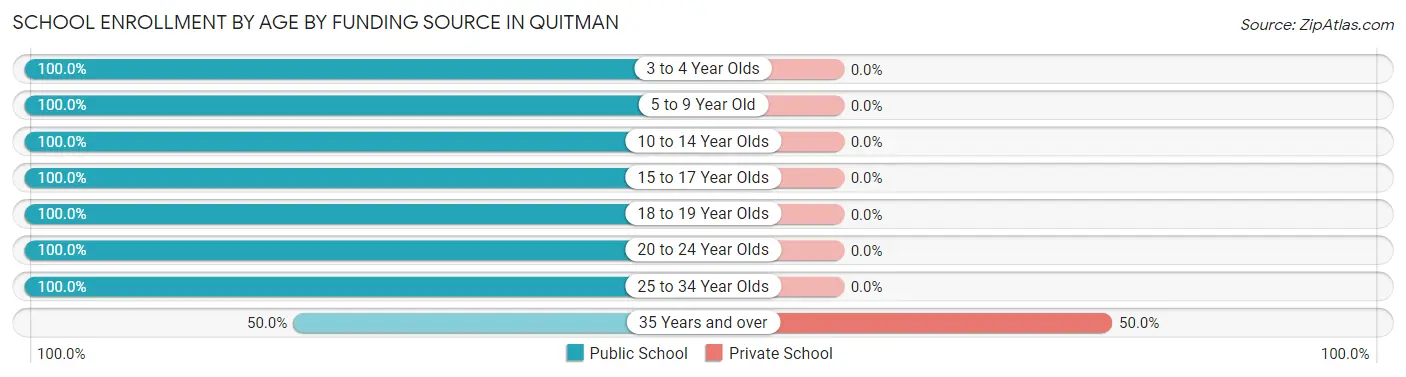
| Age Bracket | Public School | Private School |
| 3 to 4 Year Olds | 2 (100.0%) | 0 (0.0%) |
| 5 to 9 Year Old | 27 (100.0%) | 0 (0.0%) |
| 10 to 14 Year Olds | 46 (100.0%) | 0 (0.0%) |
| 15 to 17 Year Olds | 27 (100.0%) | 0 (0.0%) |
| 18 to 19 Year Olds | 3 (100.0%) | 0 (0.0%) |
| 20 to 24 Year Olds | 2 (100.0%) | 0 (0.0%) |
| 25 to 34 Year Olds | 6 (100.0%) | 0 (0.0%) |
| 35 Years and over | 2 (50.0%) | 2 (50.0%) |
| Total | 115 (98.3%) | 2 (1.7%) |
Educational Attainment by Field of Study in Quitman
Business (29 | 38.2%), education (24 | 31.6%), physical & health sciences (11 | 14.5%), bio, nature & agricultural (4 | 5.3%), and science & technology (4 | 5.3%) are the most common fields of study among 76 individuals in Quitman who have obtained a bachelor's degree or higher.
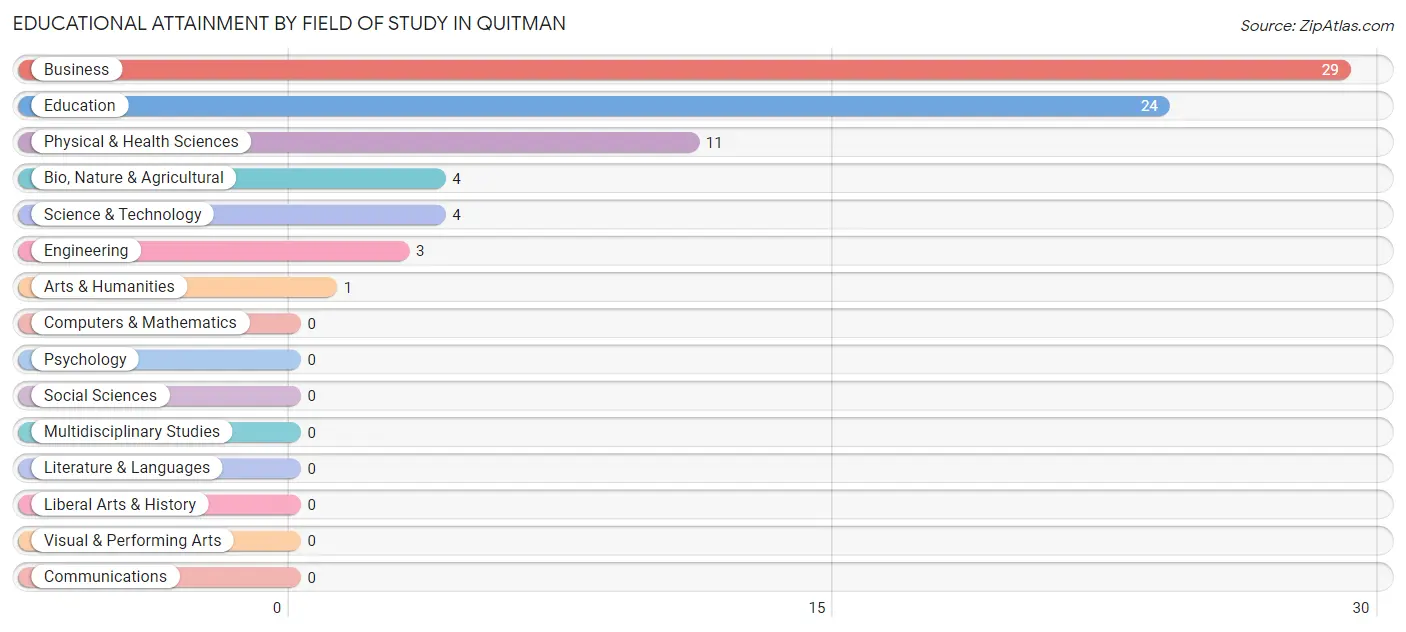
| Field of Study | # Graduates | % Graduates |
| Computers & Mathematics | 0 | 0.0% |
| Bio, Nature & Agricultural | 4 | 5.3% |
| Physical & Health Sciences | 11 | 14.5% |
| Psychology | 0 | 0.0% |
| Social Sciences | 0 | 0.0% |
| Engineering | 3 | 4.0% |
| Multidisciplinary Studies | 0 | 0.0% |
| Science & Technology | 4 | 5.3% |
| Business | 29 | 38.2% |
| Education | 24 | 31.6% |
| Literature & Languages | 0 | 0.0% |
| Liberal Arts & History | 0 | 0.0% |
| Visual & Performing Arts | 0 | 0.0% |
| Communications | 0 | 0.0% |
| Arts & Humanities | 1 | 1.3% |
| Total | 76 | 100.0% |
Transportation & Commute in Quitman
Vehicle Availability by Sex in Quitman
The most prevalent vehicle ownership categories in Quitman are males with 1 vehicle (55, accounting for 34.6%) and females with 1 vehicle (34, making up 42.0%).
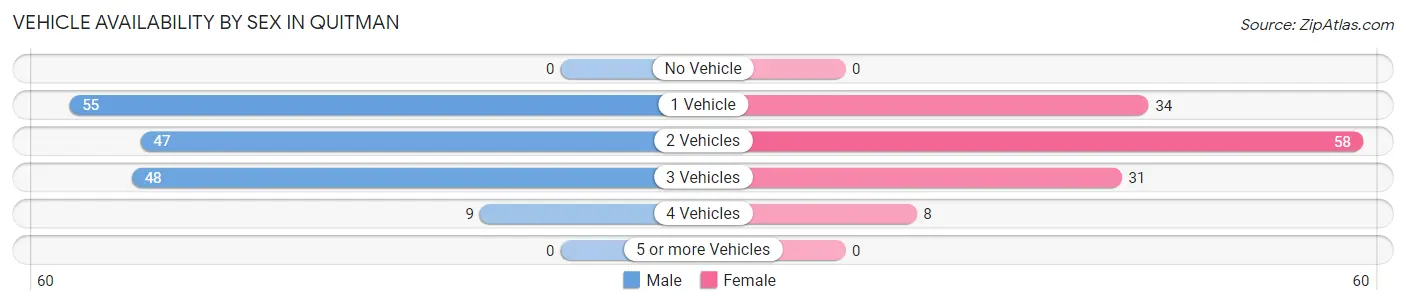
| Vehicles Available | Male | Female |
| No Vehicle | 0 (0.0%) | 0 (0.0%) |
| 1 Vehicle | 55 (34.6%) | 34 (26.0%) |
| 2 Vehicles | 47 (29.6%) | 58 (44.3%) |
| 3 Vehicles | 48 (30.2%) | 31 (23.7%) |
| 4 Vehicles | 9 (5.7%) | 8 (6.1%) |
| 5 or more Vehicles | 0 (0.0%) | 0 (0.0%) |
| Total | 159 (100.0%) | 131 (100.0%) |
Commute Time in Quitman
The most frequently occuring commute durations in Quitman are less than 5 minutes (79 commuters, 27.2%), 10 to 14 minutes (39 commuters, 13.5%), and 20 to 24 minutes (37 commuters, 12.8%).
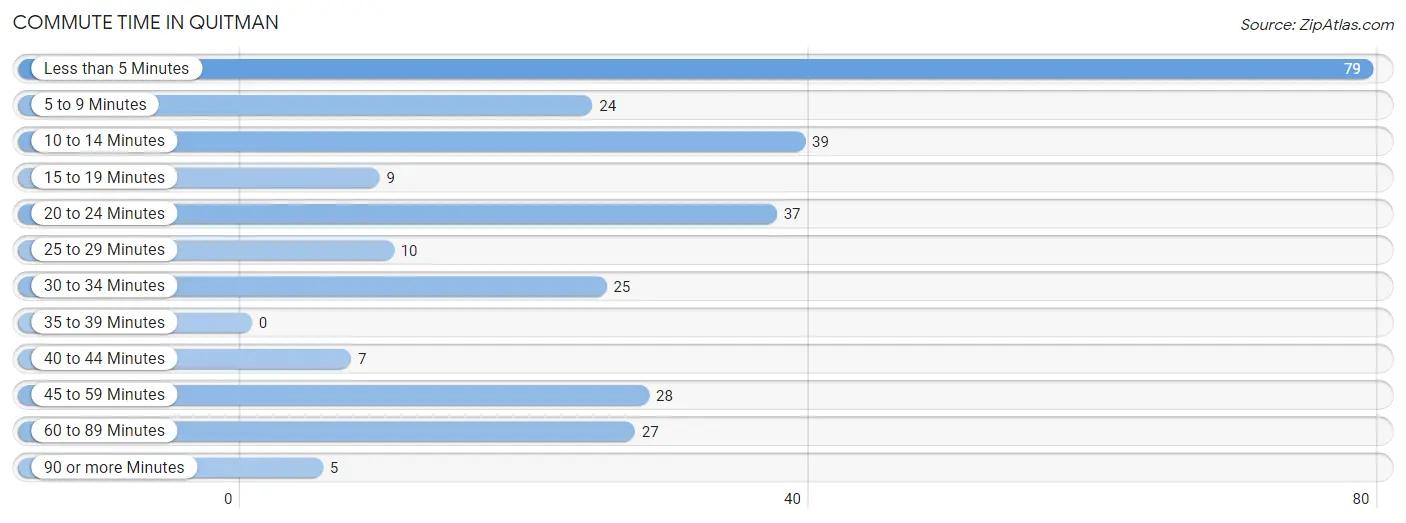
| Commute Time | # Commuters | % Commuters |
| Less than 5 Minutes | 79 | 27.2% |
| 5 to 9 Minutes | 24 | 8.3% |
| 10 to 14 Minutes | 39 | 13.5% |
| 15 to 19 Minutes | 9 | 3.1% |
| 20 to 24 Minutes | 37 | 12.8% |
| 25 to 29 Minutes | 10 | 3.5% |
| 30 to 34 Minutes | 25 | 8.6% |
| 35 to 39 Minutes | 0 | 0.0% |
| 40 to 44 Minutes | 7 | 2.4% |
| 45 to 59 Minutes | 28 | 9.7% |
| 60 to 89 Minutes | 27 | 9.3% |
| 90 or more Minutes | 5 | 1.7% |
Commute Time by Sex in Quitman
The most common commute times in Quitman are less than 5 minutes (47 commuters, 29.6%) for males and less than 5 minutes (32 commuters, 24.4%) for females.
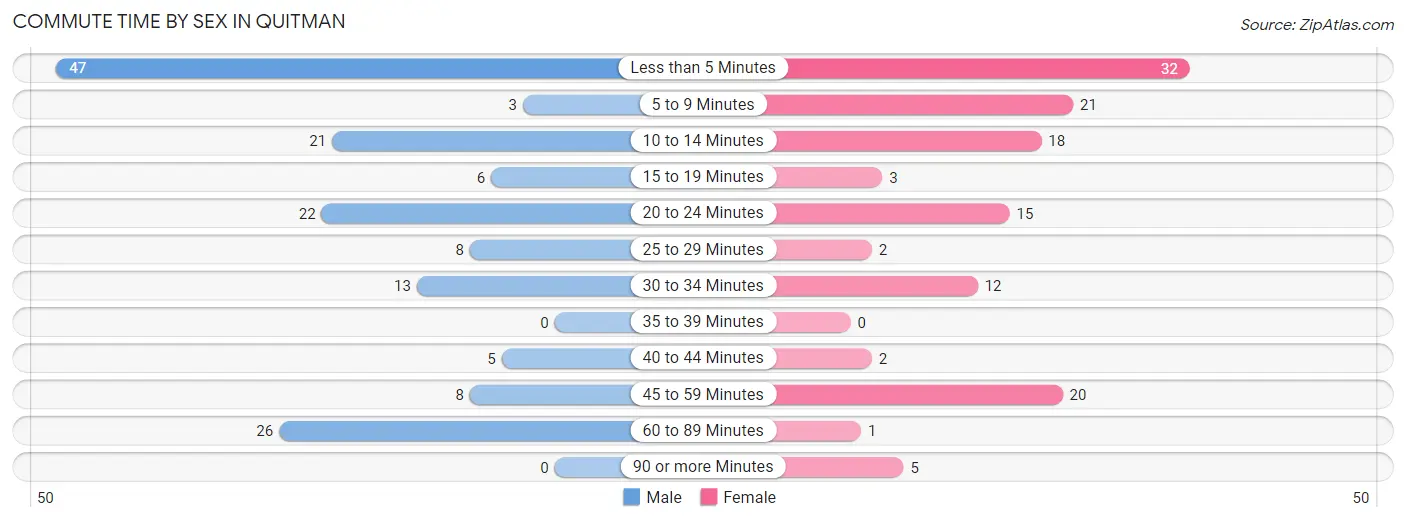
| Commute Time | Male | Female |
| Less than 5 Minutes | 47 (29.6%) | 32 (24.4%) |
| 5 to 9 Minutes | 3 (1.9%) | 21 (16.0%) |
| 10 to 14 Minutes | 21 (13.2%) | 18 (13.7%) |
| 15 to 19 Minutes | 6 (3.8%) | 3 (2.3%) |
| 20 to 24 Minutes | 22 (13.8%) | 15 (11.5%) |
| 25 to 29 Minutes | 8 (5.0%) | 2 (1.5%) |
| 30 to 34 Minutes | 13 (8.2%) | 12 (9.2%) |
| 35 to 39 Minutes | 0 (0.0%) | 0 (0.0%) |
| 40 to 44 Minutes | 5 (3.1%) | 2 (1.5%) |
| 45 to 59 Minutes | 8 (5.0%) | 20 (15.3%) |
| 60 to 89 Minutes | 26 (16.4%) | 1 (0.8%) |
| 90 or more Minutes | 0 (0.0%) | 5 (3.8%) |
Time of Departure to Work by Sex in Quitman
The most frequent times of departure to work in Quitman are 12:00 PM to 3:59 PM (45, 28.3%) for males and 7:00 AM to 7:29 AM (36, 27.5%) for females.
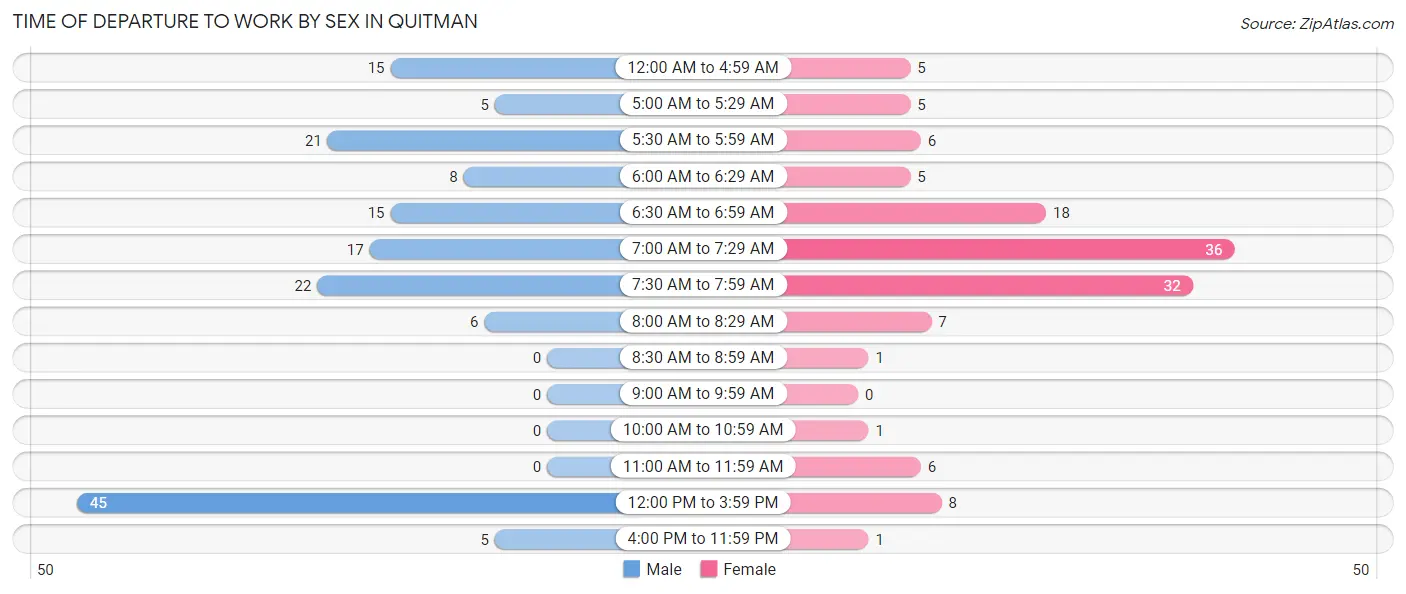
| Time of Departure | Male | Female |
| 12:00 AM to 4:59 AM | 15 (9.4%) | 5 (3.8%) |
| 5:00 AM to 5:29 AM | 5 (3.1%) | 5 (3.8%) |
| 5:30 AM to 5:59 AM | 21 (13.2%) | 6 (4.6%) |
| 6:00 AM to 6:29 AM | 8 (5.0%) | 5 (3.8%) |
| 6:30 AM to 6:59 AM | 15 (9.4%) | 18 (13.7%) |
| 7:00 AM to 7:29 AM | 17 (10.7%) | 36 (27.5%) |
| 7:30 AM to 7:59 AM | 22 (13.8%) | 32 (24.4%) |
| 8:00 AM to 8:29 AM | 6 (3.8%) | 7 (5.3%) |
| 8:30 AM to 8:59 AM | 0 (0.0%) | 1 (0.8%) |
| 9:00 AM to 9:59 AM | 0 (0.0%) | 0 (0.0%) |
| 10:00 AM to 10:59 AM | 0 (0.0%) | 1 (0.8%) |
| 11:00 AM to 11:59 AM | 0 (0.0%) | 6 (4.6%) |
| 12:00 PM to 3:59 PM | 45 (28.3%) | 8 (6.1%) |
| 4:00 PM to 11:59 PM | 5 (3.1%) | 1 (0.8%) |
| Total | 159 (100.0%) | 131 (100.0%) |
Housing Occupancy in Quitman
Occupancy by Ownership in Quitman
Of the total 328 dwellings in Quitman, owner-occupied units account for 191 (58.2%), while renter-occupied units make up 137 (41.8%).
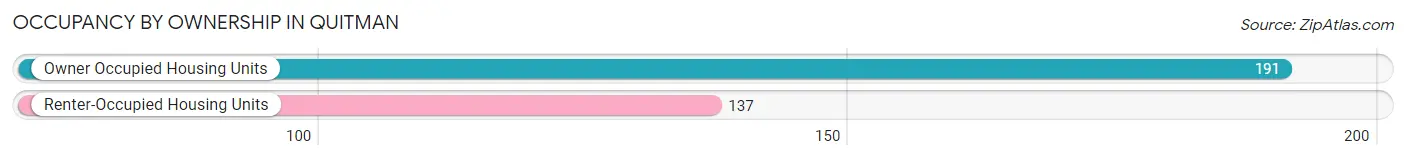
| Occupancy | # Housing Units | % Housing Units |
| Owner Occupied Housing Units | 191 | 58.2% |
| Renter-Occupied Housing Units | 137 | 41.8% |
| Total Occupied Housing Units | 328 | 100.0% |
Occupancy by Household Size in Quitman
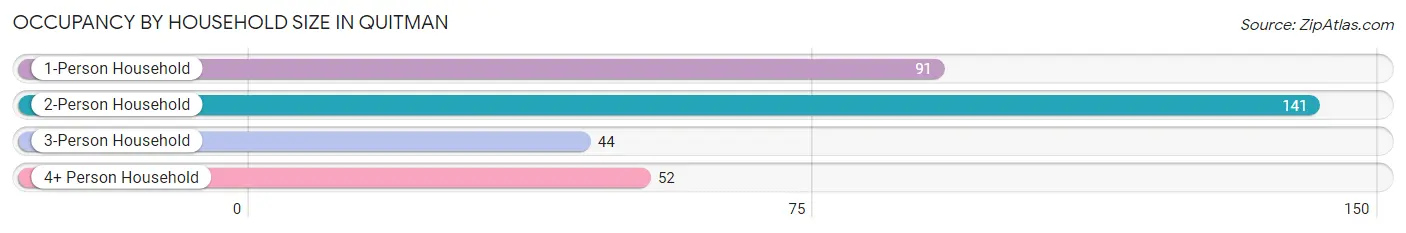
| Household Size | # Housing Units | % Housing Units |
| 1-Person Household | 91 | 27.7% |
| 2-Person Household | 141 | 43.0% |
| 3-Person Household | 44 | 13.4% |
| 4+ Person Household | 52 | 15.9% |
| Total Housing Units | 328 | 100.0% |
Occupancy by Ownership by Household Size in Quitman
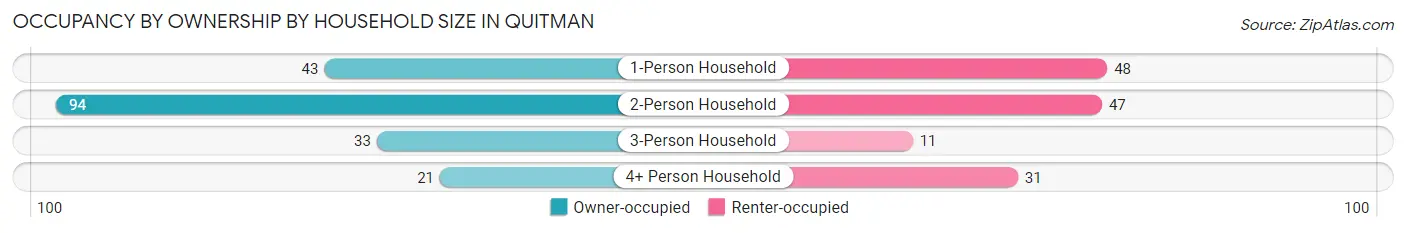
| Household Size | Owner-occupied | Renter-occupied |
| 1-Person Household | 43 (47.2%) | 48 (52.7%) |
| 2-Person Household | 94 (66.7%) | 47 (33.3%) |
| 3-Person Household | 33 (75.0%) | 11 (25.0%) |
| 4+ Person Household | 21 (40.4%) | 31 (59.6%) |
| Total Housing Units | 191 (58.2%) | 137 (41.8%) |
Occupancy by Educational Attainment in Quitman
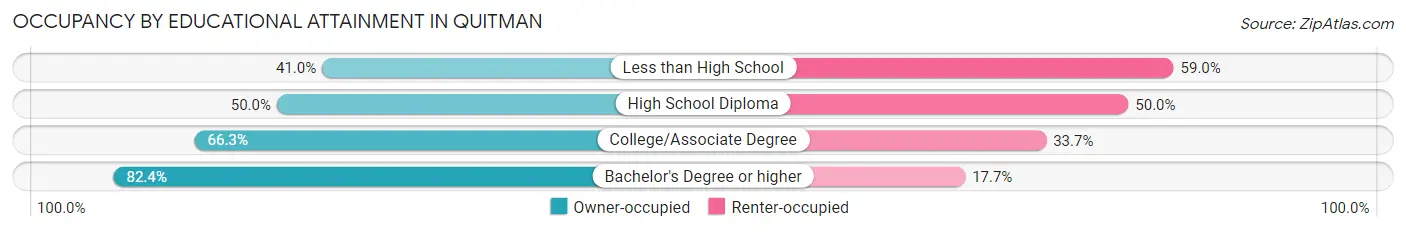
| Household Size | Owner-occupied | Renter-occupied |
| Less than High School | 16 (41.0%) | 23 (59.0%) |
| High School Diploma | 76 (50.0%) | 76 (50.0%) |
| College/Associate Degree | 57 (66.3%) | 29 (33.7%) |
| Bachelor's Degree or higher | 42 (82.4%) | 9 (17.6%) |
Occupancy by Age of Householder in Quitman
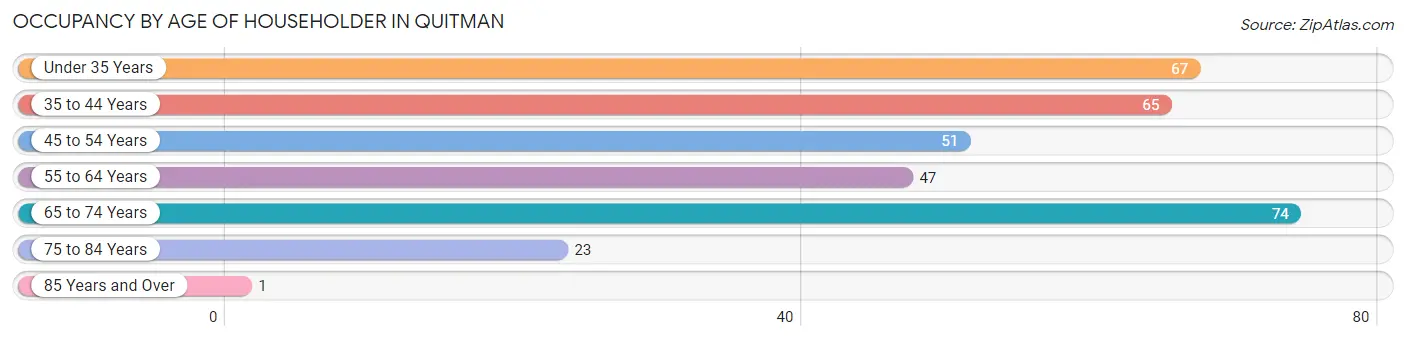
| Age Bracket | # Households | % Households |
| Under 35 Years | 67 | 20.4% |
| 35 to 44 Years | 65 | 19.8% |
| 45 to 54 Years | 51 | 15.5% |
| 55 to 64 Years | 47 | 14.3% |
| 65 to 74 Years | 74 | 22.6% |
| 75 to 84 Years | 23 | 7.0% |
| 85 Years and Over | 1 | 0.3% |
| Total | 328 | 100.0% |
Housing Finances in Quitman
Median Income by Occupancy in Quitman
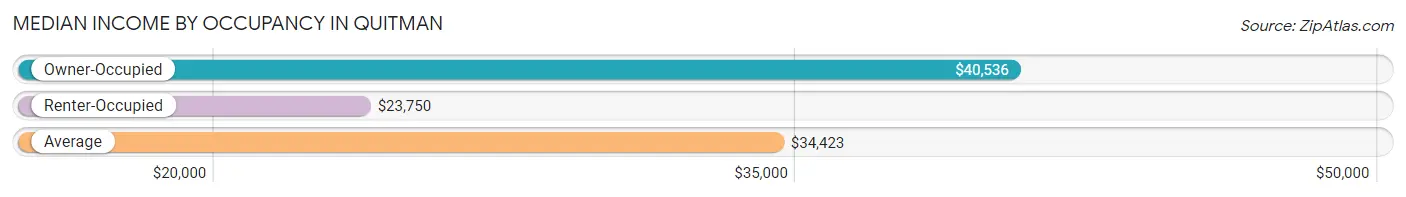
| Occupancy Type | # Households | Median Income |
| Owner-Occupied | 191 (58.2%) | $40,536 |
| Renter-Occupied | 137 (41.8%) | $23,750 |
| Average | 328 (100.0%) | $34,423 |
Occupancy by Householder Income Bracket in Quitman
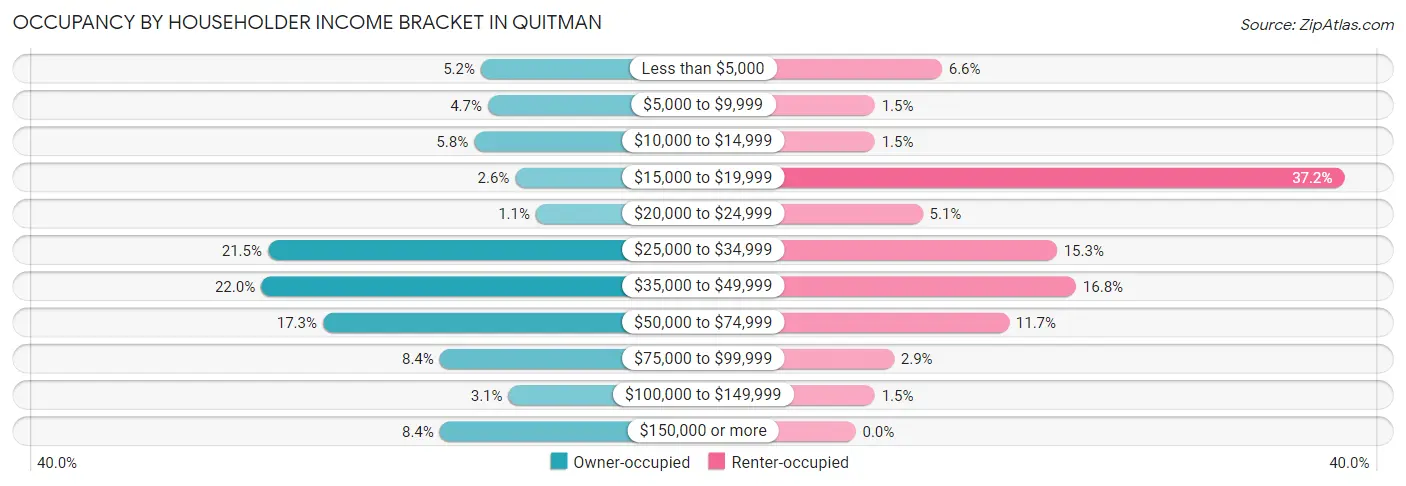
| Income Bracket | Owner-occupied | Renter-occupied |
| Less than $5,000 | 10 (5.2%) | 9 (6.6%) |
| $5,000 to $9,999 | 9 (4.7%) | 2 (1.5%) |
| $10,000 to $14,999 | 11 (5.8%) | 2 (1.5%) |
| $15,000 to $19,999 | 5 (2.6%) | 51 (37.2%) |
| $20,000 to $24,999 | 2 (1.1%) | 7 (5.1%) |
| $25,000 to $34,999 | 41 (21.5%) | 21 (15.3%) |
| $35,000 to $49,999 | 42 (22.0%) | 23 (16.8%) |
| $50,000 to $74,999 | 33 (17.3%) | 16 (11.7%) |
| $75,000 to $99,999 | 16 (8.4%) | 4 (2.9%) |
| $100,000 to $149,999 | 6 (3.1%) | 2 (1.5%) |
| $150,000 or more | 16 (8.4%) | 0 (0.0%) |
| Total | 191 (100.0%) | 137 (100.0%) |
Monthly Housing Cost Tiers in Quitman
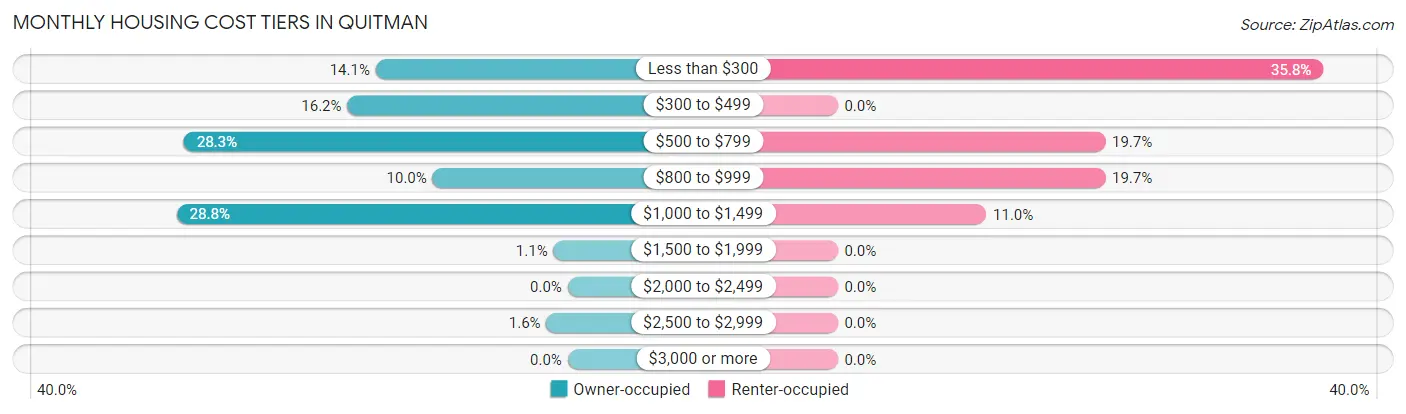
| Monthly Cost | Owner-occupied | Renter-occupied |
| Less than $300 | 27 (14.1%) | 49 (35.8%) |
| $300 to $499 | 31 (16.2%) | 0 (0.0%) |
| $500 to $799 | 54 (28.3%) | 27 (19.7%) |
| $800 to $999 | 19 (10.0%) | 27 (19.7%) |
| $1,000 to $1,499 | 55 (28.8%) | 15 (11.0%) |
| $1,500 to $1,999 | 2 (1.1%) | 0 (0.0%) |
| $2,000 to $2,499 | 0 (0.0%) | 0 (0.0%) |
| $2,500 to $2,999 | 3 (1.6%) | 0 (0.0%) |
| $3,000 or more | 0 (0.0%) | 0 (0.0%) |
| Total | 191 (100.0%) | 137 (100.0%) |
Physical Housing Characteristics in Quitman
Housing Structures in Quitman
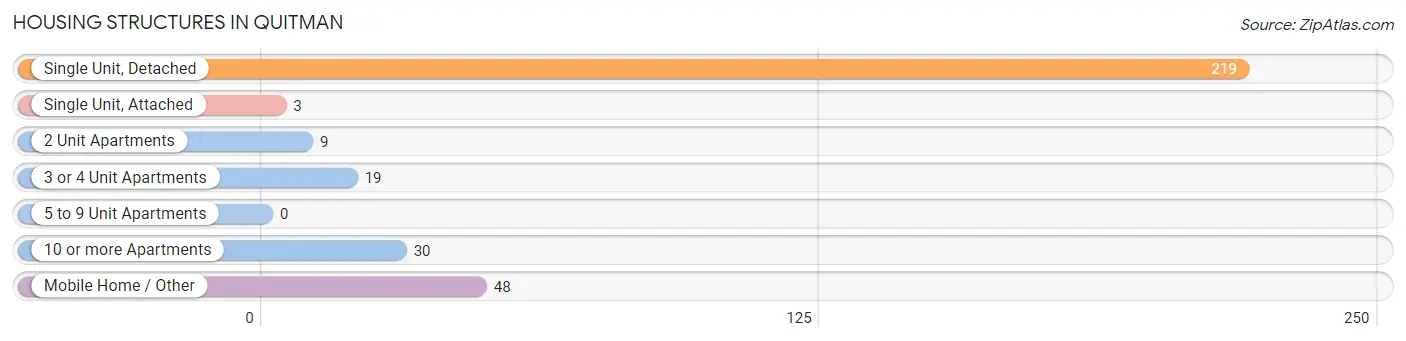
| Structure Type | # Housing Units | % Housing Units |
| Single Unit, Detached | 219 | 66.8% |
| Single Unit, Attached | 3 | 0.9% |
| 2 Unit Apartments | 9 | 2.7% |
| 3 or 4 Unit Apartments | 19 | 5.8% |
| 5 to 9 Unit Apartments | 0 | 0.0% |
| 10 or more Apartments | 30 | 9.1% |
| Mobile Home / Other | 48 | 14.6% |
| Total | 328 | 100.0% |
Housing Structures by Occupancy in Quitman
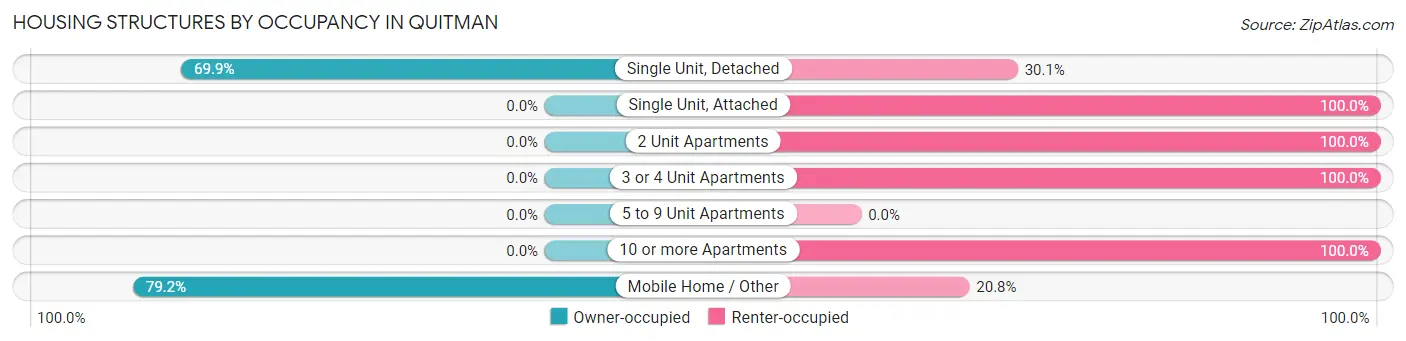
| Structure Type | Owner-occupied | Renter-occupied |
| Single Unit, Detached | 153 (69.9%) | 66 (30.1%) |
| Single Unit, Attached | 0 (0.0%) | 3 (100.0%) |
| 2 Unit Apartments | 0 (0.0%) | 9 (100.0%) |
| 3 or 4 Unit Apartments | 0 (0.0%) | 19 (100.0%) |
| 5 to 9 Unit Apartments | 0 (0.0%) | 0 (0.0%) |
| 10 or more Apartments | 0 (0.0%) | 30 (100.0%) |
| Mobile Home / Other | 38 (79.2%) | 10 (20.8%) |
| Total | 191 (58.2%) | 137 (41.8%) |
Housing Structures by Number of Rooms in Quitman
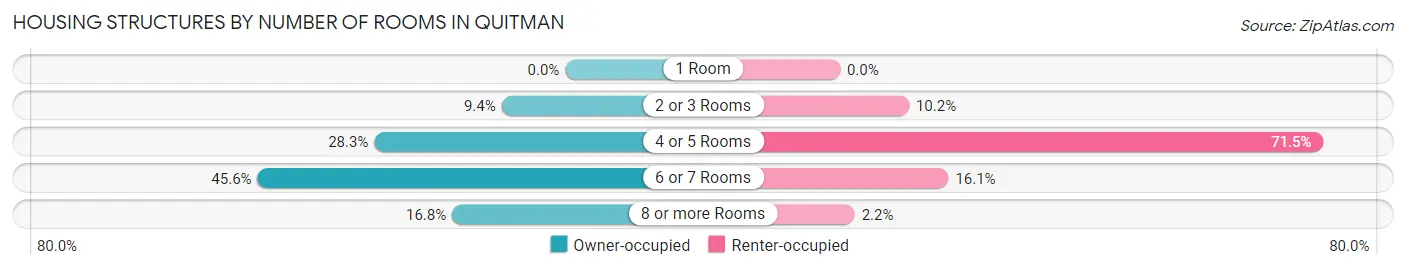
| Number of Rooms | Owner-occupied | Renter-occupied |
| 1 Room | 0 (0.0%) | 0 (0.0%) |
| 2 or 3 Rooms | 18 (9.4%) | 14 (10.2%) |
| 4 or 5 Rooms | 54 (28.3%) | 98 (71.5%) |
| 6 or 7 Rooms | 87 (45.6%) | 22 (16.1%) |
| 8 or more Rooms | 32 (16.8%) | 3 (2.2%) |
| Total | 191 (100.0%) | 137 (100.0%) |
Housing Structure by Heating Type in Quitman
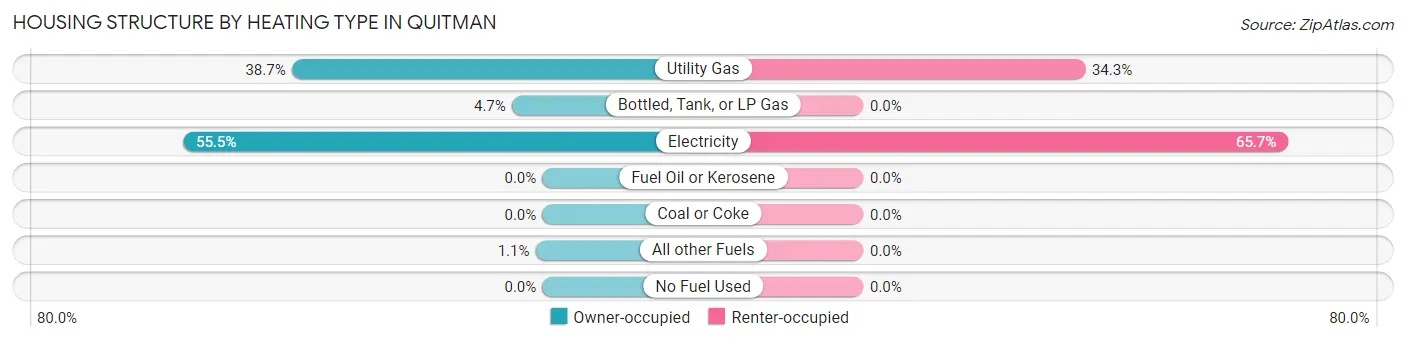
| Heating Type | Owner-occupied | Renter-occupied |
| Utility Gas | 74 (38.7%) | 47 (34.3%) |
| Bottled, Tank, or LP Gas | 9 (4.7%) | 0 (0.0%) |
| Electricity | 106 (55.5%) | 90 (65.7%) |
| Fuel Oil or Kerosene | 0 (0.0%) | 0 (0.0%) |
| Coal or Coke | 0 (0.0%) | 0 (0.0%) |
| All other Fuels | 2 (1.1%) | 0 (0.0%) |
| No Fuel Used | 0 (0.0%) | 0 (0.0%) |
| Total | 191 (100.0%) | 137 (100.0%) |
Household Vehicle Usage in Quitman
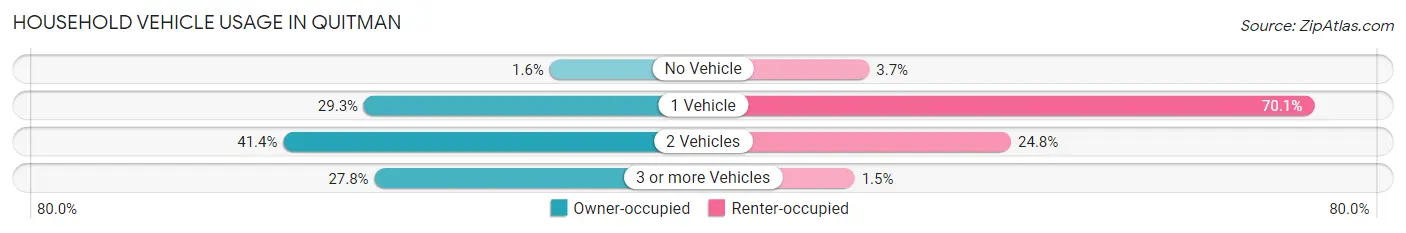
| Vehicles per Household | Owner-occupied | Renter-occupied |
| No Vehicle | 3 (1.6%) | 5 (3.6%) |
| 1 Vehicle | 56 (29.3%) | 96 (70.1%) |
| 2 Vehicles | 79 (41.4%) | 34 (24.8%) |
| 3 or more Vehicles | 53 (27.8%) | 2 (1.5%) |
| Total | 191 (100.0%) | 137 (100.0%) |
Real Estate & Mortgages in Quitman
Real Estate and Mortgage Overview in Quitman
| Characteristic | Without Mortgage | With Mortgage |
| Housing Units | 83 | 108 |
| Median Property Value | $75,400 | $130,000 |
| Median Household Income | $40,536 | $15 |
| Monthly Housing Costs | $380 | $0 |
| Real Estate Taxes | $400 | $1 |
Property Value by Mortgage Status in Quitman
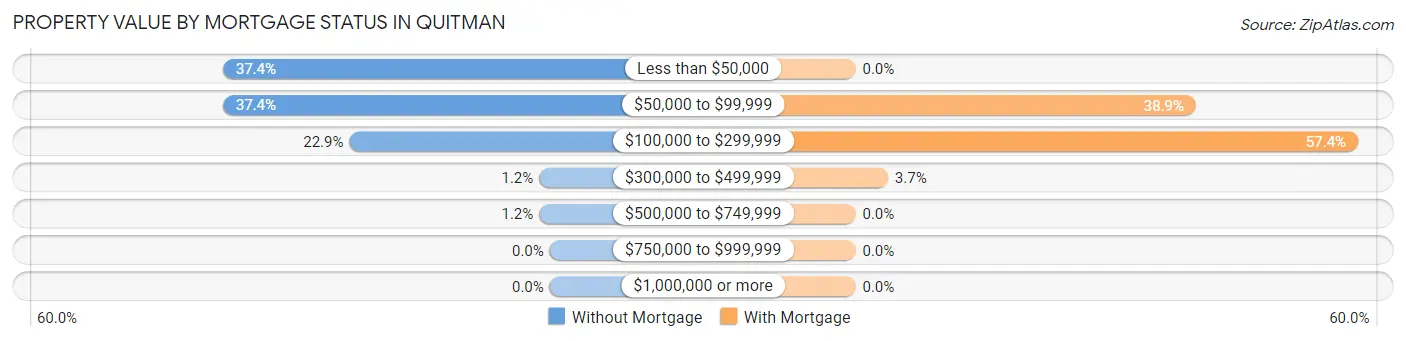
| Property Value | Without Mortgage | With Mortgage |
| Less than $50,000 | 31 (37.3%) | 0 (0.0%) |
| $50,000 to $99,999 | 31 (37.3%) | 42 (38.9%) |
| $100,000 to $299,999 | 19 (22.9%) | 62 (57.4%) |
| $300,000 to $499,999 | 1 (1.2%) | 4 (3.7%) |
| $500,000 to $749,999 | 1 (1.2%) | 0 (0.0%) |
| $750,000 to $999,999 | 0 (0.0%) | 0 (0.0%) |
| $1,000,000 or more | 0 (0.0%) | 0 (0.0%) |
| Total | 83 (100.0%) | 108 (100.0%) |
Household Income by Mortgage Status in Quitman
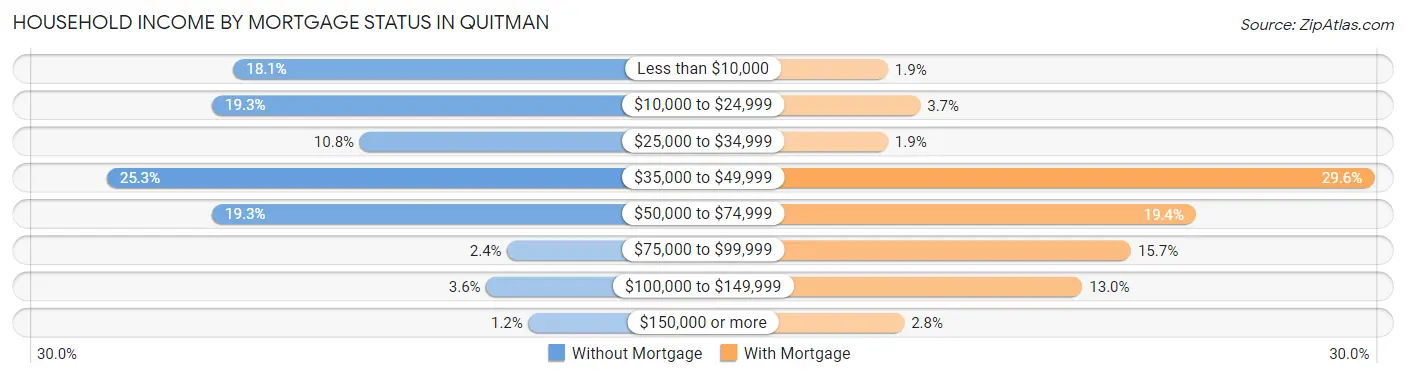
| Household Income | Without Mortgage | With Mortgage |
| Less than $10,000 | 15 (18.1%) | 2 (1.8%) |
| $10,000 to $24,999 | 16 (19.3%) | 4 (3.7%) |
| $25,000 to $34,999 | 9 (10.8%) | 2 (1.8%) |
| $35,000 to $49,999 | 21 (25.3%) | 32 (29.6%) |
| $50,000 to $74,999 | 16 (19.3%) | 21 (19.4%) |
| $75,000 to $99,999 | 2 (2.4%) | 17 (15.7%) |
| $100,000 to $149,999 | 3 (3.6%) | 14 (13.0%) |
| $150,000 or more | 1 (1.2%) | 3 (2.8%) |
| Total | 83 (100.0%) | 108 (100.0%) |
Property Value to Household Income Ratio in Quitman
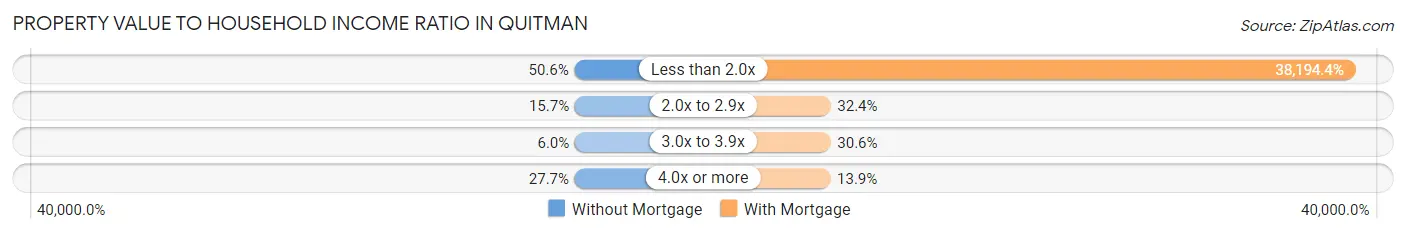
| Value-to-Income Ratio | Without Mortgage | With Mortgage |
| Less than 2.0x | 42 (50.6%) | 41,250 (38,194.4%) |
| 2.0x to 2.9x | 13 (15.7%) | 35 (32.4%) |
| 3.0x to 3.9x | 5 (6.0%) | 33 (30.6%) |
| 4.0x or more | 23 (27.7%) | 15 (13.9%) |
| Total | 83 (100.0%) | 108 (100.0%) |
Real Estate Taxes by Mortgage Status in Quitman
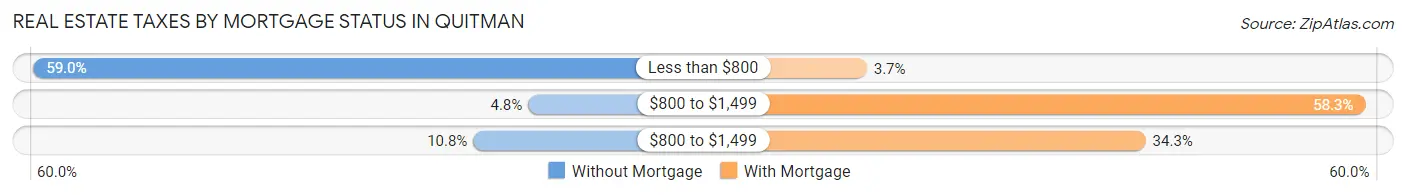
| Property Taxes | Without Mortgage | With Mortgage |
| Less than $800 | 49 (59.0%) | 4 (3.7%) |
| $800 to $1,499 | 4 (4.8%) | 63 (58.3%) |
| $800 to $1,499 | 9 (10.8%) | 37 (34.3%) |
| Total | 83 (100.0%) | 108 (100.0%) |
Health & Disability in Quitman
Health Insurance Coverage by Age in Quitman
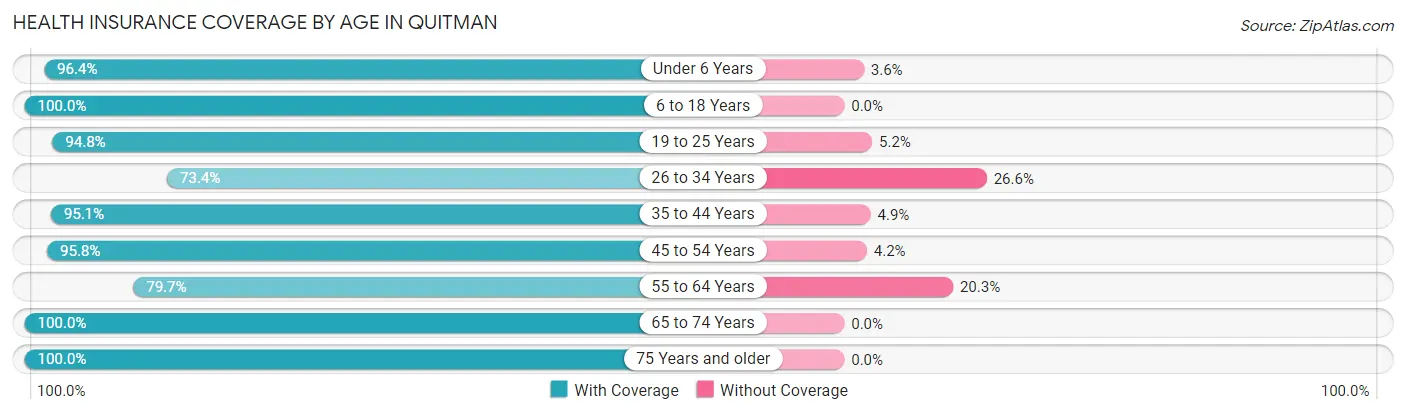
| Age Bracket | With Coverage | Without Coverage |
| Under 6 Years | 53 (96.4%) | 2 (3.6%) |
| 6 to 18 Years | 119 (100.0%) | 0 (0.0%) |
| 19 to 25 Years | 73 (94.8%) | 4 (5.2%) |
| 26 to 34 Years | 47 (73.4%) | 17 (26.6%) |
| 35 to 44 Years | 97 (95.1%) | 5 (4.9%) |
| 45 to 54 Years | 91 (95.8%) | 4 (4.2%) |
| 55 to 64 Years | 59 (79.7%) | 15 (20.3%) |
| 65 to 74 Years | 102 (100.0%) | 0 (0.0%) |
| 75 Years and older | 42 (100.0%) | 0 (0.0%) |
| Total | 683 (93.6%) | 47 (6.4%) |
Health Insurance Coverage by Citizenship Status in Quitman
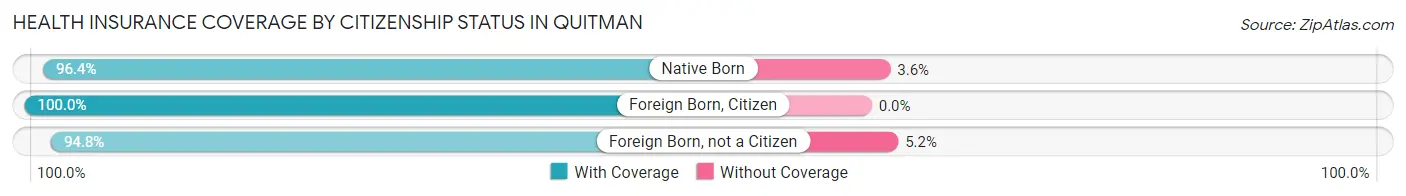
| Citizenship Status | With Coverage | Without Coverage |
| Native Born | 53 (96.4%) | 2 (3.6%) |
| Foreign Born, Citizen | 119 (100.0%) | 0 (0.0%) |
| Foreign Born, not a Citizen | 73 (94.8%) | 4 (5.2%) |
Health Insurance Coverage by Household Income in Quitman
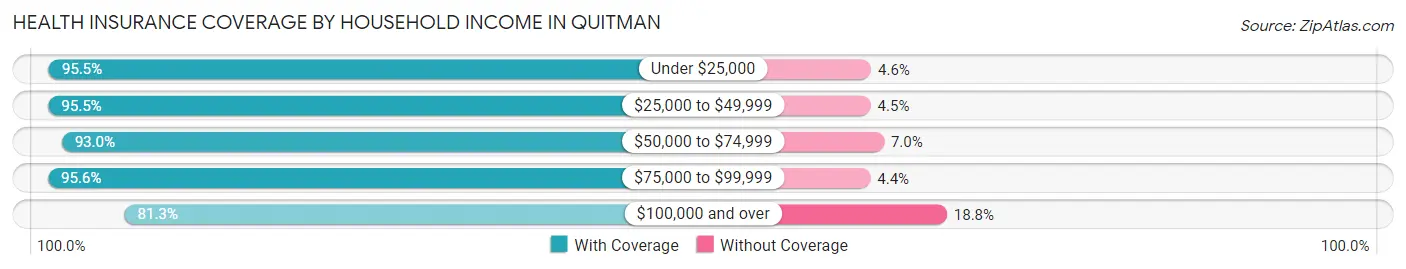
| Household Income | With Coverage | Without Coverage |
| Under $25,000 | 168 (95.5%) | 8 (4.5%) |
| $25,000 to $49,999 | 278 (95.5%) | 13 (4.5%) |
| $50,000 to $74,999 | 107 (93.0%) | 8 (7.0%) |
| $75,000 to $99,999 | 65 (95.6%) | 3 (4.4%) |
| $100,000 and over | 65 (81.2%) | 15 (18.8%) |
Public vs Private Health Insurance Coverage by Age in Quitman
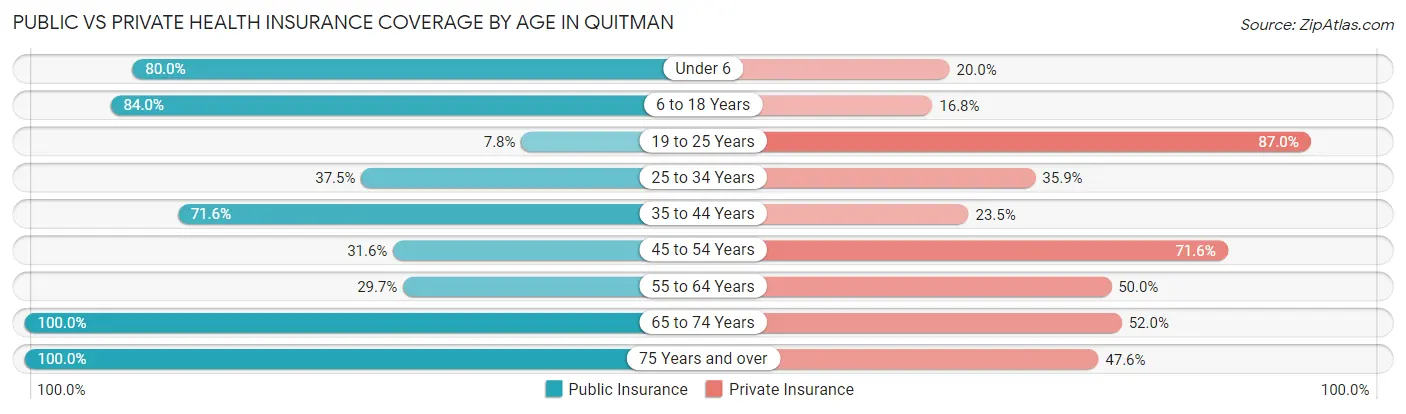
| Age Bracket | Public Insurance | Private Insurance |
| Under 6 | 44 (80.0%) | 11 (20.0%) |
| 6 to 18 Years | 100 (84.0%) | 20 (16.8%) |
| 19 to 25 Years | 6 (7.8%) | 67 (87.0%) |
| 25 to 34 Years | 24 (37.5%) | 23 (35.9%) |
| 35 to 44 Years | 73 (71.6%) | 24 (23.5%) |
| 45 to 54 Years | 30 (31.6%) | 68 (71.6%) |
| 55 to 64 Years | 22 (29.7%) | 37 (50.0%) |
| 65 to 74 Years | 102 (100.0%) | 53 (52.0%) |
| 75 Years and over | 42 (100.0%) | 20 (47.6%) |
| Total | 443 (60.7%) | 323 (44.3%) |
Disability Status by Sex by Age in Quitman
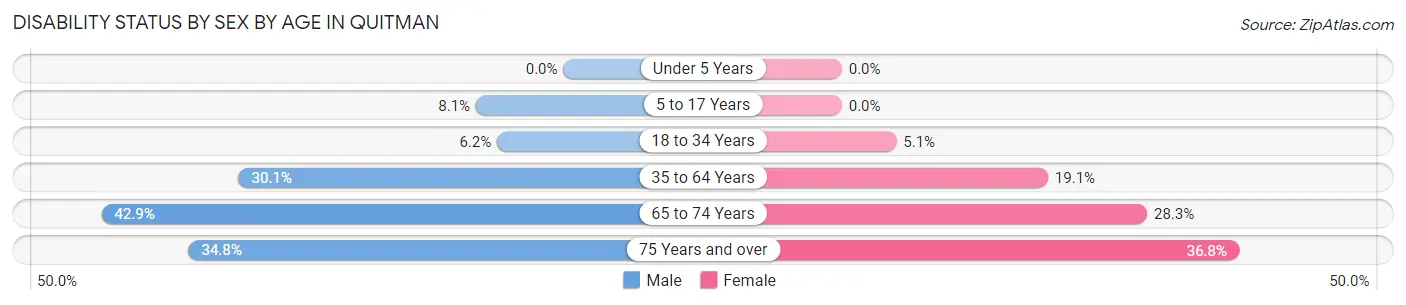
| Age Bracket | Male | Female |
| Under 5 Years | 0 (0.0%) | 0 (0.0%) |
| 5 to 17 Years | 6 (8.1%) | 0 (0.0%) |
| 18 to 34 Years | 4 (6.1%) | 4 (5.1%) |
| 35 to 64 Years | 47 (30.1%) | 22 (19.1%) |
| 65 to 74 Years | 18 (42.9%) | 17 (28.3%) |
| 75 Years and over | 8 (34.8%) | 7 (36.8%) |
Disability Class by Sex by Age in Quitman
Disability Class: Hearing Difficulty
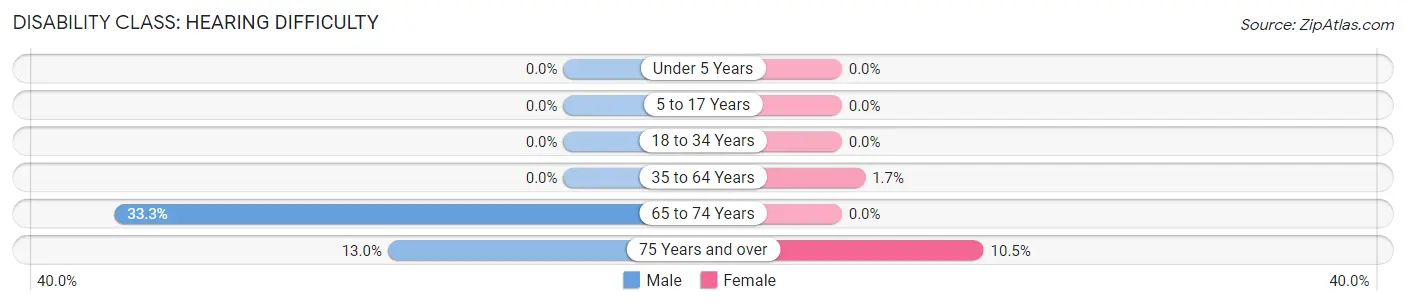
| Age Bracket | Male | Female |
| Under 5 Years | 0 (0.0%) | 0 (0.0%) |
| 5 to 17 Years | 0 (0.0%) | 0 (0.0%) |
| 18 to 34 Years | 0 (0.0%) | 0 (0.0%) |
| 35 to 64 Years | 0 (0.0%) | 2 (1.7%) |
| 65 to 74 Years | 14 (33.3%) | 0 (0.0%) |
| 75 Years and over | 3 (13.0%) | 2 (10.5%) |
Disability Class: Vision Difficulty
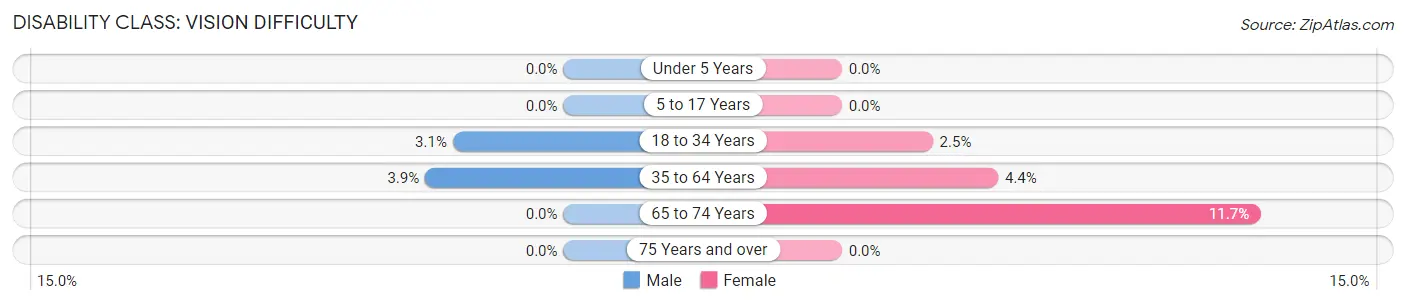
| Age Bracket | Male | Female |
| Under 5 Years | 0 (0.0%) | 0 (0.0%) |
| 5 to 17 Years | 0 (0.0%) | 0 (0.0%) |
| 18 to 34 Years | 2 (3.1%) | 2 (2.5%) |
| 35 to 64 Years | 6 (3.8%) | 5 (4.3%) |
| 65 to 74 Years | 0 (0.0%) | 7 (11.7%) |
| 75 Years and over | 0 (0.0%) | 0 (0.0%) |
Disability Class: Cognitive Difficulty
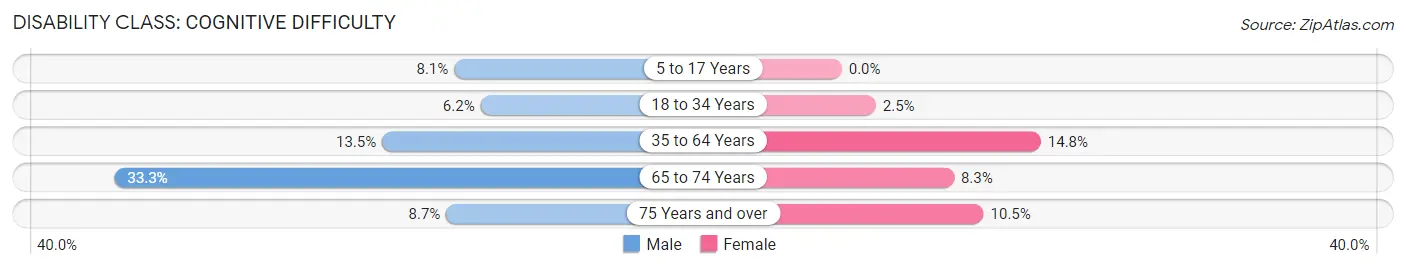
| Age Bracket | Male | Female |
| 5 to 17 Years | 6 (8.1%) | 0 (0.0%) |
| 18 to 34 Years | 4 (6.1%) | 2 (2.5%) |
| 35 to 64 Years | 21 (13.5%) | 17 (14.8%) |
| 65 to 74 Years | 14 (33.3%) | 5 (8.3%) |
| 75 Years and over | 2 (8.7%) | 2 (10.5%) |
Disability Class: Ambulatory Difficulty
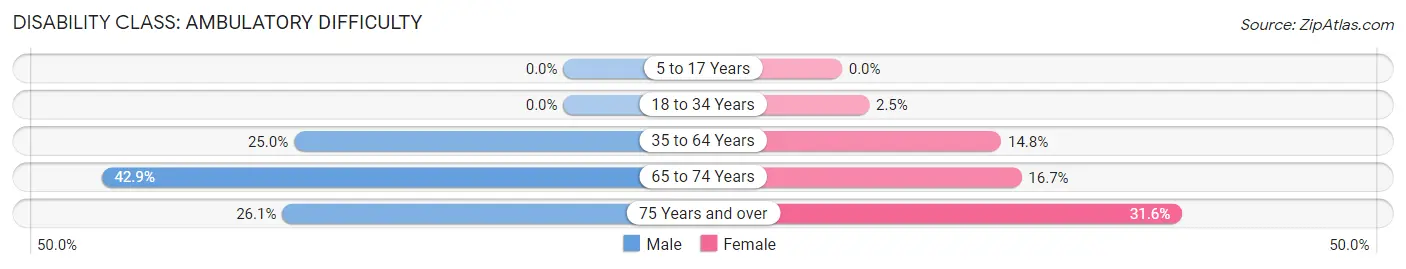
| Age Bracket | Male | Female |
| 5 to 17 Years | 0 (0.0%) | 0 (0.0%) |
| 18 to 34 Years | 0 (0.0%) | 2 (2.5%) |
| 35 to 64 Years | 39 (25.0%) | 17 (14.8%) |
| 65 to 74 Years | 18 (42.9%) | 10 (16.7%) |
| 75 Years and over | 6 (26.1%) | 6 (31.6%) |
Disability Class: Self-Care Difficulty
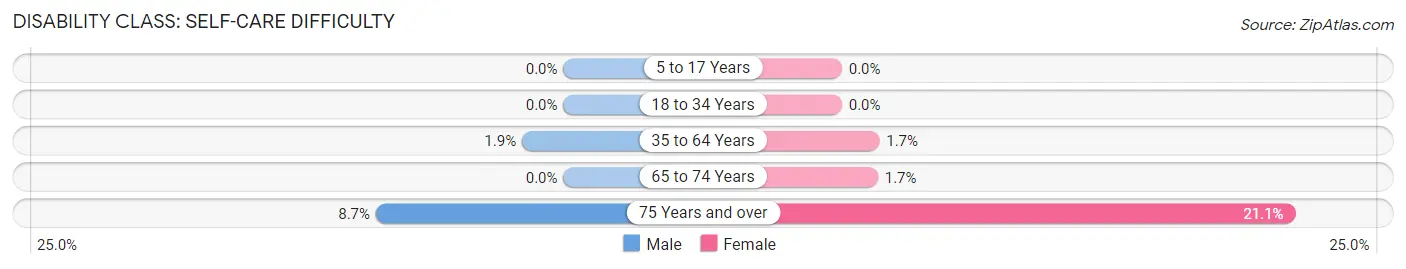
| Age Bracket | Male | Female |
| 5 to 17 Years | 0 (0.0%) | 0 (0.0%) |
| 18 to 34 Years | 0 (0.0%) | 0 (0.0%) |
| 35 to 64 Years | 3 (1.9%) | 2 (1.7%) |
| 65 to 74 Years | 0 (0.0%) | 1 (1.7%) |
| 75 Years and over | 2 (8.7%) | 4 (21.0%) |
Technology Access in Quitman
Computing Device Access in Quitman
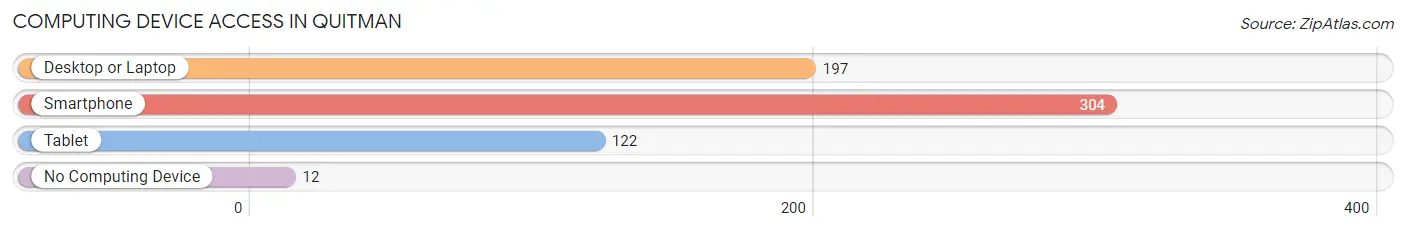
| Device Type | # Households | % Households |
| Desktop or Laptop | 197 | 60.1% |
| Smartphone | 304 | 92.7% |
| Tablet | 122 | 37.2% |
| No Computing Device | 12 | 3.7% |
| Total | 328 | 100.0% |
Internet Access in Quitman
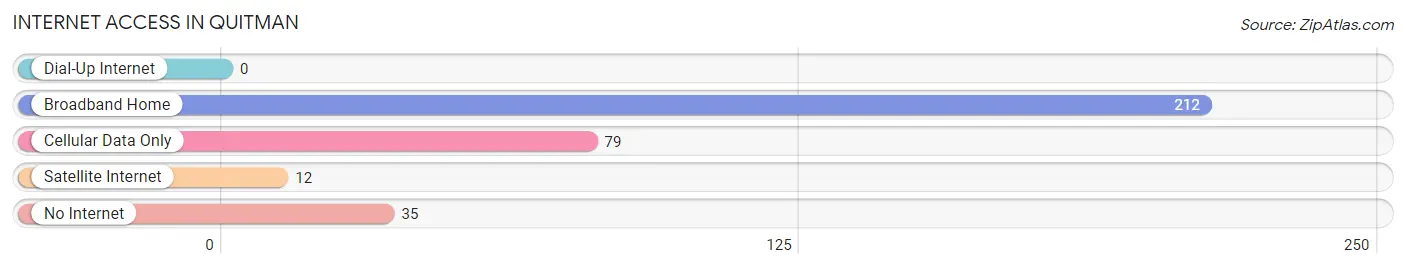
| Internet Type | # Households | % Households |
| Dial-Up Internet | 0 | 0.0% |
| Broadband Home | 212 | 64.6% |
| Cellular Data Only | 79 | 24.1% |
| Satellite Internet | 12 | 3.7% |
| No Internet | 35 | 10.7% |
| Total | 328 | 100.0% |
Quitman Summary
Quitman is a small town located in Cleburne County, Arkansas. It is situated in the foothills of the Ozark Mountains, about 25 miles south of the state capital, Little Rock. The town was founded in 1872 and was named after General John A. Quitman, a hero of the Mexican-American War. The population of Quitman was 1,093 at the 2000 census.
History
Quitman was founded in 1872 by a group of settlers from Tennessee. The town was named after General John A. Quitman, a hero of the Mexican-American War. The town was incorporated in 1876 and was the first town in Cleburne County.
The town was a center of commerce and industry in the late 19th and early 20th centuries. The town had a cotton gin, a grist mill, a sawmill, a blacksmith shop, and a general store. The town also had a hotel, a bank, and a post office.
In the early 20th century, Quitman was a popular tourist destination. The town was known for its mineral springs, which were believed to have healing properties. The town also had a number of resorts and hotels.
Geography
Quitman is located in the foothills of the Ozark Mountains in Cleburne County, Arkansas. The town is situated at the intersection of Arkansas Highway 25 and Arkansas Highway 16. The town is about 25 miles south of the state capital, Little Rock.
The town is located in a hilly area with elevations ranging from 500 to 1,000 feet above sea level. The town is surrounded by forests and is located near the White River.
Economy
The economy of Quitman is largely based on agriculture. The town is home to a number of farms and ranches. The town is also home to a number of small businesses, including a grocery store, a hardware store, and a restaurant.
The town is also home to a number of manufacturing companies, including a furniture factory and a woodworking plant. The town is also home to a number of service-based businesses, including a bank, a post office, and a number of medical and dental offices.
Demographics
As of the 2000 census, the population of Quitman was 1,093. The racial makeup of the town was 97.3% White, 0.7% African American, 0.2% Native American, 0.2% Asian, 0.1% Pacific Islander, 0.9% from other races, and 0.6% from two or more races. Hispanic or Latino of any race were 1.7% of the population.
The median income for a household in the town was $25,625, and the median income for a family was $31,250. The per capita income for the town was $14,845. About 16.2% of families and 19.2% of the population were below the poverty line, including 25.2% of those under age 18 and 15.2% of those age 65 or over.
Common Questions
What is Per Capita Income in Quitman?
Per Capita income in Quitman is $20,806.
What is the Median Family Income in Quitman?
Median Family Income in Quitman is $41,667.
What is the Median Household income in Quitman?
Median Household Income in Quitman is $34,423.
What is Income or Wage Gap in Quitman?
Income or Wage Gap in Quitman is 8.7%.
Women in Quitman earn 91.3 cents for every dollar earned by a man.
What is Inequality or Gini Index in Quitman?
Inequality or Gini Index in Quitman is 0.44.
What is the Total Population of Quitman?
Total Population of Quitman is 730.
What is the Total Male Population of Quitman?
Total Male Population of Quitman is 388.
What is the Total Female Population of Quitman?
Total Female Population of Quitman is 342.
What is the Ratio of Males per 100 Females in Quitman?
There are 113.45 Males per 100 Females in Quitman.
What is the Ratio of Females per 100 Males in Quitman?
There are 88.14 Females per 100 Males in Quitman.
What is the Median Population Age in Quitman?
Median Population Age in Quitman is 40.5 Years.
What is the Average Family Size in Quitman
Average Family Size in Quitman is 2.7 People.
What is the Average Household Size in Quitman
Average Household Size in Quitman is 2.2 People.
How Large is the Labor Force in Quitman?
There are 337 People in the Labor Forcein in Quitman.
What is the Percentage of People in the Labor Force in Quitman?
56.4% of People are in the Labor Force in Quitman.
What is the Unemployment Rate in Quitman?
Unemployment Rate in Quitman is 13.9%.