Portland, AR Map & Demographics
Portland Map
Portland Overview
$25,102
PER CAPITA INCOME
$59,688
AVG FAMILY INCOME
$46,000
AVG HOUSEHOLD INCOME
38.4%
WAGE / INCOME GAP [ % ]
61.6¢/ $1
WAGE / INCOME GAP [ $ ]
0.49
INEQUALITY / GINI INDEX
509
TOTAL POPULATION
263
MALE POPULATION
246
FEMALE POPULATION
106.91
MALES / 100 FEMALES
93.54
FEMALES / 100 MALES
39.9
MEDIAN AGE
4.1
AVG FAMILY SIZE
3.2
AVG HOUSEHOLD SIZE
202
LABOR FORCE [ PEOPLE ]
51.9%
PERCENT IN LABOR FORCE
Portland Zip Codes
Portland Area Codes
Income in Portland
Income Overview in Portland
Per Capita Income in Portland is $25,102, while median incomes of families and households are $59,688 and $46,000 respectively.
| Characteristic | Number | Measure |
| Per Capita Income | 509 | $25,102 |
| Median Family Income | 111 | $59,688 |
| Mean Family Income | 111 | $94,255 |
| Median Household Income | 158 | $46,000 |
| Mean Household Income | 158 | $76,080 |
| Income Deficit | 111 | $0 |
| Wage / Income Gap (%) | 509 | 38.39% |
| Wage / Income Gap ($) | 509 | 61.61¢ per $1 |
| Gini / Inequality Index | 509 | 0.49 |
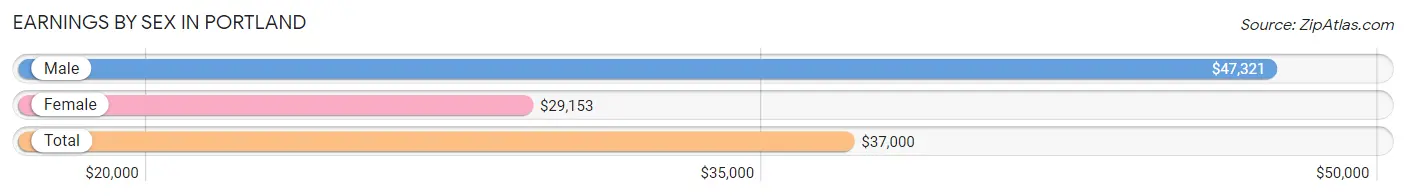
Earnings by Sex in Portland
Average Earnings in Portland are $37,000, $47,321 for men and $29,153 for women, a difference of 38.4%.
| Sex | Number | Average Earnings |
| Male | 83 (39.2%) | $47,321 |
| Female | 129 (60.9%) | $29,153 |
| Total | 212 (100.0%) | $37,000 |
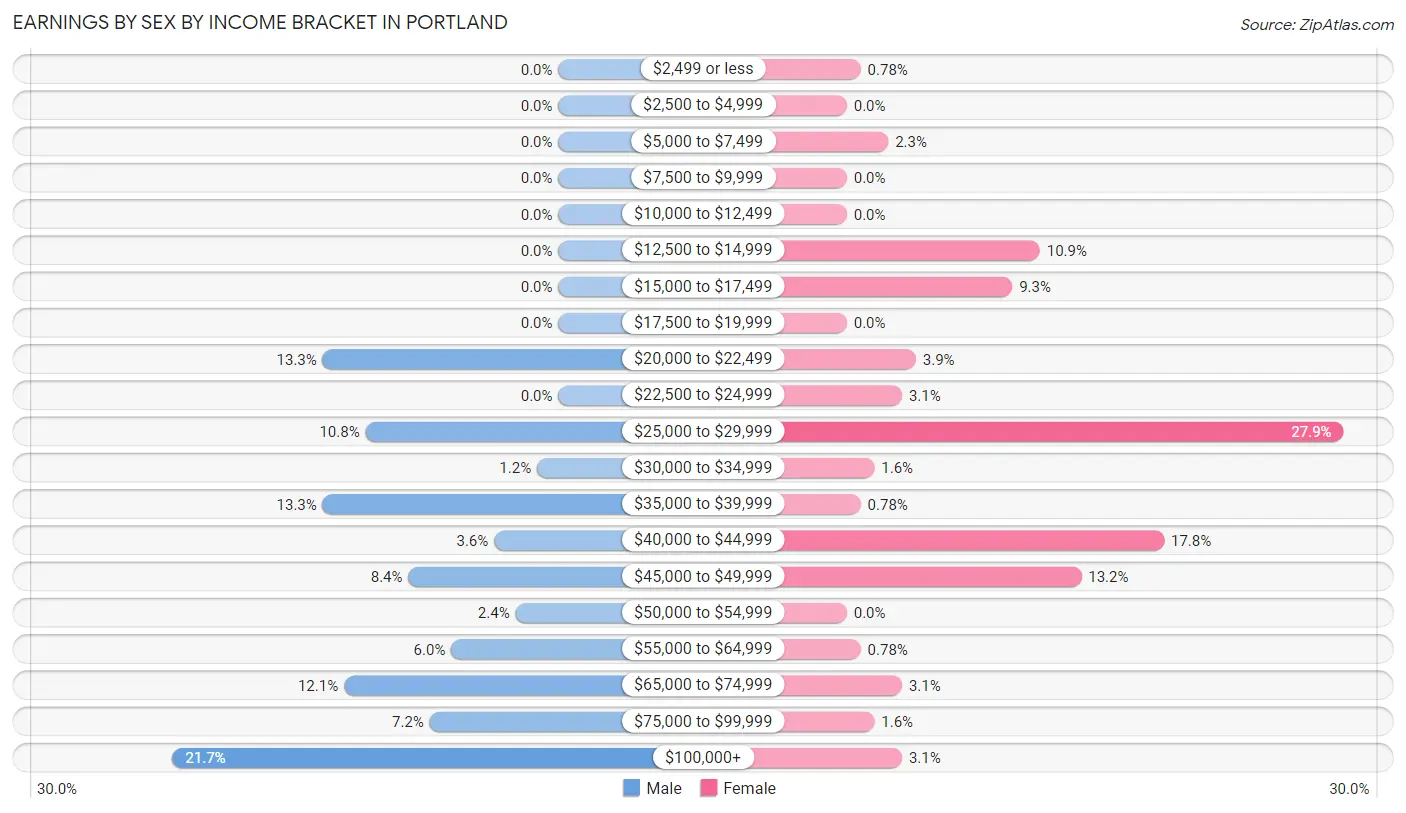
Earnings by Sex by Income Bracket in Portland
The most common earnings brackets in Portland are $100,000+ for men (18 | 21.7%) and $25,000 to $29,999 for women (36 | 27.9%).
| Income | Male | Female |
| $2,499 or less | 0 (0.0%) | 1 (0.8%) |
| $2,500 to $4,999 | 0 (0.0%) | 0 (0.0%) |
| $5,000 to $7,499 | 0 (0.0%) | 3 (2.3%) |
| $7,500 to $9,999 | 0 (0.0%) | 0 (0.0%) |
| $10,000 to $12,499 | 0 (0.0%) | 0 (0.0%) |
| $12,500 to $14,999 | 0 (0.0%) | 14 (10.8%) |
| $15,000 to $17,499 | 0 (0.0%) | 12 (9.3%) |
| $17,500 to $19,999 | 0 (0.0%) | 0 (0.0%) |
| $20,000 to $22,499 | 11 (13.3%) | 5 (3.9%) |
| $22,500 to $24,999 | 0 (0.0%) | 4 (3.1%) |
| $25,000 to $29,999 | 9 (10.8%) | 36 (27.9%) |
| $30,000 to $34,999 | 1 (1.2%) | 2 (1.5%) |
| $35,000 to $39,999 | 11 (13.3%) | 1 (0.8%) |
| $40,000 to $44,999 | 3 (3.6%) | 23 (17.8%) |
| $45,000 to $49,999 | 7 (8.4%) | 17 (13.2%) |
| $50,000 to $54,999 | 2 (2.4%) | 0 (0.0%) |
| $55,000 to $64,999 | 5 (6.0%) | 1 (0.8%) |
| $65,000 to $74,999 | 10 (12.0%) | 4 (3.1%) |
| $75,000 to $99,999 | 6 (7.2%) | 2 (1.5%) |
| $100,000+ | 18 (21.7%) | 4 (3.1%) |
| Total | 83 (100.0%) | 129 (100.0%) |
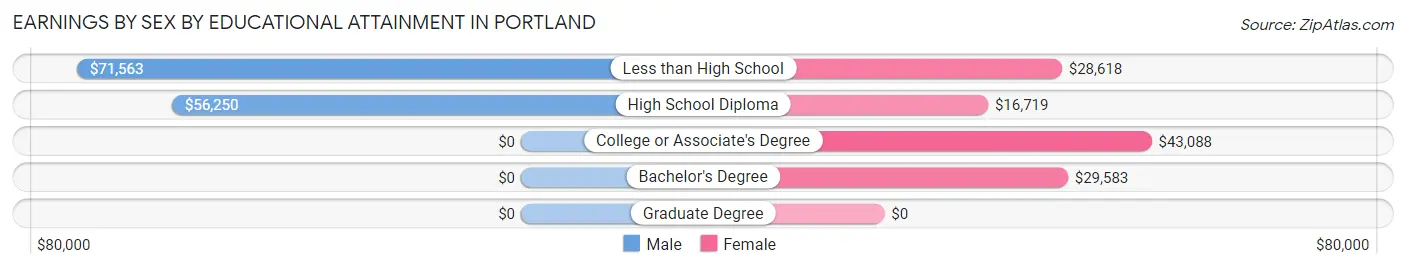
Earnings by Sex by Educational Attainment in Portland
Average earnings in Portland are $58,750 for men and $29,234 for women, a difference of 50.2%. Men with an educational attainment of less than high school enjoy the highest average annual earnings of $71,563, while those with high school diploma education earn the least with $56,250. Women with an educational attainment of college or associate's degree earn the most with the average annual earnings of $43,088, while those with high school diploma education have the smallest earnings of $16,719.
| Educational Attainment | Male Income | Female Income |
| Less than High School | $71,563 | $28,618 |
| High School Diploma | $56,250 | $16,719 |
| College or Associate's Degree | - | - |
| Bachelor's Degree | - | - |
| Graduate Degree | - | - |
| Total | $58,750 | $29,234 |
Family Income in Portland
Family Income Brackets in Portland
According to the Portland family income data, there are 32 families falling into the $35,000 to $49,999 income range, which is the most common income bracket and makes up 28.8% of all families.
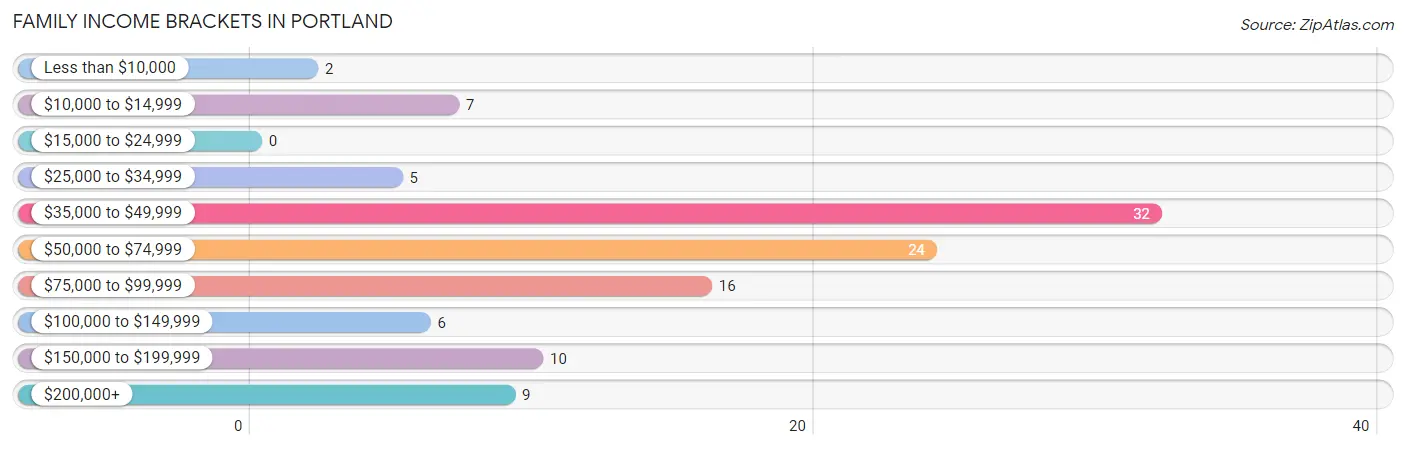
| Income Bracket | # Families | % Families |
| Less than $10,000 | 2 | 1.8% |
| $10,000 to $14,999 | 7 | 6.3% |
| $15,000 to $24,999 | 0 | 0.0% |
| $25,000 to $34,999 | 5 | 4.5% |
| $35,000 to $49,999 | 32 | 28.8% |
| $50,000 to $74,999 | 24 | 21.6% |
| $75,000 to $99,999 | 16 | 14.4% |
| $100,000 to $149,999 | 6 | 5.4% |
| $150,000 to $199,999 | 10 | 9.0% |
| $200,000+ | 9 | 8.1% |
Family Income by Famaliy Size in Portland
4-person families (7 | 6.3%) account for the highest median family income in Portland with $90,313 per family, while 2-person families (51 | 46.0%) have the highest median income of $36,875 per family member.
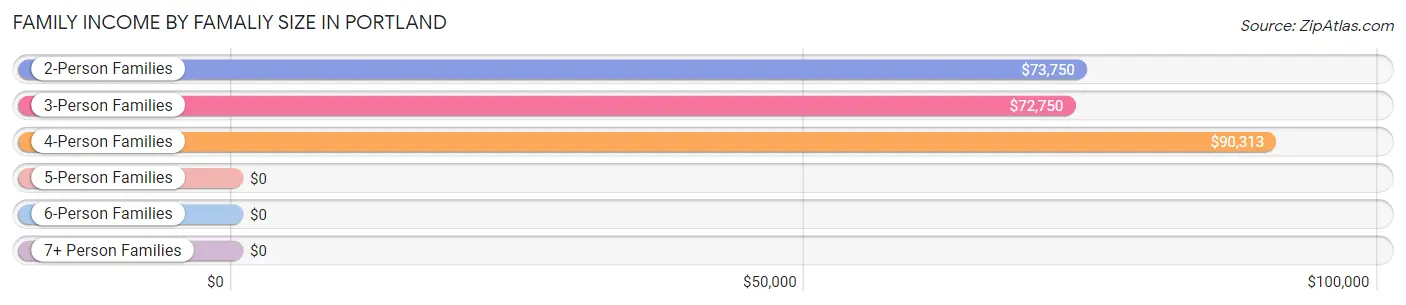
| Income Bracket | # Families | Median Income |
| 2-Person Families | 51 (46.0%) | $73,750 |
| 3-Person Families | 27 (24.3%) | $72,750 |
| 4-Person Families | 7 (6.3%) | $90,313 |
| 5-Person Families | 22 (19.8%) | $0 |
| 6-Person Families | 0 (0.0%) | $0 |
| 7+ Person Families | 4 (3.6%) | $0 |
| Total | 111 (100.0%) | $59,688 |
Family Income by Number of Earners in Portland
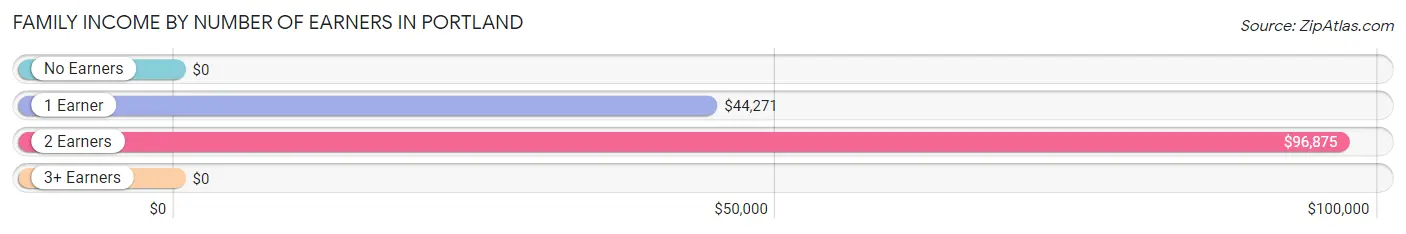
| Number of Earners | # Families | Median Income |
| No Earners | 10 (9.0%) | $0 |
| 1 Earner | 54 (48.6%) | $44,271 |
| 2 Earners | 45 (40.5%) | $96,875 |
| 3+ Earners | 2 (1.8%) | $0 |
| Total | 111 (100.0%) | $59,688 |
Household Income in Portland
Household Income Brackets in Portland
With 39 households falling in the category, the $35,000 to $49,999 income range is the most frequent in Portland, accounting for 24.7% of all households. In contrast, only 6 households (3.8%) fall into the $100,000 to $149,999 income bracket, making it the least populous group.
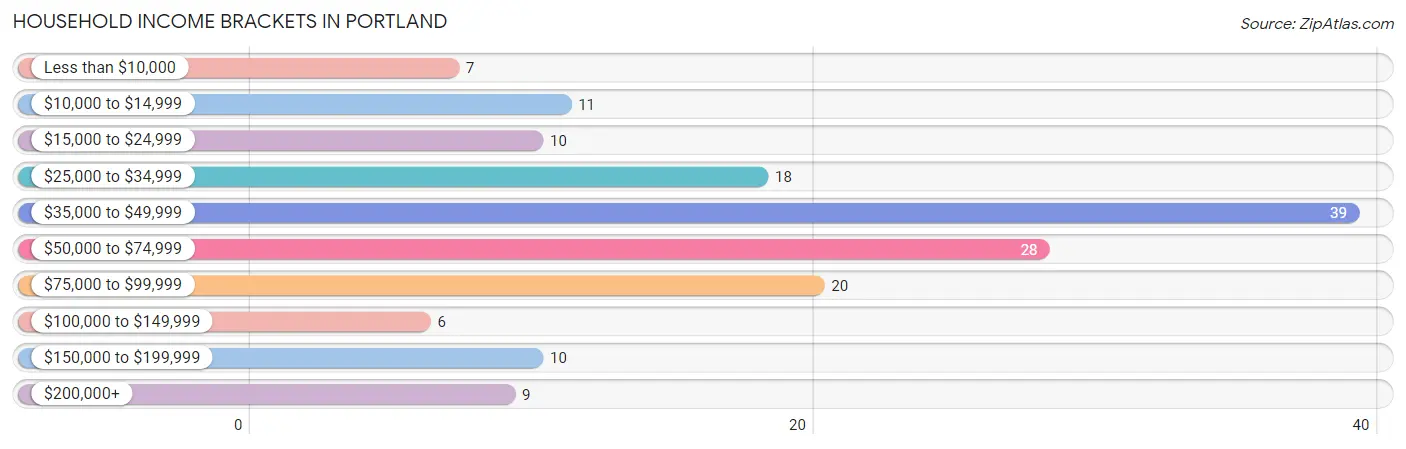
| Income Bracket | # Households | % Households |
| Less than $10,000 | 7 | 4.4% |
| $10,000 to $14,999 | 11 | 7.0% |
| $15,000 to $24,999 | 10 | 6.3% |
| $25,000 to $34,999 | 18 | 11.4% |
| $35,000 to $49,999 | 39 | 24.7% |
| $50,000 to $74,999 | 28 | 17.7% |
| $75,000 to $99,999 | 20 | 12.7% |
| $100,000 to $149,999 | 6 | 3.8% |
| $150,000 to $199,999 | 10 | 6.3% |
| $200,000+ | 9 | 5.7% |
Household Income by Householder Age in Portland
The median household income in Portland is $46,000, with the highest median household income of $58,750 found in the 25 to 44 years age bracket for the primary householder. A total of 34 households (21.5%) fall into this category. Meanwhile, the 15 to 24 years age bracket for the primary householder has the lowest median household income of $0, with 1 households (0.6%) in this group.
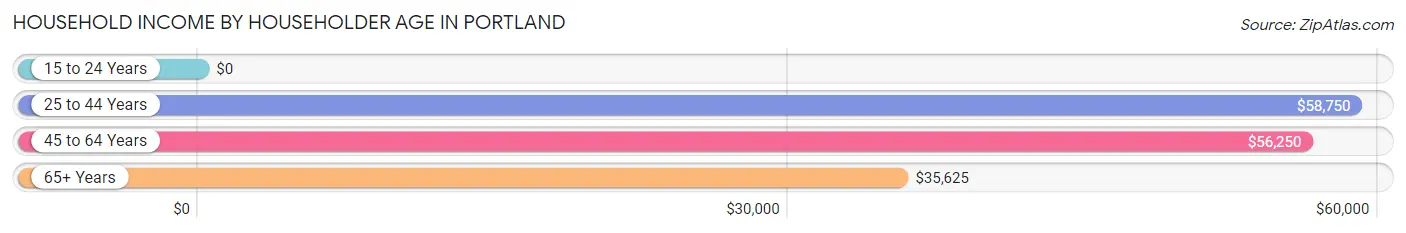
| Income Bracket | # Households | Median Income |
| 15 to 24 Years | 1 (0.6%) | $0 |
| 25 to 44 Years | 34 (21.5%) | $58,750 |
| 45 to 64 Years | 73 (46.2%) | $56,250 |
| 65+ Years | 50 (31.7%) | $35,625 |
| Total | 158 (100.0%) | $46,000 |
Poverty in Portland
Income Below Poverty by Sex and Age in Portland
With 12.2% poverty level for males and 20.7% for females among the residents of Portland, 5 year old males and under 5 year old females are the most vulnerable to poverty, with 8 males (100.0%) and 1 females (100.0%) in their respective age groups living below the poverty level.
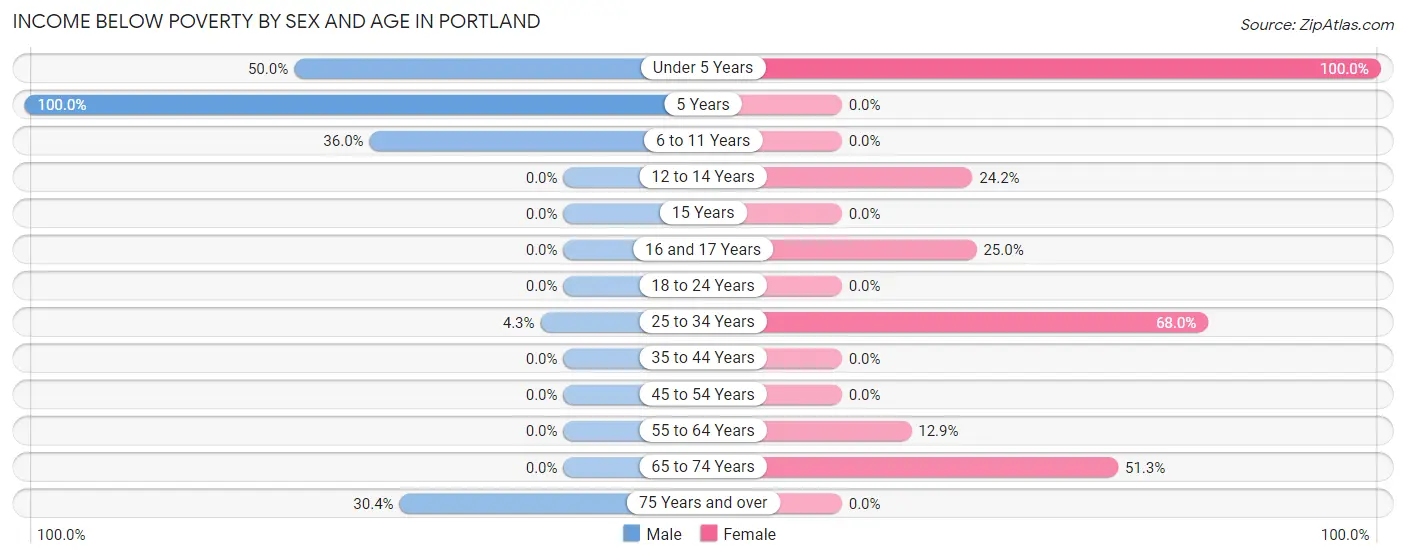
| Age Bracket | Male | Female |
| Under 5 Years | 6 (50.0%) | 1 (100.0%) |
| 5 Years | 8 (100.0%) | 0 (0.0%) |
| 6 to 11 Years | 9 (36.0%) | 0 (0.0%) |
| 12 to 14 Years | 0 (0.0%) | 8 (24.2%) |
| 15 Years | 0 (0.0%) | 0 (0.0%) |
| 16 and 17 Years | 0 (0.0%) | 1 (25.0%) |
| 18 to 24 Years | 0 (0.0%) | 0 (0.0%) |
| 25 to 34 Years | 2 (4.3%) | 17 (68.0%) |
| 35 to 44 Years | 0 (0.0%) | 0 (0.0%) |
| 45 to 54 Years | 0 (0.0%) | 0 (0.0%) |
| 55 to 64 Years | 0 (0.0%) | 4 (12.9%) |
| 65 to 74 Years | 0 (0.0%) | 20 (51.3%) |
| 75 Years and over | 7 (30.4%) | 0 (0.0%) |
| Total | 32 (12.2%) | 51 (20.7%) |
Income Above Poverty by Sex and Age in Portland
According to the poverty statistics in Portland, males aged 12 to 14 years and females aged 6 to 11 years are the age groups that are most secure financially, with 100.0% of males and 100.0% of females in these age groups living above the poverty line.
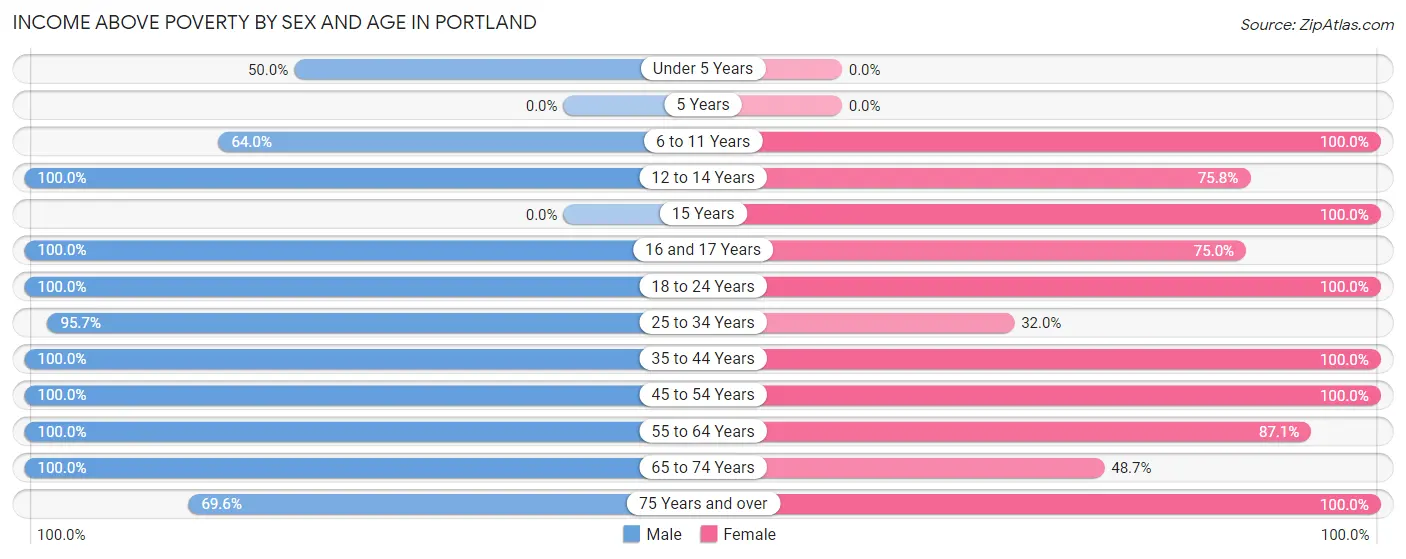
| Age Bracket | Male | Female |
| Under 5 Years | 6 (50.0%) | 0 (0.0%) |
| 5 Years | 0 (0.0%) | 0 (0.0%) |
| 6 to 11 Years | 16 (64.0%) | 29 (100.0%) |
| 12 to 14 Years | 8 (100.0%) | 25 (75.8%) |
| 15 Years | 0 (0.0%) | 4 (100.0%) |
| 16 and 17 Years | 10 (100.0%) | 3 (75.0%) |
| 18 to 24 Years | 30 (100.0%) | 1 (100.0%) |
| 25 to 34 Years | 45 (95.7%) | 8 (32.0%) |
| 35 to 44 Years | 13 (100.0%) | 16 (100.0%) |
| 45 to 54 Years | 32 (100.0%) | 56 (100.0%) |
| 55 to 64 Years | 28 (100.0%) | 27 (87.1%) |
| 65 to 74 Years | 27 (100.0%) | 19 (48.7%) |
| 75 Years and over | 16 (69.6%) | 7 (100.0%) |
| Total | 231 (87.8%) | 195 (79.3%) |
Income Below Poverty Among Married-Couple Families in Portland
The poverty statistics for married-couple families in Portland show that 10.2% or 9 of the total 88 families live below the poverty line. Families with no children have the highest poverty rate of 14.0%, comprising of 7 families. On the other hand, families with 5 or more children have the lowest poverty rate of 0.0%, which includes 0 families.
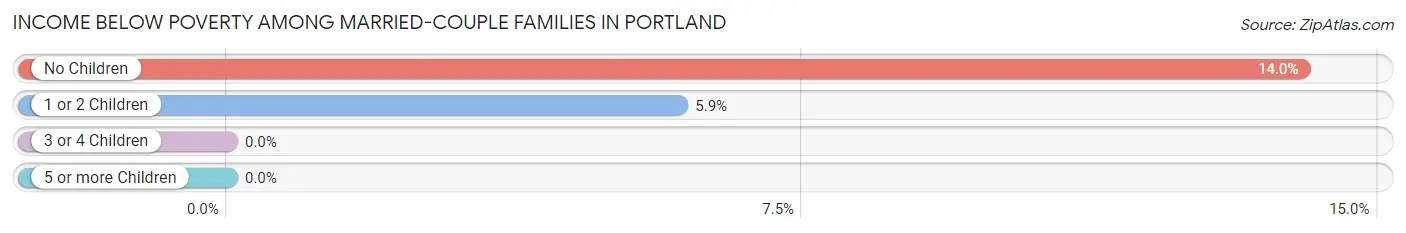
| Children | Above Poverty | Below Poverty |
| No Children | 43 (86.0%) | 7 (14.0%) |
| 1 or 2 Children | 32 (94.1%) | 2 (5.9%) |
| 3 or 4 Children | 0 (0.0%) | 0 (0.0%) |
| 5 or more Children | 4 (100.0%) | 0 (0.0%) |
| Total | 79 (89.8%) | 9 (10.2%) |
Income Below Poverty Among Single-Parent Households in Portland
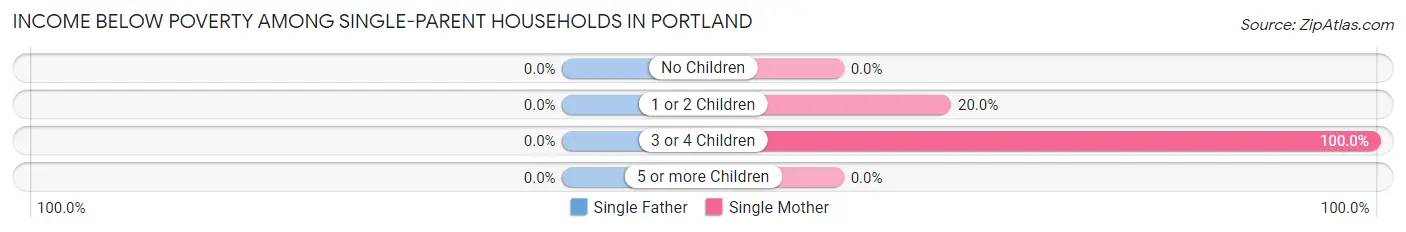
| Children | Single Father | Single Mother |
| No Children | 0 (0.0%) | 0 (0.0%) |
| 1 or 2 Children | 0 (0.0%) | 2 (20.0%) |
| 3 or 4 Children | 0 (0.0%) | 3 (100.0%) |
| 5 or more Children | 0 (0.0%) | 0 (0.0%) |
| Total | 0 (0.0%) | 5 (35.7%) |
Income Below Poverty Among Married-Couple vs Single-Parent Households in Portland
The poverty data for Portland shows that 9 of the married-couple family households (10.2%) and 5 of the single-parent households (21.7%) are living below the poverty level. Within the married-couple family households, those with no children have the highest poverty rate, with 7 households (14.0%) falling below the poverty line. Among the single-parent households, those with 3 or 4 children have the highest poverty rate, with 3 household (100.0%) living below poverty.
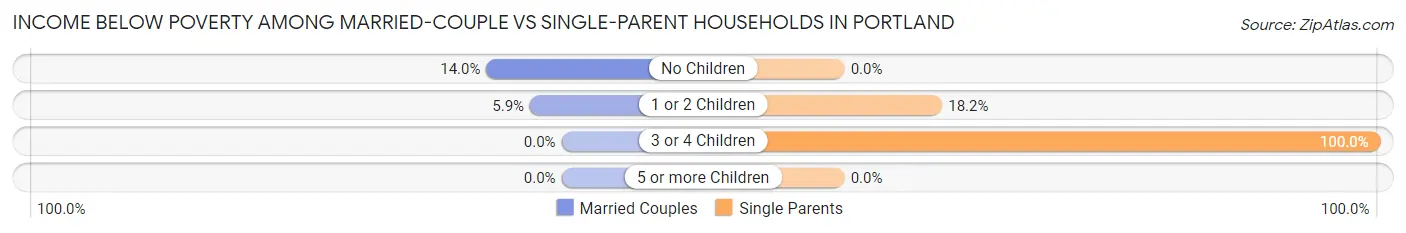
| Children | Married-Couple Families | Single-Parent Households |
| No Children | 7 (14.0%) | 0 (0.0%) |
| 1 or 2 Children | 2 (5.9%) | 2 (18.2%) |
| 3 or 4 Children | 0 (0.0%) | 3 (100.0%) |
| 5 or more Children | 0 (0.0%) | 0 (0.0%) |
| Total | 9 (10.2%) | 5 (21.7%) |
Race in Portland
The most populous races in Portland are White / Caucasian (313 | 61.5%), Black / African American (138 | 27.1%), and Hispanic or Latino (138 | 27.1%).
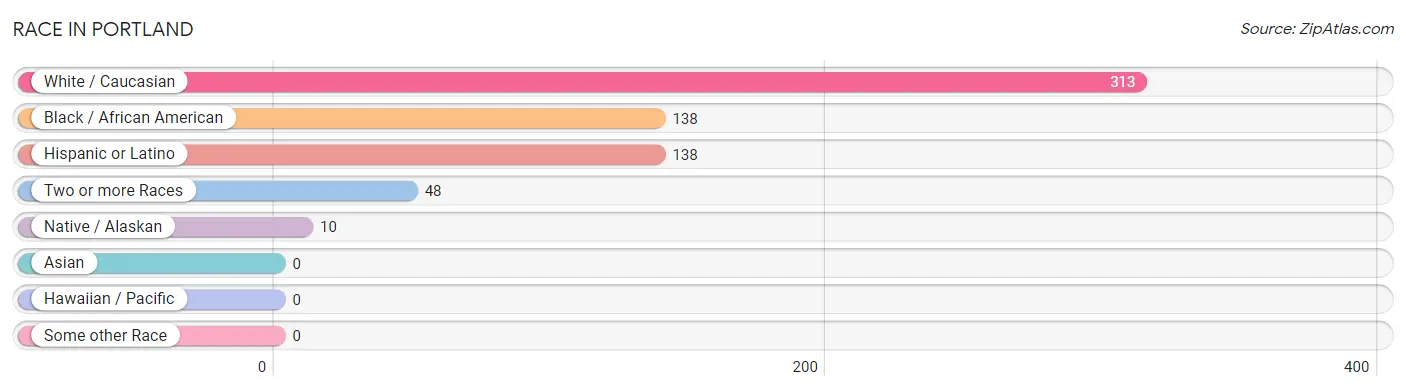
| Race | # Population | % Population |
| Asian | 0 | 0.0% |
| Black / African American | 138 | 27.1% |
| Hawaiian / Pacific | 0 | 0.0% |
| Hispanic or Latino | 138 | 27.1% |
| Native / Alaskan | 10 | 2.0% |
| White / Caucasian | 313 | 61.5% |
| Two or more Races | 48 | 9.4% |
| Some other Race | 0 | 0.0% |
| Total | 509 | 100.0% |
Ancestry in Portland
The most populous ancestries reported in Portland are Mexican (98 | 19.3%), Spaniard (40 | 7.9%), Irish (29 | 5.7%), American (12 | 2.4%), and English (9 | 1.8%), together accounting for 36.9% of all Portland residents.
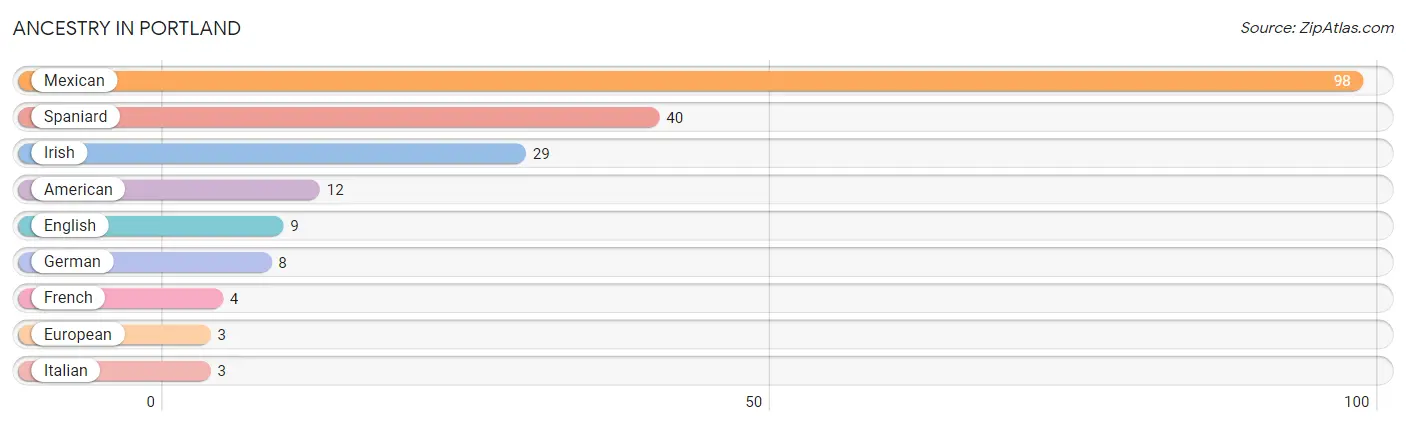
| Ancestry | # Population | % Population |
| American | 12 | 2.4% |
| English | 9 | 1.8% |
| European | 3 | 0.6% |
| French | 4 | 0.8% |
| German | 8 | 1.6% |
| Irish | 29 | 5.7% |
| Italian | 3 | 0.6% |
| Mexican | 98 | 19.3% |
| Spaniard | 40 | 7.9% | View All 9 Rows |
Immigrants in Portland
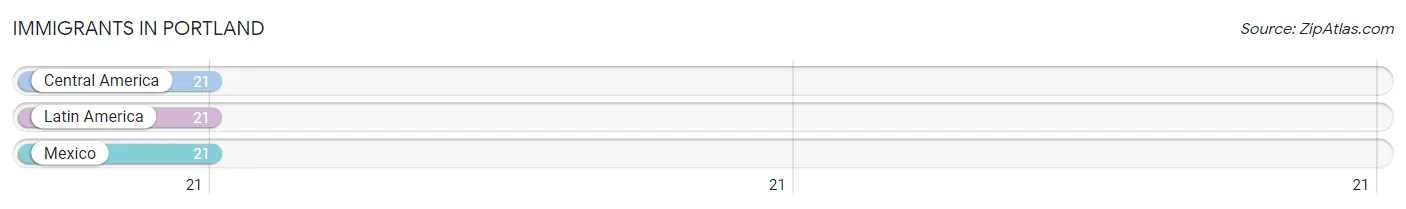
The most numerous immigrant groups reported in Portland came from Central America (21 | 4.1%), Latin America (21 | 4.1%), and Mexico (21 | 4.1%), together accounting for 12.4% of all Portland residents.
| Immigration Origin | # Population | % Population |
| Central America | 21 | 4.1% |
| Latin America | 21 | 4.1% |
| Mexico | 21 | 4.1% | View All 3 Rows |
Sex and Age in Portland
Sex and Age in Portland
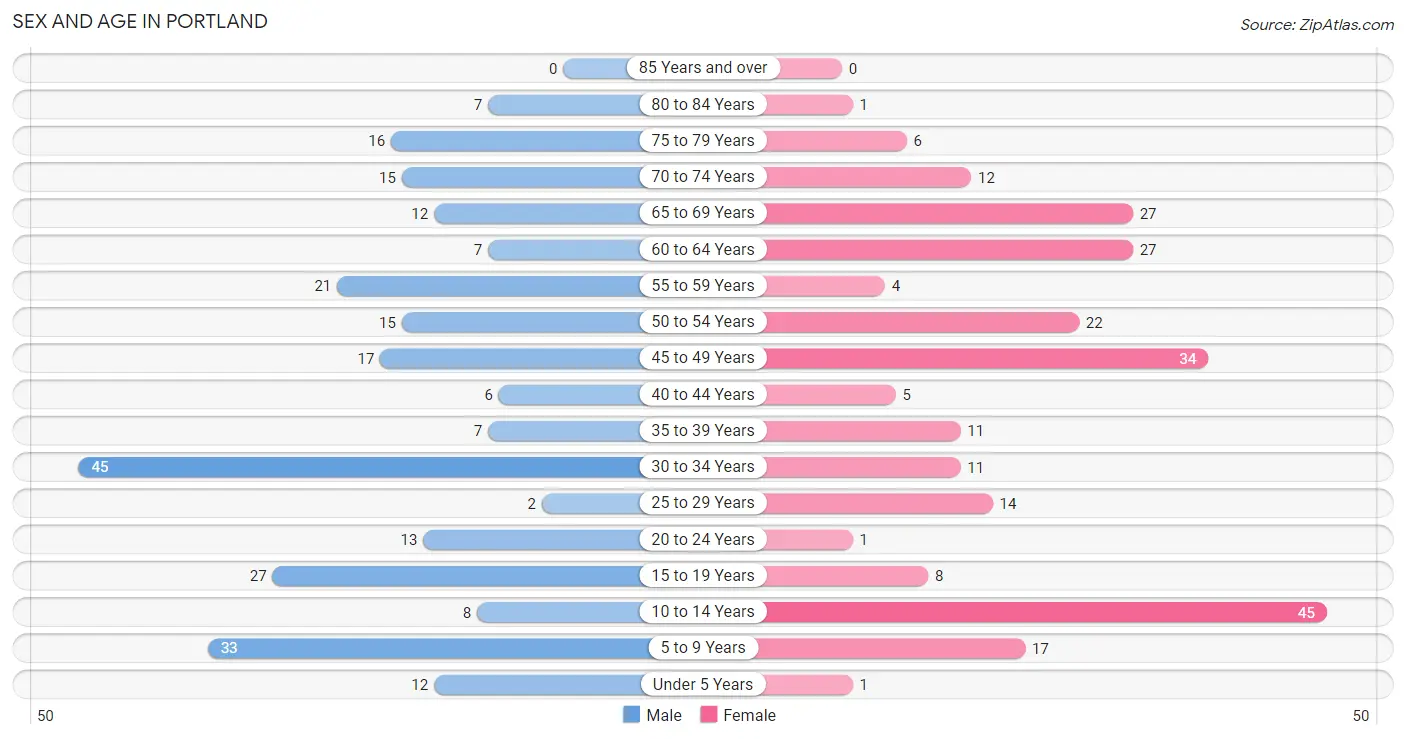
The most populous age groups in Portland are 30 to 34 Years (45 | 17.1%) for men and 10 to 14 Years (45 | 18.3%) for women.
| Age Bracket | Male | Female |
| Under 5 Years | 12 (4.6%) | 1 (0.4%) |
| 5 to 9 Years | 33 (12.6%) | 17 (6.9%) |
| 10 to 14 Years | 8 (3.0%) | 45 (18.3%) |
| 15 to 19 Years | 27 (10.3%) | 8 (3.3%) |
| 20 to 24 Years | 13 (4.9%) | 1 (0.4%) |
| 25 to 29 Years | 2 (0.8%) | 14 (5.7%) |
| 30 to 34 Years | 45 (17.1%) | 11 (4.5%) |
| 35 to 39 Years | 7 (2.7%) | 11 (4.5%) |
| 40 to 44 Years | 6 (2.3%) | 5 (2.0%) |
| 45 to 49 Years | 17 (6.5%) | 34 (13.8%) |
| 50 to 54 Years | 15 (5.7%) | 22 (8.9%) |
| 55 to 59 Years | 21 (8.0%) | 4 (1.6%) |
| 60 to 64 Years | 7 (2.7%) | 27 (11.0%) |
| 65 to 69 Years | 12 (4.6%) | 27 (11.0%) |
| 70 to 74 Years | 15 (5.7%) | 12 (4.9%) |
| 75 to 79 Years | 16 (6.1%) | 6 (2.4%) |
| 80 to 84 Years | 7 (2.7%) | 1 (0.4%) |
| 85 Years and over | 0 (0.0%) | 0 (0.0%) |
| Total | 263 (100.0%) | 246 (100.0%) |
Families and Households in Portland
Median Family Size in Portland
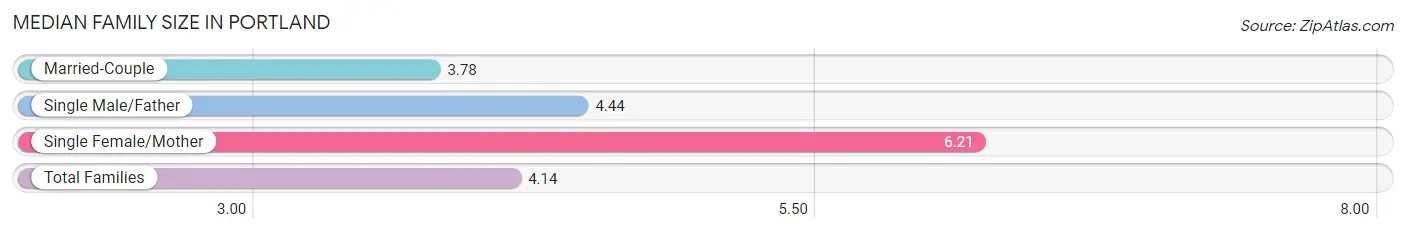
The median family size in Portland is 4.14 persons per family, with single female/mother families (14 | 12.6%) accounting for the largest median family size of 6.21 persons per family. On the other hand, married-couple families (88 | 79.3%) represent the smallest median family size with 3.78 persons per family.
| Family Type | # Families | Family Size |
| Married-Couple | 88 (79.3%) | 3.78 |
| Single Male/Father | 9 (8.1%) | 4.44 |
| Single Female/Mother | 14 (12.6%) | 6.21 |
| Total Families | 111 (100.0%) | 4.14 |
Median Household Size in Portland
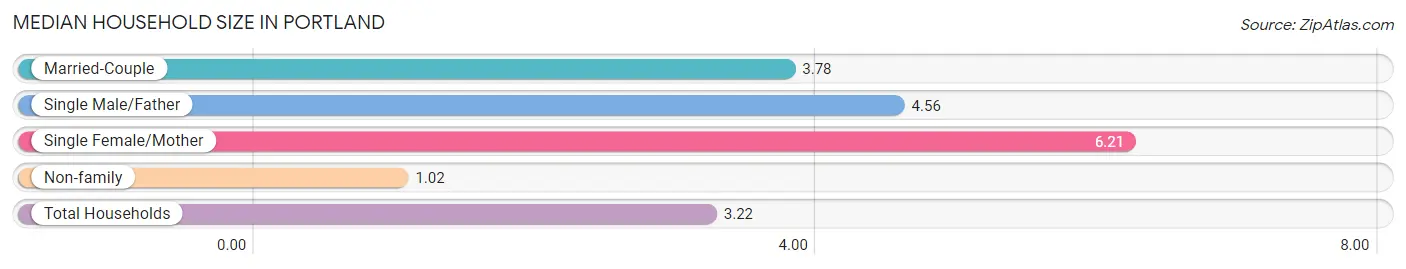
The median household size in Portland is 3.22 persons per household, with single female/mother households (14 | 8.9%) accounting for the largest median household size of 6.21 persons per household. non-family households (47 | 29.7%) represent the smallest median household size with 1.02 persons per household.
| Household Type | # Households | Household Size |
| Married-Couple | 88 (55.7%) | 3.78 |
| Single Male/Father | 9 (5.7%) | 4.56 |
| Single Female/Mother | 14 (8.9%) | 6.21 |
| Non-family | 47 (29.7%) | 1.02 |
| Total Households | 158 (100.0%) | 3.22 |
Household Size by Marriage Status in Portland
Out of a total of 158 households in Portland, 111 (70.3%) are family households, while 47 (29.7%) are nonfamily households. The most numerous type of family households are 2-person households, comprising 51, and the most common type of nonfamily households are 1-person households, comprising 46.
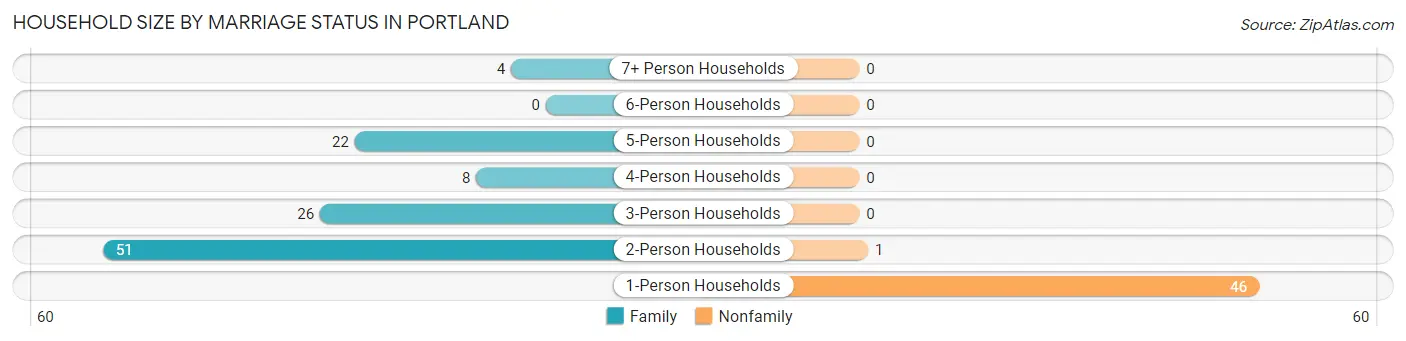
| Household Size | Family Households | Nonfamily Households |
| 1-Person Households | - | 46 (29.1%) |
| 2-Person Households | 51 (32.3%) | 1 (0.6%) |
| 3-Person Households | 26 (16.5%) | 0 (0.0%) |
| 4-Person Households | 8 (5.1%) | 0 (0.0%) |
| 5-Person Households | 22 (13.9%) | 0 (0.0%) |
| 6-Person Households | 0 (0.0%) | 0 (0.0%) |
| 7+ Person Households | 4 (2.5%) | 0 (0.0%) |
| Total | 111 (70.3%) | 47 (29.7%) |
Female Fertility in Portland
Fertility by Age in Portland
Average fertility rate in Portland is 22.0 births per 1,000 women. Women in the age bracket of 20 to 34 years have the highest fertility rate with 77.0 births per 1,000 women. Women in the age bracket of 20 to 34 years acount for 100.0% of all women with births.
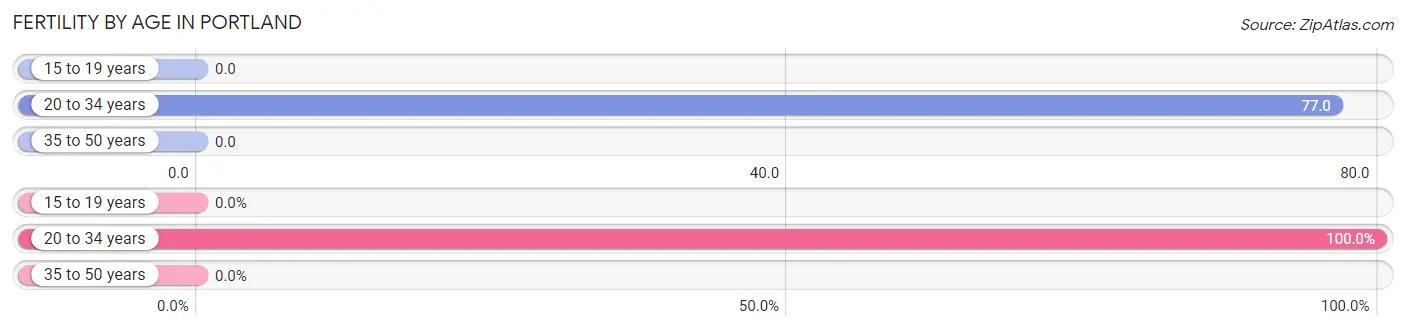
| Age Bracket | Women with Births | Births / 1,000 Women |
| 15 to 19 years | 0 (0.0%) | 0.0 |
| 20 to 34 years | 2 (100.0%) | 77.0 |
| 35 to 50 years | 0 (0.0%) | 0.0 |
| Total | 2 (100.0%) | 22.0 |
Fertility by Age by Marriage Status in Portland
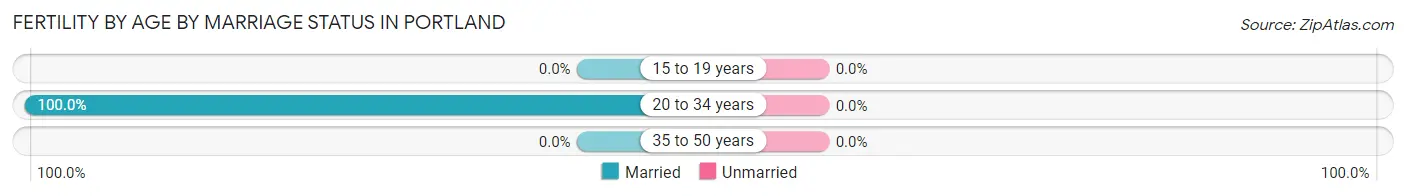
| Age Bracket | Married | Unmarried |
| 15 to 19 years | 0 (0.0%) | 0 (0.0%) |
| 20 to 34 years | 2 (100.0%) | 0 (0.0%) |
| 35 to 50 years | 0 (0.0%) | 0 (0.0%) |
| Total | 2 (100.0%) | 0 (0.0%) |
Fertility by Education in Portland
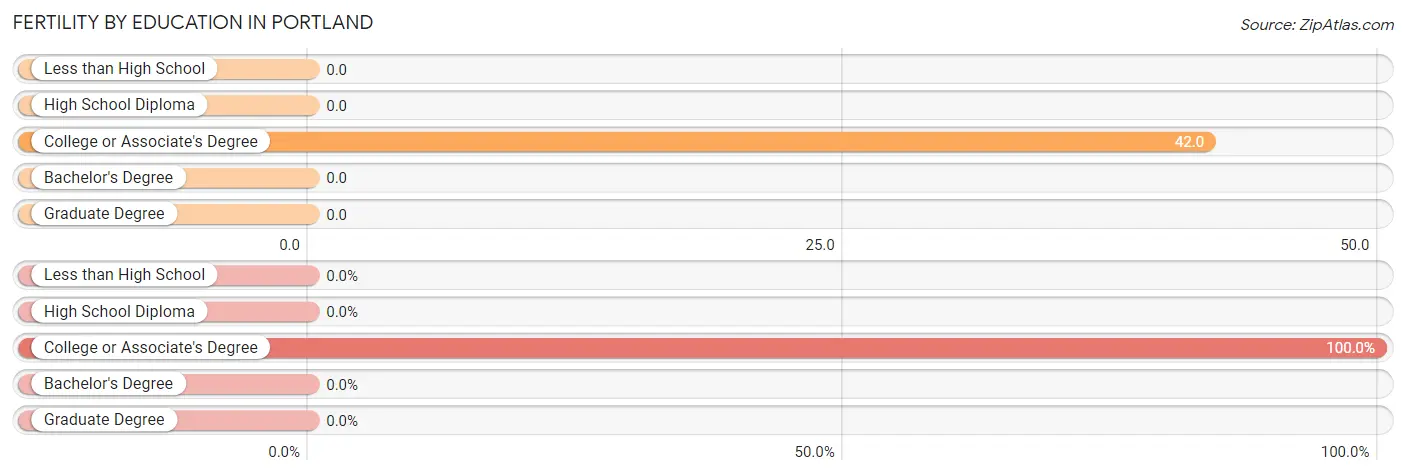
| Educational Attainment | Women with Births | Births / 1,000 Women |
| Less than High School | 0 (0.0%) | 0.0 |
| High School Diploma | 0 (0.0%) | 0.0 |
| College or Associate's Degree | 2 (100.0%) | 42.0 |
| Bachelor's Degree | 0 (0.0%) | 0.0 |
| Graduate Degree | 0 (0.0%) | 0.0 |
| Total | 2 (100.0%) | 22.0 |
Fertility by Education by Marriage Status in Portland
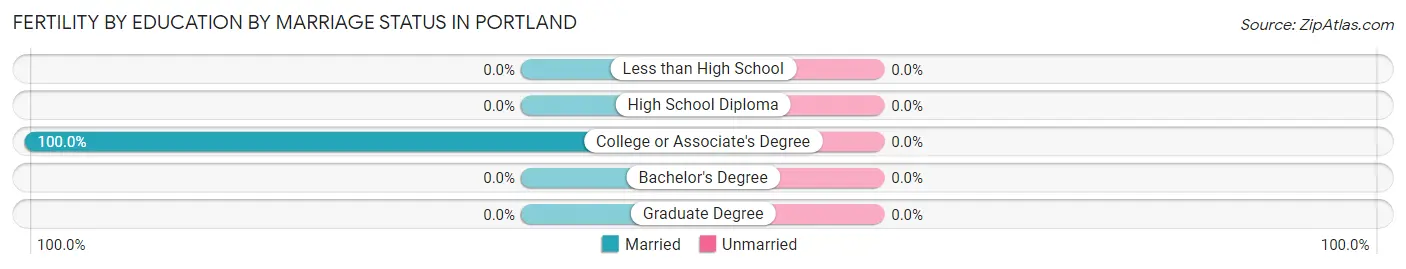
| Educational Attainment | Married | Unmarried |
| Less than High School | 0 (0.0%) | 0 (0.0%) |
| High School Diploma | 0 (0.0%) | 0 (0.0%) |
| College or Associate's Degree | 2 (100.0%) | 0 (0.0%) |
| Bachelor's Degree | 0 (0.0%) | 0 (0.0%) |
| Graduate Degree | 0 (0.0%) | 0 (0.0%) |
| Total | 2 (100.0%) | 0 (0.0%) |
Employment Characteristics in Portland
Employment by Class of Employer in Portland
Among the 202 employed individuals in Portland, private company employees (114 | 56.4%), state government employees (44 | 21.8%), and local government employees (19 | 9.4%) make up the most common classes of employment.
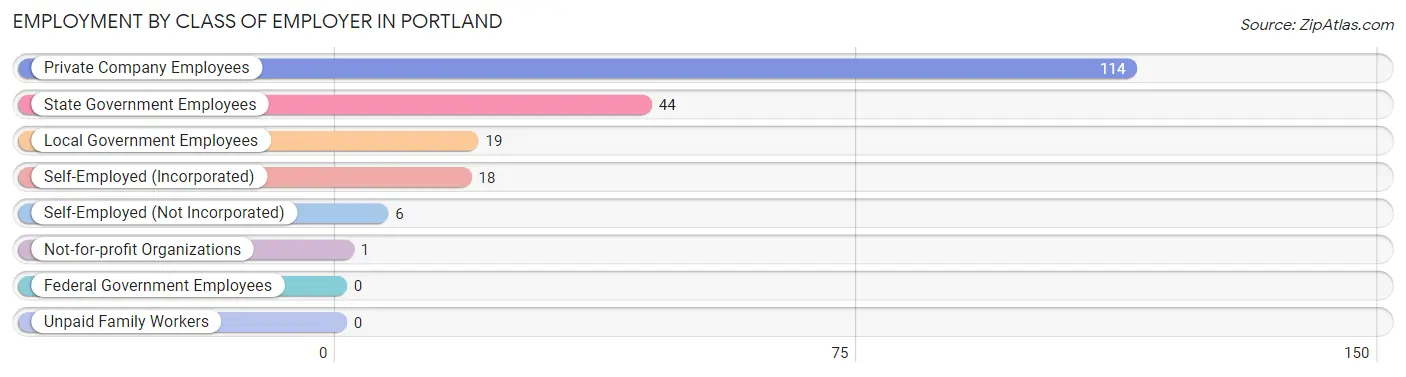
| Employer Class | # Employees | % Employees |
| Private Company Employees | 114 | 56.4% |
| Self-Employed (Incorporated) | 18 | 8.9% |
| Self-Employed (Not Incorporated) | 6 | 3.0% |
| Not-for-profit Organizations | 1 | 0.5% |
| Local Government Employees | 19 | 9.4% |
| State Government Employees | 44 | 21.8% |
| Federal Government Employees | 0 | 0.0% |
| Unpaid Family Workers | 0 | 0.0% |
| Total | 202 | 100.0% |
Employment Status by Age in Portland
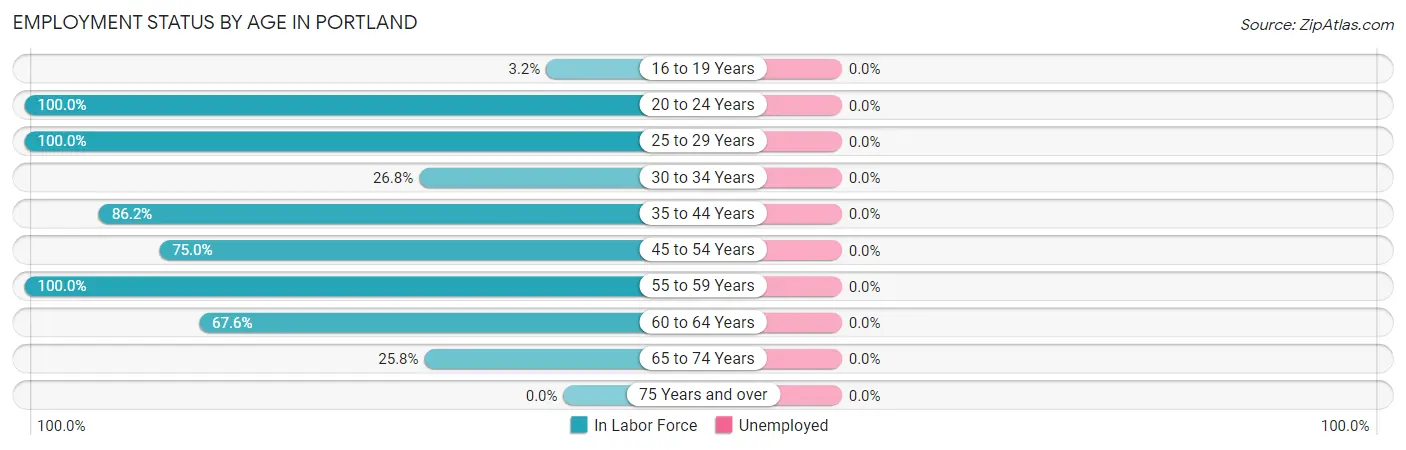
| Age Bracket | In Labor Force | Unemployed |
| 16 to 19 Years | 1 (3.2%) | 0 (0.0%) |
| 20 to 24 Years | 14 (100.0%) | 0 (0.0%) |
| 25 to 29 Years | 16 (100.0%) | 0 (0.0%) |
| 30 to 34 Years | 15 (26.8%) | 0 (0.0%) |
| 35 to 44 Years | 25 (86.2%) | 0 (0.0%) |
| 45 to 54 Years | 66 (75.0%) | 0 (0.0%) |
| 55 to 59 Years | 25 (100.0%) | 0 (0.0%) |
| 60 to 64 Years | 23 (67.6%) | 0 (0.0%) |
| 65 to 74 Years | 17 (25.8%) | 0 (0.0%) |
| 75 Years and over | 0 (0.0%) | 0 (0.0%) |
| Total | 202 (51.9%) | 0 (0.0%) |
Employment Status by Educational Attainment in Portland
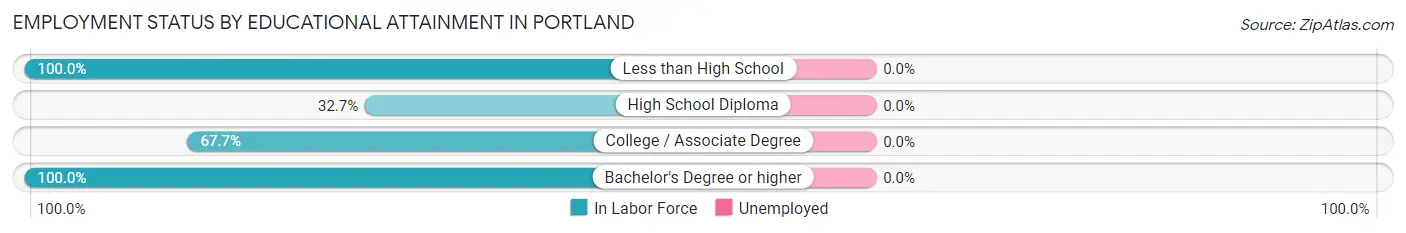
| Educational Attainment | In Labor Force | Unemployed |
| Less than High School | 28 (100.0%) | 0 (0.0%) |
| High School Diploma | 18 (32.7%) | 0 (0.0%) |
| College / Associate Degree | 86 (67.7%) | 0 (0.0%) |
| Bachelor's Degree or higher | 38 (100.0%) | 0 (0.0%) |
| Total | 170 (68.5%) | 0 (0.0%) |
Employment Occupations by Sex in Portland
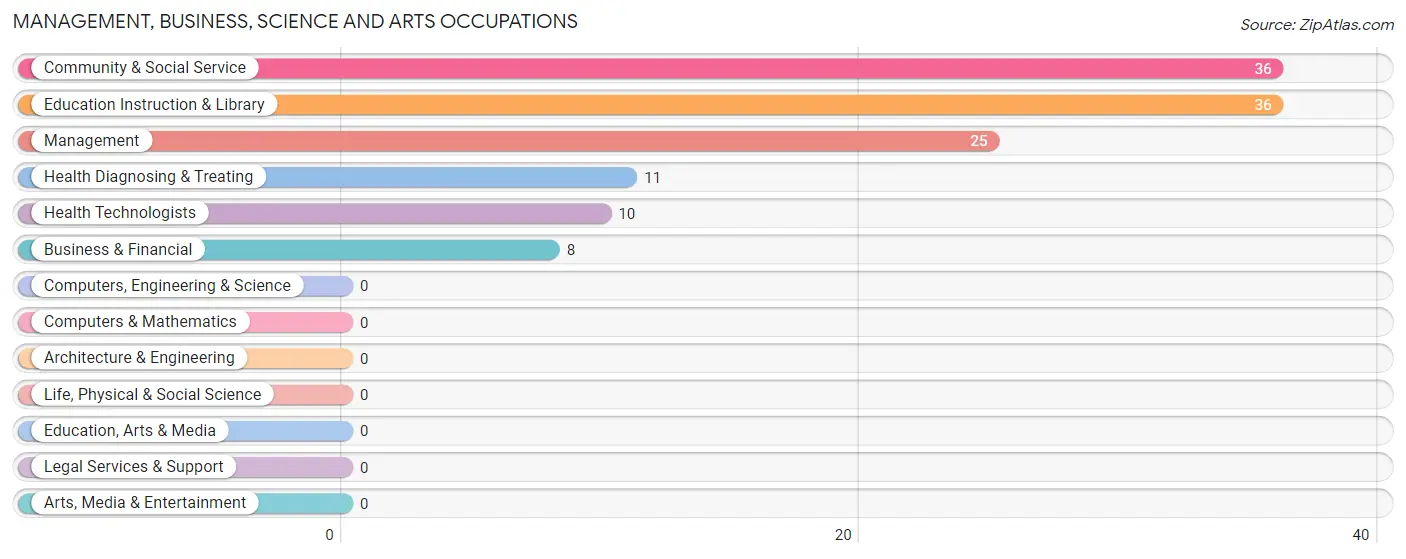
Management, Business, Science and Arts Occupations
The most common Management, Business, Science and Arts occupations in Portland are Community & Social Service (36 | 17.8%), Education Instruction & Library (36 | 17.8%), Management (25 | 12.4%), Health Diagnosing & Treating (11 | 5.4%), and Health Technologists (10 | 5.0%).
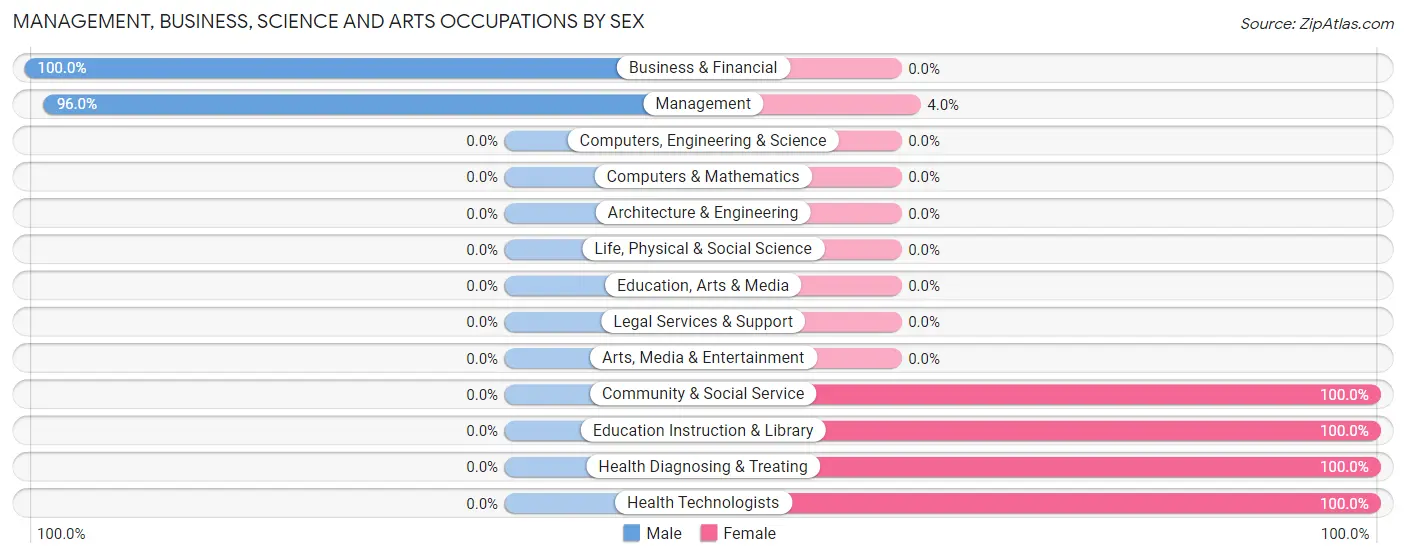
Management, Business, Science and Arts Occupations by Sex
Within the Management, Business, Science and Arts occupations in Portland, the most male-oriented occupations are Business & Financial (100.0%), and Management (96.0%), while the most female-oriented occupations are Community & Social Service (100.0%), Education Instruction & Library (100.0%), and Health Diagnosing & Treating (100.0%).
| Occupation | Male | Female |
| Management | 24 (96.0%) | 1 (4.0%) |
| Business & Financial | 8 (100.0%) | 0 (0.0%) |
| Computers, Engineering & Science | 0 (0.0%) | 0 (0.0%) |
| Computers & Mathematics | 0 (0.0%) | 0 (0.0%) |
| Architecture & Engineering | 0 (0.0%) | 0 (0.0%) |
| Life, Physical & Social Science | 0 (0.0%) | 0 (0.0%) |
| Community & Social Service | 0 (0.0%) | 36 (100.0%) |
| Education, Arts & Media | 0 (0.0%) | 0 (0.0%) |
| Legal Services & Support | 0 (0.0%) | 0 (0.0%) |
| Education Instruction & Library | 0 (0.0%) | 36 (100.0%) |
| Arts, Media & Entertainment | 0 (0.0%) | 0 (0.0%) |
| Health Diagnosing & Treating | 0 (0.0%) | 11 (100.0%) |
| Health Technologists | 0 (0.0%) | 10 (100.0%) |
| Total (Category) | 32 (40.0%) | 48 (60.0%) |
| Total (Overall) | 79 (39.1%) | 123 (60.9%) |
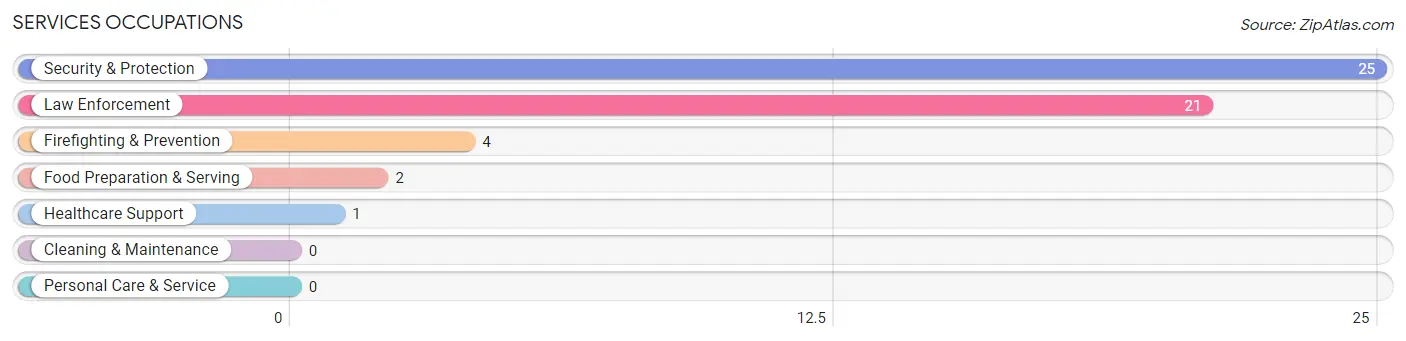
Services Occupations
The most common Services occupations in Portland are Security & Protection (25 | 12.4%), Law Enforcement (21 | 10.4%), Firefighting & Prevention (4 | 2.0%), Food Preparation & Serving (2 | 1.0%), and Healthcare Support (1 | 0.5%).
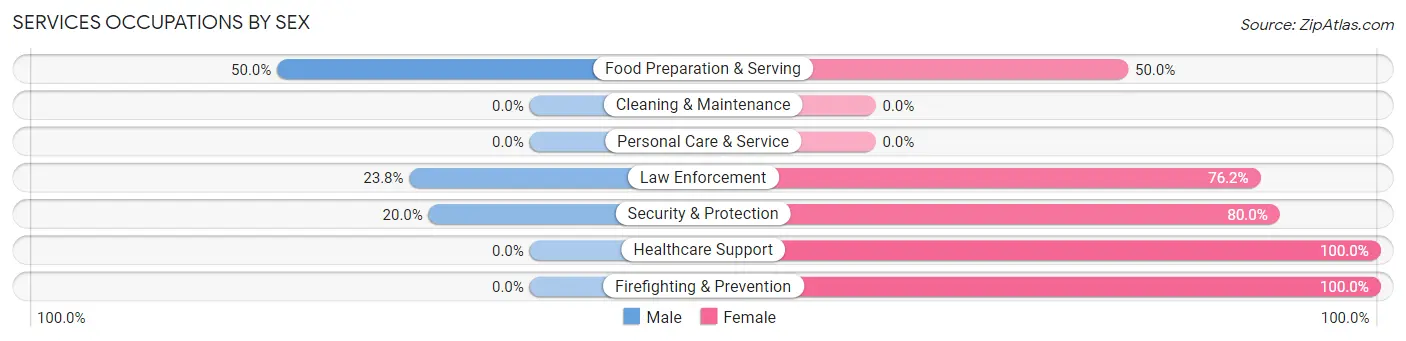
Services Occupations by Sex
Within the Services occupations in Portland, the most male-oriented occupations are Food Preparation & Serving (50.0%), Law Enforcement (23.8%), and Security & Protection (20.0%), while the most female-oriented occupations are Healthcare Support (100.0%), Firefighting & Prevention (100.0%), and Security & Protection (80.0%).
| Occupation | Male | Female |
| Healthcare Support | 0 (0.0%) | 1 (100.0%) |
| Security & Protection | 5 (20.0%) | 20 (80.0%) |
| Firefighting & Prevention | 0 (0.0%) | 4 (100.0%) |
| Law Enforcement | 5 (23.8%) | 16 (76.2%) |
| Food Preparation & Serving | 1 (50.0%) | 1 (50.0%) |
| Cleaning & Maintenance | 0 (0.0%) | 0 (0.0%) |
| Personal Care & Service | 0 (0.0%) | 0 (0.0%) |
| Total (Category) | 6 (21.4%) | 22 (78.6%) |
| Total (Overall) | 79 (39.1%) | 123 (60.9%) |
Sales and Office Occupations
The most common Sales and Office occupations in Portland are Office & Administration (19 | 9.4%), and Sales & Related (8 | 4.0%).
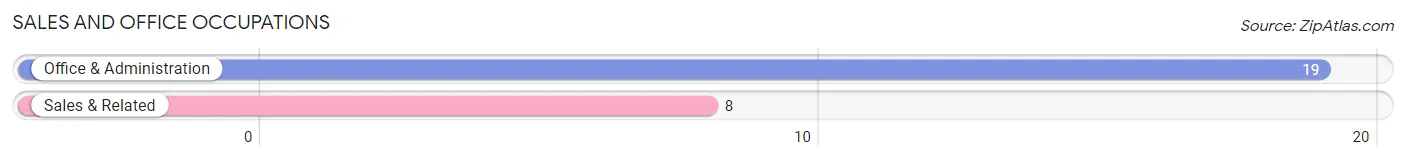
Sales and Office Occupations by Sex

| Occupation | Male | Female |
| Sales & Related | 8 (100.0%) | 0 (0.0%) |
| Office & Administration | 3 (15.8%) | 16 (84.2%) |
| Total (Category) | 11 (40.7%) | 16 (59.3%) |
| Total (Overall) | 79 (39.1%) | 123 (60.9%) |
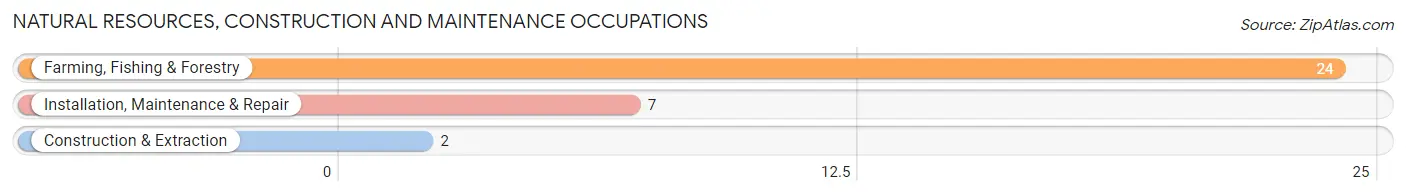
Natural Resources, Construction and Maintenance Occupations
The most common Natural Resources, Construction and Maintenance occupations in Portland are Farming, Fishing & Forestry (24 | 11.9%), Installation, Maintenance & Repair (7 | 3.5%), and Construction & Extraction (2 | 1.0%).
Natural Resources, Construction and Maintenance Occupations by Sex
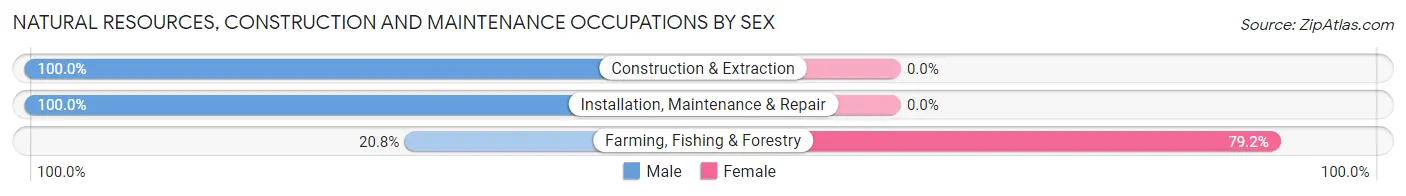
| Occupation | Male | Female |
| Farming, Fishing & Forestry | 5 (20.8%) | 19 (79.2%) |
| Construction & Extraction | 2 (100.0%) | 0 (0.0%) |
| Installation, Maintenance & Repair | 7 (100.0%) | 0 (0.0%) |
| Total (Category) | 14 (42.4%) | 19 (57.6%) |
| Total (Overall) | 79 (39.1%) | 123 (60.9%) |
Production, Transportation and Moving Occupations
The most common Production, Transportation and Moving occupations in Portland are Transportation (24 | 11.9%), Production (9 | 4.5%), and Material Moving (1 | 0.5%).
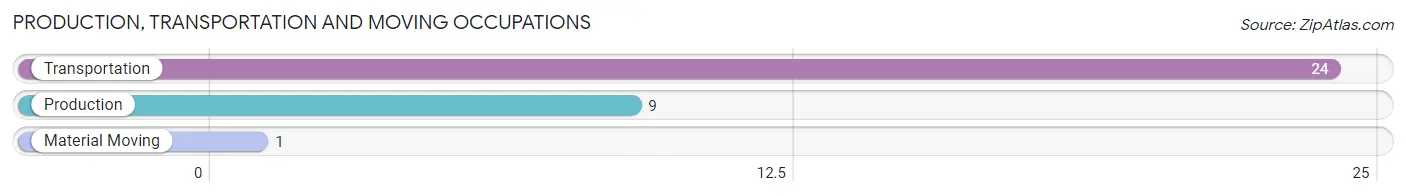
Production, Transportation and Moving Occupations by Sex
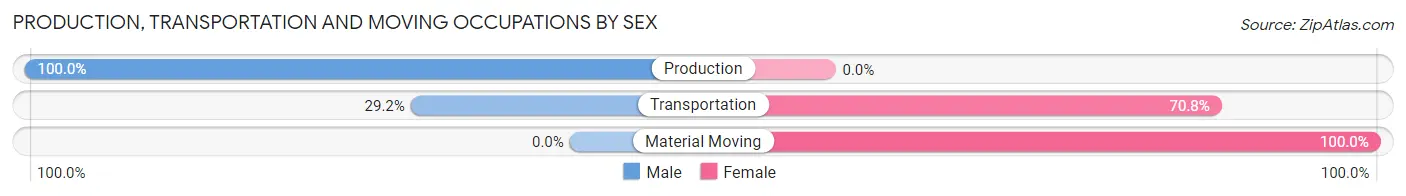
| Occupation | Male | Female |
| Production | 9 (100.0%) | 0 (0.0%) |
| Transportation | 7 (29.2%) | 17 (70.8%) |
| Material Moving | 0 (0.0%) | 1 (100.0%) |
| Total (Category) | 16 (47.1%) | 18 (52.9%) |
| Total (Overall) | 79 (39.1%) | 123 (60.9%) |
Employment Industries by Sex in Portland
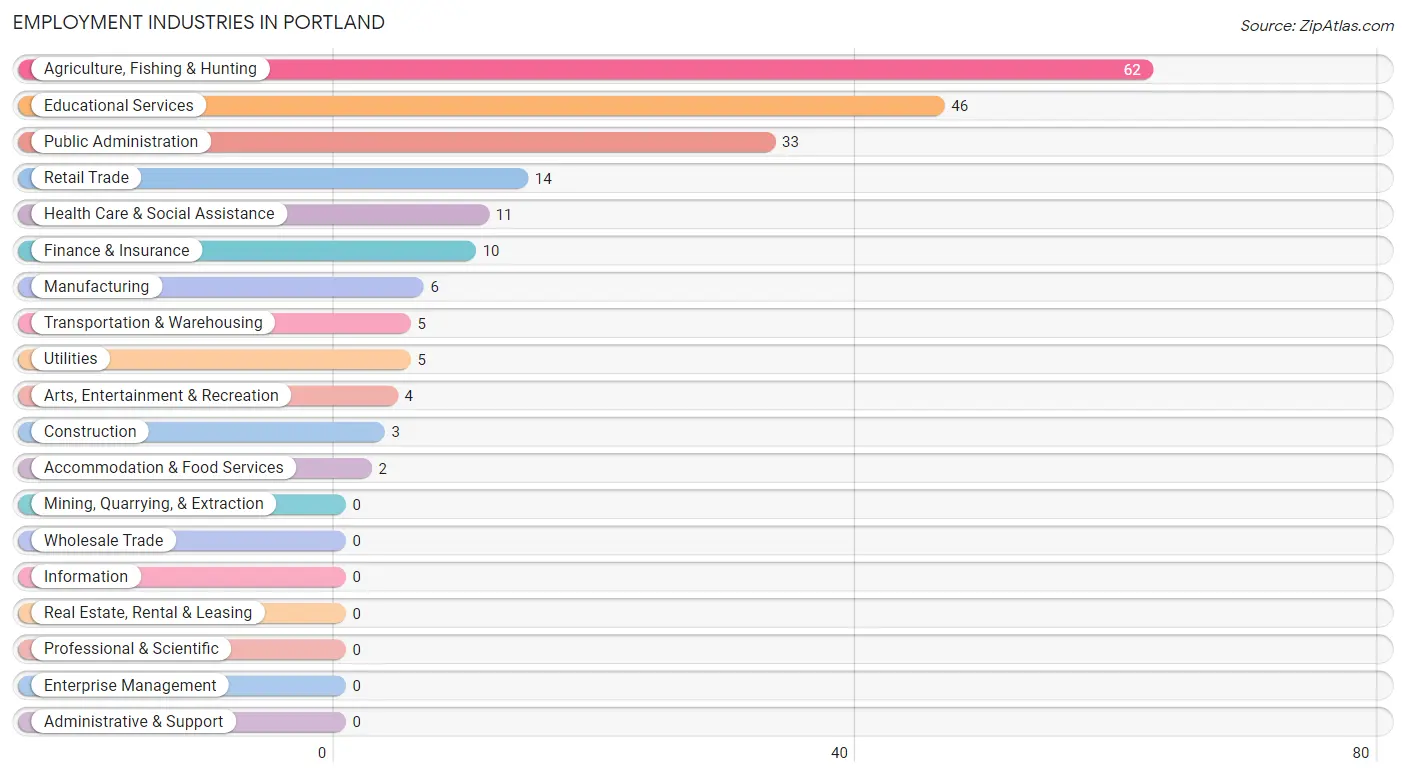
Employment Industries in Portland
The major employment industries in Portland include Agriculture, Fishing & Hunting (62 | 30.7%), Educational Services (46 | 22.8%), Public Administration (33 | 16.3%), Retail Trade (14 | 6.9%), and Health Care & Social Assistance (11 | 5.4%).
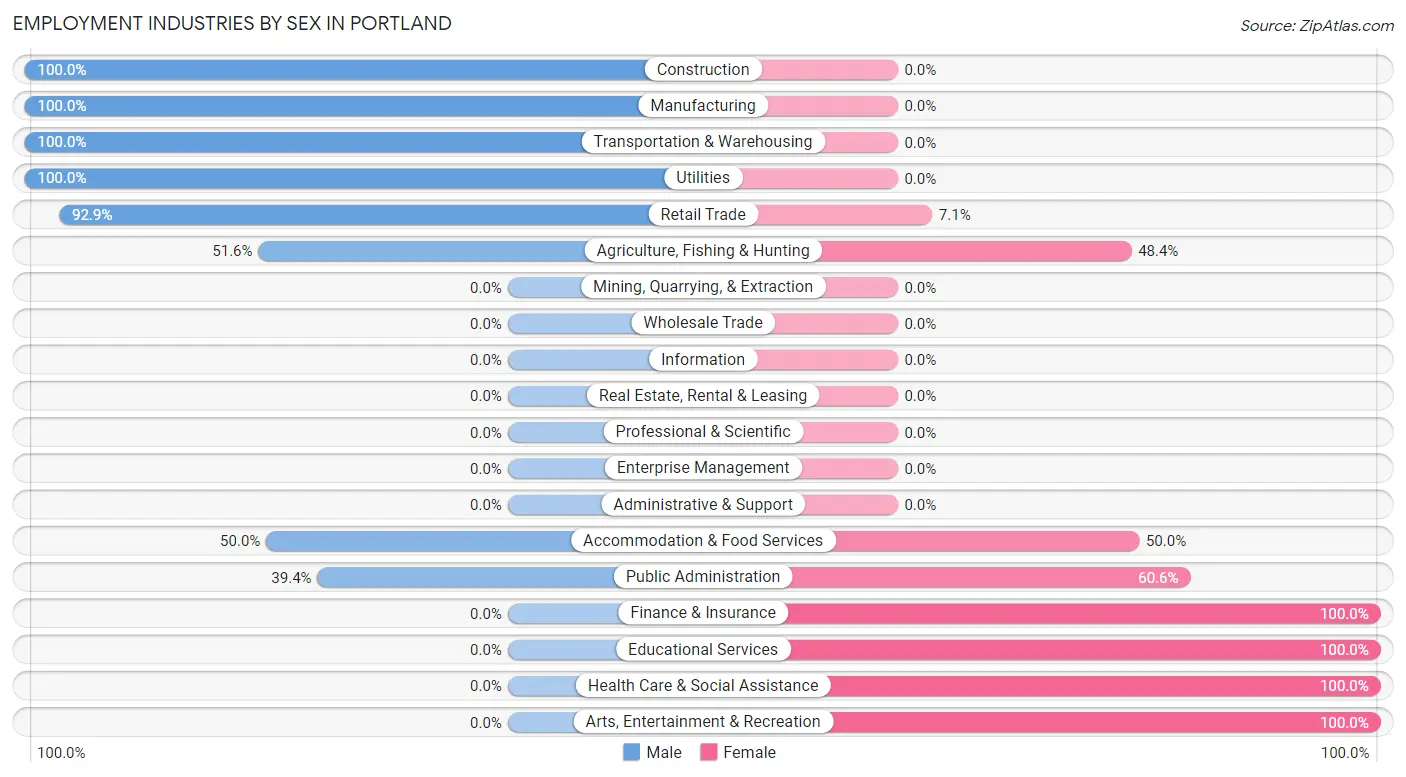
Employment Industries by Sex in Portland
The Portland industries that see more men than women are Construction (100.0%), Manufacturing (100.0%), and Transportation & Warehousing (100.0%), whereas the industries that tend to have a higher number of women are Finance & Insurance (100.0%), Educational Services (100.0%), and Health Care & Social Assistance (100.0%).
| Industry | Male | Female |
| Agriculture, Fishing & Hunting | 32 (51.6%) | 30 (48.4%) |
| Mining, Quarrying, & Extraction | 0 (0.0%) | 0 (0.0%) |
| Construction | 3 (100.0%) | 0 (0.0%) |
| Manufacturing | 6 (100.0%) | 0 (0.0%) |
| Wholesale Trade | 0 (0.0%) | 0 (0.0%) |
| Retail Trade | 13 (92.9%) | 1 (7.1%) |
| Transportation & Warehousing | 5 (100.0%) | 0 (0.0%) |
| Utilities | 5 (100.0%) | 0 (0.0%) |
| Information | 0 (0.0%) | 0 (0.0%) |
| Finance & Insurance | 0 (0.0%) | 10 (100.0%) |
| Real Estate, Rental & Leasing | 0 (0.0%) | 0 (0.0%) |
| Professional & Scientific | 0 (0.0%) | 0 (0.0%) |
| Enterprise Management | 0 (0.0%) | 0 (0.0%) |
| Administrative & Support | 0 (0.0%) | 0 (0.0%) |
| Educational Services | 0 (0.0%) | 46 (100.0%) |
| Health Care & Social Assistance | 0 (0.0%) | 11 (100.0%) |
| Arts, Entertainment & Recreation | 0 (0.0%) | 4 (100.0%) |
| Accommodation & Food Services | 1 (50.0%) | 1 (50.0%) |
| Public Administration | 13 (39.4%) | 20 (60.6%) |
| Total | 79 (39.1%) | 123 (60.9%) |
Education in Portland
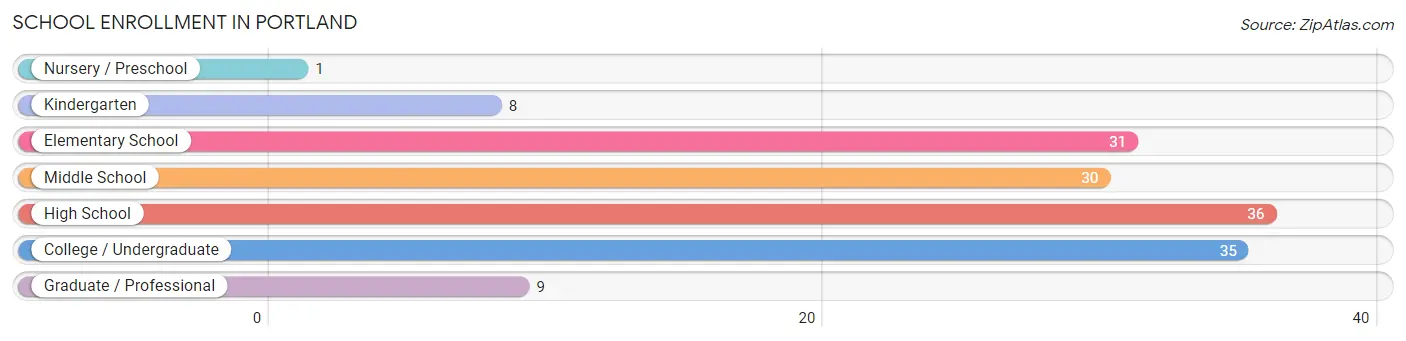
School Enrollment in Portland
The most common levels of schooling among the 150 students in Portland are high school (36 | 24.0%), college / undergraduate (35 | 23.3%), and elementary school (31 | 20.7%).
| School Level | # Students | % Students |
| Nursery / Preschool | 1 | 0.7% |
| Kindergarten | 8 | 5.3% |
| Elementary School | 31 | 20.7% |
| Middle School | 30 | 20.0% |
| High School | 36 | 24.0% |
| College / Undergraduate | 35 | 23.3% |
| Graduate / Professional | 9 | 6.0% |
| Total | 150 | 100.0% |
School Enrollment by Age by Funding Source in Portland
Out of a total of 150 students who are enrolled in schools in Portland, 16 (10.7%) attend a private institution, while the remaining 134 (89.3%) are enrolled in public schools. The age group of 20 to 24 year olds has the highest likelihood of being enrolled in private schools, with 8 (88.9% in the age bracket) enrolled. Conversely, the age group of 3 to 4 year olds has the lowest likelihood of being enrolled in a private school, with 1 (100.0% in the age bracket) attending a public institution.
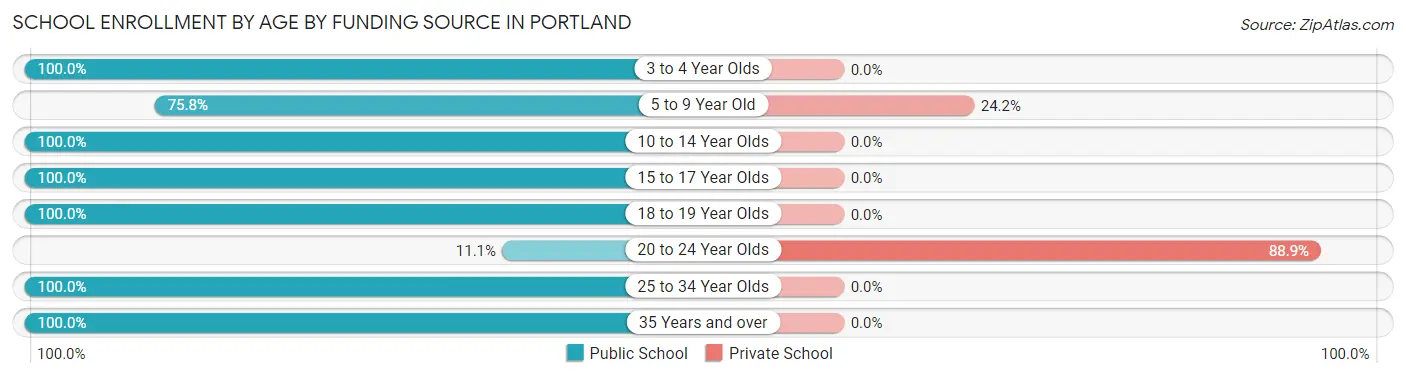
| Age Bracket | Public School | Private School |
| 3 to 4 Year Olds | 1 (100.0%) | 0 (0.0%) |
| 5 to 9 Year Old | 25 (75.8%) | 8 (24.2%) |
| 10 to 14 Year Olds | 36 (100.0%) | 0 (0.0%) |
| 15 to 17 Year Olds | 18 (100.0%) | 0 (0.0%) |
| 18 to 19 Year Olds | 17 (100.0%) | 0 (0.0%) |
| 20 to 24 Year Olds | 1 (11.1%) | 8 (88.9%) |
| 25 to 34 Year Olds | 35 (100.0%) | 0 (0.0%) |
| 35 Years and over | 1 (100.0%) | 0 (0.0%) |
| Total | 134 (89.3%) | 16 (10.7%) |
Educational Attainment by Field of Study in Portland
Business (20 | 38.5%), education (13 | 25.0%), bio, nature & agricultural (11 | 21.1%), psychology (6 | 11.5%), and science & technology (2 | 3.8%) are the most common fields of study among 52 individuals in Portland who have obtained a bachelor's degree or higher.
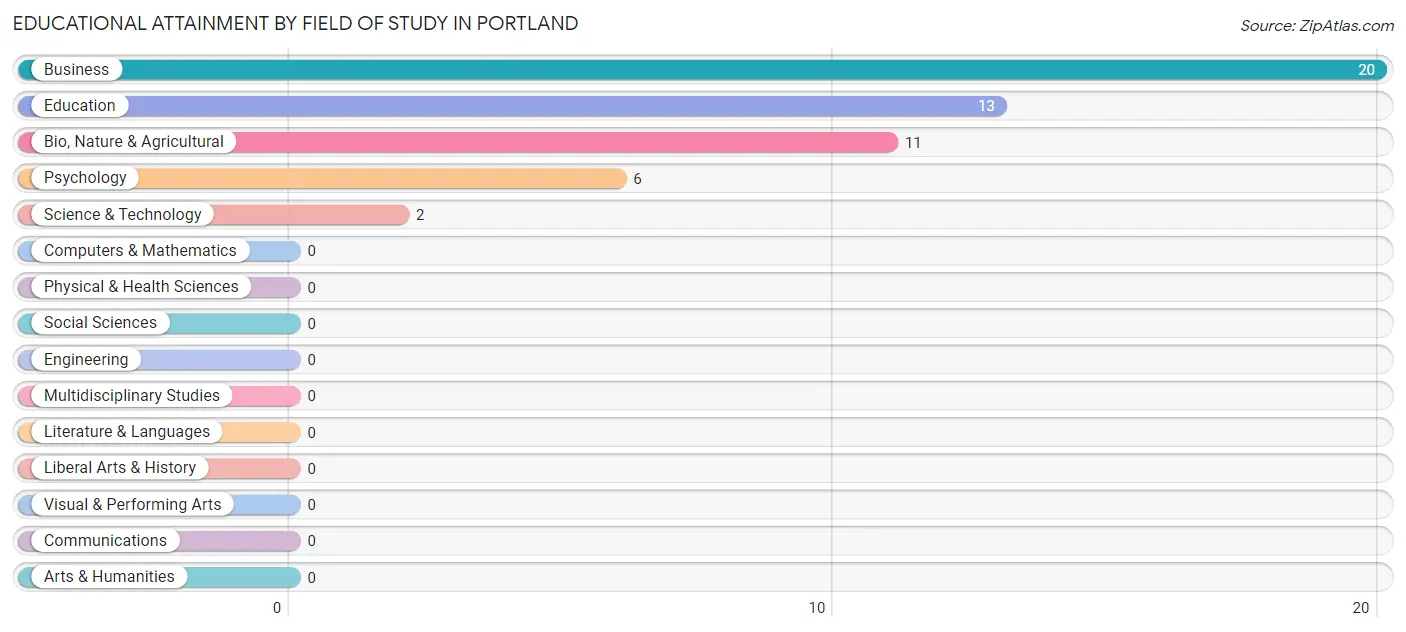
| Field of Study | # Graduates | % Graduates |
| Computers & Mathematics | 0 | 0.0% |
| Bio, Nature & Agricultural | 11 | 21.1% |
| Physical & Health Sciences | 0 | 0.0% |
| Psychology | 6 | 11.5% |
| Social Sciences | 0 | 0.0% |
| Engineering | 0 | 0.0% |
| Multidisciplinary Studies | 0 | 0.0% |
| Science & Technology | 2 | 3.8% |
| Business | 20 | 38.5% |
| Education | 13 | 25.0% |
| Literature & Languages | 0 | 0.0% |
| Liberal Arts & History | 0 | 0.0% |
| Visual & Performing Arts | 0 | 0.0% |
| Communications | 0 | 0.0% |
| Arts & Humanities | 0 | 0.0% |
| Total | 52 | 100.0% |
Transportation & Commute in Portland
Vehicle Availability by Sex in Portland
The most prevalent vehicle ownership categories in Portland are males with 2 vehicles (59, accounting for 74.7%) and females with 2 vehicles (50, making up 48.0%).
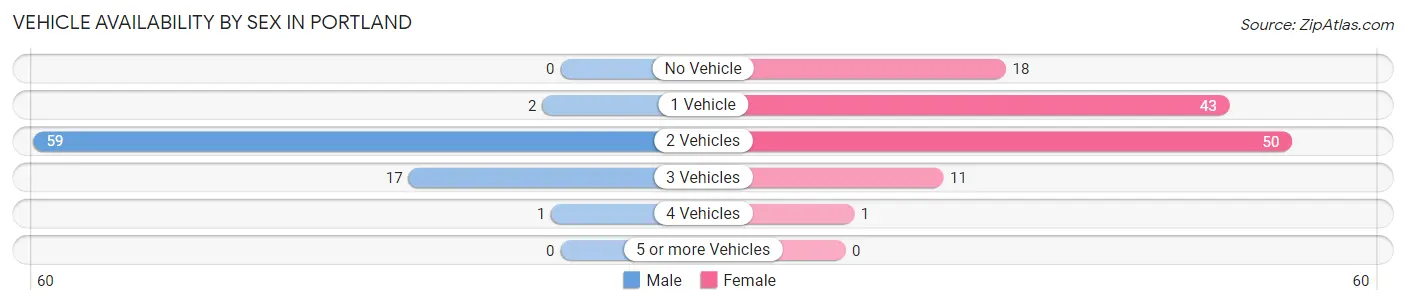
| Vehicles Available | Male | Female |
| No Vehicle | 0 (0.0%) | 18 (14.6%) |
| 1 Vehicle | 2 (2.5%) | 43 (35.0%) |
| 2 Vehicles | 59 (74.7%) | 50 (40.6%) |
| 3 Vehicles | 17 (21.5%) | 11 (8.9%) |
| 4 Vehicles | 1 (1.3%) | 1 (0.8%) |
| 5 or more Vehicles | 0 (0.0%) | 0 (0.0%) |
| Total | 79 (100.0%) | 123 (100.0%) |
Commute Time in Portland
The most frequently occuring commute durations in Portland are 5 to 9 minutes (88 commuters, 44.2%), 30 to 34 minutes (43 commuters, 21.6%), and 20 to 24 minutes (11 commuters, 5.5%).
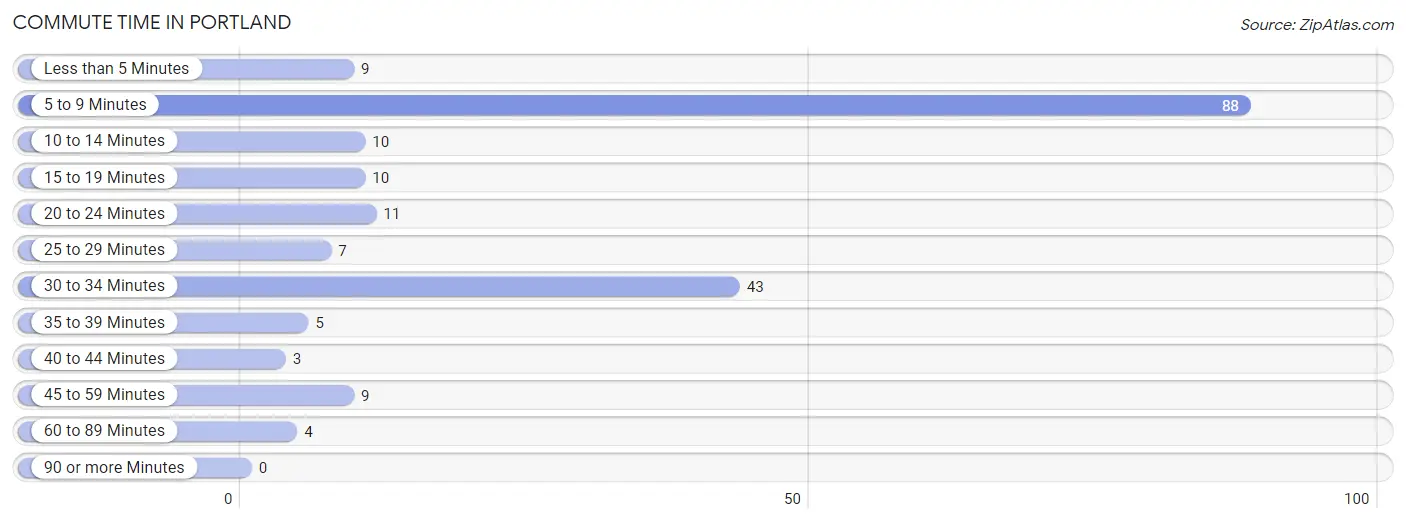
| Commute Time | # Commuters | % Commuters |
| Less than 5 Minutes | 9 | 4.5% |
| 5 to 9 Minutes | 88 | 44.2% |
| 10 to 14 Minutes | 10 | 5.0% |
| 15 to 19 Minutes | 10 | 5.0% |
| 20 to 24 Minutes | 11 | 5.5% |
| 25 to 29 Minutes | 7 | 3.5% |
| 30 to 34 Minutes | 43 | 21.6% |
| 35 to 39 Minutes | 5 | 2.5% |
| 40 to 44 Minutes | 3 | 1.5% |
| 45 to 59 Minutes | 9 | 4.5% |
| 60 to 89 Minutes | 4 | 2.0% |
| 90 or more Minutes | 0 | 0.0% |
Commute Time by Sex in Portland
The most common commute times in Portland are 5 to 9 minutes (27 commuters, 34.2%) for males and 5 to 9 minutes (61 commuters, 50.8%) for females.
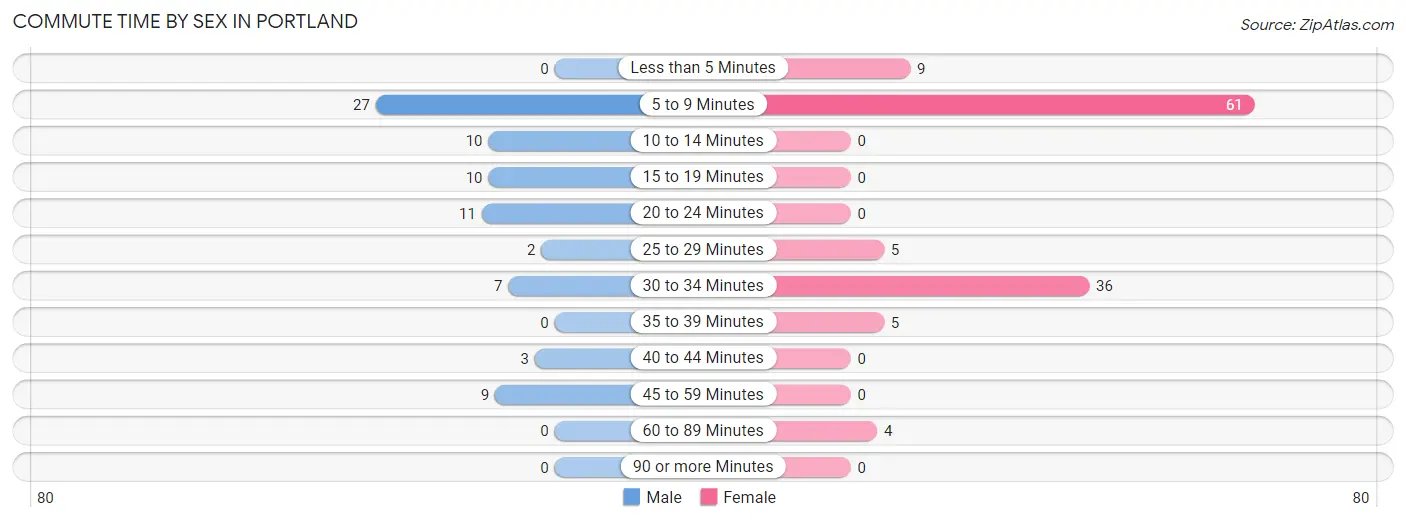
| Commute Time | Male | Female |
| Less than 5 Minutes | 0 (0.0%) | 9 (7.5%) |
| 5 to 9 Minutes | 27 (34.2%) | 61 (50.8%) |
| 10 to 14 Minutes | 10 (12.7%) | 0 (0.0%) |
| 15 to 19 Minutes | 10 (12.7%) | 0 (0.0%) |
| 20 to 24 Minutes | 11 (13.9%) | 0 (0.0%) |
| 25 to 29 Minutes | 2 (2.5%) | 5 (4.2%) |
| 30 to 34 Minutes | 7 (8.9%) | 36 (30.0%) |
| 35 to 39 Minutes | 0 (0.0%) | 5 (4.2%) |
| 40 to 44 Minutes | 3 (3.8%) | 0 (0.0%) |
| 45 to 59 Minutes | 9 (11.4%) | 0 (0.0%) |
| 60 to 89 Minutes | 0 (0.0%) | 4 (3.3%) |
| 90 or more Minutes | 0 (0.0%) | 0 (0.0%) |
Time of Departure to Work by Sex in Portland
The most frequent times of departure to work in Portland are 6:30 AM to 6:59 AM (28, 35.4%) for males and 6:00 AM to 6:29 AM (39, 32.5%) for females.
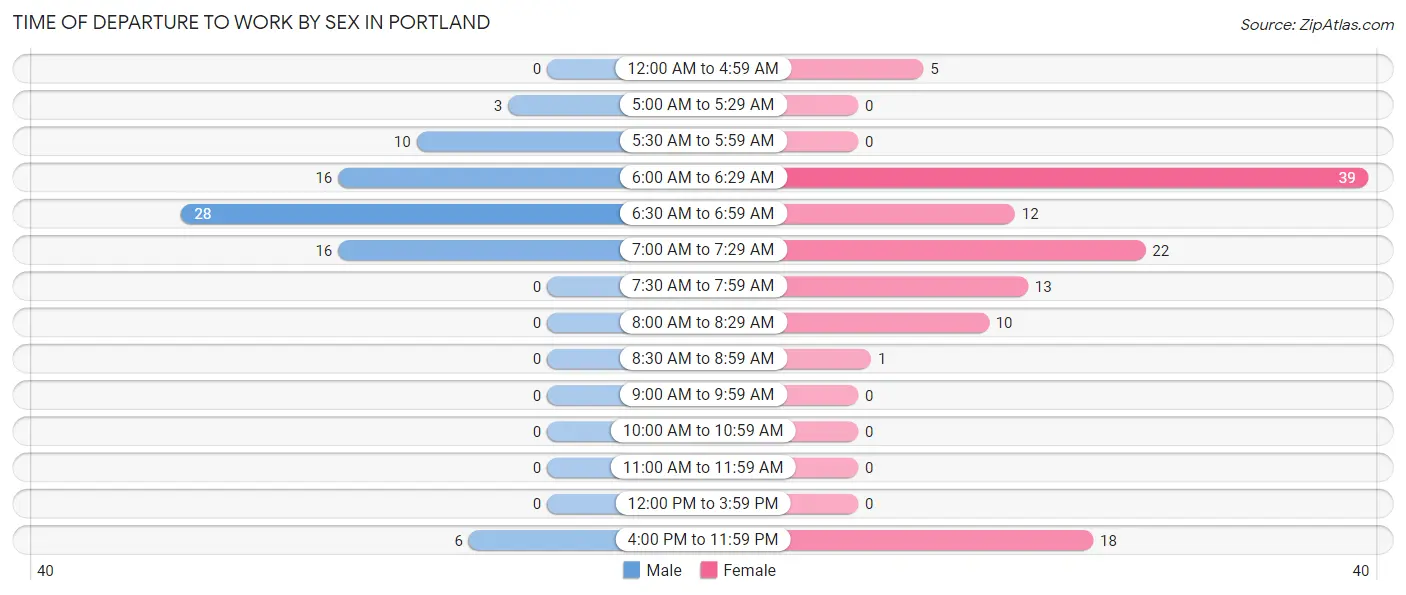
| Time of Departure | Male | Female |
| 12:00 AM to 4:59 AM | 0 (0.0%) | 5 (4.2%) |
| 5:00 AM to 5:29 AM | 3 (3.8%) | 0 (0.0%) |
| 5:30 AM to 5:59 AM | 10 (12.7%) | 0 (0.0%) |
| 6:00 AM to 6:29 AM | 16 (20.3%) | 39 (32.5%) |
| 6:30 AM to 6:59 AM | 28 (35.4%) | 12 (10.0%) |
| 7:00 AM to 7:29 AM | 16 (20.3%) | 22 (18.3%) |
| 7:30 AM to 7:59 AM | 0 (0.0%) | 13 (10.8%) |
| 8:00 AM to 8:29 AM | 0 (0.0%) | 10 (8.3%) |
| 8:30 AM to 8:59 AM | 0 (0.0%) | 1 (0.8%) |
| 9:00 AM to 9:59 AM | 0 (0.0%) | 0 (0.0%) |
| 10:00 AM to 10:59 AM | 0 (0.0%) | 0 (0.0%) |
| 11:00 AM to 11:59 AM | 0 (0.0%) | 0 (0.0%) |
| 12:00 PM to 3:59 PM | 0 (0.0%) | 0 (0.0%) |
| 4:00 PM to 11:59 PM | 6 (7.6%) | 18 (15.0%) |
| Total | 79 (100.0%) | 120 (100.0%) |
Housing Occupancy in Portland
Occupancy by Ownership in Portland
Of the total 158 dwellings in Portland, owner-occupied units account for 137 (86.7%), while renter-occupied units make up 21 (13.3%).
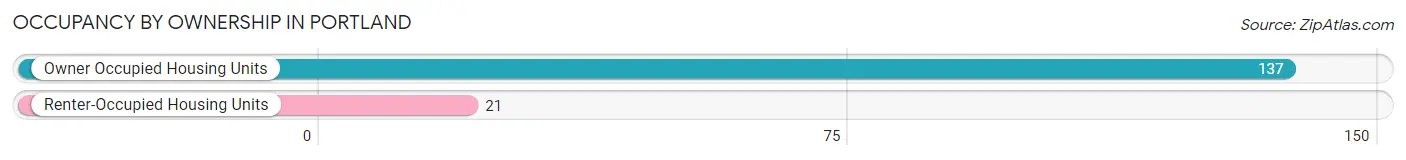
| Occupancy | # Housing Units | % Housing Units |
| Owner Occupied Housing Units | 137 | 86.7% |
| Renter-Occupied Housing Units | 21 | 13.3% |
| Total Occupied Housing Units | 158 | 100.0% |
Occupancy by Household Size in Portland
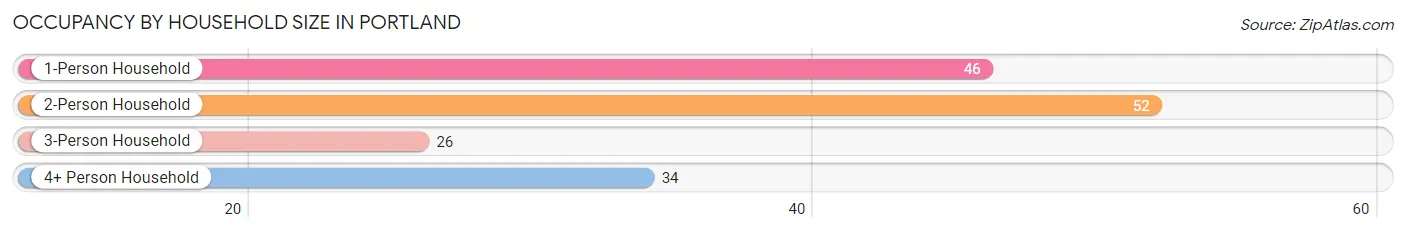
| Household Size | # Housing Units | % Housing Units |
| 1-Person Household | 46 | 29.1% |
| 2-Person Household | 52 | 32.9% |
| 3-Person Household | 26 | 16.5% |
| 4+ Person Household | 34 | 21.5% |
| Total Housing Units | 158 | 100.0% |
Occupancy by Ownership by Household Size in Portland
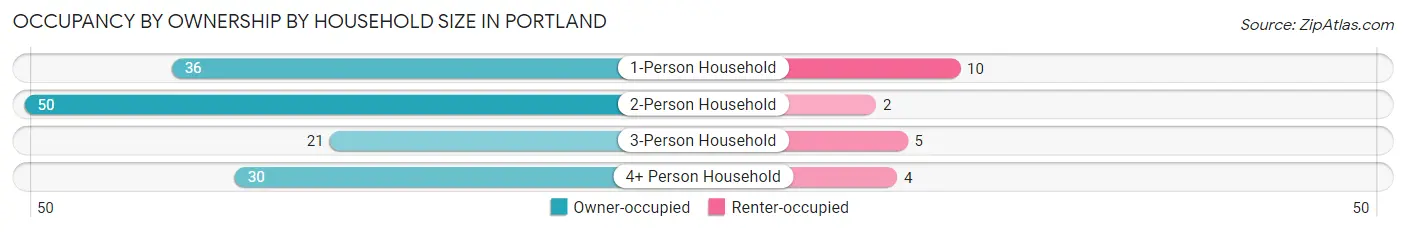
| Household Size | Owner-occupied | Renter-occupied |
| 1-Person Household | 36 (78.3%) | 10 (21.7%) |
| 2-Person Household | 50 (96.2%) | 2 (3.8%) |
| 3-Person Household | 21 (80.8%) | 5 (19.2%) |
| 4+ Person Household | 30 (88.2%) | 4 (11.8%) |
| Total Housing Units | 137 (86.7%) | 21 (13.3%) |
Occupancy by Educational Attainment in Portland
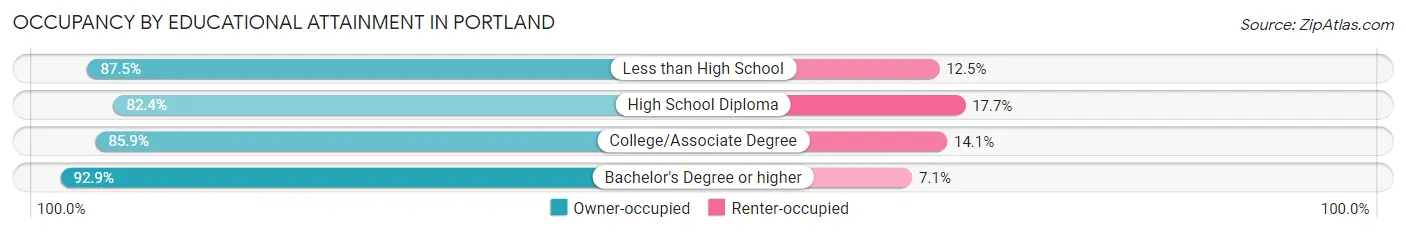
| Household Size | Owner-occupied | Renter-occupied |
| Less than High School | 28 (87.5%) | 4 (12.5%) |
| High School Diploma | 28 (82.4%) | 6 (17.6%) |
| College/Associate Degree | 55 (85.9%) | 9 (14.1%) |
| Bachelor's Degree or higher | 26 (92.9%) | 2 (7.1%) |
Occupancy by Age of Householder in Portland
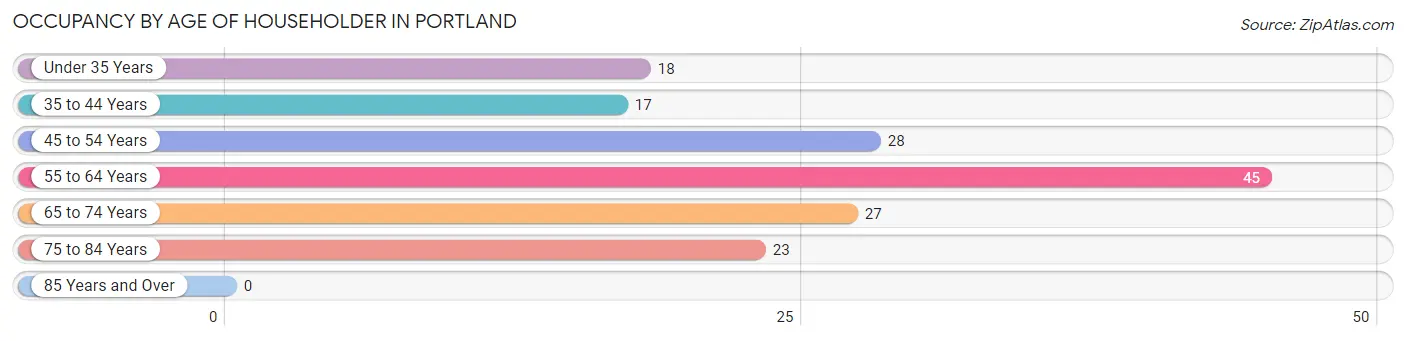
| Age Bracket | # Households | % Households |
| Under 35 Years | 18 | 11.4% |
| 35 to 44 Years | 17 | 10.8% |
| 45 to 54 Years | 28 | 17.7% |
| 55 to 64 Years | 45 | 28.5% |
| 65 to 74 Years | 27 | 17.1% |
| 75 to 84 Years | 23 | 14.6% |
| 85 Years and Over | 0 | 0.0% |
| Total | 158 | 100.0% |
Housing Finances in Portland
Median Income by Occupancy in Portland
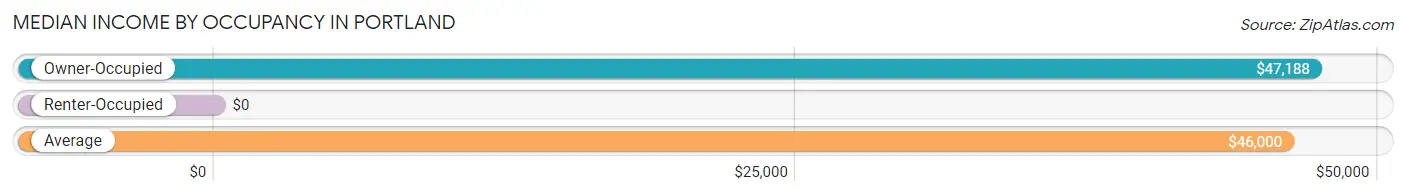
| Occupancy Type | # Households | Median Income |
| Owner-Occupied | 137 (86.7%) | $47,188 |
| Renter-Occupied | 21 (13.3%) | $0 |
| Average | 158 (100.0%) | $46,000 |
Occupancy by Householder Income Bracket in Portland
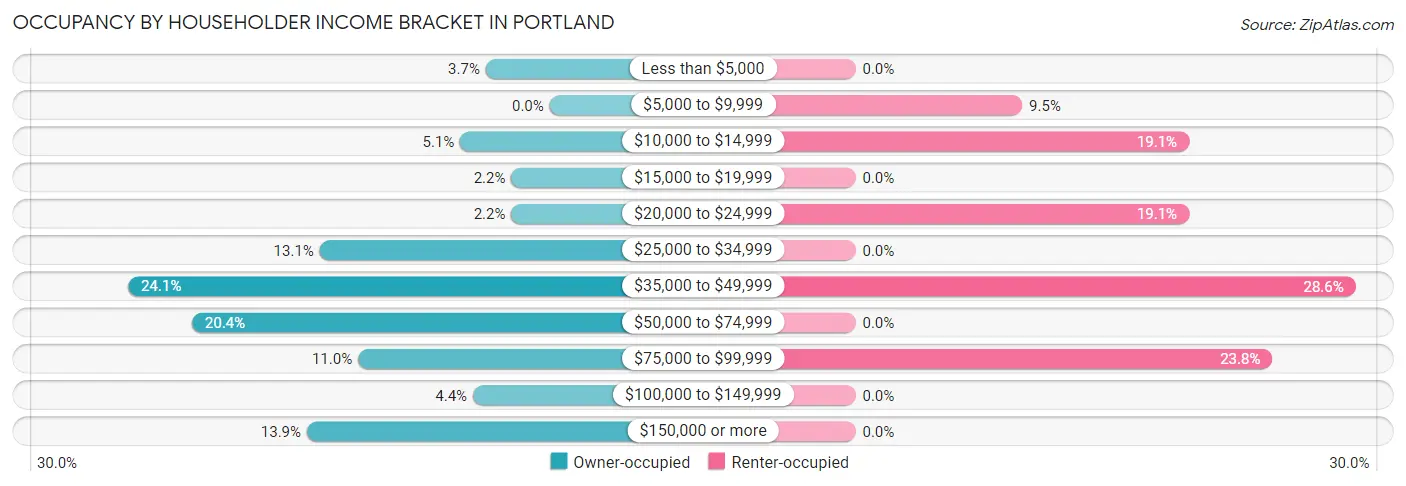
| Income Bracket | Owner-occupied | Renter-occupied |
| Less than $5,000 | 5 (3.6%) | 0 (0.0%) |
| $5,000 to $9,999 | 0 (0.0%) | 2 (9.5%) |
| $10,000 to $14,999 | 7 (5.1%) | 4 (19.1%) |
| $15,000 to $19,999 | 3 (2.2%) | 0 (0.0%) |
| $20,000 to $24,999 | 3 (2.2%) | 4 (19.1%) |
| $25,000 to $34,999 | 18 (13.1%) | 0 (0.0%) |
| $35,000 to $49,999 | 33 (24.1%) | 6 (28.6%) |
| $50,000 to $74,999 | 28 (20.4%) | 0 (0.0%) |
| $75,000 to $99,999 | 15 (11.0%) | 5 (23.8%) |
| $100,000 to $149,999 | 6 (4.4%) | 0 (0.0%) |
| $150,000 or more | 19 (13.9%) | 0 (0.0%) |
| Total | 137 (100.0%) | 21 (100.0%) |
Monthly Housing Cost Tiers in Portland
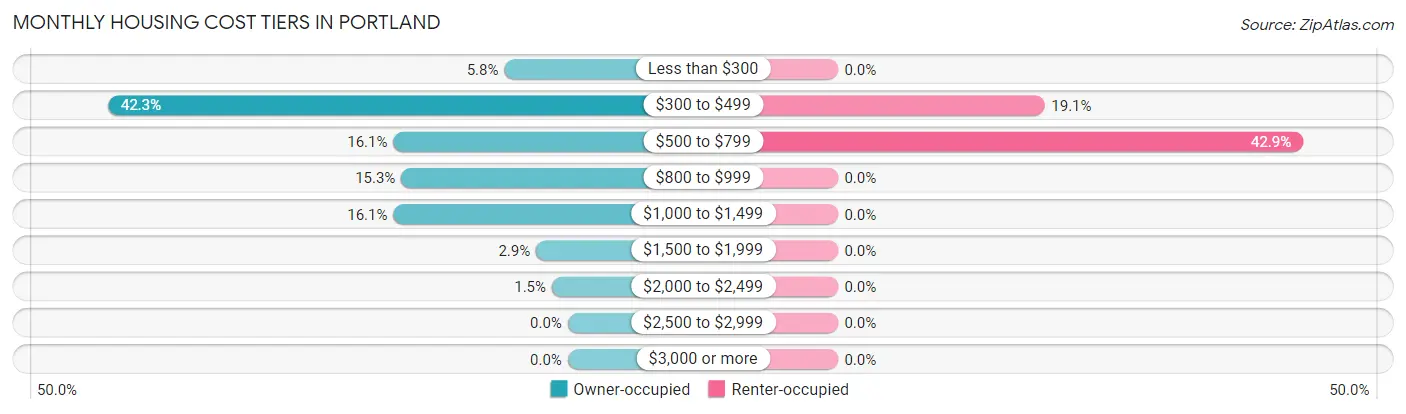
| Monthly Cost | Owner-occupied | Renter-occupied |
| Less than $300 | 8 (5.8%) | 0 (0.0%) |
| $300 to $499 | 58 (42.3%) | 4 (19.1%) |
| $500 to $799 | 22 (16.1%) | 9 (42.9%) |
| $800 to $999 | 21 (15.3%) | 0 (0.0%) |
| $1,000 to $1,499 | 22 (16.1%) | 0 (0.0%) |
| $1,500 to $1,999 | 4 (2.9%) | 0 (0.0%) |
| $2,000 to $2,499 | 2 (1.5%) | 0 (0.0%) |
| $2,500 to $2,999 | 0 (0.0%) | 0 (0.0%) |
| $3,000 or more | 0 (0.0%) | 0 (0.0%) |
| Total | 137 (100.0%) | 21 (100.0%) |
Physical Housing Characteristics in Portland
Housing Structures in Portland
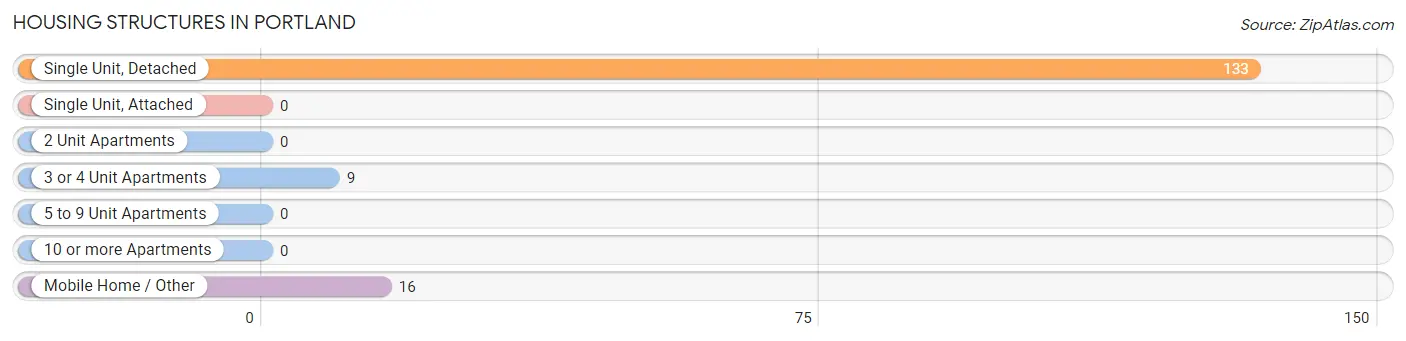
| Structure Type | # Housing Units | % Housing Units |
| Single Unit, Detached | 133 | 84.2% |
| Single Unit, Attached | 0 | 0.0% |
| 2 Unit Apartments | 0 | 0.0% |
| 3 or 4 Unit Apartments | 9 | 5.7% |
| 5 to 9 Unit Apartments | 0 | 0.0% |
| 10 or more Apartments | 0 | 0.0% |
| Mobile Home / Other | 16 | 10.1% |
| Total | 158 | 100.0% |
Housing Structures by Occupancy in Portland
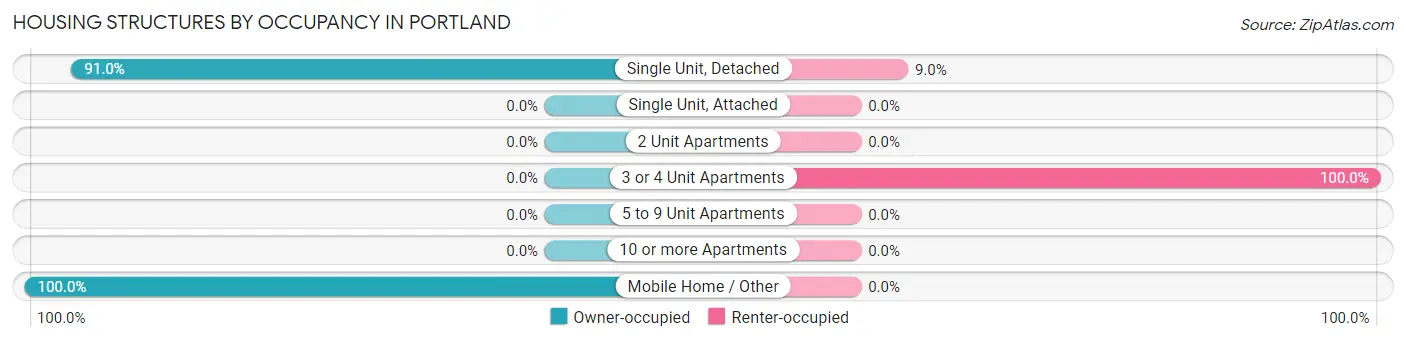
| Structure Type | Owner-occupied | Renter-occupied |
| Single Unit, Detached | 121 (91.0%) | 12 (9.0%) |
| Single Unit, Attached | 0 (0.0%) | 0 (0.0%) |
| 2 Unit Apartments | 0 (0.0%) | 0 (0.0%) |
| 3 or 4 Unit Apartments | 0 (0.0%) | 9 (100.0%) |
| 5 to 9 Unit Apartments | 0 (0.0%) | 0 (0.0%) |
| 10 or more Apartments | 0 (0.0%) | 0 (0.0%) |
| Mobile Home / Other | 16 (100.0%) | 0 (0.0%) |
| Total | 137 (86.7%) | 21 (13.3%) |
Housing Structures by Number of Rooms in Portland
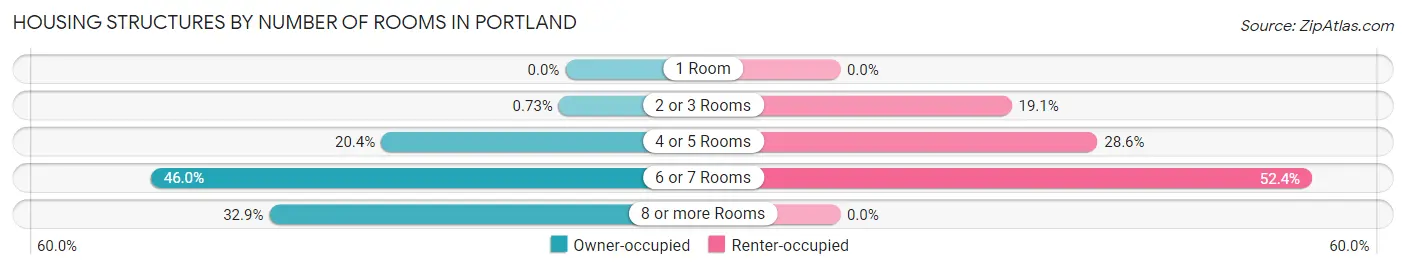
| Number of Rooms | Owner-occupied | Renter-occupied |
| 1 Room | 0 (0.0%) | 0 (0.0%) |
| 2 or 3 Rooms | 1 (0.7%) | 4 (19.1%) |
| 4 or 5 Rooms | 28 (20.4%) | 6 (28.6%) |
| 6 or 7 Rooms | 63 (46.0%) | 11 (52.4%) |
| 8 or more Rooms | 45 (32.9%) | 0 (0.0%) |
| Total | 137 (100.0%) | 21 (100.0%) |
Housing Structure by Heating Type in Portland
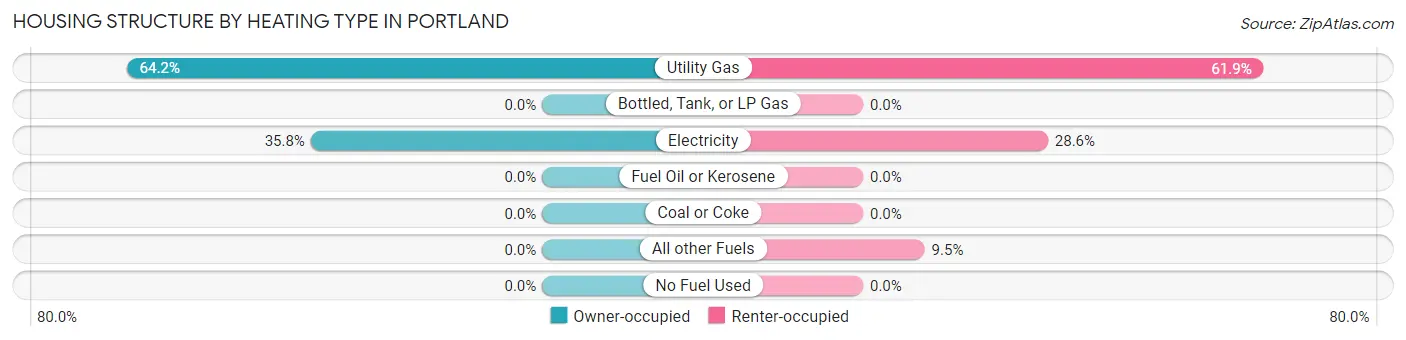
| Heating Type | Owner-occupied | Renter-occupied |
| Utility Gas | 88 (64.2%) | 13 (61.9%) |
| Bottled, Tank, or LP Gas | 0 (0.0%) | 0 (0.0%) |
| Electricity | 49 (35.8%) | 6 (28.6%) |
| Fuel Oil or Kerosene | 0 (0.0%) | 0 (0.0%) |
| Coal or Coke | 0 (0.0%) | 0 (0.0%) |
| All other Fuels | 0 (0.0%) | 2 (9.5%) |
| No Fuel Used | 0 (0.0%) | 0 (0.0%) |
| Total | 137 (100.0%) | 21 (100.0%) |
Household Vehicle Usage in Portland
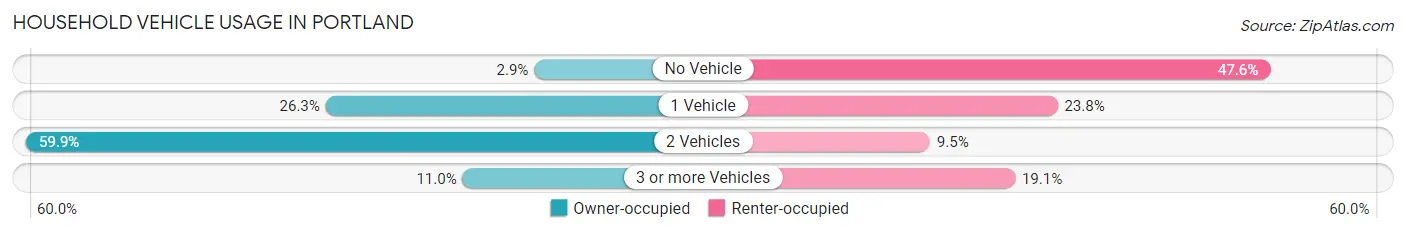
| Vehicles per Household | Owner-occupied | Renter-occupied |
| No Vehicle | 4 (2.9%) | 10 (47.6%) |
| 1 Vehicle | 36 (26.3%) | 5 (23.8%) |
| 2 Vehicles | 82 (59.9%) | 2 (9.5%) |
| 3 or more Vehicles | 15 (11.0%) | 4 (19.1%) |
| Total | 137 (100.0%) | 21 (100.0%) |
Real Estate & Mortgages in Portland
Real Estate and Mortgage Overview in Portland
| Characteristic | Without Mortgage | With Mortgage |
| Housing Units | 78 | 59 |
| Median Property Value | $62,000 | $64,100 |
| Median Household Income | $55,278 | $8 |
| Monthly Housing Costs | $398 | $0 |
| Real Estate Taxes | $353 | $26 |
Property Value by Mortgage Status in Portland
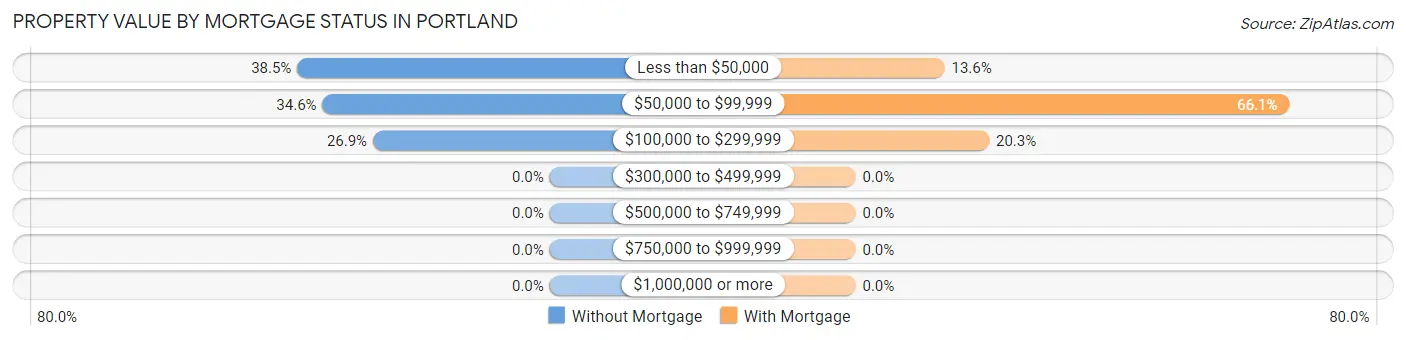
| Property Value | Without Mortgage | With Mortgage |
| Less than $50,000 | 30 (38.5%) | 8 (13.6%) |
| $50,000 to $99,999 | 27 (34.6%) | 39 (66.1%) |
| $100,000 to $299,999 | 21 (26.9%) | 12 (20.3%) |
| $300,000 to $499,999 | 0 (0.0%) | 0 (0.0%) |
| $500,000 to $749,999 | 0 (0.0%) | 0 (0.0%) |
| $750,000 to $999,999 | 0 (0.0%) | 0 (0.0%) |
| $1,000,000 or more | 0 (0.0%) | 0 (0.0%) |
| Total | 78 (100.0%) | 59 (100.0%) |
Household Income by Mortgage Status in Portland
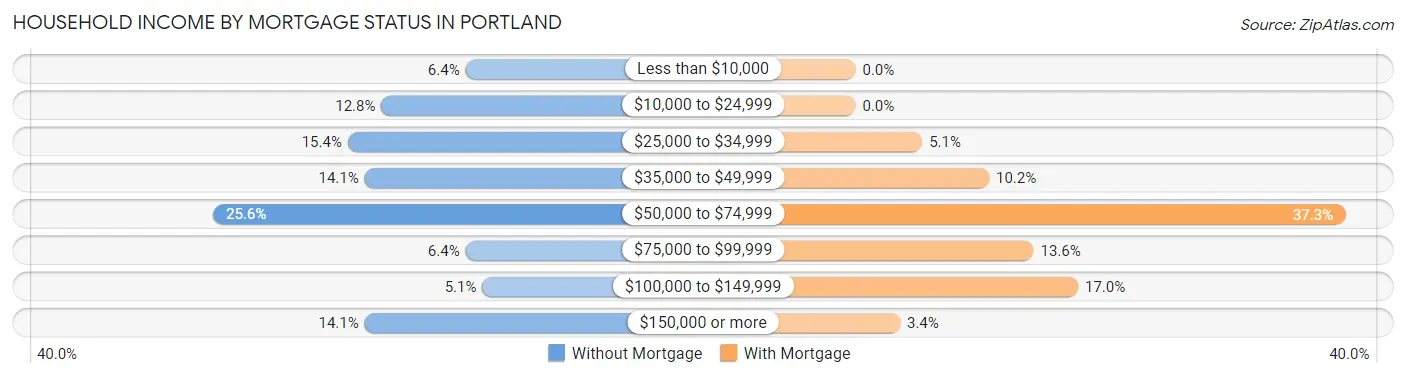
| Household Income | Without Mortgage | With Mortgage |
| Less than $10,000 | 5 (6.4%) | 0 (0.0%) |
| $10,000 to $24,999 | 10 (12.8%) | 0 (0.0%) |
| $25,000 to $34,999 | 12 (15.4%) | 3 (5.1%) |
| $35,000 to $49,999 | 11 (14.1%) | 6 (10.2%) |
| $50,000 to $74,999 | 20 (25.6%) | 22 (37.3%) |
| $75,000 to $99,999 | 5 (6.4%) | 8 (13.6%) |
| $100,000 to $149,999 | 4 (5.1%) | 10 (17.0%) |
| $150,000 or more | 11 (14.1%) | 2 (3.4%) |
| Total | 78 (100.0%) | 59 (100.0%) |
Property Value to Household Income Ratio in Portland
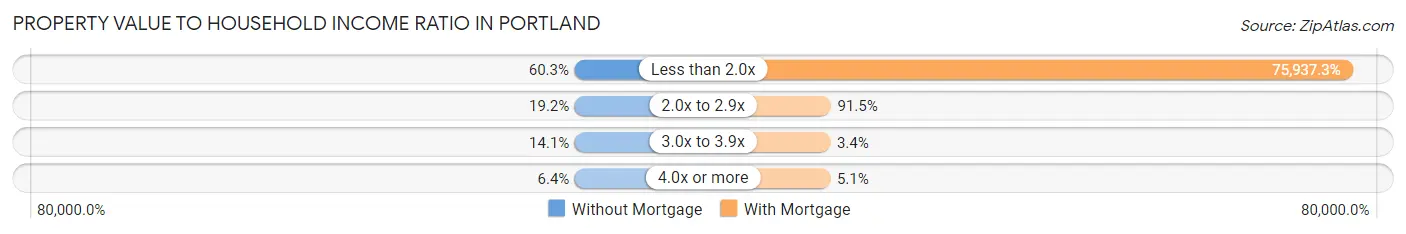
| Value-to-Income Ratio | Without Mortgage | With Mortgage |
| Less than 2.0x | 47 (60.3%) | 44,803 (75,937.3%) |
| 2.0x to 2.9x | 15 (19.2%) | 54 (91.5%) |
| 3.0x to 3.9x | 11 (14.1%) | 2 (3.4%) |
| 4.0x or more | 5 (6.4%) | 3 (5.1%) |
| Total | 78 (100.0%) | 59 (100.0%) |
Real Estate Taxes by Mortgage Status in Portland
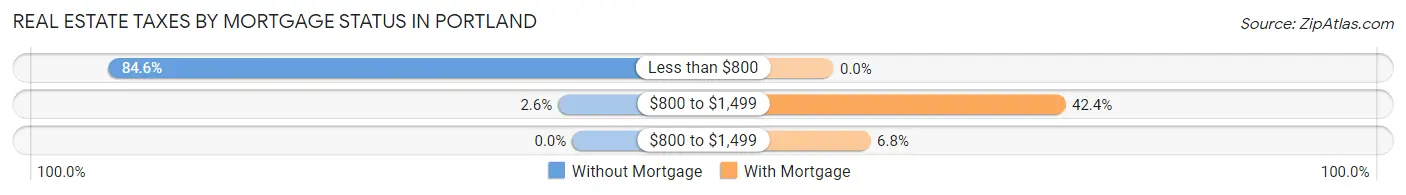
| Property Taxes | Without Mortgage | With Mortgage |
| Less than $800 | 66 (84.6%) | 0 (0.0%) |
| $800 to $1,499 | 2 (2.6%) | 25 (42.4%) |
| $800 to $1,499 | 0 (0.0%) | 4 (6.8%) |
| Total | 78 (100.0%) | 59 (100.0%) |
Health & Disability in Portland
Health Insurance Coverage by Age in Portland
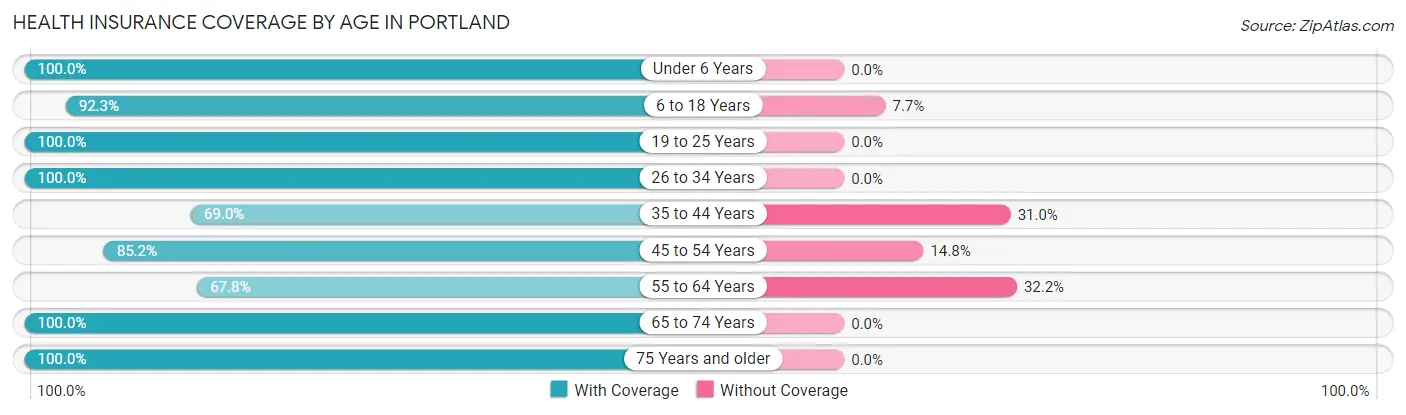
| Age Bracket | With Coverage | Without Coverage |
| Under 6 Years | 21 (100.0%) | 0 (0.0%) |
| 6 to 18 Years | 120 (92.3%) | 10 (7.7%) |
| 19 to 25 Years | 15 (100.0%) | 0 (0.0%) |
| 26 to 34 Years | 71 (100.0%) | 0 (0.0%) |
| 35 to 44 Years | 20 (69.0%) | 9 (31.0%) |
| 45 to 54 Years | 75 (85.2%) | 13 (14.8%) |
| 55 to 64 Years | 40 (67.8%) | 19 (32.2%) |
| 65 to 74 Years | 66 (100.0%) | 0 (0.0%) |
| 75 Years and older | 30 (100.0%) | 0 (0.0%) |
| Total | 458 (90.0%) | 51 (10.0%) |
Health Insurance Coverage by Citizenship Status in Portland
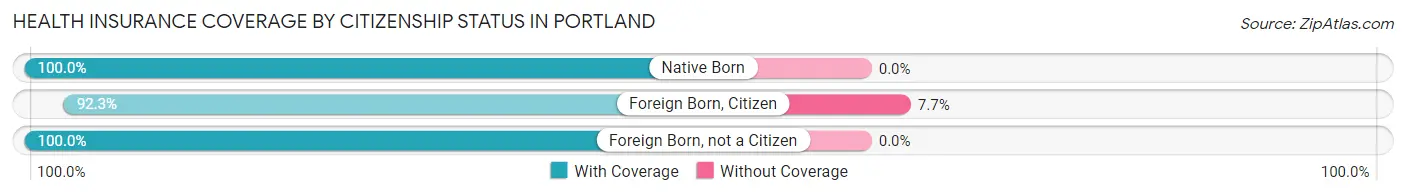
| Citizenship Status | With Coverage | Without Coverage |
| Native Born | 21 (100.0%) | 0 (0.0%) |
| Foreign Born, Citizen | 120 (92.3%) | 10 (7.7%) |
| Foreign Born, not a Citizen | 15 (100.0%) | 0 (0.0%) |
Health Insurance Coverage by Household Income in Portland
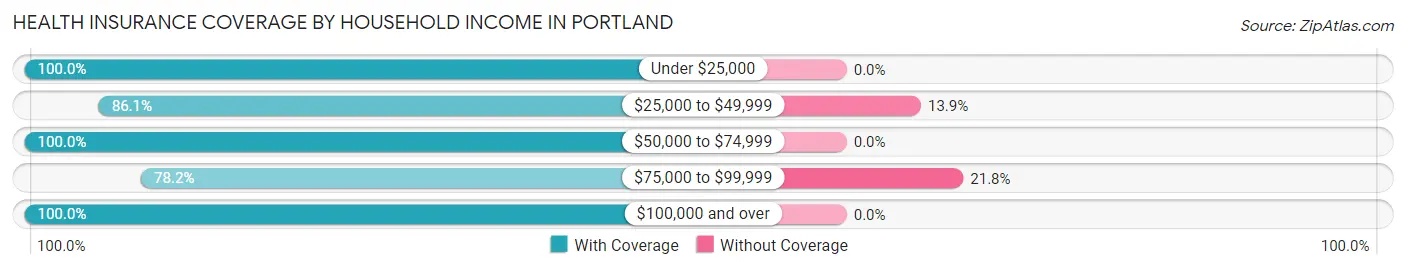
| Household Income | With Coverage | Without Coverage |
| Under $25,000 | 42 (100.0%) | 0 (0.0%) |
| $25,000 to $49,999 | 198 (86.1%) | 32 (13.9%) |
| $50,000 to $74,999 | 96 (100.0%) | 0 (0.0%) |
| $75,000 to $99,999 | 68 (78.2%) | 19 (21.8%) |
| $100,000 and over | 54 (100.0%) | 0 (0.0%) |
Public vs Private Health Insurance Coverage by Age in Portland
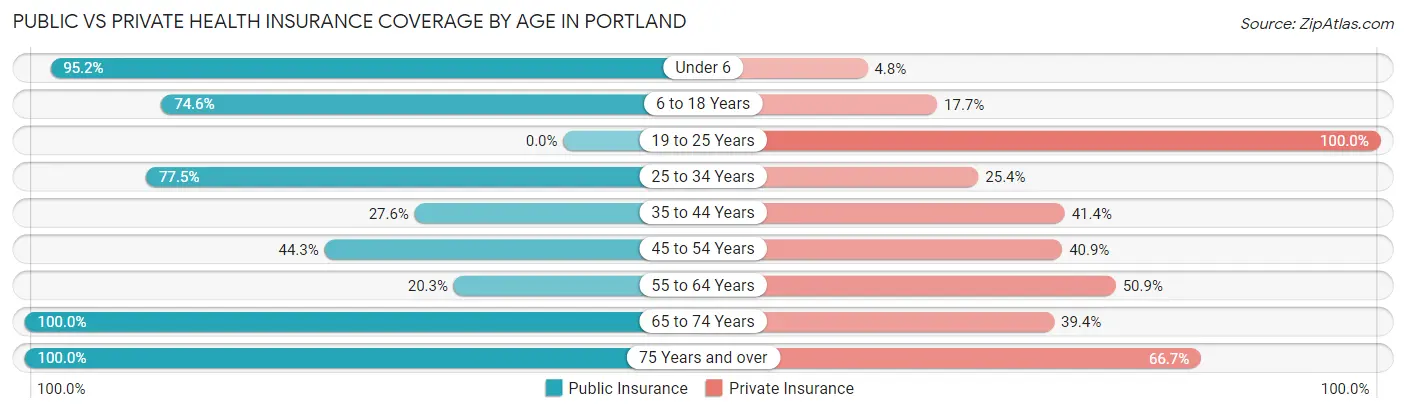
| Age Bracket | Public Insurance | Private Insurance |
| Under 6 | 20 (95.2%) | 1 (4.8%) |
| 6 to 18 Years | 97 (74.6%) | 23 (17.7%) |
| 19 to 25 Years | 0 (0.0%) | 15 (100.0%) |
| 25 to 34 Years | 55 (77.5%) | 18 (25.4%) |
| 35 to 44 Years | 8 (27.6%) | 12 (41.4%) |
| 45 to 54 Years | 39 (44.3%) | 36 (40.9%) |
| 55 to 64 Years | 12 (20.3%) | 30 (50.8%) |
| 65 to 74 Years | 66 (100.0%) | 26 (39.4%) |
| 75 Years and over | 30 (100.0%) | 20 (66.7%) |
| Total | 327 (64.2%) | 181 (35.6%) |
Disability Status by Sex by Age in Portland
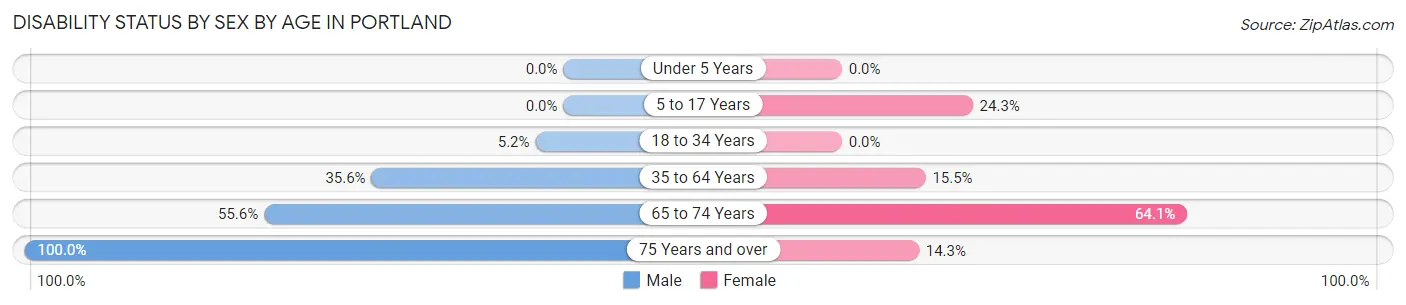
| Age Bracket | Male | Female |
| Under 5 Years | 0 (0.0%) | 0 (0.0%) |
| 5 to 17 Years | 0 (0.0%) | 17 (24.3%) |
| 18 to 34 Years | 4 (5.2%) | 0 (0.0%) |
| 35 to 64 Years | 26 (35.6%) | 16 (15.5%) |
| 65 to 74 Years | 15 (55.6%) | 25 (64.1%) |
| 75 Years and over | 23 (100.0%) | 1 (14.3%) |
Disability Class by Sex by Age in Portland
Disability Class: Hearing Difficulty
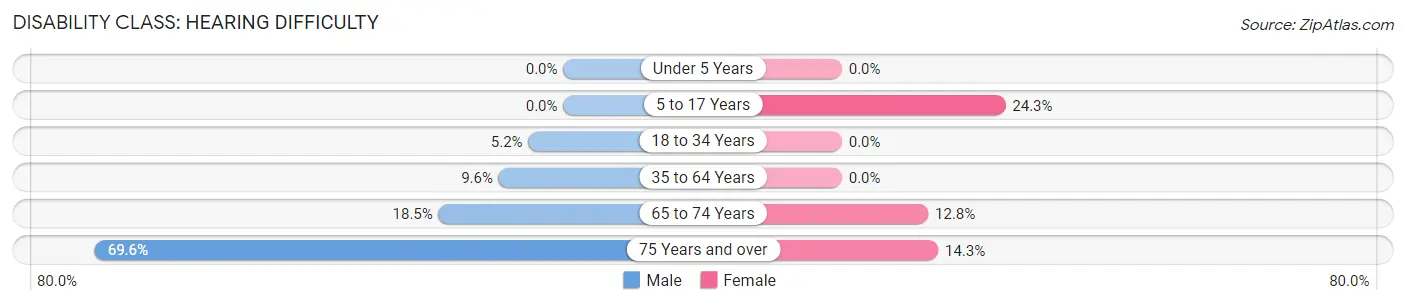
| Age Bracket | Male | Female |
| Under 5 Years | 0 (0.0%) | 0 (0.0%) |
| 5 to 17 Years | 0 (0.0%) | 17 (24.3%) |
| 18 to 34 Years | 4 (5.2%) | 0 (0.0%) |
| 35 to 64 Years | 7 (9.6%) | 0 (0.0%) |
| 65 to 74 Years | 5 (18.5%) | 5 (12.8%) |
| 75 Years and over | 16 (69.6%) | 1 (14.3%) |
Disability Class: Vision Difficulty
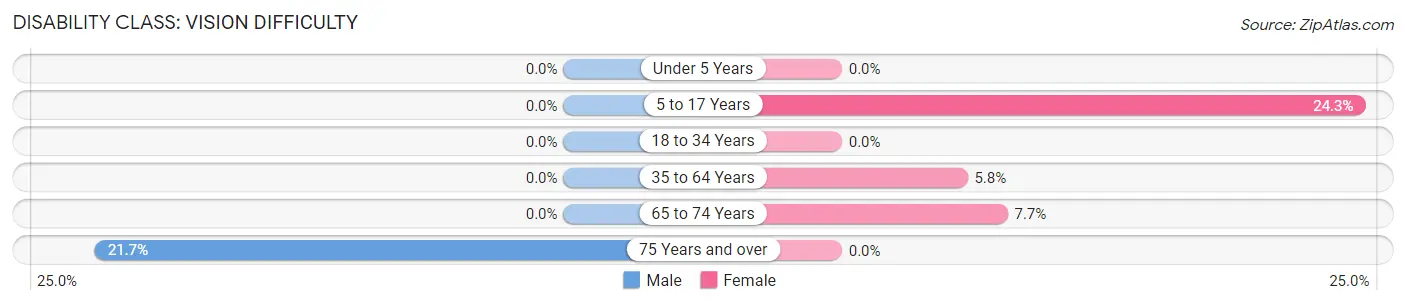
| Age Bracket | Male | Female |
| Under 5 Years | 0 (0.0%) | 0 (0.0%) |
| 5 to 17 Years | 0 (0.0%) | 17 (24.3%) |
| 18 to 34 Years | 0 (0.0%) | 0 (0.0%) |
| 35 to 64 Years | 0 (0.0%) | 6 (5.8%) |
| 65 to 74 Years | 0 (0.0%) | 3 (7.7%) |
| 75 Years and over | 5 (21.7%) | 0 (0.0%) |
Disability Class: Cognitive Difficulty
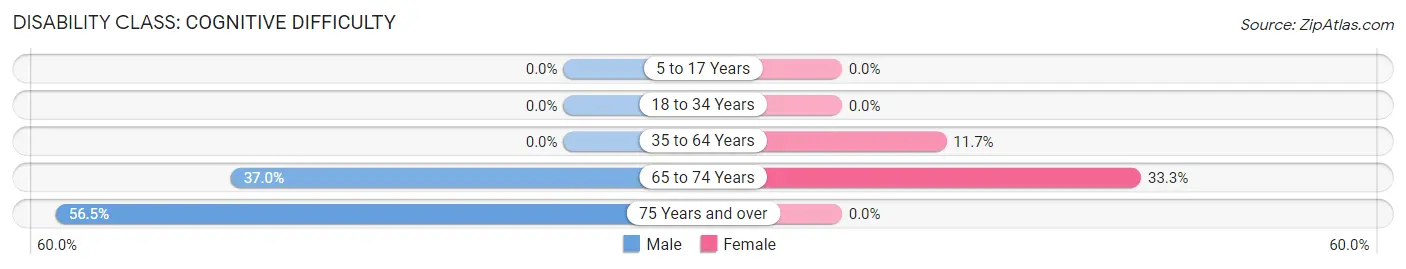
| Age Bracket | Male | Female |
| 5 to 17 Years | 0 (0.0%) | 0 (0.0%) |
| 18 to 34 Years | 0 (0.0%) | 0 (0.0%) |
| 35 to 64 Years | 0 (0.0%) | 12 (11.7%) |
| 65 to 74 Years | 10 (37.0%) | 13 (33.3%) |
| 75 Years and over | 13 (56.5%) | 0 (0.0%) |
Disability Class: Ambulatory Difficulty
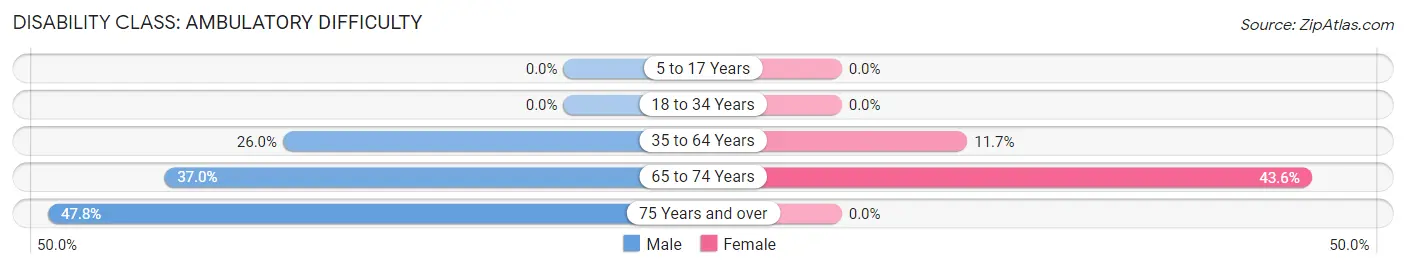
| Age Bracket | Male | Female |
| 5 to 17 Years | 0 (0.0%) | 0 (0.0%) |
| 18 to 34 Years | 0 (0.0%) | 0 (0.0%) |
| 35 to 64 Years | 19 (26.0%) | 12 (11.7%) |
| 65 to 74 Years | 10 (37.0%) | 17 (43.6%) |
| 75 Years and over | 11 (47.8%) | 0 (0.0%) |
Disability Class: Self-Care Difficulty
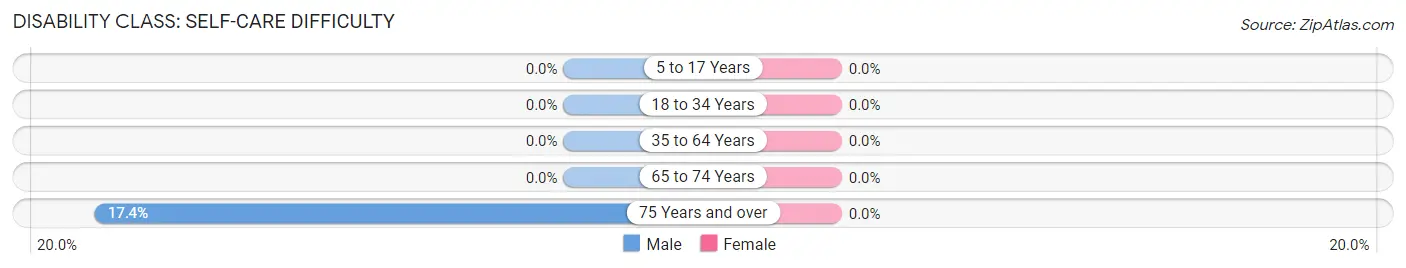
| Age Bracket | Male | Female |
| 5 to 17 Years | 0 (0.0%) | 0 (0.0%) |
| 18 to 34 Years | 0 (0.0%) | 0 (0.0%) |
| 35 to 64 Years | 0 (0.0%) | 0 (0.0%) |
| 65 to 74 Years | 0 (0.0%) | 0 (0.0%) |
| 75 Years and over | 4 (17.4%) | 0 (0.0%) |
Technology Access in Portland
Computing Device Access in Portland
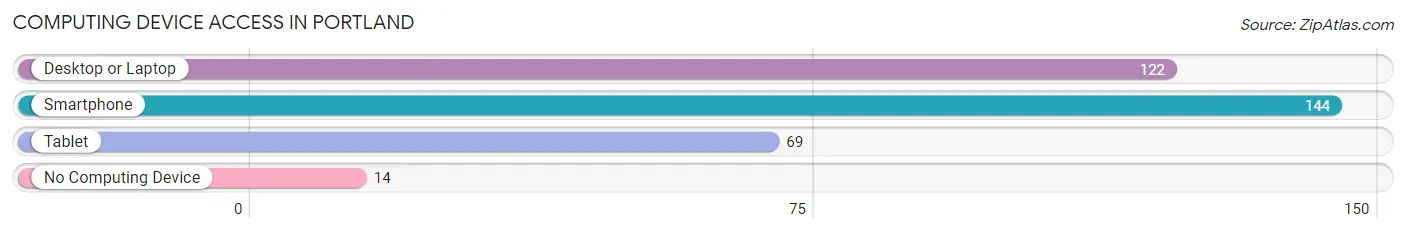
| Device Type | # Households | % Households |
| Desktop or Laptop | 122 | 77.2% |
| Smartphone | 144 | 91.1% |
| Tablet | 69 | 43.7% |
| No Computing Device | 14 | 8.9% |
| Total | 158 | 100.0% |
Internet Access in Portland
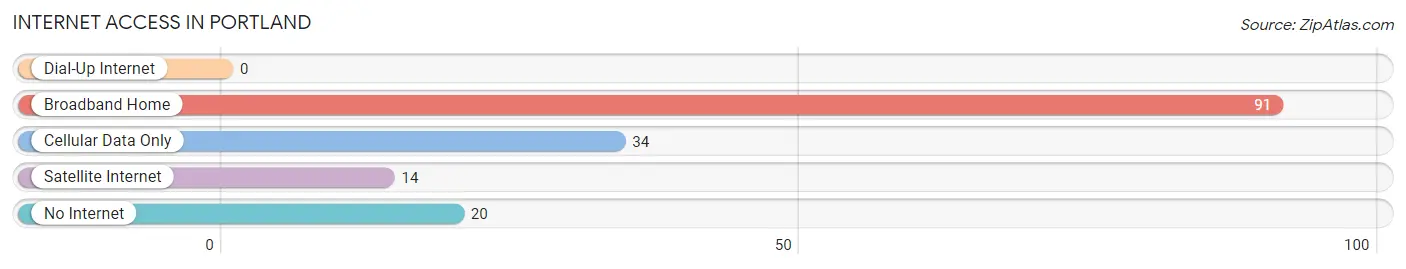
| Internet Type | # Households | % Households |
| Dial-Up Internet | 0 | 0.0% |
| Broadband Home | 91 | 57.6% |
| Cellular Data Only | 34 | 21.5% |
| Satellite Internet | 14 | 8.9% |
| No Internet | 20 | 12.7% |
| Total | 158 | 100.0% |
Portland Summary
Portland, Arkansas is a small city located in the southwestern corner of the state, in Hempstead County. It is situated on the banks of the Red River, and is part of the Texarkana metropolitan area. The city has a population of approximately 2,000 people, and is the county seat of Hempstead County.
History
Portland was founded in 1836 by a group of settlers from Tennessee. The town was named after Portland, Tennessee, and was originally intended to be a trading post. The town quickly grew, and by 1837, it had become the county seat of Hempstead County.
In the late 19th century, Portland was a bustling river port, and the town was home to several cotton gins, sawmills, and other businesses. The town was also home to a number of churches, and was a popular destination for riverboat travelers.
In the early 20th century, the town began to decline, as the river trade shifted to other towns. The Great Depression also had a negative impact on the town, and by the 1950s, the population had dropped to just over 1,000 people.
Geography
Portland is located in the southwestern corner of Arkansas, in Hempstead County. The city is situated on the banks of the Red River, and is part of the Texarkana metropolitan area. The city has a total area of 2.2 square miles, all of which is land.
The climate in Portland is humid subtropical, with hot, humid summers and mild winters. The average annual temperature is around 64°F, and the average annual precipitation is around 48 inches.
Economy
The economy of Portland is largely based on agriculture and manufacturing. The city is home to several large farms, and the surrounding area is known for its cotton, soybeans, and other crops.
The city is also home to several manufacturing companies, including a paper mill, a furniture factory, and a plastics plant. The city is also home to a number of retail stores, restaurants, and other businesses.
Demographics
As of the 2010 census, the population of Portland was 2,000 people. The racial makeup of the city was 79.2% White, 17.2% African American, 0.7% Native American, 0.3% Asian, 0.1% Pacific Islander, and 2.5% from other races.
The median household income in Portland was $30,000, and the median family income was $35,000. The per capita income in the city was $15,000. Approximately 17.2% of the population was below the poverty line.
Conclusion
Portland, Arkansas is a small city located in the southwestern corner of the state, in Hempstead County. It is situated on the banks of the Red River, and is part of the Texarkana metropolitan area. The city has a population of approximately 2,000 people, and is the county seat of Hempstead County. The economy of Portland is largely based on agriculture and manufacturing, and the city is home to several large farms, manufacturing companies, and other businesses. The racial makeup of the city is 79.2% White, 17.2% African American, 0.7% Native American, 0.3% Asian, 0.1% Pacific Islander, and 2.5% from other races. The median household income in Portland was $30,000, and the median family income was $35,000. Approximately 17.2% of the population was below the poverty line.
Common Questions
What is Per Capita Income in Portland?
Per Capita income in Portland is $25,102.
What is the Median Family Income in Portland?
Median Family Income in Portland is $59,688.
What is the Median Household income in Portland?
Median Household Income in Portland is $46,000.
What is Income or Wage Gap in Portland?
Income or Wage Gap in Portland is 38.4%.
Women in Portland earn 61.6 cents for every dollar earned by a man.
What is Inequality or Gini Index in Portland?
Inequality or Gini Index in Portland is 0.49.
What is the Total Population of Portland?
Total Population of Portland is 509.
What is the Total Male Population of Portland?
Total Male Population of Portland is 263.
What is the Total Female Population of Portland?
Total Female Population of Portland is 246.
What is the Ratio of Males per 100 Females in Portland?
There are 106.91 Males per 100 Females in Portland.
What is the Ratio of Females per 100 Males in Portland?
There are 93.54 Females per 100 Males in Portland.
What is the Median Population Age in Portland?
Median Population Age in Portland is 39.9 Years.
What is the Average Family Size in Portland
Average Family Size in Portland is 4.1 People.
What is the Average Household Size in Portland
Average Household Size in Portland is 3.2 People.
How Large is the Labor Force in Portland?
There are 202 People in the Labor Forcein in Portland.
What is the Percentage of People in the Labor Force in Portland?
51.9% of People are in the Labor Force in Portland.