Plainview, AR Map & Demographics
Plainview Map
Plainview Overview
$25,079
PER CAPITA INCOME
$42,550
AVG HOUSEHOLD INCOME
44.3%
WAGE / INCOME GAP [ % ]
55.7¢/ $1
WAGE / INCOME GAP [ $ ]
0.41
INEQUALITY / GINI INDEX
450
TOTAL POPULATION
198
MALE POPULATION
252
FEMALE POPULATION
78.57
MALES / 100 FEMALES
127.27
FEMALES / 100 MALES
46.7
MEDIAN AGE
3.3
AVG FAMILY SIZE
2.2
AVG HOUSEHOLD SIZE
183
LABOR FORCE [ PEOPLE ]
45.5%
PERCENT IN LABOR FORCE
Plainview Zip Codes
Income in Plainview
Income Overview in Plainview
| Characteristic | Number | Measure |
| Per Capita Income | 450 | $25,079 |
| Median Family Income | 99 | $0 |
| Mean Family Income | 99 | $72,028 |
| Median Household Income | 201 | $42,550 |
| Mean Household Income | 201 | $51,126 |
| Income Deficit | 99 | $0 |
| Wage / Income Gap (%) | 450 | 44.31% |
| Wage / Income Gap ($) | 450 | 55.69¢ per $1 |
| Gini / Inequality Index | 450 | 0.41 |
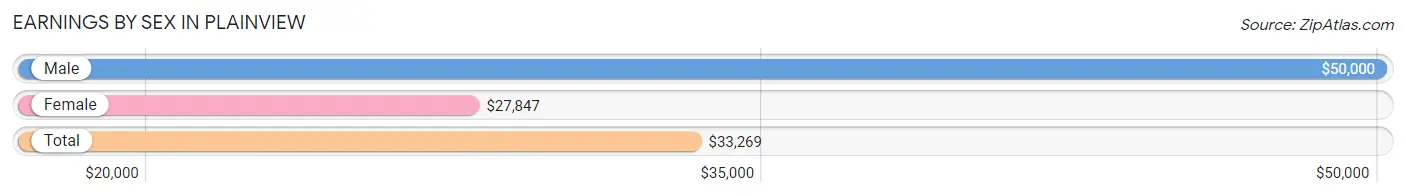
Earnings by Sex in Plainview
Average Earnings in Plainview are $33,269, $50,000 for men and $27,847 for women, a difference of 44.3%.
| Sex | Number | Average Earnings |
| Male | 86 (44.8%) | $50,000 |
| Female | 106 (55.2%) | $27,847 |
| Total | 192 (100.0%) | $33,269 |
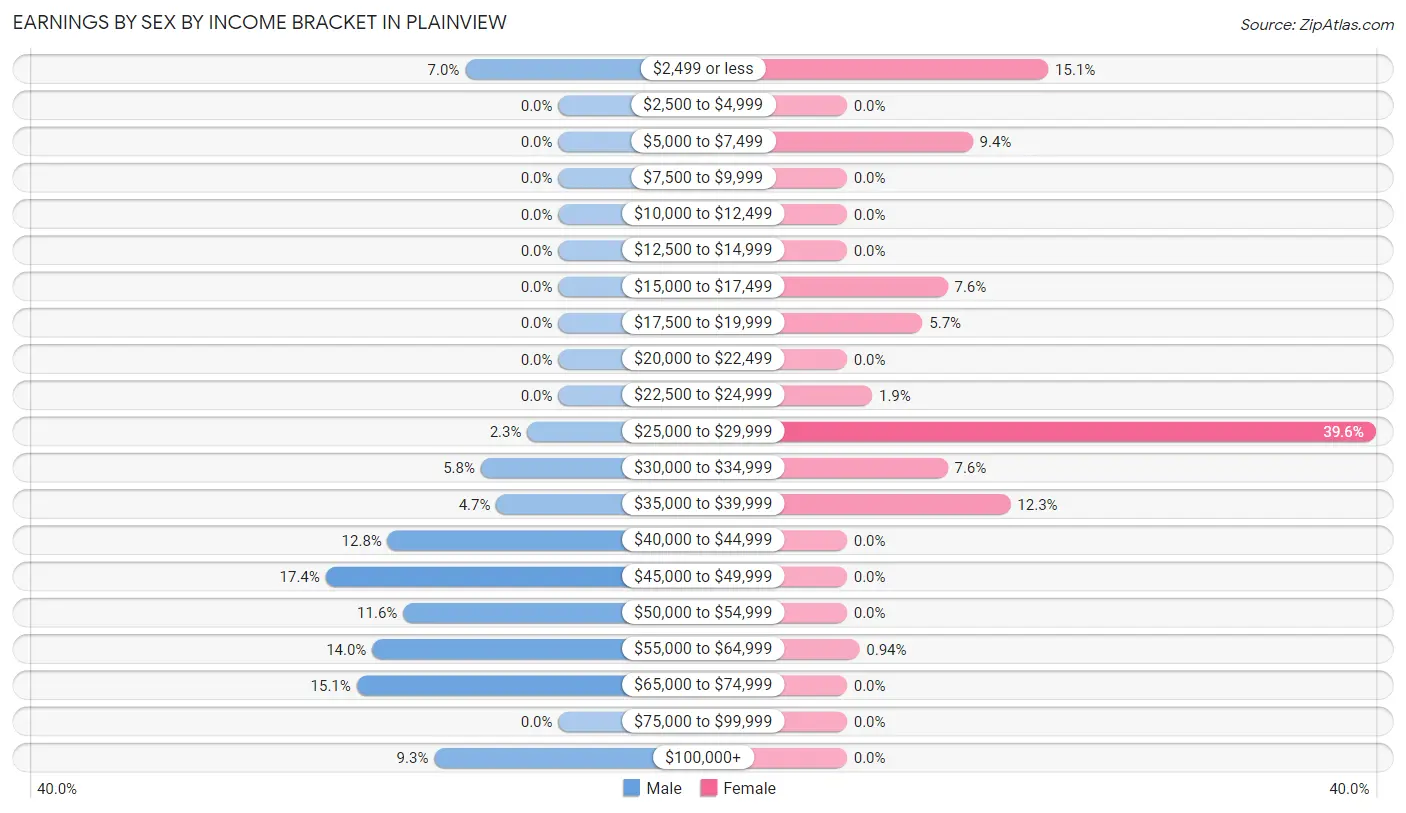
Earnings by Sex by Income Bracket in Plainview
The most common earnings brackets in Plainview are $45,000 to $49,999 for men (15 | 17.4%) and $25,000 to $29,999 for women (42 | 39.6%).
| Income | Male | Female |
| $2,499 or less | 6 (7.0%) | 16 (15.1%) |
| $2,500 to $4,999 | 0 (0.0%) | 0 (0.0%) |
| $5,000 to $7,499 | 0 (0.0%) | 10 (9.4%) |
| $7,500 to $9,999 | 0 (0.0%) | 0 (0.0%) |
| $10,000 to $12,499 | 0 (0.0%) | 0 (0.0%) |
| $12,500 to $14,999 | 0 (0.0%) | 0 (0.0%) |
| $15,000 to $17,499 | 0 (0.0%) | 8 (7.5%) |
| $17,500 to $19,999 | 0 (0.0%) | 6 (5.7%) |
| $20,000 to $22,499 | 0 (0.0%) | 0 (0.0%) |
| $22,500 to $24,999 | 0 (0.0%) | 2 (1.9%) |
| $25,000 to $29,999 | 2 (2.3%) | 42 (39.6%) |
| $30,000 to $34,999 | 5 (5.8%) | 8 (7.5%) |
| $35,000 to $39,999 | 4 (4.6%) | 13 (12.3%) |
| $40,000 to $44,999 | 11 (12.8%) | 0 (0.0%) |
| $45,000 to $49,999 | 15 (17.4%) | 0 (0.0%) |
| $50,000 to $54,999 | 10 (11.6%) | 0 (0.0%) |
| $55,000 to $64,999 | 12 (14.0%) | 1 (0.9%) |
| $65,000 to $74,999 | 13 (15.1%) | 0 (0.0%) |
| $75,000 to $99,999 | 0 (0.0%) | 0 (0.0%) |
| $100,000+ | 8 (9.3%) | 0 (0.0%) |
| Total | 86 (100.0%) | 106 (100.0%) |
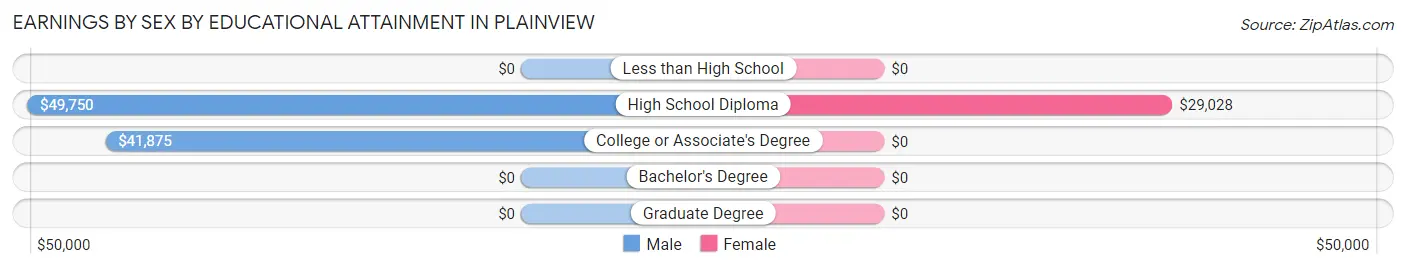
Earnings by Sex by Educational Attainment in Plainview
Average earnings in Plainview are $50,000 for men and $28,993 for women, a difference of 42.0%. Men with an educational attainment of high school diploma enjoy the highest average annual earnings of $49,750, while those with college or associate's degree education earn the least with $41,875. Women with an educational attainment of high school diploma earn the most with the average annual earnings of $29,028, while those with high school diploma education have the smallest earnings of $29,028.
| Educational Attainment | Male Income | Female Income |
| Less than High School | - | - |
| High School Diploma | $49,750 | $29,028 |
| College or Associate's Degree | $41,875 | $0 |
| Bachelor's Degree | - | - |
| Graduate Degree | - | - |
| Total | $50,000 | $28,993 |
Family Income in Plainview
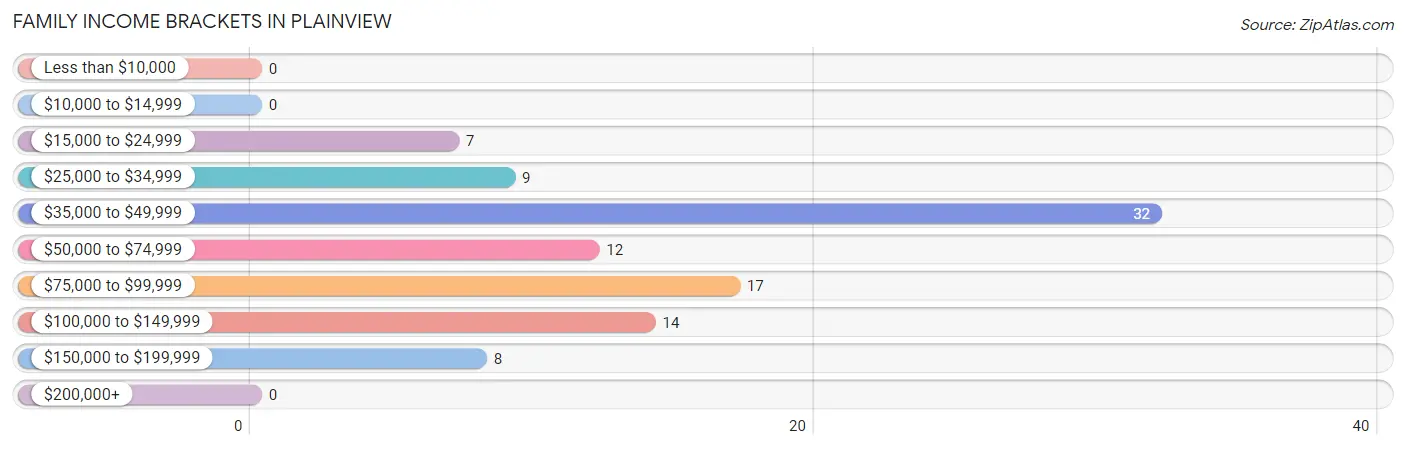
Family Income Brackets in Plainview
According to the Plainview family income data, there are 32 families falling into the $35,000 to $49,999 income range, which is the most common income bracket and makes up 32.3% of all families.
| Income Bracket | # Families | % Families |
| Less than $10,000 | 0 | 0.0% |
| $10,000 to $14,999 | 0 | 0.0% |
| $15,000 to $24,999 | 7 | 7.1% |
| $25,000 to $34,999 | 9 | 9.1% |
| $35,000 to $49,999 | 32 | 32.3% |
| $50,000 to $74,999 | 12 | 12.1% |
| $75,000 to $99,999 | 17 | 17.2% |
| $100,000 to $149,999 | 14 | 14.1% |
| $150,000 to $199,999 | 8 | 8.1% |
| $200,000+ | 0 | 0.0% |
Family Income by Famaliy Size in Plainview
| Income Bracket | # Families | Median Income |
| 2-Person Families | 46 (46.5%) | $0 |
| 3-Person Families | 1 (1.0%) | $0 |
| 4-Person Families | 41 (41.4%) | $0 |
| 5-Person Families | 11 (11.1%) | $0 |
| 6-Person Families | 0 (0.0%) | $0 |
| 7+ Person Families | 0 (0.0%) | $0 |
| Total | 99 (100.0%) | $0 |
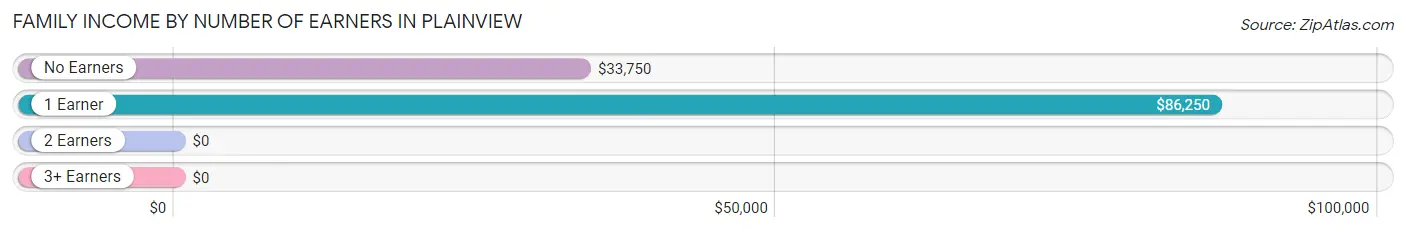
Family Income by Number of Earners in Plainview
| Number of Earners | # Families | Median Income |
| No Earners | 21 (21.2%) | $33,750 |
| 1 Earner | 22 (22.2%) | $86,250 |
| 2 Earners | 45 (45.5%) | $0 |
| 3+ Earners | 11 (11.1%) | $0 |
| Total | 99 (100.0%) | $0 |
Household Income in Plainview
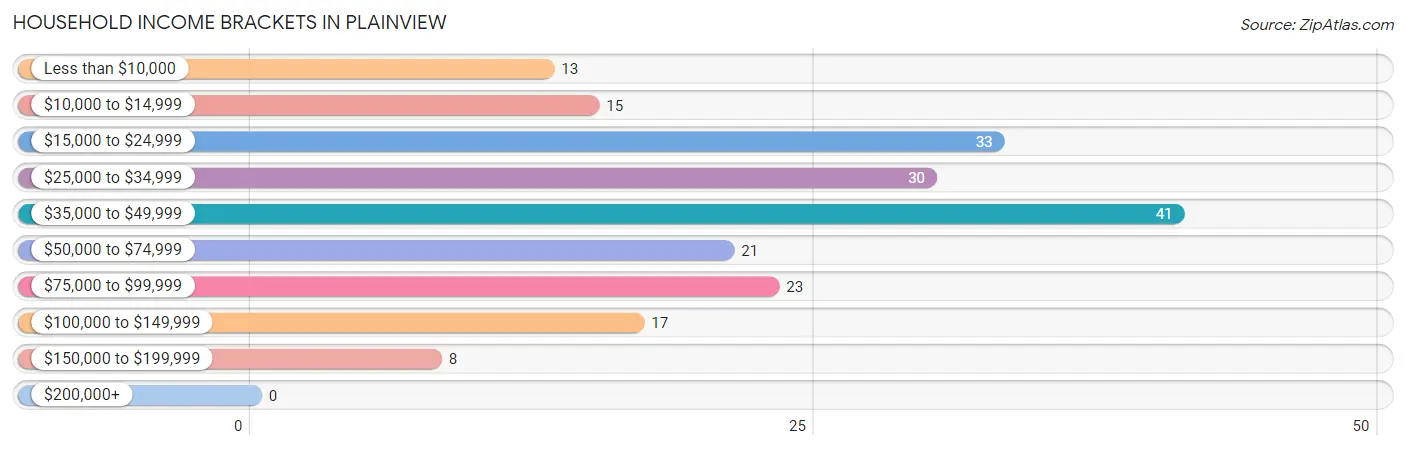
Household Income Brackets in Plainview
With 41 households falling in the category, the $35,000 to $49,999 income range is the most frequent in Plainview, accounting for 20.4% of all households.
| Income Bracket | # Households | % Households |
| Less than $10,000 | 13 | 6.5% |
| $10,000 to $14,999 | 15 | 7.5% |
| $15,000 to $24,999 | 33 | 16.4% |
| $25,000 to $34,999 | 30 | 14.9% |
| $35,000 to $49,999 | 41 | 20.4% |
| $50,000 to $74,999 | 21 | 10.4% |
| $75,000 to $99,999 | 23 | 11.4% |
| $100,000 to $149,999 | 17 | 8.5% |
| $150,000 to $199,999 | 8 | 4.0% |
| $200,000+ | 0 | 0.0% |
Household Income by Householder Age in Plainview
The median household income in Plainview is $42,550, with the highest median household income of $35,938 found in the 45 to 64 years age bracket for the primary householder. A total of 113 households (56.2%) fall into this category. Meanwhile, the 15 to 24 years age bracket for the primary householder has the lowest median household income of $0, with 8 households (4.0%) in this group.
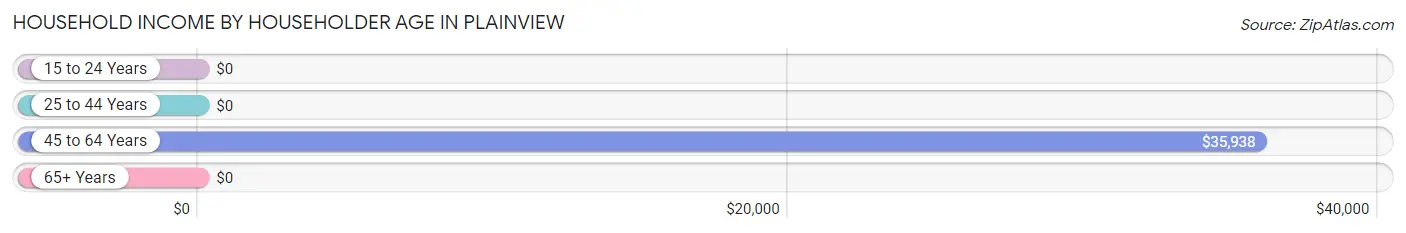
| Income Bracket | # Households | Median Income |
| 15 to 24 Years | 8 (4.0%) | $0 |
| 25 to 44 Years | 27 (13.4%) | $0 |
| 45 to 64 Years | 113 (56.2%) | $35,938 |
| 65+ Years | 53 (26.4%) | $0 |
| Total | 201 (100.0%) | $42,550 |
Poverty in Plainview
Income Below Poverty by Sex and Age in Plainview
With 7.6% poverty level for males and 13.5% for females among the residents of Plainview, 55 to 64 year old males and 75 year old and over females are the most vulnerable to poverty, with 8 males (20.5%) and 9 females (36.0%) in their respective age groups living below the poverty level.
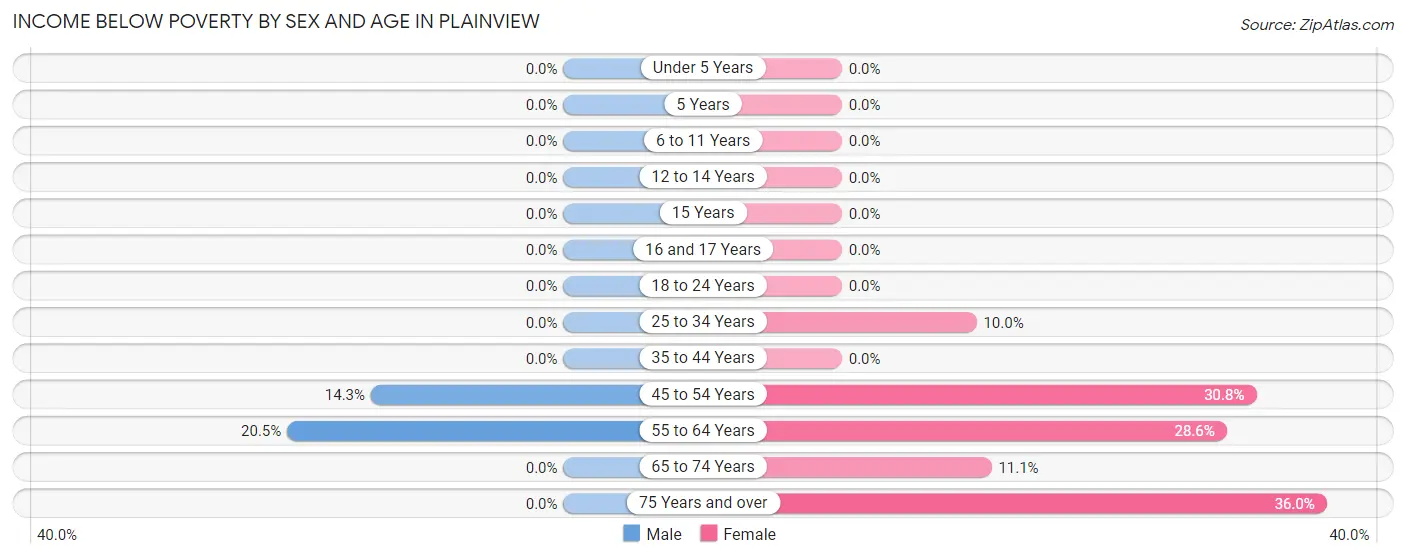
| Age Bracket | Male | Female |
| Under 5 Years | 0 (0.0%) | 0 (0.0%) |
| 5 Years | 0 (0.0%) | 0 (0.0%) |
| 6 to 11 Years | 0 (0.0%) | 0 (0.0%) |
| 12 to 14 Years | 0 (0.0%) | 0 (0.0%) |
| 15 Years | 0 (0.0%) | 0 (0.0%) |
| 16 and 17 Years | 0 (0.0%) | 0 (0.0%) |
| 18 to 24 Years | 0 (0.0%) | 0 (0.0%) |
| 25 to 34 Years | 0 (0.0%) | 1 (10.0%) |
| 35 to 44 Years | 0 (0.0%) | 0 (0.0%) |
| 45 to 54 Years | 7 (14.3%) | 8 (30.8%) |
| 55 to 64 Years | 8 (20.5%) | 14 (28.6%) |
| 65 to 74 Years | 0 (0.0%) | 2 (11.1%) |
| 75 Years and over | 0 (0.0%) | 9 (36.0%) |
| Total | 15 (7.6%) | 34 (13.5%) |
Income Above Poverty by Sex and Age in Plainview
According to the poverty statistics in Plainview, males aged under 5 years and females aged under 5 years are the age groups that are most secure financially, with 100.0% of males and 100.0% of females in these age groups living above the poverty line.
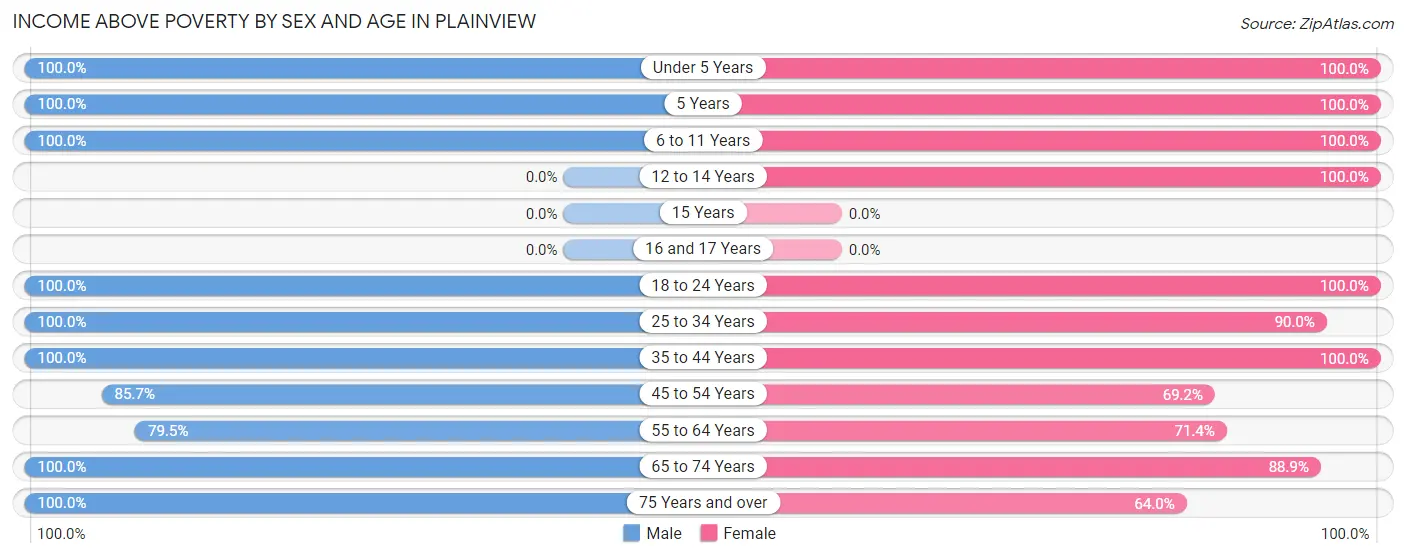
| Age Bracket | Male | Female |
| Under 5 Years | 10 (100.0%) | 9 (100.0%) |
| 5 Years | 9 (100.0%) | 6 (100.0%) |
| 6 to 11 Years | 4 (100.0%) | 6 (100.0%) |
| 12 to 14 Years | 0 (0.0%) | 4 (100.0%) |
| 15 Years | 0 (0.0%) | 0 (0.0%) |
| 16 and 17 Years | 0 (0.0%) | 0 (0.0%) |
| 18 to 24 Years | 15 (100.0%) | 60 (100.0%) |
| 25 to 34 Years | 21 (100.0%) | 9 (90.0%) |
| 35 to 44 Years | 14 (100.0%) | 39 (100.0%) |
| 45 to 54 Years | 42 (85.7%) | 18 (69.2%) |
| 55 to 64 Years | 31 (79.5%) | 35 (71.4%) |
| 65 to 74 Years | 18 (100.0%) | 16 (88.9%) |
| 75 Years and over | 19 (100.0%) | 16 (64.0%) |
| Total | 183 (92.4%) | 218 (86.5%) |
Income Below Poverty Among Married-Couple Families in Plainview
The poverty statistics for married-couple families in Plainview show that 7.9% or 7 of the total 89 families live below the poverty line. Families with no children have the highest poverty rate of 11.3%, comprising of 7 families. On the other hand, families with 1 or 2 children have the lowest poverty rate of 0.0%, which includes 0 families.
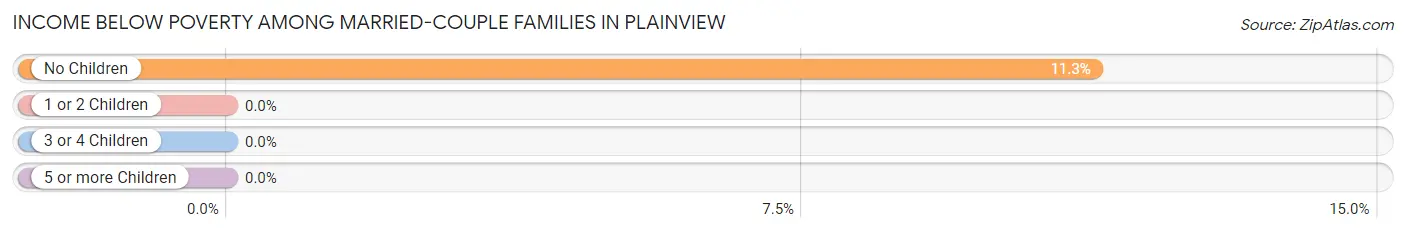
| Children | Above Poverty | Below Poverty |
| No Children | 55 (88.7%) | 7 (11.3%) |
| 1 or 2 Children | 27 (100.0%) | 0 (0.0%) |
| 3 or 4 Children | 0 (0.0%) | 0 (0.0%) |
| 5 or more Children | 0 (0.0%) | 0 (0.0%) |
| Total | 82 (92.1%) | 7 (7.9%) |
Income Below Poverty Among Single-Parent Households in Plainview
| Children | Single Father | Single Mother |
| No Children | 0 (0.0%) | 0 (0.0%) |
| 1 or 2 Children | 0 (0.0%) | 0 (0.0%) |
| 3 or 4 Children | 0 (0.0%) | 0 (0.0%) |
| 5 or more Children | 0 (0.0%) | 0 (0.0%) |
| Total | 0 (0.0%) | 0 (0.0%) |
Income Below Poverty Among Married-Couple vs Single-Parent Households in Plainview
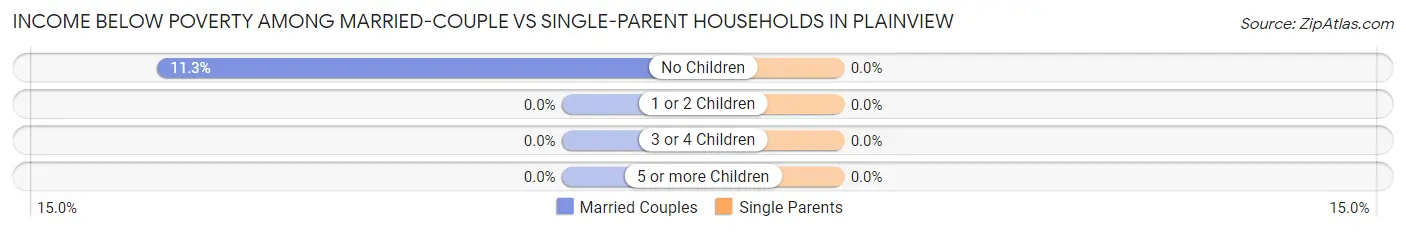
| Children | Married-Couple Families | Single-Parent Households |
| No Children | 7 (11.3%) | 0 (0.0%) |
| 1 or 2 Children | 0 (0.0%) | 0 (0.0%) |
| 3 or 4 Children | 0 (0.0%) | 0 (0.0%) |
| 5 or more Children | 0 (0.0%) | 0 (0.0%) |
| Total | 7 (7.9%) | 0 (0.0%) |
Race in Plainview
The most populous races in Plainview are White / Caucasian (449 | 99.8%), and Two or more Races (1 | 0.2%).
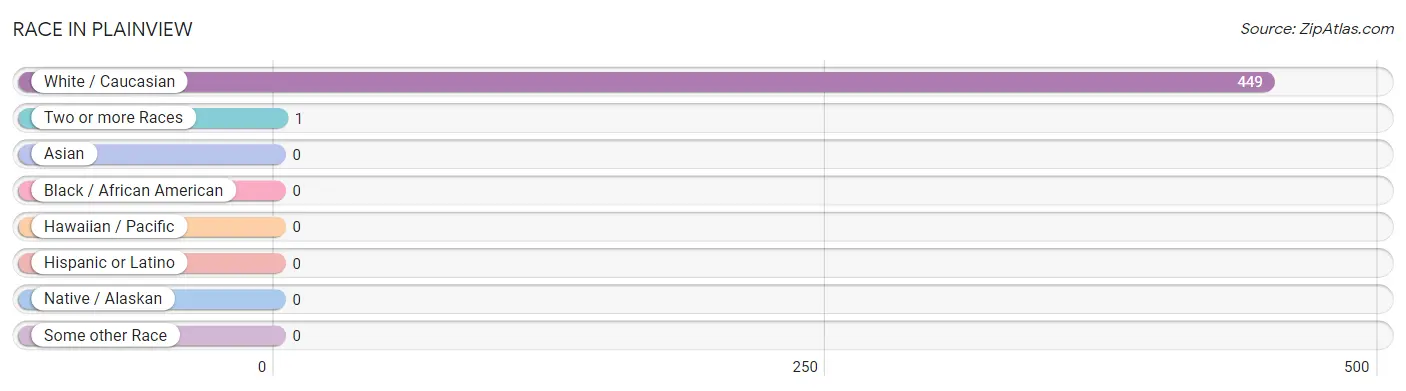
| Race | # Population | % Population |
| Asian | 0 | 0.0% |
| Black / African American | 0 | 0.0% |
| Hawaiian / Pacific | 0 | 0.0% |
| Hispanic or Latino | 0 | 0.0% |
| Native / Alaskan | 0 | 0.0% |
| White / Caucasian | 449 | 99.8% |
| Two or more Races | 1 | 0.2% |
| Some other Race | 0 | 0.0% |
| Total | 450 | 100.0% |
Ancestry in Plainview
The most populous ancestries reported in Plainview are English (62 | 13.8%), German (32 | 7.1%), American (19 | 4.2%), Irish (17 | 3.8%), and Dutch (13 | 2.9%), together accounting for 31.8% of all Plainview residents.
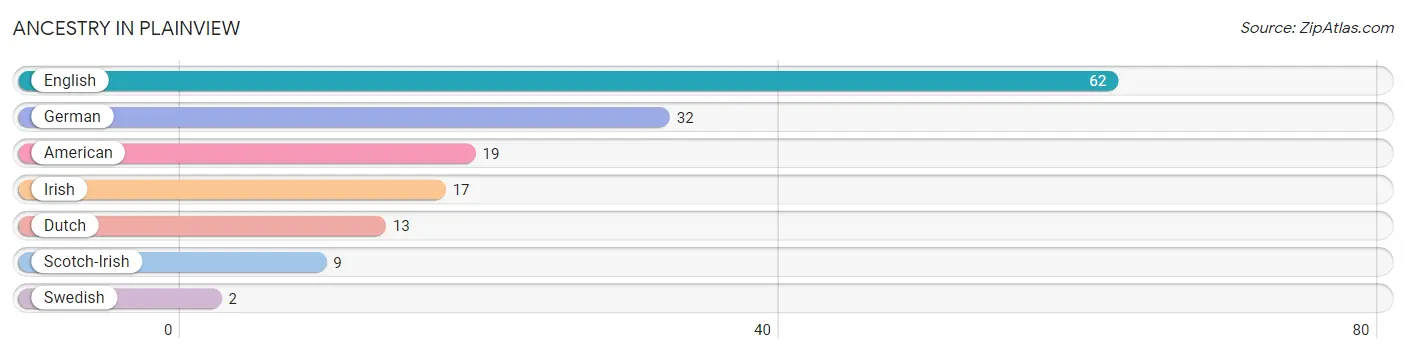
| Ancestry | # Population | % Population |
| American | 19 | 4.2% |
| Dutch | 13 | 2.9% |
| English | 62 | 13.8% |
| German | 32 | 7.1% |
| Irish | 17 | 3.8% |
| Scotch-Irish | 9 | 2.0% |
| Swedish | 2 | 0.4% | View All 7 Rows |
Immigrants in Plainview

| Immigration Origin | # Population | % Population | View All 0 Rows |
Sex and Age in Plainview
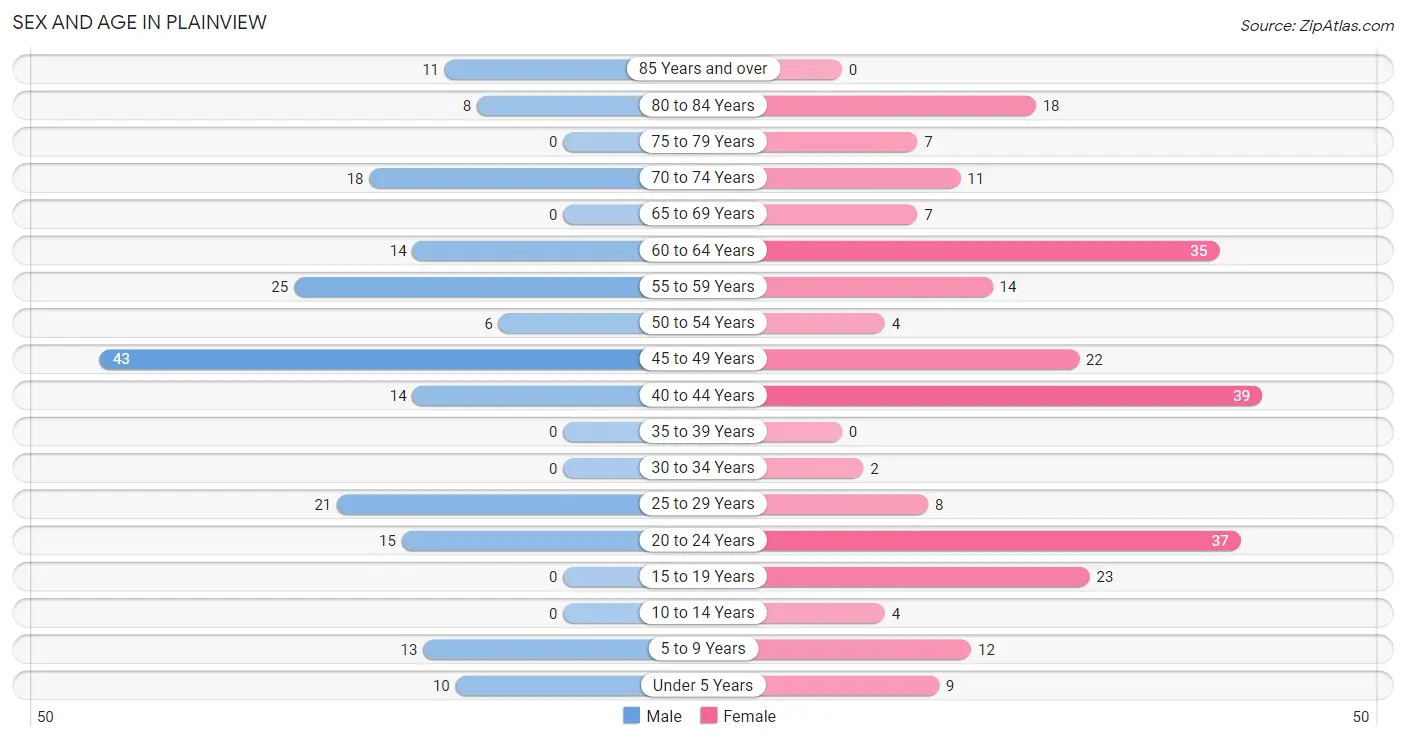
Sex and Age in Plainview
The most populous age groups in Plainview are 45 to 49 Years (43 | 21.7%) for men and 40 to 44 Years (39 | 15.5%) for women.
| Age Bracket | Male | Female |
| Under 5 Years | 10 (5.1%) | 9 (3.6%) |
| 5 to 9 Years | 13 (6.6%) | 12 (4.8%) |
| 10 to 14 Years | 0 (0.0%) | 4 (1.6%) |
| 15 to 19 Years | 0 (0.0%) | 23 (9.1%) |
| 20 to 24 Years | 15 (7.6%) | 37 (14.7%) |
| 25 to 29 Years | 21 (10.6%) | 8 (3.2%) |
| 30 to 34 Years | 0 (0.0%) | 2 (0.8%) |
| 35 to 39 Years | 0 (0.0%) | 0 (0.0%) |
| 40 to 44 Years | 14 (7.1%) | 39 (15.5%) |
| 45 to 49 Years | 43 (21.7%) | 22 (8.7%) |
| 50 to 54 Years | 6 (3.0%) | 4 (1.6%) |
| 55 to 59 Years | 25 (12.6%) | 14 (5.6%) |
| 60 to 64 Years | 14 (7.1%) | 35 (13.9%) |
| 65 to 69 Years | 0 (0.0%) | 7 (2.8%) |
| 70 to 74 Years | 18 (9.1%) | 11 (4.4%) |
| 75 to 79 Years | 0 (0.0%) | 7 (2.8%) |
| 80 to 84 Years | 8 (4.0%) | 18 (7.1%) |
| 85 Years and over | 11 (5.6%) | 0 (0.0%) |
| Total | 198 (100.0%) | 252 (100.0%) |
Families and Households in Plainview
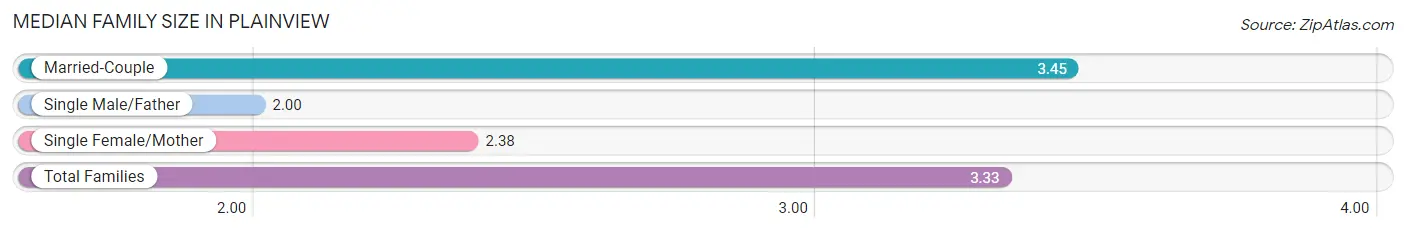
Median Family Size in Plainview
The median family size in Plainview is 3.33 persons per family, with married-couple families (89 | 89.9%) accounting for the largest median family size of 3.45 persons per family. On the other hand, single male/father families (2 | 2.0%) represent the smallest median family size with 2.00 persons per family.
| Family Type | # Families | Family Size |
| Married-Couple | 89 (89.9%) | 3.45 |
| Single Male/Father | 2 (2.0%) | 2.00 |
| Single Female/Mother | 8 (8.1%) | 2.38 |
| Total Families | 99 (100.0%) | 3.33 |
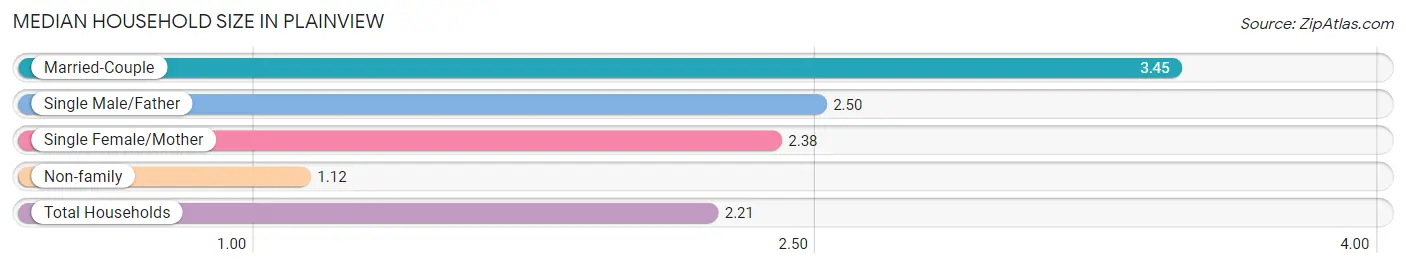
Median Household Size in Plainview
The median household size in Plainview is 2.21 persons per household, with married-couple households (89 | 44.3%) accounting for the largest median household size of 3.45 persons per household. non-family households (102 | 50.7%) represent the smallest median household size with 1.12 persons per household.
| Household Type | # Households | Household Size |
| Married-Couple | 89 (44.3%) | 3.45 |
| Single Male/Father | 2 (1.0%) | 2.50 |
| Single Female/Mother | 8 (4.0%) | 2.38 |
| Non-family | 102 (50.7%) | 1.12 |
| Total Households | 201 (100.0%) | 2.21 |
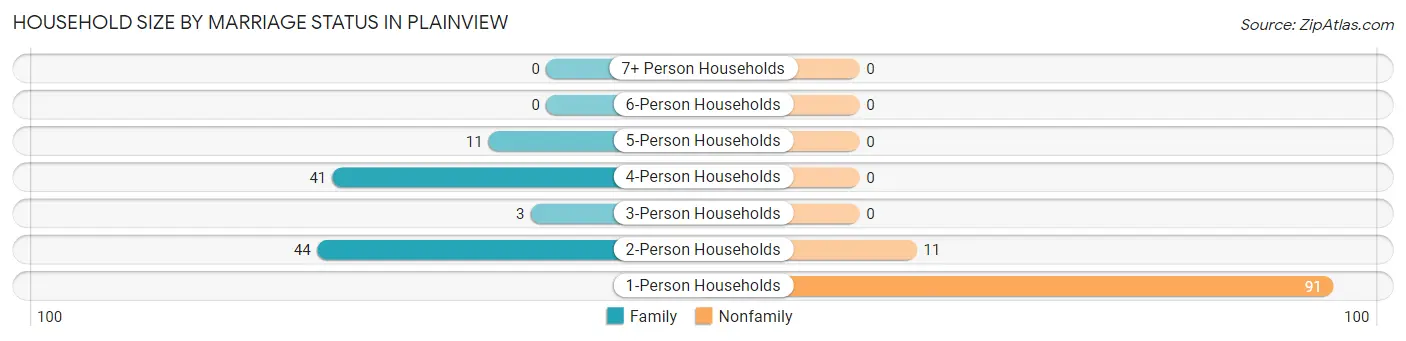
Household Size by Marriage Status in Plainview
Out of a total of 201 households in Plainview, 99 (49.2%) are family households, while 102 (50.7%) are nonfamily households. The most numerous type of family households are 2-person households, comprising 44, and the most common type of nonfamily households are 1-person households, comprising 91.
| Household Size | Family Households | Nonfamily Households |
| 1-Person Households | - | 91 (45.3%) |
| 2-Person Households | 44 (21.9%) | 11 (5.5%) |
| 3-Person Households | 3 (1.5%) | 0 (0.0%) |
| 4-Person Households | 41 (20.4%) | 0 (0.0%) |
| 5-Person Households | 11 (5.5%) | 0 (0.0%) |
| 6-Person Households | 0 (0.0%) | 0 (0.0%) |
| 7+ Person Households | 0 (0.0%) | 0 (0.0%) |
| Total | 99 (49.2%) | 102 (50.7%) |
Female Fertility in Plainview
Fertility by Age in Plainview
Average fertility rate in Plainview is 15.0 births per 1,000 women. Women in the age bracket of 20 to 34 years have the highest fertility rate with 43.0 births per 1,000 women. Women in the age bracket of 20 to 34 years acount for 100.0% of all women with births.
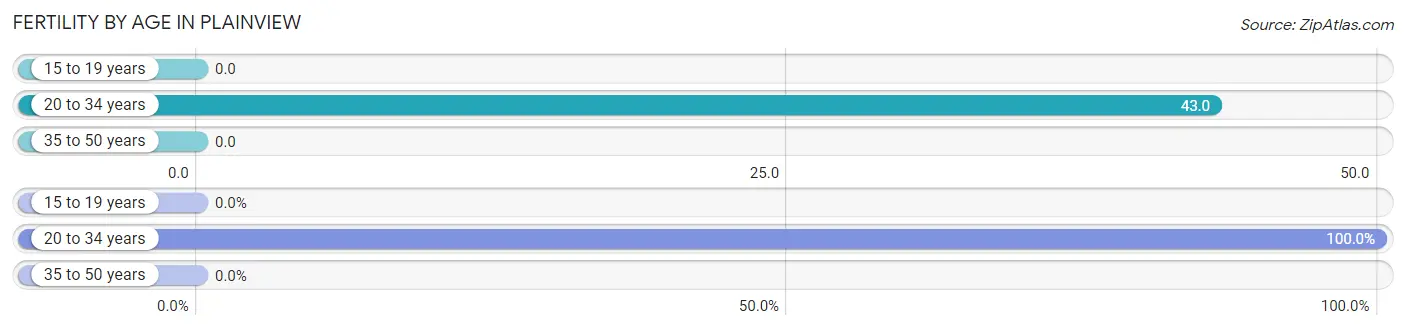
| Age Bracket | Women with Births | Births / 1,000 Women |
| 15 to 19 years | 0 (0.0%) | 0.0 |
| 20 to 34 years | 2 (100.0%) | 43.0 |
| 35 to 50 years | 0 (0.0%) | 0.0 |
| Total | 2 (100.0%) | 15.0 |
Fertility by Age by Marriage Status in Plainview
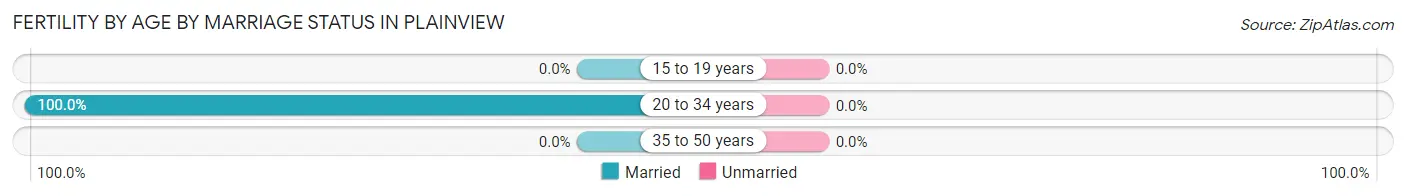
| Age Bracket | Married | Unmarried |
| 15 to 19 years | 0 (0.0%) | 0 (0.0%) |
| 20 to 34 years | 2 (100.0%) | 0 (0.0%) |
| 35 to 50 years | 0 (0.0%) | 0 (0.0%) |
| Total | 2 (100.0%) | 0 (0.0%) |
Fertility by Education in Plainview
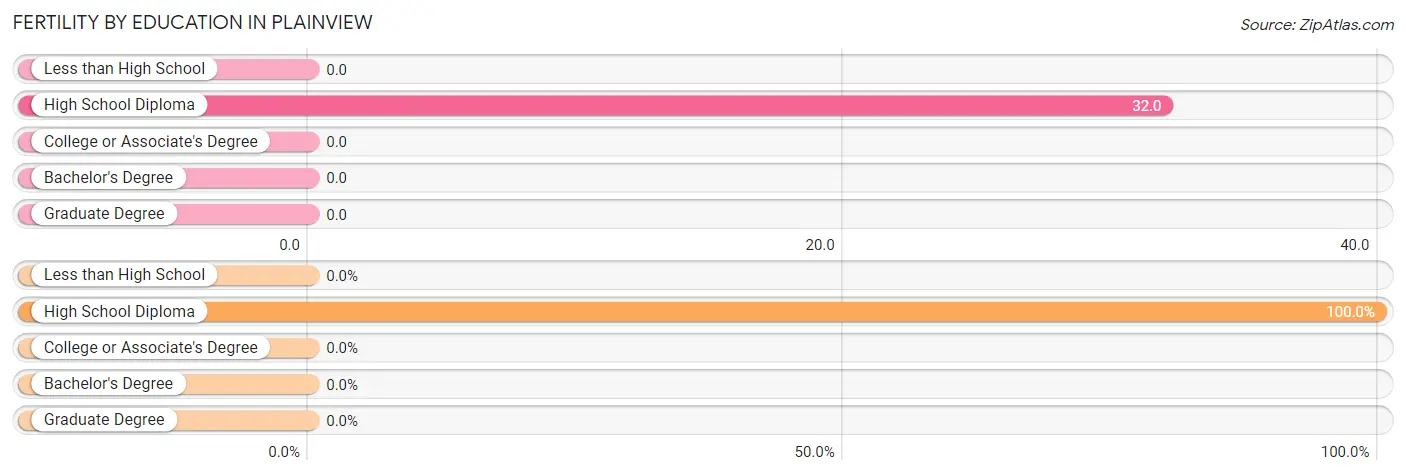
| Educational Attainment | Women with Births | Births / 1,000 Women |
| Less than High School | 0 (0.0%) | 0.0 |
| High School Diploma | 2 (100.0%) | 32.0 |
| College or Associate's Degree | 0 (0.0%) | 0.0 |
| Bachelor's Degree | 0 (0.0%) | 0.0 |
| Graduate Degree | 0 (0.0%) | 0.0 |
| Total | 2 (100.0%) | 15.0 |
Fertility by Education by Marriage Status in Plainview
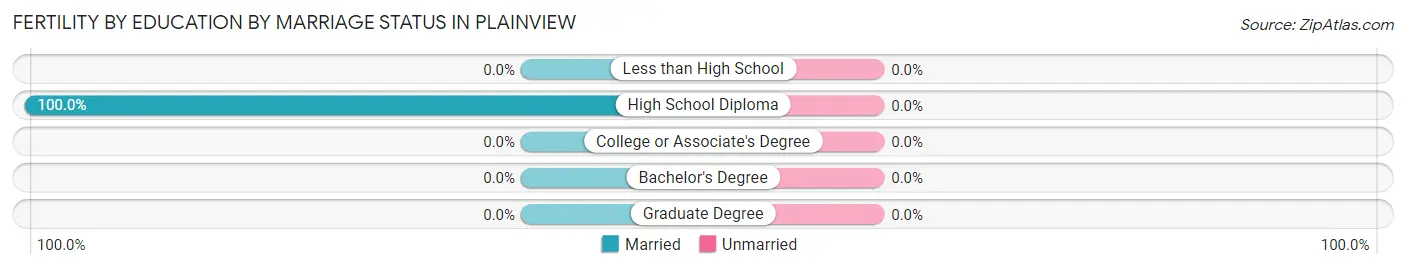
| Educational Attainment | Married | Unmarried |
| Less than High School | 0 (0.0%) | 0 (0.0%) |
| High School Diploma | 2 (100.0%) | 0 (0.0%) |
| College or Associate's Degree | 0 (0.0%) | 0 (0.0%) |
| Bachelor's Degree | 0 (0.0%) | 0 (0.0%) |
| Graduate Degree | 0 (0.0%) | 0 (0.0%) |
| Total | 2 (100.0%) | 0 (0.0%) |
Employment Characteristics in Plainview
Employment by Class of Employer in Plainview
Among the 183 employed individuals in Plainview, private company employees (163 | 89.1%), not-for-profit organizations (7 | 3.8%), and state government employees (6 | 3.3%) make up the most common classes of employment.
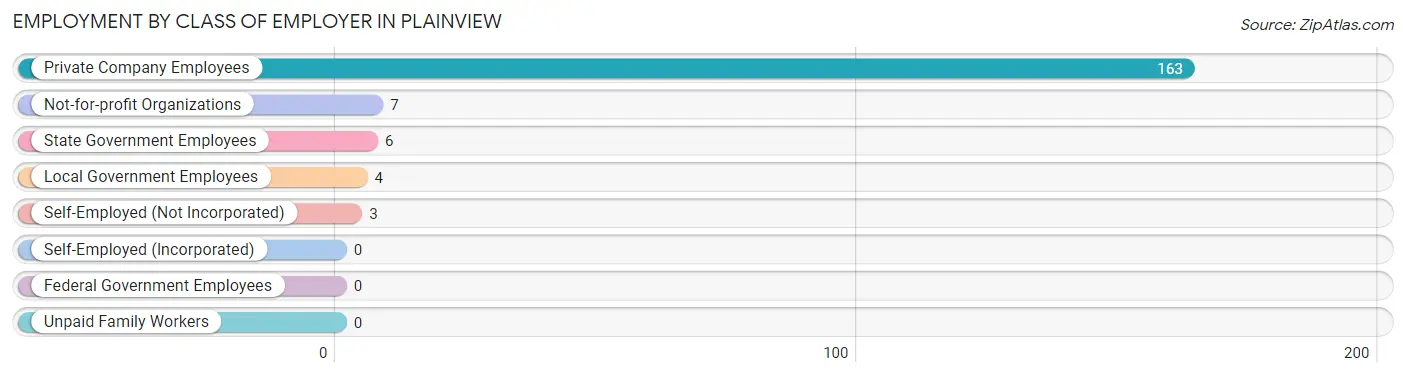
| Employer Class | # Employees | % Employees |
| Private Company Employees | 163 | 89.1% |
| Self-Employed (Incorporated) | 0 | 0.0% |
| Self-Employed (Not Incorporated) | 3 | 1.6% |
| Not-for-profit Organizations | 7 | 3.8% |
| Local Government Employees | 4 | 2.2% |
| State Government Employees | 6 | 3.3% |
| Federal Government Employees | 0 | 0.0% |
| Unpaid Family Workers | 0 | 0.0% |
| Total | 183 | 100.0% |
Employment Status by Age in Plainview
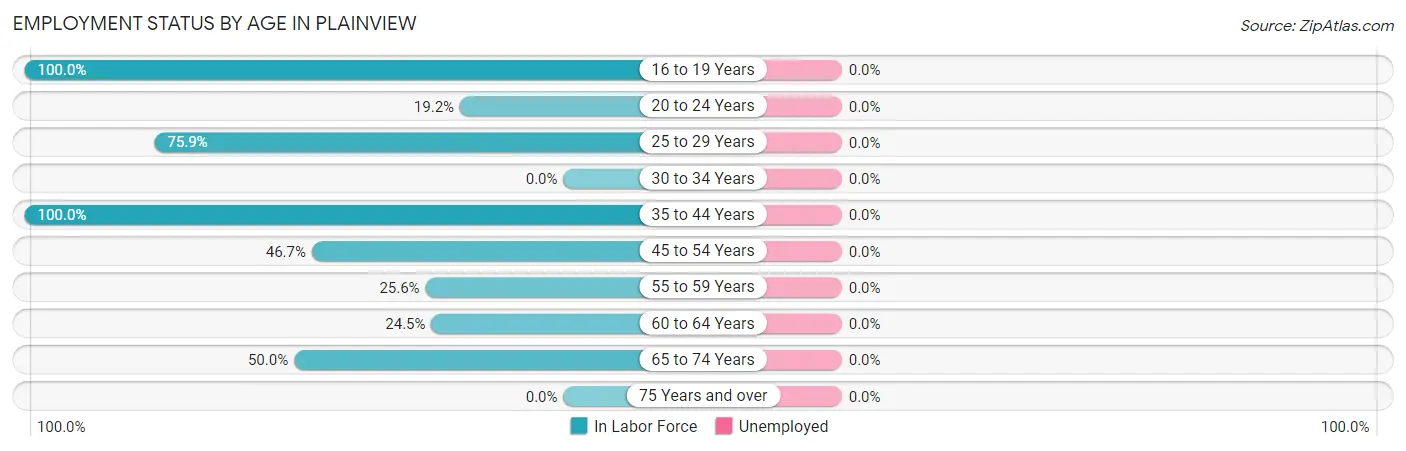
| Age Bracket | In Labor Force | Unemployed |
| 16 to 19 Years | 23 (100.0%) | 0 (0.0%) |
| 20 to 24 Years | 10 (19.2%) | 0 (0.0%) |
| 25 to 29 Years | 22 (75.9%) | 0 (0.0%) |
| 30 to 34 Years | 0 (0.0%) | 0 (0.0%) |
| 35 to 44 Years | 53 (100.0%) | 0 (0.0%) |
| 45 to 54 Years | 35 (46.7%) | 0 (0.0%) |
| 55 to 59 Years | 10 (25.6%) | 0 (0.0%) |
| 60 to 64 Years | 12 (24.5%) | 0 (0.0%) |
| 65 to 74 Years | 18 (50.0%) | 0 (0.0%) |
| 75 Years and over | 0 (0.0%) | 0 (0.0%) |
| Total | 183 (45.5%) | 0 (0.0%) |
Employment Status by Educational Attainment in Plainview
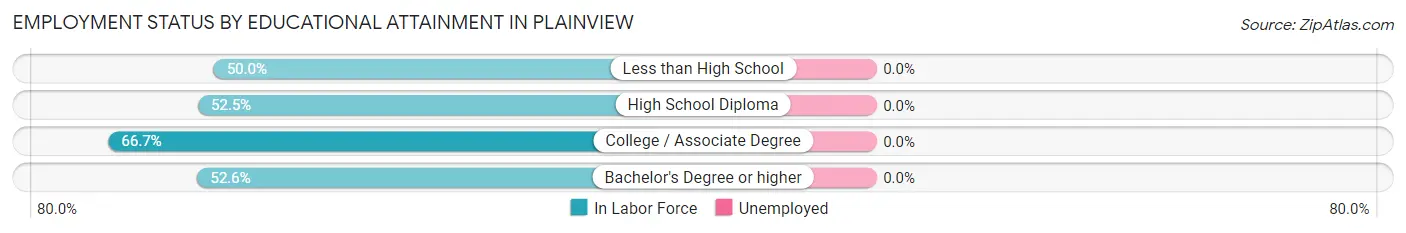
| Educational Attainment | In Labor Force | Unemployed |
| Less than High School | 21 (50.0%) | 0 (0.0%) |
| High School Diploma | 85 (52.5%) | 0 (0.0%) |
| College / Associate Degree | 16 (66.7%) | 0 (0.0%) |
| Bachelor's Degree or higher | 10 (52.6%) | 0 (0.0%) |
| Total | 132 (53.4%) | 0 (0.0%) |
Employment Occupations by Sex in Plainview
Management, Business, Science and Arts Occupations
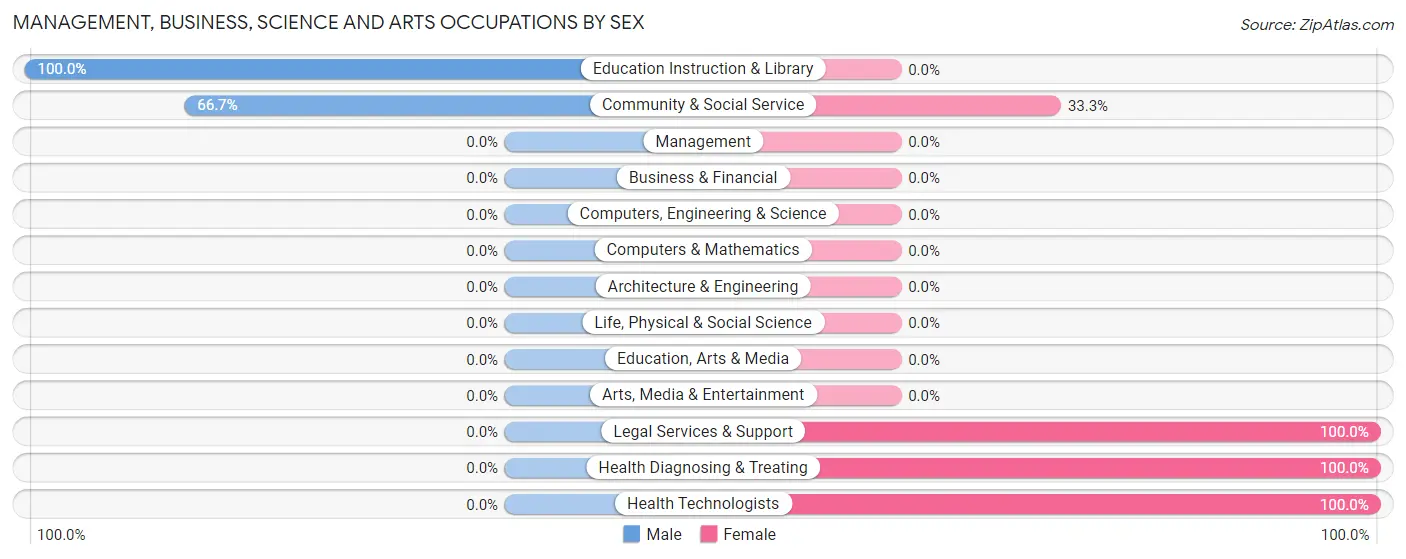
The most common Management, Business, Science and Arts occupations in Plainview are Community & Social Service (9 | 4.9%), Education Instruction & Library (6 | 3.3%), Legal Services & Support (3 | 1.6%), Health Diagnosing & Treating (1 | 0.5%), and Health Technologists (1 | 0.5%).
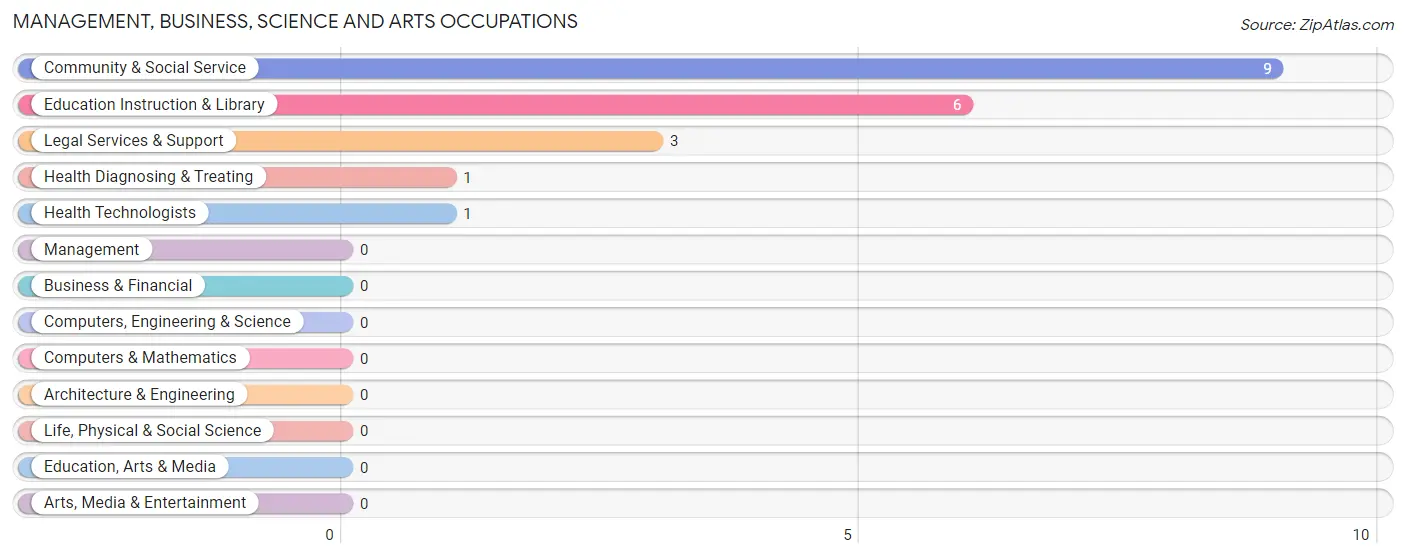
Management, Business, Science and Arts Occupations by Sex
Within the Management, Business, Science and Arts occupations in Plainview, the most male-oriented occupations are Education Instruction & Library (100.0%), and Community & Social Service (66.7%), while the most female-oriented occupations are Legal Services & Support (100.0%), Health Diagnosing & Treating (100.0%), and Health Technologists (100.0%).
| Occupation | Male | Female |
| Management | 0 (0.0%) | 0 (0.0%) |
| Business & Financial | 0 (0.0%) | 0 (0.0%) |
| Computers, Engineering & Science | 0 (0.0%) | 0 (0.0%) |
| Computers & Mathematics | 0 (0.0%) | 0 (0.0%) |
| Architecture & Engineering | 0 (0.0%) | 0 (0.0%) |
| Life, Physical & Social Science | 0 (0.0%) | 0 (0.0%) |
| Community & Social Service | 6 (66.7%) | 3 (33.3%) |
| Education, Arts & Media | 0 (0.0%) | 0 (0.0%) |
| Legal Services & Support | 0 (0.0%) | 3 (100.0%) |
| Education Instruction & Library | 6 (100.0%) | 0 (0.0%) |
| Arts, Media & Entertainment | 0 (0.0%) | 0 (0.0%) |
| Health Diagnosing & Treating | 0 (0.0%) | 1 (100.0%) |
| Health Technologists | 0 (0.0%) | 1 (100.0%) |
| Total (Category) | 6 (60.0%) | 4 (40.0%) |
| Total (Overall) | 86 (47.0%) | 97 (53.0%) |
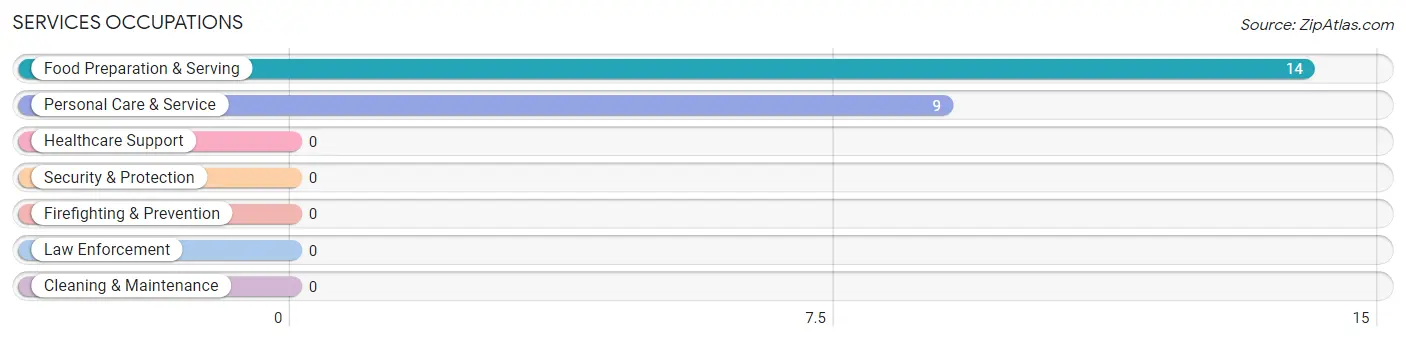
Services Occupations
The most common Services occupations in Plainview are Food Preparation & Serving (14 | 7.6%), and Personal Care & Service (9 | 4.9%).
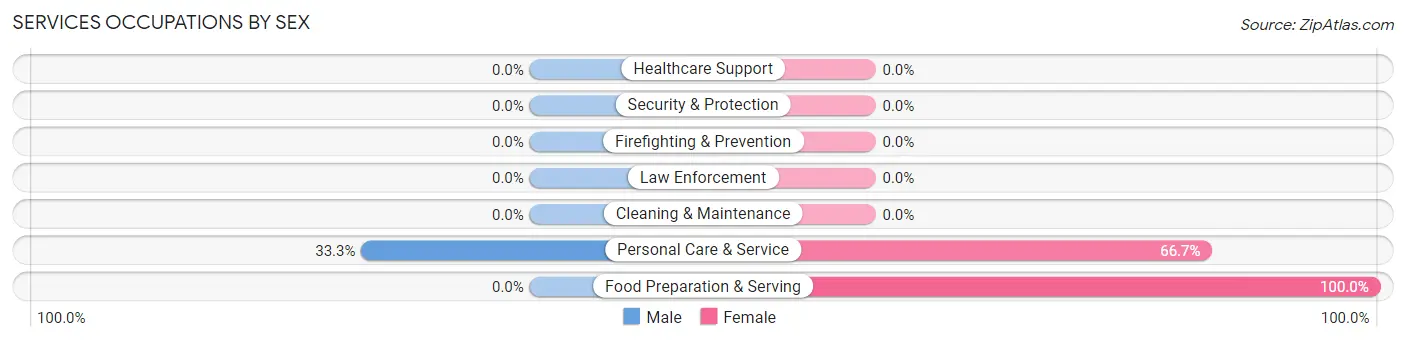
Services Occupations by Sex
| Occupation | Male | Female |
| Healthcare Support | 0 (0.0%) | 0 (0.0%) |
| Security & Protection | 0 (0.0%) | 0 (0.0%) |
| Firefighting & Prevention | 0 (0.0%) | 0 (0.0%) |
| Law Enforcement | 0 (0.0%) | 0 (0.0%) |
| Food Preparation & Serving | 0 (0.0%) | 14 (100.0%) |
| Cleaning & Maintenance | 0 (0.0%) | 0 (0.0%) |
| Personal Care & Service | 3 (33.3%) | 6 (66.7%) |
| Total (Category) | 3 (13.0%) | 20 (87.0%) |
| Total (Overall) | 86 (47.0%) | 97 (53.0%) |
Sales and Office Occupations
The most common Sales and Office occupations in Plainview are Office & Administration (66 | 36.1%), and Sales & Related (14 | 7.6%).

Sales and Office Occupations by Sex

| Occupation | Male | Female |
| Sales & Related | 6 (42.9%) | 8 (57.1%) |
| Office & Administration | 6 (9.1%) | 60 (90.9%) |
| Total (Category) | 12 (15.0%) | 68 (85.0%) |
| Total (Overall) | 86 (47.0%) | 97 (53.0%) |
Natural Resources, Construction and Maintenance Occupations
The most common Natural Resources, Construction and Maintenance occupations in Plainview are , and Construction & Extraction (10 | 5.5%).
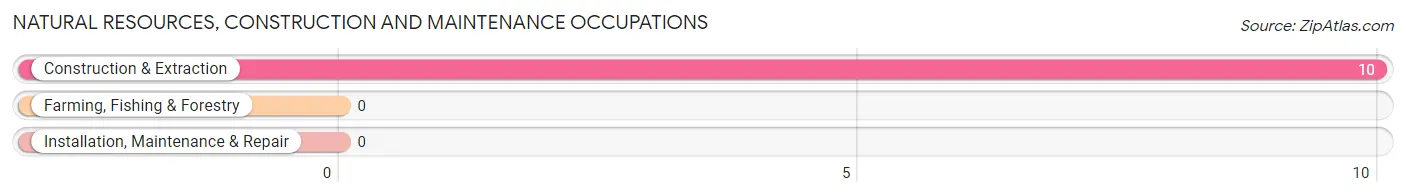
Natural Resources, Construction and Maintenance Occupations by Sex

| Occupation | Male | Female |
| Farming, Fishing & Forestry | 0 (0.0%) | 0 (0.0%) |
| Construction & Extraction | 10 (100.0%) | 0 (0.0%) |
| Installation, Maintenance & Repair | 0 (0.0%) | 0 (0.0%) |
| Total (Category) | 10 (100.0%) | 0 (0.0%) |
| Total (Overall) | 86 (47.0%) | 97 (53.0%) |
Production, Transportation and Moving Occupations
The most common Production, Transportation and Moving occupations in Plainview are Production (30 | 16.4%), Transportation (21 | 11.5%), and Material Moving (9 | 4.9%).
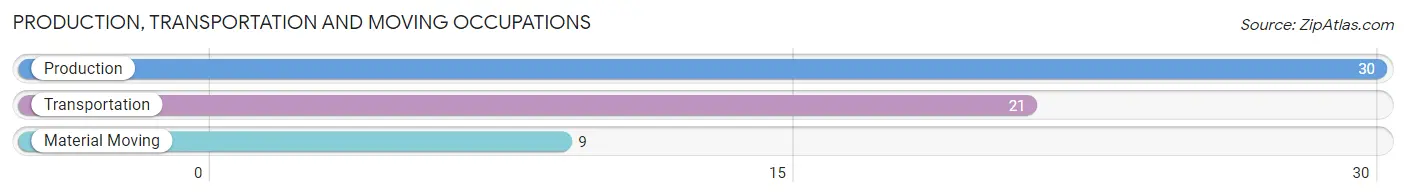
Production, Transportation and Moving Occupations by Sex
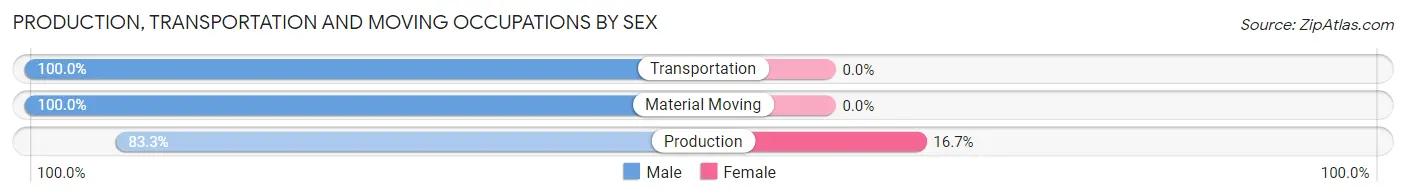
| Occupation | Male | Female |
| Production | 25 (83.3%) | 5 (16.7%) |
| Transportation | 21 (100.0%) | 0 (0.0%) |
| Material Moving | 9 (100.0%) | 0 (0.0%) |
| Total (Category) | 55 (91.7%) | 5 (8.3%) |
| Total (Overall) | 86 (47.0%) | 97 (53.0%) |
Employment Industries by Sex in Plainview
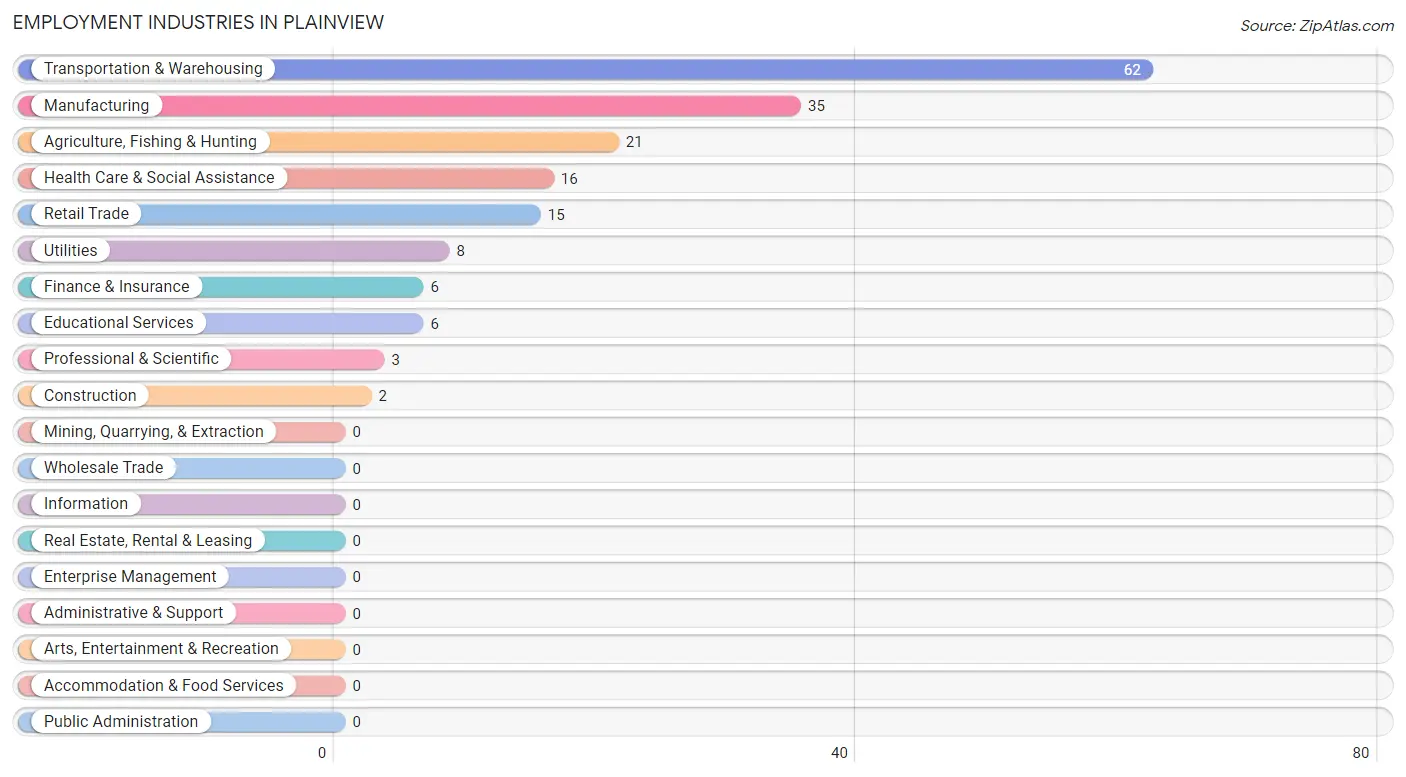
Employment Industries in Plainview
The major employment industries in Plainview include Transportation & Warehousing (62 | 33.9%), Manufacturing (35 | 19.1%), Agriculture, Fishing & Hunting (21 | 11.5%), Health Care & Social Assistance (16 | 8.7%), and Retail Trade (15 | 8.2%).
Employment Industries by Sex in Plainview
The Plainview industries that see more men than women are Agriculture, Fishing & Hunting (100.0%), Construction (100.0%), and Utilities (100.0%), whereas the industries that tend to have a higher number of women are Retail Trade (100.0%), Professional & Scientific (100.0%), and Health Care & Social Assistance (100.0%).
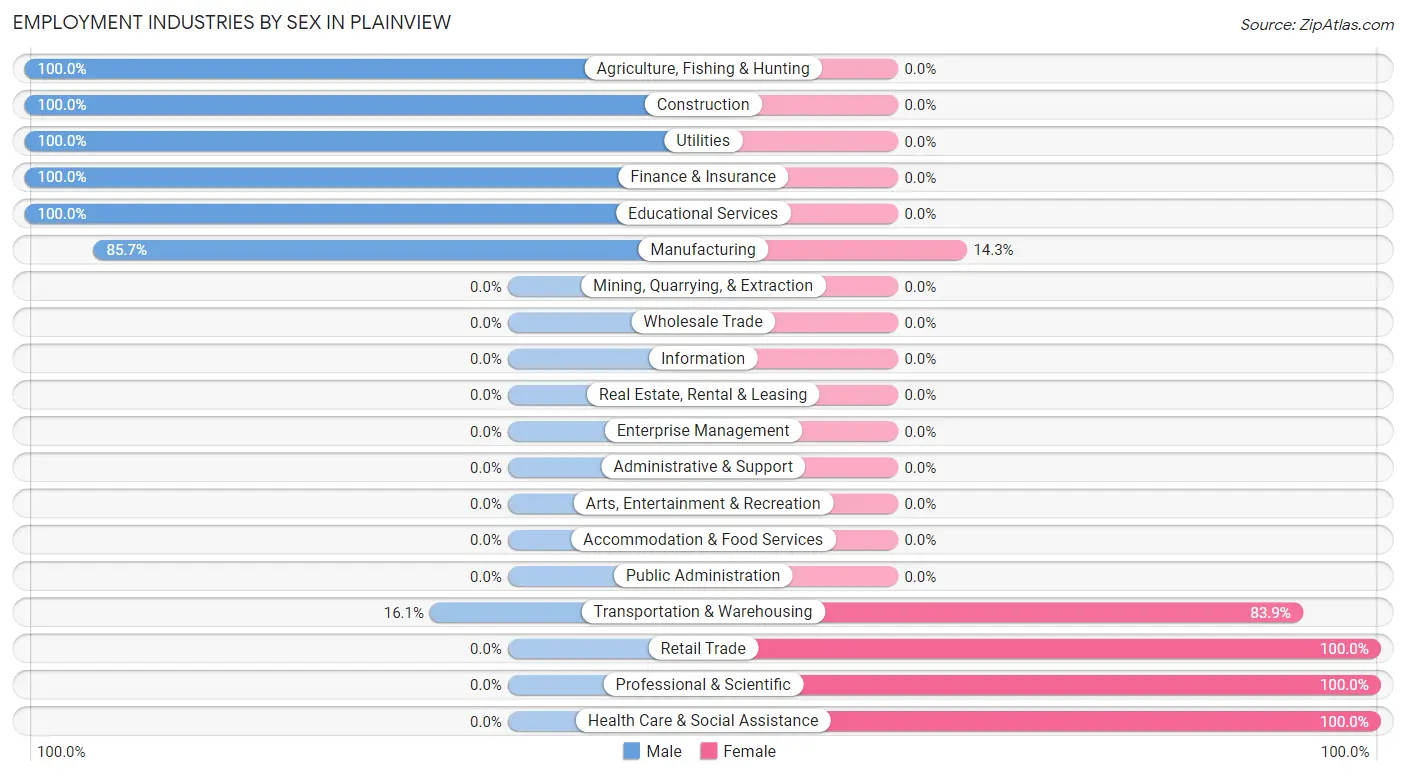
| Industry | Male | Female |
| Agriculture, Fishing & Hunting | 21 (100.0%) | 0 (0.0%) |
| Mining, Quarrying, & Extraction | 0 (0.0%) | 0 (0.0%) |
| Construction | 2 (100.0%) | 0 (0.0%) |
| Manufacturing | 30 (85.7%) | 5 (14.3%) |
| Wholesale Trade | 0 (0.0%) | 0 (0.0%) |
| Retail Trade | 0 (0.0%) | 15 (100.0%) |
| Transportation & Warehousing | 10 (16.1%) | 52 (83.9%) |
| Utilities | 8 (100.0%) | 0 (0.0%) |
| Information | 0 (0.0%) | 0 (0.0%) |
| Finance & Insurance | 6 (100.0%) | 0 (0.0%) |
| Real Estate, Rental & Leasing | 0 (0.0%) | 0 (0.0%) |
| Professional & Scientific | 0 (0.0%) | 3 (100.0%) |
| Enterprise Management | 0 (0.0%) | 0 (0.0%) |
| Administrative & Support | 0 (0.0%) | 0 (0.0%) |
| Educational Services | 6 (100.0%) | 0 (0.0%) |
| Health Care & Social Assistance | 0 (0.0%) | 16 (100.0%) |
| Arts, Entertainment & Recreation | 0 (0.0%) | 0 (0.0%) |
| Accommodation & Food Services | 0 (0.0%) | 0 (0.0%) |
| Public Administration | 0 (0.0%) | 0 (0.0%) |
| Total | 86 (47.0%) | 97 (53.0%) |
Education in Plainview
School Enrollment in Plainview
The most common levels of schooling among the 82 students in Plainview are college / undergraduate (50 | 61.0%), elementary school (10 | 12.2%), and nursery / preschool (9 | 11.0%).
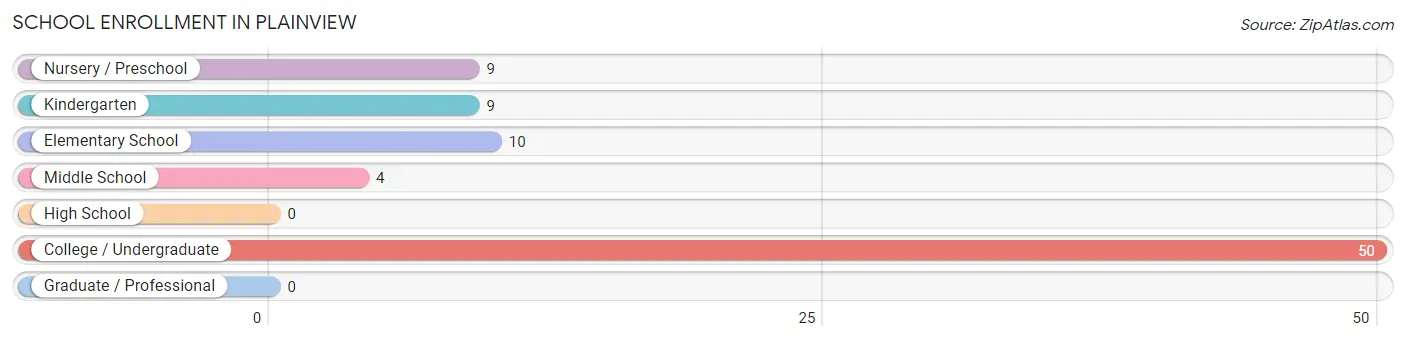
| School Level | # Students | % Students |
| Nursery / Preschool | 9 | 11.0% |
| Kindergarten | 9 | 11.0% |
| Elementary School | 10 | 12.2% |
| Middle School | 4 | 4.9% |
| High School | 0 | 0.0% |
| College / Undergraduate | 50 | 61.0% |
| Graduate / Professional | 0 | 0.0% |
| Total | 82 | 100.0% |
School Enrollment by Age by Funding Source in Plainview
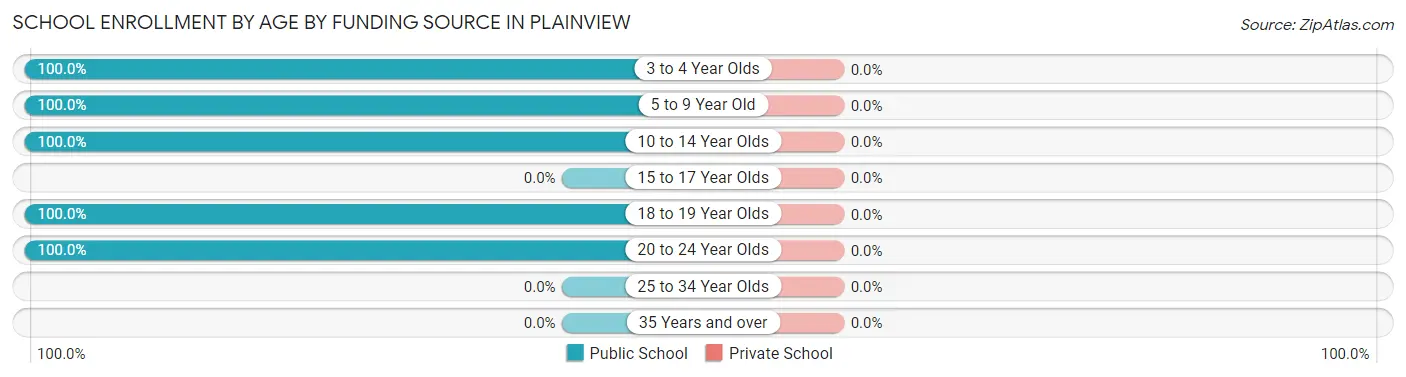
| Age Bracket | Public School | Private School |
| 3 to 4 Year Olds | 3 (100.0%) | 0 (0.0%) |
| 5 to 9 Year Old | 25 (100.0%) | 0 (0.0%) |
| 10 to 14 Year Olds | 4 (100.0%) | 0 (0.0%) |
| 15 to 17 Year Olds | 0 (0.0%) | 0 (0.0%) |
| 18 to 19 Year Olds | 23 (100.0%) | 0 (0.0%) |
| 20 to 24 Year Olds | 27 (100.0%) | 0 (0.0%) |
| 25 to 34 Year Olds | 0 (0.0%) | 0 (0.0%) |
| 35 Years and over | 0 (0.0%) | 0 (0.0%) |
| Total | 82 (100.0%) | 0 (0.0%) |
Educational Attainment by Field of Study in Plainview
Education (12 | 63.2%), science & technology (4 | 21.0%), and business (3 | 15.8%) are the most common fields of study among 19 individuals in Plainview who have obtained a bachelor's degree or higher.
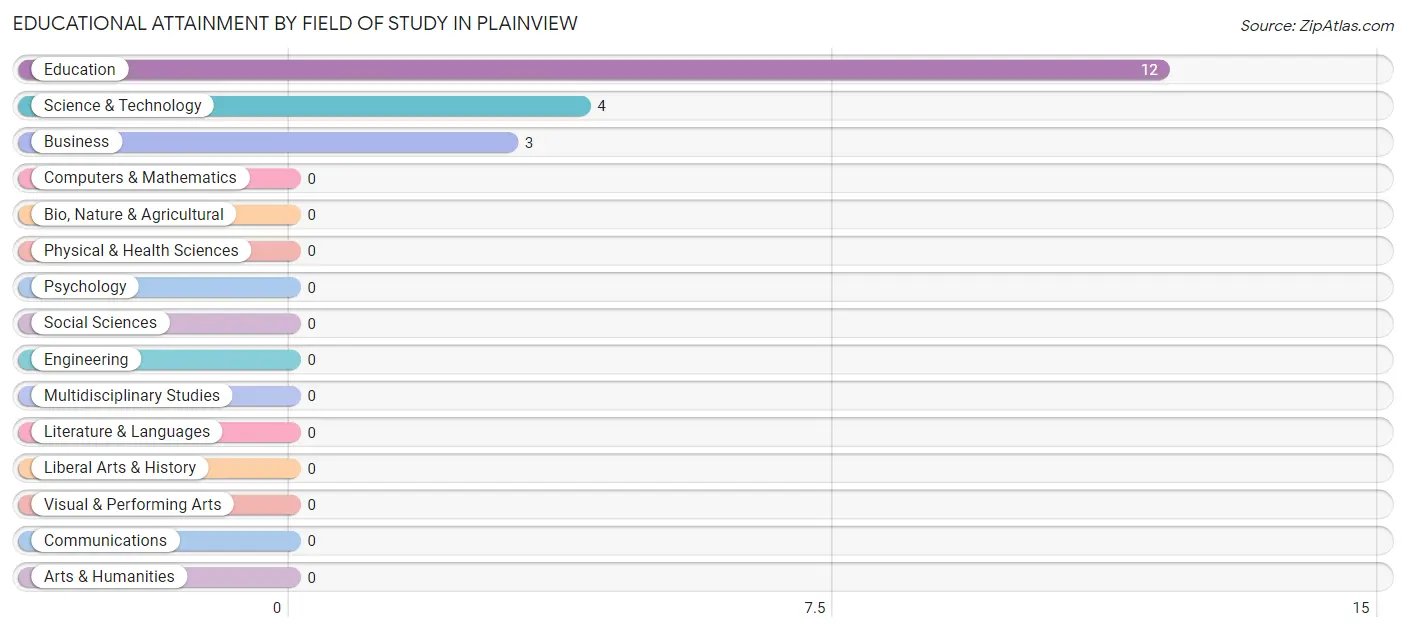
| Field of Study | # Graduates | % Graduates |
| Computers & Mathematics | 0 | 0.0% |
| Bio, Nature & Agricultural | 0 | 0.0% |
| Physical & Health Sciences | 0 | 0.0% |
| Psychology | 0 | 0.0% |
| Social Sciences | 0 | 0.0% |
| Engineering | 0 | 0.0% |
| Multidisciplinary Studies | 0 | 0.0% |
| Science & Technology | 4 | 21.0% |
| Business | 3 | 15.8% |
| Education | 12 | 63.2% |
| Literature & Languages | 0 | 0.0% |
| Liberal Arts & History | 0 | 0.0% |
| Visual & Performing Arts | 0 | 0.0% |
| Communications | 0 | 0.0% |
| Arts & Humanities | 0 | 0.0% |
| Total | 19 | 100.0% |
Transportation & Commute in Plainview
Vehicle Availability by Sex in Plainview
The most prevalent vehicle ownership categories in Plainview are males with 2 vehicles (38, accounting for 44.2%) and females with 2 vehicles (17, making up 39.2%).
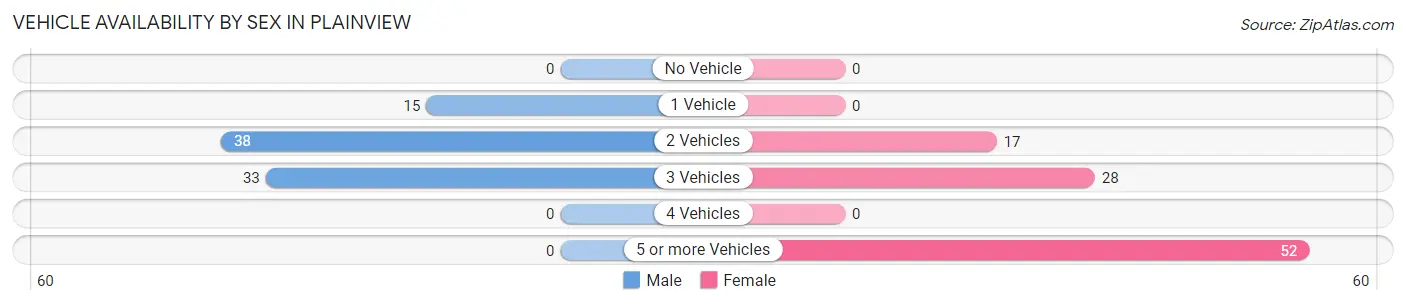
| Vehicles Available | Male | Female |
| No Vehicle | 0 (0.0%) | 0 (0.0%) |
| 1 Vehicle | 15 (17.4%) | 0 (0.0%) |
| 2 Vehicles | 38 (44.2%) | 17 (17.5%) |
| 3 Vehicles | 33 (38.4%) | 28 (28.9%) |
| 4 Vehicles | 0 (0.0%) | 0 (0.0%) |
| 5 or more Vehicles | 0 (0.0%) | 52 (53.6%) |
| Total | 86 (100.0%) | 97 (100.0%) |
Commute Time in Plainview
The most frequently occuring commute durations in Plainview are 35 to 39 minutes (55 commuters, 31.1%), 40 to 44 minutes (36 commuters, 20.3%), and 45 to 59 minutes (34 commuters, 19.2%).
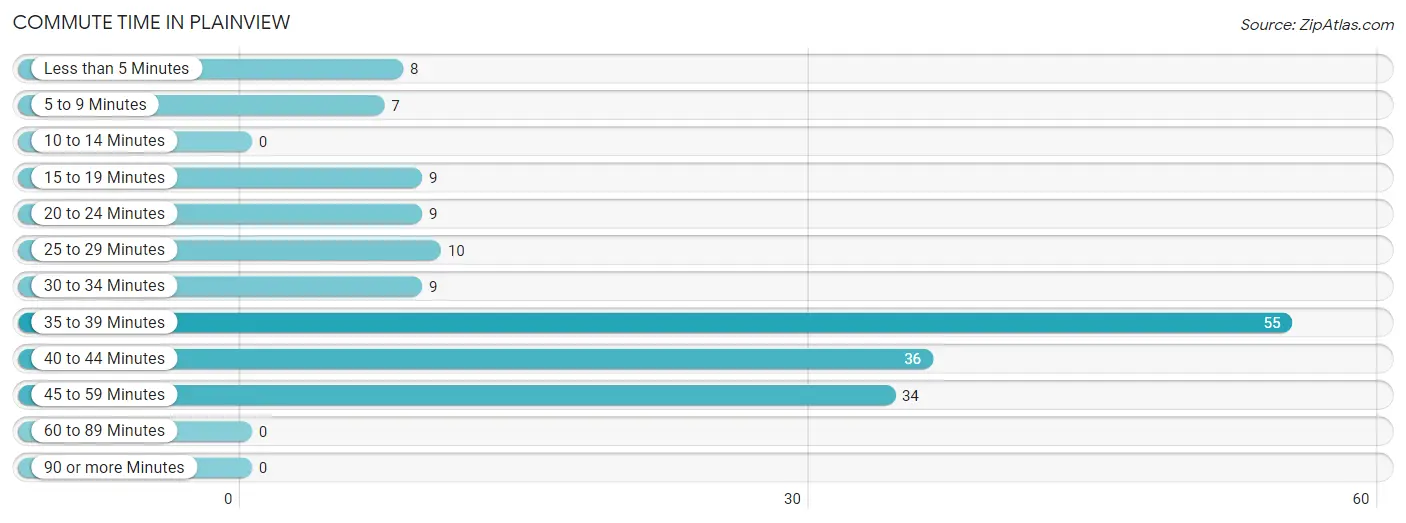
| Commute Time | # Commuters | % Commuters |
| Less than 5 Minutes | 8 | 4.5% |
| 5 to 9 Minutes | 7 | 4.0% |
| 10 to 14 Minutes | 0 | 0.0% |
| 15 to 19 Minutes | 9 | 5.1% |
| 20 to 24 Minutes | 9 | 5.1% |
| 25 to 29 Minutes | 10 | 5.7% |
| 30 to 34 Minutes | 9 | 5.1% |
| 35 to 39 Minutes | 55 | 31.1% |
| 40 to 44 Minutes | 36 | 20.3% |
| 45 to 59 Minutes | 34 | 19.2% |
| 60 to 89 Minutes | 0 | 0.0% |
| 90 or more Minutes | 0 | 0.0% |
Commute Time by Sex in Plainview
The most common commute times in Plainview are 45 to 59 minutes (27 commuters, 33.8%) for males and 35 to 39 minutes (39 commuters, 40.2%) for females.
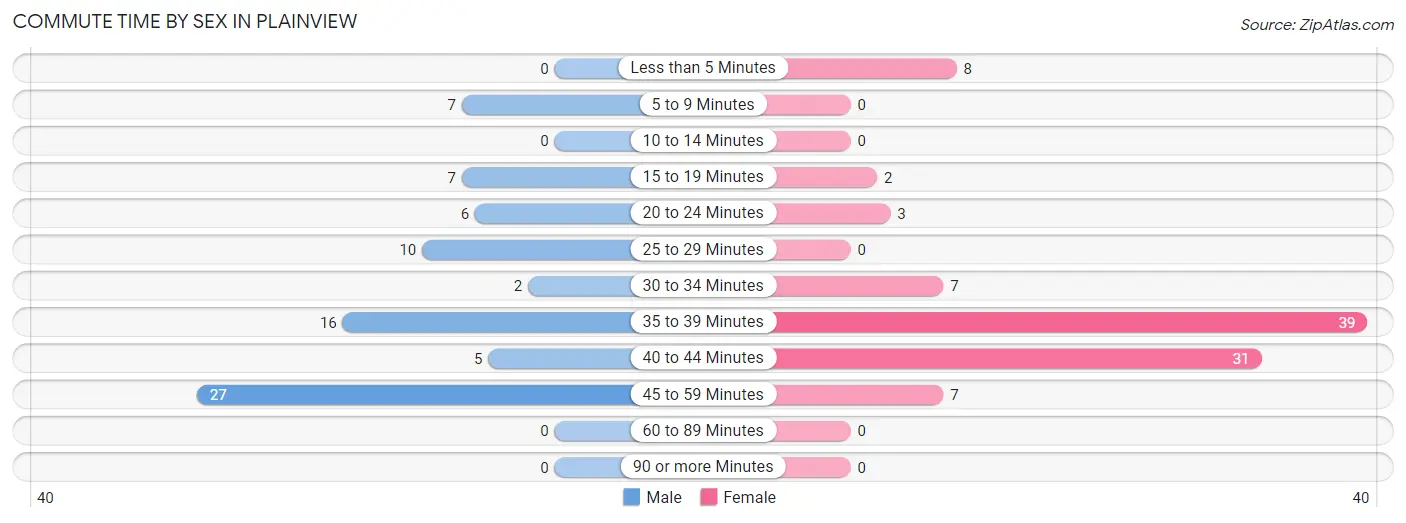
| Commute Time | Male | Female |
| Less than 5 Minutes | 0 (0.0%) | 8 (8.3%) |
| 5 to 9 Minutes | 7 (8.7%) | 0 (0.0%) |
| 10 to 14 Minutes | 0 (0.0%) | 0 (0.0%) |
| 15 to 19 Minutes | 7 (8.7%) | 2 (2.1%) |
| 20 to 24 Minutes | 6 (7.5%) | 3 (3.1%) |
| 25 to 29 Minutes | 10 (12.5%) | 0 (0.0%) |
| 30 to 34 Minutes | 2 (2.5%) | 7 (7.2%) |
| 35 to 39 Minutes | 16 (20.0%) | 39 (40.2%) |
| 40 to 44 Minutes | 5 (6.2%) | 31 (32.0%) |
| 45 to 59 Minutes | 27 (33.8%) | 7 (7.2%) |
| 60 to 89 Minutes | 0 (0.0%) | 0 (0.0%) |
| 90 or more Minutes | 0 (0.0%) | 0 (0.0%) |
Time of Departure to Work by Sex in Plainview
The most frequent times of departure to work in Plainview are 12:00 AM to 4:59 AM (34, 42.5%) for males and 7:00 AM to 7:29 AM (44, 45.4%) for females.
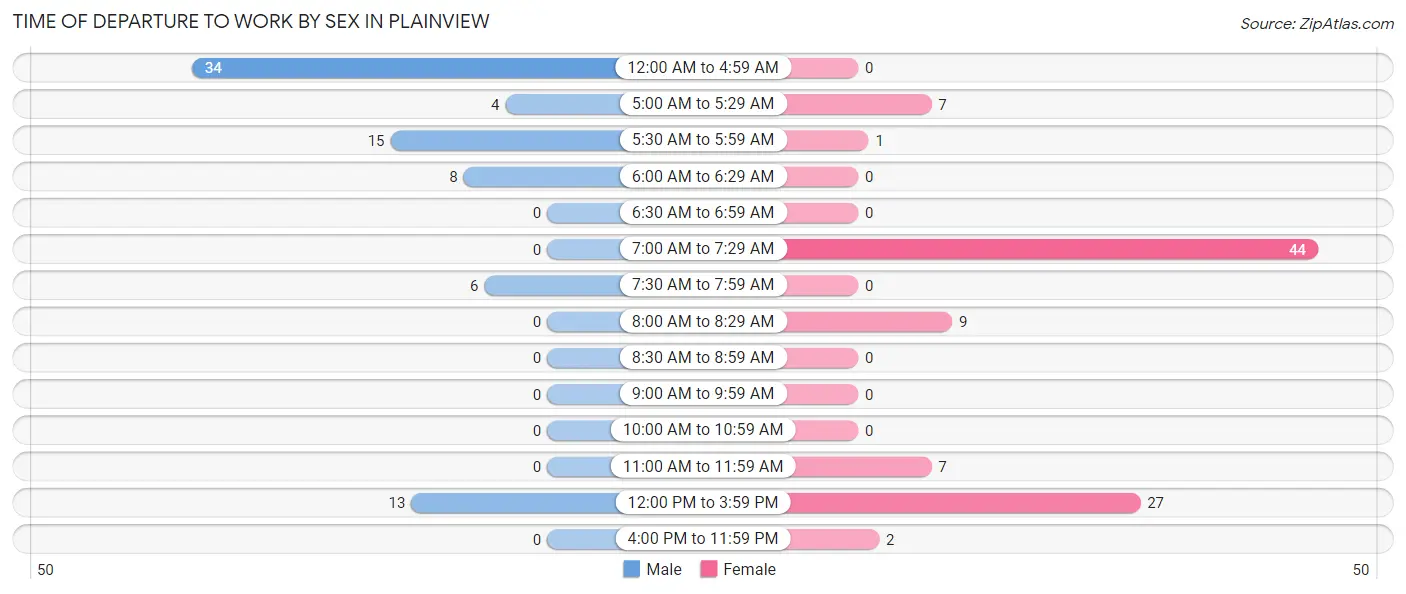
| Time of Departure | Male | Female |
| 12:00 AM to 4:59 AM | 34 (42.5%) | 0 (0.0%) |
| 5:00 AM to 5:29 AM | 4 (5.0%) | 7 (7.2%) |
| 5:30 AM to 5:59 AM | 15 (18.8%) | 1 (1.0%) |
| 6:00 AM to 6:29 AM | 8 (10.0%) | 0 (0.0%) |
| 6:30 AM to 6:59 AM | 0 (0.0%) | 0 (0.0%) |
| 7:00 AM to 7:29 AM | 0 (0.0%) | 44 (45.4%) |
| 7:30 AM to 7:59 AM | 6 (7.5%) | 0 (0.0%) |
| 8:00 AM to 8:29 AM | 0 (0.0%) | 9 (9.3%) |
| 8:30 AM to 8:59 AM | 0 (0.0%) | 0 (0.0%) |
| 9:00 AM to 9:59 AM | 0 (0.0%) | 0 (0.0%) |
| 10:00 AM to 10:59 AM | 0 (0.0%) | 0 (0.0%) |
| 11:00 AM to 11:59 AM | 0 (0.0%) | 7 (7.2%) |
| 12:00 PM to 3:59 PM | 13 (16.3%) | 27 (27.8%) |
| 4:00 PM to 11:59 PM | 0 (0.0%) | 2 (2.1%) |
| Total | 80 (100.0%) | 97 (100.0%) |
Housing Occupancy in Plainview
Occupancy by Ownership in Plainview
Of the total 201 dwellings in Plainview, owner-occupied units account for 134 (66.7%), while renter-occupied units make up 67 (33.3%).
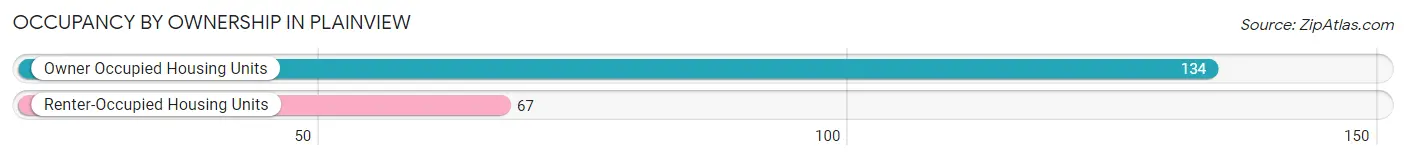
| Occupancy | # Housing Units | % Housing Units |
| Owner Occupied Housing Units | 134 | 66.7% |
| Renter-Occupied Housing Units | 67 | 33.3% |
| Total Occupied Housing Units | 201 | 100.0% |
Occupancy by Household Size in Plainview
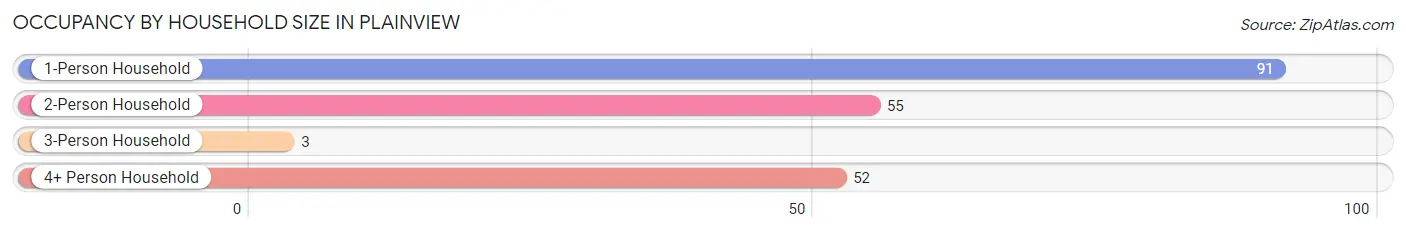
| Household Size | # Housing Units | % Housing Units |
| 1-Person Household | 91 | 45.3% |
| 2-Person Household | 55 | 27.4% |
| 3-Person Household | 3 | 1.5% |
| 4+ Person Household | 52 | 25.9% |
| Total Housing Units | 201 | 100.0% |
Occupancy by Ownership by Household Size in Plainview
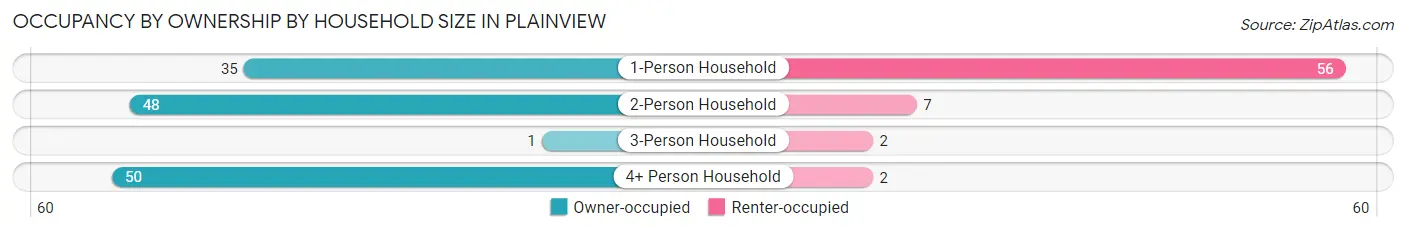
| Household Size | Owner-occupied | Renter-occupied |
| 1-Person Household | 35 (38.5%) | 56 (61.5%) |
| 2-Person Household | 48 (87.3%) | 7 (12.7%) |
| 3-Person Household | 1 (33.3%) | 2 (66.7%) |
| 4+ Person Household | 50 (96.2%) | 2 (3.8%) |
| Total Housing Units | 134 (66.7%) | 67 (33.3%) |
Occupancy by Educational Attainment in Plainview
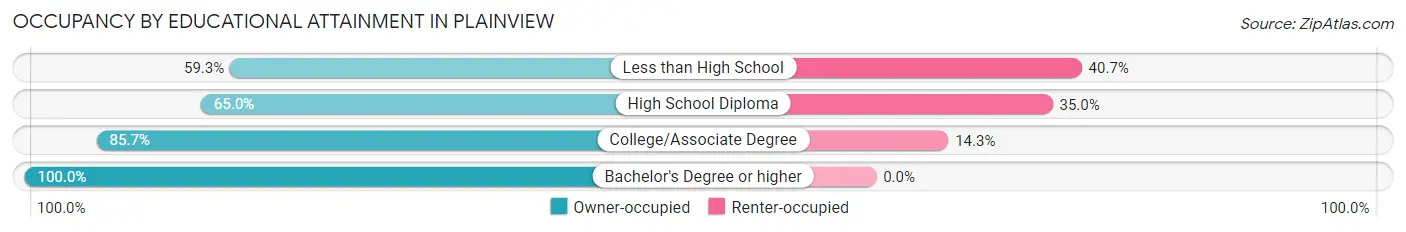
| Household Size | Owner-occupied | Renter-occupied |
| Less than High School | 32 (59.3%) | 22 (40.7%) |
| High School Diploma | 80 (65.0%) | 43 (35.0%) |
| College/Associate Degree | 12 (85.7%) | 2 (14.3%) |
| Bachelor's Degree or higher | 10 (100.0%) | 0 (0.0%) |
Occupancy by Age of Householder in Plainview
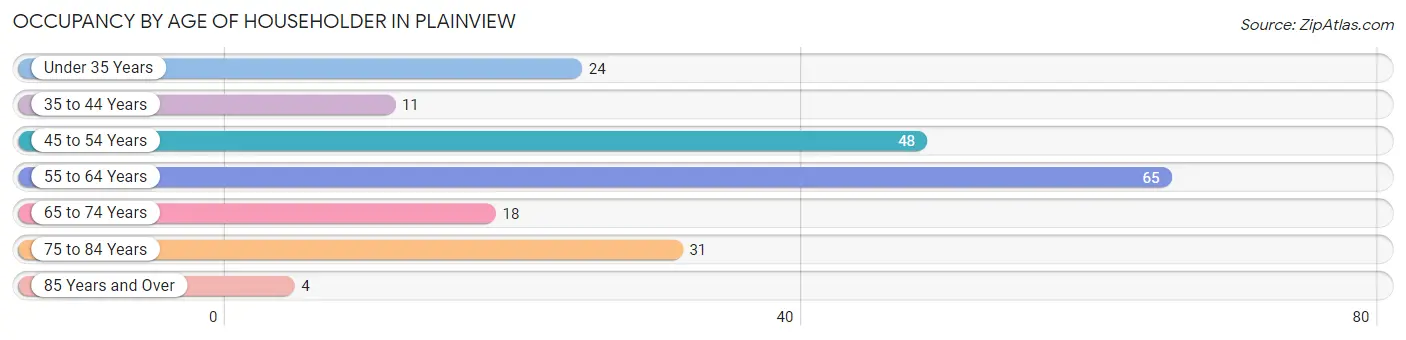
| Age Bracket | # Households | % Households |
| Under 35 Years | 24 | 11.9% |
| 35 to 44 Years | 11 | 5.5% |
| 45 to 54 Years | 48 | 23.9% |
| 55 to 64 Years | 65 | 32.3% |
| 65 to 74 Years | 18 | 9.0% |
| 75 to 84 Years | 31 | 15.4% |
| 85 Years and Over | 4 | 2.0% |
| Total | 201 | 100.0% |
Housing Finances in Plainview
Median Income by Occupancy in Plainview
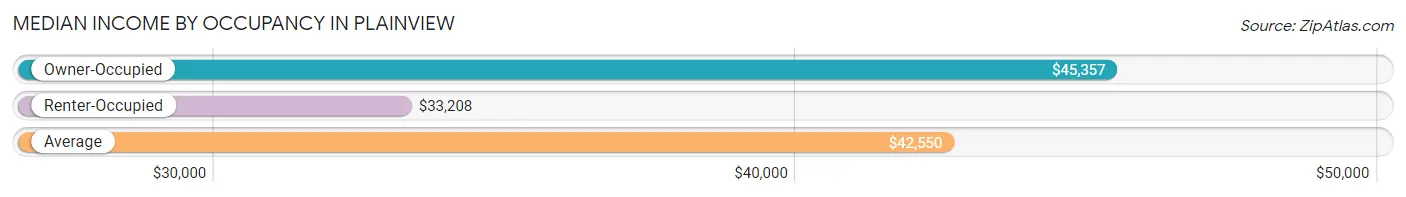
| Occupancy Type | # Households | Median Income |
| Owner-Occupied | 134 (66.7%) | $45,357 |
| Renter-Occupied | 67 (33.3%) | $33,208 |
| Average | 201 (100.0%) | $42,550 |
Occupancy by Householder Income Bracket in Plainview
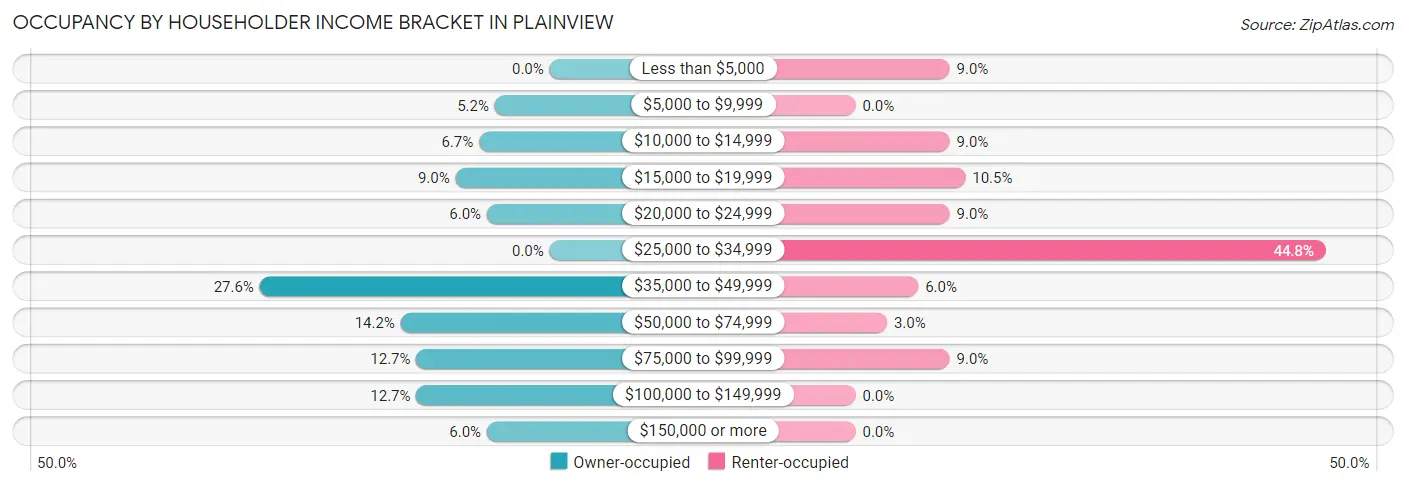
| Income Bracket | Owner-occupied | Renter-occupied |
| Less than $5,000 | 0 (0.0%) | 6 (9.0%) |
| $5,000 to $9,999 | 7 (5.2%) | 0 (0.0%) |
| $10,000 to $14,999 | 9 (6.7%) | 6 (9.0%) |
| $15,000 to $19,999 | 12 (9.0%) | 7 (10.4%) |
| $20,000 to $24,999 | 8 (6.0%) | 6 (9.0%) |
| $25,000 to $34,999 | 0 (0.0%) | 30 (44.8%) |
| $35,000 to $49,999 | 37 (27.6%) | 4 (6.0%) |
| $50,000 to $74,999 | 19 (14.2%) | 2 (3.0%) |
| $75,000 to $99,999 | 17 (12.7%) | 6 (9.0%) |
| $100,000 to $149,999 | 17 (12.7%) | 0 (0.0%) |
| $150,000 or more | 8 (6.0%) | 0 (0.0%) |
| Total | 134 (100.0%) | 67 (100.0%) |
Monthly Housing Cost Tiers in Plainview
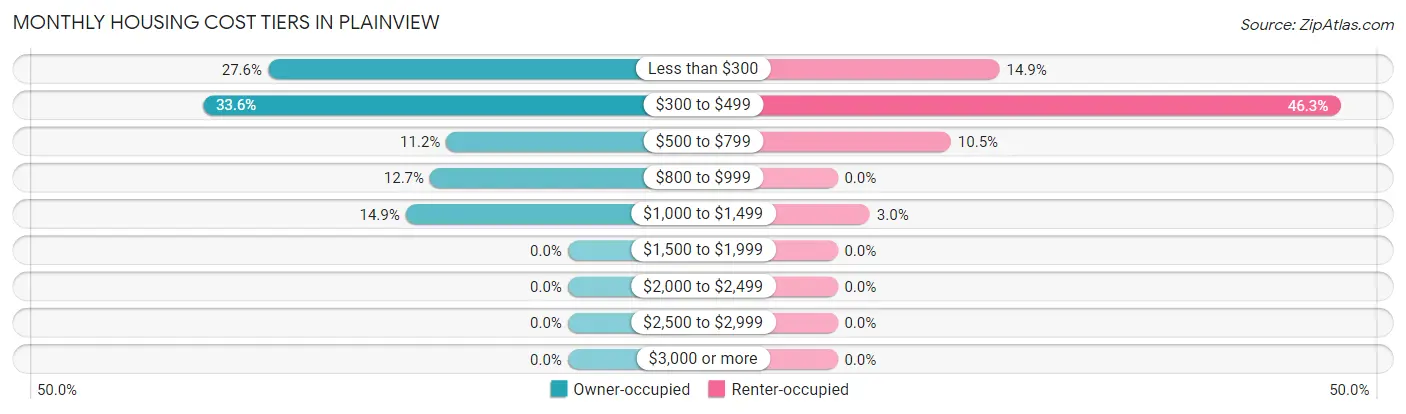
| Monthly Cost | Owner-occupied | Renter-occupied |
| Less than $300 | 37 (27.6%) | 10 (14.9%) |
| $300 to $499 | 45 (33.6%) | 31 (46.3%) |
| $500 to $799 | 15 (11.2%) | 7 (10.4%) |
| $800 to $999 | 17 (12.7%) | 0 (0.0%) |
| $1,000 to $1,499 | 20 (14.9%) | 2 (3.0%) |
| $1,500 to $1,999 | 0 (0.0%) | 0 (0.0%) |
| $2,000 to $2,499 | 0 (0.0%) | 0 (0.0%) |
| $2,500 to $2,999 | 0 (0.0%) | 0 (0.0%) |
| $3,000 or more | 0 (0.0%) | 0 (0.0%) |
| Total | 134 (100.0%) | 67 (100.0%) |
Physical Housing Characteristics in Plainview
Housing Structures in Plainview
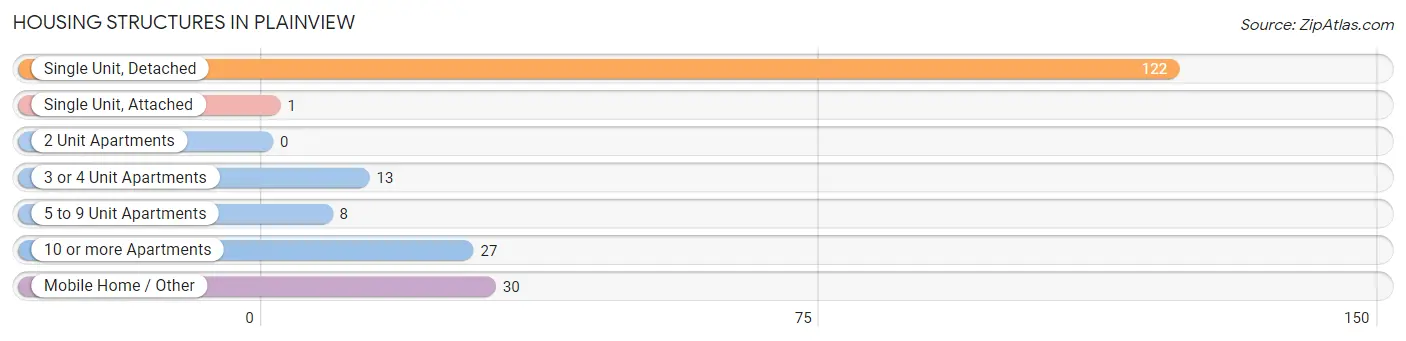
| Structure Type | # Housing Units | % Housing Units |
| Single Unit, Detached | 122 | 60.7% |
| Single Unit, Attached | 1 | 0.5% |
| 2 Unit Apartments | 0 | 0.0% |
| 3 or 4 Unit Apartments | 13 | 6.5% |
| 5 to 9 Unit Apartments | 8 | 4.0% |
| 10 or more Apartments | 27 | 13.4% |
| Mobile Home / Other | 30 | 14.9% |
| Total | 201 | 100.0% |
Housing Structures by Occupancy in Plainview
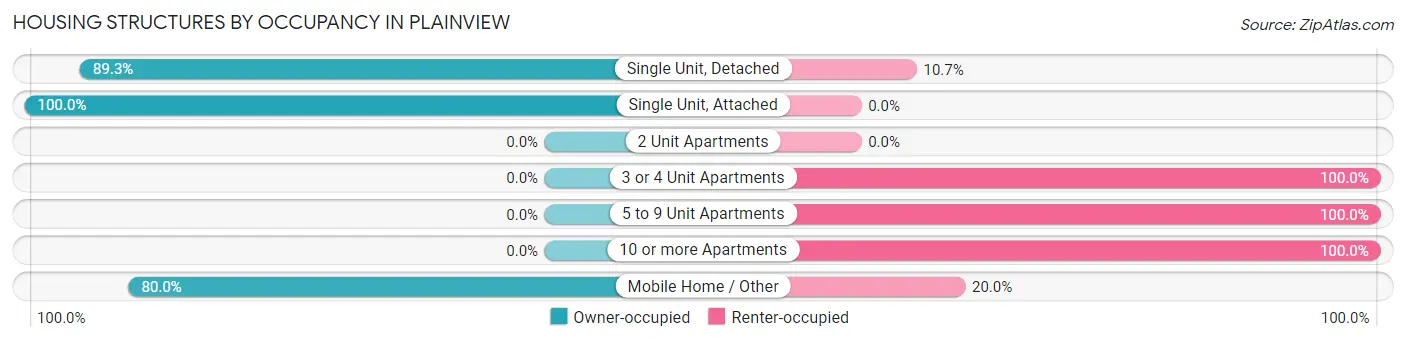
| Structure Type | Owner-occupied | Renter-occupied |
| Single Unit, Detached | 109 (89.3%) | 13 (10.7%) |
| Single Unit, Attached | 1 (100.0%) | 0 (0.0%) |
| 2 Unit Apartments | 0 (0.0%) | 0 (0.0%) |
| 3 or 4 Unit Apartments | 0 (0.0%) | 13 (100.0%) |
| 5 to 9 Unit Apartments | 0 (0.0%) | 8 (100.0%) |
| 10 or more Apartments | 0 (0.0%) | 27 (100.0%) |
| Mobile Home / Other | 24 (80.0%) | 6 (20.0%) |
| Total | 134 (66.7%) | 67 (33.3%) |
Housing Structures by Number of Rooms in Plainview
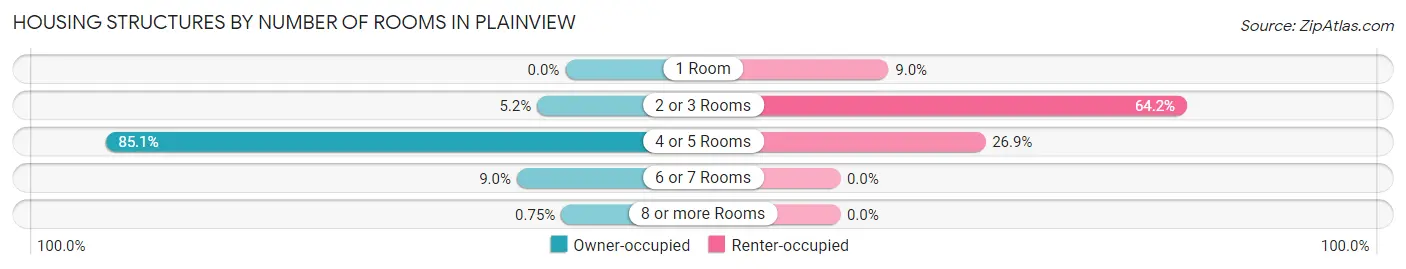
| Number of Rooms | Owner-occupied | Renter-occupied |
| 1 Room | 0 (0.0%) | 6 (9.0%) |
| 2 or 3 Rooms | 7 (5.2%) | 43 (64.2%) |
| 4 or 5 Rooms | 114 (85.1%) | 18 (26.9%) |
| 6 or 7 Rooms | 12 (9.0%) | 0 (0.0%) |
| 8 or more Rooms | 1 (0.7%) | 0 (0.0%) |
| Total | 134 (100.0%) | 67 (100.0%) |
Housing Structure by Heating Type in Plainview
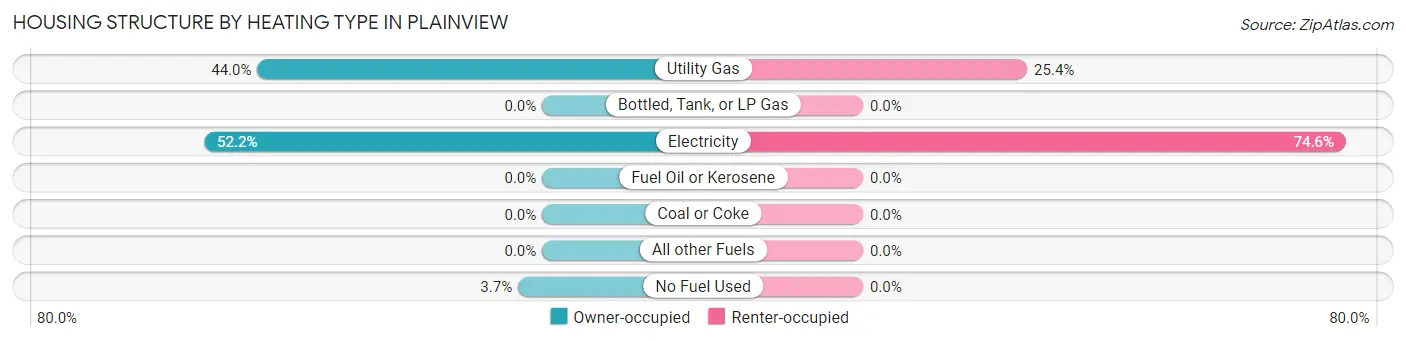
| Heating Type | Owner-occupied | Renter-occupied |
| Utility Gas | 59 (44.0%) | 17 (25.4%) |
| Bottled, Tank, or LP Gas | 0 (0.0%) | 0 (0.0%) |
| Electricity | 70 (52.2%) | 50 (74.6%) |
| Fuel Oil or Kerosene | 0 (0.0%) | 0 (0.0%) |
| Coal or Coke | 0 (0.0%) | 0 (0.0%) |
| All other Fuels | 0 (0.0%) | 0 (0.0%) |
| No Fuel Used | 5 (3.7%) | 0 (0.0%) |
| Total | 134 (100.0%) | 67 (100.0%) |
Household Vehicle Usage in Plainview
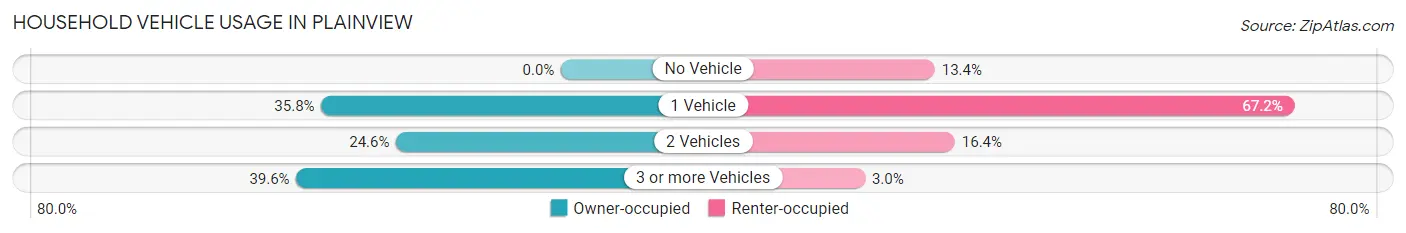
| Vehicles per Household | Owner-occupied | Renter-occupied |
| No Vehicle | 0 (0.0%) | 9 (13.4%) |
| 1 Vehicle | 48 (35.8%) | 45 (67.2%) |
| 2 Vehicles | 33 (24.6%) | 11 (16.4%) |
| 3 or more Vehicles | 53 (39.6%) | 2 (3.0%) |
| Total | 134 (100.0%) | 67 (100.0%) |
Real Estate & Mortgages in Plainview
Real Estate and Mortgage Overview in Plainview
| Characteristic | Without Mortgage | With Mortgage |
| Housing Units | 75 | 59 |
| Median Property Value | $101,800 | $108,000 |
| Median Household Income | $43,750 | $0 |
| Monthly Housing Costs | $303 | $0 |
| Real Estate Taxes | $312 | $6 |
Property Value by Mortgage Status in Plainview
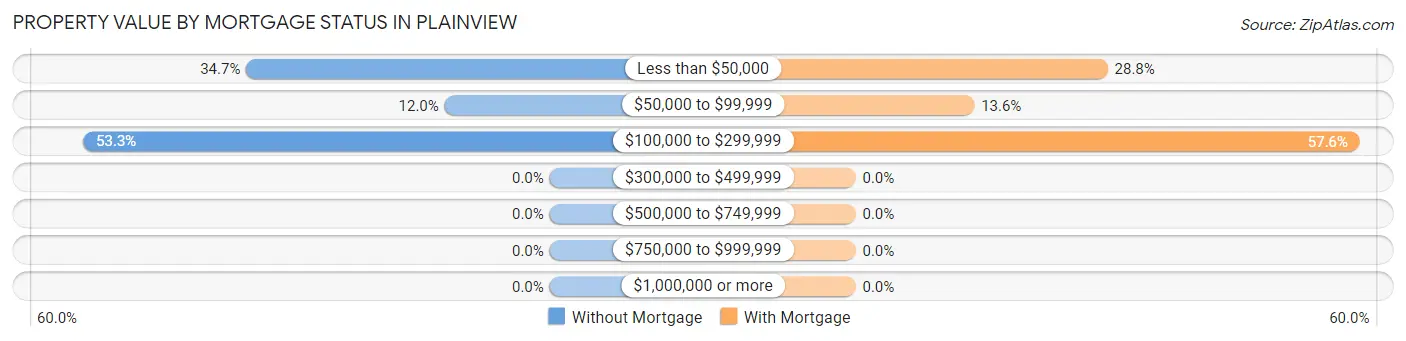
| Property Value | Without Mortgage | With Mortgage |
| Less than $50,000 | 26 (34.7%) | 17 (28.8%) |
| $50,000 to $99,999 | 9 (12.0%) | 8 (13.6%) |
| $100,000 to $299,999 | 40 (53.3%) | 34 (57.6%) |
| $300,000 to $499,999 | 0 (0.0%) | 0 (0.0%) |
| $500,000 to $749,999 | 0 (0.0%) | 0 (0.0%) |
| $750,000 to $999,999 | 0 (0.0%) | 0 (0.0%) |
| $1,000,000 or more | 0 (0.0%) | 0 (0.0%) |
| Total | 75 (100.0%) | 59 (100.0%) |
Household Income by Mortgage Status in Plainview
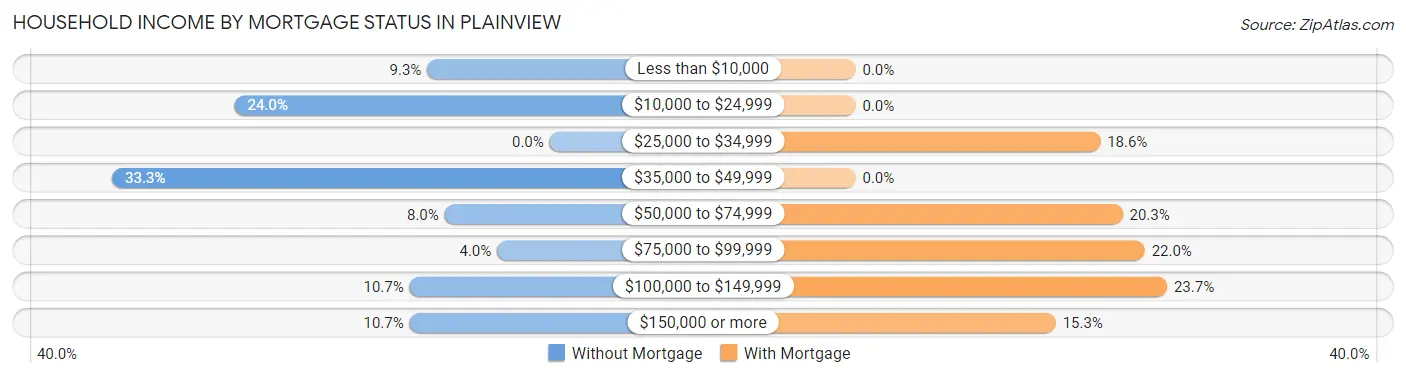
| Household Income | Without Mortgage | With Mortgage |
| Less than $10,000 | 7 (9.3%) | 0 (0.0%) |
| $10,000 to $24,999 | 18 (24.0%) | 0 (0.0%) |
| $25,000 to $34,999 | 0 (0.0%) | 11 (18.6%) |
| $35,000 to $49,999 | 25 (33.3%) | 0 (0.0%) |
| $50,000 to $74,999 | 6 (8.0%) | 12 (20.3%) |
| $75,000 to $99,999 | 3 (4.0%) | 13 (22.0%) |
| $100,000 to $149,999 | 8 (10.7%) | 14 (23.7%) |
| $150,000 or more | 8 (10.7%) | 9 (15.2%) |
| Total | 75 (100.0%) | 59 (100.0%) |
Property Value to Household Income Ratio in Plainview
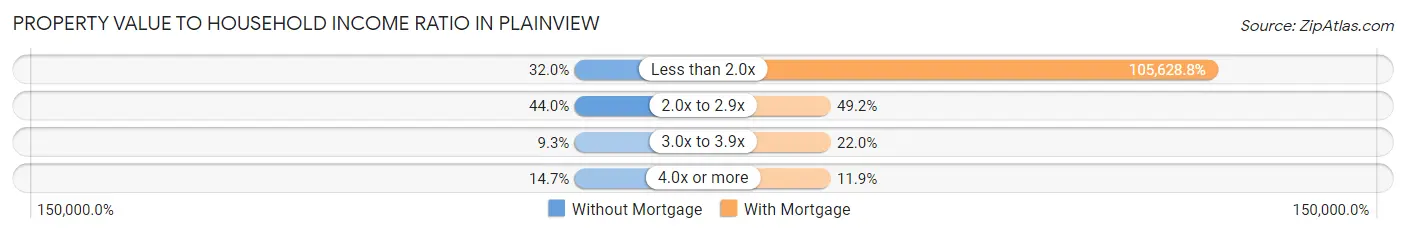
| Value-to-Income Ratio | Without Mortgage | With Mortgage |
| Less than 2.0x | 24 (32.0%) | 62,321 (105,628.8%) |
| 2.0x to 2.9x | 33 (44.0%) | 29 (49.1%) |
| 3.0x to 3.9x | 7 (9.3%) | 13 (22.0%) |
| 4.0x or more | 11 (14.7%) | 7 (11.9%) |
| Total | 75 (100.0%) | 59 (100.0%) |
Real Estate Taxes by Mortgage Status in Plainview
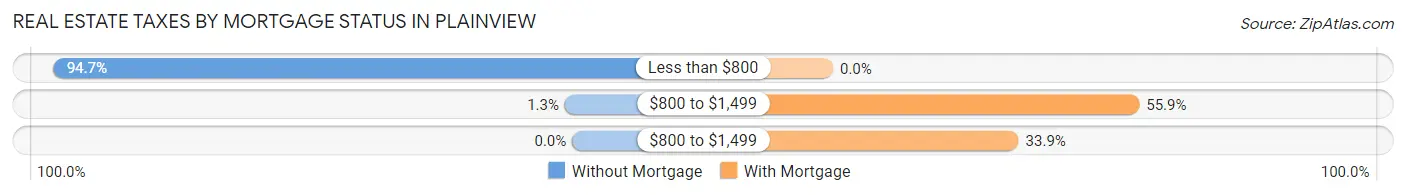
| Property Taxes | Without Mortgage | With Mortgage |
| Less than $800 | 71 (94.7%) | 0 (0.0%) |
| $800 to $1,499 | 1 (1.3%) | 33 (55.9%) |
| $800 to $1,499 | 0 (0.0%) | 20 (33.9%) |
| Total | 75 (100.0%) | 59 (100.0%) |
Health & Disability in Plainview
Health Insurance Coverage by Age in Plainview
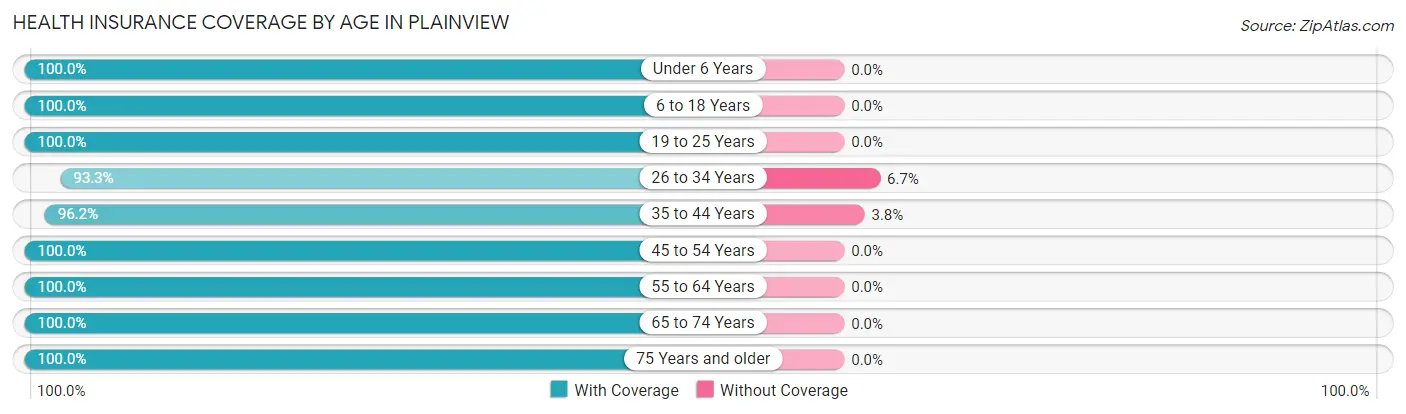
| Age Bracket | With Coverage | Without Coverage |
| Under 6 Years | 34 (100.0%) | 0 (0.0%) |
| 6 to 18 Years | 37 (100.0%) | 0 (0.0%) |
| 19 to 25 Years | 53 (100.0%) | 0 (0.0%) |
| 26 to 34 Years | 28 (93.3%) | 2 (6.7%) |
| 35 to 44 Years | 51 (96.2%) | 2 (3.8%) |
| 45 to 54 Years | 75 (100.0%) | 0 (0.0%) |
| 55 to 64 Years | 88 (100.0%) | 0 (0.0%) |
| 65 to 74 Years | 36 (100.0%) | 0 (0.0%) |
| 75 Years and older | 44 (100.0%) | 0 (0.0%) |
| Total | 446 (99.1%) | 4 (0.9%) |
Health Insurance Coverage by Citizenship Status in Plainview
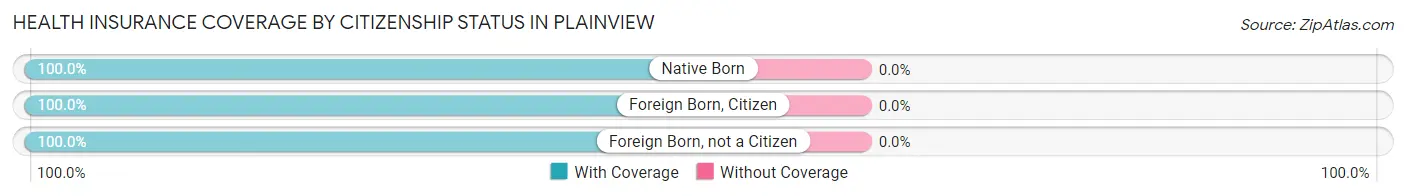
| Citizenship Status | With Coverage | Without Coverage |
| Native Born | 34 (100.0%) | 0 (0.0%) |
| Foreign Born, Citizen | 37 (100.0%) | 0 (0.0%) |
| Foreign Born, not a Citizen | 53 (100.0%) | 0 (0.0%) |
Health Insurance Coverage by Household Income in Plainview
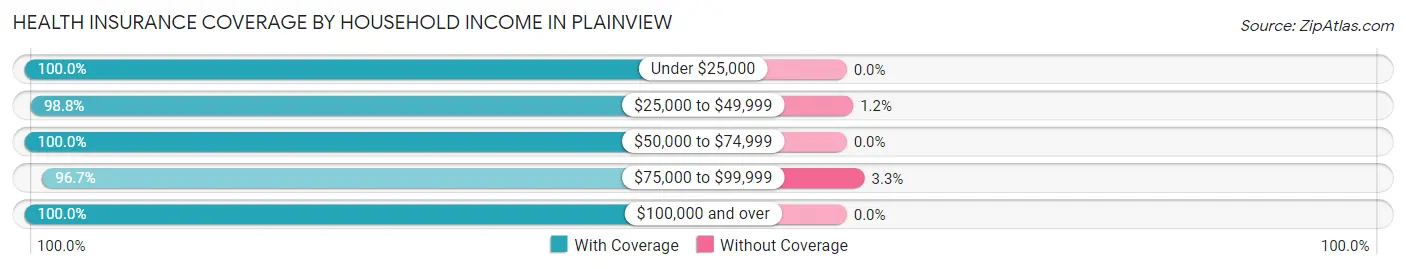
| Household Income | With Coverage | Without Coverage |
| Under $25,000 | 68 (100.0%) | 0 (0.0%) |
| $25,000 to $49,999 | 165 (98.8%) | 2 (1.2%) |
| $50,000 to $74,999 | 64 (100.0%) | 0 (0.0%) |
| $75,000 to $99,999 | 58 (96.7%) | 2 (3.3%) |
| $100,000 and over | 86 (100.0%) | 0 (0.0%) |
Public vs Private Health Insurance Coverage by Age in Plainview
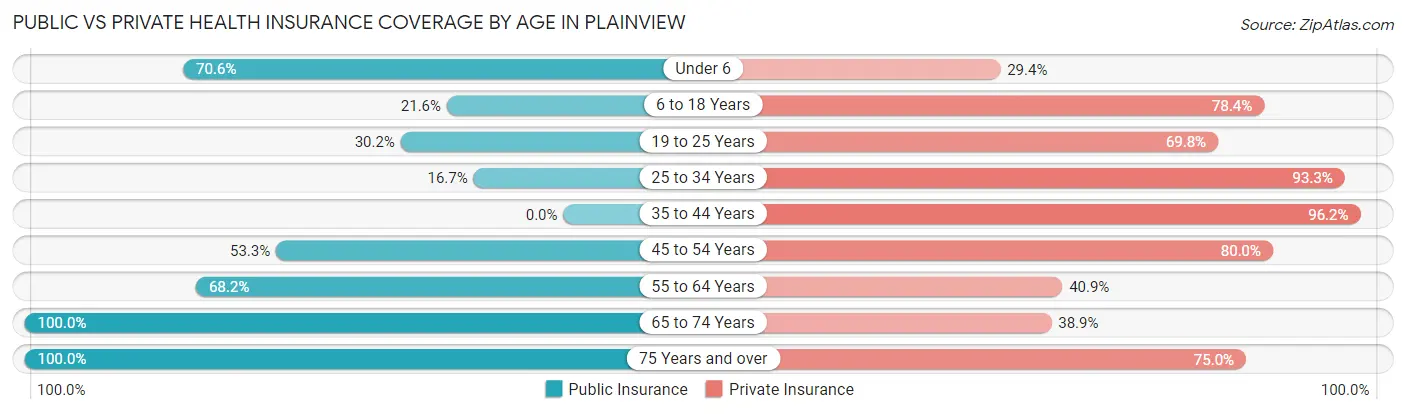
| Age Bracket | Public Insurance | Private Insurance |
| Under 6 | 24 (70.6%) | 10 (29.4%) |
| 6 to 18 Years | 8 (21.6%) | 29 (78.4%) |
| 19 to 25 Years | 16 (30.2%) | 37 (69.8%) |
| 25 to 34 Years | 5 (16.7%) | 28 (93.3%) |
| 35 to 44 Years | 0 (0.0%) | 51 (96.2%) |
| 45 to 54 Years | 40 (53.3%) | 60 (80.0%) |
| 55 to 64 Years | 60 (68.2%) | 36 (40.9%) |
| 65 to 74 Years | 36 (100.0%) | 14 (38.9%) |
| 75 Years and over | 44 (100.0%) | 33 (75.0%) |
| Total | 233 (51.8%) | 298 (66.2%) |
Disability Status by Sex by Age in Plainview
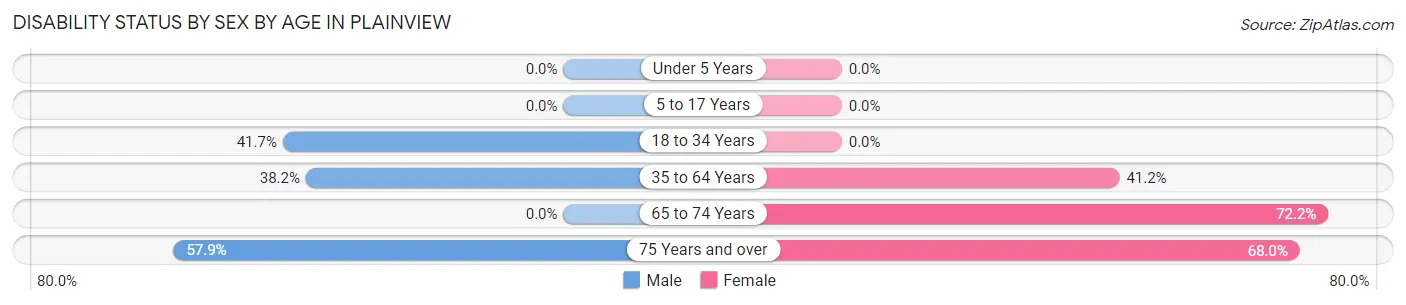
| Age Bracket | Male | Female |
| Under 5 Years | 0 (0.0%) | 0 (0.0%) |
| 5 to 17 Years | 0 (0.0%) | 0 (0.0%) |
| 18 to 34 Years | 15 (41.7%) | 0 (0.0%) |
| 35 to 64 Years | 39 (38.2%) | 47 (41.2%) |
| 65 to 74 Years | 0 (0.0%) | 13 (72.2%) |
| 75 Years and over | 11 (57.9%) | 17 (68.0%) |
Disability Class by Sex by Age in Plainview
Disability Class: Hearing Difficulty
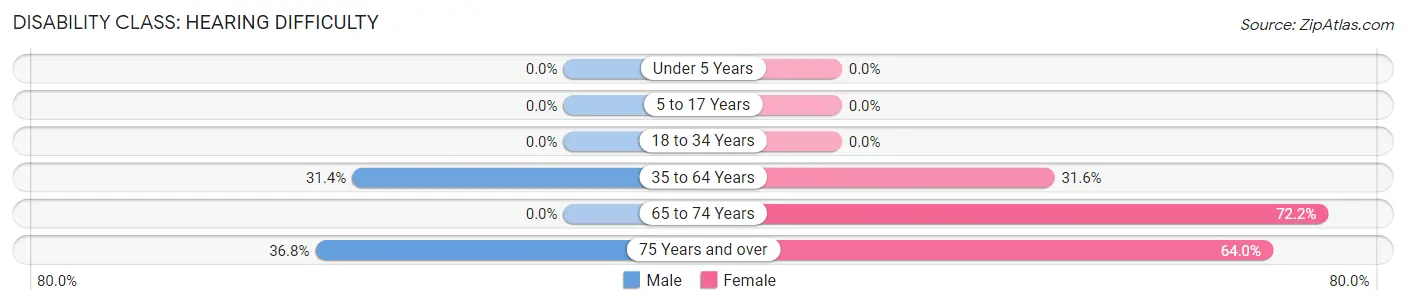
| Age Bracket | Male | Female |
| Under 5 Years | 0 (0.0%) | 0 (0.0%) |
| 5 to 17 Years | 0 (0.0%) | 0 (0.0%) |
| 18 to 34 Years | 0 (0.0%) | 0 (0.0%) |
| 35 to 64 Years | 32 (31.4%) | 36 (31.6%) |
| 65 to 74 Years | 0 (0.0%) | 13 (72.2%) |
| 75 Years and over | 7 (36.8%) | 16 (64.0%) |
Disability Class: Vision Difficulty
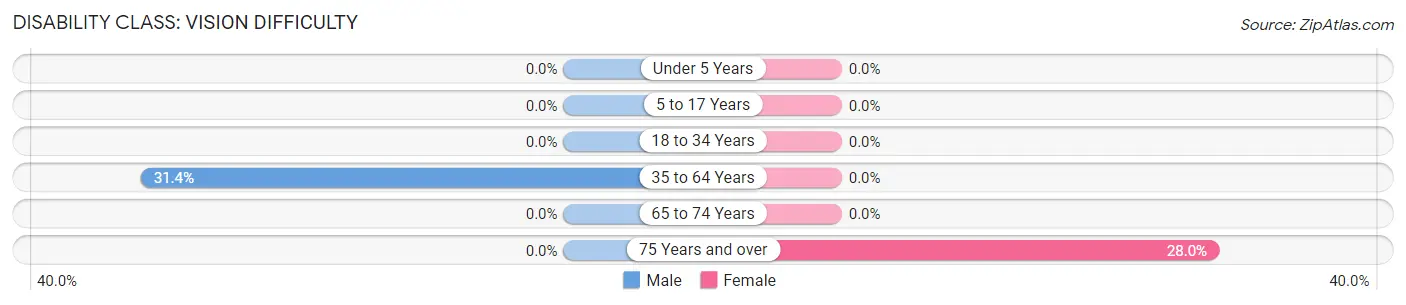
| Age Bracket | Male | Female |
| Under 5 Years | 0 (0.0%) | 0 (0.0%) |
| 5 to 17 Years | 0 (0.0%) | 0 (0.0%) |
| 18 to 34 Years | 0 (0.0%) | 0 (0.0%) |
| 35 to 64 Years | 32 (31.4%) | 0 (0.0%) |
| 65 to 74 Years | 0 (0.0%) | 0 (0.0%) |
| 75 Years and over | 0 (0.0%) | 7 (28.0%) |
Disability Class: Cognitive Difficulty
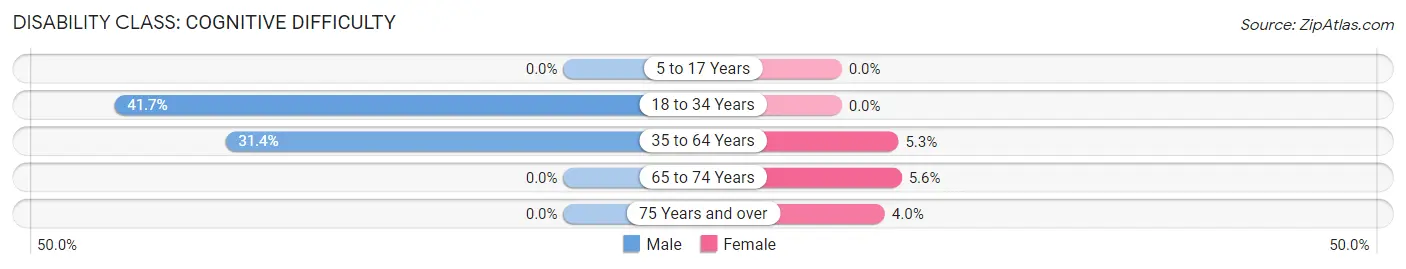
| Age Bracket | Male | Female |
| 5 to 17 Years | 0 (0.0%) | 0 (0.0%) |
| 18 to 34 Years | 15 (41.7%) | 0 (0.0%) |
| 35 to 64 Years | 32 (31.4%) | 6 (5.3%) |
| 65 to 74 Years | 0 (0.0%) | 1 (5.6%) |
| 75 Years and over | 0 (0.0%) | 1 (4.0%) |
Disability Class: Ambulatory Difficulty
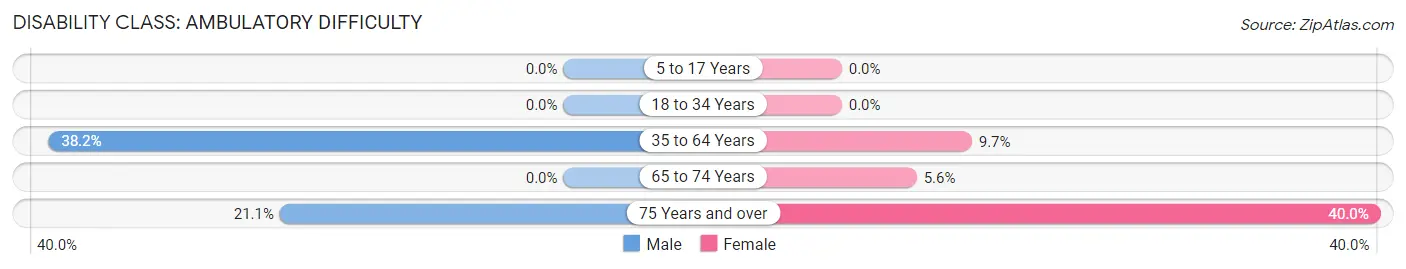
| Age Bracket | Male | Female |
| 5 to 17 Years | 0 (0.0%) | 0 (0.0%) |
| 18 to 34 Years | 0 (0.0%) | 0 (0.0%) |
| 35 to 64 Years | 39 (38.2%) | 11 (9.7%) |
| 65 to 74 Years | 0 (0.0%) | 1 (5.6%) |
| 75 Years and over | 4 (21.0%) | 10 (40.0%) |
Disability Class: Self-Care Difficulty
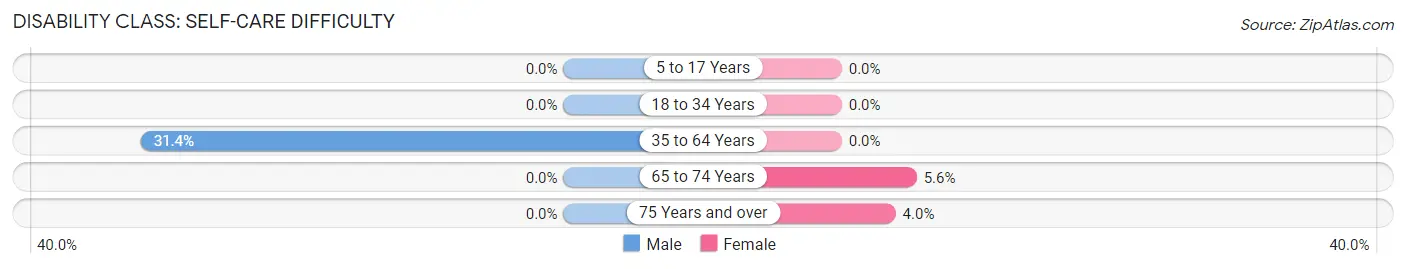
| Age Bracket | Male | Female |
| 5 to 17 Years | 0 (0.0%) | 0 (0.0%) |
| 18 to 34 Years | 0 (0.0%) | 0 (0.0%) |
| 35 to 64 Years | 32 (31.4%) | 0 (0.0%) |
| 65 to 74 Years | 0 (0.0%) | 1 (5.6%) |
| 75 Years and over | 0 (0.0%) | 1 (4.0%) |
Technology Access in Plainview
Computing Device Access in Plainview
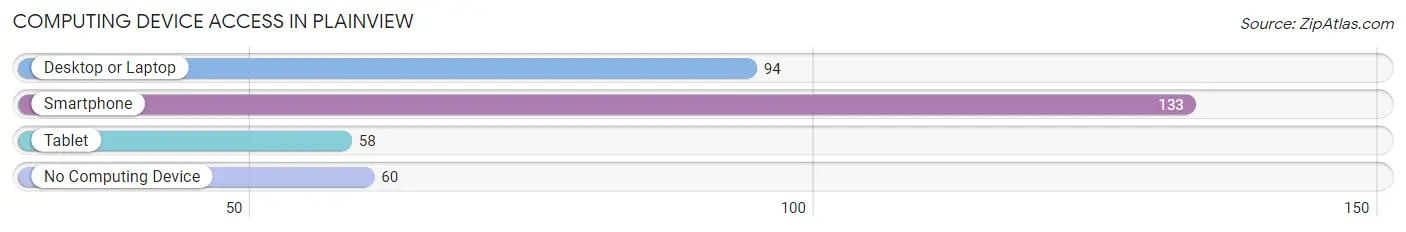
| Device Type | # Households | % Households |
| Desktop or Laptop | 94 | 46.8% |
| Smartphone | 133 | 66.2% |
| Tablet | 58 | 28.9% |
| No Computing Device | 60 | 29.8% |
| Total | 201 | 100.0% |
Internet Access in Plainview
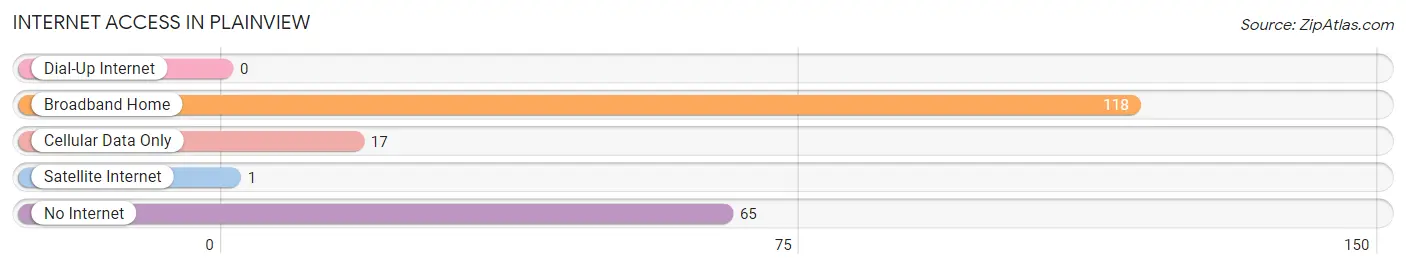
| Internet Type | # Households | % Households |
| Dial-Up Internet | 0 | 0.0% |
| Broadband Home | 118 | 58.7% |
| Cellular Data Only | 17 | 8.5% |
| Satellite Internet | 1 | 0.5% |
| No Internet | 65 | 32.3% |
| Total | 201 | 100.0% |
Plainview Summary
Plainview is a small town located in the northwest corner of Arkansas, in the foothills of the Ozark Mountains. It is situated in the Arkansas River Valley, and is part of the Fort Smith metropolitan area. The town has a population of approximately 1,000 people, and is known for its rural charm and friendly atmosphere.
History
The area that is now Plainview was first settled in the early 1800s by settlers from the nearby town of Van Buren. The town was originally known as “Plainview” due to its flat terrain and open fields. The town was officially incorporated in 1883, and the first post office was established in 1884.
In the late 1800s, the town began to grow and prosper due to the arrival of the railroad. The railroad brought new businesses and industries to the area, and the town quickly became a hub for commerce and transportation.
In the early 1900s, the town experienced a period of growth and development. The population increased, and new businesses and industries were established. The town also became a popular tourist destination, as it was located near the Ozark Mountains and the Arkansas River.
Geography
Plainview is located in the northwest corner of Arkansas, in the foothills of the Ozark Mountains. The town is situated in the Arkansas River Valley, and is part of the Fort Smith metropolitan area. The town is located approximately 30 miles south of Fayetteville, and is approximately 60 miles north of Little Rock.
The town is situated on a flat plain, and is surrounded by rolling hills and forests. The town is located at an elevation of approximately 1,000 feet above sea level. The climate in the area is mild, with hot summers and cold winters.
Economy
The economy of Plainview is largely based on agriculture and tourism. The town is home to several farms and ranches, and the surrounding area is known for its fertile soil and abundant wildlife. The town is also a popular tourist destination, as it is located near the Ozark Mountains and the Arkansas River.
The town is home to several small businesses, including restaurants, shops, and other services. The town is also home to a small manufacturing plant, which produces a variety of products.
Demographics
As of the 2010 census, the population of Plainview was 1,000 people. The racial makeup of the town was 97.2% White, 0.7% African American, 0.3% Native American, 0.2% Asian, and 1.6% from other races. The median household income was $35,000, and the median age was 40 years.
Conclusion
Plainview is a small town located in the northwest corner of Arkansas, in the foothills of the Ozark Mountains. The town has a population of approximately 1,000 people, and is known for its rural charm and friendly atmosphere. The economy of the town is largely based on agriculture and tourism, and the town is home to several small businesses. The racial makeup of the town is predominantly White, with a small percentage of African American, Native American, and Asian residents.
Common Questions
What is Per Capita Income in Plainview?
Per Capita income in Plainview is $25,079.
What is the Median Household income in Plainview?
Median Household Income in Plainview is $42,550.
What is Income or Wage Gap in Plainview?
Income or Wage Gap in Plainview is 44.3%.
Women in Plainview earn 55.7 cents for every dollar earned by a man.
What is Inequality or Gini Index in Plainview?
Inequality or Gini Index in Plainview is 0.41.
What is the Total Population of Plainview?
Total Population of Plainview is 450.
What is the Total Male Population of Plainview?
Total Male Population of Plainview is 198.
What is the Total Female Population of Plainview?
Total Female Population of Plainview is 252.
What is the Ratio of Males per 100 Females in Plainview?
There are 78.57 Males per 100 Females in Plainview.
What is the Ratio of Females per 100 Males in Plainview?
There are 127.27 Females per 100 Males in Plainview.
What is the Median Population Age in Plainview?
Median Population Age in Plainview is 46.7 Years.
What is the Average Family Size in Plainview
Average Family Size in Plainview is 3.3 People.
What is the Average Household Size in Plainview
Average Household Size in Plainview is 2.2 People.
How Large is the Labor Force in Plainview?
There are 183 People in the Labor Forcein in Plainview.
What is the Percentage of People in the Labor Force in Plainview?
45.5% of People are in the Labor Force in Plainview.