Paris, AR Map & Demographics
Paris Map
Paris Overview
$33,737
PER CAPITA INCOME
$56,189
AVG FAMILY INCOME
$45,505
AVG HOUSEHOLD INCOME
62.5%
WAGE / INCOME GAP [ % ]
37.5¢/ $1
WAGE / INCOME GAP [ $ ]
0.56
INEQUALITY / GINI INDEX
3,214
TOTAL POPULATION
1,489
MALE POPULATION
1,725
FEMALE POPULATION
86.32
MALES / 100 FEMALES
115.85
FEMALES / 100 MALES
45.1
MEDIAN AGE
2.8
AVG FAMILY SIZE
2.0
AVG HOUSEHOLD SIZE
1,637
LABOR FORCE [ PEOPLE ]
60.5%
PERCENT IN LABOR FORCE
7.6%
UNEMPLOYMENT RATE
Paris Zip Codes
Paris Area Codes
Income in Paris
Income Overview in Paris
Per Capita Income in Paris is $33,737, while median incomes of families and households are $56,189 and $45,505 respectively.
| Characteristic | Number | Measure |
| Per Capita Income | 3,214 | $33,737 |
| Median Family Income | 773 | $56,189 |
| Mean Family Income | 773 | $66,919 |
| Median Household Income | 1,525 | $45,505 |
| Mean Household Income | 1,525 | $69,918 |
| Income Deficit | 773 | $0 |
| Wage / Income Gap (%) | 3,214 | 62.46% |
| Wage / Income Gap ($) | 3,214 | 37.54¢ per $1 |
| Gini / Inequality Index | 3,214 | 0.56 |
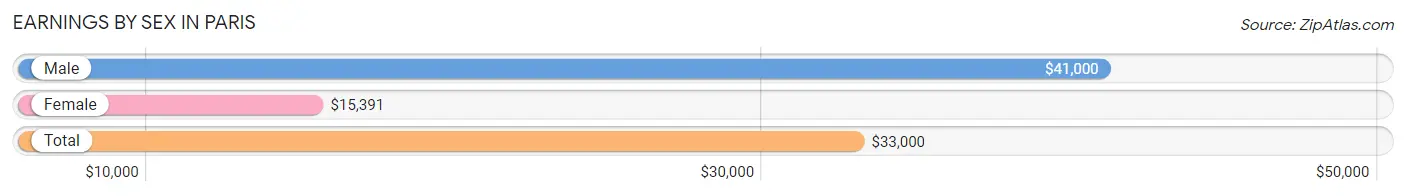
Earnings by Sex in Paris
Average Earnings in Paris are $33,000, $41,000 for men and $15,391 for women, a difference of 62.5%.
| Sex | Number | Average Earnings |
| Male | 920 (55.6%) | $41,000 |
| Female | 734 (44.4%) | $15,391 |
| Total | 1,654 (100.0%) | $33,000 |
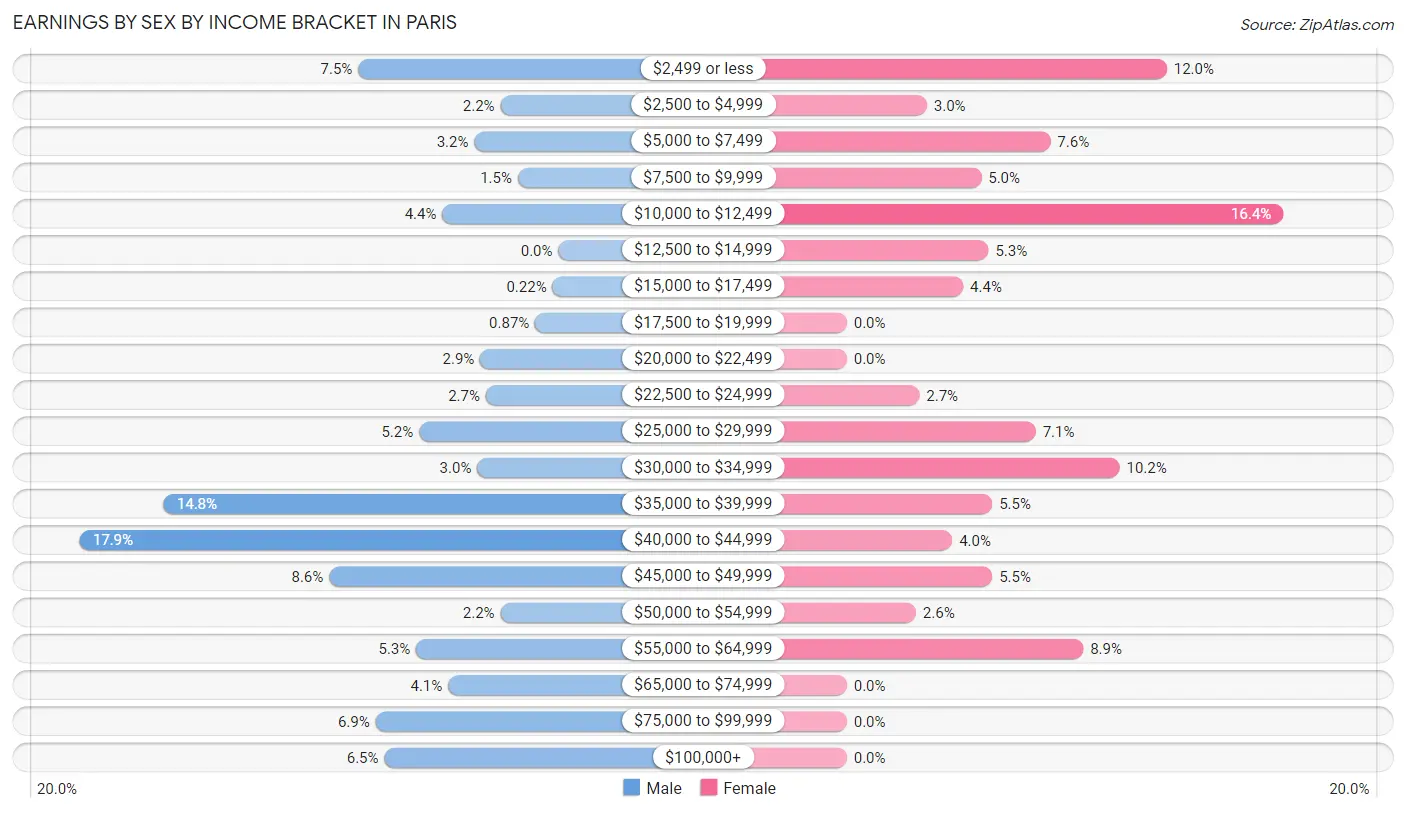
Earnings by Sex by Income Bracket in Paris
The most common earnings brackets in Paris are $40,000 to $44,999 for men (165 | 17.9%) and $10,000 to $12,499 for women (120 | 16.4%).
| Income | Male | Female |
| $2,499 or less | 69 (7.5%) | 88 (12.0%) |
| $2,500 to $4,999 | 20 (2.2%) | 22 (3.0%) |
| $5,000 to $7,499 | 29 (3.2%) | 56 (7.6%) |
| $7,500 to $9,999 | 14 (1.5%) | 37 (5.0%) |
| $10,000 to $12,499 | 40 (4.3%) | 120 (16.4%) |
| $12,500 to $14,999 | 0 (0.0%) | 39 (5.3%) |
| $15,000 to $17,499 | 2 (0.2%) | 32 (4.4%) |
| $17,500 to $19,999 | 8 (0.9%) | 0 (0.0%) |
| $20,000 to $22,499 | 27 (2.9%) | 0 (0.0%) |
| $22,500 to $24,999 | 25 (2.7%) | 20 (2.7%) |
| $25,000 to $29,999 | 48 (5.2%) | 52 (7.1%) |
| $30,000 to $34,999 | 28 (3.0%) | 75 (10.2%) |
| $35,000 to $39,999 | 136 (14.8%) | 40 (5.4%) |
| $40,000 to $44,999 | 165 (17.9%) | 29 (4.0%) |
| $45,000 to $49,999 | 79 (8.6%) | 40 (5.4%) |
| $50,000 to $54,999 | 20 (2.2%) | 19 (2.6%) |
| $55,000 to $64,999 | 49 (5.3%) | 65 (8.9%) |
| $65,000 to $74,999 | 38 (4.1%) | 0 (0.0%) |
| $75,000 to $99,999 | 63 (6.9%) | 0 (0.0%) |
| $100,000+ | 60 (6.5%) | 0 (0.0%) |
| Total | 920 (100.0%) | 734 (100.0%) |
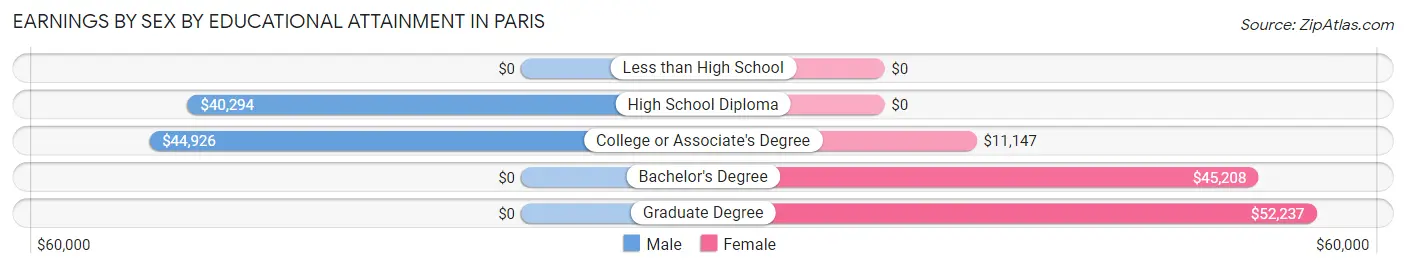
Earnings by Sex by Educational Attainment in Paris
| Educational Attainment | Male Income | Female Income |
| Less than High School | - | - |
| High School Diploma | $40,294 | $0 |
| College or Associate's Degree | $44,926 | $11,147 |
| Bachelor's Degree | - | - |
| Graduate Degree | - | - |
| Total | $42,810 | $0 |
Family Income in Paris
Family Income Brackets in Paris
According to the Paris family income data, there are 219 families falling into the $50,000 to $74,999 income range, which is the most common income bracket and makes up 28.3% of all families.
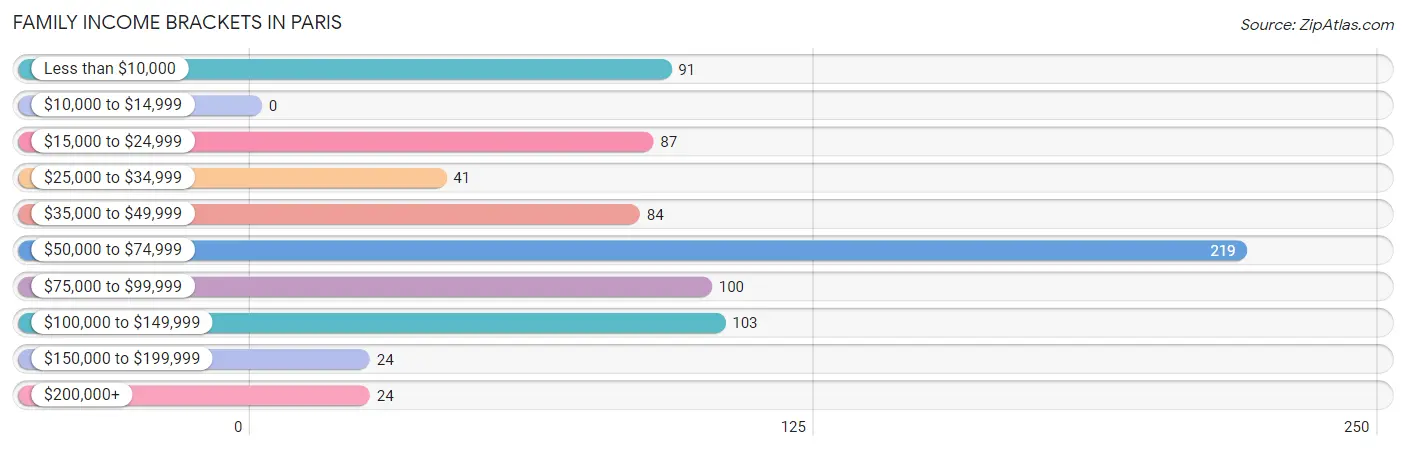
| Income Bracket | # Families | % Families |
| Less than $10,000 | 91 | 11.8% |
| $10,000 to $14,999 | 0 | 0.0% |
| $15,000 to $24,999 | 87 | 11.3% |
| $25,000 to $34,999 | 41 | 5.3% |
| $35,000 to $49,999 | 84 | 10.9% |
| $50,000 to $74,999 | 219 | 28.3% |
| $75,000 to $99,999 | 100 | 12.9% |
| $100,000 to $149,999 | 103 | 13.3% |
| $150,000 to $199,999 | 24 | 3.1% |
| $200,000+ | 24 | 3.1% |
Family Income by Famaliy Size in Paris
5-person families (40 | 5.2%) account for the highest median family income in Paris with $92,941 per family, while 2-person families (289 | 37.4%) have the highest median income of $33,924 per family member.
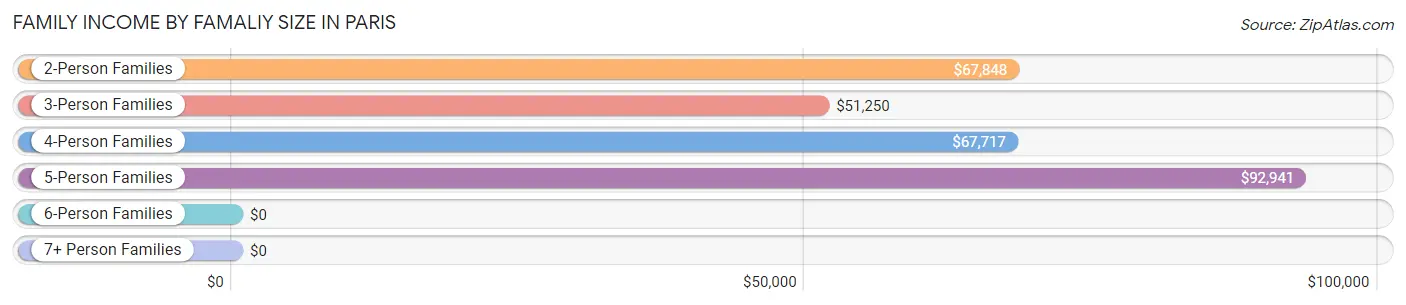
| Income Bracket | # Families | Median Income |
| 2-Person Families | 289 (37.4%) | $67,848 |
| 3-Person Families | 318 (41.1%) | $51,250 |
| 4-Person Families | 120 (15.5%) | $67,717 |
| 5-Person Families | 40 (5.2%) | $92,941 |
| 6-Person Families | 5 (0.6%) | $0 |
| 7+ Person Families | 1 (0.1%) | $0 |
| Total | 773 (100.0%) | $56,189 |
Family Income by Number of Earners in Paris
The median family income in Paris is $56,189, with families comprising 3+ earners (44) having the highest median family income of $69,891, while families with no earners (88) have the lowest median family income of $22,143, accounting for 5.7% and 11.4% of families, respectively.
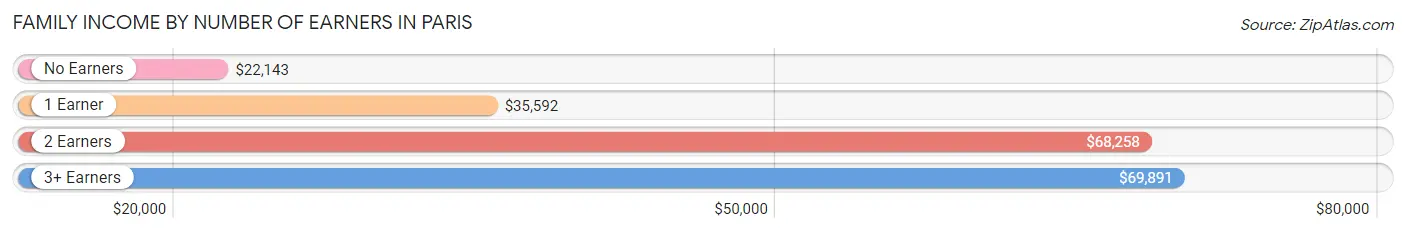
| Number of Earners | # Families | Median Income |
| No Earners | 88 (11.4%) | $22,143 |
| 1 Earner | 295 (38.2%) | $35,592 |
| 2 Earners | 346 (44.8%) | $68,258 |
| 3+ Earners | 44 (5.7%) | $69,891 |
| Total | 773 (100.0%) | $56,189 |
Household Income in Paris
Household Income Brackets in Paris
With 342 households falling in the category, the $35,000 to $49,999 income range is the most frequent in Paris, accounting for 22.4% of all households. In contrast, only 24 households (1.6%) fall into the $150,000 to $199,999 income bracket, making it the least populous group.
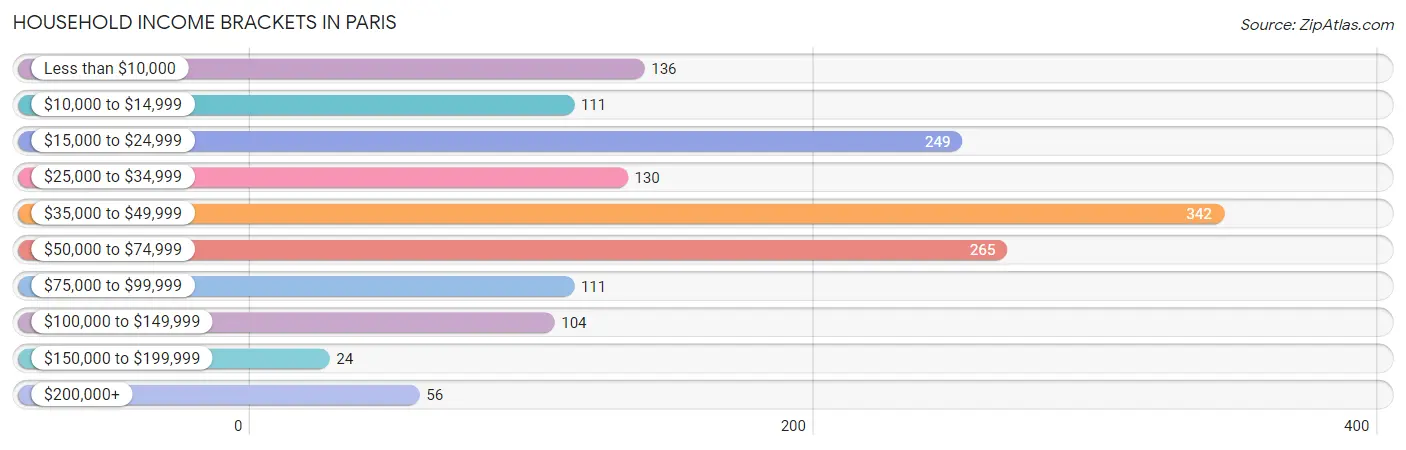
| Income Bracket | # Households | % Households |
| Less than $10,000 | 136 | 8.9% |
| $10,000 to $14,999 | 111 | 7.3% |
| $15,000 to $24,999 | 249 | 16.3% |
| $25,000 to $34,999 | 130 | 8.5% |
| $35,000 to $49,999 | 342 | 22.4% |
| $50,000 to $74,999 | 265 | 17.4% |
| $75,000 to $99,999 | 111 | 7.3% |
| $100,000 to $149,999 | 104 | 6.8% |
| $150,000 to $199,999 | 24 | 1.6% |
| $200,000+ | 56 | 3.7% |
Household Income by Householder Age in Paris
The median household income in Paris is $45,505, with the highest median household income of $48,672 found in the 15 to 24 years age bracket for the primary householder. A total of 60 households (3.9%) fall into this category. Meanwhile, the 65+ years age bracket for the primary householder has the lowest median household income of $22,961, with 463 households (30.4%) in this group.
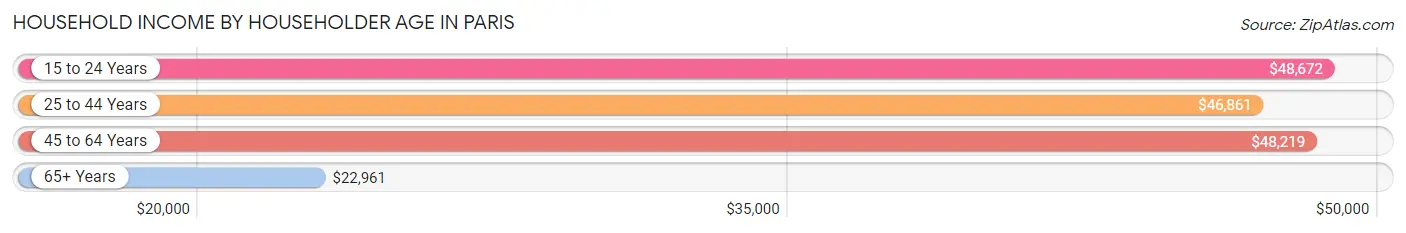
| Income Bracket | # Households | Median Income |
| 15 to 24 Years | 60 (3.9%) | $48,672 |
| 25 to 44 Years | 429 (28.1%) | $46,861 |
| 45 to 64 Years | 573 (37.6%) | $48,219 |
| 65+ Years | 463 (30.4%) | $22,961 |
| Total | 1,525 (100.0%) | $45,505 |
Poverty in Paris
Income Below Poverty by Sex and Age in Paris
With 17.4% poverty level for males and 25.6% for females among the residents of Paris, under 5 year old males and 5 year old females are the most vulnerable to poverty, with 25 males (30.5%) and 30 females (100.0%) in their respective age groups living below the poverty level.
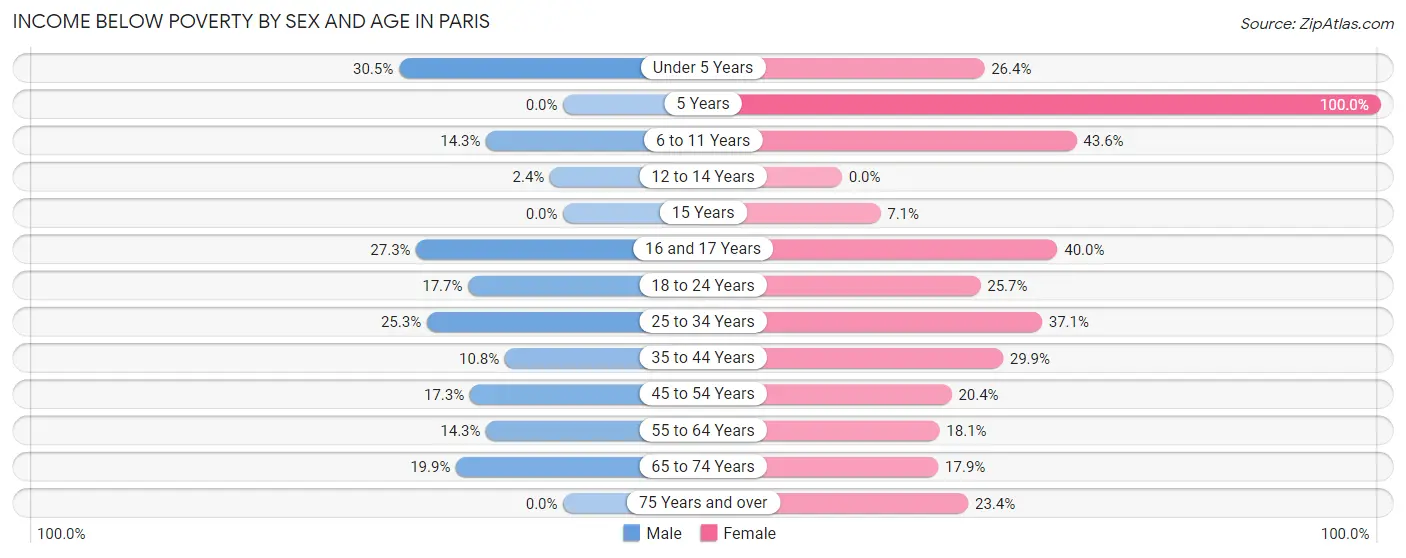
| Age Bracket | Male | Female |
| Under 5 Years | 25 (30.5%) | 23 (26.4%) |
| 5 Years | 0 (0.0%) | 30 (100.0%) |
| 6 to 11 Years | 10 (14.3%) | 27 (43.5%) |
| 12 to 14 Years | 1 (2.4%) | 0 (0.0%) |
| 15 Years | 0 (0.0%) | 1 (7.1%) |
| 16 and 17 Years | 9 (27.3%) | 12 (40.0%) |
| 18 to 24 Years | 15 (17.6%) | 18 (25.7%) |
| 25 to 34 Years | 62 (25.3%) | 101 (37.1%) |
| 35 to 44 Years | 16 (10.8%) | 52 (29.9%) |
| 45 to 54 Years | 40 (17.3%) | 47 (20.3%) |
| 55 to 64 Years | 38 (14.3%) | 25 (18.1%) |
| 65 to 74 Years | 33 (19.9%) | 39 (17.9%) |
| 75 Years and over | 0 (0.0%) | 45 (23.4%) |
| Total | 249 (17.4%) | 420 (25.6%) |
Income Above Poverty by Sex and Age in Paris
According to the poverty statistics in Paris, males aged 75 years and over and females aged 12 to 14 years are the age groups that are most secure financially, with 100.0% of males and 100.0% of females in these age groups living above the poverty line.
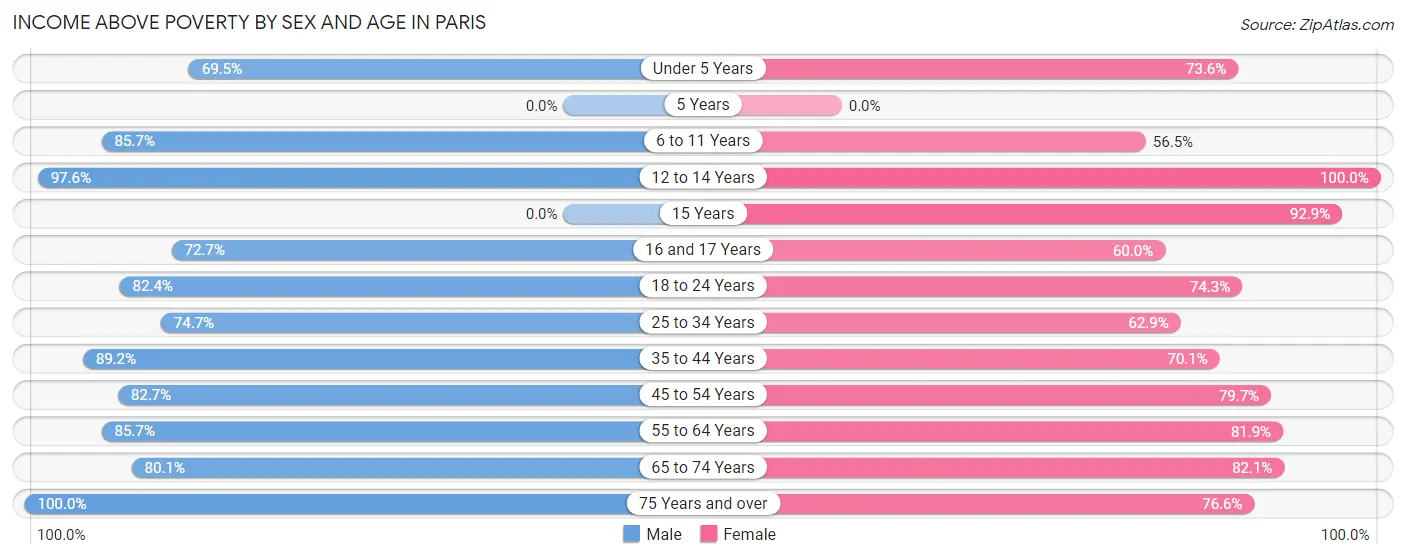
| Age Bracket | Male | Female |
| Under 5 Years | 57 (69.5%) | 64 (73.6%) |
| 5 Years | 0 (0.0%) | 0 (0.0%) |
| 6 to 11 Years | 60 (85.7%) | 35 (56.5%) |
| 12 to 14 Years | 40 (97.6%) | 122 (100.0%) |
| 15 Years | 0 (0.0%) | 13 (92.9%) |
| 16 and 17 Years | 24 (72.7%) | 18 (60.0%) |
| 18 to 24 Years | 70 (82.4%) | 52 (74.3%) |
| 25 to 34 Years | 183 (74.7%) | 171 (62.9%) |
| 35 to 44 Years | 132 (89.2%) | 122 (70.1%) |
| 45 to 54 Years | 191 (82.7%) | 184 (79.6%) |
| 55 to 64 Years | 228 (85.7%) | 113 (81.9%) |
| 65 to 74 Years | 133 (80.1%) | 179 (82.1%) |
| 75 Years and over | 60 (100.0%) | 147 (76.6%) |
| Total | 1,178 (82.6%) | 1,220 (74.4%) |
Income Below Poverty Among Married-Couple Families in Paris
The poverty statistics for married-couple families in Paris show that 5.5% or 31 of the total 568 families live below the poverty line. Families with 5 or more children have the highest poverty rate of 100.0%, comprising of 1 families. On the other hand, families with no children have the lowest poverty rate of 0.0%, which includes 0 families.
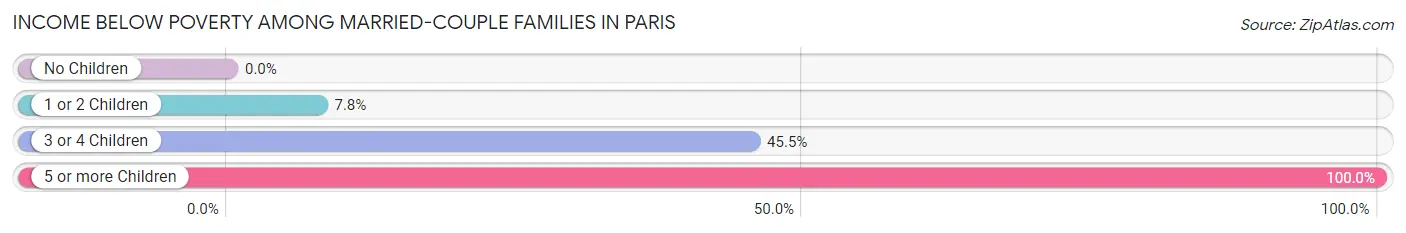
| Children | Above Poverty | Below Poverty |
| No Children | 235 (100.0%) | 0 (0.0%) |
| 1 or 2 Children | 296 (92.2%) | 25 (7.8%) |
| 3 or 4 Children | 6 (54.5%) | 5 (45.5%) |
| 5 or more Children | 0 (0.0%) | 1 (100.0%) |
| Total | 537 (94.5%) | 31 (5.5%) |
Income Below Poverty Among Single-Parent Households in Paris
According to the poverty data in Paris, 34.0% or 17 single-father households and 56.8% or 88 single-mother households are living below the poverty line. Among single-father households, those with 1 or 2 children have the highest poverty rate, with 17 households (56.7%) experiencing poverty. Likewise, among single-mother households, those with 1 or 2 children have the highest poverty rate, with 88 households (59.9%) falling below the poverty line.
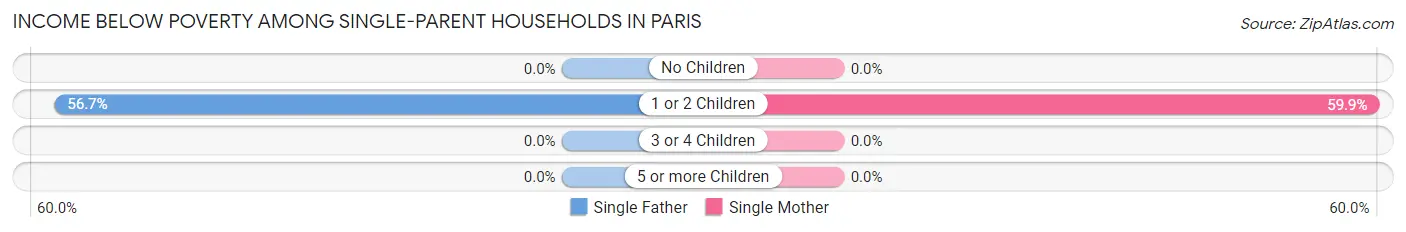
| Children | Single Father | Single Mother |
| No Children | 0 (0.0%) | 0 (0.0%) |
| 1 or 2 Children | 17 (56.7%) | 88 (59.9%) |
| 3 or 4 Children | 0 (0.0%) | 0 (0.0%) |
| 5 or more Children | 0 (0.0%) | 0 (0.0%) |
| Total | 17 (34.0%) | 88 (56.8%) |
Income Below Poverty Among Married-Couple vs Single-Parent Households in Paris
The poverty data for Paris shows that 31 of the married-couple family households (5.5%) and 105 of the single-parent households (51.2%) are living below the poverty level. Within the married-couple family households, those with 5 or more children have the highest poverty rate, with 1 households (100.0%) falling below the poverty line. Among the single-parent households, those with 1 or 2 children have the highest poverty rate, with 105 household (59.3%) living below poverty.
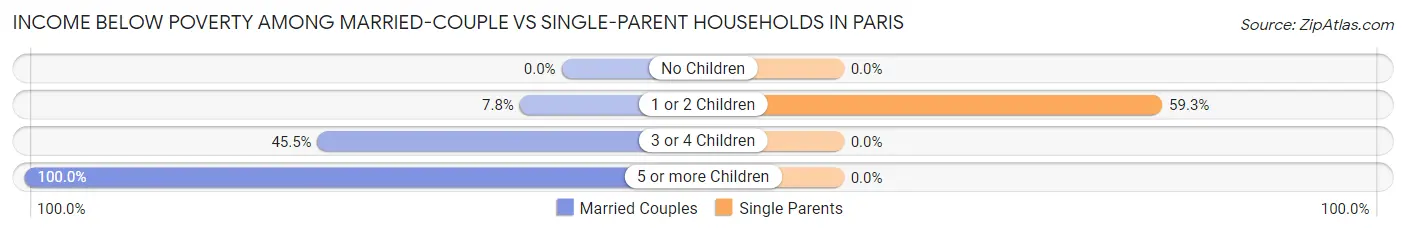
| Children | Married-Couple Families | Single-Parent Households |
| No Children | 0 (0.0%) | 0 (0.0%) |
| 1 or 2 Children | 25 (7.8%) | 105 (59.3%) |
| 3 or 4 Children | 5 (45.5%) | 0 (0.0%) |
| 5 or more Children | 1 (100.0%) | 0 (0.0%) |
| Total | 31 (5.5%) | 105 (51.2%) |
Race in Paris
The most populous races in Paris are White / Caucasian (2,885 | 89.8%), Asian (189 | 5.9%), and Hispanic or Latino (95 | 3.0%).
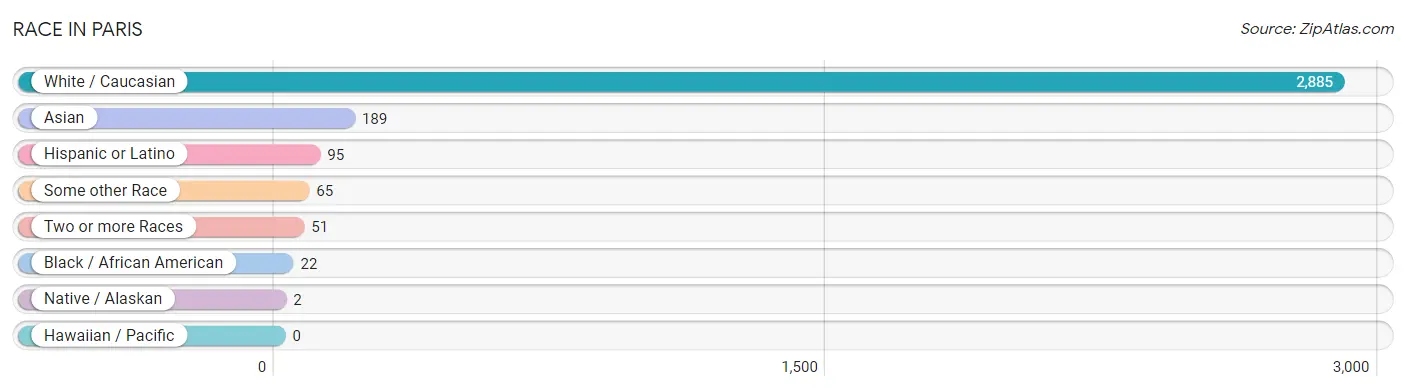
| Race | # Population | % Population |
| Asian | 189 | 5.9% |
| Black / African American | 22 | 0.7% |
| Hawaiian / Pacific | 0 | 0.0% |
| Hispanic or Latino | 95 | 3.0% |
| Native / Alaskan | 2 | 0.1% |
| White / Caucasian | 2,885 | 89.8% |
| Two or more Races | 51 | 1.6% |
| Some other Race | 65 | 2.0% |
| Total | 3,214 | 100.0% |
Ancestry in Paris
The most populous ancestries reported in Paris are German (343 | 10.7%), American (316 | 9.8%), Irish (227 | 7.1%), English (208 | 6.5%), and Bangladeshi (106 | 3.3%), together accounting for 37.3% of all Paris residents.
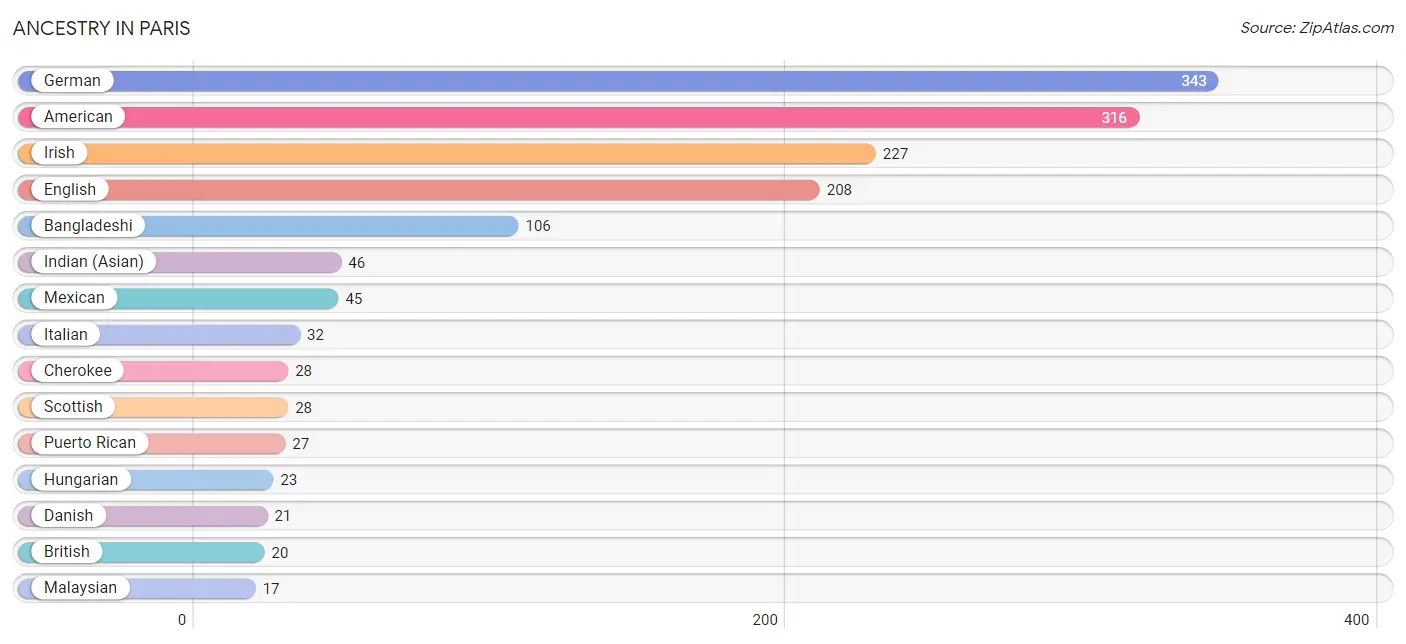
| Ancestry | # Population | % Population |
| Alaska Native | 2 | 0.1% |
| American | 316 | 9.8% |
| Apache | 1 | 0.0% |
| Arab | 2 | 0.1% |
| Bangladeshi | 106 | 3.3% |
| British | 20 | 0.6% |
| Cherokee | 28 | 0.9% |
| Danish | 21 | 0.6% |
| Dutch | 10 | 0.3% |
| English | 208 | 6.5% |
| German | 343 | 10.7% |
| Hungarian | 23 | 0.7% |
| Indian (Asian) | 46 | 1.4% |
| Irish | 227 | 7.1% |
| Italian | 32 | 1.0% |
| Luxembourger | 15 | 0.5% |
| Malaysian | 17 | 0.5% |
| Mexican | 45 | 1.4% |
| Peruvian | 11 | 0.3% |
| Puerto Rican | 27 | 0.8% |
| Scotch-Irish | 10 | 0.3% |
| Scottish | 28 | 0.9% |
| South American | 11 | 0.3% | View All 23 Rows |
Immigrants in Paris
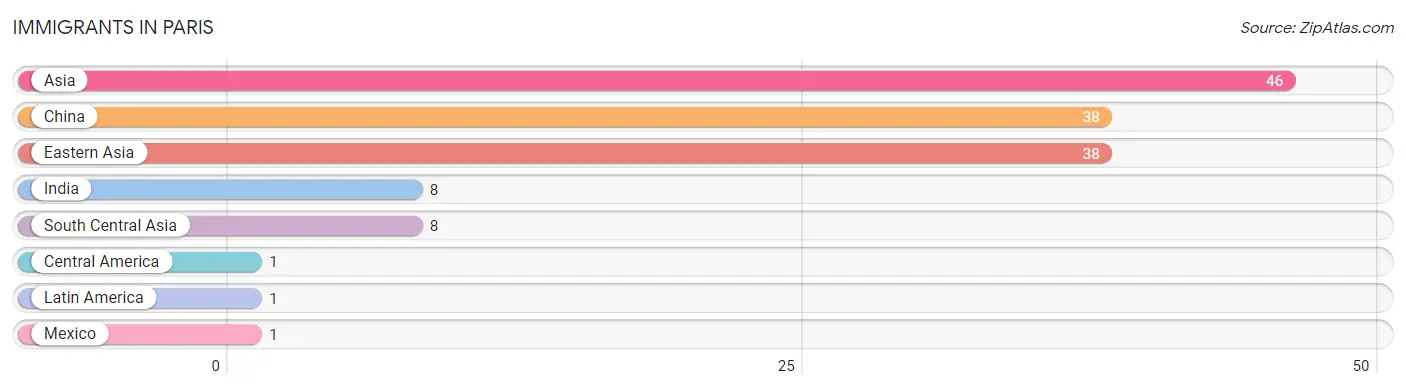
The most numerous immigrant groups reported in Paris came from Asia (46 | 1.4%), China (38 | 1.2%), Eastern Asia (38 | 1.2%), India (8 | 0.3%), and South Central Asia (8 | 0.3%), together accounting for 4.3% of all Paris residents.
| Immigration Origin | # Population | % Population |
| Asia | 46 | 1.4% |
| Central America | 1 | 0.0% |
| China | 38 | 1.2% |
| Eastern Asia | 38 | 1.2% |
| India | 8 | 0.3% |
| Latin America | 1 | 0.0% |
| Mexico | 1 | 0.0% |
| South Central Asia | 8 | 0.3% | View All 8 Rows |
Sex and Age in Paris
Sex and Age in Paris
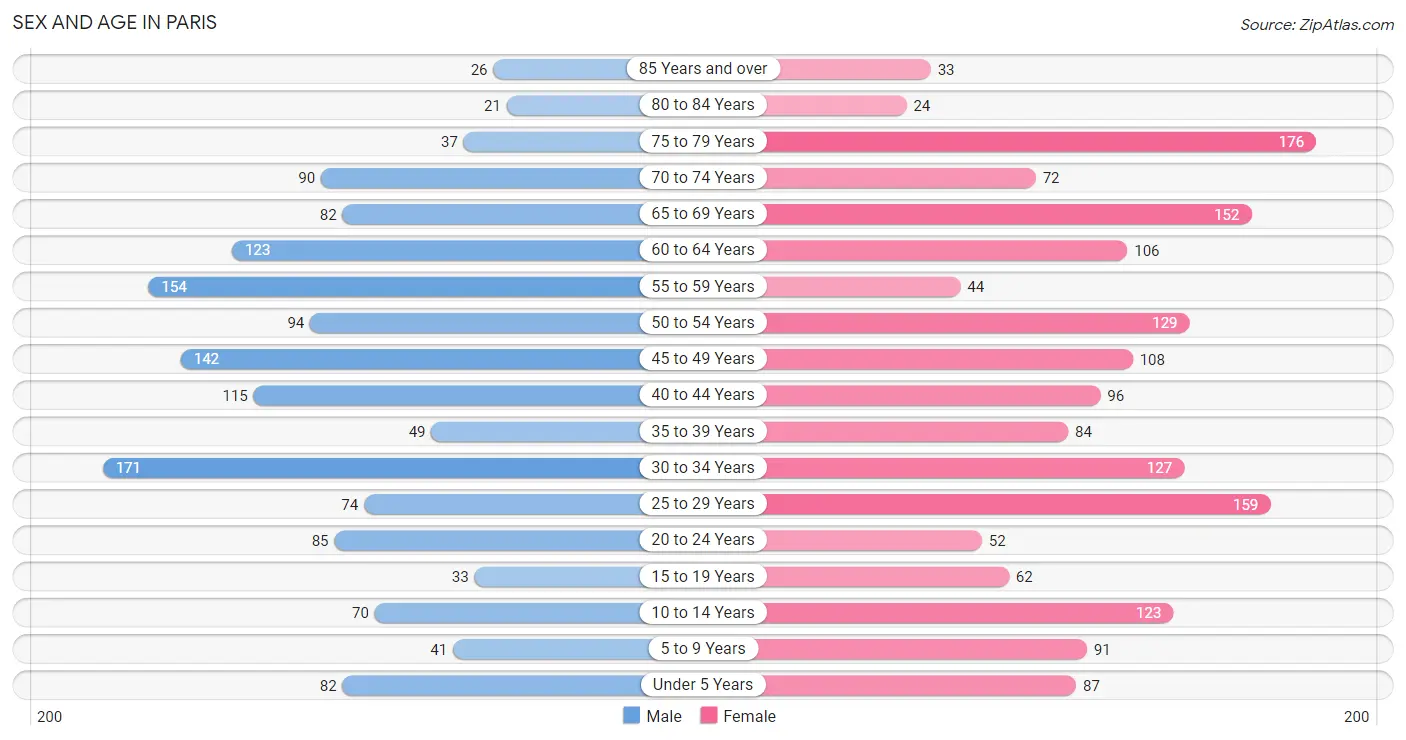
The most populous age groups in Paris are 30 to 34 Years (171 | 11.5%) for men and 75 to 79 Years (176 | 10.2%) for women.
| Age Bracket | Male | Female |
| Under 5 Years | 82 (5.5%) | 87 (5.0%) |
| 5 to 9 Years | 41 (2.8%) | 91 (5.3%) |
| 10 to 14 Years | 70 (4.7%) | 123 (7.1%) |
| 15 to 19 Years | 33 (2.2%) | 62 (3.6%) |
| 20 to 24 Years | 85 (5.7%) | 52 (3.0%) |
| 25 to 29 Years | 74 (5.0%) | 159 (9.2%) |
| 30 to 34 Years | 171 (11.5%) | 127 (7.4%) |
| 35 to 39 Years | 49 (3.3%) | 84 (4.9%) |
| 40 to 44 Years | 115 (7.7%) | 96 (5.6%) |
| 45 to 49 Years | 142 (9.5%) | 108 (6.3%) |
| 50 to 54 Years | 94 (6.3%) | 129 (7.5%) |
| 55 to 59 Years | 154 (10.3%) | 44 (2.5%) |
| 60 to 64 Years | 123 (8.3%) | 106 (6.1%) |
| 65 to 69 Years | 82 (5.5%) | 152 (8.8%) |
| 70 to 74 Years | 90 (6.0%) | 72 (4.2%) |
| 75 to 79 Years | 37 (2.5%) | 176 (10.2%) |
| 80 to 84 Years | 21 (1.4%) | 24 (1.4%) |
| 85 Years and over | 26 (1.8%) | 33 (1.9%) |
| Total | 1,489 (100.0%) | 1,725 (100.0%) |
Families and Households in Paris
Median Family Size in Paris
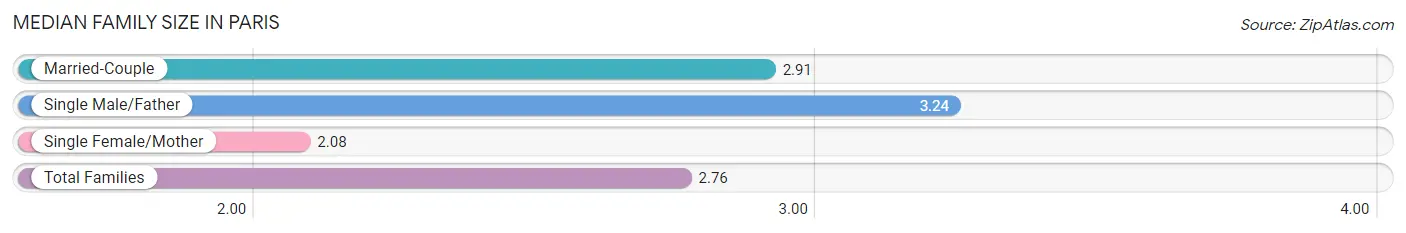
The median family size in Paris is 2.76 persons per family, with single male/father families (50 | 6.5%) accounting for the largest median family size of 3.24 persons per family. On the other hand, single female/mother families (155 | 20.1%) represent the smallest median family size with 2.08 persons per family.
| Family Type | # Families | Family Size |
| Married-Couple | 568 (73.5%) | 2.91 |
| Single Male/Father | 50 (6.5%) | 3.24 |
| Single Female/Mother | 155 (20.1%) | 2.08 |
| Total Families | 773 (100.0%) | 2.76 |
Median Household Size in Paris
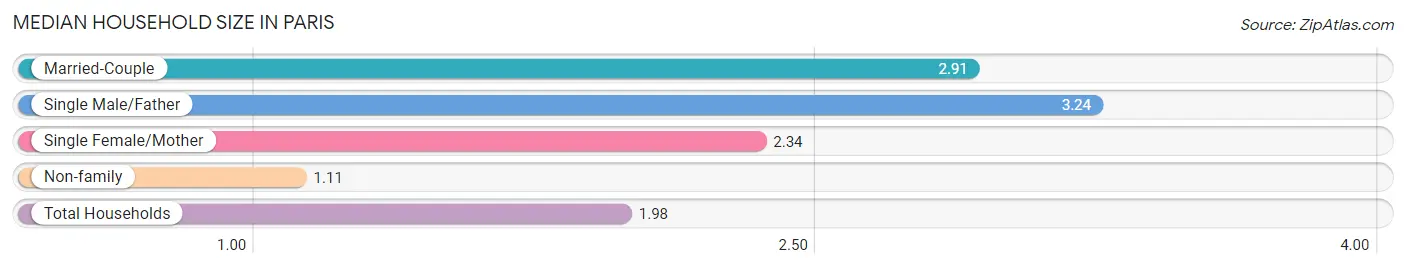
The median household size in Paris is 1.98 persons per household, with single male/father households (50 | 3.3%) accounting for the largest median household size of 3.24 persons per household. non-family households (752 | 49.3%) represent the smallest median household size with 1.11 persons per household.
| Household Type | # Households | Household Size |
| Married-Couple | 568 (37.2%) | 2.91 |
| Single Male/Father | 50 (3.3%) | 3.24 |
| Single Female/Mother | 155 (10.2%) | 2.34 |
| Non-family | 752 (49.3%) | 1.11 |
| Total Households | 1,525 (100.0%) | 1.98 |
Household Size by Marriage Status in Paris
Out of a total of 1,525 households in Paris, 773 (50.7%) are family households, while 752 (49.3%) are nonfamily households. The most numerous type of family households are 3-person households, comprising 290, and the most common type of nonfamily households are 1-person households, comprising 696.
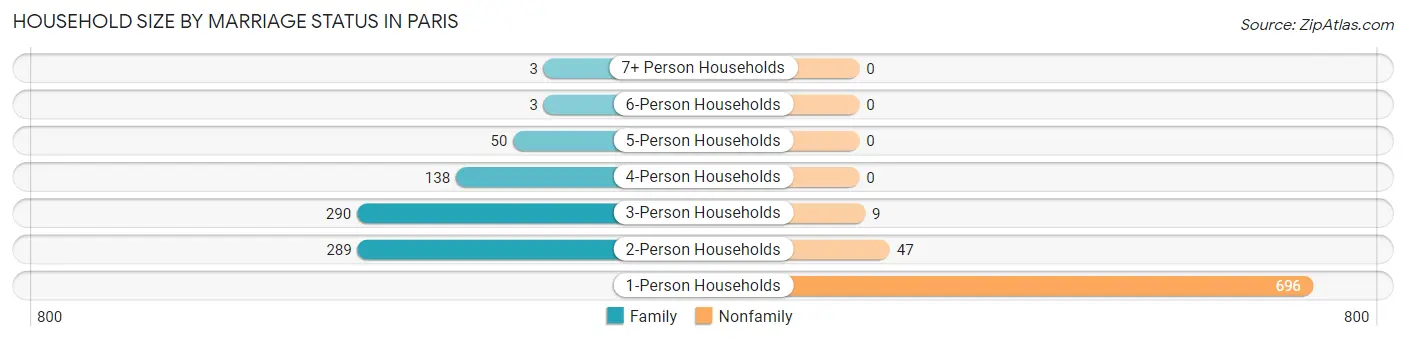
| Household Size | Family Households | Nonfamily Households |
| 1-Person Households | - | 696 (45.6%) |
| 2-Person Households | 289 (19.0%) | 47 (3.1%) |
| 3-Person Households | 290 (19.0%) | 9 (0.6%) |
| 4-Person Households | 138 (9.0%) | 0 (0.0%) |
| 5-Person Households | 50 (3.3%) | 0 (0.0%) |
| 6-Person Households | 3 (0.2%) | 0 (0.0%) |
| 7+ Person Households | 3 (0.2%) | 0 (0.0%) |
| Total | 773 (50.7%) | 752 (49.3%) |
Female Fertility in Paris
Fertility by Age in Paris
Average fertility rate in Paris is 25.0 births per 1,000 women. Women in the age bracket of 15 to 19 years have the highest fertility rate with 290.0 births per 1,000 women. Women in the age bracket of 15 to 19 years acount for 100.0% of all women with births.
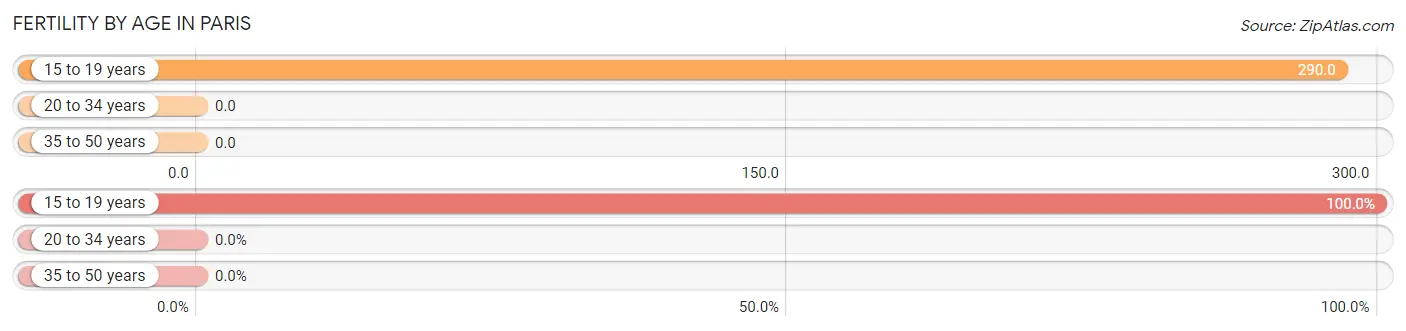
| Age Bracket | Women with Births | Births / 1,000 Women |
| 15 to 19 years | 18 (100.0%) | 290.0 |
| 20 to 34 years | 0 (0.0%) | 0.0 |
| 35 to 50 years | 0 (0.0%) | 0.0 |
| Total | 18 (100.0%) | 25.0 |
Fertility by Age by Marriage Status in Paris
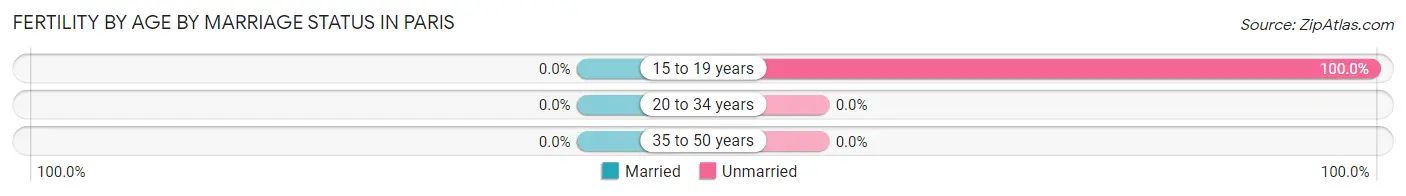
| Age Bracket | Married | Unmarried |
| 15 to 19 years | 0 (0.0%) | 18 (100.0%) |
| 20 to 34 years | 0 (0.0%) | 0 (0.0%) |
| 35 to 50 years | 0 (0.0%) | 0 (0.0%) |
| Total | 0 (0.0%) | 18 (100.0%) |
Fertility by Education in Paris
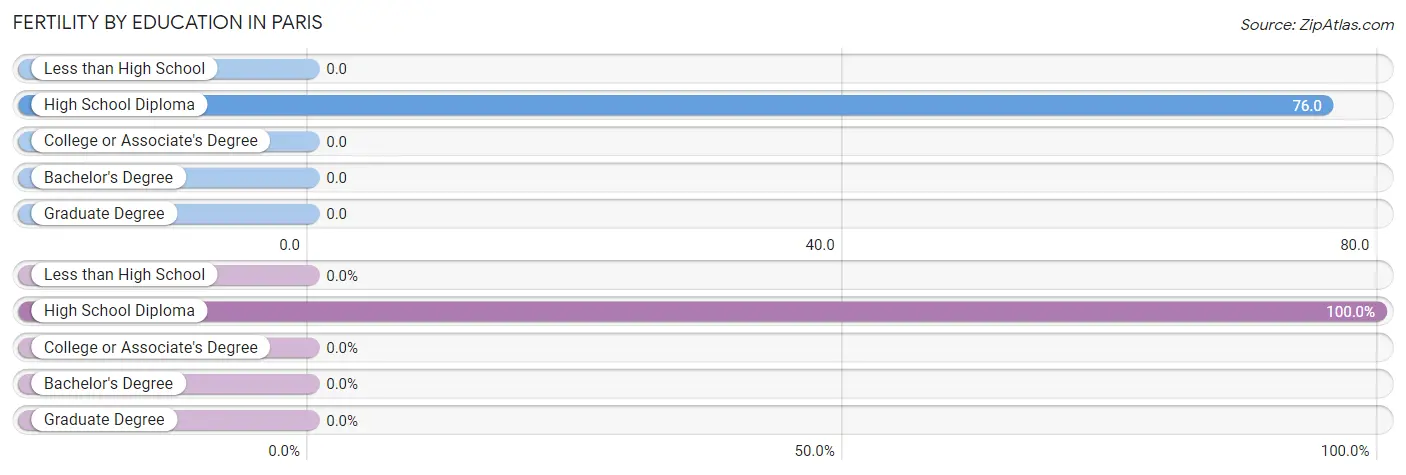
| Educational Attainment | Women with Births | Births / 1,000 Women |
| Less than High School | 0 (0.0%) | 0.0 |
| High School Diploma | 18 (100.0%) | 76.0 |
| College or Associate's Degree | 0 (0.0%) | 0.0 |
| Bachelor's Degree | 0 (0.0%) | 0.0 |
| Graduate Degree | 0 (0.0%) | 0.0 |
| Total | 18 (100.0%) | 25.0 |
Fertility by Education by Marriage Status in Paris
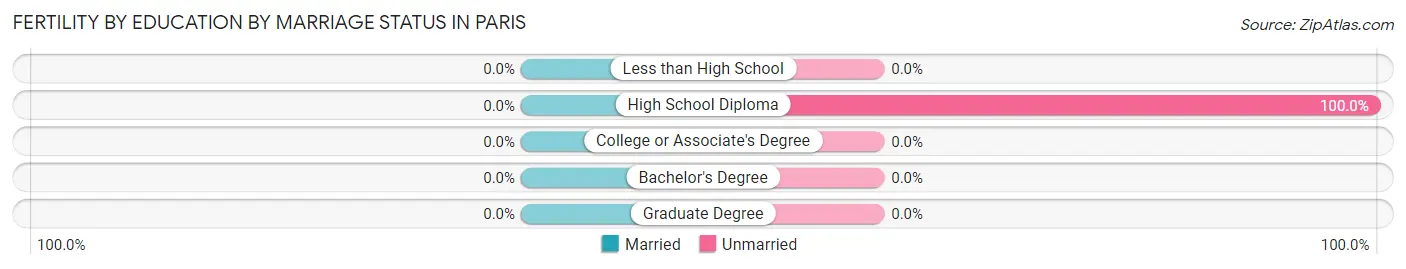
| Educational Attainment | Married | Unmarried |
| Less than High School | 0 (0.0%) | 0 (0.0%) |
| High School Diploma | 0 (0.0%) | 18 (100.0%) |
| College or Associate's Degree | 0 (0.0%) | 0 (0.0%) |
| Bachelor's Degree | 0 (0.0%) | 0 (0.0%) |
| Graduate Degree | 0 (0.0%) | 0 (0.0%) |
| Total | 0 (0.0%) | 18 (100.0%) |
Employment Characteristics in Paris
Employment by Class of Employer in Paris
Among the 1,466 employed individuals in Paris, private company employees (1,077 | 73.5%), local government employees (115 | 7.8%), and not-for-profit organizations (102 | 7.0%) make up the most common classes of employment.
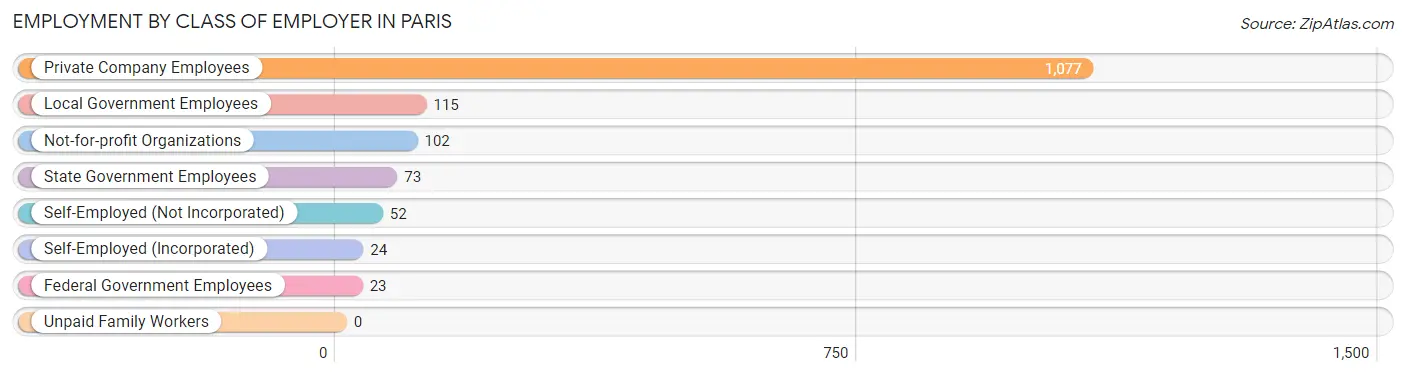
| Employer Class | # Employees | % Employees |
| Private Company Employees | 1,077 | 73.5% |
| Self-Employed (Incorporated) | 24 | 1.6% |
| Self-Employed (Not Incorporated) | 52 | 3.5% |
| Not-for-profit Organizations | 102 | 7.0% |
| Local Government Employees | 115 | 7.8% |
| State Government Employees | 73 | 5.0% |
| Federal Government Employees | 23 | 1.6% |
| Unpaid Family Workers | 0 | 0.0% |
| Total | 1,466 | 100.0% |
Employment Status by Age in Paris
According to the labor force statistics for Paris, out of the total population over 16 years of age (2,706), 60.5% or 1,637 individuals are in the labor force, with 7.6% or 124 of them unemployed. The age group with the highest labor force participation rate is 20 to 24 years, with 100.0% or 137 individuals in the labor force. Within the labor force, the 16 to 19 years age range has the highest percentage of unemployed individuals, with 41.9% or 18 of them being unemployed.
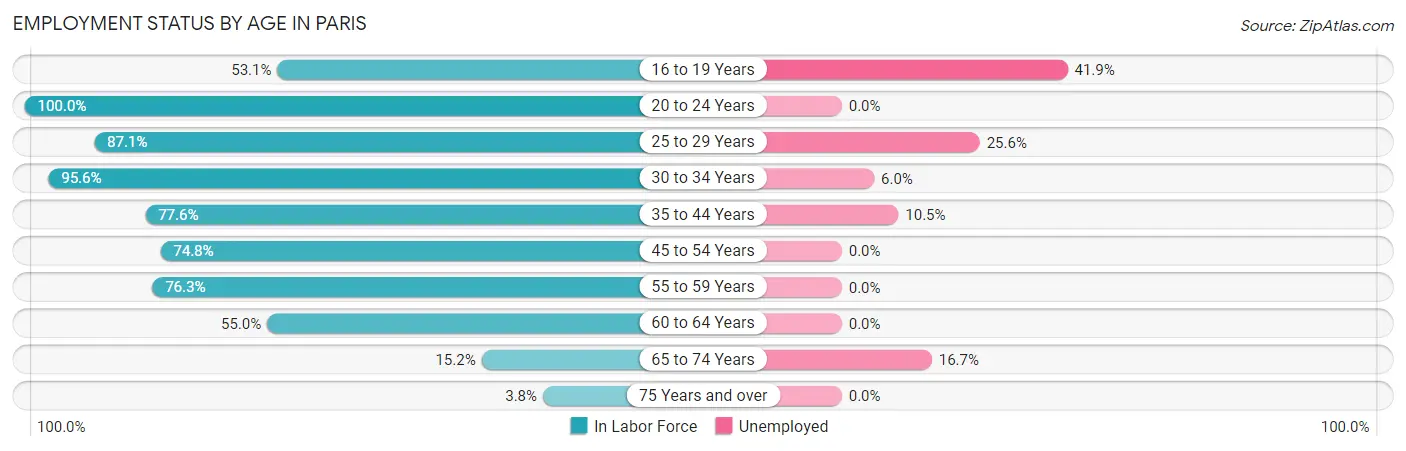
| Age Bracket | In Labor Force | Unemployed |
| 16 to 19 Years | 43 (53.1%) | 18 (41.9%) |
| 20 to 24 Years | 137 (100.0%) | 0 (0.0%) |
| 25 to 29 Years | 203 (87.1%) | 52 (25.6%) |
| 30 to 34 Years | 285 (95.6%) | 17 (6.0%) |
| 35 to 44 Years | 267 (77.6%) | 28 (10.5%) |
| 45 to 54 Years | 354 (74.8%) | 0 (0.0%) |
| 55 to 59 Years | 151 (76.3%) | 0 (0.0%) |
| 60 to 64 Years | 126 (55.0%) | 0 (0.0%) |
| 65 to 74 Years | 60 (15.2%) | 10 (16.7%) |
| 75 Years and over | 12 (3.8%) | 0 (0.0%) |
| Total | 1,637 (60.5%) | 124 (7.6%) |
Employment Status by Educational Attainment in Paris
According to labor force statistics for Paris, 78.1% of individuals (1,386) out of the total population between 25 and 64 years of age (1,775) are in the labor force, with 7.0% or 97 of them being unemployed. The group with the highest labor force participation rate are those with the educational attainment of college / associate degree, with 92.3% or 514 individuals in the labor force. Within the labor force, individuals with college / associate degree education have the highest percentage of unemployment, with 11.7% or 60 of them being unemployed.
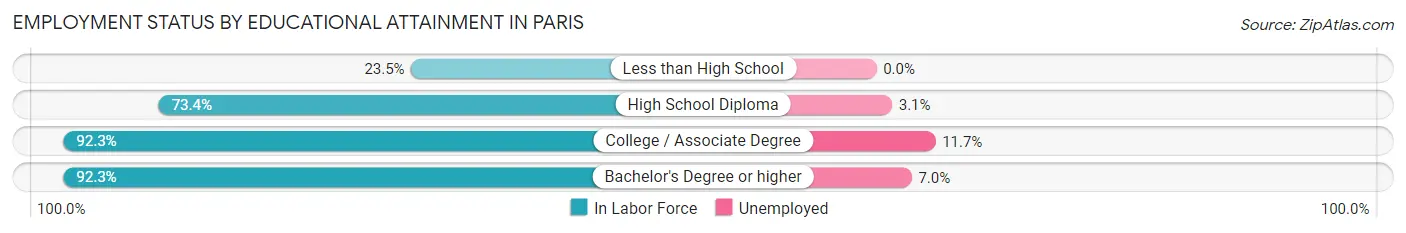
| Educational Attainment | In Labor Force | Unemployed |
| Less than High School | 38 (23.5%) | 0 (0.0%) |
| High School Diploma | 547 (73.4%) | 23 (3.1%) |
| College / Associate Degree | 514 (92.3%) | 65 (11.7%) |
| Bachelor's Degree or higher | 287 (92.3%) | 22 (7.0%) |
| Total | 1,386 (78.1%) | 124 (7.0%) |
Employment Occupations by Sex in Paris
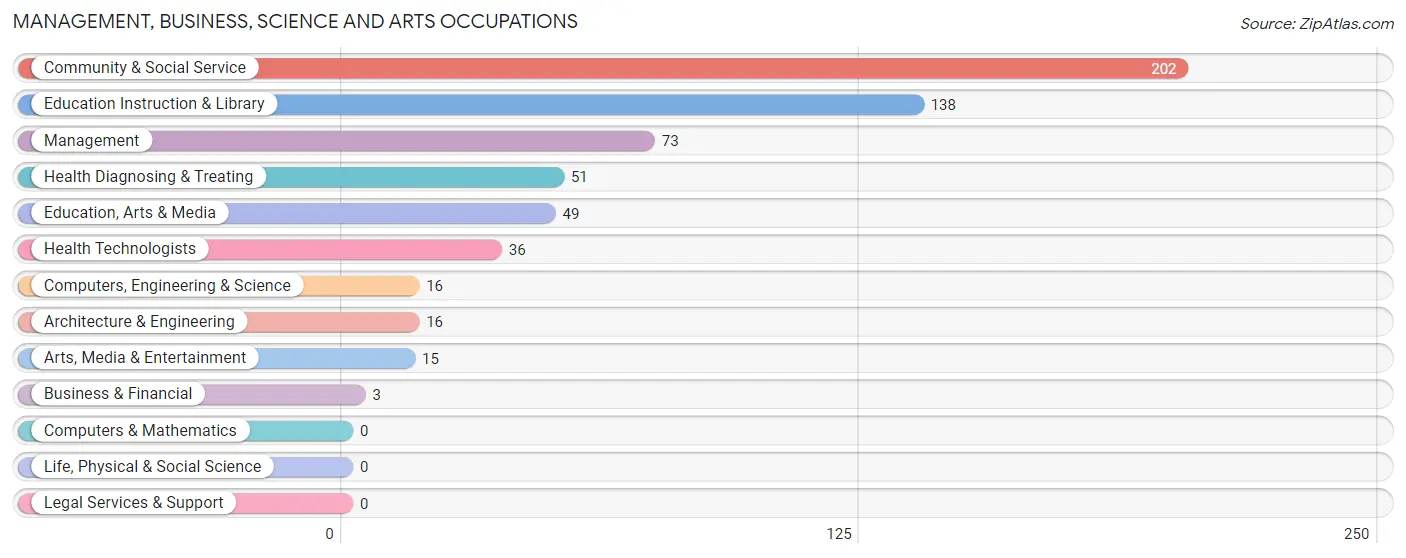
Management, Business, Science and Arts Occupations
The most common Management, Business, Science and Arts occupations in Paris are Community & Social Service (202 | 13.4%), Education Instruction & Library (138 | 9.1%), Management (73 | 4.8%), Health Diagnosing & Treating (51 | 3.4%), and Education, Arts & Media (49 | 3.2%).
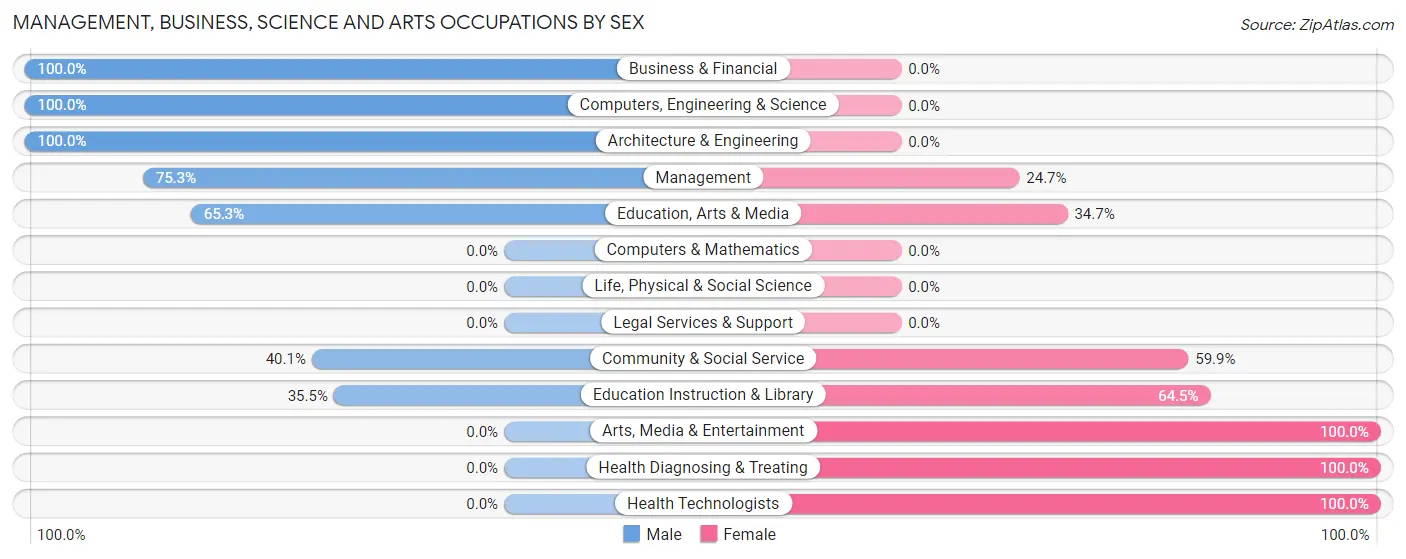
Management, Business, Science and Arts Occupations by Sex
Within the Management, Business, Science and Arts occupations in Paris, the most male-oriented occupations are Business & Financial (100.0%), Computers, Engineering & Science (100.0%), and Architecture & Engineering (100.0%), while the most female-oriented occupations are Arts, Media & Entertainment (100.0%), Health Diagnosing & Treating (100.0%), and Health Technologists (100.0%).
| Occupation | Male | Female |
| Management | 55 (75.3%) | 18 (24.7%) |
| Business & Financial | 3 (100.0%) | 0 (0.0%) |
| Computers, Engineering & Science | 16 (100.0%) | 0 (0.0%) |
| Computers & Mathematics | 0 (0.0%) | 0 (0.0%) |
| Architecture & Engineering | 16 (100.0%) | 0 (0.0%) |
| Life, Physical & Social Science | 0 (0.0%) | 0 (0.0%) |
| Community & Social Service | 81 (40.1%) | 121 (59.9%) |
| Education, Arts & Media | 32 (65.3%) | 17 (34.7%) |
| Legal Services & Support | 0 (0.0%) | 0 (0.0%) |
| Education Instruction & Library | 49 (35.5%) | 89 (64.5%) |
| Arts, Media & Entertainment | 0 (0.0%) | 15 (100.0%) |
| Health Diagnosing & Treating | 0 (0.0%) | 51 (100.0%) |
| Health Technologists | 0 (0.0%) | 36 (100.0%) |
| Total (Category) | 155 (44.9%) | 190 (55.1%) |
| Total (Overall) | 866 (57.2%) | 647 (42.8%) |
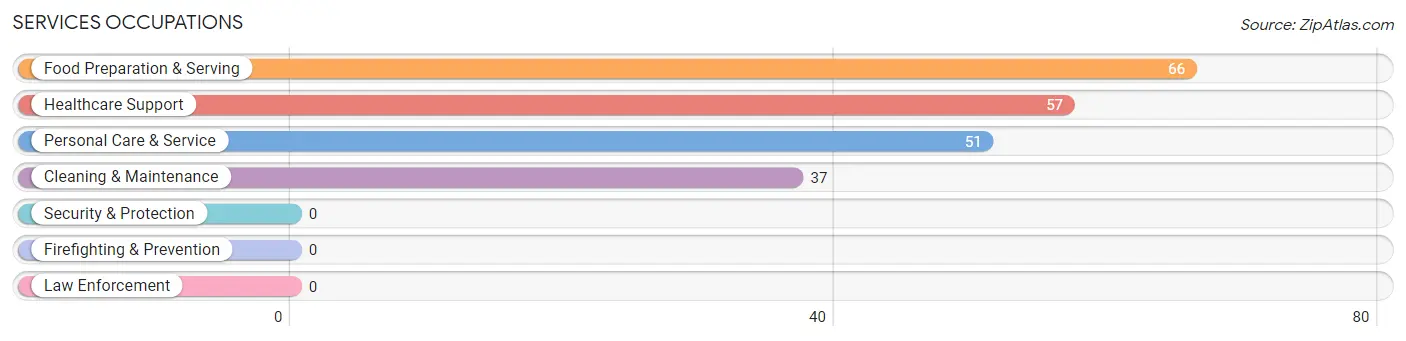
Services Occupations
The most common Services occupations in Paris are Food Preparation & Serving (66 | 4.4%), Healthcare Support (57 | 3.8%), Personal Care & Service (51 | 3.4%), and Cleaning & Maintenance (37 | 2.5%).
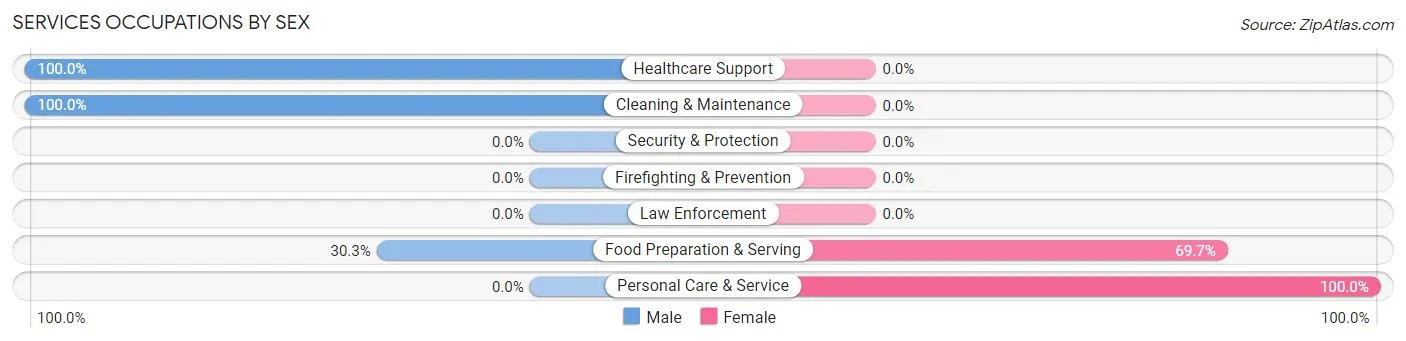
Services Occupations by Sex
Within the Services occupations in Paris, the most male-oriented occupations are Healthcare Support (100.0%), Cleaning & Maintenance (100.0%), and Food Preparation & Serving (30.3%), while the most female-oriented occupations are Personal Care & Service (100.0%), and Food Preparation & Serving (69.7%).
| Occupation | Male | Female |
| Healthcare Support | 57 (100.0%) | 0 (0.0%) |
| Security & Protection | 0 (0.0%) | 0 (0.0%) |
| Firefighting & Prevention | 0 (0.0%) | 0 (0.0%) |
| Law Enforcement | 0 (0.0%) | 0 (0.0%) |
| Food Preparation & Serving | 20 (30.3%) | 46 (69.7%) |
| Cleaning & Maintenance | 37 (100.0%) | 0 (0.0%) |
| Personal Care & Service | 0 (0.0%) | 51 (100.0%) |
| Total (Category) | 114 (54.0%) | 97 (46.0%) |
| Total (Overall) | 866 (57.2%) | 647 (42.8%) |
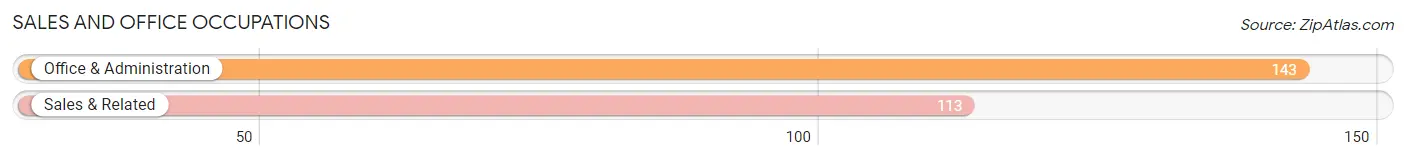
Sales and Office Occupations
The most common Sales and Office occupations in Paris are Office & Administration (143 | 9.5%), and Sales & Related (113 | 7.5%).
Sales and Office Occupations by Sex

| Occupation | Male | Female |
| Sales & Related | 12 (10.6%) | 101 (89.4%) |
| Office & Administration | 23 (16.1%) | 120 (83.9%) |
| Total (Category) | 35 (13.7%) | 221 (86.3%) |
| Total (Overall) | 866 (57.2%) | 647 (42.8%) |
Natural Resources, Construction and Maintenance Occupations
The most common Natural Resources, Construction and Maintenance occupations in Paris are Installation, Maintenance & Repair (82 | 5.4%), Construction & Extraction (30 | 2.0%), and Farming, Fishing & Forestry (24 | 1.6%).

Natural Resources, Construction and Maintenance Occupations by Sex

| Occupation | Male | Female |
| Farming, Fishing & Forestry | 24 (100.0%) | 0 (0.0%) |
| Construction & Extraction | 30 (100.0%) | 0 (0.0%) |
| Installation, Maintenance & Repair | 82 (100.0%) | 0 (0.0%) |
| Total (Category) | 136 (100.0%) | 0 (0.0%) |
| Total (Overall) | 866 (57.2%) | 647 (42.8%) |
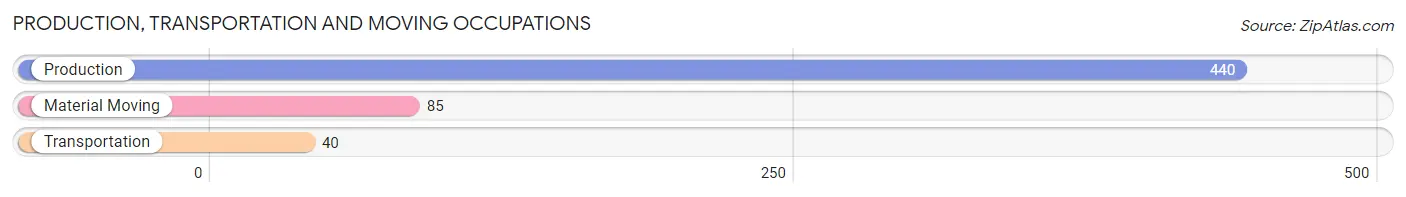
Production, Transportation and Moving Occupations
The most common Production, Transportation and Moving occupations in Paris are Production (440 | 29.1%), Material Moving (85 | 5.6%), and Transportation (40 | 2.6%).
Production, Transportation and Moving Occupations by Sex
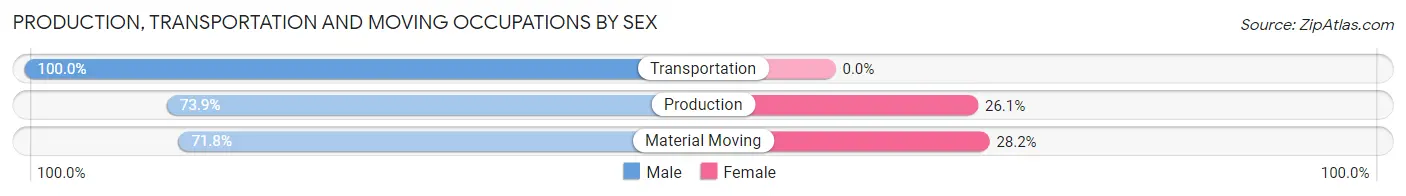
| Occupation | Male | Female |
| Production | 325 (73.9%) | 115 (26.1%) |
| Transportation | 40 (100.0%) | 0 (0.0%) |
| Material Moving | 61 (71.8%) | 24 (28.2%) |
| Total (Category) | 426 (75.4%) | 139 (24.6%) |
| Total (Overall) | 866 (57.2%) | 647 (42.8%) |
Employment Industries by Sex in Paris
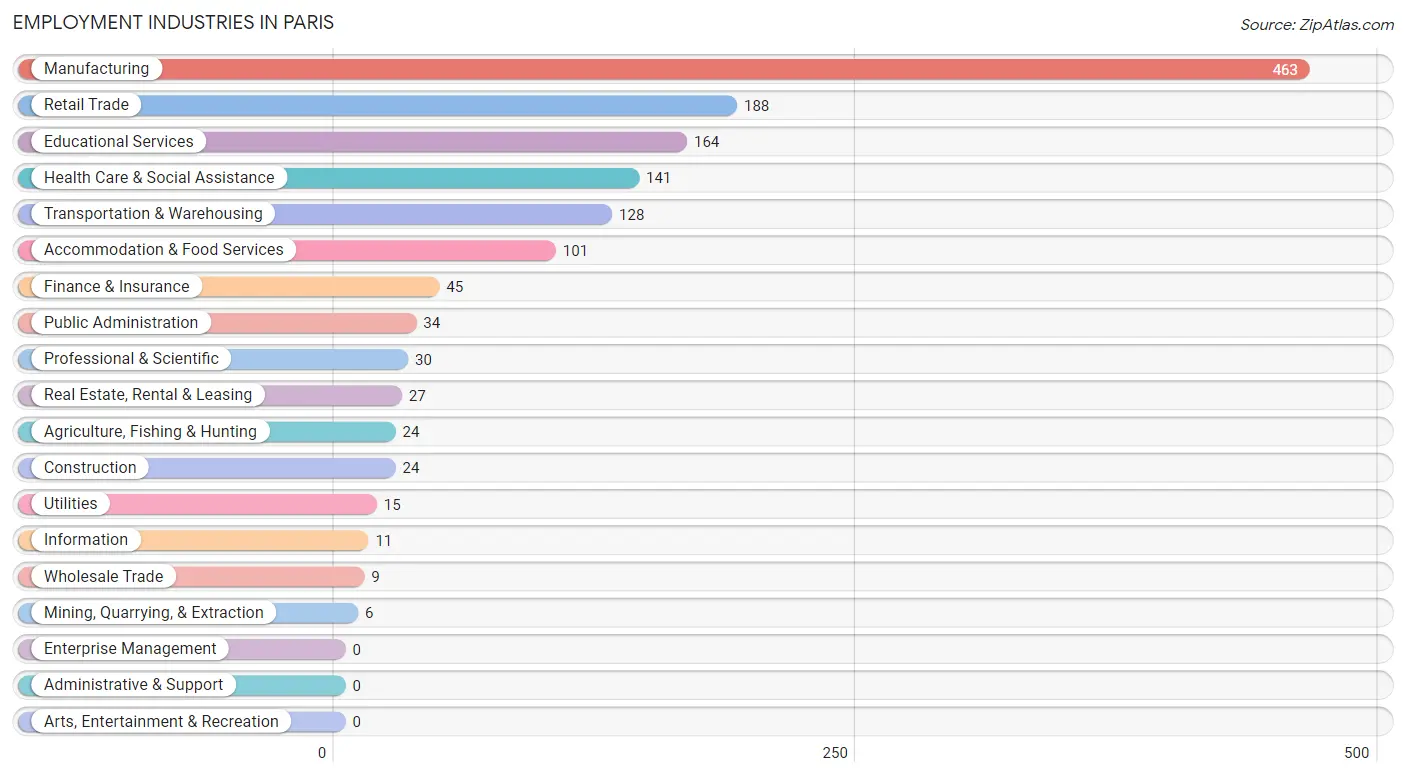
Employment Industries in Paris
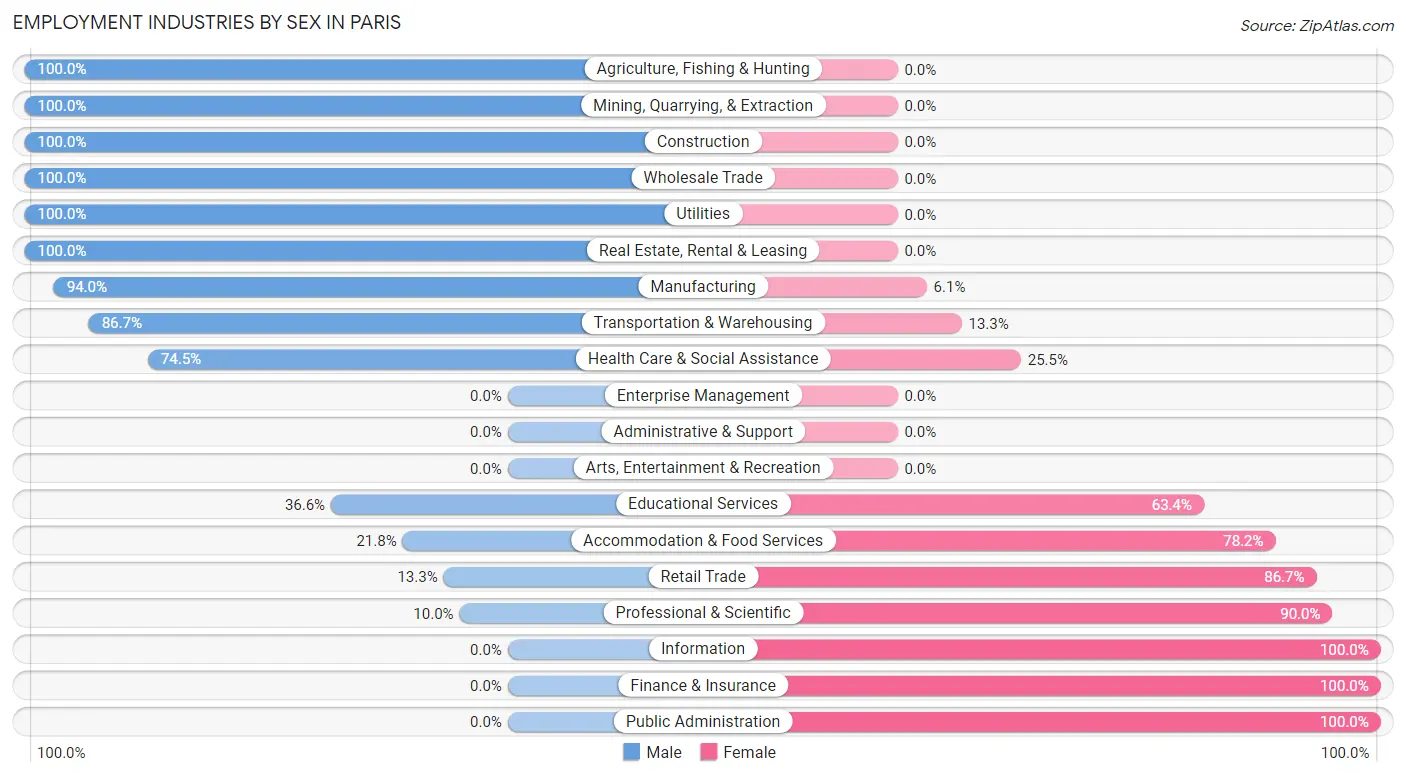
The major employment industries in Paris include Manufacturing (463 | 30.6%), Retail Trade (188 | 12.4%), Educational Services (164 | 10.8%), Health Care & Social Assistance (141 | 9.3%), and Transportation & Warehousing (128 | 8.5%).
Employment Industries by Sex in Paris
The Paris industries that see more men than women are Agriculture, Fishing & Hunting (100.0%), Mining, Quarrying, & Extraction (100.0%), and Construction (100.0%), whereas the industries that tend to have a higher number of women are Information (100.0%), Finance & Insurance (100.0%), and Public Administration (100.0%).
| Industry | Male | Female |
| Agriculture, Fishing & Hunting | 24 (100.0%) | 0 (0.0%) |
| Mining, Quarrying, & Extraction | 6 (100.0%) | 0 (0.0%) |
| Construction | 24 (100.0%) | 0 (0.0%) |
| Manufacturing | 435 (94.0%) | 28 (6.0%) |
| Wholesale Trade | 9 (100.0%) | 0 (0.0%) |
| Retail Trade | 25 (13.3%) | 163 (86.7%) |
| Transportation & Warehousing | 111 (86.7%) | 17 (13.3%) |
| Utilities | 15 (100.0%) | 0 (0.0%) |
| Information | 0 (0.0%) | 11 (100.0%) |
| Finance & Insurance | 0 (0.0%) | 45 (100.0%) |
| Real Estate, Rental & Leasing | 27 (100.0%) | 0 (0.0%) |
| Professional & Scientific | 3 (10.0%) | 27 (90.0%) |
| Enterprise Management | 0 (0.0%) | 0 (0.0%) |
| Administrative & Support | 0 (0.0%) | 0 (0.0%) |
| Educational Services | 60 (36.6%) | 104 (63.4%) |
| Health Care & Social Assistance | 105 (74.5%) | 36 (25.5%) |
| Arts, Entertainment & Recreation | 0 (0.0%) | 0 (0.0%) |
| Accommodation & Food Services | 22 (21.8%) | 79 (78.2%) |
| Public Administration | 0 (0.0%) | 34 (100.0%) |
| Total | 866 (57.2%) | 647 (42.8%) |
Education in Paris
School Enrollment in Paris
The most common levels of schooling among the 579 students in Paris are middle school (174 | 30.0%), elementary school (93 | 16.1%), and high school (91 | 15.7%).
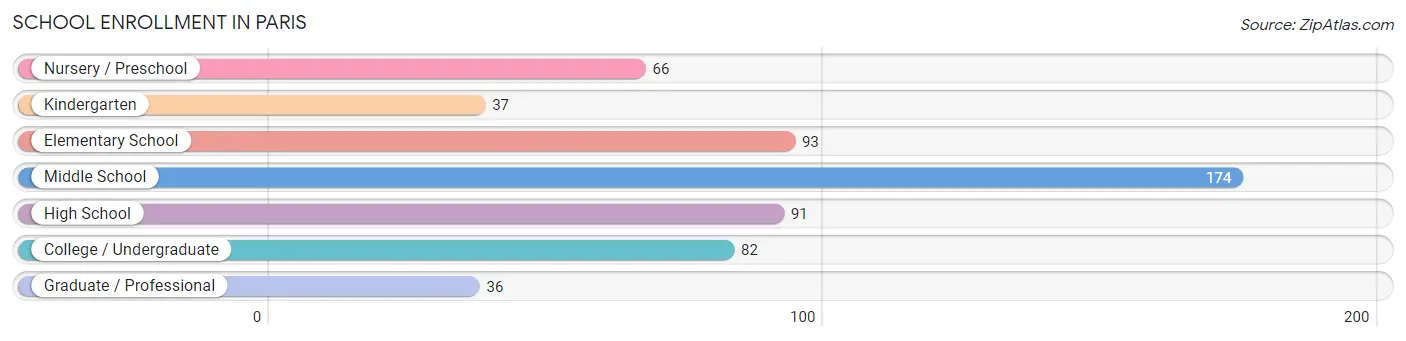
| School Level | # Students | % Students |
| Nursery / Preschool | 66 | 11.4% |
| Kindergarten | 37 | 6.4% |
| Elementary School | 93 | 16.1% |
| Middle School | 174 | 30.0% |
| High School | 91 | 15.7% |
| College / Undergraduate | 82 | 14.2% |
| Graduate / Professional | 36 | 6.2% |
| Total | 579 | 100.0% |
School Enrollment by Age by Funding Source in Paris
Out of a total of 579 students who are enrolled in schools in Paris, 24 (4.1%) attend a private institution, while the remaining 555 (95.9%) are enrolled in public schools. The age group of 15 to 17 year olds has the highest likelihood of being enrolled in private schools, with 7 (9.7% in the age bracket) enrolled. Conversely, the age group of 25 to 34 year olds has the lowest likelihood of being enrolled in a private school, with 69 (100.0% in the age bracket) attending a public institution.
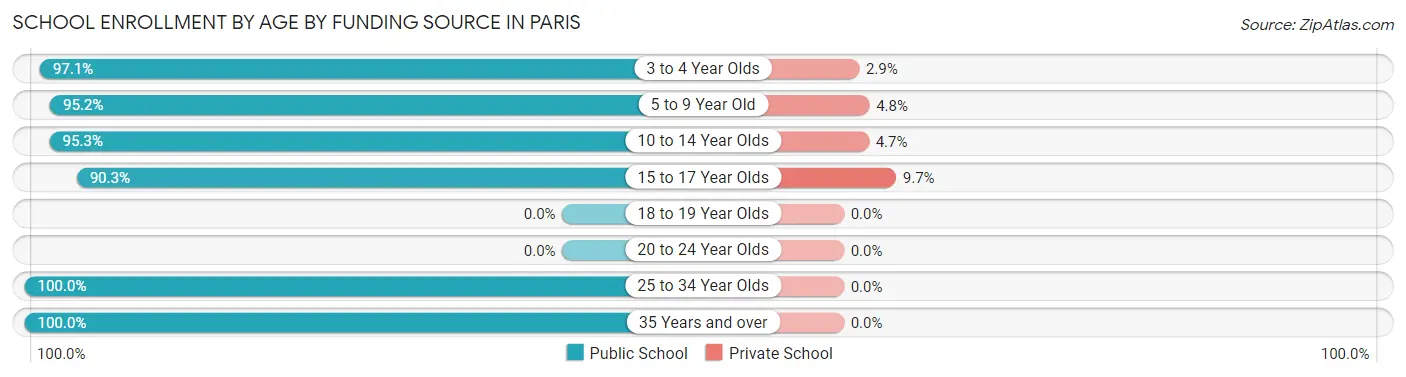
| Age Bracket | Public School | Private School |
| 3 to 4 Year Olds | 68 (97.1%) | 2 (2.9%) |
| 5 to 9 Year Old | 120 (95.2%) | 6 (4.8%) |
| 10 to 14 Year Olds | 184 (95.3%) | 9 (4.7%) |
| 15 to 17 Year Olds | 65 (90.3%) | 7 (9.7%) |
| 18 to 19 Year Olds | 0 (0.0%) | 0 (0.0%) |
| 20 to 24 Year Olds | 0 (0.0%) | 0 (0.0%) |
| 25 to 34 Year Olds | 69 (100.0%) | 0 (0.0%) |
| 35 Years and over | 49 (100.0%) | 0 (0.0%) |
| Total | 555 (95.9%) | 24 (4.1%) |
Educational Attainment by Field of Study in Paris
Business (103 | 21.1%), education (72 | 14.7%), physical & health sciences (69 | 14.1%), liberal arts & history (42 | 8.6%), and engineering (38 | 7.8%) are the most common fields of study among 488 individuals in Paris who have obtained a bachelor's degree or higher.
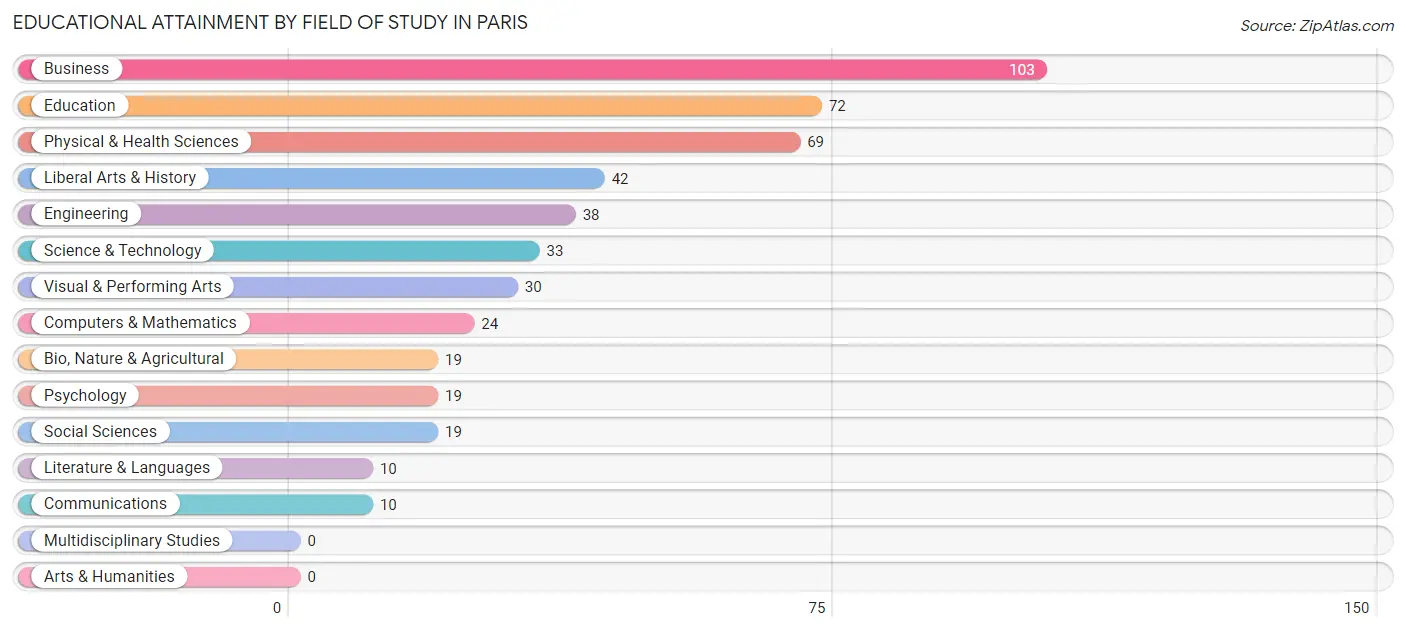
| Field of Study | # Graduates | % Graduates |
| Computers & Mathematics | 24 | 4.9% |
| Bio, Nature & Agricultural | 19 | 3.9% |
| Physical & Health Sciences | 69 | 14.1% |
| Psychology | 19 | 3.9% |
| Social Sciences | 19 | 3.9% |
| Engineering | 38 | 7.8% |
| Multidisciplinary Studies | 0 | 0.0% |
| Science & Technology | 33 | 6.8% |
| Business | 103 | 21.1% |
| Education | 72 | 14.7% |
| Literature & Languages | 10 | 2.1% |
| Liberal Arts & History | 42 | 8.6% |
| Visual & Performing Arts | 30 | 6.1% |
| Communications | 10 | 2.1% |
| Arts & Humanities | 0 | 0.0% |
| Total | 488 | 100.0% |
Transportation & Commute in Paris
Vehicle Availability by Sex in Paris
The most prevalent vehicle ownership categories in Paris are males with 2 vehicles (397, accounting for 48.7%) and females with 2 vehicles (261, making up 61.4%).
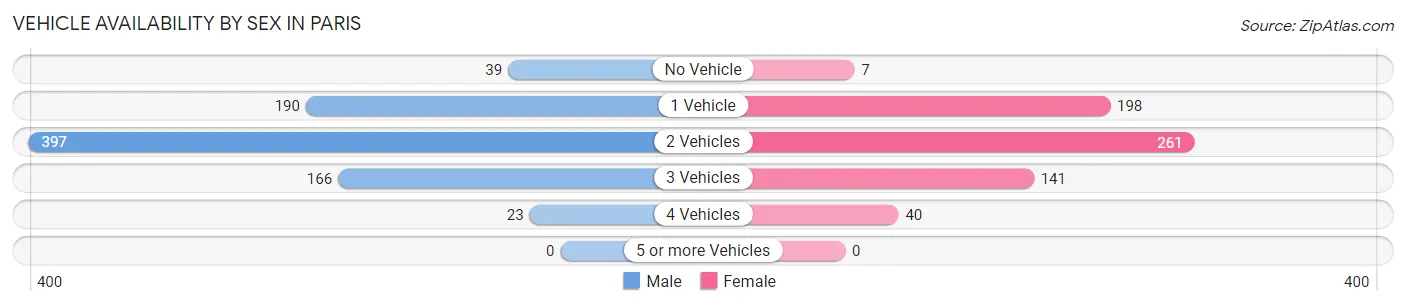
| Vehicles Available | Male | Female |
| No Vehicle | 39 (4.8%) | 7 (1.1%) |
| 1 Vehicle | 190 (23.3%) | 198 (30.6%) |
| 2 Vehicles | 397 (48.7%) | 261 (40.3%) |
| 3 Vehicles | 166 (20.4%) | 141 (21.8%) |
| 4 Vehicles | 23 (2.8%) | 40 (6.2%) |
| 5 or more Vehicles | 0 (0.0%) | 0 (0.0%) |
| Total | 815 (100.0%) | 647 (100.0%) |
Commute Time in Paris
The most frequently occuring commute durations in Paris are 5 to 9 minutes (515 commuters, 35.1%), 10 to 14 minutes (228 commuters, 15.5%), and 30 to 34 minutes (219 commuters, 14.9%).

| Commute Time | # Commuters | % Commuters |
| Less than 5 Minutes | 206 | 14.1% |
| 5 to 9 Minutes | 515 | 35.1% |
| 10 to 14 Minutes | 228 | 15.5% |
| 15 to 19 Minutes | 54 | 3.7% |
| 20 to 24 Minutes | 33 | 2.2% |
| 25 to 29 Minutes | 0 | 0.0% |
| 30 to 34 Minutes | 219 | 14.9% |
| 35 to 39 Minutes | 48 | 3.3% |
| 40 to 44 Minutes | 0 | 0.0% |
| 45 to 59 Minutes | 68 | 4.6% |
| 60 to 89 Minutes | 88 | 6.0% |
| 90 or more Minutes | 7 | 0.5% |
Commute Time by Sex in Paris
The most common commute times in Paris are 5 to 9 minutes (216 commuters, 26.4%) for males and 5 to 9 minutes (299 commuters, 46.2%) for females.
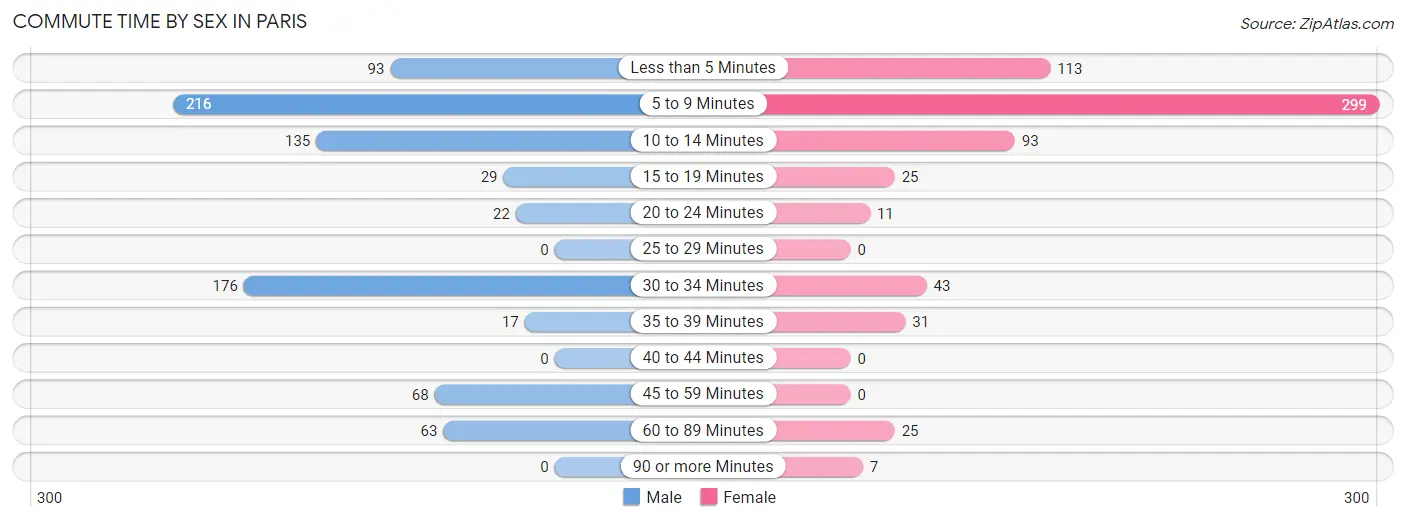
| Commute Time | Male | Female |
| Less than 5 Minutes | 93 (11.4%) | 113 (17.5%) |
| 5 to 9 Minutes | 216 (26.4%) | 299 (46.2%) |
| 10 to 14 Minutes | 135 (16.5%) | 93 (14.4%) |
| 15 to 19 Minutes | 29 (3.5%) | 25 (3.9%) |
| 20 to 24 Minutes | 22 (2.7%) | 11 (1.7%) |
| 25 to 29 Minutes | 0 (0.0%) | 0 (0.0%) |
| 30 to 34 Minutes | 176 (21.5%) | 43 (6.7%) |
| 35 to 39 Minutes | 17 (2.1%) | 31 (4.8%) |
| 40 to 44 Minutes | 0 (0.0%) | 0 (0.0%) |
| 45 to 59 Minutes | 68 (8.3%) | 0 (0.0%) |
| 60 to 89 Minutes | 63 (7.7%) | 25 (3.9%) |
| 90 or more Minutes | 0 (0.0%) | 7 (1.1%) |
Time of Departure to Work by Sex in Paris
The most frequent times of departure to work in Paris are 12:00 PM to 3:59 PM (174, 21.2%) for males and 7:00 AM to 7:29 AM (143, 22.1%) for females.
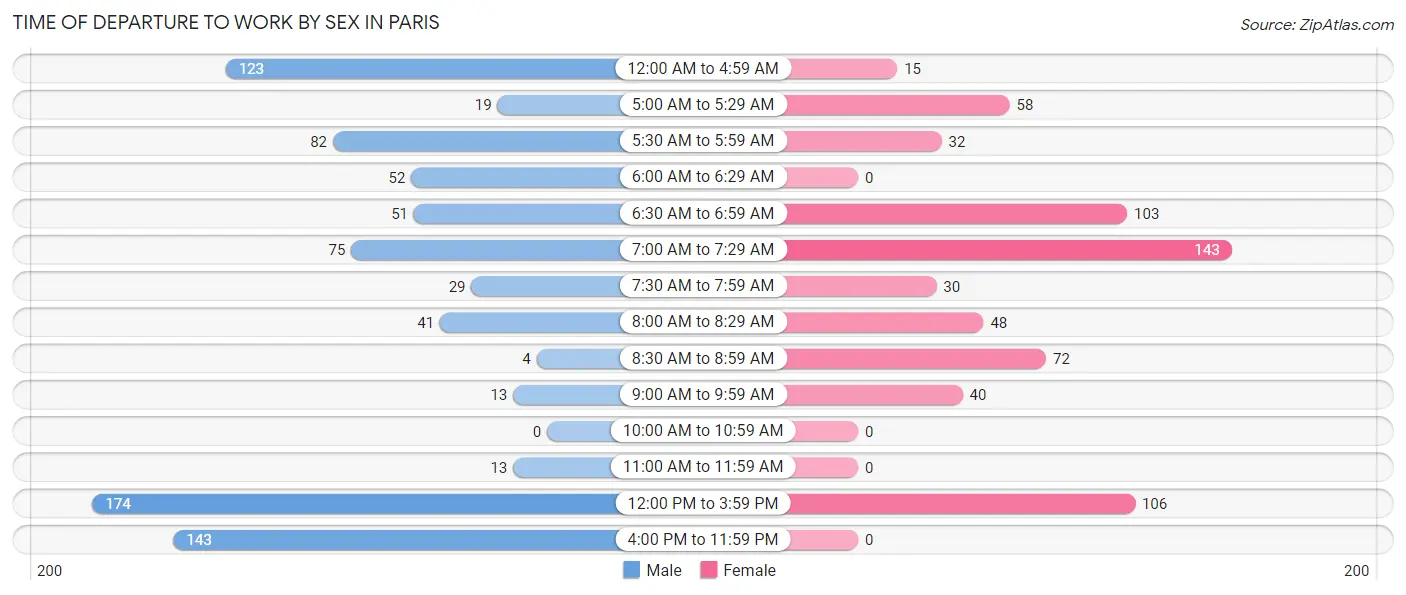
| Time of Departure | Male | Female |
| 12:00 AM to 4:59 AM | 123 (15.0%) | 15 (2.3%) |
| 5:00 AM to 5:29 AM | 19 (2.3%) | 58 (9.0%) |
| 5:30 AM to 5:59 AM | 82 (10.0%) | 32 (5.0%) |
| 6:00 AM to 6:29 AM | 52 (6.4%) | 0 (0.0%) |
| 6:30 AM to 6:59 AM | 51 (6.2%) | 103 (15.9%) |
| 7:00 AM to 7:29 AM | 75 (9.2%) | 143 (22.1%) |
| 7:30 AM to 7:59 AM | 29 (3.5%) | 30 (4.6%) |
| 8:00 AM to 8:29 AM | 41 (5.0%) | 48 (7.4%) |
| 8:30 AM to 8:59 AM | 4 (0.5%) | 72 (11.1%) |
| 9:00 AM to 9:59 AM | 13 (1.6%) | 40 (6.2%) |
| 10:00 AM to 10:59 AM | 0 (0.0%) | 0 (0.0%) |
| 11:00 AM to 11:59 AM | 13 (1.6%) | 0 (0.0%) |
| 12:00 PM to 3:59 PM | 174 (21.2%) | 106 (16.4%) |
| 4:00 PM to 11:59 PM | 143 (17.5%) | 0 (0.0%) |
| Total | 819 (100.0%) | 647 (100.0%) |
Housing Occupancy in Paris
Occupancy by Ownership in Paris
Of the total 1,525 dwellings in Paris, owner-occupied units account for 944 (61.9%), while renter-occupied units make up 581 (38.1%).
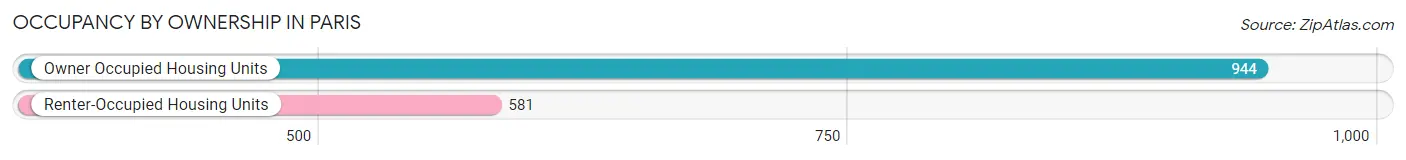
| Occupancy | # Housing Units | % Housing Units |
| Owner Occupied Housing Units | 944 | 61.9% |
| Renter-Occupied Housing Units | 581 | 38.1% |
| Total Occupied Housing Units | 1,525 | 100.0% |
Occupancy by Household Size in Paris
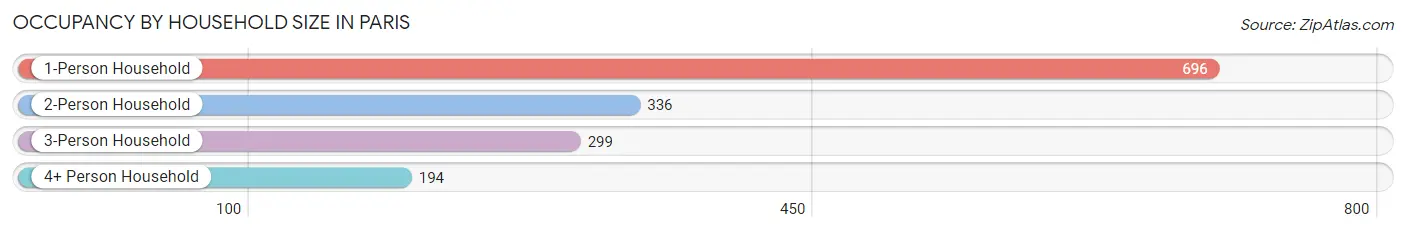
| Household Size | # Housing Units | % Housing Units |
| 1-Person Household | 696 | 45.6% |
| 2-Person Household | 336 | 22.0% |
| 3-Person Household | 299 | 19.6% |
| 4+ Person Household | 194 | 12.7% |
| Total Housing Units | 1,525 | 100.0% |
Occupancy by Ownership by Household Size in Paris
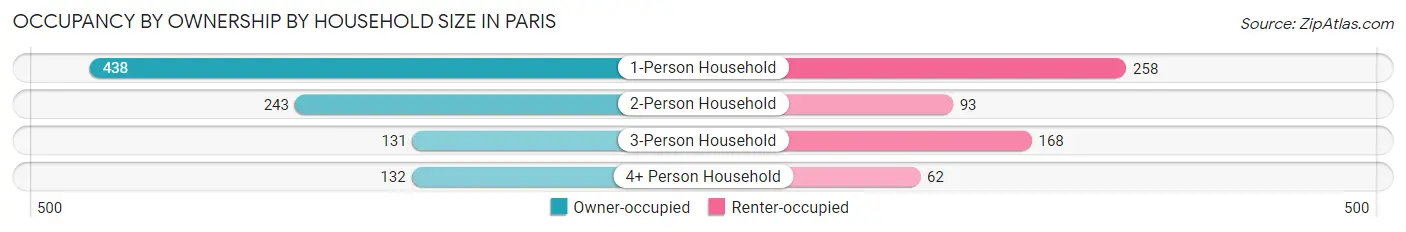
| Household Size | Owner-occupied | Renter-occupied |
| 1-Person Household | 438 (62.9%) | 258 (37.1%) |
| 2-Person Household | 243 (72.3%) | 93 (27.7%) |
| 3-Person Household | 131 (43.8%) | 168 (56.2%) |
| 4+ Person Household | 132 (68.0%) | 62 (32.0%) |
| Total Housing Units | 944 (61.9%) | 581 (38.1%) |
Occupancy by Educational Attainment in Paris
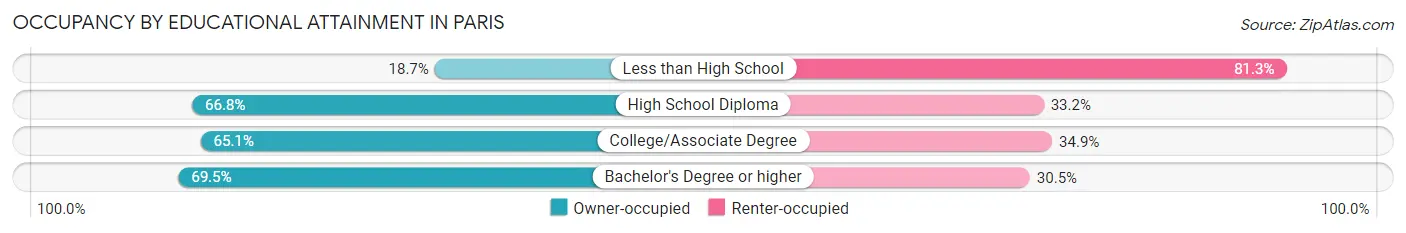
| Household Size | Owner-occupied | Renter-occupied |
| Less than High School | 29 (18.7%) | 126 (81.3%) |
| High School Diploma | 406 (66.8%) | 202 (33.2%) |
| College/Associate Degree | 306 (65.1%) | 164 (34.9%) |
| Bachelor's Degree or higher | 203 (69.5%) | 89 (30.5%) |
Occupancy by Age of Householder in Paris
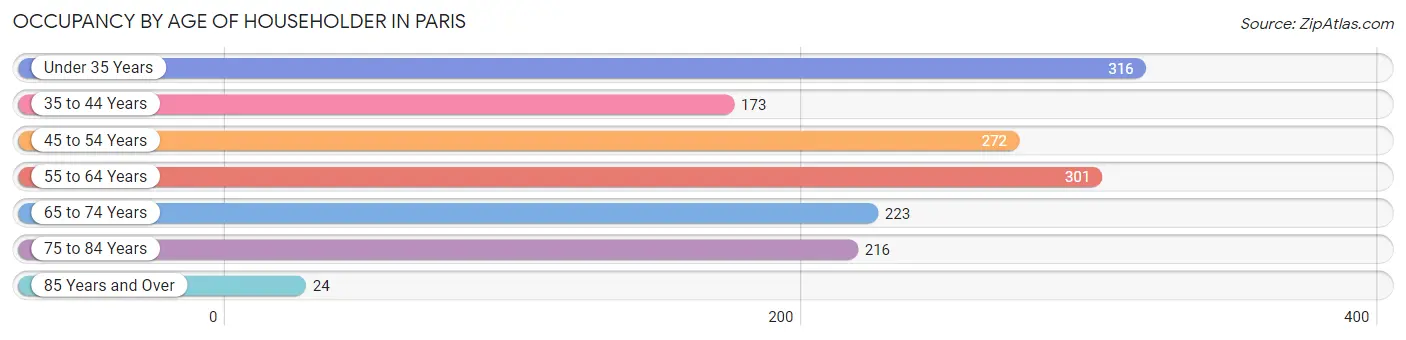
| Age Bracket | # Households | % Households |
| Under 35 Years | 316 | 20.7% |
| 35 to 44 Years | 173 | 11.3% |
| 45 to 54 Years | 272 | 17.8% |
| 55 to 64 Years | 301 | 19.7% |
| 65 to 74 Years | 223 | 14.6% |
| 75 to 84 Years | 216 | 14.2% |
| 85 Years and Over | 24 | 1.6% |
| Total | 1,525 | 100.0% |
Housing Finances in Paris
Median Income by Occupancy in Paris
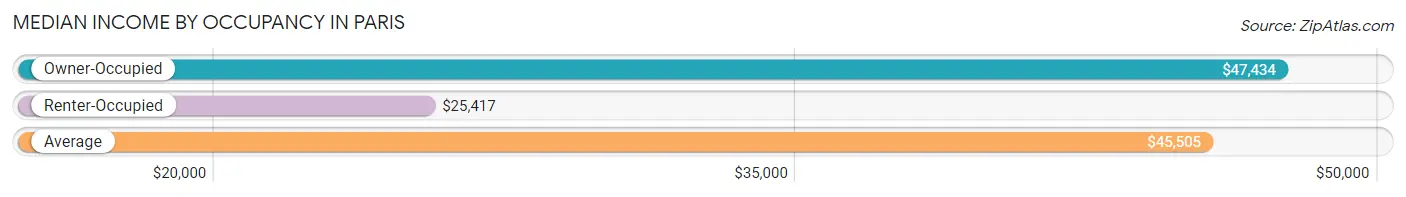
| Occupancy Type | # Households | Median Income |
| Owner-Occupied | 944 (61.9%) | $47,434 |
| Renter-Occupied | 581 (38.1%) | $25,417 |
| Average | 1,525 (100.0%) | $45,505 |
Occupancy by Householder Income Bracket in Paris
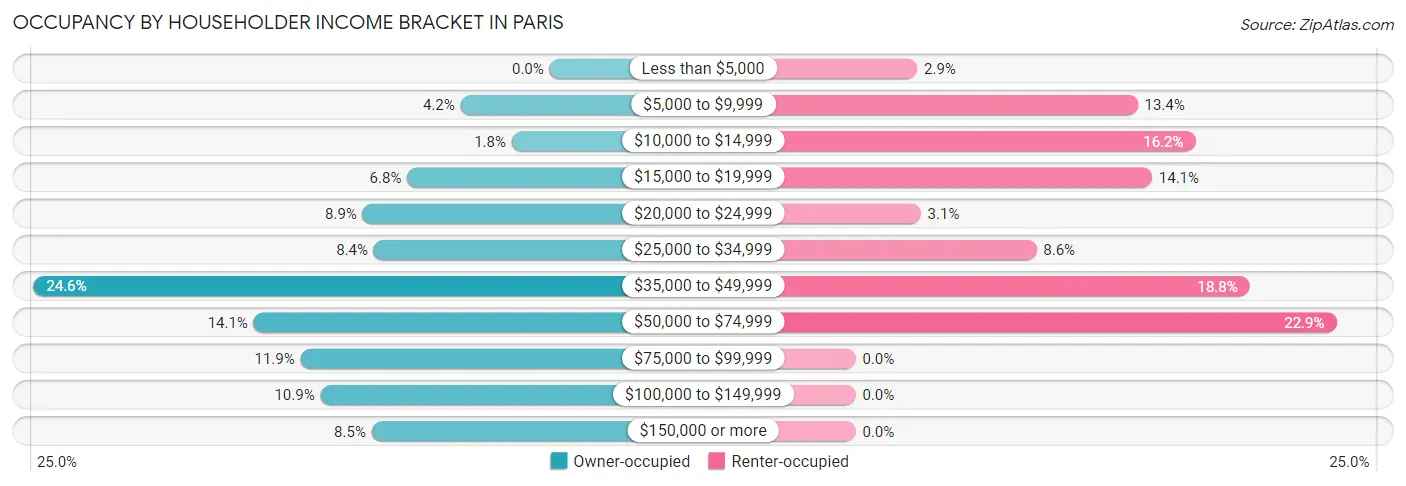
| Income Bracket | Owner-occupied | Renter-occupied |
| Less than $5,000 | 0 (0.0%) | 17 (2.9%) |
| $5,000 to $9,999 | 40 (4.2%) | 78 (13.4%) |
| $10,000 to $14,999 | 17 (1.8%) | 94 (16.2%) |
| $15,000 to $19,999 | 64 (6.8%) | 82 (14.1%) |
| $20,000 to $24,999 | 84 (8.9%) | 18 (3.1%) |
| $25,000 to $34,999 | 79 (8.4%) | 50 (8.6%) |
| $35,000 to $49,999 | 232 (24.6%) | 109 (18.8%) |
| $50,000 to $74,999 | 133 (14.1%) | 133 (22.9%) |
| $75,000 to $99,999 | 112 (11.9%) | 0 (0.0%) |
| $100,000 to $149,999 | 103 (10.9%) | 0 (0.0%) |
| $150,000 or more | 80 (8.5%) | 0 (0.0%) |
| Total | 944 (100.0%) | 581 (100.0%) |
Monthly Housing Cost Tiers in Paris
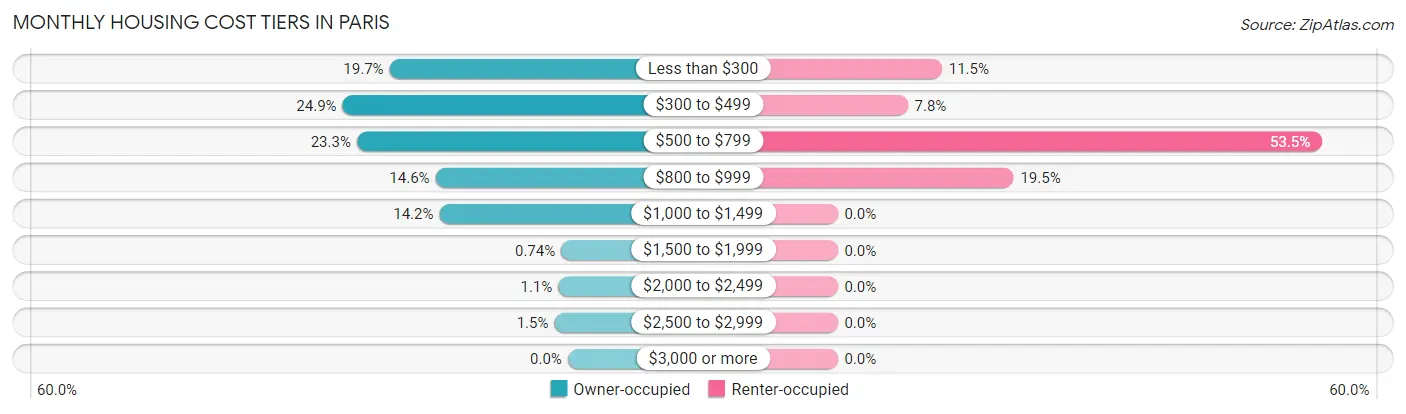
| Monthly Cost | Owner-occupied | Renter-occupied |
| Less than $300 | 186 (19.7%) | 67 (11.5%) |
| $300 to $499 | 235 (24.9%) | 45 (7.7%) |
| $500 to $799 | 220 (23.3%) | 311 (53.5%) |
| $800 to $999 | 138 (14.6%) | 113 (19.5%) |
| $1,000 to $1,499 | 134 (14.2%) | 0 (0.0%) |
| $1,500 to $1,999 | 7 (0.7%) | 0 (0.0%) |
| $2,000 to $2,499 | 10 (1.1%) | 0 (0.0%) |
| $2,500 to $2,999 | 14 (1.5%) | 0 (0.0%) |
| $3,000 or more | 0 (0.0%) | 0 (0.0%) |
| Total | 944 (100.0%) | 581 (100.0%) |
Physical Housing Characteristics in Paris
Housing Structures in Paris
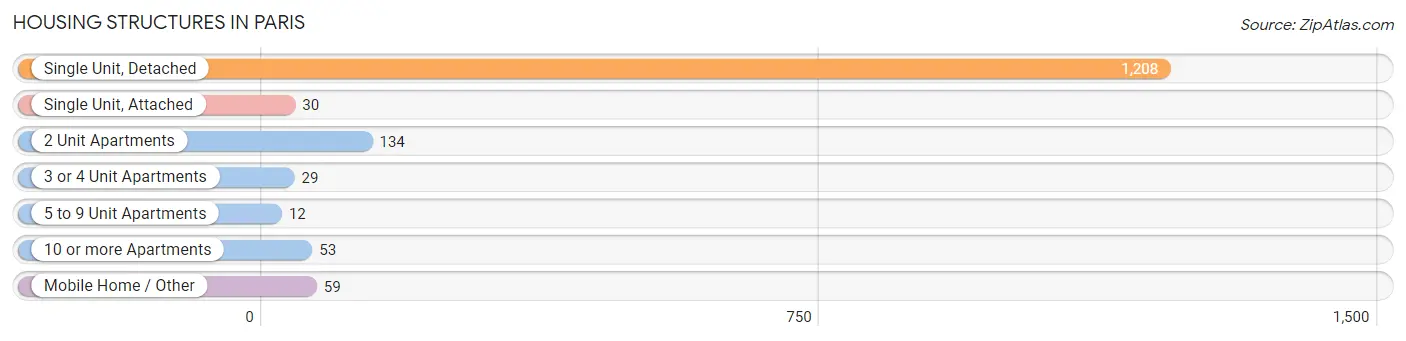
| Structure Type | # Housing Units | % Housing Units |
| Single Unit, Detached | 1,208 | 79.2% |
| Single Unit, Attached | 30 | 2.0% |
| 2 Unit Apartments | 134 | 8.8% |
| 3 or 4 Unit Apartments | 29 | 1.9% |
| 5 to 9 Unit Apartments | 12 | 0.8% |
| 10 or more Apartments | 53 | 3.5% |
| Mobile Home / Other | 59 | 3.9% |
| Total | 1,525 | 100.0% |
Housing Structures by Occupancy in Paris
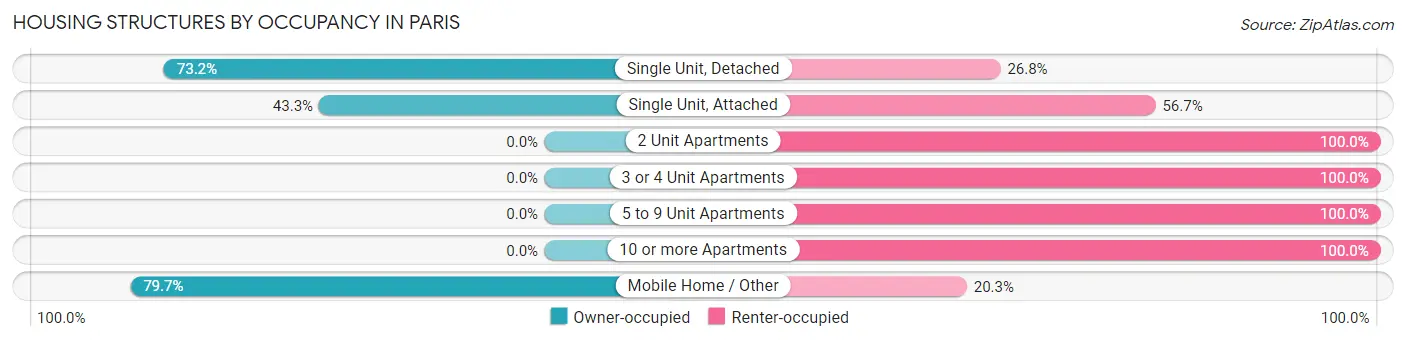
| Structure Type | Owner-occupied | Renter-occupied |
| Single Unit, Detached | 884 (73.2%) | 324 (26.8%) |
| Single Unit, Attached | 13 (43.3%) | 17 (56.7%) |
| 2 Unit Apartments | 0 (0.0%) | 134 (100.0%) |
| 3 or 4 Unit Apartments | 0 (0.0%) | 29 (100.0%) |
| 5 to 9 Unit Apartments | 0 (0.0%) | 12 (100.0%) |
| 10 or more Apartments | 0 (0.0%) | 53 (100.0%) |
| Mobile Home / Other | 47 (79.7%) | 12 (20.3%) |
| Total | 944 (61.9%) | 581 (38.1%) |
Housing Structures by Number of Rooms in Paris
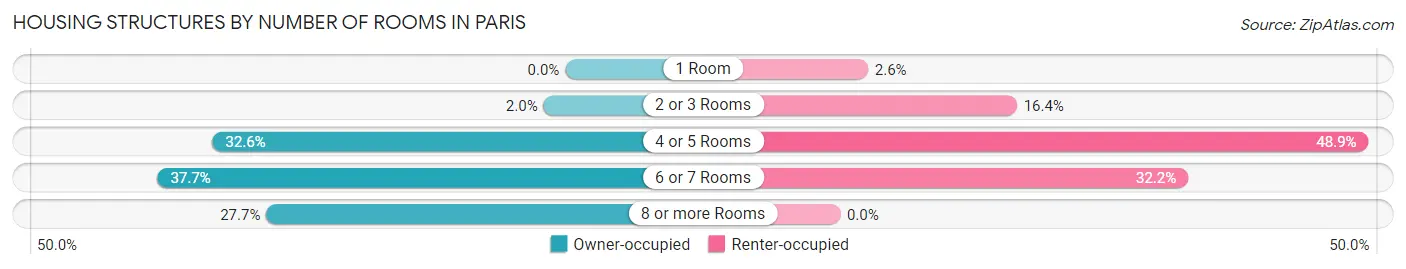
| Number of Rooms | Owner-occupied | Renter-occupied |
| 1 Room | 0 (0.0%) | 15 (2.6%) |
| 2 or 3 Rooms | 19 (2.0%) | 95 (16.4%) |
| 4 or 5 Rooms | 308 (32.6%) | 284 (48.9%) |
| 6 or 7 Rooms | 356 (37.7%) | 187 (32.2%) |
| 8 or more Rooms | 261 (27.7%) | 0 (0.0%) |
| Total | 944 (100.0%) | 581 (100.0%) |
Housing Structure by Heating Type in Paris
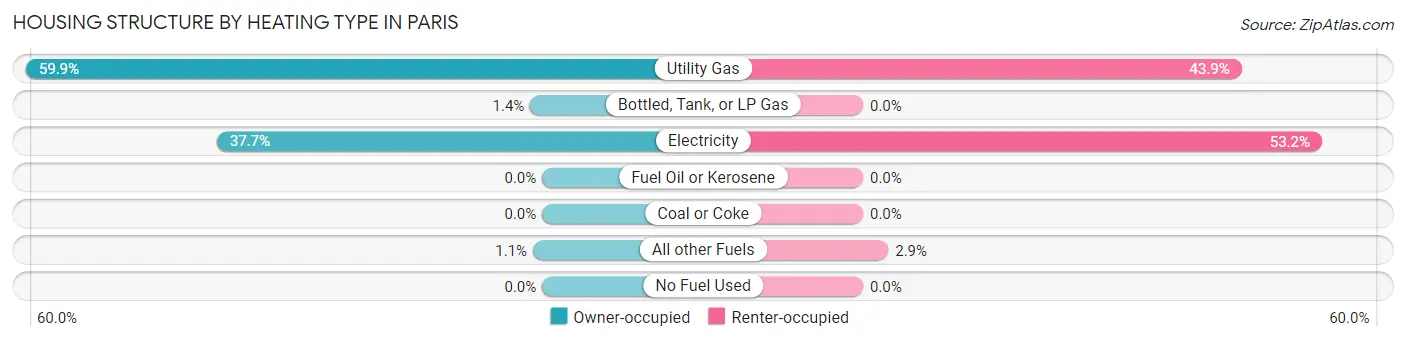
| Heating Type | Owner-occupied | Renter-occupied |
| Utility Gas | 565 (59.9%) | 255 (43.9%) |
| Bottled, Tank, or LP Gas | 13 (1.4%) | 0 (0.0%) |
| Electricity | 356 (37.7%) | 309 (53.2%) |
| Fuel Oil or Kerosene | 0 (0.0%) | 0 (0.0%) |
| Coal or Coke | 0 (0.0%) | 0 (0.0%) |
| All other Fuels | 10 (1.1%) | 17 (2.9%) |
| No Fuel Used | 0 (0.0%) | 0 (0.0%) |
| Total | 944 (100.0%) | 581 (100.0%) |
Household Vehicle Usage in Paris
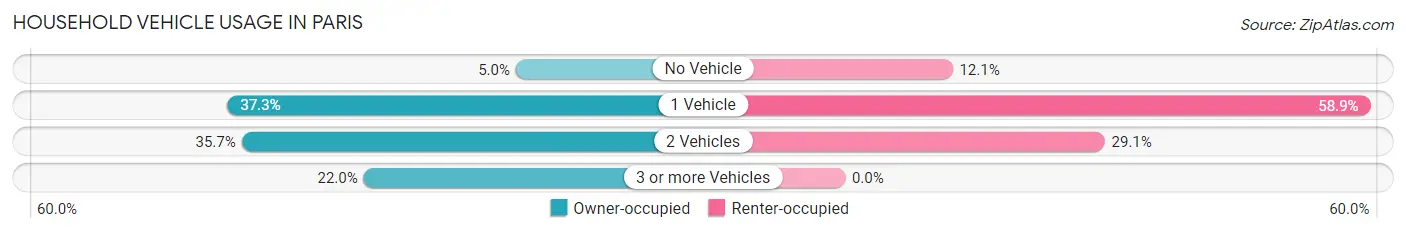
| Vehicles per Household | Owner-occupied | Renter-occupied |
| No Vehicle | 47 (5.0%) | 70 (12.0%) |
| 1 Vehicle | 352 (37.3%) | 342 (58.9%) |
| 2 Vehicles | 337 (35.7%) | 169 (29.1%) |
| 3 or more Vehicles | 208 (22.0%) | 0 (0.0%) |
| Total | 944 (100.0%) | 581 (100.0%) |
Real Estate & Mortgages in Paris
Real Estate and Mortgage Overview in Paris
| Characteristic | Without Mortgage | With Mortgage |
| Housing Units | 432 | 512 |
| Median Property Value | $101,900 | $129,400 |
| Median Household Income | $47,028 | $52 |
| Monthly Housing Costs | $345 | $0 |
| Real Estate Taxes | $643 | $20 |
Property Value by Mortgage Status in Paris
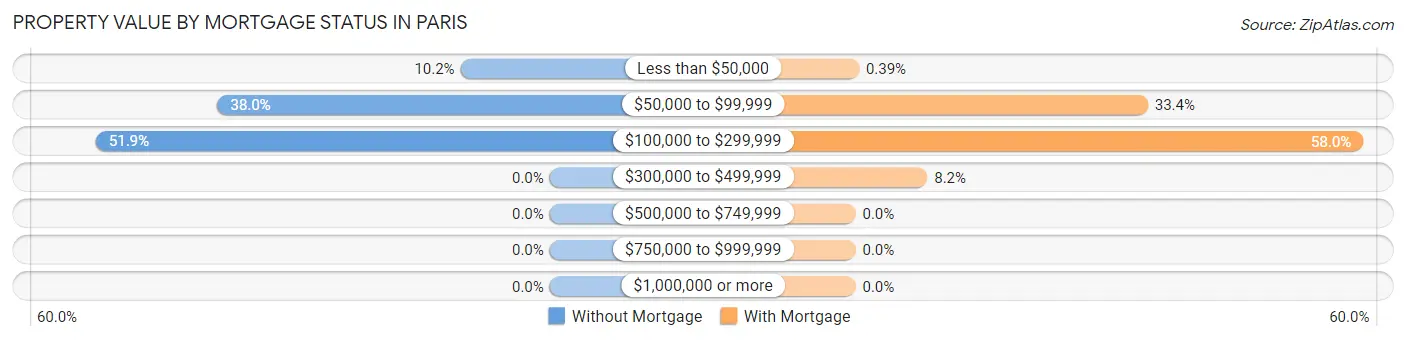
| Property Value | Without Mortgage | With Mortgage |
| Less than $50,000 | 44 (10.2%) | 2 (0.4%) |
| $50,000 to $99,999 | 164 (38.0%) | 171 (33.4%) |
| $100,000 to $299,999 | 224 (51.8%) | 297 (58.0%) |
| $300,000 to $499,999 | 0 (0.0%) | 42 (8.2%) |
| $500,000 to $749,999 | 0 (0.0%) | 0 (0.0%) |
| $750,000 to $999,999 | 0 (0.0%) | 0 (0.0%) |
| $1,000,000 or more | 0 (0.0%) | 0 (0.0%) |
| Total | 432 (100.0%) | 512 (100.0%) |
Household Income by Mortgage Status in Paris
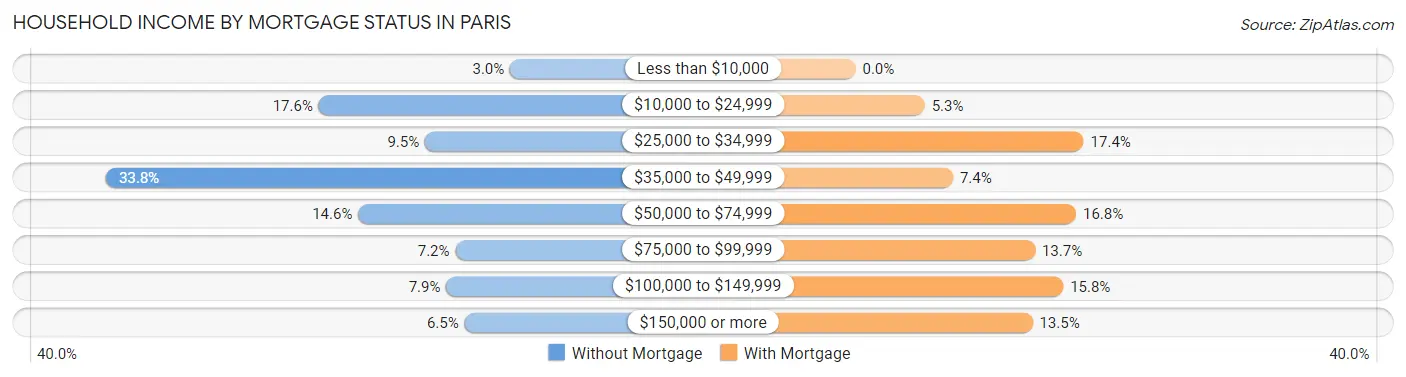
| Household Income | Without Mortgage | With Mortgage |
| Less than $10,000 | 13 (3.0%) | 0 (0.0%) |
| $10,000 to $24,999 | 76 (17.6%) | 27 (5.3%) |
| $25,000 to $34,999 | 41 (9.5%) | 89 (17.4%) |
| $35,000 to $49,999 | 146 (33.8%) | 38 (7.4%) |
| $50,000 to $74,999 | 63 (14.6%) | 86 (16.8%) |
| $75,000 to $99,999 | 31 (7.2%) | 70 (13.7%) |
| $100,000 to $149,999 | 34 (7.9%) | 81 (15.8%) |
| $150,000 or more | 28 (6.5%) | 69 (13.5%) |
| Total | 432 (100.0%) | 512 (100.0%) |
Property Value to Household Income Ratio in Paris
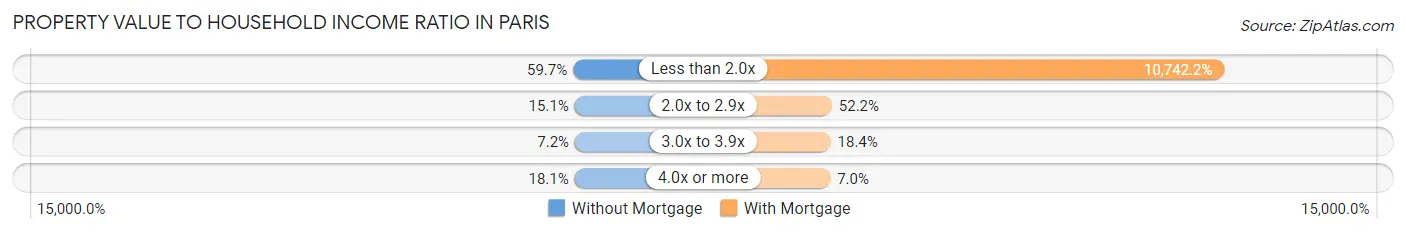
| Value-to-Income Ratio | Without Mortgage | With Mortgage |
| Less than 2.0x | 258 (59.7%) | 55,000 (10,742.2%) |
| 2.0x to 2.9x | 65 (15.0%) | 267 (52.1%) |
| 3.0x to 3.9x | 31 (7.2%) | 94 (18.4%) |
| 4.0x or more | 78 (18.1%) | 36 (7.0%) |
| Total | 432 (100.0%) | 512 (100.0%) |
Real Estate Taxes by Mortgage Status in Paris
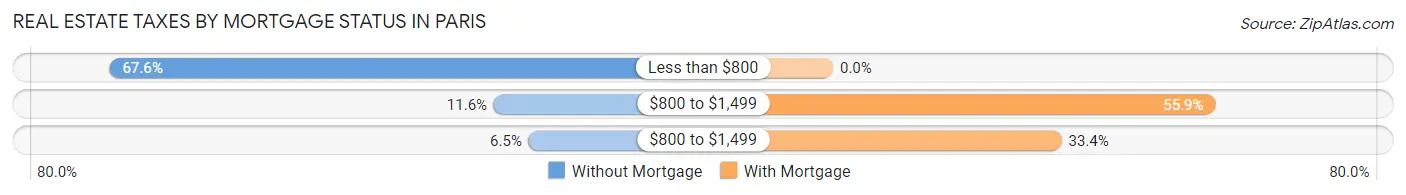
| Property Taxes | Without Mortgage | With Mortgage |
| Less than $800 | 292 (67.6%) | 0 (0.0%) |
| $800 to $1,499 | 50 (11.6%) | 286 (55.9%) |
| $800 to $1,499 | 28 (6.5%) | 171 (33.4%) |
| Total | 432 (100.0%) | 512 (100.0%) |
Health & Disability in Paris
Health Insurance Coverage by Age in Paris
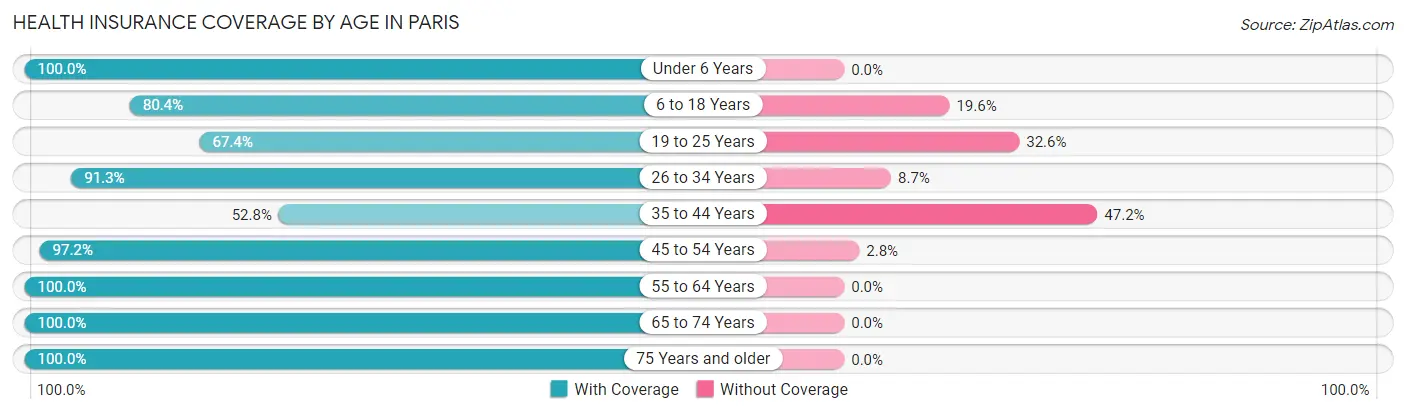
| Age Bracket | With Coverage | Without Coverage |
| Under 6 Years | 199 (100.0%) | 0 (0.0%) |
| 6 to 18 Years | 299 (80.4%) | 73 (19.6%) |
| 19 to 25 Years | 159 (67.4%) | 77 (32.6%) |
| 26 to 34 Years | 398 (91.3%) | 38 (8.7%) |
| 35 to 44 Years | 170 (52.8%) | 152 (47.2%) |
| 45 to 54 Years | 449 (97.2%) | 13 (2.8%) |
| 55 to 64 Years | 404 (100.0%) | 0 (0.0%) |
| 65 to 74 Years | 384 (100.0%) | 0 (0.0%) |
| 75 Years and older | 252 (100.0%) | 0 (0.0%) |
| Total | 2,714 (88.5%) | 353 (11.5%) |
Health Insurance Coverage by Citizenship Status in Paris

| Citizenship Status | With Coverage | Without Coverage |
| Native Born | 199 (100.0%) | 0 (0.0%) |
| Foreign Born, Citizen | 299 (80.4%) | 73 (19.6%) |
| Foreign Born, not a Citizen | 159 (67.4%) | 77 (32.6%) |
Health Insurance Coverage by Household Income in Paris
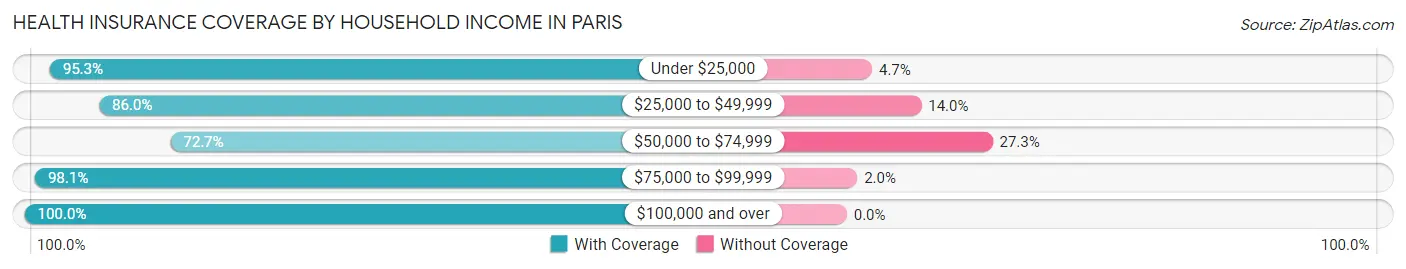
| Household Income | With Coverage | Without Coverage |
| Under $25,000 | 665 (95.3%) | 33 (4.7%) |
| $25,000 to $49,999 | 752 (86.0%) | 122 (14.0%) |
| $50,000 to $74,999 | 511 (72.7%) | 192 (27.3%) |
| $75,000 to $99,999 | 302 (98.1%) | 6 (1.9%) |
| $100,000 and over | 429 (100.0%) | 0 (0.0%) |
Public vs Private Health Insurance Coverage by Age in Paris
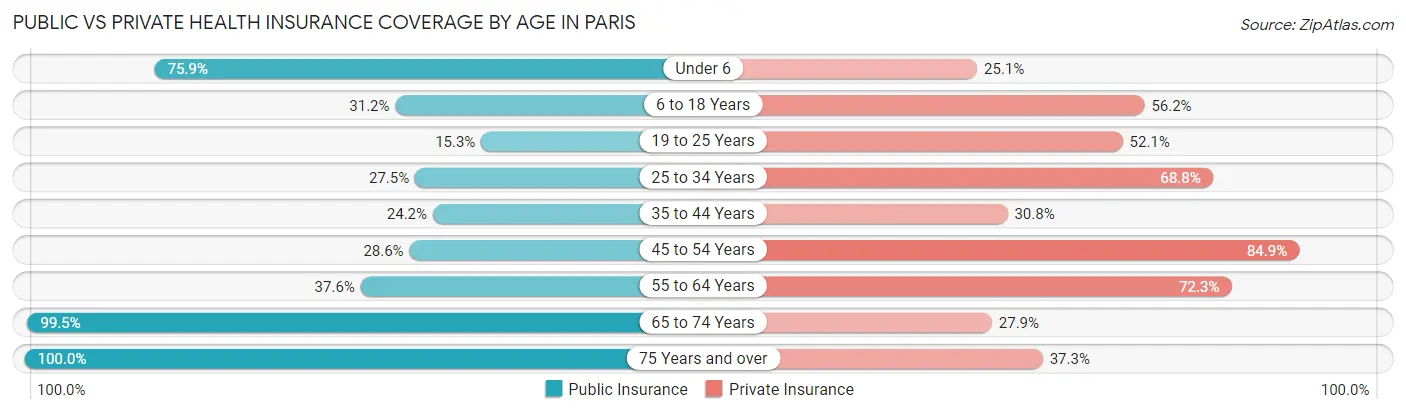
| Age Bracket | Public Insurance | Private Insurance |
| Under 6 | 151 (75.9%) | 50 (25.1%) |
| 6 to 18 Years | 116 (31.2%) | 209 (56.2%) |
| 19 to 25 Years | 36 (15.2%) | 123 (52.1%) |
| 25 to 34 Years | 120 (27.5%) | 300 (68.8%) |
| 35 to 44 Years | 78 (24.2%) | 99 (30.7%) |
| 45 to 54 Years | 132 (28.6%) | 392 (84.9%) |
| 55 to 64 Years | 152 (37.6%) | 292 (72.3%) |
| 65 to 74 Years | 382 (99.5%) | 107 (27.9%) |
| 75 Years and over | 252 (100.0%) | 94 (37.3%) |
| Total | 1,419 (46.3%) | 1,666 (54.3%) |
Disability Status by Sex by Age in Paris
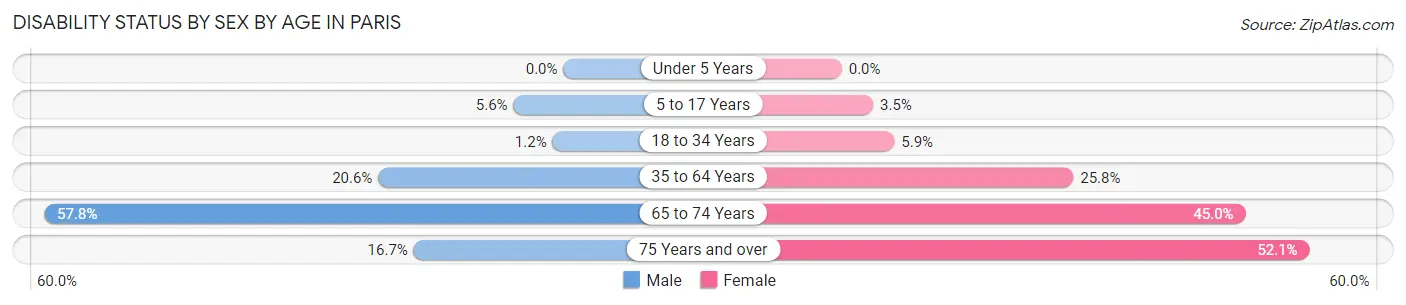
| Age Bracket | Male | Female |
| Under 5 Years | 0 (0.0%) | 0 (0.0%) |
| 5 to 17 Years | 8 (5.6%) | 9 (3.5%) |
| 18 to 34 Years | 4 (1.2%) | 20 (5.9%) |
| 35 to 64 Years | 133 (20.6%) | 140 (25.8%) |
| 65 to 74 Years | 96 (57.8%) | 98 (45.0%) |
| 75 Years and over | 10 (16.7%) | 100 (52.1%) |
Disability Class by Sex by Age in Paris
Disability Class: Hearing Difficulty
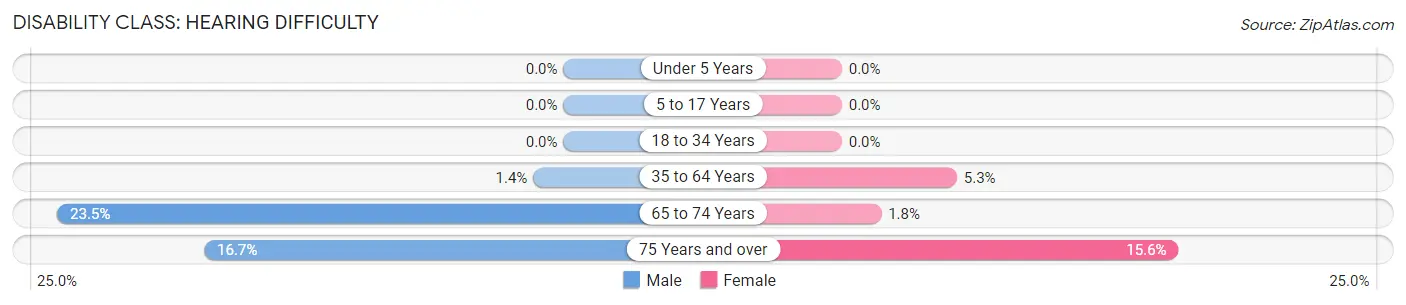
| Age Bracket | Male | Female |
| Under 5 Years | 0 (0.0%) | 0 (0.0%) |
| 5 to 17 Years | 0 (0.0%) | 0 (0.0%) |
| 18 to 34 Years | 0 (0.0%) | 0 (0.0%) |
| 35 to 64 Years | 9 (1.4%) | 29 (5.3%) |
| 65 to 74 Years | 39 (23.5%) | 4 (1.8%) |
| 75 Years and over | 10 (16.7%) | 30 (15.6%) |
Disability Class: Vision Difficulty
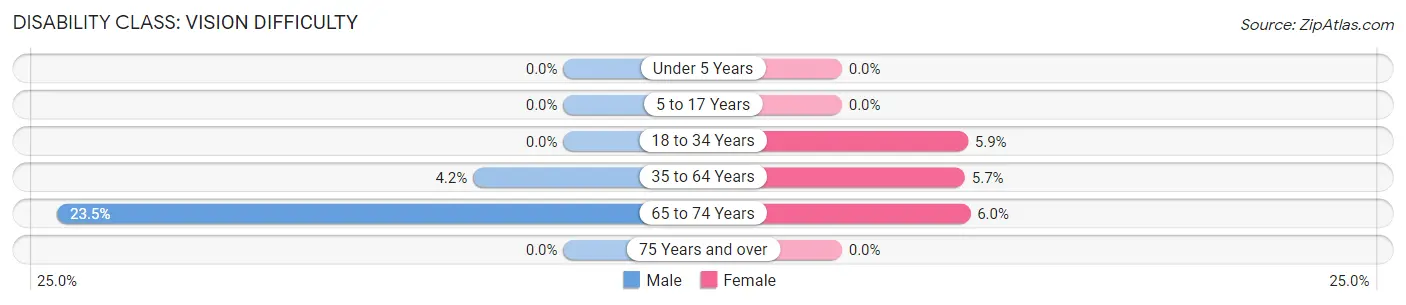
| Age Bracket | Male | Female |
| Under 5 Years | 0 (0.0%) | 0 (0.0%) |
| 5 to 17 Years | 0 (0.0%) | 0 (0.0%) |
| 18 to 34 Years | 0 (0.0%) | 20 (5.9%) |
| 35 to 64 Years | 27 (4.2%) | 31 (5.7%) |
| 65 to 74 Years | 39 (23.5%) | 13 (6.0%) |
| 75 Years and over | 0 (0.0%) | 0 (0.0%) |
Disability Class: Cognitive Difficulty
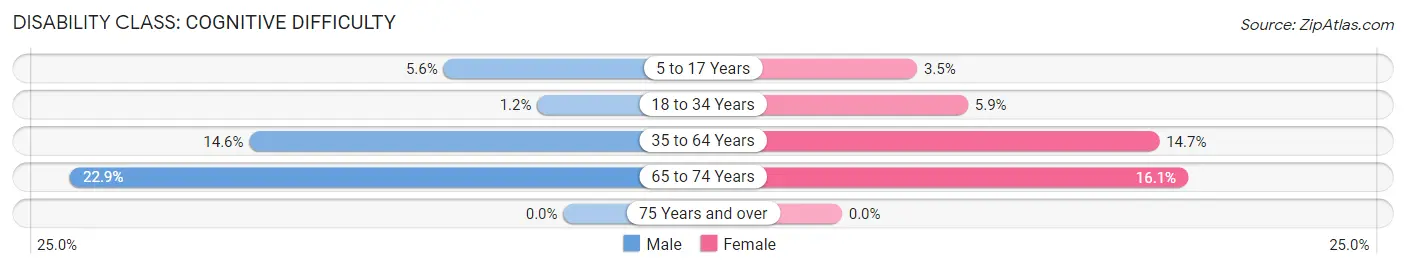
| Age Bracket | Male | Female |
| 5 to 17 Years | 8 (5.6%) | 9 (3.5%) |
| 18 to 34 Years | 4 (1.2%) | 20 (5.9%) |
| 35 to 64 Years | 94 (14.6%) | 80 (14.7%) |
| 65 to 74 Years | 38 (22.9%) | 35 (16.1%) |
| 75 Years and over | 0 (0.0%) | 0 (0.0%) |
Disability Class: Ambulatory Difficulty
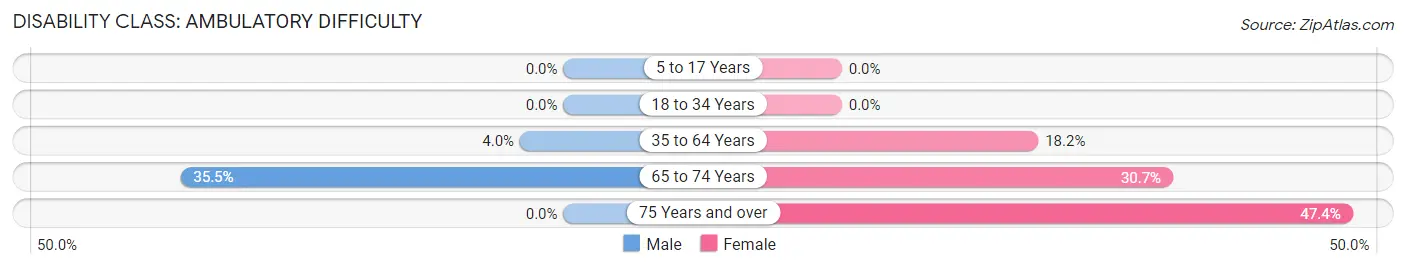
| Age Bracket | Male | Female |
| 5 to 17 Years | 0 (0.0%) | 0 (0.0%) |
| 18 to 34 Years | 0 (0.0%) | 0 (0.0%) |
| 35 to 64 Years | 26 (4.0%) | 99 (18.2%) |
| 65 to 74 Years | 59 (35.5%) | 67 (30.7%) |
| 75 Years and over | 0 (0.0%) | 91 (47.4%) |
Disability Class: Self-Care Difficulty

| Age Bracket | Male | Female |
| 5 to 17 Years | 0 (0.0%) | 0 (0.0%) |
| 18 to 34 Years | 0 (0.0%) | 0 (0.0%) |
| 35 to 64 Years | 7 (1.1%) | 35 (6.5%) |
| 65 to 74 Years | 38 (22.9%) | 0 (0.0%) |
| 75 Years and over | 0 (0.0%) | 16 (8.3%) |
Technology Access in Paris
Computing Device Access in Paris
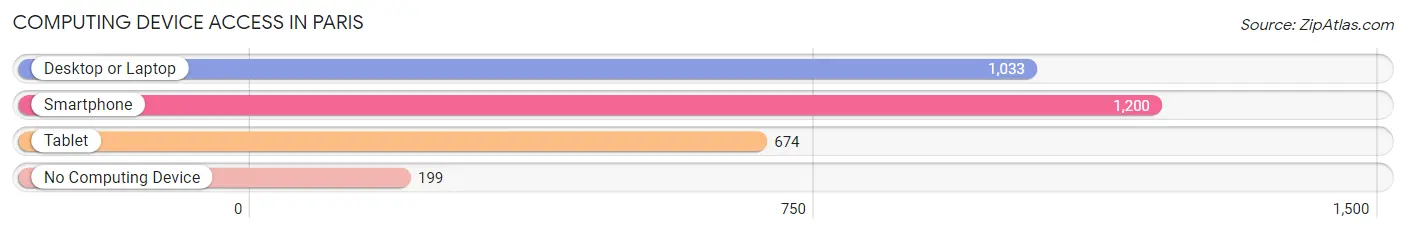
| Device Type | # Households | % Households |
| Desktop or Laptop | 1,033 | 67.7% |
| Smartphone | 1,200 | 78.7% |
| Tablet | 674 | 44.2% |
| No Computing Device | 199 | 13.1% |
| Total | 1,525 | 100.0% |
Internet Access in Paris
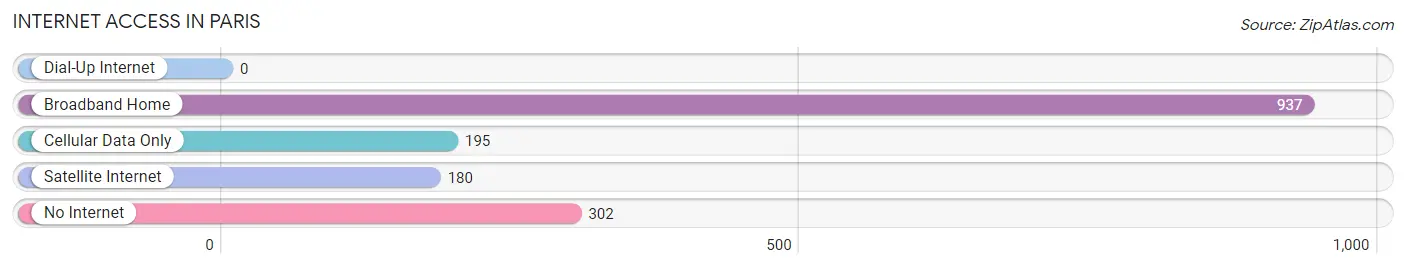
| Internet Type | # Households | % Households |
| Dial-Up Internet | 0 | 0.0% |
| Broadband Home | 937 | 61.4% |
| Cellular Data Only | 195 | 12.8% |
| Satellite Internet | 180 | 11.8% |
| No Internet | 302 | 19.8% |
| Total | 1,525 | 100.0% |
Paris Summary
Paris, Arkansas is a city located in the northwest corner of the state, in Logan County. It is the county seat of Logan County and is located on the Arkansas River. The city has a population of approximately 3,000 people and is part of the Fort Smith metropolitan area.
History
The area that is now Paris was first settled in 1819 by William and Mary Ann Martin, who built a log cabin on the banks of the Arkansas River. The area was known as Martin’s Bluff, and the Martins were the first settlers in the area. In 1821, the area was renamed Paris, after the French city of the same name.
In 1836, the town was officially incorporated and the first post office was established. The town grew slowly, but steadily, and by the late 1800s, it had become a thriving community. The town was home to several businesses, including a cotton gin, a grist mill, a sawmill, and a blacksmith shop.
In the early 1900s, the town began to experience a period of growth and prosperity. The railroad arrived in Paris in 1906, and the town was connected to the rest of the state. This allowed for the growth of the local economy and the population of the town began to grow.
In the 1920s, the town experienced a period of decline. The Great Depression hit the town hard, and many businesses closed. The population of the town began to decline, and by the 1940s, the population had dropped to just over 1,000 people.
In the 1950s, the town began to experience a period of growth and prosperity once again. The economy began to improve, and the population of the town began to grow. By the 1970s, the population had grown to over 3,000 people.
Geography
Paris is located in the northwest corner of the state, in Logan County. It is situated on the Arkansas River, and is surrounded by rolling hills and wooded areas. The city is located approximately 30 miles from Fort Smith, Arkansas, and is part of the Fort Smith metropolitan area.
The climate in Paris is humid subtropical, with hot, humid summers and mild winters. The average annual temperature is around 64 degrees Fahrenheit, and the average annual precipitation is around 45 inches.
Economy
The economy of Paris is largely based on agriculture and manufacturing. The city is home to several large manufacturing companies, including Tyson Foods, which is one of the largest employers in the city. Other major employers in the city include the University of Arkansas at Fort Smith, the Arkansas Department of Corrections, and the Arkansas Department of Human Services.
The city is also home to several small businesses, including restaurants, retail stores, and service providers. The city is also home to several tourist attractions, including the Paris Historic District, the Paris Museum of Art, and the Paris Aquatic Center.
Demographics
As of the 2010 census, the population of Paris was 3,072. The racial makeup of the city was 79.3% White, 17.2% African American, 0.3% Native American, 0.4% Asian, 0.1% Pacific Islander, 1.2% from other races, and 1.5% from two or more races. Hispanic or Latino of any race were 2.7% of the population.
The median income for a household in the city was $30,938, and the median income for a family was $37,917. The per capita income for the city was $17,845. About 17.2% of families and 20.3% of the population were below the poverty line, including 28.3% of those under age 18 and 14.2% of those age 65 or over.
Common Questions
What is Per Capita Income in Paris?
Per Capita income in Paris is $33,737.
What is the Median Family Income in Paris?
Median Family Income in Paris is $56,189.
What is the Median Household income in Paris?
Median Household Income in Paris is $45,505.
What is Income or Wage Gap in Paris?
Income or Wage Gap in Paris is 62.5%.
Women in Paris earn 37.5 cents for every dollar earned by a man.
What is Inequality or Gini Index in Paris?
Inequality or Gini Index in Paris is 0.56.
What is the Total Population of Paris?
Total Population of Paris is 3,214.
What is the Total Male Population of Paris?
Total Male Population of Paris is 1,489.
What is the Total Female Population of Paris?
Total Female Population of Paris is 1,725.
What is the Ratio of Males per 100 Females in Paris?
There are 86.32 Males per 100 Females in Paris.
What is the Ratio of Females per 100 Males in Paris?
There are 115.85 Females per 100 Males in Paris.
What is the Median Population Age in Paris?
Median Population Age in Paris is 45.1 Years.
What is the Average Family Size in Paris
Average Family Size in Paris is 2.8 People.
What is the Average Household Size in Paris
Average Household Size in Paris is 2.0 People.
How Large is the Labor Force in Paris?
There are 1,637 People in the Labor Forcein in Paris.
What is the Percentage of People in the Labor Force in Paris?
60.5% of People are in the Labor Force in Paris.
What is the Unemployment Rate in Paris?
Unemployment Rate in Paris is 7.6%.