Ola, AR Map & Demographics
Ola Map
Ola Overview
$21,753
PER CAPITA INCOME
$67,188
AVG FAMILY INCOME
$44,042
AVG HOUSEHOLD INCOME
36.3%
WAGE / INCOME GAP [ % ]
63.7¢/ $1
WAGE / INCOME GAP [ $ ]
$7,312
FAMILY INCOME DEFICIT
0.38
INEQUALITY / GINI INDEX
869
TOTAL POPULATION
416
MALE POPULATION
453
FEMALE POPULATION
91.83
MALES / 100 FEMALES
108.89
FEMALES / 100 MALES
44.7
MEDIAN AGE
2.8
AVG FAMILY SIZE
2.2
AVG HOUSEHOLD SIZE
345
LABOR FORCE [ PEOPLE ]
48.3%
PERCENT IN LABOR FORCE
6.7%
UNEMPLOYMENT RATE
Ola Zip Codes
Income in Ola
Income Overview in Ola
Per Capita Income in Ola is $21,753, while median incomes of families and households are $67,188 and $44,042 respectively.
| Characteristic | Number | Measure |
| Per Capita Income | 869 | $21,753 |
| Median Family Income | 223 | $67,188 |
| Mean Family Income | 223 | $63,775 |
| Median Household Income | 385 | $44,042 |
| Mean Household Income | 385 | $49,735 |
| Income Deficit | 223 | $7,312 |
| Wage / Income Gap (%) | 869 | 36.26% |
| Wage / Income Gap ($) | 869 | 63.74¢ per $1 |
| Gini / Inequality Index | 869 | 0.38 |
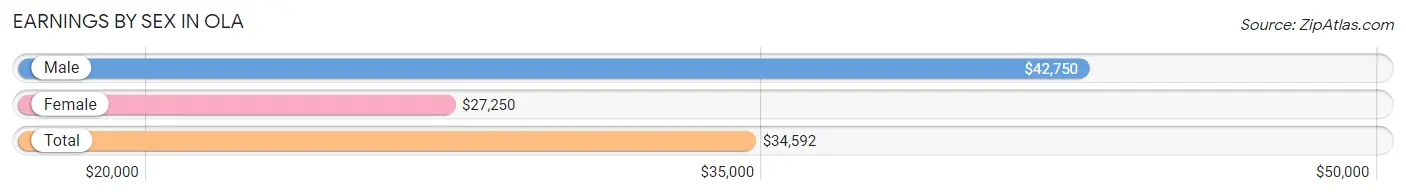
Earnings by Sex in Ola
Average Earnings in Ola are $34,592, $42,750 for men and $27,250 for women, a difference of 36.3%.
| Sex | Number | Average Earnings |
| Male | 183 (51.0%) | $42,750 |
| Female | 176 (49.0%) | $27,250 |
| Total | 359 (100.0%) | $34,592 |
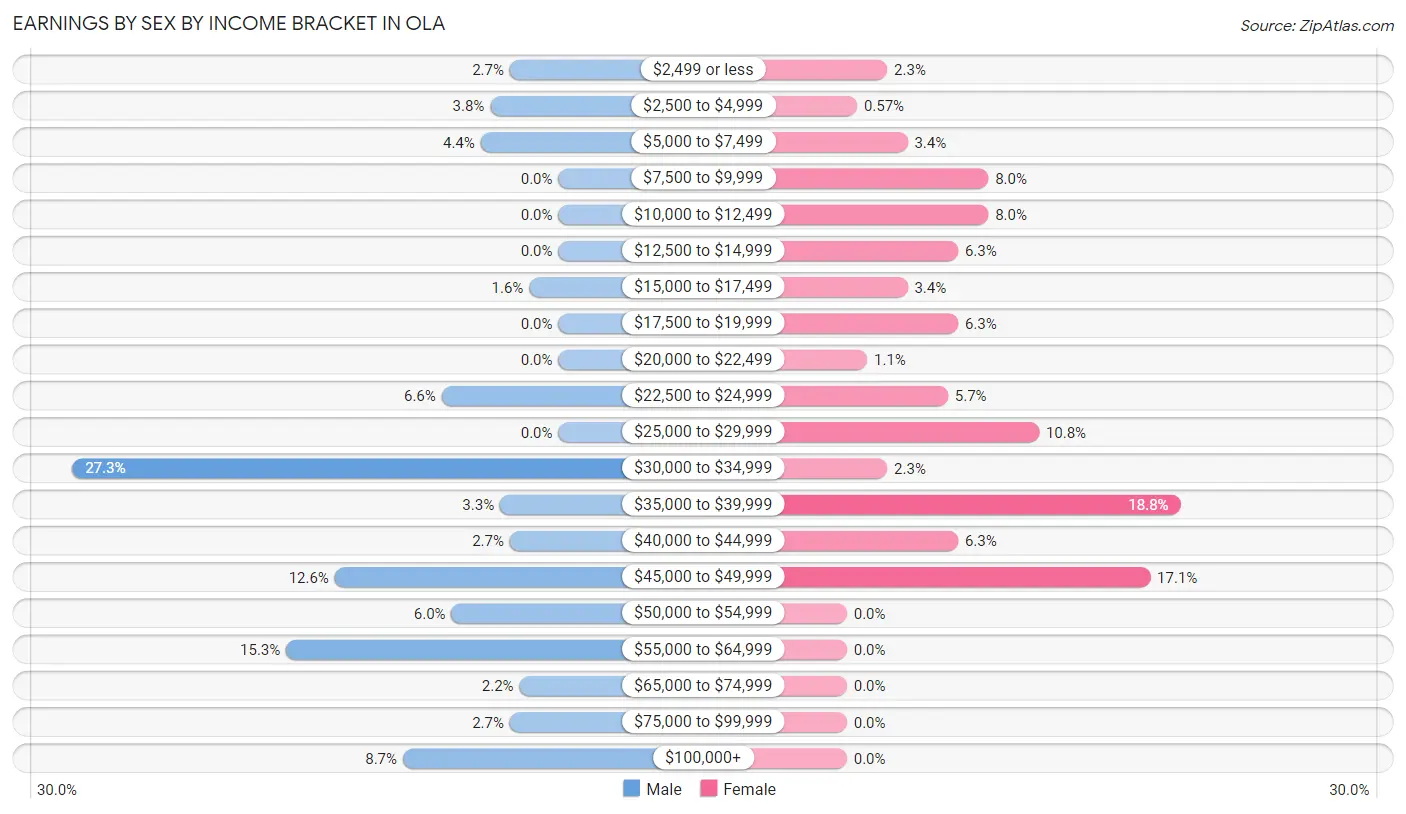
Earnings by Sex by Income Bracket in Ola
The most common earnings brackets in Ola are $30,000 to $34,999 for men (50 | 27.3%) and $35,000 to $39,999 for women (33 | 18.8%).
| Income | Male | Female |
| $2,499 or less | 5 (2.7%) | 4 (2.3%) |
| $2,500 to $4,999 | 7 (3.8%) | 1 (0.6%) |
| $5,000 to $7,499 | 8 (4.4%) | 6 (3.4%) |
| $7,500 to $9,999 | 0 (0.0%) | 14 (8.0%) |
| $10,000 to $12,499 | 0 (0.0%) | 14 (8.0%) |
| $12,500 to $14,999 | 0 (0.0%) | 11 (6.2%) |
| $15,000 to $17,499 | 3 (1.6%) | 6 (3.4%) |
| $17,500 to $19,999 | 0 (0.0%) | 11 (6.2%) |
| $20,000 to $22,499 | 0 (0.0%) | 2 (1.1%) |
| $22,500 to $24,999 | 12 (6.6%) | 10 (5.7%) |
| $25,000 to $29,999 | 0 (0.0%) | 19 (10.8%) |
| $30,000 to $34,999 | 50 (27.3%) | 4 (2.3%) |
| $35,000 to $39,999 | 6 (3.3%) | 33 (18.8%) |
| $40,000 to $44,999 | 5 (2.7%) | 11 (6.2%) |
| $45,000 to $49,999 | 23 (12.6%) | 30 (17.1%) |
| $50,000 to $54,999 | 11 (6.0%) | 0 (0.0%) |
| $55,000 to $64,999 | 28 (15.3%) | 0 (0.0%) |
| $65,000 to $74,999 | 4 (2.2%) | 0 (0.0%) |
| $75,000 to $99,999 | 5 (2.7%) | 0 (0.0%) |
| $100,000+ | 16 (8.7%) | 0 (0.0%) |
| Total | 183 (100.0%) | 176 (100.0%) |
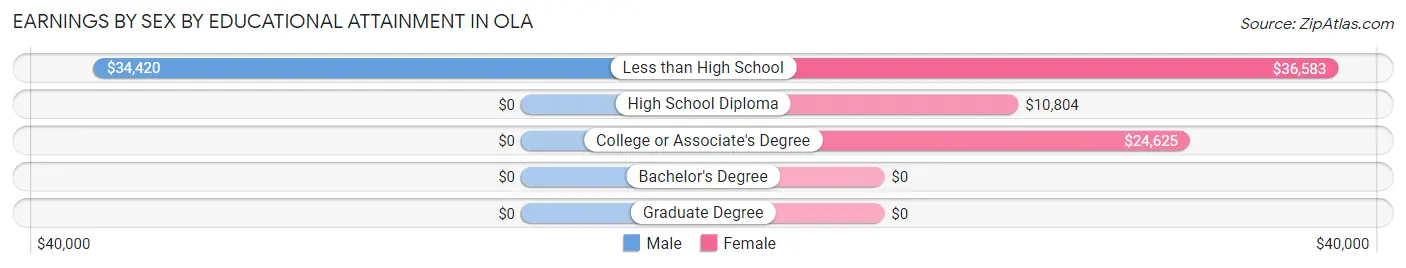
Earnings by Sex by Educational Attainment in Ola
Average earnings in Ola are $34,792 for men and $26,625 for women, a difference of 23.5%. Men with an educational attainment of less than high school enjoy the highest average annual earnings of $34,420, while those with less than high school education earn the least with $34,420. Women with an educational attainment of less than high school earn the most with the average annual earnings of $36,583, while those with high school diploma education have the smallest earnings of $10,804.
| Educational Attainment | Male Income | Female Income |
| Less than High School | $34,420 | $36,583 |
| High School Diploma | - | - |
| College or Associate's Degree | - | - |
| Bachelor's Degree | - | - |
| Graduate Degree | - | - |
| Total | $34,792 | $26,625 |
Family Income in Ola
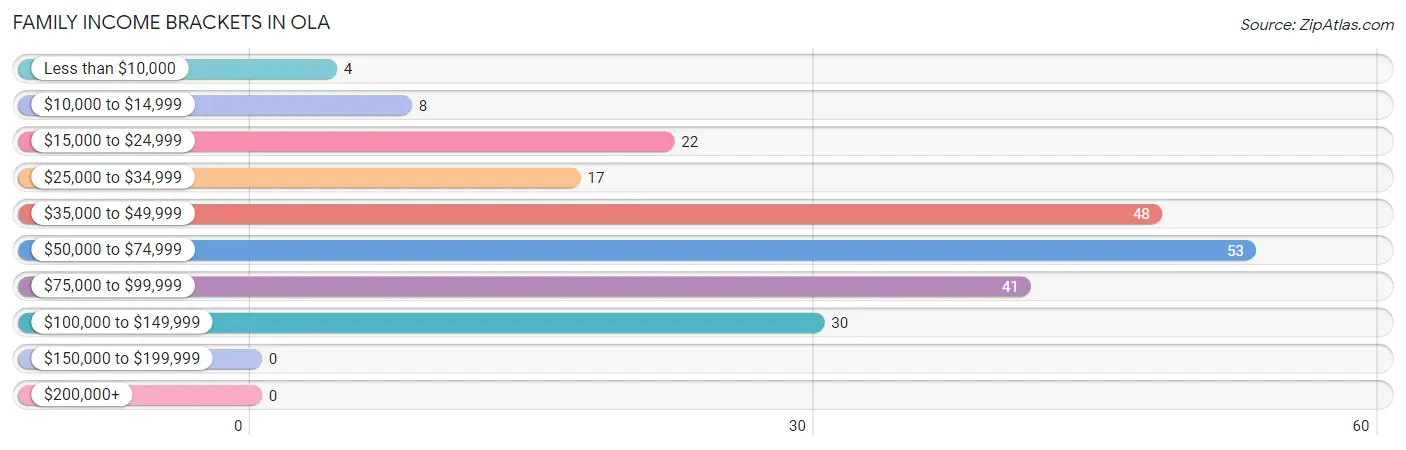
Family Income Brackets in Ola
According to the Ola family income data, there are 53 families falling into the $50,000 to $74,999 income range, which is the most common income bracket and makes up 23.8% of all families.
| Income Bracket | # Families | % Families |
| Less than $10,000 | 4 | 1.8% |
| $10,000 to $14,999 | 8 | 3.6% |
| $15,000 to $24,999 | 22 | 9.9% |
| $25,000 to $34,999 | 17 | 7.6% |
| $35,000 to $49,999 | 48 | 21.5% |
| $50,000 to $74,999 | 53 | 23.8% |
| $75,000 to $99,999 | 41 | 18.4% |
| $100,000 to $149,999 | 30 | 13.5% |
| $150,000 to $199,999 | 0 | 0.0% |
| $200,000+ | 0 | 0.0% |
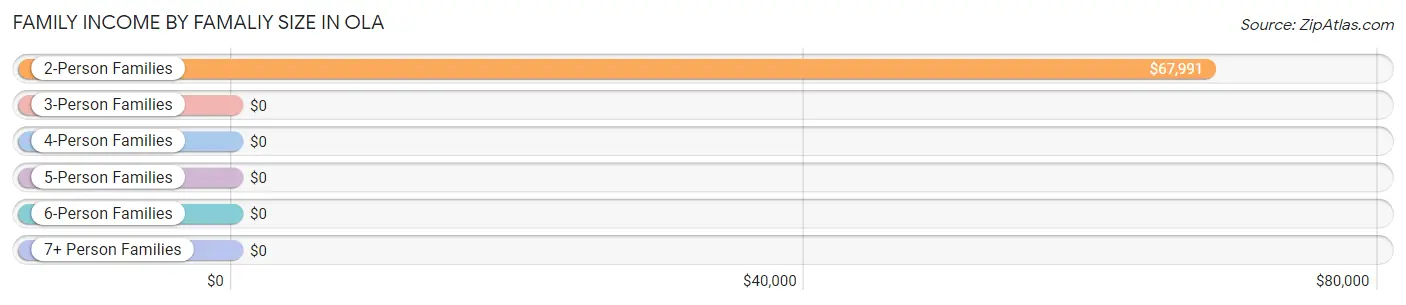
Family Income by Famaliy Size in Ola
2-person families (125 | 56.0%) account for the highest median family income in Ola with $67,991 per family, while 2-person families (125 | 56.0%) have the highest median income of $33,996 per family member.
| Income Bracket | # Families | Median Income |
| 2-Person Families | 125 (56.0%) | $67,991 |
| 3-Person Families | 38 (17.0%) | $0 |
| 4-Person Families | 24 (10.8%) | $0 |
| 5-Person Families | 14 (6.3%) | $0 |
| 6-Person Families | 15 (6.7%) | $0 |
| 7+ Person Families | 7 (3.1%) | $0 |
| Total | 223 (100.0%) | $67,188 |
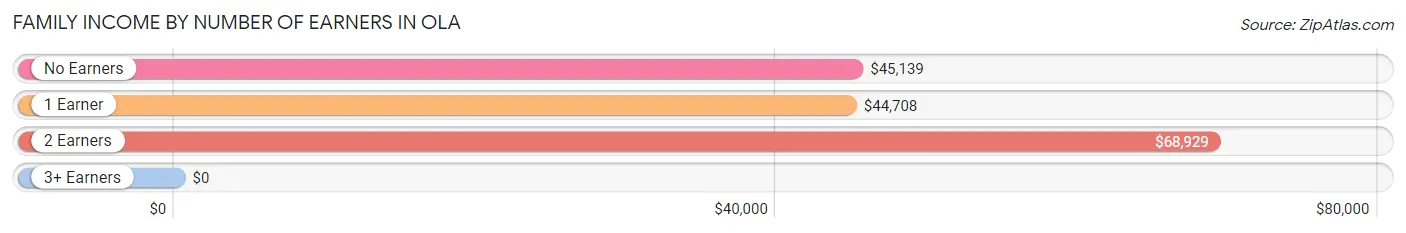
Family Income by Number of Earners in Ola
| Number of Earners | # Families | Median Income |
| No Earners | 17 (7.6%) | $45,139 |
| 1 Earner | 133 (59.6%) | $44,708 |
| 2 Earners | 56 (25.1%) | $68,929 |
| 3+ Earners | 17 (7.6%) | $0 |
| Total | 223 (100.0%) | $67,188 |
Household Income in Ola
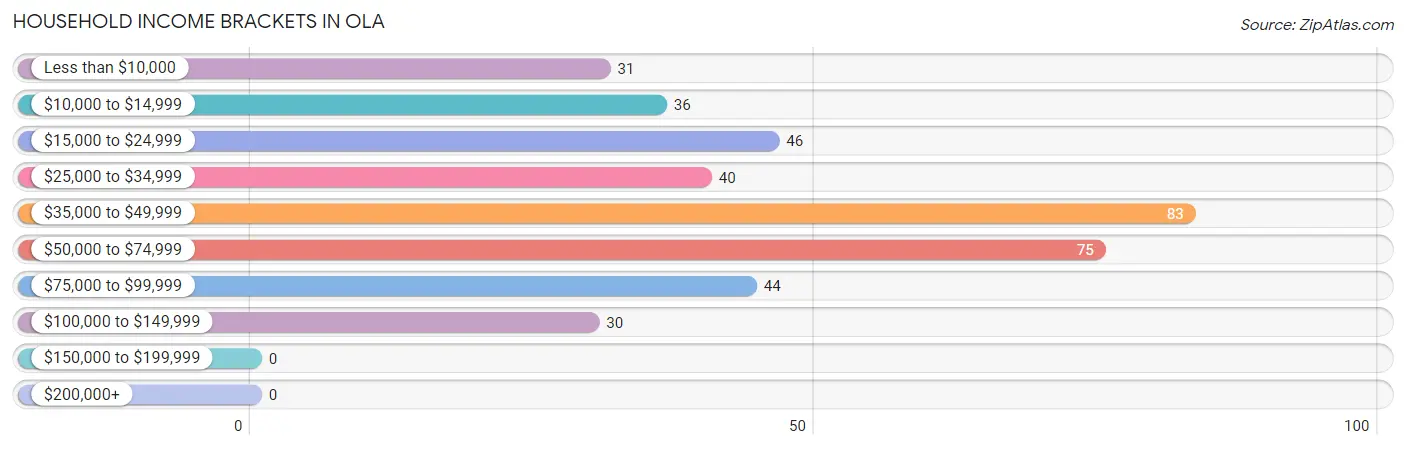
Household Income Brackets in Ola
With 83 households falling in the category, the $35,000 to $49,999 income range is the most frequent in Ola, accounting for 21.6% of all households.
| Income Bracket | # Households | % Households |
| Less than $10,000 | 31 | 8.1% |
| $10,000 to $14,999 | 36 | 9.4% |
| $15,000 to $24,999 | 46 | 11.9% |
| $25,000 to $34,999 | 40 | 10.4% |
| $35,000 to $49,999 | 83 | 21.6% |
| $50,000 to $74,999 | 75 | 19.5% |
| $75,000 to $99,999 | 44 | 11.4% |
| $100,000 to $149,999 | 30 | 7.8% |
| $150,000 to $199,999 | 0 | 0.0% |
| $200,000+ | 0 | 0.0% |
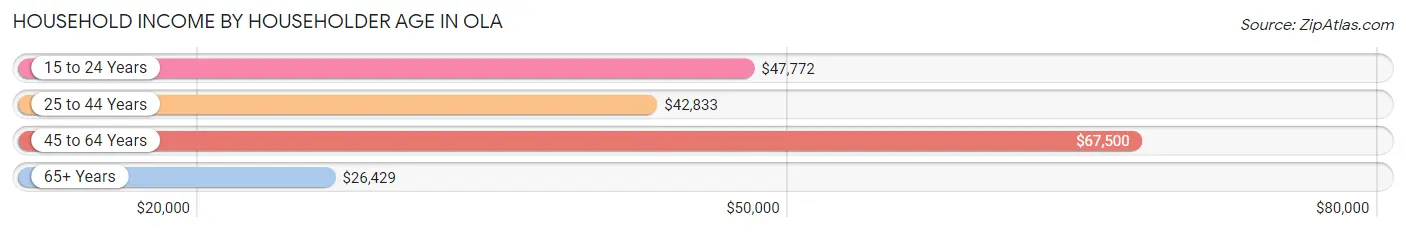
Household Income by Householder Age in Ola
The median household income in Ola is $44,042, with the highest median household income of $67,500 found in the 45 to 64 years age bracket for the primary householder. A total of 184 households (47.8%) fall into this category. Meanwhile, the 65+ years age bracket for the primary householder has the lowest median household income of $26,429, with 70 households (18.2%) in this group.
| Income Bracket | # Households | Median Income |
| 15 to 24 Years | 47 (12.2%) | $47,772 |
| 25 to 44 Years | 84 (21.8%) | $42,833 |
| 45 to 64 Years | 184 (47.8%) | $67,500 |
| 65+ Years | 70 (18.2%) | $26,429 |
| Total | 385 (100.0%) | $44,042 |
Poverty in Ola
Income Below Poverty by Sex and Age in Ola
With 22.6% poverty level for males and 28.4% for females among the residents of Ola, 35 to 44 year old males and under 5 year old females are the most vulnerable to poverty, with 24 males (80.0%) and 12 females (66.7%) in their respective age groups living below the poverty level.
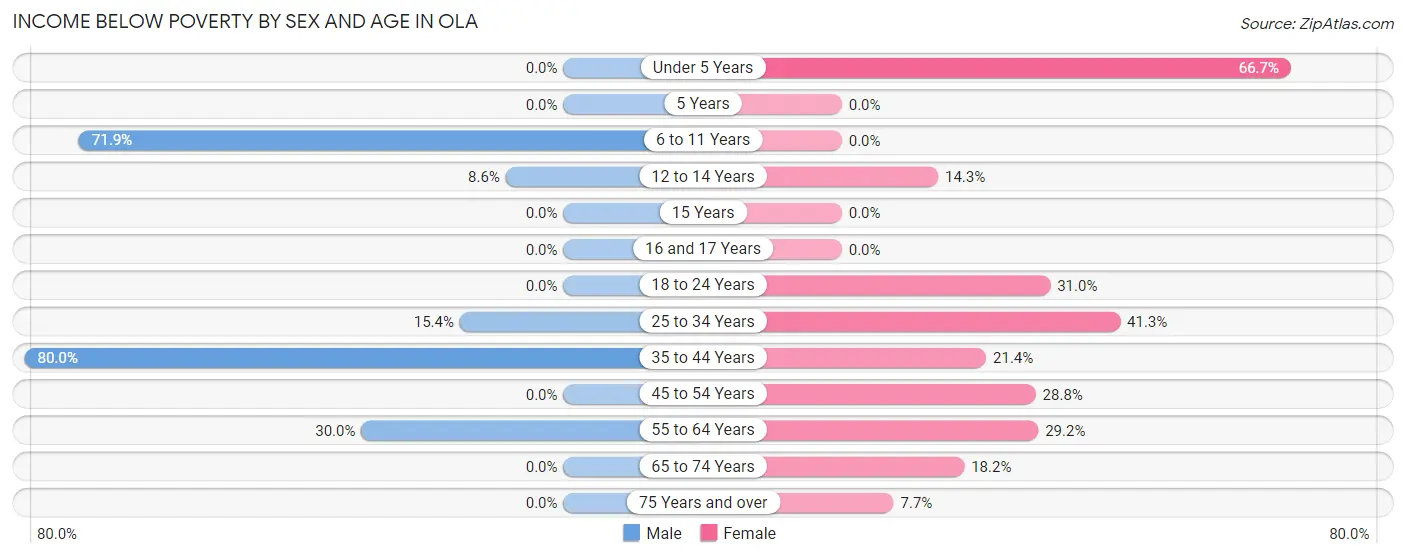
| Age Bracket | Male | Female |
| Under 5 Years | 0 (0.0%) | 12 (66.7%) |
| 5 Years | 0 (0.0%) | 0 (0.0%) |
| 6 to 11 Years | 41 (71.9%) | 0 (0.0%) |
| 12 to 14 Years | 3 (8.6%) | 2 (14.3%) |
| 15 Years | 0 (0.0%) | 0 (0.0%) |
| 16 and 17 Years | 0 (0.0%) | 0 (0.0%) |
| 18 to 24 Years | 0 (0.0%) | 13 (30.9%) |
| 25 to 34 Years | 6 (15.4%) | 31 (41.3%) |
| 35 to 44 Years | 24 (80.0%) | 6 (21.4%) |
| 45 to 54 Years | 0 (0.0%) | 19 (28.8%) |
| 55 to 64 Years | 18 (30.0%) | 28 (29.2%) |
| 65 to 74 Years | 0 (0.0%) | 6 (18.2%) |
| 75 Years and over | 0 (0.0%) | 3 (7.7%) |
| Total | 92 (22.6%) | 120 (28.4%) |
Income Above Poverty by Sex and Age in Ola
According to the poverty statistics in Ola, males aged under 5 years and females aged 6 to 11 years are the age groups that are most secure financially, with 100.0% of males and 100.0% of females in these age groups living above the poverty line.
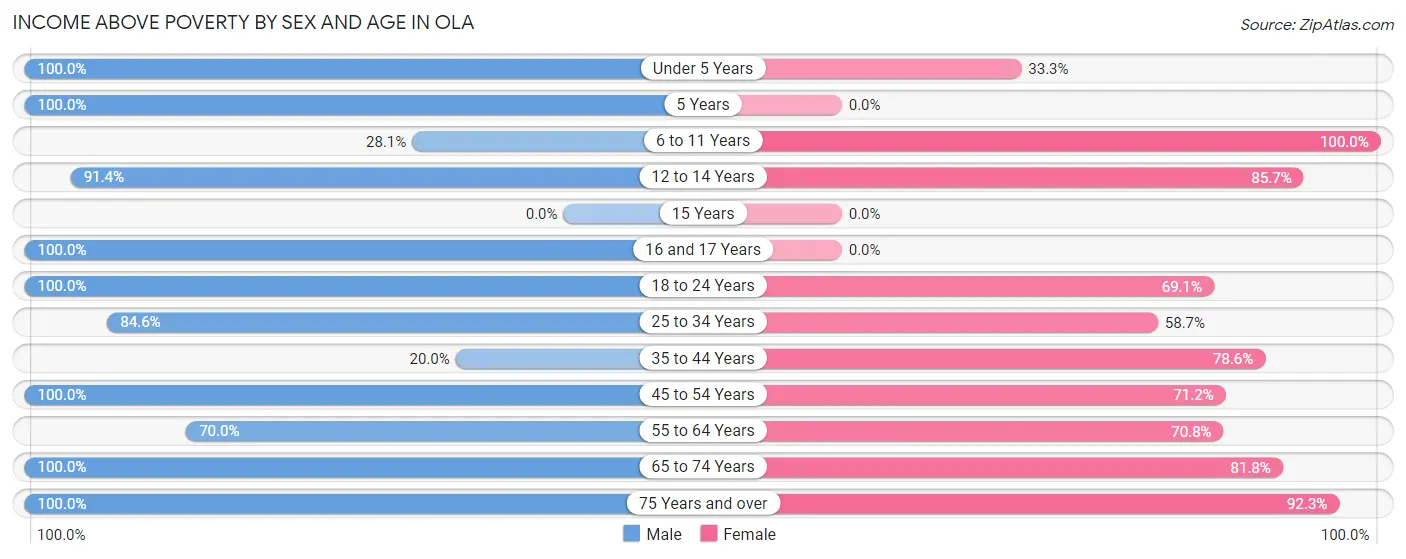
| Age Bracket | Male | Female |
| Under 5 Years | 9 (100.0%) | 6 (33.3%) |
| 5 Years | 11 (100.0%) | 0 (0.0%) |
| 6 to 11 Years | 16 (28.1%) | 11 (100.0%) |
| 12 to 14 Years | 32 (91.4%) | 12 (85.7%) |
| 15 Years | 0 (0.0%) | 0 (0.0%) |
| 16 and 17 Years | 4 (100.0%) | 0 (0.0%) |
| 18 to 24 Years | 58 (100.0%) | 29 (69.1%) |
| 25 to 34 Years | 33 (84.6%) | 44 (58.7%) |
| 35 to 44 Years | 6 (20.0%) | 22 (78.6%) |
| 45 to 54 Years | 66 (100.0%) | 47 (71.2%) |
| 55 to 64 Years | 42 (70.0%) | 68 (70.8%) |
| 65 to 74 Years | 25 (100.0%) | 27 (81.8%) |
| 75 Years and over | 14 (100.0%) | 36 (92.3%) |
| Total | 316 (77.4%) | 302 (71.6%) |
Income Below Poverty Among Married-Couple Families in Ola
The poverty statistics for married-couple families in Ola show that 15.0% or 22 of the total 147 families live below the poverty line. Families with 1 or 2 children have the highest poverty rate of 100.0%, comprising of 22 families. On the other hand, families with no children have the lowest poverty rate of 0.0%, which includes 0 families.
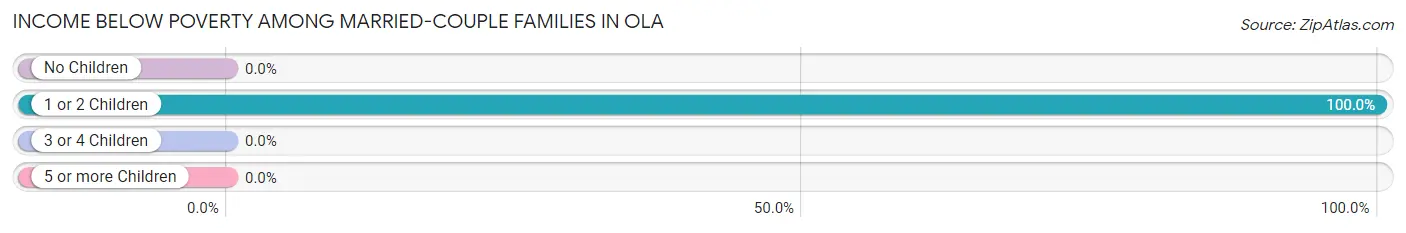
| Children | Above Poverty | Below Poverty |
| No Children | 118 (100.0%) | 0 (0.0%) |
| 1 or 2 Children | 0 (0.0%) | 22 (100.0%) |
| 3 or 4 Children | 7 (100.0%) | 0 (0.0%) |
| 5 or more Children | 0 (0.0%) | 0 (0.0%) |
| Total | 125 (85.0%) | 22 (15.0%) |
Income Below Poverty Among Single-Parent Households in Ola
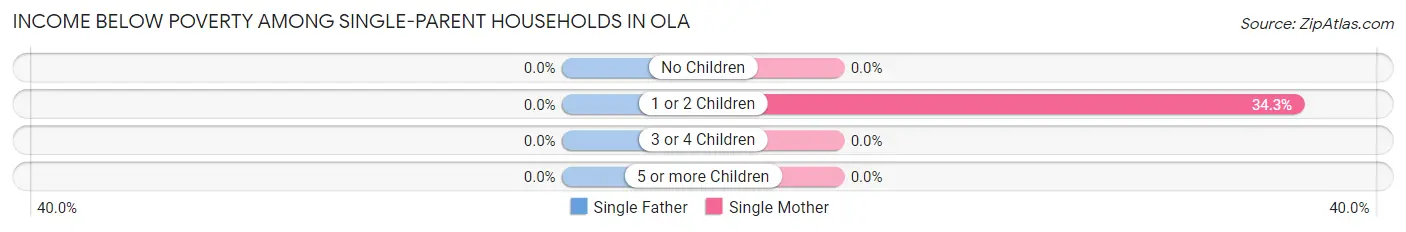
| Children | Single Father | Single Mother |
| No Children | 0 (0.0%) | 0 (0.0%) |
| 1 or 2 Children | 0 (0.0%) | 12 (34.3%) |
| 3 or 4 Children | 0 (0.0%) | 0 (0.0%) |
| 5 or more Children | 0 (0.0%) | 0 (0.0%) |
| Total | 0 (0.0%) | 12 (22.6%) |
Income Below Poverty Among Married-Couple vs Single-Parent Households in Ola
The poverty data for Ola shows that 22 of the married-couple family households (15.0%) and 12 of the single-parent households (15.8%) are living below the poverty level. Within the married-couple family households, those with 1 or 2 children have the highest poverty rate, with 22 households (100.0%) falling below the poverty line. Among the single-parent households, those with 1 or 2 children have the highest poverty rate, with 12 household (34.3%) living below poverty.
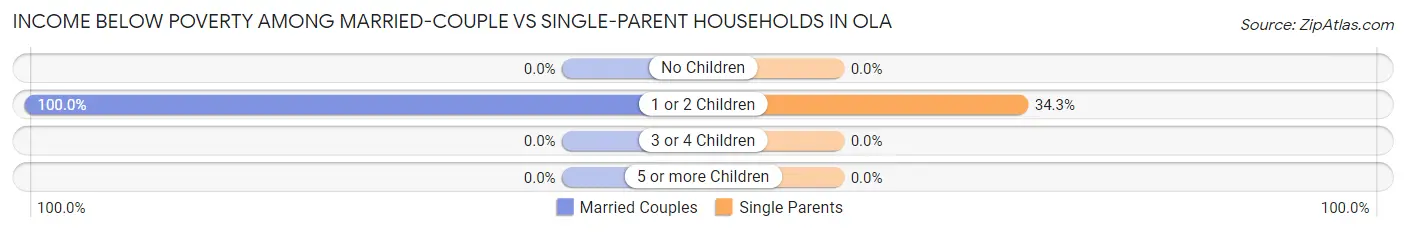
| Children | Married-Couple Families | Single-Parent Households |
| No Children | 0 (0.0%) | 0 (0.0%) |
| 1 or 2 Children | 22 (100.0%) | 12 (34.3%) |
| 3 or 4 Children | 0 (0.0%) | 0 (0.0%) |
| 5 or more Children | 0 (0.0%) | 0 (0.0%) |
| Total | 22 (15.0%) | 12 (15.8%) |
Race in Ola
The most populous races in Ola are White / Caucasian (767 | 88.3%), Hispanic or Latino (81 | 9.3%), and Some other Race (77 | 8.9%).
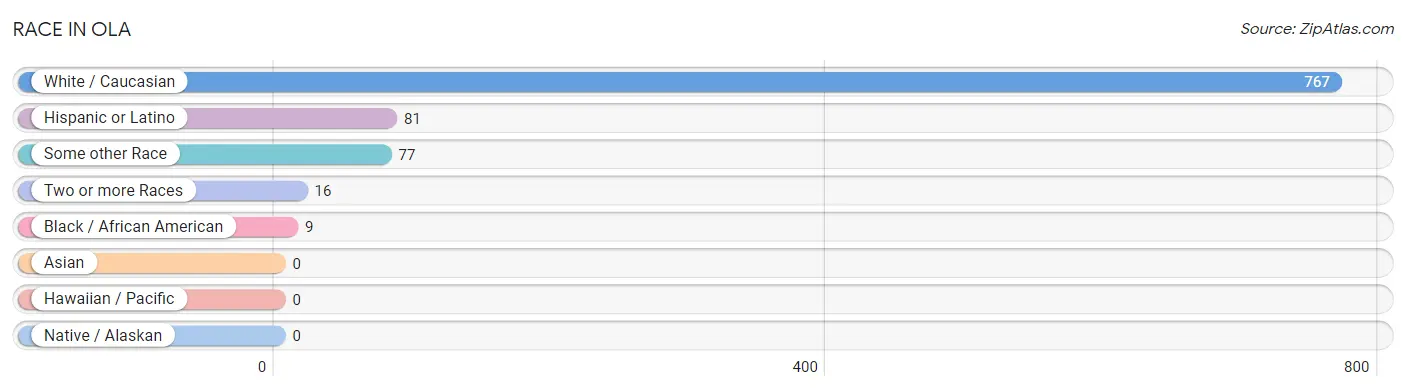
| Race | # Population | % Population |
| Asian | 0 | 0.0% |
| Black / African American | 9 | 1.0% |
| Hawaiian / Pacific | 0 | 0.0% |
| Hispanic or Latino | 81 | 9.3% |
| Native / Alaskan | 0 | 0.0% |
| White / Caucasian | 767 | 88.3% |
| Two or more Races | 16 | 1.8% |
| Some other Race | 77 | 8.9% |
| Total | 869 | 100.0% |
Ancestry in Ola
The most populous ancestries reported in Ola are American (120 | 13.8%), Mexican (77 | 8.9%), Irish (47 | 5.4%), German (41 | 4.7%), and Dutch (29 | 3.3%), together accounting for 36.1% of all Ola residents.
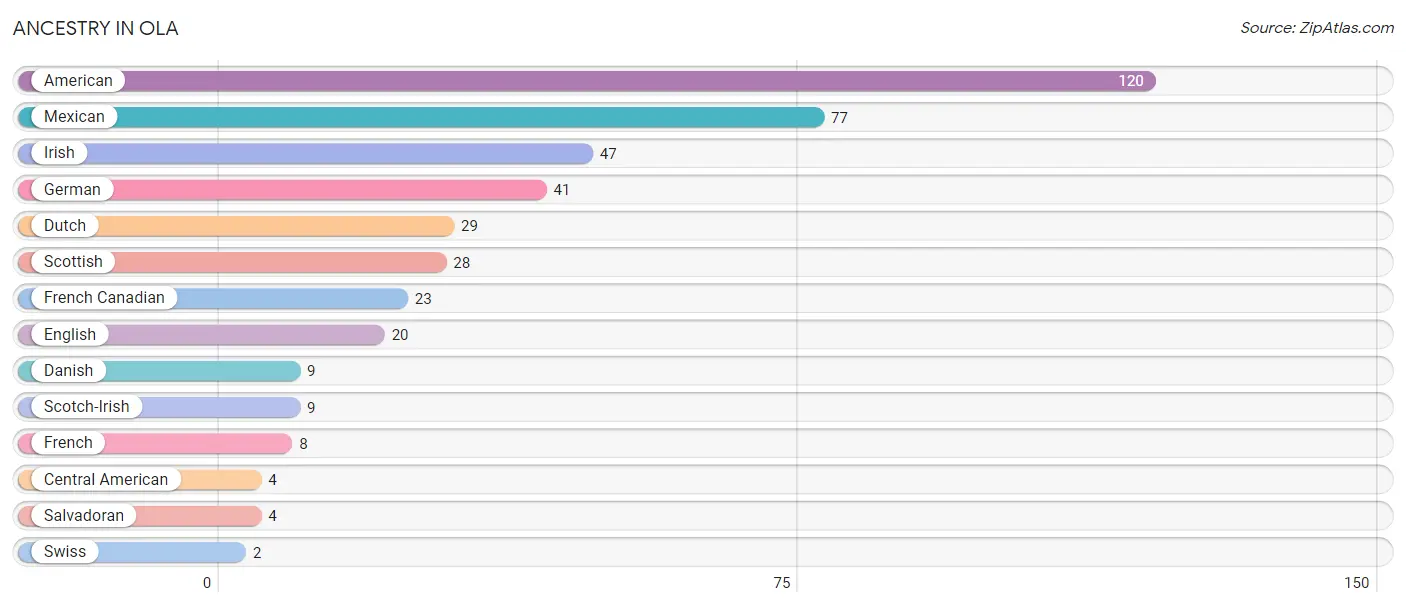
| Ancestry | # Population | % Population |
| American | 120 | 13.8% |
| Central American | 4 | 0.5% |
| Danish | 9 | 1.0% |
| Dutch | 29 | 3.3% |
| English | 20 | 2.3% |
| French | 8 | 0.9% |
| French Canadian | 23 | 2.6% |
| German | 41 | 4.7% |
| Irish | 47 | 5.4% |
| Mexican | 77 | 8.9% |
| Salvadoran | 4 | 0.5% |
| Scotch-Irish | 9 | 1.0% |
| Scottish | 28 | 3.2% |
| Swiss | 2 | 0.2% | View All 14 Rows |
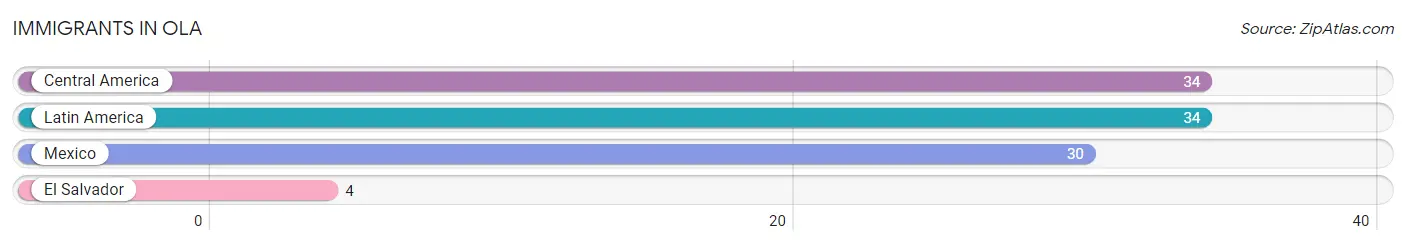
Immigrants in Ola
The most numerous immigrant groups reported in Ola came from Central America (34 | 3.9%), Latin America (34 | 3.9%), Mexico (30 | 3.5%), and El Salvador (4 | 0.5%), together accounting for 11.7% of all Ola residents.
| Immigration Origin | # Population | % Population |
| Central America | 34 | 3.9% |
| El Salvador | 4 | 0.5% |
| Latin America | 34 | 3.9% |
| Mexico | 30 | 3.5% | View All 4 Rows |
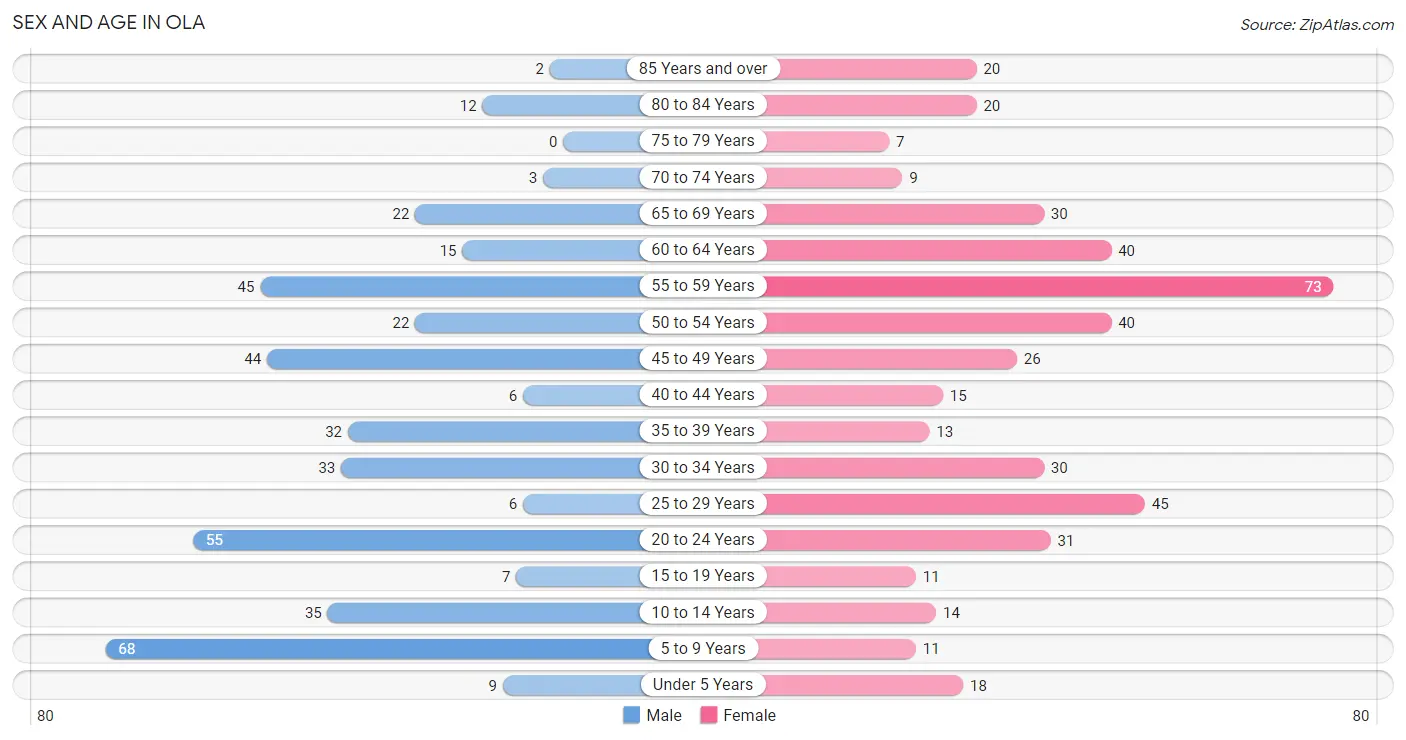
Sex and Age in Ola
Sex and Age in Ola
The most populous age groups in Ola are 5 to 9 Years (68 | 16.4%) for men and 55 to 59 Years (73 | 16.1%) for women.
| Age Bracket | Male | Female |
| Under 5 Years | 9 (2.2%) | 18 (4.0%) |
| 5 to 9 Years | 68 (16.4%) | 11 (2.4%) |
| 10 to 14 Years | 35 (8.4%) | 14 (3.1%) |
| 15 to 19 Years | 7 (1.7%) | 11 (2.4%) |
| 20 to 24 Years | 55 (13.2%) | 31 (6.8%) |
| 25 to 29 Years | 6 (1.4%) | 45 (9.9%) |
| 30 to 34 Years | 33 (7.9%) | 30 (6.6%) |
| 35 to 39 Years | 32 (7.7%) | 13 (2.9%) |
| 40 to 44 Years | 6 (1.4%) | 15 (3.3%) |
| 45 to 49 Years | 44 (10.6%) | 26 (5.7%) |
| 50 to 54 Years | 22 (5.3%) | 40 (8.8%) |
| 55 to 59 Years | 45 (10.8%) | 73 (16.1%) |
| 60 to 64 Years | 15 (3.6%) | 40 (8.8%) |
| 65 to 69 Years | 22 (5.3%) | 30 (6.6%) |
| 70 to 74 Years | 3 (0.7%) | 9 (2.0%) |
| 75 to 79 Years | 0 (0.0%) | 7 (1.5%) |
| 80 to 84 Years | 12 (2.9%) | 20 (4.4%) |
| 85 Years and over | 2 (0.5%) | 20 (4.4%) |
| Total | 416 (100.0%) | 453 (100.0%) |
Families and Households in Ola
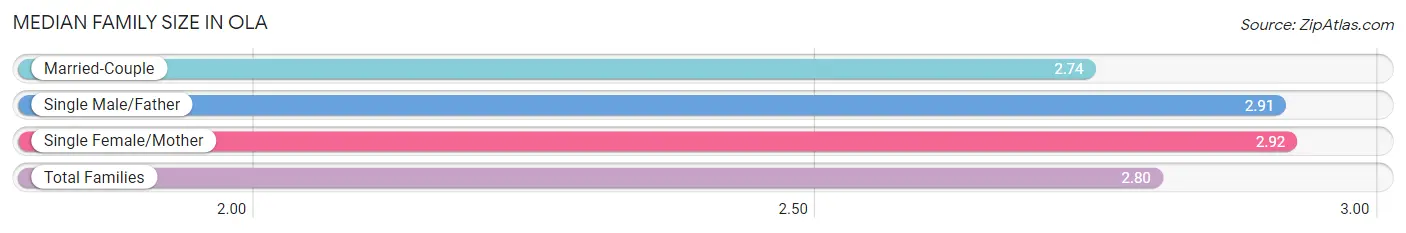
Median Family Size in Ola
The median family size in Ola is 2.80 persons per family, with single female/mother families (53 | 23.8%) accounting for the largest median family size of 2.92 persons per family. On the other hand, married-couple families (147 | 65.9%) represent the smallest median family size with 2.74 persons per family.
| Family Type | # Families | Family Size |
| Married-Couple | 147 (65.9%) | 2.74 |
| Single Male/Father | 23 (10.3%) | 2.91 |
| Single Female/Mother | 53 (23.8%) | 2.92 |
| Total Families | 223 (100.0%) | 2.80 |
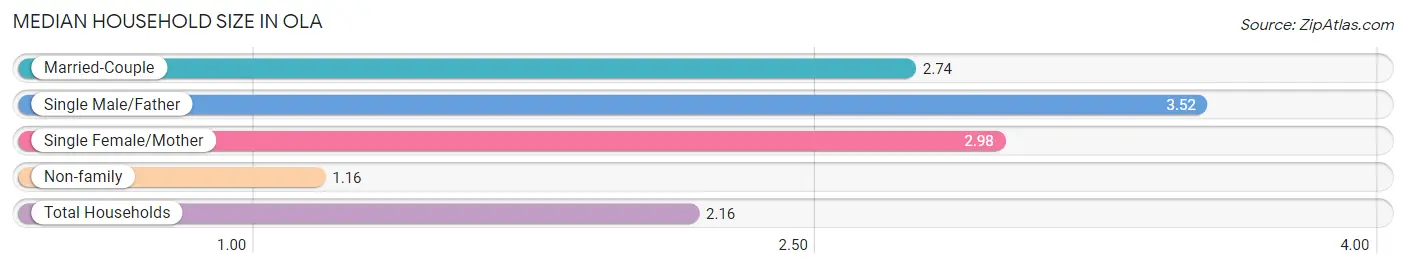
Median Household Size in Ola
The median household size in Ola is 2.16 persons per household, with single male/father households (23 | 6.0%) accounting for the largest median household size of 3.52 persons per household. non-family households (162 | 42.1%) represent the smallest median household size with 1.16 persons per household.
| Household Type | # Households | Household Size |
| Married-Couple | 147 (38.2%) | 2.74 |
| Single Male/Father | 23 (6.0%) | 3.52 |
| Single Female/Mother | 53 (13.8%) | 2.98 |
| Non-family | 162 (42.1%) | 1.16 |
| Total Households | 385 (100.0%) | 2.16 |
Household Size by Marriage Status in Ola
Out of a total of 385 households in Ola, 223 (57.9%) are family households, while 162 (42.1%) are nonfamily households. The most numerous type of family households are 2-person households, comprising 122, and the most common type of nonfamily households are 1-person households, comprising 136.
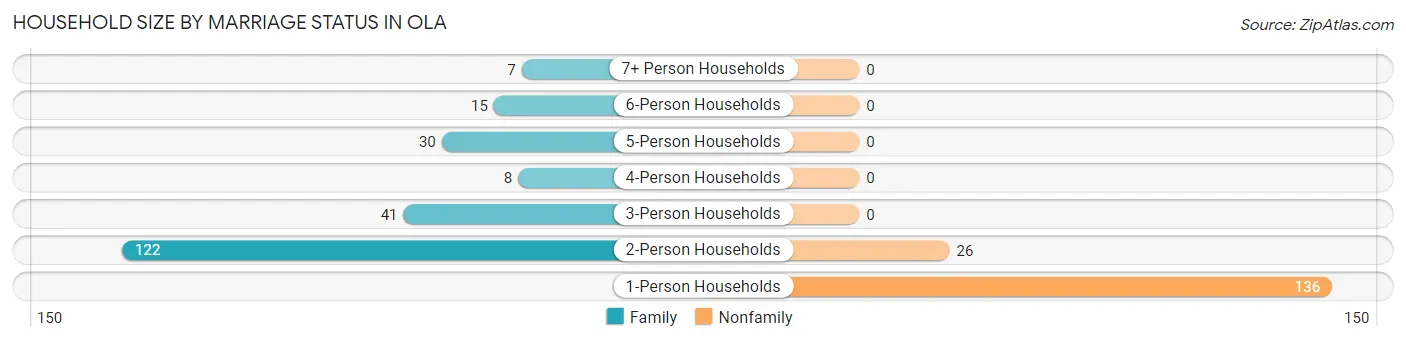
| Household Size | Family Households | Nonfamily Households |
| 1-Person Households | - | 136 (35.3%) |
| 2-Person Households | 122 (31.7%) | 26 (6.8%) |
| 3-Person Households | 41 (10.6%) | 0 (0.0%) |
| 4-Person Households | 8 (2.1%) | 0 (0.0%) |
| 5-Person Households | 30 (7.8%) | 0 (0.0%) |
| 6-Person Households | 15 (3.9%) | 0 (0.0%) |
| 7+ Person Households | 7 (1.8%) | 0 (0.0%) |
| Total | 223 (57.9%) | 162 (42.1%) |
Female Fertility in Ola
Fertility by Age in Ola
Average fertility rate in Ola is 54.0 births per 1,000 women. Women in the age bracket of 20 to 34 years have the highest fertility rate with 94.0 births per 1,000 women. Women in the age bracket of 20 to 34 years acount for 100.0% of all women with births.
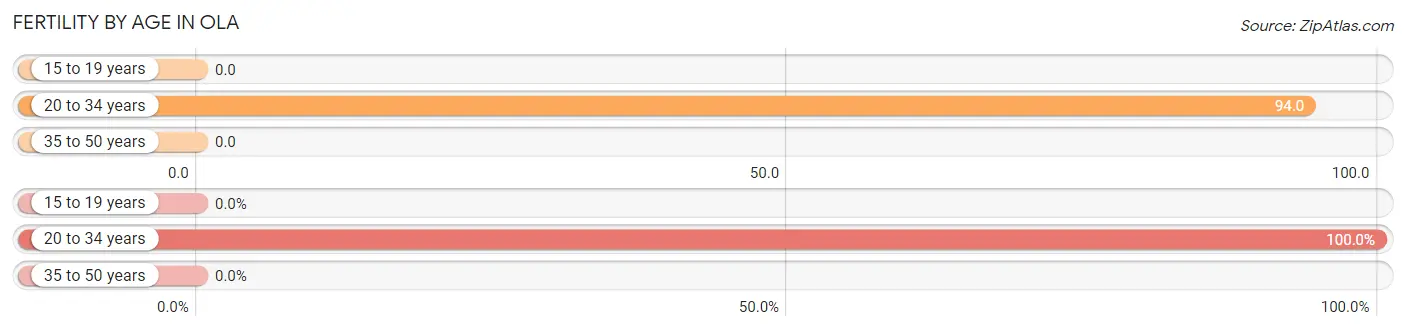
| Age Bracket | Women with Births | Births / 1,000 Women |
| 15 to 19 years | 0 (0.0%) | 0.0 |
| 20 to 34 years | 10 (100.0%) | 94.0 |
| 35 to 50 years | 0 (0.0%) | 0.0 |
| Total | 10 (100.0%) | 54.0 |
Fertility by Age by Marriage Status in Ola
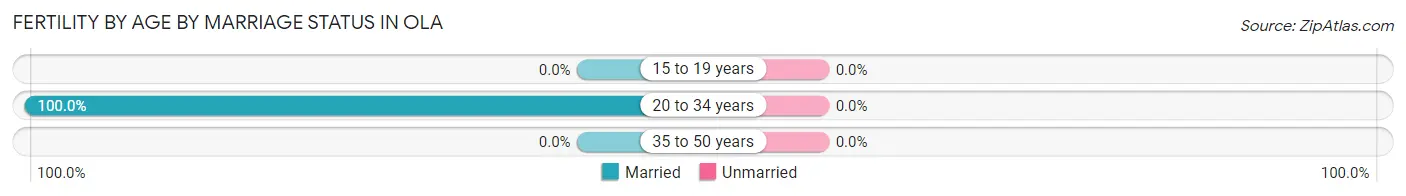
| Age Bracket | Married | Unmarried |
| 15 to 19 years | 0 (0.0%) | 0 (0.0%) |
| 20 to 34 years | 10 (100.0%) | 0 (0.0%) |
| 35 to 50 years | 0 (0.0%) | 0 (0.0%) |
| Total | 10 (100.0%) | 0 (0.0%) |
Fertility by Education in Ola
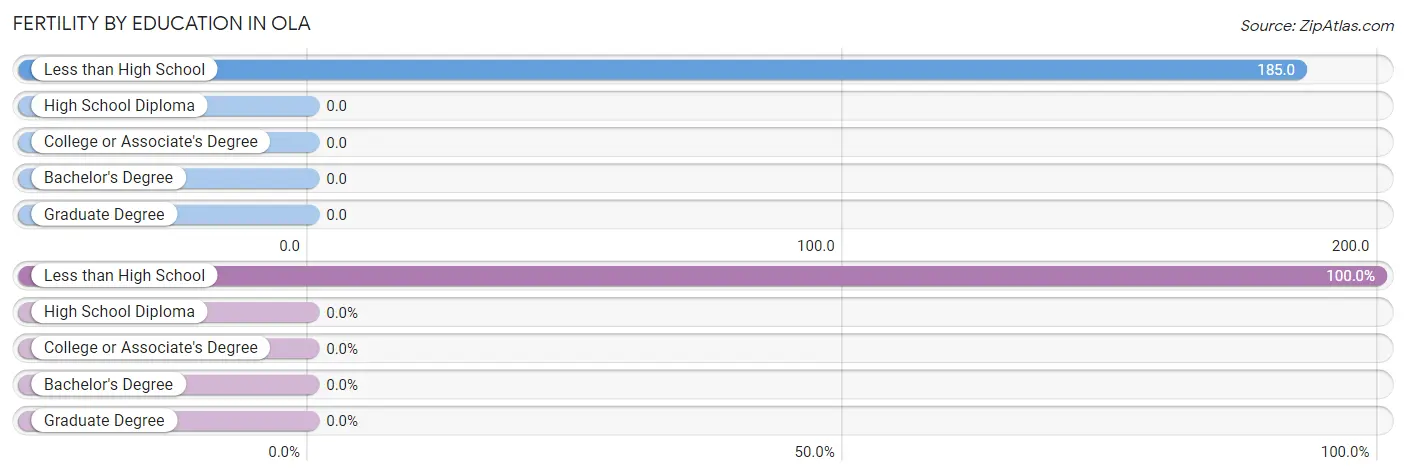
| Educational Attainment | Women with Births | Births / 1,000 Women |
| Less than High School | 10 (100.0%) | 185.0 |
| High School Diploma | 0 (0.0%) | 0.0 |
| College or Associate's Degree | 0 (0.0%) | 0.0 |
| Bachelor's Degree | 0 (0.0%) | 0.0 |
| Graduate Degree | 0 (0.0%) | 0.0 |
| Total | 10 (100.0%) | 54.0 |
Fertility by Education by Marriage Status in Ola
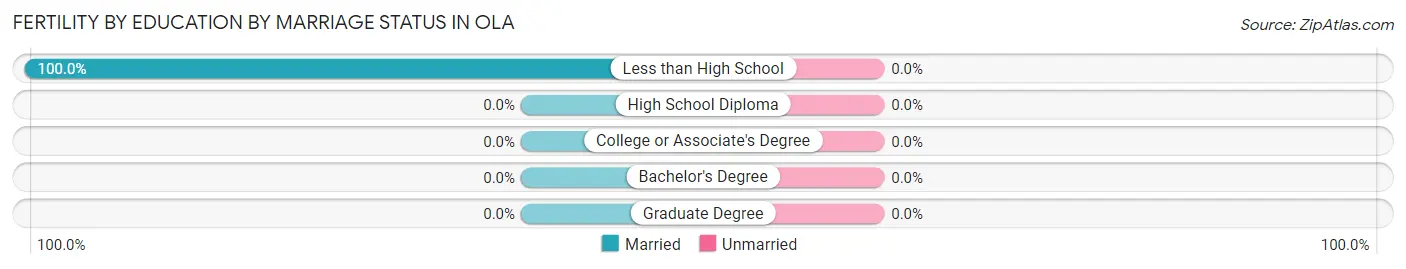
| Educational Attainment | Married | Unmarried |
| Less than High School | 10 (100.0%) | 0 (0.0%) |
| High School Diploma | 0 (0.0%) | 0 (0.0%) |
| College or Associate's Degree | 0 (0.0%) | 0 (0.0%) |
| Bachelor's Degree | 0 (0.0%) | 0 (0.0%) |
| Graduate Degree | 0 (0.0%) | 0 (0.0%) |
| Total | 10 (100.0%) | 0 (0.0%) |
Employment Characteristics in Ola
Employment by Class of Employer in Ola
Among the 322 employed individuals in Ola, private company employees (234 | 72.7%), not-for-profit organizations (25 | 7.8%), and local government employees (22 | 6.8%) make up the most common classes of employment.
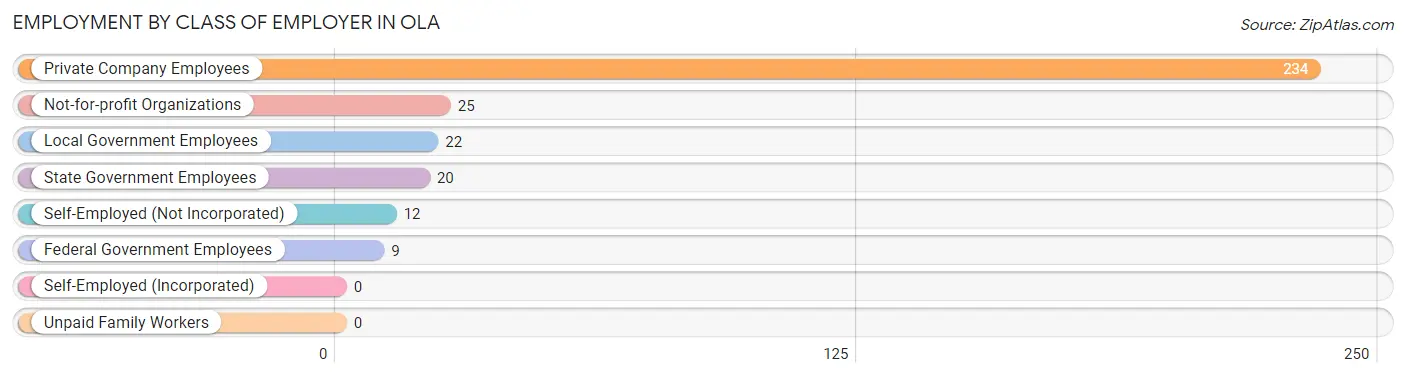
| Employer Class | # Employees | % Employees |
| Private Company Employees | 234 | 72.7% |
| Self-Employed (Incorporated) | 0 | 0.0% |
| Self-Employed (Not Incorporated) | 12 | 3.7% |
| Not-for-profit Organizations | 25 | 7.8% |
| Local Government Employees | 22 | 6.8% |
| State Government Employees | 20 | 6.2% |
| Federal Government Employees | 9 | 2.8% |
| Unpaid Family Workers | 0 | 0.0% |
| Total | 322 | 100.0% |
Employment Status by Age in Ola
According to the labor force statistics for Ola, out of the total population over 16 years of age (714), 48.3% or 345 individuals are in the labor force, with 6.7% or 23 of them unemployed. The age group with the highest labor force participation rate is 16 to 19 years, with 100.0% or 18 individuals in the labor force. Within the labor force, the 16 to 19 years age range has the highest percentage of unemployed individuals, with 83.3% or 15 of them being unemployed.
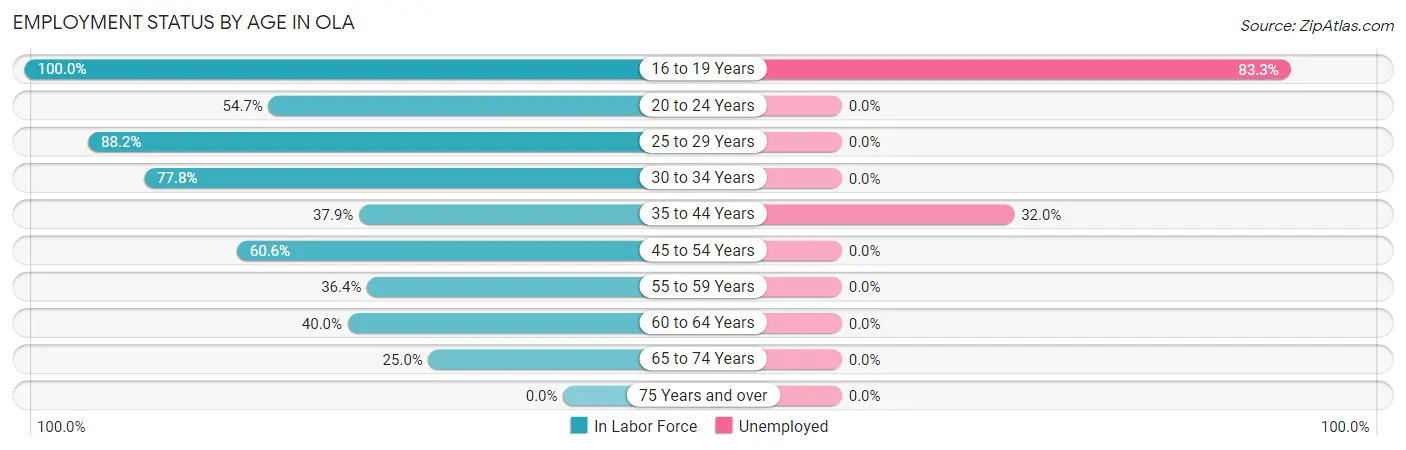
| Age Bracket | In Labor Force | Unemployed |
| 16 to 19 Years | 18 (100.0%) | 15 (83.3%) |
| 20 to 24 Years | 47 (54.7%) | 0 (0.0%) |
| 25 to 29 Years | 45 (88.2%) | 0 (0.0%) |
| 30 to 34 Years | 49 (77.8%) | 0 (0.0%) |
| 35 to 44 Years | 25 (37.9%) | 8 (32.0%) |
| 45 to 54 Years | 80 (60.6%) | 0 (0.0%) |
| 55 to 59 Years | 43 (36.4%) | 0 (0.0%) |
| 60 to 64 Years | 22 (40.0%) | 0 (0.0%) |
| 65 to 74 Years | 16 (25.0%) | 0 (0.0%) |
| 75 Years and over | 0 (0.0%) | 0 (0.0%) |
| Total | 345 (48.3%) | 23 (6.7%) |
Employment Status by Educational Attainment in Ola
According to labor force statistics for Ola, 54.4% of individuals (264) out of the total population between 25 and 64 years of age (485) are in the labor force, with 3.0% or 8 of them being unemployed. The group with the highest labor force participation rate are those with the educational attainment of less than high school, with 71.7% or 114 individuals in the labor force. Within the labor force, individuals with college / associate degree education have the highest percentage of unemployment, with 11.4% or 8 of them being unemployed.
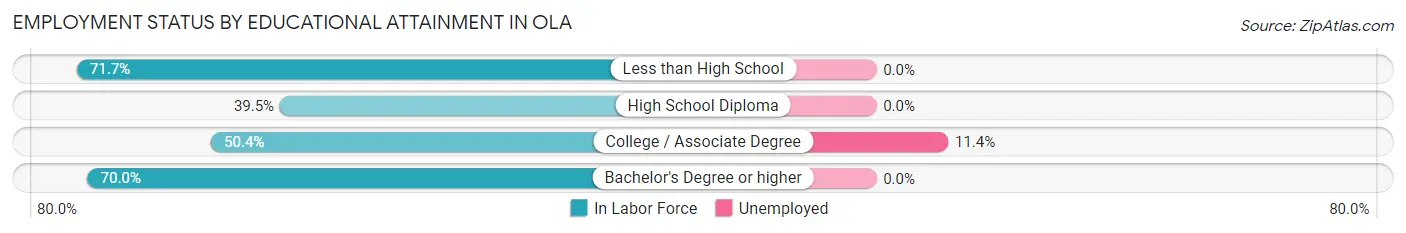
| Educational Attainment | In Labor Force | Unemployed |
| Less than High School | 114 (71.7%) | 0 (0.0%) |
| High School Diploma | 66 (39.5%) | 0 (0.0%) |
| College / Associate Degree | 70 (50.4%) | 16 (11.4%) |
| Bachelor's Degree or higher | 14 (70.0%) | 0 (0.0%) |
| Total | 264 (54.4%) | 15 (3.0%) |
Employment Occupations by Sex in Ola
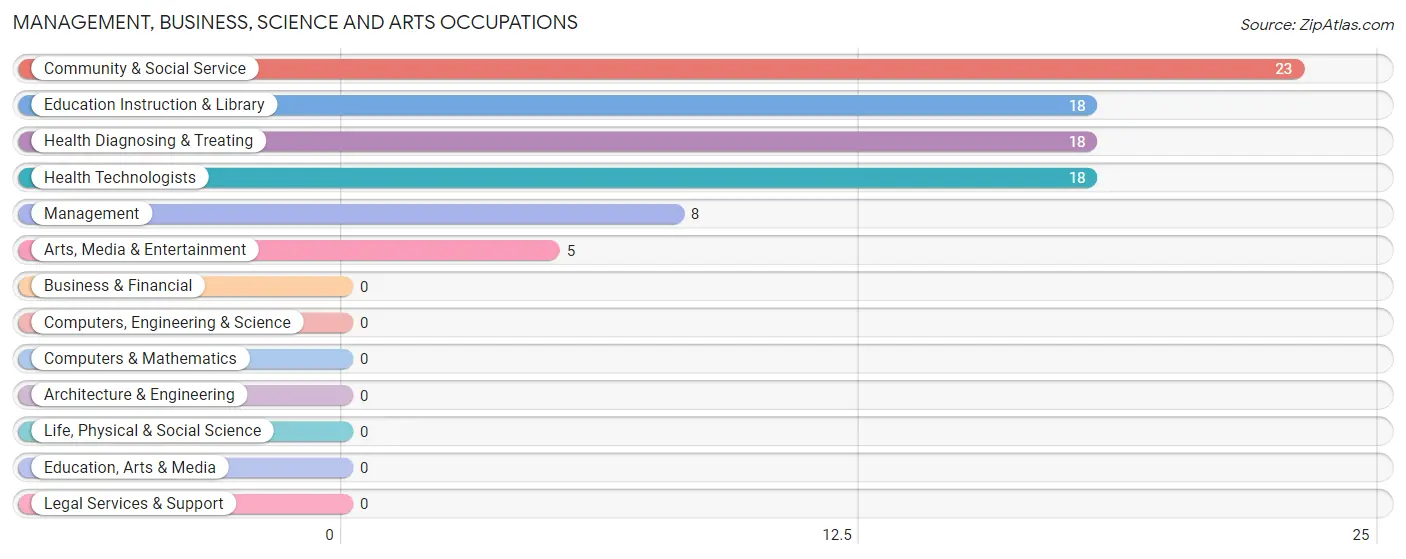
Management, Business, Science and Arts Occupations
The most common Management, Business, Science and Arts occupations in Ola are Community & Social Service (23 | 7.1%), Education Instruction & Library (18 | 5.6%), Health Diagnosing & Treating (18 | 5.6%), Health Technologists (18 | 5.6%), and Management (8 | 2.5%).
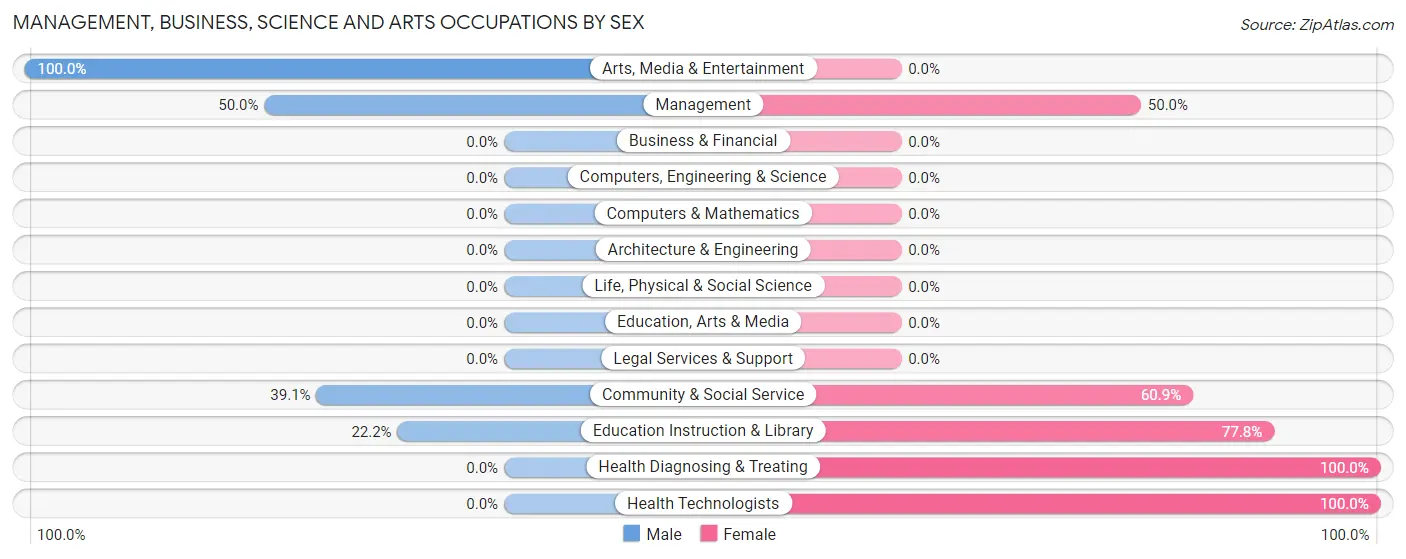
Management, Business, Science and Arts Occupations by Sex
Within the Management, Business, Science and Arts occupations in Ola, the most male-oriented occupations are Arts, Media & Entertainment (100.0%), Management (50.0%), and Community & Social Service (39.1%), while the most female-oriented occupations are Health Diagnosing & Treating (100.0%), Health Technologists (100.0%), and Education Instruction & Library (77.8%).
| Occupation | Male | Female |
| Management | 4 (50.0%) | 4 (50.0%) |
| Business & Financial | 0 (0.0%) | 0 (0.0%) |
| Computers, Engineering & Science | 0 (0.0%) | 0 (0.0%) |
| Computers & Mathematics | 0 (0.0%) | 0 (0.0%) |
| Architecture & Engineering | 0 (0.0%) | 0 (0.0%) |
| Life, Physical & Social Science | 0 (0.0%) | 0 (0.0%) |
| Community & Social Service | 9 (39.1%) | 14 (60.9%) |
| Education, Arts & Media | 0 (0.0%) | 0 (0.0%) |
| Legal Services & Support | 0 (0.0%) | 0 (0.0%) |
| Education Instruction & Library | 4 (22.2%) | 14 (77.8%) |
| Arts, Media & Entertainment | 5 (100.0%) | 0 (0.0%) |
| Health Diagnosing & Treating | 0 (0.0%) | 18 (100.0%) |
| Health Technologists | 0 (0.0%) | 18 (100.0%) |
| Total (Category) | 13 (26.5%) | 36 (73.5%) |
| Total (Overall) | 171 (53.1%) | 151 (46.9%) |
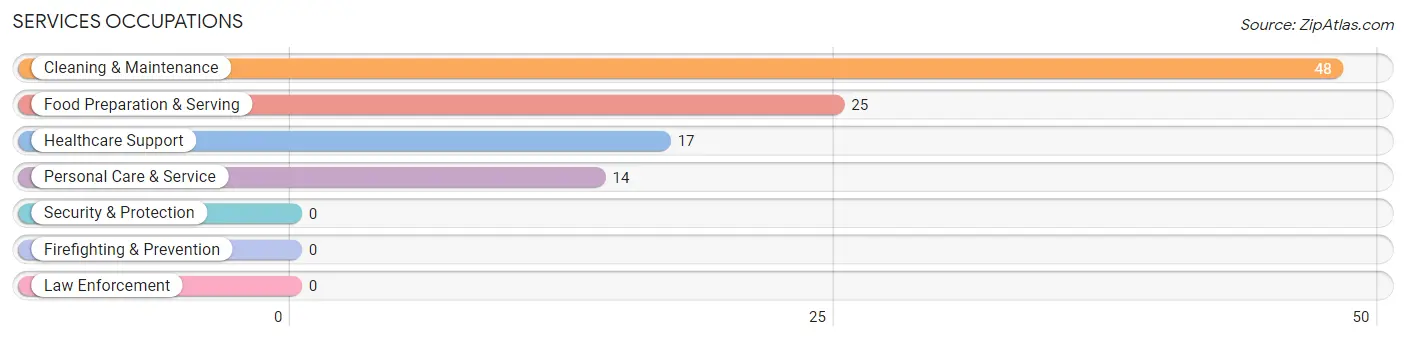
Services Occupations
The most common Services occupations in Ola are Cleaning & Maintenance (48 | 14.9%), Food Preparation & Serving (25 | 7.8%), Healthcare Support (17 | 5.3%), and Personal Care & Service (14 | 4.3%).
Services Occupations by Sex
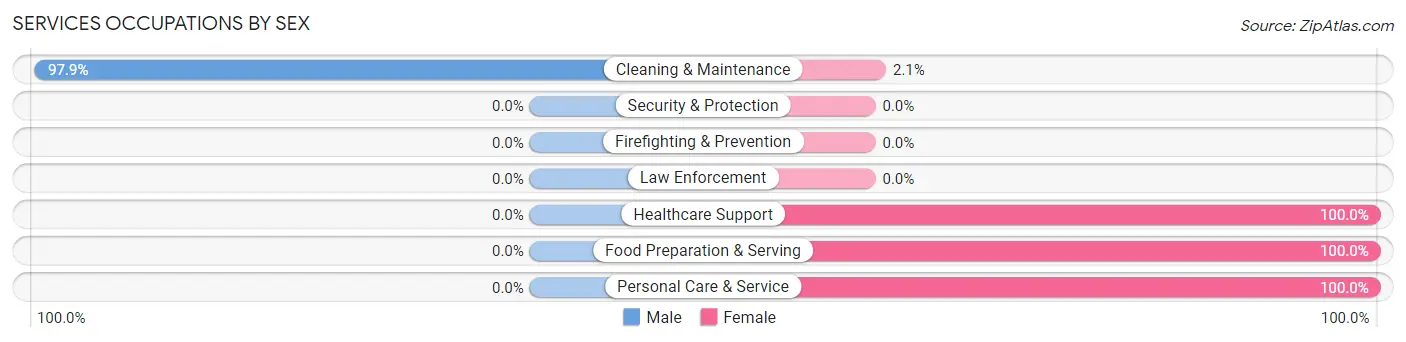
| Occupation | Male | Female |
| Healthcare Support | 0 (0.0%) | 17 (100.0%) |
| Security & Protection | 0 (0.0%) | 0 (0.0%) |
| Firefighting & Prevention | 0 (0.0%) | 0 (0.0%) |
| Law Enforcement | 0 (0.0%) | 0 (0.0%) |
| Food Preparation & Serving | 0 (0.0%) | 25 (100.0%) |
| Cleaning & Maintenance | 47 (97.9%) | 1 (2.1%) |
| Personal Care & Service | 0 (0.0%) | 14 (100.0%) |
| Total (Category) | 47 (45.2%) | 57 (54.8%) |
| Total (Overall) | 171 (53.1%) | 151 (46.9%) |
Sales and Office Occupations
The most common Sales and Office occupations in Ola are Sales & Related (63 | 19.6%), and Office & Administration (11 | 3.4%).
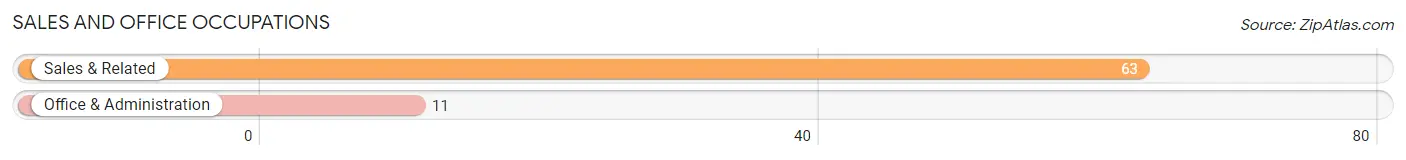
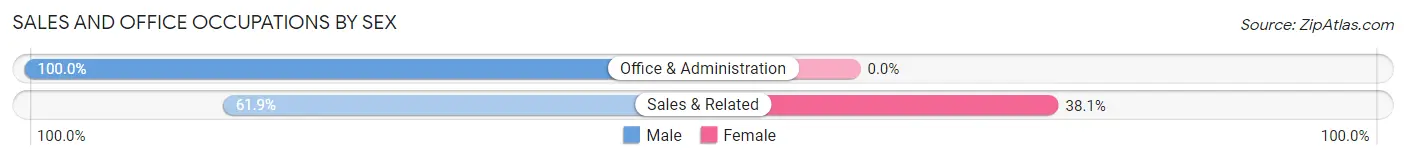
Sales and Office Occupations by Sex
| Occupation | Male | Female |
| Sales & Related | 39 (61.9%) | 24 (38.1%) |
| Office & Administration | 11 (100.0%) | 0 (0.0%) |
| Total (Category) | 50 (67.6%) | 24 (32.4%) |
| Total (Overall) | 171 (53.1%) | 151 (46.9%) |
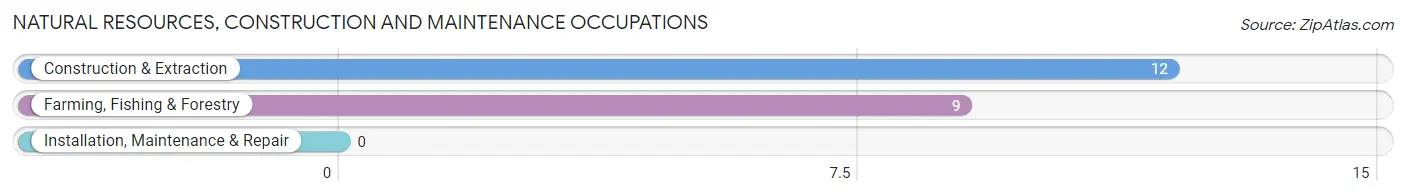
Natural Resources, Construction and Maintenance Occupations
The most common Natural Resources, Construction and Maintenance occupations in Ola are Construction & Extraction (12 | 3.7%), and Farming, Fishing & Forestry (9 | 2.8%).
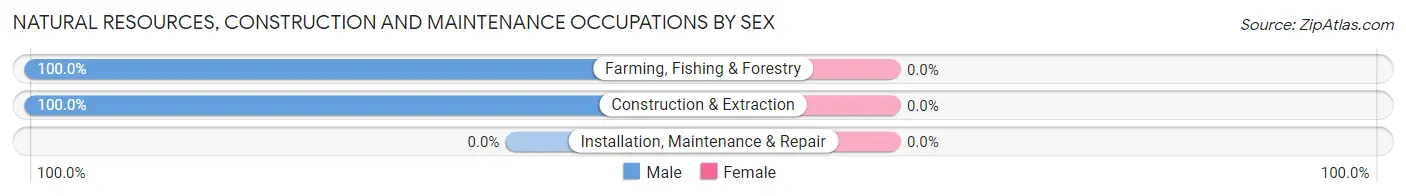
Natural Resources, Construction and Maintenance Occupations by Sex
| Occupation | Male | Female |
| Farming, Fishing & Forestry | 9 (100.0%) | 0 (0.0%) |
| Construction & Extraction | 12 (100.0%) | 0 (0.0%) |
| Installation, Maintenance & Repair | 0 (0.0%) | 0 (0.0%) |
| Total (Category) | 21 (100.0%) | 0 (0.0%) |
| Total (Overall) | 171 (53.1%) | 151 (46.9%) |
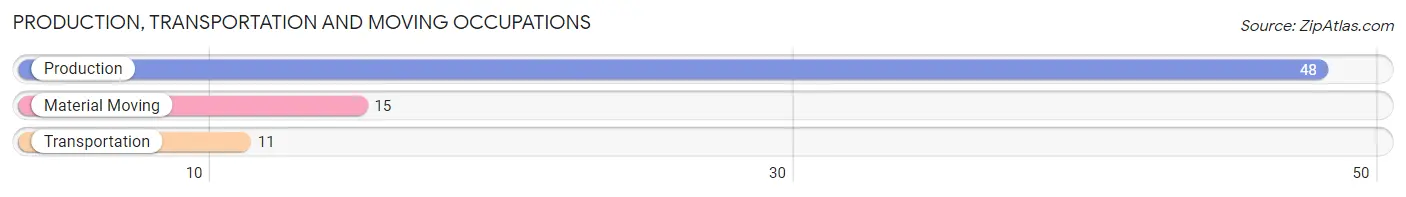
Production, Transportation and Moving Occupations
The most common Production, Transportation and Moving occupations in Ola are Production (48 | 14.9%), Material Moving (15 | 4.7%), and Transportation (11 | 3.4%).
Production, Transportation and Moving Occupations by Sex
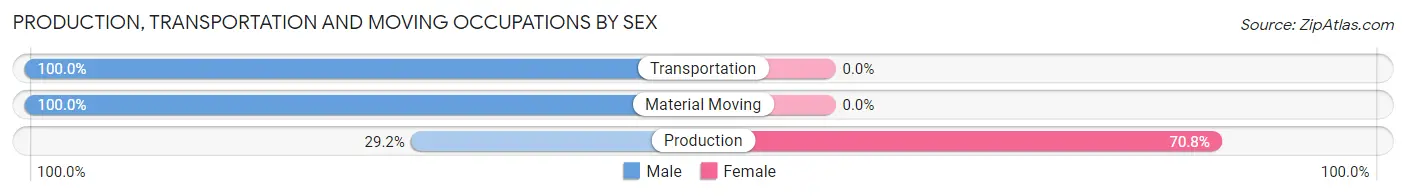
| Occupation | Male | Female |
| Production | 14 (29.2%) | 34 (70.8%) |
| Transportation | 11 (100.0%) | 0 (0.0%) |
| Material Moving | 15 (100.0%) | 0 (0.0%) |
| Total (Category) | 40 (54.0%) | 34 (46.0%) |
| Total (Overall) | 171 (53.1%) | 151 (46.9%) |
Employment Industries by Sex in Ola
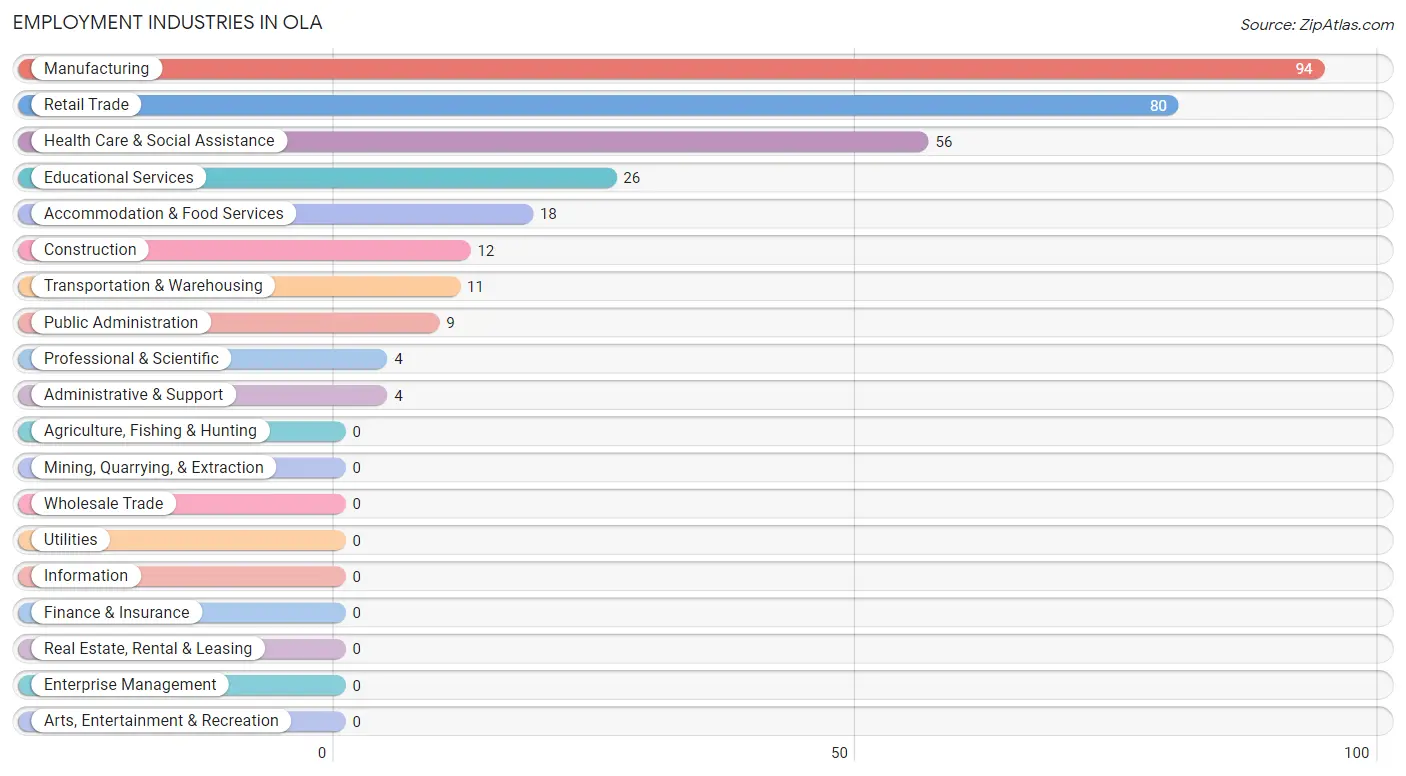
Employment Industries in Ola
The major employment industries in Ola include Manufacturing (94 | 29.2%), Retail Trade (80 | 24.8%), Health Care & Social Assistance (56 | 17.4%), Educational Services (26 | 8.1%), and Accommodation & Food Services (18 | 5.6%).
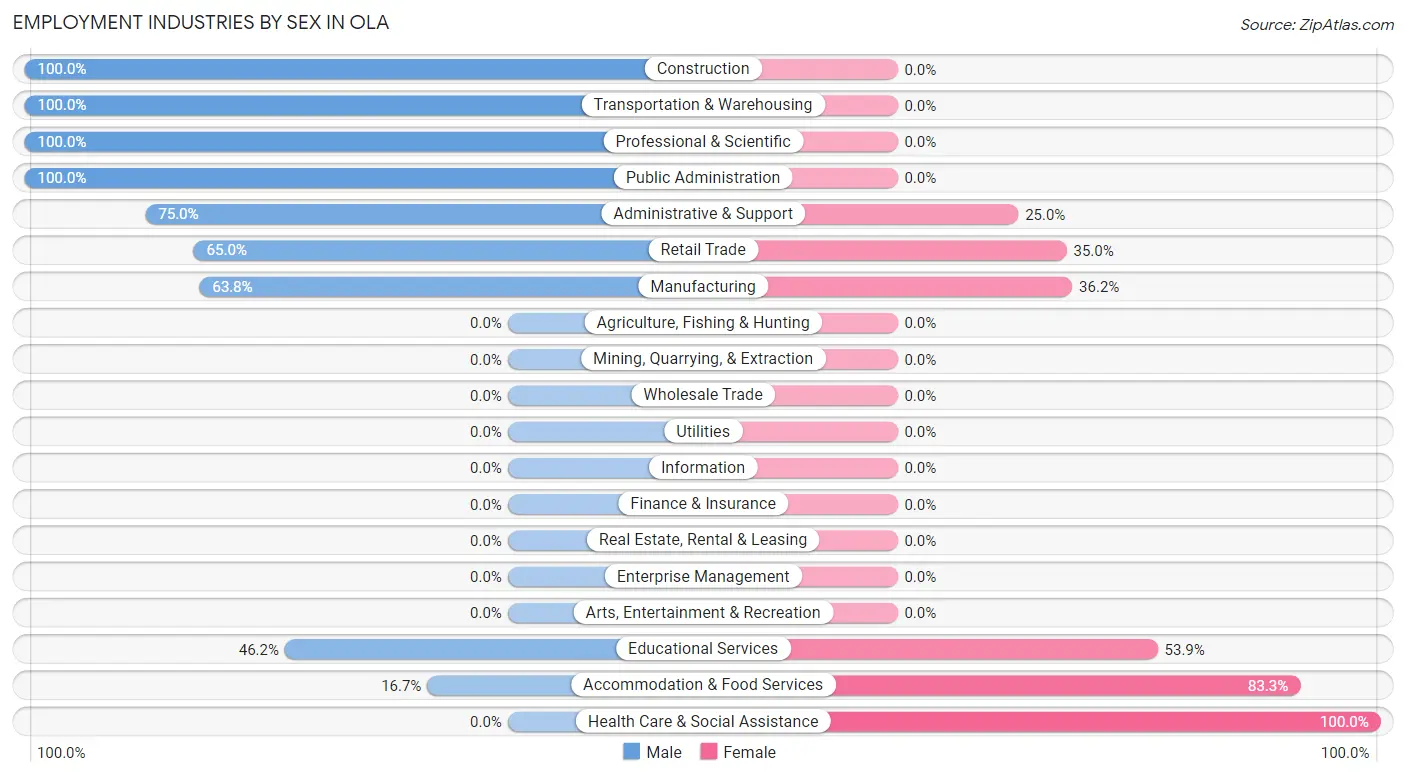
Employment Industries by Sex in Ola
The Ola industries that see more men than women are Construction (100.0%), Transportation & Warehousing (100.0%), and Professional & Scientific (100.0%), whereas the industries that tend to have a higher number of women are Health Care & Social Assistance (100.0%), Accommodation & Food Services (83.3%), and Educational Services (53.8%).
| Industry | Male | Female |
| Agriculture, Fishing & Hunting | 0 (0.0%) | 0 (0.0%) |
| Mining, Quarrying, & Extraction | 0 (0.0%) | 0 (0.0%) |
| Construction | 12 (100.0%) | 0 (0.0%) |
| Manufacturing | 60 (63.8%) | 34 (36.2%) |
| Wholesale Trade | 0 (0.0%) | 0 (0.0%) |
| Retail Trade | 52 (65.0%) | 28 (35.0%) |
| Transportation & Warehousing | 11 (100.0%) | 0 (0.0%) |
| Utilities | 0 (0.0%) | 0 (0.0%) |
| Information | 0 (0.0%) | 0 (0.0%) |
| Finance & Insurance | 0 (0.0%) | 0 (0.0%) |
| Real Estate, Rental & Leasing | 0 (0.0%) | 0 (0.0%) |
| Professional & Scientific | 4 (100.0%) | 0 (0.0%) |
| Enterprise Management | 0 (0.0%) | 0 (0.0%) |
| Administrative & Support | 3 (75.0%) | 1 (25.0%) |
| Educational Services | 12 (46.2%) | 14 (53.8%) |
| Health Care & Social Assistance | 0 (0.0%) | 56 (100.0%) |
| Arts, Entertainment & Recreation | 0 (0.0%) | 0 (0.0%) |
| Accommodation & Food Services | 3 (16.7%) | 15 (83.3%) |
| Public Administration | 9 (100.0%) | 0 (0.0%) |
| Total | 171 (53.1%) | 151 (46.9%) |
Education in Ola
School Enrollment in Ola
The most common levels of schooling among the 135 students in Ola are middle school (47 | 34.8%), elementary school (34 | 25.2%), and kindergarten (32 | 23.7%).
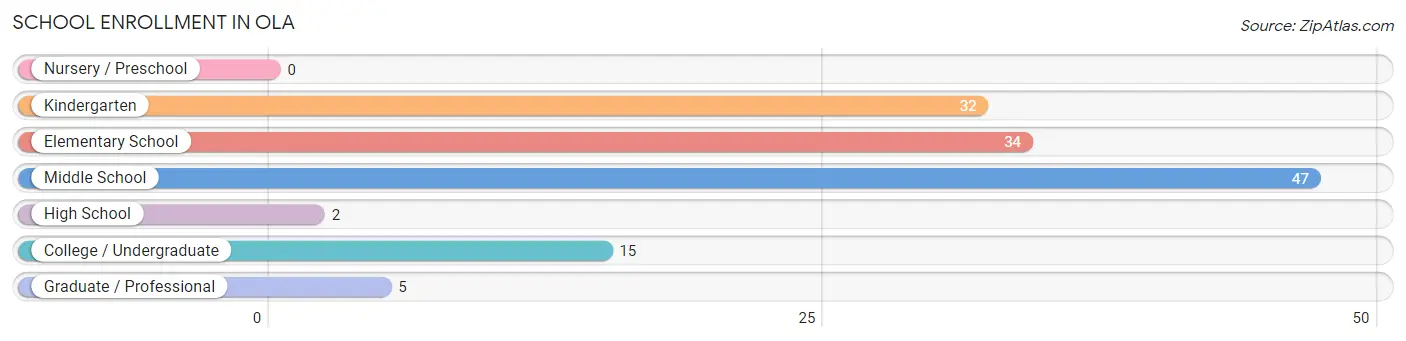
| School Level | # Students | % Students |
| Nursery / Preschool | 0 | 0.0% |
| Kindergarten | 32 | 23.7% |
| Elementary School | 34 | 25.2% |
| Middle School | 47 | 34.8% |
| High School | 2 | 1.5% |
| College / Undergraduate | 15 | 11.1% |
| Graduate / Professional | 5 | 3.7% |
| Total | 135 | 100.0% |
School Enrollment by Age by Funding Source in Ola
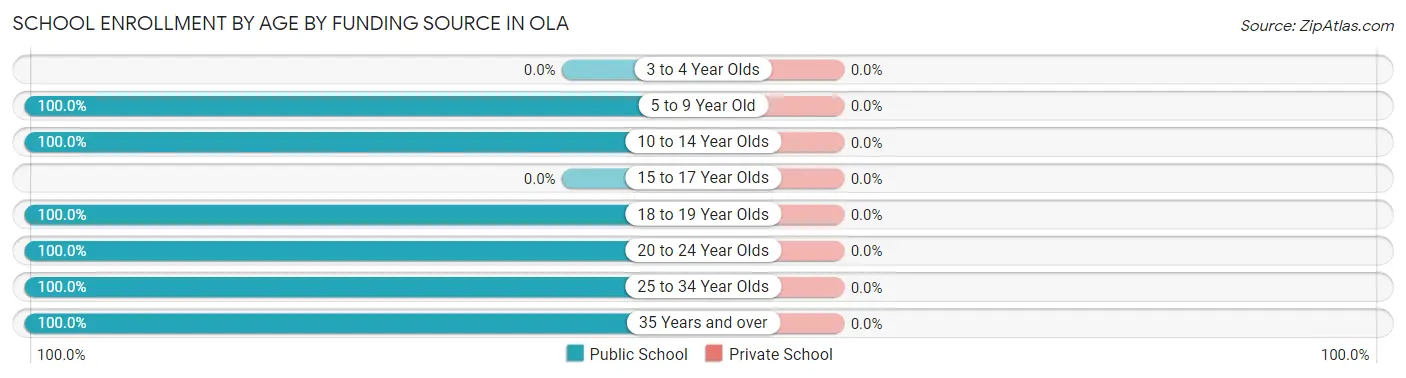
| Age Bracket | Public School | Private School |
| 3 to 4 Year Olds | 0 (0.0%) | 0 (0.0%) |
| 5 to 9 Year Old | 66 (100.0%) | 0 (0.0%) |
| 10 to 14 Year Olds | 49 (100.0%) | 0 (0.0%) |
| 15 to 17 Year Olds | 0 (0.0%) | 0 (0.0%) |
| 18 to 19 Year Olds | 3 (100.0%) | 0 (0.0%) |
| 20 to 24 Year Olds | 4 (100.0%) | 0 (0.0%) |
| 25 to 34 Year Olds | 8 (100.0%) | 0 (0.0%) |
| 35 Years and over | 5 (100.0%) | 0 (0.0%) |
| Total | 135 (100.0%) | 0 (0.0%) |
Educational Attainment by Field of Study in Ola
Science & technology (21 | 42.9%), education (20 | 40.8%), and business (8 | 16.3%) are the most common fields of study among 49 individuals in Ola who have obtained a bachelor's degree or higher.
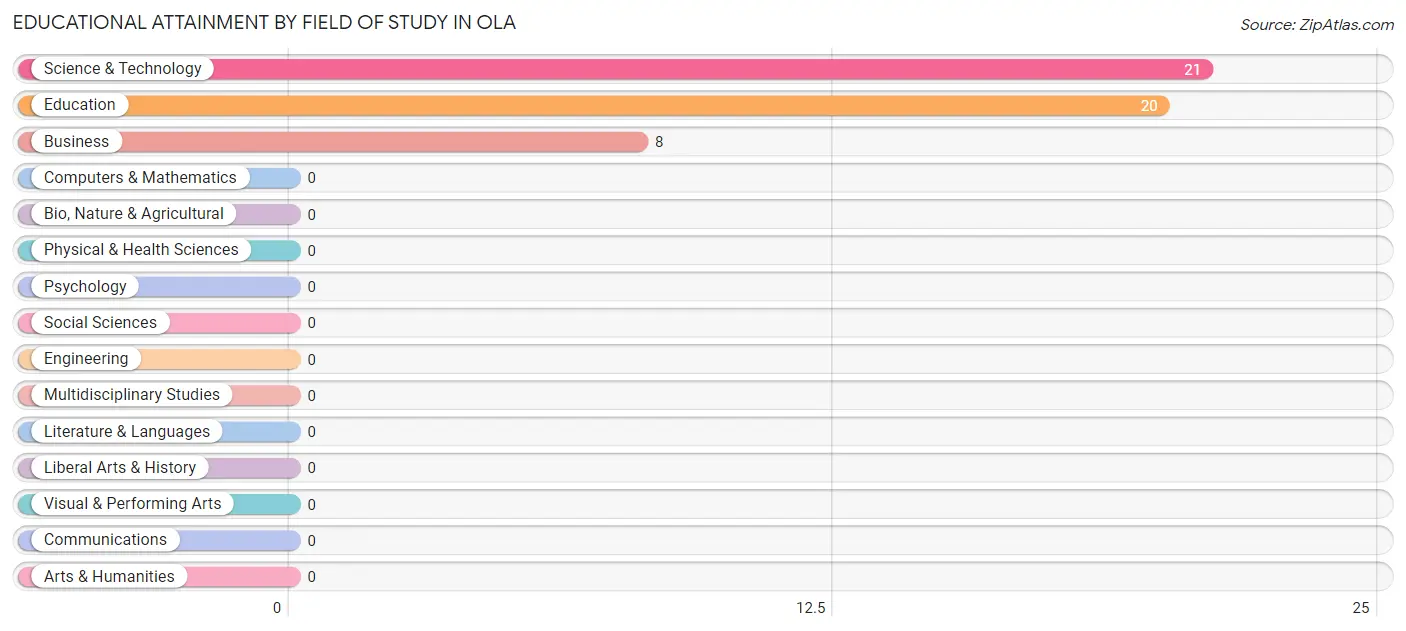
| Field of Study | # Graduates | % Graduates |
| Computers & Mathematics | 0 | 0.0% |
| Bio, Nature & Agricultural | 0 | 0.0% |
| Physical & Health Sciences | 0 | 0.0% |
| Psychology | 0 | 0.0% |
| Social Sciences | 0 | 0.0% |
| Engineering | 0 | 0.0% |
| Multidisciplinary Studies | 0 | 0.0% |
| Science & Technology | 21 | 42.9% |
| Business | 8 | 16.3% |
| Education | 20 | 40.8% |
| Literature & Languages | 0 | 0.0% |
| Liberal Arts & History | 0 | 0.0% |
| Visual & Performing Arts | 0 | 0.0% |
| Communications | 0 | 0.0% |
| Arts & Humanities | 0 | 0.0% |
| Total | 49 | 100.0% |
Transportation & Commute in Ola
Vehicle Availability by Sex in Ola
The most prevalent vehicle ownership categories in Ola are males with 3 vehicles (72, accounting for 42.1%) and females with 3 vehicles (15, making up 47.7%).
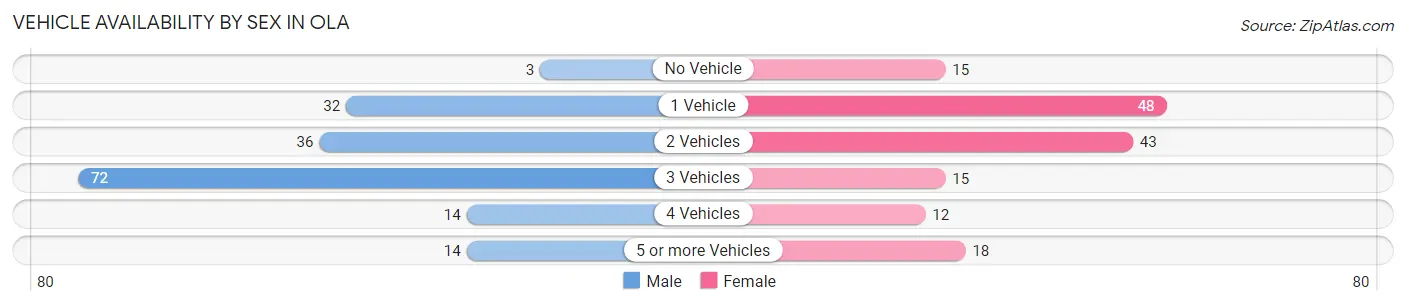
| Vehicles Available | Male | Female |
| No Vehicle | 3 (1.8%) | 15 (9.9%) |
| 1 Vehicle | 32 (18.7%) | 48 (31.8%) |
| 2 Vehicles | 36 (21.0%) | 43 (28.5%) |
| 3 Vehicles | 72 (42.1%) | 15 (9.9%) |
| 4 Vehicles | 14 (8.2%) | 12 (8.0%) |
| 5 or more Vehicles | 14 (8.2%) | 18 (11.9%) |
| Total | 171 (100.0%) | 151 (100.0%) |
Commute Time in Ola
The most frequently occuring commute durations in Ola are 35 to 39 minutes (77 commuters, 25.6%), 20 to 24 minutes (49 commuters, 16.3%), and 5 to 9 minutes (39 commuters, 13.0%).
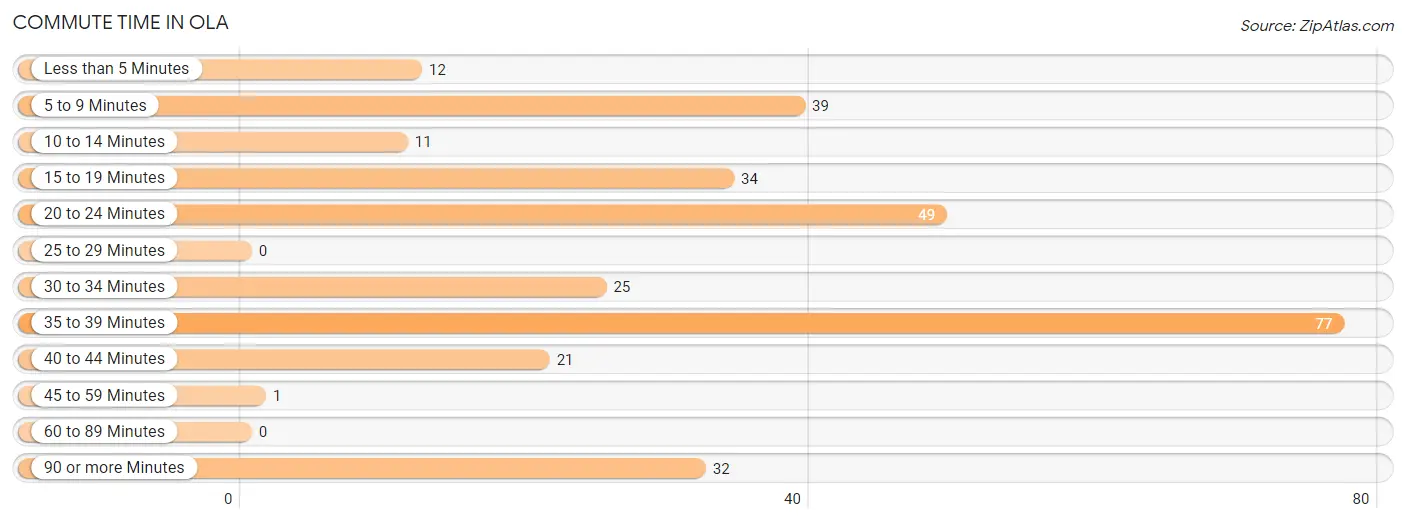
| Commute Time | # Commuters | % Commuters |
| Less than 5 Minutes | 12 | 4.0% |
| 5 to 9 Minutes | 39 | 13.0% |
| 10 to 14 Minutes | 11 | 3.6% |
| 15 to 19 Minutes | 34 | 11.3% |
| 20 to 24 Minutes | 49 | 16.3% |
| 25 to 29 Minutes | 0 | 0.0% |
| 30 to 34 Minutes | 25 | 8.3% |
| 35 to 39 Minutes | 77 | 25.6% |
| 40 to 44 Minutes | 21 | 7.0% |
| 45 to 59 Minutes | 1 | 0.3% |
| 60 to 89 Minutes | 0 | 0.0% |
| 90 or more Minutes | 32 | 10.6% |
Commute Time by Sex in Ola
The most common commute times in Ola are 35 to 39 minutes (42 commuters, 28.0%) for males and 5 to 9 minutes (35 commuters, 23.2%) for females.
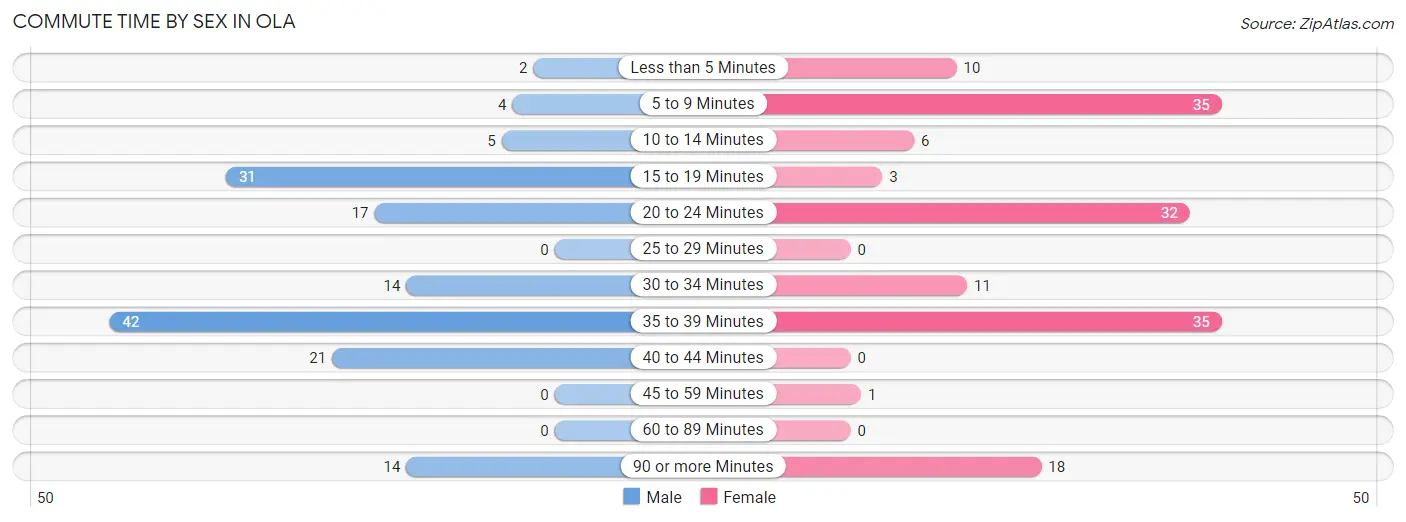
| Commute Time | Male | Female |
| Less than 5 Minutes | 2 (1.3%) | 10 (6.6%) |
| 5 to 9 Minutes | 4 (2.7%) | 35 (23.2%) |
| 10 to 14 Minutes | 5 (3.3%) | 6 (4.0%) |
| 15 to 19 Minutes | 31 (20.7%) | 3 (2.0%) |
| 20 to 24 Minutes | 17 (11.3%) | 32 (21.2%) |
| 25 to 29 Minutes | 0 (0.0%) | 0 (0.0%) |
| 30 to 34 Minutes | 14 (9.3%) | 11 (7.3%) |
| 35 to 39 Minutes | 42 (28.0%) | 35 (23.2%) |
| 40 to 44 Minutes | 21 (14.0%) | 0 (0.0%) |
| 45 to 59 Minutes | 0 (0.0%) | 1 (0.7%) |
| 60 to 89 Minutes | 0 (0.0%) | 0 (0.0%) |
| 90 or more Minutes | 14 (9.3%) | 18 (11.9%) |
Time of Departure to Work by Sex in Ola
The most frequent times of departure to work in Ola are 7:00 AM to 7:29 AM (33, 22.0%) for males and 12:00 AM to 4:59 AM (31, 20.5%) for females.
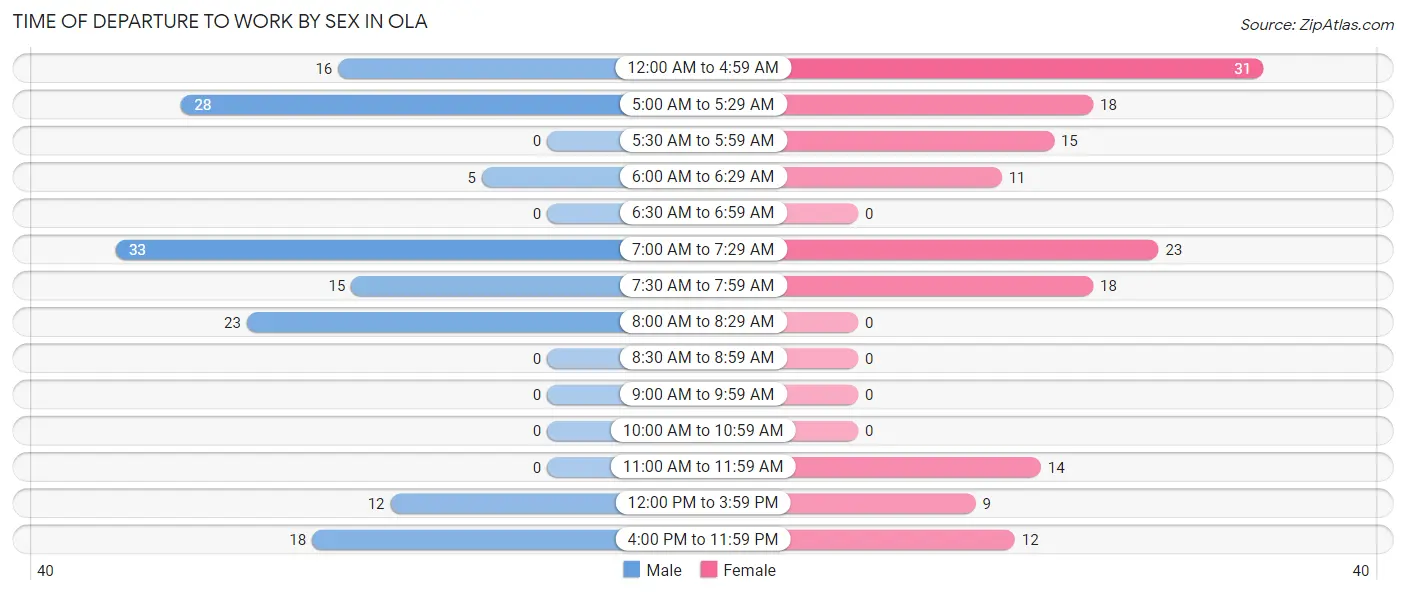
| Time of Departure | Male | Female |
| 12:00 AM to 4:59 AM | 16 (10.7%) | 31 (20.5%) |
| 5:00 AM to 5:29 AM | 28 (18.7%) | 18 (11.9%) |
| 5:30 AM to 5:59 AM | 0 (0.0%) | 15 (9.9%) |
| 6:00 AM to 6:29 AM | 5 (3.3%) | 11 (7.3%) |
| 6:30 AM to 6:59 AM | 0 (0.0%) | 0 (0.0%) |
| 7:00 AM to 7:29 AM | 33 (22.0%) | 23 (15.2%) |
| 7:30 AM to 7:59 AM | 15 (10.0%) | 18 (11.9%) |
| 8:00 AM to 8:29 AM | 23 (15.3%) | 0 (0.0%) |
| 8:30 AM to 8:59 AM | 0 (0.0%) | 0 (0.0%) |
| 9:00 AM to 9:59 AM | 0 (0.0%) | 0 (0.0%) |
| 10:00 AM to 10:59 AM | 0 (0.0%) | 0 (0.0%) |
| 11:00 AM to 11:59 AM | 0 (0.0%) | 14 (9.3%) |
| 12:00 PM to 3:59 PM | 12 (8.0%) | 9 (6.0%) |
| 4:00 PM to 11:59 PM | 18 (12.0%) | 12 (8.0%) |
| Total | 150 (100.0%) | 151 (100.0%) |
Housing Occupancy in Ola
Occupancy by Ownership in Ola
Of the total 385 dwellings in Ola, owner-occupied units account for 172 (44.7%), while renter-occupied units make up 213 (55.3%).
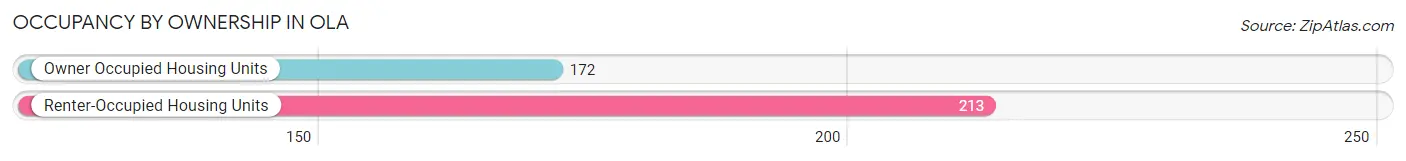
| Occupancy | # Housing Units | % Housing Units |
| Owner Occupied Housing Units | 172 | 44.7% |
| Renter-Occupied Housing Units | 213 | 55.3% |
| Total Occupied Housing Units | 385 | 100.0% |
Occupancy by Household Size in Ola
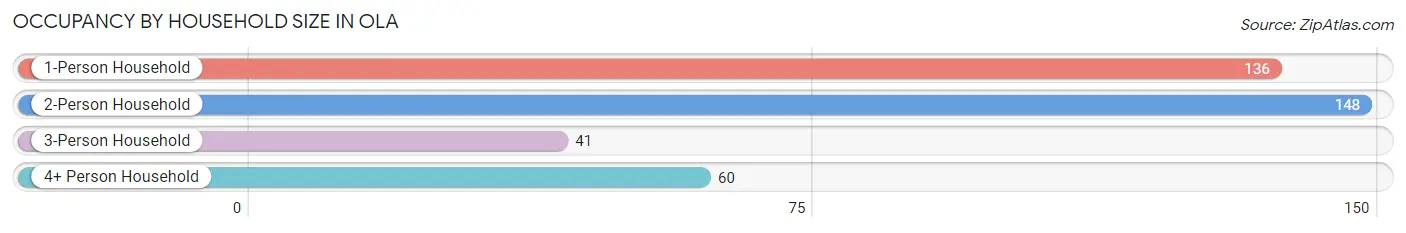
| Household Size | # Housing Units | % Housing Units |
| 1-Person Household | 136 | 35.3% |
| 2-Person Household | 148 | 38.4% |
| 3-Person Household | 41 | 10.6% |
| 4+ Person Household | 60 | 15.6% |
| Total Housing Units | 385 | 100.0% |
Occupancy by Ownership by Household Size in Ola
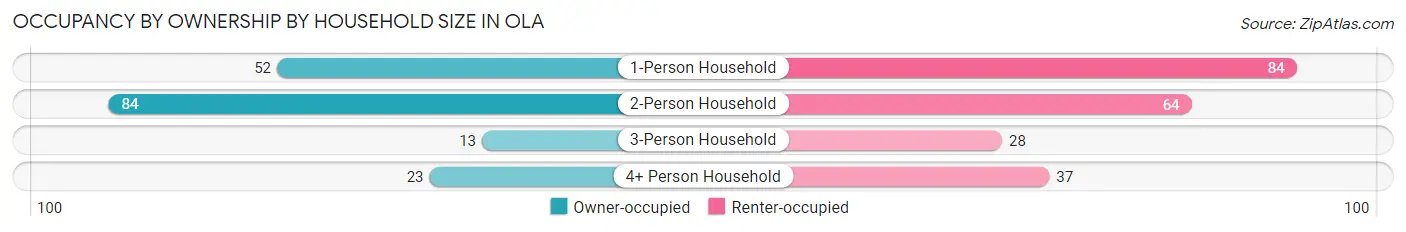
| Household Size | Owner-occupied | Renter-occupied |
| 1-Person Household | 52 (38.2%) | 84 (61.8%) |
| 2-Person Household | 84 (56.8%) | 64 (43.2%) |
| 3-Person Household | 13 (31.7%) | 28 (68.3%) |
| 4+ Person Household | 23 (38.3%) | 37 (61.7%) |
| Total Housing Units | 172 (44.7%) | 213 (55.3%) |
Occupancy by Educational Attainment in Ola
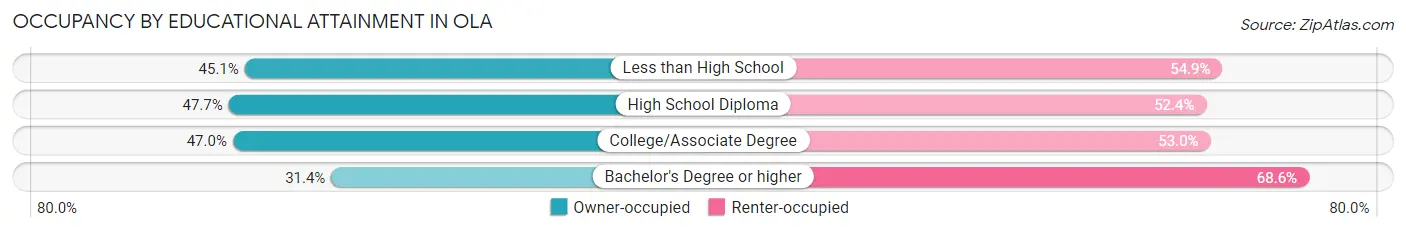
| Household Size | Owner-occupied | Renter-occupied |
| Less than High School | 46 (45.1%) | 56 (54.9%) |
| High School Diploma | 71 (47.6%) | 78 (52.3%) |
| College/Associate Degree | 39 (47.0%) | 44 (53.0%) |
| Bachelor's Degree or higher | 16 (31.4%) | 35 (68.6%) |
Occupancy by Age of Householder in Ola
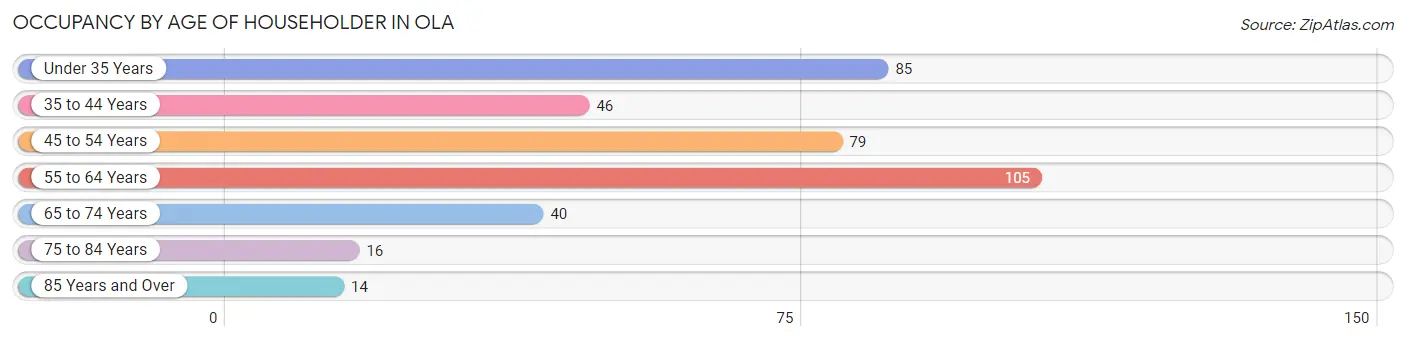
| Age Bracket | # Households | % Households |
| Under 35 Years | 85 | 22.1% |
| 35 to 44 Years | 46 | 11.9% |
| 45 to 54 Years | 79 | 20.5% |
| 55 to 64 Years | 105 | 27.3% |
| 65 to 74 Years | 40 | 10.4% |
| 75 to 84 Years | 16 | 4.2% |
| 85 Years and Over | 14 | 3.6% |
| Total | 385 | 100.0% |
Housing Finances in Ola
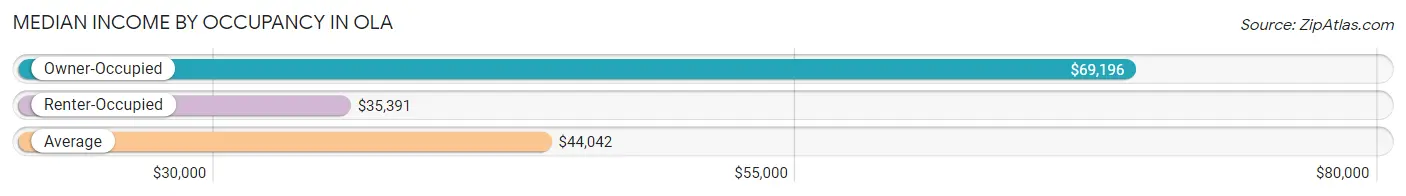
Median Income by Occupancy in Ola
| Occupancy Type | # Households | Median Income |
| Owner-Occupied | 172 (44.7%) | $69,196 |
| Renter-Occupied | 213 (55.3%) | $35,391 |
| Average | 385 (100.0%) | $44,042 |
Occupancy by Householder Income Bracket in Ola
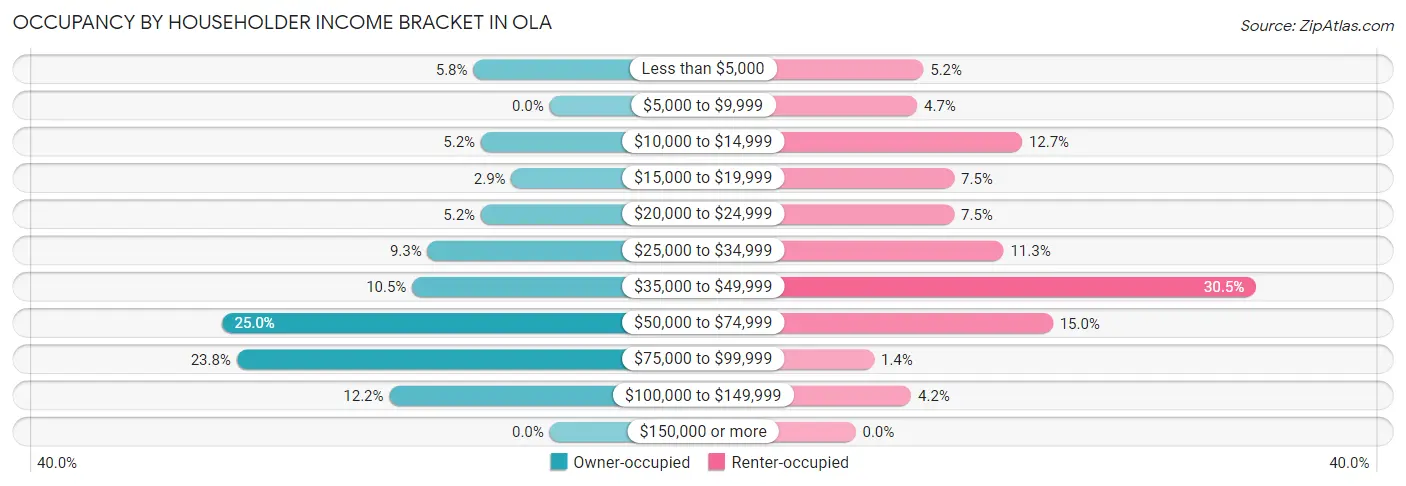
| Income Bracket | Owner-occupied | Renter-occupied |
| Less than $5,000 | 10 (5.8%) | 11 (5.2%) |
| $5,000 to $9,999 | 0 (0.0%) | 10 (4.7%) |
| $10,000 to $14,999 | 9 (5.2%) | 27 (12.7%) |
| $15,000 to $19,999 | 5 (2.9%) | 16 (7.5%) |
| $20,000 to $24,999 | 9 (5.2%) | 16 (7.5%) |
| $25,000 to $34,999 | 16 (9.3%) | 24 (11.3%) |
| $35,000 to $49,999 | 18 (10.5%) | 65 (30.5%) |
| $50,000 to $74,999 | 43 (25.0%) | 32 (15.0%) |
| $75,000 to $99,999 | 41 (23.8%) | 3 (1.4%) |
| $100,000 to $149,999 | 21 (12.2%) | 9 (4.2%) |
| $150,000 or more | 0 (0.0%) | 0 (0.0%) |
| Total | 172 (100.0%) | 213 (100.0%) |
Monthly Housing Cost Tiers in Ola
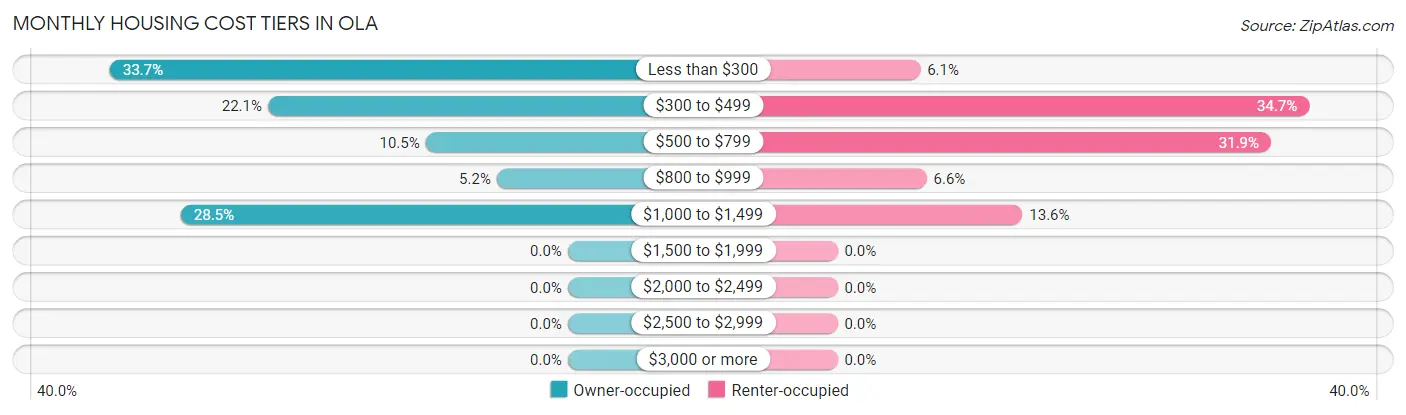
| Monthly Cost | Owner-occupied | Renter-occupied |
| Less than $300 | 58 (33.7%) | 13 (6.1%) |
| $300 to $499 | 38 (22.1%) | 74 (34.7%) |
| $500 to $799 | 18 (10.5%) | 68 (31.9%) |
| $800 to $999 | 9 (5.2%) | 14 (6.6%) |
| $1,000 to $1,499 | 49 (28.5%) | 29 (13.6%) |
| $1,500 to $1,999 | 0 (0.0%) | 0 (0.0%) |
| $2,000 to $2,499 | 0 (0.0%) | 0 (0.0%) |
| $2,500 to $2,999 | 0 (0.0%) | 0 (0.0%) |
| $3,000 or more | 0 (0.0%) | 0 (0.0%) |
| Total | 172 (100.0%) | 213 (100.0%) |
Physical Housing Characteristics in Ola
Housing Structures in Ola
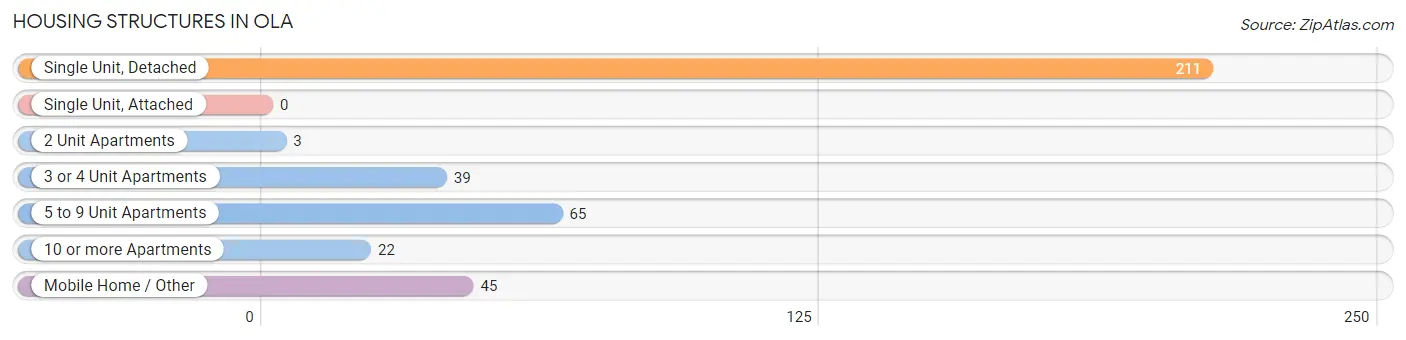
| Structure Type | # Housing Units | % Housing Units |
| Single Unit, Detached | 211 | 54.8% |
| Single Unit, Attached | 0 | 0.0% |
| 2 Unit Apartments | 3 | 0.8% |
| 3 or 4 Unit Apartments | 39 | 10.1% |
| 5 to 9 Unit Apartments | 65 | 16.9% |
| 10 or more Apartments | 22 | 5.7% |
| Mobile Home / Other | 45 | 11.7% |
| Total | 385 | 100.0% |
Housing Structures by Occupancy in Ola
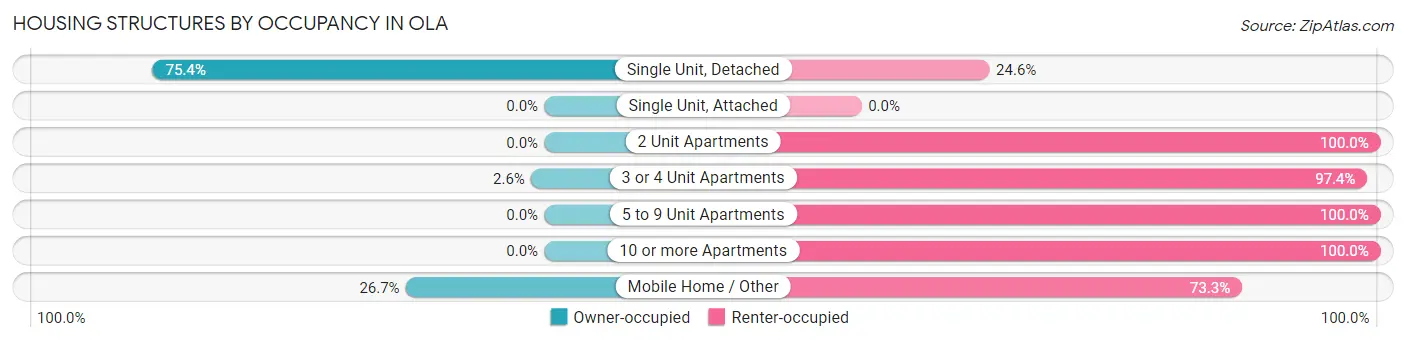
| Structure Type | Owner-occupied | Renter-occupied |
| Single Unit, Detached | 159 (75.4%) | 52 (24.6%) |
| Single Unit, Attached | 0 (0.0%) | 0 (0.0%) |
| 2 Unit Apartments | 0 (0.0%) | 3 (100.0%) |
| 3 or 4 Unit Apartments | 1 (2.6%) | 38 (97.4%) |
| 5 to 9 Unit Apartments | 0 (0.0%) | 65 (100.0%) |
| 10 or more Apartments | 0 (0.0%) | 22 (100.0%) |
| Mobile Home / Other | 12 (26.7%) | 33 (73.3%) |
| Total | 172 (44.7%) | 213 (55.3%) |
Housing Structures by Number of Rooms in Ola
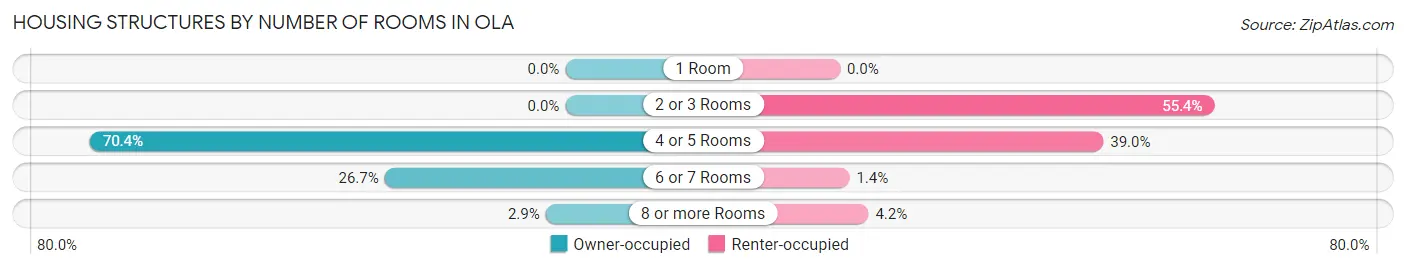
| Number of Rooms | Owner-occupied | Renter-occupied |
| 1 Room | 0 (0.0%) | 0 (0.0%) |
| 2 or 3 Rooms | 0 (0.0%) | 118 (55.4%) |
| 4 or 5 Rooms | 121 (70.4%) | 83 (39.0%) |
| 6 or 7 Rooms | 46 (26.7%) | 3 (1.4%) |
| 8 or more Rooms | 5 (2.9%) | 9 (4.2%) |
| Total | 172 (100.0%) | 213 (100.0%) |
Housing Structure by Heating Type in Ola
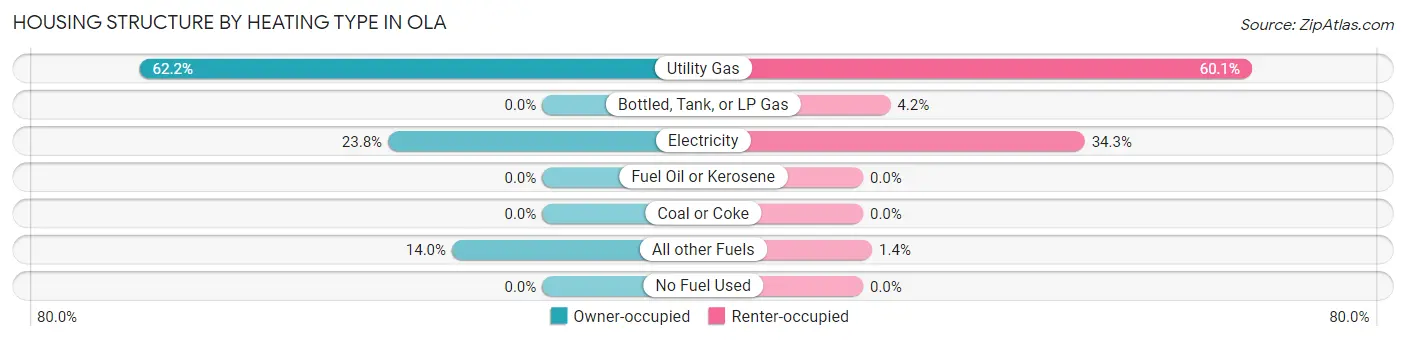
| Heating Type | Owner-occupied | Renter-occupied |
| Utility Gas | 107 (62.2%) | 128 (60.1%) |
| Bottled, Tank, or LP Gas | 0 (0.0%) | 9 (4.2%) |
| Electricity | 41 (23.8%) | 73 (34.3%) |
| Fuel Oil or Kerosene | 0 (0.0%) | 0 (0.0%) |
| Coal or Coke | 0 (0.0%) | 0 (0.0%) |
| All other Fuels | 24 (14.0%) | 3 (1.4%) |
| No Fuel Used | 0 (0.0%) | 0 (0.0%) |
| Total | 172 (100.0%) | 213 (100.0%) |
Household Vehicle Usage in Ola
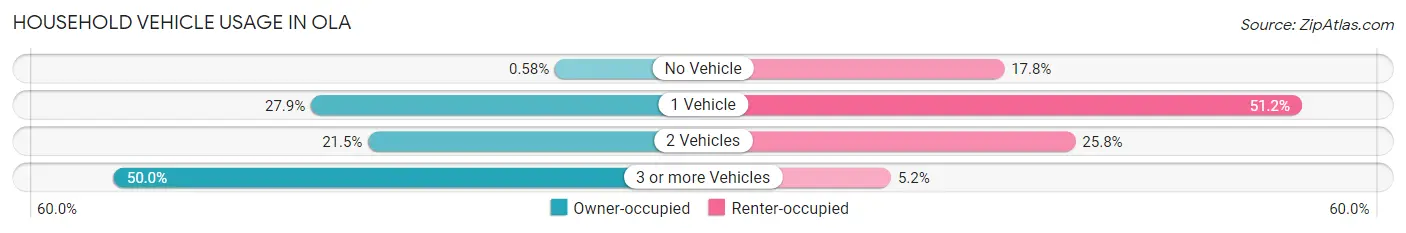
| Vehicles per Household | Owner-occupied | Renter-occupied |
| No Vehicle | 1 (0.6%) | 38 (17.8%) |
| 1 Vehicle | 48 (27.9%) | 109 (51.2%) |
| 2 Vehicles | 37 (21.5%) | 55 (25.8%) |
| 3 or more Vehicles | 86 (50.0%) | 11 (5.2%) |
| Total | 172 (100.0%) | 213 (100.0%) |
Real Estate & Mortgages in Ola
Real Estate and Mortgage Overview in Ola
| Characteristic | Without Mortgage | With Mortgage |
| Housing Units | 97 | 75 |
| Median Property Value | $57,500 | $69,500 |
| Median Household Income | $71,563 | $0 |
| Monthly Housing Costs | $253 | $0 |
| Real Estate Taxes | $280 | $0 |
Property Value by Mortgage Status in Ola
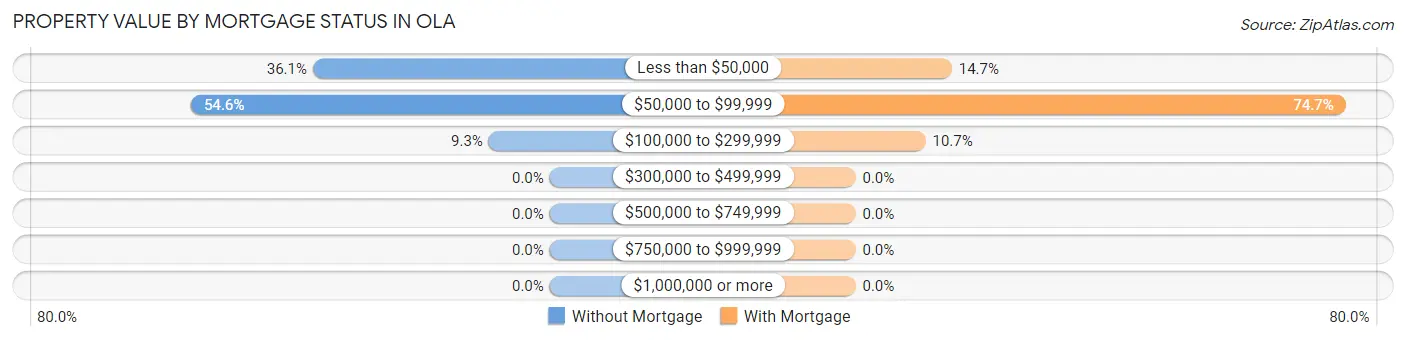
| Property Value | Without Mortgage | With Mortgage |
| Less than $50,000 | 35 (36.1%) | 11 (14.7%) |
| $50,000 to $99,999 | 53 (54.6%) | 56 (74.7%) |
| $100,000 to $299,999 | 9 (9.3%) | 8 (10.7%) |
| $300,000 to $499,999 | 0 (0.0%) | 0 (0.0%) |
| $500,000 to $749,999 | 0 (0.0%) | 0 (0.0%) |
| $750,000 to $999,999 | 0 (0.0%) | 0 (0.0%) |
| $1,000,000 or more | 0 (0.0%) | 0 (0.0%) |
| Total | 97 (100.0%) | 75 (100.0%) |
Household Income by Mortgage Status in Ola
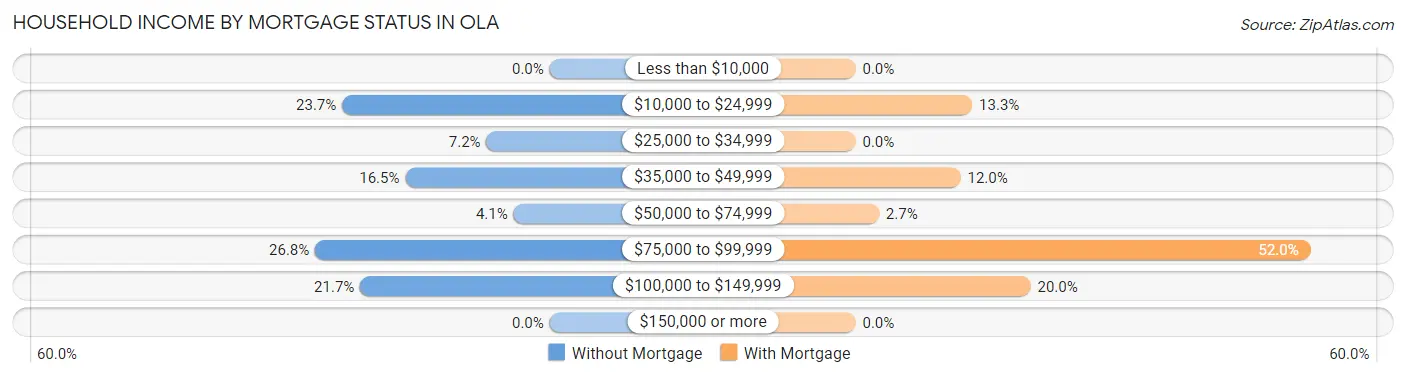
| Household Income | Without Mortgage | With Mortgage |
| Less than $10,000 | 0 (0.0%) | 0 (0.0%) |
| $10,000 to $24,999 | 23 (23.7%) | 10 (13.3%) |
| $25,000 to $34,999 | 7 (7.2%) | 0 (0.0%) |
| $35,000 to $49,999 | 16 (16.5%) | 9 (12.0%) |
| $50,000 to $74,999 | 4 (4.1%) | 2 (2.7%) |
| $75,000 to $99,999 | 26 (26.8%) | 39 (52.0%) |
| $100,000 to $149,999 | 21 (21.6%) | 15 (20.0%) |
| $150,000 or more | 0 (0.0%) | 0 (0.0%) |
| Total | 97 (100.0%) | 75 (100.0%) |
Property Value to Household Income Ratio in Ola
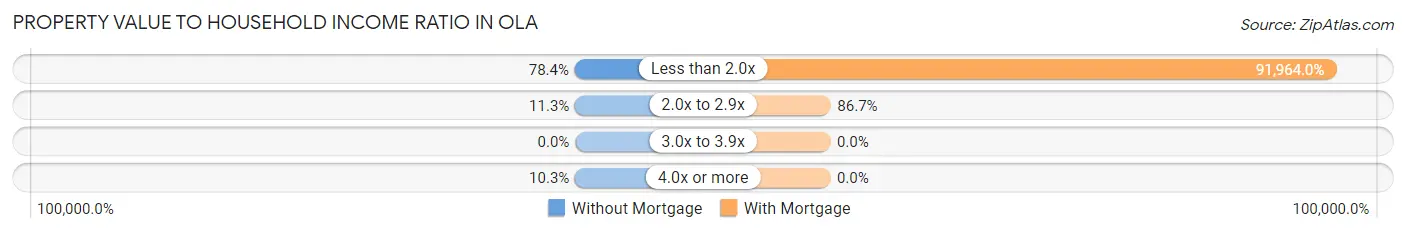
| Value-to-Income Ratio | Without Mortgage | With Mortgage |
| Less than 2.0x | 76 (78.3%) | 68,973 (91,964.0%) |
| 2.0x to 2.9x | 11 (11.3%) | 65 (86.7%) |
| 3.0x to 3.9x | 0 (0.0%) | 0 (0.0%) |
| 4.0x or more | 10 (10.3%) | 0 (0.0%) |
| Total | 97 (100.0%) | 75 (100.0%) |
Real Estate Taxes by Mortgage Status in Ola
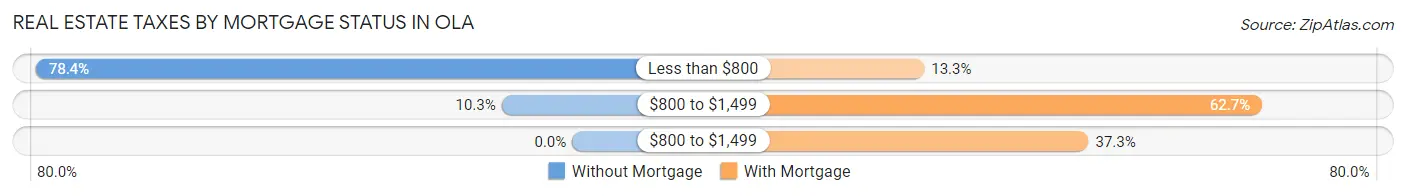
| Property Taxes | Without Mortgage | With Mortgage |
| Less than $800 | 76 (78.3%) | 10 (13.3%) |
| $800 to $1,499 | 10 (10.3%) | 47 (62.7%) |
| $800 to $1,499 | 0 (0.0%) | 28 (37.3%) |
| Total | 97 (100.0%) | 75 (100.0%) |
Health & Disability in Ola
Health Insurance Coverage by Age in Ola
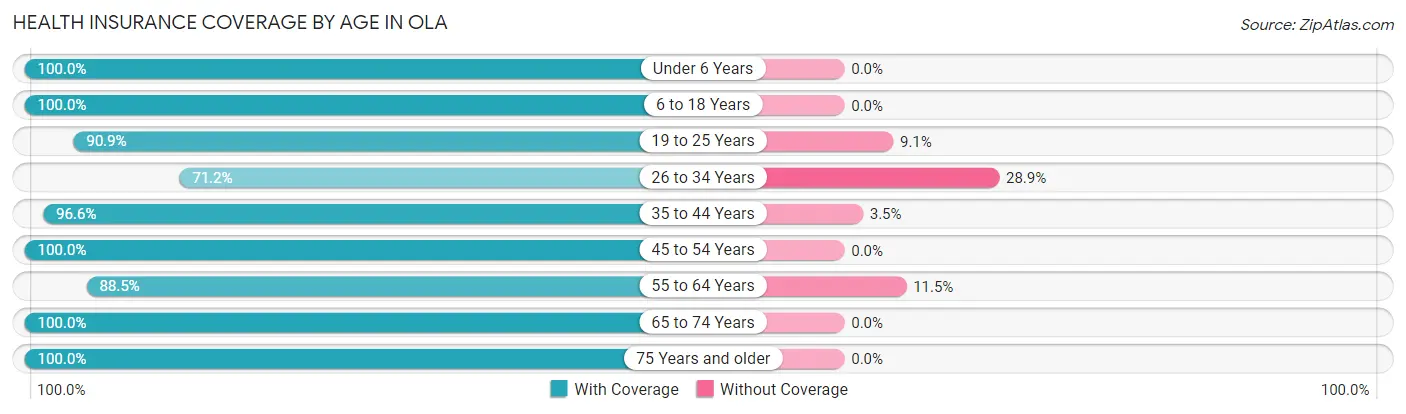
| Age Bracket | With Coverage | Without Coverage |
| Under 6 Years | 38 (100.0%) | 0 (0.0%) |
| 6 to 18 Years | 121 (100.0%) | 0 (0.0%) |
| 19 to 25 Years | 100 (90.9%) | 10 (9.1%) |
| 26 to 34 Years | 74 (71.2%) | 30 (28.8%) |
| 35 to 44 Years | 56 (96.6%) | 2 (3.5%) |
| 45 to 54 Years | 132 (100.0%) | 0 (0.0%) |
| 55 to 64 Years | 138 (88.5%) | 18 (11.5%) |
| 65 to 74 Years | 58 (100.0%) | 0 (0.0%) |
| 75 Years and older | 53 (100.0%) | 0 (0.0%) |
| Total | 770 (92.8%) | 60 (7.2%) |
Health Insurance Coverage by Citizenship Status in Ola
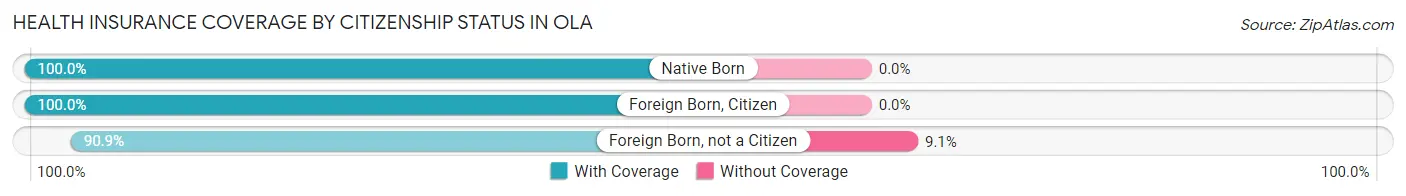
| Citizenship Status | With Coverage | Without Coverage |
| Native Born | 38 (100.0%) | 0 (0.0%) |
| Foreign Born, Citizen | 121 (100.0%) | 0 (0.0%) |
| Foreign Born, not a Citizen | 100 (90.9%) | 10 (9.1%) |
Health Insurance Coverage by Household Income in Ola
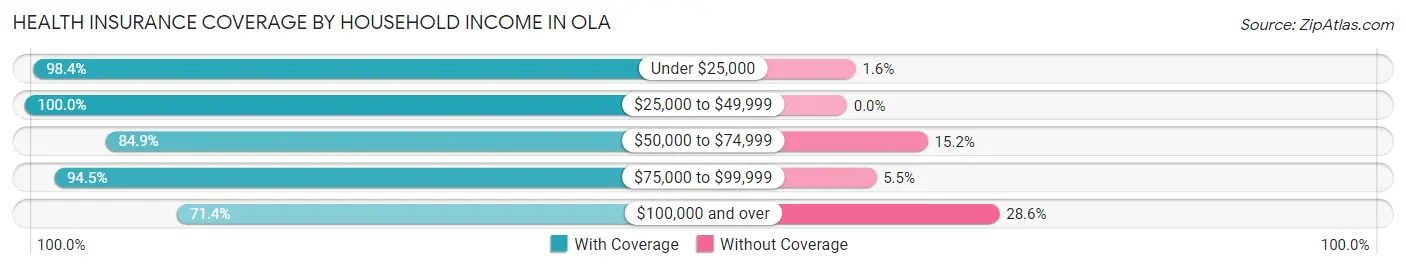
| Household Income | With Coverage | Without Coverage |
| Under $25,000 | 182 (98.4%) | 3 (1.6%) |
| $25,000 to $49,999 | 281 (100.0%) | 0 (0.0%) |
| $50,000 to $74,999 | 112 (84.9%) | 20 (15.1%) |
| $75,000 to $99,999 | 120 (94.5%) | 7 (5.5%) |
| $100,000 and over | 75 (71.4%) | 30 (28.6%) |
Public vs Private Health Insurance Coverage by Age in Ola
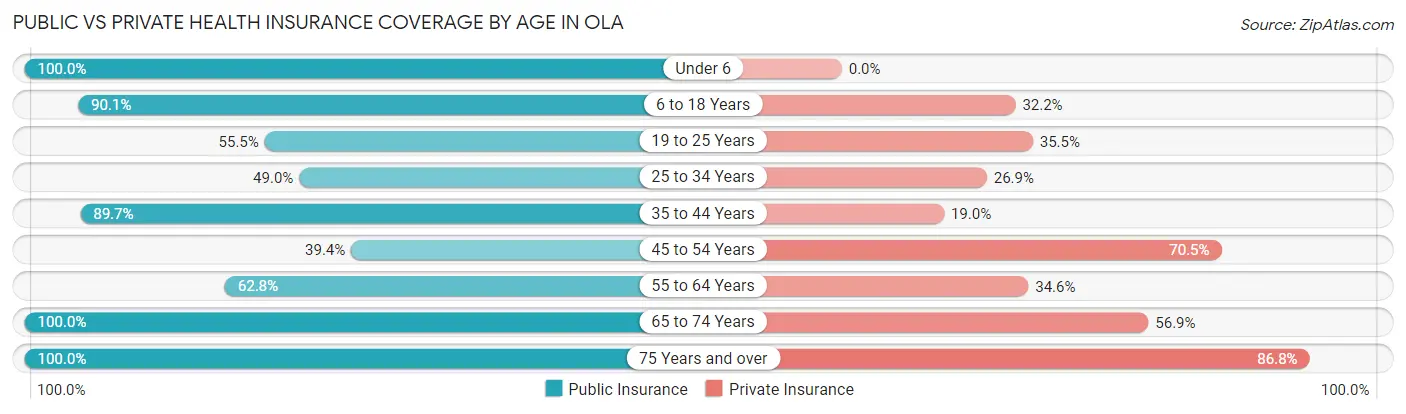
| Age Bracket | Public Insurance | Private Insurance |
| Under 6 | 38 (100.0%) | 0 (0.0%) |
| 6 to 18 Years | 109 (90.1%) | 39 (32.2%) |
| 19 to 25 Years | 61 (55.4%) | 39 (35.4%) |
| 25 to 34 Years | 51 (49.0%) | 28 (26.9%) |
| 35 to 44 Years | 52 (89.7%) | 11 (19.0%) |
| 45 to 54 Years | 52 (39.4%) | 93 (70.5%) |
| 55 to 64 Years | 98 (62.8%) | 54 (34.6%) |
| 65 to 74 Years | 58 (100.0%) | 33 (56.9%) |
| 75 Years and over | 53 (100.0%) | 46 (86.8%) |
| Total | 572 (68.9%) | 343 (41.3%) |
Disability Status by Sex by Age in Ola
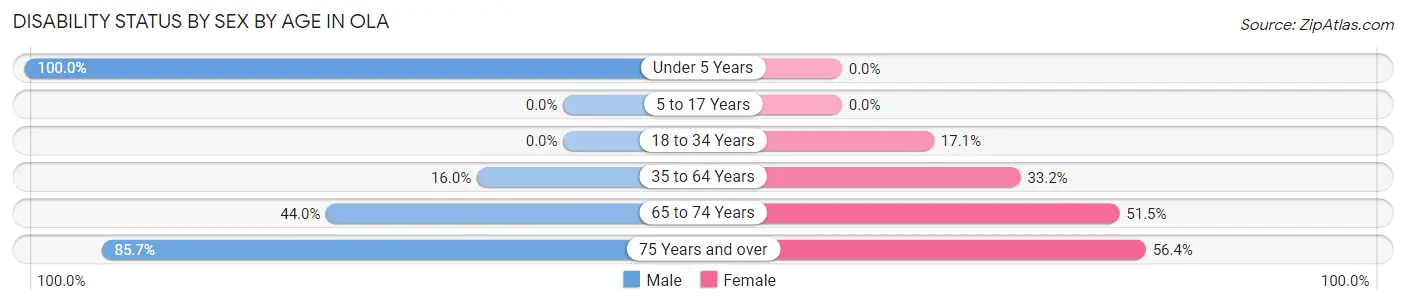
| Age Bracket | Male | Female |
| Under 5 Years | 9 (100.0%) | 0 (0.0%) |
| 5 to 17 Years | 0 (0.0%) | 0 (0.0%) |
| 18 to 34 Years | 0 (0.0%) | 20 (17.1%) |
| 35 to 64 Years | 25 (16.0%) | 63 (33.2%) |
| 65 to 74 Years | 11 (44.0%) | 17 (51.5%) |
| 75 Years and over | 12 (85.7%) | 22 (56.4%) |
Disability Class by Sex by Age in Ola
Disability Class: Hearing Difficulty
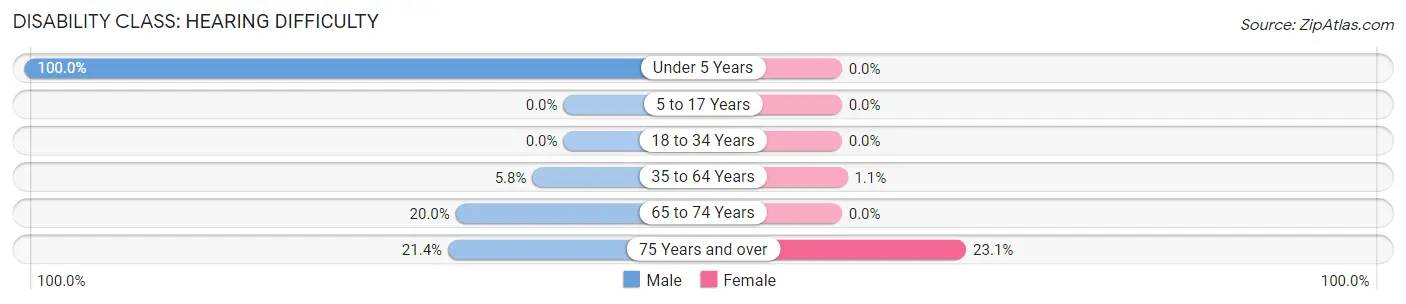
| Age Bracket | Male | Female |
| Under 5 Years | 9 (100.0%) | 0 (0.0%) |
| 5 to 17 Years | 0 (0.0%) | 0 (0.0%) |
| 18 to 34 Years | 0 (0.0%) | 0 (0.0%) |
| 35 to 64 Years | 9 (5.8%) | 2 (1.1%) |
| 65 to 74 Years | 5 (20.0%) | 0 (0.0%) |
| 75 Years and over | 3 (21.4%) | 9 (23.1%) |
Disability Class: Vision Difficulty
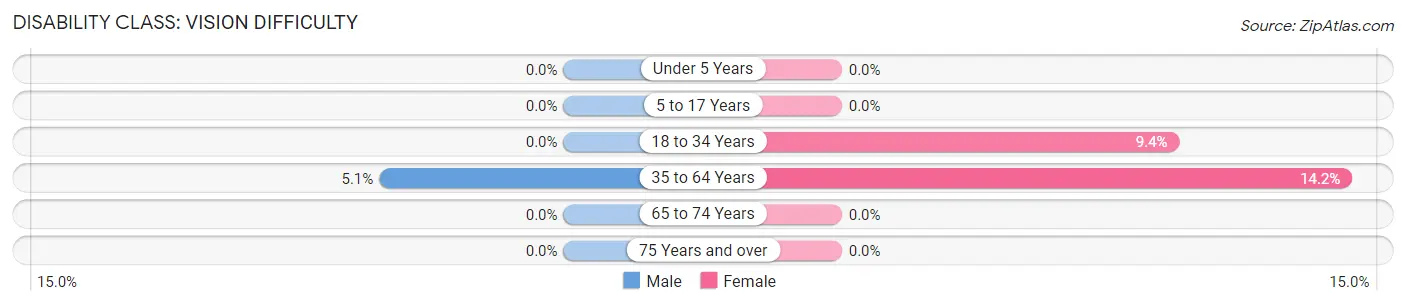
| Age Bracket | Male | Female |
| Under 5 Years | 0 (0.0%) | 0 (0.0%) |
| 5 to 17 Years | 0 (0.0%) | 0 (0.0%) |
| 18 to 34 Years | 0 (0.0%) | 11 (9.4%) |
| 35 to 64 Years | 8 (5.1%) | 27 (14.2%) |
| 65 to 74 Years | 0 (0.0%) | 0 (0.0%) |
| 75 Years and over | 0 (0.0%) | 0 (0.0%) |
Disability Class: Cognitive Difficulty
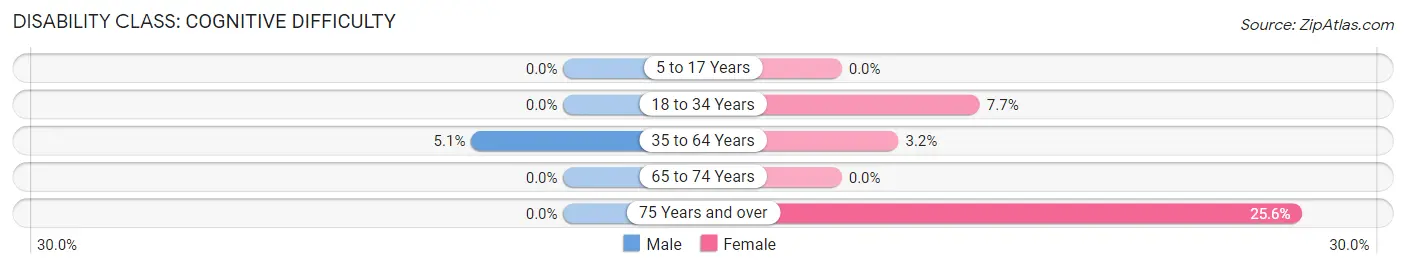
| Age Bracket | Male | Female |
| 5 to 17 Years | 0 (0.0%) | 0 (0.0%) |
| 18 to 34 Years | 0 (0.0%) | 9 (7.7%) |
| 35 to 64 Years | 8 (5.1%) | 6 (3.2%) |
| 65 to 74 Years | 0 (0.0%) | 0 (0.0%) |
| 75 Years and over | 0 (0.0%) | 10 (25.6%) |
Disability Class: Ambulatory Difficulty
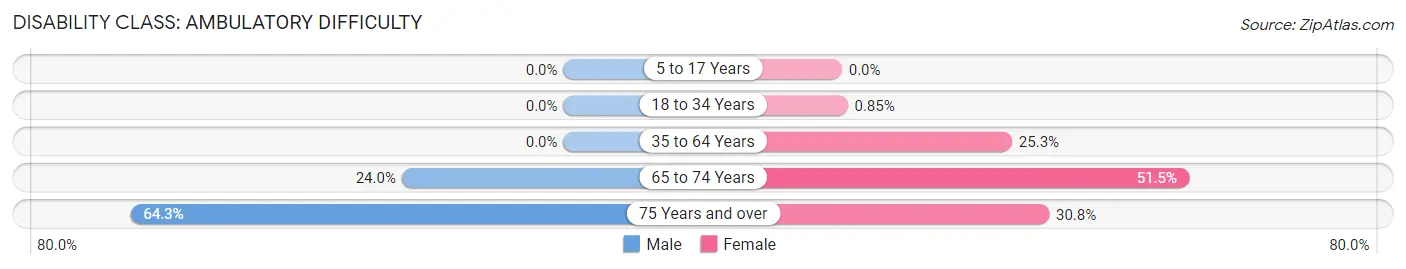
| Age Bracket | Male | Female |
| 5 to 17 Years | 0 (0.0%) | 0 (0.0%) |
| 18 to 34 Years | 0 (0.0%) | 1 (0.9%) |
| 35 to 64 Years | 0 (0.0%) | 48 (25.3%) |
| 65 to 74 Years | 6 (24.0%) | 17 (51.5%) |
| 75 Years and over | 9 (64.3%) | 12 (30.8%) |
Disability Class: Self-Care Difficulty
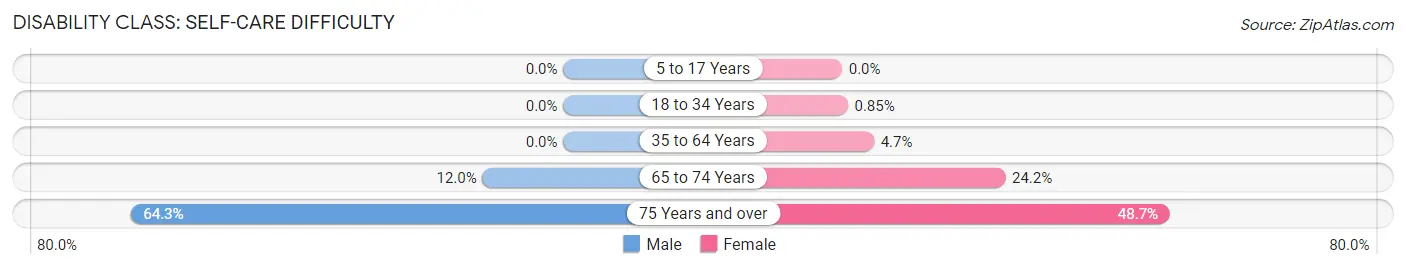
| Age Bracket | Male | Female |
| 5 to 17 Years | 0 (0.0%) | 0 (0.0%) |
| 18 to 34 Years | 0 (0.0%) | 1 (0.9%) |
| 35 to 64 Years | 0 (0.0%) | 9 (4.7%) |
| 65 to 74 Years | 3 (12.0%) | 8 (24.2%) |
| 75 Years and over | 9 (64.3%) | 19 (48.7%) |
Technology Access in Ola
Computing Device Access in Ola
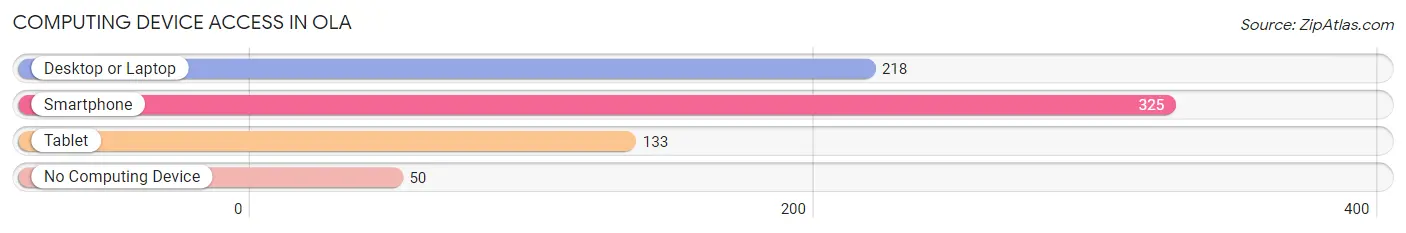
| Device Type | # Households | % Households |
| Desktop or Laptop | 218 | 56.6% |
| Smartphone | 325 | 84.4% |
| Tablet | 133 | 34.5% |
| No Computing Device | 50 | 13.0% |
| Total | 385 | 100.0% |
Internet Access in Ola
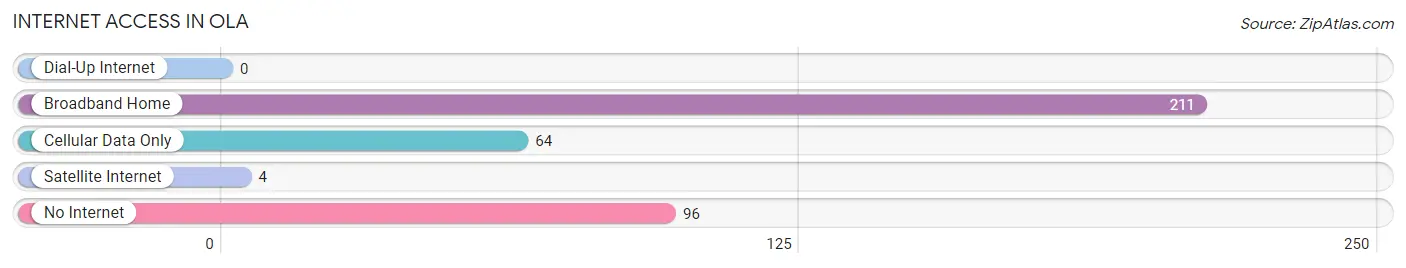
| Internet Type | # Households | % Households |
| Dial-Up Internet | 0 | 0.0% |
| Broadband Home | 211 | 54.8% |
| Cellular Data Only | 64 | 16.6% |
| Satellite Internet | 4 | 1.0% |
| No Internet | 96 | 24.9% |
| Total | 385 | 100.0% |
Ola Summary
Ola is a city located in Yell County, Arkansas, United States. The population was 1,845 at the 2010 census. It is part of the Russellville Micropolitan Statistical Area.
Geography
Ola is located at 35 17 45 N 93 17 17 W 35 295890 93 288118
According to the United States Census Bureau the city has a total area of 2 2sqmi all land
History
Ola was founded in 1872 by the Reverend John W. Ola, a Methodist minister. The town was named after him. The first post office was established in 1873.
The Ola Historic District was listed on the National Register of Historic Places in 1992
Demographics
As of the census of 2000, there were 1,845 people, 745 households, and 517 families residing in the city. The population density was 837.2 people per square mile (323.3/km^2). There were 817 housing units at an average density of 370.3 per square mile (143.0/km^2). The racial makeup of the city was 97.45% White, 0.11% Black or African American, 0.60% Native American, 0.05% Asian, 0.05% Pacific Islander, 0.60% from other races, and 1.14% from two or more races. 1.60% of the population were Hispanic or Latino of any race.
There were 745 households, out of which 32.2% had children under the age of 18 living with them, 51.7% were married couples living together, 12.7% had a female householder with no husband present, and 31.7% were non-families. 28.7% of all households were made up of individuals, and 15.2% had someone living alone who was 65 years of age or older. The average household size was 2.45 and the average family size was 3.00.
In the city, the population was spread out, with 26.2% under the age of 18, 8.2% from 18 to 24, 27.2% from 25 to 44, 21.7% from 45 to 64, and 16.7% who were 65 years of age or older. The median age was 37 years. For every 100 females, there were 87.2 males. For every 100 females age 18 and over, there were 82.2 males.
The median income for a household in the city was $25,938, and the median income for a family was $31,250. Males had a median income of $25,000 versus $19,375 for females. The per capita income for the city was $13,945. About 14.2% of families and 17.2% of the population were below the poverty line, including 22.2% of those under age 18 and 16.2% of those age 65 or over.
Economy
Ola is a small rural town with a population of 1,845. The economy is largely based on agriculture and small businesses. The town is home to a variety of small businesses, including a grocery store, a hardware store, a restaurant, and a few other small shops. The town also has a few manufacturing plants, including a poultry processing plant and a wood products plant.
The town is also home to a few tourist attractions, including the Ola Museum, which houses artifacts from the town's history, and the Ola Water Park, which features a variety of water slides and pools.
The town is served by the Ola School District, which includes an elementary school, a middle school, and a high school. The school district also operates a vocational-technical school.
Conclusion
Ola is a small rural town located in Yell County, Arkansas. The town has a population of 1,845 and is largely based on agriculture and small businesses. The town is home to a variety of small businesses, a few manufacturing plants, and a few tourist attractions. The town is served by the Ola School District, which includes an elementary school, a middle school, and a high school. Ola is a great place to live and work, and is a great example of a small town in Arkansas.
Common Questions
What is Per Capita Income in Ola?
Per Capita income in Ola is $21,753.
What is the Median Family Income in Ola?
Median Family Income in Ola is $67,188.
What is the Median Household income in Ola?
Median Household Income in Ola is $44,042.
What is Income or Wage Gap in Ola?
Income or Wage Gap in Ola is 36.3%.
Women in Ola earn 63.7 cents for every dollar earned by a man.
What is Family Income Deficit in Ola?
Family Income Deficit in Ola is $7,312.
Families that are below poverty line in Ola earn $7,312 less on average than the poverty threshold level.
What is Inequality or Gini Index in Ola?
Inequality or Gini Index in Ola is 0.38.
What is the Total Population of Ola?
Total Population of Ola is 869.
What is the Total Male Population of Ola?
Total Male Population of Ola is 416.
What is the Total Female Population of Ola?
Total Female Population of Ola is 453.
What is the Ratio of Males per 100 Females in Ola?
There are 91.83 Males per 100 Females in Ola.
What is the Ratio of Females per 100 Males in Ola?
There are 108.89 Females per 100 Males in Ola.
What is the Median Population Age in Ola?
Median Population Age in Ola is 44.7 Years.
What is the Average Family Size in Ola
Average Family Size in Ola is 2.8 People.
What is the Average Household Size in Ola
Average Household Size in Ola is 2.2 People.
How Large is the Labor Force in Ola?
There are 345 People in the Labor Forcein in Ola.
What is the Percentage of People in the Labor Force in Ola?
48.3% of People are in the Labor Force in Ola.
What is the Unemployment Rate in Ola?
Unemployment Rate in Ola is 6.7%.