O Kean, AR Map & Demographics
O Kean Map
O Kean Overview
$23,391
PER CAPITA INCOME
$40,000
AVG FAMILY INCOME
$48,750
AVG HOUSEHOLD INCOME
0.30
INEQUALITY / GINI INDEX
149
TOTAL POPULATION
80
MALE POPULATION
69
FEMALE POPULATION
115.94
MALES / 100 FEMALES
86.25
FEMALES / 100 MALES
65.3
MEDIAN AGE
2.6
AVG FAMILY SIZE
2.5
AVG HOUSEHOLD SIZE
45
LABOR FORCE [ PEOPLE ]
34.4%
PERCENT IN LABOR FORCE
6.7%
UNEMPLOYMENT RATE
O Kean Zip Codes
O Kean Area Codes
Income in O Kean
Income Overview in O Kean
Per Capita Income in O Kean is $23,391, while median incomes of families and households are $40,000 and $48,750 respectively.
| Characteristic | Number | Measure |
| Per Capita Income | 149 | $23,391 |
| Median Family Income | 40 | $40,000 |
| Mean Family Income | 40 | $43,715 |
| Median Household Income | 58 | $48,750 |
| Mean Household Income | 58 | $44,567 |
| Income Deficit | 40 | $0 |
| Wage / Income Gap (%) | 149 | 0.00% |
| Wage / Income Gap ($) | 149 | 100.00¢ per $1 |
| Gini / Inequality Index | 149 | 0.30 |
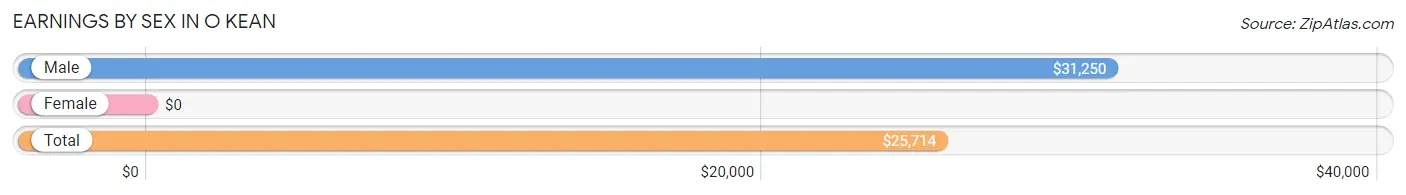
Earnings by Sex in O Kean
| Sex | Number | Average Earnings |
| Male | 33 (66.0%) | $31,250 |
| Female | 17 (34.0%) | $0 |
| Total | 50 (100.0%) | $25,714 |
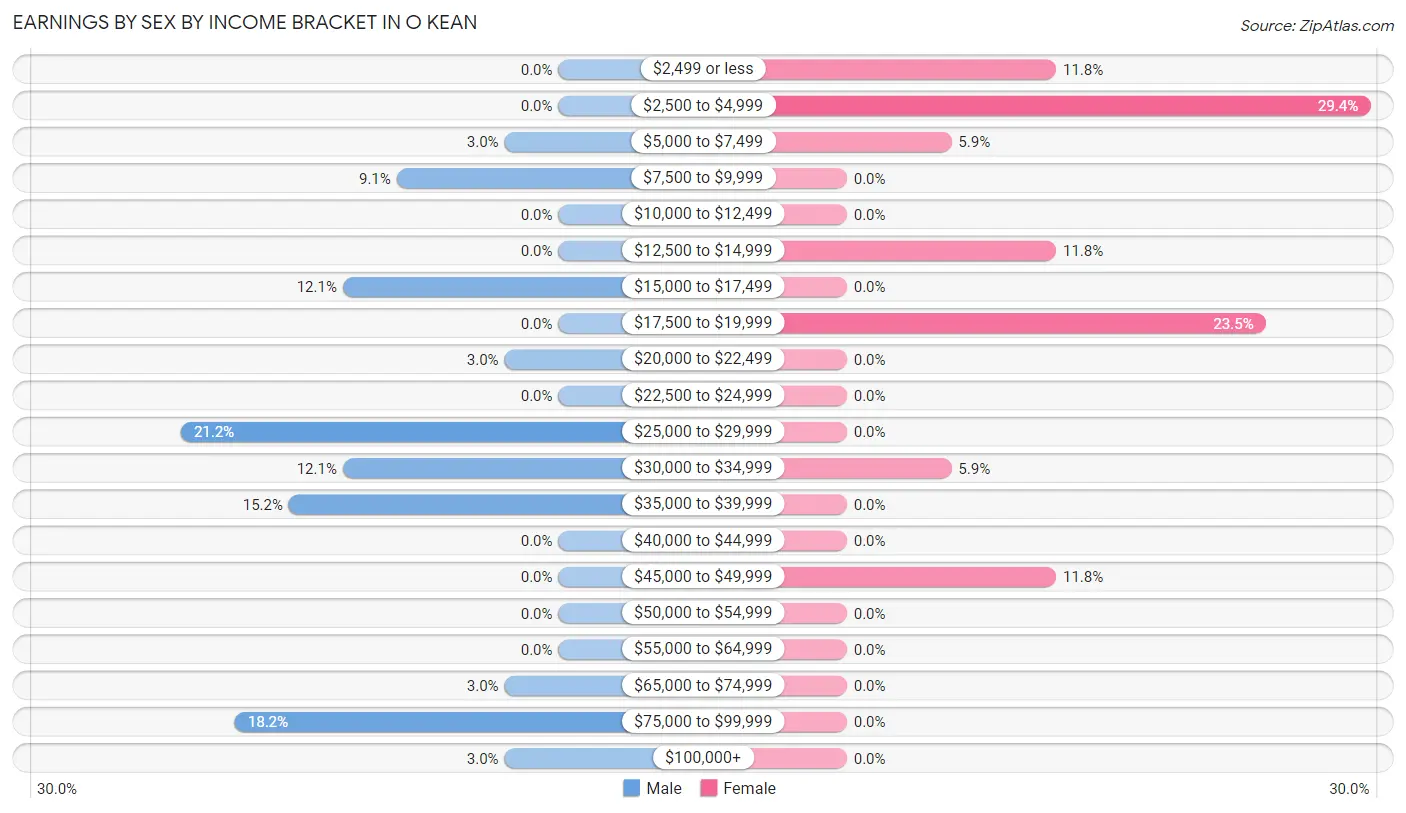
Earnings by Sex by Income Bracket in O Kean
The most common earnings brackets in O Kean are $25,000 to $29,999 for men (7 | 21.2%) and $2,500 to $4,999 for women (5 | 29.4%).
| Income | Male | Female |
| $2,499 or less | 0 (0.0%) | 2 (11.8%) |
| $2,500 to $4,999 | 0 (0.0%) | 5 (29.4%) |
| $5,000 to $7,499 | 1 (3.0%) | 1 (5.9%) |
| $7,500 to $9,999 | 3 (9.1%) | 0 (0.0%) |
| $10,000 to $12,499 | 0 (0.0%) | 0 (0.0%) |
| $12,500 to $14,999 | 0 (0.0%) | 2 (11.8%) |
| $15,000 to $17,499 | 4 (12.1%) | 0 (0.0%) |
| $17,500 to $19,999 | 0 (0.0%) | 4 (23.5%) |
| $20,000 to $22,499 | 1 (3.0%) | 0 (0.0%) |
| $22,500 to $24,999 | 0 (0.0%) | 0 (0.0%) |
| $25,000 to $29,999 | 7 (21.2%) | 0 (0.0%) |
| $30,000 to $34,999 | 4 (12.1%) | 1 (5.9%) |
| $35,000 to $39,999 | 5 (15.1%) | 0 (0.0%) |
| $40,000 to $44,999 | 0 (0.0%) | 0 (0.0%) |
| $45,000 to $49,999 | 0 (0.0%) | 2 (11.8%) |
| $50,000 to $54,999 | 0 (0.0%) | 0 (0.0%) |
| $55,000 to $64,999 | 0 (0.0%) | 0 (0.0%) |
| $65,000 to $74,999 | 1 (3.0%) | 0 (0.0%) |
| $75,000 to $99,999 | 6 (18.2%) | 0 (0.0%) |
| $100,000+ | 1 (3.0%) | 0 (0.0%) |
| Total | 33 (100.0%) | 17 (100.0%) |
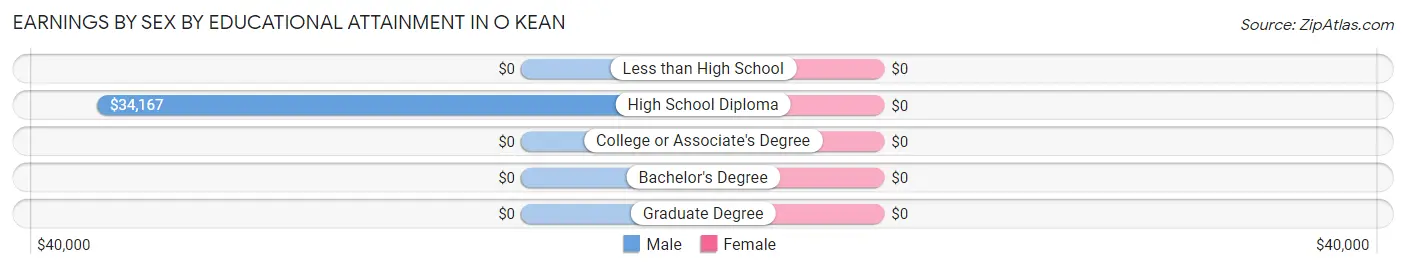
Earnings by Sex by Educational Attainment in O Kean
| Educational Attainment | Male Income | Female Income |
| Less than High School | - | - |
| High School Diploma | $34,167 | $0 |
| College or Associate's Degree | - | - |
| Bachelor's Degree | - | - |
| Graduate Degree | - | - |
| Total | $31,250 | $0 |
Family Income in O Kean
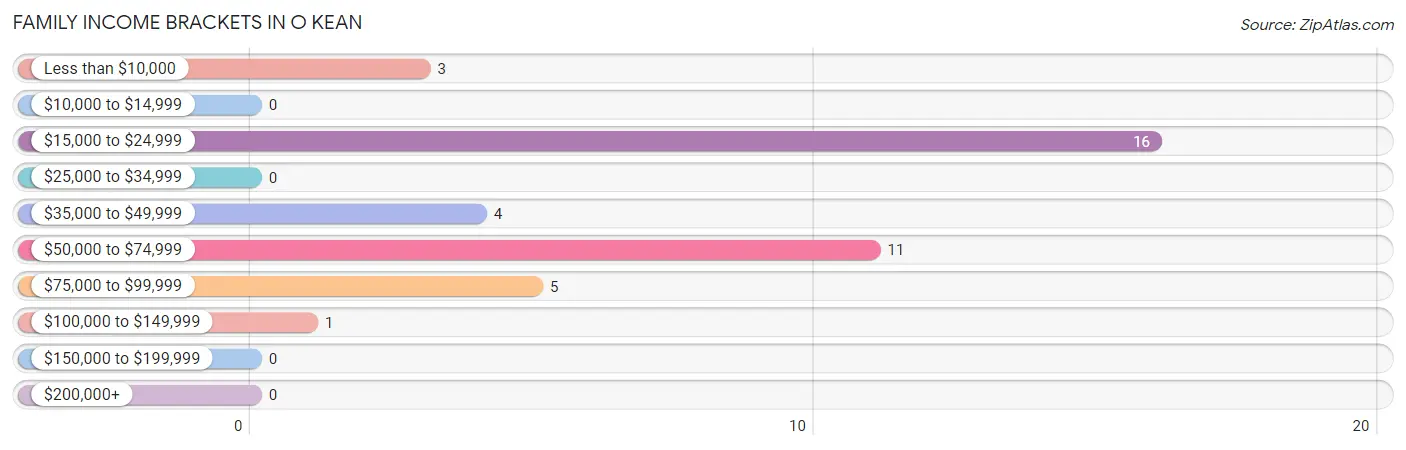
Family Income Brackets in O Kean
According to the O Kean family income data, there are 16 families falling into the $15,000 to $24,999 income range, which is the most common income bracket and makes up 40.0% of all families.
| Income Bracket | # Families | % Families |
| Less than $10,000 | 3 | 7.5% |
| $10,000 to $14,999 | 0 | 0.0% |
| $15,000 to $24,999 | 16 | 40.0% |
| $25,000 to $34,999 | 0 | 0.0% |
| $35,000 to $49,999 | 4 | 10.0% |
| $50,000 to $74,999 | 11 | 27.5% |
| $75,000 to $99,999 | 5 | 12.5% |
| $100,000 to $149,999 | 1 | 2.5% |
| $150,000 to $199,999 | 0 | 0.0% |
| $200,000+ | 0 | 0.0% |
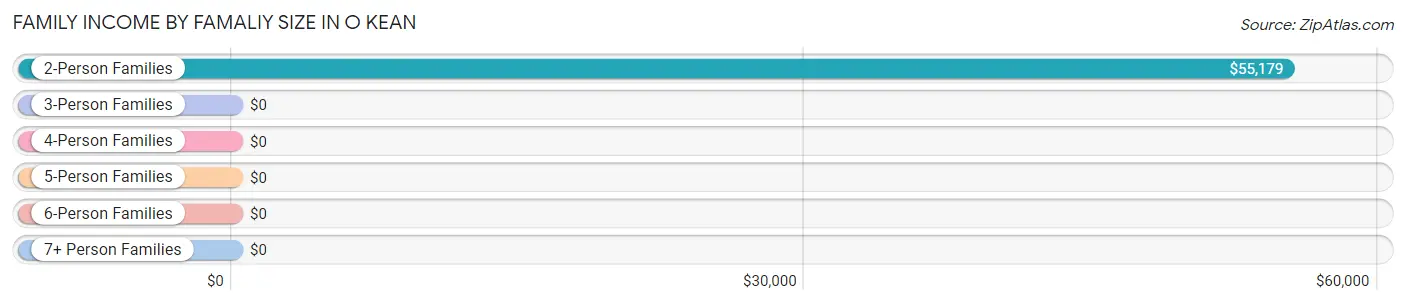
Family Income by Famaliy Size in O Kean
2-person families (29 | 72.5%) account for the highest median family income in O Kean with $55,179 per family, while 2-person families (29 | 72.5%) have the highest median income of $27,590 per family member.
| Income Bracket | # Families | Median Income |
| 2-Person Families | 29 (72.5%) | $55,179 |
| 3-Person Families | 3 (7.5%) | $0 |
| 4-Person Families | 5 (12.5%) | $0 |
| 5-Person Families | 3 (7.5%) | $0 |
| 6-Person Families | 0 (0.0%) | $0 |
| 7+ Person Families | 0 (0.0%) | $0 |
| Total | 40 (100.0%) | $40,000 |
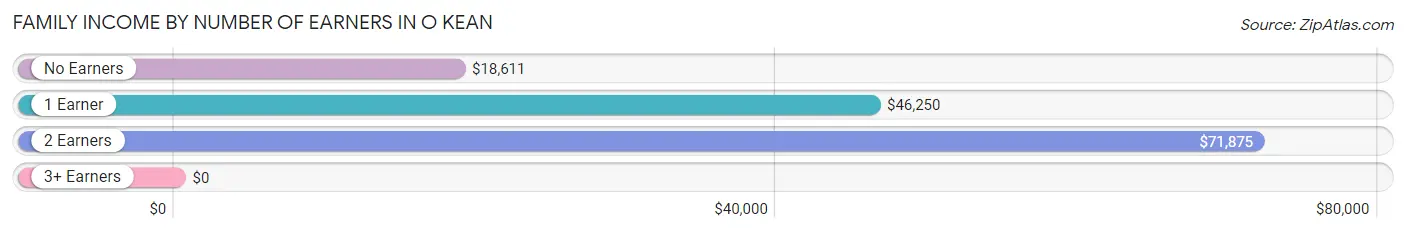
Family Income by Number of Earners in O Kean
| Number of Earners | # Families | Median Income |
| No Earners | 10 (25.0%) | $18,611 |
| 1 Earner | 22 (55.0%) | $46,250 |
| 2 Earners | 8 (20.0%) | $71,875 |
| 3+ Earners | 0 (0.0%) | $0 |
| Total | 40 (100.0%) | $40,000 |
Household Income in O Kean
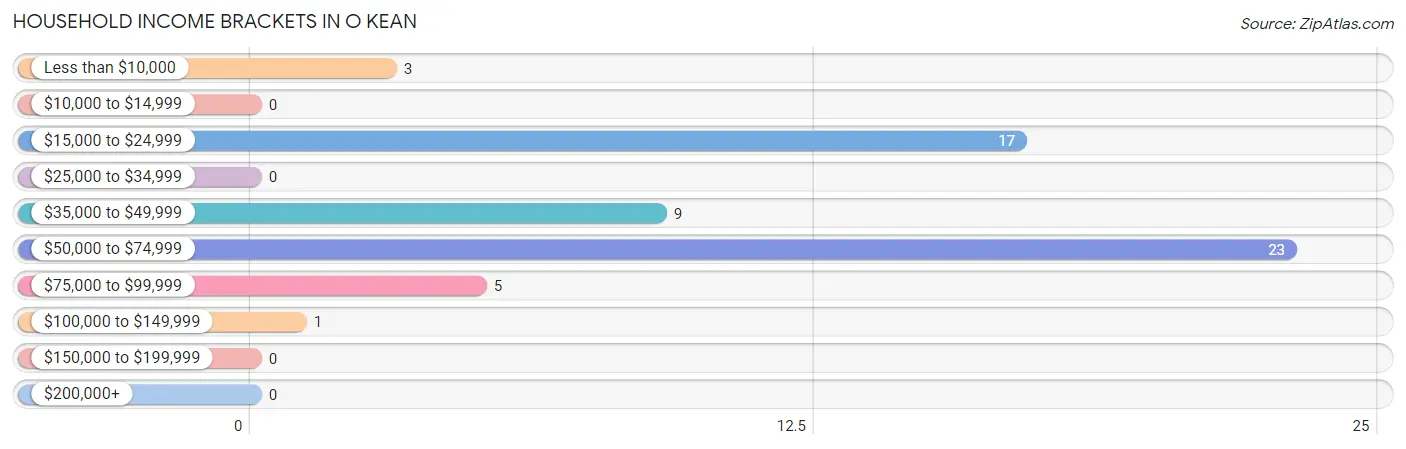
Household Income Brackets in O Kean
With 23 households falling in the category, the $50,000 to $74,999 income range is the most frequent in O Kean, accounting for 39.7% of all households.
| Income Bracket | # Households | % Households |
| Less than $10,000 | 3 | 5.2% |
| $10,000 to $14,999 | 0 | 0.0% |
| $15,000 to $24,999 | 17 | 29.3% |
| $25,000 to $34,999 | 0 | 0.0% |
| $35,000 to $49,999 | 9 | 15.5% |
| $50,000 to $74,999 | 23 | 39.7% |
| $75,000 to $99,999 | 5 | 8.6% |
| $100,000 to $149,999 | 1 | 1.7% |
| $150,000 to $199,999 | 0 | 0.0% |
| $200,000+ | 0 | 0.0% |
Household Income by Householder Age in O Kean
The median household income in O Kean is $48,750, with the highest median household income of $51,146 found in the 65+ years age bracket for the primary householder. A total of 37 households (63.8%) fall into this category.
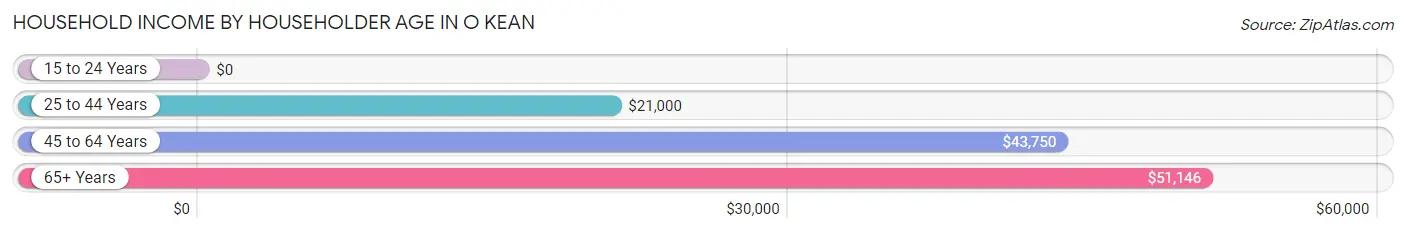
| Income Bracket | # Households | Median Income |
| 15 to 24 Years | 0 (0.0%) | $0 |
| 25 to 44 Years | 10 (17.2%) | $21,000 |
| 45 to 64 Years | 11 (19.0%) | $43,750 |
| 65+ Years | 37 (63.8%) | $51,146 |
| Total | 58 (100.0%) | $48,750 |
Poverty in O Kean
Income Below Poverty by Sex and Age in O Kean
With 30.0% poverty level for males and 21.7% for females among the residents of O Kean, under 5 year old males and 6 to 11 year old females are the most vulnerable to poverty, with 6 males (100.0%) and 6 females (100.0%) in their respective age groups living below the poverty level.
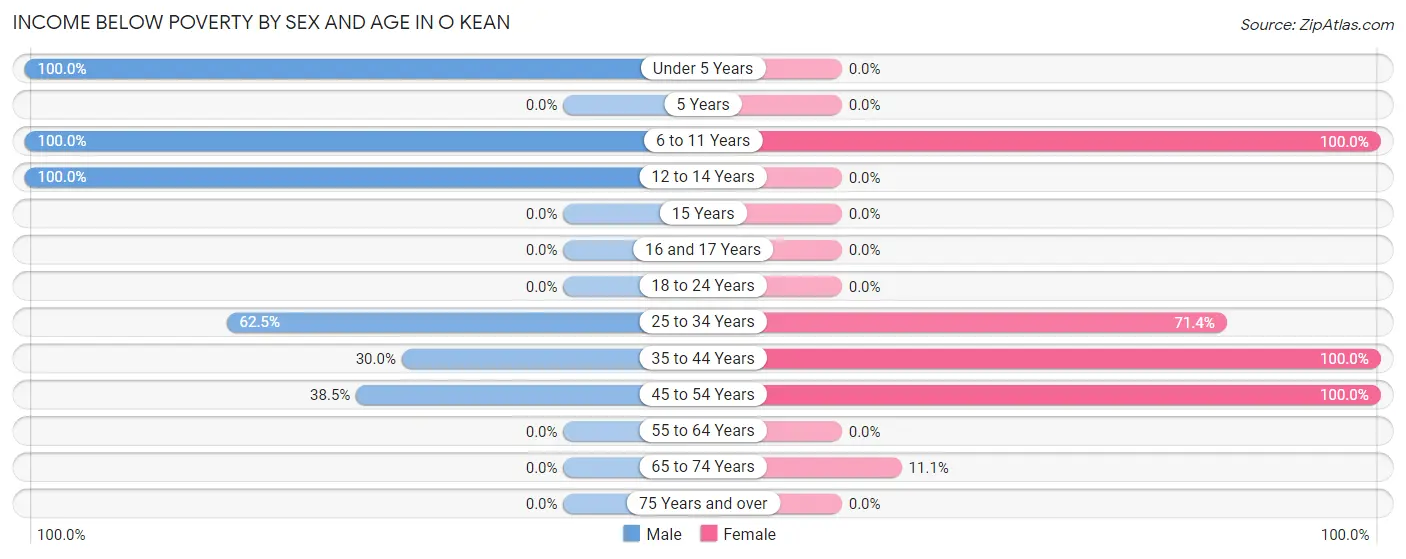
| Age Bracket | Male | Female |
| Under 5 Years | 6 (100.0%) | 0 (0.0%) |
| 5 Years | 0 (0.0%) | 0 (0.0%) |
| 6 to 11 Years | 3 (100.0%) | 6 (100.0%) |
| 12 to 14 Years | 2 (100.0%) | 0 (0.0%) |
| 15 Years | 0 (0.0%) | 0 (0.0%) |
| 16 and 17 Years | 0 (0.0%) | 0 (0.0%) |
| 18 to 24 Years | 0 (0.0%) | 0 (0.0%) |
| 25 to 34 Years | 5 (62.5%) | 5 (71.4%) |
| 35 to 44 Years | 3 (30.0%) | 2 (100.0%) |
| 45 to 54 Years | 5 (38.5%) | 1 (100.0%) |
| 55 to 64 Years | 0 (0.0%) | 0 (0.0%) |
| 65 to 74 Years | 0 (0.0%) | 1 (11.1%) |
| 75 Years and over | 0 (0.0%) | 0 (0.0%) |
| Total | 24 (30.0%) | 15 (21.7%) |
Income Above Poverty by Sex and Age in O Kean
According to the poverty statistics in O Kean, males aged 55 to 64 years and females aged 12 to 14 years are the age groups that are most secure financially, with 100.0% of males and 100.0% of females in these age groups living above the poverty line.
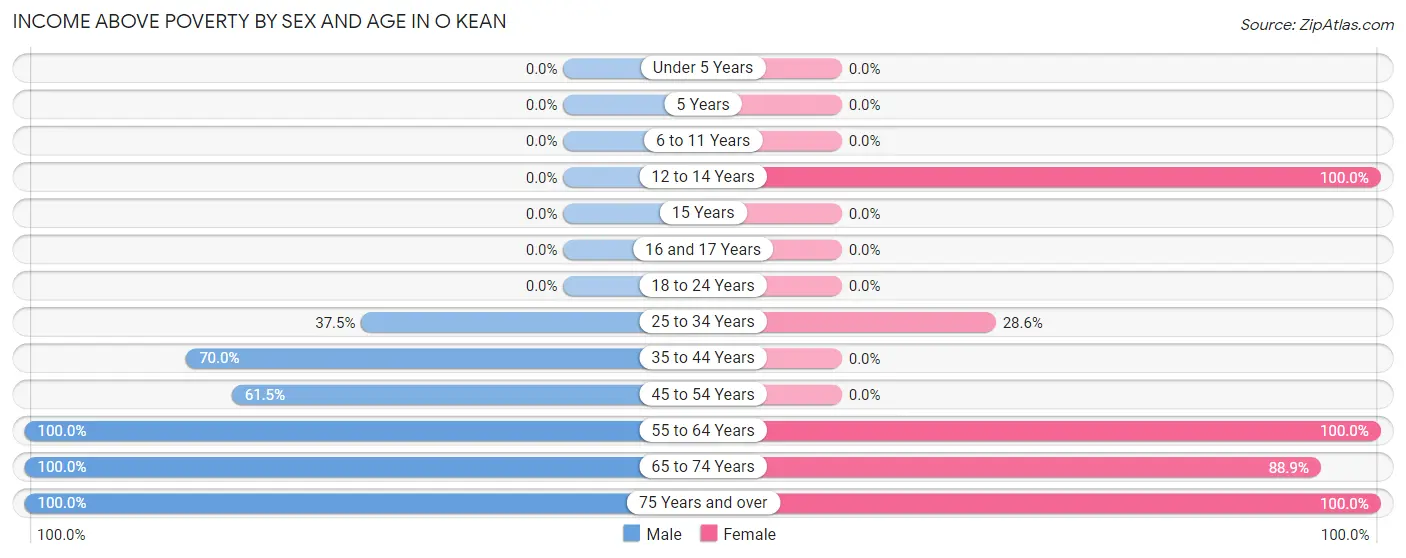
| Age Bracket | Male | Female |
| Under 5 Years | 0 (0.0%) | 0 (0.0%) |
| 5 Years | 0 (0.0%) | 0 (0.0%) |
| 6 to 11 Years | 0 (0.0%) | 0 (0.0%) |
| 12 to 14 Years | 0 (0.0%) | 1 (100.0%) |
| 15 Years | 0 (0.0%) | 0 (0.0%) |
| 16 and 17 Years | 0 (0.0%) | 0 (0.0%) |
| 18 to 24 Years | 0 (0.0%) | 0 (0.0%) |
| 25 to 34 Years | 3 (37.5%) | 2 (28.6%) |
| 35 to 44 Years | 7 (70.0%) | 0 (0.0%) |
| 45 to 54 Years | 8 (61.5%) | 0 (0.0%) |
| 55 to 64 Years | 6 (100.0%) | 6 (100.0%) |
| 65 to 74 Years | 20 (100.0%) | 8 (88.9%) |
| 75 Years and over | 12 (100.0%) | 37 (100.0%) |
| Total | 56 (70.0%) | 54 (78.3%) |
Income Below Poverty Among Married-Couple Families in O Kean
The poverty statistics for married-couple families in O Kean show that 27.3% or 9 of the total 33 families live below the poverty line. Families with 3 or 4 children have the highest poverty rate of 100.0%, comprising of 3 families. On the other hand, families with no children have the lowest poverty rate of 4.3%, which includes 1 families.
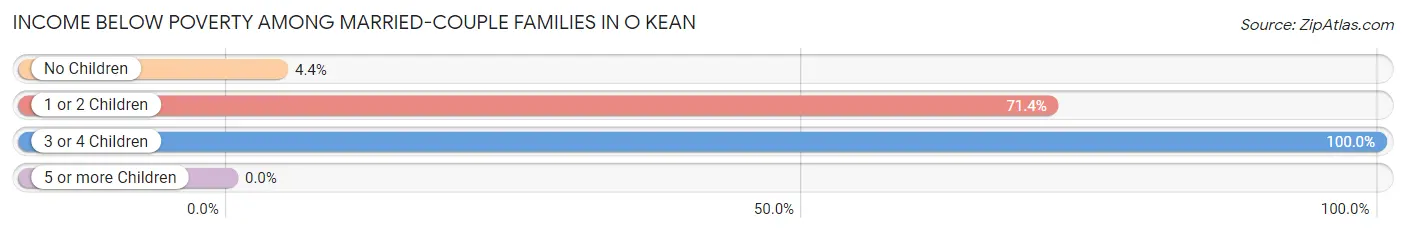
| Children | Above Poverty | Below Poverty |
| No Children | 22 (95.7%) | 1 (4.3%) |
| 1 or 2 Children | 2 (28.6%) | 5 (71.4%) |
| 3 or 4 Children | 0 (0.0%) | 3 (100.0%) |
| 5 or more Children | 0 (0.0%) | 0 (0.0%) |
| Total | 24 (72.7%) | 9 (27.3%) |
Income Below Poverty Among Single-Parent Households in O Kean
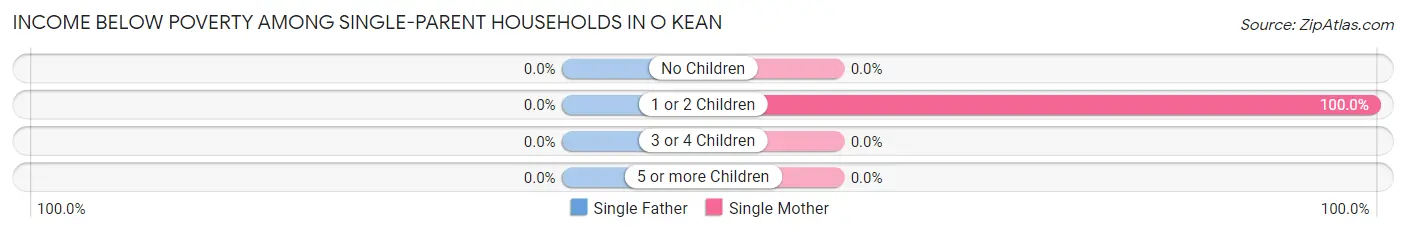
| Children | Single Father | Single Mother |
| No Children | 0 (0.0%) | 0 (0.0%) |
| 1 or 2 Children | 0 (0.0%) | 1 (100.0%) |
| 3 or 4 Children | 0 (0.0%) | 0 (0.0%) |
| 5 or more Children | 0 (0.0%) | 0 (0.0%) |
| Total | 0 (0.0%) | 1 (16.7%) |
Income Below Poverty Among Married-Couple vs Single-Parent Households in O Kean
The poverty data for O Kean shows that 9 of the married-couple family households (27.3%) and 1 of the single-parent households (14.3%) are living below the poverty level. Within the married-couple family households, those with 3 or 4 children have the highest poverty rate, with 3 households (100.0%) falling below the poverty line. Among the single-parent households, those with 1 or 2 children have the highest poverty rate, with 1 household (100.0%) living below poverty.
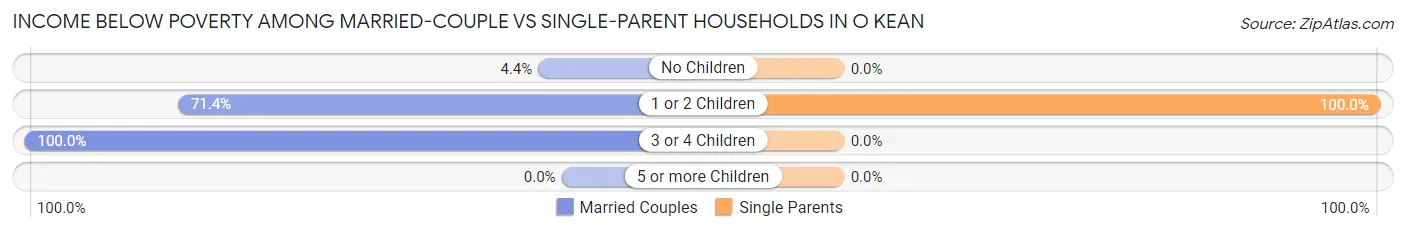
| Children | Married-Couple Families | Single-Parent Households |
| No Children | 1 (4.3%) | 0 (0.0%) |
| 1 or 2 Children | 5 (71.4%) | 1 (100.0%) |
| 3 or 4 Children | 3 (100.0%) | 0 (0.0%) |
| 5 or more Children | 0 (0.0%) | 0 (0.0%) |
| Total | 9 (27.3%) | 1 (14.3%) |
Race in O Kean
The most populous races in O Kean are , and White / Caucasian (149 | 100.0%).
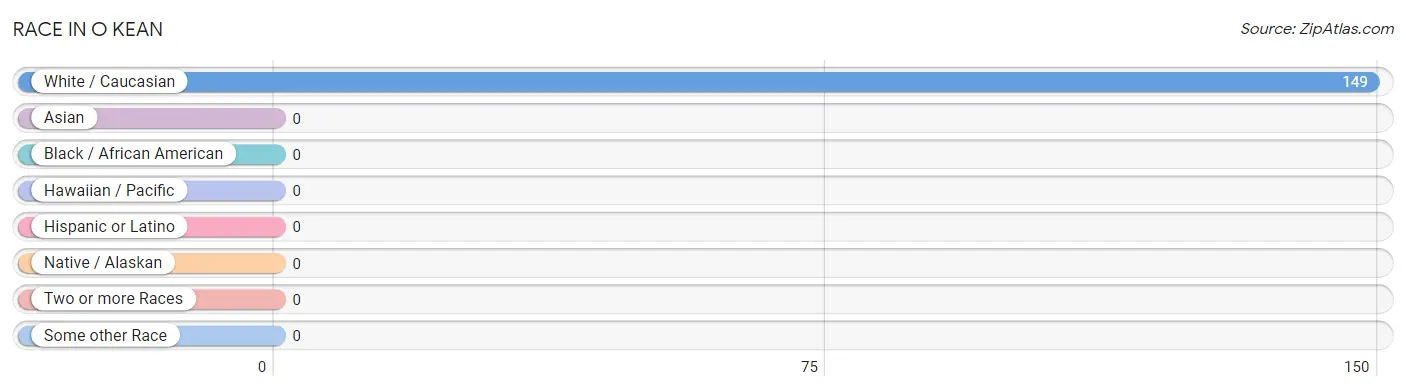
| Race | # Population | % Population |
| Asian | 0 | 0.0% |
| Black / African American | 0 | 0.0% |
| Hawaiian / Pacific | 0 | 0.0% |
| Hispanic or Latino | 0 | 0.0% |
| Native / Alaskan | 0 | 0.0% |
| White / Caucasian | 149 | 100.0% |
| Two or more Races | 0 | 0.0% |
| Some other Race | 0 | 0.0% |
| Total | 149 | 100.0% |
Ancestry in O Kean
The most populous ancestries reported in O Kean are American (39 | 26.2%), English (21 | 14.1%), German (7 | 4.7%), Irish (4 | 2.7%), and Swiss (4 | 2.7%), together accounting for 50.3% of all O Kean residents.
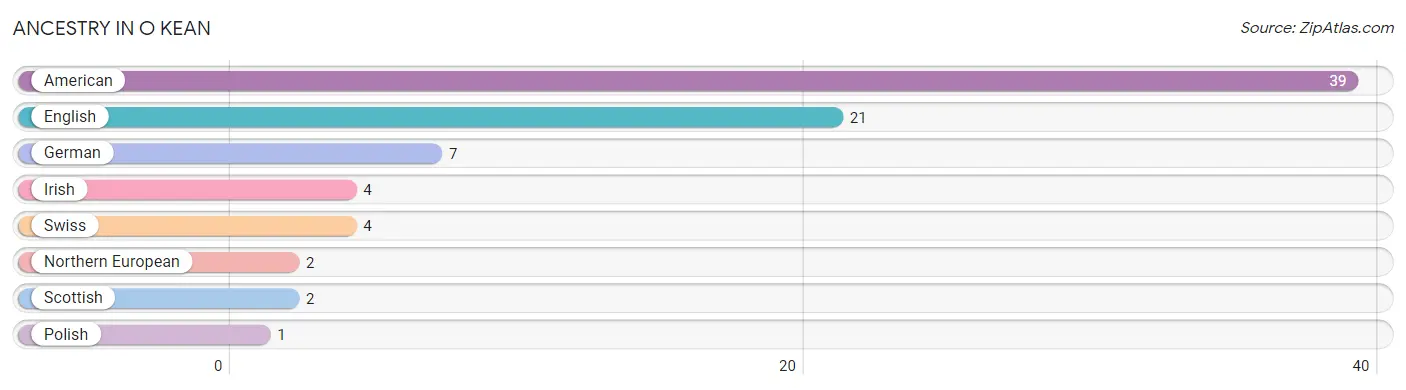
| Ancestry | # Population | % Population |
| American | 39 | 26.2% |
| English | 21 | 14.1% |
| German | 7 | 4.7% |
| Irish | 4 | 2.7% |
| Northern European | 2 | 1.3% |
| Polish | 1 | 0.7% |
| Scottish | 2 | 1.3% |
| Swiss | 4 | 2.7% | View All 8 Rows |
Immigrants in O Kean

| Immigration Origin | # Population | % Population | View All 0 Rows |
Sex and Age in O Kean
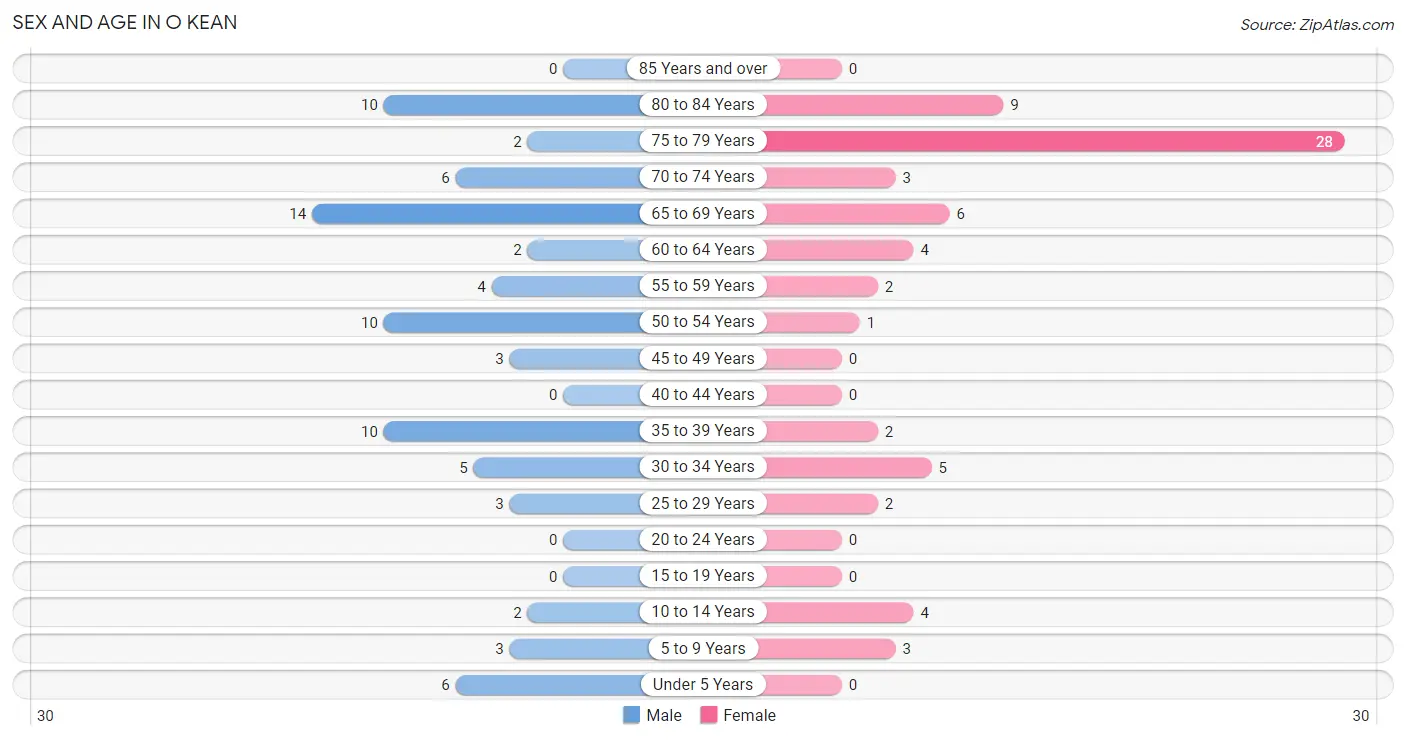
Sex and Age in O Kean
The most populous age groups in O Kean are 65 to 69 Years (14 | 17.5%) for men and 75 to 79 Years (28 | 40.6%) for women.
| Age Bracket | Male | Female |
| Under 5 Years | 6 (7.5%) | 0 (0.0%) |
| 5 to 9 Years | 3 (3.7%) | 3 (4.3%) |
| 10 to 14 Years | 2 (2.5%) | 4 (5.8%) |
| 15 to 19 Years | 0 (0.0%) | 0 (0.0%) |
| 20 to 24 Years | 0 (0.0%) | 0 (0.0%) |
| 25 to 29 Years | 3 (3.7%) | 2 (2.9%) |
| 30 to 34 Years | 5 (6.2%) | 5 (7.2%) |
| 35 to 39 Years | 10 (12.5%) | 2 (2.9%) |
| 40 to 44 Years | 0 (0.0%) | 0 (0.0%) |
| 45 to 49 Years | 3 (3.7%) | 0 (0.0%) |
| 50 to 54 Years | 10 (12.5%) | 1 (1.5%) |
| 55 to 59 Years | 4 (5.0%) | 2 (2.9%) |
| 60 to 64 Years | 2 (2.5%) | 4 (5.8%) |
| 65 to 69 Years | 14 (17.5%) | 6 (8.7%) |
| 70 to 74 Years | 6 (7.5%) | 3 (4.3%) |
| 75 to 79 Years | 2 (2.5%) | 28 (40.6%) |
| 80 to 84 Years | 10 (12.5%) | 9 (13.0%) |
| 85 Years and over | 0 (0.0%) | 0 (0.0%) |
| Total | 80 (100.0%) | 69 (100.0%) |
Families and Households in O Kean
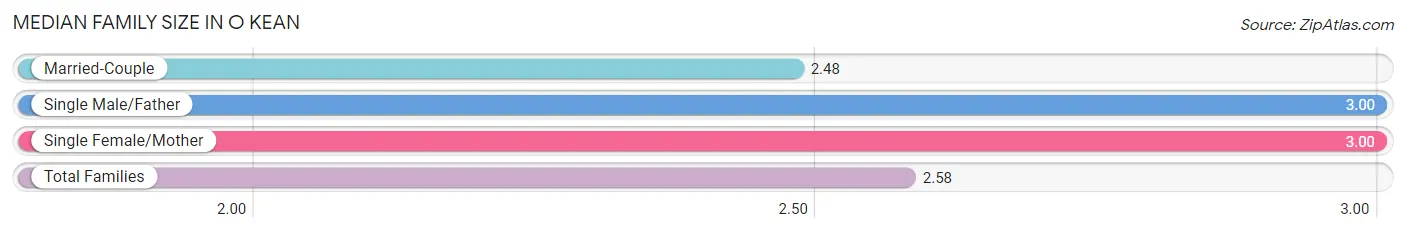
Median Family Size in O Kean
The median family size in O Kean is 2.58 persons per family, with single male/father families (1 | 2.5%) accounting for the largest median family size of 3 persons per family. On the other hand, married-couple families (33 | 82.5%) represent the smallest median family size with 2.48 persons per family.
| Family Type | # Families | Family Size |
| Married-Couple | 33 (82.5%) | 2.48 |
| Single Male/Father | 1 (2.5%) | 3.00 |
| Single Female/Mother | 6 (15.0%) | 3.00 |
| Total Families | 40 (100.0%) | 2.58 |
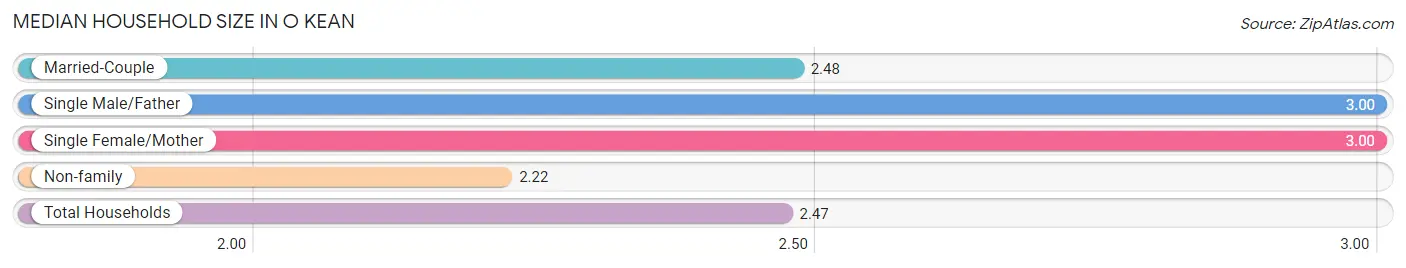
Median Household Size in O Kean
The median household size in O Kean is 2.47 persons per household, with single male/father households (1 | 1.7%) accounting for the largest median household size of 3 persons per household. non-family households (18 | 31.0%) represent the smallest median household size with 2.22 persons per household.
| Household Type | # Households | Household Size |
| Married-Couple | 33 (56.9%) | 2.48 |
| Single Male/Father | 1 (1.7%) | 3.00 |
| Single Female/Mother | 6 (10.3%) | 3.00 |
| Non-family | 18 (31.0%) | 2.22 |
| Total Households | 58 (100.0%) | 2.47 |
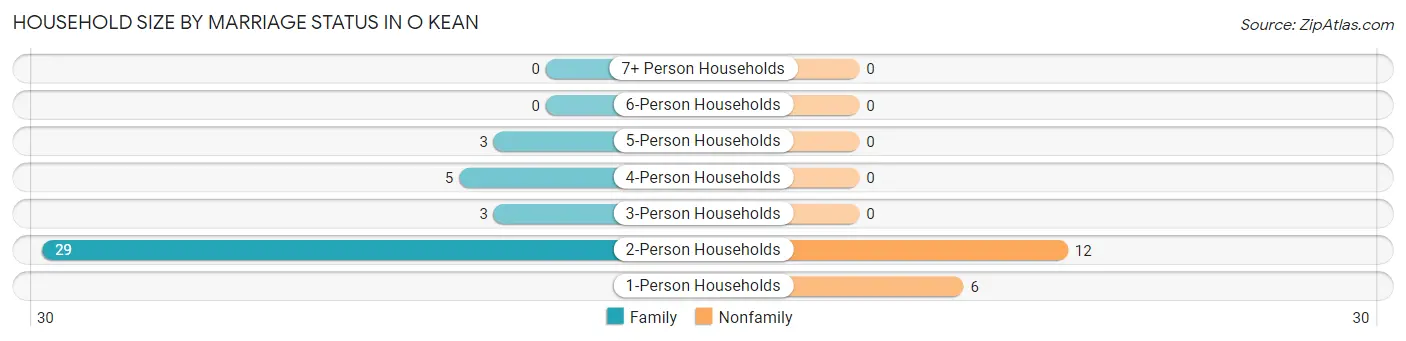
Household Size by Marriage Status in O Kean
Out of a total of 58 households in O Kean, 40 (69.0%) are family households, while 18 (31.0%) are nonfamily households. The most numerous type of family households are 2-person households, comprising 29, and the most common type of nonfamily households are 2-person households, comprising 12.
| Household Size | Family Households | Nonfamily Households |
| 1-Person Households | - | 6 (10.3%) |
| 2-Person Households | 29 (50.0%) | 12 (20.7%) |
| 3-Person Households | 3 (5.2%) | 0 (0.0%) |
| 4-Person Households | 5 (8.6%) | 0 (0.0%) |
| 5-Person Households | 3 (5.2%) | 0 (0.0%) |
| 6-Person Households | 0 (0.0%) | 0 (0.0%) |
| 7+ Person Households | 0 (0.0%) | 0 (0.0%) |
| Total | 40 (69.0%) | 18 (31.0%) |
Female Fertility in O Kean
Fertility by Age in O Kean
| Age Bracket | Women with Births | Births / 1,000 Women |
| 15 to 19 years | 0 (0.0%) | 0.0 |
| 20 to 34 years | 0 (0.0%) | 0.0 |
| 35 to 50 years | 0 (0.0%) | 0.0 |
| Total | 0 (0.0%) | 0.0 |
Fertility by Age by Marriage Status in O Kean
| Age Bracket | Married | Unmarried |
| 15 to 19 years | 0 (0.0%) | 0 (0.0%) |
| 20 to 34 years | 0 (0.0%) | 0 (0.0%) |
| 35 to 50 years | 0 (0.0%) | 0 (0.0%) |
| Total | 0 (0.0%) | 0 (0.0%) |
Fertility by Education in O Kean
| Educational Attainment | Women with Births | Births / 1,000 Women |
| Less than High School | 0 (0.0%) | 0.0 |
| High School Diploma | 0 (0.0%) | 0.0 |
| College or Associate's Degree | 0 (0.0%) | 0.0 |
| Bachelor's Degree | 0 (0.0%) | 0.0 |
| Graduate Degree | 0 (0.0%) | 0.0 |
| Total | 0 (0.0%) | 0.0 |
Fertility by Education by Marriage Status in O Kean
| Educational Attainment | Married | Unmarried |
| Less than High School | 0 (0.0%) | 0 (0.0%) |
| High School Diploma | 0 (0.0%) | 0 (0.0%) |
| College or Associate's Degree | 0 (0.0%) | 0 (0.0%) |
| Bachelor's Degree | 0 (0.0%) | 0 (0.0%) |
| Graduate Degree | 0 (0.0%) | 0 (0.0%) |
| Total | 0 (0.0%) | 0 (0.0%) |
Employment Characteristics in O Kean
Employment by Class of Employer in O Kean
Among the 42 employed individuals in O Kean, private company employees (33 | 78.6%), not-for-profit organizations (7 | 16.7%), and local government employees (2 | 4.8%) make up the most common classes of employment.
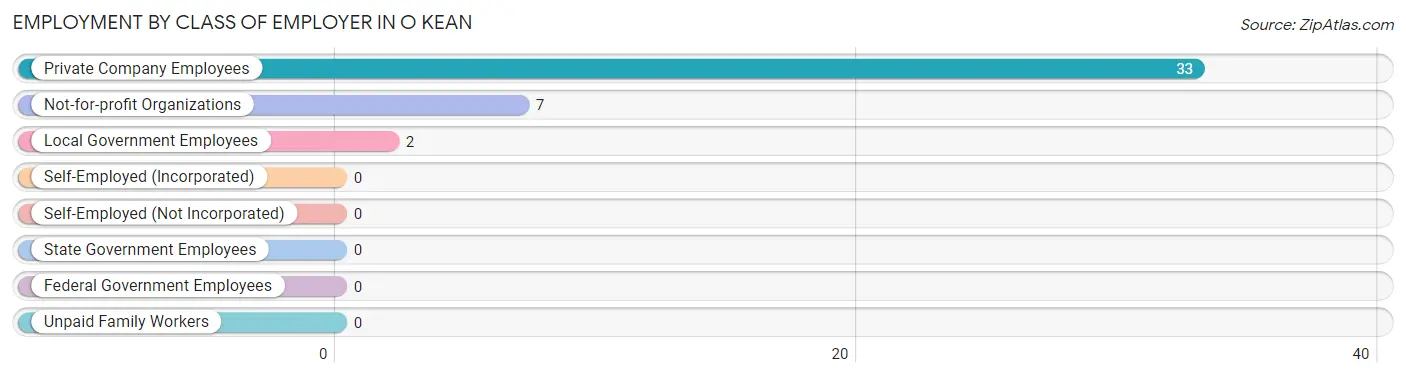
| Employer Class | # Employees | % Employees |
| Private Company Employees | 33 | 78.6% |
| Self-Employed (Incorporated) | 0 | 0.0% |
| Self-Employed (Not Incorporated) | 0 | 0.0% |
| Not-for-profit Organizations | 7 | 16.7% |
| Local Government Employees | 2 | 4.8% |
| State Government Employees | 0 | 0.0% |
| Federal Government Employees | 0 | 0.0% |
| Unpaid Family Workers | 0 | 0.0% |
| Total | 42 | 100.0% |
Employment Status by Age in O Kean
According to the labor force statistics for O Kean, out of the total population over 16 years of age (131), 34.4% or 45 individuals are in the labor force, with 6.7% or 3 of them unemployed. The age group with the highest labor force participation rate is 25 to 29 years, with 100.0% or 5 individuals in the labor force. Within the labor force, the 45 to 54 years age range has the highest percentage of unemployed individuals, with 23.1% or 3 of them being unemployed.
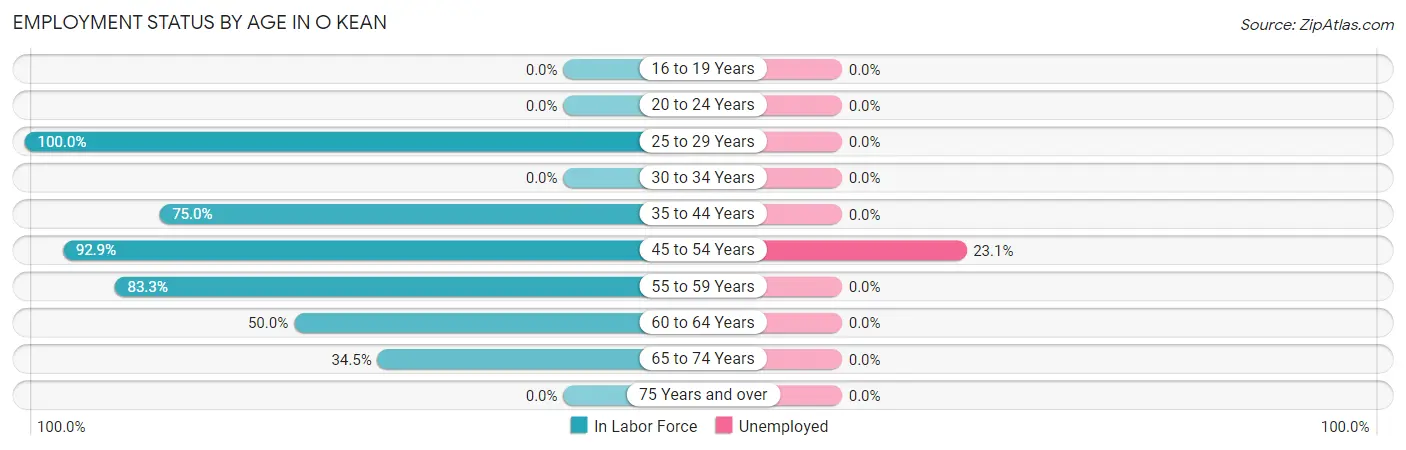
| Age Bracket | In Labor Force | Unemployed |
| 16 to 19 Years | 0 (0.0%) | 0 (0.0%) |
| 20 to 24 Years | 0 (0.0%) | 0 (0.0%) |
| 25 to 29 Years | 5 (100.0%) | 0 (0.0%) |
| 30 to 34 Years | 0 (0.0%) | 0 (0.0%) |
| 35 to 44 Years | 9 (75.0%) | 0 (0.0%) |
| 45 to 54 Years | 13 (92.9%) | 3 (23.1%) |
| 55 to 59 Years | 5 (83.3%) | 0 (0.0%) |
| 60 to 64 Years | 3 (50.0%) | 0 (0.0%) |
| 65 to 74 Years | 10 (34.5%) | 0 (0.0%) |
| 75 Years and over | 0 (0.0%) | 0 (0.0%) |
| Total | 45 (34.4%) | 3 (6.7%) |
Employment Status by Educational Attainment in O Kean
According to labor force statistics for O Kean, 66.0% of individuals (35) out of the total population between 25 and 64 years of age (53) are in the labor force, with 8.6% or 3 of them being unemployed. The group with the highest labor force participation rate are those with the educational attainment of bachelor's degree or higher, with 100.0% or 13 individuals in the labor force. Within the labor force, individuals with high school diploma education have the highest percentage of unemployment, with 17.6% or 3 of them being unemployed.
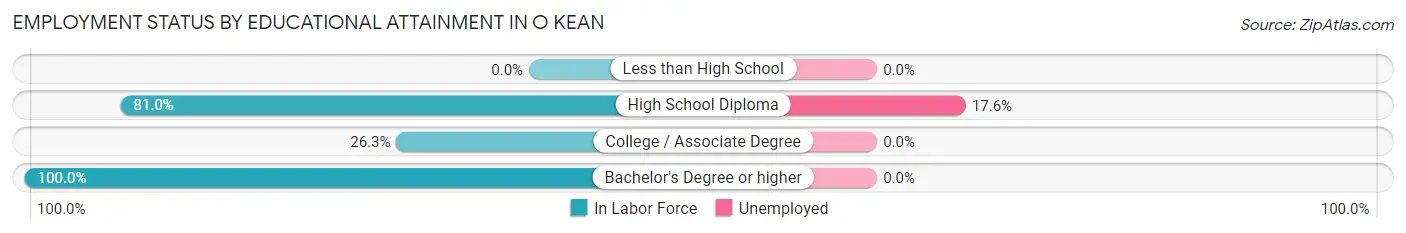
| Educational Attainment | In Labor Force | Unemployed |
| Less than High School | 0 (0.0%) | 0 (0.0%) |
| High School Diploma | 17 (81.0%) | 4 (17.6%) |
| College / Associate Degree | 5 (26.3%) | 0 (0.0%) |
| Bachelor's Degree or higher | 13 (100.0%) | 0 (0.0%) |
| Total | 35 (66.0%) | 5 (8.6%) |
Employment Occupations by Sex in O Kean
Management, Business, Science and Arts Occupations
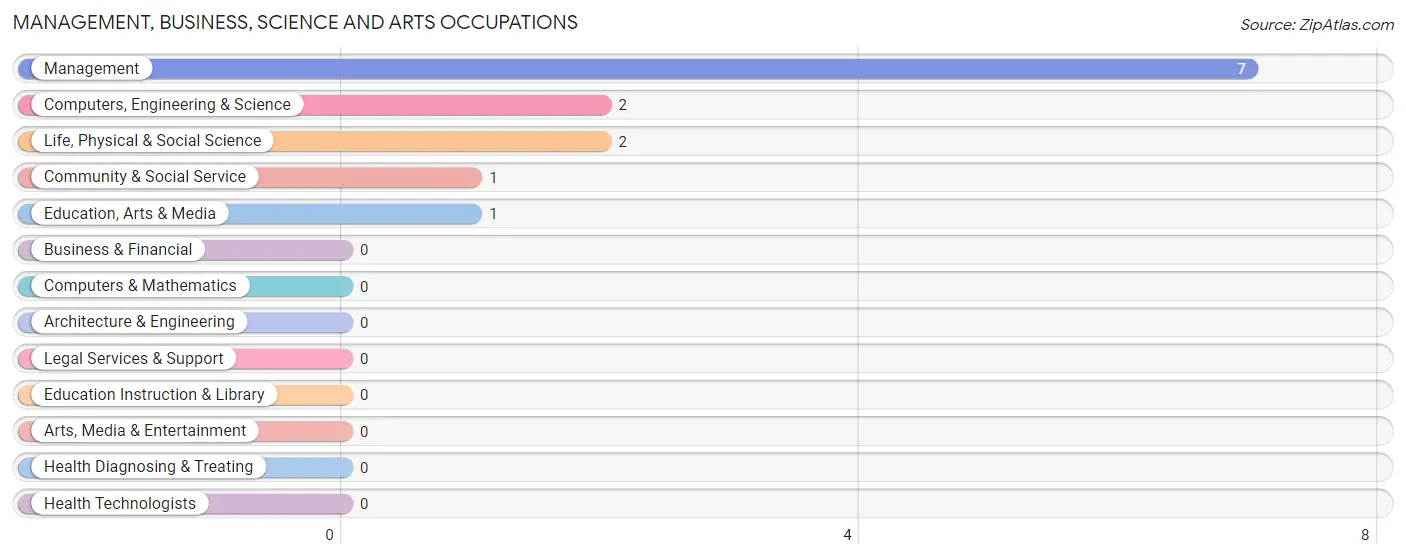
The most common Management, Business, Science and Arts occupations in O Kean are Management (7 | 16.7%), Computers, Engineering & Science (2 | 4.8%), Life, Physical & Social Science (2 | 4.8%), Community & Social Service (1 | 2.4%), and Education, Arts & Media (1 | 2.4%).
Management, Business, Science and Arts Occupations by Sex
Within the Management, Business, Science and Arts occupations in O Kean, the most male-oriented occupations are Management (100.0%), Community & Social Service (100.0%), and Education, Arts & Media (100.0%), while the most female-oriented occupations are Computers, Engineering & Science (100.0%), and Life, Physical & Social Science (100.0%).
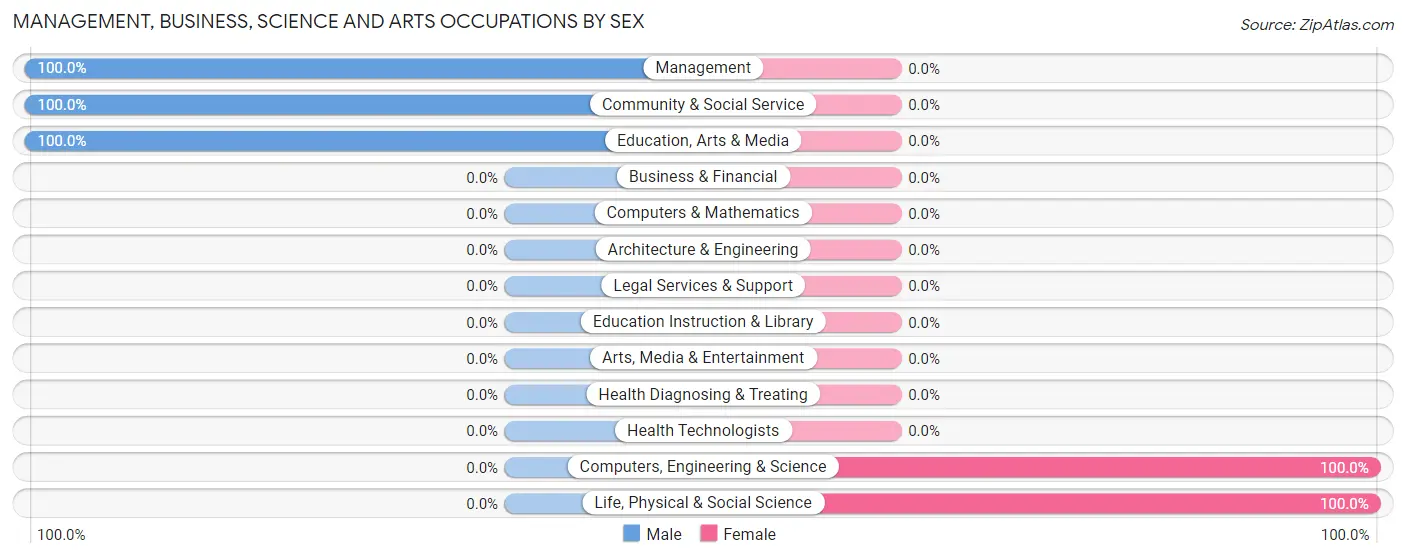
| Occupation | Male | Female |
| Management | 7 (100.0%) | 0 (0.0%) |
| Business & Financial | 0 (0.0%) | 0 (0.0%) |
| Computers, Engineering & Science | 0 (0.0%) | 2 (100.0%) |
| Computers & Mathematics | 0 (0.0%) | 0 (0.0%) |
| Architecture & Engineering | 0 (0.0%) | 0 (0.0%) |
| Life, Physical & Social Science | 0 (0.0%) | 2 (100.0%) |
| Community & Social Service | 1 (100.0%) | 0 (0.0%) |
| Education, Arts & Media | 1 (100.0%) | 0 (0.0%) |
| Legal Services & Support | 0 (0.0%) | 0 (0.0%) |
| Education Instruction & Library | 0 (0.0%) | 0 (0.0%) |
| Arts, Media & Entertainment | 0 (0.0%) | 0 (0.0%) |
| Health Diagnosing & Treating | 0 (0.0%) | 0 (0.0%) |
| Health Technologists | 0 (0.0%) | 0 (0.0%) |
| Total (Category) | 8 (80.0%) | 2 (20.0%) |
| Total (Overall) | 31 (73.8%) | 11 (26.2%) |
Services Occupations
The most common Services occupations in O Kean are Food Preparation & Serving (4 | 9.5%), Healthcare Support (2 | 4.8%), and Cleaning & Maintenance (2 | 4.8%).
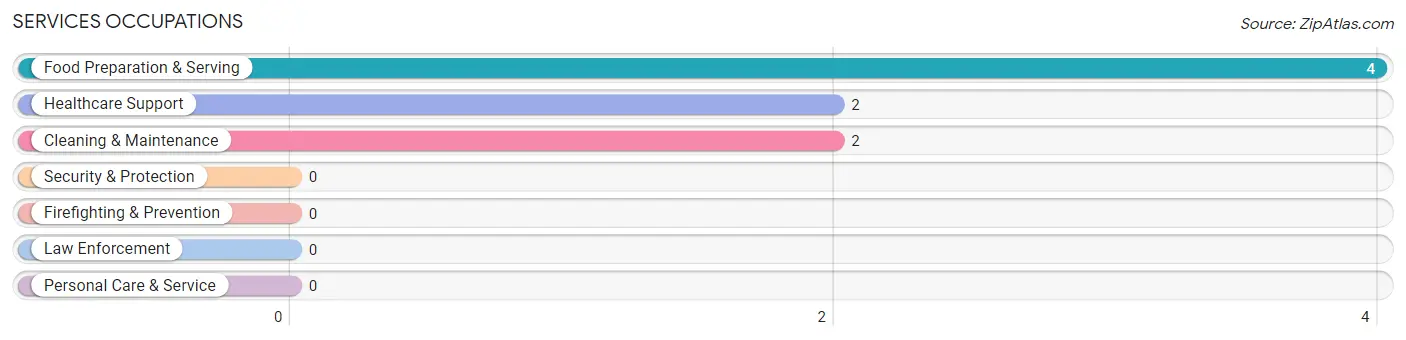
Services Occupations by Sex
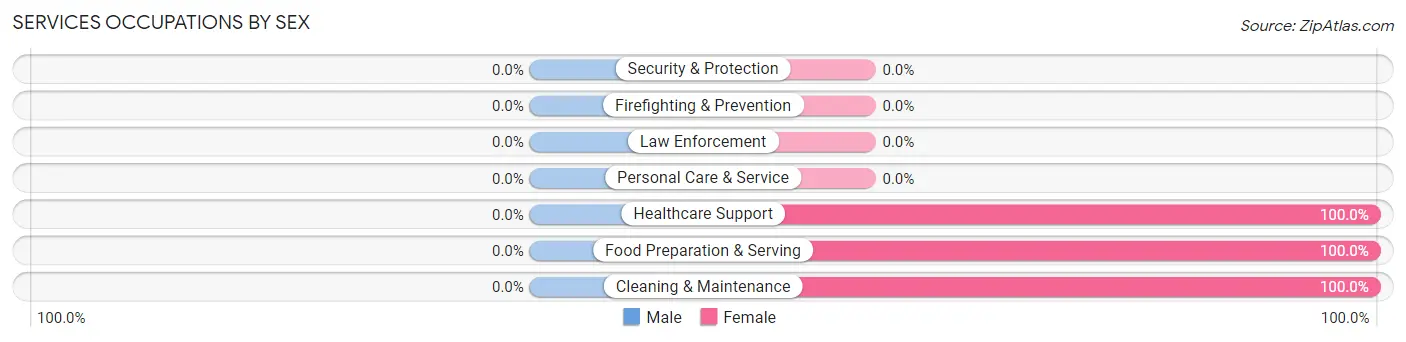
| Occupation | Male | Female |
| Healthcare Support | 0 (0.0%) | 2 (100.0%) |
| Security & Protection | 0 (0.0%) | 0 (0.0%) |
| Firefighting & Prevention | 0 (0.0%) | 0 (0.0%) |
| Law Enforcement | 0 (0.0%) | 0 (0.0%) |
| Food Preparation & Serving | 0 (0.0%) | 4 (100.0%) |
| Cleaning & Maintenance | 0 (0.0%) | 2 (100.0%) |
| Personal Care & Service | 0 (0.0%) | 0 (0.0%) |
| Total (Category) | 0 (0.0%) | 8 (100.0%) |
| Total (Overall) | 31 (73.8%) | 11 (26.2%) |
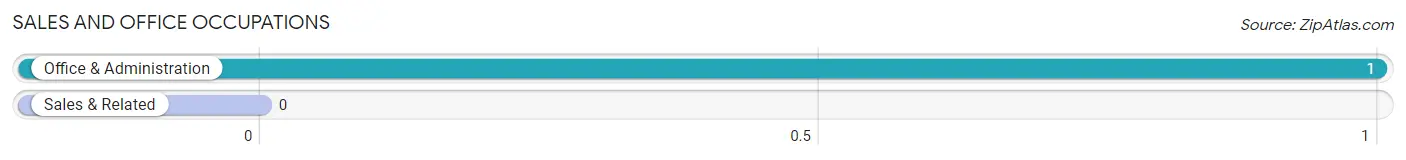
Sales and Office Occupations
The most common Sales and Office occupations in O Kean are , and Office & Administration (1 | 2.4%).
Sales and Office Occupations by Sex
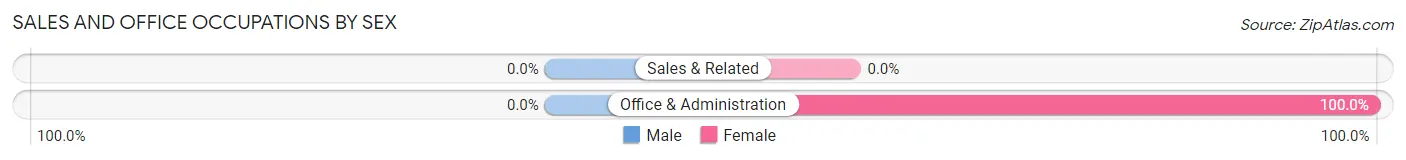
| Occupation | Male | Female |
| Sales & Related | 0 (0.0%) | 0 (0.0%) |
| Office & Administration | 0 (0.0%) | 1 (100.0%) |
| Total (Category) | 0 (0.0%) | 1 (100.0%) |
| Total (Overall) | 31 (73.8%) | 11 (26.2%) |
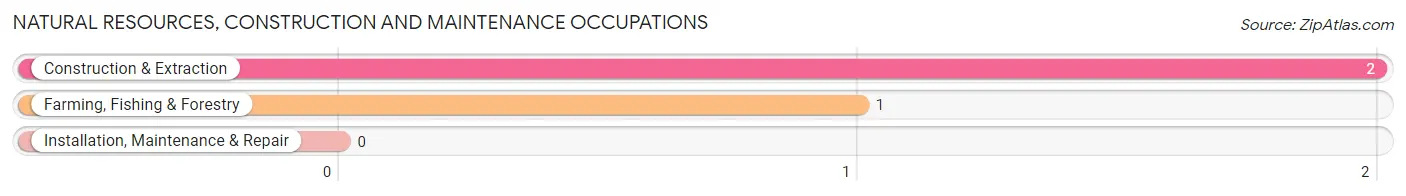
Natural Resources, Construction and Maintenance Occupations
The most common Natural Resources, Construction and Maintenance occupations in O Kean are Construction & Extraction (2 | 4.8%), and Farming, Fishing & Forestry (1 | 2.4%).
Natural Resources, Construction and Maintenance Occupations by Sex
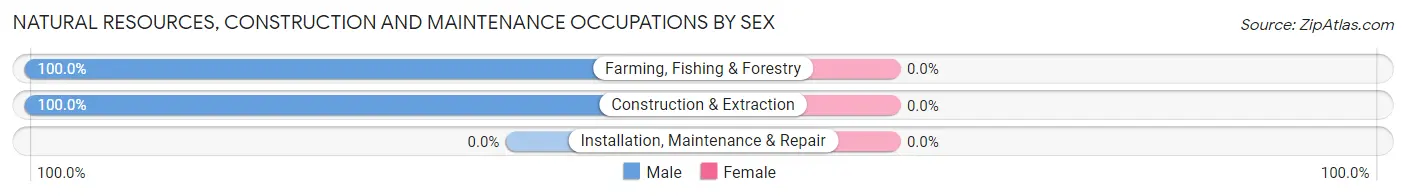
| Occupation | Male | Female |
| Farming, Fishing & Forestry | 1 (100.0%) | 0 (0.0%) |
| Construction & Extraction | 2 (100.0%) | 0 (0.0%) |
| Installation, Maintenance & Repair | 0 (0.0%) | 0 (0.0%) |
| Total (Category) | 3 (100.0%) | 0 (0.0%) |
| Total (Overall) | 31 (73.8%) | 11 (26.2%) |
Production, Transportation and Moving Occupations
The most common Production, Transportation and Moving occupations in O Kean are Production (8 | 19.1%), Material Moving (7 | 16.7%), and Transportation (5 | 11.9%).
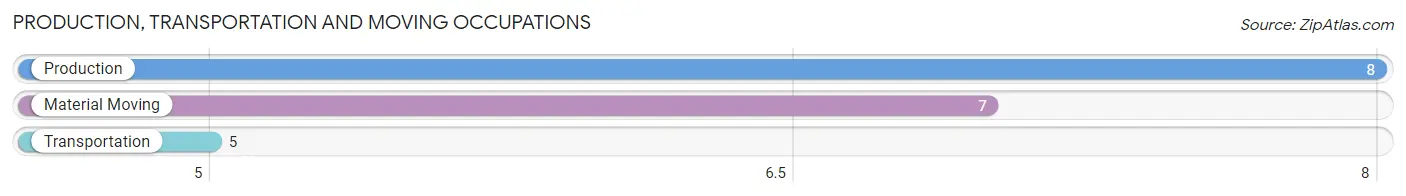
Production, Transportation and Moving Occupations by Sex
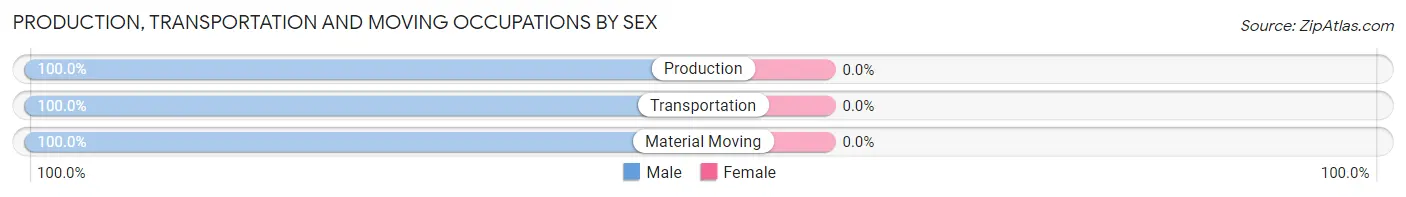
| Occupation | Male | Female |
| Production | 8 (100.0%) | 0 (0.0%) |
| Transportation | 5 (100.0%) | 0 (0.0%) |
| Material Moving | 7 (100.0%) | 0 (0.0%) |
| Total (Category) | 20 (100.0%) | 0 (0.0%) |
| Total (Overall) | 31 (73.8%) | 11 (26.2%) |
Employment Industries by Sex in O Kean
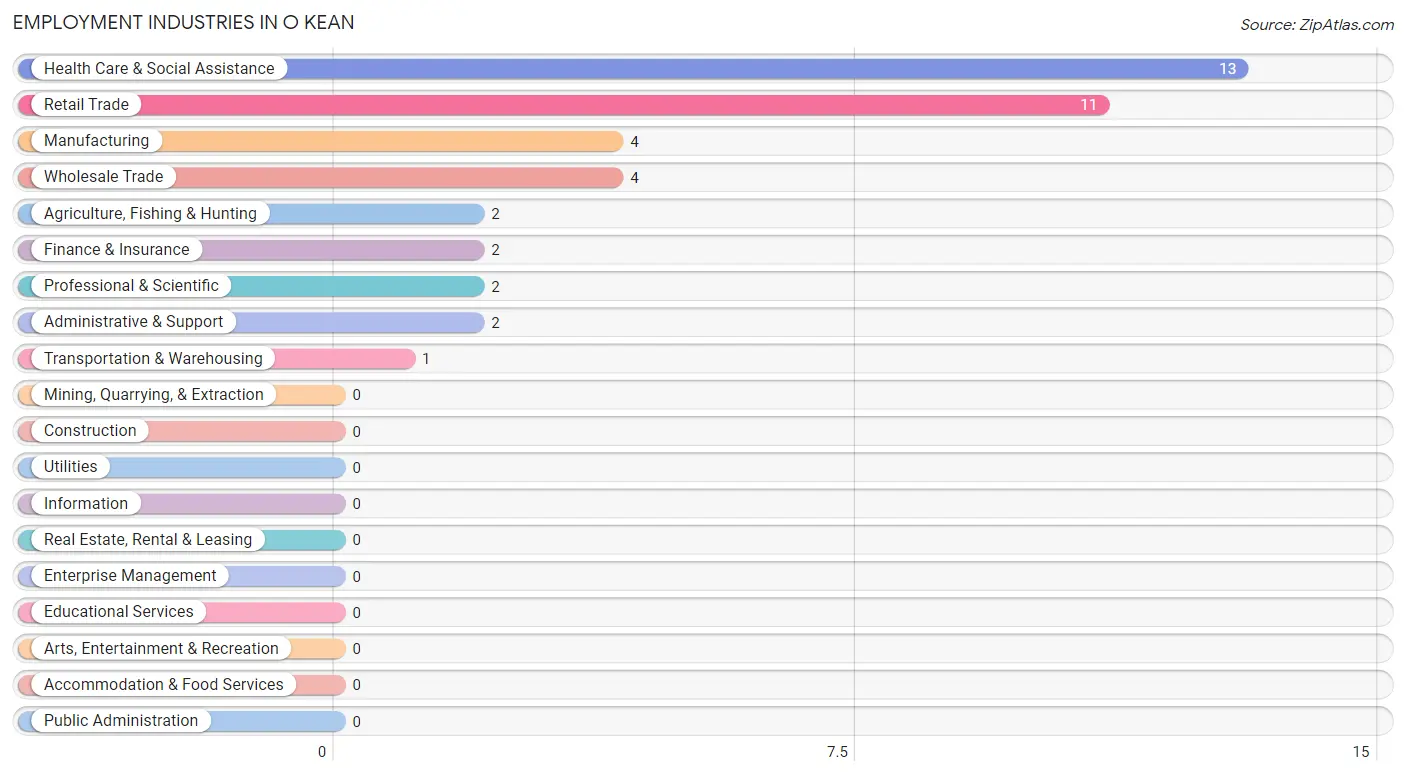
Employment Industries in O Kean
The major employment industries in O Kean include Health Care & Social Assistance (13 | 30.9%), Retail Trade (11 | 26.2%), Manufacturing (4 | 9.5%), Wholesale Trade (4 | 9.5%), and Agriculture, Fishing & Hunting (2 | 4.8%).
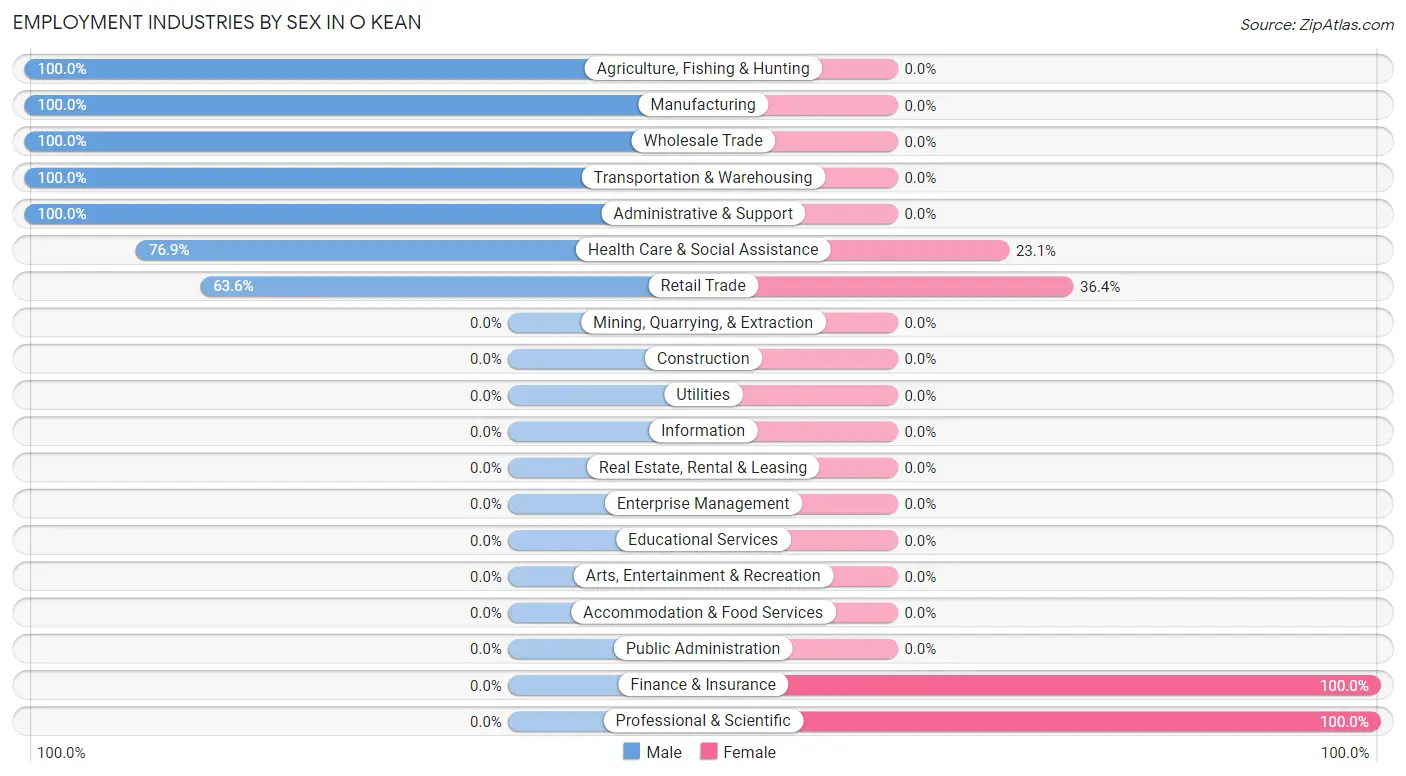
Employment Industries by Sex in O Kean
The O Kean industries that see more men than women are Agriculture, Fishing & Hunting (100.0%), Manufacturing (100.0%), and Wholesale Trade (100.0%), whereas the industries that tend to have a higher number of women are Finance & Insurance (100.0%), Professional & Scientific (100.0%), and Retail Trade (36.4%).
| Industry | Male | Female |
| Agriculture, Fishing & Hunting | 2 (100.0%) | 0 (0.0%) |
| Mining, Quarrying, & Extraction | 0 (0.0%) | 0 (0.0%) |
| Construction | 0 (0.0%) | 0 (0.0%) |
| Manufacturing | 4 (100.0%) | 0 (0.0%) |
| Wholesale Trade | 4 (100.0%) | 0 (0.0%) |
| Retail Trade | 7 (63.6%) | 4 (36.4%) |
| Transportation & Warehousing | 1 (100.0%) | 0 (0.0%) |
| Utilities | 0 (0.0%) | 0 (0.0%) |
| Information | 0 (0.0%) | 0 (0.0%) |
| Finance & Insurance | 0 (0.0%) | 2 (100.0%) |
| Real Estate, Rental & Leasing | 0 (0.0%) | 0 (0.0%) |
| Professional & Scientific | 0 (0.0%) | 2 (100.0%) |
| Enterprise Management | 0 (0.0%) | 0 (0.0%) |
| Administrative & Support | 2 (100.0%) | 0 (0.0%) |
| Educational Services | 0 (0.0%) | 0 (0.0%) |
| Health Care & Social Assistance | 10 (76.9%) | 3 (23.1%) |
| Arts, Entertainment & Recreation | 0 (0.0%) | 0 (0.0%) |
| Accommodation & Food Services | 0 (0.0%) | 0 (0.0%) |
| Public Administration | 0 (0.0%) | 0 (0.0%) |
| Total | 31 (73.8%) | 11 (26.2%) |
Education in O Kean
School Enrollment in O Kean
The most common levels of schooling among the 12 students in O Kean are kindergarten (6 | 50.0%), elementary school (3 | 25.0%), and middle school (3 | 25.0%).
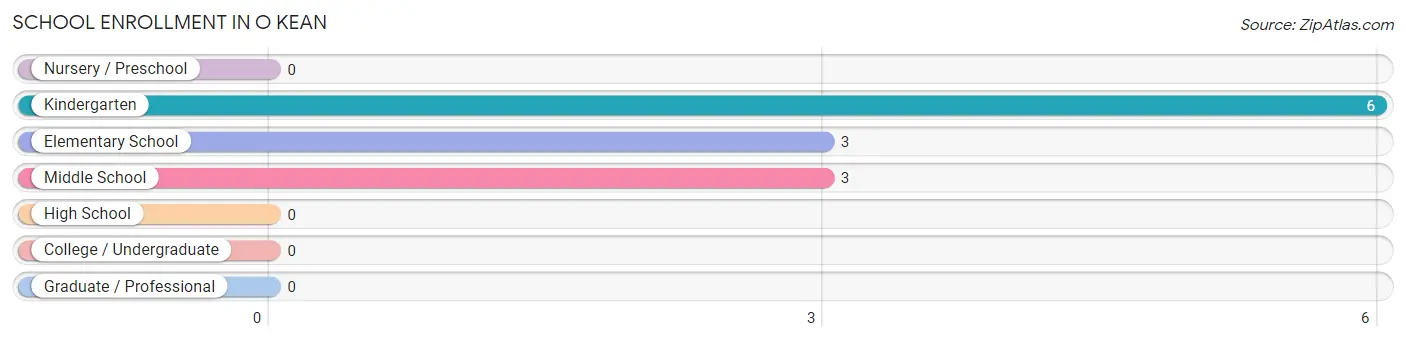
| School Level | # Students | % Students |
| Nursery / Preschool | 0 | 0.0% |
| Kindergarten | 6 | 50.0% |
| Elementary School | 3 | 25.0% |
| Middle School | 3 | 25.0% |
| High School | 0 | 0.0% |
| College / Undergraduate | 0 | 0.0% |
| Graduate / Professional | 0 | 0.0% |
| Total | 12 | 100.0% |
School Enrollment by Age by Funding Source in O Kean
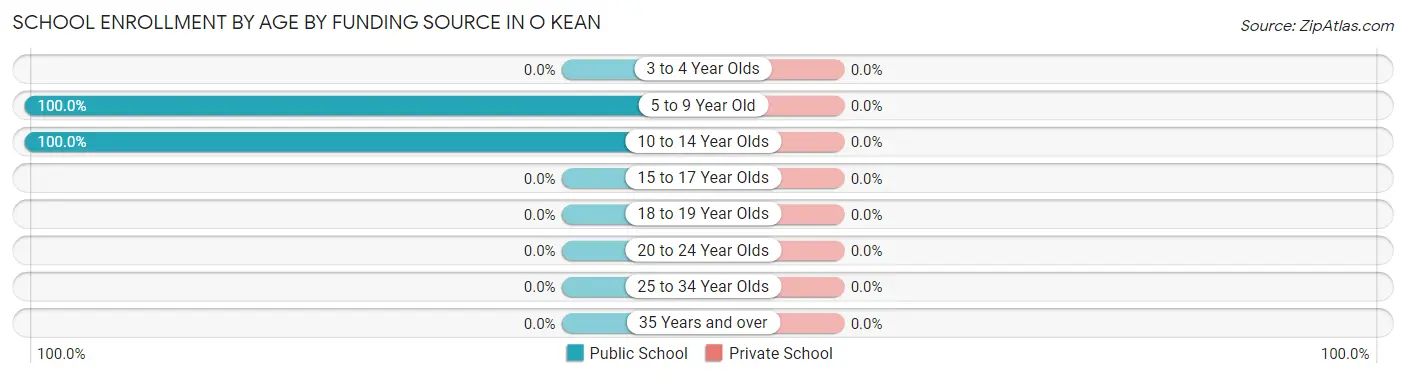
| Age Bracket | Public School | Private School |
| 3 to 4 Year Olds | 0 (0.0%) | 0 (0.0%) |
| 5 to 9 Year Old | 6 (100.0%) | 0 (0.0%) |
| 10 to 14 Year Olds | 6 (100.0%) | 0 (0.0%) |
| 15 to 17 Year Olds | 0 (0.0%) | 0 (0.0%) |
| 18 to 19 Year Olds | 0 (0.0%) | 0 (0.0%) |
| 20 to 24 Year Olds | 0 (0.0%) | 0 (0.0%) |
| 25 to 34 Year Olds | 0 (0.0%) | 0 (0.0%) |
| 35 Years and over | 0 (0.0%) | 0 (0.0%) |
| Total | 12 (100.0%) | 0 (0.0%) |
Educational Attainment by Field of Study in O Kean
Computers & mathematics (7 | 50.0%), arts & humanities (6 | 42.9%), and liberal arts & history (1 | 7.1%) are the most common fields of study among 14 individuals in O Kean who have obtained a bachelor's degree or higher.
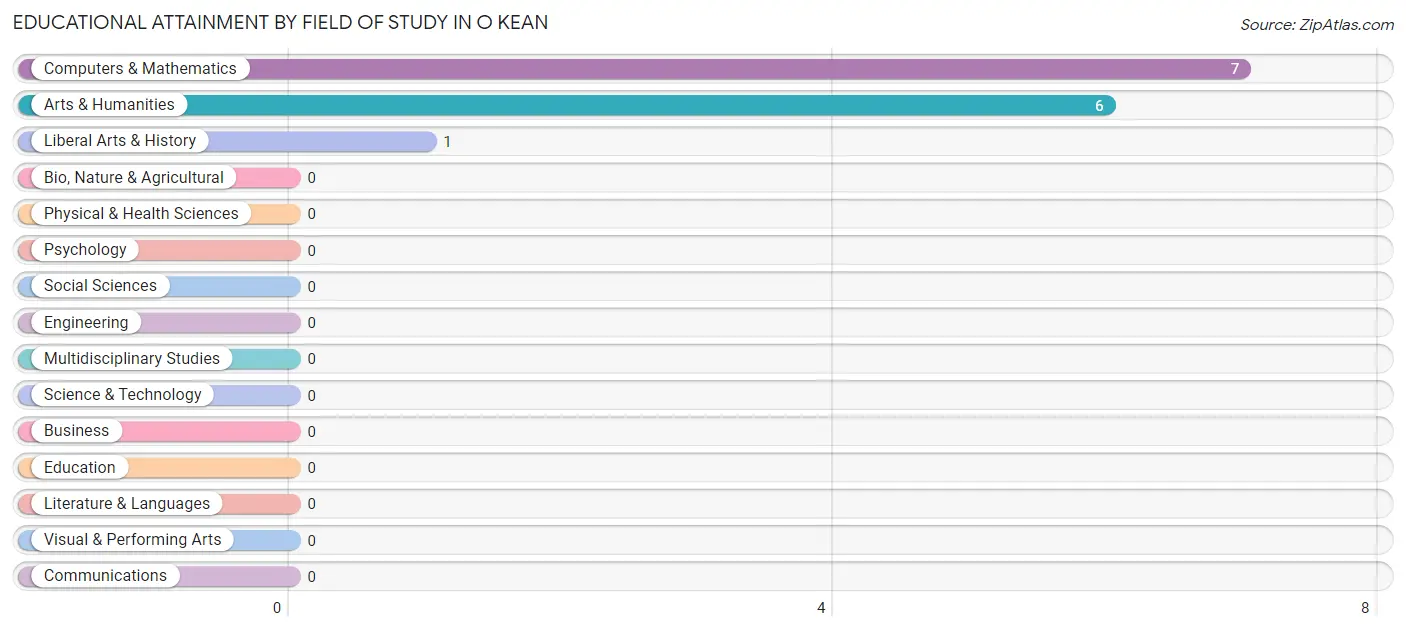
| Field of Study | # Graduates | % Graduates |
| Computers & Mathematics | 7 | 50.0% |
| Bio, Nature & Agricultural | 0 | 0.0% |
| Physical & Health Sciences | 0 | 0.0% |
| Psychology | 0 | 0.0% |
| Social Sciences | 0 | 0.0% |
| Engineering | 0 | 0.0% |
| Multidisciplinary Studies | 0 | 0.0% |
| Science & Technology | 0 | 0.0% |
| Business | 0 | 0.0% |
| Education | 0 | 0.0% |
| Literature & Languages | 0 | 0.0% |
| Liberal Arts & History | 1 | 7.1% |
| Visual & Performing Arts | 0 | 0.0% |
| Communications | 0 | 0.0% |
| Arts & Humanities | 6 | 42.9% |
| Total | 14 | 100.0% |
Transportation & Commute in O Kean
Vehicle Availability by Sex in O Kean
The most prevalent vehicle ownership categories in O Kean are males with 2 vehicles (22, accounting for 88.0%) and females with 2 vehicles (8, making up 200.0%).
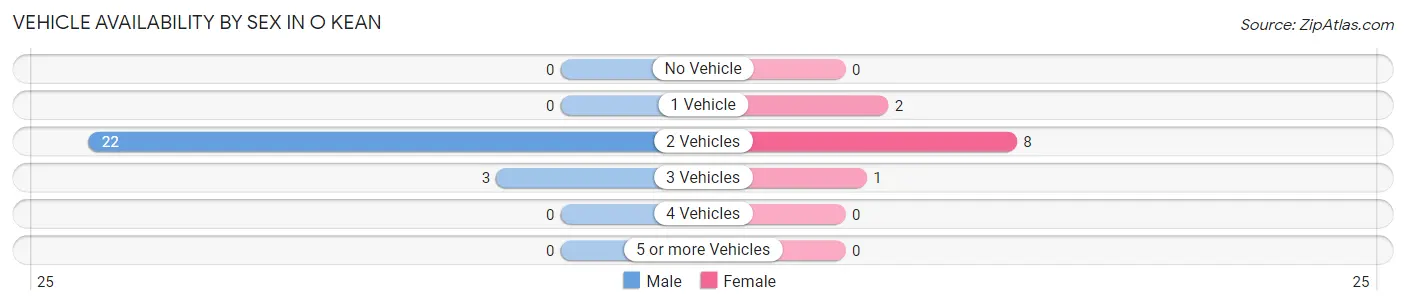
| Vehicles Available | Male | Female |
| No Vehicle | 0 (0.0%) | 0 (0.0%) |
| 1 Vehicle | 0 (0.0%) | 2 (18.2%) |
| 2 Vehicles | 22 (88.0%) | 8 (72.7%) |
| 3 Vehicles | 3 (12.0%) | 1 (9.1%) |
| 4 Vehicles | 0 (0.0%) | 0 (0.0%) |
| 5 or more Vehicles | 0 (0.0%) | 0 (0.0%) |
| Total | 25 (100.0%) | 11 (100.0%) |
Commute Time in O Kean
The most frequently occuring commute durations in O Kean are 20 to 24 minutes (21 commuters, 50.0%), less than 5 minutes (10 commuters, 23.8%), and 15 to 19 minutes (4 commuters, 9.5%).
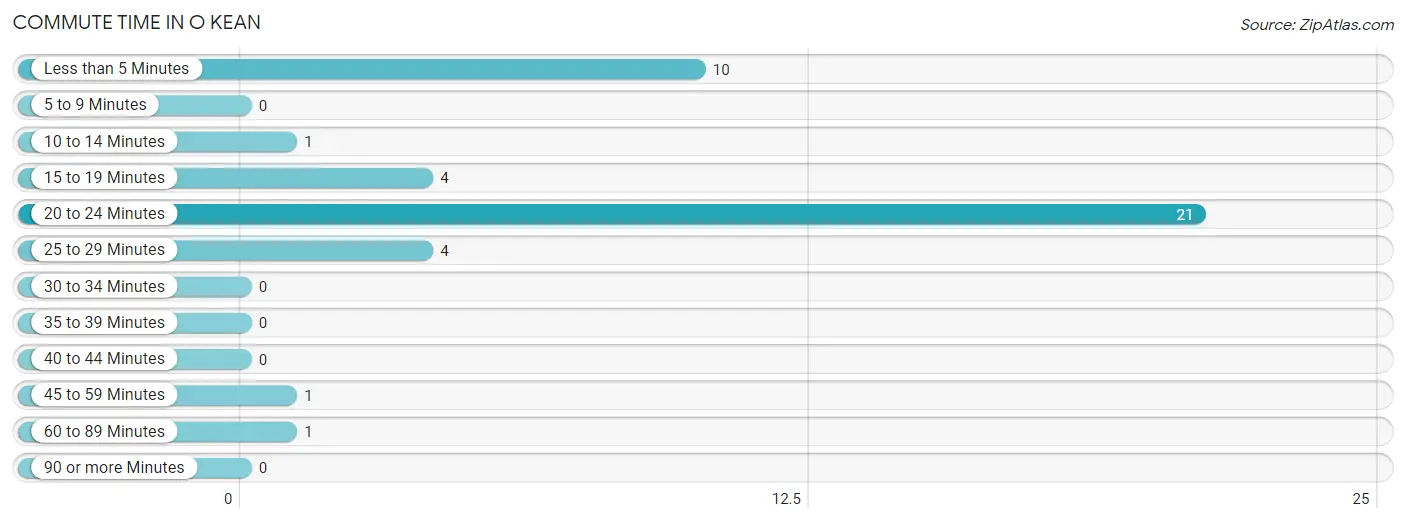
| Commute Time | # Commuters | % Commuters |
| Less than 5 Minutes | 10 | 23.8% |
| 5 to 9 Minutes | 0 | 0.0% |
| 10 to 14 Minutes | 1 | 2.4% |
| 15 to 19 Minutes | 4 | 9.5% |
| 20 to 24 Minutes | 21 | 50.0% |
| 25 to 29 Minutes | 4 | 9.5% |
| 30 to 34 Minutes | 0 | 0.0% |
| 35 to 39 Minutes | 0 | 0.0% |
| 40 to 44 Minutes | 0 | 0.0% |
| 45 to 59 Minutes | 1 | 2.4% |
| 60 to 89 Minutes | 1 | 2.4% |
| 90 or more Minutes | 0 | 0.0% |
Commute Time by Sex in O Kean
The most common commute times in O Kean are 20 to 24 minutes (15 commuters, 48.4%) for males and 20 to 24 minutes (6 commuters, 54.5%) for females.
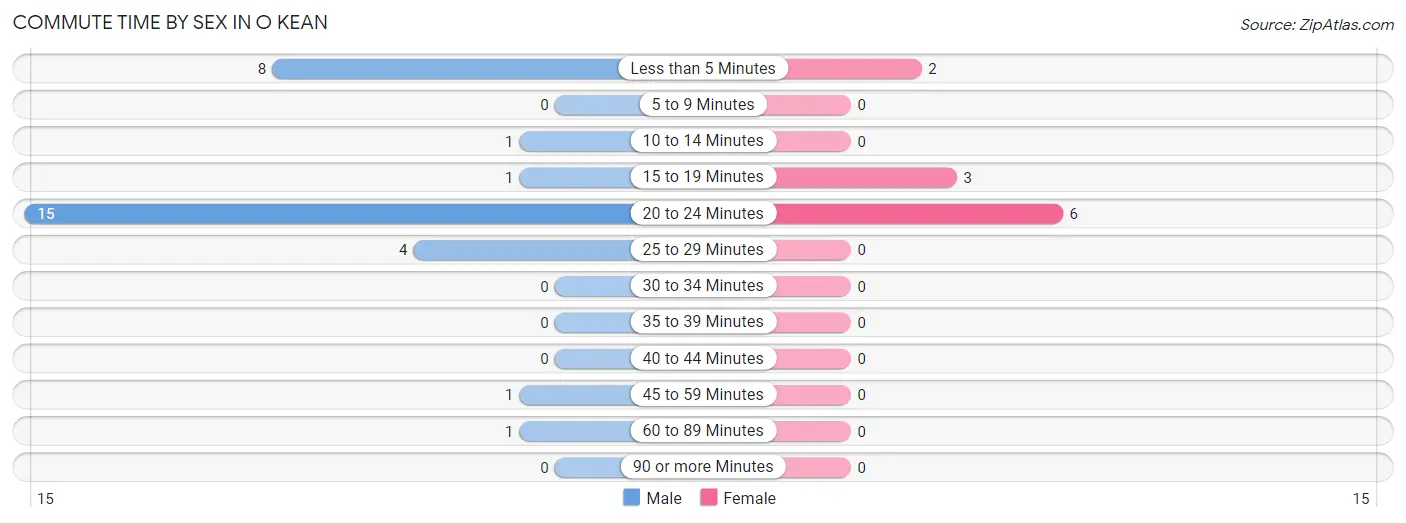
| Commute Time | Male | Female |
| Less than 5 Minutes | 8 (25.8%) | 2 (18.2%) |
| 5 to 9 Minutes | 0 (0.0%) | 0 (0.0%) |
| 10 to 14 Minutes | 1 (3.2%) | 0 (0.0%) |
| 15 to 19 Minutes | 1 (3.2%) | 3 (27.3%) |
| 20 to 24 Minutes | 15 (48.4%) | 6 (54.5%) |
| 25 to 29 Minutes | 4 (12.9%) | 0 (0.0%) |
| 30 to 34 Minutes | 0 (0.0%) | 0 (0.0%) |
| 35 to 39 Minutes | 0 (0.0%) | 0 (0.0%) |
| 40 to 44 Minutes | 0 (0.0%) | 0 (0.0%) |
| 45 to 59 Minutes | 1 (3.2%) | 0 (0.0%) |
| 60 to 89 Minutes | 1 (3.2%) | 0 (0.0%) |
| 90 or more Minutes | 0 (0.0%) | 0 (0.0%) |
Time of Departure to Work by Sex in O Kean
The most frequent times of departure to work in O Kean are 12:00 PM to 3:59 PM (12, 38.7%) for males and 12:00 AM to 4:59 AM (4, 36.4%) for females.
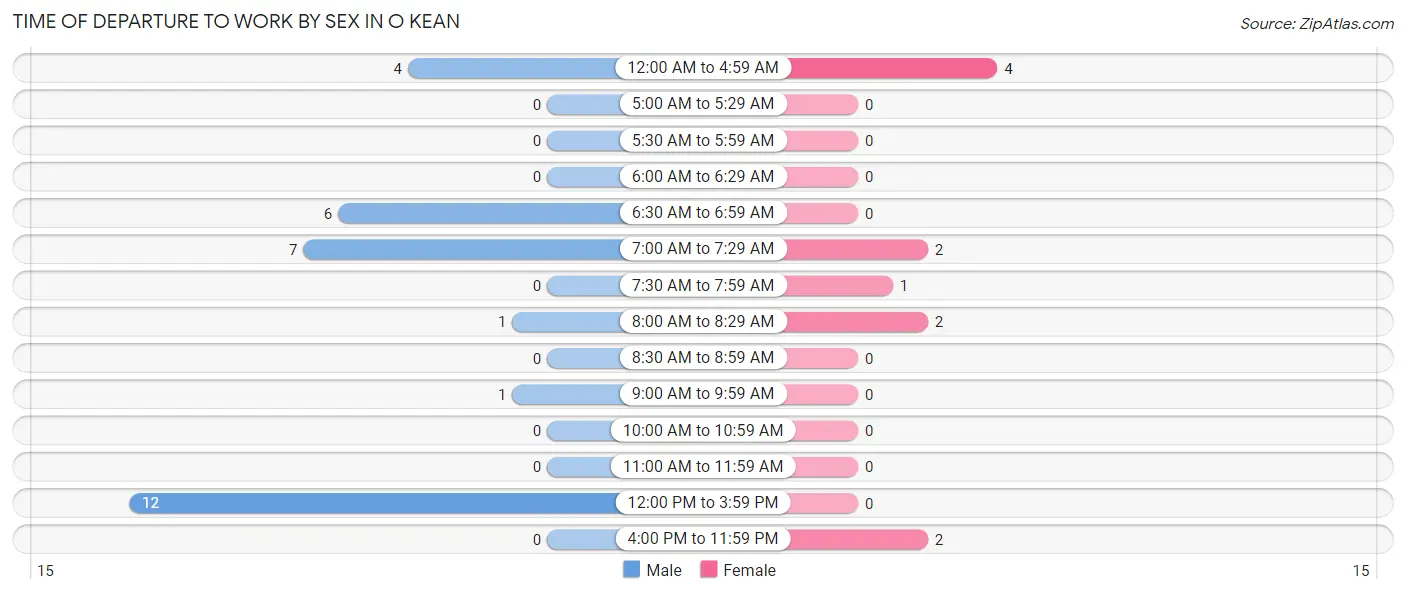
| Time of Departure | Male | Female |
| 12:00 AM to 4:59 AM | 4 (12.9%) | 4 (36.4%) |
| 5:00 AM to 5:29 AM | 0 (0.0%) | 0 (0.0%) |
| 5:30 AM to 5:59 AM | 0 (0.0%) | 0 (0.0%) |
| 6:00 AM to 6:29 AM | 0 (0.0%) | 0 (0.0%) |
| 6:30 AM to 6:59 AM | 6 (19.4%) | 0 (0.0%) |
| 7:00 AM to 7:29 AM | 7 (22.6%) | 2 (18.2%) |
| 7:30 AM to 7:59 AM | 0 (0.0%) | 1 (9.1%) |
| 8:00 AM to 8:29 AM | 1 (3.2%) | 2 (18.2%) |
| 8:30 AM to 8:59 AM | 0 (0.0%) | 0 (0.0%) |
| 9:00 AM to 9:59 AM | 1 (3.2%) | 0 (0.0%) |
| 10:00 AM to 10:59 AM | 0 (0.0%) | 0 (0.0%) |
| 11:00 AM to 11:59 AM | 0 (0.0%) | 0 (0.0%) |
| 12:00 PM to 3:59 PM | 12 (38.7%) | 0 (0.0%) |
| 4:00 PM to 11:59 PM | 0 (0.0%) | 2 (18.2%) |
| Total | 31 (100.0%) | 11 (100.0%) |
Housing Occupancy in O Kean
Occupancy by Ownership in O Kean
Of the total 58 dwellings in O Kean, owner-occupied units account for 42 (72.4%), while renter-occupied units make up 16 (27.6%).
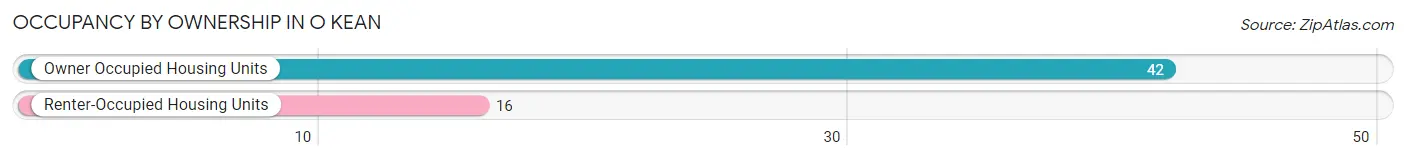
| Occupancy | # Housing Units | % Housing Units |
| Owner Occupied Housing Units | 42 | 72.4% |
| Renter-Occupied Housing Units | 16 | 27.6% |
| Total Occupied Housing Units | 58 | 100.0% |
Occupancy by Household Size in O Kean
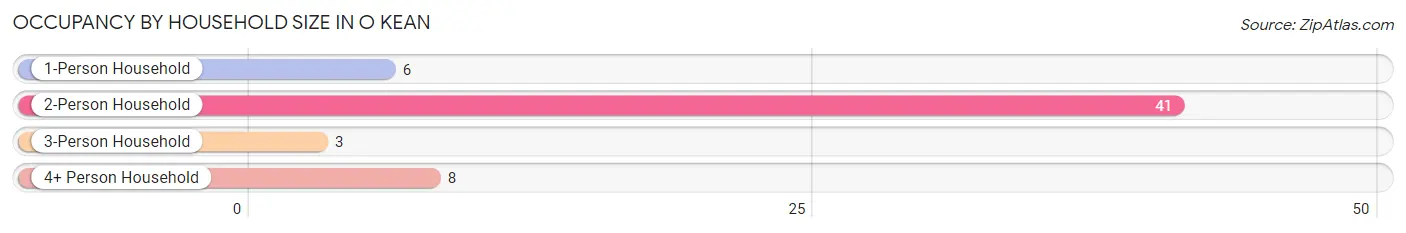
| Household Size | # Housing Units | % Housing Units |
| 1-Person Household | 6 | 10.3% |
| 2-Person Household | 41 | 70.7% |
| 3-Person Household | 3 | 5.2% |
| 4+ Person Household | 8 | 13.8% |
| Total Housing Units | 58 | 100.0% |
Occupancy by Ownership by Household Size in O Kean
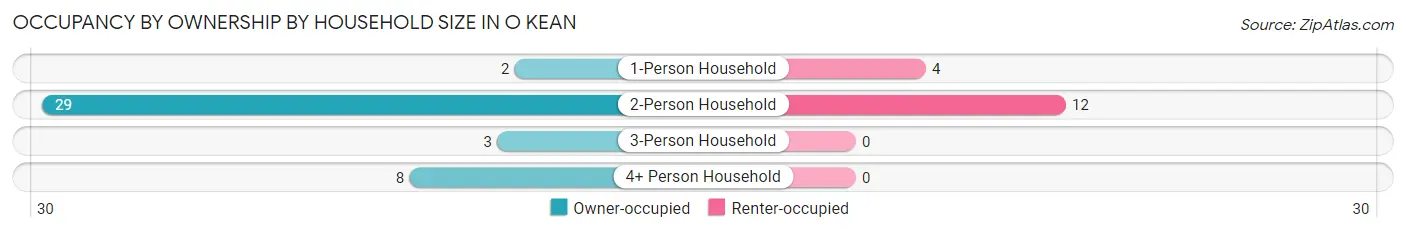
| Household Size | Owner-occupied | Renter-occupied |
| 1-Person Household | 2 (33.3%) | 4 (66.7%) |
| 2-Person Household | 29 (70.7%) | 12 (29.3%) |
| 3-Person Household | 3 (100.0%) | 0 (0.0%) |
| 4+ Person Household | 8 (100.0%) | 0 (0.0%) |
| Total Housing Units | 42 (72.4%) | 16 (27.6%) |
Occupancy by Educational Attainment in O Kean
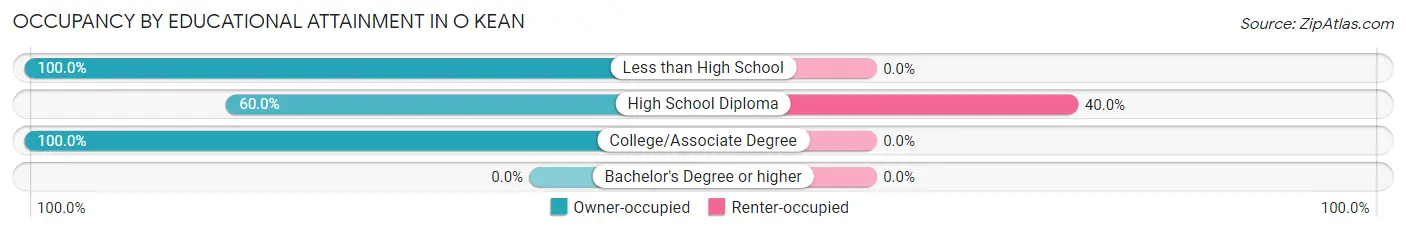
| Household Size | Owner-occupied | Renter-occupied |
| Less than High School | 6 (100.0%) | 0 (0.0%) |
| High School Diploma | 24 (60.0%) | 16 (40.0%) |
| College/Associate Degree | 12 (100.0%) | 0 (0.0%) |
| Bachelor's Degree or higher | 0 (0.0%) | 0 (0.0%) |
Occupancy by Age of Householder in O Kean
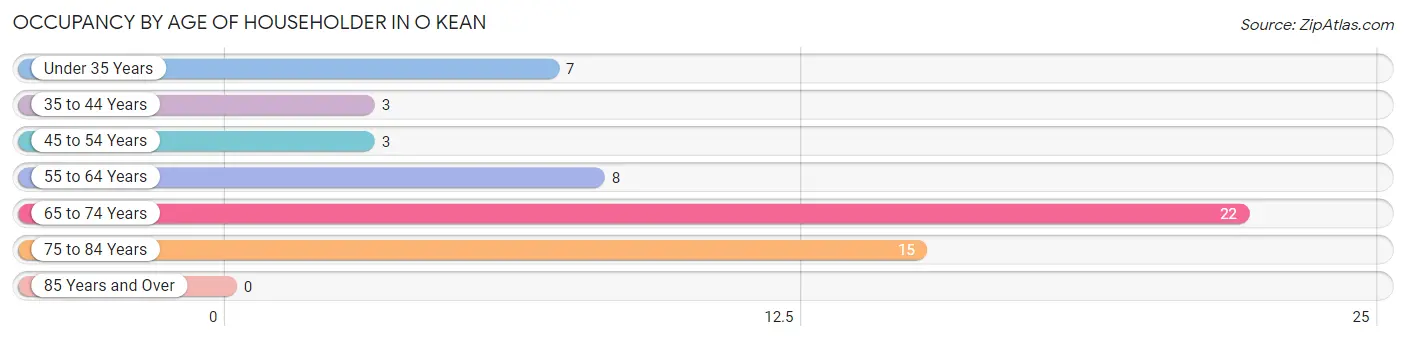
| Age Bracket | # Households | % Households |
| Under 35 Years | 7 | 12.1% |
| 35 to 44 Years | 3 | 5.2% |
| 45 to 54 Years | 3 | 5.2% |
| 55 to 64 Years | 8 | 13.8% |
| 65 to 74 Years | 22 | 37.9% |
| 75 to 84 Years | 15 | 25.9% |
| 85 Years and Over | 0 | 0.0% |
| Total | 58 | 100.0% |
Housing Finances in O Kean
Median Income by Occupancy in O Kean
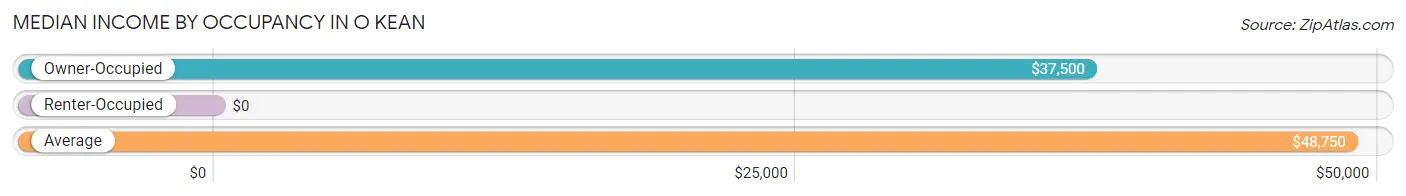
| Occupancy Type | # Households | Median Income |
| Owner-Occupied | 42 (72.4%) | $37,500 |
| Renter-Occupied | 16 (27.6%) | $0 |
| Average | 58 (100.0%) | $48,750 |
Occupancy by Householder Income Bracket in O Kean
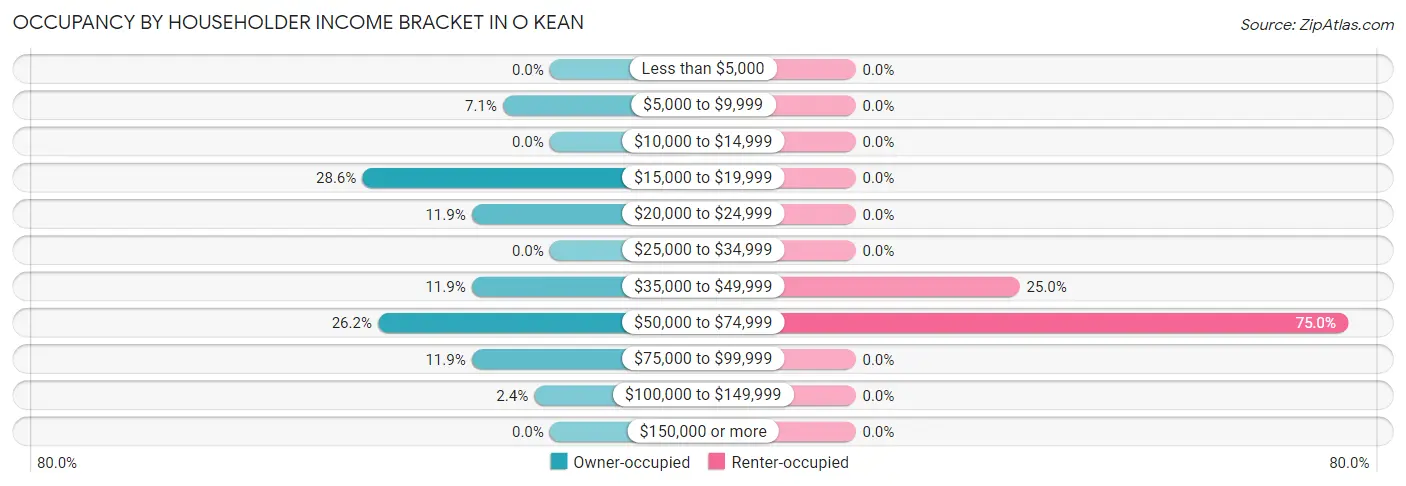
| Income Bracket | Owner-occupied | Renter-occupied |
| Less than $5,000 | 0 (0.0%) | 0 (0.0%) |
| $5,000 to $9,999 | 3 (7.1%) | 0 (0.0%) |
| $10,000 to $14,999 | 0 (0.0%) | 0 (0.0%) |
| $15,000 to $19,999 | 12 (28.6%) | 0 (0.0%) |
| $20,000 to $24,999 | 5 (11.9%) | 0 (0.0%) |
| $25,000 to $34,999 | 0 (0.0%) | 0 (0.0%) |
| $35,000 to $49,999 | 5 (11.9%) | 4 (25.0%) |
| $50,000 to $74,999 | 11 (26.2%) | 12 (75.0%) |
| $75,000 to $99,999 | 5 (11.9%) | 0 (0.0%) |
| $100,000 to $149,999 | 1 (2.4%) | 0 (0.0%) |
| $150,000 or more | 0 (0.0%) | 0 (0.0%) |
| Total | 42 (100.0%) | 16 (100.0%) |
Monthly Housing Cost Tiers in O Kean
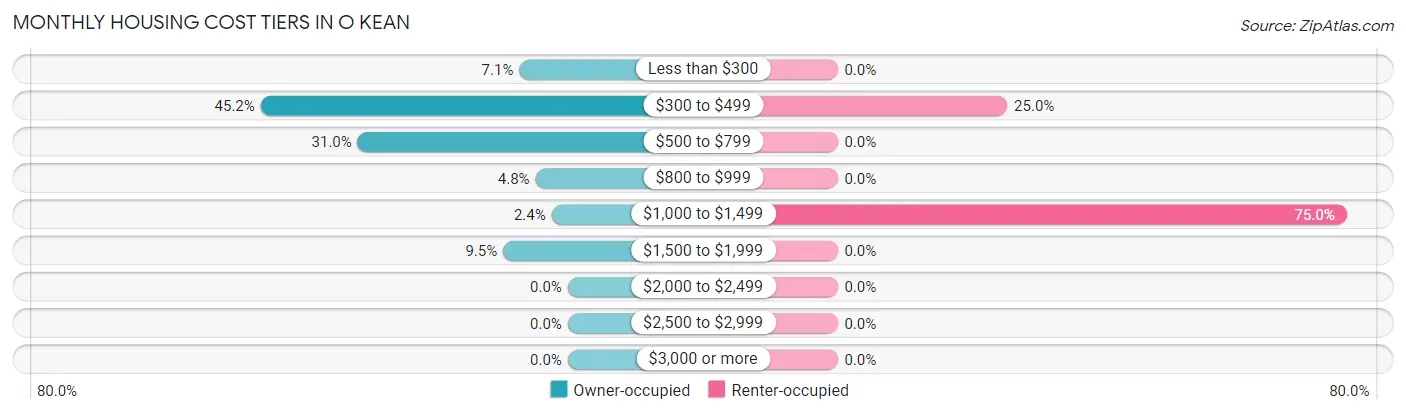
| Monthly Cost | Owner-occupied | Renter-occupied |
| Less than $300 | 3 (7.1%) | 0 (0.0%) |
| $300 to $499 | 19 (45.2%) | 4 (25.0%) |
| $500 to $799 | 13 (30.9%) | 0 (0.0%) |
| $800 to $999 | 2 (4.8%) | 0 (0.0%) |
| $1,000 to $1,499 | 1 (2.4%) | 12 (75.0%) |
| $1,500 to $1,999 | 4 (9.5%) | 0 (0.0%) |
| $2,000 to $2,499 | 0 (0.0%) | 0 (0.0%) |
| $2,500 to $2,999 | 0 (0.0%) | 0 (0.0%) |
| $3,000 or more | 0 (0.0%) | 0 (0.0%) |
| Total | 42 (100.0%) | 16 (100.0%) |
Physical Housing Characteristics in O Kean
Housing Structures in O Kean
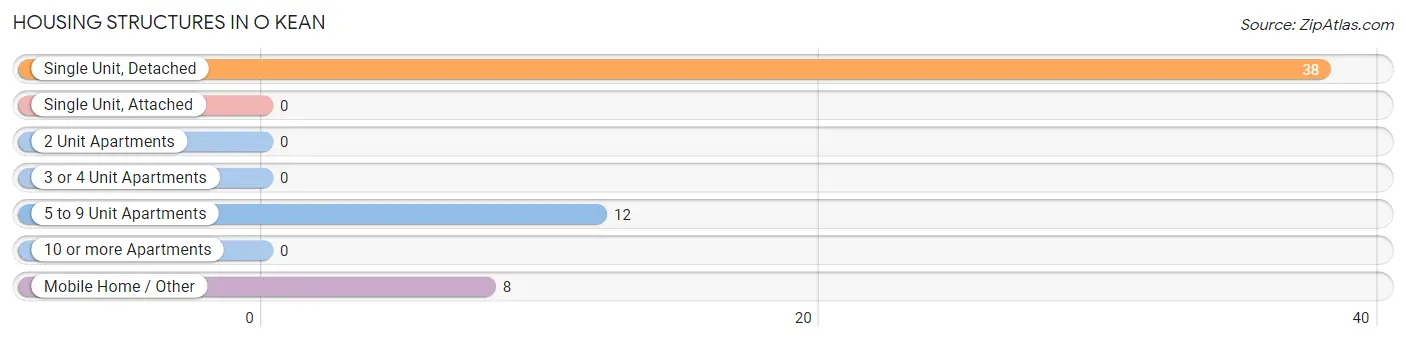
| Structure Type | # Housing Units | % Housing Units |
| Single Unit, Detached | 38 | 65.5% |
| Single Unit, Attached | 0 | 0.0% |
| 2 Unit Apartments | 0 | 0.0% |
| 3 or 4 Unit Apartments | 0 | 0.0% |
| 5 to 9 Unit Apartments | 12 | 20.7% |
| 10 or more Apartments | 0 | 0.0% |
| Mobile Home / Other | 8 | 13.8% |
| Total | 58 | 100.0% |
Housing Structures by Occupancy in O Kean
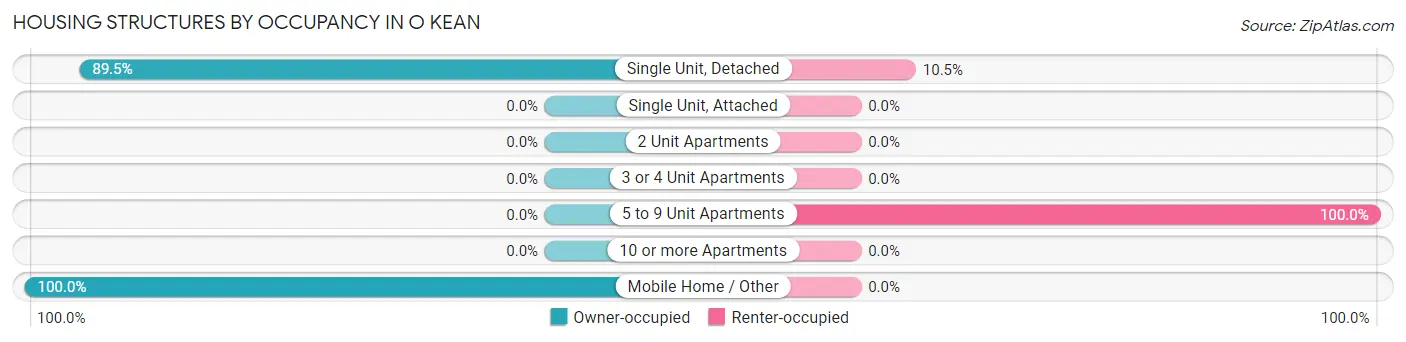
| Structure Type | Owner-occupied | Renter-occupied |
| Single Unit, Detached | 34 (89.5%) | 4 (10.5%) |
| Single Unit, Attached | 0 (0.0%) | 0 (0.0%) |
| 2 Unit Apartments | 0 (0.0%) | 0 (0.0%) |
| 3 or 4 Unit Apartments | 0 (0.0%) | 0 (0.0%) |
| 5 to 9 Unit Apartments | 0 (0.0%) | 12 (100.0%) |
| 10 or more Apartments | 0 (0.0%) | 0 (0.0%) |
| Mobile Home / Other | 8 (100.0%) | 0 (0.0%) |
| Total | 42 (72.4%) | 16 (27.6%) |
Housing Structures by Number of Rooms in O Kean
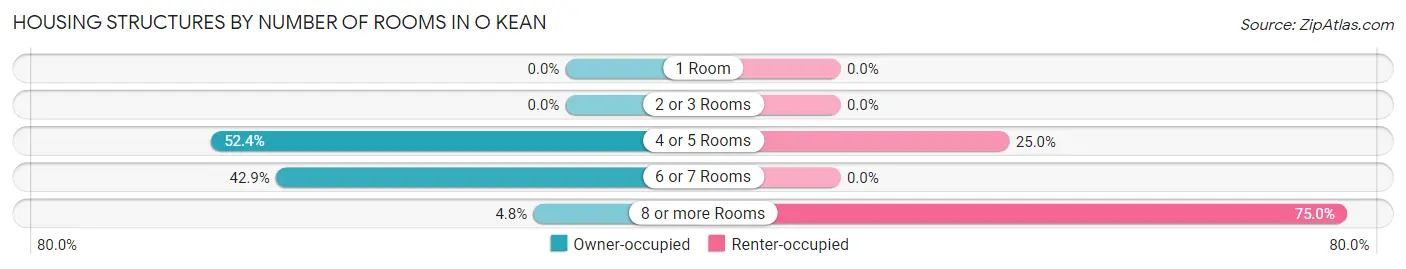
| Number of Rooms | Owner-occupied | Renter-occupied |
| 1 Room | 0 (0.0%) | 0 (0.0%) |
| 2 or 3 Rooms | 0 (0.0%) | 0 (0.0%) |
| 4 or 5 Rooms | 22 (52.4%) | 4 (25.0%) |
| 6 or 7 Rooms | 18 (42.9%) | 0 (0.0%) |
| 8 or more Rooms | 2 (4.8%) | 12 (75.0%) |
| Total | 42 (100.0%) | 16 (100.0%) |
Housing Structure by Heating Type in O Kean
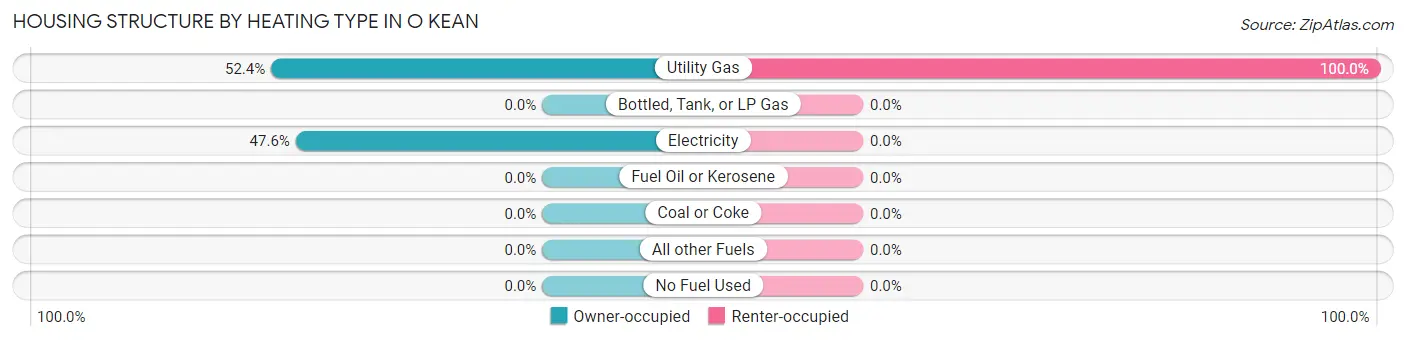
| Heating Type | Owner-occupied | Renter-occupied |
| Utility Gas | 22 (52.4%) | 16 (100.0%) |
| Bottled, Tank, or LP Gas | 0 (0.0%) | 0 (0.0%) |
| Electricity | 20 (47.6%) | 0 (0.0%) |
| Fuel Oil or Kerosene | 0 (0.0%) | 0 (0.0%) |
| Coal or Coke | 0 (0.0%) | 0 (0.0%) |
| All other Fuels | 0 (0.0%) | 0 (0.0%) |
| No Fuel Used | 0 (0.0%) | 0 (0.0%) |
| Total | 42 (100.0%) | 16 (100.0%) |
Household Vehicle Usage in O Kean
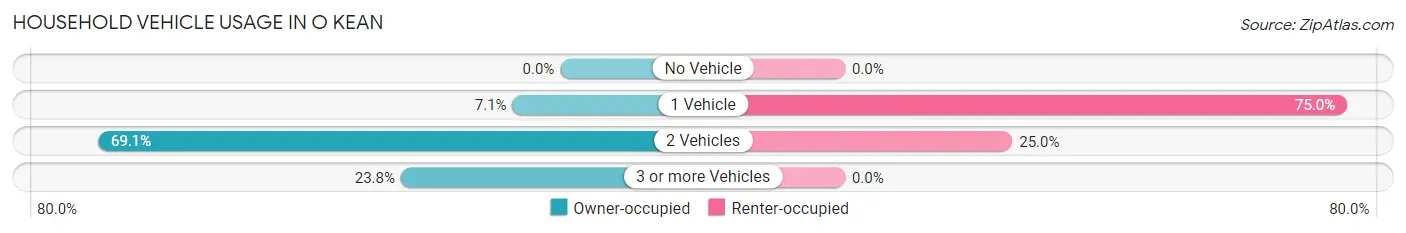
| Vehicles per Household | Owner-occupied | Renter-occupied |
| No Vehicle | 0 (0.0%) | 0 (0.0%) |
| 1 Vehicle | 3 (7.1%) | 12 (75.0%) |
| 2 Vehicles | 29 (69.1%) | 4 (25.0%) |
| 3 or more Vehicles | 10 (23.8%) | 0 (0.0%) |
| Total | 42 (100.0%) | 16 (100.0%) |
Real Estate & Mortgages in O Kean
Real Estate and Mortgage Overview in O Kean
| Characteristic | Without Mortgage | With Mortgage |
| Housing Units | 24 | 18 |
| Median Property Value | $56,000 | $58,000 |
| Median Household Income | $19,750 | $0 |
| Monthly Housing Costs | $410 | $0 |
| Real Estate Taxes | $550 | $0 |
Property Value by Mortgage Status in O Kean
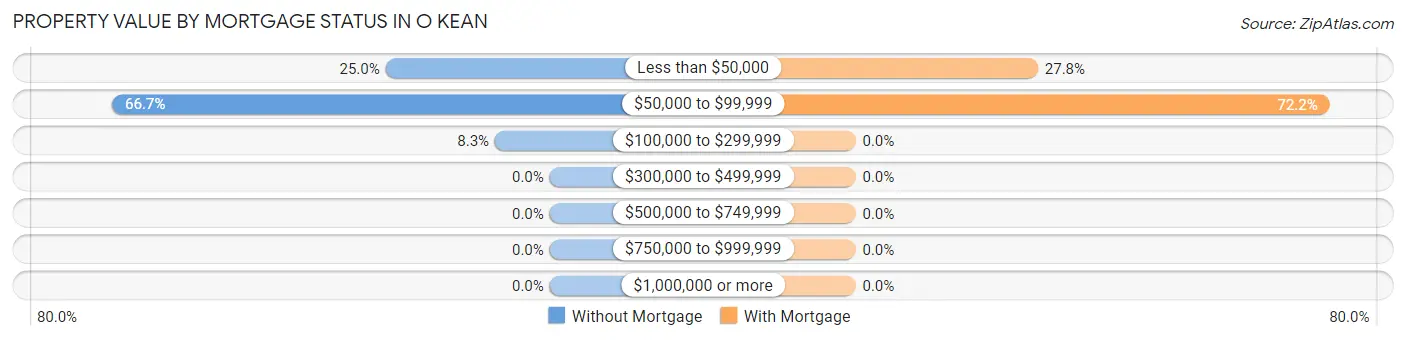
| Property Value | Without Mortgage | With Mortgage |
| Less than $50,000 | 6 (25.0%) | 5 (27.8%) |
| $50,000 to $99,999 | 16 (66.7%) | 13 (72.2%) |
| $100,000 to $299,999 | 2 (8.3%) | 0 (0.0%) |
| $300,000 to $499,999 | 0 (0.0%) | 0 (0.0%) |
| $500,000 to $749,999 | 0 (0.0%) | 0 (0.0%) |
| $750,000 to $999,999 | 0 (0.0%) | 0 (0.0%) |
| $1,000,000 or more | 0 (0.0%) | 0 (0.0%) |
| Total | 24 (100.0%) | 18 (100.0%) |
Household Income by Mortgage Status in O Kean
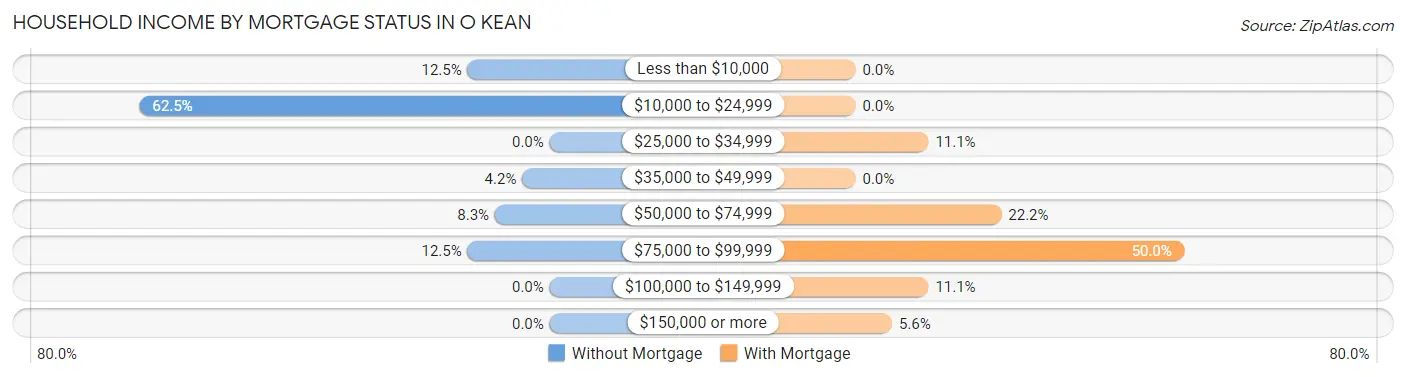
| Household Income | Without Mortgage | With Mortgage |
| Less than $10,000 | 3 (12.5%) | 0 (0.0%) |
| $10,000 to $24,999 | 15 (62.5%) | 0 (0.0%) |
| $25,000 to $34,999 | 0 (0.0%) | 2 (11.1%) |
| $35,000 to $49,999 | 1 (4.2%) | 0 (0.0%) |
| $50,000 to $74,999 | 2 (8.3%) | 4 (22.2%) |
| $75,000 to $99,999 | 3 (12.5%) | 9 (50.0%) |
| $100,000 to $149,999 | 0 (0.0%) | 2 (11.1%) |
| $150,000 or more | 0 (0.0%) | 1 (5.6%) |
| Total | 24 (100.0%) | 18 (100.0%) |
Property Value to Household Income Ratio in O Kean
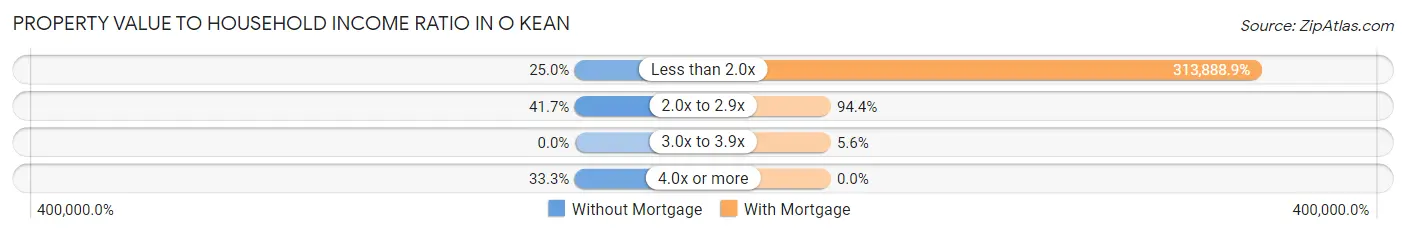
| Value-to-Income Ratio | Without Mortgage | With Mortgage |
| Less than 2.0x | 6 (25.0%) | 56,500 (313,888.9%) |
| 2.0x to 2.9x | 10 (41.7%) | 17 (94.4%) |
| 3.0x to 3.9x | 0 (0.0%) | 1 (5.6%) |
| 4.0x or more | 8 (33.3%) | 0 (0.0%) |
| Total | 24 (100.0%) | 18 (100.0%) |
Real Estate Taxes by Mortgage Status in O Kean
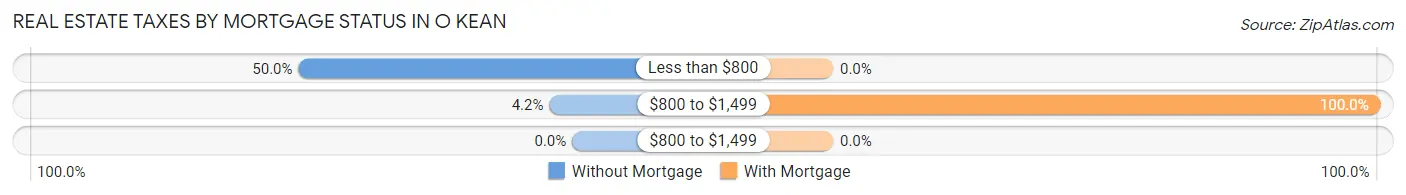
| Property Taxes | Without Mortgage | With Mortgage |
| Less than $800 | 12 (50.0%) | 0 (0.0%) |
| $800 to $1,499 | 1 (4.2%) | 18 (100.0%) |
| $800 to $1,499 | 0 (0.0%) | 0 (0.0%) |
| Total | 24 (100.0%) | 18 (100.0%) |
Health & Disability in O Kean
Health Insurance Coverage by Age in O Kean
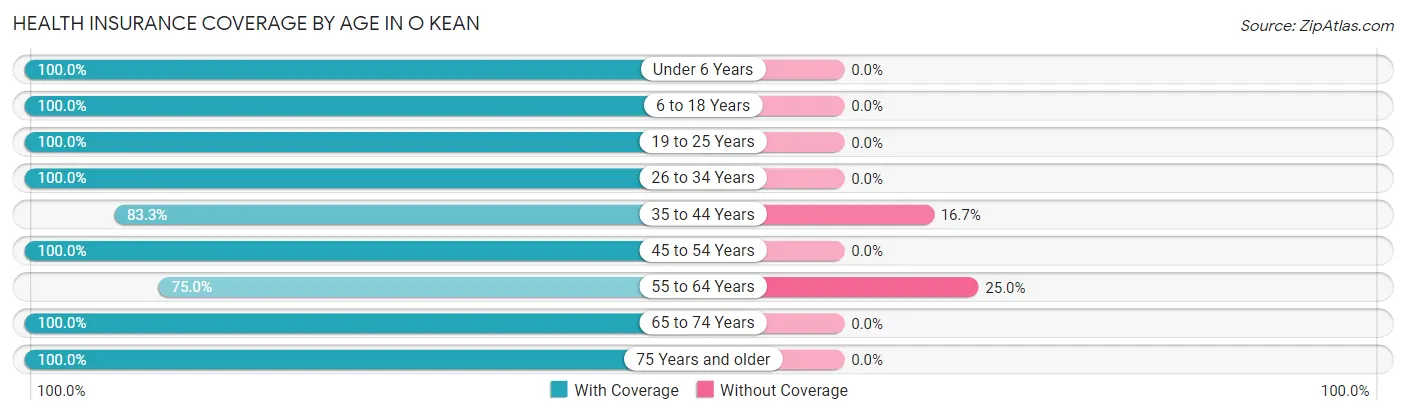
| Age Bracket | With Coverage | Without Coverage |
| Under 6 Years | 6 (100.0%) | 0 (0.0%) |
| 6 to 18 Years | 12 (100.0%) | 0 (0.0%) |
| 19 to 25 Years | 5 (100.0%) | 0 (0.0%) |
| 26 to 34 Years | 10 (100.0%) | 0 (0.0%) |
| 35 to 44 Years | 10 (83.3%) | 2 (16.7%) |
| 45 to 54 Years | 14 (100.0%) | 0 (0.0%) |
| 55 to 64 Years | 9 (75.0%) | 3 (25.0%) |
| 65 to 74 Years | 29 (100.0%) | 0 (0.0%) |
| 75 Years and older | 49 (100.0%) | 0 (0.0%) |
| Total | 144 (96.6%) | 5 (3.4%) |
Health Insurance Coverage by Citizenship Status in O Kean
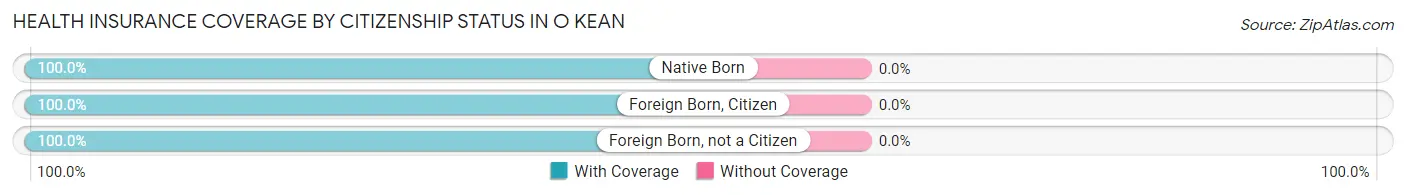
| Citizenship Status | With Coverage | Without Coverage |
| Native Born | 6 (100.0%) | 0 (0.0%) |
| Foreign Born, Citizen | 12 (100.0%) | 0 (0.0%) |
| Foreign Born, not a Citizen | 5 (100.0%) | 0 (0.0%) |
Health Insurance Coverage by Household Income in O Kean
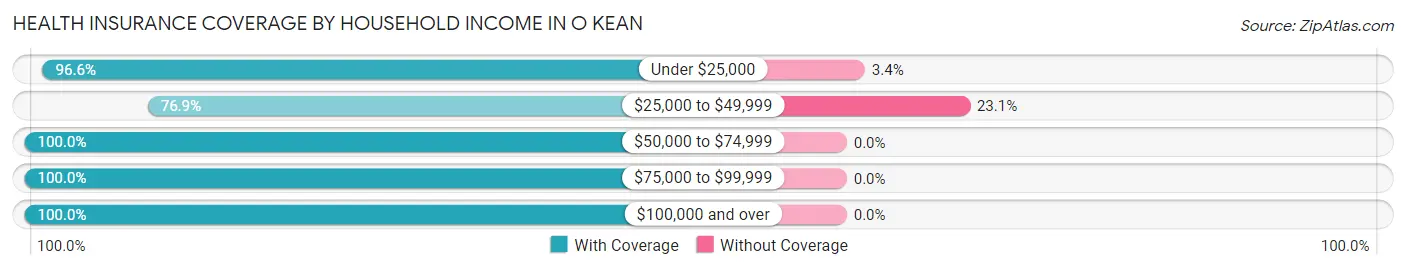
| Household Income | With Coverage | Without Coverage |
| Under $25,000 | 57 (96.6%) | 2 (3.4%) |
| $25,000 to $49,999 | 10 (76.9%) | 3 (23.1%) |
| $50,000 to $74,999 | 57 (100.0%) | 0 (0.0%) |
| $75,000 to $99,999 | 12 (100.0%) | 0 (0.0%) |
| $100,000 and over | 2 (100.0%) | 0 (0.0%) |
Public vs Private Health Insurance Coverage by Age in O Kean
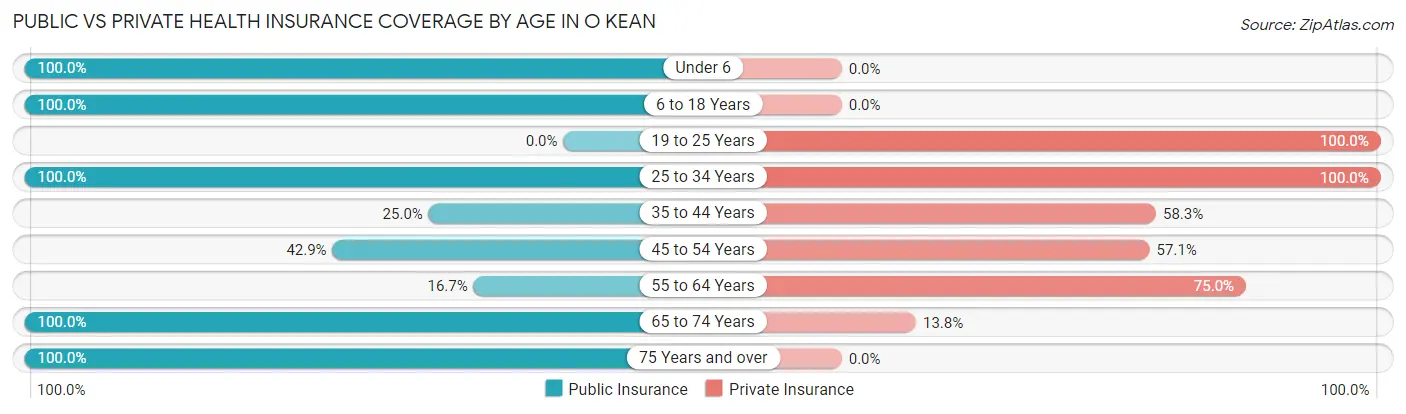
| Age Bracket | Public Insurance | Private Insurance |
| Under 6 | 6 (100.0%) | 0 (0.0%) |
| 6 to 18 Years | 12 (100.0%) | 0 (0.0%) |
| 19 to 25 Years | 0 (0.0%) | 5 (100.0%) |
| 25 to 34 Years | 10 (100.0%) | 10 (100.0%) |
| 35 to 44 Years | 3 (25.0%) | 7 (58.3%) |
| 45 to 54 Years | 6 (42.9%) | 8 (57.1%) |
| 55 to 64 Years | 2 (16.7%) | 9 (75.0%) |
| 65 to 74 Years | 29 (100.0%) | 4 (13.8%) |
| 75 Years and over | 49 (100.0%) | 0 (0.0%) |
| Total | 117 (78.5%) | 43 (28.9%) |
Disability Status by Sex by Age in O Kean
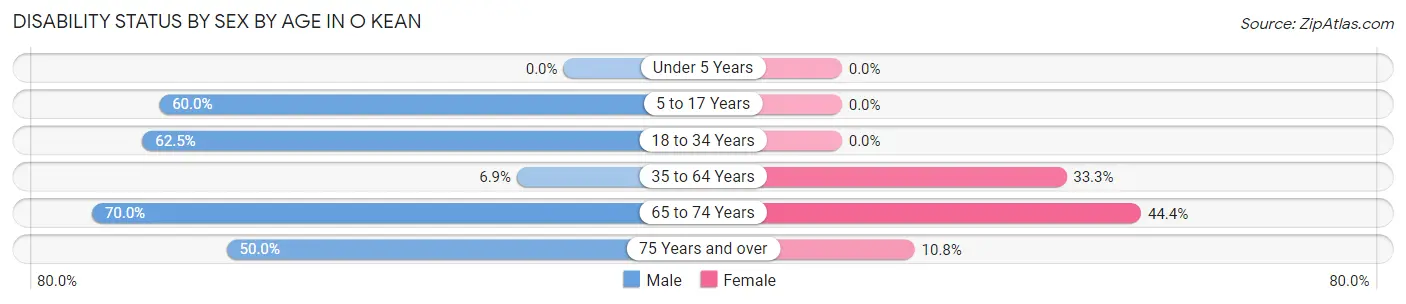
| Age Bracket | Male | Female |
| Under 5 Years | 0 (0.0%) | 0 (0.0%) |
| 5 to 17 Years | 3 (60.0%) | 0 (0.0%) |
| 18 to 34 Years | 5 (62.5%) | 0 (0.0%) |
| 35 to 64 Years | 2 (6.9%) | 3 (33.3%) |
| 65 to 74 Years | 14 (70.0%) | 4 (44.4%) |
| 75 Years and over | 6 (50.0%) | 4 (10.8%) |
Disability Class by Sex by Age in O Kean
Disability Class: Hearing Difficulty
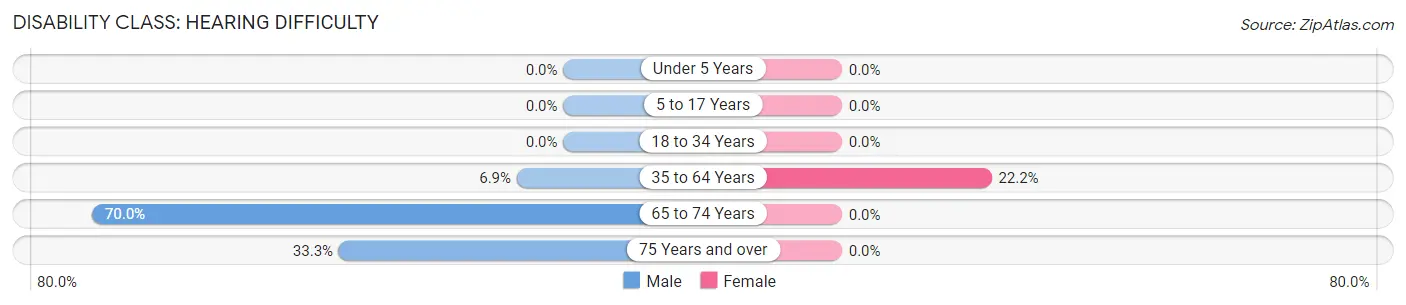
| Age Bracket | Male | Female |
| Under 5 Years | 0 (0.0%) | 0 (0.0%) |
| 5 to 17 Years | 0 (0.0%) | 0 (0.0%) |
| 18 to 34 Years | 0 (0.0%) | 0 (0.0%) |
| 35 to 64 Years | 2 (6.9%) | 2 (22.2%) |
| 65 to 74 Years | 14 (70.0%) | 0 (0.0%) |
| 75 Years and over | 4 (33.3%) | 0 (0.0%) |
Disability Class: Vision Difficulty
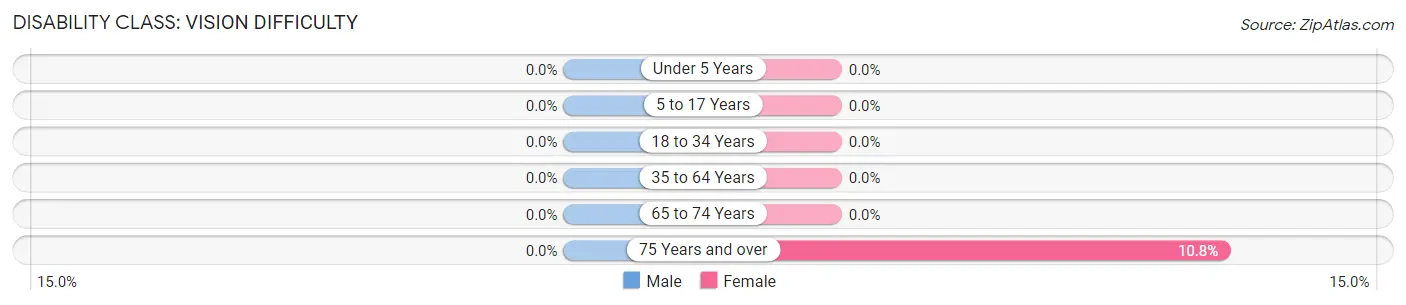
| Age Bracket | Male | Female |
| Under 5 Years | 0 (0.0%) | 0 (0.0%) |
| 5 to 17 Years | 0 (0.0%) | 0 (0.0%) |
| 18 to 34 Years | 0 (0.0%) | 0 (0.0%) |
| 35 to 64 Years | 0 (0.0%) | 0 (0.0%) |
| 65 to 74 Years | 0 (0.0%) | 0 (0.0%) |
| 75 Years and over | 0 (0.0%) | 4 (10.8%) |
Disability Class: Cognitive Difficulty
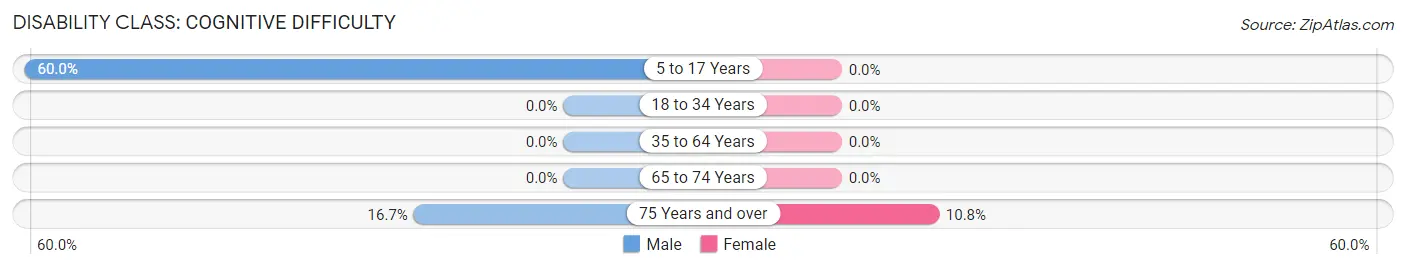
| Age Bracket | Male | Female |
| 5 to 17 Years | 3 (60.0%) | 0 (0.0%) |
| 18 to 34 Years | 0 (0.0%) | 0 (0.0%) |
| 35 to 64 Years | 0 (0.0%) | 0 (0.0%) |
| 65 to 74 Years | 0 (0.0%) | 0 (0.0%) |
| 75 Years and over | 2 (16.7%) | 4 (10.8%) |
Disability Class: Ambulatory Difficulty
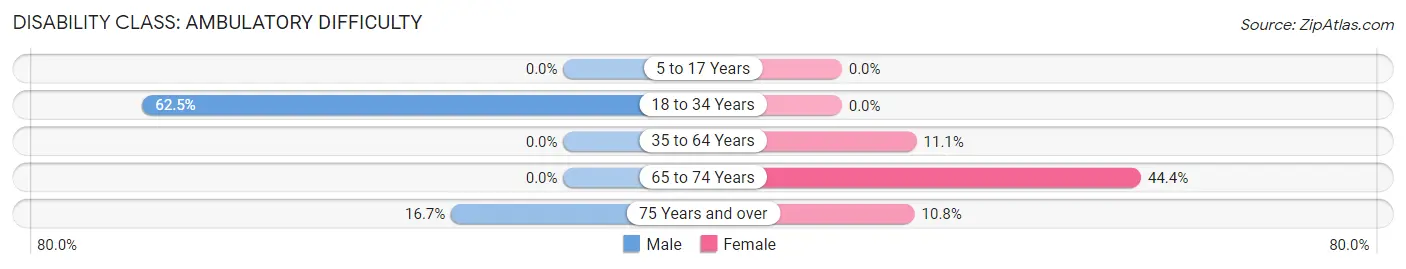
| Age Bracket | Male | Female |
| 5 to 17 Years | 0 (0.0%) | 0 (0.0%) |
| 18 to 34 Years | 5 (62.5%) | 0 (0.0%) |
| 35 to 64 Years | 0 (0.0%) | 1 (11.1%) |
| 65 to 74 Years | 0 (0.0%) | 4 (44.4%) |
| 75 Years and over | 2 (16.7%) | 4 (10.8%) |
Disability Class: Self-Care Difficulty
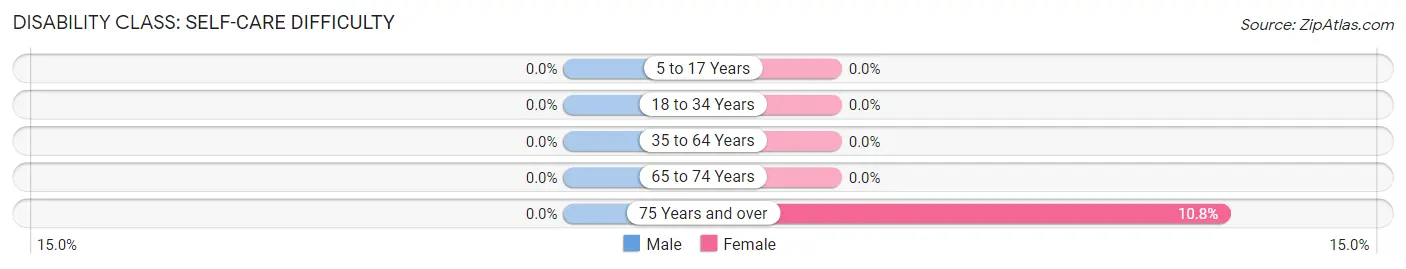
| Age Bracket | Male | Female |
| 5 to 17 Years | 0 (0.0%) | 0 (0.0%) |
| 18 to 34 Years | 0 (0.0%) | 0 (0.0%) |
| 35 to 64 Years | 0 (0.0%) | 0 (0.0%) |
| 65 to 74 Years | 0 (0.0%) | 0 (0.0%) |
| 75 Years and over | 0 (0.0%) | 4 (10.8%) |
Technology Access in O Kean
Computing Device Access in O Kean
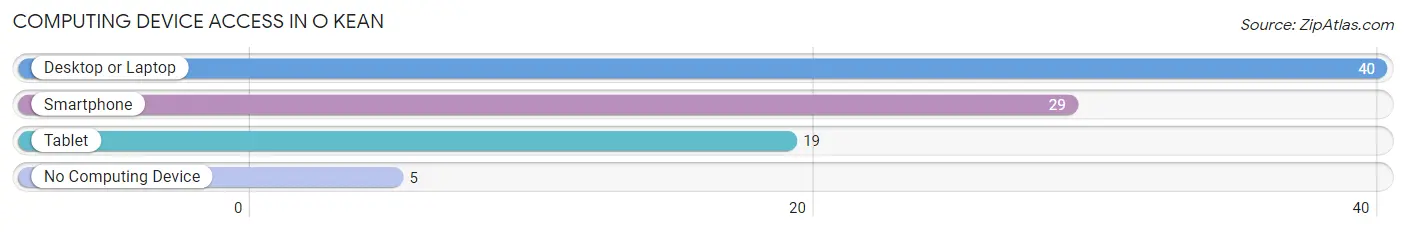
| Device Type | # Households | % Households |
| Desktop or Laptop | 40 | 69.0% |
| Smartphone | 29 | 50.0% |
| Tablet | 19 | 32.8% |
| No Computing Device | 5 | 8.6% |
| Total | 58 | 100.0% |
Internet Access in O Kean
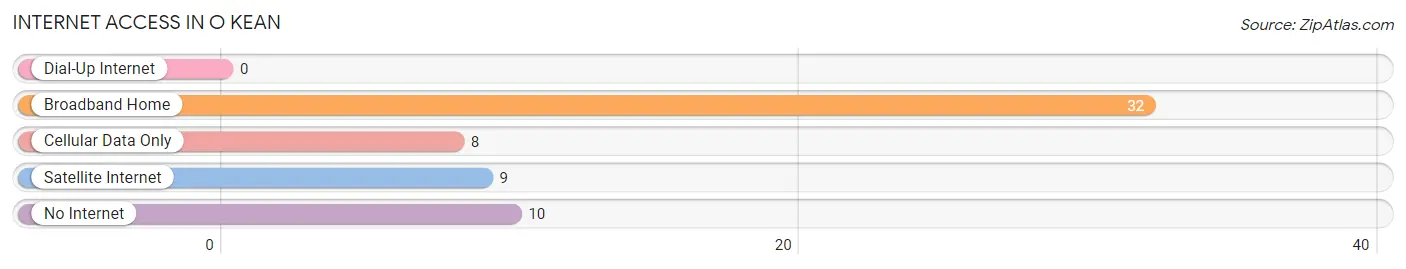
| Internet Type | # Households | % Households |
| Dial-Up Internet | 0 | 0.0% |
| Broadband Home | 32 | 55.2% |
| Cellular Data Only | 8 | 13.8% |
| Satellite Internet | 9 | 15.5% |
| No Internet | 10 | 17.2% |
| Total | 58 | 100.0% |
O Kean Summary
Kean, Arkansas is a small town located in the northwest corner of the state, near the Oklahoma border. It is part of the Fort Smith metropolitan area and is home to a population of just over 1,000 people. The town was founded in 1883 and has a rich history that is still evident today.
Geography
Kean is located in the northwest corner of Arkansas, near the Oklahoma border. It is part of the Fort Smith metropolitan area and is situated in the Ozark Mountains. The town is surrounded by rolling hills and lush forests, making it a popular destination for outdoor activities such as hiking, camping, and fishing. The town is also home to several small lakes, including Lake Kean, which is a popular spot for swimming and boating.
Economy
Kean’s economy is largely based on agriculture and tourism. The town is home to several farms, which produce a variety of crops, including corn, soybeans, and wheat. The town is also home to several small businesses, including restaurants, shops, and a few small manufacturing companies. Tourism is also an important part of the local economy, as the town is a popular destination for outdoor activities.
Demographics
As of the 2010 census, Kean had a population of 1,072 people. The population is largely white (94.2%), with a small percentage of African Americans (2.2%) and Hispanics (2.6%). The median household income is $37,500, and the median age is 38. The town is home to a variety of religious denominations, including Baptist, Methodist, and Catholic.
History
Kean was founded in 1883 by a group of settlers from Missouri. The town was named after a local Native American chief, Chief Kean. The town quickly grew and became a popular destination for settlers, as it was located near the Arkansas-Oklahoma border. The town was also home to several businesses, including a sawmill, a gristmill, and a cotton gin.
In the early 1900s, the town experienced a period of growth, as the railroad was extended to the area. This allowed for the transportation of goods and people, and the town quickly became a hub for commerce. The town also experienced a period of growth during the Great Depression, as the government provided relief funds to the area.
Today, Kean is a small town with a rich history. The town is home to a variety of businesses, including restaurants, shops, and a few small manufacturing companies. The town is also a popular destination for outdoor activities, such as hiking, camping, and fishing.
Common Questions
What is Per Capita Income in O Kean?
Per Capita income in O Kean is $23,391.
What is the Median Family Income in O Kean?
Median Family Income in O Kean is $40,000.
What is the Median Household income in O Kean?
Median Household Income in O Kean is $48,750.
What is Inequality or Gini Index in O Kean?
Inequality or Gini Index in O Kean is 0.30.
What is the Total Population of O Kean?
Total Population of O Kean is 149.
What is the Total Male Population of O Kean?
Total Male Population of O Kean is 80.
What is the Total Female Population of O Kean?
Total Female Population of O Kean is 69.
What is the Ratio of Males per 100 Females in O Kean?
There are 115.94 Males per 100 Females in O Kean.
What is the Ratio of Females per 100 Males in O Kean?
There are 86.25 Females per 100 Males in O Kean.
What is the Median Population Age in O Kean?
Median Population Age in O Kean is 65.3 Years.
What is the Average Family Size in O Kean
Average Family Size in O Kean is 2.6 People.
What is the Average Household Size in O Kean
Average Household Size in O Kean is 2.5 People.
How Large is the Labor Force in O Kean?
There are 45 People in the Labor Forcein in O Kean.
What is the Percentage of People in the Labor Force in O Kean?
34.4% of People are in the Labor Force in O Kean.
What is the Unemployment Rate in O Kean?
Unemployment Rate in O Kean is 6.7%.