Newport, AR Map & Demographics
Newport Map
Newport Overview
$17,455
PER CAPITA INCOME
$47,586
AVG FAMILY INCOME
$32,440
AVG HOUSEHOLD INCOME
34.9%
WAGE / INCOME GAP [ % ]
65.1¢/ $1
WAGE / INCOME GAP [ $ ]
$7,953
FAMILY INCOME DEFICIT
0.47
INEQUALITY / GINI INDEX
7,984
TOTAL POPULATION
3,605
MALE POPULATION
4,379
FEMALE POPULATION
82.32
MALES / 100 FEMALES
121.47
FEMALES / 100 MALES
39.0
MEDIAN AGE
2.8
AVG FAMILY SIZE
2.1
AVG HOUSEHOLD SIZE
2,714
LABOR FORCE [ PEOPLE ]
39.4%
PERCENT IN LABOR FORCE
13.1%
UNEMPLOYMENT RATE
Newport Zip Codes
Newport Area Codes
Income in Newport
Income Overview in Newport
Per Capita Income in Newport is $17,455, while median incomes of families and households are $47,586 and $32,440 respectively.
| Characteristic | Number | Measure |
| Per Capita Income | 7,984 | $17,455 |
| Median Family Income | 1,416 | $47,586 |
| Mean Family Income | 1,416 | $60,915 |
| Median Household Income | 2,671 | $32,440 |
| Mean Household Income | 2,671 | $46,413 |
| Income Deficit | 1,416 | $7,953 |
| Wage / Income Gap (%) | 7,984 | 34.87% |
| Wage / Income Gap ($) | 7,984 | 65.13¢ per $1 |
| Gini / Inequality Index | 7,984 | 0.47 |
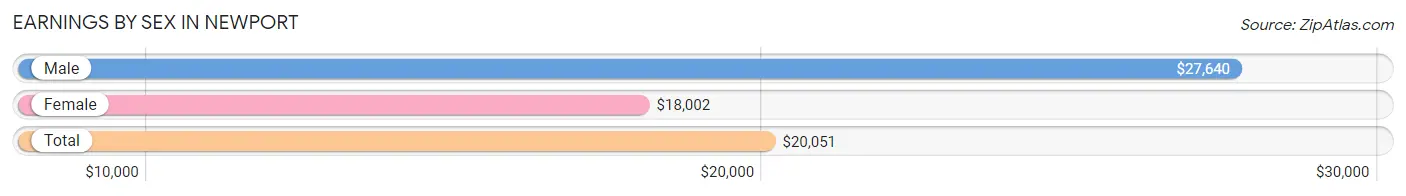
Earnings by Sex in Newport
Average Earnings in Newport are $20,051, $27,640 for men and $18,002 for women, a difference of 34.9%.
| Sex | Number | Average Earnings |
| Male | 1,704 (50.6%) | $27,640 |
| Female | 1,663 (49.4%) | $18,002 |
| Total | 3,367 (100.0%) | $20,051 |
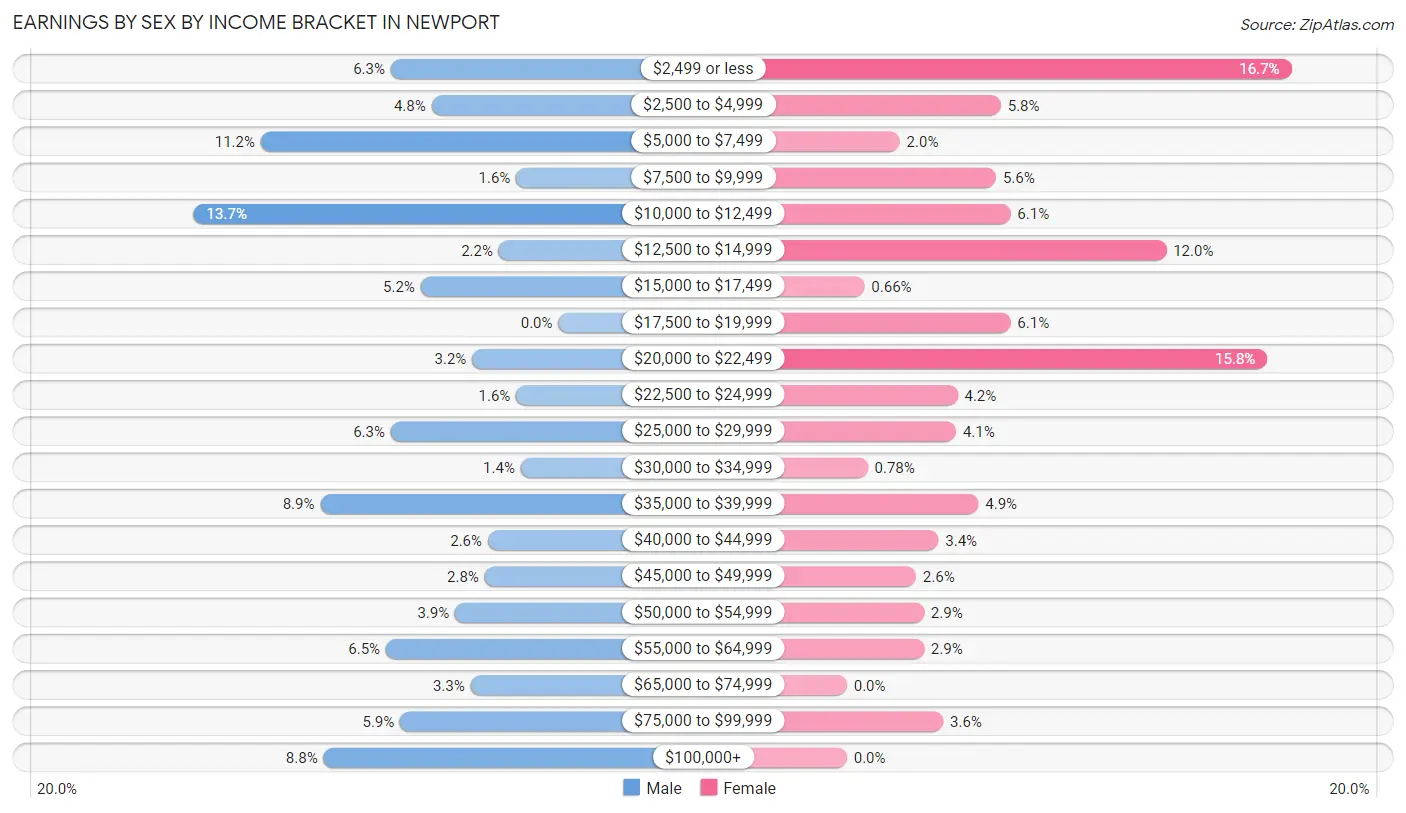
Earnings by Sex by Income Bracket in Newport
The most common earnings brackets in Newport are $10,000 to $12,499 for men (233 | 13.7%) and $2,499 or less for women (277 | 16.7%).
| Income | Male | Female |
| $2,499 or less | 107 (6.3%) | 277 (16.7%) |
| $2,500 to $4,999 | 81 (4.8%) | 96 (5.8%) |
| $5,000 to $7,499 | 190 (11.2%) | 33 (2.0%) |
| $7,500 to $9,999 | 27 (1.6%) | 93 (5.6%) |
| $10,000 to $12,499 | 233 (13.7%) | 102 (6.1%) |
| $12,500 to $14,999 | 38 (2.2%) | 199 (12.0%) |
| $15,000 to $17,499 | 88 (5.2%) | 11 (0.7%) |
| $17,500 to $19,999 | 0 (0.0%) | 102 (6.1%) |
| $20,000 to $22,499 | 55 (3.2%) | 262 (15.8%) |
| $22,500 to $24,999 | 27 (1.6%) | 69 (4.2%) |
| $25,000 to $29,999 | 107 (6.3%) | 68 (4.1%) |
| $30,000 to $34,999 | 24 (1.4%) | 13 (0.8%) |
| $35,000 to $39,999 | 152 (8.9%) | 82 (4.9%) |
| $40,000 to $44,999 | 45 (2.6%) | 57 (3.4%) |
| $45,000 to $49,999 | 47 (2.8%) | 43 (2.6%) |
| $50,000 to $54,999 | 66 (3.9%) | 48 (2.9%) |
| $55,000 to $64,999 | 110 (6.5%) | 48 (2.9%) |
| $65,000 to $74,999 | 56 (3.3%) | 0 (0.0%) |
| $75,000 to $99,999 | 101 (5.9%) | 60 (3.6%) |
| $100,000+ | 150 (8.8%) | 0 (0.0%) |
| Total | 1,704 (100.0%) | 1,663 (100.0%) |
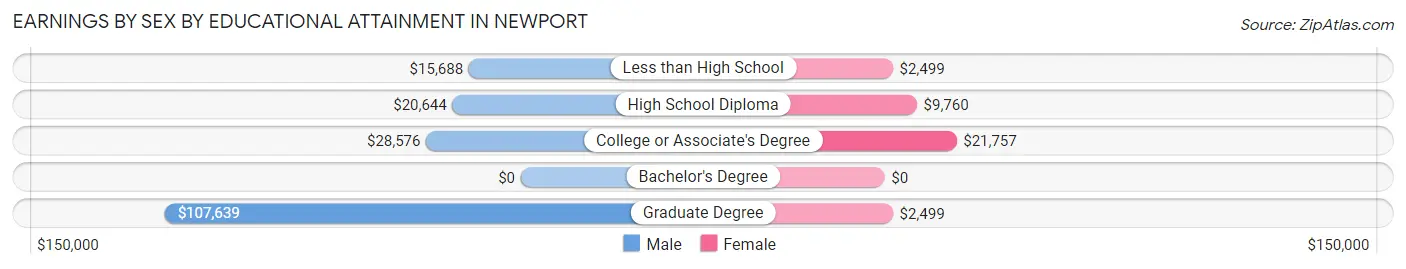
Earnings by Sex by Educational Attainment in Newport
Average earnings in Newport are $24,491 for men and $17,708 for women, a difference of 27.7%. Men with an educational attainment of graduate degree enjoy the highest average annual earnings of $107,639, while those with less than high school education earn the least with $15,688. Women with an educational attainment of college or associate's degree earn the most with the average annual earnings of $21,757, while those with less than high school education have the smallest earnings of $2,499.
| Educational Attainment | Male Income | Female Income |
| Less than High School | $15,688 | $2,499 |
| High School Diploma | $20,644 | $9,760 |
| College or Associate's Degree | $28,576 | $21,757 |
| Bachelor's Degree | - | - |
| Graduate Degree | $107,639 | $2,499 |
| Total | $24,491 | $17,708 |
Family Income in Newport
Family Income Brackets in Newport
According to the Newport family income data, there are 263 families falling into the $50,000 to $74,999 income range, which is the most common income bracket and makes up 18.6% of all families. Conversely, the $150,000 to $199,999 income bracket is the least frequent group with only 18 families (1.3%) belonging to this category.
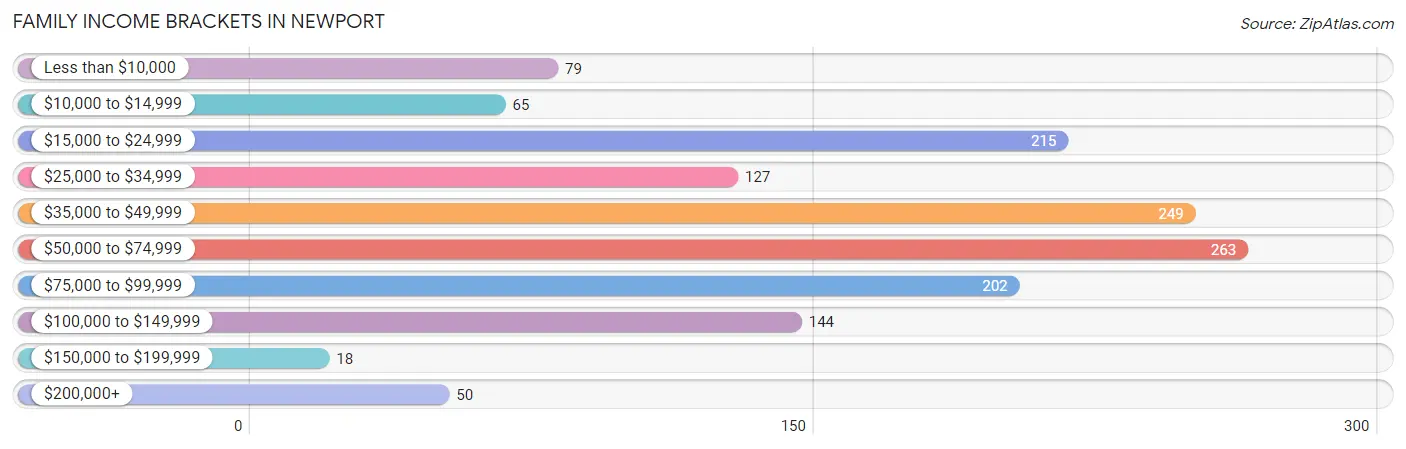
| Income Bracket | # Families | % Families |
| Less than $10,000 | 79 | 5.6% |
| $10,000 to $14,999 | 65 | 4.6% |
| $15,000 to $24,999 | 215 | 15.2% |
| $25,000 to $34,999 | 127 | 9.0% |
| $35,000 to $49,999 | 249 | 17.6% |
| $50,000 to $74,999 | 263 | 18.6% |
| $75,000 to $99,999 | 202 | 14.3% |
| $100,000 to $149,999 | 144 | 10.2% |
| $150,000 to $199,999 | 18 | 1.3% |
| $200,000+ | 50 | 3.5% |
Family Income by Famaliy Size in Newport
4-person families (265 | 18.7%) account for the highest median family income in Newport with $64,531 per family, while 2-person families (902 | 63.7%) have the highest median income of $20,560 per family member.
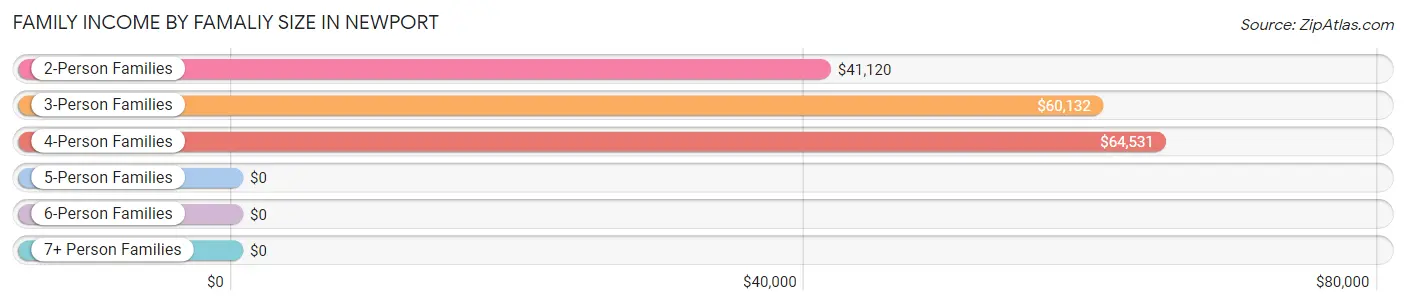
| Income Bracket | # Families | Median Income |
| 2-Person Families | 902 (63.7%) | $41,120 |
| 3-Person Families | 150 (10.6%) | $60,132 |
| 4-Person Families | 265 (18.7%) | $64,531 |
| 5-Person Families | 36 (2.5%) | $0 |
| 6-Person Families | 63 (4.4%) | $0 |
| 7+ Person Families | 0 (0.0%) | $0 |
| Total | 1,416 (100.0%) | $47,586 |
Family Income by Number of Earners in Newport
The median family income in Newport is $47,586, with families comprising 3+ earners (69) having the highest median family income of $110,823, while families with no earners (253) have the lowest median family income of $27,679, accounting for 4.9% and 17.9% of families, respectively.
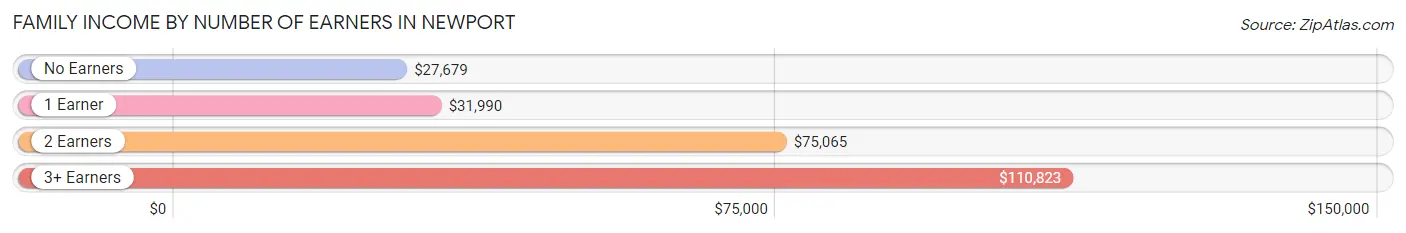
| Number of Earners | # Families | Median Income |
| No Earners | 253 (17.9%) | $27,679 |
| 1 Earner | 532 (37.6%) | $31,990 |
| 2 Earners | 562 (39.7%) | $75,065 |
| 3+ Earners | 69 (4.9%) | $110,823 |
| Total | 1,416 (100.0%) | $47,586 |
Household Income in Newport
Household Income Brackets in Newport
With 593 households falling in the category, the $15,000 to $24,999 income range is the most frequent in Newport, accounting for 22.2% of all households. In contrast, only 43 households (1.6%) fall into the $150,000 to $199,999 income bracket, making it the least populous group.
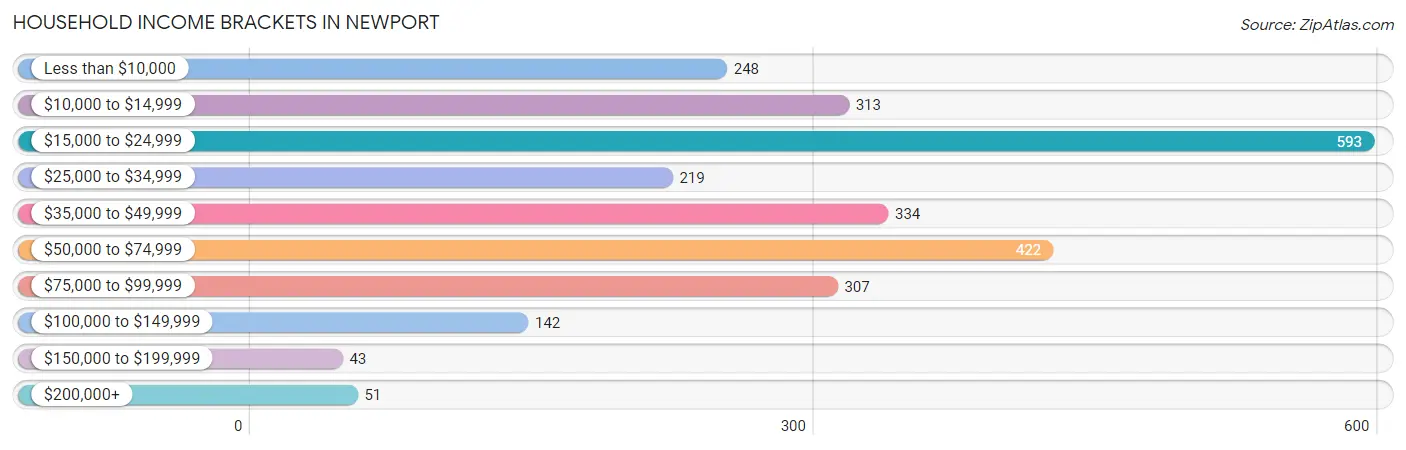
| Income Bracket | # Households | % Households |
| Less than $10,000 | 248 | 9.3% |
| $10,000 to $14,999 | 313 | 11.7% |
| $15,000 to $24,999 | 593 | 22.2% |
| $25,000 to $34,999 | 219 | 8.2% |
| $35,000 to $49,999 | 334 | 12.5% |
| $50,000 to $74,999 | 422 | 15.8% |
| $75,000 to $99,999 | 307 | 11.5% |
| $100,000 to $149,999 | 142 | 5.3% |
| $150,000 to $199,999 | 43 | 1.6% |
| $200,000+ | 51 | 1.9% |
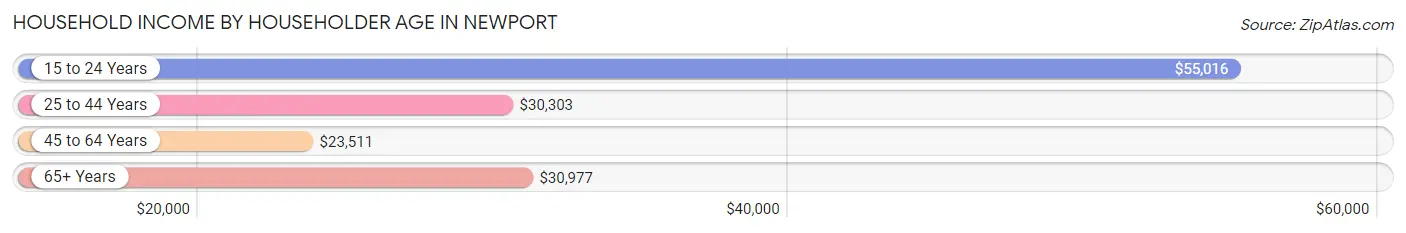
Household Income by Householder Age in Newport
The median household income in Newport is $32,440, with the highest median household income of $55,016 found in the 15 to 24 years age bracket for the primary householder. A total of 297 households (11.1%) fall into this category. Meanwhile, the 45 to 64 years age bracket for the primary householder has the lowest median household income of $23,511, with 803 households (30.1%) in this group.
| Income Bracket | # Households | Median Income |
| 15 to 24 Years | 297 (11.1%) | $55,016 |
| 25 to 44 Years | 770 (28.8%) | $30,303 |
| 45 to 64 Years | 803 (30.1%) | $23,511 |
| 65+ Years | 801 (30.0%) | $30,977 |
| Total | 2,671 (100.0%) | $32,440 |
Poverty in Newport
Income Below Poverty by Sex and Age in Newport
With 20.1% poverty level for males and 29.6% for females among the residents of Newport, 12 to 14 year old males and 15 year old females are the most vulnerable to poverty, with 77 males (43.5%) and 41 females (100.0%) in their respective age groups living below the poverty level.
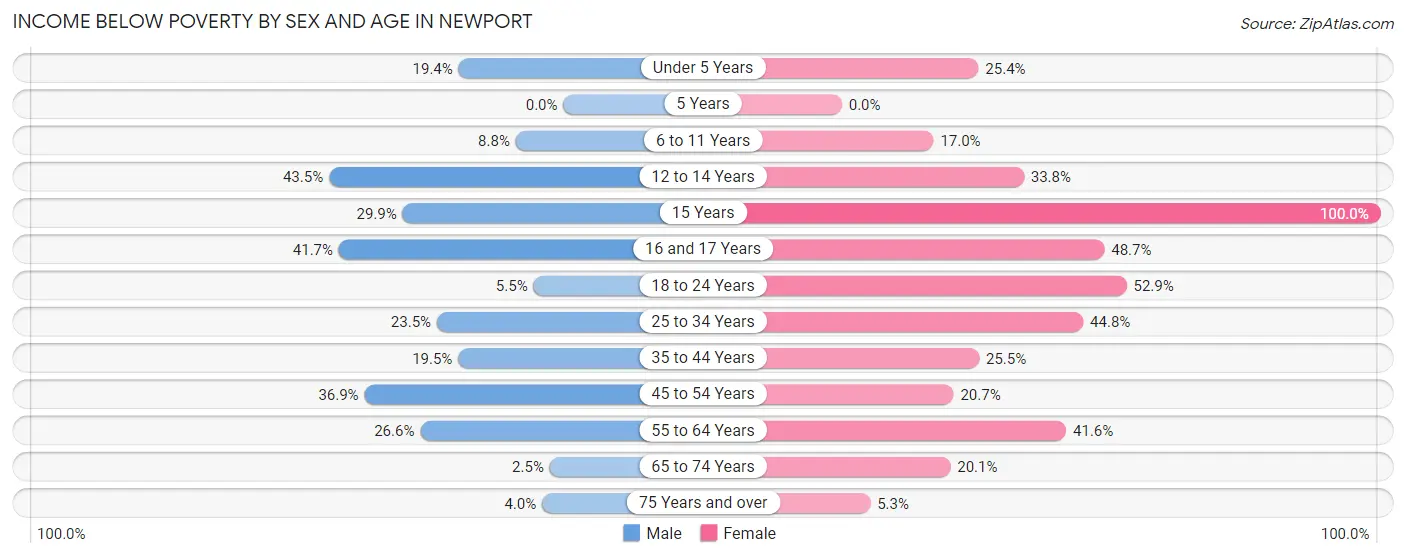
| Age Bracket | Male | Female |
| Under 5 Years | 21 (19.4%) | 35 (25.4%) |
| 5 Years | 0 (0.0%) | 0 (0.0%) |
| 6 to 11 Years | 16 (8.8%) | 33 (17.0%) |
| 12 to 14 Years | 77 (43.5%) | 50 (33.8%) |
| 15 Years | 20 (29.8%) | 41 (100.0%) |
| 16 and 17 Years | 20 (41.7%) | 19 (48.7%) |
| 18 to 24 Years | 18 (5.5%) | 157 (52.9%) |
| 25 to 34 Years | 115 (23.5%) | 112 (44.8%) |
| 35 to 44 Years | 57 (19.5%) | 122 (25.5%) |
| 45 to 54 Years | 120 (36.9%) | 57 (20.7%) |
| 55 to 64 Years | 68 (26.6%) | 147 (41.6%) |
| 65 to 74 Years | 5 (2.5%) | 88 (20.1%) |
| 75 Years and over | 10 (4.0%) | 16 (5.3%) |
| Total | 547 (20.1%) | 877 (29.6%) |
Income Above Poverty by Sex and Age in Newport
According to the poverty statistics in Newport, males aged 65 to 74 years and females aged 5 years are the age groups that are most secure financially, with 97.5% of males and 100.0% of females in these age groups living above the poverty line.
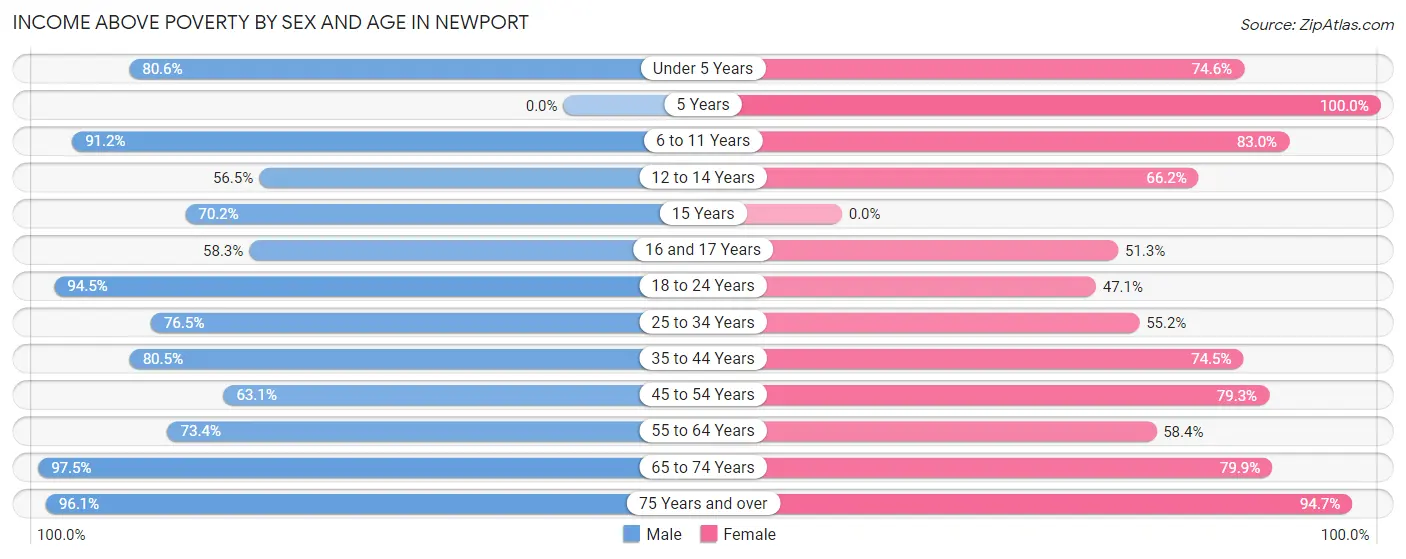
| Age Bracket | Male | Female |
| Under 5 Years | 87 (80.6%) | 103 (74.6%) |
| 5 Years | 0 (0.0%) | 13 (100.0%) |
| 6 to 11 Years | 165 (91.2%) | 161 (83.0%) |
| 12 to 14 Years | 100 (56.5%) | 98 (66.2%) |
| 15 Years | 47 (70.2%) | 0 (0.0%) |
| 16 and 17 Years | 28 (58.3%) | 20 (51.3%) |
| 18 to 24 Years | 307 (94.5%) | 140 (47.1%) |
| 25 to 34 Years | 375 (76.5%) | 138 (55.2%) |
| 35 to 44 Years | 235 (80.5%) | 357 (74.5%) |
| 45 to 54 Years | 205 (63.1%) | 218 (79.3%) |
| 55 to 64 Years | 188 (73.4%) | 206 (58.4%) |
| 65 to 74 Years | 193 (97.5%) | 349 (79.9%) |
| 75 Years and over | 243 (96.1%) | 287 (94.7%) |
| Total | 2,173 (79.9%) | 2,090 (70.4%) |
Income Below Poverty Among Married-Couple Families in Newport
The poverty statistics for married-couple families in Newport show that 8.7% or 68 of the total 779 families live below the poverty line. Families with no children have the highest poverty rate of 13.2%, comprising of 61 families. On the other hand, families with 3 or 4 children have the lowest poverty rate of 0.0%, which includes 0 families.
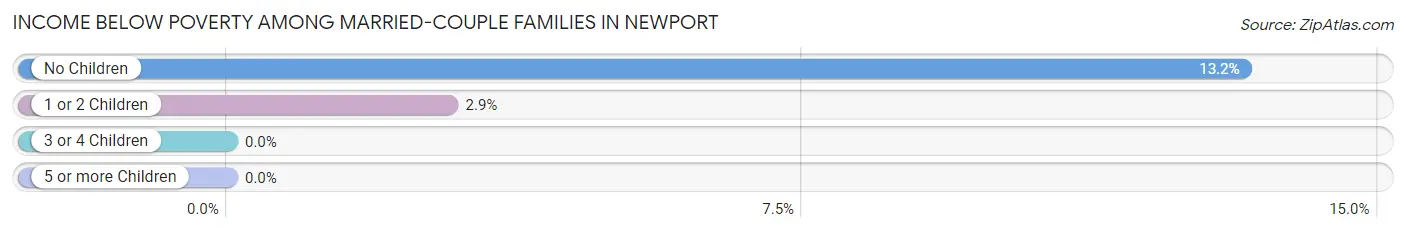
| Children | Above Poverty | Below Poverty |
| No Children | 400 (86.8%) | 61 (13.2%) |
| 1 or 2 Children | 236 (97.1%) | 7 (2.9%) |
| 3 or 4 Children | 75 (100.0%) | 0 (0.0%) |
| 5 or more Children | 0 (0.0%) | 0 (0.0%) |
| Total | 711 (91.3%) | 68 (8.7%) |
Income Below Poverty Among Single-Parent Households in Newport
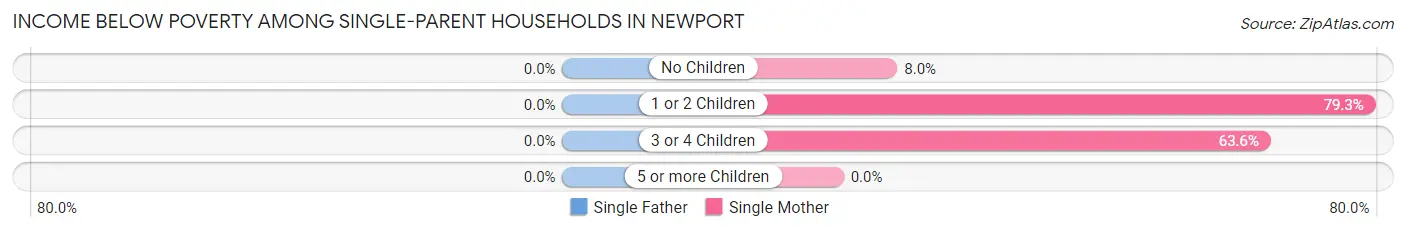
| Children | Single Father | Single Mother |
| No Children | 0 (0.0%) | 14 (8.0%) |
| 1 or 2 Children | 0 (0.0%) | 195 (79.3%) |
| 3 or 4 Children | 0 (0.0%) | 21 (63.6%) |
| 5 or more Children | 0 (0.0%) | 0 (0.0%) |
| Total | 0 (0.0%) | 230 (50.7%) |
Income Below Poverty Among Married-Couple vs Single-Parent Households in Newport
The poverty data for Newport shows that 68 of the married-couple family households (8.7%) and 230 of the single-parent households (36.1%) are living below the poverty level. Within the married-couple family households, those with no children have the highest poverty rate, with 61 households (13.2%) falling below the poverty line. Among the single-parent households, those with 1 or 2 children have the highest poverty rate, with 195 household (74.7%) living below poverty.
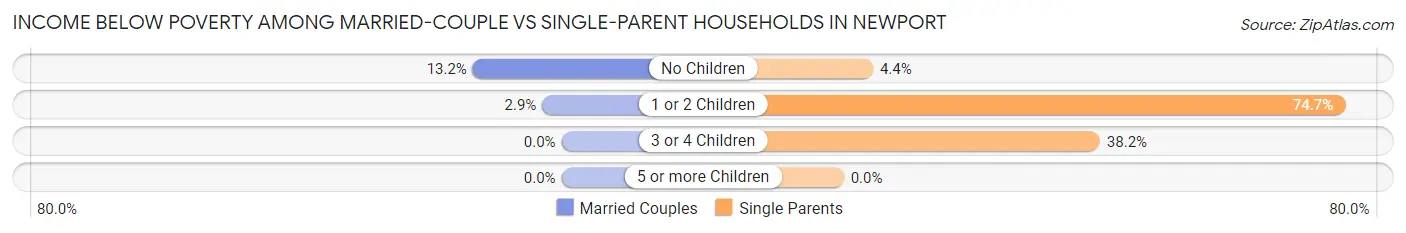
| Children | Married-Couple Families | Single-Parent Households |
| No Children | 61 (13.2%) | 14 (4.4%) |
| 1 or 2 Children | 7 (2.9%) | 195 (74.7%) |
| 3 or 4 Children | 0 (0.0%) | 21 (38.2%) |
| 5 or more Children | 0 (0.0%) | 0 (0.0%) |
| Total | 68 (8.7%) | 230 (36.1%) |
Race in Newport
The most populous races in Newport are White / Caucasian (5,188 | 65.0%), Black / African American (1,653 | 20.7%), and Two or more Races (1,054 | 13.2%).
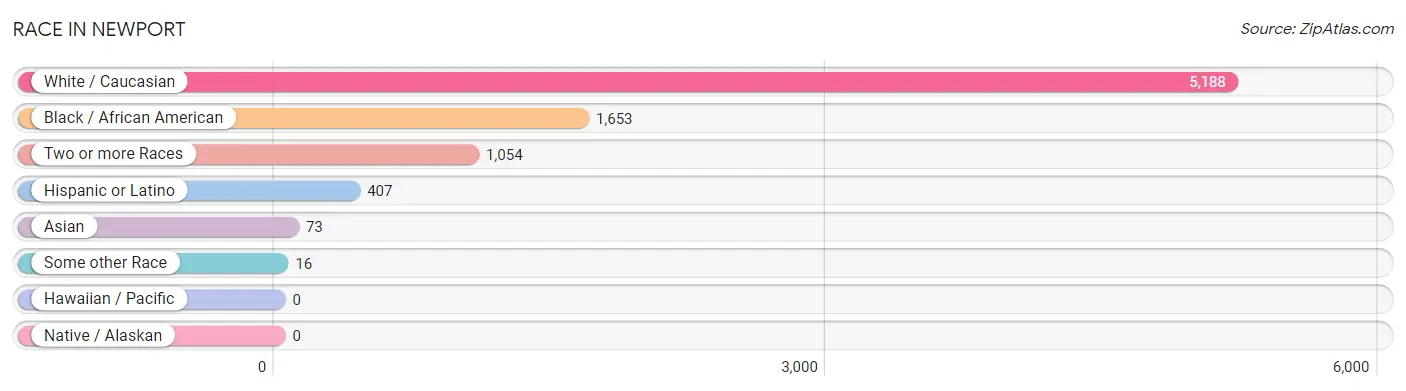
| Race | # Population | % Population |
| Asian | 73 | 0.9% |
| Black / African American | 1,653 | 20.7% |
| Hawaiian / Pacific | 0 | 0.0% |
| Hispanic or Latino | 407 | 5.1% |
| Native / Alaskan | 0 | 0.0% |
| White / Caucasian | 5,188 | 65.0% |
| Two or more Races | 1,054 | 13.2% |
| Some other Race | 16 | 0.2% |
| Total | 7,984 | 100.0% |
Ancestry in Newport
The most populous ancestries reported in Newport are American (961 | 12.0%), German (867 | 10.9%), Irish (739 | 9.3%), English (566 | 7.1%), and Mexican (298 | 3.7%), together accounting for 43.0% of all Newport residents.
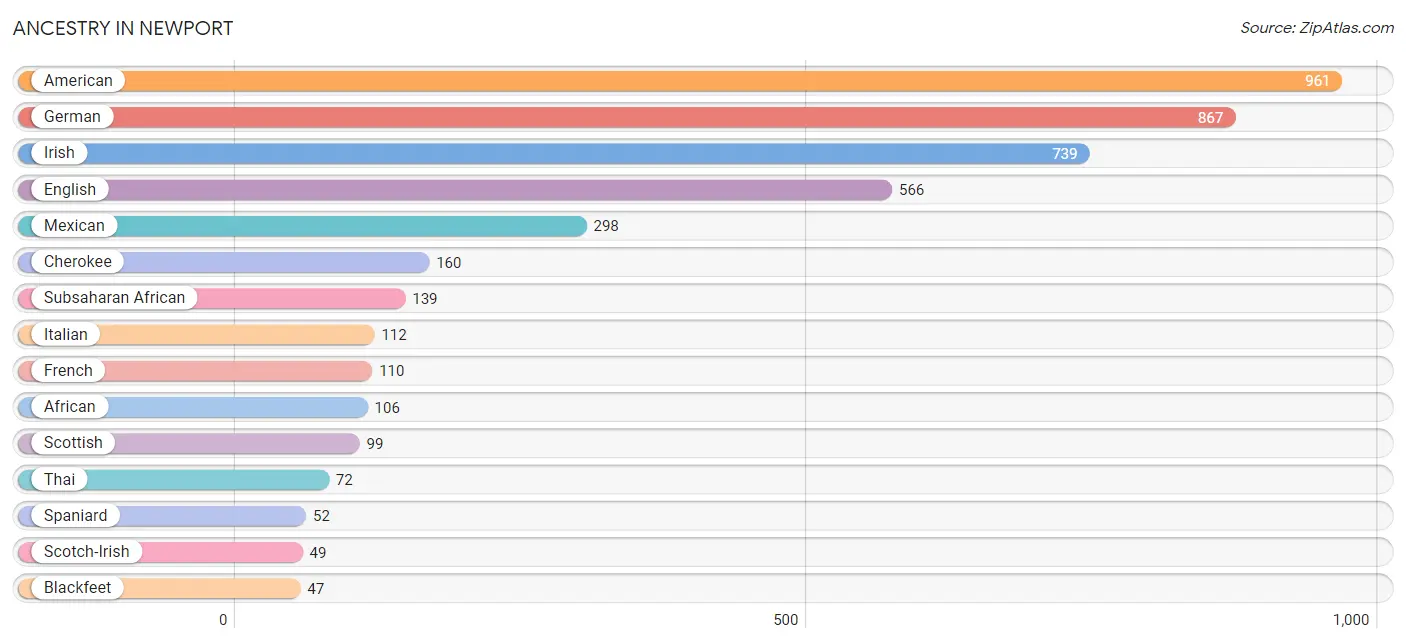
| Ancestry | # Population | % Population |
| African | 106 | 1.3% |
| American | 961 | 12.0% |
| Blackfeet | 47 | 0.6% |
| British | 25 | 0.3% |
| Burmese | 34 | 0.4% |
| Celtic | 9 | 0.1% |
| Central American | 46 | 0.6% |
| Cherokee | 160 | 2.0% |
| Costa Rican | 16 | 0.2% |
| Czech | 35 | 0.4% |
| Czechoslovakian | 7 | 0.1% |
| Dutch | 24 | 0.3% |
| English | 566 | 7.1% |
| European | 18 | 0.2% |
| French | 110 | 1.4% |
| German | 867 | 10.9% |
| Irish | 739 | 9.3% |
| Italian | 112 | 1.4% |
| Jamaican | 45 | 0.6% |
| Mexican | 298 | 3.7% |
| Norwegian | 21 | 0.3% |
| Osage | 39 | 0.5% |
| Pakistani | 47 | 0.6% |
| Polish | 16 | 0.2% |
| Russian | 8 | 0.1% |
| Salvadoran | 30 | 0.4% |
| Scandinavian | 13 | 0.2% |
| Scotch-Irish | 49 | 0.6% |
| Scottish | 99 | 1.2% |
| South African | 33 | 0.4% |
| Spaniard | 52 | 0.6% |
| Spanish | 10 | 0.1% |
| Subsaharan African | 139 | 1.7% |
| Swedish | 26 | 0.3% |
| Thai | 72 | 0.9% |
| Welsh | 9 | 0.1% | View All 36 Rows |
Immigrants in Newport
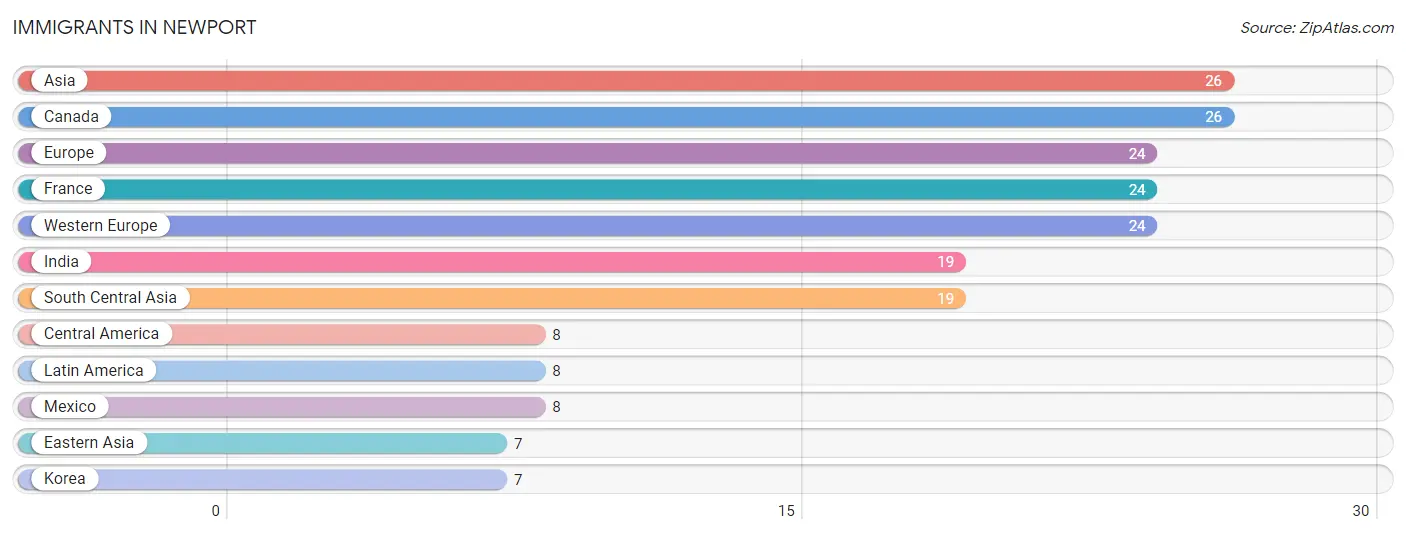
The most numerous immigrant groups reported in Newport came from Asia (26 | 0.3%), Canada (26 | 0.3%), Europe (24 | 0.3%), France (24 | 0.3%), and Western Europe (24 | 0.3%), together accounting for 1.6% of all Newport residents.
| Immigration Origin | # Population | % Population |
| Asia | 26 | 0.3% |
| Canada | 26 | 0.3% |
| Central America | 8 | 0.1% |
| Eastern Asia | 7 | 0.1% |
| Europe | 24 | 0.3% |
| France | 24 | 0.3% |
| India | 19 | 0.2% |
| Korea | 7 | 0.1% |
| Latin America | 8 | 0.1% |
| Mexico | 8 | 0.1% |
| South Central Asia | 19 | 0.2% |
| Western Europe | 24 | 0.3% | View All 12 Rows |
Sex and Age in Newport
Sex and Age in Newport
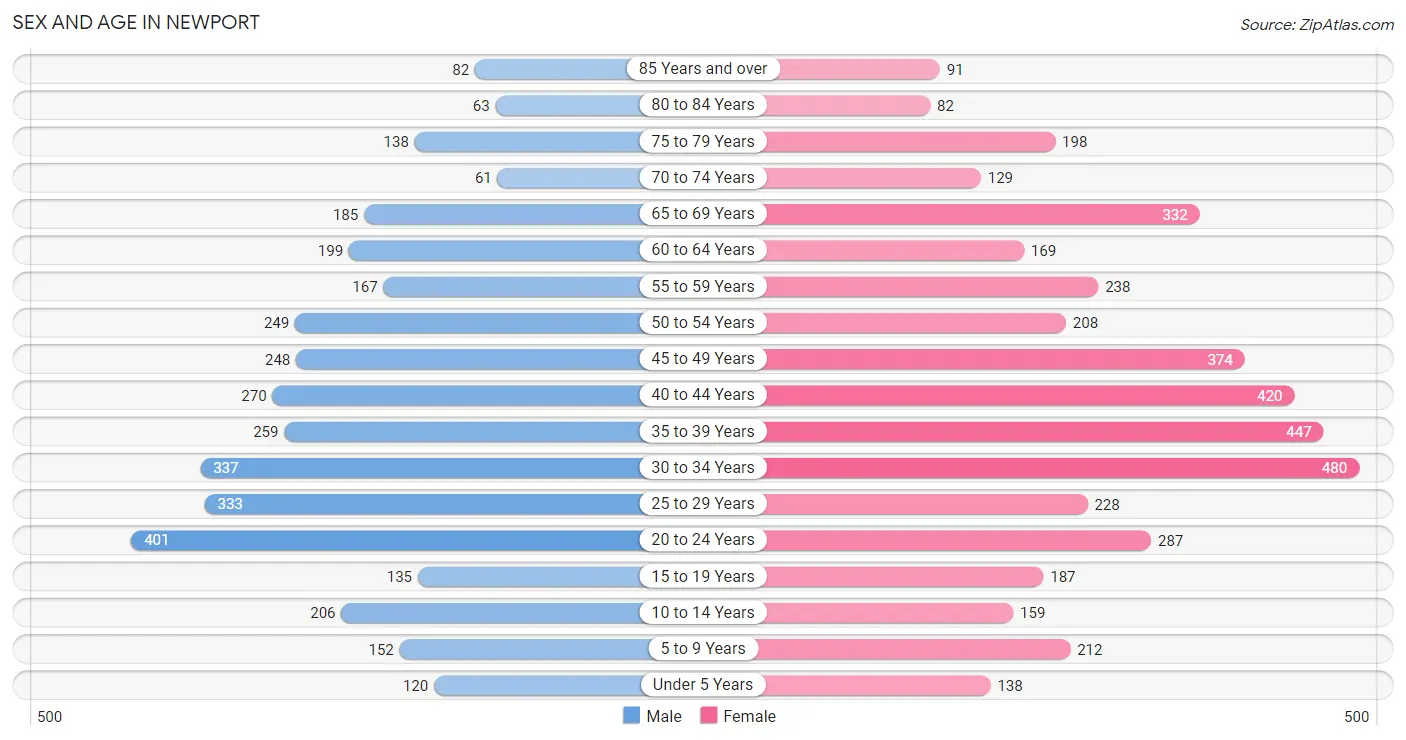
The most populous age groups in Newport are 20 to 24 Years (401 | 11.1%) for men and 30 to 34 Years (480 | 11.0%) for women.
| Age Bracket | Male | Female |
| Under 5 Years | 120 (3.3%) | 138 (3.2%) |
| 5 to 9 Years | 152 (4.2%) | 212 (4.8%) |
| 10 to 14 Years | 206 (5.7%) | 159 (3.6%) |
| 15 to 19 Years | 135 (3.7%) | 187 (4.3%) |
| 20 to 24 Years | 401 (11.1%) | 287 (6.6%) |
| 25 to 29 Years | 333 (9.2%) | 228 (5.2%) |
| 30 to 34 Years | 337 (9.3%) | 480 (11.0%) |
| 35 to 39 Years | 259 (7.2%) | 447 (10.2%) |
| 40 to 44 Years | 270 (7.5%) | 420 (9.6%) |
| 45 to 49 Years | 248 (6.9%) | 374 (8.5%) |
| 50 to 54 Years | 249 (6.9%) | 208 (4.8%) |
| 55 to 59 Years | 167 (4.6%) | 238 (5.4%) |
| 60 to 64 Years | 199 (5.5%) | 169 (3.9%) |
| 65 to 69 Years | 185 (5.1%) | 332 (7.6%) |
| 70 to 74 Years | 61 (1.7%) | 129 (2.9%) |
| 75 to 79 Years | 138 (3.8%) | 198 (4.5%) |
| 80 to 84 Years | 63 (1.8%) | 82 (1.9%) |
| 85 Years and over | 82 (2.3%) | 91 (2.1%) |
| Total | 3,605 (100.0%) | 4,379 (100.0%) |
Families and Households in Newport
Median Family Size in Newport
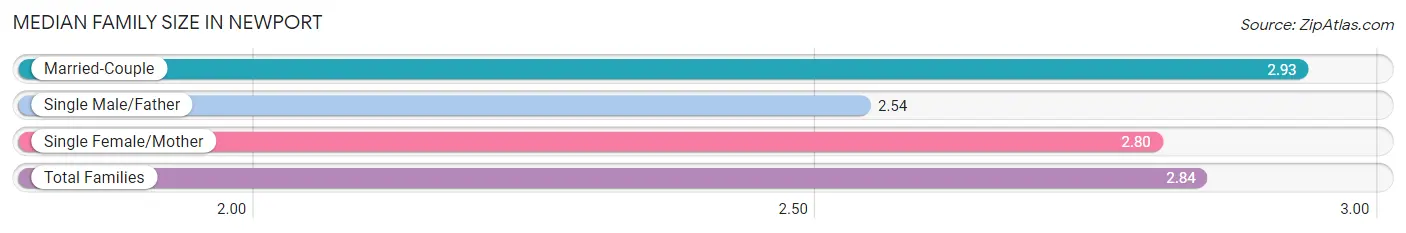
The median family size in Newport is 2.84 persons per family, with married-couple families (779 | 55.0%) accounting for the largest median family size of 2.93 persons per family. On the other hand, single male/father families (183 | 12.9%) represent the smallest median family size with 2.54 persons per family.
| Family Type | # Families | Family Size |
| Married-Couple | 779 (55.0%) | 2.93 |
| Single Male/Father | 183 (12.9%) | 2.54 |
| Single Female/Mother | 454 (32.1%) | 2.80 |
| Total Families | 1,416 (100.0%) | 2.84 |
Median Household Size in Newport
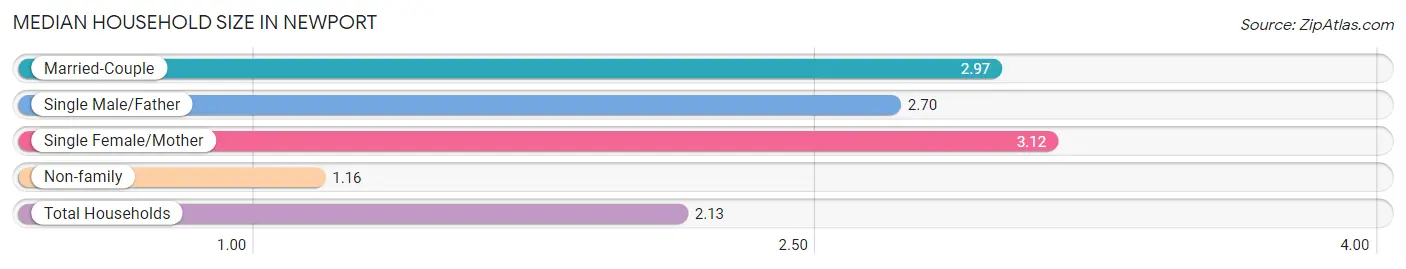
The median household size in Newport is 2.13 persons per household, with single female/mother households (454 | 17.0%) accounting for the largest median household size of 3.12 persons per household. non-family households (1,255 | 47.0%) represent the smallest median household size with 1.16 persons per household.
| Household Type | # Households | Household Size |
| Married-Couple | 779 (29.2%) | 2.97 |
| Single Male/Father | 183 (6.9%) | 2.70 |
| Single Female/Mother | 454 (17.0%) | 3.12 |
| Non-family | 1,255 (47.0%) | 1.16 |
| Total Households | 2,671 (100.0%) | 2.13 |
Household Size by Marriage Status in Newport
Out of a total of 2,671 households in Newport, 1,416 (53.0%) are family households, while 1,255 (47.0%) are nonfamily households. The most numerous type of family households are 2-person households, comprising 763, and the most common type of nonfamily households are 1-person households, comprising 1,093.
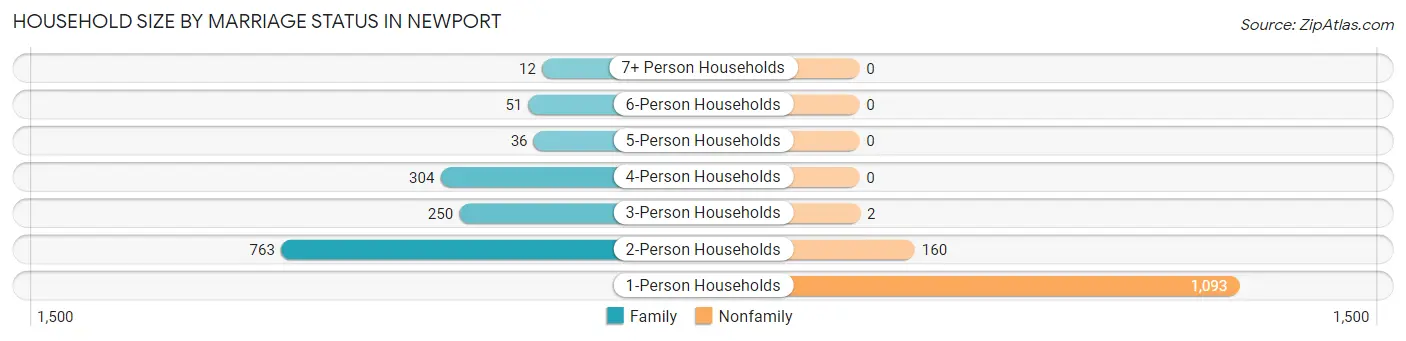
| Household Size | Family Households | Nonfamily Households |
| 1-Person Households | - | 1,093 (40.9%) |
| 2-Person Households | 763 (28.6%) | 160 (6.0%) |
| 3-Person Households | 250 (9.4%) | 2 (0.1%) |
| 4-Person Households | 304 (11.4%) | 0 (0.0%) |
| 5-Person Households | 36 (1.3%) | 0 (0.0%) |
| 6-Person Households | 51 (1.9%) | 0 (0.0%) |
| 7+ Person Households | 12 (0.4%) | 0 (0.0%) |
| Total | 1,416 (53.0%) | 1,255 (47.0%) |
Female Fertility in Newport
Fertility by Age in Newport
Average fertility rate in Newport is 55.0 births per 1,000 women. Women in the age bracket of 15 to 19 years have the highest fertility rate with 283.0 births per 1,000 women. Women in the age bracket of 20 to 34 years acount for 58.4% of all women with births.
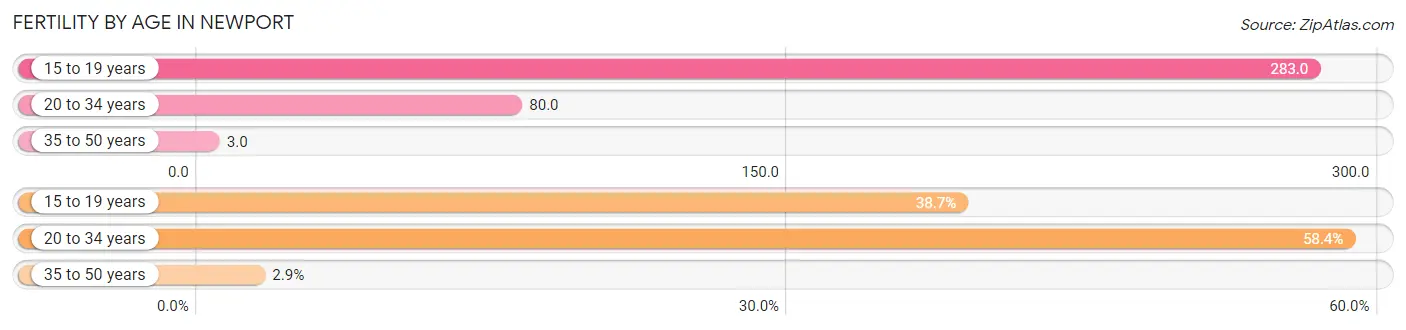
| Age Bracket | Women with Births | Births / 1,000 Women |
| 15 to 19 years | 53 (38.7%) | 283.0 |
| 20 to 34 years | 80 (58.4%) | 80.0 |
| 35 to 50 years | 4 (2.9%) | 3.0 |
| Total | 137 (100.0%) | 55.0 |
Fertility by Age by Marriage Status in Newport
33.6% of women with births (137) in Newport are married. The highest percentage of unmarried women with births falls into 20 to 34 years age bracket with 68.8% of them unmarried at the time of birth, while the lowest percentage of unmarried women with births belong to 35 to 50 years age bracket with 0.0% of them unmarried.
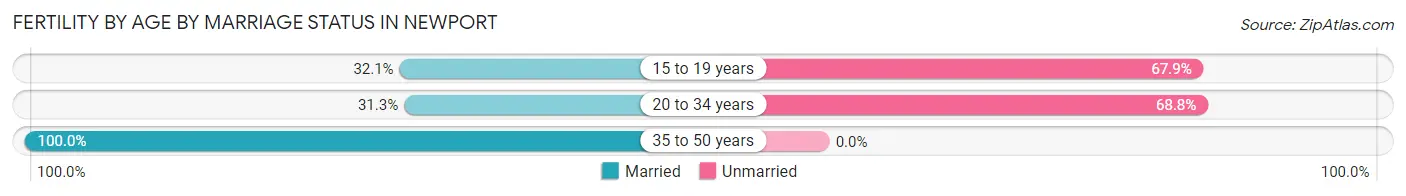
| Age Bracket | Married | Unmarried |
| 15 to 19 years | 17 (32.1%) | 36 (67.9%) |
| 20 to 34 years | 25 (31.2%) | 55 (68.8%) |
| 35 to 50 years | 4 (100.0%) | 0 (0.0%) |
| Total | 46 (33.6%) | 91 (66.4%) |
Fertility by Education in Newport
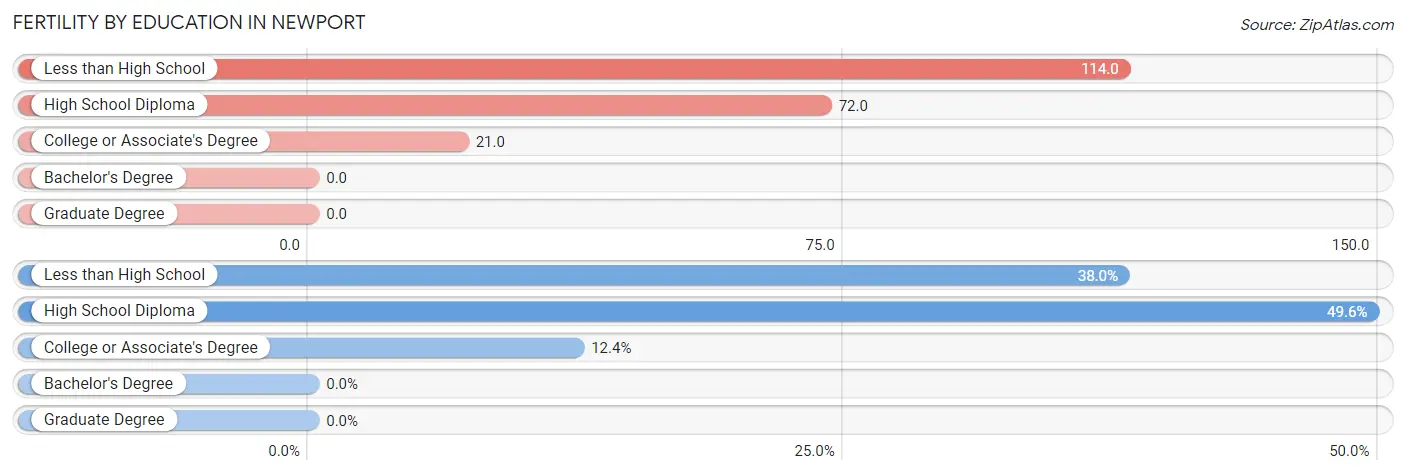
| Educational Attainment | Women with Births | Births / 1,000 Women |
| Less than High School | 52 (38.0%) | 114.0 |
| High School Diploma | 68 (49.6%) | 72.0 |
| College or Associate's Degree | 17 (12.4%) | 21.0 |
| Bachelor's Degree | 0 (0.0%) | 0.0 |
| Graduate Degree | 0 (0.0%) | 0.0 |
| Total | 137 (100.0%) | 55.0 |
Fertility by Education by Marriage Status in Newport
66.4% of women with births in Newport are unmarried. Women with the educational attainment of college or associate's degree are most likely to be married with 100.0% of them married at childbirth, while women with the educational attainment of less than high school are least likely to be married with 76.9% of them unmarried at childbirth.
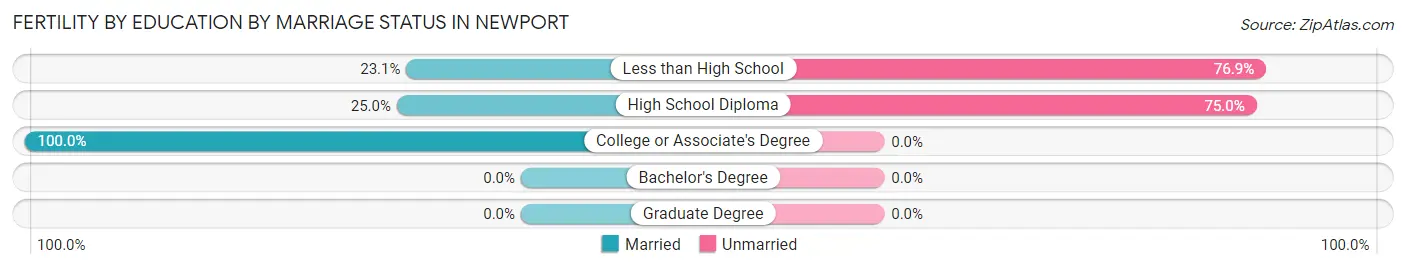
| Educational Attainment | Married | Unmarried |
| Less than High School | 12 (23.1%) | 40 (76.9%) |
| High School Diploma | 17 (25.0%) | 51 (75.0%) |
| College or Associate's Degree | 17 (100.0%) | 0 (0.0%) |
| Bachelor's Degree | 0 (0.0%) | 0 (0.0%) |
| Graduate Degree | 0 (0.0%) | 0 (0.0%) |
| Total | 46 (33.6%) | 91 (66.4%) |
Employment Characteristics in Newport
Employment by Class of Employer in Newport
Among the 2,315 employed individuals in Newport, private company employees (1,425 | 61.6%), state government employees (220 | 9.5%), and local government employees (187 | 8.1%) make up the most common classes of employment.
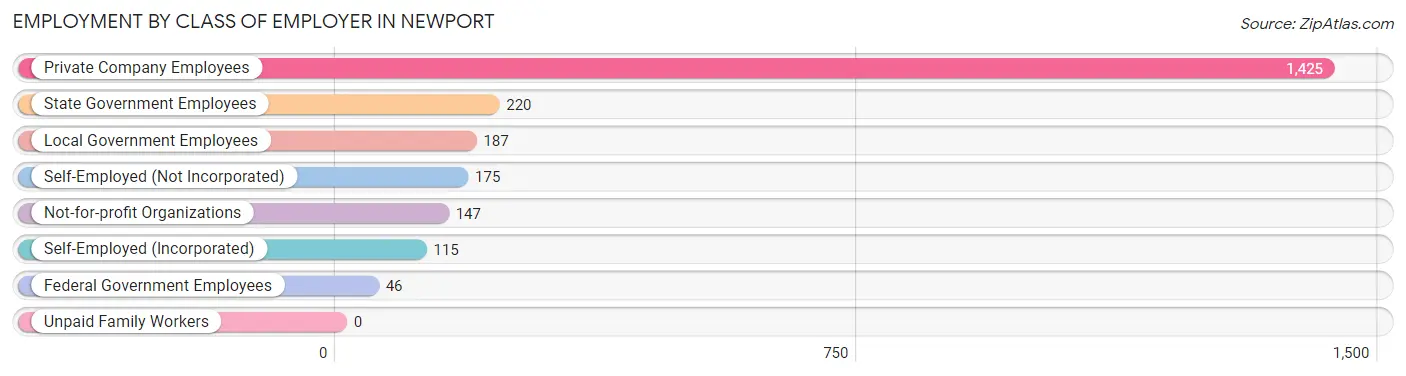
| Employer Class | # Employees | % Employees |
| Private Company Employees | 1,425 | 61.6% |
| Self-Employed (Incorporated) | 115 | 5.0% |
| Self-Employed (Not Incorporated) | 175 | 7.6% |
| Not-for-profit Organizations | 147 | 6.4% |
| Local Government Employees | 187 | 8.1% |
| State Government Employees | 220 | 9.5% |
| Federal Government Employees | 46 | 2.0% |
| Unpaid Family Workers | 0 | 0.0% |
| Total | 2,315 | 100.0% |
Employment Status by Age in Newport
According to the labor force statistics for Newport, out of the total population over 16 years of age (6,889), 39.4% or 2,714 individuals are in the labor force, with 13.1% or 356 of them unemployed. The age group with the highest labor force participation rate is 25 to 29 years, with 65.1% or 365 individuals in the labor force. Within the labor force, the 35 to 44 years age range has the highest percentage of unemployed individuals, with 27.9% or 181 of them being unemployed.
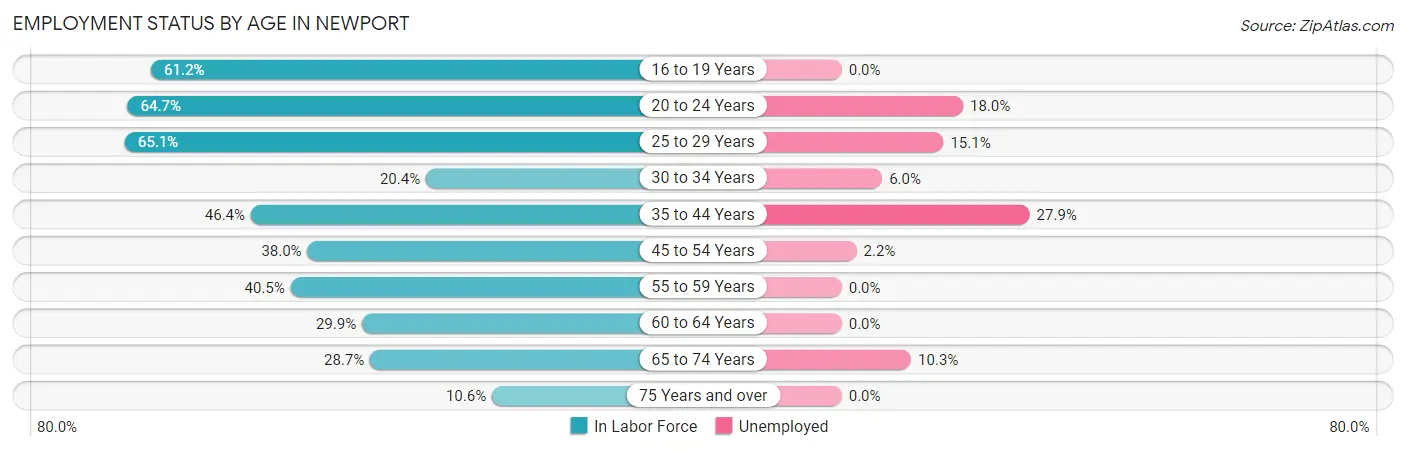
| Age Bracket | In Labor Force | Unemployed |
| 16 to 19 Years | 131 (61.2%) | 0 (0.0%) |
| 20 to 24 Years | 445 (64.7%) | 80 (18.0%) |
| 25 to 29 Years | 365 (65.1%) | 55 (15.1%) |
| 30 to 34 Years | 167 (20.4%) | 10 (6.0%) |
| 35 to 44 Years | 648 (46.4%) | 181 (27.9%) |
| 45 to 54 Years | 410 (38.0%) | 9 (2.2%) |
| 55 to 59 Years | 164 (40.5%) | 0 (0.0%) |
| 60 to 64 Years | 110 (29.9%) | 0 (0.0%) |
| 65 to 74 Years | 203 (28.7%) | 21 (10.3%) |
| 75 Years and over | 69 (10.6%) | 0 (0.0%) |
| Total | 2,714 (39.4%) | 356 (13.1%) |
Employment Status by Educational Attainment in Newport
According to labor force statistics for Newport, 40.3% of individuals (1,864) out of the total population between 25 and 64 years of age (4,626) are in the labor force, with 13.7% or 255 of them being unemployed. The group with the highest labor force participation rate are those with the educational attainment of bachelor's degree or higher, with 76.1% or 353 individuals in the labor force. Within the labor force, individuals with college / associate degree education have the highest percentage of unemployment, with 18.7% or 156 of them being unemployed.
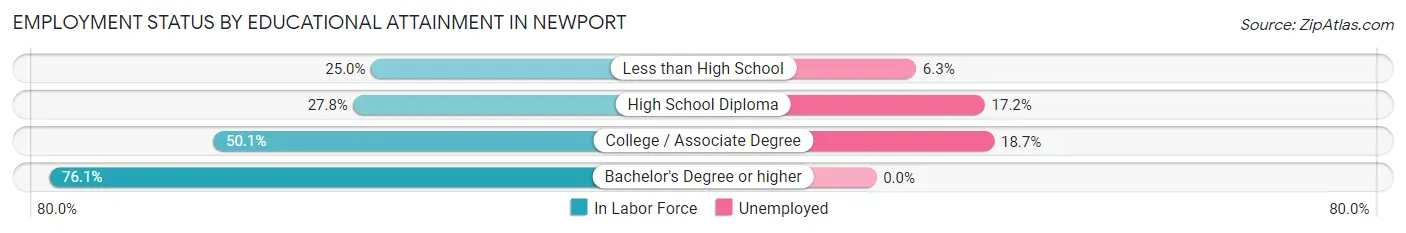
| Educational Attainment | In Labor Force | Unemployed |
| Less than High School | 158 (25.0%) | 40 (6.3%) |
| High School Diploma | 518 (27.8%) | 320 (17.2%) |
| College / Associate Degree | 835 (50.1%) | 312 (18.7%) |
| Bachelor's Degree or higher | 353 (76.1%) | 0 (0.0%) |
| Total | 1,864 (40.3%) | 634 (13.7%) |
Employment Occupations by Sex in Newport
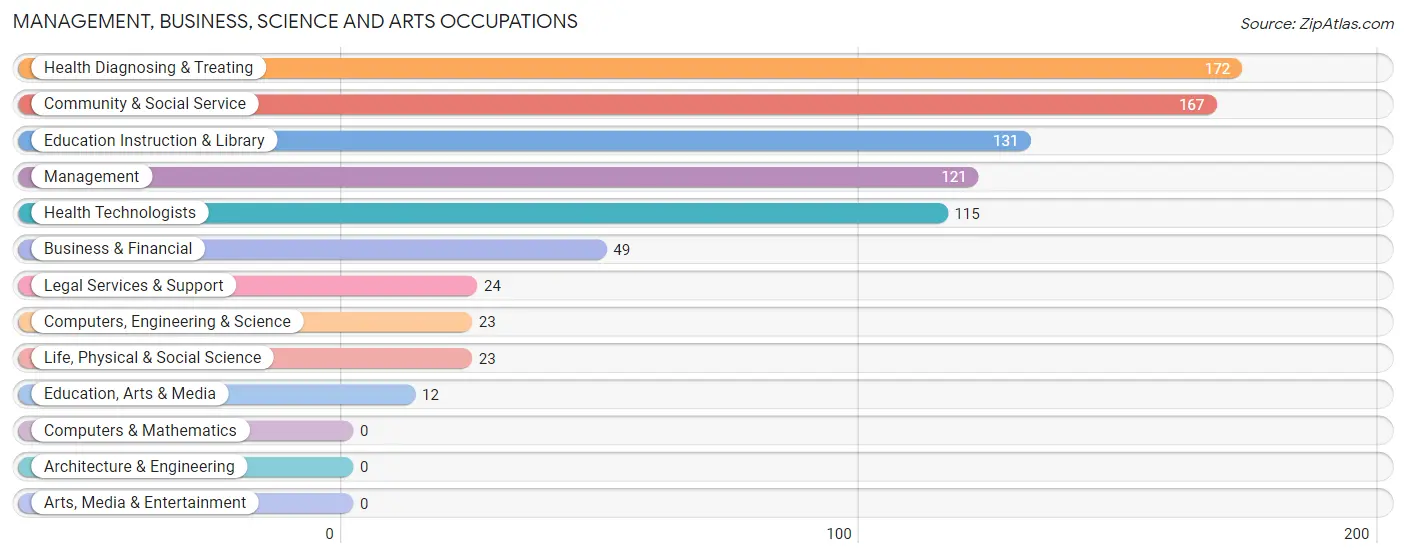
Management, Business, Science and Arts Occupations
The most common Management, Business, Science and Arts occupations in Newport are Health Diagnosing & Treating (172 | 7.3%), Community & Social Service (167 | 7.1%), Education Instruction & Library (131 | 5.6%), Management (121 | 5.1%), and Health Technologists (115 | 4.9%).
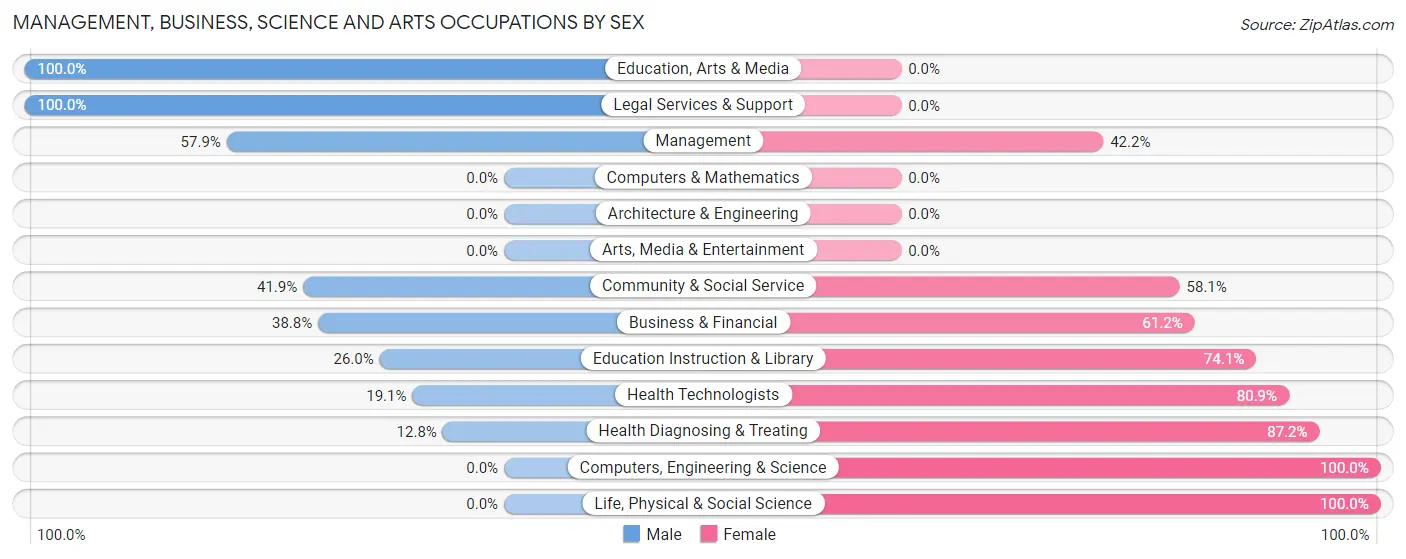
Management, Business, Science and Arts Occupations by Sex
Within the Management, Business, Science and Arts occupations in Newport, the most male-oriented occupations are Education, Arts & Media (100.0%), Legal Services & Support (100.0%), and Management (57.9%), while the most female-oriented occupations are Computers, Engineering & Science (100.0%), Life, Physical & Social Science (100.0%), and Health Diagnosing & Treating (87.2%).
| Occupation | Male | Female |
| Management | 70 (57.9%) | 51 (42.1%) |
| Business & Financial | 19 (38.8%) | 30 (61.2%) |
| Computers, Engineering & Science | 0 (0.0%) | 23 (100.0%) |
| Computers & Mathematics | 0 (0.0%) | 0 (0.0%) |
| Architecture & Engineering | 0 (0.0%) | 0 (0.0%) |
| Life, Physical & Social Science | 0 (0.0%) | 23 (100.0%) |
| Community & Social Service | 70 (41.9%) | 97 (58.1%) |
| Education, Arts & Media | 12 (100.0%) | 0 (0.0%) |
| Legal Services & Support | 24 (100.0%) | 0 (0.0%) |
| Education Instruction & Library | 34 (26.0%) | 97 (74.1%) |
| Arts, Media & Entertainment | 0 (0.0%) | 0 (0.0%) |
| Health Diagnosing & Treating | 22 (12.8%) | 150 (87.2%) |
| Health Technologists | 22 (19.1%) | 93 (80.9%) |
| Total (Category) | 181 (34.0%) | 351 (66.0%) |
| Total (Overall) | 1,334 (56.6%) | 1,022 (43.4%) |
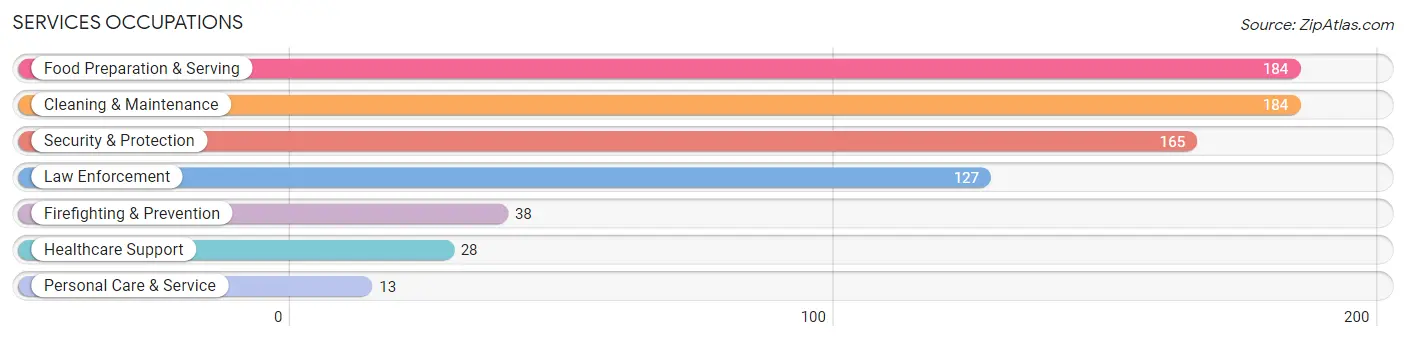
Services Occupations
The most common Services occupations in Newport are Food Preparation & Serving (184 | 7.8%), Cleaning & Maintenance (184 | 7.8%), Security & Protection (165 | 7.0%), Law Enforcement (127 | 5.4%), and Firefighting & Prevention (38 | 1.6%).
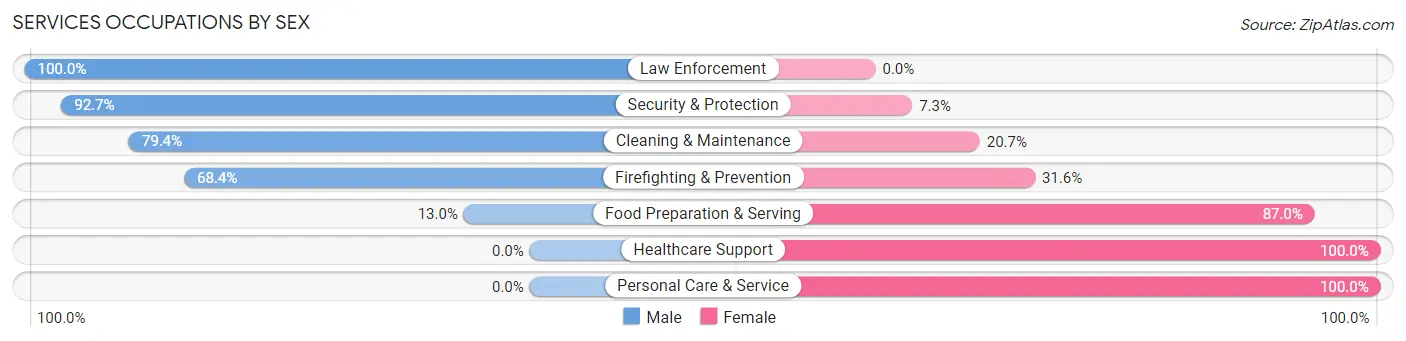
Services Occupations by Sex
Within the Services occupations in Newport, the most male-oriented occupations are Law Enforcement (100.0%), Security & Protection (92.7%), and Cleaning & Maintenance (79.3%), while the most female-oriented occupations are Healthcare Support (100.0%), Personal Care & Service (100.0%), and Food Preparation & Serving (87.0%).
| Occupation | Male | Female |
| Healthcare Support | 0 (0.0%) | 28 (100.0%) |
| Security & Protection | 153 (92.7%) | 12 (7.3%) |
| Firefighting & Prevention | 26 (68.4%) | 12 (31.6%) |
| Law Enforcement | 127 (100.0%) | 0 (0.0%) |
| Food Preparation & Serving | 24 (13.0%) | 160 (87.0%) |
| Cleaning & Maintenance | 146 (79.3%) | 38 (20.6%) |
| Personal Care & Service | 0 (0.0%) | 13 (100.0%) |
| Total (Category) | 323 (56.3%) | 251 (43.7%) |
| Total (Overall) | 1,334 (56.6%) | 1,022 (43.4%) |
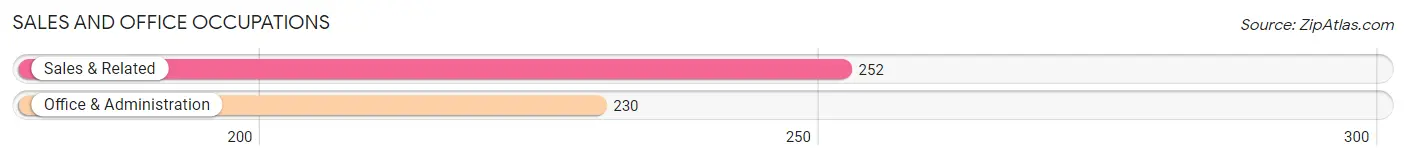
Sales and Office Occupations
The most common Sales and Office occupations in Newport are Sales & Related (252 | 10.7%), and Office & Administration (230 | 9.8%).
Sales and Office Occupations by Sex
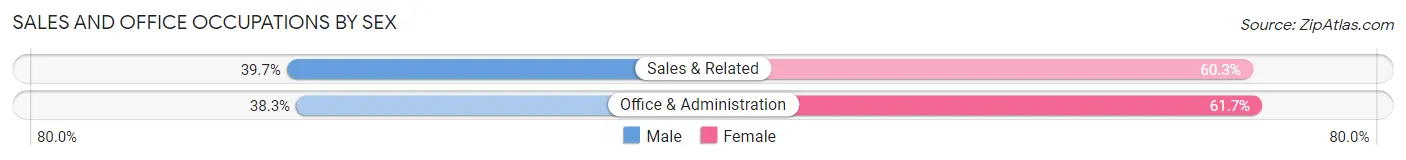
| Occupation | Male | Female |
| Sales & Related | 100 (39.7%) | 152 (60.3%) |
| Office & Administration | 88 (38.3%) | 142 (61.7%) |
| Total (Category) | 188 (39.0%) | 294 (61.0%) |
| Total (Overall) | 1,334 (56.6%) | 1,022 (43.4%) |
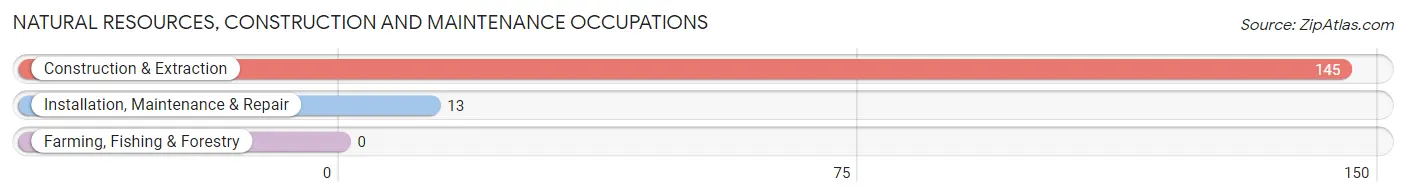
Natural Resources, Construction and Maintenance Occupations
The most common Natural Resources, Construction and Maintenance occupations in Newport are Construction & Extraction (145 | 6.1%), and Installation, Maintenance & Repair (13 | 0.5%).
Natural Resources, Construction and Maintenance Occupations by Sex
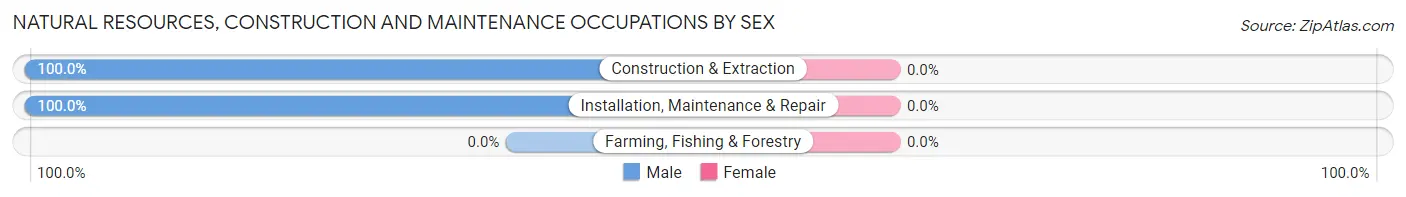
| Occupation | Male | Female |
| Farming, Fishing & Forestry | 0 (0.0%) | 0 (0.0%) |
| Construction & Extraction | 145 (100.0%) | 0 (0.0%) |
| Installation, Maintenance & Repair | 13 (100.0%) | 0 (0.0%) |
| Total (Category) | 158 (100.0%) | 0 (0.0%) |
| Total (Overall) | 1,334 (56.6%) | 1,022 (43.4%) |
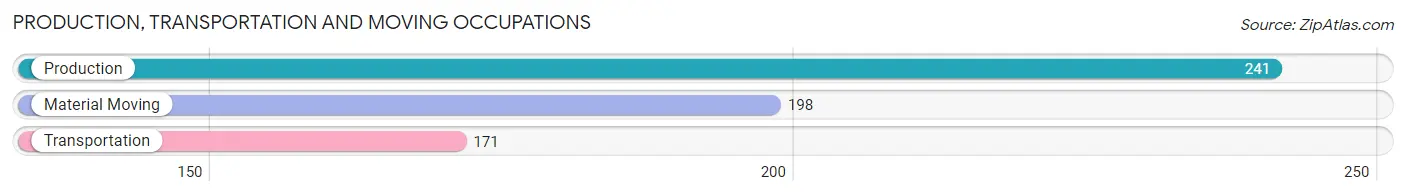
Production, Transportation and Moving Occupations
The most common Production, Transportation and Moving occupations in Newport are Production (241 | 10.2%), Material Moving (198 | 8.4%), and Transportation (171 | 7.3%).
Production, Transportation and Moving Occupations by Sex
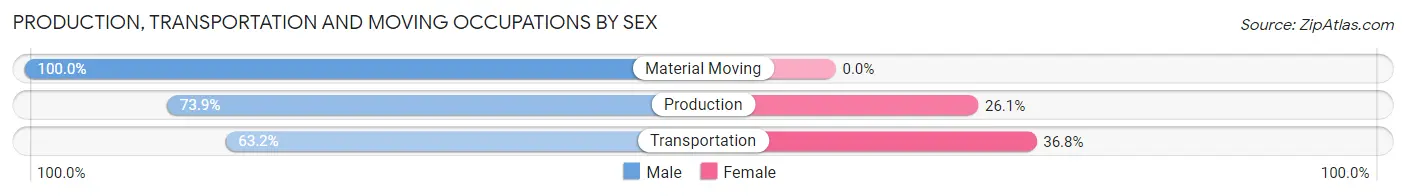
| Occupation | Male | Female |
| Production | 178 (73.9%) | 63 (26.1%) |
| Transportation | 108 (63.2%) | 63 (36.8%) |
| Material Moving | 198 (100.0%) | 0 (0.0%) |
| Total (Category) | 484 (79.3%) | 126 (20.7%) |
| Total (Overall) | 1,334 (56.6%) | 1,022 (43.4%) |
Employment Industries by Sex in Newport
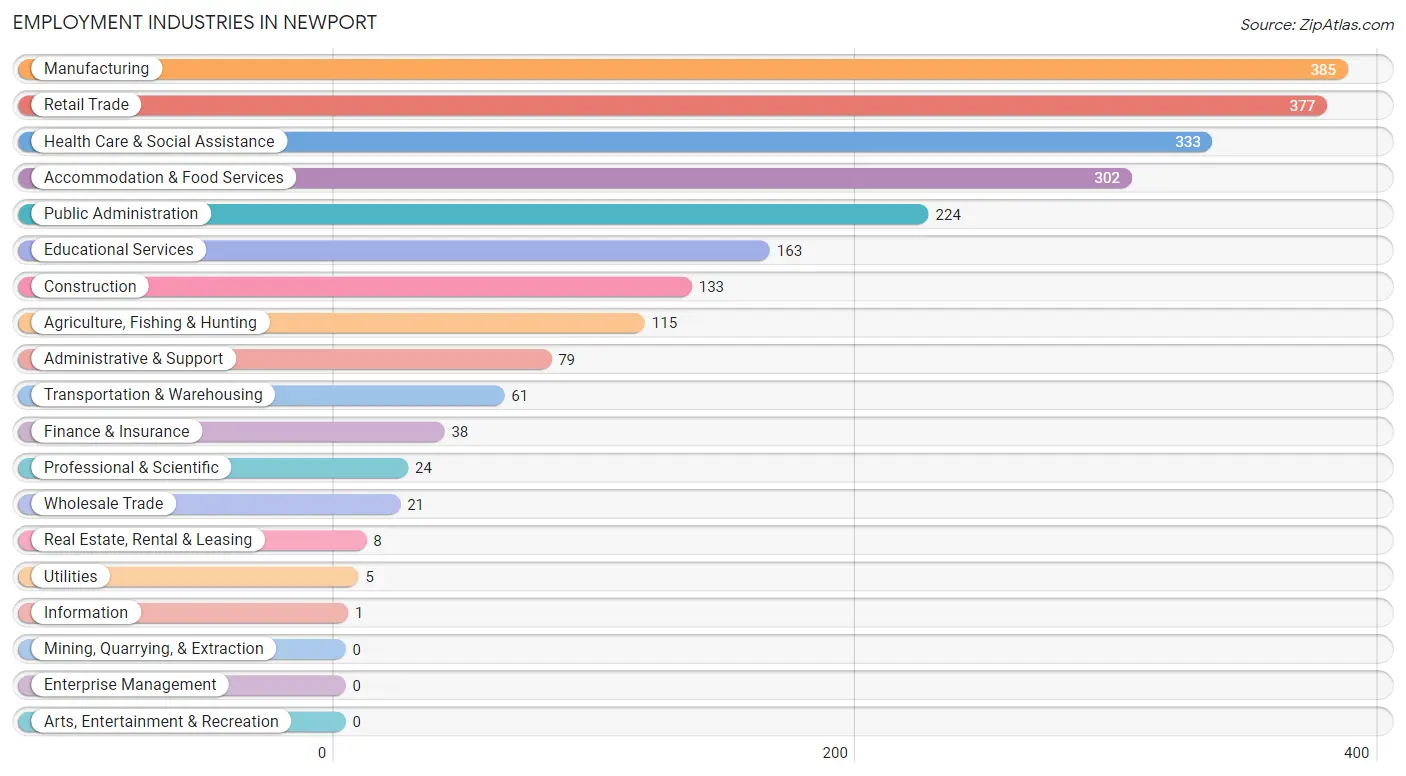
Employment Industries in Newport
The major employment industries in Newport include Manufacturing (385 | 16.3%), Retail Trade (377 | 16.0%), Health Care & Social Assistance (333 | 14.1%), Accommodation & Food Services (302 | 12.8%), and Public Administration (224 | 9.5%).
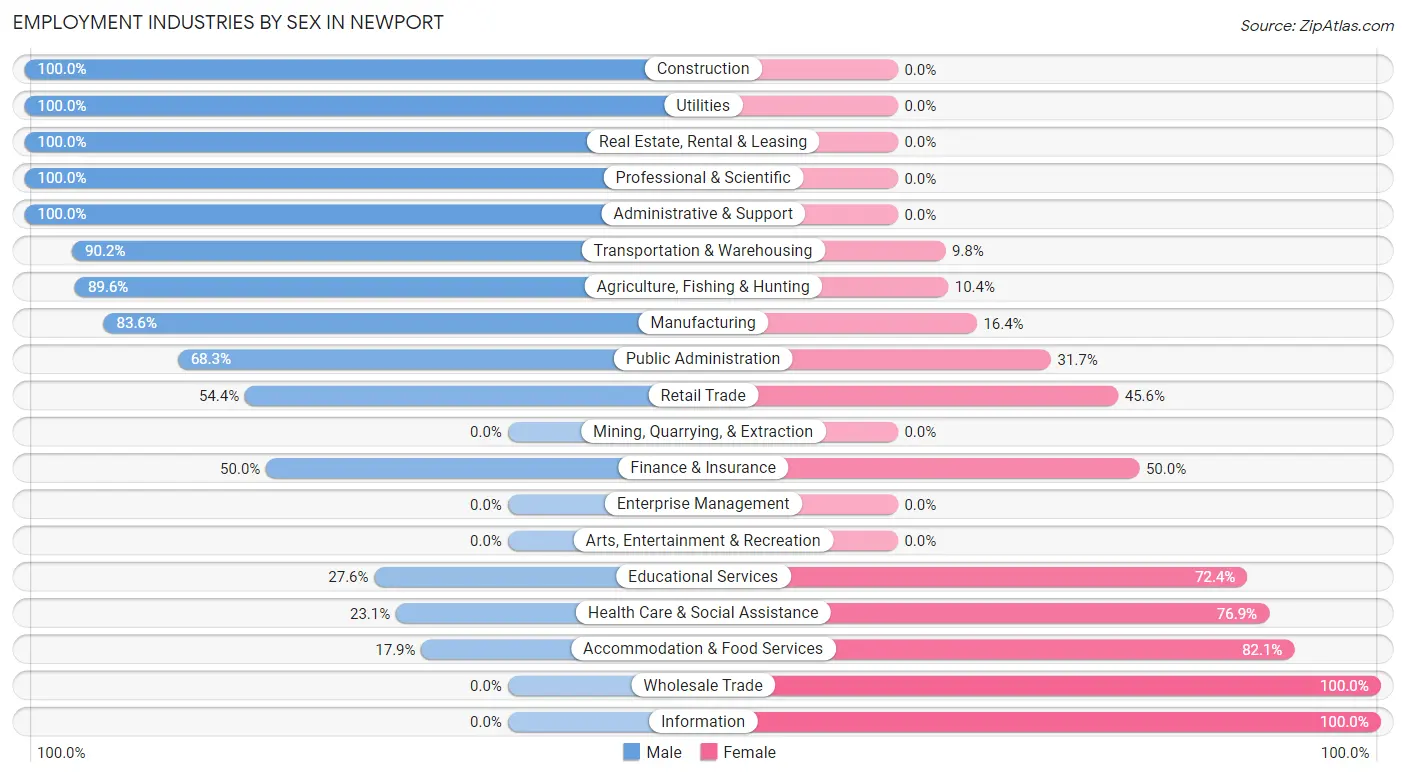
Employment Industries by Sex in Newport
The Newport industries that see more men than women are Construction (100.0%), Utilities (100.0%), and Real Estate, Rental & Leasing (100.0%), whereas the industries that tend to have a higher number of women are Wholesale Trade (100.0%), Information (100.0%), and Accommodation & Food Services (82.1%).
| Industry | Male | Female |
| Agriculture, Fishing & Hunting | 103 (89.6%) | 12 (10.4%) |
| Mining, Quarrying, & Extraction | 0 (0.0%) | 0 (0.0%) |
| Construction | 133 (100.0%) | 0 (0.0%) |
| Manufacturing | 322 (83.6%) | 63 (16.4%) |
| Wholesale Trade | 0 (0.0%) | 21 (100.0%) |
| Retail Trade | 205 (54.4%) | 172 (45.6%) |
| Transportation & Warehousing | 55 (90.2%) | 6 (9.8%) |
| Utilities | 5 (100.0%) | 0 (0.0%) |
| Information | 0 (0.0%) | 1 (100.0%) |
| Finance & Insurance | 19 (50.0%) | 19 (50.0%) |
| Real Estate, Rental & Leasing | 8 (100.0%) | 0 (0.0%) |
| Professional & Scientific | 24 (100.0%) | 0 (0.0%) |
| Enterprise Management | 0 (0.0%) | 0 (0.0%) |
| Administrative & Support | 79 (100.0%) | 0 (0.0%) |
| Educational Services | 45 (27.6%) | 118 (72.4%) |
| Health Care & Social Assistance | 77 (23.1%) | 256 (76.9%) |
| Arts, Entertainment & Recreation | 0 (0.0%) | 0 (0.0%) |
| Accommodation & Food Services | 54 (17.9%) | 248 (82.1%) |
| Public Administration | 153 (68.3%) | 71 (31.7%) |
| Total | 1,334 (56.6%) | 1,022 (43.4%) |
Education in Newport
School Enrollment in Newport
The most common levels of schooling among the 1,404 students in Newport are middle school (353 | 25.1%), elementary school (318 | 22.7%), and college / undergraduate (312 | 22.2%).
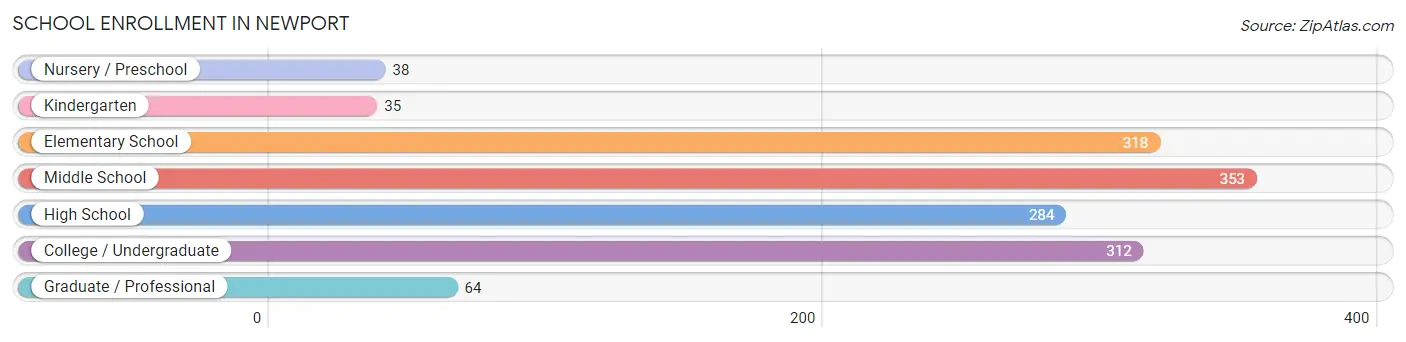
| School Level | # Students | % Students |
| Nursery / Preschool | 38 | 2.7% |
| Kindergarten | 35 | 2.5% |
| Elementary School | 318 | 22.7% |
| Middle School | 353 | 25.1% |
| High School | 284 | 20.2% |
| College / Undergraduate | 312 | 22.2% |
| Graduate / Professional | 64 | 4.6% |
| Total | 1,404 | 100.0% |
School Enrollment by Age by Funding Source in Newport
Out of a total of 1,404 students who are enrolled in schools in Newport, 208 (14.8%) attend a private institution, while the remaining 1,196 (85.2%) are enrolled in public schools. The age group of 20 to 24 year olds has the highest likelihood of being enrolled in private schools, with 8 (40.0% in the age bracket) enrolled. Conversely, the age group of 3 to 4 year olds has the lowest likelihood of being enrolled in a private school, with 27 (100.0% in the age bracket) attending a public institution.
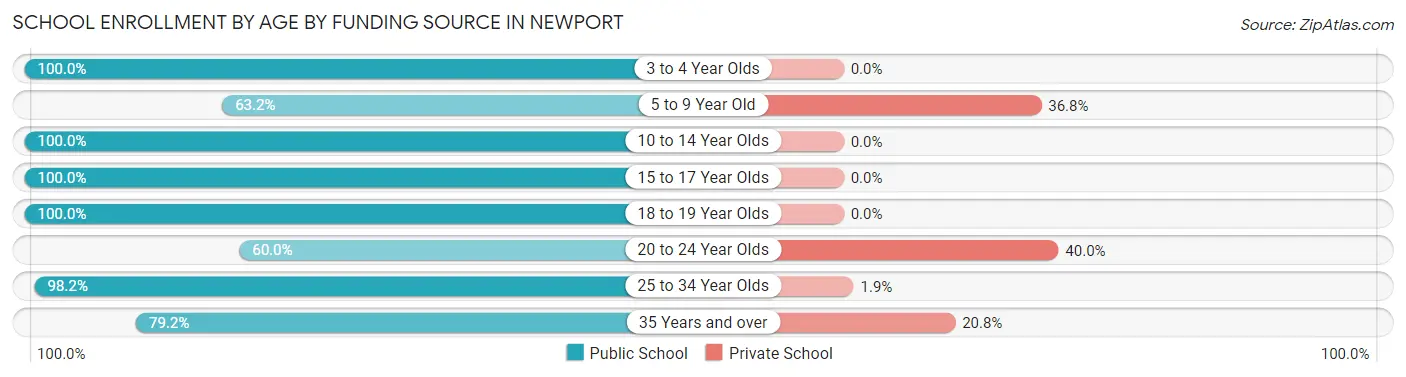
| Age Bracket | Public School | Private School |
| 3 to 4 Year Olds | 27 (100.0%) | 0 (0.0%) |
| 5 to 9 Year Old | 230 (63.2%) | 134 (36.8%) |
| 10 to 14 Year Olds | 352 (100.0%) | 0 (0.0%) |
| 15 to 17 Year Olds | 195 (100.0%) | 0 (0.0%) |
| 18 to 19 Year Olds | 79 (100.0%) | 0 (0.0%) |
| 20 to 24 Year Olds | 12 (60.0%) | 8 (40.0%) |
| 25 to 34 Year Olds | 53 (98.2%) | 1 (1.8%) |
| 35 Years and over | 248 (79.2%) | 65 (20.8%) |
| Total | 1,196 (85.2%) | 208 (14.8%) |
Educational Attainment by Field of Study in Newport
Education (176 | 28.2%), science & technology (168 | 26.9%), engineering (65 | 10.4%), business (58 | 9.3%), and arts & humanities (37 | 5.9%) are the most common fields of study among 624 individuals in Newport who have obtained a bachelor's degree or higher.
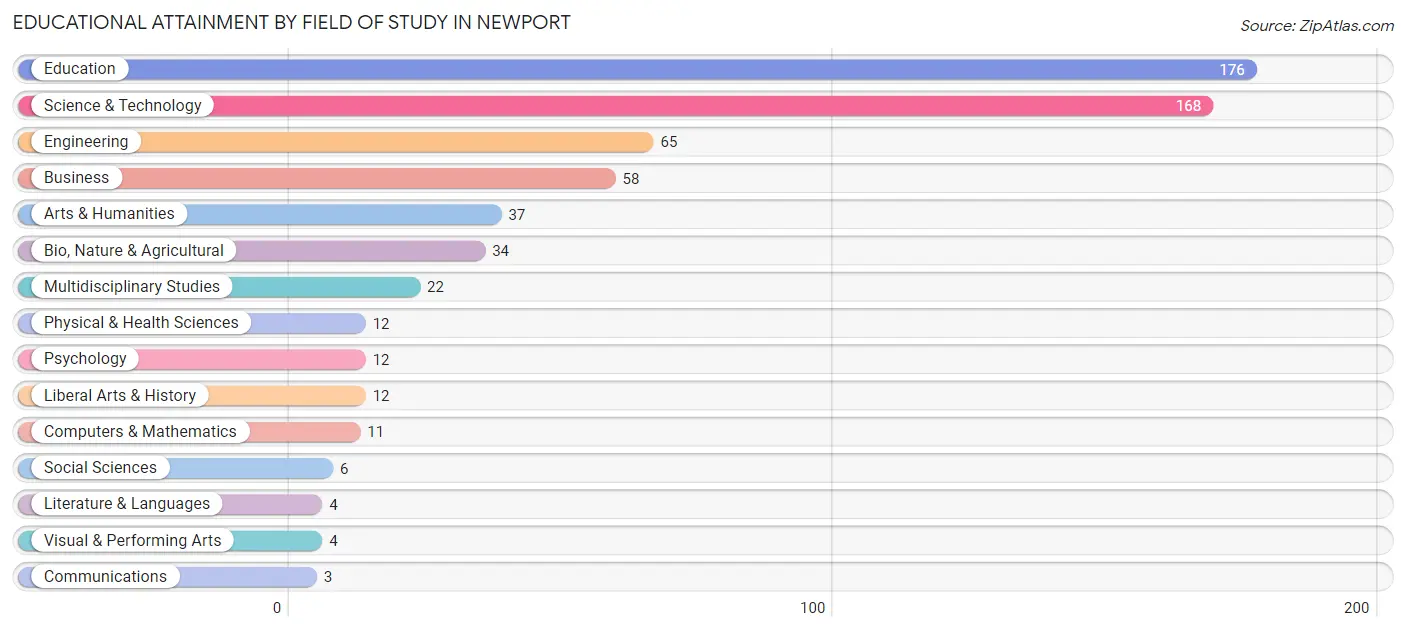
| Field of Study | # Graduates | % Graduates |
| Computers & Mathematics | 11 | 1.8% |
| Bio, Nature & Agricultural | 34 | 5.4% |
| Physical & Health Sciences | 12 | 1.9% |
| Psychology | 12 | 1.9% |
| Social Sciences | 6 | 1.0% |
| Engineering | 65 | 10.4% |
| Multidisciplinary Studies | 22 | 3.5% |
| Science & Technology | 168 | 26.9% |
| Business | 58 | 9.3% |
| Education | 176 | 28.2% |
| Literature & Languages | 4 | 0.6% |
| Liberal Arts & History | 12 | 1.9% |
| Visual & Performing Arts | 4 | 0.6% |
| Communications | 3 | 0.5% |
| Arts & Humanities | 37 | 5.9% |
| Total | 624 | 100.0% |
Transportation & Commute in Newport
Vehicle Availability by Sex in Newport
The most prevalent vehicle ownership categories in Newport are males with 2 vehicles (616, accounting for 46.4%) and females with 2 vehicles (295, making up 62.4%).
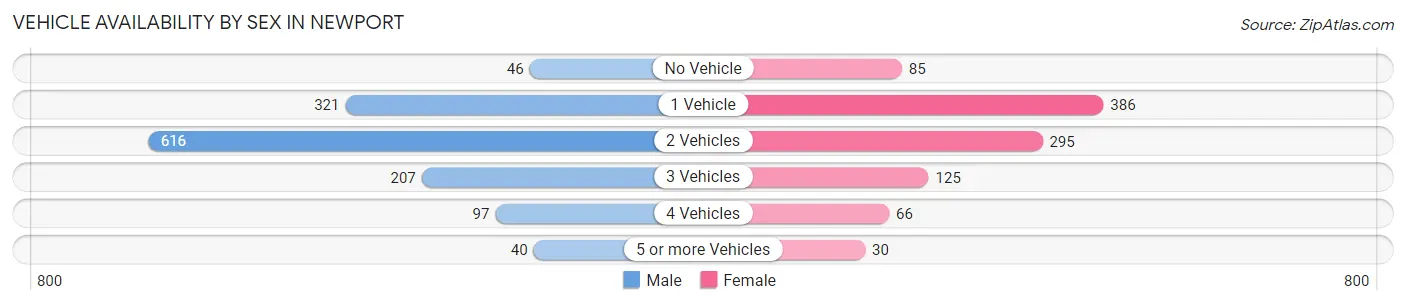
| Vehicles Available | Male | Female |
| No Vehicle | 46 (3.5%) | 85 (8.6%) |
| 1 Vehicle | 321 (24.2%) | 386 (39.1%) |
| 2 Vehicles | 616 (46.4%) | 295 (29.9%) |
| 3 Vehicles | 207 (15.6%) | 125 (12.7%) |
| 4 Vehicles | 97 (7.3%) | 66 (6.7%) |
| 5 or more Vehicles | 40 (3.0%) | 30 (3.0%) |
| Total | 1,327 (100.0%) | 987 (100.0%) |
Commute Time in Newport
The most frequently occuring commute durations in Newport are 5 to 9 minutes (648 commuters, 28.3%), 10 to 14 minutes (472 commuters, 20.6%), and less than 5 minutes (469 commuters, 20.5%).
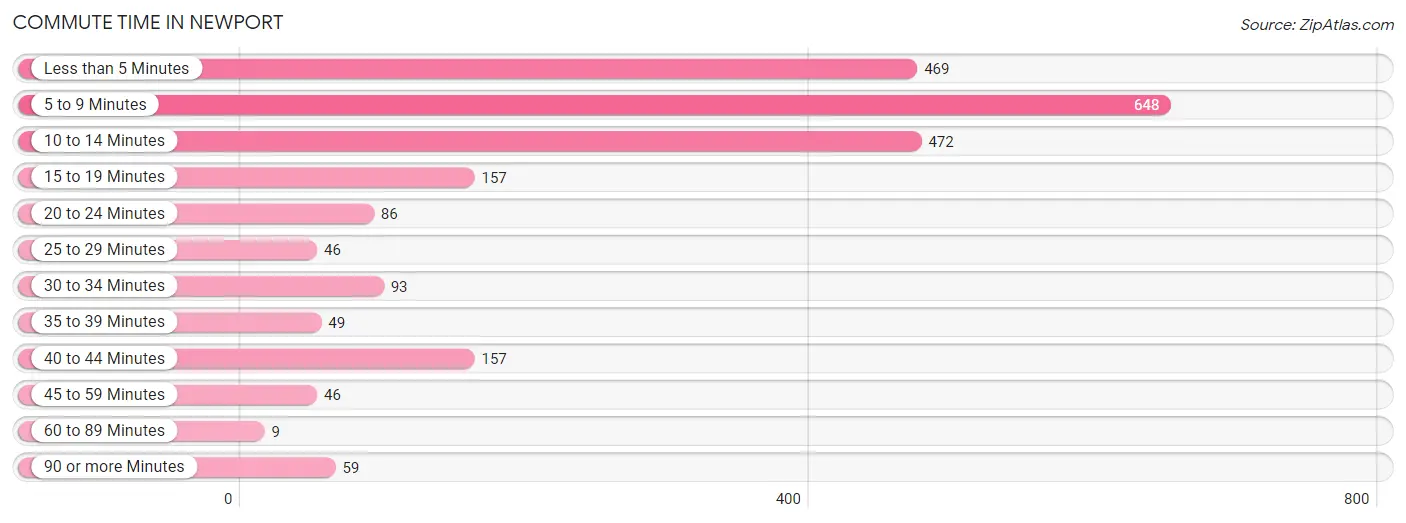
| Commute Time | # Commuters | % Commuters |
| Less than 5 Minutes | 469 | 20.5% |
| 5 to 9 Minutes | 648 | 28.3% |
| 10 to 14 Minutes | 472 | 20.6% |
| 15 to 19 Minutes | 157 | 6.9% |
| 20 to 24 Minutes | 86 | 3.7% |
| 25 to 29 Minutes | 46 | 2.0% |
| 30 to 34 Minutes | 93 | 4.1% |
| 35 to 39 Minutes | 49 | 2.1% |
| 40 to 44 Minutes | 157 | 6.9% |
| 45 to 59 Minutes | 46 | 2.0% |
| 60 to 89 Minutes | 9 | 0.4% |
| 90 or more Minutes | 59 | 2.6% |
Commute Time by Sex in Newport
The most common commute times in Newport are 5 to 9 minutes (378 commuters, 28.9%) for males and 5 to 9 minutes (270 commuters, 27.5%) for females.
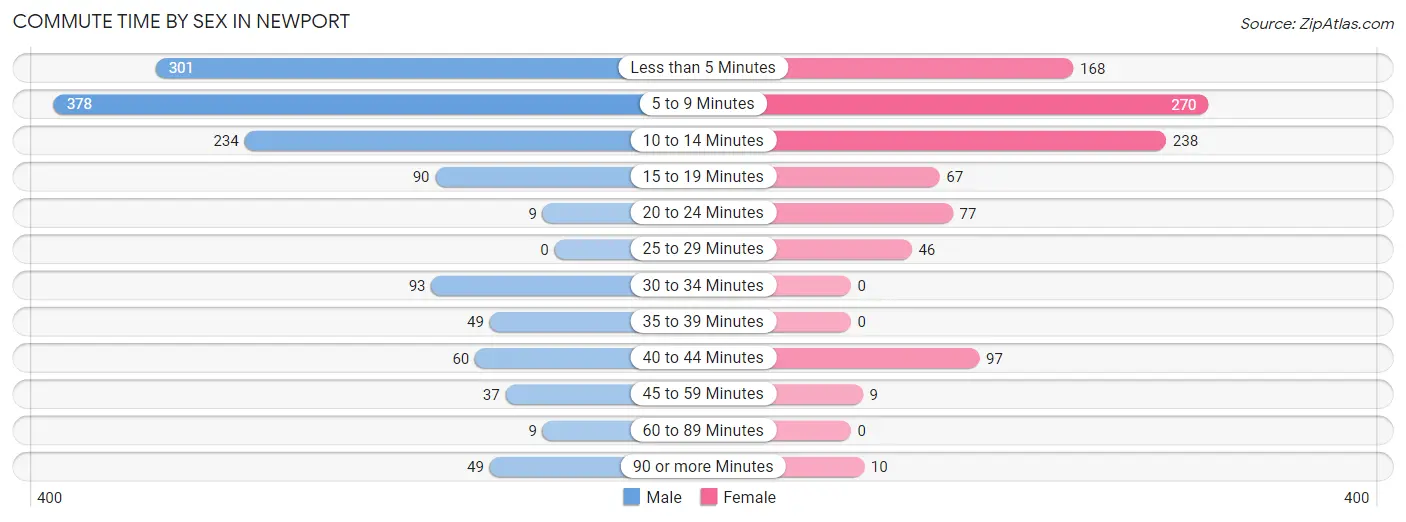
| Commute Time | Male | Female |
| Less than 5 Minutes | 301 (23.0%) | 168 (17.1%) |
| 5 to 9 Minutes | 378 (28.9%) | 270 (27.5%) |
| 10 to 14 Minutes | 234 (17.9%) | 238 (24.2%) |
| 15 to 19 Minutes | 90 (6.9%) | 67 (6.8%) |
| 20 to 24 Minutes | 9 (0.7%) | 77 (7.8%) |
| 25 to 29 Minutes | 0 (0.0%) | 46 (4.7%) |
| 30 to 34 Minutes | 93 (7.1%) | 0 (0.0%) |
| 35 to 39 Minutes | 49 (3.7%) | 0 (0.0%) |
| 40 to 44 Minutes | 60 (4.6%) | 97 (9.9%) |
| 45 to 59 Minutes | 37 (2.8%) | 9 (0.9%) |
| 60 to 89 Minutes | 9 (0.7%) | 0 (0.0%) |
| 90 or more Minutes | 49 (3.7%) | 10 (1.0%) |
Time of Departure to Work by Sex in Newport
The most frequent times of departure to work in Newport are 7:30 AM to 7:59 AM (309, 23.6%) for males and 7:30 AM to 7:59 AM (252, 25.7%) for females.
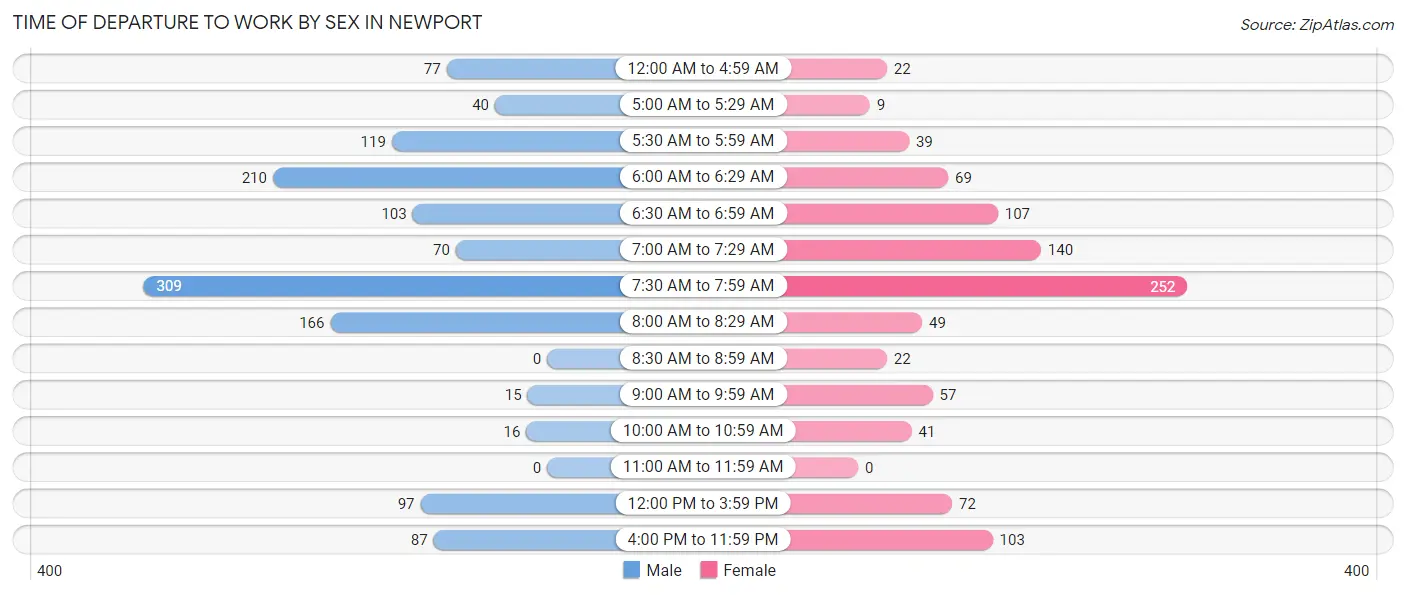
| Time of Departure | Male | Female |
| 12:00 AM to 4:59 AM | 77 (5.9%) | 22 (2.2%) |
| 5:00 AM to 5:29 AM | 40 (3.1%) | 9 (0.9%) |
| 5:30 AM to 5:59 AM | 119 (9.1%) | 39 (4.0%) |
| 6:00 AM to 6:29 AM | 210 (16.0%) | 69 (7.0%) |
| 6:30 AM to 6:59 AM | 103 (7.9%) | 107 (10.9%) |
| 7:00 AM to 7:29 AM | 70 (5.3%) | 140 (14.3%) |
| 7:30 AM to 7:59 AM | 309 (23.6%) | 252 (25.7%) |
| 8:00 AM to 8:29 AM | 166 (12.7%) | 49 (5.0%) |
| 8:30 AM to 8:59 AM | 0 (0.0%) | 22 (2.2%) |
| 9:00 AM to 9:59 AM | 15 (1.1%) | 57 (5.8%) |
| 10:00 AM to 10:59 AM | 16 (1.2%) | 41 (4.2%) |
| 11:00 AM to 11:59 AM | 0 (0.0%) | 0 (0.0%) |
| 12:00 PM to 3:59 PM | 97 (7.4%) | 72 (7.3%) |
| 4:00 PM to 11:59 PM | 87 (6.7%) | 103 (10.5%) |
| Total | 1,309 (100.0%) | 982 (100.0%) |
Housing Occupancy in Newport
Occupancy by Ownership in Newport
Of the total 2,671 dwellings in Newport, owner-occupied units account for 1,368 (51.2%), while renter-occupied units make up 1,303 (48.8%).
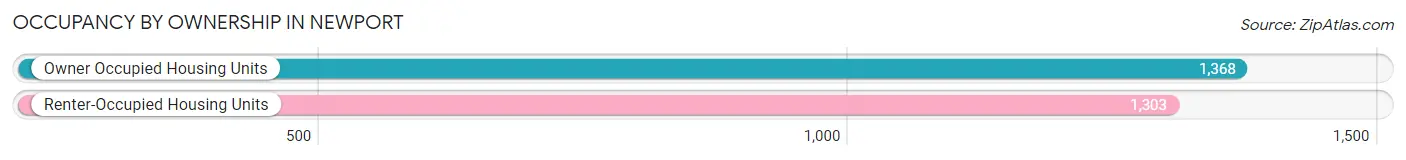
| Occupancy | # Housing Units | % Housing Units |
| Owner Occupied Housing Units | 1,368 | 51.2% |
| Renter-Occupied Housing Units | 1,303 | 48.8% |
| Total Occupied Housing Units | 2,671 | 100.0% |
Occupancy by Household Size in Newport
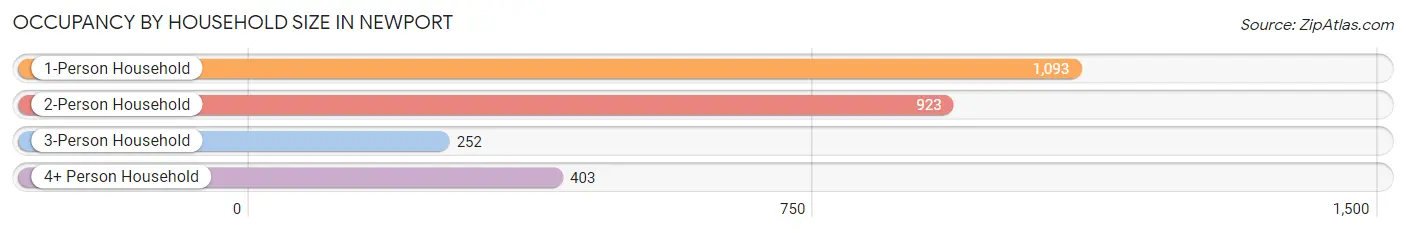
| Household Size | # Housing Units | % Housing Units |
| 1-Person Household | 1,093 | 40.9% |
| 2-Person Household | 923 | 34.6% |
| 3-Person Household | 252 | 9.4% |
| 4+ Person Household | 403 | 15.1% |
| Total Housing Units | 2,671 | 100.0% |
Occupancy by Ownership by Household Size in Newport
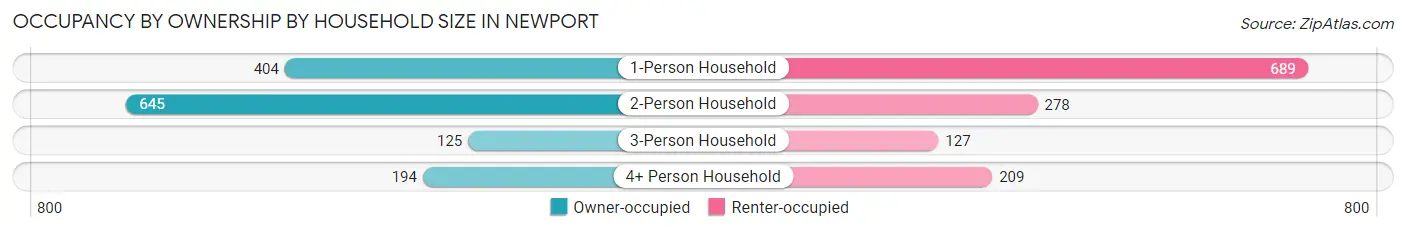
| Household Size | Owner-occupied | Renter-occupied |
| 1-Person Household | 404 (37.0%) | 689 (63.0%) |
| 2-Person Household | 645 (69.9%) | 278 (30.1%) |
| 3-Person Household | 125 (49.6%) | 127 (50.4%) |
| 4+ Person Household | 194 (48.1%) | 209 (51.9%) |
| Total Housing Units | 1,368 (51.2%) | 1,303 (48.8%) |
Occupancy by Educational Attainment in Newport
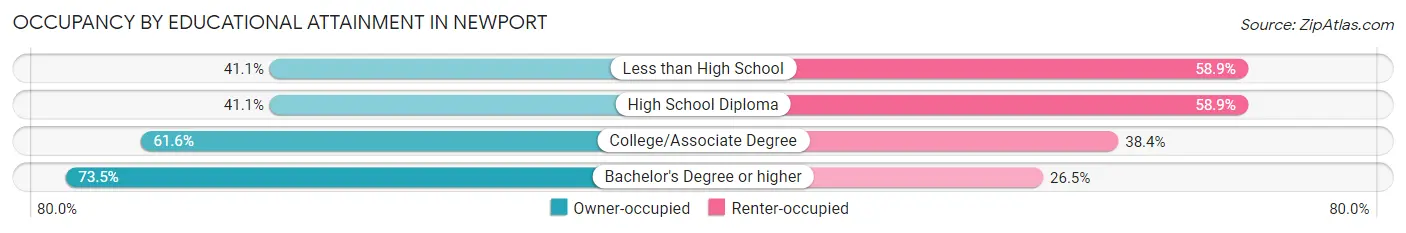
| Household Size | Owner-occupied | Renter-occupied |
| Less than High School | 148 (41.1%) | 212 (58.9%) |
| High School Diploma | 485 (41.1%) | 695 (58.9%) |
| College/Associate Degree | 499 (61.6%) | 311 (38.4%) |
| Bachelor's Degree or higher | 236 (73.5%) | 85 (26.5%) |
Occupancy by Age of Householder in Newport
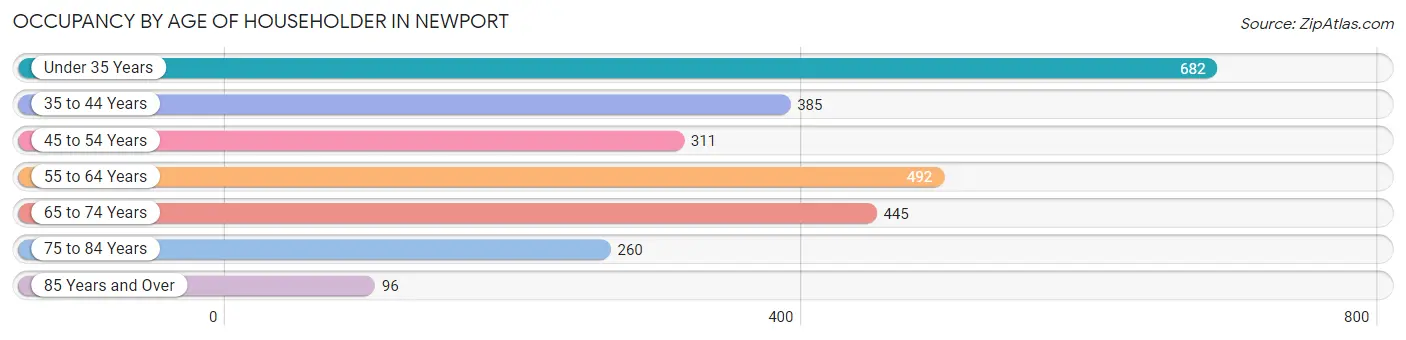
| Age Bracket | # Households | % Households |
| Under 35 Years | 682 | 25.5% |
| 35 to 44 Years | 385 | 14.4% |
| 45 to 54 Years | 311 | 11.6% |
| 55 to 64 Years | 492 | 18.4% |
| 65 to 74 Years | 445 | 16.7% |
| 75 to 84 Years | 260 | 9.7% |
| 85 Years and Over | 96 | 3.6% |
| Total | 2,671 | 100.0% |
Housing Finances in Newport
Median Income by Occupancy in Newport
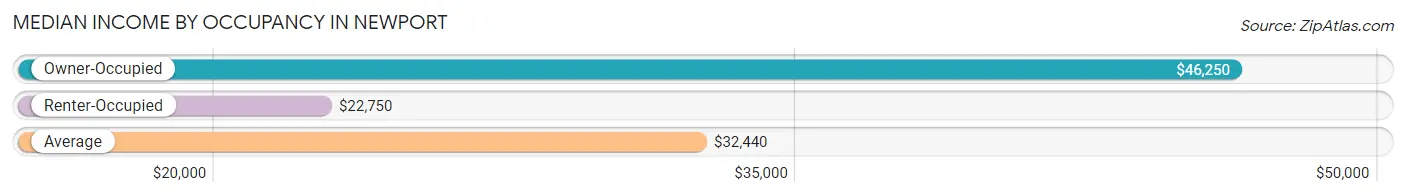
| Occupancy Type | # Households | Median Income |
| Owner-Occupied | 1,368 (51.2%) | $46,250 |
| Renter-Occupied | 1,303 (48.8%) | $22,750 |
| Average | 2,671 (100.0%) | $32,440 |
Occupancy by Householder Income Bracket in Newport
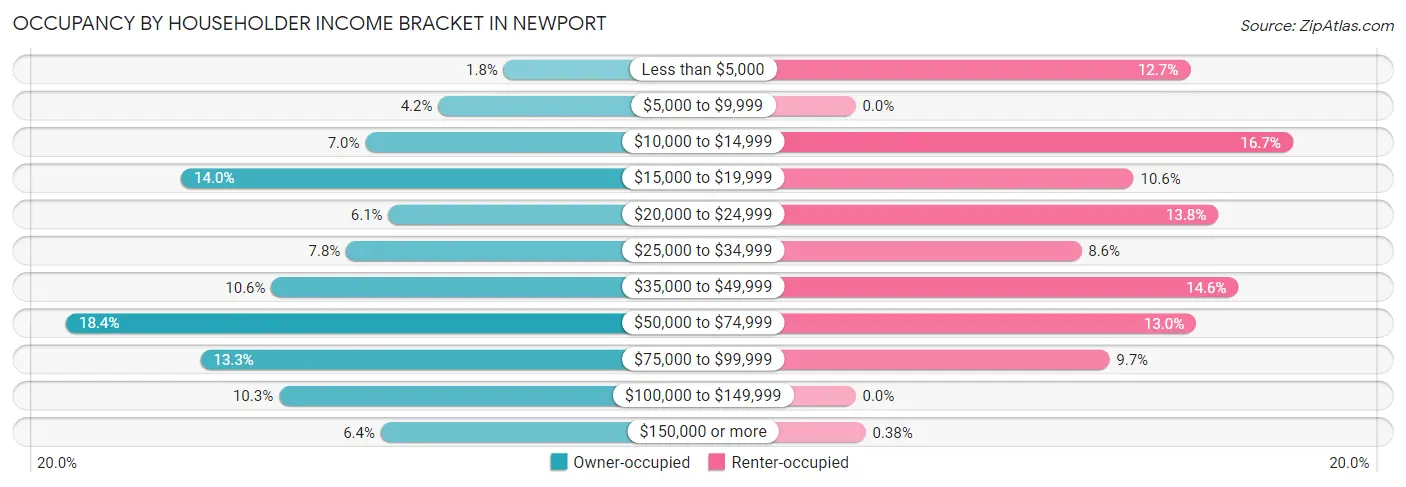
| Income Bracket | Owner-occupied | Renter-occupied |
| Less than $5,000 | 24 (1.8%) | 166 (12.7%) |
| $5,000 to $9,999 | 58 (4.2%) | 0 (0.0%) |
| $10,000 to $14,999 | 96 (7.0%) | 217 (16.7%) |
| $15,000 to $19,999 | 192 (14.0%) | 138 (10.6%) |
| $20,000 to $24,999 | 84 (6.1%) | 180 (13.8%) |
| $25,000 to $34,999 | 106 (7.7%) | 112 (8.6%) |
| $35,000 to $49,999 | 145 (10.6%) | 190 (14.6%) |
| $50,000 to $74,999 | 252 (18.4%) | 169 (13.0%) |
| $75,000 to $99,999 | 182 (13.3%) | 126 (9.7%) |
| $100,000 to $149,999 | 141 (10.3%) | 0 (0.0%) |
| $150,000 or more | 88 (6.4%) | 5 (0.4%) |
| Total | 1,368 (100.0%) | 1,303 (100.0%) |
Monthly Housing Cost Tiers in Newport
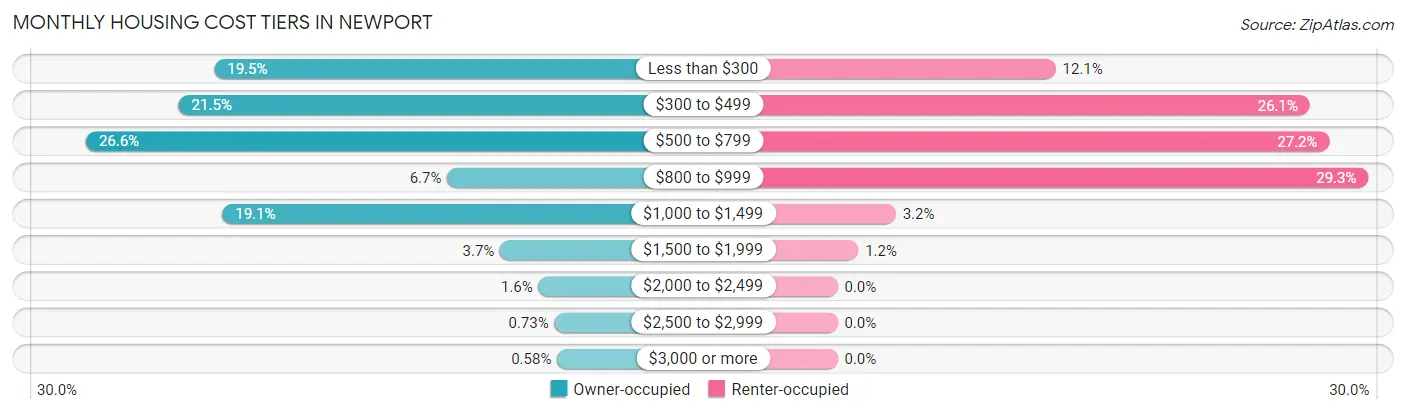
| Monthly Cost | Owner-occupied | Renter-occupied |
| Less than $300 | 267 (19.5%) | 157 (12.0%) |
| $300 to $499 | 294 (21.5%) | 340 (26.1%) |
| $500 to $799 | 364 (26.6%) | 354 (27.2%) |
| $800 to $999 | 91 (6.7%) | 382 (29.3%) |
| $1,000 to $1,499 | 261 (19.1%) | 42 (3.2%) |
| $1,500 to $1,999 | 51 (3.7%) | 15 (1.1%) |
| $2,000 to $2,499 | 22 (1.6%) | 0 (0.0%) |
| $2,500 to $2,999 | 10 (0.7%) | 0 (0.0%) |
| $3,000 or more | 8 (0.6%) | 0 (0.0%) |
| Total | 1,368 (100.0%) | 1,303 (100.0%) |
Physical Housing Characteristics in Newport
Housing Structures in Newport
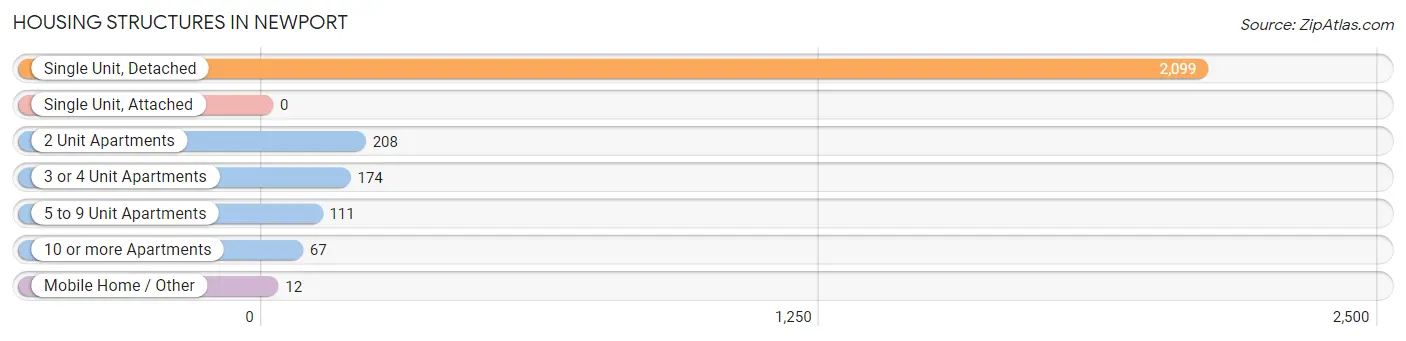
| Structure Type | # Housing Units | % Housing Units |
| Single Unit, Detached | 2,099 | 78.6% |
| Single Unit, Attached | 0 | 0.0% |
| 2 Unit Apartments | 208 | 7.8% |
| 3 or 4 Unit Apartments | 174 | 6.5% |
| 5 to 9 Unit Apartments | 111 | 4.2% |
| 10 or more Apartments | 67 | 2.5% |
| Mobile Home / Other | 12 | 0.4% |
| Total | 2,671 | 100.0% |
Housing Structures by Occupancy in Newport
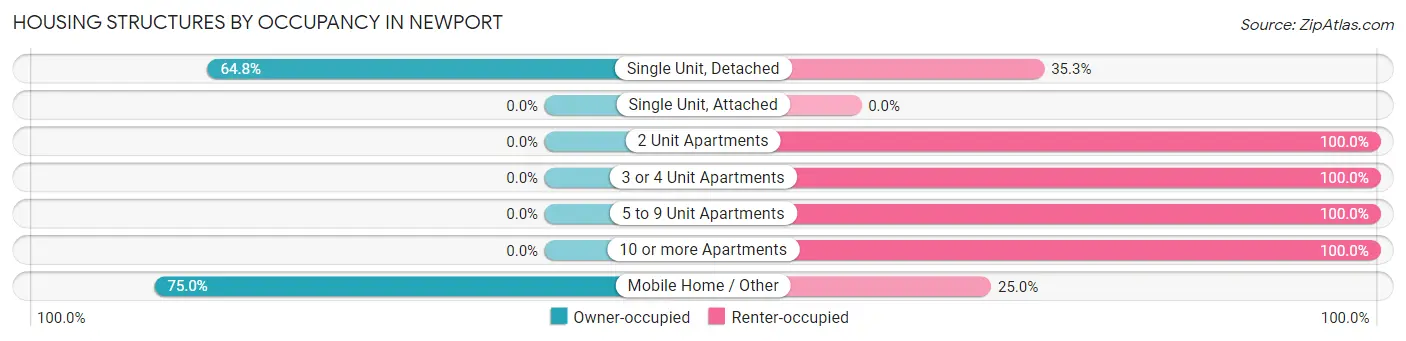
| Structure Type | Owner-occupied | Renter-occupied |
| Single Unit, Detached | 1,359 (64.7%) | 740 (35.2%) |
| Single Unit, Attached | 0 (0.0%) | 0 (0.0%) |
| 2 Unit Apartments | 0 (0.0%) | 208 (100.0%) |
| 3 or 4 Unit Apartments | 0 (0.0%) | 174 (100.0%) |
| 5 to 9 Unit Apartments | 0 (0.0%) | 111 (100.0%) |
| 10 or more Apartments | 0 (0.0%) | 67 (100.0%) |
| Mobile Home / Other | 9 (75.0%) | 3 (25.0%) |
| Total | 1,368 (51.2%) | 1,303 (48.8%) |
Housing Structures by Number of Rooms in Newport
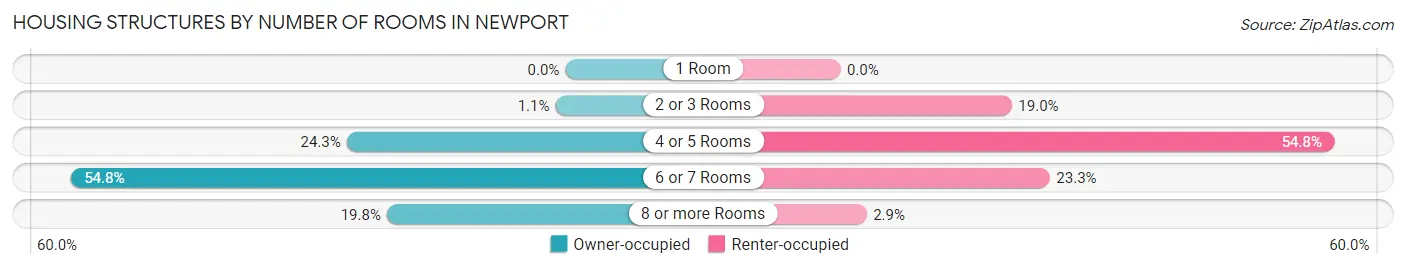
| Number of Rooms | Owner-occupied | Renter-occupied |
| 1 Room | 0 (0.0%) | 0 (0.0%) |
| 2 or 3 Rooms | 15 (1.1%) | 248 (19.0%) |
| 4 or 5 Rooms | 332 (24.3%) | 714 (54.8%) |
| 6 or 7 Rooms | 750 (54.8%) | 303 (23.3%) |
| 8 or more Rooms | 271 (19.8%) | 38 (2.9%) |
| Total | 1,368 (100.0%) | 1,303 (100.0%) |
Housing Structure by Heating Type in Newport
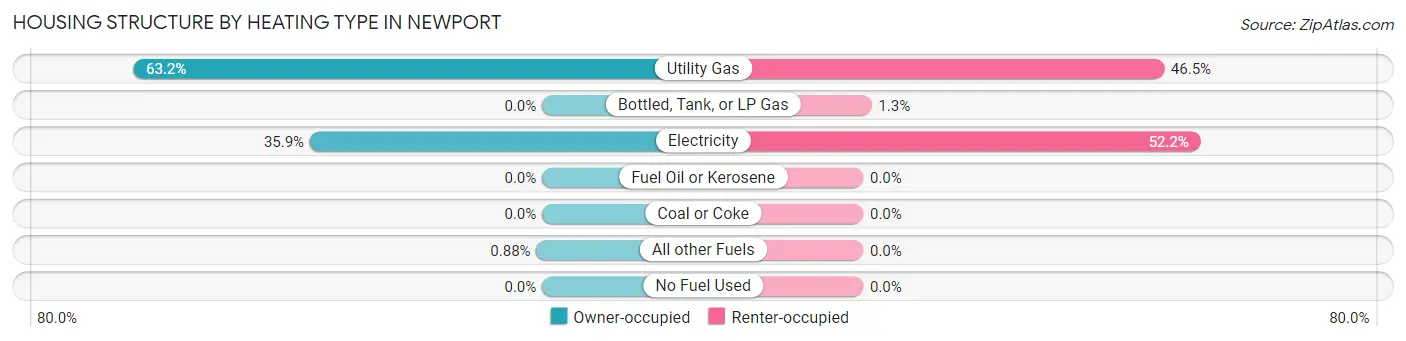
| Heating Type | Owner-occupied | Renter-occupied |
| Utility Gas | 865 (63.2%) | 606 (46.5%) |
| Bottled, Tank, or LP Gas | 0 (0.0%) | 17 (1.3%) |
| Electricity | 491 (35.9%) | 680 (52.2%) |
| Fuel Oil or Kerosene | 0 (0.0%) | 0 (0.0%) |
| Coal or Coke | 0 (0.0%) | 0 (0.0%) |
| All other Fuels | 12 (0.9%) | 0 (0.0%) |
| No Fuel Used | 0 (0.0%) | 0 (0.0%) |
| Total | 1,368 (100.0%) | 1,303 (100.0%) |
Household Vehicle Usage in Newport
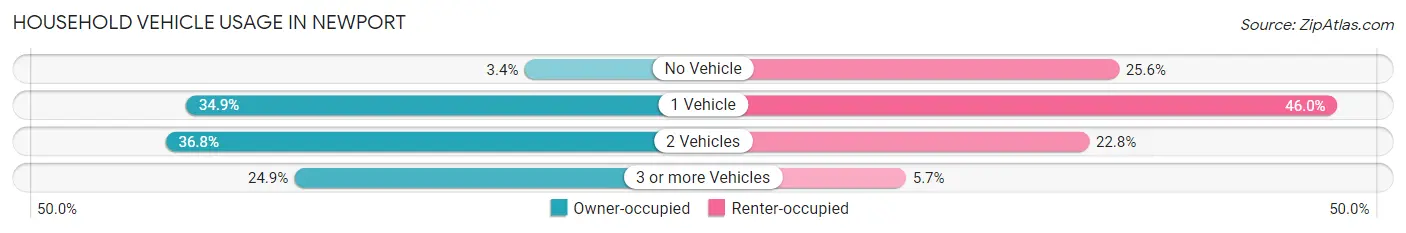
| Vehicles per Household | Owner-occupied | Renter-occupied |
| No Vehicle | 46 (3.4%) | 333 (25.6%) |
| 1 Vehicle | 478 (34.9%) | 599 (46.0%) |
| 2 Vehicles | 504 (36.8%) | 297 (22.8%) |
| 3 or more Vehicles | 340 (24.8%) | 74 (5.7%) |
| Total | 1,368 (100.0%) | 1,303 (100.0%) |
Real Estate & Mortgages in Newport
Real Estate and Mortgage Overview in Newport
| Characteristic | Without Mortgage | With Mortgage |
| Housing Units | 724 | 644 |
| Median Property Value | $104,100 | $126,200 |
| Median Household Income | $33,448 | $56 |
| Monthly Housing Costs | $405 | $8 |
| Real Estate Taxes | $565 | $77 |
Property Value by Mortgage Status in Newport
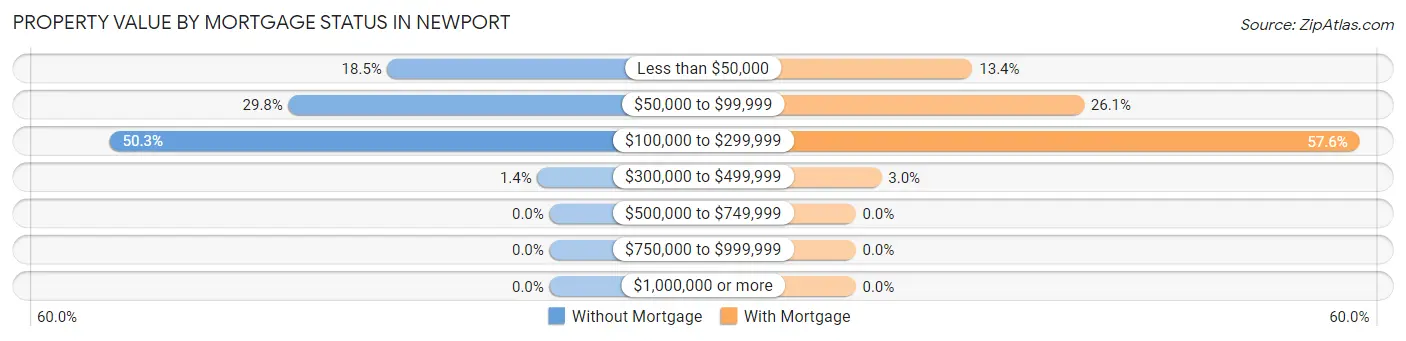
| Property Value | Without Mortgage | With Mortgage |
| Less than $50,000 | 134 (18.5%) | 86 (13.4%) |
| $50,000 to $99,999 | 216 (29.8%) | 168 (26.1%) |
| $100,000 to $299,999 | 364 (50.3%) | 371 (57.6%) |
| $300,000 to $499,999 | 10 (1.4%) | 19 (2.9%) |
| $500,000 to $749,999 | 0 (0.0%) | 0 (0.0%) |
| $750,000 to $999,999 | 0 (0.0%) | 0 (0.0%) |
| $1,000,000 or more | 0 (0.0%) | 0 (0.0%) |
| Total | 724 (100.0%) | 644 (100.0%) |
Household Income by Mortgage Status in Newport
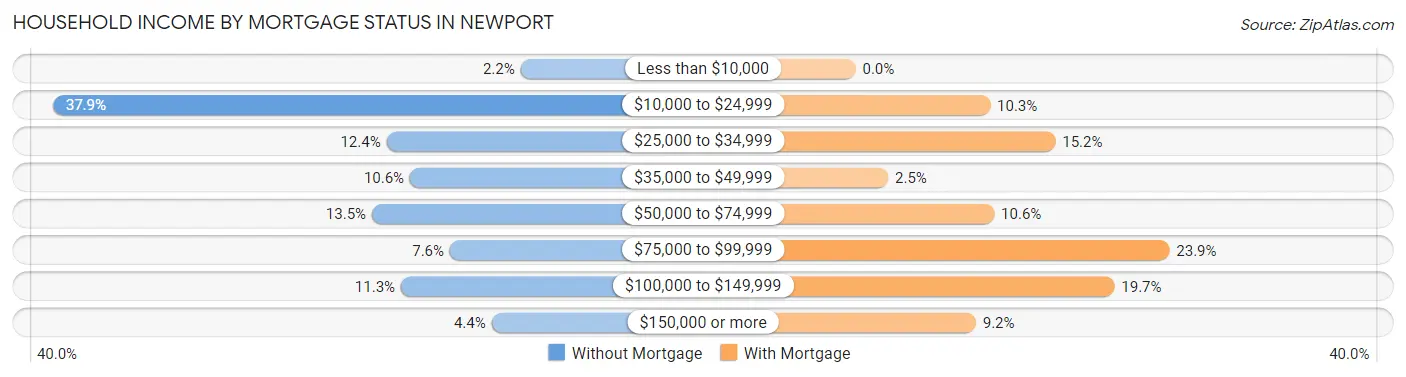
| Household Income | Without Mortgage | With Mortgage |
| Less than $10,000 | 16 (2.2%) | 0 (0.0%) |
| $10,000 to $24,999 | 274 (37.9%) | 66 (10.2%) |
| $25,000 to $34,999 | 90 (12.4%) | 98 (15.2%) |
| $35,000 to $49,999 | 77 (10.6%) | 16 (2.5%) |
| $50,000 to $74,999 | 98 (13.5%) | 68 (10.6%) |
| $75,000 to $99,999 | 55 (7.6%) | 154 (23.9%) |
| $100,000 to $149,999 | 82 (11.3%) | 127 (19.7%) |
| $150,000 or more | 32 (4.4%) | 59 (9.2%) |
| Total | 724 (100.0%) | 644 (100.0%) |
Property Value to Household Income Ratio in Newport
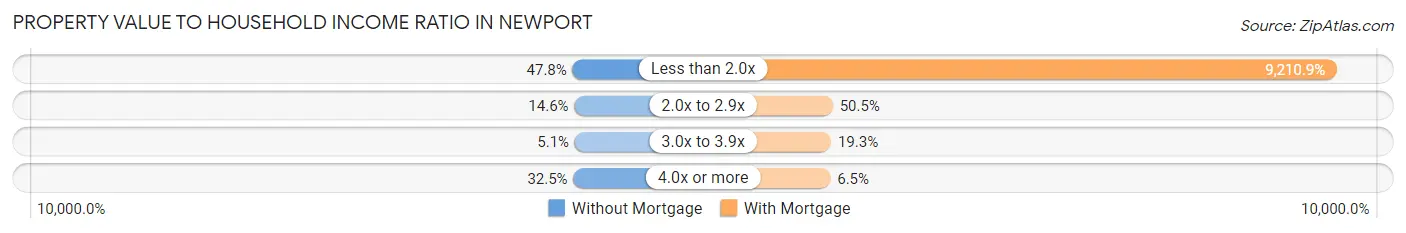
| Value-to-Income Ratio | Without Mortgage | With Mortgage |
| Less than 2.0x | 346 (47.8%) | 59,318 (9,210.9%) |
| 2.0x to 2.9x | 106 (14.6%) | 325 (50.5%) |
| 3.0x to 3.9x | 37 (5.1%) | 124 (19.3%) |
| 4.0x or more | 235 (32.5%) | 42 (6.5%) |
| Total | 724 (100.0%) | 644 (100.0%) |
Real Estate Taxes by Mortgage Status in Newport
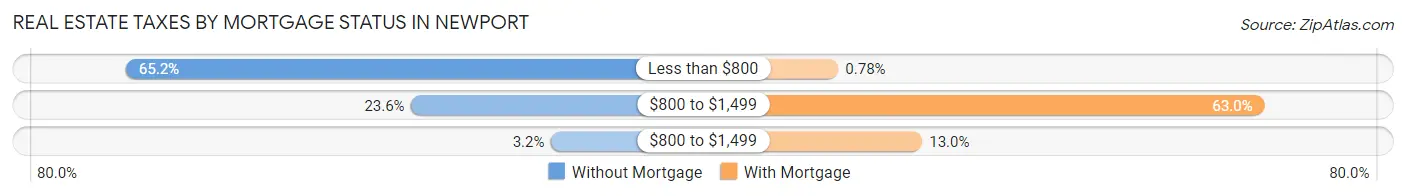
| Property Taxes | Without Mortgage | With Mortgage |
| Less than $800 | 472 (65.2%) | 5 (0.8%) |
| $800 to $1,499 | 171 (23.6%) | 406 (63.0%) |
| $800 to $1,499 | 23 (3.2%) | 84 (13.0%) |
| Total | 724 (100.0%) | 644 (100.0%) |
Health & Disability in Newport
Health Insurance Coverage by Age in Newport
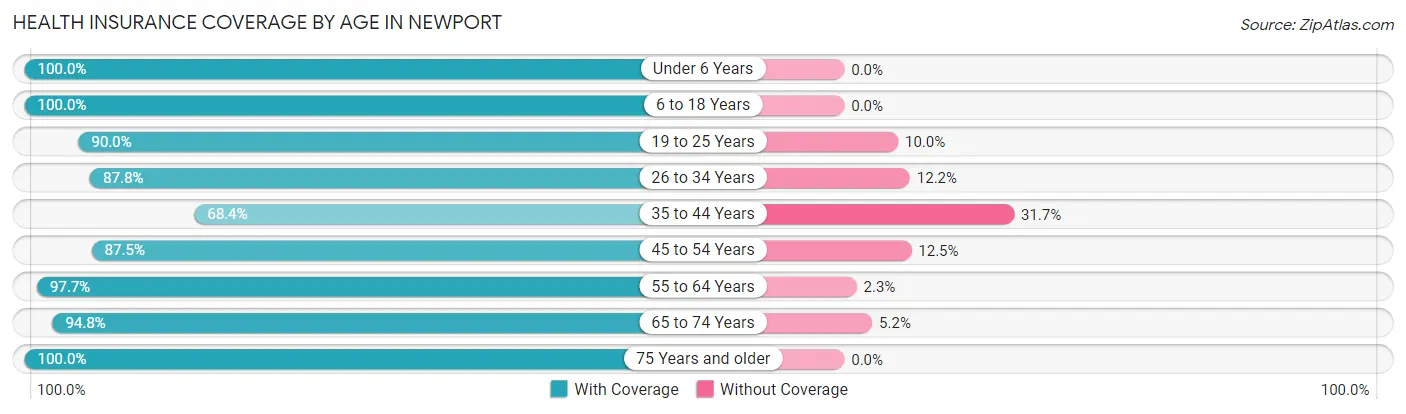
| Age Bracket | With Coverage | Without Coverage |
| Under 6 Years | 271 (100.0%) | 0 (0.0%) |
| 6 to 18 Years | 990 (100.0%) | 0 (0.0%) |
| 19 to 25 Years | 529 (90.0%) | 59 (10.0%) |
| 26 to 34 Years | 610 (87.8%) | 85 (12.2%) |
| 35 to 44 Years | 527 (68.3%) | 244 (31.7%) |
| 45 to 54 Years | 525 (87.5%) | 75 (12.5%) |
| 55 to 64 Years | 595 (97.7%) | 14 (2.3%) |
| 65 to 74 Years | 602 (94.8%) | 33 (5.2%) |
| 75 Years and older | 556 (100.0%) | 0 (0.0%) |
| Total | 5,205 (91.1%) | 510 (8.9%) |
Health Insurance Coverage by Citizenship Status in Newport
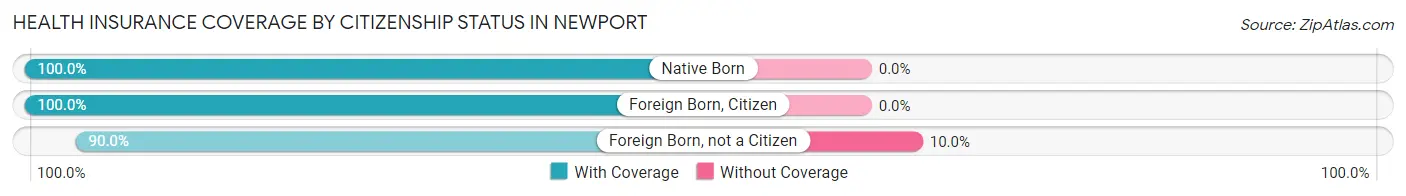
| Citizenship Status | With Coverage | Without Coverage |
| Native Born | 271 (100.0%) | 0 (0.0%) |
| Foreign Born, Citizen | 990 (100.0%) | 0 (0.0%) |
| Foreign Born, not a Citizen | 529 (90.0%) | 59 (10.0%) |
Health Insurance Coverage by Household Income in Newport
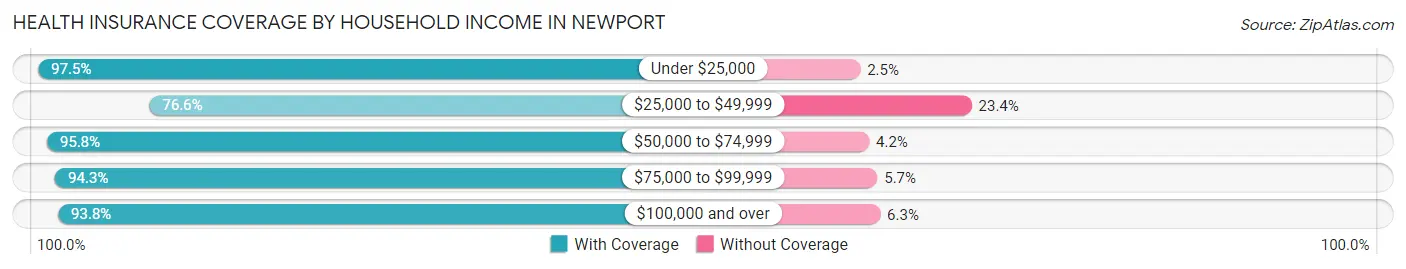
| Household Income | With Coverage | Without Coverage |
| Under $25,000 | 1,699 (97.5%) | 44 (2.5%) |
| $25,000 to $49,999 | 1,085 (76.6%) | 331 (23.4%) |
| $50,000 to $74,999 | 849 (95.8%) | 37 (4.2%) |
| $75,000 to $99,999 | 759 (94.3%) | 46 (5.7%) |
| $100,000 and over | 780 (93.8%) | 52 (6.2%) |
Public vs Private Health Insurance Coverage by Age in Newport
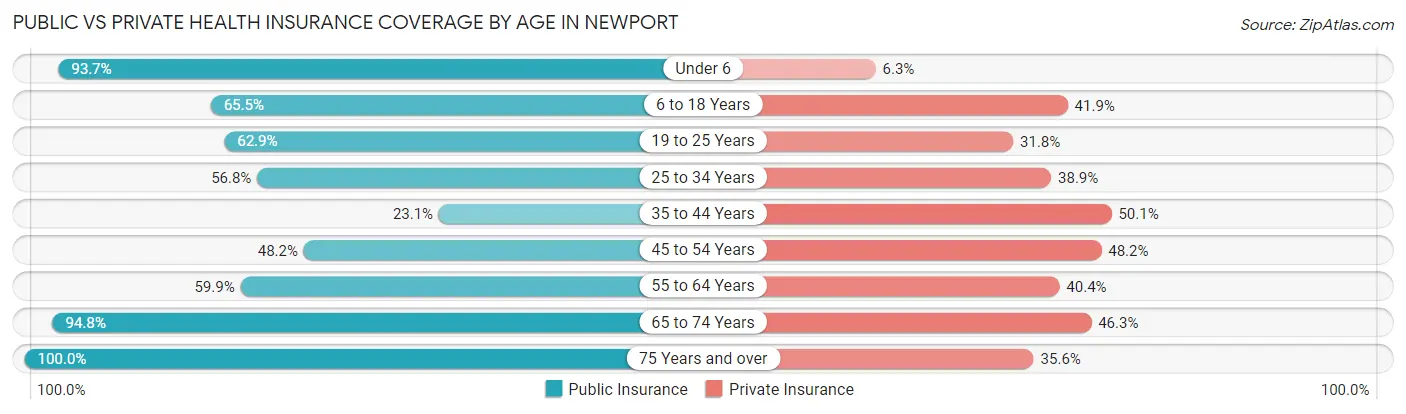
| Age Bracket | Public Insurance | Private Insurance |
| Under 6 | 254 (93.7%) | 17 (6.3%) |
| 6 to 18 Years | 648 (65.4%) | 415 (41.9%) |
| 19 to 25 Years | 370 (62.9%) | 187 (31.8%) |
| 25 to 34 Years | 395 (56.8%) | 270 (38.9%) |
| 35 to 44 Years | 178 (23.1%) | 386 (50.1%) |
| 45 to 54 Years | 289 (48.2%) | 289 (48.2%) |
| 55 to 64 Years | 365 (59.9%) | 246 (40.4%) |
| 65 to 74 Years | 602 (94.8%) | 294 (46.3%) |
| 75 Years and over | 556 (100.0%) | 198 (35.6%) |
| Total | 3,657 (64.0%) | 2,302 (40.3%) |
Disability Status by Sex by Age in Newport
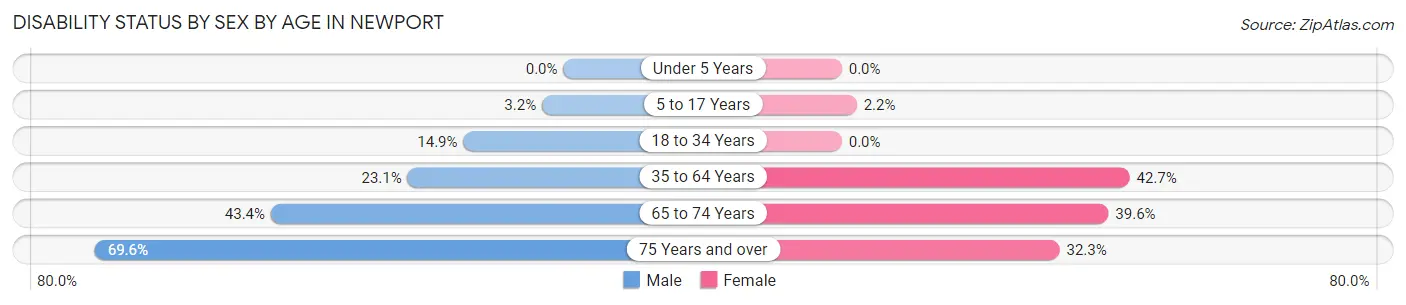
| Age Bracket | Male | Female |
| Under 5 Years | 0 (0.0%) | 0 (0.0%) |
| 5 to 17 Years | 15 (3.2%) | 10 (2.2%) |
| 18 to 34 Years | 121 (14.8%) | 0 (0.0%) |
| 35 to 64 Years | 202 (23.1%) | 473 (42.7%) |
| 65 to 74 Years | 86 (43.4%) | 173 (39.6%) |
| 75 Years and over | 176 (69.6%) | 98 (32.3%) |
Disability Class by Sex by Age in Newport
Disability Class: Hearing Difficulty
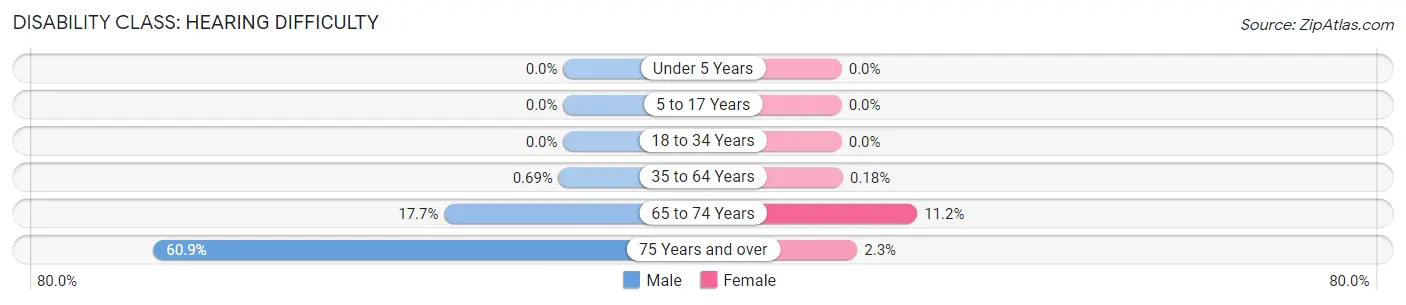
| Age Bracket | Male | Female |
| Under 5 Years | 0 (0.0%) | 0 (0.0%) |
| 5 to 17 Years | 0 (0.0%) | 0 (0.0%) |
| 18 to 34 Years | 0 (0.0%) | 0 (0.0%) |
| 35 to 64 Years | 6 (0.7%) | 2 (0.2%) |
| 65 to 74 Years | 35 (17.7%) | 49 (11.2%) |
| 75 Years and over | 154 (60.9%) | 7 (2.3%) |
Disability Class: Vision Difficulty
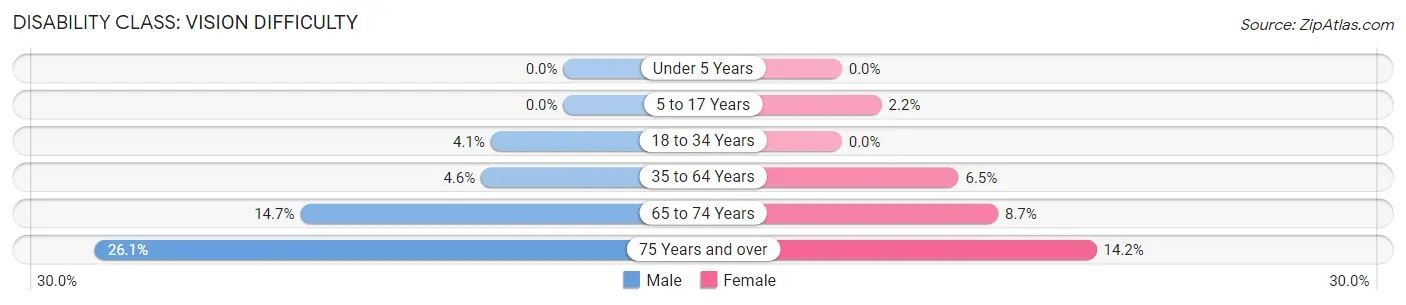
| Age Bracket | Male | Female |
| Under 5 Years | 0 (0.0%) | 0 (0.0%) |
| 5 to 17 Years | 0 (0.0%) | 10 (2.2%) |
| 18 to 34 Years | 33 (4.1%) | 0 (0.0%) |
| 35 to 64 Years | 40 (4.6%) | 72 (6.5%) |
| 65 to 74 Years | 29 (14.6%) | 38 (8.7%) |
| 75 Years and over | 66 (26.1%) | 43 (14.2%) |
Disability Class: Cognitive Difficulty
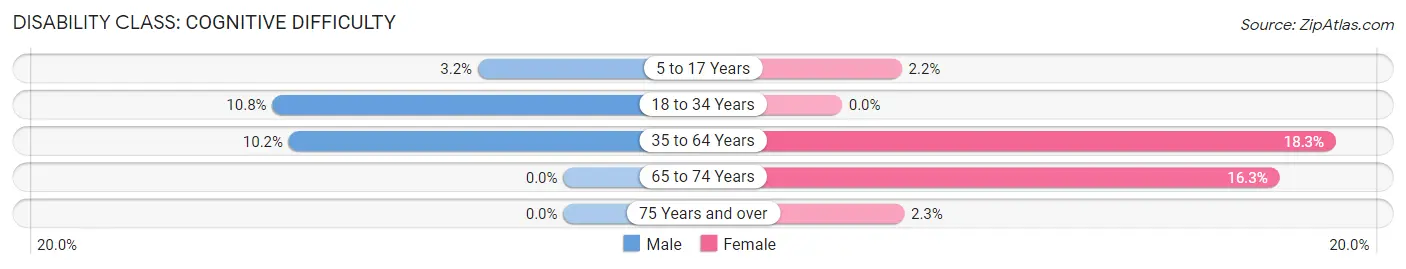
| Age Bracket | Male | Female |
| 5 to 17 Years | 15 (3.2%) | 10 (2.2%) |
| 18 to 34 Years | 88 (10.8%) | 0 (0.0%) |
| 35 to 64 Years | 89 (10.2%) | 203 (18.3%) |
| 65 to 74 Years | 0 (0.0%) | 71 (16.3%) |
| 75 Years and over | 0 (0.0%) | 7 (2.3%) |
Disability Class: Ambulatory Difficulty
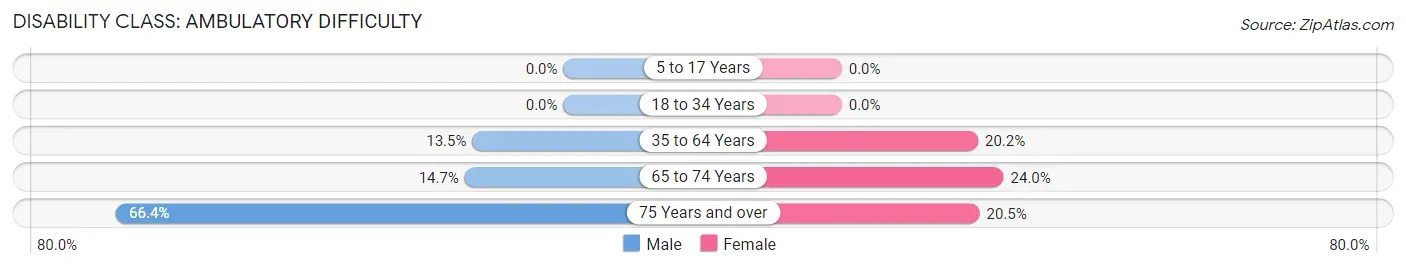
| Age Bracket | Male | Female |
| 5 to 17 Years | 0 (0.0%) | 0 (0.0%) |
| 18 to 34 Years | 0 (0.0%) | 0 (0.0%) |
| 35 to 64 Years | 118 (13.5%) | 224 (20.2%) |
| 65 to 74 Years | 29 (14.6%) | 105 (24.0%) |
| 75 Years and over | 168 (66.4%) | 62 (20.5%) |
Disability Class: Self-Care Difficulty
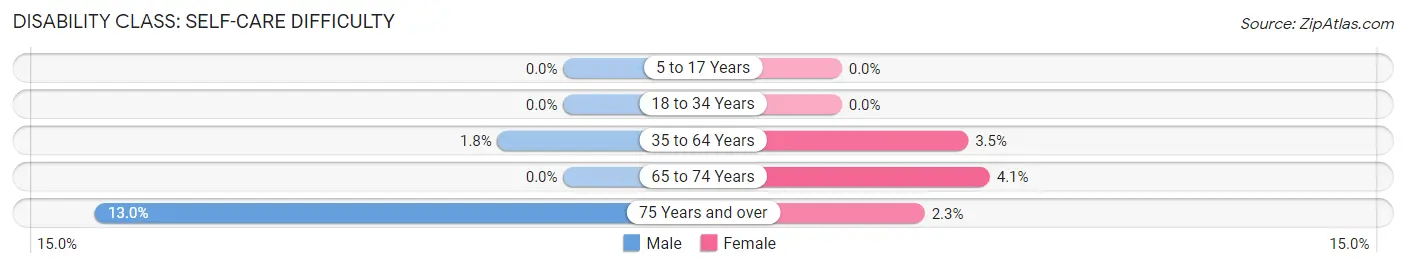
| Age Bracket | Male | Female |
| 5 to 17 Years | 0 (0.0%) | 0 (0.0%) |
| 18 to 34 Years | 0 (0.0%) | 0 (0.0%) |
| 35 to 64 Years | 16 (1.8%) | 39 (3.5%) |
| 65 to 74 Years | 0 (0.0%) | 18 (4.1%) |
| 75 Years and over | 33 (13.0%) | 7 (2.3%) |
Technology Access in Newport
Computing Device Access in Newport
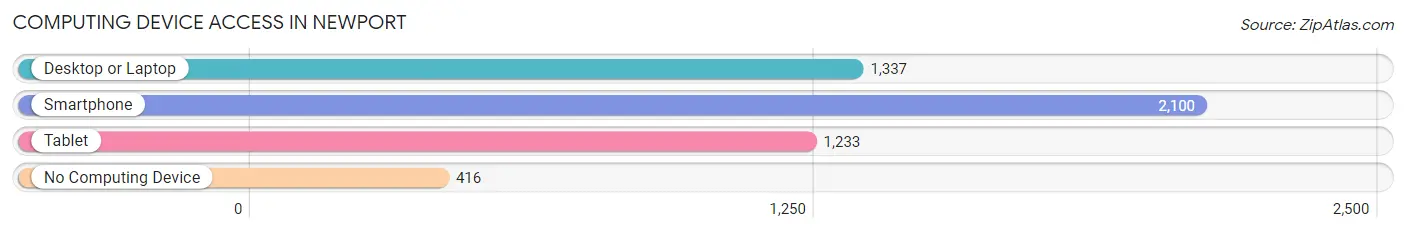
| Device Type | # Households | % Households |
| Desktop or Laptop | 1,337 | 50.1% |
| Smartphone | 2,100 | 78.6% |
| Tablet | 1,233 | 46.2% |
| No Computing Device | 416 | 15.6% |
| Total | 2,671 | 100.0% |
Internet Access in Newport
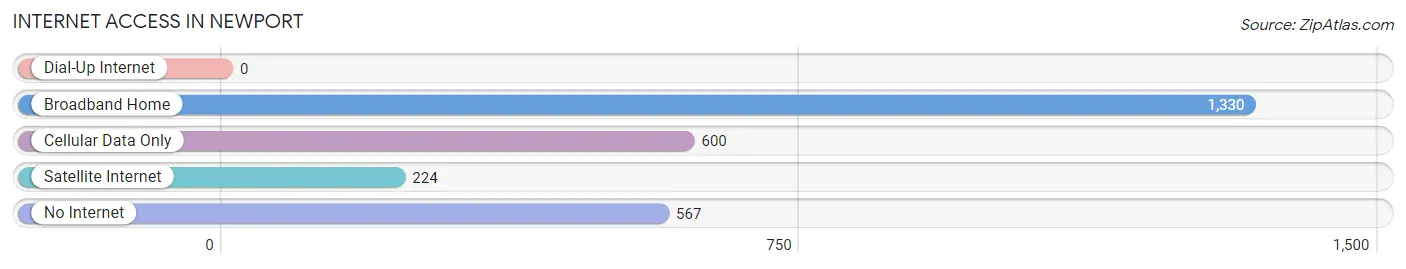
| Internet Type | # Households | % Households |
| Dial-Up Internet | 0 | 0.0% |
| Broadband Home | 1,330 | 49.8% |
| Cellular Data Only | 600 | 22.5% |
| Satellite Internet | 224 | 8.4% |
| No Internet | 567 | 21.2% |
| Total | 2,671 | 100.0% |
Newport Summary
Newport, Arkansas is a city located in Jackson County, Arkansas. It is the county seat of Jackson County and is located in the northeast corner of the state. The city is situated on the White River and is home to a population of approximately 7,000 people.
History
The area that is now Newport was first settled in the early 1800s by settlers from Tennessee and Kentucky. The first post office was established in 1837 and the town was officially incorporated in 1851. The city was named after the nearby Newport Barracks, which was a military post established in 1836.
During the Civil War, Newport was a major supply center for the Confederate Army. The city was also the site of several battles, including the Battle of Chalk Bluff in 1863. After the war, the city experienced a period of growth and development, with the establishment of several businesses and industries.
Geography
Newport is located in the northeast corner of Arkansas, in Jackson County. The city is situated on the White River and is surrounded by the Ozark Mountains. The city has a total area of 8.3 square miles, with a population density of 845 people per square mile.
The climate in Newport is humid subtropical, with hot, humid summers and mild winters. The average annual temperature is 63 degrees Fahrenheit, with an average annual precipitation of 48 inches.
Economy
The economy of Newport is largely based on agriculture and manufacturing. The city is home to several large manufacturing companies, including Newport Plastics, Newport Steel, and Newport Paper. The city also has a thriving tourism industry, with several attractions, including the White River National Wildlife Refuge, the Arkansas State University Museum, and the Arkansas Railroad Museum.
Demographics
As of the 2010 census, the population of Newport was 7,000 people. The racial makeup of the city was 79.3% White, 17.2% African American, 0.7% Native American, 0.4% Asian, 0.1% Pacific Islander, and 2.3% from other races. The median household income was $30,945, and the median family income was $37,917.
The largest employers in Newport are the Newport School District, the Newport Medical Center, and the Newport Plastics Company. The city also has a thriving retail sector, with several stores and restaurants located in the downtown area.
Conclusion
Newport, Arkansas is a city located in Jackson County, Arkansas. It is the county seat of Jackson County and is situated on the White River. The city has a population of approximately 7,000 people and is home to several large manufacturing companies. The economy of Newport is largely based on agriculture and manufacturing, and the city also has a thriving tourism industry. The racial makeup of the city is 79.3% White, 17.2% African American, 0.7% Native American, 0.4% Asian, 0.1% Pacific Islander, and 2.3% from other races. The median household income was $30,945, and the median family income was $37,917.
Common Questions
What is Per Capita Income in Newport?
Per Capita income in Newport is $17,455.
What is the Median Family Income in Newport?
Median Family Income in Newport is $47,586.
What is the Median Household income in Newport?
Median Household Income in Newport is $32,440.
What is Income or Wage Gap in Newport?
Income or Wage Gap in Newport is 34.9%.
Women in Newport earn 65.1 cents for every dollar earned by a man.
What is Family Income Deficit in Newport?
Family Income Deficit in Newport is $7,953.
Families that are below poverty line in Newport earn $7,953 less on average than the poverty threshold level.
What is Inequality or Gini Index in Newport?
Inequality or Gini Index in Newport is 0.47.
What is the Total Population of Newport?
Total Population of Newport is 7,984.
What is the Total Male Population of Newport?
Total Male Population of Newport is 3,605.
What is the Total Female Population of Newport?
Total Female Population of Newport is 4,379.
What is the Ratio of Males per 100 Females in Newport?
There are 82.32 Males per 100 Females in Newport.
What is the Ratio of Females per 100 Males in Newport?
There are 121.47 Females per 100 Males in Newport.
What is the Median Population Age in Newport?
Median Population Age in Newport is 39.0 Years.
What is the Average Family Size in Newport
Average Family Size in Newport is 2.8 People.
What is the Average Household Size in Newport
Average Household Size in Newport is 2.1 People.
How Large is the Labor Force in Newport?
There are 2,714 People in the Labor Forcein in Newport.
What is the Percentage of People in the Labor Force in Newport?
39.4% of People are in the Labor Force in Newport.
What is the Unemployment Rate in Newport?
Unemployment Rate in Newport is 13.1%.