New Blaine, AR Map & Demographics
New Blaine Map
New Blaine Overview
$20,572
PER CAPITA INCOME
$45,379
AVG HOUSEHOLD INCOME
0.35
INEQUALITY / GINI INDEX
378
TOTAL POPULATION
209
MALE POPULATION
169
FEMALE POPULATION
123.67
MALES / 100 FEMALES
80.86
FEMALES / 100 MALES
54.8
MEDIAN AGE
3.1
AVG FAMILY SIZE
2.7
AVG HOUSEHOLD SIZE
156
LABOR FORCE [ PEOPLE ]
46.7%
PERCENT IN LABOR FORCE
New Blaine Zip Codes
New Blaine Area Codes
Income in New Blaine
Income Overview in New Blaine
| Characteristic | Number | Measure |
| Per Capita Income | 378 | $20,572 |
| Median Family Income | 115 | $0 |
| Mean Family Income | 115 | $62,890 |
| Median Household Income | 140 | $45,379 |
| Mean Household Income | 140 | $56,066 |
| Income Deficit | 115 | $0 |
| Wage / Income Gap (%) | 378 | 0.00% |
| Wage / Income Gap ($) | 378 | 100.00¢ per $1 |
| Gini / Inequality Index | 378 | 0.35 |
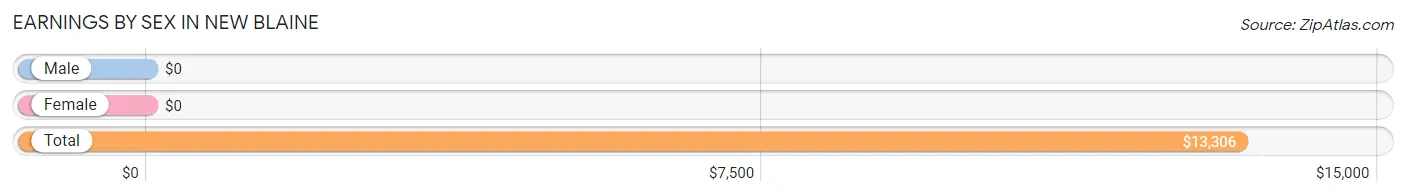
Earnings by Sex in New Blaine
| Sex | Number | Average Earnings |
| Male | 124 (79.5%) | $0 |
| Female | 32 (20.5%) | $0 |
| Total | 156 (100.0%) | $13,306 |
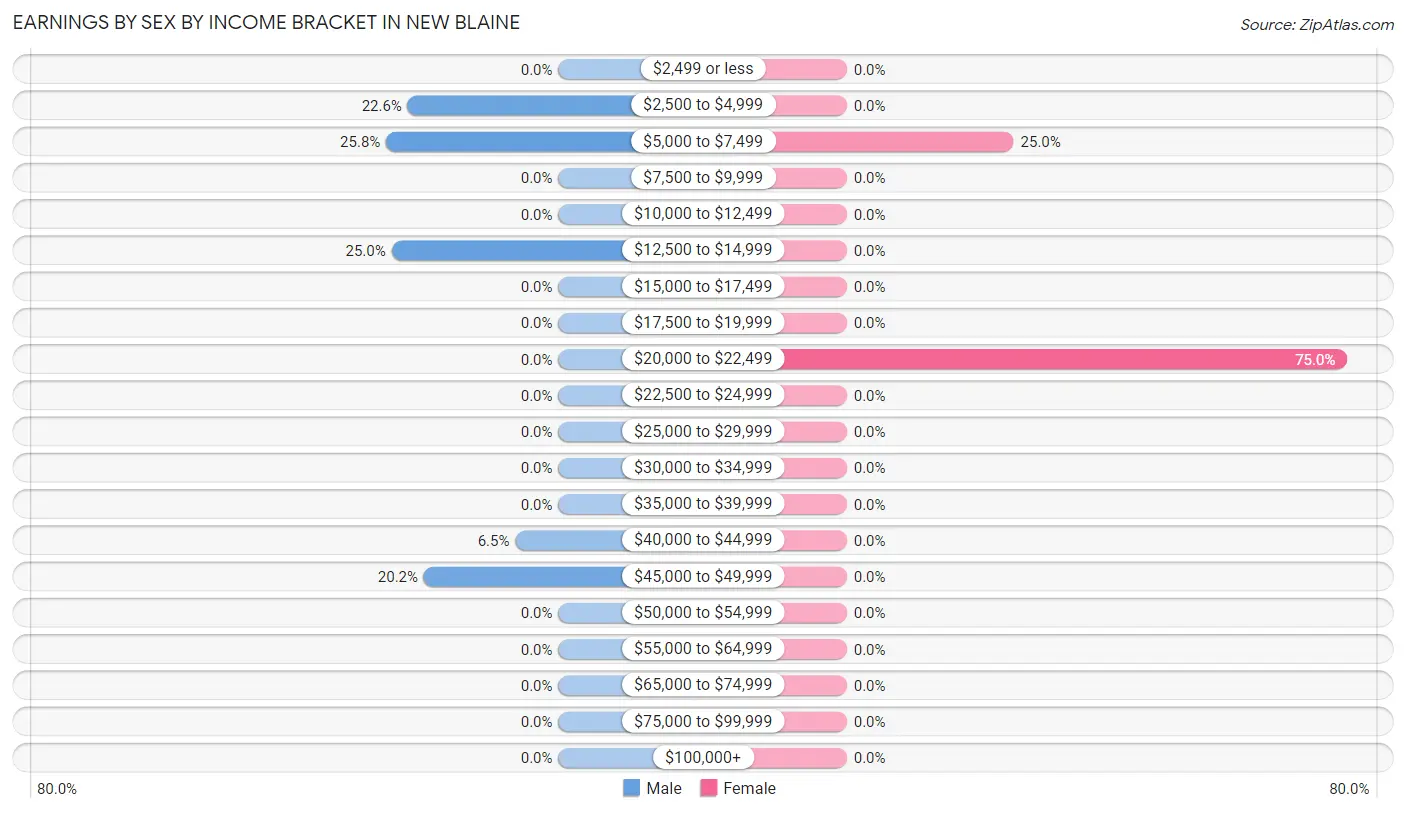
Earnings by Sex by Income Bracket in New Blaine
The most common earnings brackets in New Blaine are $5,000 to $7,499 for men (32 | 25.8%) and $20,000 to $22,499 for women (24 | 75.0%).
| Income | Male | Female |
| $2,499 or less | 0 (0.0%) | 0 (0.0%) |
| $2,500 to $4,999 | 28 (22.6%) | 0 (0.0%) |
| $5,000 to $7,499 | 32 (25.8%) | 8 (25.0%) |
| $7,500 to $9,999 | 0 (0.0%) | 0 (0.0%) |
| $10,000 to $12,499 | 0 (0.0%) | 0 (0.0%) |
| $12,500 to $14,999 | 31 (25.0%) | 0 (0.0%) |
| $15,000 to $17,499 | 0 (0.0%) | 0 (0.0%) |
| $17,500 to $19,999 | 0 (0.0%) | 0 (0.0%) |
| $20,000 to $22,499 | 0 (0.0%) | 24 (75.0%) |
| $22,500 to $24,999 | 0 (0.0%) | 0 (0.0%) |
| $25,000 to $29,999 | 0 (0.0%) | 0 (0.0%) |
| $30,000 to $34,999 | 0 (0.0%) | 0 (0.0%) |
| $35,000 to $39,999 | 0 (0.0%) | 0 (0.0%) |
| $40,000 to $44,999 | 8 (6.5%) | 0 (0.0%) |
| $45,000 to $49,999 | 25 (20.2%) | 0 (0.0%) |
| $50,000 to $54,999 | 0 (0.0%) | 0 (0.0%) |
| $55,000 to $64,999 | 0 (0.0%) | 0 (0.0%) |
| $65,000 to $74,999 | 0 (0.0%) | 0 (0.0%) |
| $75,000 to $99,999 | 0 (0.0%) | 0 (0.0%) |
| $100,000+ | 0 (0.0%) | 0 (0.0%) |
| Total | 124 (100.0%) | 32 (100.0%) |
Earnings by Sex by Educational Attainment in New Blaine
| Educational Attainment | Male Income | Female Income |
| Less than High School | - | - |
| High School Diploma | - | - |
| College or Associate's Degree | - | - |
| Bachelor's Degree | - | - |
| Graduate Degree | - | - |
| Total | - | - |
Family Income in New Blaine
Family Income Brackets in New Blaine
According to the New Blaine family income data, there are 61 families falling into the $35,000 to $49,999 income range, which is the most common income bracket and makes up 53.0% of all families.
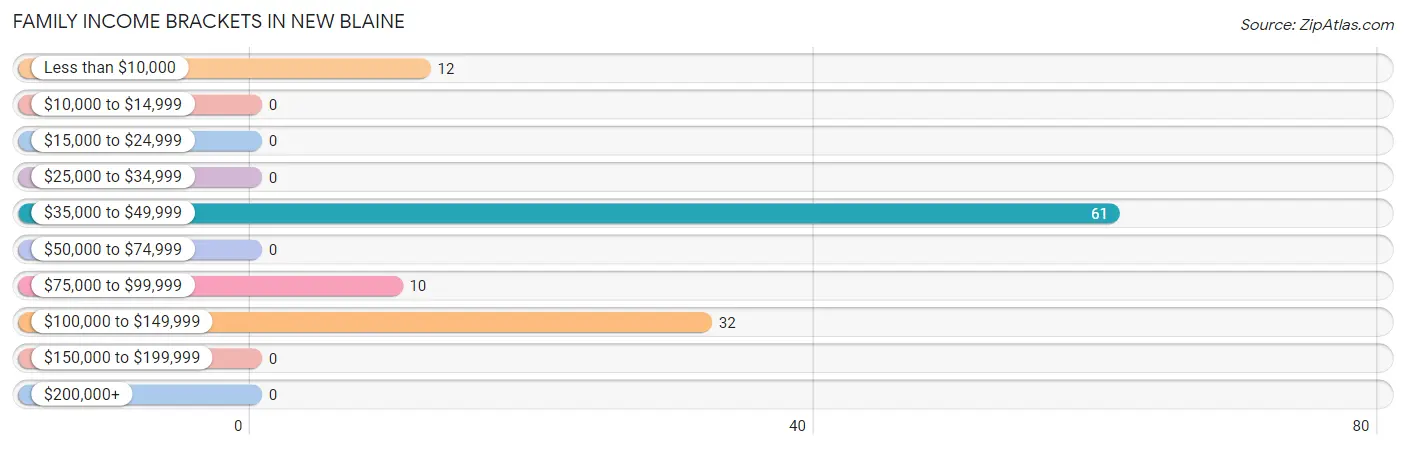
| Income Bracket | # Families | % Families |
| Less than $10,000 | 12 | 10.4% |
| $10,000 to $14,999 | 0 | 0.0% |
| $15,000 to $24,999 | 0 | 0.0% |
| $25,000 to $34,999 | 0 | 0.0% |
| $35,000 to $49,999 | 61 | 53.0% |
| $50,000 to $74,999 | 0 | 0.0% |
| $75,000 to $99,999 | 10 | 8.7% |
| $100,000 to $149,999 | 32 | 27.8% |
| $150,000 to $199,999 | 0 | 0.0% |
| $200,000+ | 0 | 0.0% |
Family Income by Famaliy Size in New Blaine
2-person families (43 | 37.4%) account for the highest median family income in New Blaine with $46,629 per family, while 2-person families (43 | 37.4%) have the highest median income of $23,314 per family member.
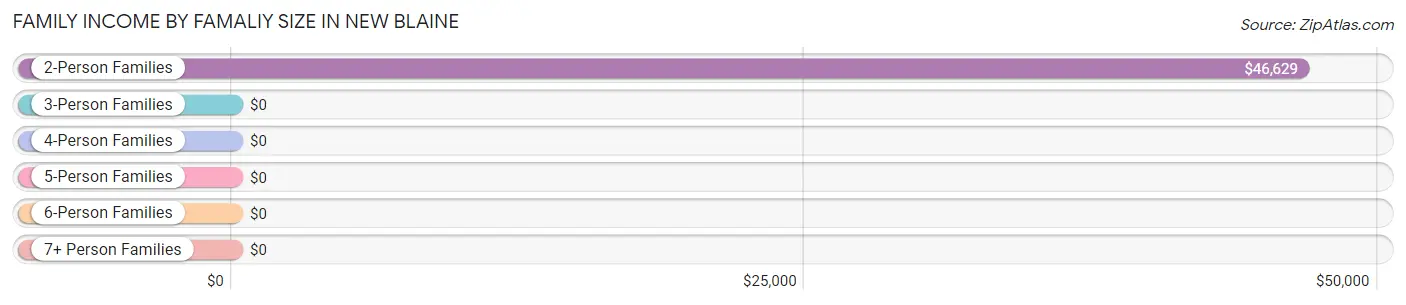
| Income Bracket | # Families | Median Income |
| 2-Person Families | 43 (37.4%) | $46,629 |
| 3-Person Families | 32 (27.8%) | $0 |
| 4-Person Families | 0 (0.0%) | $0 |
| 5-Person Families | 40 (34.8%) | $0 |
| 6-Person Families | 0 (0.0%) | $0 |
| 7+ Person Families | 0 (0.0%) | $0 |
| Total | 115 (100.0%) | $0 |
Family Income by Number of Earners in New Blaine
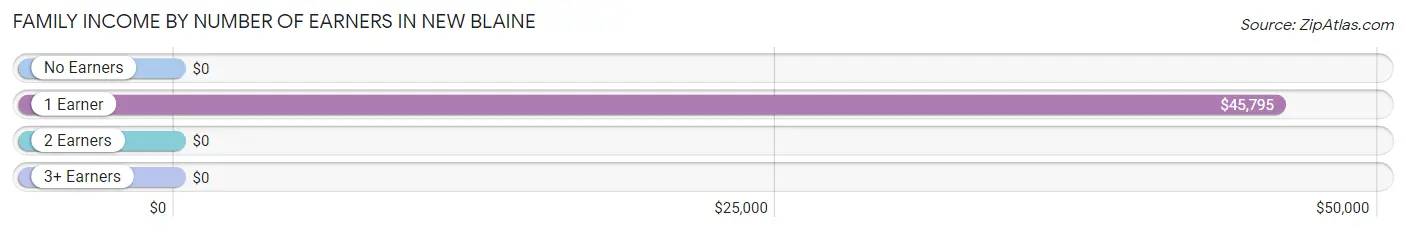
| Number of Earners | # Families | Median Income |
| No Earners | 10 (8.7%) | $0 |
| 1 Earner | 45 (39.1%) | $45,795 |
| 2 Earners | 60 (52.2%) | $0 |
| 3+ Earners | 0 (0.0%) | $0 |
| Total | 115 (100.0%) | $0 |
Household Income in New Blaine
Household Income Brackets in New Blaine
With 61 households falling in the category, the $35,000 to $49,999 income range is the most frequent in New Blaine, accounting for 43.6% of all households.
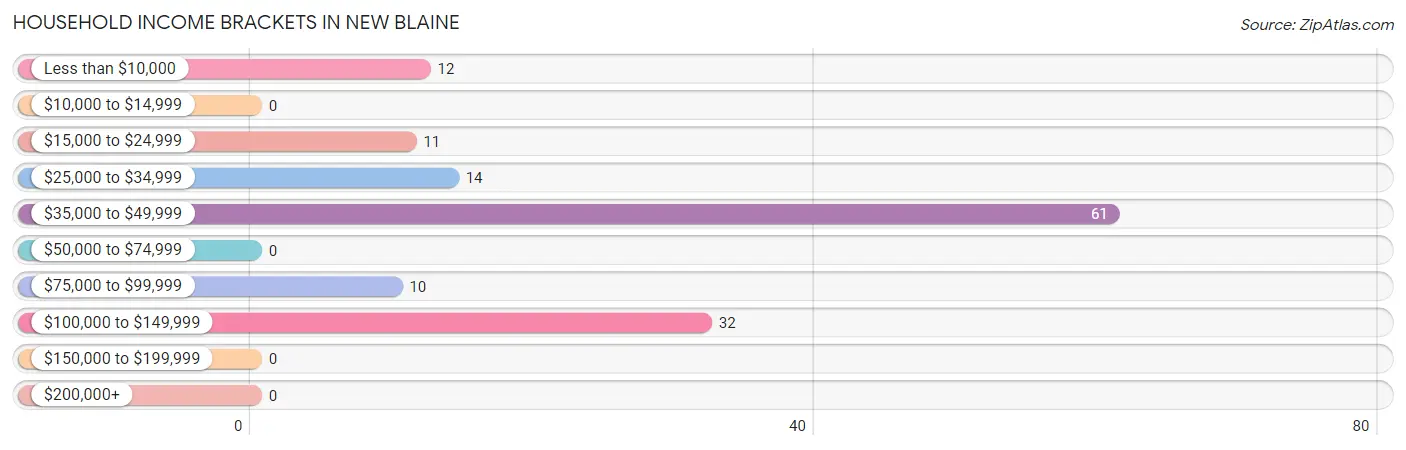
| Income Bracket | # Households | % Households |
| Less than $10,000 | 12 | 8.6% |
| $10,000 to $14,999 | 0 | 0.0% |
| $15,000 to $24,999 | 11 | 7.9% |
| $25,000 to $34,999 | 14 | 10.0% |
| $35,000 to $49,999 | 61 | 43.6% |
| $50,000 to $74,999 | 0 | 0.0% |
| $75,000 to $99,999 | 10 | 7.1% |
| $100,000 to $149,999 | 32 | 22.9% |
| $150,000 to $199,999 | 0 | 0.0% |
| $200,000+ | 0 | 0.0% |
Household Income by Householder Age in New Blaine
The median household income in New Blaine is $45,379, with the highest median household income of $39,330 found in the 45 to 64 years age bracket for the primary householder. A total of 65 households (46.4%) fall into this category.
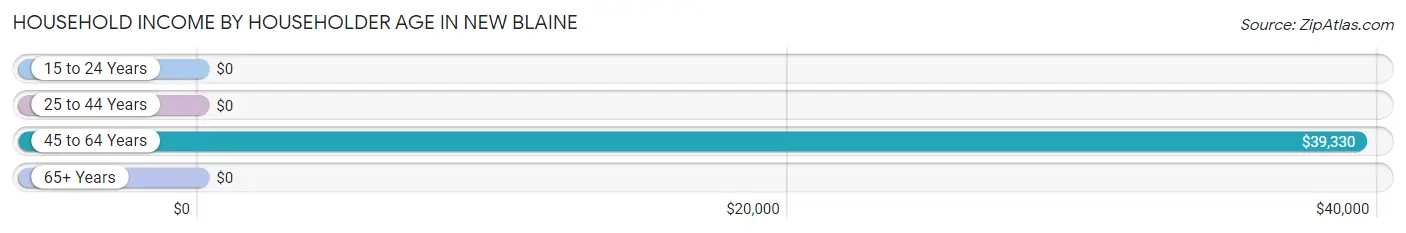
| Income Bracket | # Households | Median Income |
| 15 to 24 Years | 0 (0.0%) | $0 |
| 25 to 44 Years | 0 (0.0%) | $0 |
| 45 to 64 Years | 65 (46.4%) | $39,330 |
| 65+ Years | 75 (53.6%) | $0 |
| Total | 140 (100.0%) | $45,379 |
Poverty in New Blaine
Income Below Poverty by Sex and Age in New Blaine
With 10.1% poverty level for males and 18.3% for females among the residents of New Blaine, 6 to 11 year old males and 6 to 11 year old females are the most vulnerable to poverty, with 11 males (100.0%) and 11 females (100.0%) in their respective age groups living below the poverty level.
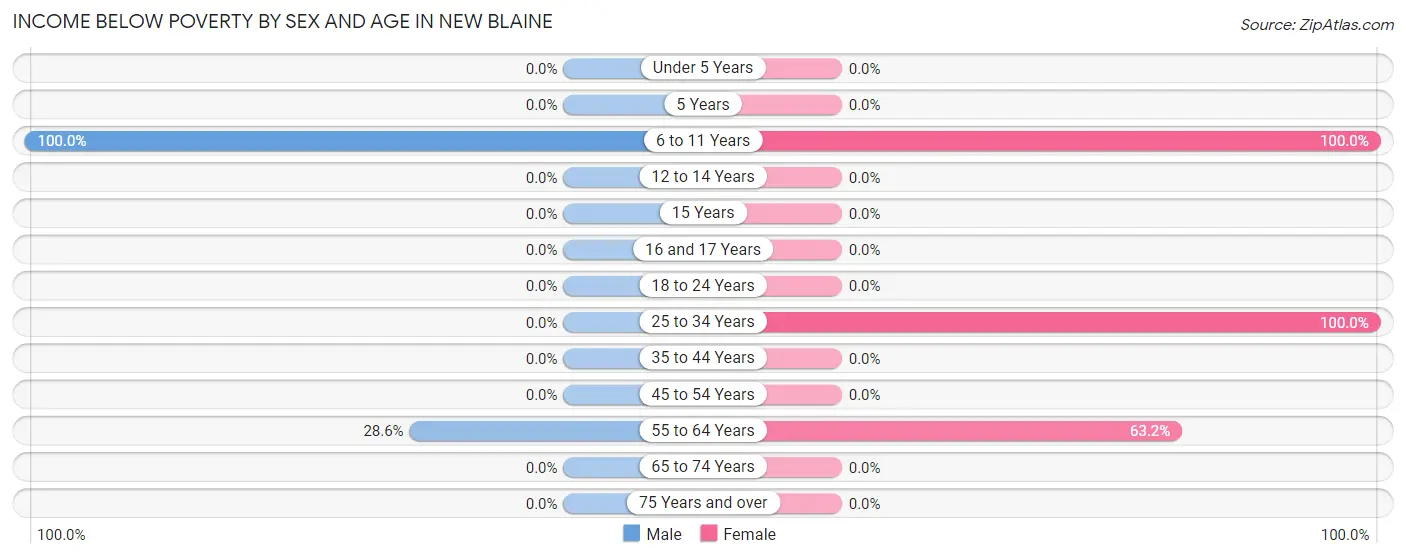
| Age Bracket | Male | Female |
| Under 5 Years | 0 (0.0%) | 0 (0.0%) |
| 5 Years | 0 (0.0%) | 0 (0.0%) |
| 6 to 11 Years | 11 (100.0%) | 11 (100.0%) |
| 12 to 14 Years | 0 (0.0%) | 0 (0.0%) |
| 15 Years | 0 (0.0%) | 0 (0.0%) |
| 16 and 17 Years | 0 (0.0%) | 0 (0.0%) |
| 18 to 24 Years | 0 (0.0%) | 0 (0.0%) |
| 25 to 34 Years | 0 (0.0%) | 8 (100.0%) |
| 35 to 44 Years | 0 (0.0%) | 0 (0.0%) |
| 45 to 54 Years | 0 (0.0%) | 0 (0.0%) |
| 55 to 64 Years | 10 (28.6%) | 12 (63.2%) |
| 65 to 74 Years | 0 (0.0%) | 0 (0.0%) |
| 75 Years and over | 0 (0.0%) | 0 (0.0%) |
| Total | 21 (10.1%) | 31 (18.3%) |
Income Above Poverty by Sex and Age in New Blaine
According to the poverty statistics in New Blaine, males aged 12 to 14 years and females aged 16 and 17 years are the age groups that are most secure financially, with 100.0% of males and 100.0% of females in these age groups living above the poverty line.
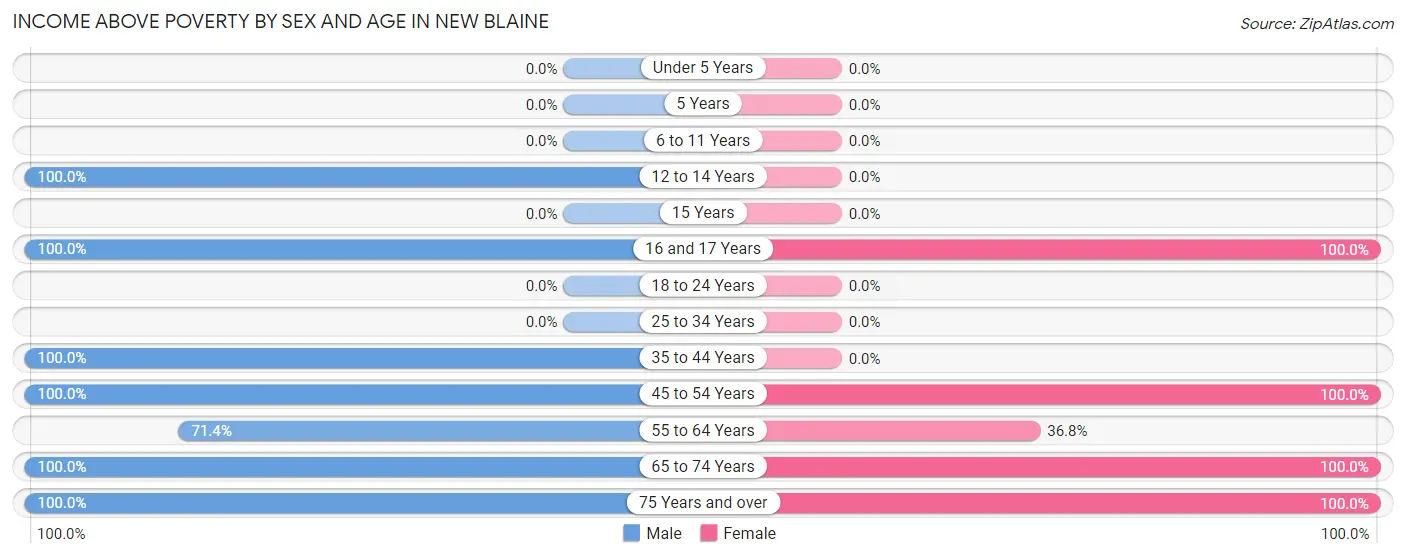
| Age Bracket | Male | Female |
| Under 5 Years | 0 (0.0%) | 0 (0.0%) |
| 5 Years | 0 (0.0%) | 0 (0.0%) |
| 6 to 11 Years | 0 (0.0%) | 0 (0.0%) |
| 12 to 14 Years | 22 (100.0%) | 0 (0.0%) |
| 15 Years | 0 (0.0%) | 0 (0.0%) |
| 16 and 17 Years | 21 (100.0%) | 13 (100.0%) |
| 18 to 24 Years | 0 (0.0%) | 0 (0.0%) |
| 25 to 34 Years | 0 (0.0%) | 0 (0.0%) |
| 35 to 44 Years | 31 (100.0%) | 0 (0.0%) |
| 45 to 54 Years | 28 (100.0%) | 59 (100.0%) |
| 55 to 64 Years | 25 (71.4%) | 7 (36.8%) |
| 65 to 74 Years | 40 (100.0%) | 36 (100.0%) |
| 75 Years and over | 21 (100.0%) | 23 (100.0%) |
| Total | 188 (89.9%) | 138 (81.7%) |
Income Below Poverty Among Married-Couple Families in New Blaine
The poverty statistics for married-couple families in New Blaine show that 10.4% or 12 of the total 115 families live below the poverty line. Families with 1 or 2 children have the highest poverty rate of 100.0%, comprising of 12 families. On the other hand, families with no children have the lowest poverty rate of 0.0%, which includes 0 families.
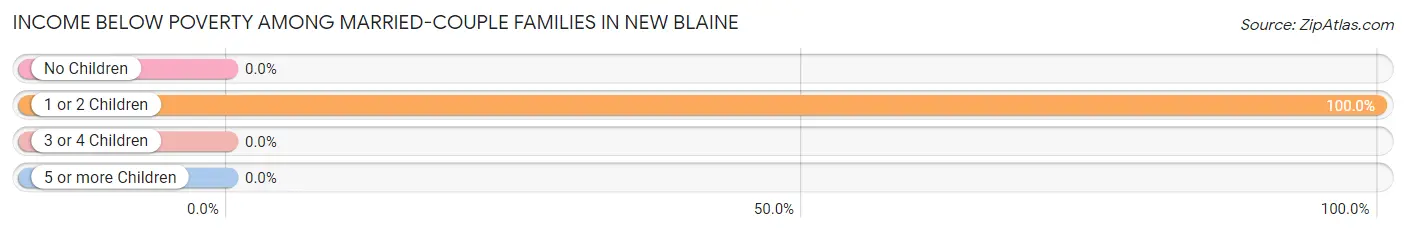
| Children | Above Poverty | Below Poverty |
| No Children | 75 (100.0%) | 0 (0.0%) |
| 1 or 2 Children | 0 (0.0%) | 12 (100.0%) |
| 3 or 4 Children | 28 (100.0%) | 0 (0.0%) |
| 5 or more Children | 0 (0.0%) | 0 (0.0%) |
| Total | 103 (89.6%) | 12 (10.4%) |
Income Below Poverty Among Single-Parent Households in New Blaine
| Children | Single Father | Single Mother |
| No Children | 0 (0.0%) | 0 (0.0%) |
| 1 or 2 Children | 0 (0.0%) | 0 (0.0%) |
| 3 or 4 Children | 0 (0.0%) | 0 (0.0%) |
| 5 or more Children | 0 (0.0%) | 0 (0.0%) |
| Total | 0 (0.0%) | 0 (0.0%) |
Income Below Poverty Among Married-Couple vs Single-Parent Households in New Blaine
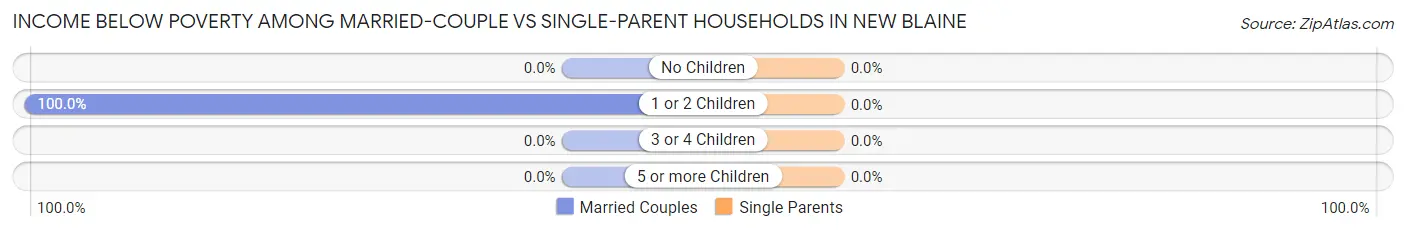
| Children | Married-Couple Families | Single-Parent Households |
| No Children | 0 (0.0%) | 0 (0.0%) |
| 1 or 2 Children | 12 (100.0%) | 0 (0.0%) |
| 3 or 4 Children | 0 (0.0%) | 0 (0.0%) |
| 5 or more Children | 0 (0.0%) | 0 (0.0%) |
| Total | 12 (10.4%) | 0 (0.0%) |
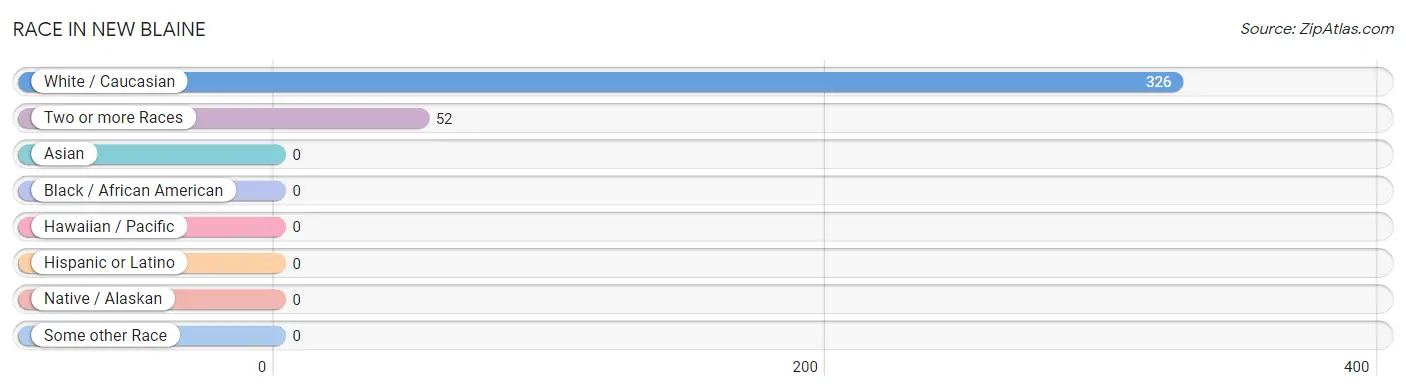
Race in New Blaine
The most populous races in New Blaine are White / Caucasian (326 | 86.2%), and Two or more Races (52 | 13.8%).
| Race | # Population | % Population |
| Asian | 0 | 0.0% |
| Black / African American | 0 | 0.0% |
| Hawaiian / Pacific | 0 | 0.0% |
| Hispanic or Latino | 0 | 0.0% |
| Native / Alaskan | 0 | 0.0% |
| White / Caucasian | 326 | 86.2% |
| Two or more Races | 52 | 13.8% |
| Some other Race | 0 | 0.0% |
| Total | 378 | 100.0% |
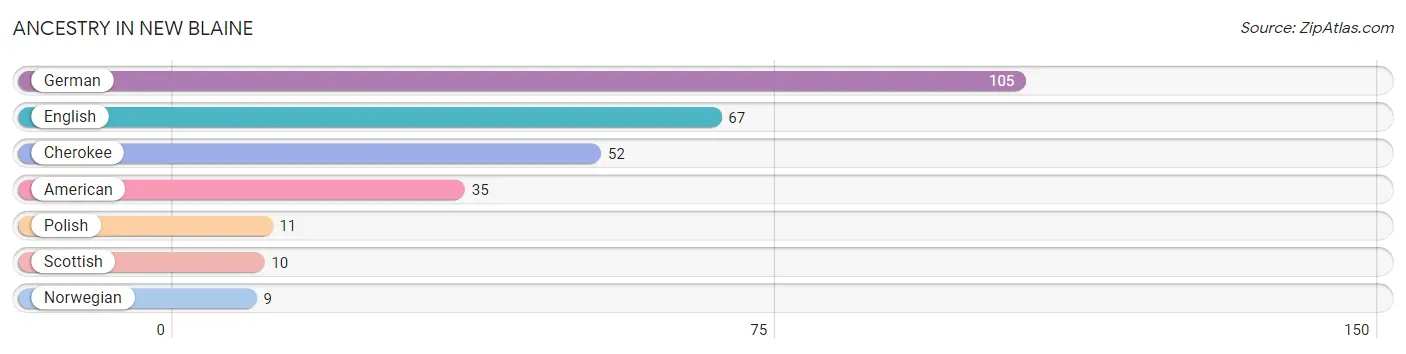
Ancestry in New Blaine
The most populous ancestries reported in New Blaine are German (105 | 27.8%), English (67 | 17.7%), Cherokee (52 | 13.8%), American (35 | 9.3%), and Polish (11 | 2.9%), together accounting for 71.4% of all New Blaine residents.
| Ancestry | # Population | % Population |
| American | 35 | 9.3% |
| Cherokee | 52 | 13.8% |
| English | 67 | 17.7% |
| German | 105 | 27.8% |
| Norwegian | 9 | 2.4% |
| Polish | 11 | 2.9% |
| Scottish | 10 | 2.6% | View All 7 Rows |
Immigrants in New Blaine

| Immigration Origin | # Population | % Population | View All 0 Rows |
Sex and Age in New Blaine
Sex and Age in New Blaine
The most populous age groups in New Blaine are 65 to 69 Years (40 | 19.1%) for men and 50 to 54 Years (59 | 34.9%) for women.
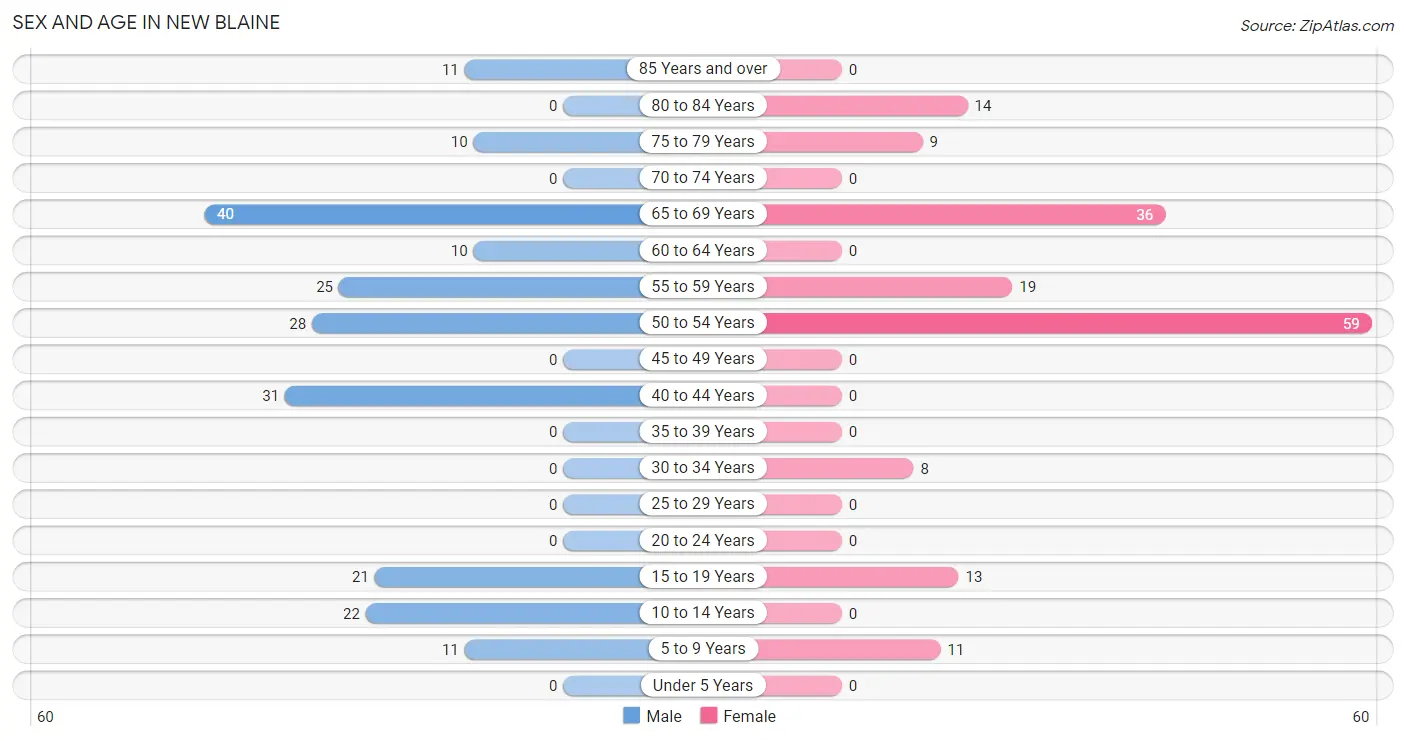
| Age Bracket | Male | Female |
| Under 5 Years | 0 (0.0%) | 0 (0.0%) |
| 5 to 9 Years | 11 (5.3%) | 11 (6.5%) |
| 10 to 14 Years | 22 (10.5%) | 0 (0.0%) |
| 15 to 19 Years | 21 (10.1%) | 13 (7.7%) |
| 20 to 24 Years | 0 (0.0%) | 0 (0.0%) |
| 25 to 29 Years | 0 (0.0%) | 0 (0.0%) |
| 30 to 34 Years | 0 (0.0%) | 8 (4.7%) |
| 35 to 39 Years | 0 (0.0%) | 0 (0.0%) |
| 40 to 44 Years | 31 (14.8%) | 0 (0.0%) |
| 45 to 49 Years | 0 (0.0%) | 0 (0.0%) |
| 50 to 54 Years | 28 (13.4%) | 59 (34.9%) |
| 55 to 59 Years | 25 (12.0%) | 19 (11.2%) |
| 60 to 64 Years | 10 (4.8%) | 0 (0.0%) |
| 65 to 69 Years | 40 (19.1%) | 36 (21.3%) |
| 70 to 74 Years | 0 (0.0%) | 0 (0.0%) |
| 75 to 79 Years | 10 (4.8%) | 9 (5.3%) |
| 80 to 84 Years | 0 (0.0%) | 14 (8.3%) |
| 85 Years and over | 11 (5.3%) | 0 (0.0%) |
| Total | 209 (100.0%) | 169 (100.0%) |
Families and Households in New Blaine
Median Family Size in New Blaine
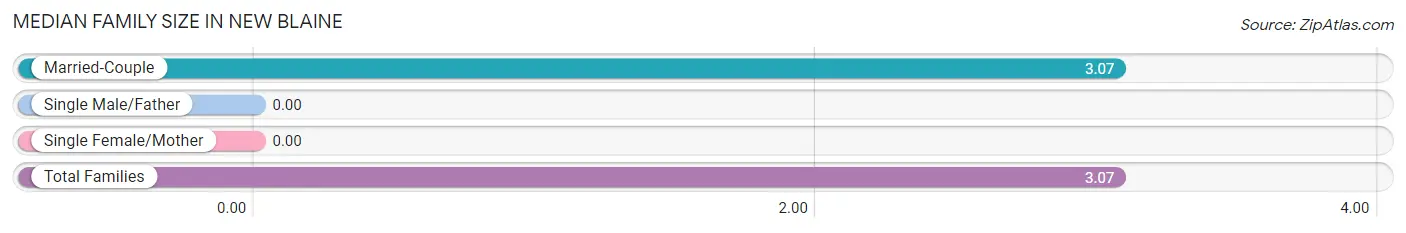
| Family Type | # Families | Family Size |
| Married-Couple | 115 (100.0%) | 3.07 |
| Single Male/Father | 0 (0.0%) | - |
| Single Female/Mother | 0 (0.0%) | - |
| Total Families | 115 (100.0%) | 3.07 |
Median Household Size in New Blaine
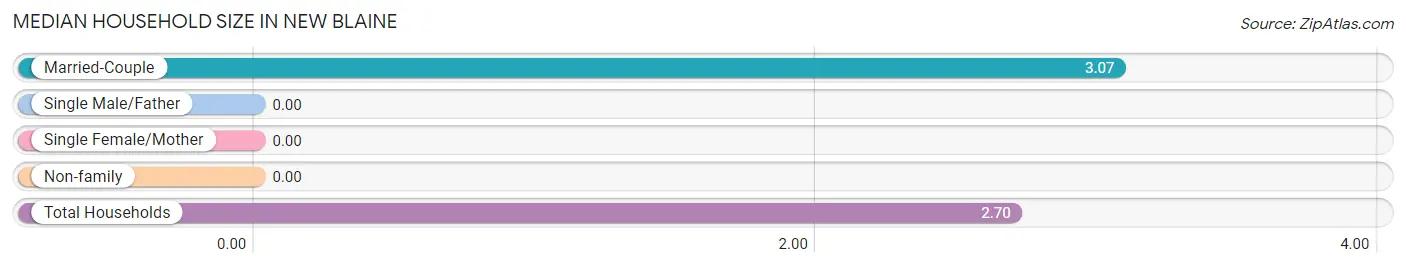
| Household Type | # Households | Household Size |
| Married-Couple | 115 (82.1%) | 3.07 |
| Single Male/Father | 0 (0.0%) | - |
| Single Female/Mother | 0 (0.0%) | - |
| Non-family | 25 (17.9%) | - |
| Total Households | 140 (100.0%) | 2.70 |
Household Size by Marriage Status in New Blaine
Out of a total of 140 households in New Blaine, 115 (82.1%) are family households, while 25 (17.9%) are nonfamily households. The most numerous type of family households are 2-person households, comprising 43, and the most common type of nonfamily households are 1-person households, comprising 25.
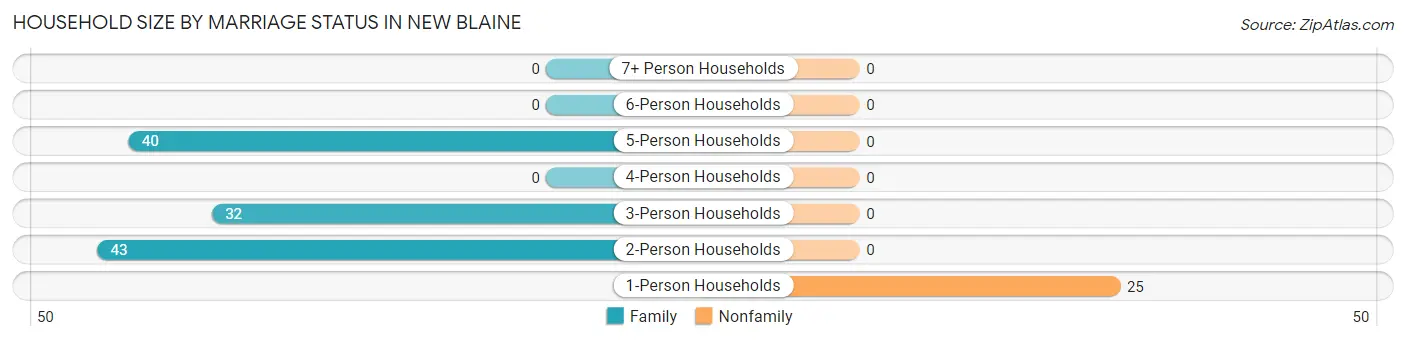
| Household Size | Family Households | Nonfamily Households |
| 1-Person Households | - | 25 (17.9%) |
| 2-Person Households | 43 (30.7%) | 0 (0.0%) |
| 3-Person Households | 32 (22.9%) | 0 (0.0%) |
| 4-Person Households | 0 (0.0%) | 0 (0.0%) |
| 5-Person Households | 40 (28.6%) | 0 (0.0%) |
| 6-Person Households | 0 (0.0%) | 0 (0.0%) |
| 7+ Person Households | 0 (0.0%) | 0 (0.0%) |
| Total | 115 (82.1%) | 25 (17.9%) |
Female Fertility in New Blaine
Fertility by Age in New Blaine
| Age Bracket | Women with Births | Births / 1,000 Women |
| 15 to 19 years | 0 (0.0%) | 0.0 |
| 20 to 34 years | 0 (0.0%) | 0.0 |
| 35 to 50 years | 0 (0.0%) | 0.0 |
| Total | 0 (0.0%) | 0.0 |
Fertility by Age by Marriage Status in New Blaine
| Age Bracket | Married | Unmarried |
| 15 to 19 years | 0 (0.0%) | 0 (0.0%) |
| 20 to 34 years | 0 (0.0%) | 0 (0.0%) |
| 35 to 50 years | 0 (0.0%) | 0 (0.0%) |
| Total | 0 (0.0%) | 0 (0.0%) |
Fertility by Education in New Blaine
| Educational Attainment | Women with Births | Births / 1,000 Women |
| Less than High School | 0 (0.0%) | 0.0 |
| High School Diploma | 0 (0.0%) | 0.0 |
| College or Associate's Degree | 0 (0.0%) | 0.0 |
| Bachelor's Degree | 0 (0.0%) | 0.0 |
| Graduate Degree | 0 (0.0%) | 0.0 |
| Total | 0 (0.0%) | 0.0 |
Fertility by Education by Marriage Status in New Blaine
| Educational Attainment | Married | Unmarried |
| Less than High School | 0 (0.0%) | 0 (0.0%) |
| High School Diploma | 0 (0.0%) | 0 (0.0%) |
| College or Associate's Degree | 0 (0.0%) | 0 (0.0%) |
| Bachelor's Degree | 0 (0.0%) | 0 (0.0%) |
| Graduate Degree | 0 (0.0%) | 0 (0.0%) |
| Total | 0 (0.0%) | 0 (0.0%) |
Employment Characteristics in New Blaine
Employment by Class of Employer in New Blaine
Among the 128 employed individuals in New Blaine, private company employees (64 | 50.0%), self-employed (incorporated) (32 | 25.0%), and local government employees (24 | 18.8%) make up the most common classes of employment.
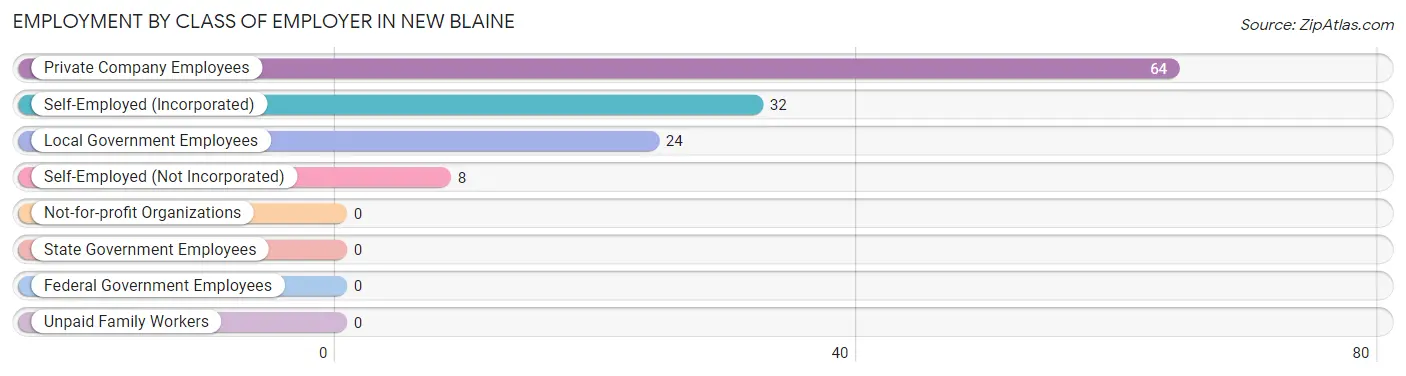
| Employer Class | # Employees | % Employees |
| Private Company Employees | 64 | 50.0% |
| Self-Employed (Incorporated) | 32 | 25.0% |
| Self-Employed (Not Incorporated) | 8 | 6.2% |
| Not-for-profit Organizations | 0 | 0.0% |
| Local Government Employees | 24 | 18.8% |
| State Government Employees | 0 | 0.0% |
| Federal Government Employees | 0 | 0.0% |
| Unpaid Family Workers | 0 | 0.0% |
| Total | 128 | 100.0% |
Employment Status by Age in New Blaine
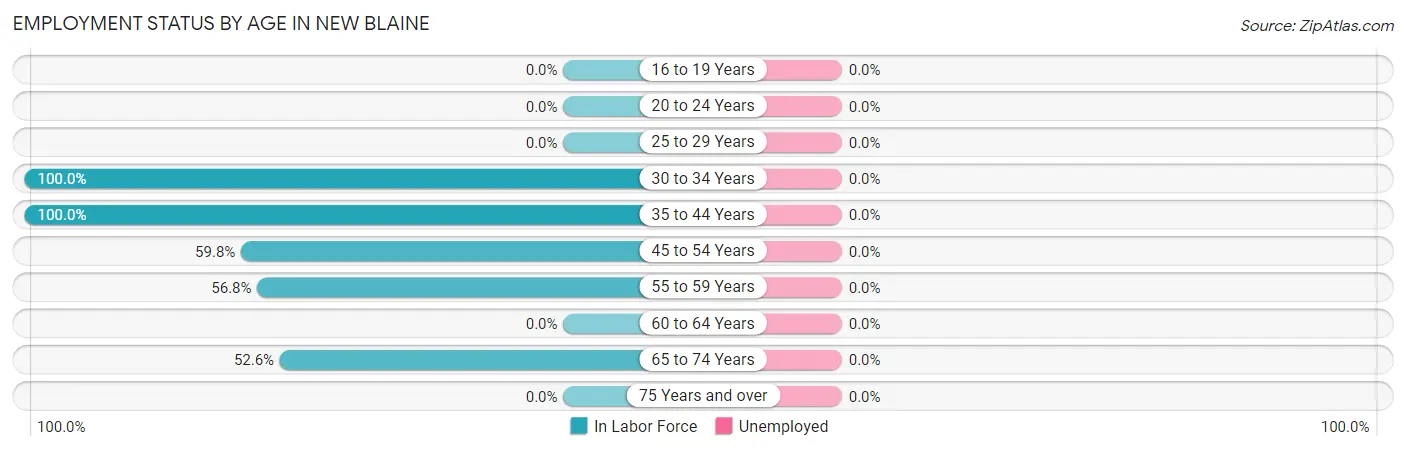
| Age Bracket | In Labor Force | Unemployed |
| 16 to 19 Years | 0 (0.0%) | 0 (0.0%) |
| 20 to 24 Years | 0 (0.0%) | 0 (0.0%) |
| 25 to 29 Years | 0 (0.0%) | 0 (0.0%) |
| 30 to 34 Years | 8 (100.0%) | 0 (0.0%) |
| 35 to 44 Years | 31 (100.0%) | 0 (0.0%) |
| 45 to 54 Years | 52 (59.8%) | 0 (0.0%) |
| 55 to 59 Years | 25 (56.8%) | 0 (0.0%) |
| 60 to 64 Years | 0 (0.0%) | 0 (0.0%) |
| 65 to 74 Years | 40 (52.6%) | 0 (0.0%) |
| 75 Years and over | 0 (0.0%) | 0 (0.0%) |
| Total | 156 (46.7%) | 0 (0.0%) |
Employment Status by Educational Attainment in New Blaine
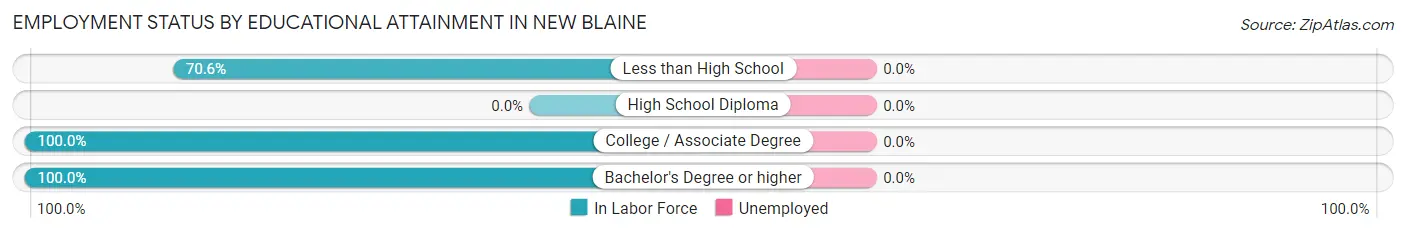
| Educational Attainment | In Labor Force | Unemployed |
| Less than High School | 24 (70.6%) | 0 (0.0%) |
| High School Diploma | 0 (0.0%) | 0 (0.0%) |
| College / Associate Degree | 33 (100.0%) | 0 (0.0%) |
| Bachelor's Degree or higher | 59 (100.0%) | 0 (0.0%) |
| Total | 116 (64.4%) | 0 (0.0%) |
Employment Occupations by Sex in New Blaine
Management, Business, Science and Arts Occupations
The most common Management, Business, Science and Arts occupations in New Blaine are Business & Financial (57 | 36.5%), Community & Social Service (55 | 35.3%), Legal Services & Support (31 | 19.9%), and Education Instruction & Library (24 | 15.4%).
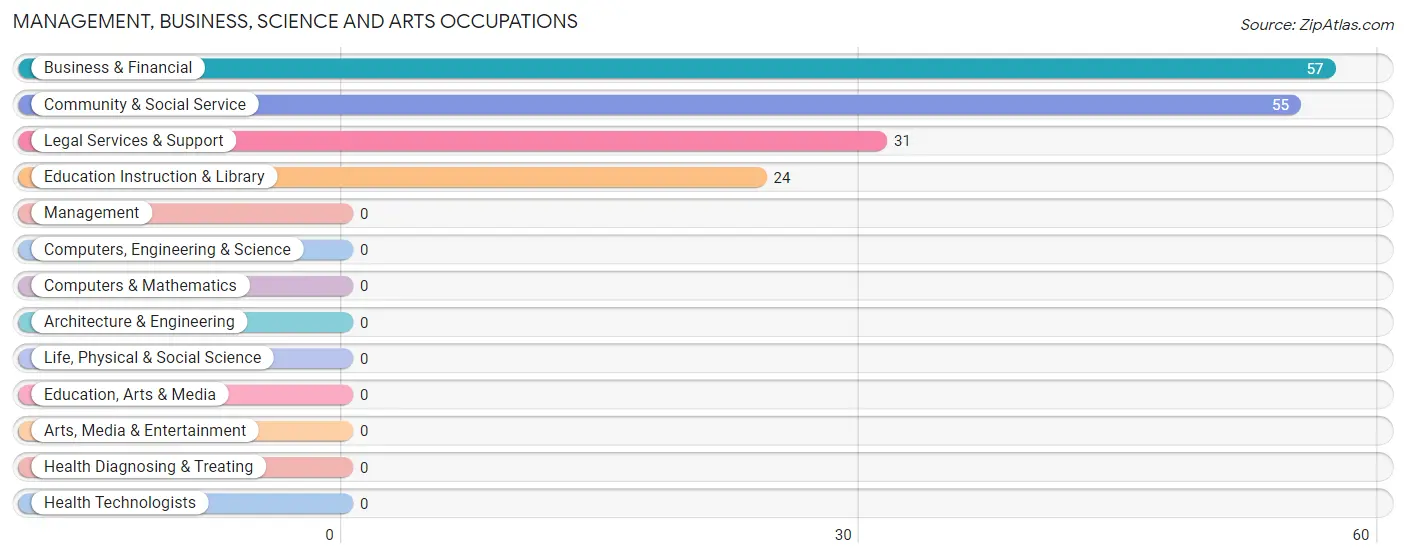
Management, Business, Science and Arts Occupations by Sex
Within the Management, Business, Science and Arts occupations in New Blaine, the most male-oriented occupations are Business & Financial (100.0%), Legal Services & Support (100.0%), and Community & Social Service (56.4%), while the most female-oriented occupations are Education Instruction & Library (100.0%), and Community & Social Service (43.6%).
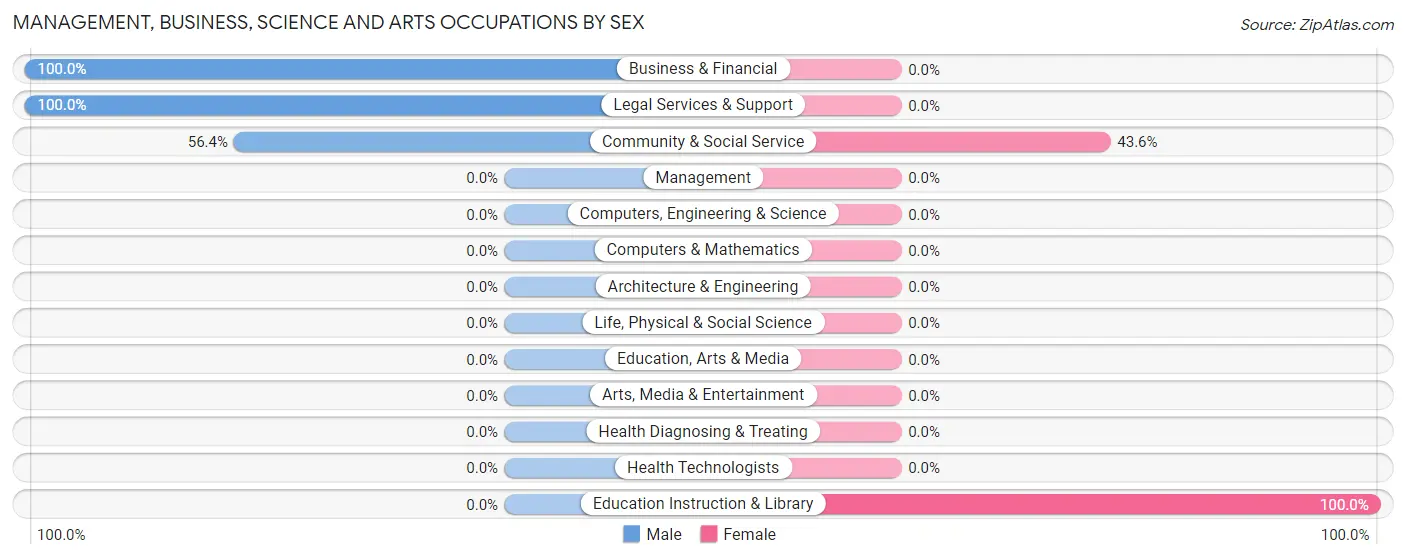
| Occupation | Male | Female |
| Management | 0 (0.0%) | 0 (0.0%) |
| Business & Financial | 57 (100.0%) | 0 (0.0%) |
| Computers, Engineering & Science | 0 (0.0%) | 0 (0.0%) |
| Computers & Mathematics | 0 (0.0%) | 0 (0.0%) |
| Architecture & Engineering | 0 (0.0%) | 0 (0.0%) |
| Life, Physical & Social Science | 0 (0.0%) | 0 (0.0%) |
| Community & Social Service | 31 (56.4%) | 24 (43.6%) |
| Education, Arts & Media | 0 (0.0%) | 0 (0.0%) |
| Legal Services & Support | 31 (100.0%) | 0 (0.0%) |
| Education Instruction & Library | 0 (0.0%) | 24 (100.0%) |
| Arts, Media & Entertainment | 0 (0.0%) | 0 (0.0%) |
| Health Diagnosing & Treating | 0 (0.0%) | 0 (0.0%) |
| Health Technologists | 0 (0.0%) | 0 (0.0%) |
| Total (Category) | 88 (78.6%) | 24 (21.4%) |
| Total (Overall) | 124 (79.5%) | 32 (20.5%) |
Services Occupations
The most common Services occupations in New Blaine are , and Cleaning & Maintenance (36 | 23.1%).
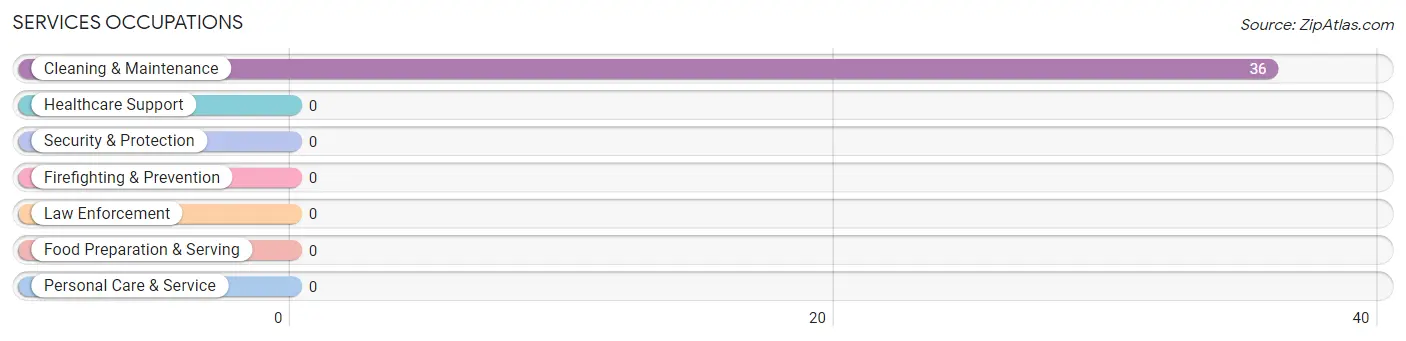
Services Occupations by Sex
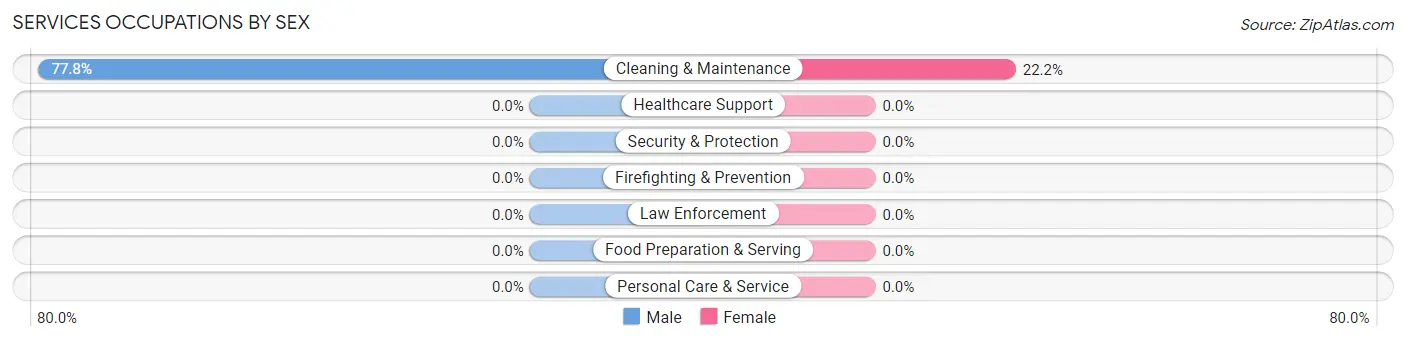
| Occupation | Male | Female |
| Healthcare Support | 0 (0.0%) | 0 (0.0%) |
| Security & Protection | 0 (0.0%) | 0 (0.0%) |
| Firefighting & Prevention | 0 (0.0%) | 0 (0.0%) |
| Law Enforcement | 0 (0.0%) | 0 (0.0%) |
| Food Preparation & Serving | 0 (0.0%) | 0 (0.0%) |
| Cleaning & Maintenance | 28 (77.8%) | 8 (22.2%) |
| Personal Care & Service | 0 (0.0%) | 0 (0.0%) |
| Total (Category) | 28 (77.8%) | 8 (22.2%) |
| Total (Overall) | 124 (79.5%) | 32 (20.5%) |
Sales and Office Occupations
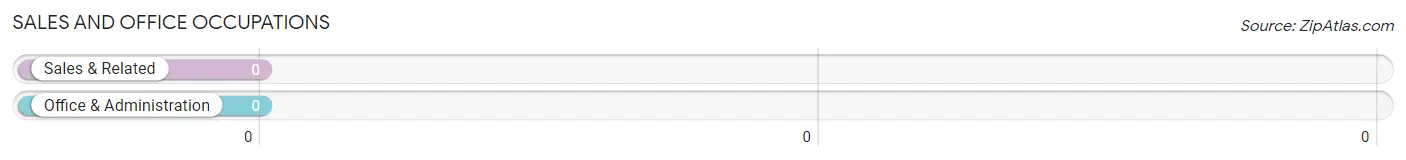
Sales and Office Occupations by Sex
| Occupation | Male | Female |
| Sales & Related | 0 (0.0%) | 0 (0.0%) |
| Office & Administration | 0 (0.0%) | 0 (0.0%) |
| Total (Category) | 0 (0.0%) | 0 (0.0%) |
| Total (Overall) | 124 (79.5%) | 32 (20.5%) |
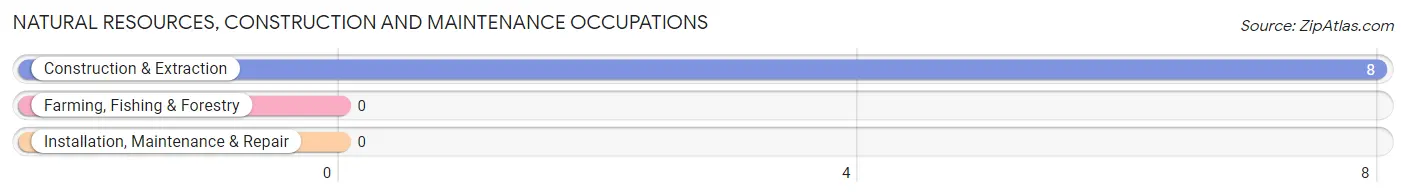
Natural Resources, Construction and Maintenance Occupations
The most common Natural Resources, Construction and Maintenance occupations in New Blaine are , and Construction & Extraction (8 | 5.1%).
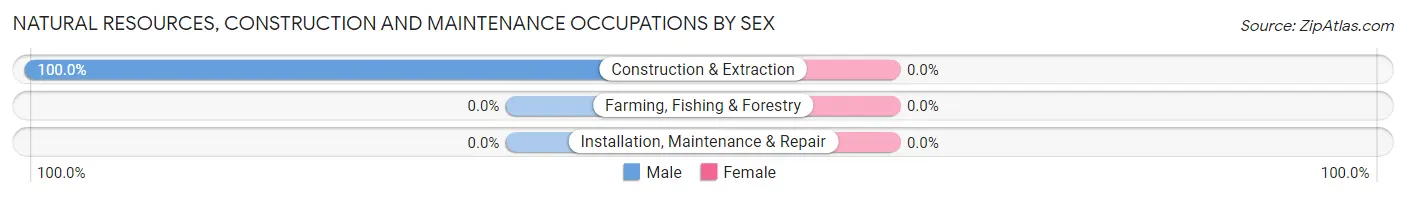
Natural Resources, Construction and Maintenance Occupations by Sex
| Occupation | Male | Female |
| Farming, Fishing & Forestry | 0 (0.0%) | 0 (0.0%) |
| Construction & Extraction | 8 (100.0%) | 0 (0.0%) |
| Installation, Maintenance & Repair | 0 (0.0%) | 0 (0.0%) |
| Total (Category) | 8 (100.0%) | 0 (0.0%) |
| Total (Overall) | 124 (79.5%) | 32 (20.5%) |
Production, Transportation and Moving Occupations
Production, Transportation and Moving Occupations by Sex
| Occupation | Male | Female |
| Production | 0 (0.0%) | 0 (0.0%) |
| Transportation | 0 (0.0%) | 0 (0.0%) |
| Material Moving | 0 (0.0%) | 0 (0.0%) |
| Total (Category) | 0 (0.0%) | 0 (0.0%) |
| Total (Overall) | 124 (79.5%) | 32 (20.5%) |
Employment Industries by Sex in New Blaine
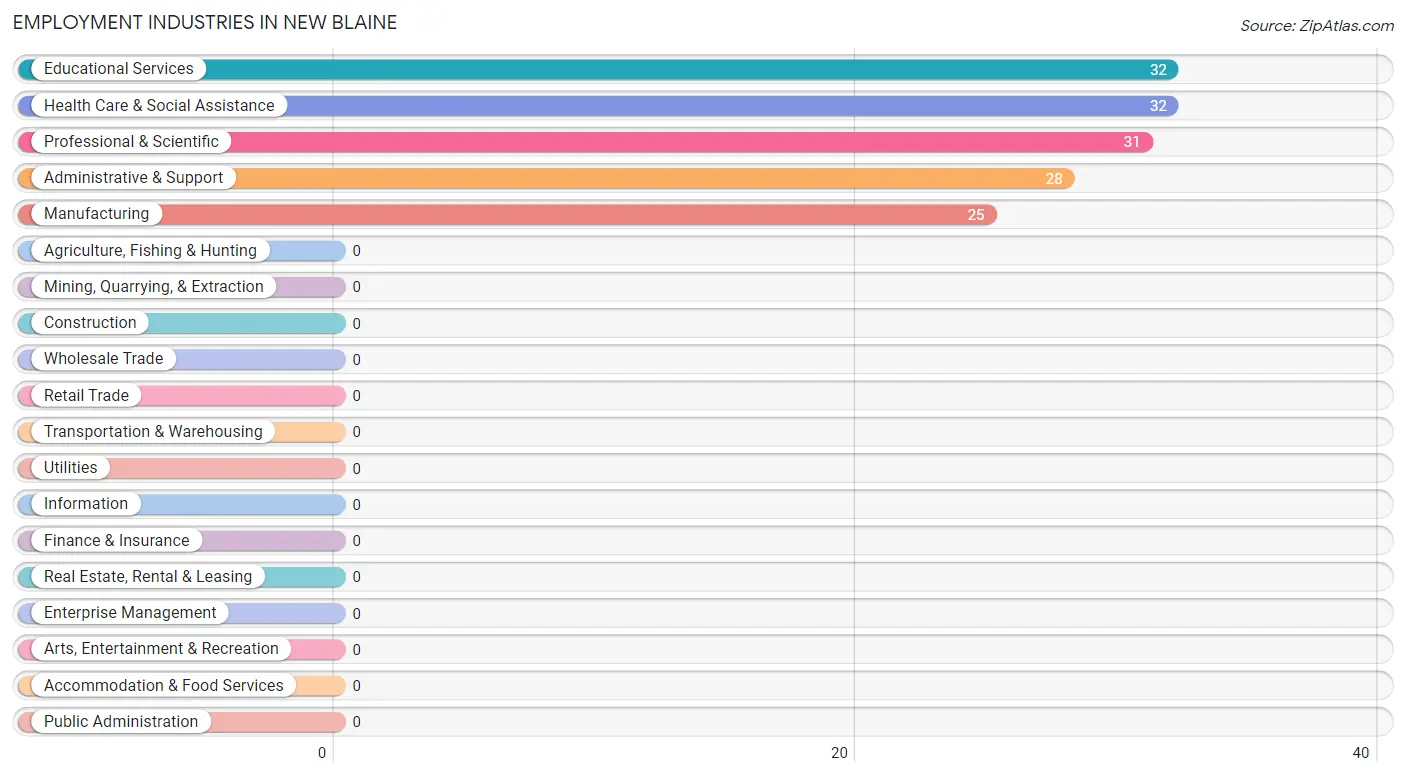
Employment Industries in New Blaine
The major employment industries in New Blaine include Educational Services (32 | 20.5%), Health Care & Social Assistance (32 | 20.5%), Professional & Scientific (31 | 19.9%), Administrative & Support (28 | 17.9%), and Manufacturing (25 | 16.0%).
Employment Industries by Sex in New Blaine
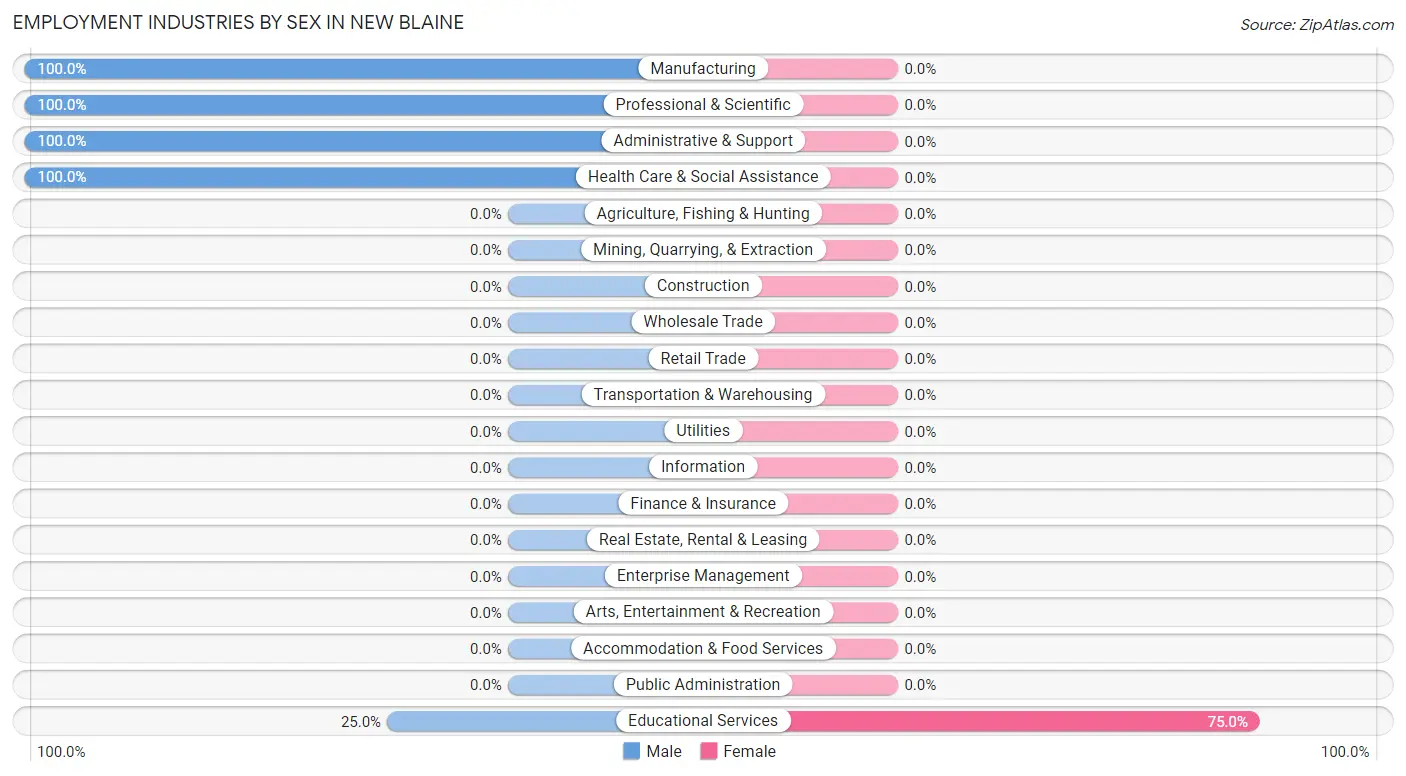
| Industry | Male | Female |
| Agriculture, Fishing & Hunting | 0 (0.0%) | 0 (0.0%) |
| Mining, Quarrying, & Extraction | 0 (0.0%) | 0 (0.0%) |
| Construction | 0 (0.0%) | 0 (0.0%) |
| Manufacturing | 25 (100.0%) | 0 (0.0%) |
| Wholesale Trade | 0 (0.0%) | 0 (0.0%) |
| Retail Trade | 0 (0.0%) | 0 (0.0%) |
| Transportation & Warehousing | 0 (0.0%) | 0 (0.0%) |
| Utilities | 0 (0.0%) | 0 (0.0%) |
| Information | 0 (0.0%) | 0 (0.0%) |
| Finance & Insurance | 0 (0.0%) | 0 (0.0%) |
| Real Estate, Rental & Leasing | 0 (0.0%) | 0 (0.0%) |
| Professional & Scientific | 31 (100.0%) | 0 (0.0%) |
| Enterprise Management | 0 (0.0%) | 0 (0.0%) |
| Administrative & Support | 28 (100.0%) | 0 (0.0%) |
| Educational Services | 8 (25.0%) | 24 (75.0%) |
| Health Care & Social Assistance | 32 (100.0%) | 0 (0.0%) |
| Arts, Entertainment & Recreation | 0 (0.0%) | 0 (0.0%) |
| Accommodation & Food Services | 0 (0.0%) | 0 (0.0%) |
| Public Administration | 0 (0.0%) | 0 (0.0%) |
| Total | 124 (79.5%) | 32 (20.5%) |
Education in New Blaine
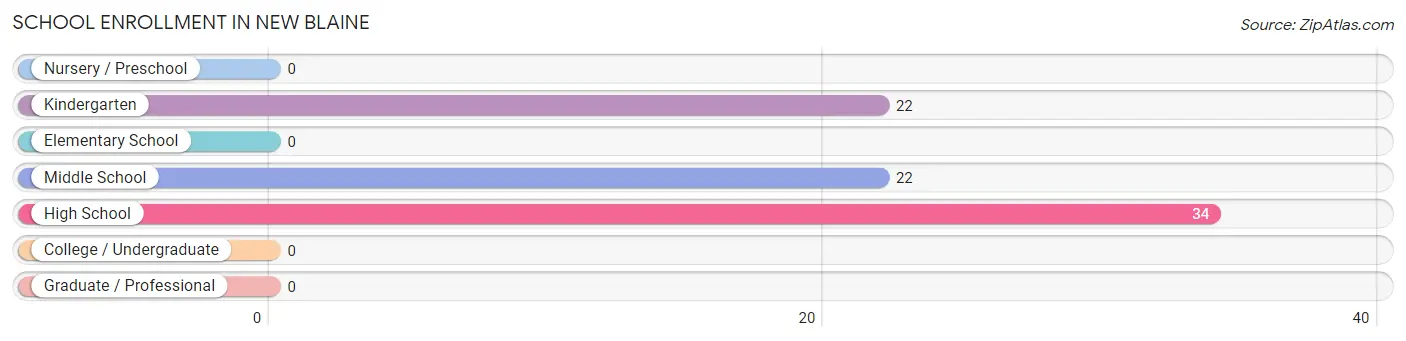
School Enrollment in New Blaine
The most common levels of schooling among the 78 students in New Blaine are high school (34 | 43.6%), kindergarten (22 | 28.2%), and middle school (22 | 28.2%).
| School Level | # Students | % Students |
| Nursery / Preschool | 0 | 0.0% |
| Kindergarten | 22 | 28.2% |
| Elementary School | 0 | 0.0% |
| Middle School | 22 | 28.2% |
| High School | 34 | 43.6% |
| College / Undergraduate | 0 | 0.0% |
| Graduate / Professional | 0 | 0.0% |
| Total | 78 | 100.0% |
School Enrollment by Age by Funding Source in New Blaine
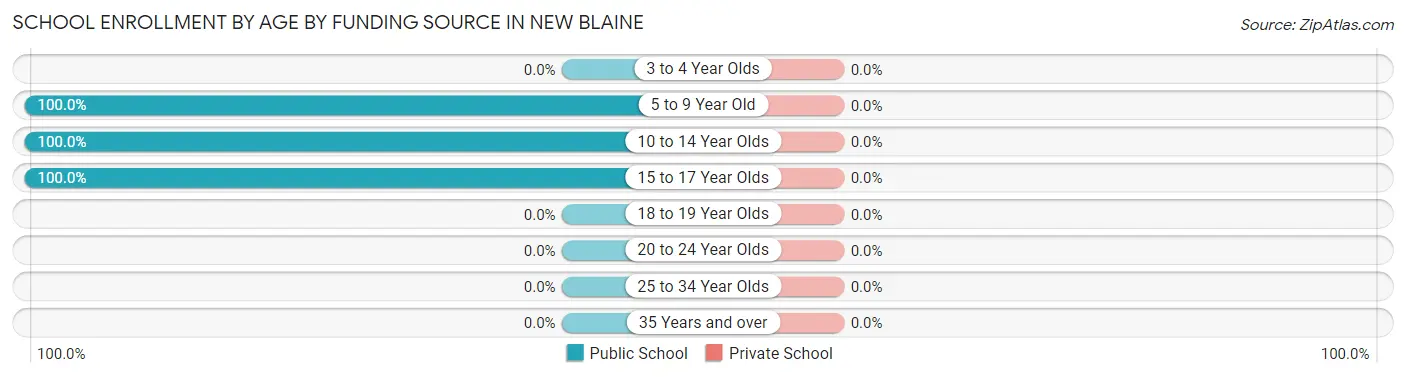
| Age Bracket | Public School | Private School |
| 3 to 4 Year Olds | 0 (0.0%) | 0 (0.0%) |
| 5 to 9 Year Old | 22 (100.0%) | 0 (0.0%) |
| 10 to 14 Year Olds | 22 (100.0%) | 0 (0.0%) |
| 15 to 17 Year Olds | 34 (100.0%) | 0 (0.0%) |
| 18 to 19 Year Olds | 0 (0.0%) | 0 (0.0%) |
| 20 to 24 Year Olds | 0 (0.0%) | 0 (0.0%) |
| 25 to 34 Year Olds | 0 (0.0%) | 0 (0.0%) |
| 35 Years and over | 0 (0.0%) | 0 (0.0%) |
| Total | 78 (100.0%) | 0 (0.0%) |
Educational Attainment by Field of Study in New Blaine
Education (36 | 28.3%), bio, nature & agricultural (32 | 25.2%), liberal arts & history (31 | 24.4%), and business (28 | 22.1%) are the most common fields of study among 127 individuals in New Blaine who have obtained a bachelor's degree or higher.
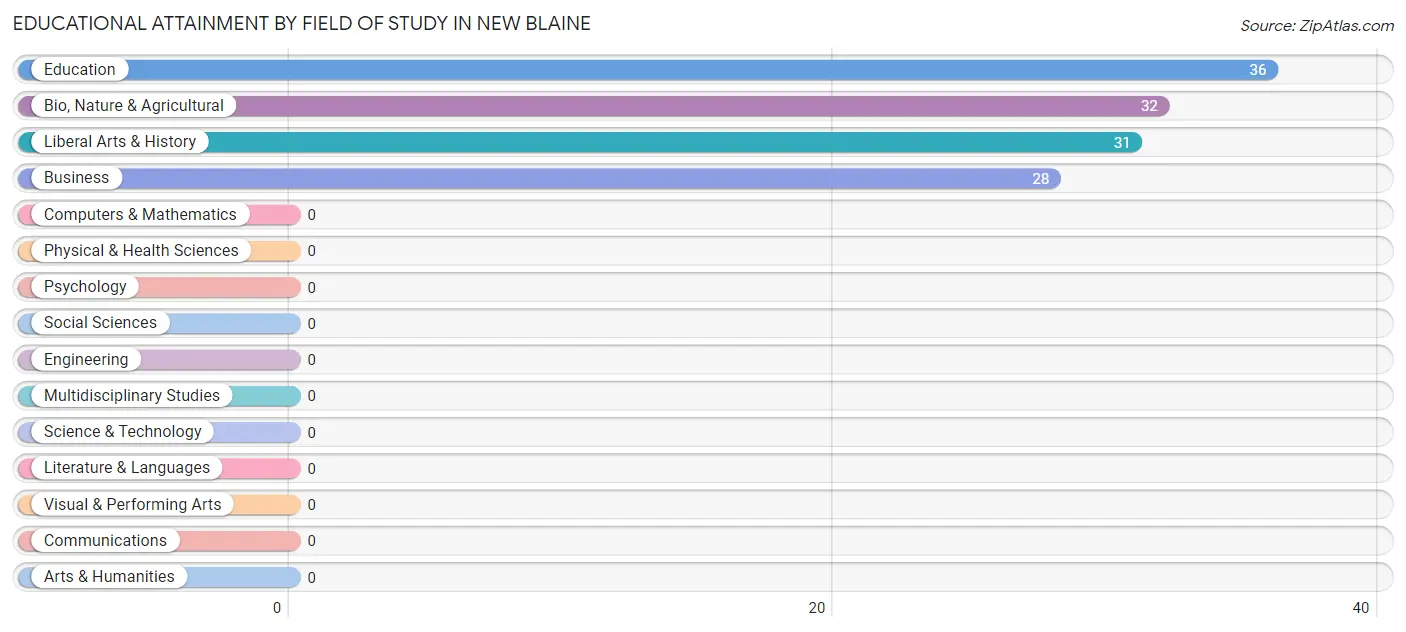
| Field of Study | # Graduates | % Graduates |
| Computers & Mathematics | 0 | 0.0% |
| Bio, Nature & Agricultural | 32 | 25.2% |
| Physical & Health Sciences | 0 | 0.0% |
| Psychology | 0 | 0.0% |
| Social Sciences | 0 | 0.0% |
| Engineering | 0 | 0.0% |
| Multidisciplinary Studies | 0 | 0.0% |
| Science & Technology | 0 | 0.0% |
| Business | 28 | 22.1% |
| Education | 36 | 28.3% |
| Literature & Languages | 0 | 0.0% |
| Liberal Arts & History | 31 | 24.4% |
| Visual & Performing Arts | 0 | 0.0% |
| Communications | 0 | 0.0% |
| Arts & Humanities | 0 | 0.0% |
| Total | 127 | 100.0% |
Transportation & Commute in New Blaine
Vehicle Availability by Sex in New Blaine
The most prevalent vehicle ownership categories in New Blaine are males with 3 vehicles (63, accounting for 65.6%) and females with 3 vehicles (24, making up 196.9%).
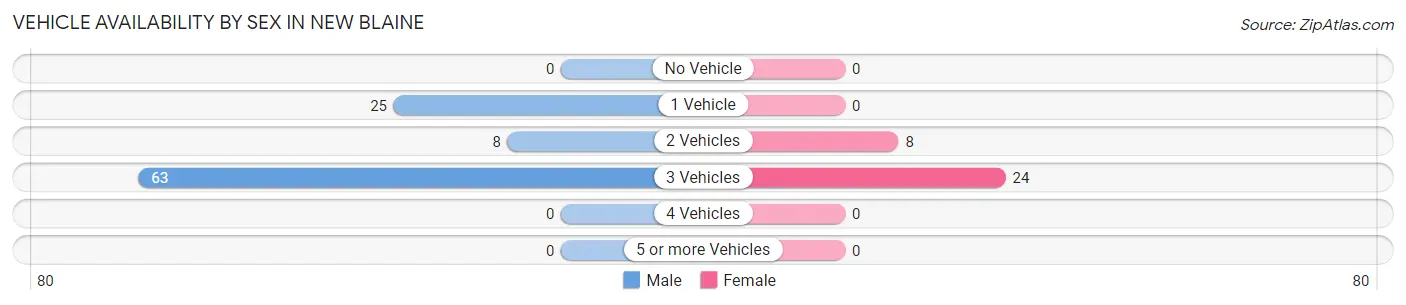
| Vehicles Available | Male | Female |
| No Vehicle | 0 (0.0%) | 0 (0.0%) |
| 1 Vehicle | 25 (26.0%) | 0 (0.0%) |
| 2 Vehicles | 8 (8.3%) | 8 (25.0%) |
| 3 Vehicles | 63 (65.6%) | 24 (75.0%) |
| 4 Vehicles | 0 (0.0%) | 0 (0.0%) |
| 5 or more Vehicles | 0 (0.0%) | 0 (0.0%) |
| Total | 96 (100.0%) | 32 (100.0%) |
Commute Time in New Blaine
The most frequently occuring commute durations in New Blaine are 40 to 44 minutes (33 commuters, 31.7%), 25 to 29 minutes (32 commuters, 30.8%), and 20 to 24 minutes (31 commuters, 29.8%).
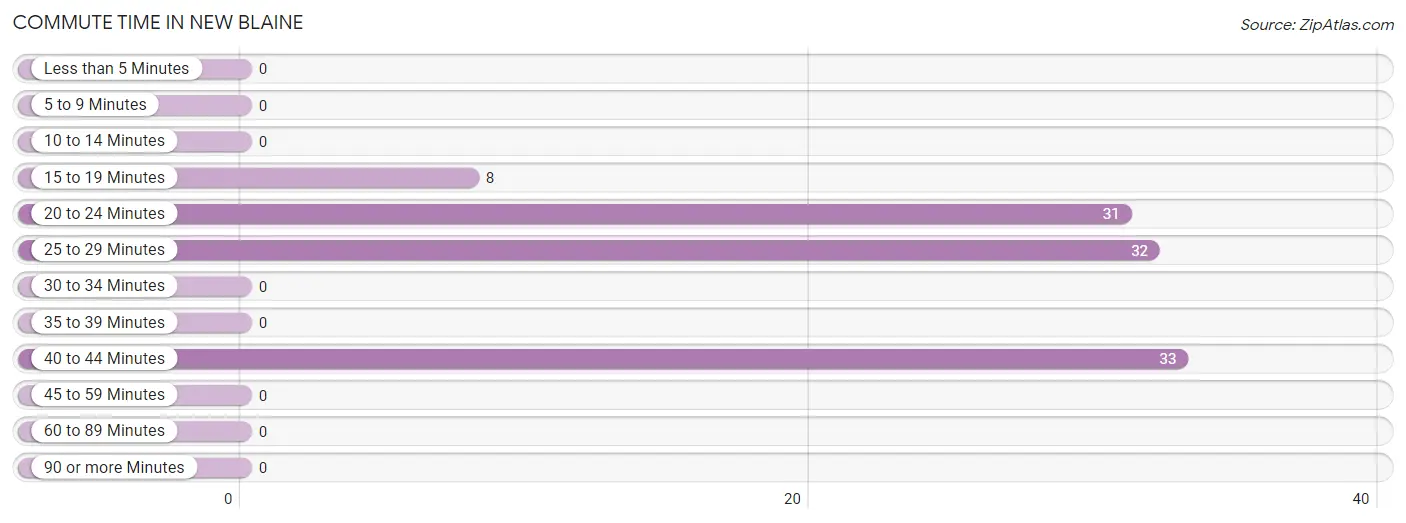
| Commute Time | # Commuters | % Commuters |
| Less than 5 Minutes | 0 | 0.0% |
| 5 to 9 Minutes | 0 | 0.0% |
| 10 to 14 Minutes | 0 | 0.0% |
| 15 to 19 Minutes | 8 | 7.7% |
| 20 to 24 Minutes | 31 | 29.8% |
| 25 to 29 Minutes | 32 | 30.8% |
| 30 to 34 Minutes | 0 | 0.0% |
| 35 to 39 Minutes | 0 | 0.0% |
| 40 to 44 Minutes | 33 | 31.7% |
| 45 to 59 Minutes | 0 | 0.0% |
| 60 to 89 Minutes | 0 | 0.0% |
| 90 or more Minutes | 0 | 0.0% |
Commute Time by Sex in New Blaine
The most common commute times in New Blaine are 25 to 29 minutes (32 commuters, 33.3%) for males and 40 to 44 minutes (8 commuters, 100.0%) for females.
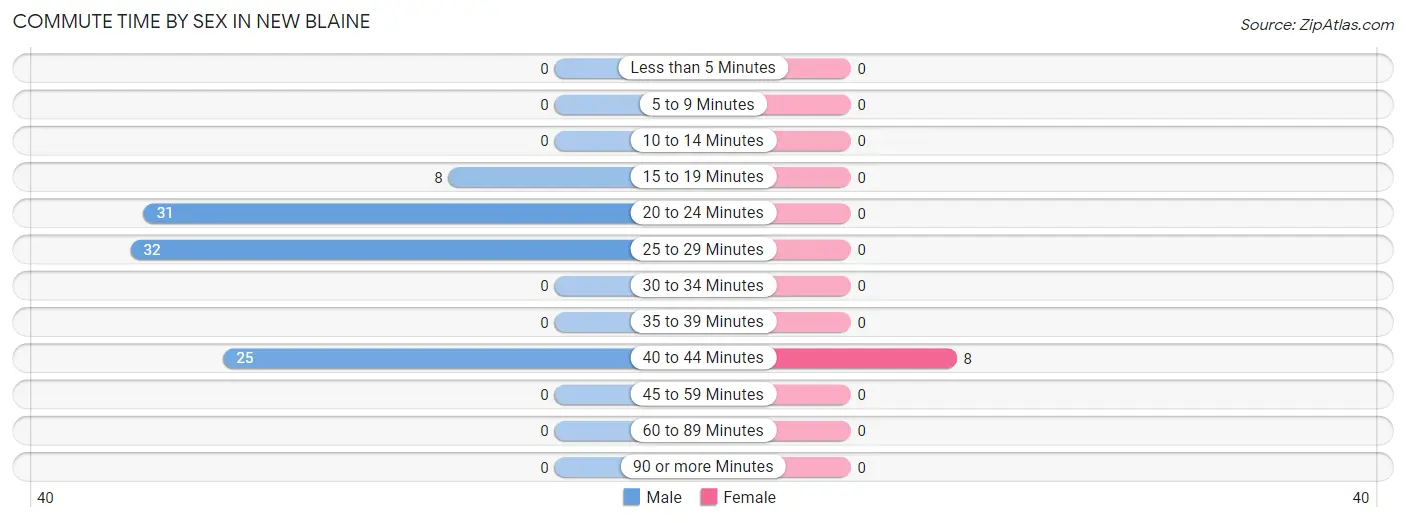
| Commute Time | Male | Female |
| Less than 5 Minutes | 0 (0.0%) | 0 (0.0%) |
| 5 to 9 Minutes | 0 (0.0%) | 0 (0.0%) |
| 10 to 14 Minutes | 0 (0.0%) | 0 (0.0%) |
| 15 to 19 Minutes | 8 (8.3%) | 0 (0.0%) |
| 20 to 24 Minutes | 31 (32.3%) | 0 (0.0%) |
| 25 to 29 Minutes | 32 (33.3%) | 0 (0.0%) |
| 30 to 34 Minutes | 0 (0.0%) | 0 (0.0%) |
| 35 to 39 Minutes | 0 (0.0%) | 0 (0.0%) |
| 40 to 44 Minutes | 25 (26.0%) | 8 (100.0%) |
| 45 to 59 Minutes | 0 (0.0%) | 0 (0.0%) |
| 60 to 89 Minutes | 0 (0.0%) | 0 (0.0%) |
| 90 or more Minutes | 0 (0.0%) | 0 (0.0%) |
Time of Departure to Work by Sex in New Blaine
The most frequent times of departure to work in New Blaine are 6:30 AM to 6:59 AM (57, 59.4%) for males and 9:00 AM to 9:59 AM (8, 100.0%) for females.
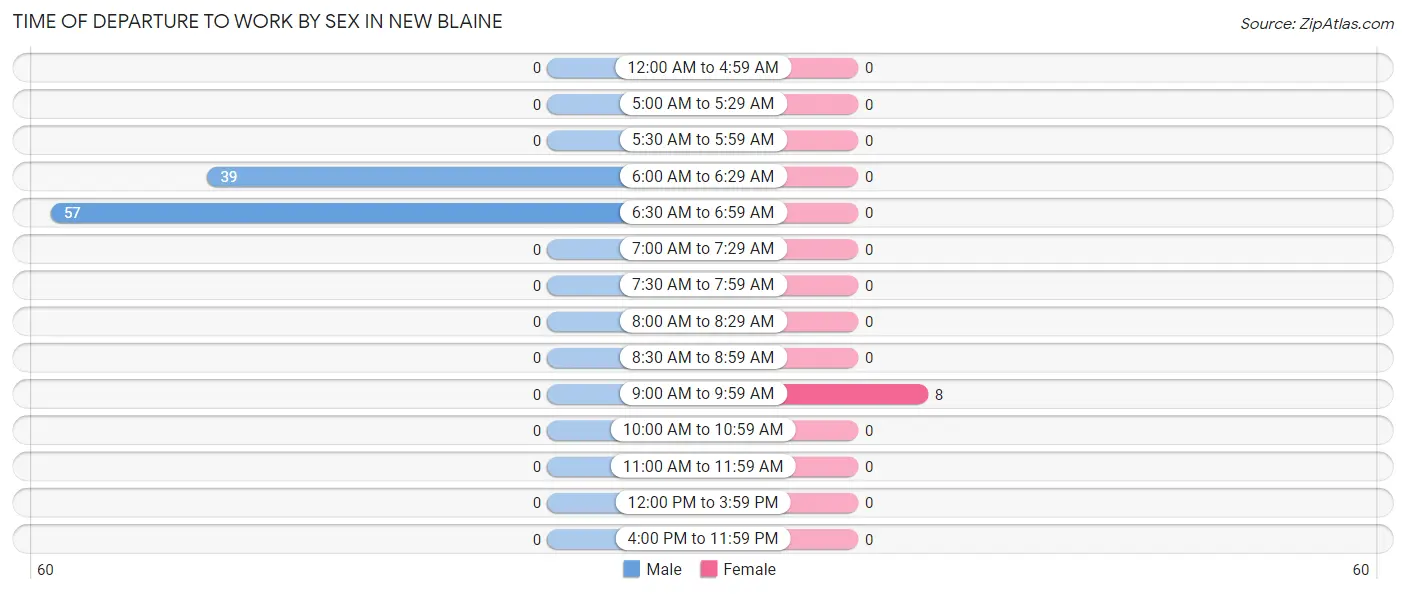
| Time of Departure | Male | Female |
| 12:00 AM to 4:59 AM | 0 (0.0%) | 0 (0.0%) |
| 5:00 AM to 5:29 AM | 0 (0.0%) | 0 (0.0%) |
| 5:30 AM to 5:59 AM | 0 (0.0%) | 0 (0.0%) |
| 6:00 AM to 6:29 AM | 39 (40.6%) | 0 (0.0%) |
| 6:30 AM to 6:59 AM | 57 (59.4%) | 0 (0.0%) |
| 7:00 AM to 7:29 AM | 0 (0.0%) | 0 (0.0%) |
| 7:30 AM to 7:59 AM | 0 (0.0%) | 0 (0.0%) |
| 8:00 AM to 8:29 AM | 0 (0.0%) | 0 (0.0%) |
| 8:30 AM to 8:59 AM | 0 (0.0%) | 0 (0.0%) |
| 9:00 AM to 9:59 AM | 0 (0.0%) | 8 (100.0%) |
| 10:00 AM to 10:59 AM | 0 (0.0%) | 0 (0.0%) |
| 11:00 AM to 11:59 AM | 0 (0.0%) | 0 (0.0%) |
| 12:00 PM to 3:59 PM | 0 (0.0%) | 0 (0.0%) |
| 4:00 PM to 11:59 PM | 0 (0.0%) | 0 (0.0%) |
| Total | 96 (100.0%) | 8 (100.0%) |
Housing Occupancy in New Blaine
Occupancy by Ownership in New Blaine
Of the total 140 dwellings in New Blaine, owner-occupied units account for 140 (100.0%), while renter-occupied units make up 0 (0.0%).
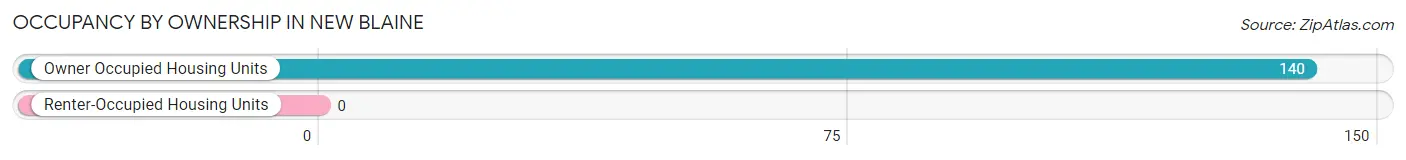
| Occupancy | # Housing Units | % Housing Units |
| Owner Occupied Housing Units | 140 | 100.0% |
| Renter-Occupied Housing Units | 0 | 0.0% |
| Total Occupied Housing Units | 140 | 100.0% |
Occupancy by Household Size in New Blaine
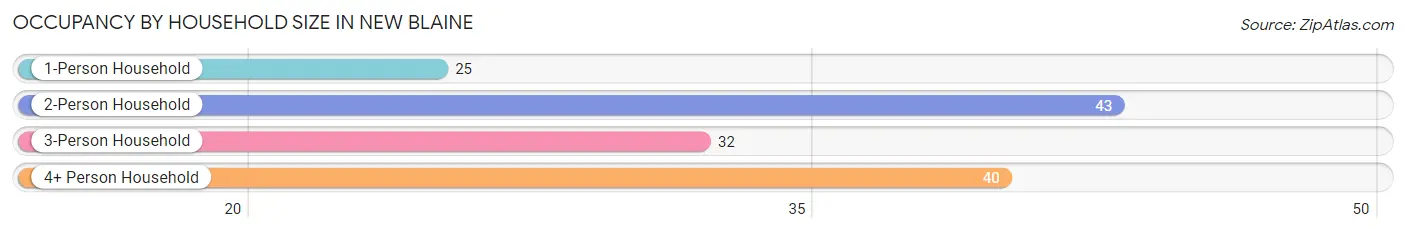
| Household Size | # Housing Units | % Housing Units |
| 1-Person Household | 25 | 17.9% |
| 2-Person Household | 43 | 30.7% |
| 3-Person Household | 32 | 22.9% |
| 4+ Person Household | 40 | 28.6% |
| Total Housing Units | 140 | 100.0% |
Occupancy by Ownership by Household Size in New Blaine
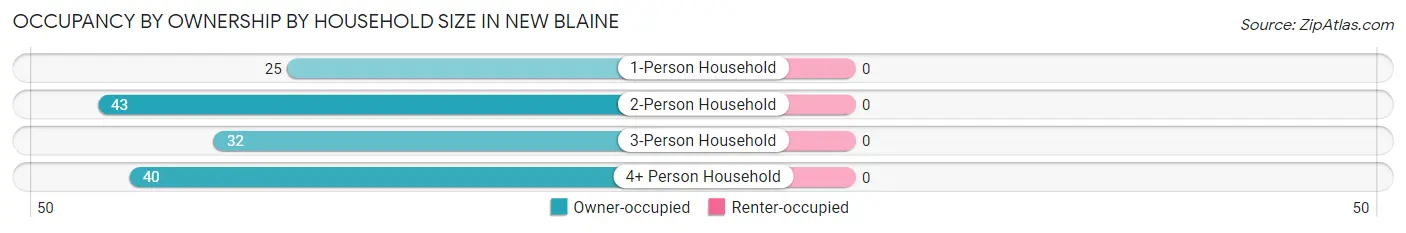
| Household Size | Owner-occupied | Renter-occupied |
| 1-Person Household | 25 (100.0%) | 0 (0.0%) |
| 2-Person Household | 43 (100.0%) | 0 (0.0%) |
| 3-Person Household | 32 (100.0%) | 0 (0.0%) |
| 4+ Person Household | 40 (100.0%) | 0 (0.0%) |
| Total Housing Units | 140 (100.0%) | 0 (0.0%) |
Occupancy by Educational Attainment in New Blaine
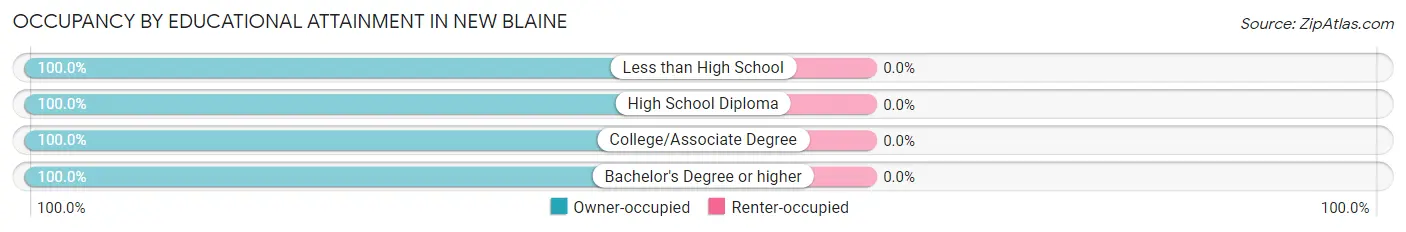
| Household Size | Owner-occupied | Renter-occupied |
| Less than High School | 11 (100.0%) | 0 (0.0%) |
| High School Diploma | 36 (100.0%) | 0 (0.0%) |
| College/Associate Degree | 33 (100.0%) | 0 (0.0%) |
| Bachelor's Degree or higher | 60 (100.0%) | 0 (0.0%) |
Occupancy by Age of Householder in New Blaine
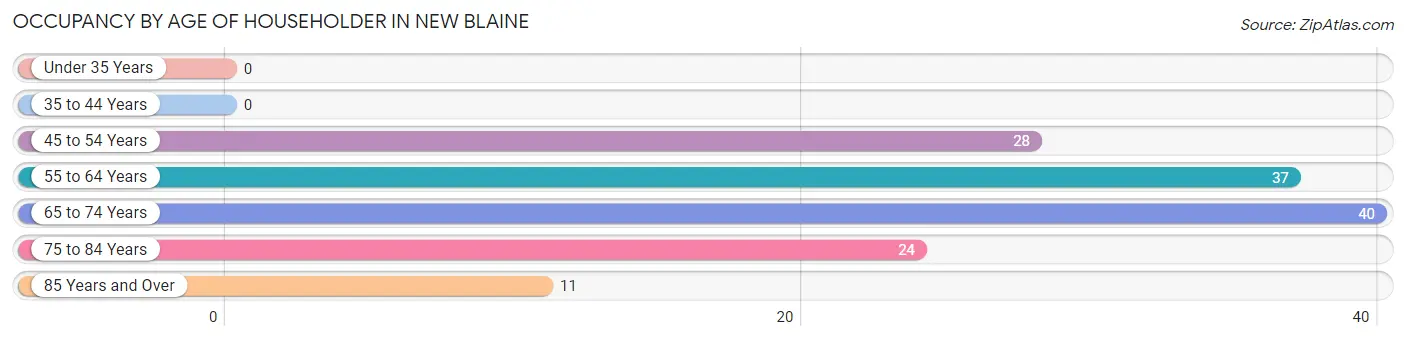
| Age Bracket | # Households | % Households |
| Under 35 Years | 0 | 0.0% |
| 35 to 44 Years | 0 | 0.0% |
| 45 to 54 Years | 28 | 20.0% |
| 55 to 64 Years | 37 | 26.4% |
| 65 to 74 Years | 40 | 28.6% |
| 75 to 84 Years | 24 | 17.1% |
| 85 Years and Over | 11 | 7.9% |
| Total | 140 | 100.0% |
Housing Finances in New Blaine
Median Income by Occupancy in New Blaine
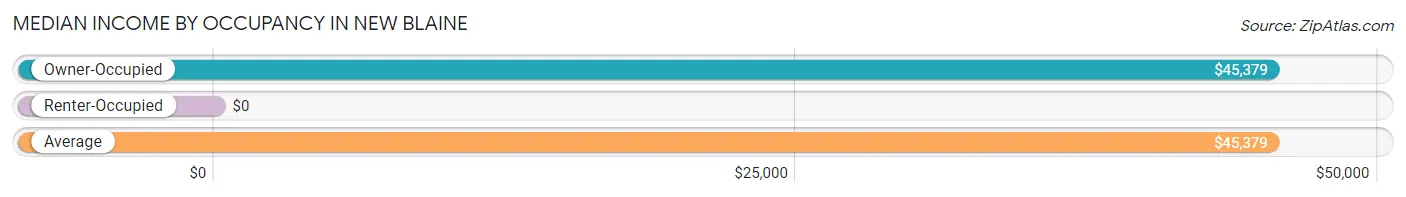
| Occupancy Type | # Households | Median Income |
| Owner-Occupied | 140 (100.0%) | $45,379 |
| Renter-Occupied | 0 (0.0%) | $0 |
| Average | 140 (100.0%) | $45,379 |
Occupancy by Householder Income Bracket in New Blaine
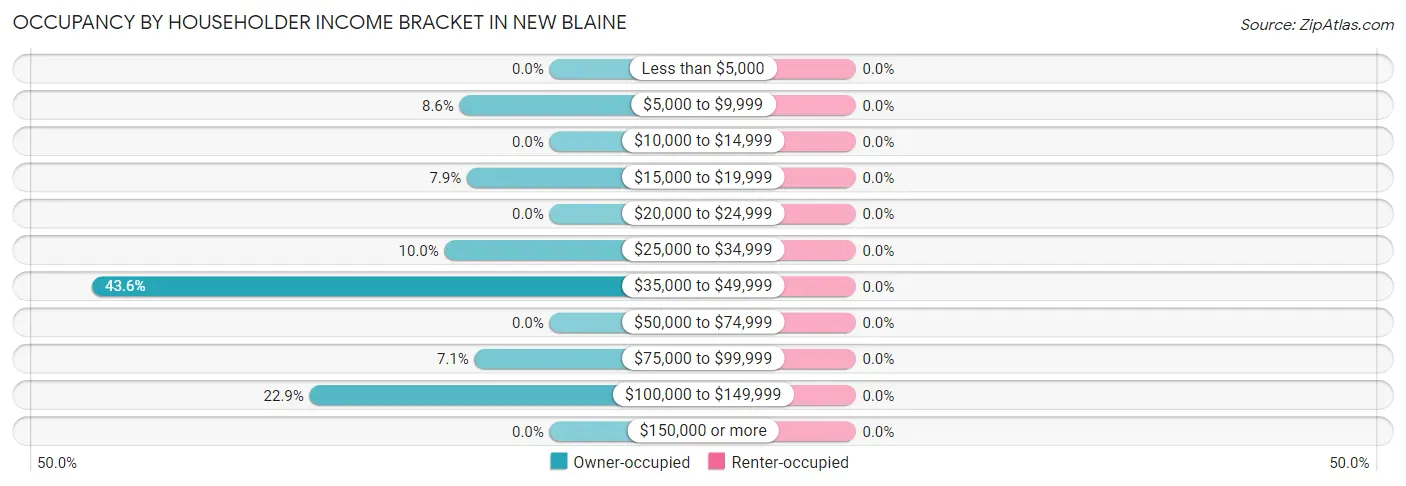
| Income Bracket | Owner-occupied | Renter-occupied |
| Less than $5,000 | 0 (0.0%) | 0 (0.0%) |
| $5,000 to $9,999 | 12 (8.6%) | 0 (0.0%) |
| $10,000 to $14,999 | 0 (0.0%) | 0 (0.0%) |
| $15,000 to $19,999 | 11 (7.9%) | 0 (0.0%) |
| $20,000 to $24,999 | 0 (0.0%) | 0 (0.0%) |
| $25,000 to $34,999 | 14 (10.0%) | 0 (0.0%) |
| $35,000 to $49,999 | 61 (43.6%) | 0 (0.0%) |
| $50,000 to $74,999 | 0 (0.0%) | 0 (0.0%) |
| $75,000 to $99,999 | 10 (7.1%) | 0 (0.0%) |
| $100,000 to $149,999 | 32 (22.9%) | 0 (0.0%) |
| $150,000 or more | 0 (0.0%) | 0 (0.0%) |
| Total | 140 (100.0%) | 0 (0.0%) |
Monthly Housing Cost Tiers in New Blaine
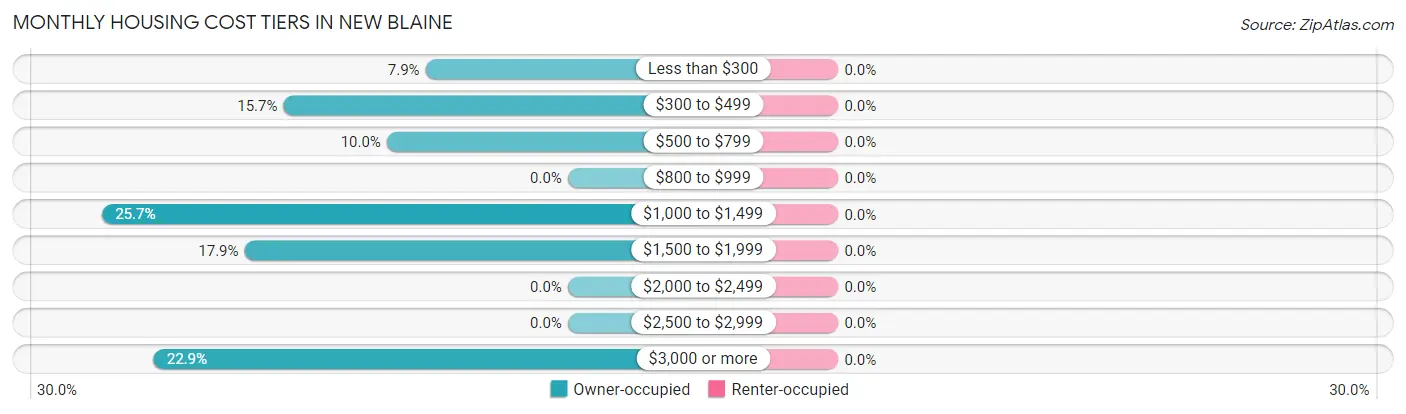
| Monthly Cost | Owner-occupied | Renter-occupied |
| Less than $300 | 11 (7.9%) | 0 (0.0%) |
| $300 to $499 | 22 (15.7%) | 0 (0.0%) |
| $500 to $799 | 14 (10.0%) | 0 (0.0%) |
| $800 to $999 | 0 (0.0%) | 0 (0.0%) |
| $1,000 to $1,499 | 36 (25.7%) | 0 (0.0%) |
| $1,500 to $1,999 | 25 (17.9%) | 0 (0.0%) |
| $2,000 to $2,499 | 0 (0.0%) | 0 (0.0%) |
| $2,500 to $2,999 | 0 (0.0%) | 0 (0.0%) |
| $3,000 or more | 32 (22.9%) | 0 (0.0%) |
| Total | 140 (100.0%) | 0 (0.0%) |
Physical Housing Characteristics in New Blaine
Housing Structures in New Blaine
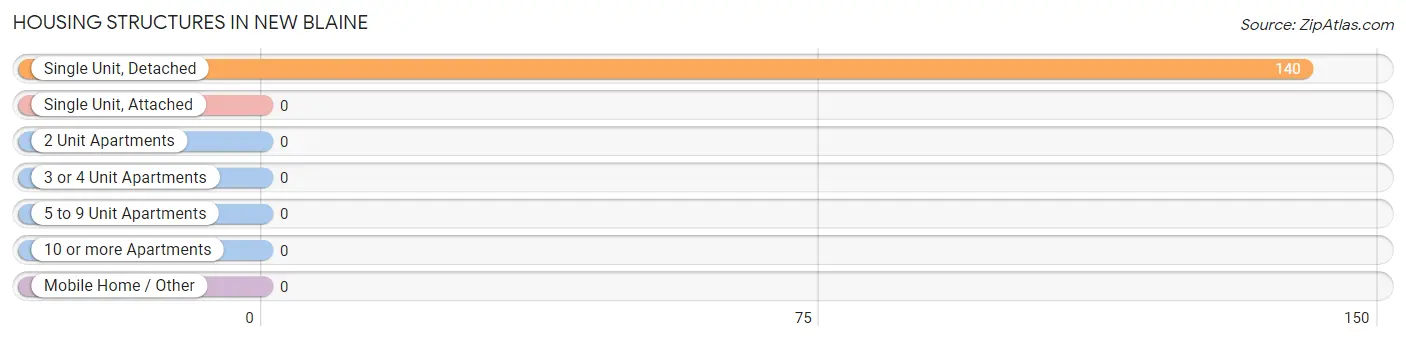
| Structure Type | # Housing Units | % Housing Units |
| Single Unit, Detached | 140 | 100.0% |
| Single Unit, Attached | 0 | 0.0% |
| 2 Unit Apartments | 0 | 0.0% |
| 3 or 4 Unit Apartments | 0 | 0.0% |
| 5 to 9 Unit Apartments | 0 | 0.0% |
| 10 or more Apartments | 0 | 0.0% |
| Mobile Home / Other | 0 | 0.0% |
| Total | 140 | 100.0% |
Housing Structures by Occupancy in New Blaine
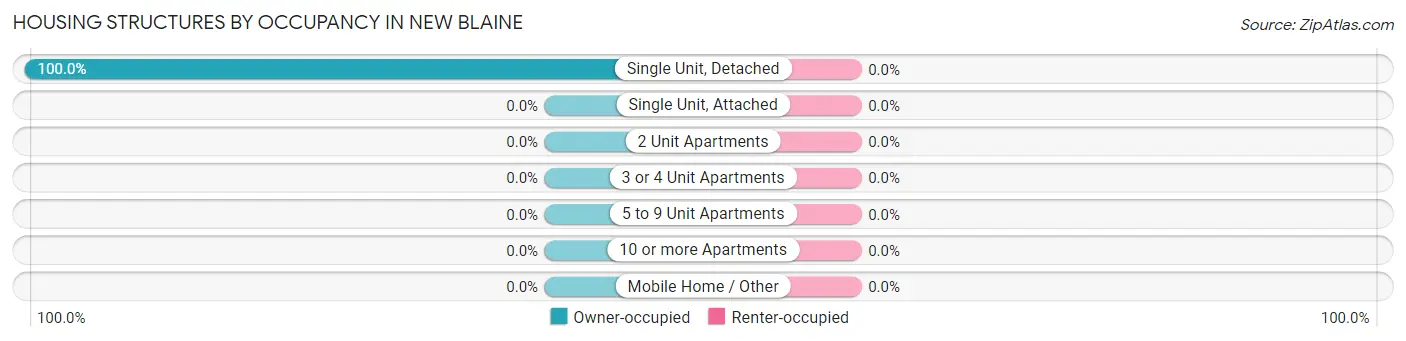
| Structure Type | Owner-occupied | Renter-occupied |
| Single Unit, Detached | 140 (100.0%) | 0 (0.0%) |
| Single Unit, Attached | 0 (0.0%) | 0 (0.0%) |
| 2 Unit Apartments | 0 (0.0%) | 0 (0.0%) |
| 3 or 4 Unit Apartments | 0 (0.0%) | 0 (0.0%) |
| 5 to 9 Unit Apartments | 0 (0.0%) | 0 (0.0%) |
| 10 or more Apartments | 0 (0.0%) | 0 (0.0%) |
| Mobile Home / Other | 0 (0.0%) | 0 (0.0%) |
| Total | 140 (100.0%) | 0 (0.0%) |
Housing Structures by Number of Rooms in New Blaine
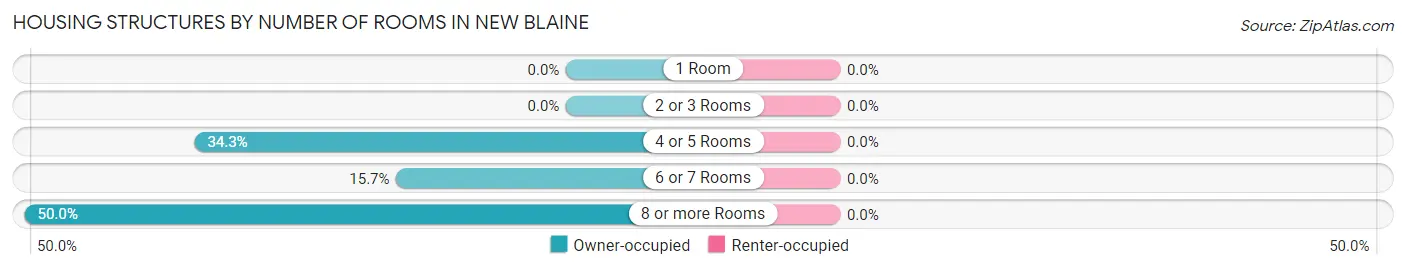
| Number of Rooms | Owner-occupied | Renter-occupied |
| 1 Room | 0 (0.0%) | 0 (0.0%) |
| 2 or 3 Rooms | 0 (0.0%) | 0 (0.0%) |
| 4 or 5 Rooms | 48 (34.3%) | 0 (0.0%) |
| 6 or 7 Rooms | 22 (15.7%) | 0 (0.0%) |
| 8 or more Rooms | 70 (50.0%) | 0 (0.0%) |
| Total | 140 (100.0%) | 0 (0.0%) |
Housing Structure by Heating Type in New Blaine
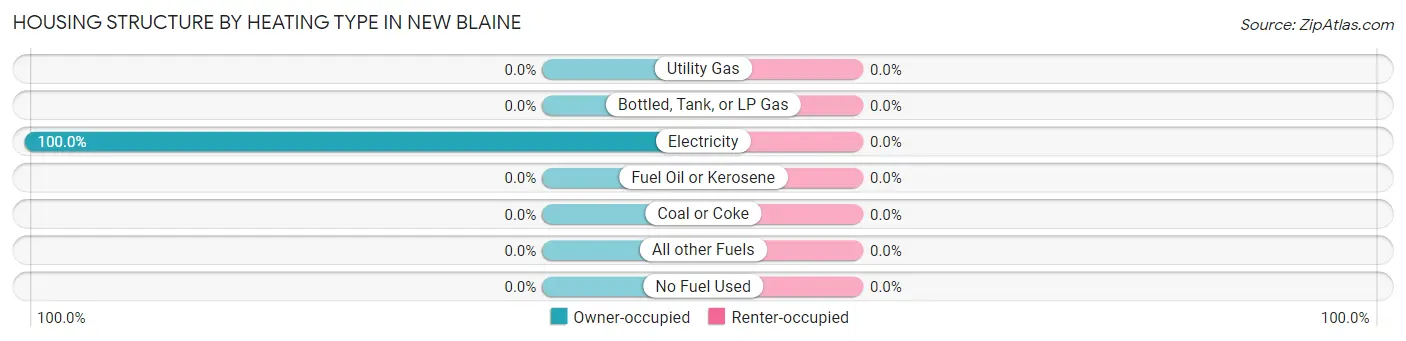
| Heating Type | Owner-occupied | Renter-occupied |
| Utility Gas | 0 (0.0%) | 0 (0.0%) |
| Bottled, Tank, or LP Gas | 0 (0.0%) | 0 (0.0%) |
| Electricity | 140 (100.0%) | 0 (0.0%) |
| Fuel Oil or Kerosene | 0 (0.0%) | 0 (0.0%) |
| Coal or Coke | 0 (0.0%) | 0 (0.0%) |
| All other Fuels | 0 (0.0%) | 0 (0.0%) |
| No Fuel Used | 0 (0.0%) | 0 (0.0%) |
| Total | 140 (100.0%) | 0 (0.0%) |
Household Vehicle Usage in New Blaine
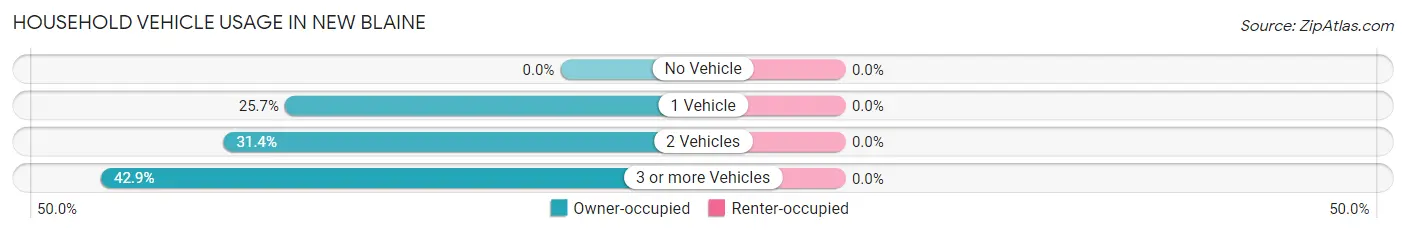
| Vehicles per Household | Owner-occupied | Renter-occupied |
| No Vehicle | 0 (0.0%) | 0 (0.0%) |
| 1 Vehicle | 36 (25.7%) | 0 (0.0%) |
| 2 Vehicles | 44 (31.4%) | 0 (0.0%) |
| 3 or more Vehicles | 60 (42.9%) | 0 (0.0%) |
| Total | 140 (100.0%) | 0 (0.0%) |
Real Estate & Mortgages in New Blaine
Real Estate and Mortgage Overview in New Blaine
| Characteristic | Without Mortgage | With Mortgage |
| Housing Units | 47 | 93 |
| Median Property Value | $175,500 | $0 |
| Median Household Income | - | - |
| Monthly Housing Costs | $378 | $32 |
| Real Estate Taxes | $410 | $0 |
Property Value by Mortgage Status in New Blaine
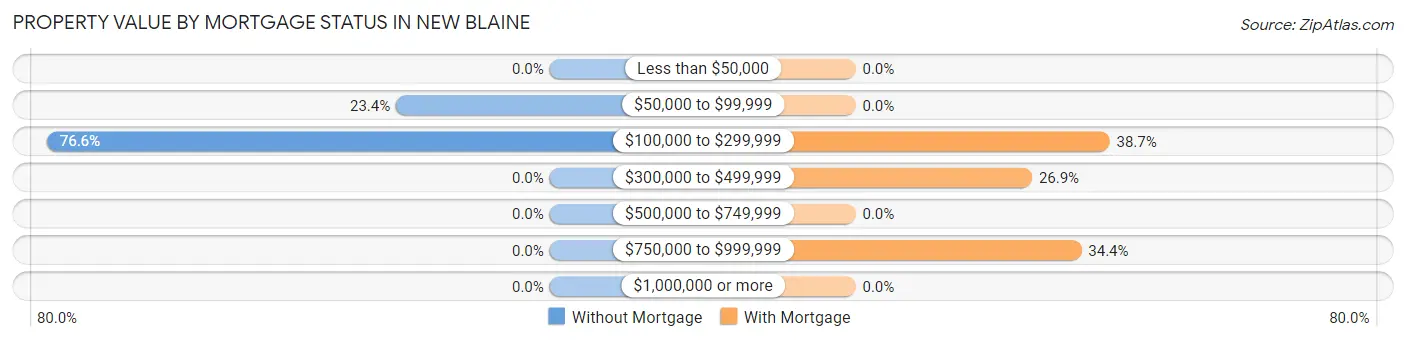
| Property Value | Without Mortgage | With Mortgage |
| Less than $50,000 | 0 (0.0%) | 0 (0.0%) |
| $50,000 to $99,999 | 11 (23.4%) | 0 (0.0%) |
| $100,000 to $299,999 | 36 (76.6%) | 36 (38.7%) |
| $300,000 to $499,999 | 0 (0.0%) | 25 (26.9%) |
| $500,000 to $749,999 | 0 (0.0%) | 0 (0.0%) |
| $750,000 to $999,999 | 0 (0.0%) | 32 (34.4%) |
| $1,000,000 or more | 0 (0.0%) | 0 (0.0%) |
| Total | 47 (100.0%) | 93 (100.0%) |
Household Income by Mortgage Status in New Blaine
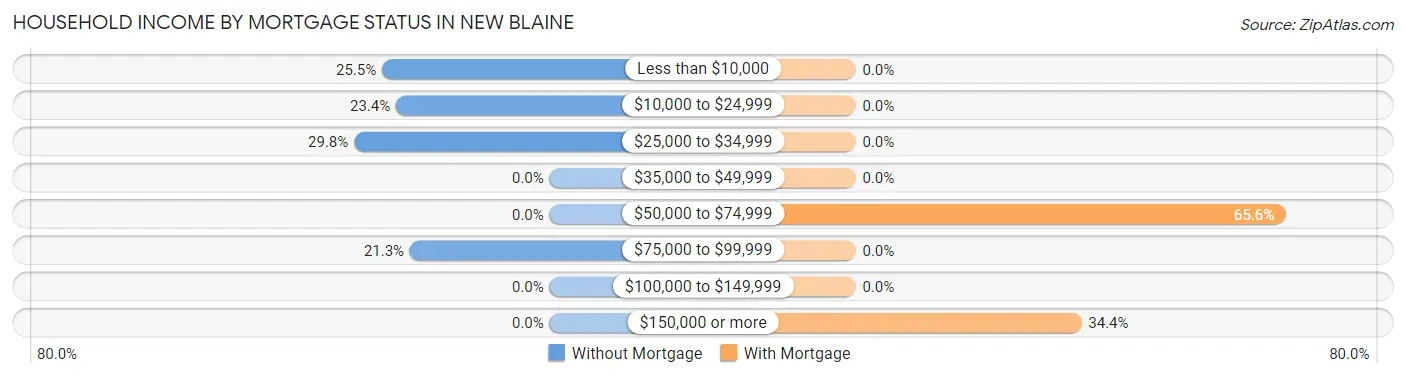
| Household Income | Without Mortgage | With Mortgage |
| Less than $10,000 | 12 (25.5%) | 0 (0.0%) |
| $10,000 to $24,999 | 11 (23.4%) | 0 (0.0%) |
| $25,000 to $34,999 | 14 (29.8%) | 0 (0.0%) |
| $35,000 to $49,999 | 0 (0.0%) | 0 (0.0%) |
| $50,000 to $74,999 | 0 (0.0%) | 61 (65.6%) |
| $75,000 to $99,999 | 10 (21.3%) | 0 (0.0%) |
| $100,000 to $149,999 | 0 (0.0%) | 0 (0.0%) |
| $150,000 or more | 0 (0.0%) | 32 (34.4%) |
| Total | 47 (100.0%) | 93 (100.0%) |
Property Value to Household Income Ratio in New Blaine
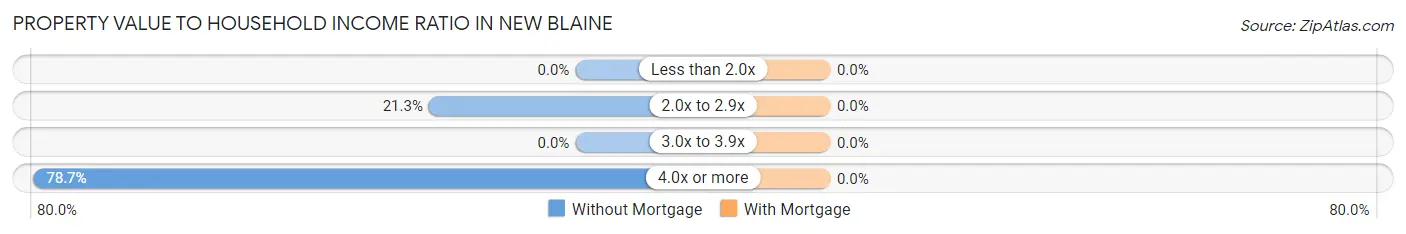
| Value-to-Income Ratio | Without Mortgage | With Mortgage |
| Less than 2.0x | 0 (0.0%) | 0 (0.0%) |
| 2.0x to 2.9x | 10 (21.3%) | 0 (0.0%) |
| 3.0x to 3.9x | 0 (0.0%) | 0 (0.0%) |
| 4.0x or more | 37 (78.7%) | 0 (0.0%) |
| Total | 47 (100.0%) | 93 (100.0%) |
Real Estate Taxes by Mortgage Status in New Blaine
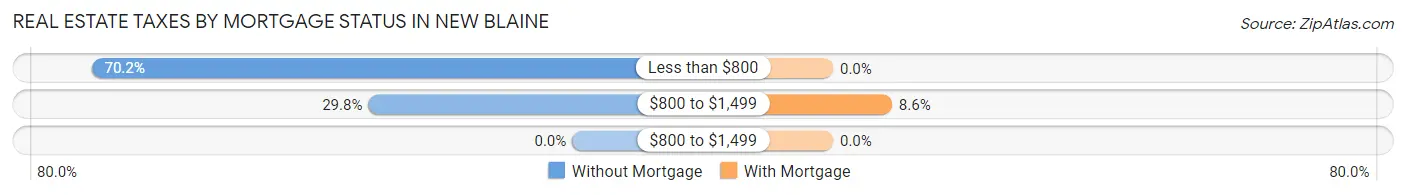
| Property Taxes | Without Mortgage | With Mortgage |
| Less than $800 | 33 (70.2%) | 0 (0.0%) |
| $800 to $1,499 | 14 (29.8%) | 8 (8.6%) |
| $800 to $1,499 | 0 (0.0%) | 0 (0.0%) |
| Total | 47 (100.0%) | 93 (100.0%) |
Health & Disability in New Blaine
Health Insurance Coverage by Age in New Blaine
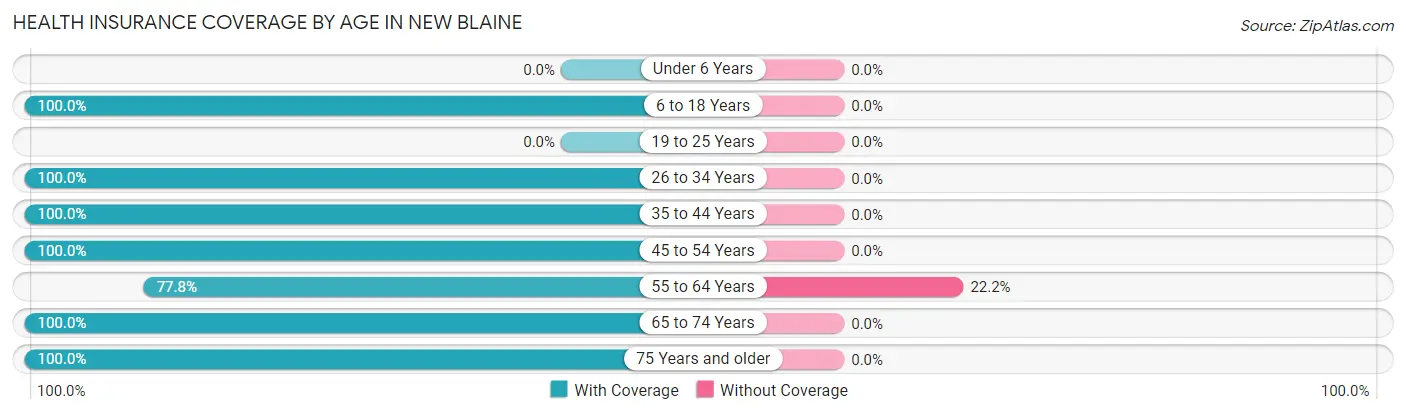
| Age Bracket | With Coverage | Without Coverage |
| Under 6 Years | 0 (0.0%) | 0 (0.0%) |
| 6 to 18 Years | 78 (100.0%) | 0 (0.0%) |
| 19 to 25 Years | 0 (0.0%) | 0 (0.0%) |
| 26 to 34 Years | 8 (100.0%) | 0 (0.0%) |
| 35 to 44 Years | 31 (100.0%) | 0 (0.0%) |
| 45 to 54 Years | 87 (100.0%) | 0 (0.0%) |
| 55 to 64 Years | 42 (77.8%) | 12 (22.2%) |
| 65 to 74 Years | 76 (100.0%) | 0 (0.0%) |
| 75 Years and older | 44 (100.0%) | 0 (0.0%) |
| Total | 366 (96.8%) | 12 (3.2%) |
Health Insurance Coverage by Citizenship Status in New Blaine
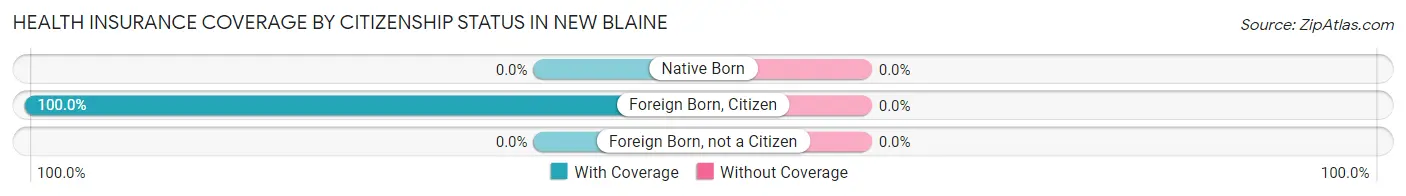
| Citizenship Status | With Coverage | Without Coverage |
| Native Born | 0 (0.0%) | 0 (0.0%) |
| Foreign Born, Citizen | 78 (100.0%) | 0 (0.0%) |
| Foreign Born, not a Citizen | 0 (0.0%) | 0 (0.0%) |
Health Insurance Coverage by Household Income in New Blaine
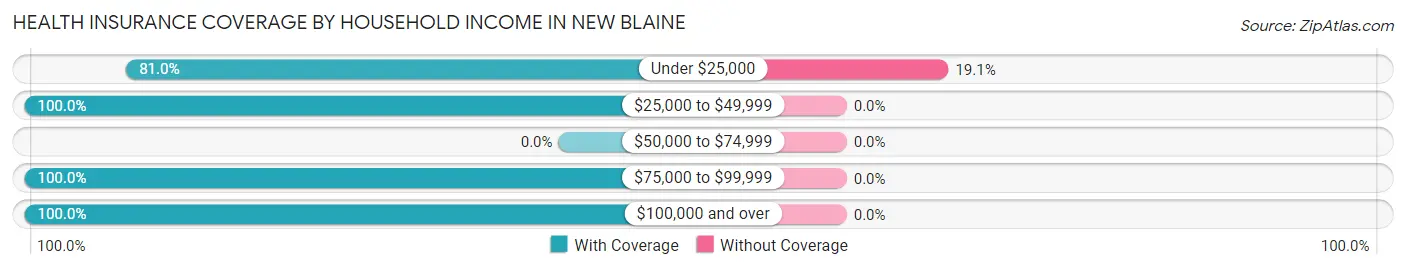
| Household Income | With Coverage | Without Coverage |
| Under $25,000 | 51 (80.9%) | 12 (19.1%) |
| $25,000 to $49,999 | 197 (100.0%) | 0 (0.0%) |
| $50,000 to $74,999 | 0 (0.0%) | 0 (0.0%) |
| $75,000 to $99,999 | 19 (100.0%) | 0 (0.0%) |
| $100,000 and over | 99 (100.0%) | 0 (0.0%) |
Public vs Private Health Insurance Coverage by Age in New Blaine
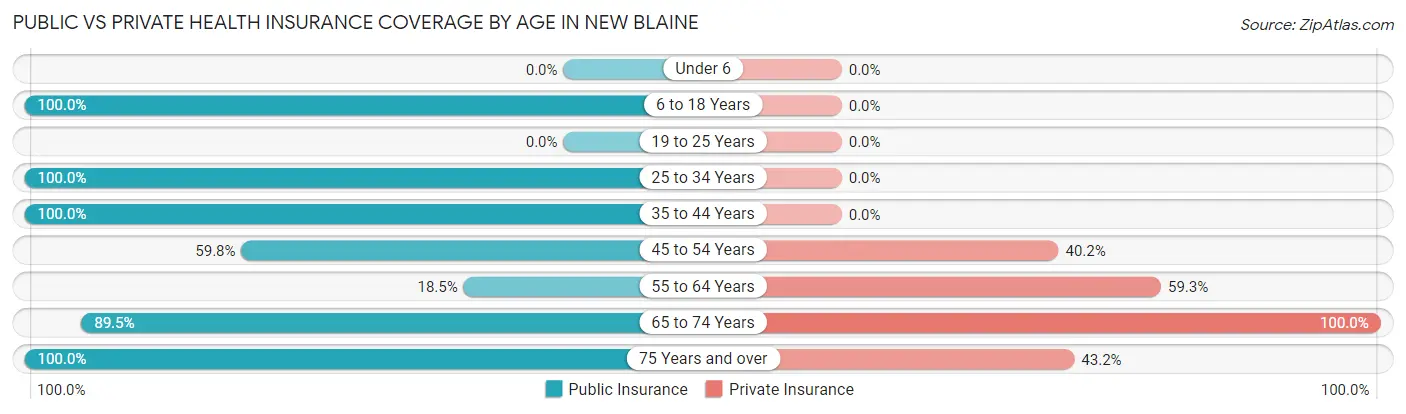
| Age Bracket | Public Insurance | Private Insurance |
| Under 6 | 0 (0.0%) | 0 (0.0%) |
| 6 to 18 Years | 78 (100.0%) | 0 (0.0%) |
| 19 to 25 Years | 0 (0.0%) | 0 (0.0%) |
| 25 to 34 Years | 8 (100.0%) | 0 (0.0%) |
| 35 to 44 Years | 31 (100.0%) | 0 (0.0%) |
| 45 to 54 Years | 52 (59.8%) | 35 (40.2%) |
| 55 to 64 Years | 10 (18.5%) | 32 (59.3%) |
| 65 to 74 Years | 68 (89.5%) | 76 (100.0%) |
| 75 Years and over | 44 (100.0%) | 19 (43.2%) |
| Total | 291 (77.0%) | 162 (42.9%) |
Disability Status by Sex by Age in New Blaine
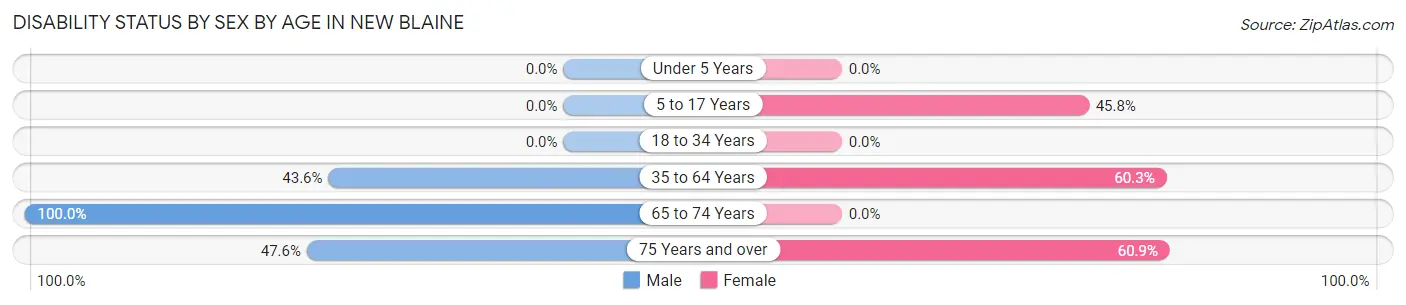
| Age Bracket | Male | Female |
| Under 5 Years | 0 (0.0%) | 0 (0.0%) |
| 5 to 17 Years | 0 (0.0%) | 11 (45.8%) |
| 18 to 34 Years | 0 (0.0%) | 0 (0.0%) |
| 35 to 64 Years | 41 (43.6%) | 47 (60.3%) |
| 65 to 74 Years | 40 (100.0%) | 0 (0.0%) |
| 75 Years and over | 10 (47.6%) | 14 (60.9%) |
Disability Class by Sex by Age in New Blaine
Disability Class: Hearing Difficulty
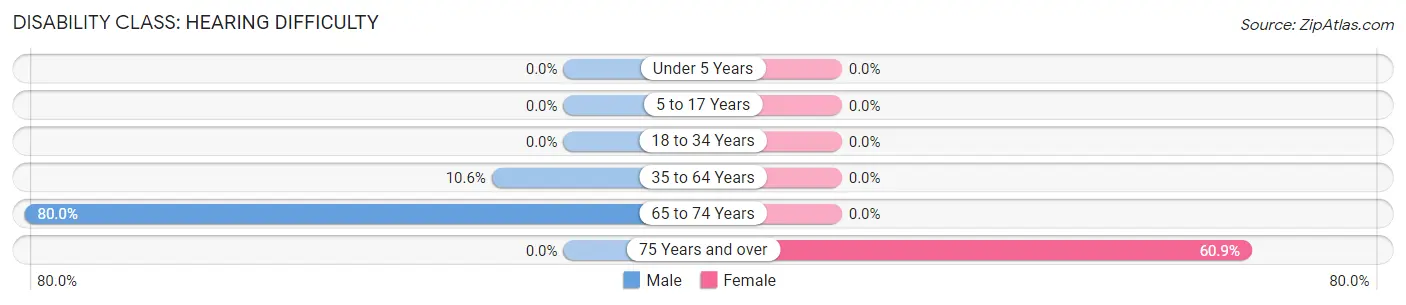
| Age Bracket | Male | Female |
| Under 5 Years | 0 (0.0%) | 0 (0.0%) |
| 5 to 17 Years | 0 (0.0%) | 0 (0.0%) |
| 18 to 34 Years | 0 (0.0%) | 0 (0.0%) |
| 35 to 64 Years | 10 (10.6%) | 0 (0.0%) |
| 65 to 74 Years | 32 (80.0%) | 0 (0.0%) |
| 75 Years and over | 0 (0.0%) | 14 (60.9%) |
Disability Class: Vision Difficulty
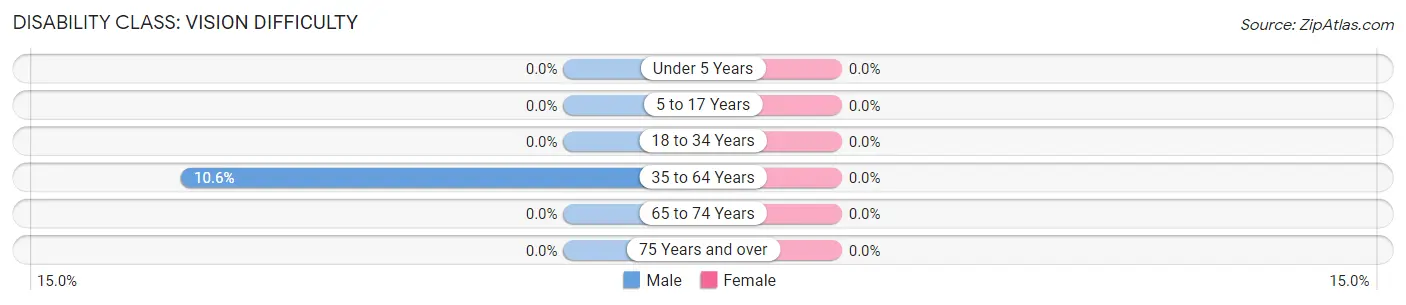
| Age Bracket | Male | Female |
| Under 5 Years | 0 (0.0%) | 0 (0.0%) |
| 5 to 17 Years | 0 (0.0%) | 0 (0.0%) |
| 18 to 34 Years | 0 (0.0%) | 0 (0.0%) |
| 35 to 64 Years | 10 (10.6%) | 0 (0.0%) |
| 65 to 74 Years | 0 (0.0%) | 0 (0.0%) |
| 75 Years and over | 0 (0.0%) | 0 (0.0%) |
Disability Class: Cognitive Difficulty
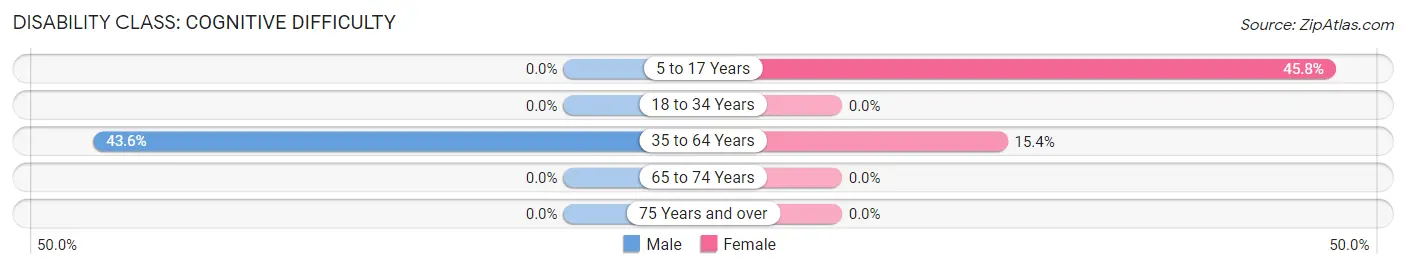
| Age Bracket | Male | Female |
| 5 to 17 Years | 0 (0.0%) | 11 (45.8%) |
| 18 to 34 Years | 0 (0.0%) | 0 (0.0%) |
| 35 to 64 Years | 41 (43.6%) | 12 (15.4%) |
| 65 to 74 Years | 0 (0.0%) | 0 (0.0%) |
| 75 Years and over | 0 (0.0%) | 0 (0.0%) |
Disability Class: Ambulatory Difficulty
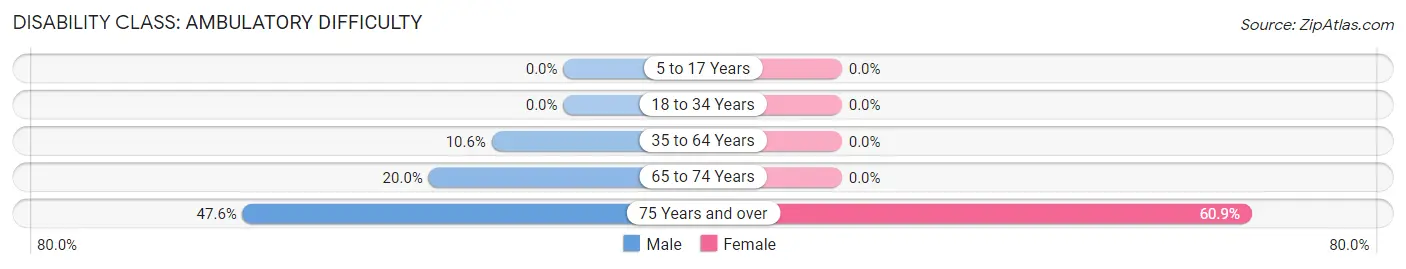
| Age Bracket | Male | Female |
| 5 to 17 Years | 0 (0.0%) | 0 (0.0%) |
| 18 to 34 Years | 0 (0.0%) | 0 (0.0%) |
| 35 to 64 Years | 10 (10.6%) | 0 (0.0%) |
| 65 to 74 Years | 8 (20.0%) | 0 (0.0%) |
| 75 Years and over | 10 (47.6%) | 14 (60.9%) |
Disability Class: Self-Care Difficulty
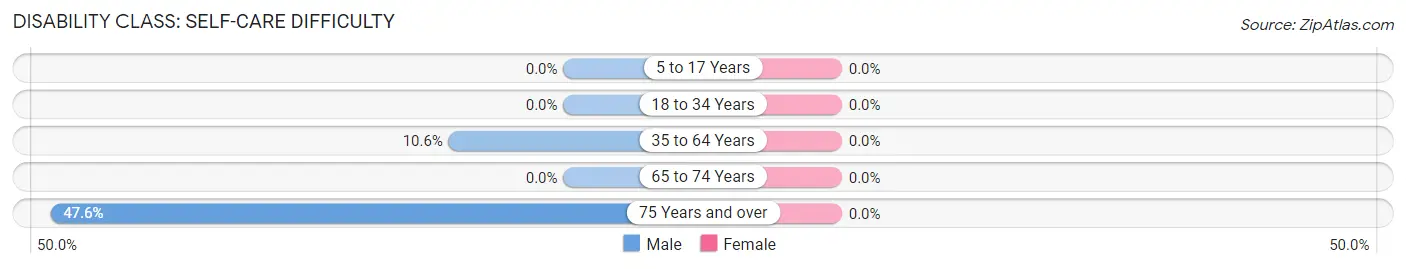
| Age Bracket | Male | Female |
| 5 to 17 Years | 0 (0.0%) | 0 (0.0%) |
| 18 to 34 Years | 0 (0.0%) | 0 (0.0%) |
| 35 to 64 Years | 10 (10.6%) | 0 (0.0%) |
| 65 to 74 Years | 0 (0.0%) | 0 (0.0%) |
| 75 Years and over | 10 (47.6%) | 0 (0.0%) |
Technology Access in New Blaine
Computing Device Access in New Blaine
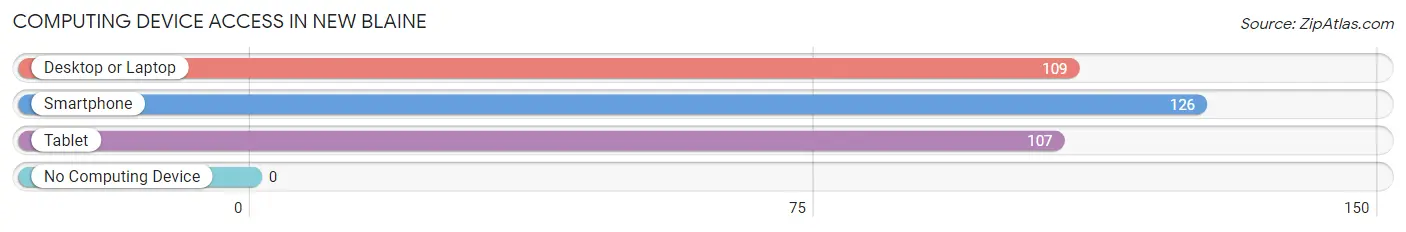
| Device Type | # Households | % Households |
| Desktop or Laptop | 109 | 77.9% |
| Smartphone | 126 | 90.0% |
| Tablet | 107 | 76.4% |
| No Computing Device | 0 | 0.0% |
| Total | 140 | 100.0% |
Internet Access in New Blaine
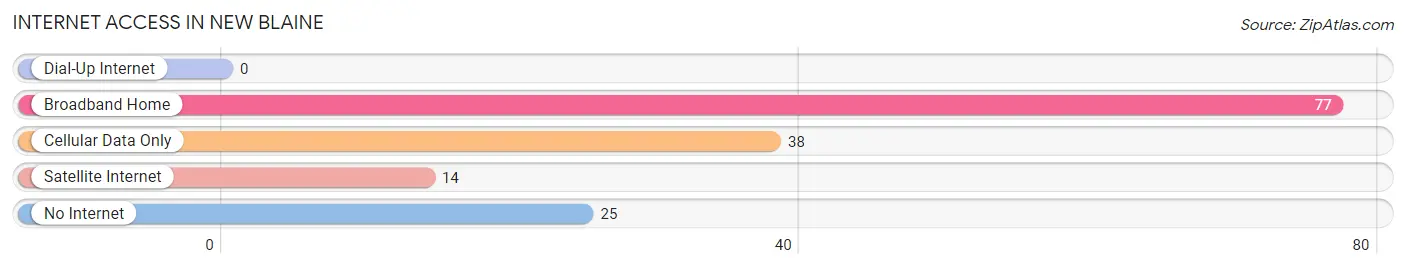
| Internet Type | # Households | % Households |
| Dial-Up Internet | 0 | 0.0% |
| Broadband Home | 77 | 55.0% |
| Cellular Data Only | 38 | 27.1% |
| Satellite Internet | 14 | 10.0% |
| No Internet | 25 | 17.9% |
| Total | 140 | 100.0% |
New Blaine Summary
Blaine, Arkansas is a small town located in the northwest corner of the state, near the Oklahoma border. It is part of the Fort Smith metropolitan area and is the county seat of Sebastian County. The town was founded in 1872 and was named after James G. Blaine, a former U.S. Secretary of State.
Geography
Blaine is located in the northwest corner of Arkansas, near the Oklahoma border. It is part of the Fort Smith metropolitan area and is the county seat of Sebastian County. The town is situated in the Arkansas River Valley, which is part of the Ozark Mountains. The town is surrounded by rolling hills and is located at an elevation of 590 feet. The climate is humid subtropical, with hot summers and mild winters.
Economy
The economy of Blaine is largely based on agriculture and manufacturing. The town is home to several large poultry processing plants, as well as a number of smaller businesses. The town is also home to a number of retail stores, restaurants, and other services.
Demographics
As of the 2010 census, the population of Blaine was 2,845. The racial makeup of the town was 92.3% White, 4.2% African American, 0.3% Native American, 0.3% Asian, 0.1% Pacific Islander, and 2.8% from other races. The median household income was $31,250, and the median family income was $37,500.
History
Blaine was founded in 1872 and was named after James G. Blaine, a former U.S. Secretary of State. The town was originally a farming community, but it soon became a center for the timber industry. The town was also home to a number of sawmills and other businesses. In the early 20th century, the town began to experience a period of growth and prosperity. The town was incorporated in 1912 and the population grew to over 1,000 by the 1930s.
In the 1950s, the town began to experience a decline in population as many of the businesses closed or moved away. The town was also affected by the construction of the nearby Fort Chaffee military base. The population of the town continued to decline until the 1990s, when it began to experience a period of growth and revitalization. The population of the town has been steadily increasing since then and is now estimated to be around 2,845.
Blaine is a small town with a rich history and a bright future. The town is home to a number of businesses and is a great place to live and work. The town is also home to a number of parks and recreational areas, making it a great place to visit and explore. Blaine is a great place to call home and is sure to continue to grow and prosper in the years to come.
Common Questions
What is Per Capita Income in New Blaine?
Per Capita income in New Blaine is $20,572.
What is the Median Household income in New Blaine?
Median Household Income in New Blaine is $45,379.
What is Inequality or Gini Index in New Blaine?
Inequality or Gini Index in New Blaine is 0.35.
What is the Total Population of New Blaine?
Total Population of New Blaine is 378.
What is the Total Male Population of New Blaine?
Total Male Population of New Blaine is 209.
What is the Total Female Population of New Blaine?
Total Female Population of New Blaine is 169.
What is the Ratio of Males per 100 Females in New Blaine?
There are 123.67 Males per 100 Females in New Blaine.
What is the Ratio of Females per 100 Males in New Blaine?
There are 80.86 Females per 100 Males in New Blaine.
What is the Median Population Age in New Blaine?
Median Population Age in New Blaine is 54.8 Years.
What is the Average Family Size in New Blaine
Average Family Size in New Blaine is 3.1 People.
What is the Average Household Size in New Blaine
Average Household Size in New Blaine is 2.7 People.
How Large is the Labor Force in New Blaine?
There are 156 People in the Labor Forcein in New Blaine.
What is the Percentage of People in the Labor Force in New Blaine?
46.7% of People are in the Labor Force in New Blaine.