Mulberry, AR Map & Demographics
Mulberry Map
Mulberry Overview
$24,370
PER CAPITA INCOME
$50,982
AVG FAMILY INCOME
$41,932
AVG HOUSEHOLD INCOME
30.2%
WAGE / INCOME GAP [ % ]
69.8¢/ $1
WAGE / INCOME GAP [ $ ]
0.42
INEQUALITY / GINI INDEX
1,616
TOTAL POPULATION
792
MALE POPULATION
824
FEMALE POPULATION
96.12
MALES / 100 FEMALES
104.04
FEMALES / 100 MALES
44.3
MEDIAN AGE
2.9
AVG FAMILY SIZE
2.3
AVG HOUSEHOLD SIZE
569
LABOR FORCE [ PEOPLE ]
41.2%
PERCENT IN LABOR FORCE
3.3%
UNEMPLOYMENT RATE
Mulberry Zip Codes
Mulberry Area Codes
Income in Mulberry
Income Overview in Mulberry
Per Capita Income in Mulberry is $24,370, while median incomes of families and households are $50,982 and $41,932 respectively.
| Characteristic | Number | Measure |
| Per Capita Income | 1,616 | $24,370 |
| Median Family Income | 417 | $50,982 |
| Mean Family Income | 417 | $70,000 |
| Median Household Income | 675 | $41,932 |
| Mean Household Income | 675 | $56,897 |
| Income Deficit | 417 | $0 |
| Wage / Income Gap (%) | 1,616 | 30.25% |
| Wage / Income Gap ($) | 1,616 | 69.75¢ per $1 |
| Gini / Inequality Index | 1,616 | 0.42 |
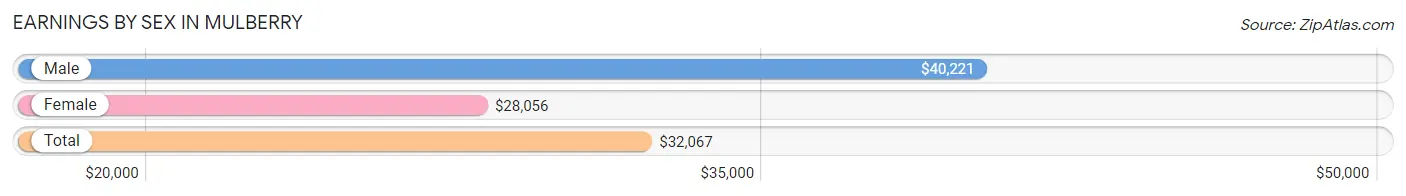
Earnings by Sex in Mulberry
Average Earnings in Mulberry are $32,067, $40,221 for men and $28,056 for women, a difference of 30.2%.
| Sex | Number | Average Earnings |
| Male | 329 (55.3%) | $40,221 |
| Female | 266 (44.7%) | $28,056 |
| Total | 595 (100.0%) | $32,067 |
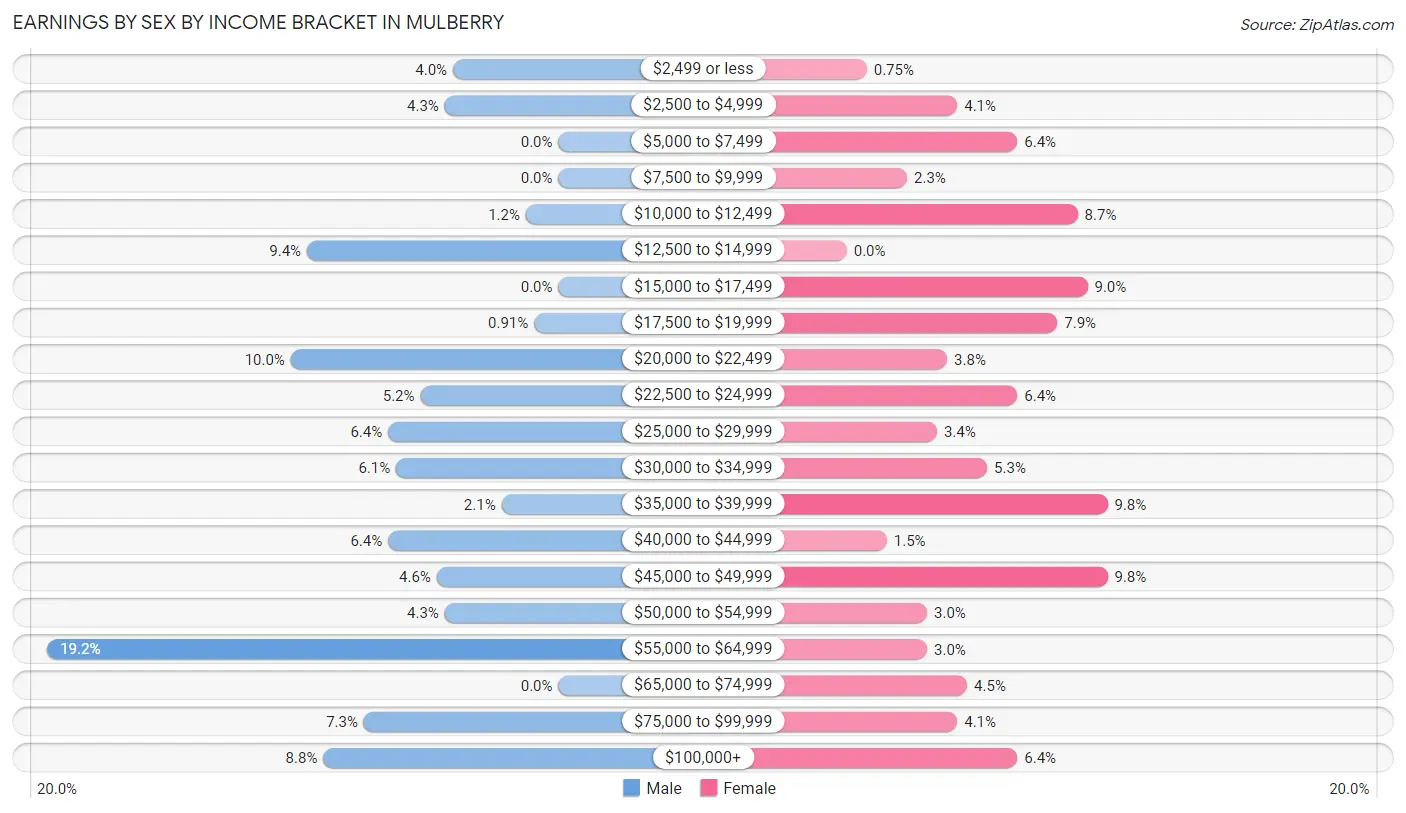
Earnings by Sex by Income Bracket in Mulberry
The most common earnings brackets in Mulberry are $55,000 to $64,999 for men (63 | 19.2%) and $35,000 to $39,999 for women (26 | 9.8%).
| Income | Male | Female |
| $2,499 or less | 13 (4.0%) | 2 (0.7%) |
| $2,500 to $4,999 | 14 (4.3%) | 11 (4.1%) |
| $5,000 to $7,499 | 0 (0.0%) | 17 (6.4%) |
| $7,500 to $9,999 | 0 (0.0%) | 6 (2.3%) |
| $10,000 to $12,499 | 4 (1.2%) | 23 (8.6%) |
| $12,500 to $14,999 | 31 (9.4%) | 0 (0.0%) |
| $15,000 to $17,499 | 0 (0.0%) | 24 (9.0%) |
| $17,500 to $19,999 | 3 (0.9%) | 21 (7.9%) |
| $20,000 to $22,499 | 33 (10.0%) | 10 (3.8%) |
| $22,500 to $24,999 | 17 (5.2%) | 17 (6.4%) |
| $25,000 to $29,999 | 21 (6.4%) | 9 (3.4%) |
| $30,000 to $34,999 | 20 (6.1%) | 14 (5.3%) |
| $35,000 to $39,999 | 7 (2.1%) | 26 (9.8%) |
| $40,000 to $44,999 | 21 (6.4%) | 4 (1.5%) |
| $45,000 to $49,999 | 15 (4.6%) | 26 (9.8%) |
| $50,000 to $54,999 | 14 (4.3%) | 8 (3.0%) |
| $55,000 to $64,999 | 63 (19.2%) | 8 (3.0%) |
| $65,000 to $74,999 | 0 (0.0%) | 12 (4.5%) |
| $75,000 to $99,999 | 24 (7.3%) | 11 (4.1%) |
| $100,000+ | 29 (8.8%) | 17 (6.4%) |
| Total | 329 (100.0%) | 266 (100.0%) |
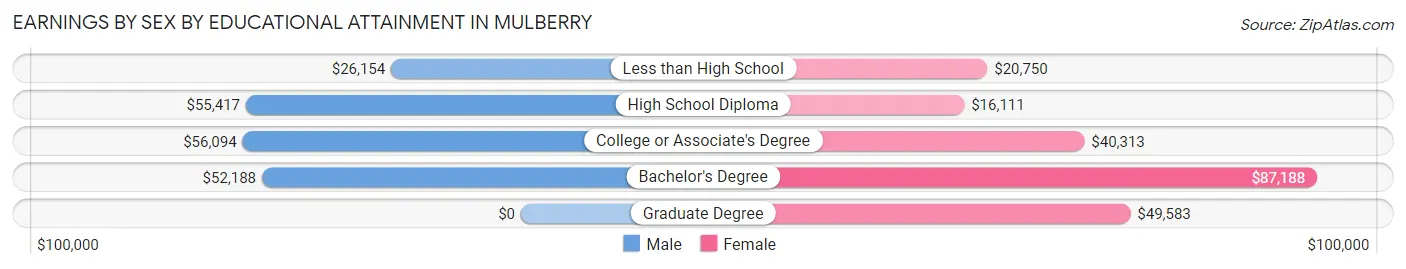
Earnings by Sex by Educational Attainment in Mulberry
Average earnings in Mulberry are $50,000 for men and $34,063 for women, a difference of 31.9%. Men with an educational attainment of college or associate's degree enjoy the highest average annual earnings of $56,094, while those with less than high school education earn the least with $26,154. Women with an educational attainment of bachelor's degree earn the most with the average annual earnings of $87,188, while those with high school diploma education have the smallest earnings of $16,111.
| Educational Attainment | Male Income | Female Income |
| Less than High School | $26,154 | $20,750 |
| High School Diploma | $55,417 | $16,111 |
| College or Associate's Degree | $56,094 | $40,313 |
| Bachelor's Degree | $52,188 | $87,188 |
| Graduate Degree | - | - |
| Total | $50,000 | $34,063 |
Family Income in Mulberry
Family Income Brackets in Mulberry
According to the Mulberry family income data, there are 80 families falling into the $25,000 to $34,999 income range, which is the most common income bracket and makes up 19.2% of all families. Conversely, the less than $10,000 income bracket is the least frequent group with only 3 families (0.7%) belonging to this category.
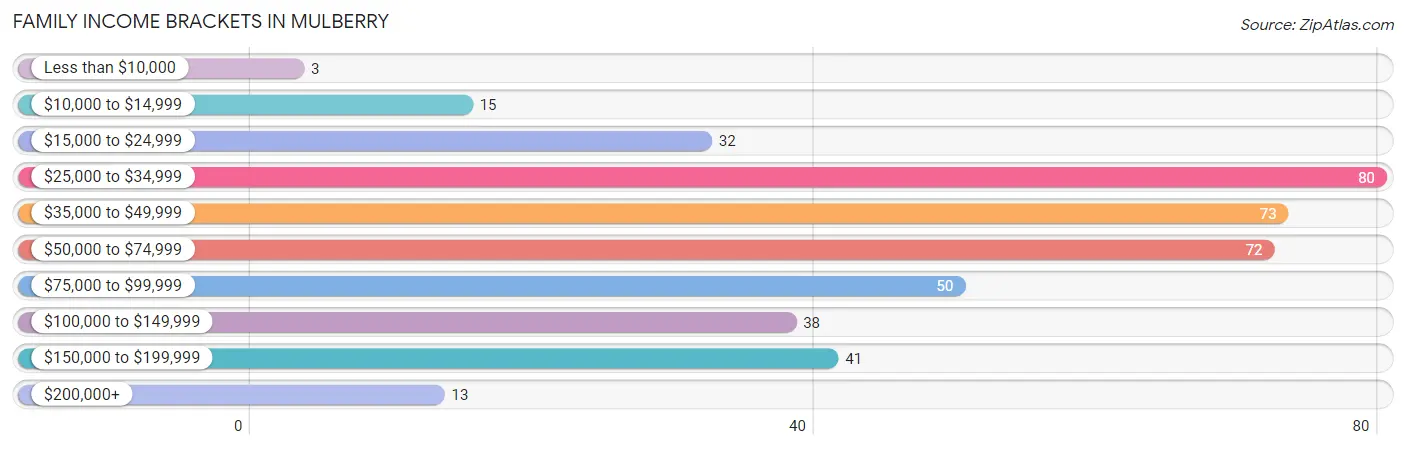
| Income Bracket | # Families | % Families |
| Less than $10,000 | 3 | 0.7% |
| $10,000 to $14,999 | 15 | 3.6% |
| $15,000 to $24,999 | 32 | 7.7% |
| $25,000 to $34,999 | 80 | 19.2% |
| $35,000 to $49,999 | 73 | 17.5% |
| $50,000 to $74,999 | 72 | 17.3% |
| $75,000 to $99,999 | 50 | 12.0% |
| $100,000 to $149,999 | 38 | 9.1% |
| $150,000 to $199,999 | 41 | 9.8% |
| $200,000+ | 13 | 3.1% |
Family Income by Famaliy Size in Mulberry
4-person families (68 | 16.3%) account for the highest median family income in Mulberry with $90,417 per family, while 2-person families (171 | 41.0%) have the highest median income of $24,688 per family member.
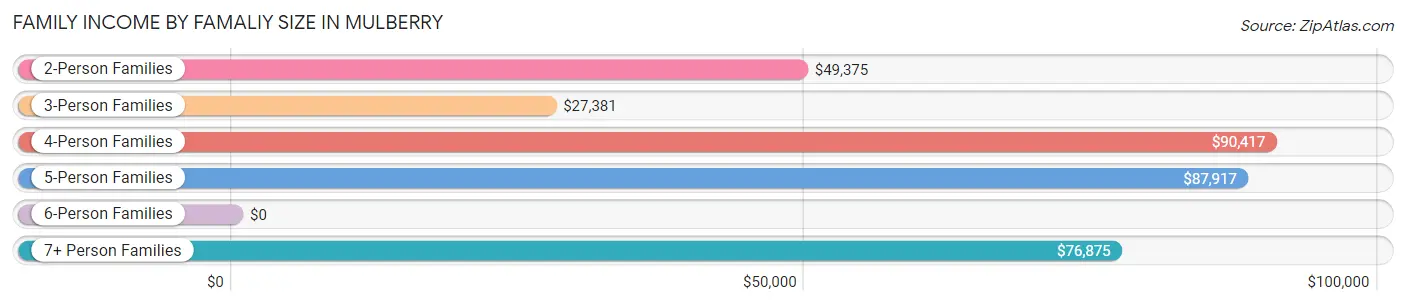
| Income Bracket | # Families | Median Income |
| 2-Person Families | 171 (41.0%) | $49,375 |
| 3-Person Families | 134 (32.1%) | $27,381 |
| 4-Person Families | 68 (16.3%) | $90,417 |
| 5-Person Families | 23 (5.5%) | $87,917 |
| 6-Person Families | 5 (1.2%) | $0 |
| 7+ Person Families | 16 (3.8%) | $76,875 |
| Total | 417 (100.0%) | $50,982 |
Family Income by Number of Earners in Mulberry
The median family income in Mulberry is $50,982, with families comprising 2 earners (93) having the highest median family income of $103,750, while families with no earners (146) have the lowest median family income of $26,984, accounting for 22.3% and 35.0% of families, respectively.
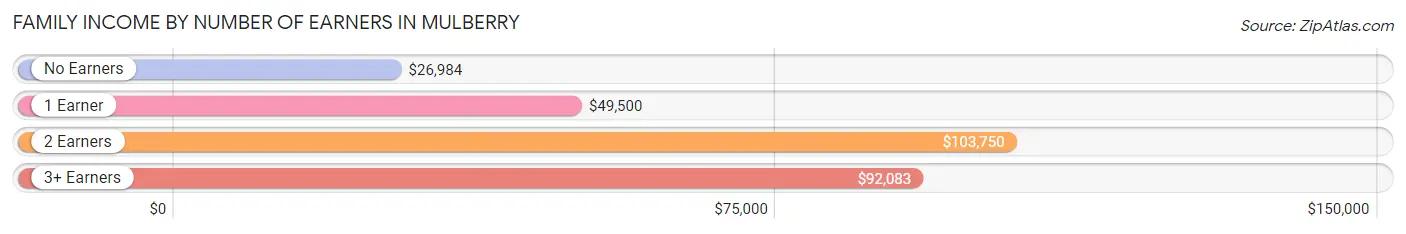
| Number of Earners | # Families | Median Income |
| No Earners | 146 (35.0%) | $26,984 |
| 1 Earner | 160 (38.4%) | $49,500 |
| 2 Earners | 93 (22.3%) | $103,750 |
| 3+ Earners | 18 (4.3%) | $92,083 |
| Total | 417 (100.0%) | $50,982 |
Household Income in Mulberry
Household Income Brackets in Mulberry
With 157 households falling in the category, the $35,000 to $49,999 income range is the most frequent in Mulberry, accounting for 23.3% of all households. In contrast, only 13 households (1.9%) fall into the $200,000+ income bracket, making it the least populous group.
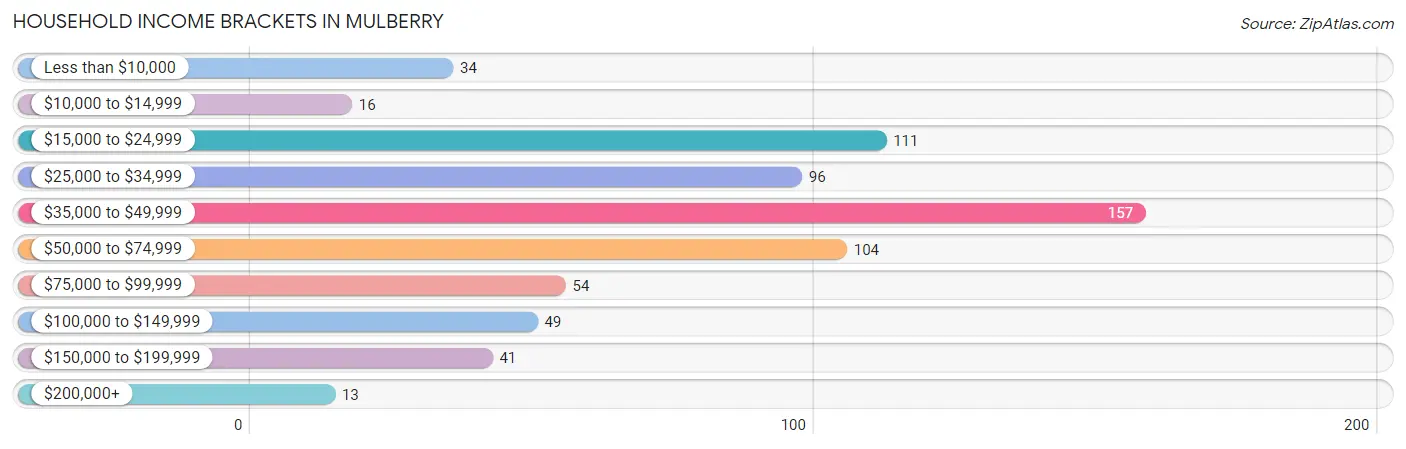
| Income Bracket | # Households | % Households |
| Less than $10,000 | 34 | 5.0% |
| $10,000 to $14,999 | 16 | 2.4% |
| $15,000 to $24,999 | 111 | 16.4% |
| $25,000 to $34,999 | 96 | 14.2% |
| $35,000 to $49,999 | 157 | 23.3% |
| $50,000 to $74,999 | 104 | 15.4% |
| $75,000 to $99,999 | 54 | 8.0% |
| $100,000 to $149,999 | 49 | 7.3% |
| $150,000 to $199,999 | 41 | 6.1% |
| $200,000+ | 13 | 1.9% |
Household Income by Householder Age in Mulberry
The median household income in Mulberry is $41,932, with the highest median household income of $51,607 found in the 25 to 44 years age bracket for the primary householder. A total of 145 households (21.5%) fall into this category. Meanwhile, the 15 to 24 years age bracket for the primary householder has the lowest median household income of $0, with 18 households (2.7%) in this group.
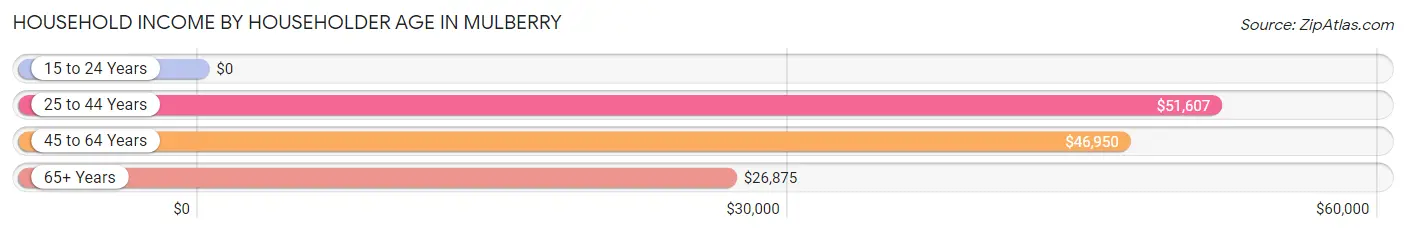
| Income Bracket | # Households | Median Income |
| 15 to 24 Years | 18 (2.7%) | $0 |
| 25 to 44 Years | 145 (21.5%) | $51,607 |
| 45 to 64 Years | 257 (38.1%) | $46,950 |
| 65+ Years | 255 (37.8%) | $26,875 |
| Total | 675 (100.0%) | $41,932 |
Poverty in Mulberry
Income Below Poverty by Sex and Age in Mulberry
With 11.0% poverty level for males and 22.7% for females among the residents of Mulberry, 6 to 11 year old males and 6 to 11 year old females are the most vulnerable to poverty, with 21 males (42.0%) and 19 females (43.2%) in their respective age groups living below the poverty level.
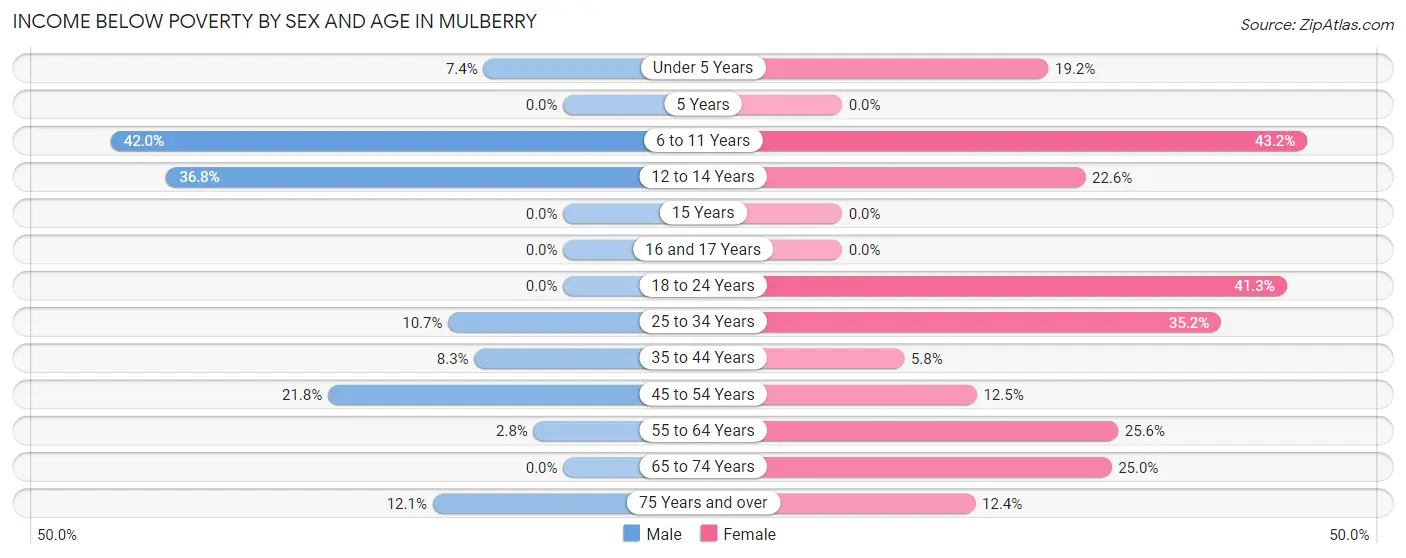
| Age Bracket | Male | Female |
| Under 5 Years | 2 (7.4%) | 9 (19.2%) |
| 5 Years | 0 (0.0%) | 0 (0.0%) |
| 6 to 11 Years | 21 (42.0%) | 19 (43.2%) |
| 12 to 14 Years | 7 (36.8%) | 7 (22.6%) |
| 15 Years | 0 (0.0%) | 0 (0.0%) |
| 16 and 17 Years | 0 (0.0%) | 0 (0.0%) |
| 18 to 24 Years | 0 (0.0%) | 26 (41.3%) |
| 25 to 34 Years | 11 (10.7%) | 44 (35.2%) |
| 35 to 44 Years | 8 (8.3%) | 3 (5.8%) |
| 45 to 54 Years | 19 (21.8%) | 13 (12.5%) |
| 55 to 64 Years | 3 (2.8%) | 31 (25.6%) |
| 65 to 74 Years | 0 (0.0%) | 23 (25.0%) |
| 75 Years and over | 16 (12.1%) | 12 (12.4%) |
| Total | 87 (11.0%) | 187 (22.7%) |
Income Above Poverty by Sex and Age in Mulberry
According to the poverty statistics in Mulberry, males aged 5 years and females aged 15 years are the age groups that are most secure financially, with 100.0% of males and 100.0% of females in these age groups living above the poverty line.
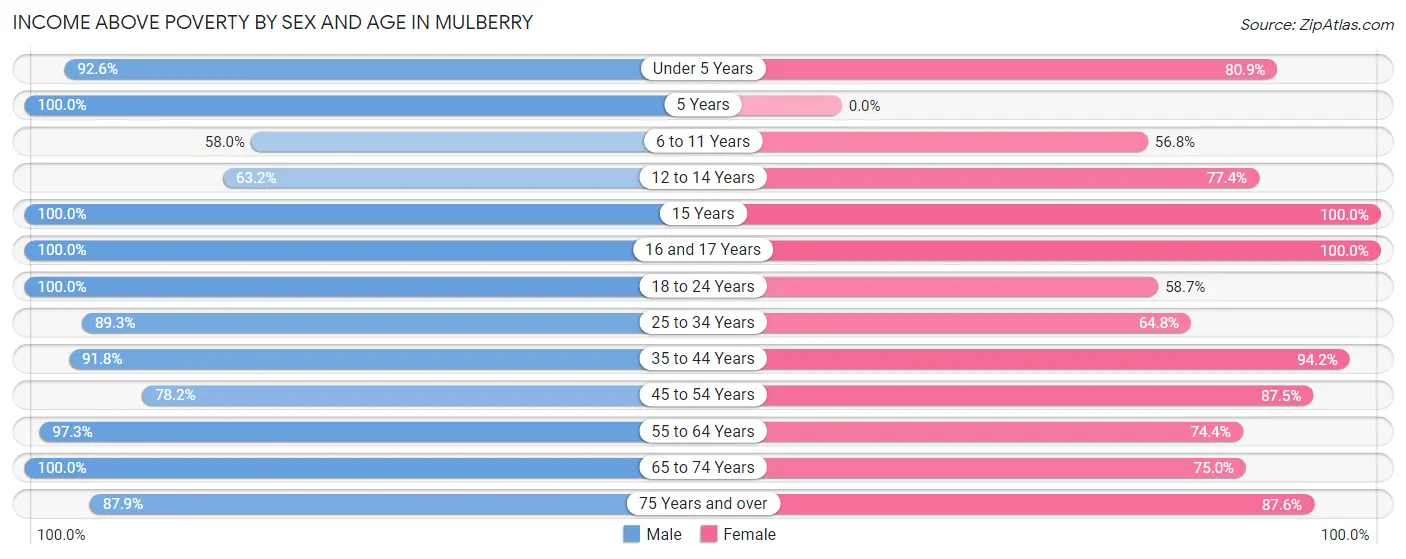
| Age Bracket | Male | Female |
| Under 5 Years | 25 (92.6%) | 38 (80.8%) |
| 5 Years | 9 (100.0%) | 0 (0.0%) |
| 6 to 11 Years | 29 (58.0%) | 25 (56.8%) |
| 12 to 14 Years | 12 (63.2%) | 24 (77.4%) |
| 15 Years | 3 (100.0%) | 6 (100.0%) |
| 16 and 17 Years | 22 (100.0%) | 42 (100.0%) |
| 18 to 24 Years | 80 (100.0%) | 37 (58.7%) |
| 25 to 34 Years | 92 (89.3%) | 81 (64.8%) |
| 35 to 44 Years | 89 (91.7%) | 49 (94.2%) |
| 45 to 54 Years | 68 (78.2%) | 91 (87.5%) |
| 55 to 64 Years | 106 (97.3%) | 90 (74.4%) |
| 65 to 74 Years | 54 (100.0%) | 69 (75.0%) |
| 75 Years and over | 116 (87.9%) | 85 (87.6%) |
| Total | 705 (89.0%) | 637 (77.3%) |
Income Below Poverty Among Married-Couple Families in Mulberry
The poverty statistics for married-couple families in Mulberry show that 3.1% or 10 of the total 320 families live below the poverty line. Families with 5 or more children have the highest poverty rate of 41.7%, comprising of 5 families. On the other hand, families with 3 or 4 children have the lowest poverty rate of 0.0%, which includes 0 families.
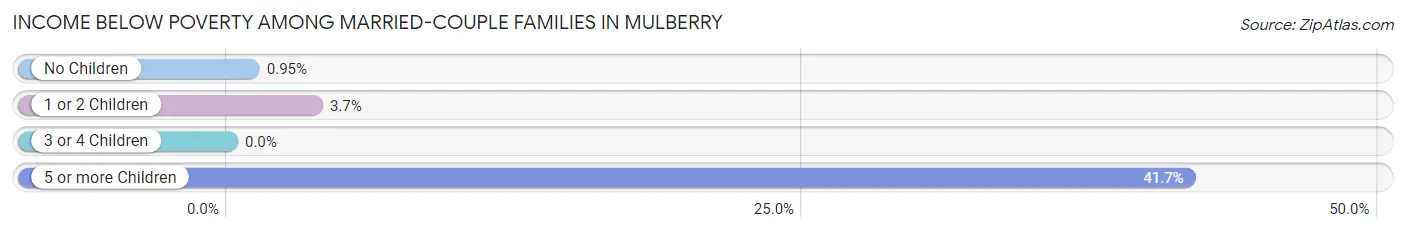
| Children | Above Poverty | Below Poverty |
| No Children | 209 (99.1%) | 2 (0.9%) |
| 1 or 2 Children | 78 (96.3%) | 3 (3.7%) |
| 3 or 4 Children | 16 (100.0%) | 0 (0.0%) |
| 5 or more Children | 7 (58.3%) | 5 (41.7%) |
| Total | 310 (96.9%) | 10 (3.1%) |
Income Below Poverty Among Single-Parent Households in Mulberry
According to the poverty data in Mulberry, 15.2% or 7 single-father households and 41.2% or 21 single-mother households are living below the poverty line. Among single-father households, those with 3 or 4 children have the highest poverty rate, with 3 households (100.0%) experiencing poverty. Likewise, among single-mother households, those with 3 or 4 children have the highest poverty rate, with 2 households (100.0%) falling below the poverty line.
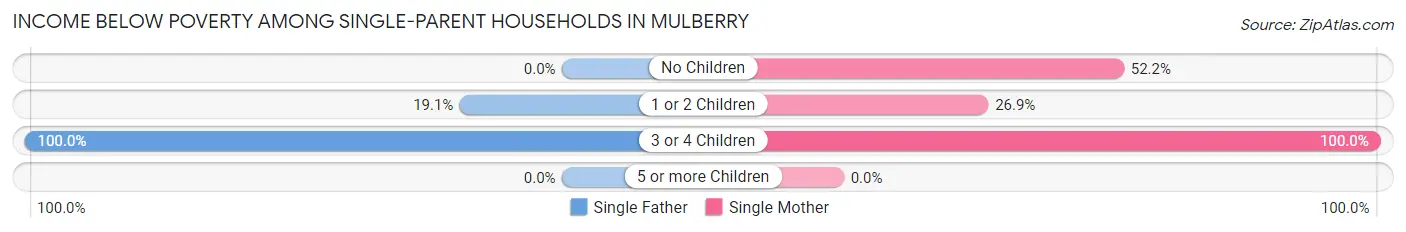
| Children | Single Father | Single Mother |
| No Children | 0 (0.0%) | 12 (52.2%) |
| 1 or 2 Children | 4 (19.1%) | 7 (26.9%) |
| 3 or 4 Children | 3 (100.0%) | 2 (100.0%) |
| 5 or more Children | 0 (0.0%) | 0 (0.0%) |
| Total | 7 (15.2%) | 21 (41.2%) |
Income Below Poverty Among Married-Couple vs Single-Parent Households in Mulberry
The poverty data for Mulberry shows that 10 of the married-couple family households (3.1%) and 28 of the single-parent households (28.9%) are living below the poverty level. Within the married-couple family households, those with 5 or more children have the highest poverty rate, with 5 households (41.7%) falling below the poverty line. Among the single-parent households, those with 3 or 4 children have the highest poverty rate, with 5 household (100.0%) living below poverty.
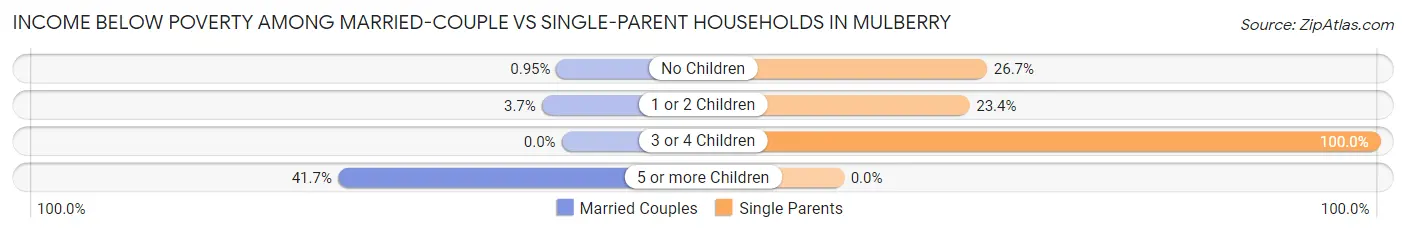
| Children | Married-Couple Families | Single-Parent Households |
| No Children | 2 (0.9%) | 12 (26.7%) |
| 1 or 2 Children | 3 (3.7%) | 11 (23.4%) |
| 3 or 4 Children | 0 (0.0%) | 5 (100.0%) |
| 5 or more Children | 5 (41.7%) | 0 (0.0%) |
| Total | 10 (3.1%) | 28 (28.9%) |
Race in Mulberry
The most populous races in Mulberry are White / Caucasian (1,436 | 88.9%), Two or more Races (84 | 5.2%), and Native / Alaskan (75 | 4.6%).
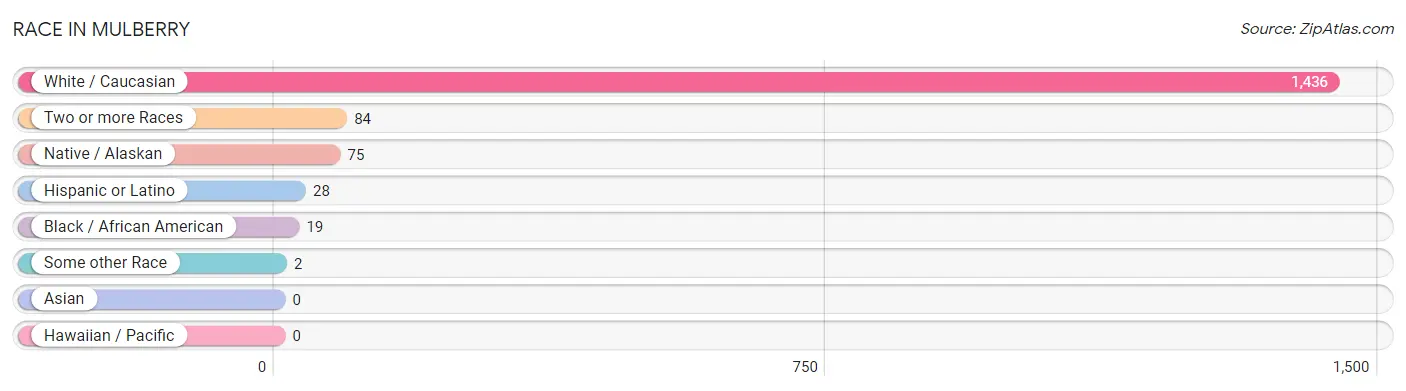
| Race | # Population | % Population |
| Asian | 0 | 0.0% |
| Black / African American | 19 | 1.2% |
| Hawaiian / Pacific | 0 | 0.0% |
| Hispanic or Latino | 28 | 1.7% |
| Native / Alaskan | 75 | 4.6% |
| White / Caucasian | 1,436 | 88.9% |
| Two or more Races | 84 | 5.2% |
| Some other Race | 2 | 0.1% |
| Total | 1,616 | 100.0% |
Ancestry in Mulberry
The most populous ancestries reported in Mulberry are American (404 | 25.0%), English (171 | 10.6%), German (155 | 9.6%), Irish (127 | 7.9%), and Cherokee (99 | 6.1%), together accounting for 59.2% of all Mulberry residents.
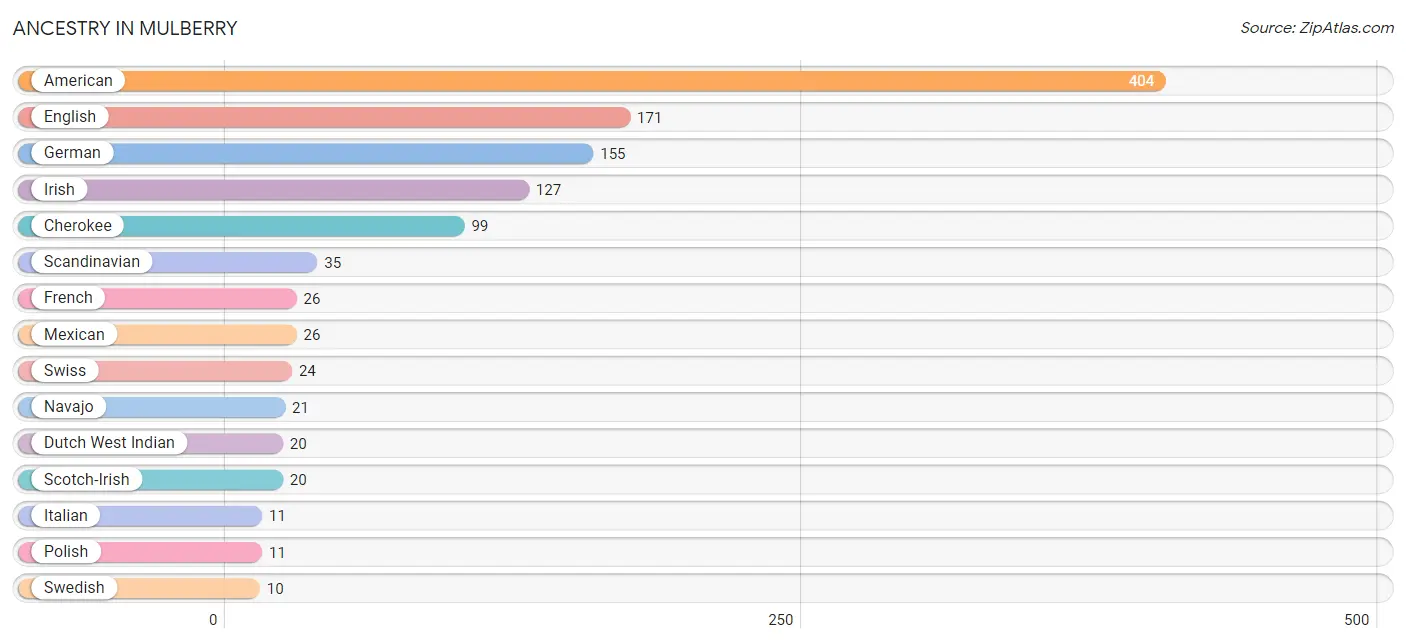
| Ancestry | # Population | % Population |
| American | 404 | 25.0% |
| Cherokee | 99 | 6.1% |
| Dutch | 4 | 0.3% |
| Dutch West Indian | 20 | 1.2% |
| English | 171 | 10.6% |
| European | 6 | 0.4% |
| French | 26 | 1.6% |
| German | 155 | 9.6% |
| Irish | 127 | 7.9% |
| Italian | 11 | 0.7% |
| Mexican | 26 | 1.6% |
| Navajo | 21 | 1.3% |
| Polish | 11 | 0.7% |
| Russian | 5 | 0.3% |
| Scandinavian | 35 | 2.2% |
| Scotch-Irish | 20 | 1.2% |
| Scottish | 5 | 0.3% |
| Spaniard | 2 | 0.1% |
| Swedish | 10 | 0.6% |
| Swiss | 24 | 1.5% | View All 20 Rows |
Immigrants in Mulberry
The most numerous immigrant groups reported in Mulberry came from Europe (6 | 0.4%), Eastern Europe (4 | 0.3%), Poland (4 | 0.3%), Southern Europe (2 | 0.1%), and Spain (2 | 0.1%), together accounting for 1.1% of all Mulberry residents.
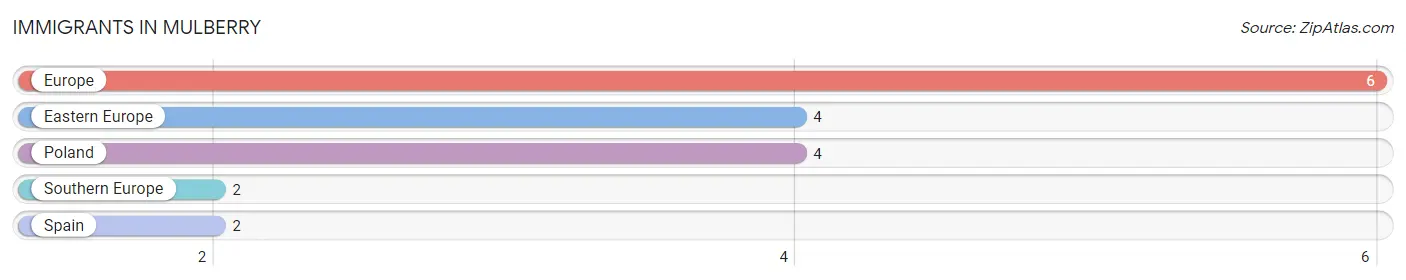
| Immigration Origin | # Population | % Population |
| Eastern Europe | 4 | 0.3% |
| Europe | 6 | 0.4% |
| Poland | 4 | 0.3% |
| Southern Europe | 2 | 0.1% |
| Spain | 2 | 0.1% | View All 5 Rows |
Sex and Age in Mulberry
Sex and Age in Mulberry
The most populous age groups in Mulberry are 80 to 84 Years (99 | 12.5%) for men and 15 to 19 Years (73 | 8.9%) for women.
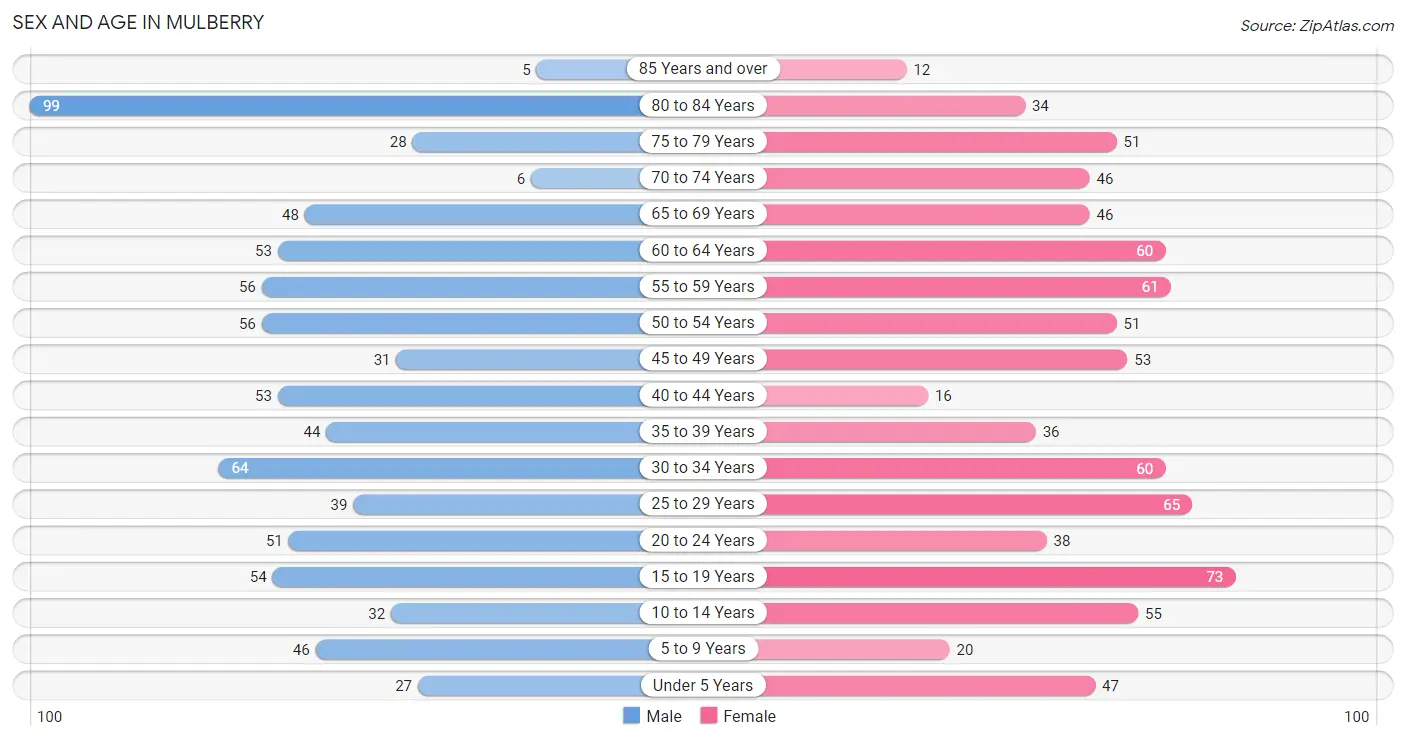
| Age Bracket | Male | Female |
| Under 5 Years | 27 (3.4%) | 47 (5.7%) |
| 5 to 9 Years | 46 (5.8%) | 20 (2.4%) |
| 10 to 14 Years | 32 (4.0%) | 55 (6.7%) |
| 15 to 19 Years | 54 (6.8%) | 73 (8.9%) |
| 20 to 24 Years | 51 (6.4%) | 38 (4.6%) |
| 25 to 29 Years | 39 (4.9%) | 65 (7.9%) |
| 30 to 34 Years | 64 (8.1%) | 60 (7.3%) |
| 35 to 39 Years | 44 (5.6%) | 36 (4.4%) |
| 40 to 44 Years | 53 (6.7%) | 16 (1.9%) |
| 45 to 49 Years | 31 (3.9%) | 53 (6.4%) |
| 50 to 54 Years | 56 (7.1%) | 51 (6.2%) |
| 55 to 59 Years | 56 (7.1%) | 61 (7.4%) |
| 60 to 64 Years | 53 (6.7%) | 60 (7.3%) |
| 65 to 69 Years | 48 (6.1%) | 46 (5.6%) |
| 70 to 74 Years | 6 (0.8%) | 46 (5.6%) |
| 75 to 79 Years | 28 (3.5%) | 51 (6.2%) |
| 80 to 84 Years | 99 (12.5%) | 34 (4.1%) |
| 85 Years and over | 5 (0.6%) | 12 (1.5%) |
| Total | 792 (100.0%) | 824 (100.0%) |
Families and Households in Mulberry
Median Family Size in Mulberry
The median family size in Mulberry is 2.91 persons per family, with single male/father families (46 | 11.0%) accounting for the largest median family size of 2.93 persons per family. On the other hand, married-couple families (320 | 76.7%) represent the smallest median family size with 2.90 persons per family.
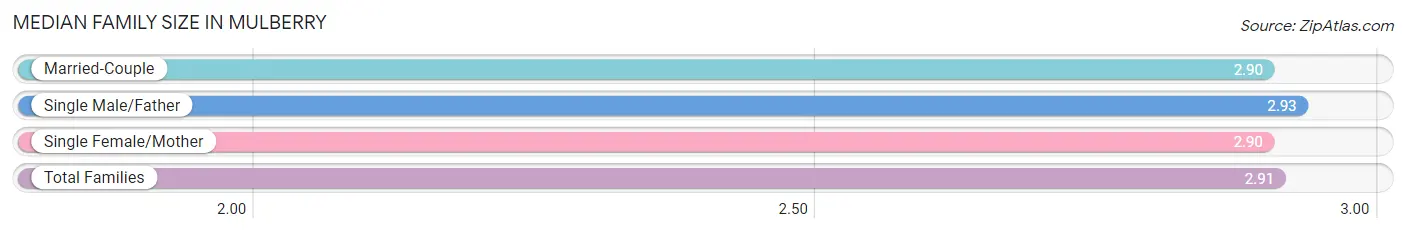
| Family Type | # Families | Family Size |
| Married-Couple | 320 (76.7%) | 2.90 |
| Single Male/Father | 46 (11.0%) | 2.93 |
| Single Female/Mother | 51 (12.2%) | 2.90 |
| Total Families | 417 (100.0%) | 2.91 |
Median Household Size in Mulberry
The median household size in Mulberry is 2.32 persons per household, with single male/father households (46 | 6.8%) accounting for the largest median household size of 3.3 persons per household. non-family households (258 | 38.2%) represent the smallest median household size with 1.17 persons per household.
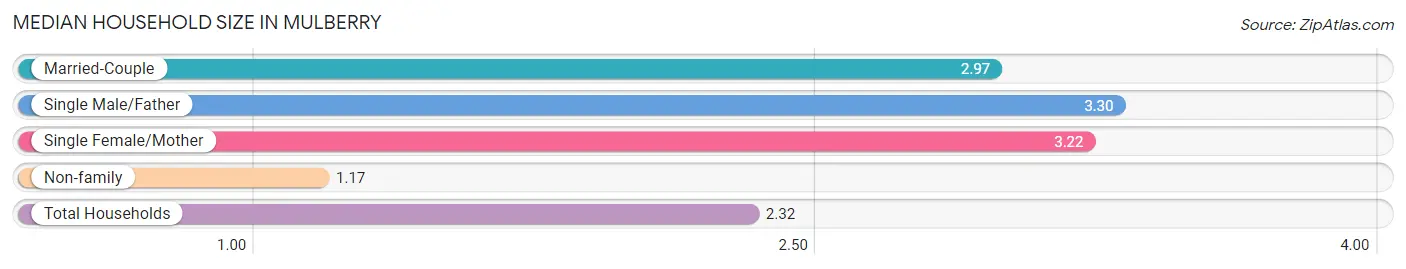
| Household Type | # Households | Household Size |
| Married-Couple | 320 (47.4%) | 2.97 |
| Single Male/Father | 46 (6.8%) | 3.30 |
| Single Female/Mother | 51 (7.6%) | 3.22 |
| Non-family | 258 (38.2%) | 1.17 |
| Total Households | 675 (100.0%) | 2.32 |
Household Size by Marriage Status in Mulberry
Out of a total of 675 households in Mulberry, 417 (61.8%) are family households, while 258 (38.2%) are nonfamily households. The most numerous type of family households are 2-person households, comprising 147, and the most common type of nonfamily households are 1-person households, comprising 215.
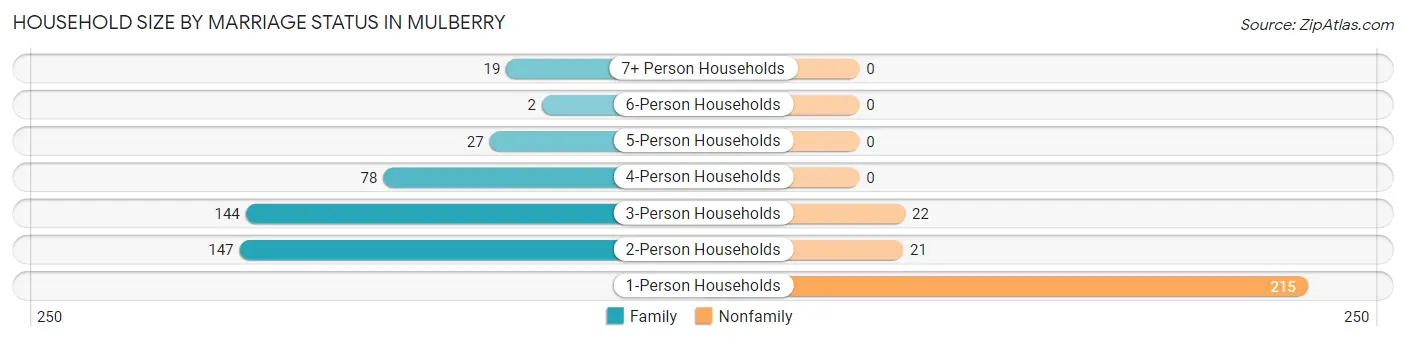
| Household Size | Family Households | Nonfamily Households |
| 1-Person Households | - | 215 (31.9%) |
| 2-Person Households | 147 (21.8%) | 21 (3.1%) |
| 3-Person Households | 144 (21.3%) | 22 (3.3%) |
| 4-Person Households | 78 (11.6%) | 0 (0.0%) |
| 5-Person Households | 27 (4.0%) | 0 (0.0%) |
| 6-Person Households | 2 (0.3%) | 0 (0.0%) |
| 7+ Person Households | 19 (2.8%) | 0 (0.0%) |
| Total | 417 (61.8%) | 258 (38.2%) |
Female Fertility in Mulberry
Fertility by Age in Mulberry
Average fertility rate in Mulberry is 66.0 births per 1,000 women. Women in the age bracket of 20 to 34 years have the highest fertility rate with 147.0 births per 1,000 women. Women in the age bracket of 20 to 34 years acount for 100.0% of all women with births.
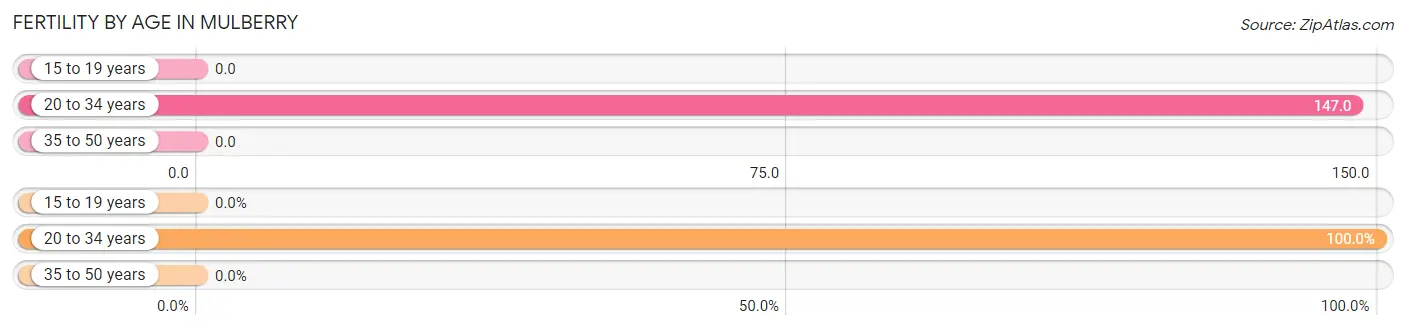
| Age Bracket | Women with Births | Births / 1,000 Women |
| 15 to 19 years | 0 (0.0%) | 0.0 |
| 20 to 34 years | 24 (100.0%) | 147.0 |
| 35 to 50 years | 0 (0.0%) | 0.0 |
| Total | 24 (100.0%) | 66.0 |
Fertility by Age by Marriage Status in Mulberry
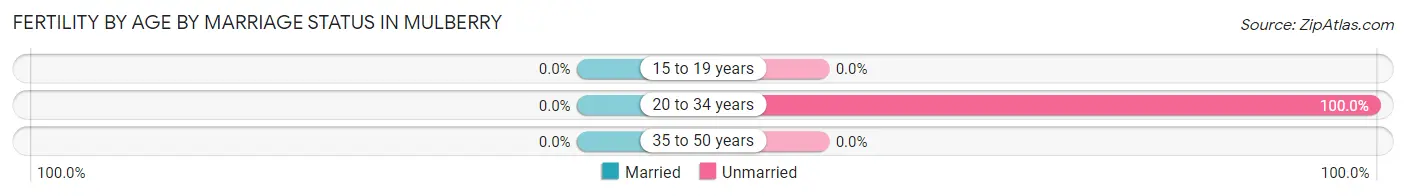
| Age Bracket | Married | Unmarried |
| 15 to 19 years | 0 (0.0%) | 0 (0.0%) |
| 20 to 34 years | 0 (0.0%) | 24 (100.0%) |
| 35 to 50 years | 0 (0.0%) | 0 (0.0%) |
| Total | 0 (0.0%) | 24 (100.0%) |
Fertility by Education in Mulberry
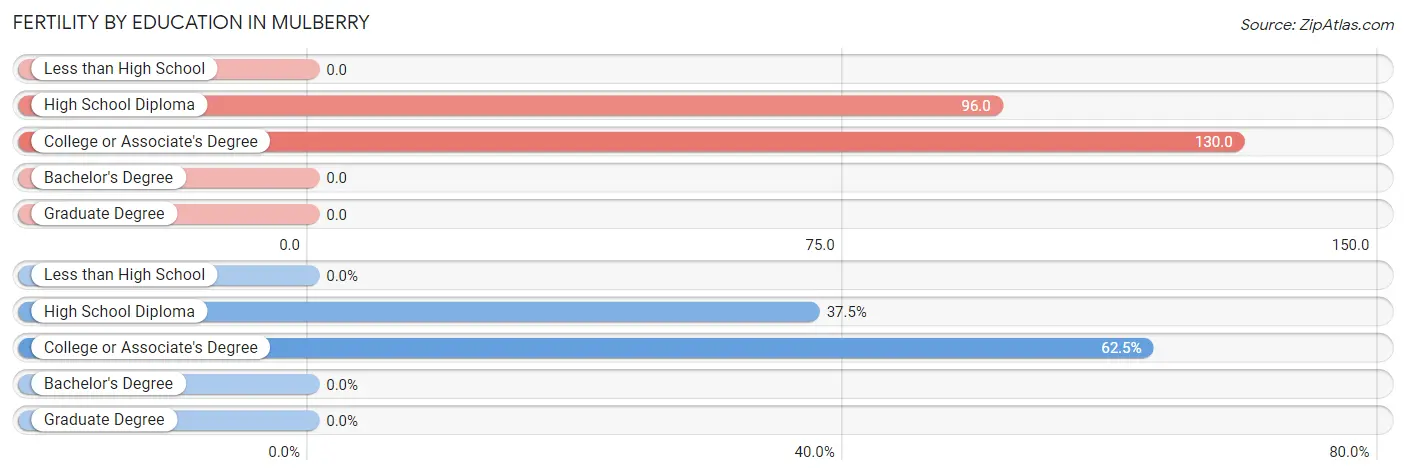
| Educational Attainment | Women with Births | Births / 1,000 Women |
| Less than High School | 0 (0.0%) | 0.0 |
| High School Diploma | 9 (37.5%) | 96.0 |
| College or Associate's Degree | 15 (62.5%) | 130.0 |
| Bachelor's Degree | 0 (0.0%) | 0.0 |
| Graduate Degree | 0 (0.0%) | 0.0 |
| Total | 24 (100.0%) | 66.0 |
Fertility by Education by Marriage Status in Mulberry
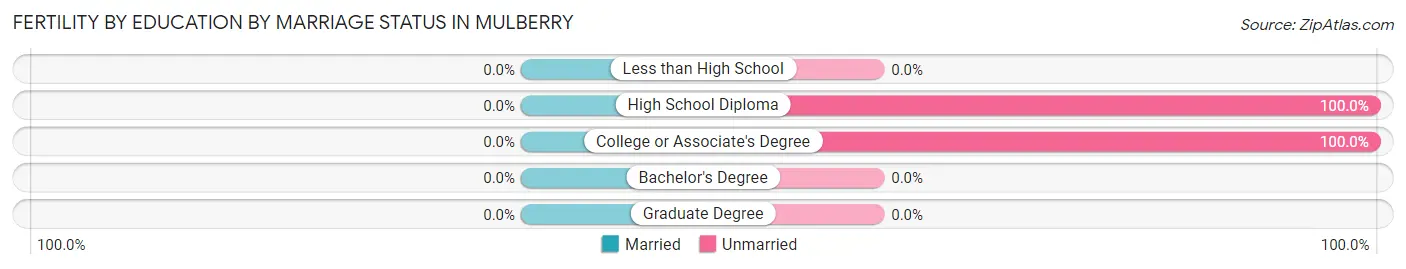
| Educational Attainment | Married | Unmarried |
| Less than High School | 0 (0.0%) | 0 (0.0%) |
| High School Diploma | 0 (0.0%) | 9 (100.0%) |
| College or Associate's Degree | 0 (0.0%) | 15 (100.0%) |
| Bachelor's Degree | 0 (0.0%) | 0 (0.0%) |
| Graduate Degree | 0 (0.0%) | 0 (0.0%) |
| Total | 0 (0.0%) | 24 (100.0%) |
Employment Characteristics in Mulberry
Employment by Class of Employer in Mulberry
Among the 548 employed individuals in Mulberry, private company employees (396 | 72.3%), self-employed (not incorporated) (38 | 6.9%), and local government employees (32 | 5.8%) make up the most common classes of employment.
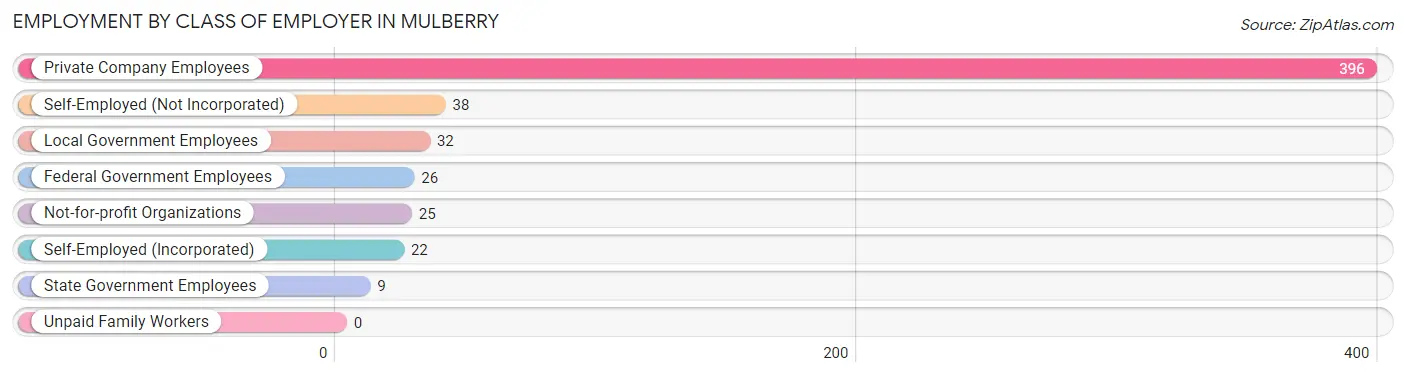
| Employer Class | # Employees | % Employees |
| Private Company Employees | 396 | 72.3% |
| Self-Employed (Incorporated) | 22 | 4.0% |
| Self-Employed (Not Incorporated) | 38 | 6.9% |
| Not-for-profit Organizations | 25 | 4.6% |
| Local Government Employees | 32 | 5.8% |
| State Government Employees | 9 | 1.6% |
| Federal Government Employees | 26 | 4.7% |
| Unpaid Family Workers | 0 | 0.0% |
| Total | 548 | 100.0% |
Employment Status by Age in Mulberry
According to the labor force statistics for Mulberry, out of the total population over 16 years of age (1,380), 41.2% or 569 individuals are in the labor force, with 3.3% or 19 of them unemployed. The age group with the highest labor force participation rate is 20 to 24 years, with 76.4% or 68 individuals in the labor force. Within the labor force, the 20 to 24 years age range has the highest percentage of unemployed individuals, with 22.1% or 15 of them being unemployed.
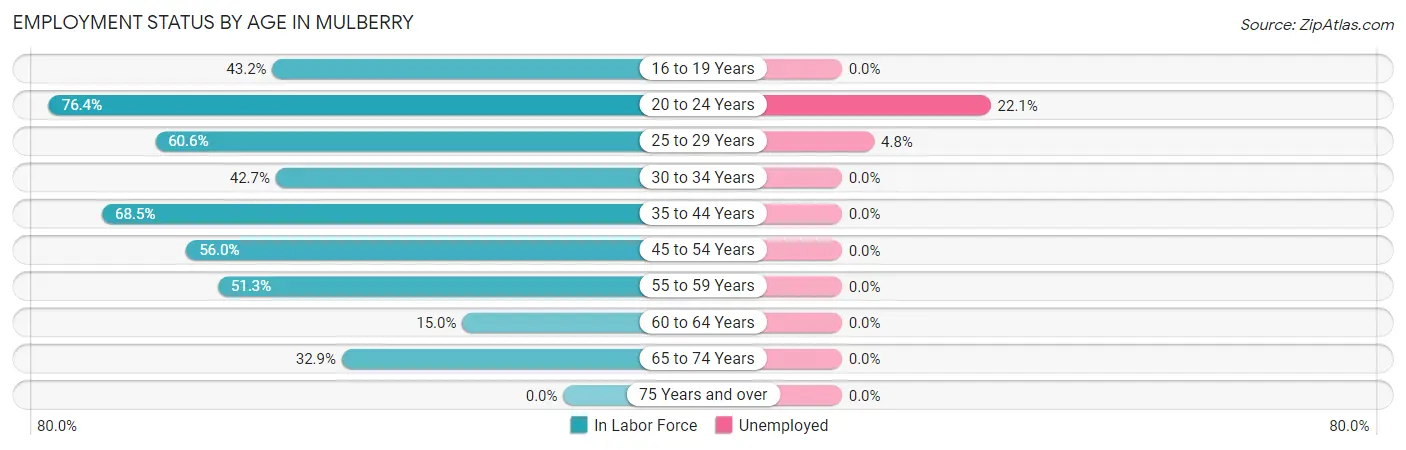
| Age Bracket | In Labor Force | Unemployed |
| 16 to 19 Years | 51 (43.2%) | 0 (0.0%) |
| 20 to 24 Years | 68 (76.4%) | 15 (22.1%) |
| 25 to 29 Years | 63 (60.6%) | 3 (4.8%) |
| 30 to 34 Years | 53 (42.7%) | 0 (0.0%) |
| 35 to 44 Years | 102 (68.5%) | 0 (0.0%) |
| 45 to 54 Years | 107 (56.0%) | 0 (0.0%) |
| 55 to 59 Years | 60 (51.3%) | 0 (0.0%) |
| 60 to 64 Years | 17 (15.0%) | 0 (0.0%) |
| 65 to 74 Years | 48 (32.9%) | 0 (0.0%) |
| 75 Years and over | 0 (0.0%) | 0 (0.0%) |
| Total | 569 (41.2%) | 19 (3.3%) |
Employment Status by Educational Attainment in Mulberry
According to labor force statistics for Mulberry, 50.4% of individuals (402) out of the total population between 25 and 64 years of age (798) are in the labor force, with 0.8% or 3 of them being unemployed. The group with the highest labor force participation rate are those with the educational attainment of bachelor's degree or higher, with 90.5% or 86 individuals in the labor force. Within the labor force, individuals with less than high school education have the highest percentage of unemployment, with 5.2% or 3 of them being unemployed.
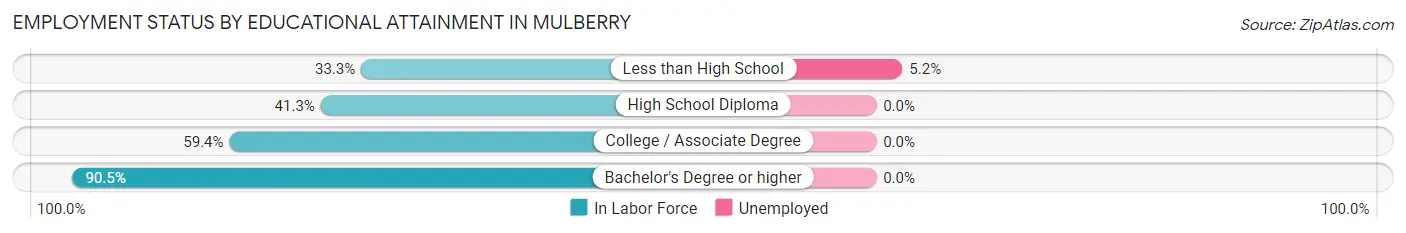
| Educational Attainment | In Labor Force | Unemployed |
| Less than High School | 58 (33.3%) | 9 (5.2%) |
| High School Diploma | 128 (41.3%) | 0 (0.0%) |
| College / Associate Degree | 130 (59.4%) | 0 (0.0%) |
| Bachelor's Degree or higher | 86 (90.5%) | 0 (0.0%) |
| Total | 402 (50.4%) | 6 (0.8%) |
Employment Occupations by Sex in Mulberry
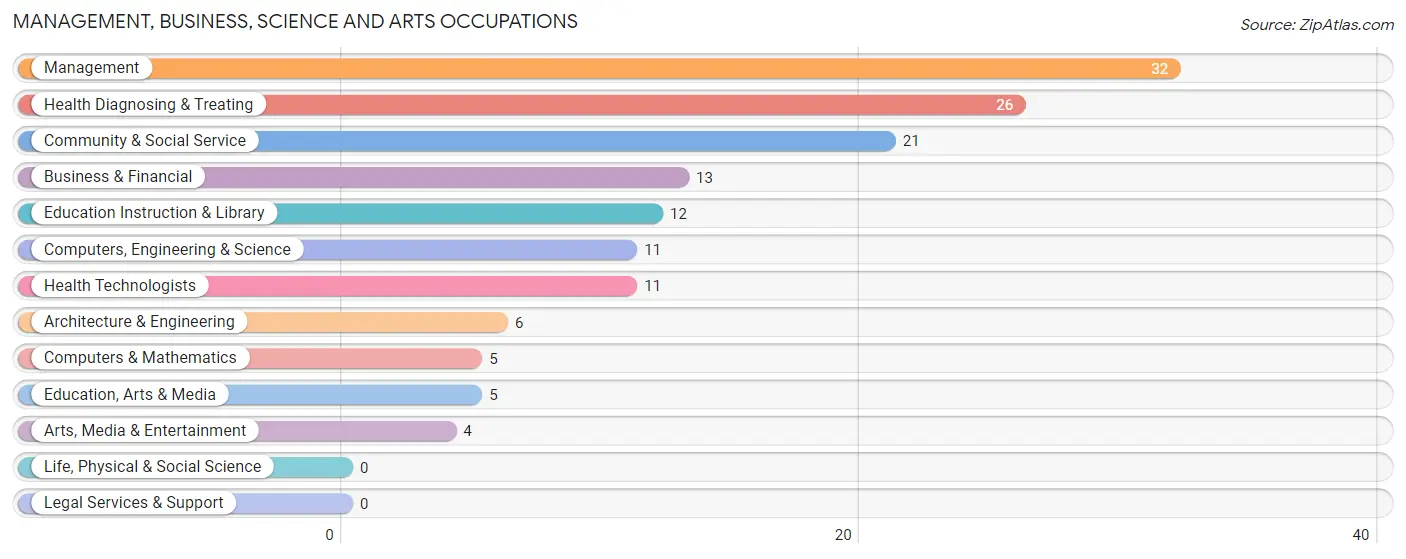
Management, Business, Science and Arts Occupations
The most common Management, Business, Science and Arts occupations in Mulberry are Management (32 | 6.0%), Health Diagnosing & Treating (26 | 4.9%), Community & Social Service (21 | 3.9%), Business & Financial (13 | 2.4%), and Education Instruction & Library (12 | 2.2%).
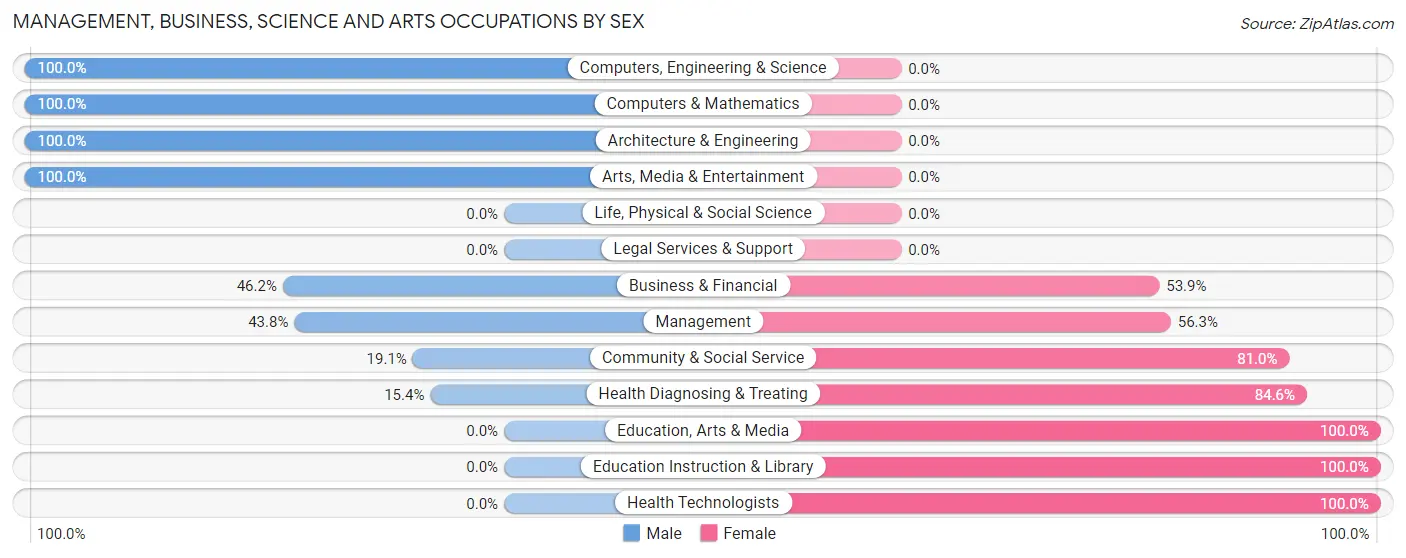
Management, Business, Science and Arts Occupations by Sex
Within the Management, Business, Science and Arts occupations in Mulberry, the most male-oriented occupations are Computers, Engineering & Science (100.0%), Computers & Mathematics (100.0%), and Architecture & Engineering (100.0%), while the most female-oriented occupations are Education, Arts & Media (100.0%), Education Instruction & Library (100.0%), and Health Technologists (100.0%).
| Occupation | Male | Female |
| Management | 14 (43.8%) | 18 (56.2%) |
| Business & Financial | 6 (46.2%) | 7 (53.8%) |
| Computers, Engineering & Science | 11 (100.0%) | 0 (0.0%) |
| Computers & Mathematics | 5 (100.0%) | 0 (0.0%) |
| Architecture & Engineering | 6 (100.0%) | 0 (0.0%) |
| Life, Physical & Social Science | 0 (0.0%) | 0 (0.0%) |
| Community & Social Service | 4 (19.1%) | 17 (80.9%) |
| Education, Arts & Media | 0 (0.0%) | 5 (100.0%) |
| Legal Services & Support | 0 (0.0%) | 0 (0.0%) |
| Education Instruction & Library | 0 (0.0%) | 12 (100.0%) |
| Arts, Media & Entertainment | 4 (100.0%) | 0 (0.0%) |
| Health Diagnosing & Treating | 4 (15.4%) | 22 (84.6%) |
| Health Technologists | 0 (0.0%) | 11 (100.0%) |
| Total (Category) | 39 (37.9%) | 64 (62.1%) |
| Total (Overall) | 276 (51.6%) | 259 (48.4%) |
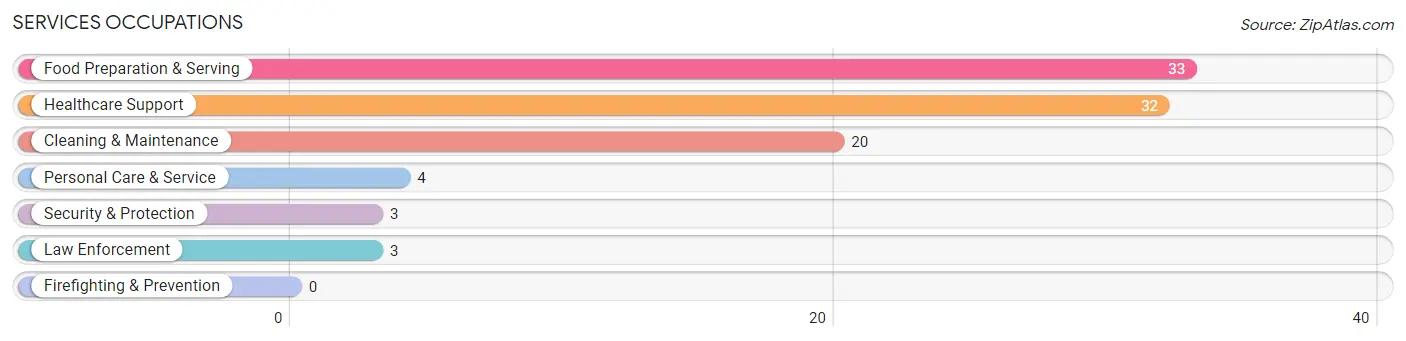
Services Occupations
The most common Services occupations in Mulberry are Food Preparation & Serving (33 | 6.2%), Healthcare Support (32 | 6.0%), Cleaning & Maintenance (20 | 3.7%), Personal Care & Service (4 | 0.7%), and Security & Protection (3 | 0.6%).
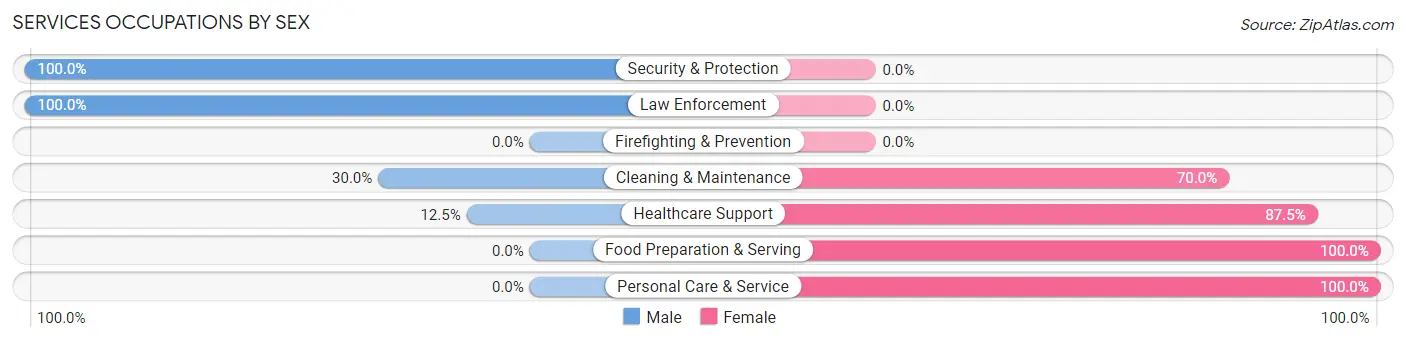
Services Occupations by Sex
Within the Services occupations in Mulberry, the most male-oriented occupations are Security & Protection (100.0%), Law Enforcement (100.0%), and Cleaning & Maintenance (30.0%), while the most female-oriented occupations are Food Preparation & Serving (100.0%), Personal Care & Service (100.0%), and Healthcare Support (87.5%).
| Occupation | Male | Female |
| Healthcare Support | 4 (12.5%) | 28 (87.5%) |
| Security & Protection | 3 (100.0%) | 0 (0.0%) |
| Firefighting & Prevention | 0 (0.0%) | 0 (0.0%) |
| Law Enforcement | 3 (100.0%) | 0 (0.0%) |
| Food Preparation & Serving | 0 (0.0%) | 33 (100.0%) |
| Cleaning & Maintenance | 6 (30.0%) | 14 (70.0%) |
| Personal Care & Service | 0 (0.0%) | 4 (100.0%) |
| Total (Category) | 13 (14.1%) | 79 (85.9%) |
| Total (Overall) | 276 (51.6%) | 259 (48.4%) |
Sales and Office Occupations
The most common Sales and Office occupations in Mulberry are Sales & Related (71 | 13.3%), and Office & Administration (67 | 12.5%).

Sales and Office Occupations by Sex

| Occupation | Male | Female |
| Sales & Related | 22 (31.0%) | 49 (69.0%) |
| Office & Administration | 35 (52.2%) | 32 (47.8%) |
| Total (Category) | 57 (41.3%) | 81 (58.7%) |
| Total (Overall) | 276 (51.6%) | 259 (48.4%) |
Natural Resources, Construction and Maintenance Occupations
The most common Natural Resources, Construction and Maintenance occupations in Mulberry are Installation, Maintenance & Repair (42 | 7.9%), Construction & Extraction (34 | 6.4%), and Farming, Fishing & Forestry (3 | 0.6%).

Natural Resources, Construction and Maintenance Occupations by Sex

| Occupation | Male | Female |
| Farming, Fishing & Forestry | 3 (100.0%) | 0 (0.0%) |
| Construction & Extraction | 34 (100.0%) | 0 (0.0%) |
| Installation, Maintenance & Repair | 42 (100.0%) | 0 (0.0%) |
| Total (Category) | 79 (100.0%) | 0 (0.0%) |
| Total (Overall) | 276 (51.6%) | 259 (48.4%) |
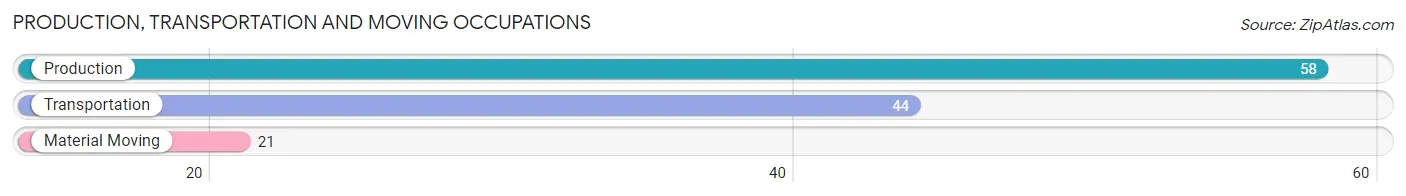
Production, Transportation and Moving Occupations
The most common Production, Transportation and Moving occupations in Mulberry are Production (58 | 10.8%), Transportation (44 | 8.2%), and Material Moving (21 | 3.9%).
Production, Transportation and Moving Occupations by Sex
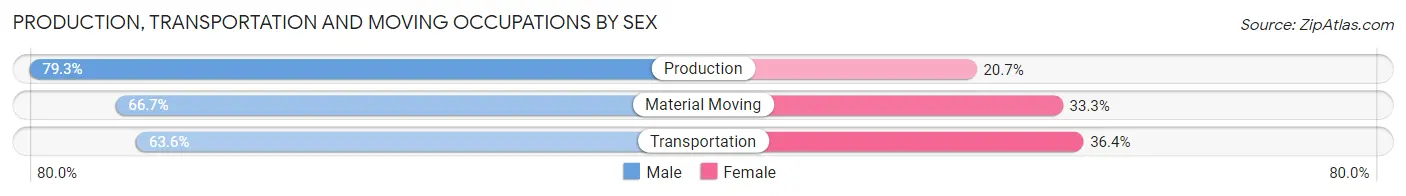
| Occupation | Male | Female |
| Production | 46 (79.3%) | 12 (20.7%) |
| Transportation | 28 (63.6%) | 16 (36.4%) |
| Material Moving | 14 (66.7%) | 7 (33.3%) |
| Total (Category) | 88 (71.5%) | 35 (28.5%) |
| Total (Overall) | 276 (51.6%) | 259 (48.4%) |
Employment Industries by Sex in Mulberry
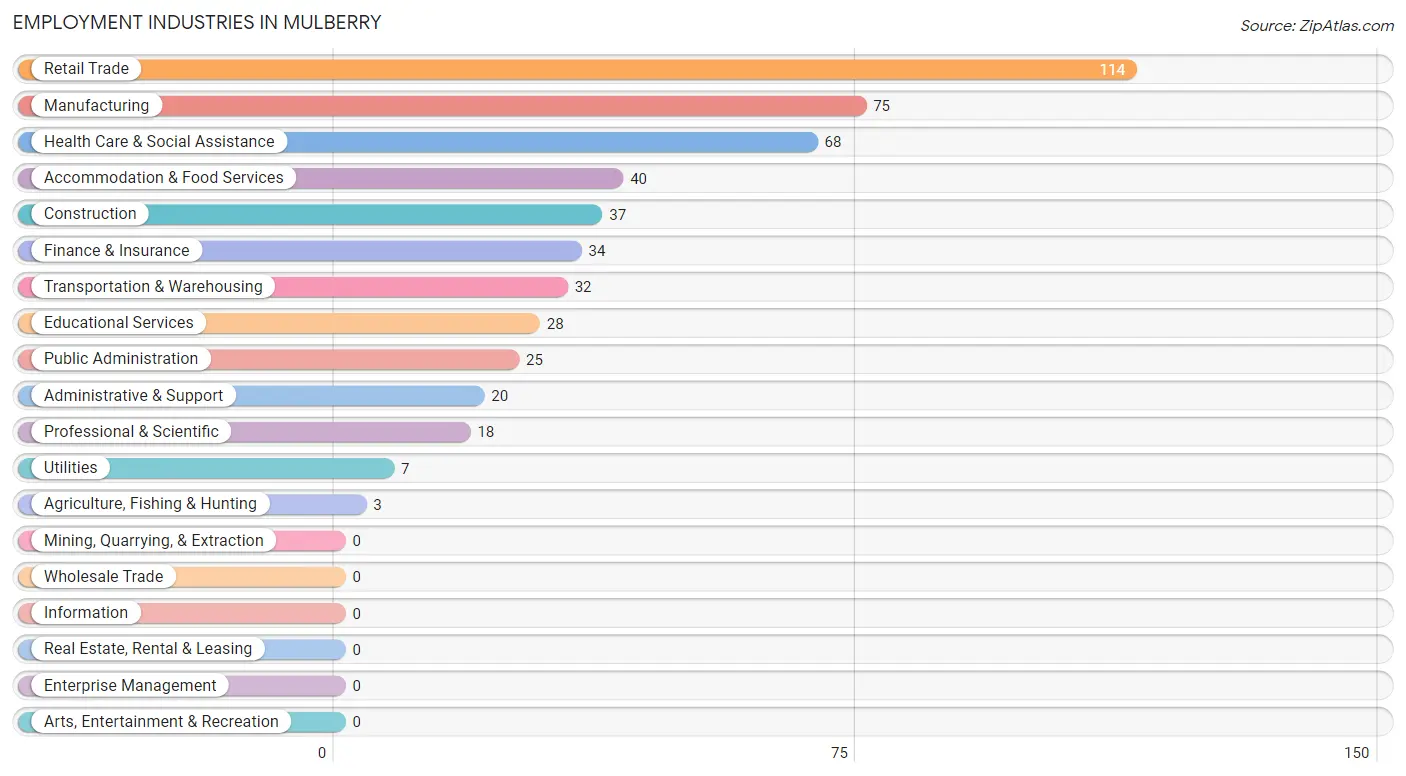
Employment Industries in Mulberry
The major employment industries in Mulberry include Retail Trade (114 | 21.3%), Manufacturing (75 | 14.0%), Health Care & Social Assistance (68 | 12.7%), Accommodation & Food Services (40 | 7.5%), and Construction (37 | 6.9%).
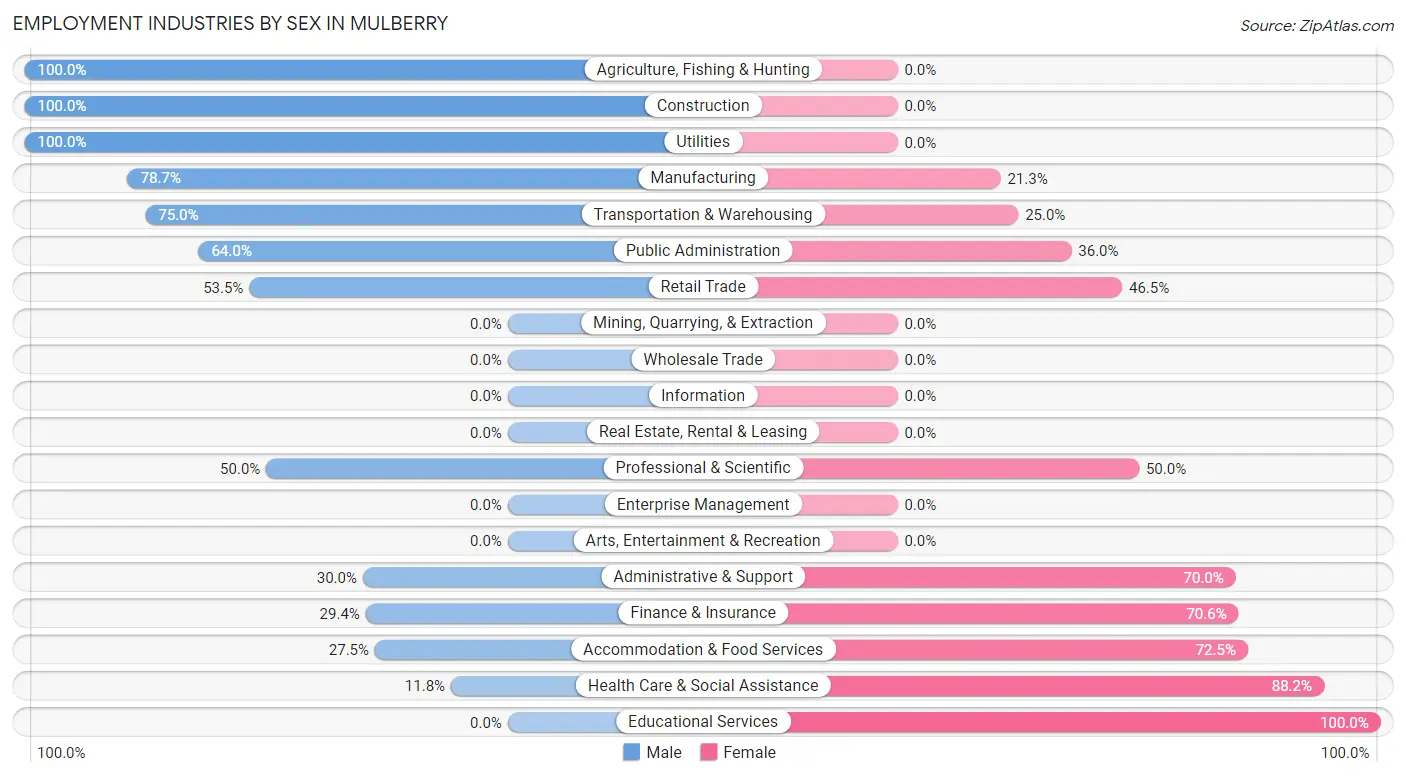
Employment Industries by Sex in Mulberry
The Mulberry industries that see more men than women are Agriculture, Fishing & Hunting (100.0%), Construction (100.0%), and Utilities (100.0%), whereas the industries that tend to have a higher number of women are Educational Services (100.0%), Health Care & Social Assistance (88.2%), and Accommodation & Food Services (72.5%).
| Industry | Male | Female |
| Agriculture, Fishing & Hunting | 3 (100.0%) | 0 (0.0%) |
| Mining, Quarrying, & Extraction | 0 (0.0%) | 0 (0.0%) |
| Construction | 37 (100.0%) | 0 (0.0%) |
| Manufacturing | 59 (78.7%) | 16 (21.3%) |
| Wholesale Trade | 0 (0.0%) | 0 (0.0%) |
| Retail Trade | 61 (53.5%) | 53 (46.5%) |
| Transportation & Warehousing | 24 (75.0%) | 8 (25.0%) |
| Utilities | 7 (100.0%) | 0 (0.0%) |
| Information | 0 (0.0%) | 0 (0.0%) |
| Finance & Insurance | 10 (29.4%) | 24 (70.6%) |
| Real Estate, Rental & Leasing | 0 (0.0%) | 0 (0.0%) |
| Professional & Scientific | 9 (50.0%) | 9 (50.0%) |
| Enterprise Management | 0 (0.0%) | 0 (0.0%) |
| Administrative & Support | 6 (30.0%) | 14 (70.0%) |
| Educational Services | 0 (0.0%) | 28 (100.0%) |
| Health Care & Social Assistance | 8 (11.8%) | 60 (88.2%) |
| Arts, Entertainment & Recreation | 0 (0.0%) | 0 (0.0%) |
| Accommodation & Food Services | 11 (27.5%) | 29 (72.5%) |
| Public Administration | 16 (64.0%) | 9 (36.0%) |
| Total | 276 (51.6%) | 259 (48.4%) |
Education in Mulberry
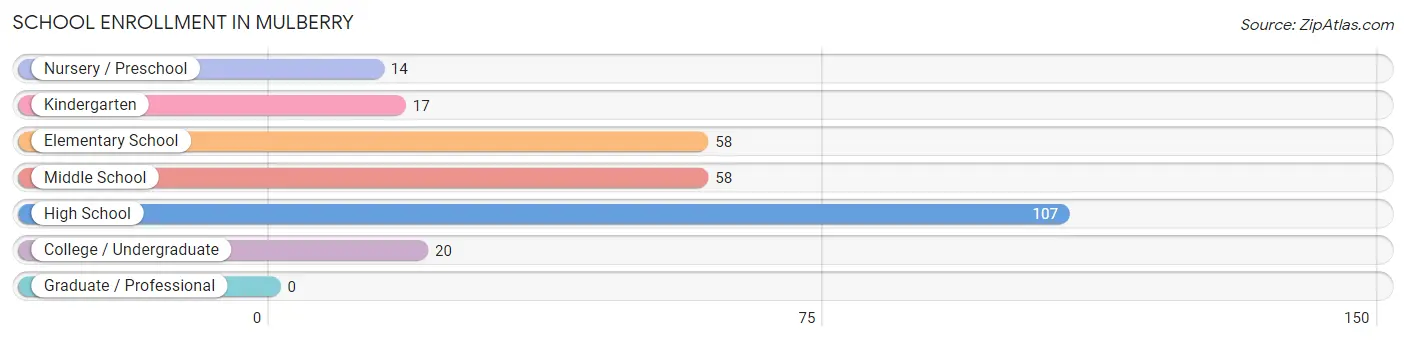
School Enrollment in Mulberry
The most common levels of schooling among the 274 students in Mulberry are high school (107 | 39.1%), elementary school (58 | 21.2%), and middle school (58 | 21.2%).
| School Level | # Students | % Students |
| Nursery / Preschool | 14 | 5.1% |
| Kindergarten | 17 | 6.2% |
| Elementary School | 58 | 21.2% |
| Middle School | 58 | 21.2% |
| High School | 107 | 39.1% |
| College / Undergraduate | 20 | 7.3% |
| Graduate / Professional | 0 | 0.0% |
| Total | 274 | 100.0% |
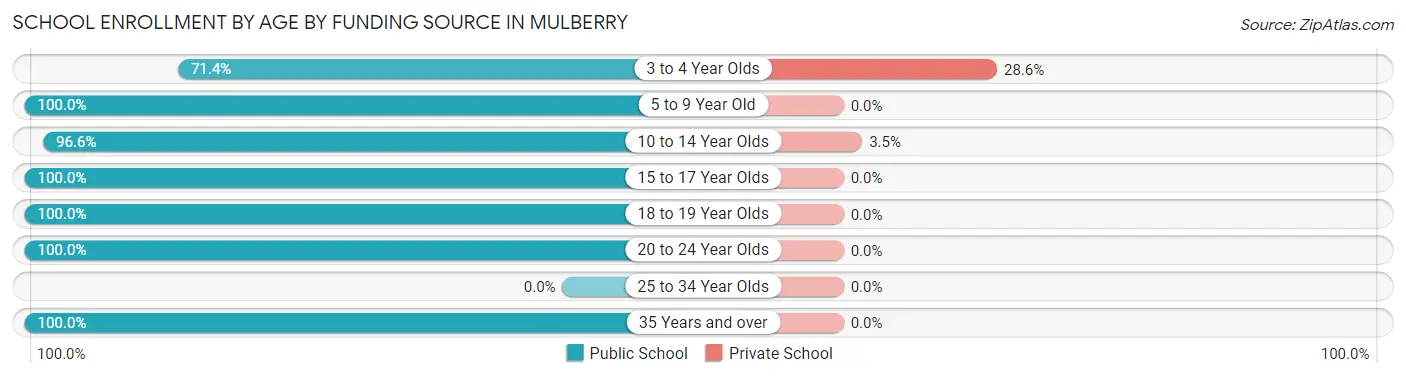
School Enrollment by Age by Funding Source in Mulberry
Out of a total of 274 students who are enrolled in schools in Mulberry, 7 (2.6%) attend a private institution, while the remaining 267 (97.4%) are enrolled in public schools. The age group of 3 to 4 year olds has the highest likelihood of being enrolled in private schools, with 4 (28.6% in the age bracket) enrolled. Conversely, the age group of 5 to 9 year old has the lowest likelihood of being enrolled in a private school, with 54 (100.0% in the age bracket) attending a public institution.
| Age Bracket | Public School | Private School |
| 3 to 4 Year Olds | 10 (71.4%) | 4 (28.6%) |
| 5 to 9 Year Old | 54 (100.0%) | 0 (0.0%) |
| 10 to 14 Year Olds | 84 (96.6%) | 3 (3.5%) |
| 15 to 17 Year Olds | 73 (100.0%) | 0 (0.0%) |
| 18 to 19 Year Olds | 33 (100.0%) | 0 (0.0%) |
| 20 to 24 Year Olds | 7 (100.0%) | 0 (0.0%) |
| 25 to 34 Year Olds | 0 (0.0%) | 0 (0.0%) |
| 35 Years and over | 6 (100.0%) | 0 (0.0%) |
| Total | 267 (97.4%) | 7 (2.6%) |
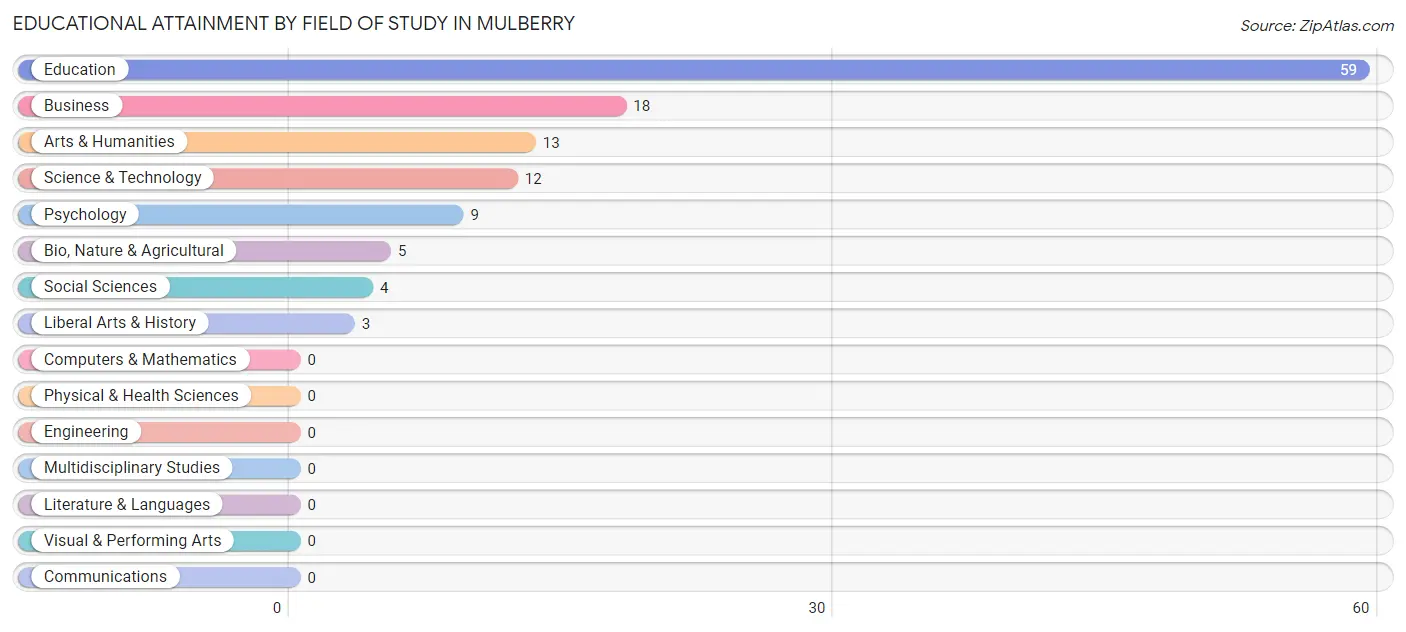
Educational Attainment by Field of Study in Mulberry
Education (59 | 48.0%), business (18 | 14.6%), arts & humanities (13 | 10.6%), science & technology (12 | 9.8%), and psychology (9 | 7.3%) are the most common fields of study among 123 individuals in Mulberry who have obtained a bachelor's degree or higher.
| Field of Study | # Graduates | % Graduates |
| Computers & Mathematics | 0 | 0.0% |
| Bio, Nature & Agricultural | 5 | 4.1% |
| Physical & Health Sciences | 0 | 0.0% |
| Psychology | 9 | 7.3% |
| Social Sciences | 4 | 3.3% |
| Engineering | 0 | 0.0% |
| Multidisciplinary Studies | 0 | 0.0% |
| Science & Technology | 12 | 9.8% |
| Business | 18 | 14.6% |
| Education | 59 | 48.0% |
| Literature & Languages | 0 | 0.0% |
| Liberal Arts & History | 3 | 2.4% |
| Visual & Performing Arts | 0 | 0.0% |
| Communications | 0 | 0.0% |
| Arts & Humanities | 13 | 10.6% |
| Total | 123 | 100.0% |
Transportation & Commute in Mulberry
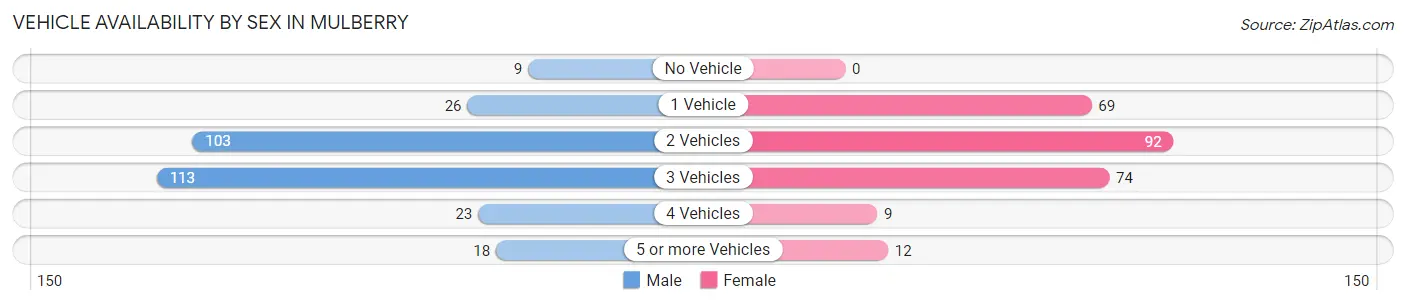
Vehicle Availability by Sex in Mulberry
The most prevalent vehicle ownership categories in Mulberry are males with 3 vehicles (113, accounting for 38.7%) and females with 3 vehicles (74, making up 44.1%).
| Vehicles Available | Male | Female |
| No Vehicle | 9 (3.1%) | 0 (0.0%) |
| 1 Vehicle | 26 (8.9%) | 69 (27.0%) |
| 2 Vehicles | 103 (35.3%) | 92 (35.9%) |
| 3 Vehicles | 113 (38.7%) | 74 (28.9%) |
| 4 Vehicles | 23 (7.9%) | 9 (3.5%) |
| 5 or more Vehicles | 18 (6.2%) | 12 (4.7%) |
| Total | 292 (100.0%) | 256 (100.0%) |
Commute Time in Mulberry
The most frequently occuring commute durations in Mulberry are 15 to 19 minutes (93 commuters, 17.6%), 30 to 34 minutes (82 commuters, 15.5%), and 10 to 14 minutes (77 commuters, 14.6%).
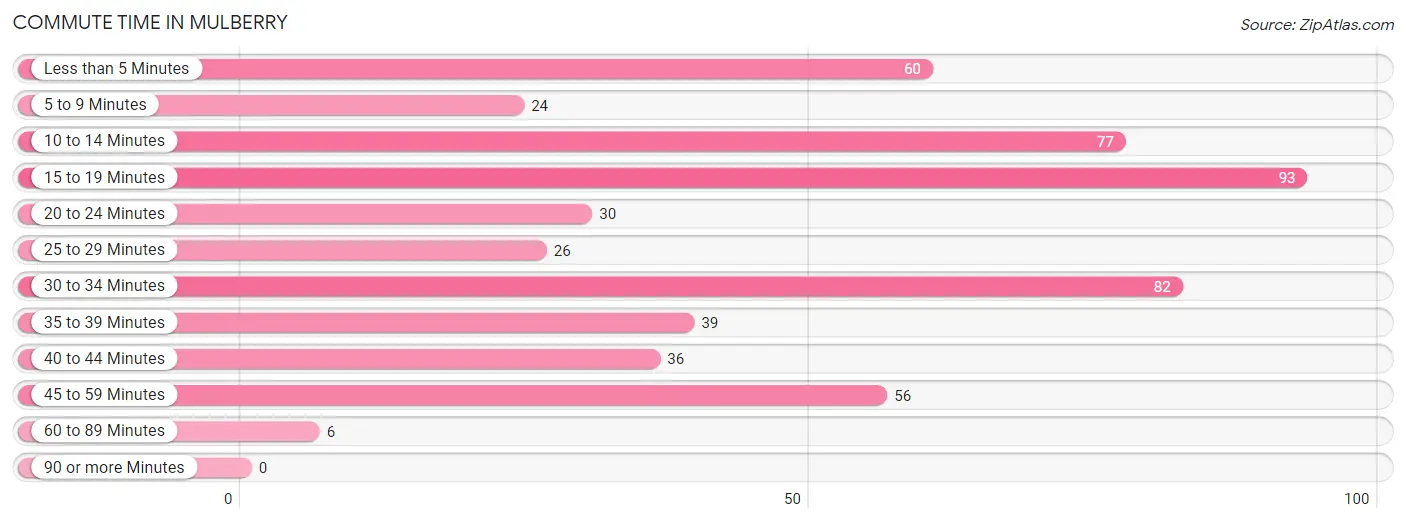
| Commute Time | # Commuters | % Commuters |
| Less than 5 Minutes | 60 | 11.3% |
| 5 to 9 Minutes | 24 | 4.5% |
| 10 to 14 Minutes | 77 | 14.6% |
| 15 to 19 Minutes | 93 | 17.6% |
| 20 to 24 Minutes | 30 | 5.7% |
| 25 to 29 Minutes | 26 | 4.9% |
| 30 to 34 Minutes | 82 | 15.5% |
| 35 to 39 Minutes | 39 | 7.4% |
| 40 to 44 Minutes | 36 | 6.8% |
| 45 to 59 Minutes | 56 | 10.6% |
| 60 to 89 Minutes | 6 | 1.1% |
| 90 or more Minutes | 0 | 0.0% |
Commute Time by Sex in Mulberry
The most common commute times in Mulberry are 15 to 19 minutes (62 commuters, 21.2%) for males and 10 to 14 minutes (41 commuters, 17.3%) for females.
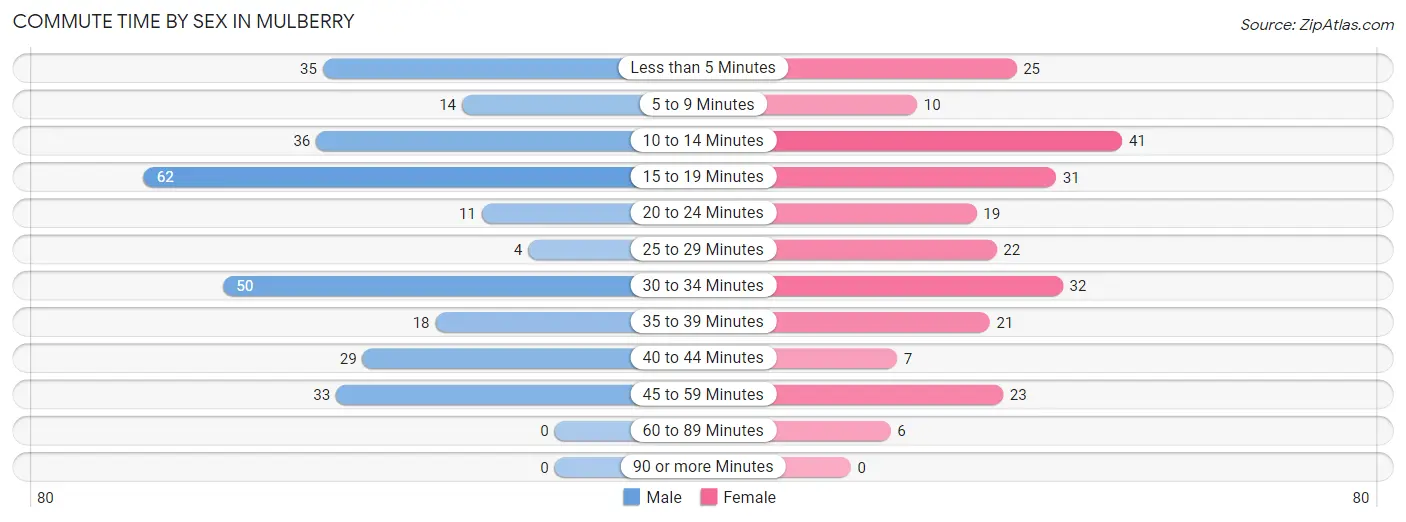
| Commute Time | Male | Female |
| Less than 5 Minutes | 35 (12.0%) | 25 (10.5%) |
| 5 to 9 Minutes | 14 (4.8%) | 10 (4.2%) |
| 10 to 14 Minutes | 36 (12.3%) | 41 (17.3%) |
| 15 to 19 Minutes | 62 (21.2%) | 31 (13.1%) |
| 20 to 24 Minutes | 11 (3.8%) | 19 (8.0%) |
| 25 to 29 Minutes | 4 (1.4%) | 22 (9.3%) |
| 30 to 34 Minutes | 50 (17.1%) | 32 (13.5%) |
| 35 to 39 Minutes | 18 (6.2%) | 21 (8.9%) |
| 40 to 44 Minutes | 29 (9.9%) | 7 (2.9%) |
| 45 to 59 Minutes | 33 (11.3%) | 23 (9.7%) |
| 60 to 89 Minutes | 0 (0.0%) | 6 (2.5%) |
| 90 or more Minutes | 0 (0.0%) | 0 (0.0%) |
Time of Departure to Work by Sex in Mulberry
The most frequent times of departure to work in Mulberry are 6:00 AM to 6:29 AM (60, 20.5%) for males and 7:30 AM to 7:59 AM (47, 19.8%) for females.
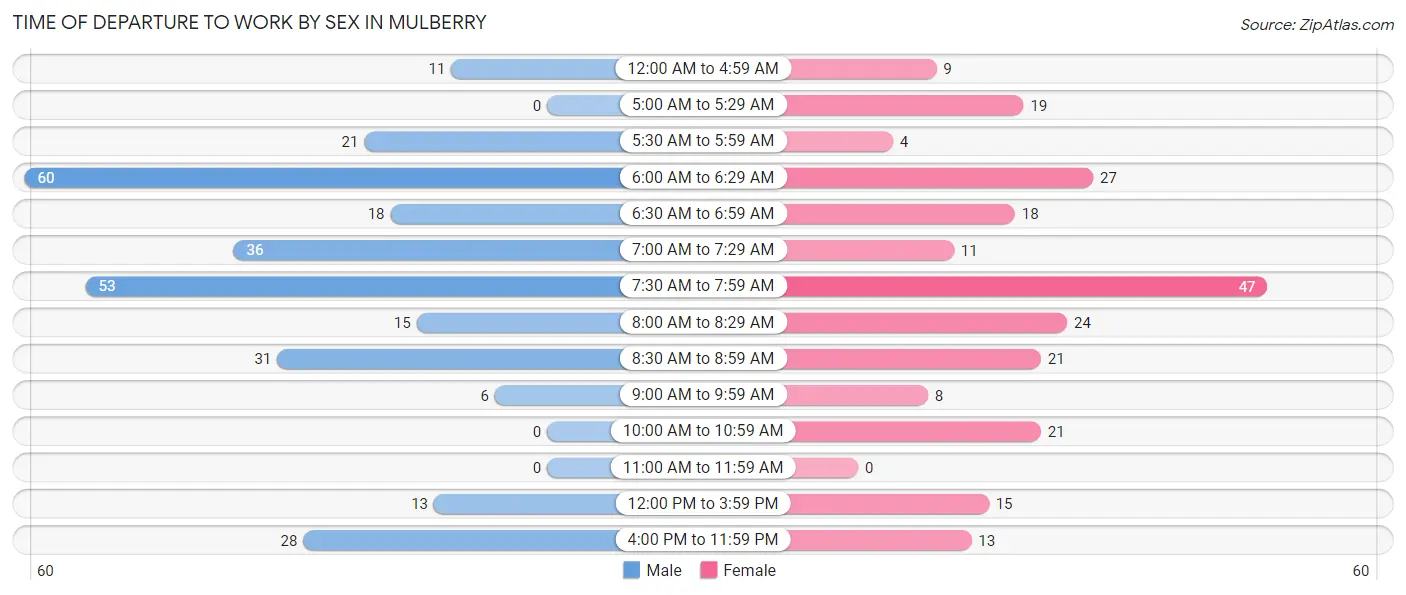
| Time of Departure | Male | Female |
| 12:00 AM to 4:59 AM | 11 (3.8%) | 9 (3.8%) |
| 5:00 AM to 5:29 AM | 0 (0.0%) | 19 (8.0%) |
| 5:30 AM to 5:59 AM | 21 (7.2%) | 4 (1.7%) |
| 6:00 AM to 6:29 AM | 60 (20.5%) | 27 (11.4%) |
| 6:30 AM to 6:59 AM | 18 (6.2%) | 18 (7.6%) |
| 7:00 AM to 7:29 AM | 36 (12.3%) | 11 (4.6%) |
| 7:30 AM to 7:59 AM | 53 (18.1%) | 47 (19.8%) |
| 8:00 AM to 8:29 AM | 15 (5.1%) | 24 (10.1%) |
| 8:30 AM to 8:59 AM | 31 (10.6%) | 21 (8.9%) |
| 9:00 AM to 9:59 AM | 6 (2.1%) | 8 (3.4%) |
| 10:00 AM to 10:59 AM | 0 (0.0%) | 21 (8.9%) |
| 11:00 AM to 11:59 AM | 0 (0.0%) | 0 (0.0%) |
| 12:00 PM to 3:59 PM | 13 (4.4%) | 15 (6.3%) |
| 4:00 PM to 11:59 PM | 28 (9.6%) | 13 (5.5%) |
| Total | 292 (100.0%) | 237 (100.0%) |
Housing Occupancy in Mulberry
Occupancy by Ownership in Mulberry
Of the total 675 dwellings in Mulberry, owner-occupied units account for 476 (70.5%), while renter-occupied units make up 199 (29.5%).
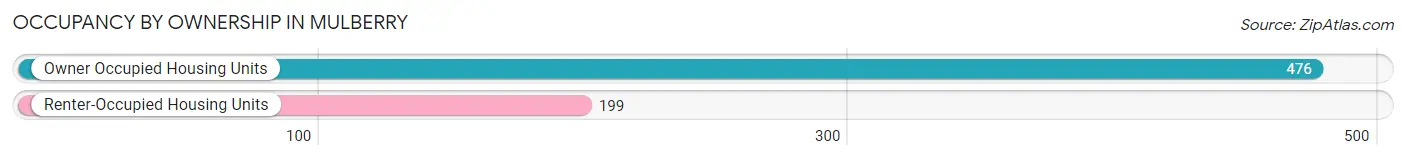
| Occupancy | # Housing Units | % Housing Units |
| Owner Occupied Housing Units | 476 | 70.5% |
| Renter-Occupied Housing Units | 199 | 29.5% |
| Total Occupied Housing Units | 675 | 100.0% |
Occupancy by Household Size in Mulberry
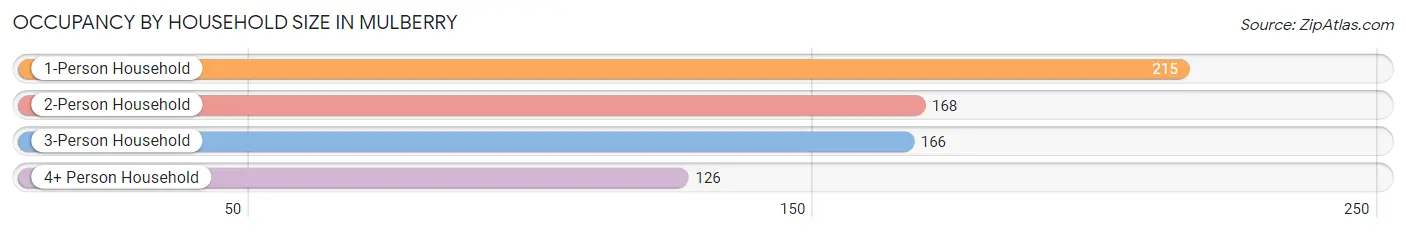
| Household Size | # Housing Units | % Housing Units |
| 1-Person Household | 215 | 31.9% |
| 2-Person Household | 168 | 24.9% |
| 3-Person Household | 166 | 24.6% |
| 4+ Person Household | 126 | 18.7% |
| Total Housing Units | 675 | 100.0% |
Occupancy by Ownership by Household Size in Mulberry
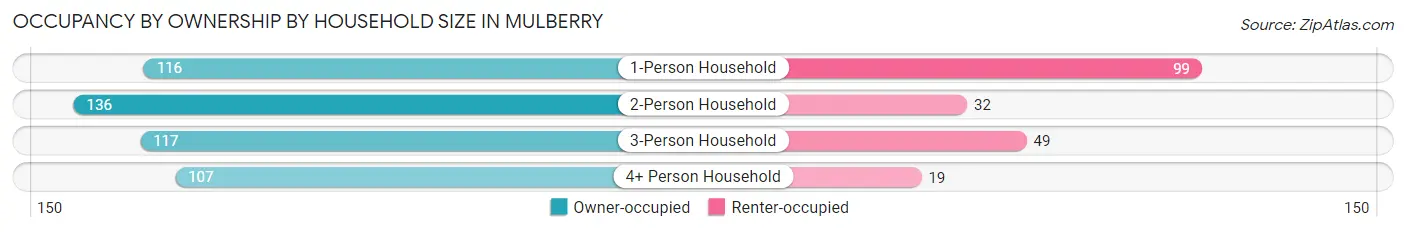
| Household Size | Owner-occupied | Renter-occupied |
| 1-Person Household | 116 (53.9%) | 99 (46.1%) |
| 2-Person Household | 136 (80.9%) | 32 (19.1%) |
| 3-Person Household | 117 (70.5%) | 49 (29.5%) |
| 4+ Person Household | 107 (84.9%) | 19 (15.1%) |
| Total Housing Units | 476 (70.5%) | 199 (29.5%) |
Occupancy by Educational Attainment in Mulberry
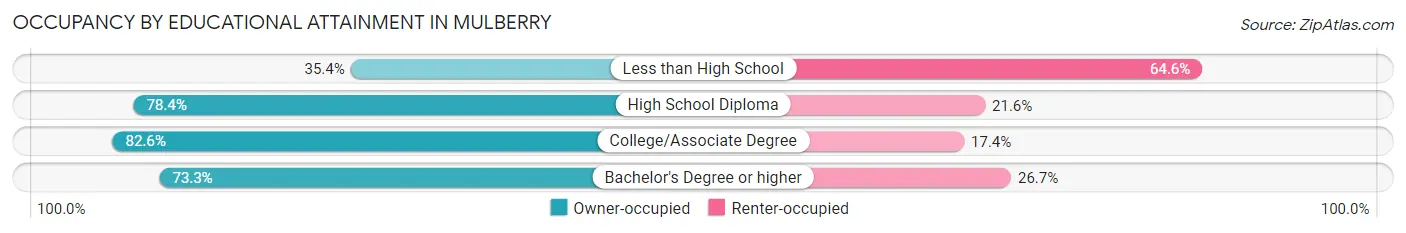
| Household Size | Owner-occupied | Renter-occupied |
| Less than High School | 46 (35.4%) | 84 (64.6%) |
| High School Diploma | 225 (78.4%) | 62 (21.6%) |
| College/Associate Degree | 142 (82.6%) | 30 (17.4%) |
| Bachelor's Degree or higher | 63 (73.3%) | 23 (26.7%) |
Occupancy by Age of Householder in Mulberry
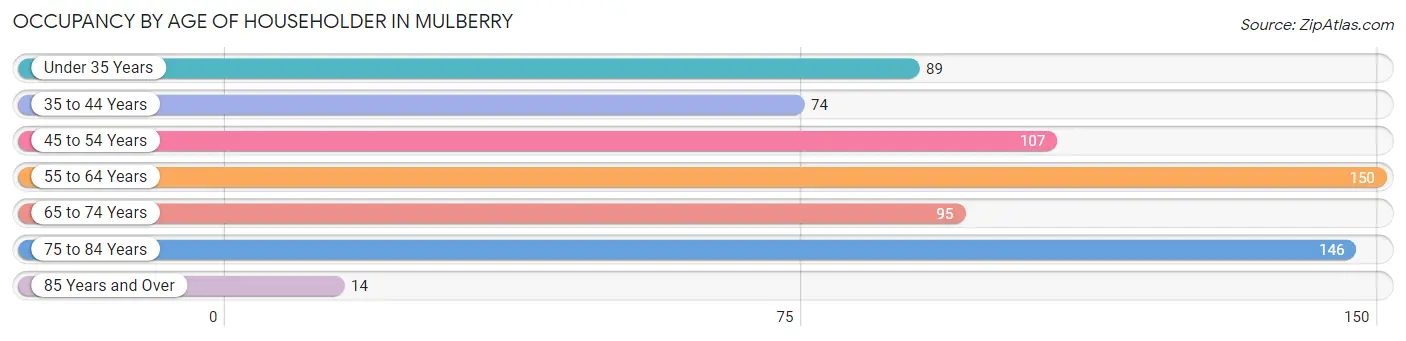
| Age Bracket | # Households | % Households |
| Under 35 Years | 89 | 13.2% |
| 35 to 44 Years | 74 | 11.0% |
| 45 to 54 Years | 107 | 15.9% |
| 55 to 64 Years | 150 | 22.2% |
| 65 to 74 Years | 95 | 14.1% |
| 75 to 84 Years | 146 | 21.6% |
| 85 Years and Over | 14 | 2.1% |
| Total | 675 | 100.0% |
Housing Finances in Mulberry
Median Income by Occupancy in Mulberry
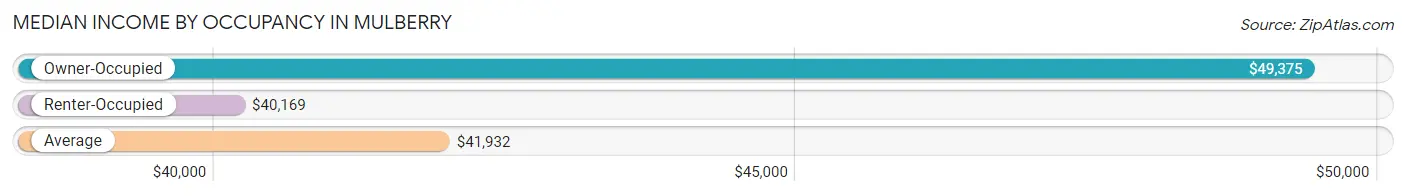
| Occupancy Type | # Households | Median Income |
| Owner-Occupied | 476 (70.5%) | $49,375 |
| Renter-Occupied | 199 (29.5%) | $40,169 |
| Average | 675 (100.0%) | $41,932 |
Occupancy by Householder Income Bracket in Mulberry
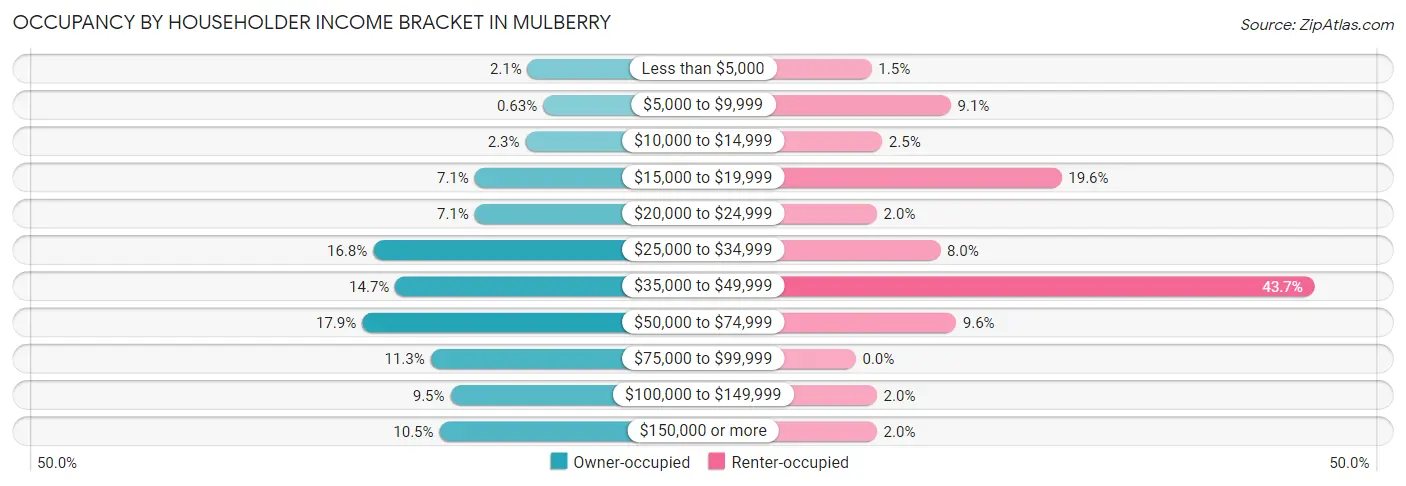
| Income Bracket | Owner-occupied | Renter-occupied |
| Less than $5,000 | 10 (2.1%) | 3 (1.5%) |
| $5,000 to $9,999 | 3 (0.6%) | 18 (9.0%) |
| $10,000 to $14,999 | 11 (2.3%) | 5 (2.5%) |
| $15,000 to $19,999 | 34 (7.1%) | 39 (19.6%) |
| $20,000 to $24,999 | 34 (7.1%) | 4 (2.0%) |
| $25,000 to $34,999 | 80 (16.8%) | 16 (8.0%) |
| $35,000 to $49,999 | 70 (14.7%) | 87 (43.7%) |
| $50,000 to $74,999 | 85 (17.9%) | 19 (9.6%) |
| $75,000 to $99,999 | 54 (11.3%) | 0 (0.0%) |
| $100,000 to $149,999 | 45 (9.5%) | 4 (2.0%) |
| $150,000 or more | 50 (10.5%) | 4 (2.0%) |
| Total | 476 (100.0%) | 199 (100.0%) |
Monthly Housing Cost Tiers in Mulberry
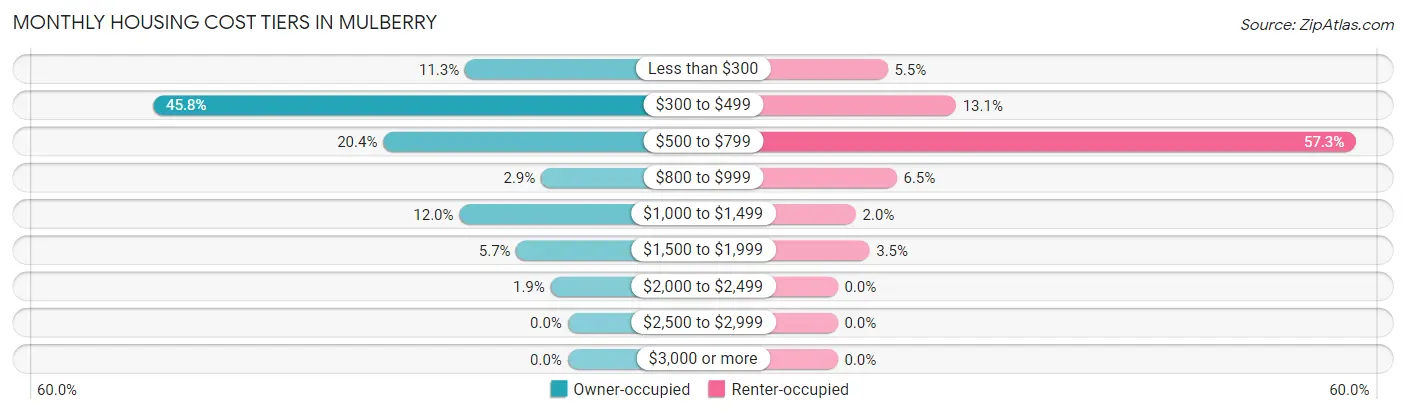
| Monthly Cost | Owner-occupied | Renter-occupied |
| Less than $300 | 54 (11.3%) | 11 (5.5%) |
| $300 to $499 | 218 (45.8%) | 26 (13.1%) |
| $500 to $799 | 97 (20.4%) | 114 (57.3%) |
| $800 to $999 | 14 (2.9%) | 13 (6.5%) |
| $1,000 to $1,499 | 57 (12.0%) | 4 (2.0%) |
| $1,500 to $1,999 | 27 (5.7%) | 7 (3.5%) |
| $2,000 to $2,499 | 9 (1.9%) | 0 (0.0%) |
| $2,500 to $2,999 | 0 (0.0%) | 0 (0.0%) |
| $3,000 or more | 0 (0.0%) | 0 (0.0%) |
| Total | 476 (100.0%) | 199 (100.0%) |
Physical Housing Characteristics in Mulberry
Housing Structures in Mulberry
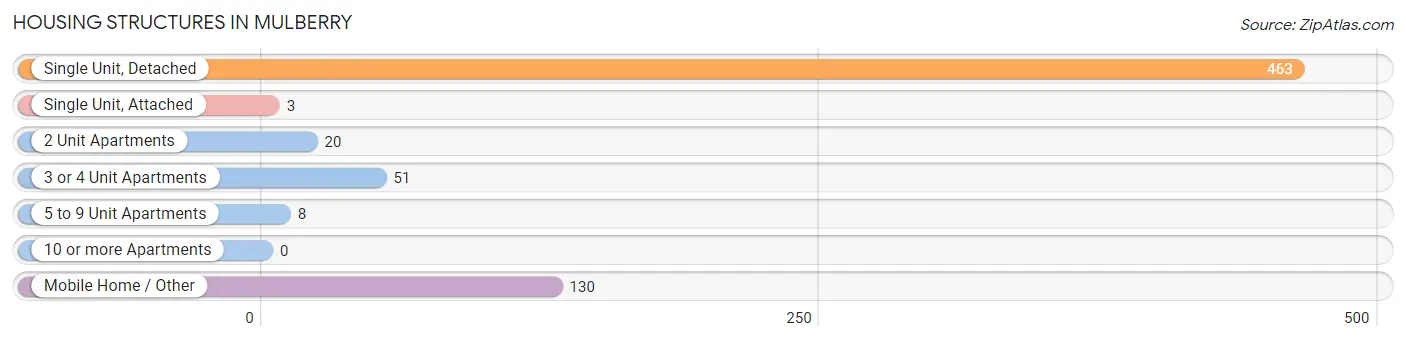
| Structure Type | # Housing Units | % Housing Units |
| Single Unit, Detached | 463 | 68.6% |
| Single Unit, Attached | 3 | 0.4% |
| 2 Unit Apartments | 20 | 3.0% |
| 3 or 4 Unit Apartments | 51 | 7.6% |
| 5 to 9 Unit Apartments | 8 | 1.2% |
| 10 or more Apartments | 0 | 0.0% |
| Mobile Home / Other | 130 | 19.3% |
| Total | 675 | 100.0% |
Housing Structures by Occupancy in Mulberry
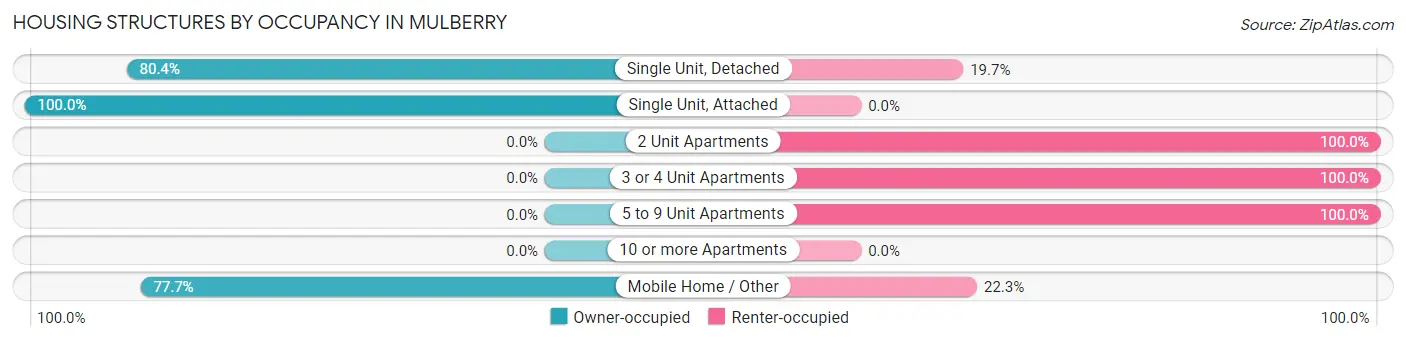
| Structure Type | Owner-occupied | Renter-occupied |
| Single Unit, Detached | 372 (80.3%) | 91 (19.7%) |
| Single Unit, Attached | 3 (100.0%) | 0 (0.0%) |
| 2 Unit Apartments | 0 (0.0%) | 20 (100.0%) |
| 3 or 4 Unit Apartments | 0 (0.0%) | 51 (100.0%) |
| 5 to 9 Unit Apartments | 0 (0.0%) | 8 (100.0%) |
| 10 or more Apartments | 0 (0.0%) | 0 (0.0%) |
| Mobile Home / Other | 101 (77.7%) | 29 (22.3%) |
| Total | 476 (70.5%) | 199 (29.5%) |
Housing Structures by Number of Rooms in Mulberry
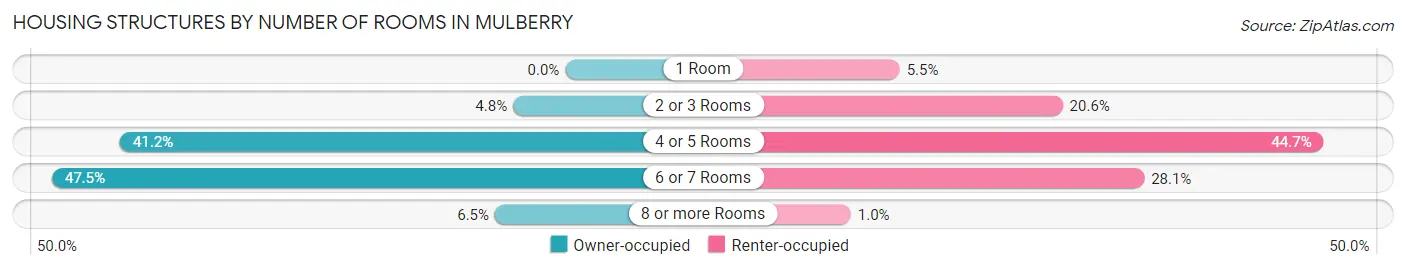
| Number of Rooms | Owner-occupied | Renter-occupied |
| 1 Room | 0 (0.0%) | 11 (5.5%) |
| 2 or 3 Rooms | 23 (4.8%) | 41 (20.6%) |
| 4 or 5 Rooms | 196 (41.2%) | 89 (44.7%) |
| 6 or 7 Rooms | 226 (47.5%) | 56 (28.1%) |
| 8 or more Rooms | 31 (6.5%) | 2 (1.0%) |
| Total | 476 (100.0%) | 199 (100.0%) |
Housing Structure by Heating Type in Mulberry
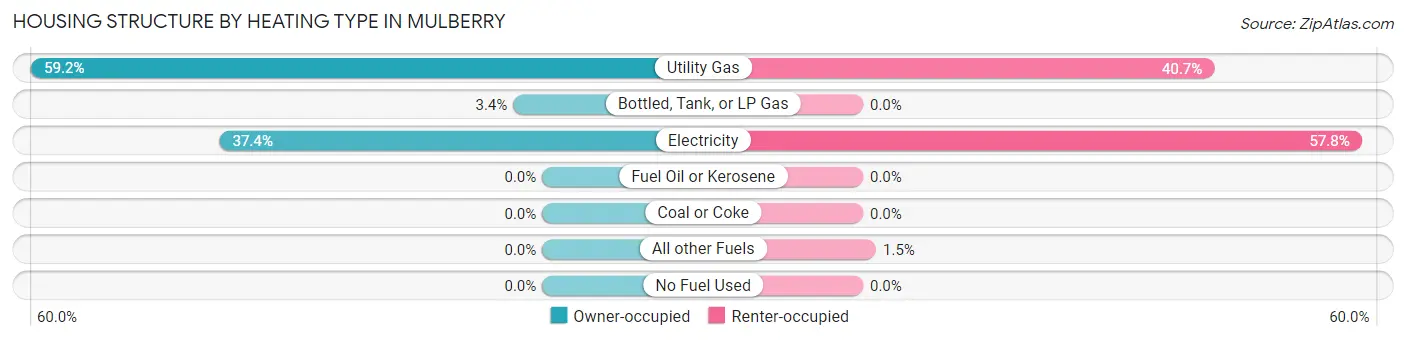
| Heating Type | Owner-occupied | Renter-occupied |
| Utility Gas | 282 (59.2%) | 81 (40.7%) |
| Bottled, Tank, or LP Gas | 16 (3.4%) | 0 (0.0%) |
| Electricity | 178 (37.4%) | 115 (57.8%) |
| Fuel Oil or Kerosene | 0 (0.0%) | 0 (0.0%) |
| Coal or Coke | 0 (0.0%) | 0 (0.0%) |
| All other Fuels | 0 (0.0%) | 3 (1.5%) |
| No Fuel Used | 0 (0.0%) | 0 (0.0%) |
| Total | 476 (100.0%) | 199 (100.0%) |
Household Vehicle Usage in Mulberry
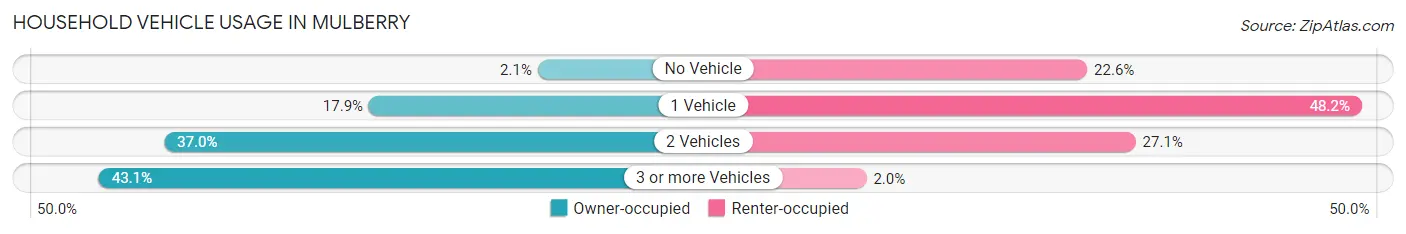
| Vehicles per Household | Owner-occupied | Renter-occupied |
| No Vehicle | 10 (2.1%) | 45 (22.6%) |
| 1 Vehicle | 85 (17.9%) | 96 (48.2%) |
| 2 Vehicles | 176 (37.0%) | 54 (27.1%) |
| 3 or more Vehicles | 205 (43.1%) | 4 (2.0%) |
| Total | 476 (100.0%) | 199 (100.0%) |
Real Estate & Mortgages in Mulberry
Real Estate and Mortgage Overview in Mulberry
| Characteristic | Without Mortgage | With Mortgage |
| Housing Units | 309 | 167 |
| Median Property Value | $84,400 | $113,800 |
| Median Household Income | $40,568 | $13 |
| Monthly Housing Costs | $428 | $0 |
| Real Estate Taxes | $532 | $7 |
Property Value by Mortgage Status in Mulberry
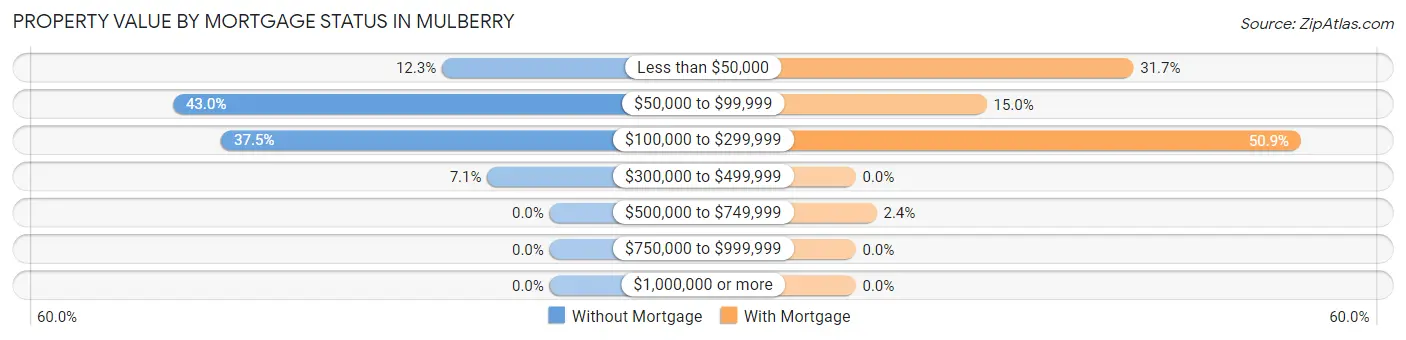
| Property Value | Without Mortgage | With Mortgage |
| Less than $50,000 | 38 (12.3%) | 53 (31.7%) |
| $50,000 to $99,999 | 133 (43.0%) | 25 (15.0%) |
| $100,000 to $299,999 | 116 (37.5%) | 85 (50.9%) |
| $300,000 to $499,999 | 22 (7.1%) | 0 (0.0%) |
| $500,000 to $749,999 | 0 (0.0%) | 4 (2.4%) |
| $750,000 to $999,999 | 0 (0.0%) | 0 (0.0%) |
| $1,000,000 or more | 0 (0.0%) | 0 (0.0%) |
| Total | 309 (100.0%) | 167 (100.0%) |
Household Income by Mortgage Status in Mulberry
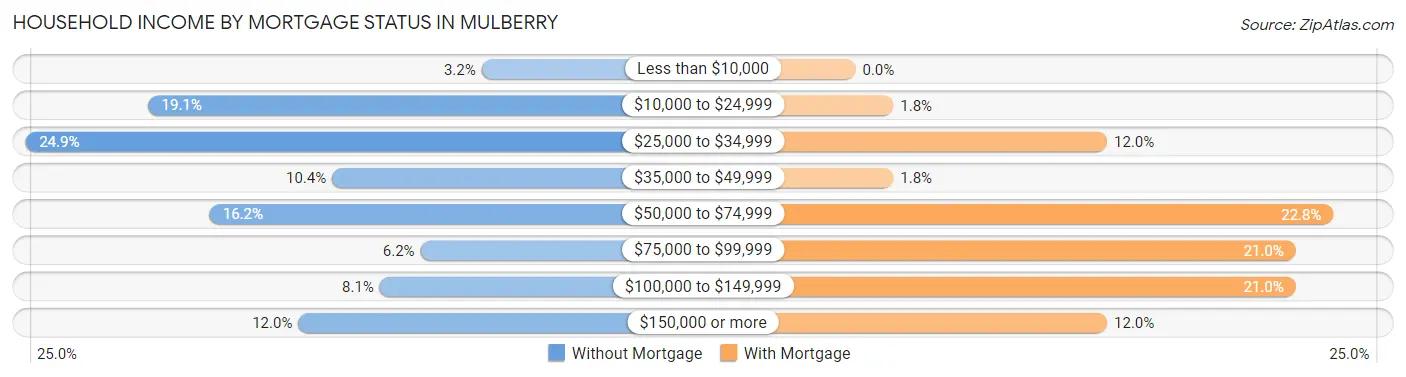
| Household Income | Without Mortgage | With Mortgage |
| Less than $10,000 | 10 (3.2%) | 0 (0.0%) |
| $10,000 to $24,999 | 59 (19.1%) | 3 (1.8%) |
| $25,000 to $34,999 | 77 (24.9%) | 20 (12.0%) |
| $35,000 to $49,999 | 32 (10.4%) | 3 (1.8%) |
| $50,000 to $74,999 | 50 (16.2%) | 38 (22.8%) |
| $75,000 to $99,999 | 19 (6.1%) | 35 (21.0%) |
| $100,000 to $149,999 | 25 (8.1%) | 35 (21.0%) |
| $150,000 or more | 37 (12.0%) | 20 (12.0%) |
| Total | 309 (100.0%) | 167 (100.0%) |
Property Value to Household Income Ratio in Mulberry
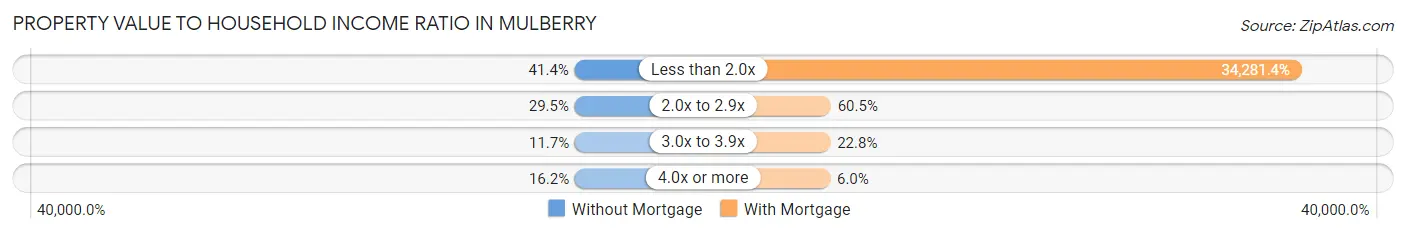
| Value-to-Income Ratio | Without Mortgage | With Mortgage |
| Less than 2.0x | 128 (41.4%) | 57,250 (34,281.4%) |
| 2.0x to 2.9x | 91 (29.4%) | 101 (60.5%) |
| 3.0x to 3.9x | 36 (11.7%) | 38 (22.8%) |
| 4.0x or more | 50 (16.2%) | 10 (6.0%) |
| Total | 309 (100.0%) | 167 (100.0%) |
Real Estate Taxes by Mortgage Status in Mulberry
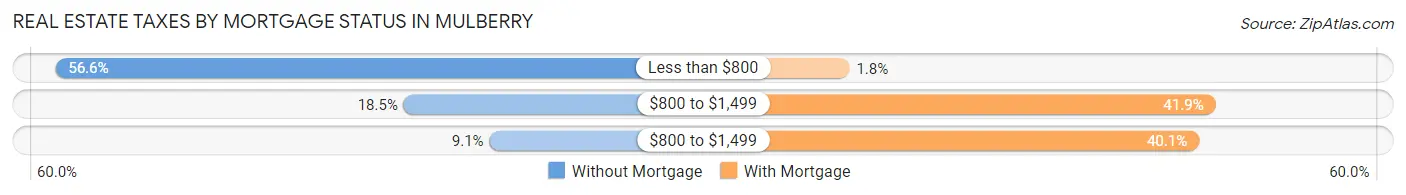
| Property Taxes | Without Mortgage | With Mortgage |
| Less than $800 | 175 (56.6%) | 3 (1.8%) |
| $800 to $1,499 | 57 (18.4%) | 70 (41.9%) |
| $800 to $1,499 | 28 (9.1%) | 67 (40.1%) |
| Total | 309 (100.0%) | 167 (100.0%) |
Health & Disability in Mulberry
Health Insurance Coverage by Age in Mulberry
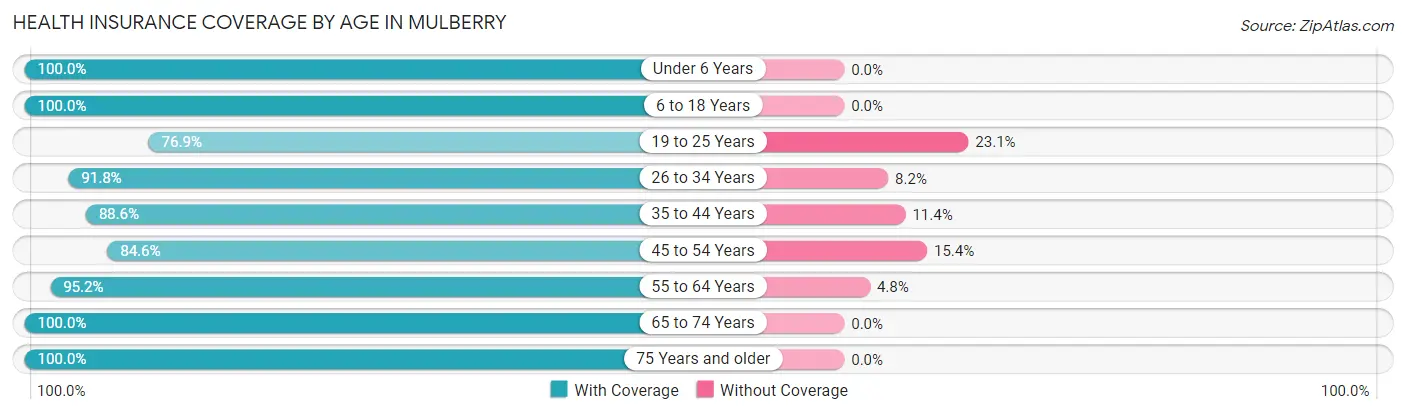
| Age Bracket | With Coverage | Without Coverage |
| Under 6 Years | 83 (100.0%) | 0 (0.0%) |
| 6 to 18 Years | 247 (100.0%) | 0 (0.0%) |
| 19 to 25 Years | 93 (76.9%) | 28 (23.1%) |
| 26 to 34 Years | 202 (91.8%) | 18 (8.2%) |
| 35 to 44 Years | 132 (88.6%) | 17 (11.4%) |
| 45 to 54 Years | 148 (84.6%) | 27 (15.4%) |
| 55 to 64 Years | 219 (95.2%) | 11 (4.8%) |
| 65 to 74 Years | 146 (100.0%) | 0 (0.0%) |
| 75 Years and older | 229 (100.0%) | 0 (0.0%) |
| Total | 1,499 (93.7%) | 101 (6.3%) |
Health Insurance Coverage by Citizenship Status in Mulberry

| Citizenship Status | With Coverage | Without Coverage |
| Native Born | 83 (100.0%) | 0 (0.0%) |
| Foreign Born, Citizen | 247 (100.0%) | 0 (0.0%) |
| Foreign Born, not a Citizen | 93 (76.9%) | 28 (23.1%) |
Health Insurance Coverage by Household Income in Mulberry
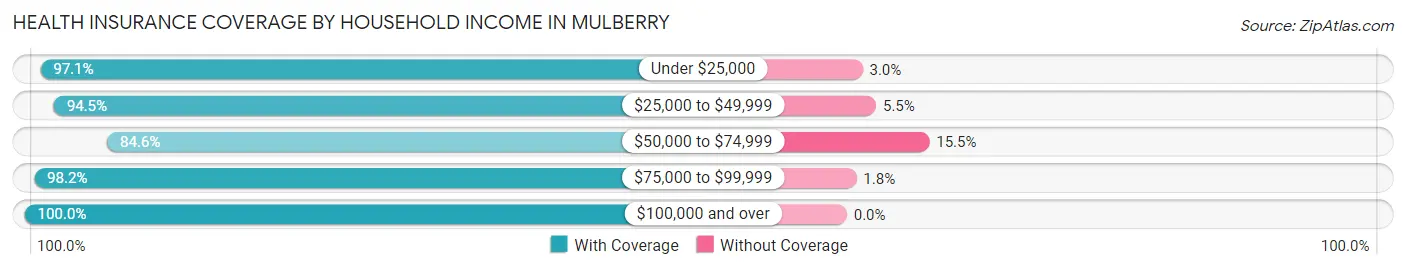
| Household Income | With Coverage | Without Coverage |
| Under $25,000 | 263 (97.1%) | 8 (2.9%) |
| $25,000 to $49,999 | 431 (94.5%) | 25 (5.5%) |
| $50,000 to $74,999 | 279 (84.6%) | 51 (15.4%) |
| $75,000 to $99,999 | 218 (98.2%) | 4 (1.8%) |
| $100,000 and over | 273 (100.0%) | 0 (0.0%) |
Public vs Private Health Insurance Coverage by Age in Mulberry
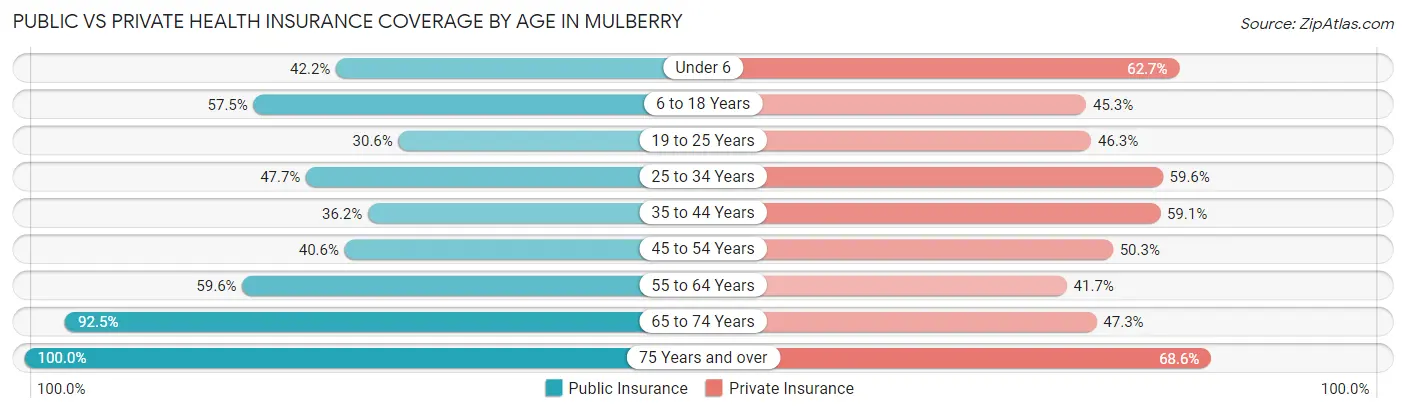
| Age Bracket | Public Insurance | Private Insurance |
| Under 6 | 35 (42.2%) | 52 (62.6%) |
| 6 to 18 Years | 142 (57.5%) | 112 (45.3%) |
| 19 to 25 Years | 37 (30.6%) | 56 (46.3%) |
| 25 to 34 Years | 105 (47.7%) | 131 (59.6%) |
| 35 to 44 Years | 54 (36.2%) | 88 (59.1%) |
| 45 to 54 Years | 71 (40.6%) | 88 (50.3%) |
| 55 to 64 Years | 137 (59.6%) | 96 (41.7%) |
| 65 to 74 Years | 135 (92.5%) | 69 (47.3%) |
| 75 Years and over | 229 (100.0%) | 157 (68.6%) |
| Total | 945 (59.1%) | 849 (53.1%) |
Disability Status by Sex by Age in Mulberry
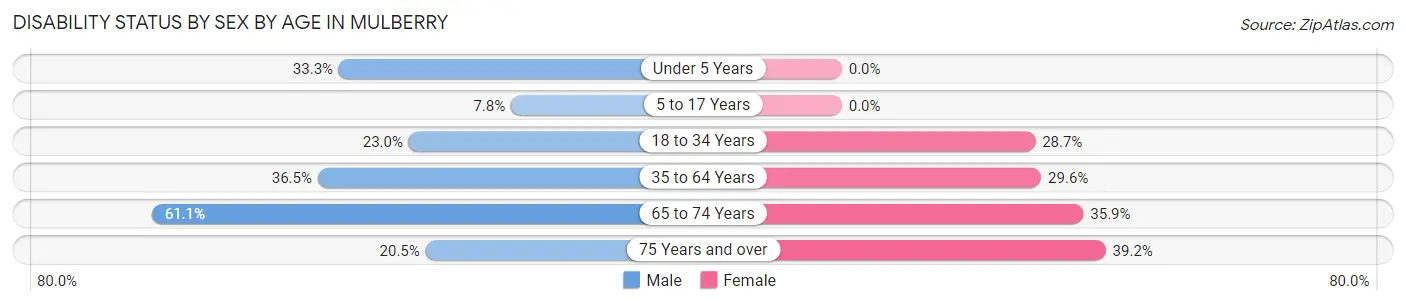
| Age Bracket | Male | Female |
| Under 5 Years | 9 (33.3%) | 0 (0.0%) |
| 5 to 17 Years | 8 (7.8%) | 0 (0.0%) |
| 18 to 34 Years | 42 (23.0%) | 54 (28.7%) |
| 35 to 64 Years | 101 (36.5%) | 82 (29.6%) |
| 65 to 74 Years | 33 (61.1%) | 33 (35.9%) |
| 75 Years and over | 27 (20.4%) | 38 (39.2%) |
Disability Class by Sex by Age in Mulberry
Disability Class: Hearing Difficulty
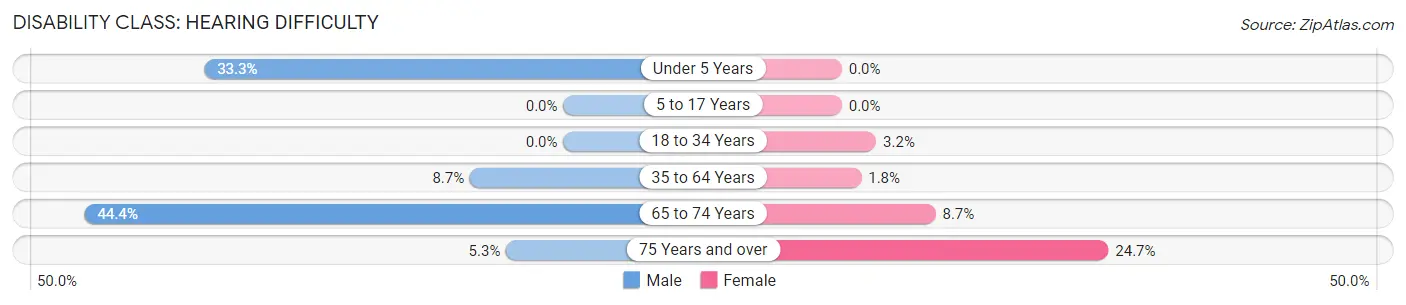
| Age Bracket | Male | Female |
| Under 5 Years | 9 (33.3%) | 0 (0.0%) |
| 5 to 17 Years | 0 (0.0%) | 0 (0.0%) |
| 18 to 34 Years | 0 (0.0%) | 6 (3.2%) |
| 35 to 64 Years | 24 (8.7%) | 5 (1.8%) |
| 65 to 74 Years | 24 (44.4%) | 8 (8.7%) |
| 75 Years and over | 7 (5.3%) | 24 (24.7%) |
Disability Class: Vision Difficulty
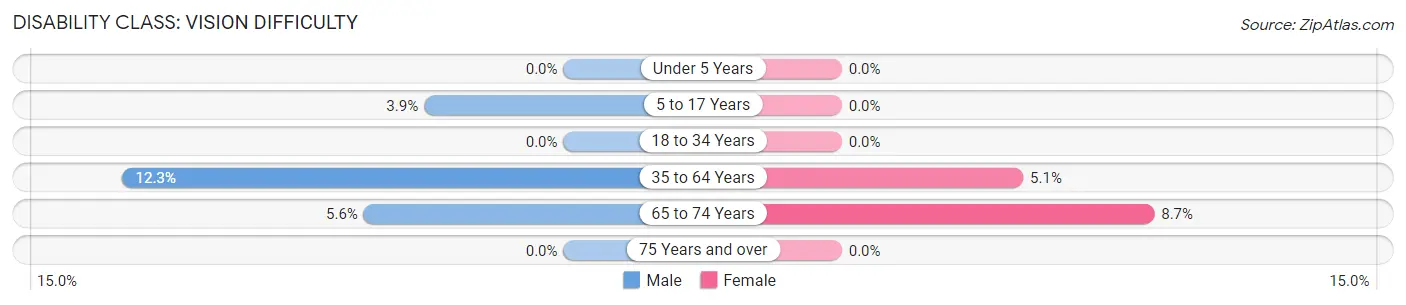
| Age Bracket | Male | Female |
| Under 5 Years | 0 (0.0%) | 0 (0.0%) |
| 5 to 17 Years | 4 (3.9%) | 0 (0.0%) |
| 18 to 34 Years | 0 (0.0%) | 0 (0.0%) |
| 35 to 64 Years | 34 (12.3%) | 14 (5.1%) |
| 65 to 74 Years | 3 (5.6%) | 8 (8.7%) |
| 75 Years and over | 0 (0.0%) | 0 (0.0%) |
Disability Class: Cognitive Difficulty
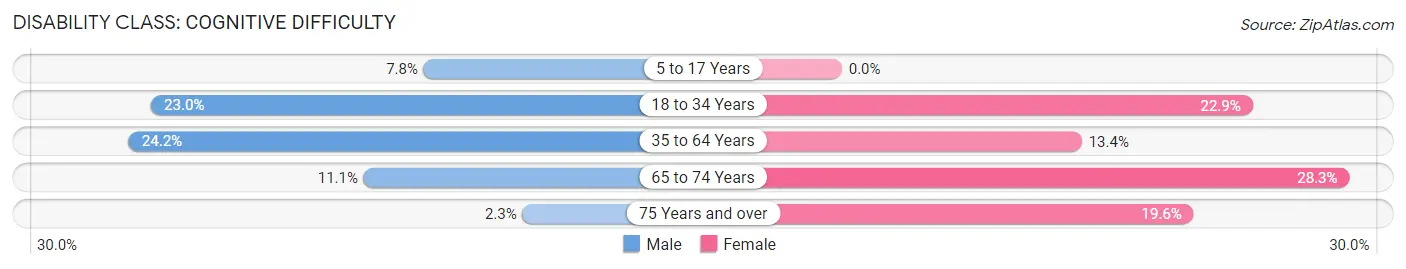
| Age Bracket | Male | Female |
| 5 to 17 Years | 8 (7.8%) | 0 (0.0%) |
| 18 to 34 Years | 42 (23.0%) | 43 (22.9%) |
| 35 to 64 Years | 67 (24.2%) | 37 (13.4%) |
| 65 to 74 Years | 6 (11.1%) | 26 (28.3%) |
| 75 Years and over | 3 (2.3%) | 19 (19.6%) |
Disability Class: Ambulatory Difficulty
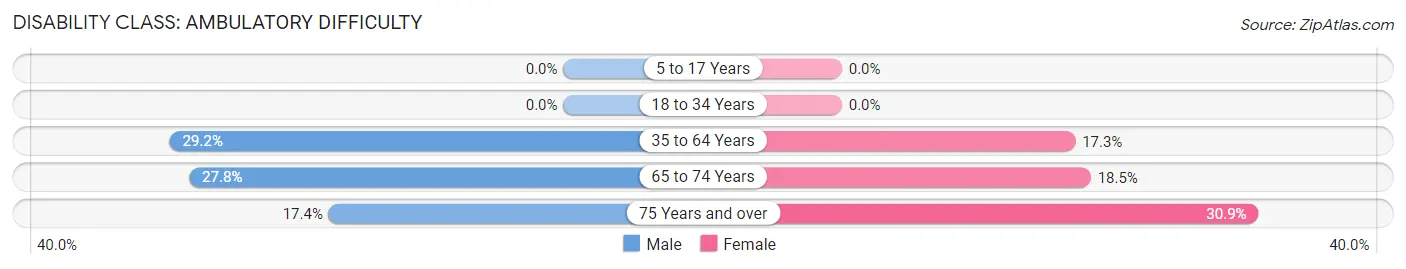
| Age Bracket | Male | Female |
| 5 to 17 Years | 0 (0.0%) | 0 (0.0%) |
| 18 to 34 Years | 0 (0.0%) | 0 (0.0%) |
| 35 to 64 Years | 81 (29.2%) | 48 (17.3%) |
| 65 to 74 Years | 15 (27.8%) | 17 (18.5%) |
| 75 Years and over | 23 (17.4%) | 30 (30.9%) |
Disability Class: Self-Care Difficulty
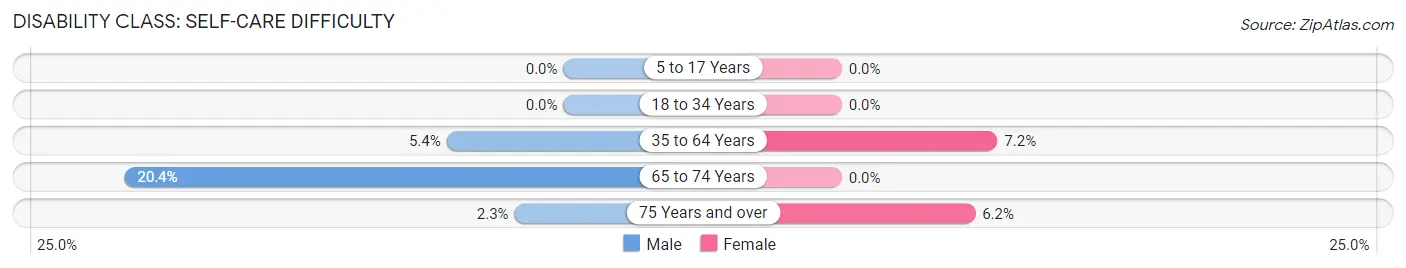
| Age Bracket | Male | Female |
| 5 to 17 Years | 0 (0.0%) | 0 (0.0%) |
| 18 to 34 Years | 0 (0.0%) | 0 (0.0%) |
| 35 to 64 Years | 15 (5.4%) | 20 (7.2%) |
| 65 to 74 Years | 11 (20.4%) | 0 (0.0%) |
| 75 Years and over | 3 (2.3%) | 6 (6.2%) |
Technology Access in Mulberry
Computing Device Access in Mulberry
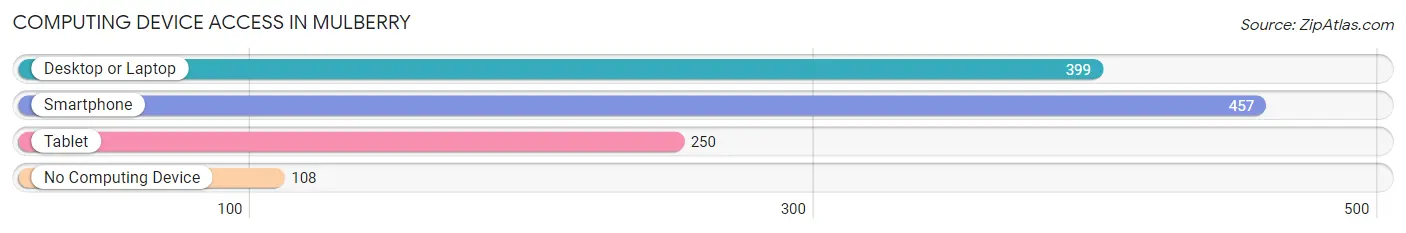
| Device Type | # Households | % Households |
| Desktop or Laptop | 399 | 59.1% |
| Smartphone | 457 | 67.7% |
| Tablet | 250 | 37.0% |
| No Computing Device | 108 | 16.0% |
| Total | 675 | 100.0% |
Internet Access in Mulberry
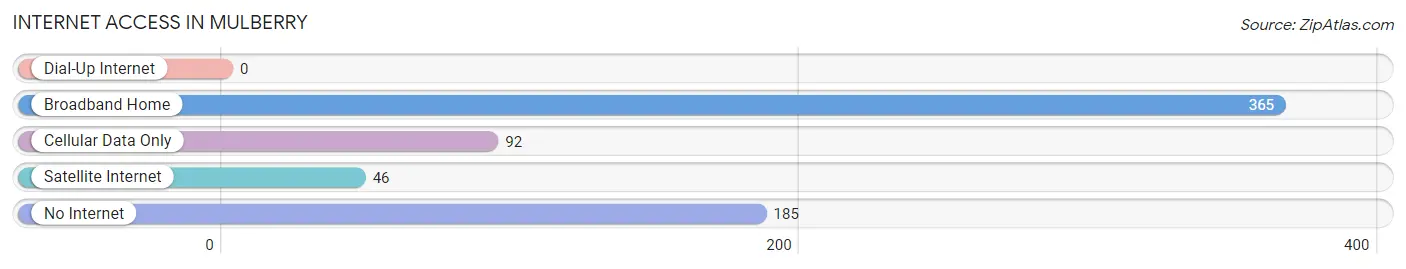
| Internet Type | # Households | % Households |
| Dial-Up Internet | 0 | 0.0% |
| Broadband Home | 365 | 54.1% |
| Cellular Data Only | 92 | 13.6% |
| Satellite Internet | 46 | 6.8% |
| No Internet | 185 | 27.4% |
| Total | 675 | 100.0% |
Mulberry Summary
Mulberry, Arkansas is a small town located in Crawford County, Arkansas. It is situated in the Ozark Mountains, approximately 20 miles south of Fort Smith and about 10 miles north of the Arkansas-Oklahoma border. The town was founded in 1872 and has a population of 1,845 as of the 2010 census.
Geography
Mulberry is located in the Ozark Mountains of northwest Arkansas. The town is situated in the foothills of the Ozarks, with the Mulberry River running through the center of town. The town is located at the intersection of Arkansas Highway 22 and Arkansas Highway 64. The town is surrounded by rolling hills and forests, with the Mulberry River providing a scenic backdrop.
Climate
Mulberry has a humid subtropical climate, with hot, humid summers and mild winters. The average annual temperature is 64°F, with an average high of 86°F in the summer and an average low of 42°F in the winter. The average annual precipitation is 45 inches, with the wettest month being May.
Demographics
As of the 2010 census, Mulberry had a population of 1,845. The racial makeup of the town was 94.3% White, 0.3% African American, 0.3% Native American, 0.2% Asian, 0.1% Pacific Islander, 0.1% from other races, and 4.7% from two or more races. Hispanic or Latino of any race were 1.3% of the population.
Economy
Mulberry’s economy is largely based on agriculture and tourism. The town is home to several farms, including a large cattle ranch. The town also has several small businesses, including a grocery store, a hardware store, and a few restaurants. Tourism is also an important part of the local economy, with visitors coming to the area to enjoy the scenic beauty of the Ozarks.
History
Mulberry was founded in 1872 by a group of settlers from Missouri. The town was named after the Mulberry River, which runs through the center of town. The town quickly grew, and by the early 1900s, it had become a thriving agricultural center. The town was also home to several sawmills and gristmills, which provided lumber and grain for the local economy.
In the early 20th century, the town began to decline as the timber industry moved away from the area. The town was also affected by the Great Depression, and many of the businesses in town closed. However, the town was able to survive, and in the 1950s, it began to experience a resurgence. The town was revitalized by the construction of a new highway, which brought in new businesses and visitors.
Today, Mulberry is a small, rural town with a population of 1,845. The town is still largely agricultural, with several farms and ranches in the area. The town is also home to several small businesses, including a grocery store, a hardware store, and a few restaurants. Tourism is also an important part of the local economy, with visitors coming to the area to enjoy the scenic beauty of the Ozarks.
Common Questions
What is Per Capita Income in Mulberry?
Per Capita income in Mulberry is $24,370.
What is the Median Family Income in Mulberry?
Median Family Income in Mulberry is $50,982.
What is the Median Household income in Mulberry?
Median Household Income in Mulberry is $41,932.
What is Income or Wage Gap in Mulberry?
Income or Wage Gap in Mulberry is 30.2%.
Women in Mulberry earn 69.8 cents for every dollar earned by a man.
What is Inequality or Gini Index in Mulberry?
Inequality or Gini Index in Mulberry is 0.42.
What is the Total Population of Mulberry?
Total Population of Mulberry is 1,616.
What is the Total Male Population of Mulberry?
Total Male Population of Mulberry is 792.
What is the Total Female Population of Mulberry?
Total Female Population of Mulberry is 824.
What is the Ratio of Males per 100 Females in Mulberry?
There are 96.12 Males per 100 Females in Mulberry.
What is the Ratio of Females per 100 Males in Mulberry?
There are 104.04 Females per 100 Males in Mulberry.
What is the Median Population Age in Mulberry?
Median Population Age in Mulberry is 44.3 Years.
What is the Average Family Size in Mulberry
Average Family Size in Mulberry is 2.9 People.
What is the Average Household Size in Mulberry
Average Household Size in Mulberry is 2.3 People.
How Large is the Labor Force in Mulberry?
There are 569 People in the Labor Forcein in Mulberry.
What is the Percentage of People in the Labor Force in Mulberry?
41.2% of People are in the Labor Force in Mulberry.
What is the Unemployment Rate in Mulberry?
Unemployment Rate in Mulberry is 3.3%.