Mount Pleasant, AR Map & Demographics
Mount Pleasant Map
Mount Pleasant Overview
$23,841
PER CAPITA INCOME
$59,000
AVG FAMILY INCOME
$33,173
AVG HOUSEHOLD INCOME
29.8%
WAGE / INCOME GAP [ % ]
70.2¢/ $1
WAGE / INCOME GAP [ $ ]
0.47
INEQUALITY / GINI INDEX
279
TOTAL POPULATION
149
MALE POPULATION
130
FEMALE POPULATION
114.62
MALES / 100 FEMALES
87.25
FEMALES / 100 MALES
54.3
MEDIAN AGE
4.6
AVG FAMILY SIZE
2.7
AVG HOUSEHOLD SIZE
69
LABOR FORCE [ PEOPLE ]
28.0%
PERCENT IN LABOR FORCE
2.9%
UNEMPLOYMENT RATE
Mount Pleasant Zip Codes
Mount Pleasant Area Codes
Income in Mount Pleasant
Income Overview in Mount Pleasant
Per Capita Income in Mount Pleasant is $23,841, while median incomes of families and households are $59,000 and $33,173 respectively.
| Characteristic | Number | Measure |
| Per Capita Income | 279 | $23,841 |
| Median Family Income | 42 | $59,000 |
| Mean Family Income | 42 | $68,433 |
| Median Household Income | 105 | $33,173 |
| Mean Household Income | 105 | $44,909 |
| Income Deficit | 42 | $0 |
| Wage / Income Gap (%) | 279 | 29.82% |
| Wage / Income Gap ($) | 279 | 70.18¢ per $1 |
| Gini / Inequality Index | 279 | 0.47 |
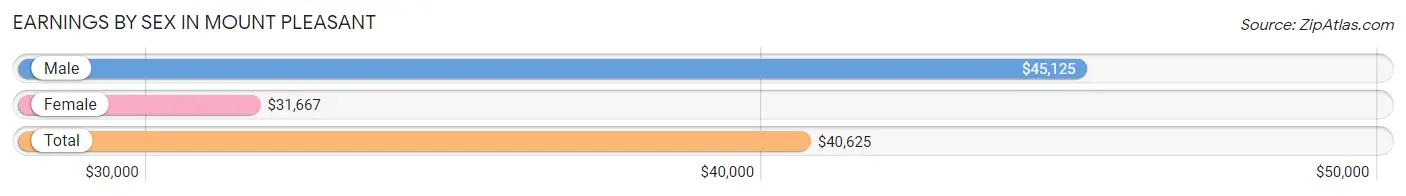
Earnings by Sex in Mount Pleasant
Average Earnings in Mount Pleasant are $40,625, $45,125 for men and $31,667 for women, a difference of 29.8%.
| Sex | Number | Average Earnings |
| Male | 43 (58.9%) | $45,125 |
| Female | 30 (41.1%) | $31,667 |
| Total | 73 (100.0%) | $40,625 |
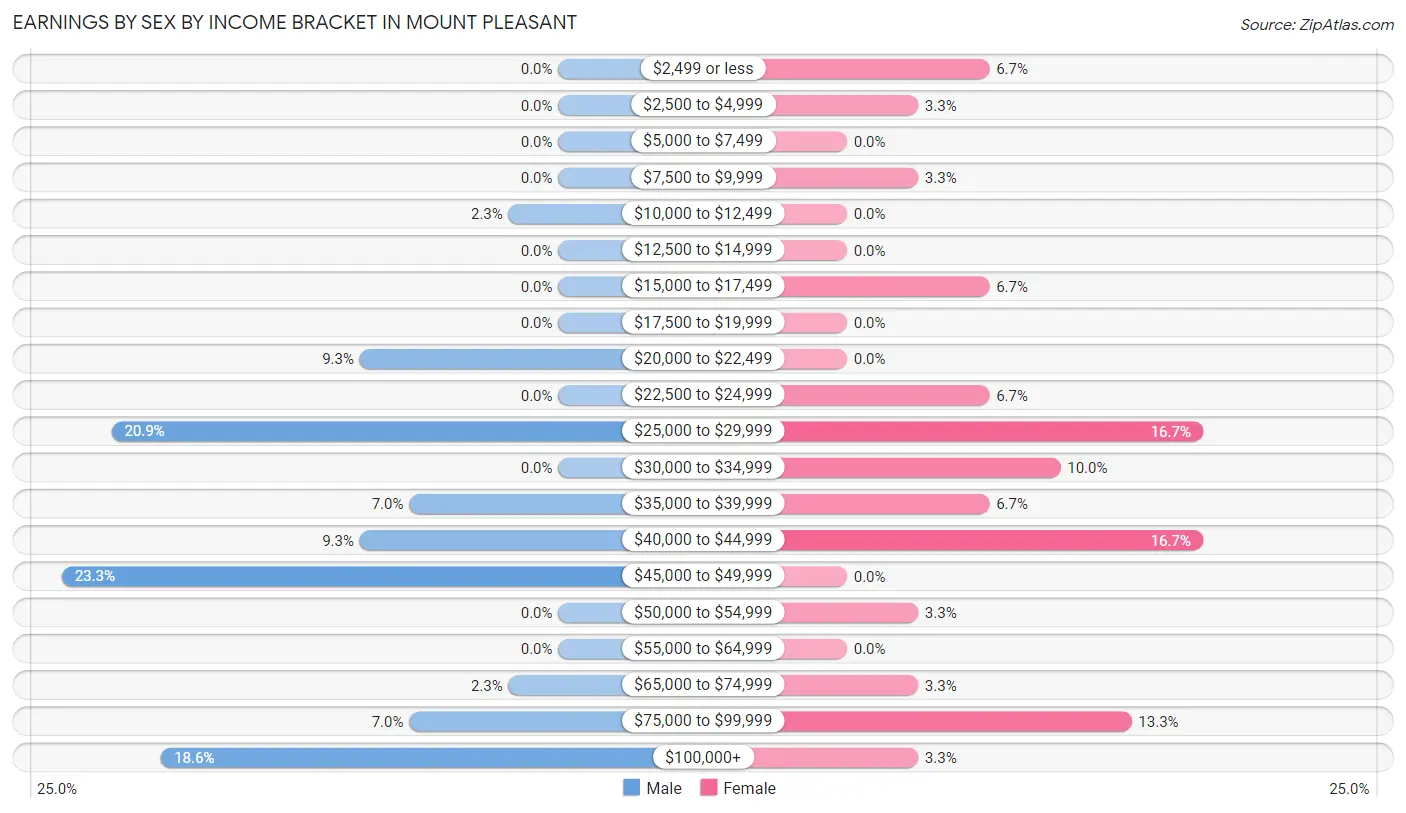
Earnings by Sex by Income Bracket in Mount Pleasant
The most common earnings brackets in Mount Pleasant are $45,000 to $49,999 for men (10 | 23.3%) and $25,000 to $29,999 for women (5 | 16.7%).
| Income | Male | Female |
| $2,499 or less | 0 (0.0%) | 2 (6.7%) |
| $2,500 to $4,999 | 0 (0.0%) | 1 (3.3%) |
| $5,000 to $7,499 | 0 (0.0%) | 0 (0.0%) |
| $7,500 to $9,999 | 0 (0.0%) | 1 (3.3%) |
| $10,000 to $12,499 | 1 (2.3%) | 0 (0.0%) |
| $12,500 to $14,999 | 0 (0.0%) | 0 (0.0%) |
| $15,000 to $17,499 | 0 (0.0%) | 2 (6.7%) |
| $17,500 to $19,999 | 0 (0.0%) | 0 (0.0%) |
| $20,000 to $22,499 | 4 (9.3%) | 0 (0.0%) |
| $22,500 to $24,999 | 0 (0.0%) | 2 (6.7%) |
| $25,000 to $29,999 | 9 (20.9%) | 5 (16.7%) |
| $30,000 to $34,999 | 0 (0.0%) | 3 (10.0%) |
| $35,000 to $39,999 | 3 (7.0%) | 2 (6.7%) |
| $40,000 to $44,999 | 4 (9.3%) | 5 (16.7%) |
| $45,000 to $49,999 | 10 (23.3%) | 0 (0.0%) |
| $50,000 to $54,999 | 0 (0.0%) | 1 (3.3%) |
| $55,000 to $64,999 | 0 (0.0%) | 0 (0.0%) |
| $65,000 to $74,999 | 1 (2.3%) | 1 (3.3%) |
| $75,000 to $99,999 | 3 (7.0%) | 4 (13.3%) |
| $100,000+ | 8 (18.6%) | 1 (3.3%) |
| Total | 43 (100.0%) | 30 (100.0%) |
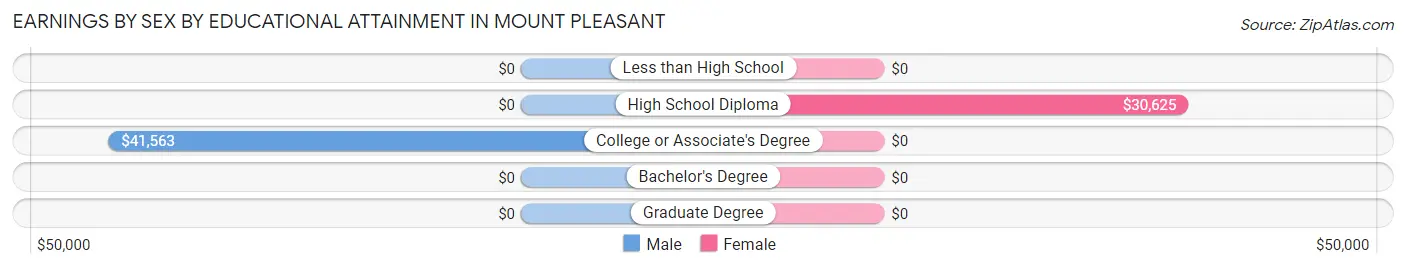
Earnings by Sex by Educational Attainment in Mount Pleasant
Average earnings in Mount Pleasant are $41,250 for men and $30,625 for women, a difference of 25.8%. Men with an educational attainment of college or associate's degree enjoy the highest average annual earnings of $41,563, while those with college or associate's degree education earn the least with $41,563. Women with an educational attainment of high school diploma earn the most with the average annual earnings of $30,625, while those with high school diploma education have the smallest earnings of $30,625.
| Educational Attainment | Male Income | Female Income |
| Less than High School | - | - |
| High School Diploma | - | - |
| College or Associate's Degree | $41,563 | $0 |
| Bachelor's Degree | - | - |
| Graduate Degree | - | - |
| Total | $41,250 | $30,625 |
Family Income in Mount Pleasant
Family Income Brackets in Mount Pleasant
According to the Mount Pleasant family income data, there are 17 families falling into the $50,000 to $74,999 income range, which is the most common income bracket and makes up 40.5% of all families. Conversely, the less than $10,000 income bracket is the least frequent group with only 1 families (2.4%) belonging to this category.
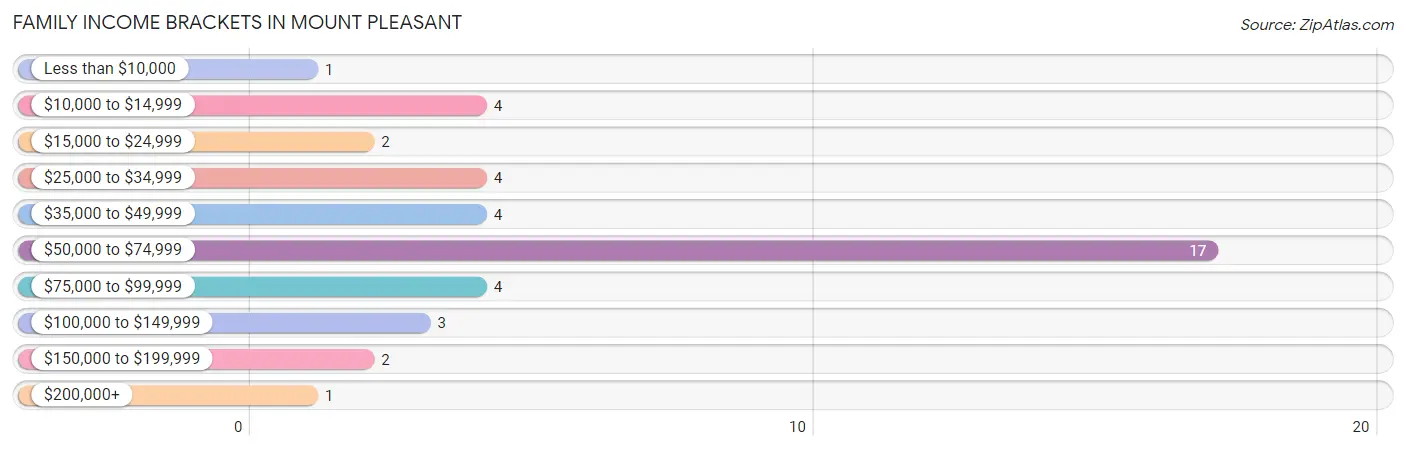
| Income Bracket | # Families | % Families |
| Less than $10,000 | 1 | 2.4% |
| $10,000 to $14,999 | 4 | 9.5% |
| $15,000 to $24,999 | 2 | 4.8% |
| $25,000 to $34,999 | 4 | 9.5% |
| $35,000 to $49,999 | 4 | 9.5% |
| $50,000 to $74,999 | 17 | 40.5% |
| $75,000 to $99,999 | 4 | 9.5% |
| $100,000 to $149,999 | 3 | 7.1% |
| $150,000 to $199,999 | 2 | 4.8% |
| $200,000+ | 1 | 2.4% |
Family Income by Famaliy Size in Mount Pleasant
5-person families (5 | 11.9%) account for the highest median family income in Mount Pleasant with $91,250 per family, while 2-person families (26 | 61.9%) have the highest median income of $25,834 per family member.
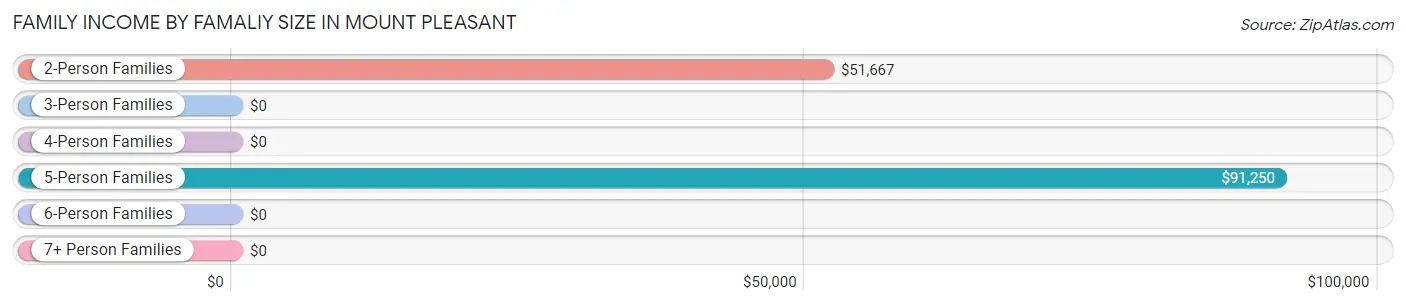
| Income Bracket | # Families | Median Income |
| 2-Person Families | 26 (61.9%) | $51,667 |
| 3-Person Families | 6 (14.3%) | $0 |
| 4-Person Families | 2 (4.8%) | $0 |
| 5-Person Families | 5 (11.9%) | $91,250 |
| 6-Person Families | 3 (7.1%) | $0 |
| 7+ Person Families | 0 (0.0%) | $0 |
| Total | 42 (100.0%) | $59,000 |
Family Income by Number of Earners in Mount Pleasant
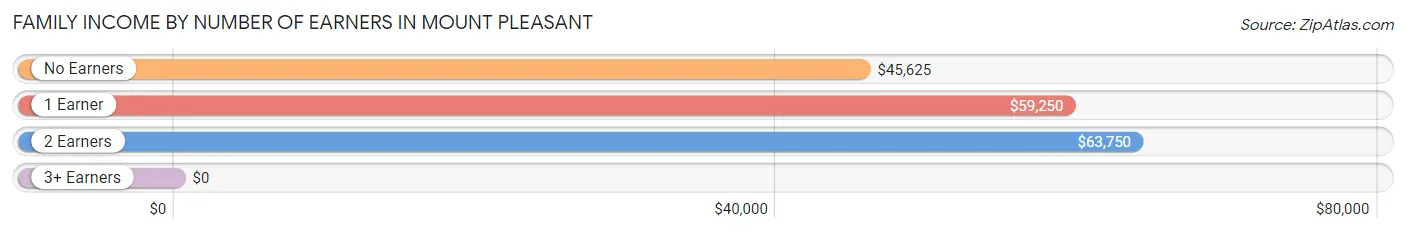
| Number of Earners | # Families | Median Income |
| No Earners | 16 (38.1%) | $45,625 |
| 1 Earner | 15 (35.7%) | $59,250 |
| 2 Earners | 10 (23.8%) | $63,750 |
| 3+ Earners | 1 (2.4%) | $0 |
| Total | 42 (100.0%) | $59,000 |
Household Income in Mount Pleasant
Household Income Brackets in Mount Pleasant
With 25 households falling in the category, the $10,000 to $14,999 income range is the most frequent in Mount Pleasant, accounting for 23.8% of all households. In contrast, only 1 households (0.9%) fall into the $200,000+ income bracket, making it the least populous group.
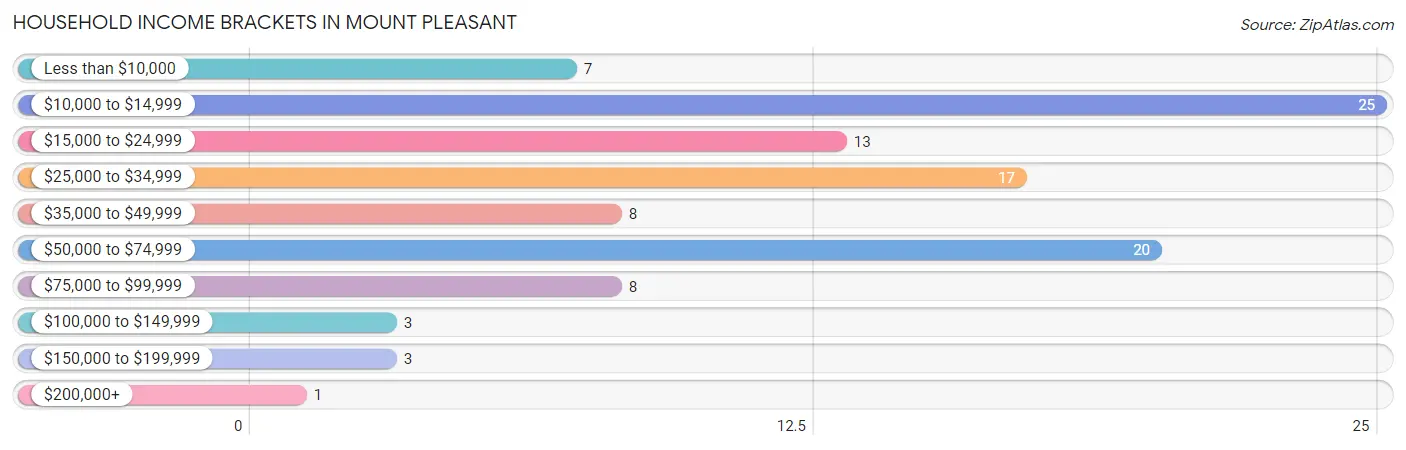
| Income Bracket | # Households | % Households |
| Less than $10,000 | 7 | 6.7% |
| $10,000 to $14,999 | 25 | 23.8% |
| $15,000 to $24,999 | 13 | 12.4% |
| $25,000 to $34,999 | 17 | 16.2% |
| $35,000 to $49,999 | 8 | 7.6% |
| $50,000 to $74,999 | 20 | 19.0% |
| $75,000 to $99,999 | 8 | 7.6% |
| $100,000 to $149,999 | 3 | 2.9% |
| $150,000 to $199,999 | 3 | 2.9% |
| $200,000+ | 1 | 1.0% |
Household Income by Householder Age in Mount Pleasant
The median household income in Mount Pleasant is $33,173, with the highest median household income of $32,692 found in the 65+ years age bracket for the primary householder. A total of 48 households (45.7%) fall into this category. Meanwhile, the 15 to 24 years age bracket for the primary householder has the lowest median household income of $0, with 1 households (0.9%) in this group.
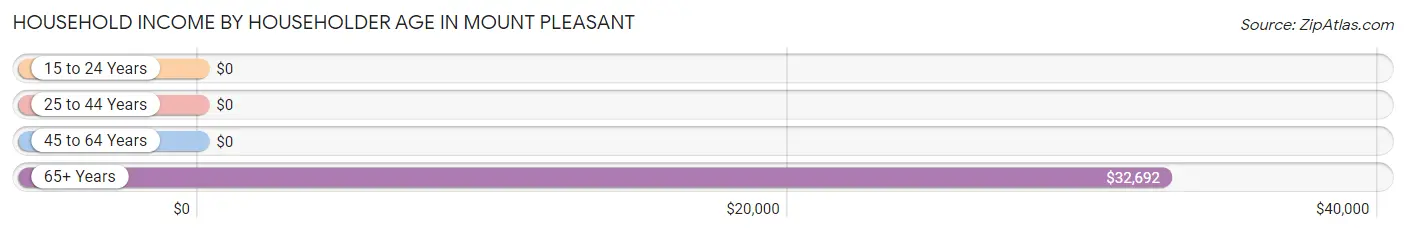
| Income Bracket | # Households | Median Income |
| 15 to 24 Years | 1 (0.9%) | $0 |
| 25 to 44 Years | 21 (20.0%) | $0 |
| 45 to 64 Years | 35 (33.3%) | $0 |
| 65+ Years | 48 (45.7%) | $32,692 |
| Total | 105 (100.0%) | $33,173 |
Poverty in Mount Pleasant
Income Below Poverty by Sex and Age in Mount Pleasant
With 29.5% poverty level for males and 33.1% for females among the residents of Mount Pleasant, 18 to 24 year old males and 6 to 11 year old females are the most vulnerable to poverty, with 6 males (54.5%) and 3 females (100.0%) in their respective age groups living below the poverty level.
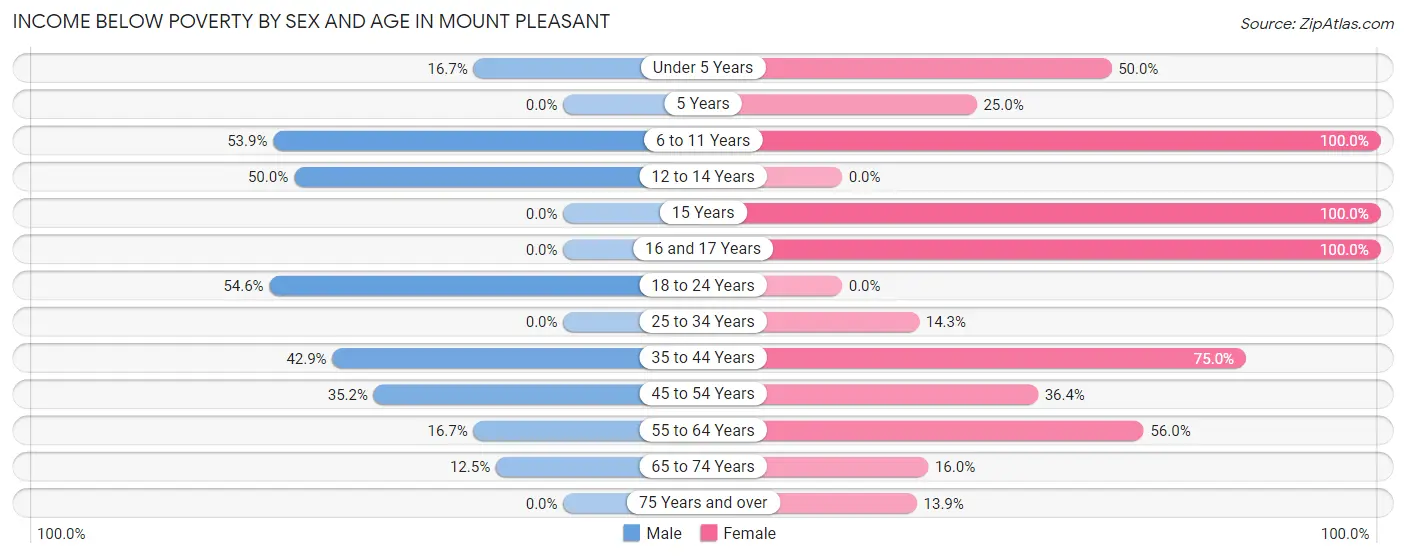
| Age Bracket | Male | Female |
| Under 5 Years | 1 (16.7%) | 2 (50.0%) |
| 5 Years | 0 (0.0%) | 1 (25.0%) |
| 6 to 11 Years | 7 (53.8%) | 3 (100.0%) |
| 12 to 14 Years | 1 (50.0%) | 0 (0.0%) |
| 15 Years | 0 (0.0%) | 1 (100.0%) |
| 16 and 17 Years | 0 (0.0%) | 5 (100.0%) |
| 18 to 24 Years | 6 (54.5%) | 0 (0.0%) |
| 25 to 34 Years | 0 (0.0%) | 1 (14.3%) |
| 35 to 44 Years | 3 (42.9%) | 3 (75.0%) |
| 45 to 54 Years | 19 (35.2%) | 4 (36.4%) |
| 55 to 64 Years | 5 (16.7%) | 14 (56.0%) |
| 65 to 74 Years | 2 (12.5%) | 4 (16.0%) |
| 75 Years and over | 0 (0.0%) | 5 (13.9%) |
| Total | 44 (29.5%) | 43 (33.1%) |
Income Above Poverty by Sex and Age in Mount Pleasant
According to the poverty statistics in Mount Pleasant, males aged 25 to 34 years and females aged 18 to 24 years are the age groups that are most secure financially, with 100.0% of males and 100.0% of females in these age groups living above the poverty line.
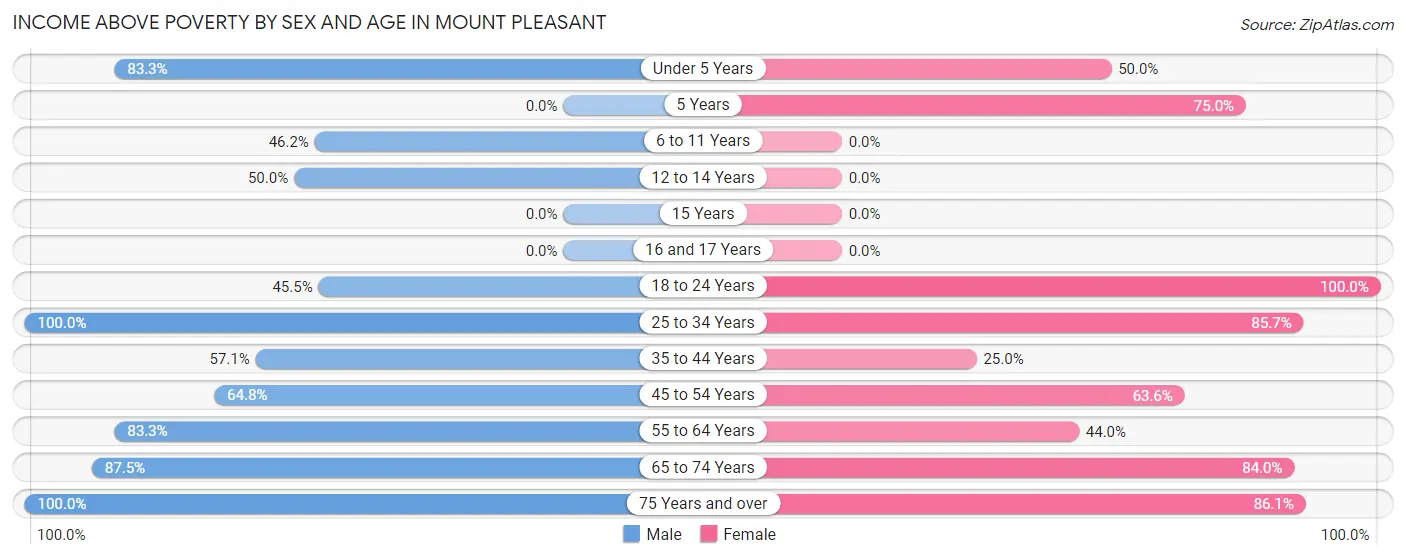
| Age Bracket | Male | Female |
| Under 5 Years | 5 (83.3%) | 2 (50.0%) |
| 5 Years | 0 (0.0%) | 3 (75.0%) |
| 6 to 11 Years | 6 (46.2%) | 0 (0.0%) |
| 12 to 14 Years | 1 (50.0%) | 0 (0.0%) |
| 15 Years | 0 (0.0%) | 0 (0.0%) |
| 16 and 17 Years | 0 (0.0%) | 0 (0.0%) |
| 18 to 24 Years | 5 (45.5%) | 5 (100.0%) |
| 25 to 34 Years | 7 (100.0%) | 6 (85.7%) |
| 35 to 44 Years | 4 (57.1%) | 1 (25.0%) |
| 45 to 54 Years | 35 (64.8%) | 7 (63.6%) |
| 55 to 64 Years | 25 (83.3%) | 11 (44.0%) |
| 65 to 74 Years | 14 (87.5%) | 21 (84.0%) |
| 75 Years and over | 3 (100.0%) | 31 (86.1%) |
| Total | 105 (70.5%) | 87 (66.9%) |
Income Below Poverty Among Married-Couple Families in Mount Pleasant
The poverty statistics for married-couple families in Mount Pleasant show that 13.3% or 4 of the total 30 families live below the poverty line. Families with 3 or 4 children have the highest poverty rate of 25.0%, comprising of 1 families. On the other hand, families with no children have the lowest poverty rate of 5.9%, which includes 1 families.
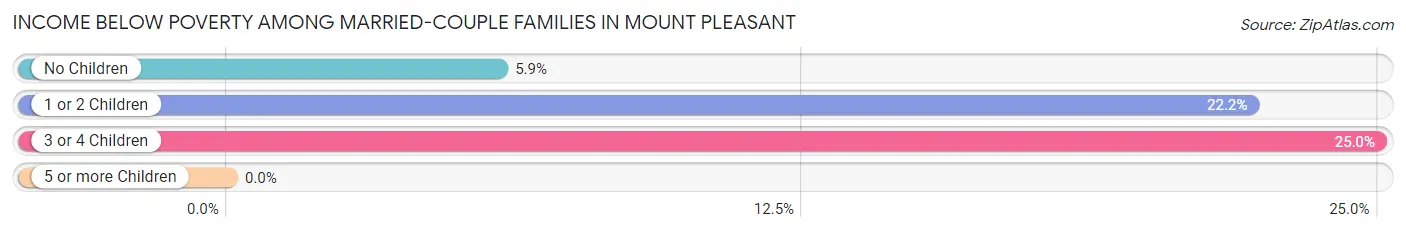
| Children | Above Poverty | Below Poverty |
| No Children | 16 (94.1%) | 1 (5.9%) |
| 1 or 2 Children | 7 (77.8%) | 2 (22.2%) |
| 3 or 4 Children | 3 (75.0%) | 1 (25.0%) |
| 5 or more Children | 0 (0.0%) | 0 (0.0%) |
| Total | 26 (86.7%) | 4 (13.3%) |
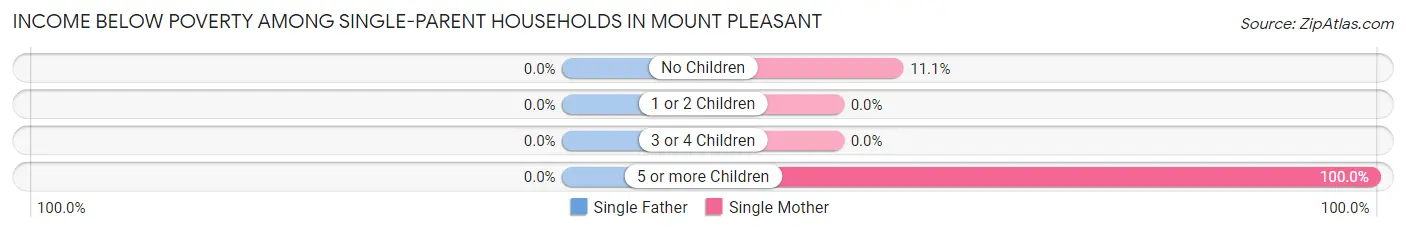
Income Below Poverty Among Single-Parent Households in Mount Pleasant
| Children | Single Father | Single Mother |
| No Children | 0 (0.0%) | 1 (11.1%) |
| 1 or 2 Children | 0 (0.0%) | 0 (0.0%) |
| 3 or 4 Children | 0 (0.0%) | 0 (0.0%) |
| 5 or more Children | 0 (0.0%) | 1 (100.0%) |
| Total | 0 (0.0%) | 2 (18.2%) |
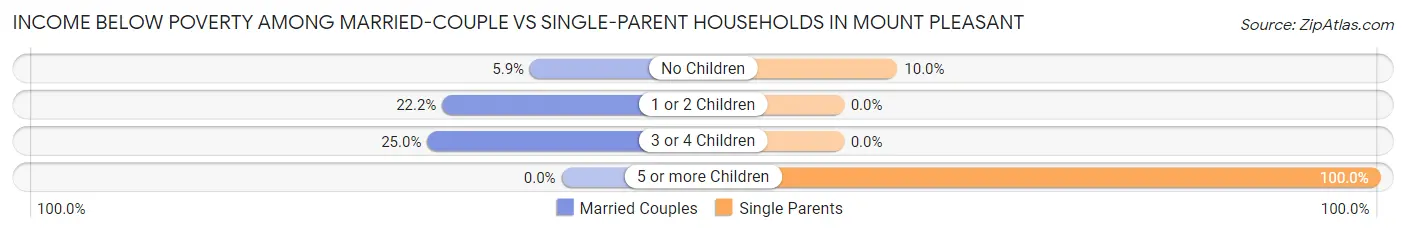
Income Below Poverty Among Married-Couple vs Single-Parent Households in Mount Pleasant
The poverty data for Mount Pleasant shows that 4 of the married-couple family households (13.3%) and 2 of the single-parent households (16.7%) are living below the poverty level. Within the married-couple family households, those with 3 or 4 children have the highest poverty rate, with 1 households (25.0%) falling below the poverty line. Among the single-parent households, those with 5 or more children have the highest poverty rate, with 1 household (100.0%) living below poverty.
| Children | Married-Couple Families | Single-Parent Households |
| No Children | 1 (5.9%) | 1 (10.0%) |
| 1 or 2 Children | 2 (22.2%) | 0 (0.0%) |
| 3 or 4 Children | 1 (25.0%) | 0 (0.0%) |
| 5 or more Children | 0 (0.0%) | 1 (100.0%) |
| Total | 4 (13.3%) | 2 (16.7%) |
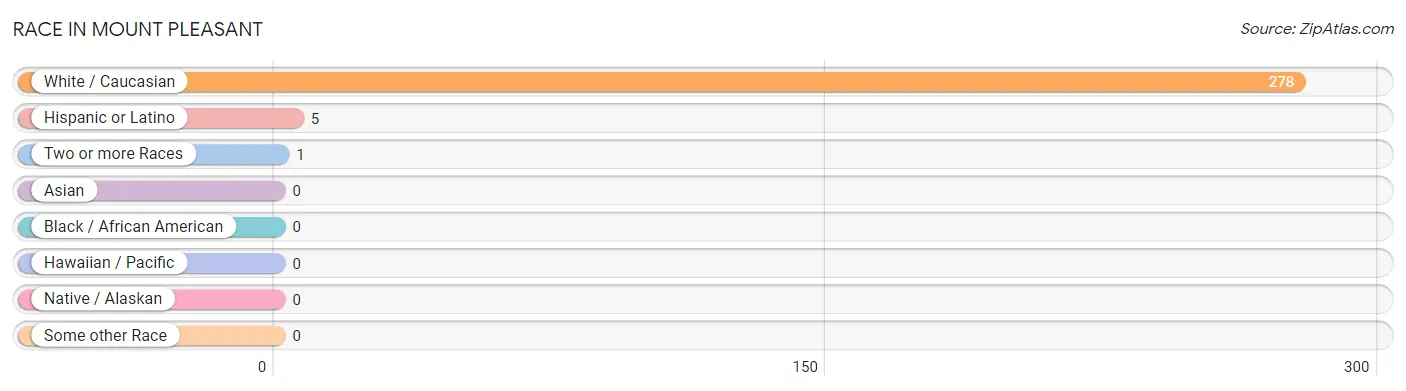
Race in Mount Pleasant
The most populous races in Mount Pleasant are White / Caucasian (278 | 99.6%), Hispanic or Latino (5 | 1.8%), and Two or more Races (1 | 0.4%).
| Race | # Population | % Population |
| Asian | 0 | 0.0% |
| Black / African American | 0 | 0.0% |
| Hawaiian / Pacific | 0 | 0.0% |
| Hispanic or Latino | 5 | 1.8% |
| Native / Alaskan | 0 | 0.0% |
| White / Caucasian | 278 | 99.6% |
| Two or more Races | 1 | 0.4% |
| Some other Race | 0 | 0.0% |
| Total | 279 | 100.0% |
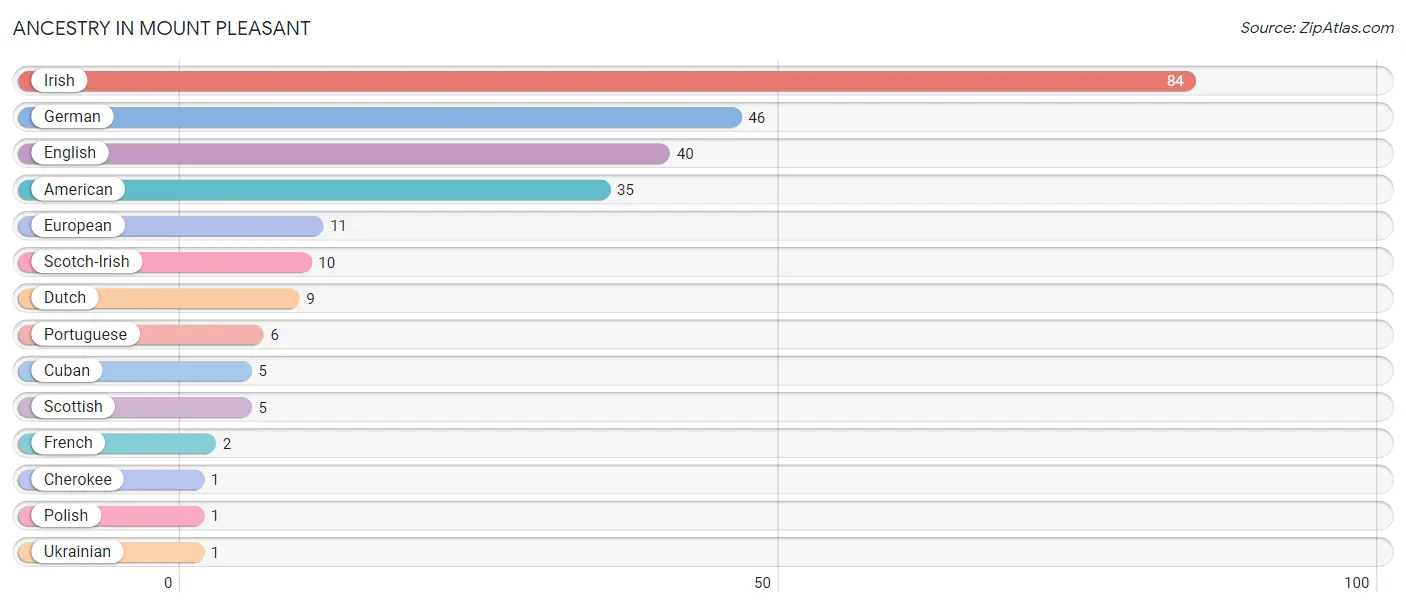
Ancestry in Mount Pleasant
The most populous ancestries reported in Mount Pleasant are Irish (84 | 30.1%), German (46 | 16.5%), English (40 | 14.3%), American (35 | 12.5%), and European (11 | 3.9%), together accounting for 77.4% of all Mount Pleasant residents.
| Ancestry | # Population | % Population |
| American | 35 | 12.5% |
| Cherokee | 1 | 0.4% |
| Cuban | 5 | 1.8% |
| Dutch | 9 | 3.2% |
| English | 40 | 14.3% |
| European | 11 | 3.9% |
| French | 2 | 0.7% |
| German | 46 | 16.5% |
| Irish | 84 | 30.1% |
| Polish | 1 | 0.4% |
| Portuguese | 6 | 2.1% |
| Scotch-Irish | 10 | 3.6% |
| Scottish | 5 | 1.8% |
| Ukrainian | 1 | 0.4% | View All 14 Rows |
Immigrants in Mount Pleasant

| Immigration Origin | # Population | % Population | View All 0 Rows |
Sex and Age in Mount Pleasant
Sex and Age in Mount Pleasant
The most populous age groups in Mount Pleasant are 45 to 49 Years (45 | 30.2%) for men and 80 to 84 Years (18 | 13.9%) for women.
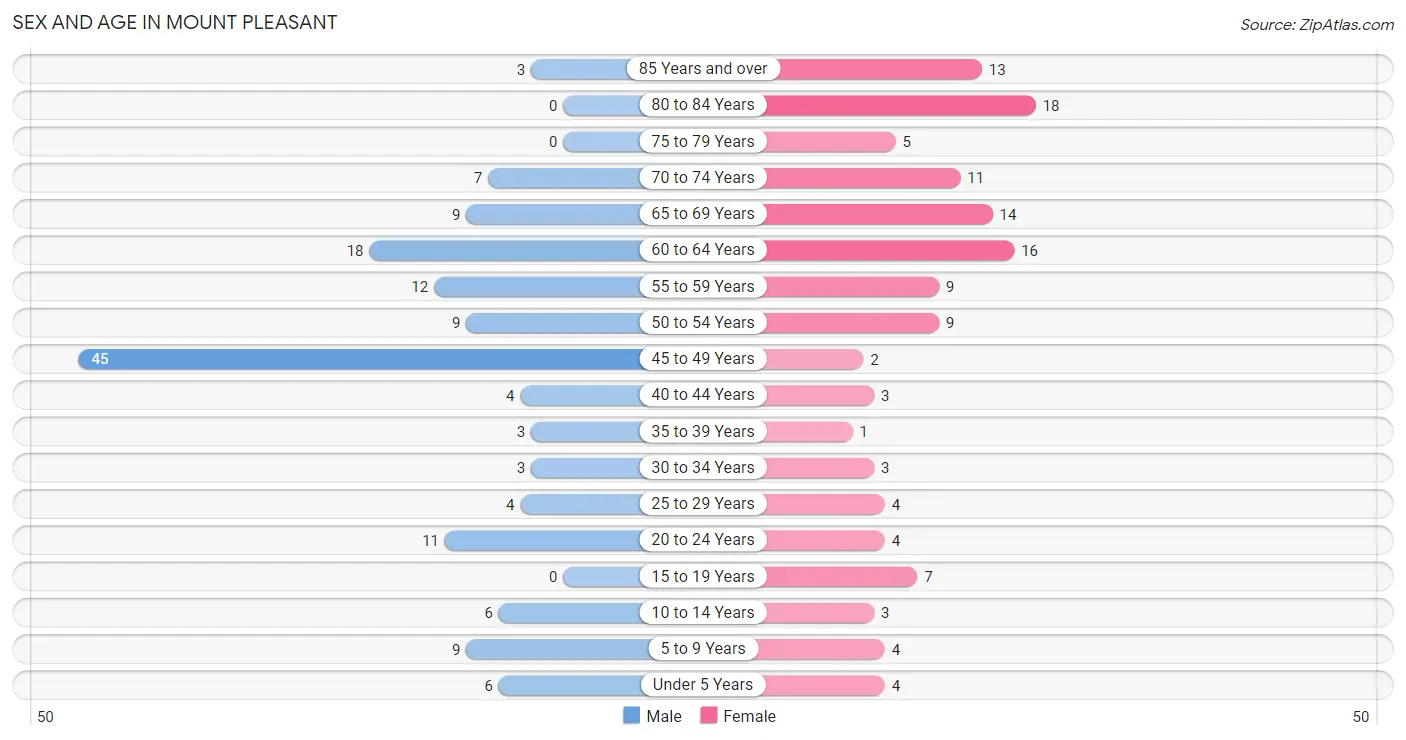
| Age Bracket | Male | Female |
| Under 5 Years | 6 (4.0%) | 4 (3.1%) |
| 5 to 9 Years | 9 (6.0%) | 4 (3.1%) |
| 10 to 14 Years | 6 (4.0%) | 3 (2.3%) |
| 15 to 19 Years | 0 (0.0%) | 7 (5.4%) |
| 20 to 24 Years | 11 (7.4%) | 4 (3.1%) |
| 25 to 29 Years | 4 (2.7%) | 4 (3.1%) |
| 30 to 34 Years | 3 (2.0%) | 3 (2.3%) |
| 35 to 39 Years | 3 (2.0%) | 1 (0.8%) |
| 40 to 44 Years | 4 (2.7%) | 3 (2.3%) |
| 45 to 49 Years | 45 (30.2%) | 2 (1.5%) |
| 50 to 54 Years | 9 (6.0%) | 9 (6.9%) |
| 55 to 59 Years | 12 (8.1%) | 9 (6.9%) |
| 60 to 64 Years | 18 (12.1%) | 16 (12.3%) |
| 65 to 69 Years | 9 (6.0%) | 14 (10.8%) |
| 70 to 74 Years | 7 (4.7%) | 11 (8.5%) |
| 75 to 79 Years | 0 (0.0%) | 5 (3.8%) |
| 80 to 84 Years | 0 (0.0%) | 18 (13.9%) |
| 85 Years and over | 3 (2.0%) | 13 (10.0%) |
| Total | 149 (100.0%) | 130 (100.0%) |
Families and Households in Mount Pleasant
Median Family Size in Mount Pleasant
The median family size in Mount Pleasant is 4.57 persons per family, with single female/mother families (11 | 26.2%) accounting for the largest median family size of 5.73 persons per family. On the other hand, single male/father families (1 | 2.4%) represent the smallest median family size with 4.00 persons per family.
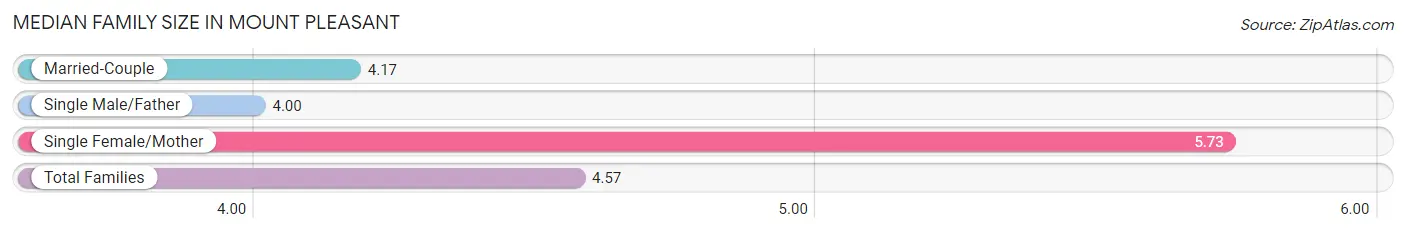
| Family Type | # Families | Family Size |
| Married-Couple | 30 (71.4%) | 4.17 |
| Single Male/Father | 1 (2.4%) | 4.00 |
| Single Female/Mother | 11 (26.2%) | 5.73 |
| Total Families | 42 (100.0%) | 4.57 |
Median Household Size in Mount Pleasant
The median household size in Mount Pleasant is 2.66 persons per household, with single female/mother households (11 | 10.5%) accounting for the largest median household size of 6.73 persons per household. non-family households (63 | 60.0%) represent the smallest median household size with 1.21 persons per household.
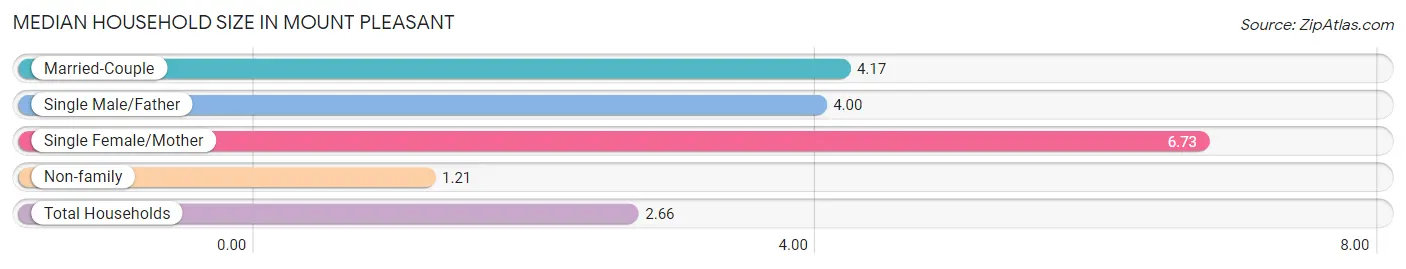
| Household Type | # Households | Household Size |
| Married-Couple | 30 (28.6%) | 4.17 |
| Single Male/Father | 1 (0.9%) | 4.00 |
| Single Female/Mother | 11 (10.5%) | 6.73 |
| Non-family | 63 (60.0%) | 1.21 |
| Total Households | 105 (100.0%) | 2.66 |
Household Size by Marriage Status in Mount Pleasant
Out of a total of 105 households in Mount Pleasant, 42 (40.0%) are family households, while 63 (60.0%) are nonfamily households. The most numerous type of family households are 2-person households, comprising 23, and the most common type of nonfamily households are 1-person households, comprising 52.
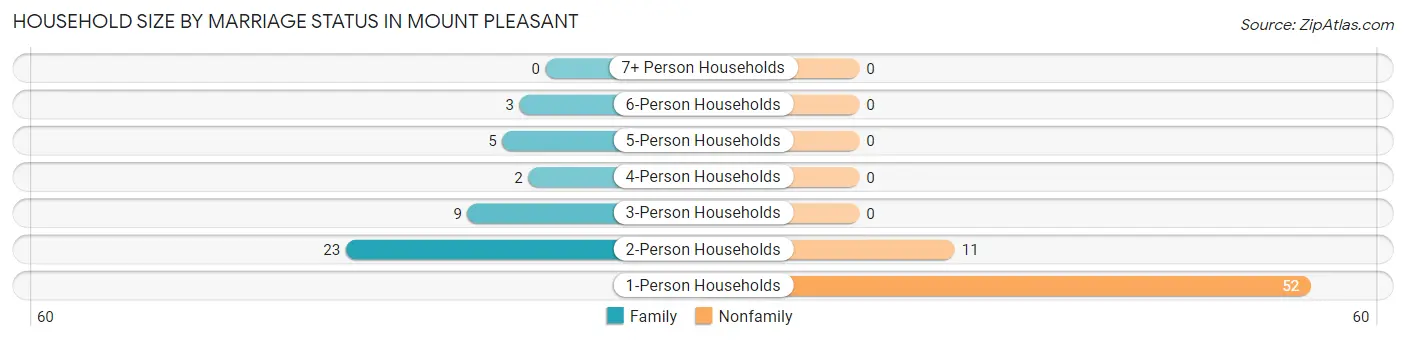
| Household Size | Family Households | Nonfamily Households |
| 1-Person Households | - | 52 (49.5%) |
| 2-Person Households | 23 (21.9%) | 11 (10.5%) |
| 3-Person Households | 9 (8.6%) | 0 (0.0%) |
| 4-Person Households | 2 (1.9%) | 0 (0.0%) |
| 5-Person Households | 5 (4.8%) | 0 (0.0%) |
| 6-Person Households | 3 (2.9%) | 0 (0.0%) |
| 7+ Person Households | 0 (0.0%) | 0 (0.0%) |
| Total | 42 (40.0%) | 63 (60.0%) |
Female Fertility in Mount Pleasant
Fertility by Age in Mount Pleasant
Average fertility rate in Mount Pleasant is 192.0 births per 1,000 women. Women in the age bracket of 20 to 34 years have the highest fertility rate with 455.0 births per 1,000 women. Women in the age bracket of 20 to 34 years acount for 100.0% of all women with births.
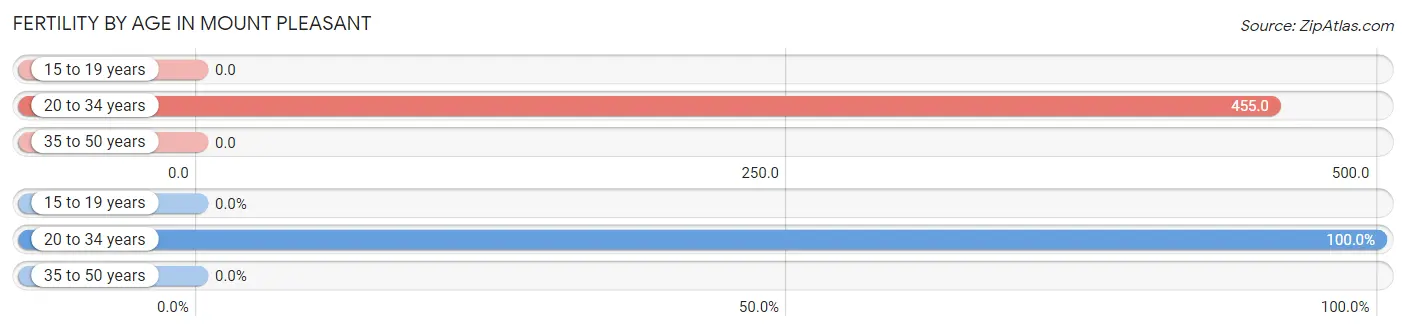
| Age Bracket | Women with Births | Births / 1,000 Women |
| 15 to 19 years | 0 (0.0%) | 0.0 |
| 20 to 34 years | 5 (100.0%) | 455.0 |
| 35 to 50 years | 0 (0.0%) | 0.0 |
| Total | 5 (100.0%) | 192.0 |
Fertility by Age by Marriage Status in Mount Pleasant
80.0% of women with births (5) in Mount Pleasant are married. The highest percentage of unmarried women with births falls into 20 to 34 years age bracket with 20.0% of them unmarried at the time of birth, while the lowest percentage of unmarried women with births belong to 20 to 34 years age bracket with 20.0% of them unmarried.
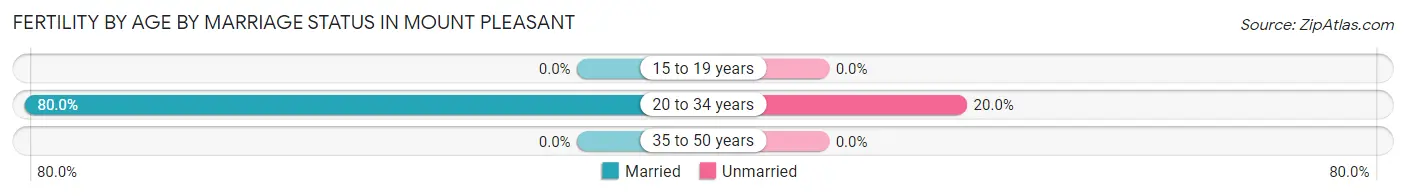
| Age Bracket | Married | Unmarried |
| 15 to 19 years | 0 (0.0%) | 0 (0.0%) |
| 20 to 34 years | 4 (80.0%) | 1 (20.0%) |
| 35 to 50 years | 0 (0.0%) | 0 (0.0%) |
| Total | 4 (80.0%) | 1 (20.0%) |
Fertility by Education in Mount Pleasant
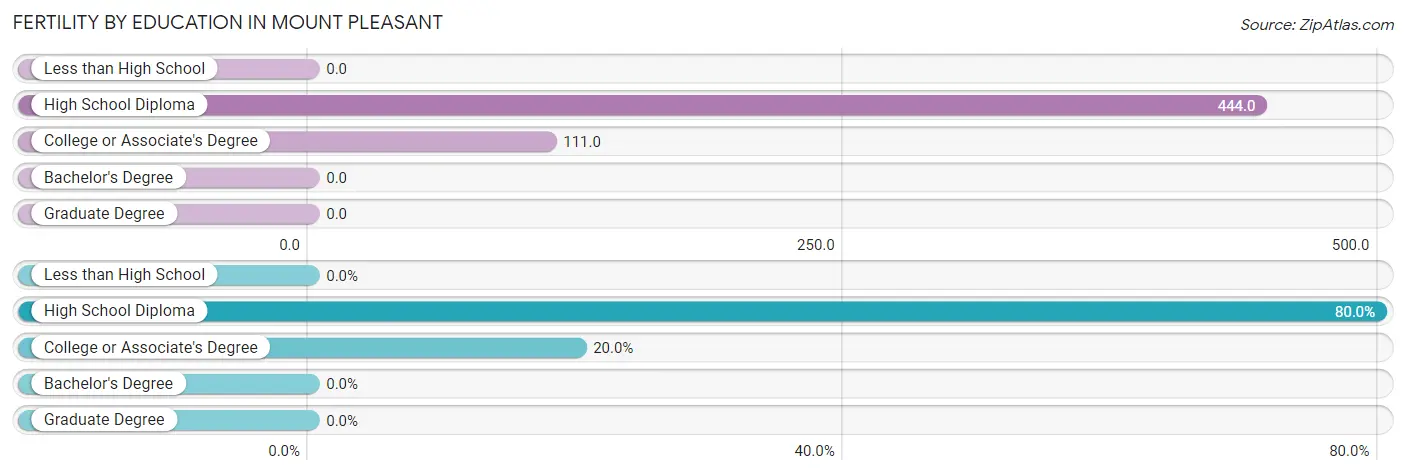
| Educational Attainment | Women with Births | Births / 1,000 Women |
| Less than High School | 0 (0.0%) | 0.0 |
| High School Diploma | 4 (80.0%) | 444.0 |
| College or Associate's Degree | 1 (20.0%) | 111.0 |
| Bachelor's Degree | 0 (0.0%) | 0.0 |
| Graduate Degree | 0 (0.0%) | 0.0 |
| Total | 5 (100.0%) | 192.0 |
Fertility by Education by Marriage Status in Mount Pleasant
20.0% of women with births in Mount Pleasant are unmarried. Women with the educational attainment of high school diploma are most likely to be married with 100.0% of them married at childbirth, while women with the educational attainment of college or associate's degree are least likely to be married with 100.0% of them unmarried at childbirth.
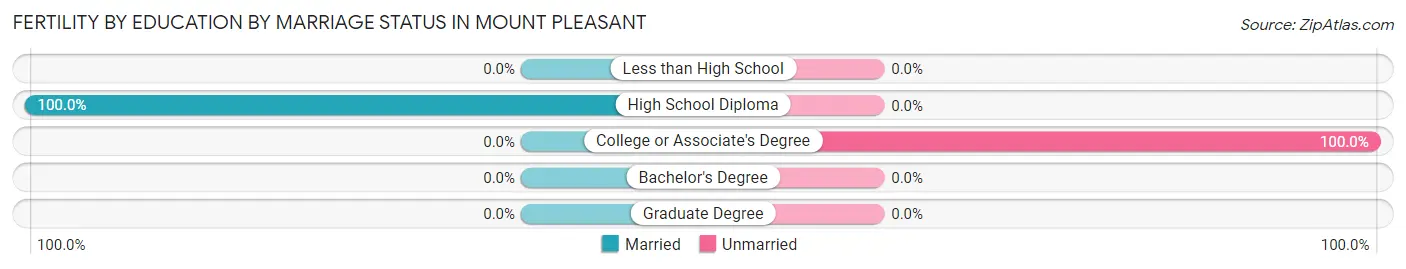
| Educational Attainment | Married | Unmarried |
| Less than High School | 0 (0.0%) | 0 (0.0%) |
| High School Diploma | 4 (100.0%) | 0 (0.0%) |
| College or Associate's Degree | 0 (0.0%) | 1 (100.0%) |
| Bachelor's Degree | 0 (0.0%) | 0 (0.0%) |
| Graduate Degree | 0 (0.0%) | 0 (0.0%) |
| Total | 4 (80.0%) | 1 (20.0%) |
Employment Characteristics in Mount Pleasant
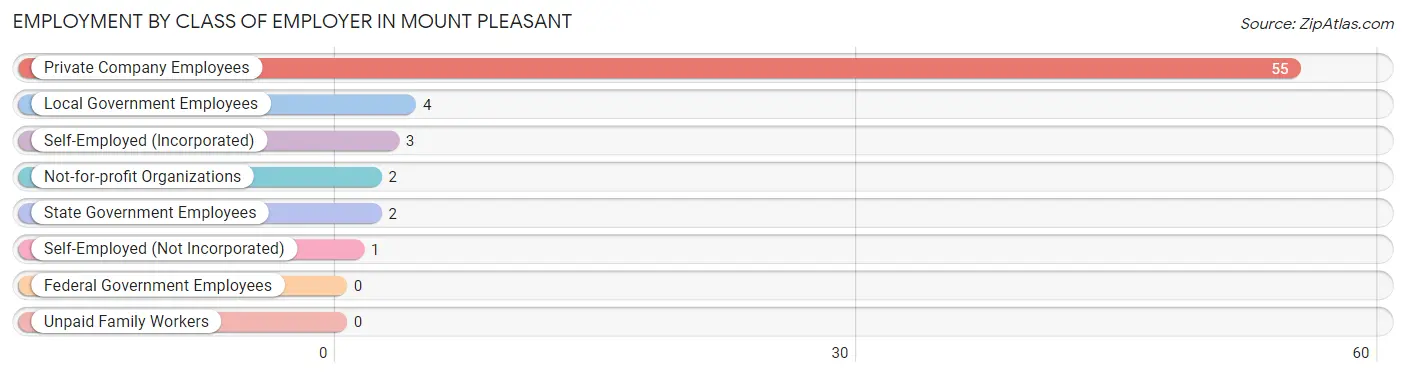
Employment by Class of Employer in Mount Pleasant
Among the 67 employed individuals in Mount Pleasant, private company employees (55 | 82.1%), local government employees (4 | 6.0%), and self-employed (incorporated) (3 | 4.5%) make up the most common classes of employment.
| Employer Class | # Employees | % Employees |
| Private Company Employees | 55 | 82.1% |
| Self-Employed (Incorporated) | 3 | 4.5% |
| Self-Employed (Not Incorporated) | 1 | 1.5% |
| Not-for-profit Organizations | 2 | 3.0% |
| Local Government Employees | 4 | 6.0% |
| State Government Employees | 2 | 3.0% |
| Federal Government Employees | 0 | 0.0% |
| Unpaid Family Workers | 0 | 0.0% |
| Total | 67 | 100.0% |
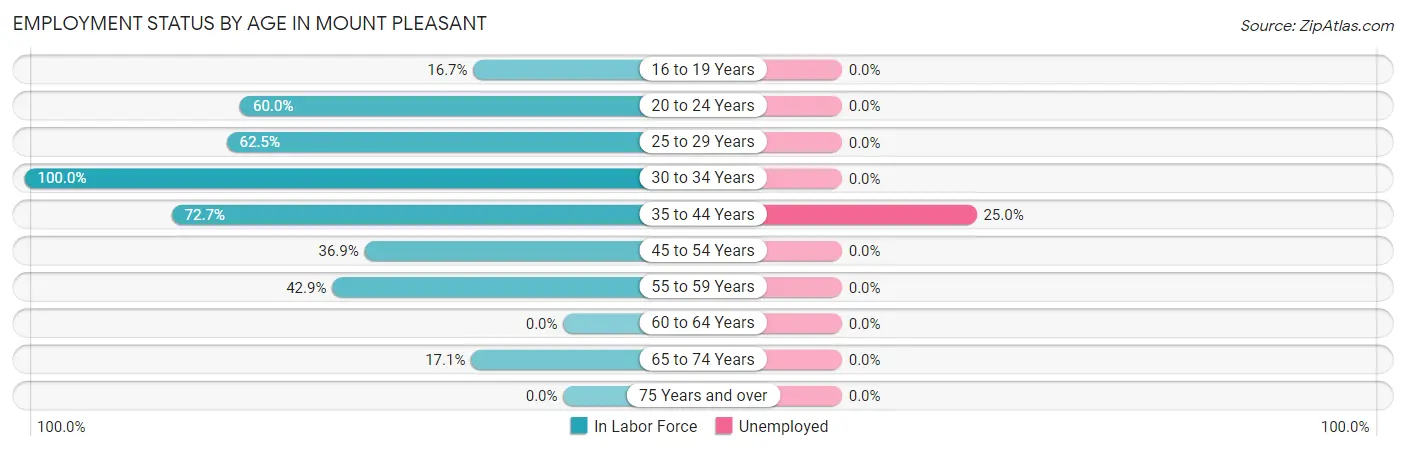
Employment Status by Age in Mount Pleasant
According to the labor force statistics for Mount Pleasant, out of the total population over 16 years of age (246), 28.0% or 69 individuals are in the labor force, with 2.9% or 2 of them unemployed. The age group with the highest labor force participation rate is 30 to 34 years, with 100.0% or 6 individuals in the labor force. Within the labor force, the 35 to 44 years age range has the highest percentage of unemployed individuals, with 25.0% or 2 of them being unemployed.
| Age Bracket | In Labor Force | Unemployed |
| 16 to 19 Years | 1 (16.7%) | 0 (0.0%) |
| 20 to 24 Years | 9 (60.0%) | 0 (0.0%) |
| 25 to 29 Years | 5 (62.5%) | 0 (0.0%) |
| 30 to 34 Years | 6 (100.0%) | 0 (0.0%) |
| 35 to 44 Years | 8 (72.7%) | 2 (25.0%) |
| 45 to 54 Years | 24 (36.9%) | 0 (0.0%) |
| 55 to 59 Years | 9 (42.9%) | 0 (0.0%) |
| 60 to 64 Years | 0 (0.0%) | 0 (0.0%) |
| 65 to 74 Years | 7 (17.1%) | 0 (0.0%) |
| 75 Years and over | 0 (0.0%) | 0 (0.0%) |
| Total | 69 (28.0%) | 2 (2.9%) |
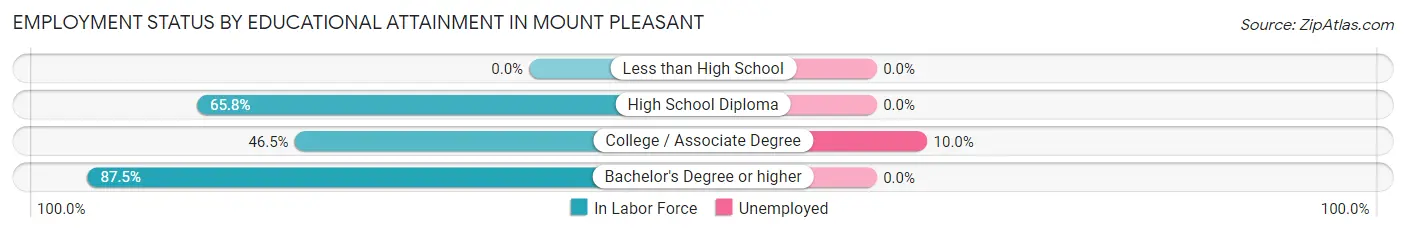
Employment Status by Educational Attainment in Mount Pleasant
According to labor force statistics for Mount Pleasant, 35.9% of individuals (52) out of the total population between 25 and 64 years of age (145) are in the labor force, with 3.8% or 2 of them being unemployed. The group with the highest labor force participation rate are those with the educational attainment of bachelor's degree or higher, with 87.5% or 7 individuals in the labor force. Within the labor force, individuals with college / associate degree education have the highest percentage of unemployment, with 10.0% or 2 of them being unemployed.
| Educational Attainment | In Labor Force | Unemployed |
| Less than High School | 0 (0.0%) | 0 (0.0%) |
| High School Diploma | 25 (65.8%) | 0 (0.0%) |
| College / Associate Degree | 20 (46.5%) | 4 (10.0%) |
| Bachelor's Degree or higher | 7 (87.5%) | 0 (0.0%) |
| Total | 52 (35.9%) | 6 (3.8%) |
Employment Occupations by Sex in Mount Pleasant
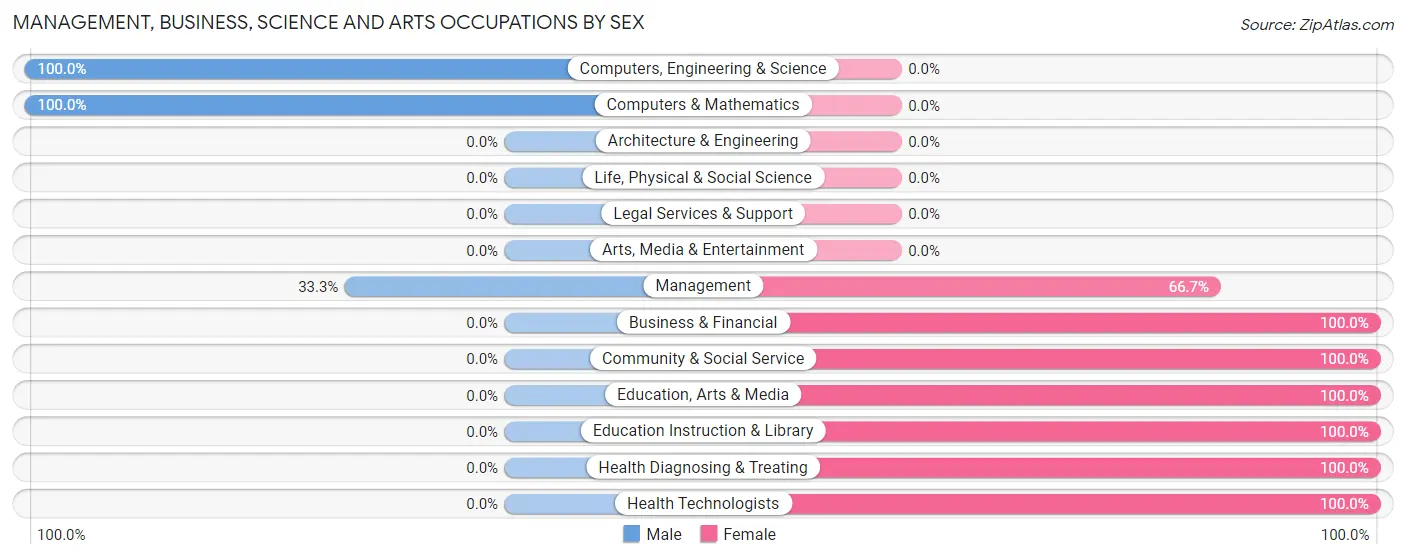
Management, Business, Science and Arts Occupations
The most common Management, Business, Science and Arts occupations in Mount Pleasant are Health Diagnosing & Treating (6 | 9.0%), Health Technologists (6 | 9.0%), Management (3 | 4.5%), Computers, Engineering & Science (3 | 4.5%), and Computers & Mathematics (3 | 4.5%).
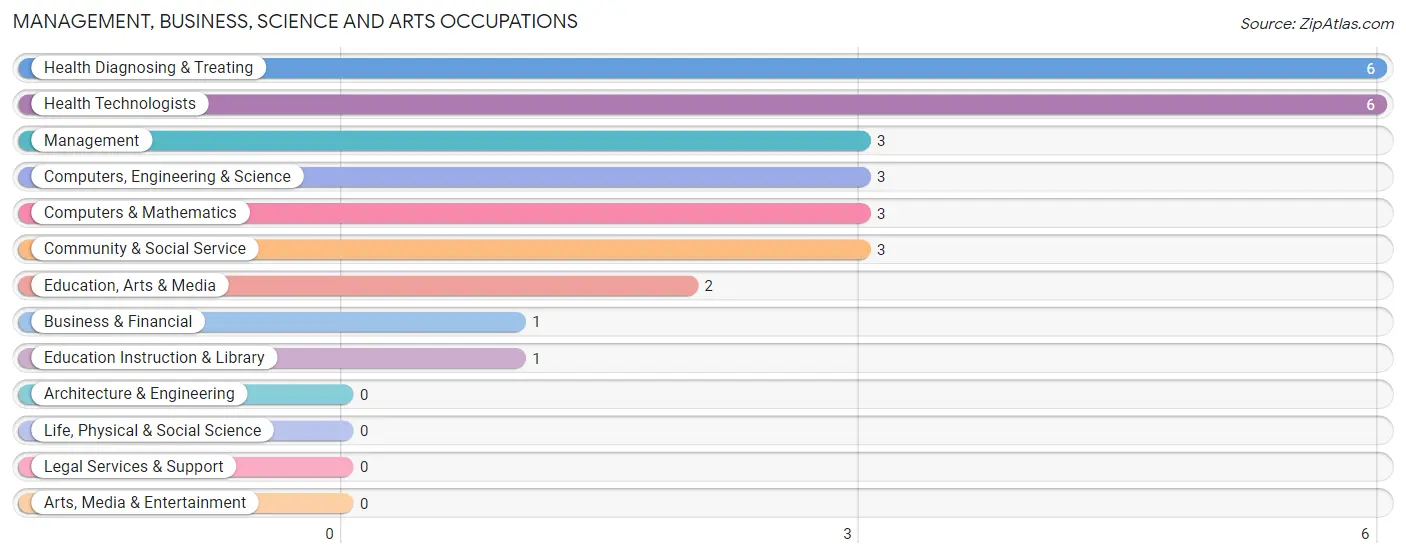
Management, Business, Science and Arts Occupations by Sex
Within the Management, Business, Science and Arts occupations in Mount Pleasant, the most male-oriented occupations are Computers, Engineering & Science (100.0%), Computers & Mathematics (100.0%), and Management (33.3%), while the most female-oriented occupations are Business & Financial (100.0%), Community & Social Service (100.0%), and Education, Arts & Media (100.0%).
| Occupation | Male | Female |
| Management | 1 (33.3%) | 2 (66.7%) |
| Business & Financial | 0 (0.0%) | 1 (100.0%) |
| Computers, Engineering & Science | 3 (100.0%) | 0 (0.0%) |
| Computers & Mathematics | 3 (100.0%) | 0 (0.0%) |
| Architecture & Engineering | 0 (0.0%) | 0 (0.0%) |
| Life, Physical & Social Science | 0 (0.0%) | 0 (0.0%) |
| Community & Social Service | 0 (0.0%) | 3 (100.0%) |
| Education, Arts & Media | 0 (0.0%) | 2 (100.0%) |
| Legal Services & Support | 0 (0.0%) | 0 (0.0%) |
| Education Instruction & Library | 0 (0.0%) | 1 (100.0%) |
| Arts, Media & Entertainment | 0 (0.0%) | 0 (0.0%) |
| Health Diagnosing & Treating | 0 (0.0%) | 6 (100.0%) |
| Health Technologists | 0 (0.0%) | 6 (100.0%) |
| Total (Category) | 4 (25.0%) | 12 (75.0%) |
| Total (Overall) | 42 (62.7%) | 25 (37.3%) |
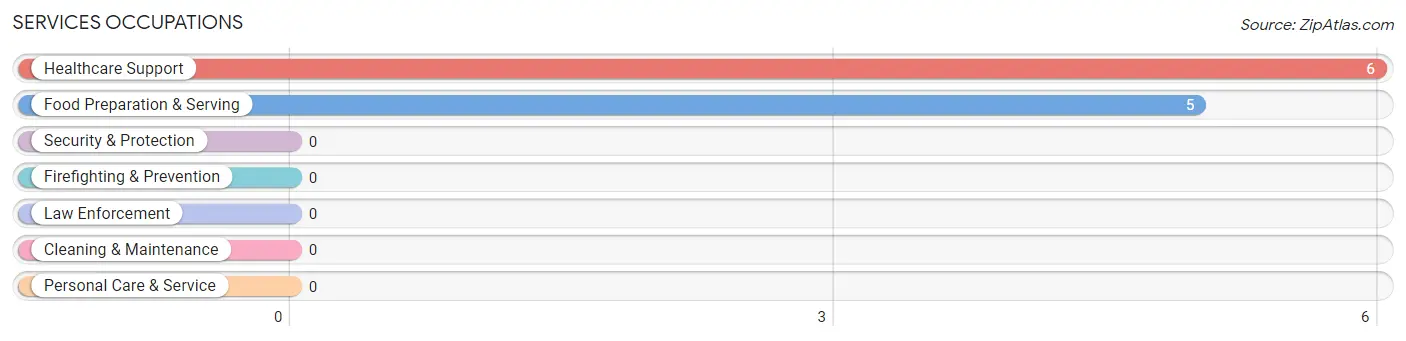
Services Occupations
The most common Services occupations in Mount Pleasant are Healthcare Support (6 | 9.0%), and Food Preparation & Serving (5 | 7.5%).
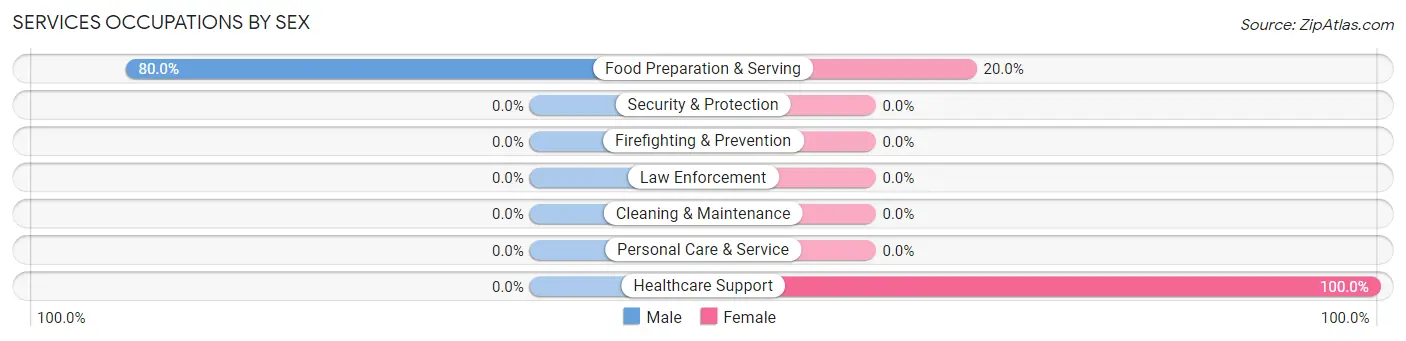
Services Occupations by Sex
| Occupation | Male | Female |
| Healthcare Support | 0 (0.0%) | 6 (100.0%) |
| Security & Protection | 0 (0.0%) | 0 (0.0%) |
| Firefighting & Prevention | 0 (0.0%) | 0 (0.0%) |
| Law Enforcement | 0 (0.0%) | 0 (0.0%) |
| Food Preparation & Serving | 4 (80.0%) | 1 (20.0%) |
| Cleaning & Maintenance | 0 (0.0%) | 0 (0.0%) |
| Personal Care & Service | 0 (0.0%) | 0 (0.0%) |
| Total (Category) | 4 (36.4%) | 7 (63.6%) |
| Total (Overall) | 42 (62.7%) | 25 (37.3%) |
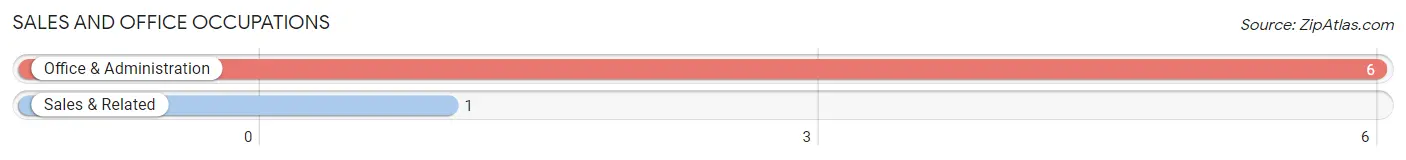
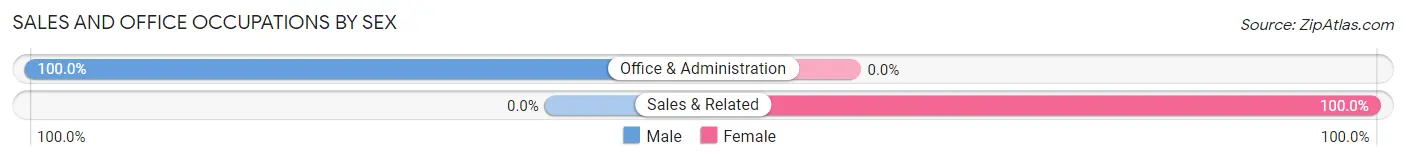
Sales and Office Occupations
The most common Sales and Office occupations in Mount Pleasant are Office & Administration (6 | 9.0%), and Sales & Related (1 | 1.5%).
Sales and Office Occupations by Sex
| Occupation | Male | Female |
| Sales & Related | 0 (0.0%) | 1 (100.0%) |
| Office & Administration | 6 (100.0%) | 0 (0.0%) |
| Total (Category) | 6 (85.7%) | 1 (14.3%) |
| Total (Overall) | 42 (62.7%) | 25 (37.3%) |
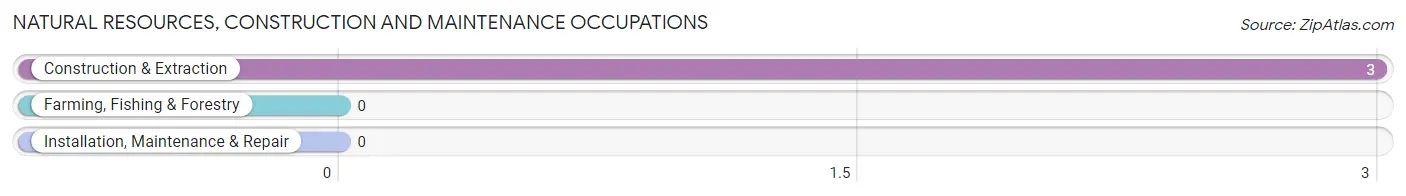
Natural Resources, Construction and Maintenance Occupations
The most common Natural Resources, Construction and Maintenance occupations in Mount Pleasant are , and Construction & Extraction (3 | 4.5%).
Natural Resources, Construction and Maintenance Occupations by Sex
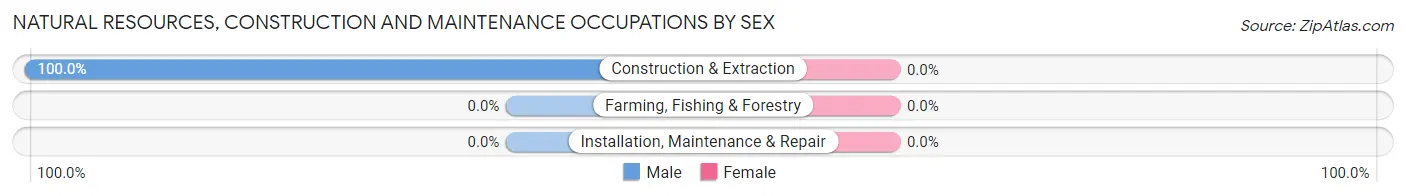
| Occupation | Male | Female |
| Farming, Fishing & Forestry | 0 (0.0%) | 0 (0.0%) |
| Construction & Extraction | 3 (100.0%) | 0 (0.0%) |
| Installation, Maintenance & Repair | 0 (0.0%) | 0 (0.0%) |
| Total (Category) | 3 (100.0%) | 0 (0.0%) |
| Total (Overall) | 42 (62.7%) | 25 (37.3%) |
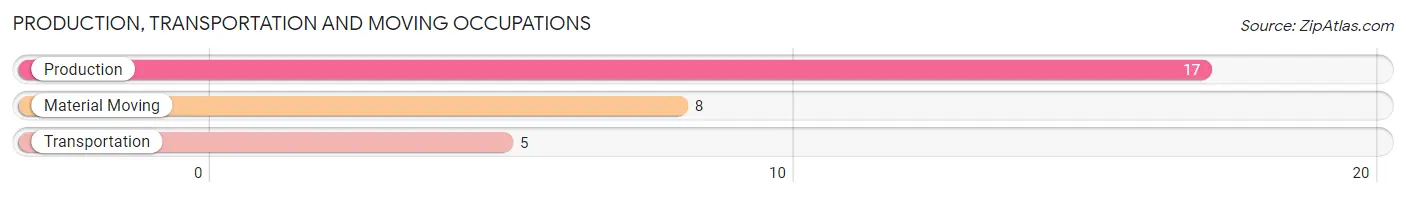
Production, Transportation and Moving Occupations
The most common Production, Transportation and Moving occupations in Mount Pleasant are Production (17 | 25.4%), Material Moving (8 | 11.9%), and Transportation (5 | 7.5%).
Production, Transportation and Moving Occupations by Sex
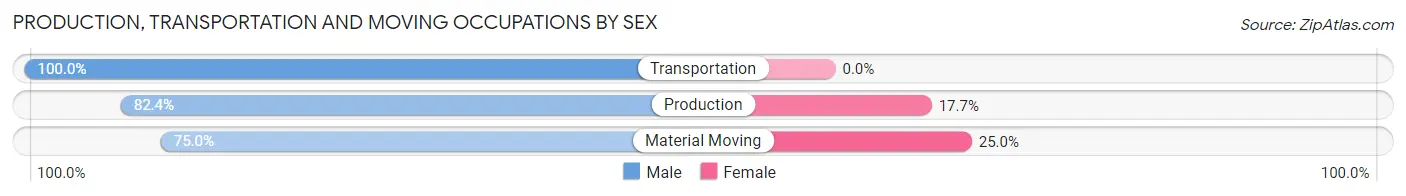
| Occupation | Male | Female |
| Production | 14 (82.4%) | 3 (17.6%) |
| Transportation | 5 (100.0%) | 0 (0.0%) |
| Material Moving | 6 (75.0%) | 2 (25.0%) |
| Total (Category) | 25 (83.3%) | 5 (16.7%) |
| Total (Overall) | 42 (62.7%) | 25 (37.3%) |
Employment Industries by Sex in Mount Pleasant
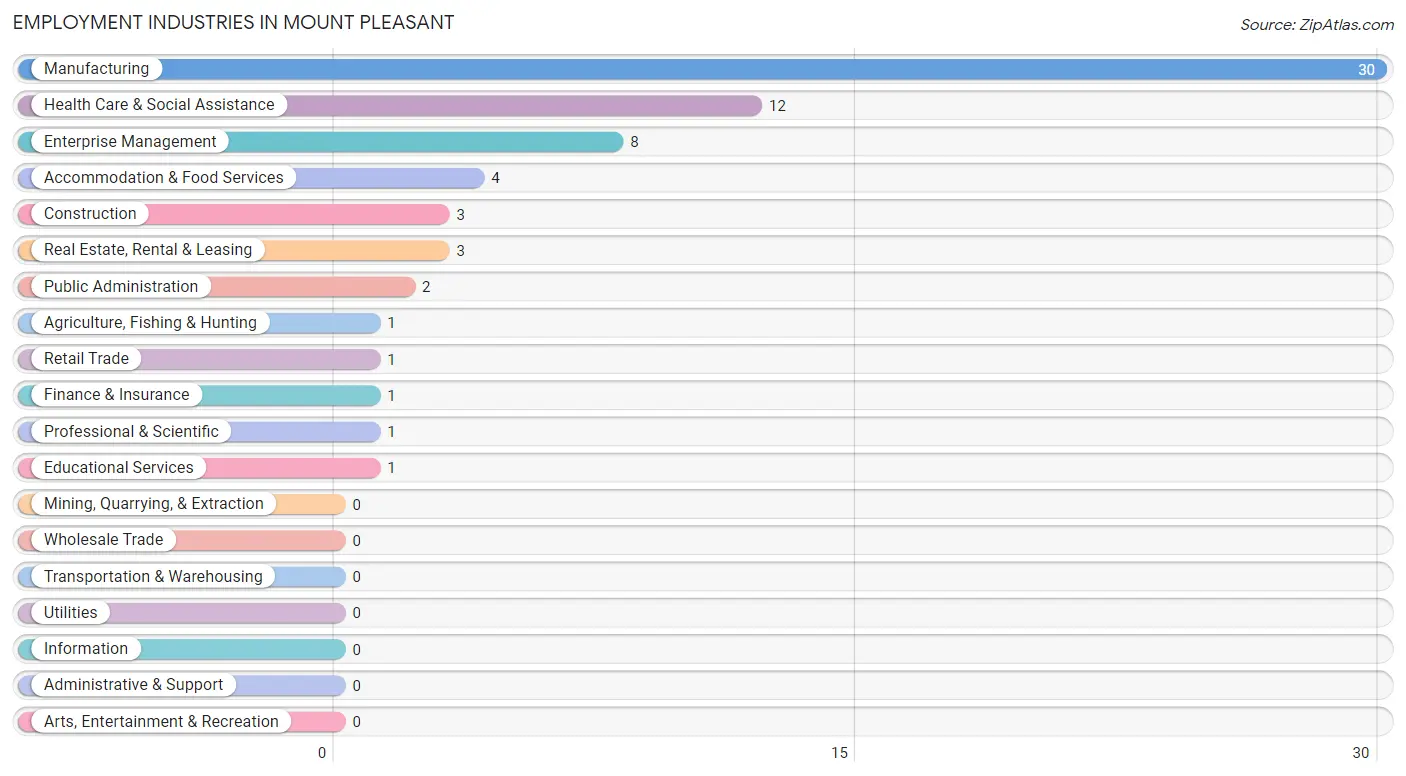
Employment Industries in Mount Pleasant
The major employment industries in Mount Pleasant include Manufacturing (30 | 44.8%), Health Care & Social Assistance (12 | 17.9%), Enterprise Management (8 | 11.9%), Accommodation & Food Services (4 | 6.0%), and Construction (3 | 4.5%).
Employment Industries by Sex in Mount Pleasant
The Mount Pleasant industries that see more men than women are Agriculture, Fishing & Hunting (100.0%), Construction (100.0%), and Real Estate, Rental & Leasing (100.0%), whereas the industries that tend to have a higher number of women are Retail Trade (100.0%), Finance & Insurance (100.0%), and Professional & Scientific (100.0%).
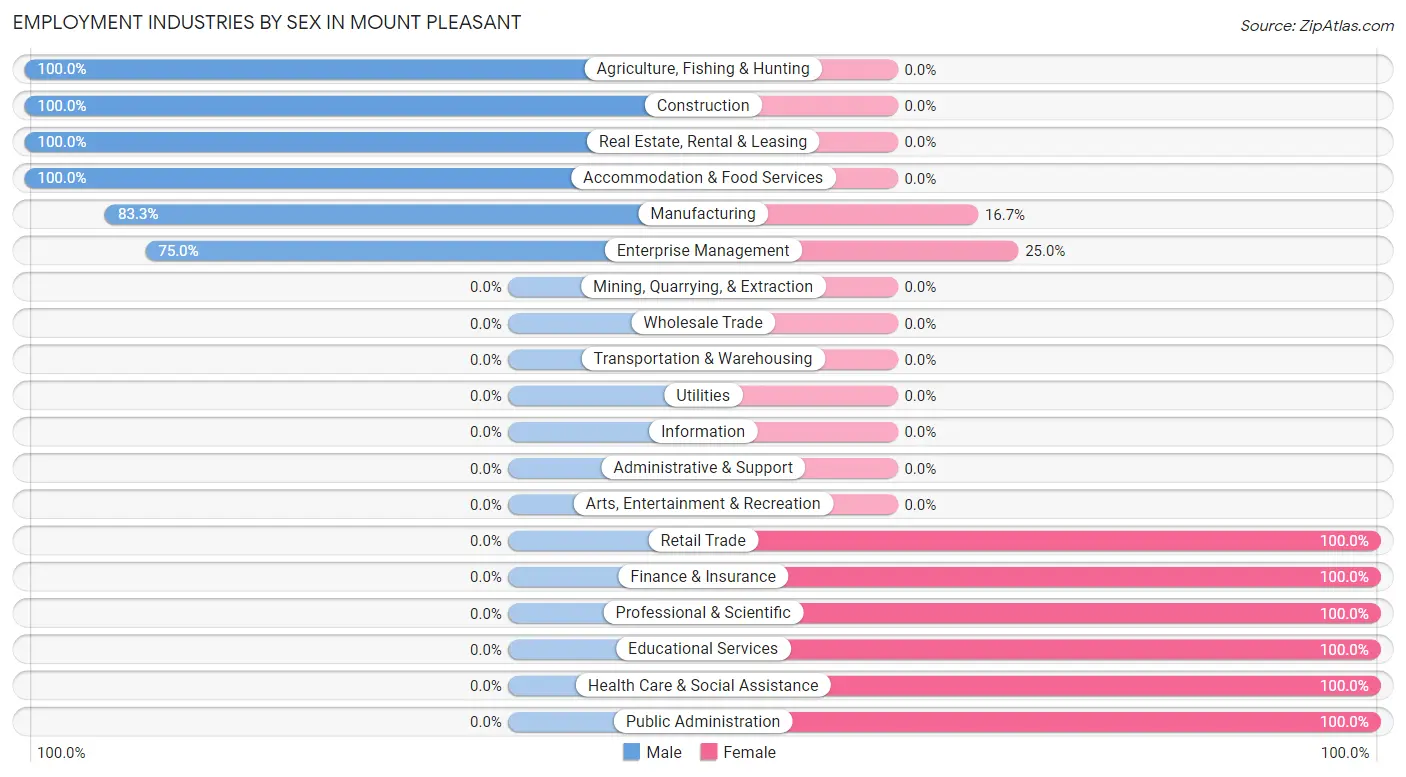
| Industry | Male | Female |
| Agriculture, Fishing & Hunting | 1 (100.0%) | 0 (0.0%) |
| Mining, Quarrying, & Extraction | 0 (0.0%) | 0 (0.0%) |
| Construction | 3 (100.0%) | 0 (0.0%) |
| Manufacturing | 25 (83.3%) | 5 (16.7%) |
| Wholesale Trade | 0 (0.0%) | 0 (0.0%) |
| Retail Trade | 0 (0.0%) | 1 (100.0%) |
| Transportation & Warehousing | 0 (0.0%) | 0 (0.0%) |
| Utilities | 0 (0.0%) | 0 (0.0%) |
| Information | 0 (0.0%) | 0 (0.0%) |
| Finance & Insurance | 0 (0.0%) | 1 (100.0%) |
| Real Estate, Rental & Leasing | 3 (100.0%) | 0 (0.0%) |
| Professional & Scientific | 0 (0.0%) | 1 (100.0%) |
| Enterprise Management | 6 (75.0%) | 2 (25.0%) |
| Administrative & Support | 0 (0.0%) | 0 (0.0%) |
| Educational Services | 0 (0.0%) | 1 (100.0%) |
| Health Care & Social Assistance | 0 (0.0%) | 12 (100.0%) |
| Arts, Entertainment & Recreation | 0 (0.0%) | 0 (0.0%) |
| Accommodation & Food Services | 4 (100.0%) | 0 (0.0%) |
| Public Administration | 0 (0.0%) | 2 (100.0%) |
| Total | 42 (62.7%) | 25 (37.3%) |
Education in Mount Pleasant
School Enrollment in Mount Pleasant
The most common levels of schooling among the 29 students in Mount Pleasant are middle school (10 | 34.5%), high school (6 | 20.7%), and elementary school (5 | 17.2%).
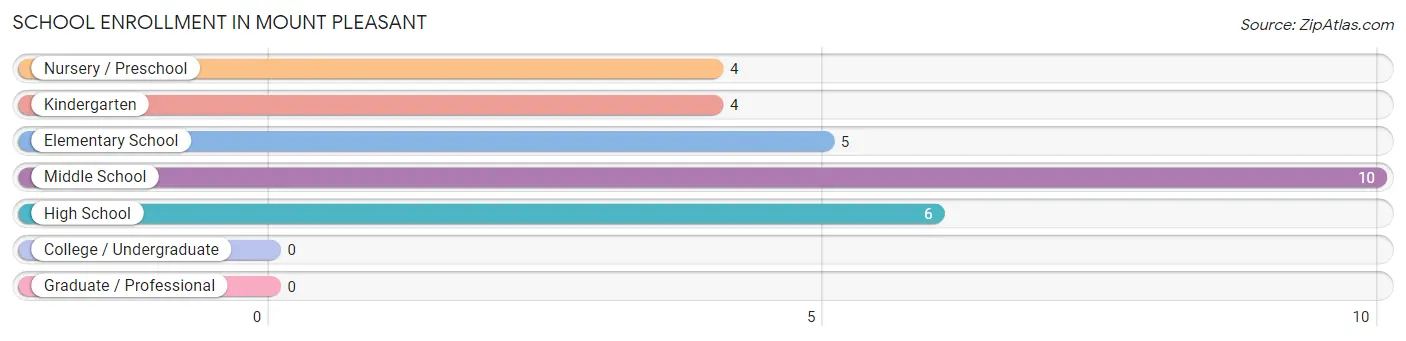
| School Level | # Students | % Students |
| Nursery / Preschool | 4 | 13.8% |
| Kindergarten | 4 | 13.8% |
| Elementary School | 5 | 17.2% |
| Middle School | 10 | 34.5% |
| High School | 6 | 20.7% |
| College / Undergraduate | 0 | 0.0% |
| Graduate / Professional | 0 | 0.0% |
| Total | 29 | 100.0% |
School Enrollment by Age by Funding Source in Mount Pleasant
Out of a total of 29 students who are enrolled in schools in Mount Pleasant, 6 (20.7%) attend a private institution, while the remaining 23 (79.3%) are enrolled in public schools. The age group of 10 to 14 year olds has the highest likelihood of being enrolled in private schools, with 3 (33.3% in the age bracket) enrolled. Conversely, the age group of 15 to 17 year olds has the lowest likelihood of being enrolled in a private school, with 6 (100.0% in the age bracket) attending a public institution.
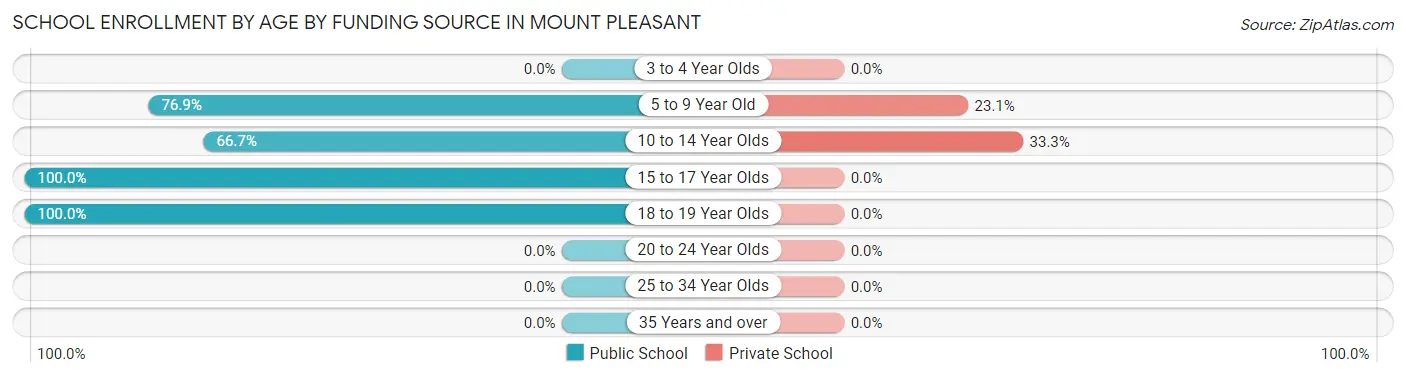
| Age Bracket | Public School | Private School |
| 3 to 4 Year Olds | 0 (0.0%) | 0 (0.0%) |
| 5 to 9 Year Old | 10 (76.9%) | 3 (23.1%) |
| 10 to 14 Year Olds | 6 (66.7%) | 3 (33.3%) |
| 15 to 17 Year Olds | 6 (100.0%) | 0 (0.0%) |
| 18 to 19 Year Olds | 1 (100.0%) | 0 (0.0%) |
| 20 to 24 Year Olds | 0 (0.0%) | 0 (0.0%) |
| 25 to 34 Year Olds | 0 (0.0%) | 0 (0.0%) |
| 35 Years and over | 0 (0.0%) | 0 (0.0%) |
| Total | 23 (79.3%) | 6 (20.7%) |
Educational Attainment by Field of Study in Mount Pleasant
Education (7 | 33.3%), computers & mathematics (5 | 23.8%), business (5 | 23.8%), and engineering (4 | 19.1%) are the most common fields of study among 21 individuals in Mount Pleasant who have obtained a bachelor's degree or higher.
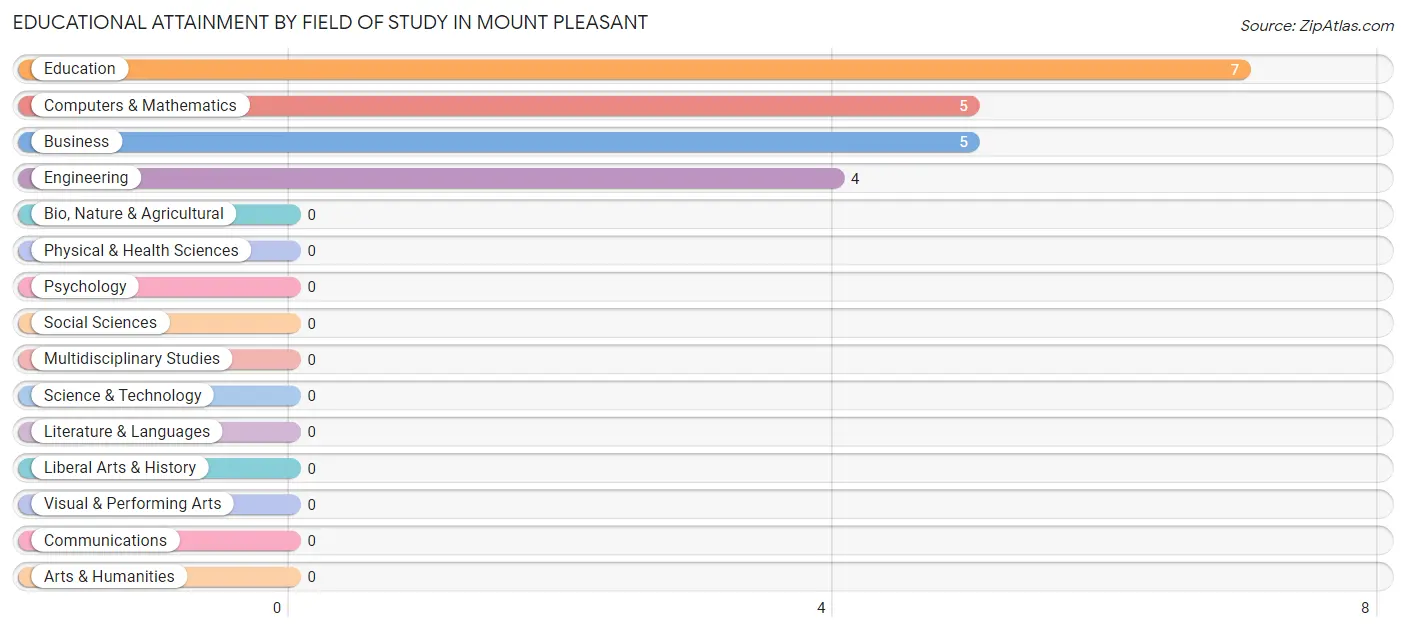
| Field of Study | # Graduates | % Graduates |
| Computers & Mathematics | 5 | 23.8% |
| Bio, Nature & Agricultural | 0 | 0.0% |
| Physical & Health Sciences | 0 | 0.0% |
| Psychology | 0 | 0.0% |
| Social Sciences | 0 | 0.0% |
| Engineering | 4 | 19.1% |
| Multidisciplinary Studies | 0 | 0.0% |
| Science & Technology | 0 | 0.0% |
| Business | 5 | 23.8% |
| Education | 7 | 33.3% |
| Literature & Languages | 0 | 0.0% |
| Liberal Arts & History | 0 | 0.0% |
| Visual & Performing Arts | 0 | 0.0% |
| Communications | 0 | 0.0% |
| Arts & Humanities | 0 | 0.0% |
| Total | 21 | 100.0% |
Transportation & Commute in Mount Pleasant
Vehicle Availability by Sex in Mount Pleasant
The most prevalent vehicle ownership categories in Mount Pleasant are males with 2 vehicles (20, accounting for 47.6%) and females with 2 vehicles (6, making up 80.0%).
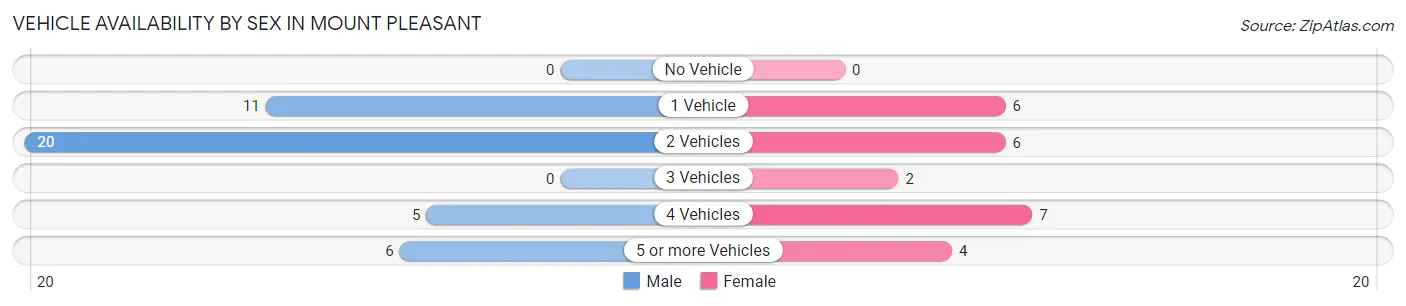
| Vehicles Available | Male | Female |
| No Vehicle | 0 (0.0%) | 0 (0.0%) |
| 1 Vehicle | 11 (26.2%) | 6 (24.0%) |
| 2 Vehicles | 20 (47.6%) | 6 (24.0%) |
| 3 Vehicles | 0 (0.0%) | 2 (8.0%) |
| 4 Vehicles | 5 (11.9%) | 7 (28.0%) |
| 5 or more Vehicles | 6 (14.3%) | 4 (16.0%) |
| Total | 42 (100.0%) | 25 (100.0%) |
Commute Time in Mount Pleasant
The most frequently occuring commute durations in Mount Pleasant are 15 to 19 minutes (15 commuters, 24.6%), 20 to 24 minutes (13 commuters, 21.3%), and 25 to 29 minutes (10 commuters, 16.4%).
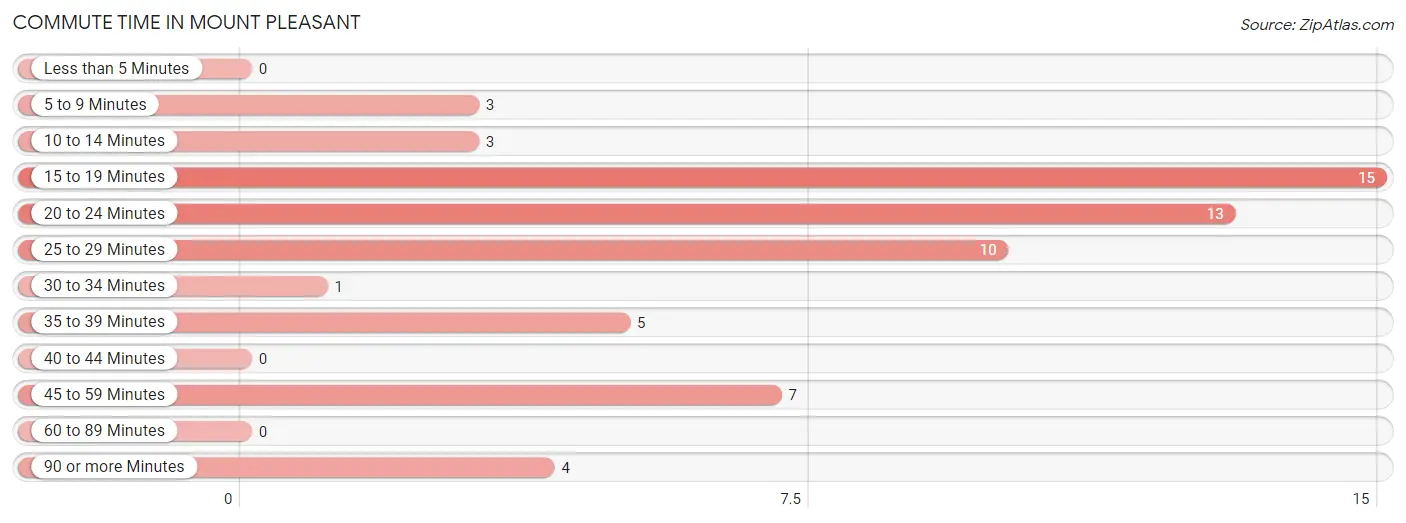
| Commute Time | # Commuters | % Commuters |
| Less than 5 Minutes | 0 | 0.0% |
| 5 to 9 Minutes | 3 | 4.9% |
| 10 to 14 Minutes | 3 | 4.9% |
| 15 to 19 Minutes | 15 | 24.6% |
| 20 to 24 Minutes | 13 | 21.3% |
| 25 to 29 Minutes | 10 | 16.4% |
| 30 to 34 Minutes | 1 | 1.6% |
| 35 to 39 Minutes | 5 | 8.2% |
| 40 to 44 Minutes | 0 | 0.0% |
| 45 to 59 Minutes | 7 | 11.5% |
| 60 to 89 Minutes | 0 | 0.0% |
| 90 or more Minutes | 4 | 6.6% |
Commute Time by Sex in Mount Pleasant
The most common commute times in Mount Pleasant are 20 to 24 minutes (10 commuters, 25.6%) for males and 15 to 19 minutes (6 commuters, 27.3%) for females.
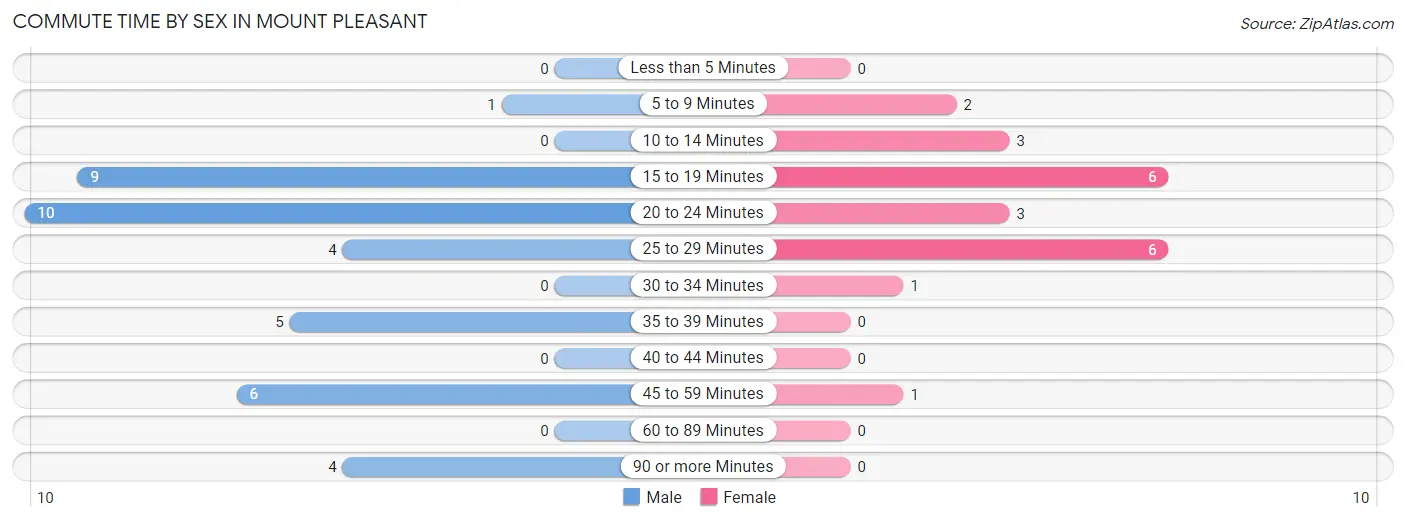
| Commute Time | Male | Female |
| Less than 5 Minutes | 0 (0.0%) | 0 (0.0%) |
| 5 to 9 Minutes | 1 (2.6%) | 2 (9.1%) |
| 10 to 14 Minutes | 0 (0.0%) | 3 (13.6%) |
| 15 to 19 Minutes | 9 (23.1%) | 6 (27.3%) |
| 20 to 24 Minutes | 10 (25.6%) | 3 (13.6%) |
| 25 to 29 Minutes | 4 (10.3%) | 6 (27.3%) |
| 30 to 34 Minutes | 0 (0.0%) | 1 (4.5%) |
| 35 to 39 Minutes | 5 (12.8%) | 0 (0.0%) |
| 40 to 44 Minutes | 0 (0.0%) | 0 (0.0%) |
| 45 to 59 Minutes | 6 (15.4%) | 1 (4.5%) |
| 60 to 89 Minutes | 0 (0.0%) | 0 (0.0%) |
| 90 or more Minutes | 4 (10.3%) | 0 (0.0%) |
Time of Departure to Work by Sex in Mount Pleasant
The most frequent times of departure to work in Mount Pleasant are 12:00 AM to 4:59 AM (11, 28.2%) for males and 12:00 AM to 4:59 AM (6, 27.3%) for females.
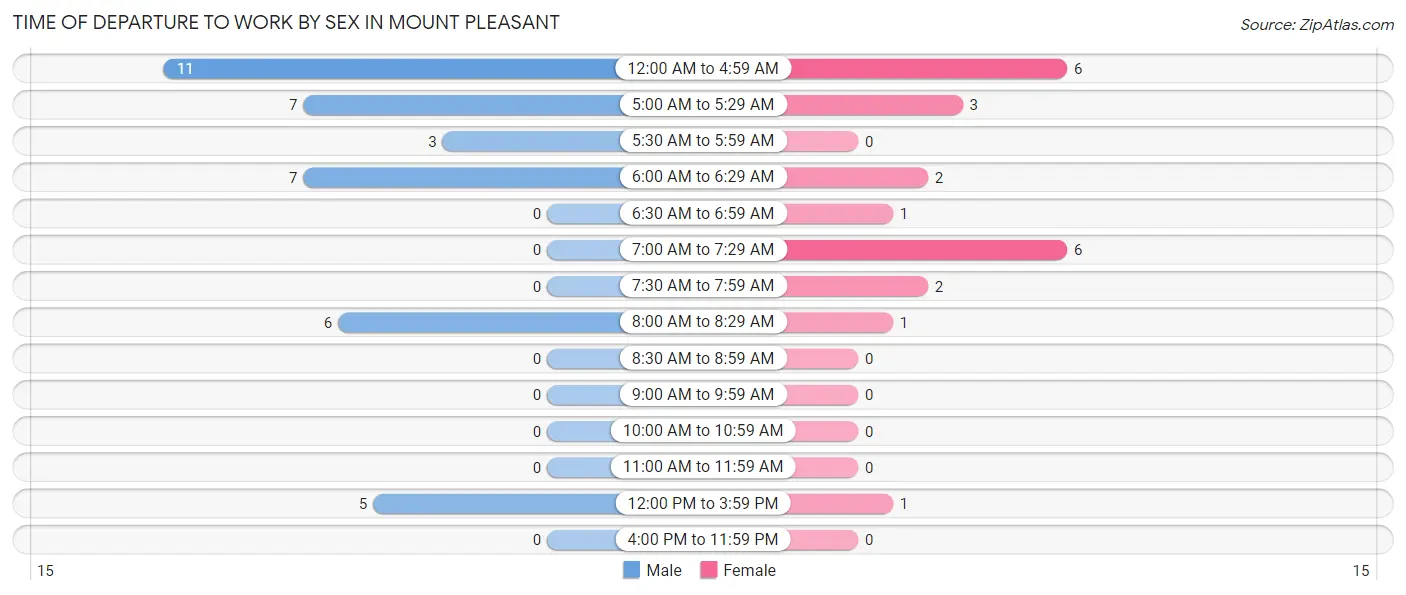
| Time of Departure | Male | Female |
| 12:00 AM to 4:59 AM | 11 (28.2%) | 6 (27.3%) |
| 5:00 AM to 5:29 AM | 7 (17.9%) | 3 (13.6%) |
| 5:30 AM to 5:59 AM | 3 (7.7%) | 0 (0.0%) |
| 6:00 AM to 6:29 AM | 7 (17.9%) | 2 (9.1%) |
| 6:30 AM to 6:59 AM | 0 (0.0%) | 1 (4.5%) |
| 7:00 AM to 7:29 AM | 0 (0.0%) | 6 (27.3%) |
| 7:30 AM to 7:59 AM | 0 (0.0%) | 2 (9.1%) |
| 8:00 AM to 8:29 AM | 6 (15.4%) | 1 (4.5%) |
| 8:30 AM to 8:59 AM | 0 (0.0%) | 0 (0.0%) |
| 9:00 AM to 9:59 AM | 0 (0.0%) | 0 (0.0%) |
| 10:00 AM to 10:59 AM | 0 (0.0%) | 0 (0.0%) |
| 11:00 AM to 11:59 AM | 0 (0.0%) | 0 (0.0%) |
| 12:00 PM to 3:59 PM | 5 (12.8%) | 1 (4.5%) |
| 4:00 PM to 11:59 PM | 0 (0.0%) | 0 (0.0%) |
| Total | 39 (100.0%) | 22 (100.0%) |
Housing Occupancy in Mount Pleasant
Occupancy by Ownership in Mount Pleasant
Of the total 105 dwellings in Mount Pleasant, owner-occupied units account for 72 (68.6%), while renter-occupied units make up 33 (31.4%).
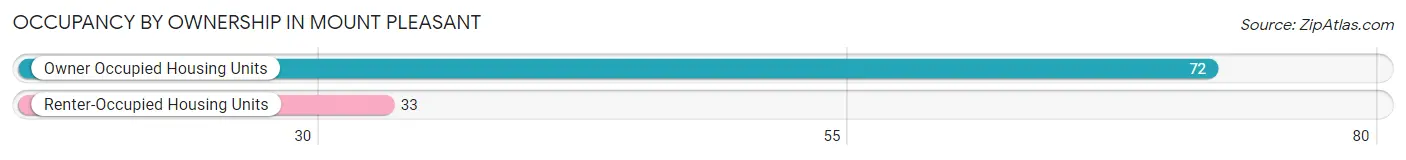
| Occupancy | # Housing Units | % Housing Units |
| Owner Occupied Housing Units | 72 | 68.6% |
| Renter-Occupied Housing Units | 33 | 31.4% |
| Total Occupied Housing Units | 105 | 100.0% |
Occupancy by Household Size in Mount Pleasant
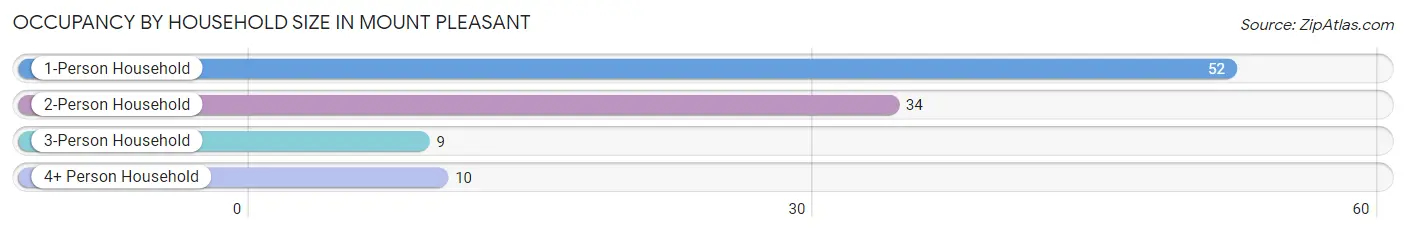
| Household Size | # Housing Units | % Housing Units |
| 1-Person Household | 52 | 49.5% |
| 2-Person Household | 34 | 32.4% |
| 3-Person Household | 9 | 8.6% |
| 4+ Person Household | 10 | 9.5% |
| Total Housing Units | 105 | 100.0% |
Occupancy by Ownership by Household Size in Mount Pleasant
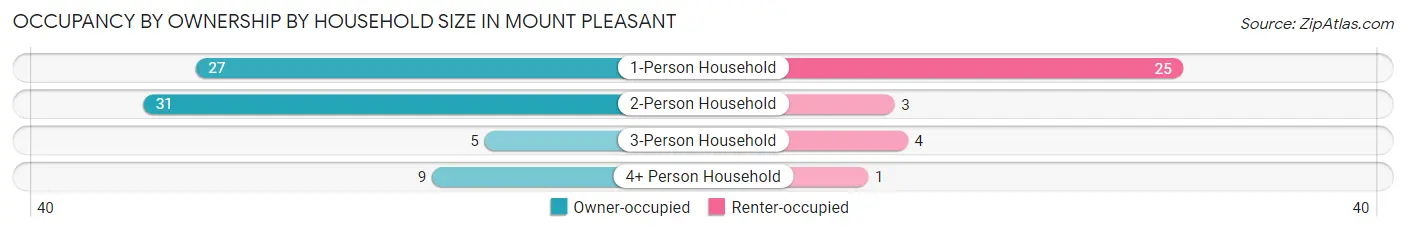
| Household Size | Owner-occupied | Renter-occupied |
| 1-Person Household | 27 (51.9%) | 25 (48.1%) |
| 2-Person Household | 31 (91.2%) | 3 (8.8%) |
| 3-Person Household | 5 (55.6%) | 4 (44.4%) |
| 4+ Person Household | 9 (90.0%) | 1 (10.0%) |
| Total Housing Units | 72 (68.6%) | 33 (31.4%) |
Occupancy by Educational Attainment in Mount Pleasant
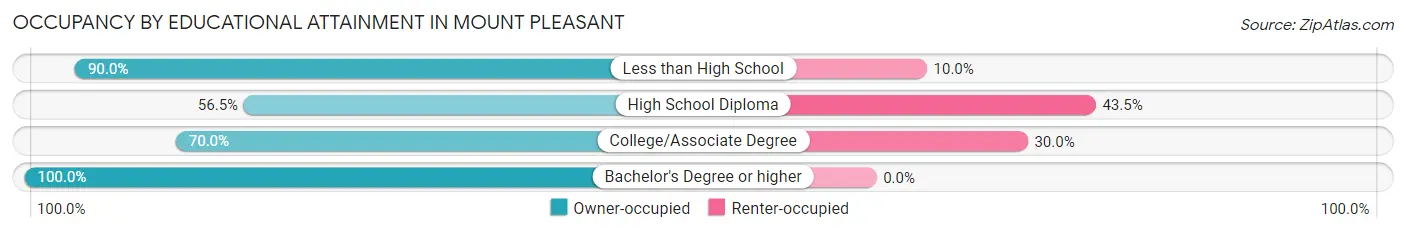
| Household Size | Owner-occupied | Renter-occupied |
| Less than High School | 9 (90.0%) | 1 (10.0%) |
| High School Diploma | 26 (56.5%) | 20 (43.5%) |
| College/Associate Degree | 28 (70.0%) | 12 (30.0%) |
| Bachelor's Degree or higher | 9 (100.0%) | 0 (0.0%) |
Occupancy by Age of Householder in Mount Pleasant
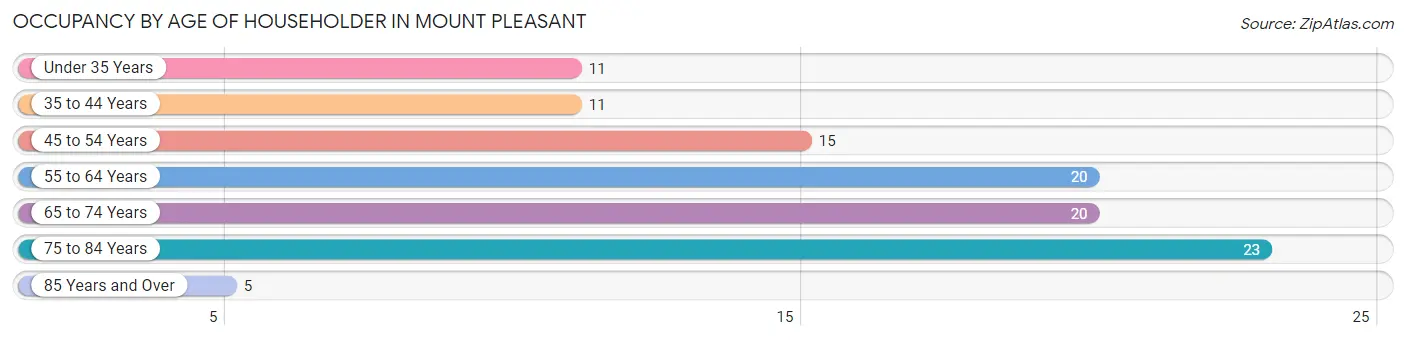
| Age Bracket | # Households | % Households |
| Under 35 Years | 11 | 10.5% |
| 35 to 44 Years | 11 | 10.5% |
| 45 to 54 Years | 15 | 14.3% |
| 55 to 64 Years | 20 | 19.1% |
| 65 to 74 Years | 20 | 19.1% |
| 75 to 84 Years | 23 | 21.9% |
| 85 Years and Over | 5 | 4.8% |
| Total | 105 | 100.0% |
Housing Finances in Mount Pleasant
Median Income by Occupancy in Mount Pleasant
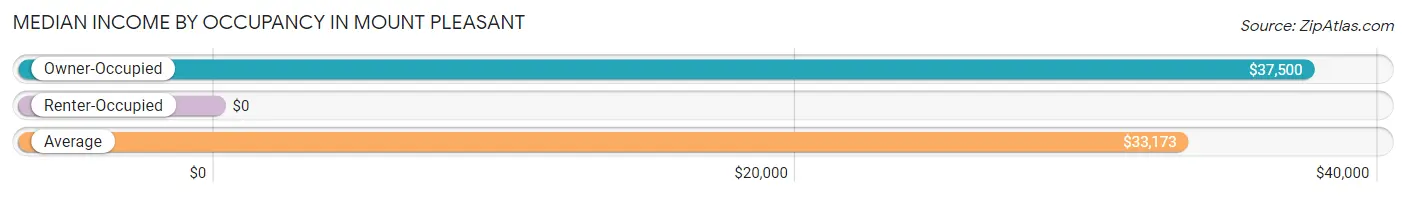
| Occupancy Type | # Households | Median Income |
| Owner-Occupied | 72 (68.6%) | $37,500 |
| Renter-Occupied | 33 (31.4%) | $0 |
| Average | 105 (100.0%) | $33,173 |
Occupancy by Householder Income Bracket in Mount Pleasant
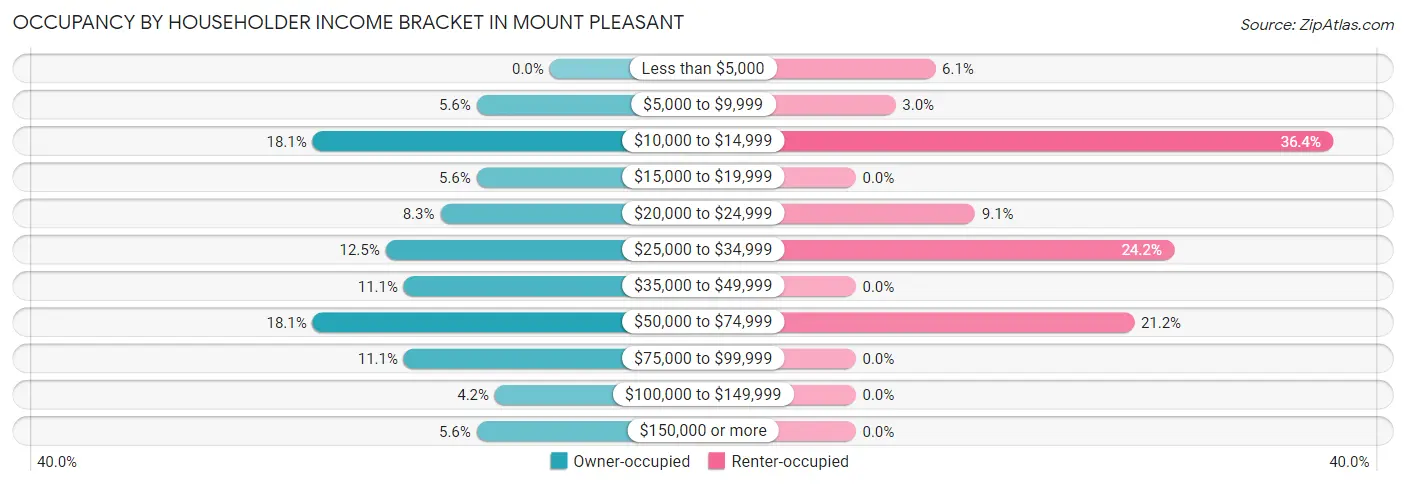
| Income Bracket | Owner-occupied | Renter-occupied |
| Less than $5,000 | 0 (0.0%) | 2 (6.1%) |
| $5,000 to $9,999 | 4 (5.6%) | 1 (3.0%) |
| $10,000 to $14,999 | 13 (18.1%) | 12 (36.4%) |
| $15,000 to $19,999 | 4 (5.6%) | 0 (0.0%) |
| $20,000 to $24,999 | 6 (8.3%) | 3 (9.1%) |
| $25,000 to $34,999 | 9 (12.5%) | 8 (24.2%) |
| $35,000 to $49,999 | 8 (11.1%) | 0 (0.0%) |
| $50,000 to $74,999 | 13 (18.1%) | 7 (21.2%) |
| $75,000 to $99,999 | 8 (11.1%) | 0 (0.0%) |
| $100,000 to $149,999 | 3 (4.2%) | 0 (0.0%) |
| $150,000 or more | 4 (5.6%) | 0 (0.0%) |
| Total | 72 (100.0%) | 33 (100.0%) |
Monthly Housing Cost Tiers in Mount Pleasant
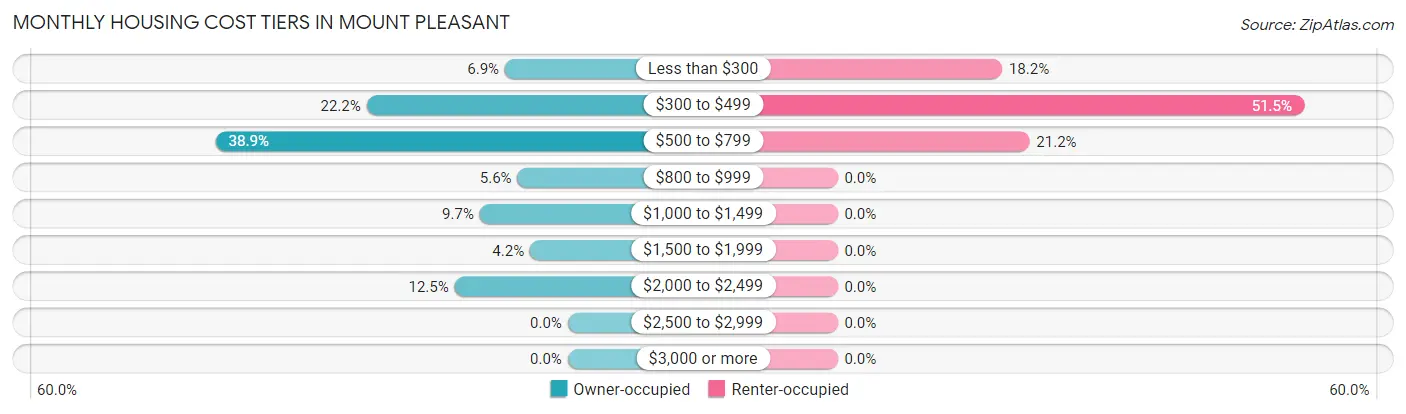
| Monthly Cost | Owner-occupied | Renter-occupied |
| Less than $300 | 5 (6.9%) | 6 (18.2%) |
| $300 to $499 | 16 (22.2%) | 17 (51.5%) |
| $500 to $799 | 28 (38.9%) | 7 (21.2%) |
| $800 to $999 | 4 (5.6%) | 0 (0.0%) |
| $1,000 to $1,499 | 7 (9.7%) | 0 (0.0%) |
| $1,500 to $1,999 | 3 (4.2%) | 0 (0.0%) |
| $2,000 to $2,499 | 9 (12.5%) | 0 (0.0%) |
| $2,500 to $2,999 | 0 (0.0%) | 0 (0.0%) |
| $3,000 or more | 0 (0.0%) | 0 (0.0%) |
| Total | 72 (100.0%) | 33 (100.0%) |
Physical Housing Characteristics in Mount Pleasant
Housing Structures in Mount Pleasant
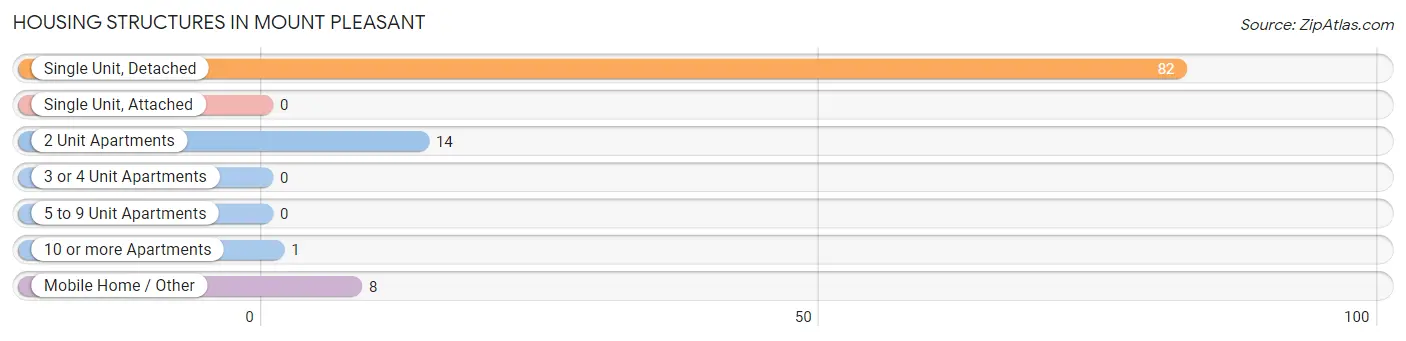
| Structure Type | # Housing Units | % Housing Units |
| Single Unit, Detached | 82 | 78.1% |
| Single Unit, Attached | 0 | 0.0% |
| 2 Unit Apartments | 14 | 13.3% |
| 3 or 4 Unit Apartments | 0 | 0.0% |
| 5 to 9 Unit Apartments | 0 | 0.0% |
| 10 or more Apartments | 1 | 0.9% |
| Mobile Home / Other | 8 | 7.6% |
| Total | 105 | 100.0% |
Housing Structures by Occupancy in Mount Pleasant
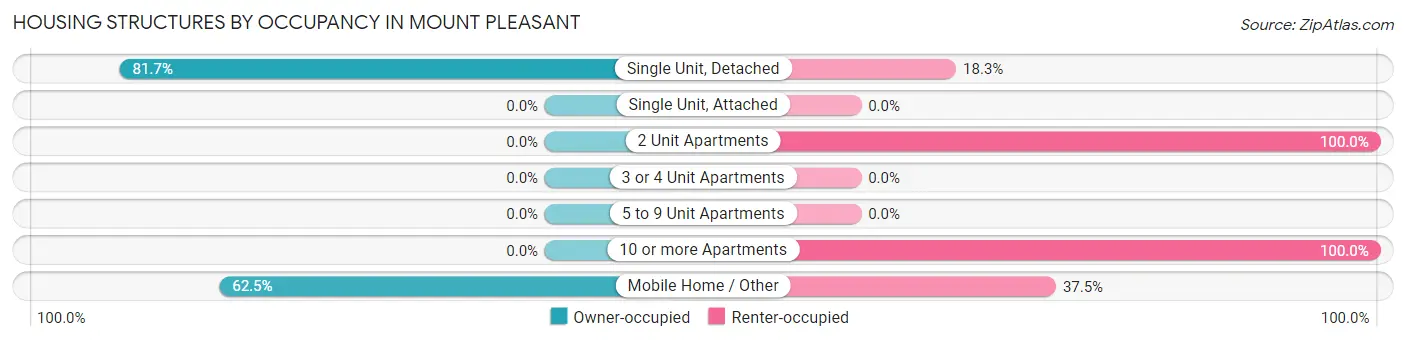
| Structure Type | Owner-occupied | Renter-occupied |
| Single Unit, Detached | 67 (81.7%) | 15 (18.3%) |
| Single Unit, Attached | 0 (0.0%) | 0 (0.0%) |
| 2 Unit Apartments | 0 (0.0%) | 14 (100.0%) |
| 3 or 4 Unit Apartments | 0 (0.0%) | 0 (0.0%) |
| 5 to 9 Unit Apartments | 0 (0.0%) | 0 (0.0%) |
| 10 or more Apartments | 0 (0.0%) | 1 (100.0%) |
| Mobile Home / Other | 5 (62.5%) | 3 (37.5%) |
| Total | 72 (68.6%) | 33 (31.4%) |
Housing Structures by Number of Rooms in Mount Pleasant
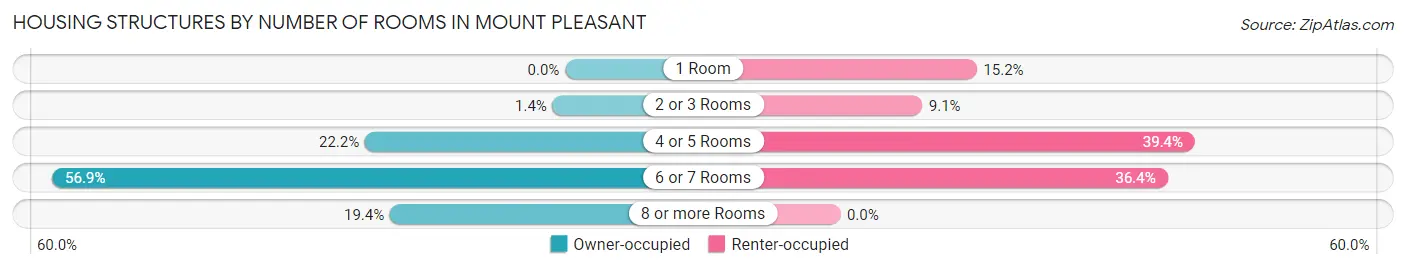
| Number of Rooms | Owner-occupied | Renter-occupied |
| 1 Room | 0 (0.0%) | 5 (15.1%) |
| 2 or 3 Rooms | 1 (1.4%) | 3 (9.1%) |
| 4 or 5 Rooms | 16 (22.2%) | 13 (39.4%) |
| 6 or 7 Rooms | 41 (56.9%) | 12 (36.4%) |
| 8 or more Rooms | 14 (19.4%) | 0 (0.0%) |
| Total | 72 (100.0%) | 33 (100.0%) |
Housing Structure by Heating Type in Mount Pleasant
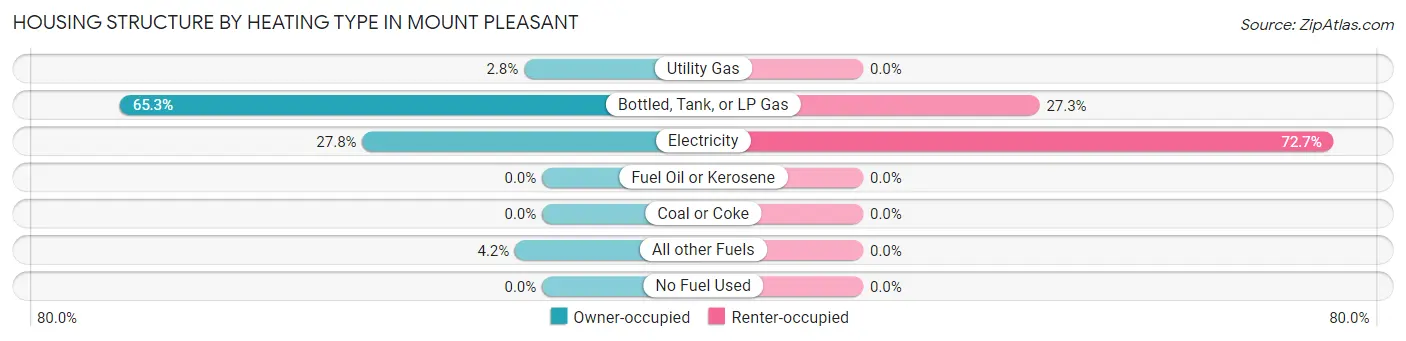
| Heating Type | Owner-occupied | Renter-occupied |
| Utility Gas | 2 (2.8%) | 0 (0.0%) |
| Bottled, Tank, or LP Gas | 47 (65.3%) | 9 (27.3%) |
| Electricity | 20 (27.8%) | 24 (72.7%) |
| Fuel Oil or Kerosene | 0 (0.0%) | 0 (0.0%) |
| Coal or Coke | 0 (0.0%) | 0 (0.0%) |
| All other Fuels | 3 (4.2%) | 0 (0.0%) |
| No Fuel Used | 0 (0.0%) | 0 (0.0%) |
| Total | 72 (100.0%) | 33 (100.0%) |
Household Vehicle Usage in Mount Pleasant
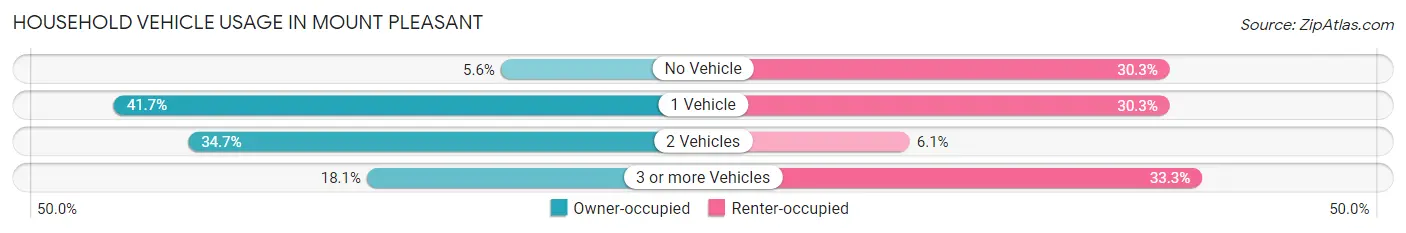
| Vehicles per Household | Owner-occupied | Renter-occupied |
| No Vehicle | 4 (5.6%) | 10 (30.3%) |
| 1 Vehicle | 30 (41.7%) | 10 (30.3%) |
| 2 Vehicles | 25 (34.7%) | 2 (6.1%) |
| 3 or more Vehicles | 13 (18.1%) | 11 (33.3%) |
| Total | 72 (100.0%) | 33 (100.0%) |
Real Estate & Mortgages in Mount Pleasant
Real Estate and Mortgage Overview in Mount Pleasant
| Characteristic | Without Mortgage | With Mortgage |
| Housing Units | 34 | 38 |
| Median Property Value | $116,700 | $0 |
| Median Household Income | $27,500 | $4 |
| Monthly Housing Costs | $420 | $0 |
| Real Estate Taxes | $478 | $5 |
Property Value by Mortgage Status in Mount Pleasant
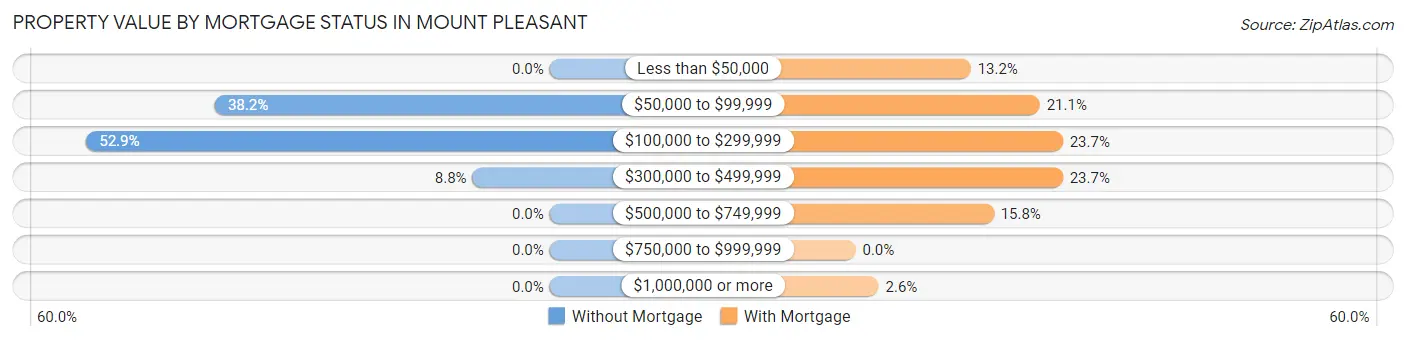
| Property Value | Without Mortgage | With Mortgage |
| Less than $50,000 | 0 (0.0%) | 5 (13.2%) |
| $50,000 to $99,999 | 13 (38.2%) | 8 (21.0%) |
| $100,000 to $299,999 | 18 (52.9%) | 9 (23.7%) |
| $300,000 to $499,999 | 3 (8.8%) | 9 (23.7%) |
| $500,000 to $749,999 | 0 (0.0%) | 6 (15.8%) |
| $750,000 to $999,999 | 0 (0.0%) | 0 (0.0%) |
| $1,000,000 or more | 0 (0.0%) | 1 (2.6%) |
| Total | 34 (100.0%) | 38 (100.0%) |
Household Income by Mortgage Status in Mount Pleasant
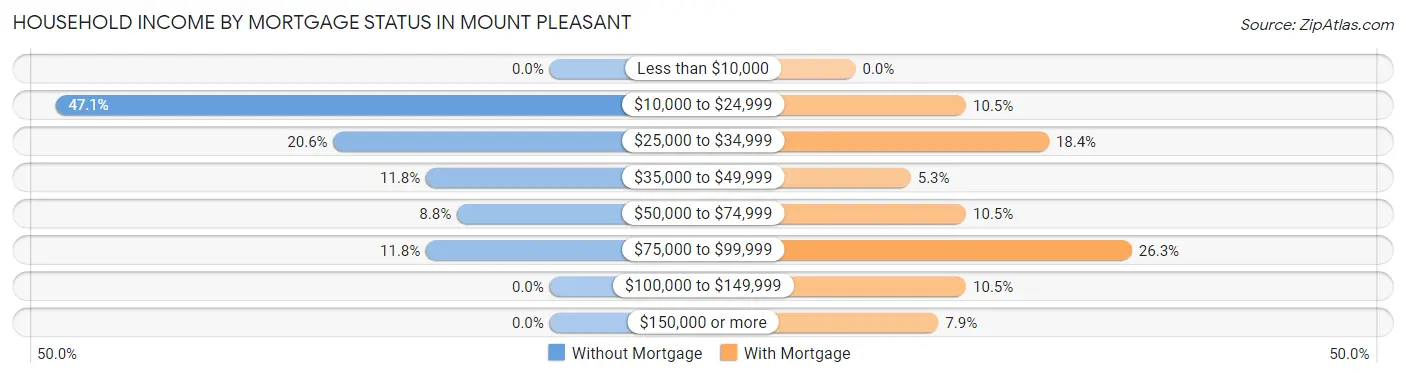
| Household Income | Without Mortgage | With Mortgage |
| Less than $10,000 | 0 (0.0%) | 0 (0.0%) |
| $10,000 to $24,999 | 16 (47.1%) | 4 (10.5%) |
| $25,000 to $34,999 | 7 (20.6%) | 7 (18.4%) |
| $35,000 to $49,999 | 4 (11.8%) | 2 (5.3%) |
| $50,000 to $74,999 | 3 (8.8%) | 4 (10.5%) |
| $75,000 to $99,999 | 4 (11.8%) | 10 (26.3%) |
| $100,000 to $149,999 | 0 (0.0%) | 4 (10.5%) |
| $150,000 or more | 0 (0.0%) | 3 (7.9%) |
| Total | 34 (100.0%) | 38 (100.0%) |
Property Value to Household Income Ratio in Mount Pleasant
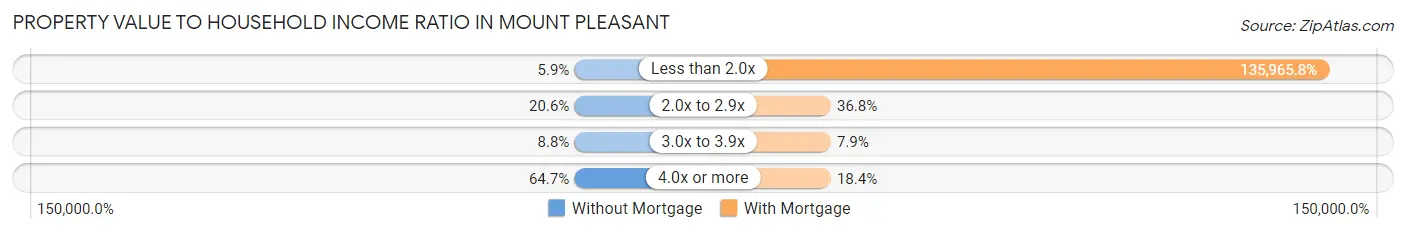
| Value-to-Income Ratio | Without Mortgage | With Mortgage |
| Less than 2.0x | 2 (5.9%) | 51,667 (135,965.8%) |
| 2.0x to 2.9x | 7 (20.6%) | 14 (36.8%) |
| 3.0x to 3.9x | 3 (8.8%) | 3 (7.9%) |
| 4.0x or more | 22 (64.7%) | 7 (18.4%) |
| Total | 34 (100.0%) | 38 (100.0%) |
Real Estate Taxes by Mortgage Status in Mount Pleasant
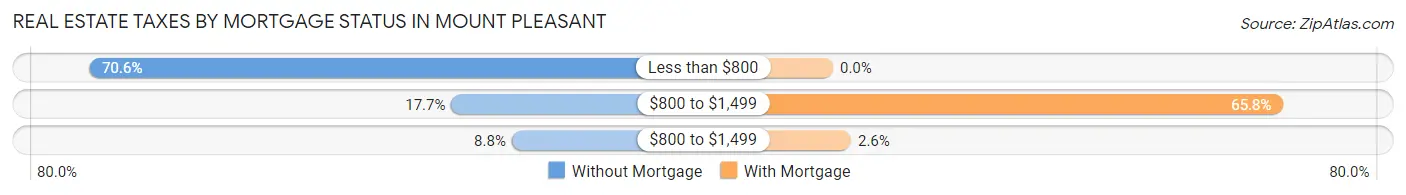
| Property Taxes | Without Mortgage | With Mortgage |
| Less than $800 | 24 (70.6%) | 0 (0.0%) |
| $800 to $1,499 | 6 (17.6%) | 25 (65.8%) |
| $800 to $1,499 | 3 (8.8%) | 1 (2.6%) |
| Total | 34 (100.0%) | 38 (100.0%) |
Health & Disability in Mount Pleasant
Health Insurance Coverage by Age in Mount Pleasant
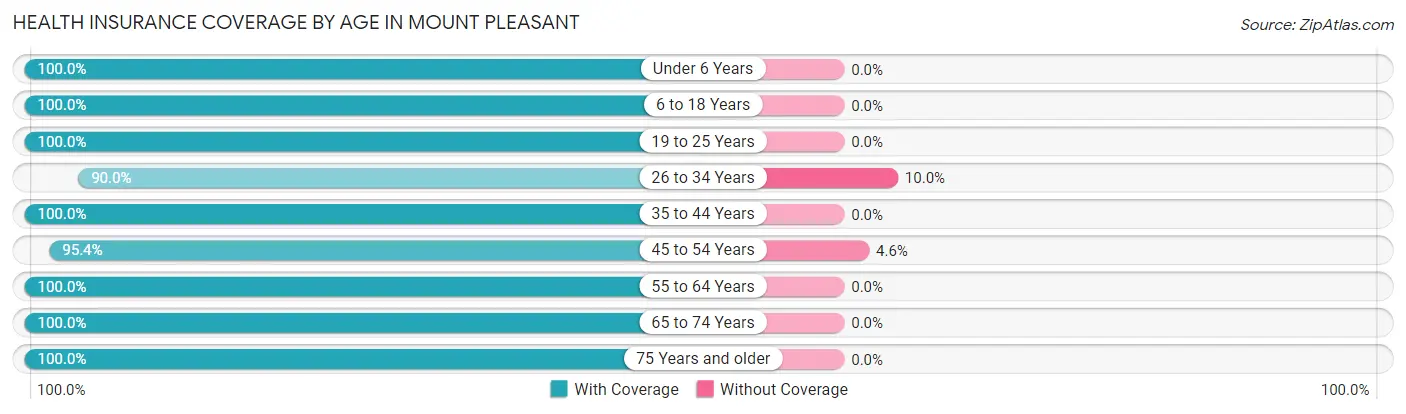
| Age Bracket | With Coverage | Without Coverage |
| Under 6 Years | 14 (100.0%) | 0 (0.0%) |
| 6 to 18 Years | 25 (100.0%) | 0 (0.0%) |
| 19 to 25 Years | 19 (100.0%) | 0 (0.0%) |
| 26 to 34 Years | 9 (90.0%) | 1 (10.0%) |
| 35 to 44 Years | 11 (100.0%) | 0 (0.0%) |
| 45 to 54 Years | 62 (95.4%) | 3 (4.6%) |
| 55 to 64 Years | 55 (100.0%) | 0 (0.0%) |
| 65 to 74 Years | 41 (100.0%) | 0 (0.0%) |
| 75 Years and older | 39 (100.0%) | 0 (0.0%) |
| Total | 275 (98.6%) | 4 (1.4%) |
Health Insurance Coverage by Citizenship Status in Mount Pleasant
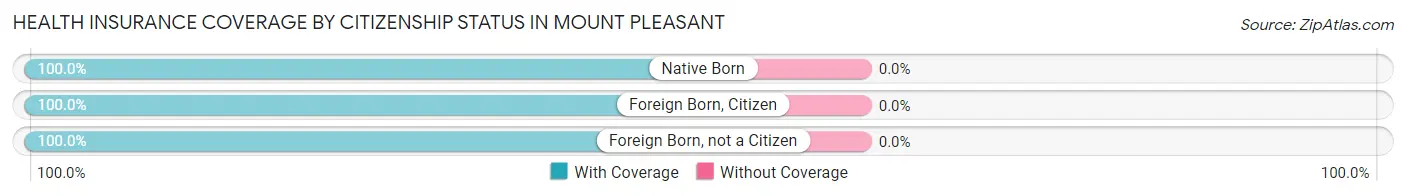
| Citizenship Status | With Coverage | Without Coverage |
| Native Born | 14 (100.0%) | 0 (0.0%) |
| Foreign Born, Citizen | 25 (100.0%) | 0 (0.0%) |
| Foreign Born, not a Citizen | 19 (100.0%) | 0 (0.0%) |
Health Insurance Coverage by Household Income in Mount Pleasant
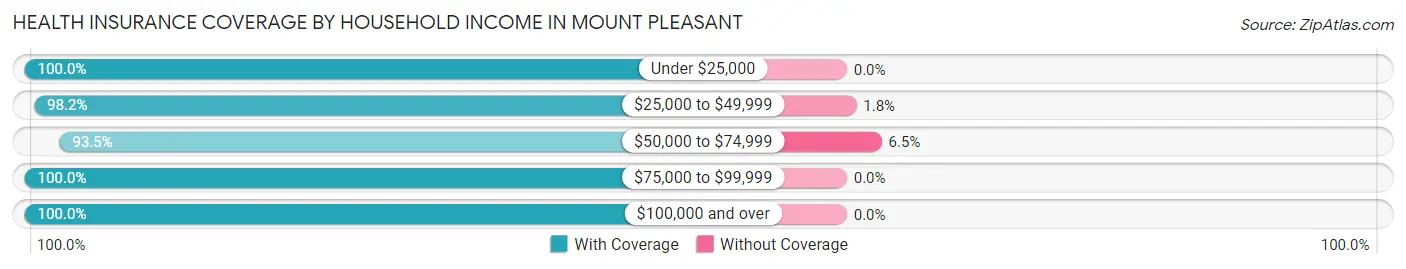
| Household Income | With Coverage | Without Coverage |
| Under $25,000 | 105 (100.0%) | 0 (0.0%) |
| $25,000 to $49,999 | 55 (98.2%) | 1 (1.8%) |
| $50,000 to $74,999 | 43 (93.5%) | 3 (6.5%) |
| $75,000 to $99,999 | 37 (100.0%) | 0 (0.0%) |
| $100,000 and over | 35 (100.0%) | 0 (0.0%) |
Public vs Private Health Insurance Coverage by Age in Mount Pleasant
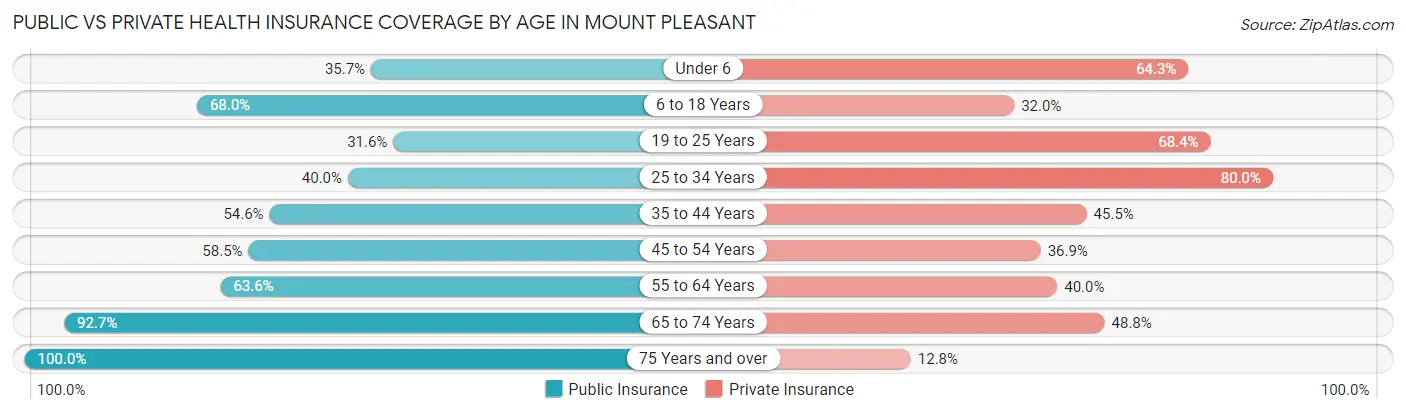
| Age Bracket | Public Insurance | Private Insurance |
| Under 6 | 5 (35.7%) | 9 (64.3%) |
| 6 to 18 Years | 17 (68.0%) | 8 (32.0%) |
| 19 to 25 Years | 6 (31.6%) | 13 (68.4%) |
| 25 to 34 Years | 4 (40.0%) | 8 (80.0%) |
| 35 to 44 Years | 6 (54.5%) | 5 (45.5%) |
| 45 to 54 Years | 38 (58.5%) | 24 (36.9%) |
| 55 to 64 Years | 35 (63.6%) | 22 (40.0%) |
| 65 to 74 Years | 38 (92.7%) | 20 (48.8%) |
| 75 Years and over | 39 (100.0%) | 5 (12.8%) |
| Total | 188 (67.4%) | 114 (40.9%) |
Disability Status by Sex by Age in Mount Pleasant
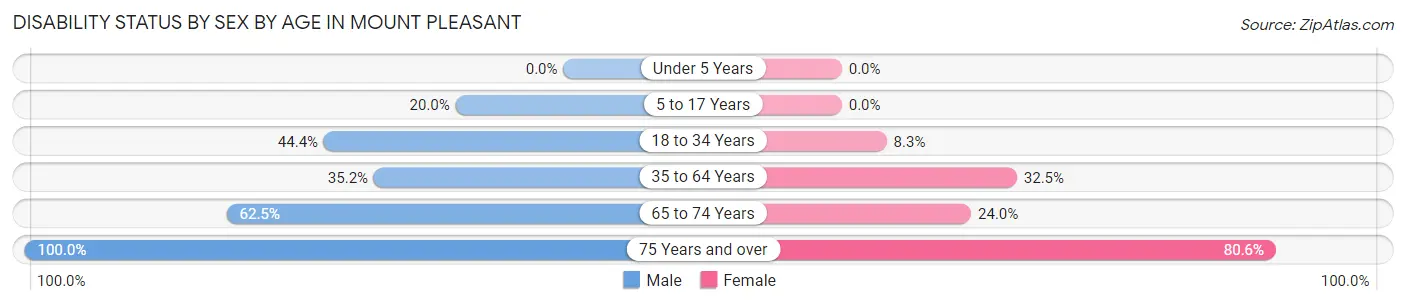
| Age Bracket | Male | Female |
| Under 5 Years | 0 (0.0%) | 0 (0.0%) |
| 5 to 17 Years | 3 (20.0%) | 0 (0.0%) |
| 18 to 34 Years | 8 (44.4%) | 1 (8.3%) |
| 35 to 64 Years | 32 (35.2%) | 13 (32.5%) |
| 65 to 74 Years | 10 (62.5%) | 6 (24.0%) |
| 75 Years and over | 3 (100.0%) | 29 (80.6%) |
Disability Class by Sex by Age in Mount Pleasant
Disability Class: Hearing Difficulty
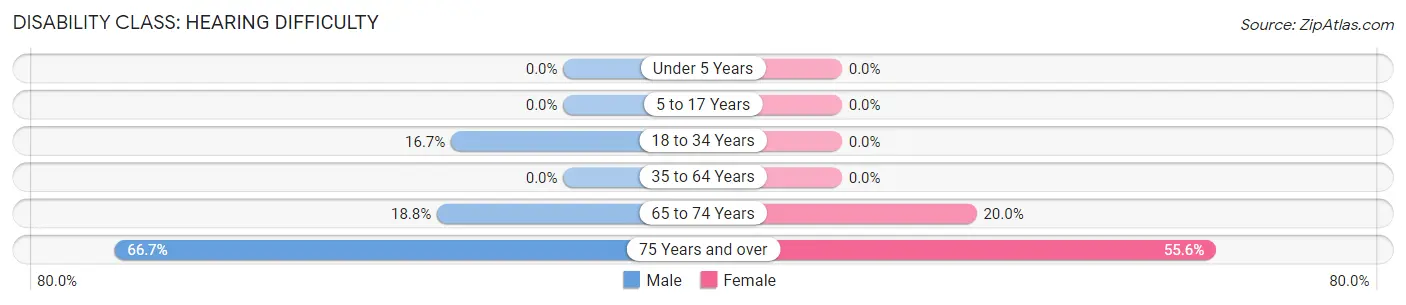
| Age Bracket | Male | Female |
| Under 5 Years | 0 (0.0%) | 0 (0.0%) |
| 5 to 17 Years | 0 (0.0%) | 0 (0.0%) |
| 18 to 34 Years | 3 (16.7%) | 0 (0.0%) |
| 35 to 64 Years | 0 (0.0%) | 0 (0.0%) |
| 65 to 74 Years | 3 (18.8%) | 5 (20.0%) |
| 75 Years and over | 2 (66.7%) | 20 (55.6%) |
Disability Class: Vision Difficulty
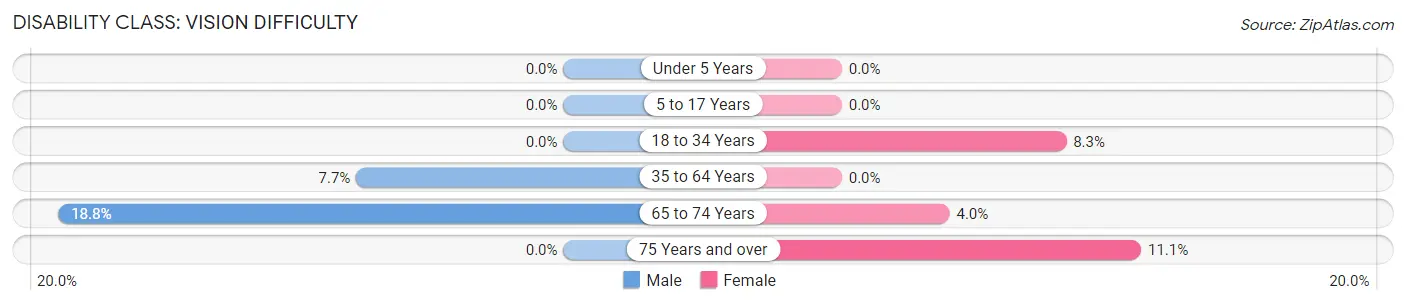
| Age Bracket | Male | Female |
| Under 5 Years | 0 (0.0%) | 0 (0.0%) |
| 5 to 17 Years | 0 (0.0%) | 0 (0.0%) |
| 18 to 34 Years | 0 (0.0%) | 1 (8.3%) |
| 35 to 64 Years | 7 (7.7%) | 0 (0.0%) |
| 65 to 74 Years | 3 (18.8%) | 1 (4.0%) |
| 75 Years and over | 0 (0.0%) | 4 (11.1%) |
Disability Class: Cognitive Difficulty
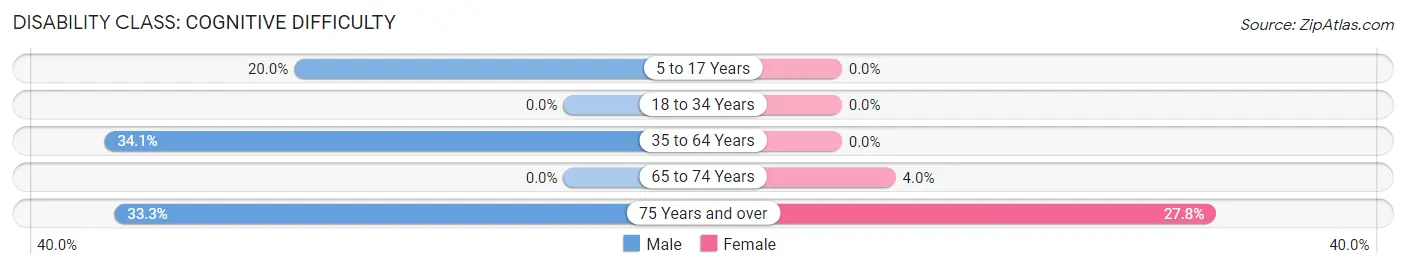
| Age Bracket | Male | Female |
| 5 to 17 Years | 3 (20.0%) | 0 (0.0%) |
| 18 to 34 Years | 0 (0.0%) | 0 (0.0%) |
| 35 to 64 Years | 31 (34.1%) | 0 (0.0%) |
| 65 to 74 Years | 0 (0.0%) | 1 (4.0%) |
| 75 Years and over | 1 (33.3%) | 10 (27.8%) |
Disability Class: Ambulatory Difficulty
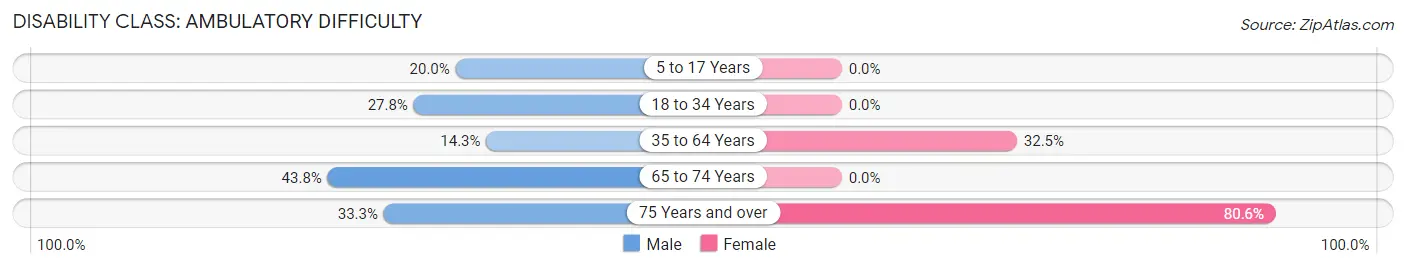
| Age Bracket | Male | Female |
| 5 to 17 Years | 3 (20.0%) | 0 (0.0%) |
| 18 to 34 Years | 5 (27.8%) | 0 (0.0%) |
| 35 to 64 Years | 13 (14.3%) | 13 (32.5%) |
| 65 to 74 Years | 7 (43.8%) | 0 (0.0%) |
| 75 Years and over | 1 (33.3%) | 29 (80.6%) |
Disability Class: Self-Care Difficulty
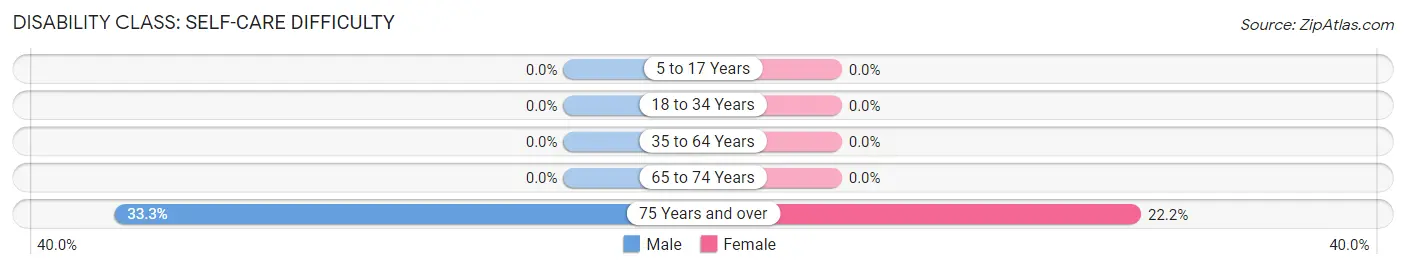
| Age Bracket | Male | Female |
| 5 to 17 Years | 0 (0.0%) | 0 (0.0%) |
| 18 to 34 Years | 0 (0.0%) | 0 (0.0%) |
| 35 to 64 Years | 0 (0.0%) | 0 (0.0%) |
| 65 to 74 Years | 0 (0.0%) | 0 (0.0%) |
| 75 Years and over | 1 (33.3%) | 8 (22.2%) |
Technology Access in Mount Pleasant
Computing Device Access in Mount Pleasant
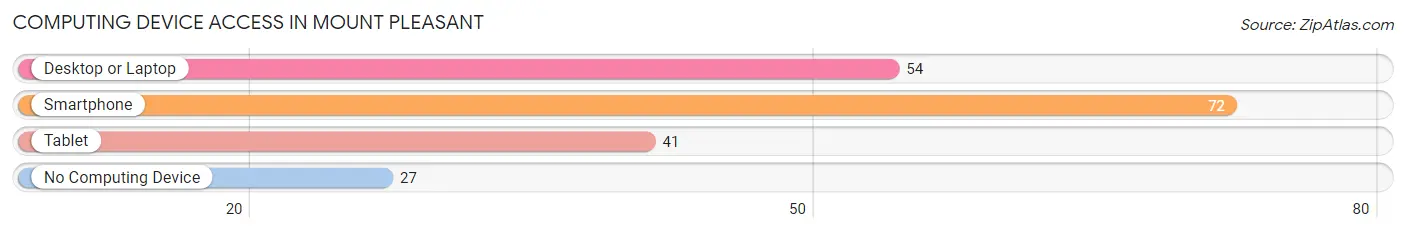
| Device Type | # Households | % Households |
| Desktop or Laptop | 54 | 51.4% |
| Smartphone | 72 | 68.6% |
| Tablet | 41 | 39.1% |
| No Computing Device | 27 | 25.7% |
| Total | 105 | 100.0% |
Internet Access in Mount Pleasant
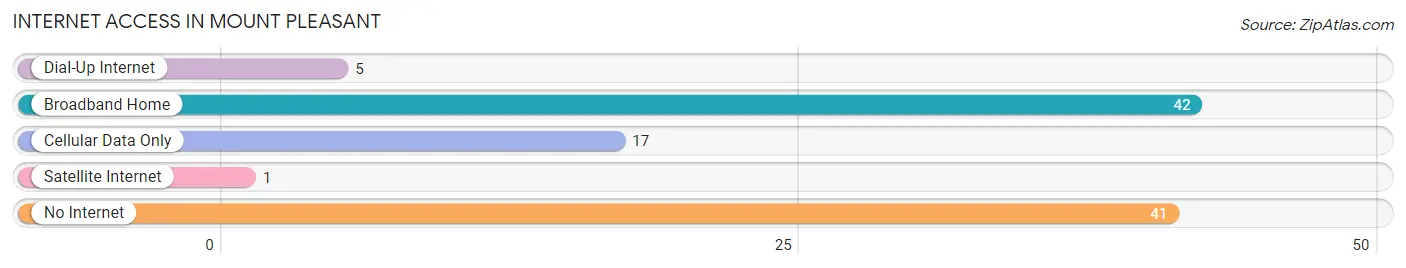
| Internet Type | # Households | % Households |
| Dial-Up Internet | 5 | 4.8% |
| Broadband Home | 42 | 40.0% |
| Cellular Data Only | 17 | 16.2% |
| Satellite Internet | 1 | 0.9% |
| No Internet | 41 | 39.1% |
| Total | 105 | 100.0% |
Mount Pleasant Summary
Introduction
Mount Pleasant is a small town located in the Ozark Mountains of Arkansas. It is situated in the northwest corner of the state, near the Oklahoma border. The town has a population of just over 1,000 people and is the county seat of Franklin County. The town is known for its rural charm and its proximity to the Ozark National Forest.
History
Mount Pleasant was first settled in 1837 by a group of settlers from Tennessee. The town was originally known as Franklin, but the name was changed to Mount Pleasant in 1845. The town was incorporated in 1876 and has remained a small, rural community ever since.
The town was an important stop on the Butterfield Overland Mail route, which ran from St. Louis to San Francisco. The route passed through Mount Pleasant and the town was a popular stop for travelers.
The town was also an important stop on the St. Louis and San Francisco Railway, which ran from St. Louis to Tulsa. The railway was an important part of the town's economy and helped to bring in new businesses and people.
Geography
Mount Pleasant is located in the Ozark Mountains of Arkansas. The town is situated in the northwest corner of the state, near the Oklahoma border. The town is surrounded by the Ozark National Forest and is located near the Mulberry River.
The town has a total area of 1.3 square miles, all of which is land. The town is located at an elevation of 1,068 feet above sea level.
Economy
The economy of Mount Pleasant is largely based on agriculture and tourism. The town is home to several small farms and ranches, which produce a variety of crops and livestock. The town is also home to several small businesses, including restaurants, shops, and other services.
Tourism is an important part of the town's economy. The town is located near the Ozark National Forest and is a popular destination for outdoor activities such as camping, fishing, and hiking. The town is also home to several historic sites, including the Butterfield Overland Mail route and the St. Louis and San Francisco Railway.
Demographics
As of the 2010 census, the population of Mount Pleasant was 1,072. The town has a population density of 817 people per square mile. The median age of the population is 44.7 years, and the median household income is $35,000.
Conclusion
Mount Pleasant is a small town located in the Ozark Mountains of Arkansas. The town has a population of just over 1,000 people and is the county seat of Franklin County. The town is known for its rural charm and its proximity to the Ozark National Forest. The economy of Mount Pleasant is largely based on agriculture and tourism. The town is home to several small farms and ranches, as well as several small businesses. Tourism is an important part of the town's economy, as the town is located near the Ozark National Forest and is a popular destination for outdoor activities. The population of Mount Pleasant is 1,072, with a median age of 44.7 years and a median household income of $35,000.
Common Questions
What is Per Capita Income in Mount Pleasant?
Per Capita income in Mount Pleasant is $23,841.
What is the Median Family Income in Mount Pleasant?
Median Family Income in Mount Pleasant is $59,000.
What is the Median Household income in Mount Pleasant?
Median Household Income in Mount Pleasant is $33,173.
What is Income or Wage Gap in Mount Pleasant?
Income or Wage Gap in Mount Pleasant is 29.8%.
Women in Mount Pleasant earn 70.2 cents for every dollar earned by a man.
What is Inequality or Gini Index in Mount Pleasant?
Inequality or Gini Index in Mount Pleasant is 0.47.
What is the Total Population of Mount Pleasant?
Total Population of Mount Pleasant is 279.
What is the Total Male Population of Mount Pleasant?
Total Male Population of Mount Pleasant is 149.
What is the Total Female Population of Mount Pleasant?
Total Female Population of Mount Pleasant is 130.
What is the Ratio of Males per 100 Females in Mount Pleasant?
There are 114.62 Males per 100 Females in Mount Pleasant.
What is the Ratio of Females per 100 Males in Mount Pleasant?
There are 87.25 Females per 100 Males in Mount Pleasant.
What is the Median Population Age in Mount Pleasant?
Median Population Age in Mount Pleasant is 54.3 Years.
What is the Average Family Size in Mount Pleasant
Average Family Size in Mount Pleasant is 4.6 People.
What is the Average Household Size in Mount Pleasant
Average Household Size in Mount Pleasant is 2.7 People.
How Large is the Labor Force in Mount Pleasant?
There are 69 People in the Labor Forcein in Mount Pleasant.
What is the Percentage of People in the Labor Force in Mount Pleasant?
28.0% of People are in the Labor Force in Mount Pleasant.
What is the Unemployment Rate in Mount Pleasant?
Unemployment Rate in Mount Pleasant is 2.9%.