Mount Ida, AR Map & Demographics
Mount Ida Map
Mount Ida Overview
$22,928
PER CAPITA INCOME
$46,133
AVG FAMILY INCOME
$42,778
AVG HOUSEHOLD INCOME
42.9%
WAGE / INCOME GAP [ % ]
57.1¢/ $1
WAGE / INCOME GAP [ $ ]
0.50
INEQUALITY / GINI INDEX
1,410
TOTAL POPULATION
739
MALE POPULATION
671
FEMALE POPULATION
110.13
MALES / 100 FEMALES
90.80
FEMALES / 100 MALES
46.5
MEDIAN AGE
2.9
AVG FAMILY SIZE
2.4
AVG HOUSEHOLD SIZE
408
LABOR FORCE [ PEOPLE ]
35.7%
PERCENT IN LABOR FORCE
7.1%
UNEMPLOYMENT RATE
Mount Ida Zip Codes
Mount Ida Area Codes
Income in Mount Ida
Income Overview in Mount Ida
Per Capita Income in Mount Ida is $22,928, while median incomes of families and households are $46,133 and $42,778 respectively.
| Characteristic | Number | Measure |
| Per Capita Income | 1,410 | $22,928 |
| Median Family Income | 378 | $46,133 |
| Mean Family Income | 378 | $65,286 |
| Median Household Income | 550 | $42,778 |
| Mean Household Income | 550 | $55,049 |
| Income Deficit | 378 | $0 |
| Wage / Income Gap (%) | 1,410 | 42.90% |
| Wage / Income Gap ($) | 1,410 | 57.10¢ per $1 |
| Gini / Inequality Index | 1,410 | 0.50 |
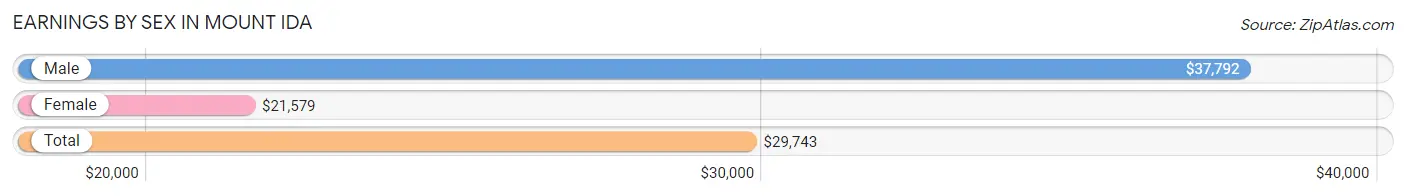
Earnings by Sex in Mount Ida
Average Earnings in Mount Ida are $29,743, $37,792 for men and $21,579 for women, a difference of 42.9%.
| Sex | Number | Average Earnings |
| Male | 219 (47.5%) | $37,792 |
| Female | 242 (52.5%) | $21,579 |
| Total | 461 (100.0%) | $29,743 |
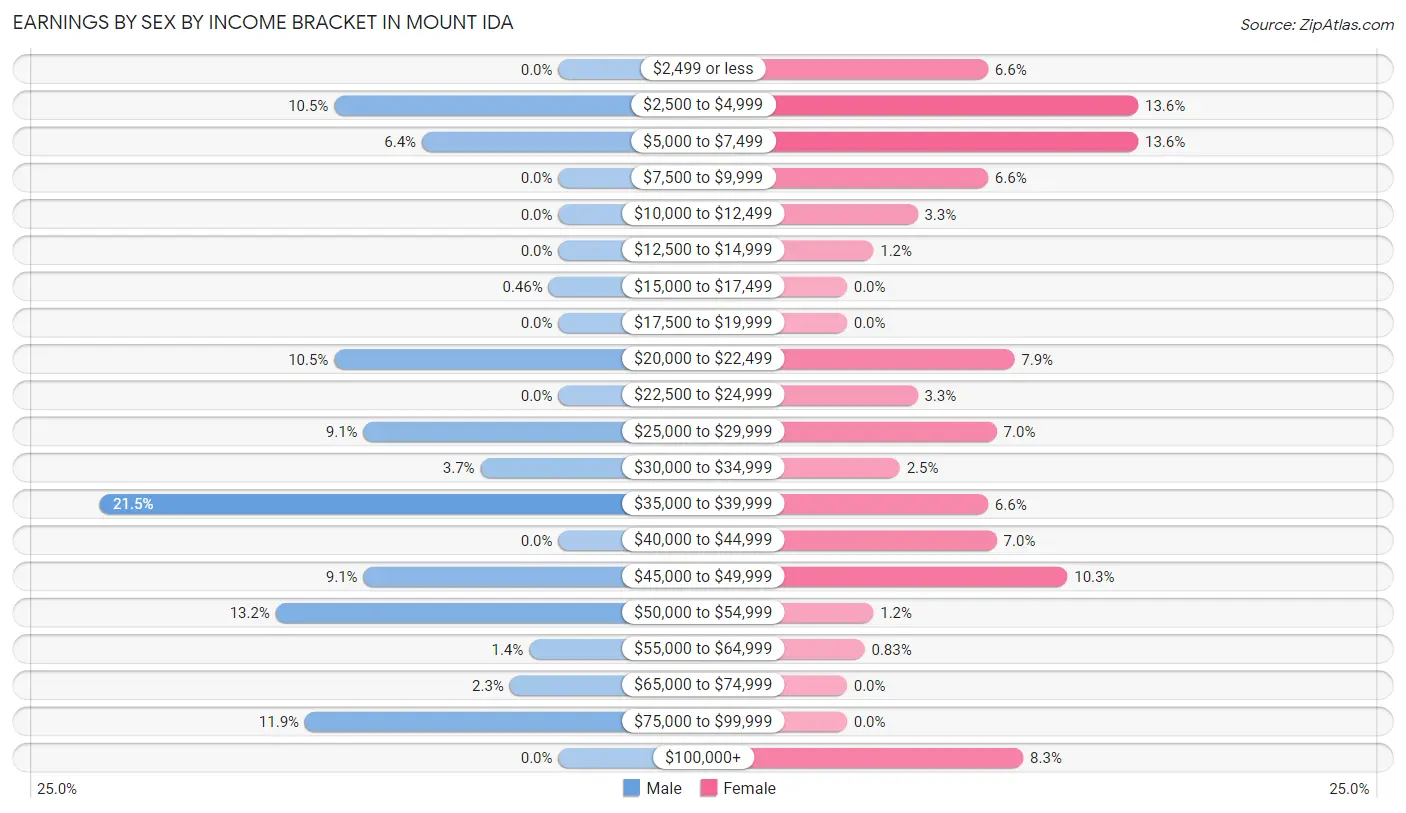
Earnings by Sex by Income Bracket in Mount Ida
The most common earnings brackets in Mount Ida are $35,000 to $39,999 for men (47 | 21.5%) and $2,500 to $4,999 for women (33 | 13.6%).
| Income | Male | Female |
| $2,499 or less | 0 (0.0%) | 16 (6.6%) |
| $2,500 to $4,999 | 23 (10.5%) | 33 (13.6%) |
| $5,000 to $7,499 | 14 (6.4%) | 33 (13.6%) |
| $7,500 to $9,999 | 0 (0.0%) | 16 (6.6%) |
| $10,000 to $12,499 | 0 (0.0%) | 8 (3.3%) |
| $12,500 to $14,999 | 0 (0.0%) | 3 (1.2%) |
| $15,000 to $17,499 | 1 (0.5%) | 0 (0.0%) |
| $17,500 to $19,999 | 0 (0.0%) | 0 (0.0%) |
| $20,000 to $22,499 | 23 (10.5%) | 19 (7.9%) |
| $22,500 to $24,999 | 0 (0.0%) | 8 (3.3%) |
| $25,000 to $29,999 | 20 (9.1%) | 17 (7.0%) |
| $30,000 to $34,999 | 8 (3.6%) | 6 (2.5%) |
| $35,000 to $39,999 | 47 (21.5%) | 16 (6.6%) |
| $40,000 to $44,999 | 0 (0.0%) | 17 (7.0%) |
| $45,000 to $49,999 | 20 (9.1%) | 25 (10.3%) |
| $50,000 to $54,999 | 29 (13.2%) | 3 (1.2%) |
| $55,000 to $64,999 | 3 (1.4%) | 2 (0.8%) |
| $65,000 to $74,999 | 5 (2.3%) | 0 (0.0%) |
| $75,000 to $99,999 | 26 (11.9%) | 0 (0.0%) |
| $100,000+ | 0 (0.0%) | 20 (8.3%) |
| Total | 219 (100.0%) | 242 (100.0%) |
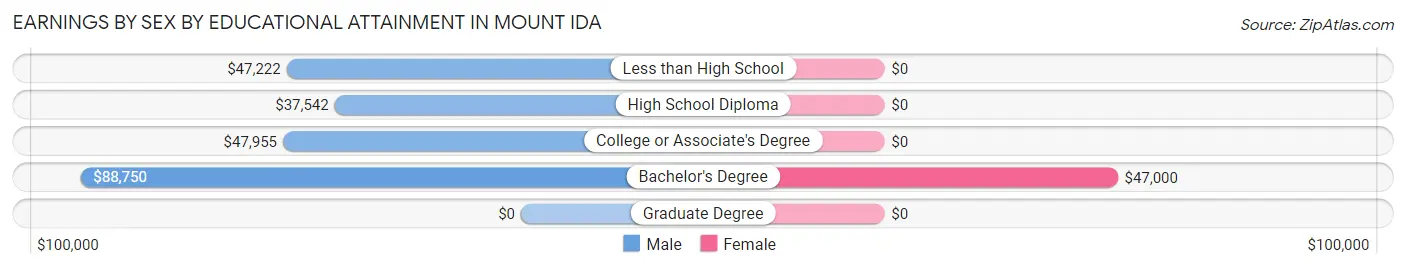
Earnings by Sex by Educational Attainment in Mount Ida
Average earnings in Mount Ida are $39,000 for men and $28,750 for women, a difference of 26.3%. Men with an educational attainment of bachelor's degree enjoy the highest average annual earnings of $88,750, while those with high school diploma education earn the least with $37,542. Women with an educational attainment of bachelor's degree earn the most with the average annual earnings of $47,000, while those with bachelor's degree education have the smallest earnings of $47,000.
| Educational Attainment | Male Income | Female Income |
| Less than High School | $47,222 | $0 |
| High School Diploma | $37,542 | $0 |
| College or Associate's Degree | $47,955 | $0 |
| Bachelor's Degree | $88,750 | $47,000 |
| Graduate Degree | - | - |
| Total | $39,000 | $28,750 |
Family Income in Mount Ida
Family Income Brackets in Mount Ida
According to the Mount Ida family income data, there are 137 families falling into the $35,000 to $49,999 income range, which is the most common income bracket and makes up 36.2% of all families.
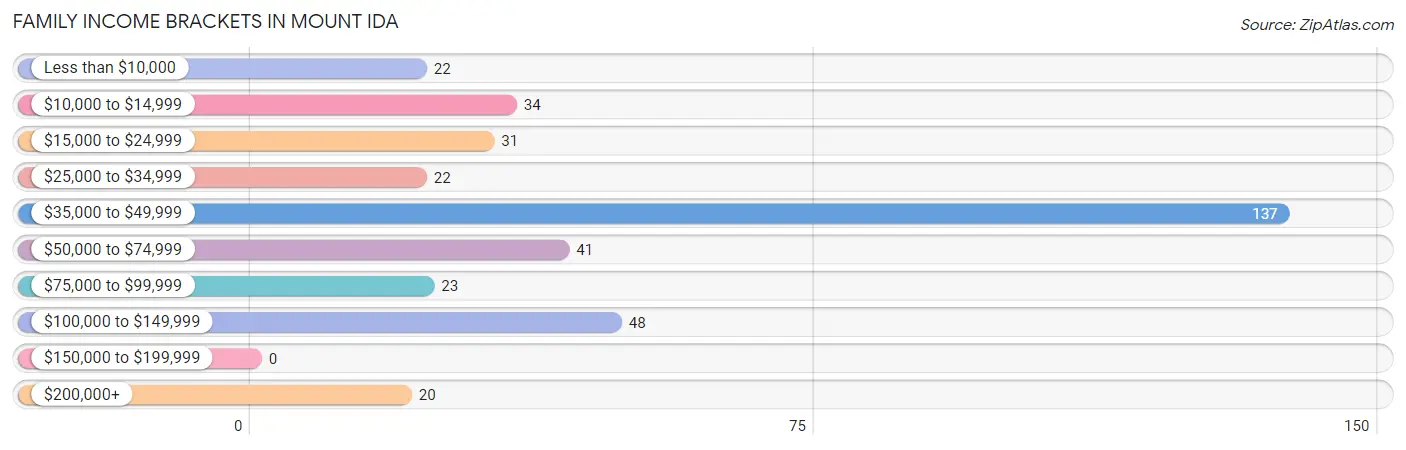
| Income Bracket | # Families | % Families |
| Less than $10,000 | 22 | 5.8% |
| $10,000 to $14,999 | 34 | 9.0% |
| $15,000 to $24,999 | 31 | 8.2% |
| $25,000 to $34,999 | 22 | 5.8% |
| $35,000 to $49,999 | 137 | 36.2% |
| $50,000 to $74,999 | 41 | 10.8% |
| $75,000 to $99,999 | 23 | 6.1% |
| $100,000 to $149,999 | 48 | 12.7% |
| $150,000 to $199,999 | 0 | 0.0% |
| $200,000+ | 20 | 5.3% |
Family Income by Famaliy Size in Mount Ida
5-person families (11 | 2.9%) account for the highest median family income in Mount Ida with $85,417 per family, while 2-person families (253 | 66.9%) have the highest median income of $23,075 per family member.
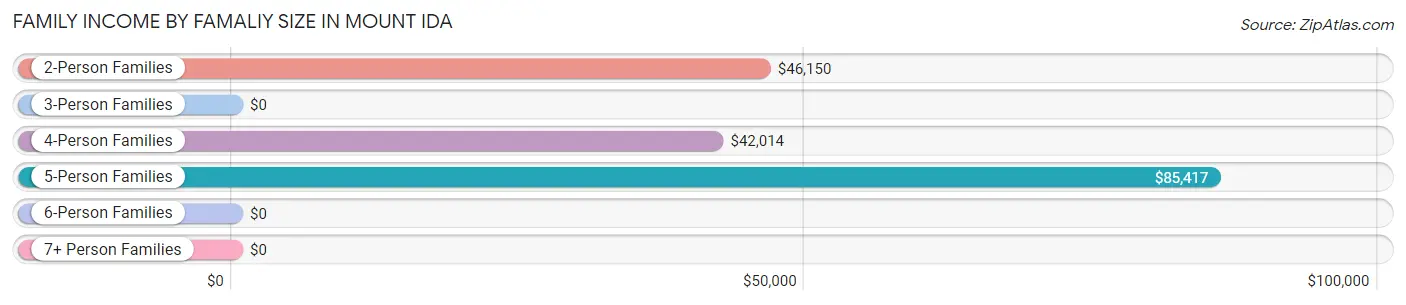
| Income Bracket | # Families | Median Income |
| 2-Person Families | 253 (66.9%) | $46,150 |
| 3-Person Families | 45 (11.9%) | $0 |
| 4-Person Families | 61 (16.1%) | $42,014 |
| 5-Person Families | 11 (2.9%) | $85,417 |
| 6-Person Families | 8 (2.1%) | $0 |
| 7+ Person Families | 0 (0.0%) | $0 |
| Total | 378 (100.0%) | $46,133 |
Family Income by Number of Earners in Mount Ida
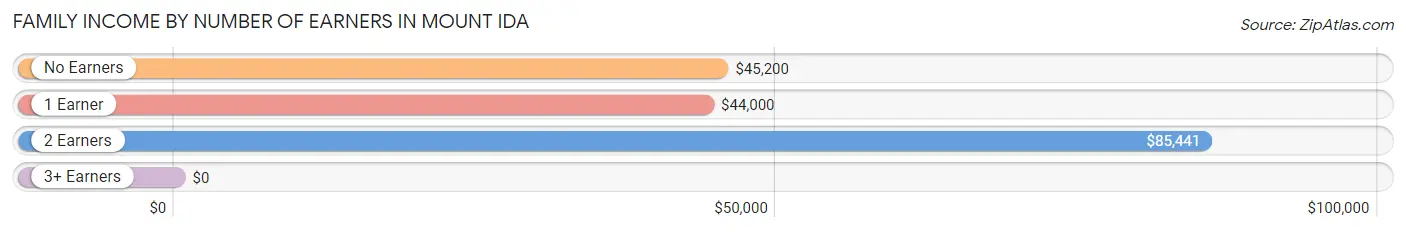
| Number of Earners | # Families | Median Income |
| No Earners | 168 (44.4%) | $45,200 |
| 1 Earner | 66 (17.5%) | $44,000 |
| 2 Earners | 138 (36.5%) | $85,441 |
| 3+ Earners | 6 (1.6%) | $0 |
| Total | 378 (100.0%) | $46,133 |
Household Income in Mount Ida
Household Income Brackets in Mount Ida
With 163 households falling in the category, the $35,000 to $49,999 income range is the most frequent in Mount Ida, accounting for 29.6% of all households.
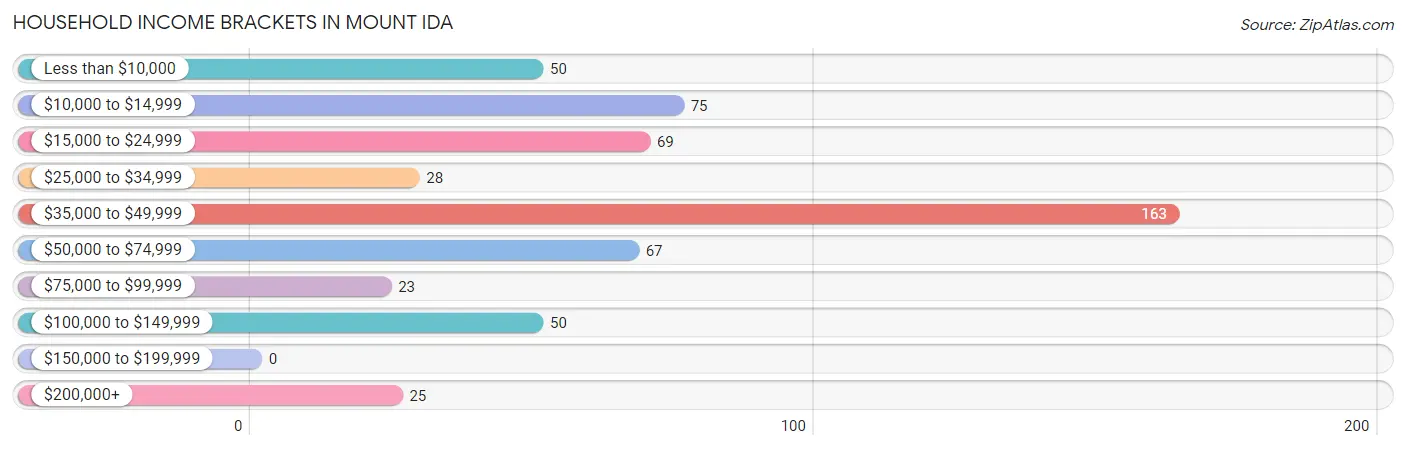
| Income Bracket | # Households | % Households |
| Less than $10,000 | 50 | 9.1% |
| $10,000 to $14,999 | 75 | 13.6% |
| $15,000 to $24,999 | 69 | 12.5% |
| $25,000 to $34,999 | 28 | 5.1% |
| $35,000 to $49,999 | 163 | 29.6% |
| $50,000 to $74,999 | 67 | 12.2% |
| $75,000 to $99,999 | 23 | 4.2% |
| $100,000 to $149,999 | 50 | 9.1% |
| $150,000 to $199,999 | 0 | 0.0% |
| $200,000+ | 25 | 4.5% |
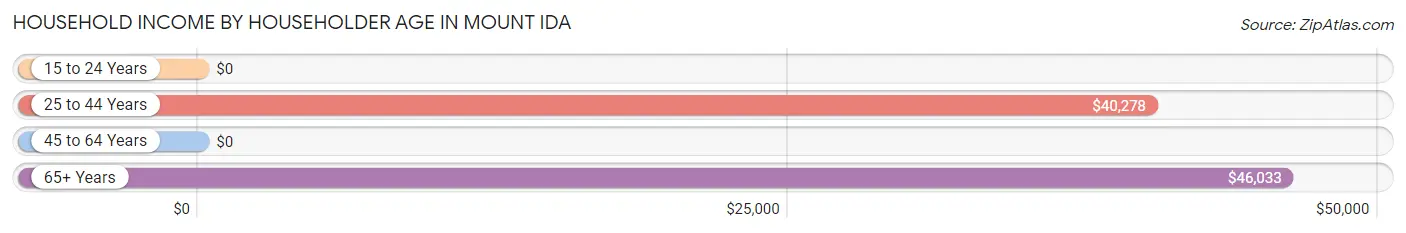
Household Income by Householder Age in Mount Ida
The median household income in Mount Ida is $42,778, with the highest median household income of $46,033 found in the 65+ years age bracket for the primary householder. A total of 260 households (47.3%) fall into this category. Meanwhile, the 15 to 24 years age bracket for the primary householder has the lowest median household income of $0, with 5 households (0.9%) in this group.
| Income Bracket | # Households | Median Income |
| 15 to 24 Years | 5 (0.9%) | $0 |
| 25 to 44 Years | 132 (24.0%) | $40,278 |
| 45 to 64 Years | 153 (27.8%) | $0 |
| 65+ Years | 260 (47.3%) | $46,033 |
| Total | 550 (100.0%) | $42,778 |
Poverty in Mount Ida
Income Below Poverty by Sex and Age in Mount Ida
With 25.8% poverty level for males and 24.4% for females among the residents of Mount Ida, 15 year old males and 5 year old females are the most vulnerable to poverty, with 11 males (100.0%) and 2 females (100.0%) in their respective age groups living below the poverty level.
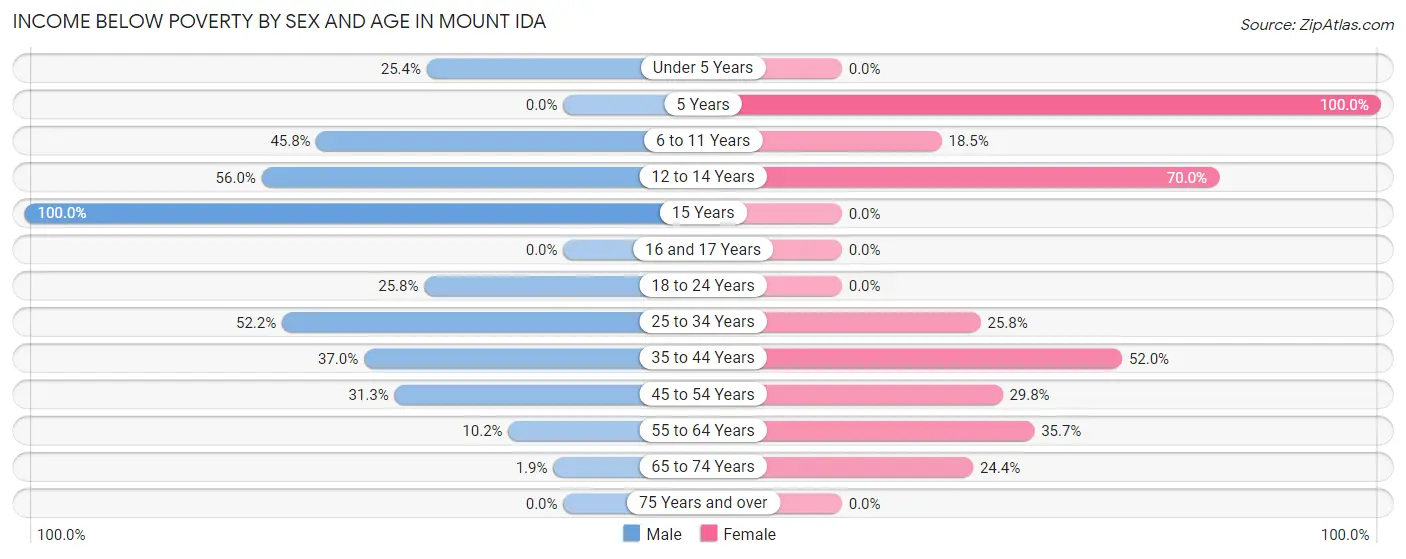
| Age Bracket | Male | Female |
| Under 5 Years | 18 (25.4%) | 0 (0.0%) |
| 5 Years | 0 (0.0%) | 2 (100.0%) |
| 6 to 11 Years | 22 (45.8%) | 10 (18.5%) |
| 12 to 14 Years | 14 (56.0%) | 7 (70.0%) |
| 15 Years | 11 (100.0%) | 0 (0.0%) |
| 16 and 17 Years | 0 (0.0%) | 0 (0.0%) |
| 18 to 24 Years | 8 (25.8%) | 0 (0.0%) |
| 25 to 34 Years | 47 (52.2%) | 17 (25.8%) |
| 35 to 44 Years | 27 (37.0%) | 39 (52.0%) |
| 45 to 54 Years | 26 (31.3%) | 17 (29.8%) |
| 55 to 64 Years | 5 (10.2%) | 25 (35.7%) |
| 65 to 74 Years | 3 (1.9%) | 28 (24.3%) |
| 75 Years and over | 0 (0.0%) | 0 (0.0%) |
| Total | 181 (25.8%) | 145 (24.4%) |
Income Above Poverty by Sex and Age in Mount Ida
According to the poverty statistics in Mount Ida, males aged 5 years and females aged under 5 years are the age groups that are most secure financially, with 100.0% of males and 100.0% of females in these age groups living above the poverty line.
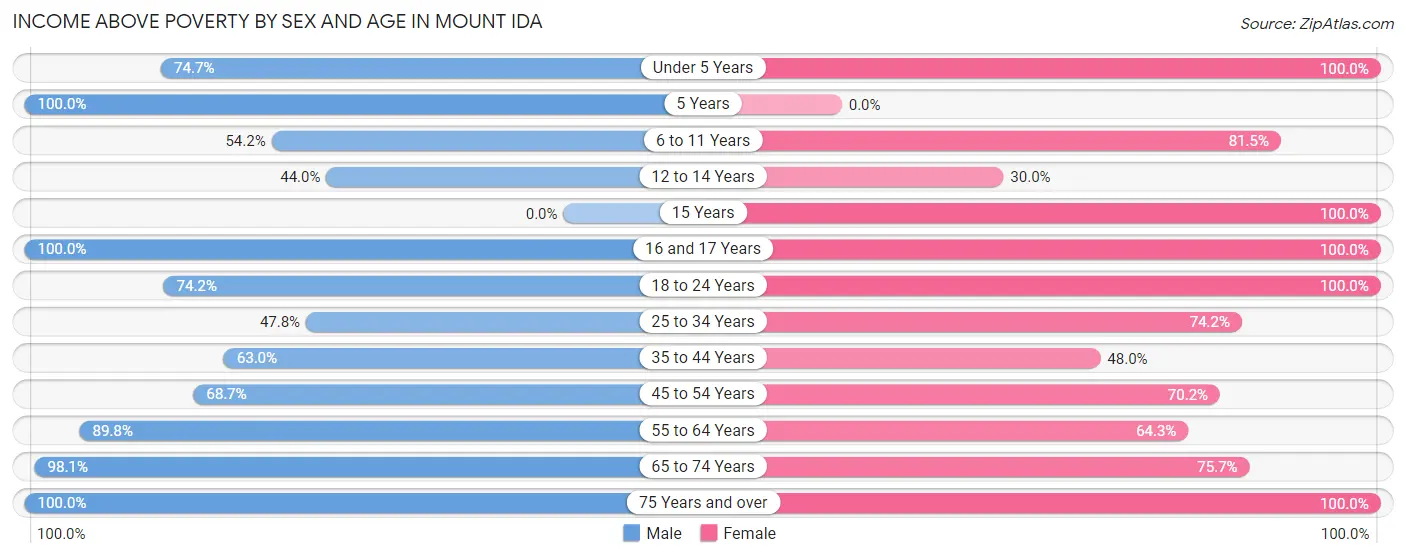
| Age Bracket | Male | Female |
| Under 5 Years | 53 (74.7%) | 37 (100.0%) |
| 5 Years | 5 (100.0%) | 0 (0.0%) |
| 6 to 11 Years | 26 (54.2%) | 44 (81.5%) |
| 12 to 14 Years | 11 (44.0%) | 3 (30.0%) |
| 15 Years | 0 (0.0%) | 3 (100.0%) |
| 16 and 17 Years | 28 (100.0%) | 4 (100.0%) |
| 18 to 24 Years | 23 (74.2%) | 48 (100.0%) |
| 25 to 34 Years | 43 (47.8%) | 49 (74.2%) |
| 35 to 44 Years | 46 (63.0%) | 36 (48.0%) |
| 45 to 54 Years | 57 (68.7%) | 40 (70.2%) |
| 55 to 64 Years | 44 (89.8%) | 45 (64.3%) |
| 65 to 74 Years | 158 (98.1%) | 87 (75.6%) |
| 75 Years and over | 27 (100.0%) | 52 (100.0%) |
| Total | 521 (74.2%) | 448 (75.5%) |
Income Below Poverty Among Married-Couple Families in Mount Ida
The poverty statistics for married-couple families in Mount Ida show that 13.7% or 44 of the total 321 families live below the poverty line. Families with 1 or 2 children have the highest poverty rate of 32.4%, comprising of 24 families. On the other hand, families with no children have the lowest poverty rate of 7.7%, which includes 18 families.
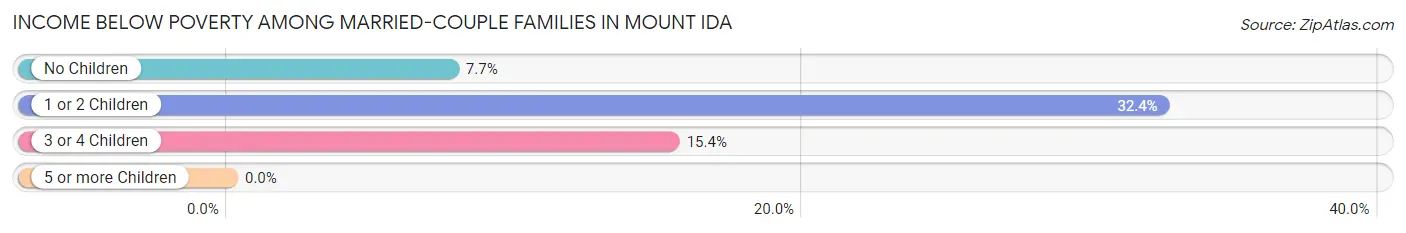
| Children | Above Poverty | Below Poverty |
| No Children | 216 (92.3%) | 18 (7.7%) |
| 1 or 2 Children | 50 (67.6%) | 24 (32.4%) |
| 3 or 4 Children | 11 (84.6%) | 2 (15.4%) |
| 5 or more Children | 0 (0.0%) | 0 (0.0%) |
| Total | 277 (86.3%) | 44 (13.7%) |
Income Below Poverty Among Single-Parent Households in Mount Ida
According to the poverty data in Mount Ida, 86.7% or 13 single-father households and 40.5% or 17 single-mother households are living below the poverty line. Among single-father households, those with 1 or 2 children have the highest poverty rate, with 3 households (100.0%) experiencing poverty. Likewise, among single-mother households, those with no children have the highest poverty rate, with 4 households (57.1%) falling below the poverty line.
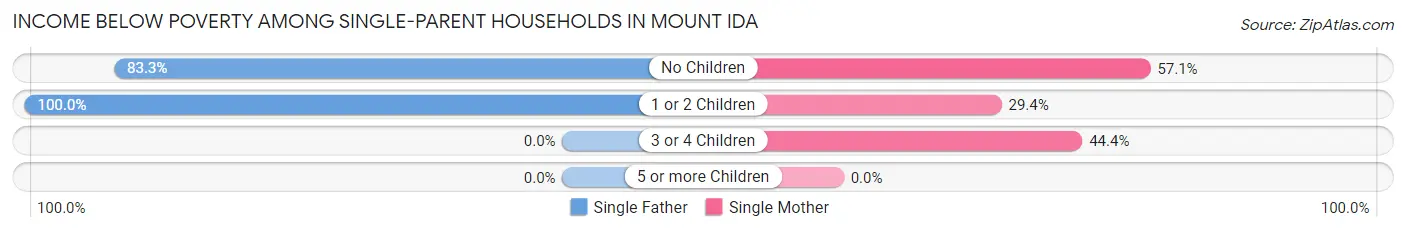
| Children | Single Father | Single Mother |
| No Children | 10 (83.3%) | 4 (57.1%) |
| 1 or 2 Children | 3 (100.0%) | 5 (29.4%) |
| 3 or 4 Children | 0 (0.0%) | 8 (44.4%) |
| 5 or more Children | 0 (0.0%) | 0 (0.0%) |
| Total | 13 (86.7%) | 17 (40.5%) |
Income Below Poverty Among Married-Couple vs Single-Parent Households in Mount Ida
The poverty data for Mount Ida shows that 44 of the married-couple family households (13.7%) and 30 of the single-parent households (52.6%) are living below the poverty level. Within the married-couple family households, those with 1 or 2 children have the highest poverty rate, with 24 households (32.4%) falling below the poverty line. Among the single-parent households, those with no children have the highest poverty rate, with 14 household (73.7%) living below poverty.
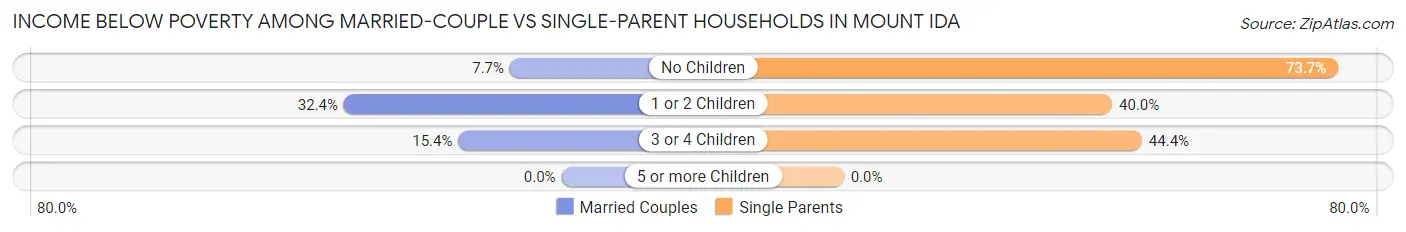
| Children | Married-Couple Families | Single-Parent Households |
| No Children | 18 (7.7%) | 14 (73.7%) |
| 1 or 2 Children | 24 (32.4%) | 8 (40.0%) |
| 3 or 4 Children | 2 (15.4%) | 8 (44.4%) |
| 5 or more Children | 0 (0.0%) | 0 (0.0%) |
| Total | 44 (13.7%) | 30 (52.6%) |
Race in Mount Ida
The most populous races in Mount Ida are White / Caucasian (1,329 | 94.3%), Two or more Races (48 | 3.4%), and Hispanic or Latino (22 | 1.6%).
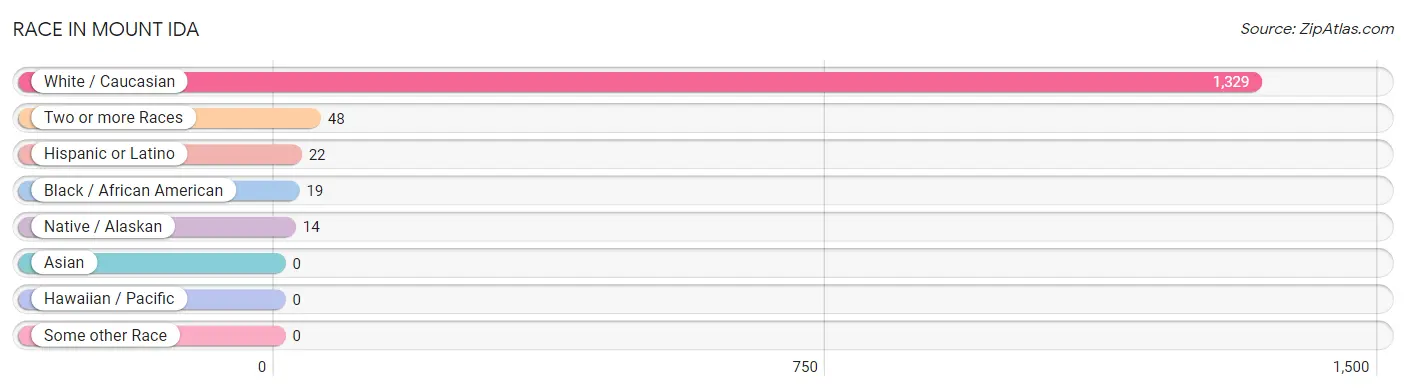
| Race | # Population | % Population |
| Asian | 0 | 0.0% |
| Black / African American | 19 | 1.3% |
| Hawaiian / Pacific | 0 | 0.0% |
| Hispanic or Latino | 22 | 1.6% |
| Native / Alaskan | 14 | 1.0% |
| White / Caucasian | 1,329 | 94.3% |
| Two or more Races | 48 | 3.4% |
| Some other Race | 0 | 0.0% |
| Total | 1,410 | 100.0% |
Ancestry in Mount Ida
The most populous ancestries reported in Mount Ida are Irish (356 | 25.3%), English (213 | 15.1%), German (155 | 11.0%), American (73 | 5.2%), and Scotch-Irish (49 | 3.5%), together accounting for 60.0% of all Mount Ida residents.
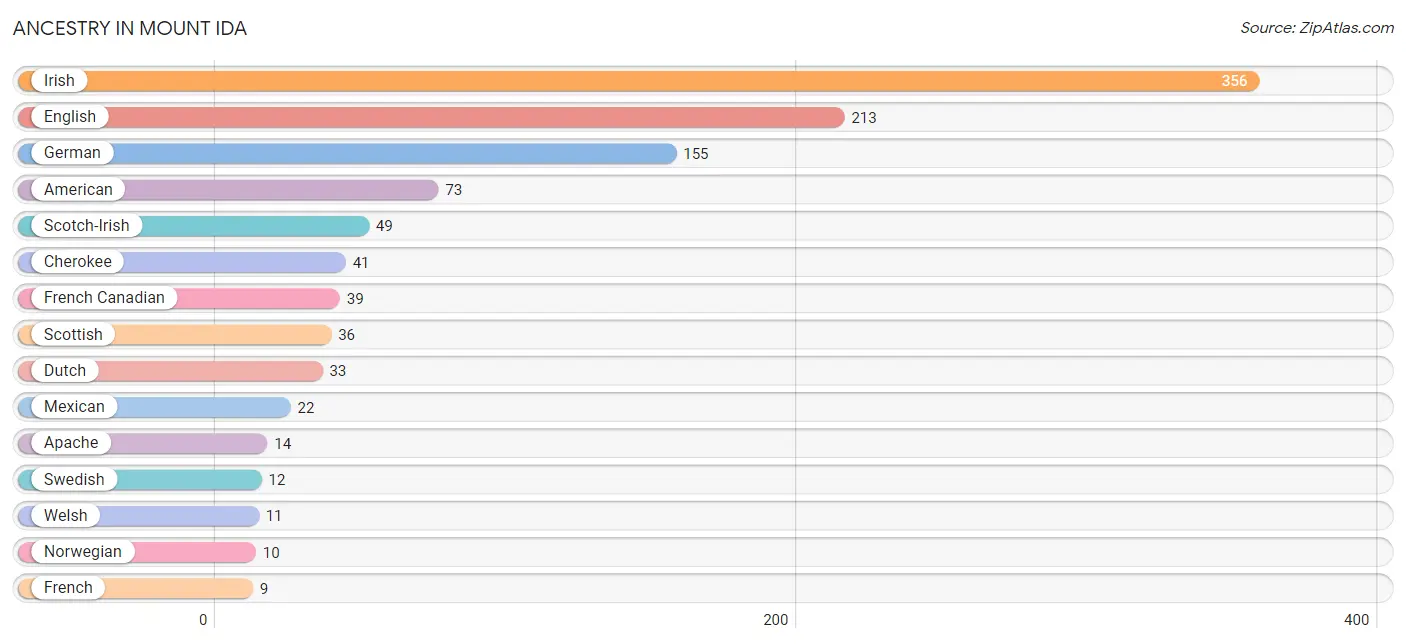
| Ancestry | # Population | % Population |
| American | 73 | 5.2% |
| Apache | 14 | 1.0% |
| Cherokee | 41 | 2.9% |
| Choctaw | 3 | 0.2% |
| Danish | 5 | 0.4% |
| Dutch | 33 | 2.3% |
| English | 213 | 15.1% |
| French | 9 | 0.6% |
| French Canadian | 39 | 2.8% |
| German | 155 | 11.0% |
| Irish | 356 | 25.3% |
| Italian | 3 | 0.2% |
| Mexican | 22 | 1.6% |
| Norwegian | 10 | 0.7% |
| Portuguese | 6 | 0.4% |
| Scotch-Irish | 49 | 3.5% |
| Scottish | 36 | 2.5% |
| Swedish | 12 | 0.9% |
| Welsh | 11 | 0.8% | View All 19 Rows |
Immigrants in Mount Ida

| Immigration Origin | # Population | % Population | View All 0 Rows |
Sex and Age in Mount Ida
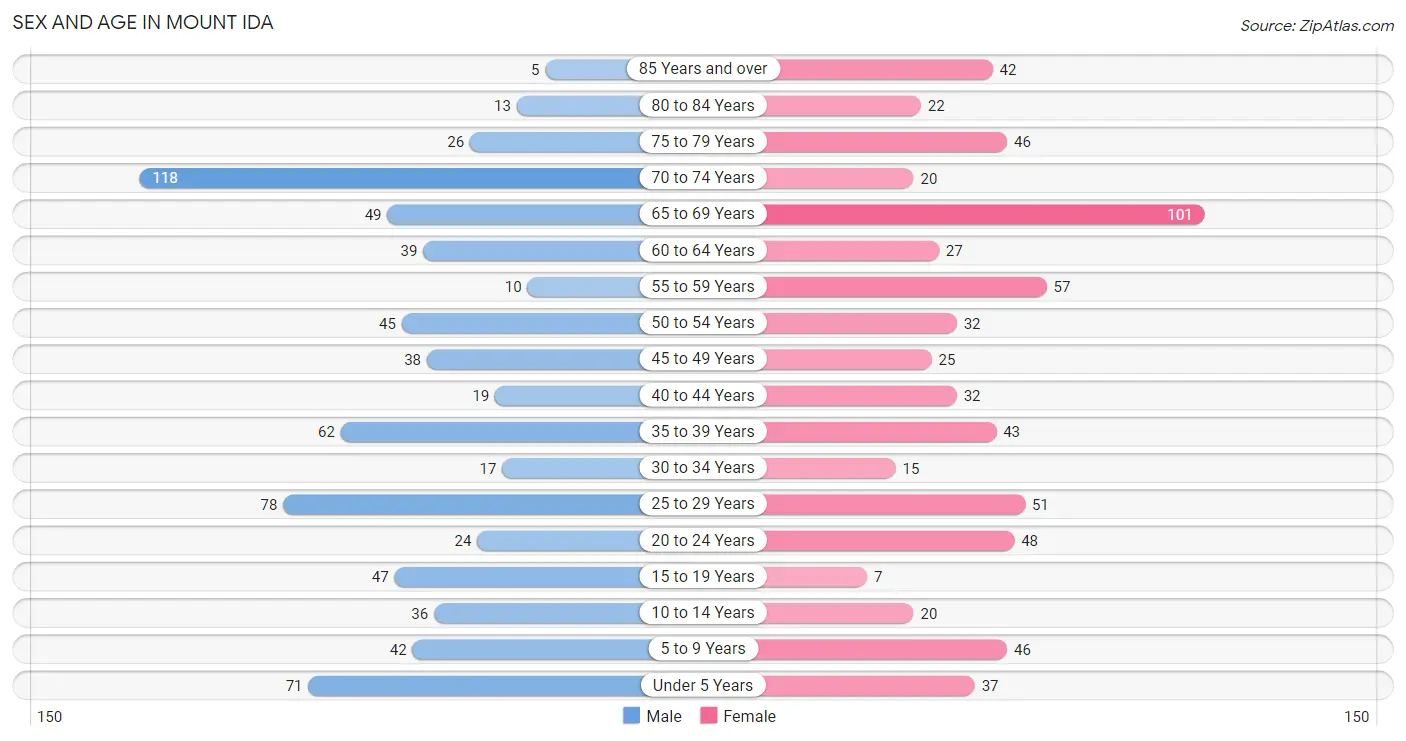
Sex and Age in Mount Ida
The most populous age groups in Mount Ida are 70 to 74 Years (118 | 16.0%) for men and 65 to 69 Years (101 | 15.0%) for women.
| Age Bracket | Male | Female |
| Under 5 Years | 71 (9.6%) | 37 (5.5%) |
| 5 to 9 Years | 42 (5.7%) | 46 (6.9%) |
| 10 to 14 Years | 36 (4.9%) | 20 (3.0%) |
| 15 to 19 Years | 47 (6.4%) | 7 (1.0%) |
| 20 to 24 Years | 24 (3.3%) | 48 (7.1%) |
| 25 to 29 Years | 78 (10.5%) | 51 (7.6%) |
| 30 to 34 Years | 17 (2.3%) | 15 (2.2%) |
| 35 to 39 Years | 62 (8.4%) | 43 (6.4%) |
| 40 to 44 Years | 19 (2.6%) | 32 (4.8%) |
| 45 to 49 Years | 38 (5.1%) | 25 (3.7%) |
| 50 to 54 Years | 45 (6.1%) | 32 (4.8%) |
| 55 to 59 Years | 10 (1.3%) | 57 (8.5%) |
| 60 to 64 Years | 39 (5.3%) | 27 (4.0%) |
| 65 to 69 Years | 49 (6.6%) | 101 (15.0%) |
| 70 to 74 Years | 118 (16.0%) | 20 (3.0%) |
| 75 to 79 Years | 26 (3.5%) | 46 (6.9%) |
| 80 to 84 Years | 13 (1.8%) | 22 (3.3%) |
| 85 Years and over | 5 (0.7%) | 42 (6.3%) |
| Total | 739 (100.0%) | 671 (100.0%) |
Families and Households in Mount Ida
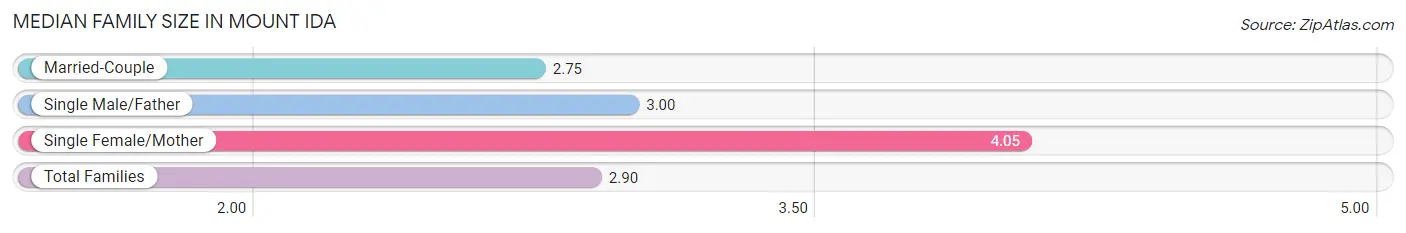
Median Family Size in Mount Ida
The median family size in Mount Ida is 2.90 persons per family, with single female/mother families (42 | 11.1%) accounting for the largest median family size of 4.05 persons per family. On the other hand, married-couple families (321 | 84.9%) represent the smallest median family size with 2.75 persons per family.
| Family Type | # Families | Family Size |
| Married-Couple | 321 (84.9%) | 2.75 |
| Single Male/Father | 15 (4.0%) | 3.00 |
| Single Female/Mother | 42 (11.1%) | 4.05 |
| Total Families | 378 (100.0%) | 2.90 |
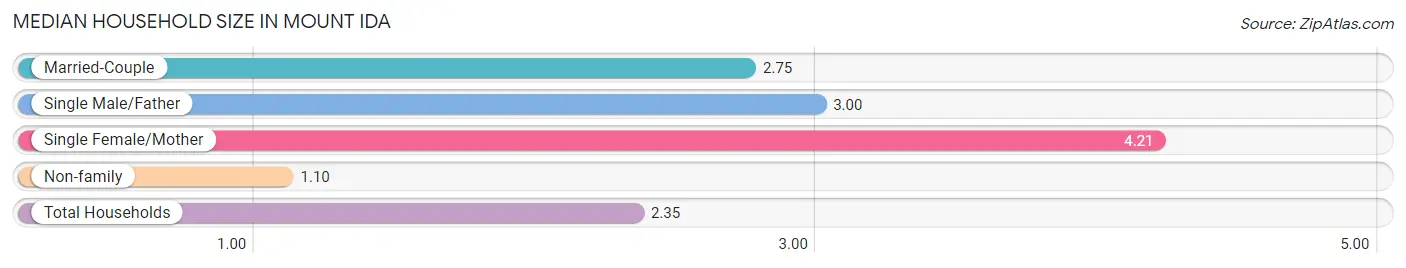
Median Household Size in Mount Ida
The median household size in Mount Ida is 2.35 persons per household, with single female/mother households (42 | 7.6%) accounting for the largest median household size of 4.21 persons per household. non-family households (172 | 31.3%) represent the smallest median household size with 1.10 persons per household.
| Household Type | # Households | Household Size |
| Married-Couple | 321 (58.4%) | 2.75 |
| Single Male/Father | 15 (2.7%) | 3.00 |
| Single Female/Mother | 42 (7.6%) | 4.21 |
| Non-family | 172 (31.3%) | 1.10 |
| Total Households | 550 (100.0%) | 2.35 |
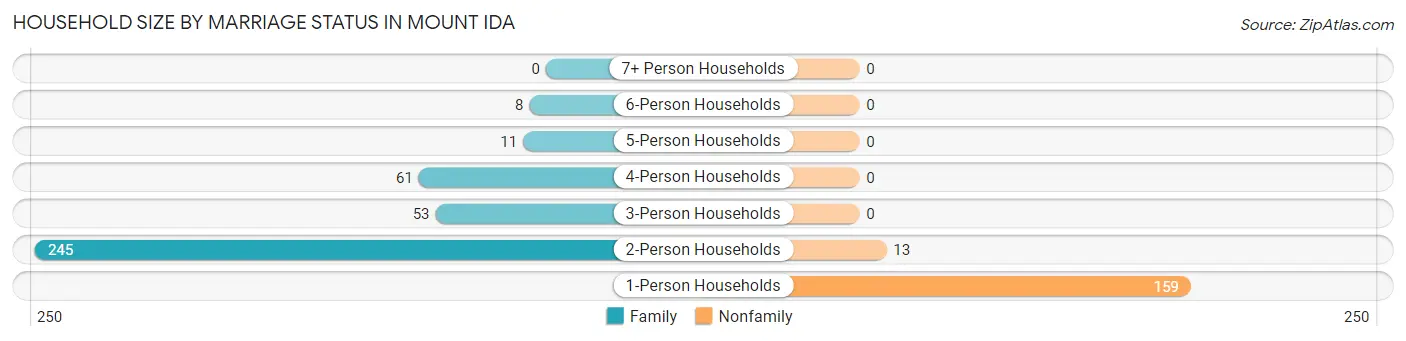
Household Size by Marriage Status in Mount Ida
Out of a total of 550 households in Mount Ida, 378 (68.7%) are family households, while 172 (31.3%) are nonfamily households. The most numerous type of family households are 2-person households, comprising 245, and the most common type of nonfamily households are 1-person households, comprising 159.
| Household Size | Family Households | Nonfamily Households |
| 1-Person Households | - | 159 (28.9%) |
| 2-Person Households | 245 (44.6%) | 13 (2.4%) |
| 3-Person Households | 53 (9.6%) | 0 (0.0%) |
| 4-Person Households | 61 (11.1%) | 0 (0.0%) |
| 5-Person Households | 11 (2.0%) | 0 (0.0%) |
| 6-Person Households | 8 (1.5%) | 0 (0.0%) |
| 7+ Person Households | 0 (0.0%) | 0 (0.0%) |
| Total | 378 (68.7%) | 172 (31.3%) |
Female Fertility in Mount Ida
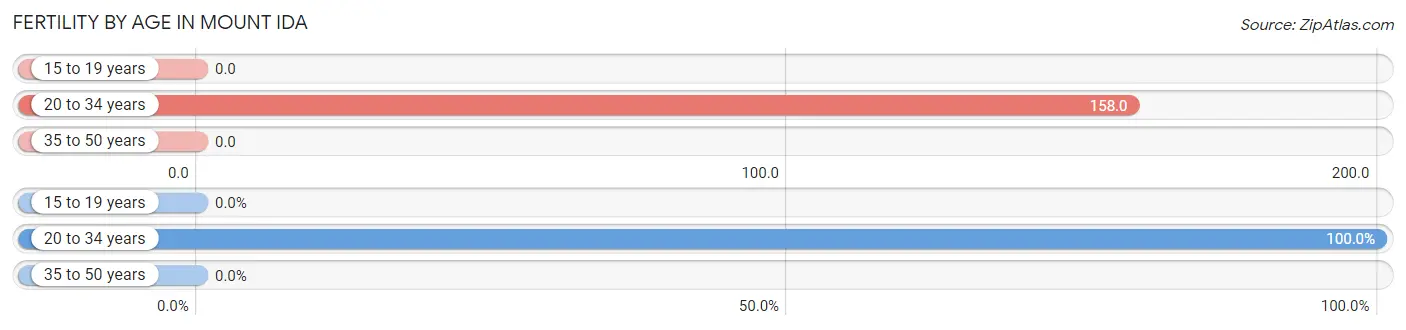
Fertility by Age in Mount Ida
Average fertility rate in Mount Ida is 78.0 births per 1,000 women. Women in the age bracket of 20 to 34 years have the highest fertility rate with 158.0 births per 1,000 women. Women in the age bracket of 20 to 34 years acount for 100.0% of all women with births.
| Age Bracket | Women with Births | Births / 1,000 Women |
| 15 to 19 years | 0 (0.0%) | 0.0 |
| 20 to 34 years | 18 (100.0%) | 158.0 |
| 35 to 50 years | 0 (0.0%) | 0.0 |
| Total | 18 (100.0%) | 78.0 |
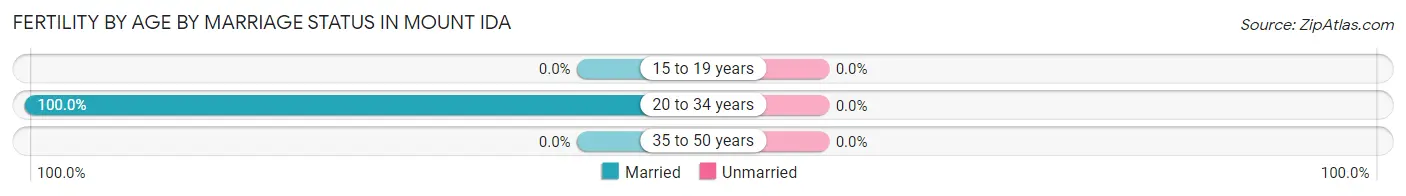
Fertility by Age by Marriage Status in Mount Ida
| Age Bracket | Married | Unmarried |
| 15 to 19 years | 0 (0.0%) | 0 (0.0%) |
| 20 to 34 years | 18 (100.0%) | 0 (0.0%) |
| 35 to 50 years | 0 (0.0%) | 0 (0.0%) |
| Total | 18 (100.0%) | 0 (0.0%) |
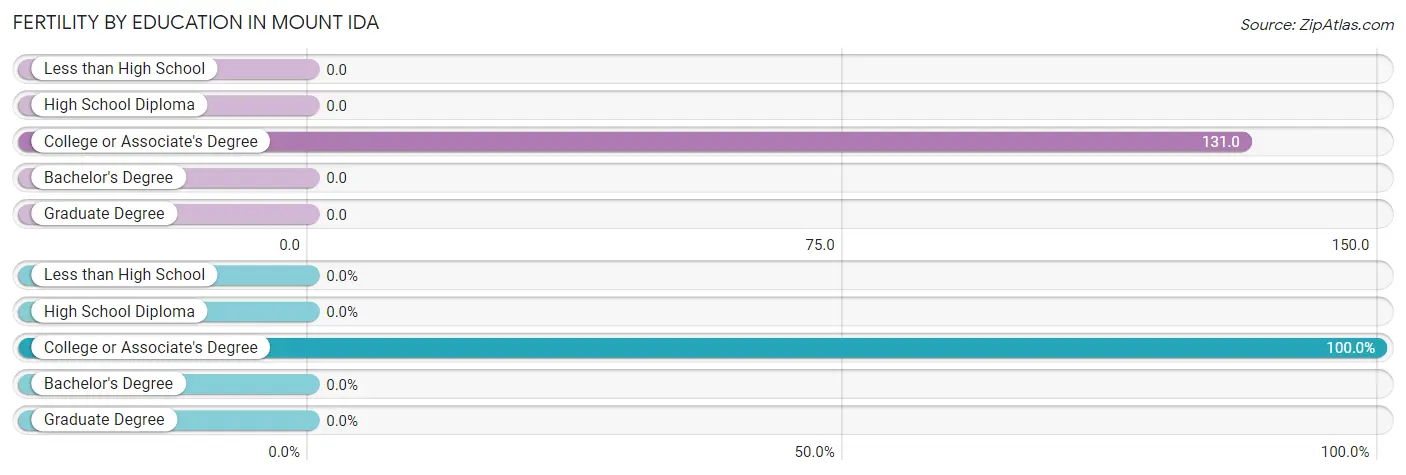
Fertility by Education in Mount Ida
| Educational Attainment | Women with Births | Births / 1,000 Women |
| Less than High School | 0 (0.0%) | 0.0 |
| High School Diploma | 0 (0.0%) | 0.0 |
| College or Associate's Degree | 18 (100.0%) | 131.0 |
| Bachelor's Degree | 0 (0.0%) | 0.0 |
| Graduate Degree | 0 (0.0%) | 0.0 |
| Total | 18 (100.0%) | 78.0 |
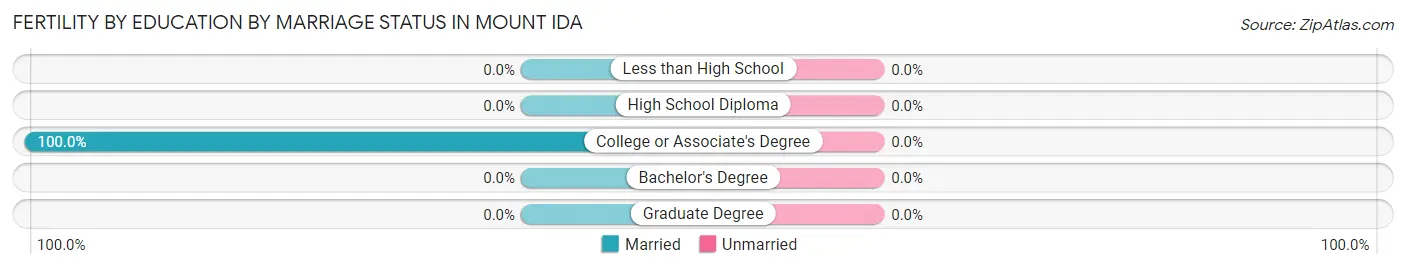
Fertility by Education by Marriage Status in Mount Ida
| Educational Attainment | Married | Unmarried |
| Less than High School | 0 (0.0%) | 0 (0.0%) |
| High School Diploma | 0 (0.0%) | 0 (0.0%) |
| College or Associate's Degree | 18 (100.0%) | 0 (0.0%) |
| Bachelor's Degree | 0 (0.0%) | 0 (0.0%) |
| Graduate Degree | 0 (0.0%) | 0 (0.0%) |
| Total | 18 (100.0%) | 0 (0.0%) |
Employment Characteristics in Mount Ida
Employment by Class of Employer in Mount Ida
Among the 379 employed individuals in Mount Ida, private company employees (269 | 71.0%), state government employees (35 | 9.2%), and self-employed (not incorporated) (31 | 8.2%) make up the most common classes of employment.
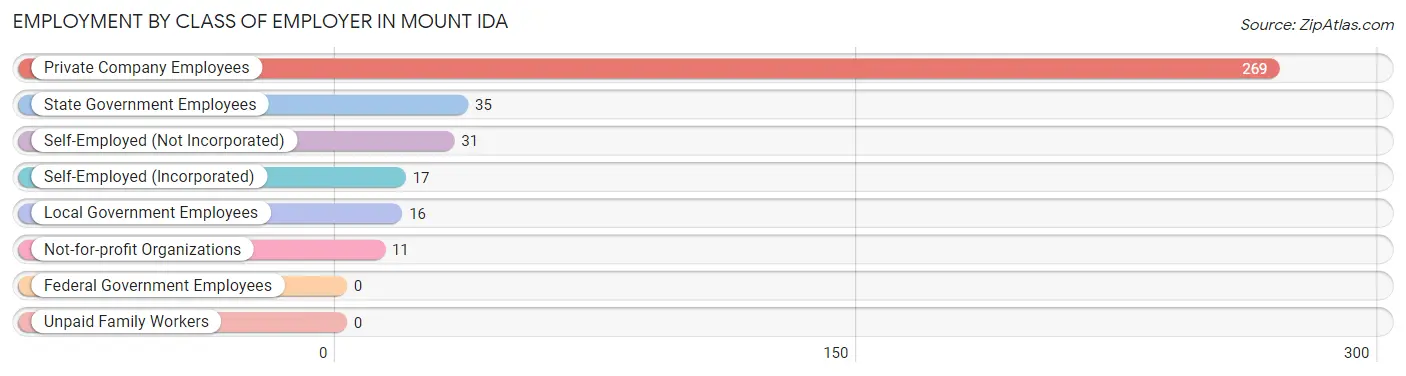
| Employer Class | # Employees | % Employees |
| Private Company Employees | 269 | 71.0% |
| Self-Employed (Incorporated) | 17 | 4.5% |
| Self-Employed (Not Incorporated) | 31 | 8.2% |
| Not-for-profit Organizations | 11 | 2.9% |
| Local Government Employees | 16 | 4.2% |
| State Government Employees | 35 | 9.2% |
| Federal Government Employees | 0 | 0.0% |
| Unpaid Family Workers | 0 | 0.0% |
| Total | 379 | 100.0% |
Employment Status by Age in Mount Ida
According to the labor force statistics for Mount Ida, out of the total population over 16 years of age (1,144), 35.7% or 408 individuals are in the labor force, with 7.1% or 29 of them unemployed. The age group with the highest labor force participation rate is 20 to 24 years, with 75.0% or 54 individuals in the labor force. Within the labor force, the 16 to 19 years age range has the highest percentage of unemployed individuals, with 100.0% or 15 of them being unemployed.
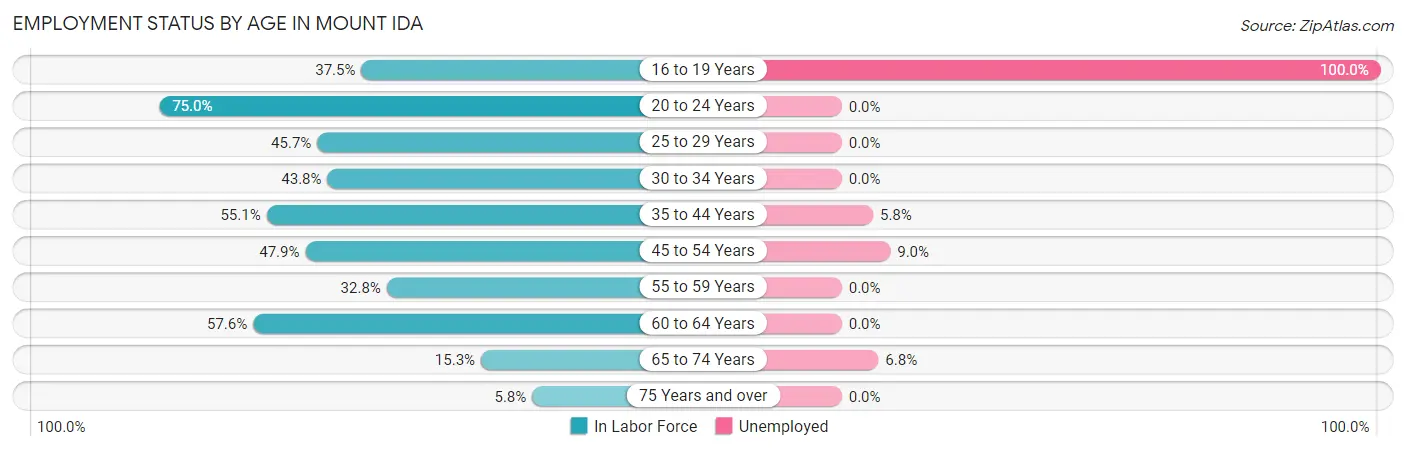
| Age Bracket | In Labor Force | Unemployed |
| 16 to 19 Years | 15 (37.5%) | 15 (100.0%) |
| 20 to 24 Years | 54 (75.0%) | 0 (0.0%) |
| 25 to 29 Years | 59 (45.7%) | 0 (0.0%) |
| 30 to 34 Years | 14 (43.8%) | 0 (0.0%) |
| 35 to 44 Years | 86 (55.1%) | 5 (5.8%) |
| 45 to 54 Years | 67 (47.9%) | 6 (9.0%) |
| 55 to 59 Years | 22 (32.8%) | 0 (0.0%) |
| 60 to 64 Years | 38 (57.6%) | 0 (0.0%) |
| 65 to 74 Years | 44 (15.3%) | 3 (6.8%) |
| 75 Years and over | 9 (5.8%) | 0 (0.0%) |
| Total | 408 (35.7%) | 29 (7.1%) |
Employment Status by Educational Attainment in Mount Ida
According to labor force statistics for Mount Ida, 48.5% of individuals (286) out of the total population between 25 and 64 years of age (590) are in the labor force, with 3.8% or 11 of them being unemployed. The group with the highest labor force participation rate are those with the educational attainment of bachelor's degree or higher, with 64.6% or 51 individuals in the labor force. Within the labor force, individuals with high school diploma education have the highest percentage of unemployment, with 11.4% or 5 of them being unemployed.
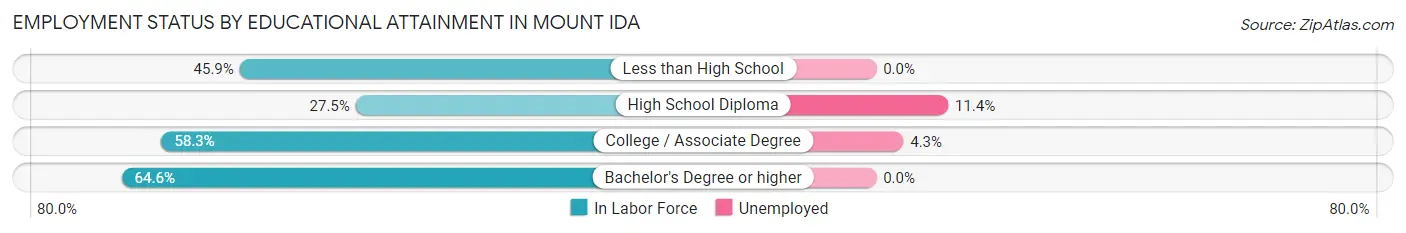
| Educational Attainment | In Labor Force | Unemployed |
| Less than High School | 51 (45.9%) | 0 (0.0%) |
| High School Diploma | 44 (27.5%) | 18 (11.4%) |
| College / Associate Degree | 140 (58.3%) | 10 (4.3%) |
| Bachelor's Degree or higher | 51 (64.6%) | 0 (0.0%) |
| Total | 286 (48.5%) | 22 (3.8%) |
Employment Occupations by Sex in Mount Ida
Management, Business, Science and Arts Occupations
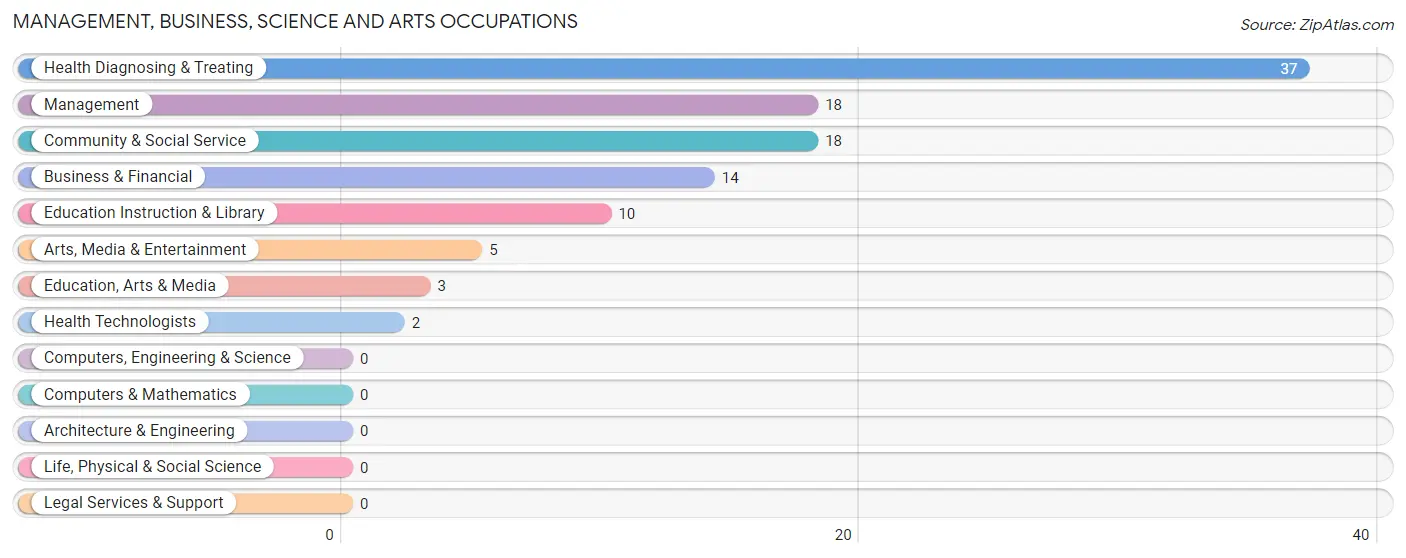
The most common Management, Business, Science and Arts occupations in Mount Ida are Health Diagnosing & Treating (37 | 9.8%), Management (18 | 4.8%), Community & Social Service (18 | 4.8%), Business & Financial (14 | 3.7%), and Education Instruction & Library (10 | 2.6%).
Management, Business, Science and Arts Occupations by Sex
Within the Management, Business, Science and Arts occupations in Mount Ida, the most male-oriented occupations are Business & Financial (100.0%), Education, Arts & Media (100.0%), and Health Technologists (100.0%), while the most female-oriented occupations are Management (100.0%), Education Instruction & Library (100.0%), and Arts, Media & Entertainment (100.0%).
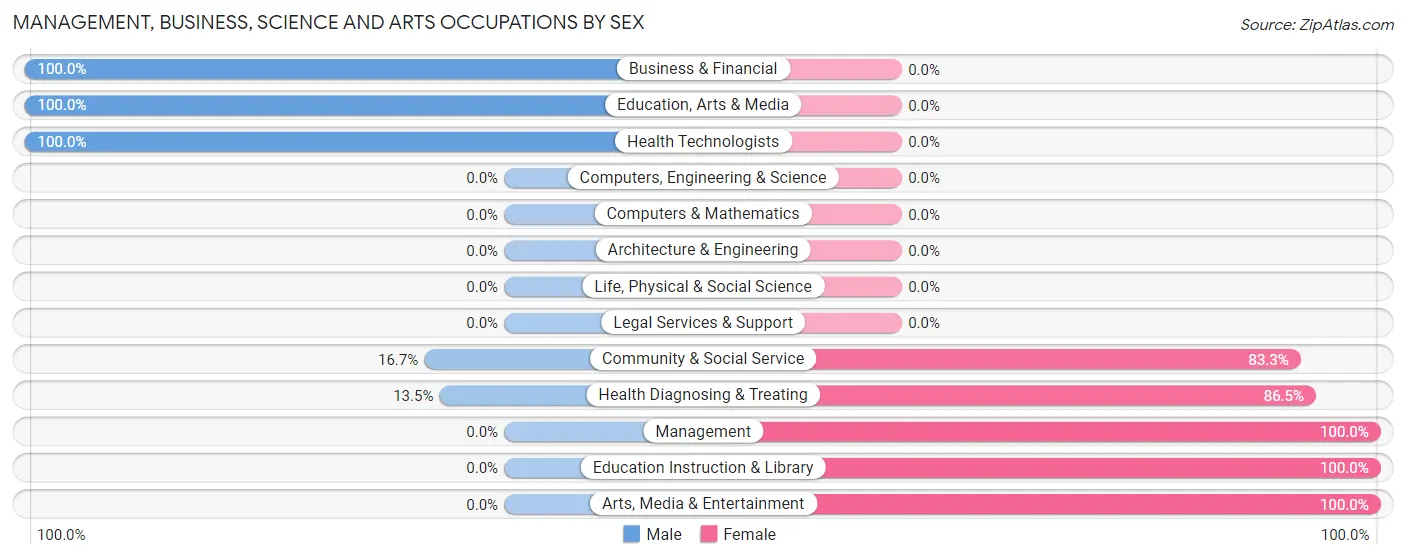
| Occupation | Male | Female |
| Management | 0 (0.0%) | 18 (100.0%) |
| Business & Financial | 14 (100.0%) | 0 (0.0%) |
| Computers, Engineering & Science | 0 (0.0%) | 0 (0.0%) |
| Computers & Mathematics | 0 (0.0%) | 0 (0.0%) |
| Architecture & Engineering | 0 (0.0%) | 0 (0.0%) |
| Life, Physical & Social Science | 0 (0.0%) | 0 (0.0%) |
| Community & Social Service | 3 (16.7%) | 15 (83.3%) |
| Education, Arts & Media | 3 (100.0%) | 0 (0.0%) |
| Legal Services & Support | 0 (0.0%) | 0 (0.0%) |
| Education Instruction & Library | 0 (0.0%) | 10 (100.0%) |
| Arts, Media & Entertainment | 0 (0.0%) | 5 (100.0%) |
| Health Diagnosing & Treating | 5 (13.5%) | 32 (86.5%) |
| Health Technologists | 2 (100.0%) | 0 (0.0%) |
| Total (Category) | 22 (25.3%) | 65 (74.7%) |
| Total (Overall) | 150 (39.6%) | 229 (60.4%) |
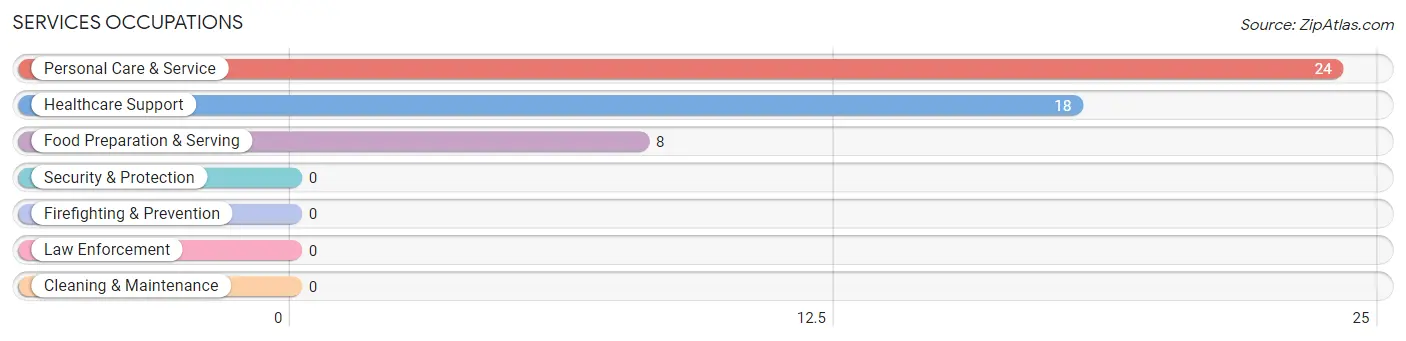
Services Occupations
The most common Services occupations in Mount Ida are Personal Care & Service (24 | 6.3%), Healthcare Support (18 | 4.8%), and Food Preparation & Serving (8 | 2.1%).
Services Occupations by Sex
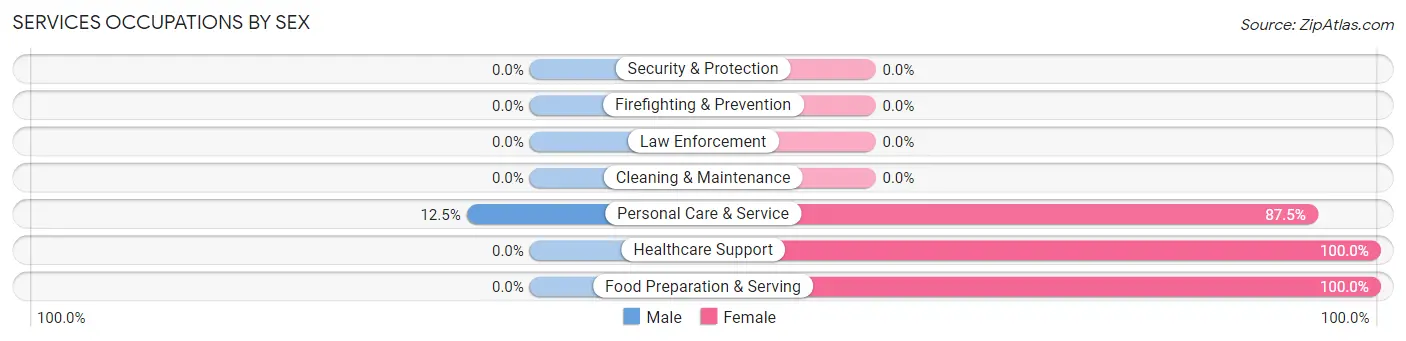
| Occupation | Male | Female |
| Healthcare Support | 0 (0.0%) | 18 (100.0%) |
| Security & Protection | 0 (0.0%) | 0 (0.0%) |
| Firefighting & Prevention | 0 (0.0%) | 0 (0.0%) |
| Law Enforcement | 0 (0.0%) | 0 (0.0%) |
| Food Preparation & Serving | 0 (0.0%) | 8 (100.0%) |
| Cleaning & Maintenance | 0 (0.0%) | 0 (0.0%) |
| Personal Care & Service | 3 (12.5%) | 21 (87.5%) |
| Total (Category) | 3 (6.0%) | 47 (94.0%) |
| Total (Overall) | 150 (39.6%) | 229 (60.4%) |
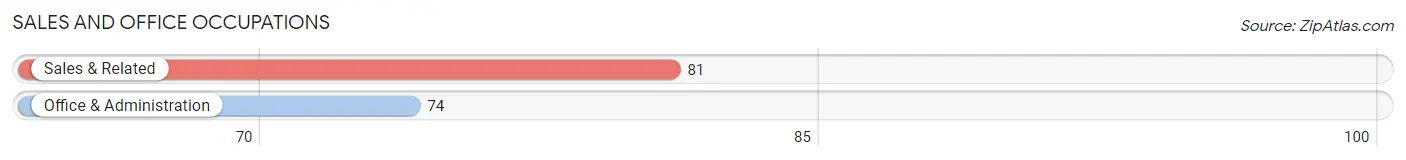
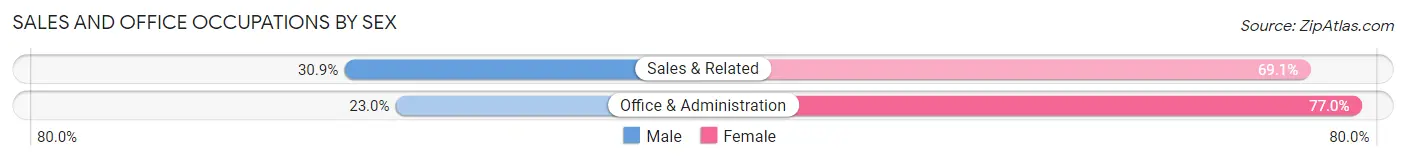
Sales and Office Occupations
The most common Sales and Office occupations in Mount Ida are Sales & Related (81 | 21.4%), and Office & Administration (74 | 19.5%).
Sales and Office Occupations by Sex
| Occupation | Male | Female |
| Sales & Related | 25 (30.9%) | 56 (69.1%) |
| Office & Administration | 17 (23.0%) | 57 (77.0%) |
| Total (Category) | 42 (27.1%) | 113 (72.9%) |
| Total (Overall) | 150 (39.6%) | 229 (60.4%) |
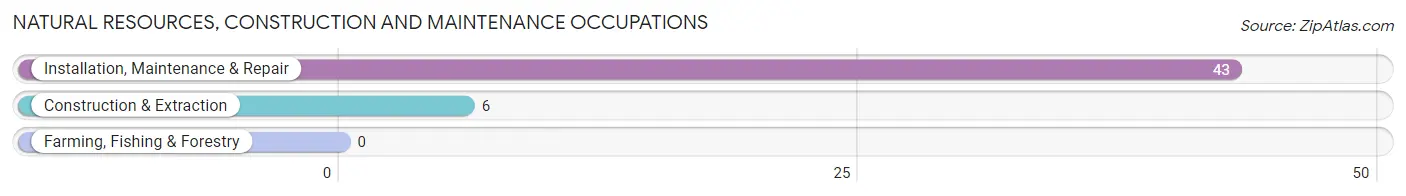
Natural Resources, Construction and Maintenance Occupations
The most common Natural Resources, Construction and Maintenance occupations in Mount Ida are Installation, Maintenance & Repair (43 | 11.4%), and Construction & Extraction (6 | 1.6%).
Natural Resources, Construction and Maintenance Occupations by Sex
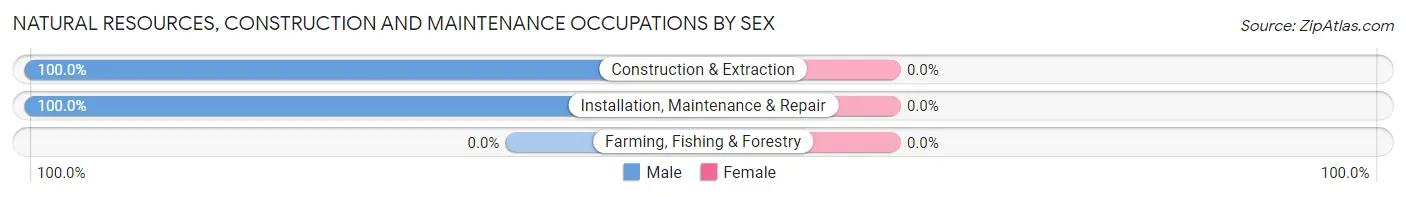
| Occupation | Male | Female |
| Farming, Fishing & Forestry | 0 (0.0%) | 0 (0.0%) |
| Construction & Extraction | 6 (100.0%) | 0 (0.0%) |
| Installation, Maintenance & Repair | 43 (100.0%) | 0 (0.0%) |
| Total (Category) | 49 (100.0%) | 0 (0.0%) |
| Total (Overall) | 150 (39.6%) | 229 (60.4%) |
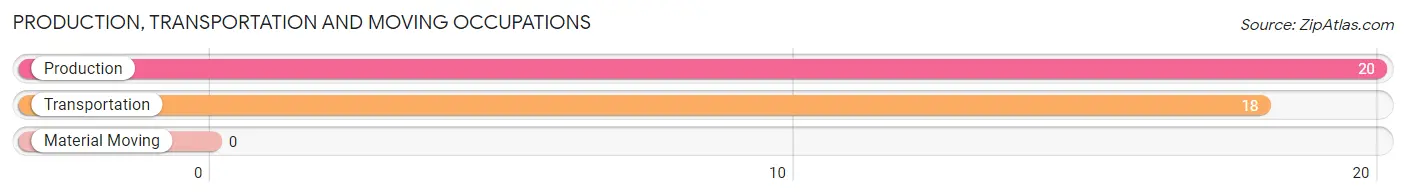
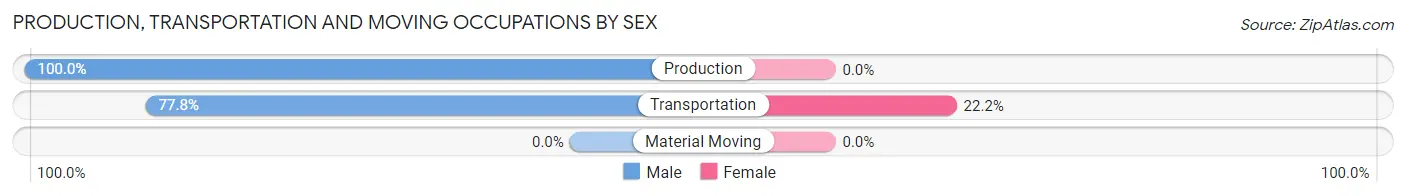
Production, Transportation and Moving Occupations
The most common Production, Transportation and Moving occupations in Mount Ida are Production (20 | 5.3%), and Transportation (18 | 4.8%).
Production, Transportation and Moving Occupations by Sex
| Occupation | Male | Female |
| Production | 20 (100.0%) | 0 (0.0%) |
| Transportation | 14 (77.8%) | 4 (22.2%) |
| Material Moving | 0 (0.0%) | 0 (0.0%) |
| Total (Category) | 34 (89.5%) | 4 (10.5%) |
| Total (Overall) | 150 (39.6%) | 229 (60.4%) |
Employment Industries by Sex in Mount Ida
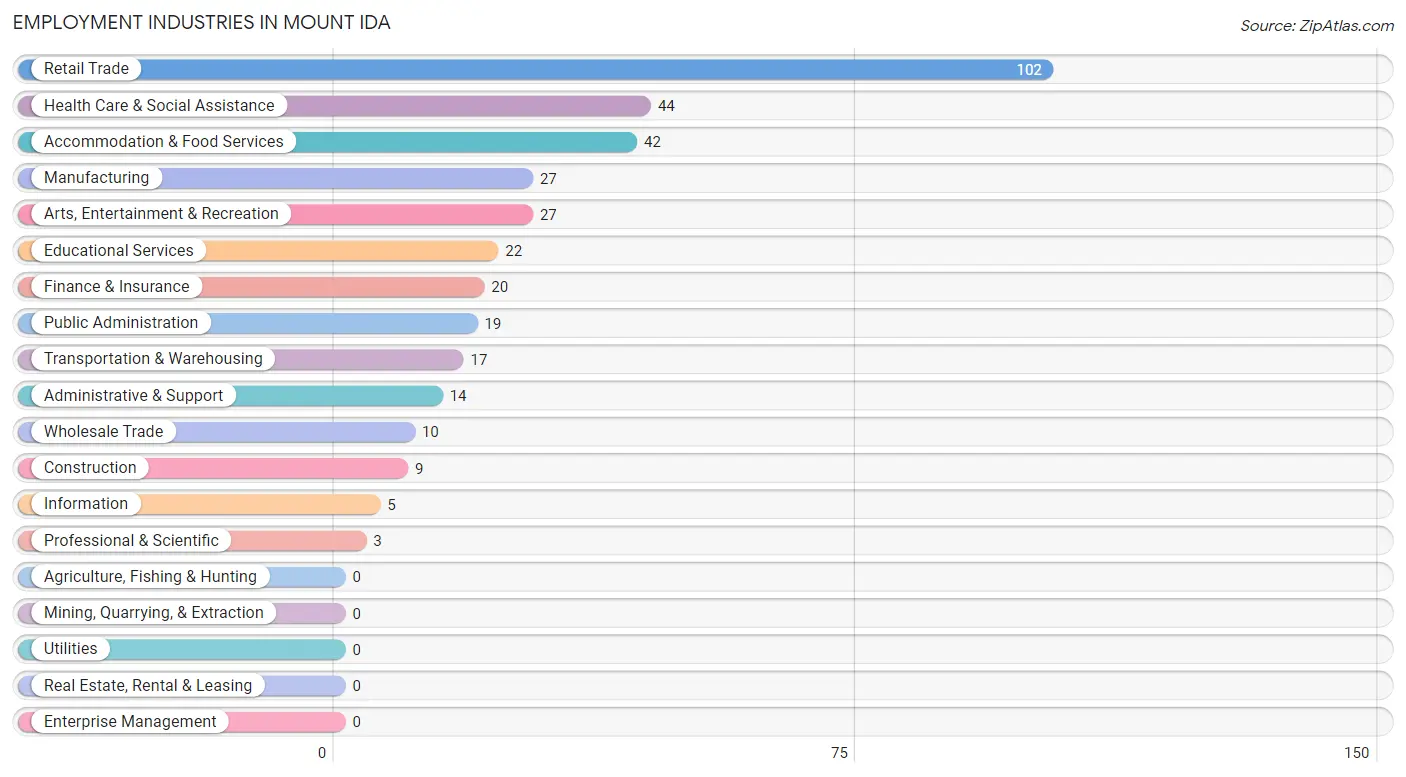
Employment Industries in Mount Ida
The major employment industries in Mount Ida include Retail Trade (102 | 26.9%), Health Care & Social Assistance (44 | 11.6%), Accommodation & Food Services (42 | 11.1%), Manufacturing (27 | 7.1%), and Arts, Entertainment & Recreation (27 | 7.1%).
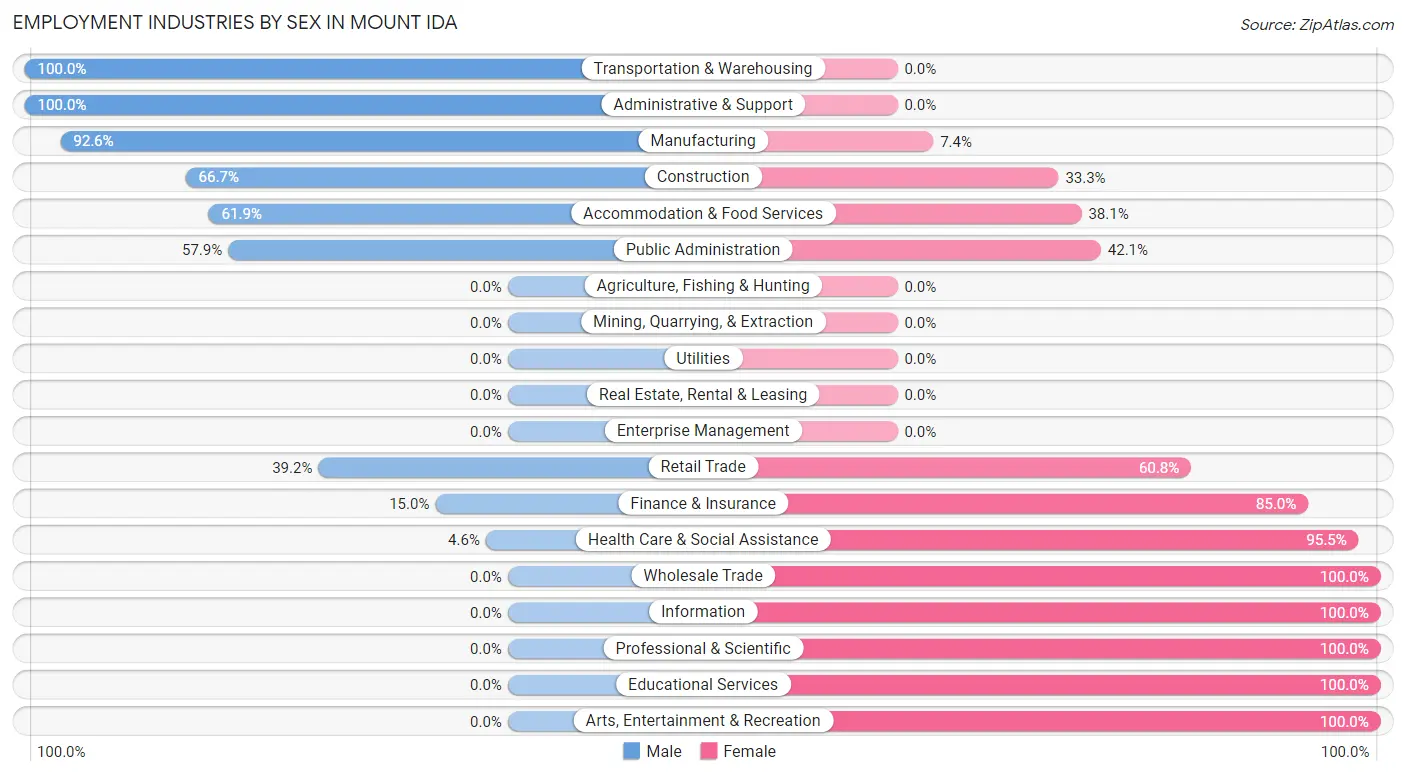
Employment Industries by Sex in Mount Ida
The Mount Ida industries that see more men than women are Transportation & Warehousing (100.0%), Administrative & Support (100.0%), and Manufacturing (92.6%), whereas the industries that tend to have a higher number of women are Wholesale Trade (100.0%), Information (100.0%), and Professional & Scientific (100.0%).
| Industry | Male | Female |
| Agriculture, Fishing & Hunting | 0 (0.0%) | 0 (0.0%) |
| Mining, Quarrying, & Extraction | 0 (0.0%) | 0 (0.0%) |
| Construction | 6 (66.7%) | 3 (33.3%) |
| Manufacturing | 25 (92.6%) | 2 (7.4%) |
| Wholesale Trade | 0 (0.0%) | 10 (100.0%) |
| Retail Trade | 40 (39.2%) | 62 (60.8%) |
| Transportation & Warehousing | 17 (100.0%) | 0 (0.0%) |
| Utilities | 0 (0.0%) | 0 (0.0%) |
| Information | 0 (0.0%) | 5 (100.0%) |
| Finance & Insurance | 3 (15.0%) | 17 (85.0%) |
| Real Estate, Rental & Leasing | 0 (0.0%) | 0 (0.0%) |
| Professional & Scientific | 0 (0.0%) | 3 (100.0%) |
| Enterprise Management | 0 (0.0%) | 0 (0.0%) |
| Administrative & Support | 14 (100.0%) | 0 (0.0%) |
| Educational Services | 0 (0.0%) | 22 (100.0%) |
| Health Care & Social Assistance | 2 (4.5%) | 42 (95.5%) |
| Arts, Entertainment & Recreation | 0 (0.0%) | 27 (100.0%) |
| Accommodation & Food Services | 26 (61.9%) | 16 (38.1%) |
| Public Administration | 11 (57.9%) | 8 (42.1%) |
| Total | 150 (39.6%) | 229 (60.4%) |
Education in Mount Ida
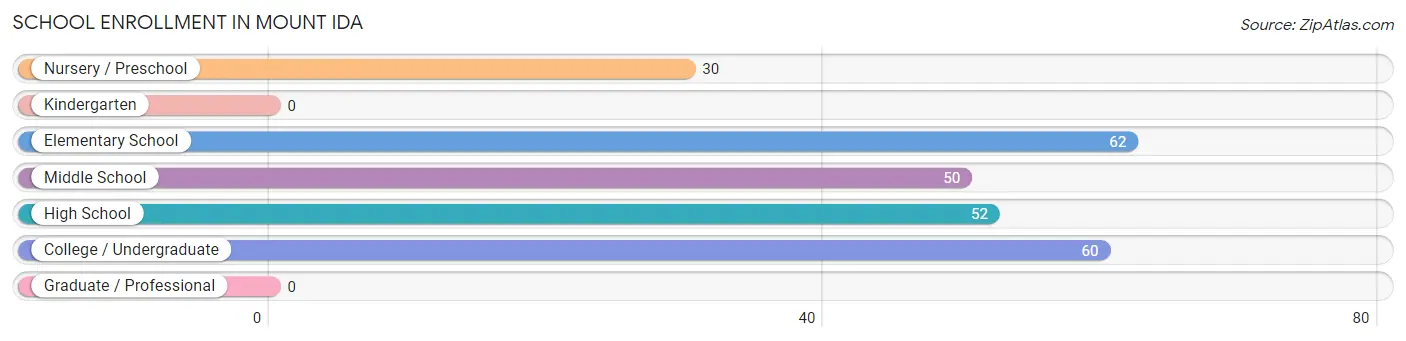
School Enrollment in Mount Ida
The most common levels of schooling among the 254 students in Mount Ida are elementary school (62 | 24.4%), college / undergraduate (60 | 23.6%), and high school (52 | 20.5%).
| School Level | # Students | % Students |
| Nursery / Preschool | 30 | 11.8% |
| Kindergarten | 0 | 0.0% |
| Elementary School | 62 | 24.4% |
| Middle School | 50 | 19.7% |
| High School | 52 | 20.5% |
| College / Undergraduate | 60 | 23.6% |
| Graduate / Professional | 0 | 0.0% |
| Total | 254 | 100.0% |
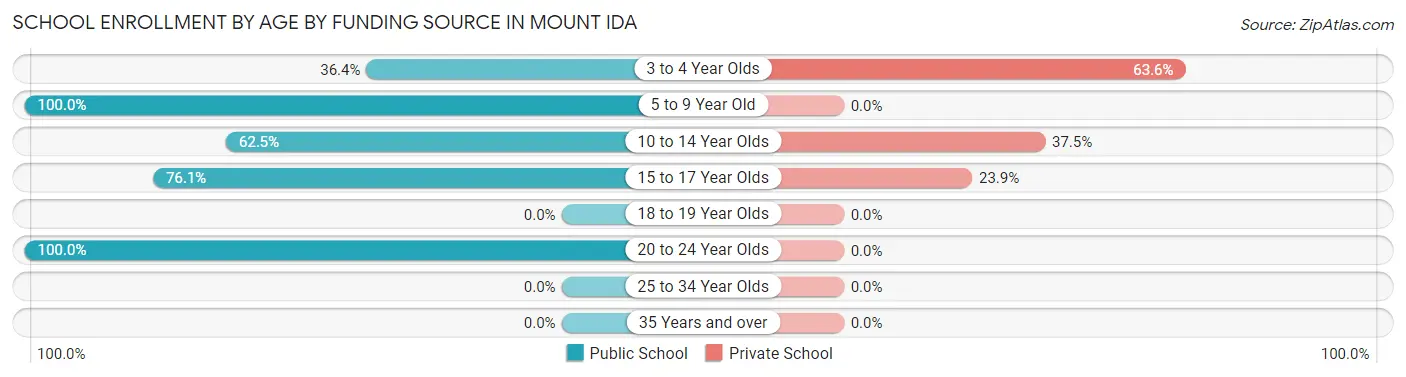
School Enrollment by Age by Funding Source in Mount Ida
Out of a total of 254 students who are enrolled in schools in Mount Ida, 39 (15.4%) attend a private institution, while the remaining 215 (84.6%) are enrolled in public schools. The age group of 3 to 4 year olds has the highest likelihood of being enrolled in private schools, with 7 (63.6% in the age bracket) enrolled. Conversely, the age group of 5 to 9 year old has the lowest likelihood of being enrolled in a private school, with 81 (100.0% in the age bracket) attending a public institution.
| Age Bracket | Public School | Private School |
| 3 to 4 Year Olds | 4 (36.4%) | 7 (63.6%) |
| 5 to 9 Year Old | 81 (100.0%) | 0 (0.0%) |
| 10 to 14 Year Olds | 35 (62.5%) | 21 (37.5%) |
| 15 to 17 Year Olds | 35 (76.1%) | 11 (23.9%) |
| 18 to 19 Year Olds | 0 (0.0%) | 0 (0.0%) |
| 20 to 24 Year Olds | 60 (100.0%) | 0 (0.0%) |
| 25 to 34 Year Olds | 0 (0.0%) | 0 (0.0%) |
| 35 Years and over | 0 (0.0%) | 0 (0.0%) |
| Total | 215 (84.6%) | 39 (15.4%) |
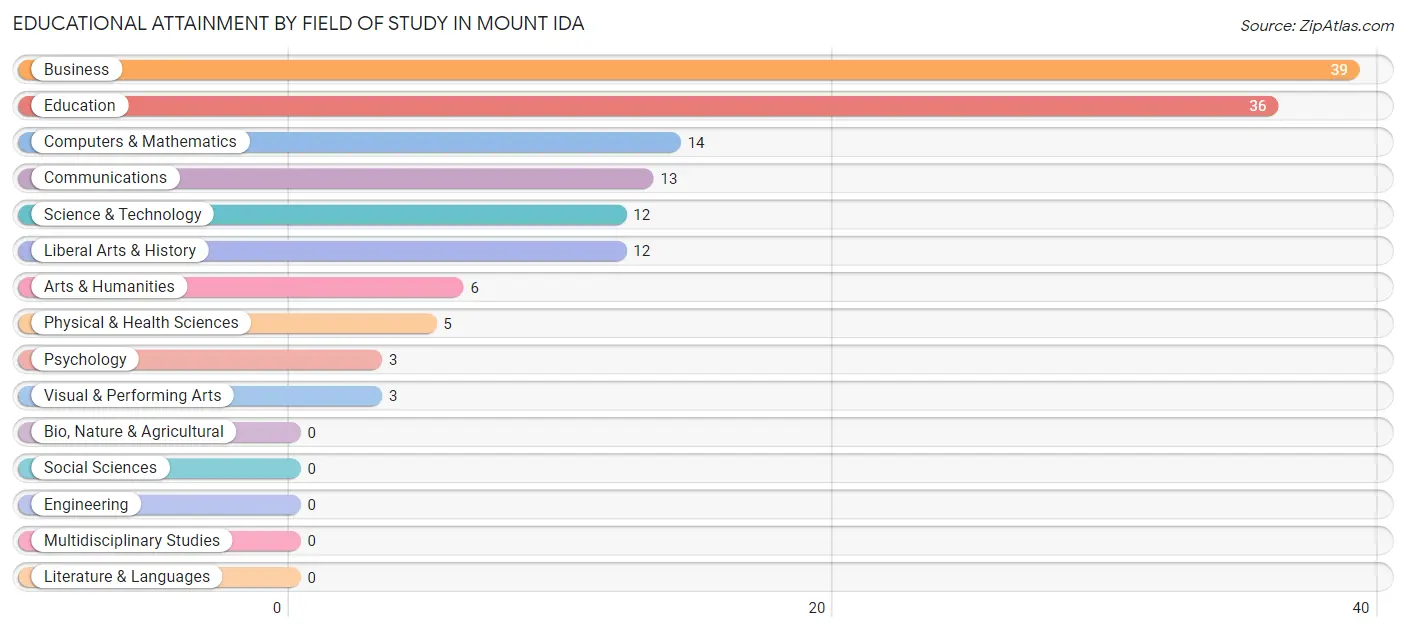
Educational Attainment by Field of Study in Mount Ida
Business (39 | 27.3%), education (36 | 25.2%), computers & mathematics (14 | 9.8%), communications (13 | 9.1%), and science & technology (12 | 8.4%) are the most common fields of study among 143 individuals in Mount Ida who have obtained a bachelor's degree or higher.
| Field of Study | # Graduates | % Graduates |
| Computers & Mathematics | 14 | 9.8% |
| Bio, Nature & Agricultural | 0 | 0.0% |
| Physical & Health Sciences | 5 | 3.5% |
| Psychology | 3 | 2.1% |
| Social Sciences | 0 | 0.0% |
| Engineering | 0 | 0.0% |
| Multidisciplinary Studies | 0 | 0.0% |
| Science & Technology | 12 | 8.4% |
| Business | 39 | 27.3% |
| Education | 36 | 25.2% |
| Literature & Languages | 0 | 0.0% |
| Liberal Arts & History | 12 | 8.4% |
| Visual & Performing Arts | 3 | 2.1% |
| Communications | 13 | 9.1% |
| Arts & Humanities | 6 | 4.2% |
| Total | 143 | 100.0% |
Transportation & Commute in Mount Ida
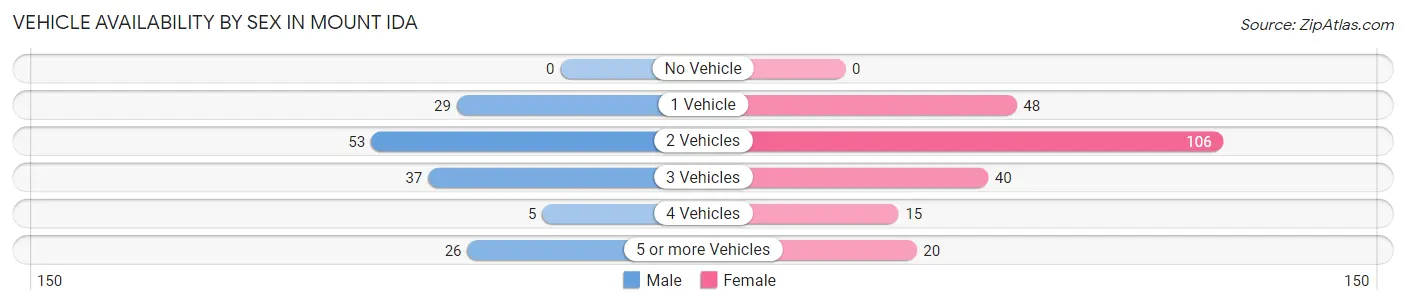
Vehicle Availability by Sex in Mount Ida
The most prevalent vehicle ownership categories in Mount Ida are males with 2 vehicles (53, accounting for 35.3%) and females with 2 vehicles (106, making up 23.1%).
| Vehicles Available | Male | Female |
| No Vehicle | 0 (0.0%) | 0 (0.0%) |
| 1 Vehicle | 29 (19.3%) | 48 (21.0%) |
| 2 Vehicles | 53 (35.3%) | 106 (46.3%) |
| 3 Vehicles | 37 (24.7%) | 40 (17.5%) |
| 4 Vehicles | 5 (3.3%) | 15 (6.6%) |
| 5 or more Vehicles | 26 (17.3%) | 20 (8.7%) |
| Total | 150 (100.0%) | 229 (100.0%) |
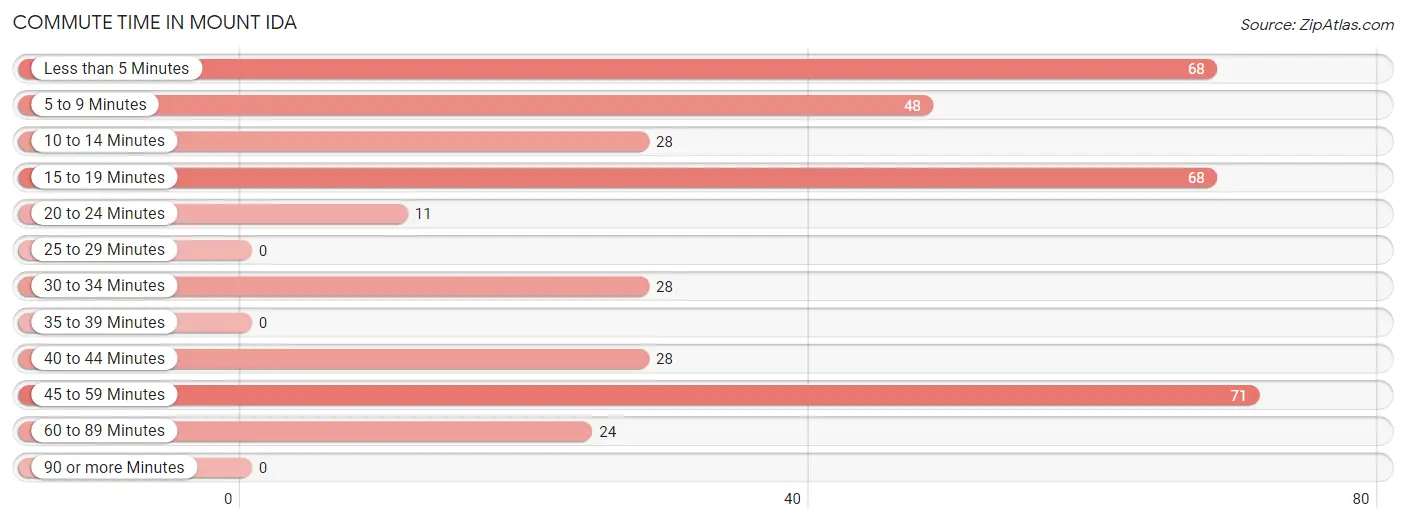
Commute Time in Mount Ida
The most frequently occuring commute durations in Mount Ida are 45 to 59 minutes (71 commuters, 19.0%), less than 5 minutes (68 commuters, 18.2%), and 15 to 19 minutes (68 commuters, 18.2%).
| Commute Time | # Commuters | % Commuters |
| Less than 5 Minutes | 68 | 18.2% |
| 5 to 9 Minutes | 48 | 12.8% |
| 10 to 14 Minutes | 28 | 7.5% |
| 15 to 19 Minutes | 68 | 18.2% |
| 20 to 24 Minutes | 11 | 2.9% |
| 25 to 29 Minutes | 0 | 0.0% |
| 30 to 34 Minutes | 28 | 7.5% |
| 35 to 39 Minutes | 0 | 0.0% |
| 40 to 44 Minutes | 28 | 7.5% |
| 45 to 59 Minutes | 71 | 19.0% |
| 60 to 89 Minutes | 24 | 6.4% |
| 90 or more Minutes | 0 | 0.0% |
Commute Time by Sex in Mount Ida
The most common commute times in Mount Ida are 15 to 19 minutes (43 commuters, 28.7%) for males and less than 5 minutes (62 commuters, 27.7%) for females.
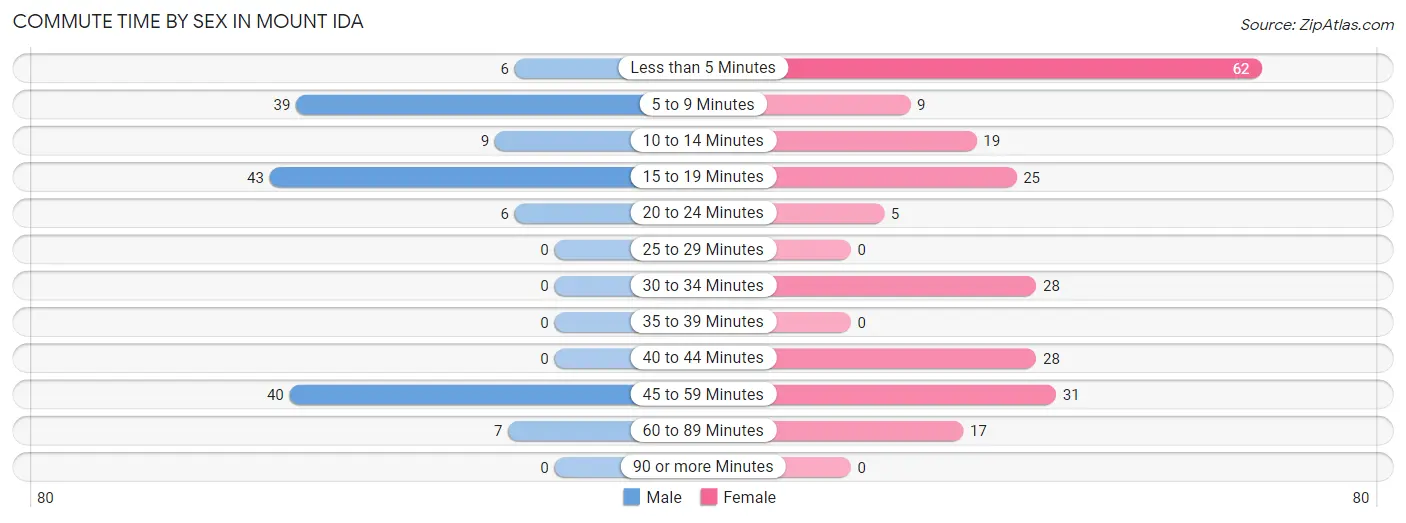
| Commute Time | Male | Female |
| Less than 5 Minutes | 6 (4.0%) | 62 (27.7%) |
| 5 to 9 Minutes | 39 (26.0%) | 9 (4.0%) |
| 10 to 14 Minutes | 9 (6.0%) | 19 (8.5%) |
| 15 to 19 Minutes | 43 (28.7%) | 25 (11.2%) |
| 20 to 24 Minutes | 6 (4.0%) | 5 (2.2%) |
| 25 to 29 Minutes | 0 (0.0%) | 0 (0.0%) |
| 30 to 34 Minutes | 0 (0.0%) | 28 (12.5%) |
| 35 to 39 Minutes | 0 (0.0%) | 0 (0.0%) |
| 40 to 44 Minutes | 0 (0.0%) | 28 (12.5%) |
| 45 to 59 Minutes | 40 (26.7%) | 31 (13.8%) |
| 60 to 89 Minutes | 7 (4.7%) | 17 (7.6%) |
| 90 or more Minutes | 0 (0.0%) | 0 (0.0%) |
Time of Departure to Work by Sex in Mount Ida
The most frequent times of departure to work in Mount Ida are 7:00 AM to 7:29 AM (71, 47.3%) for males and 7:00 AM to 7:29 AM (85, 38.0%) for females.
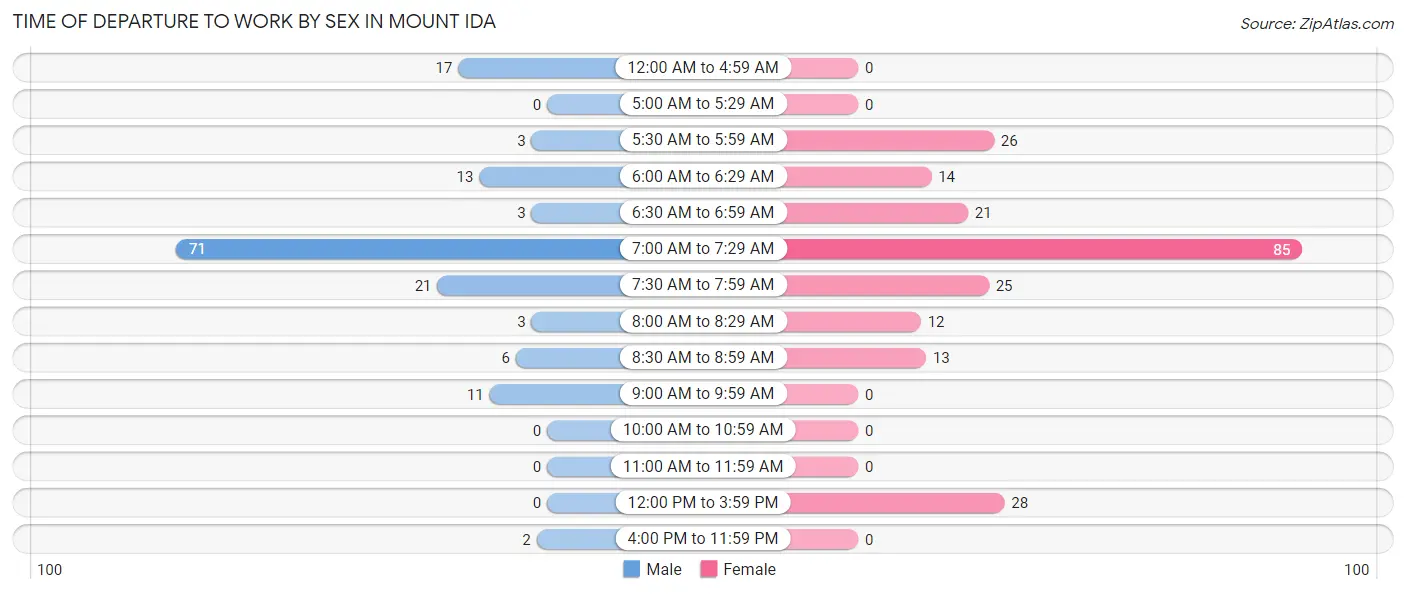
| Time of Departure | Male | Female |
| 12:00 AM to 4:59 AM | 17 (11.3%) | 0 (0.0%) |
| 5:00 AM to 5:29 AM | 0 (0.0%) | 0 (0.0%) |
| 5:30 AM to 5:59 AM | 3 (2.0%) | 26 (11.6%) |
| 6:00 AM to 6:29 AM | 13 (8.7%) | 14 (6.2%) |
| 6:30 AM to 6:59 AM | 3 (2.0%) | 21 (9.4%) |
| 7:00 AM to 7:29 AM | 71 (47.3%) | 85 (38.0%) |
| 7:30 AM to 7:59 AM | 21 (14.0%) | 25 (11.2%) |
| 8:00 AM to 8:29 AM | 3 (2.0%) | 12 (5.4%) |
| 8:30 AM to 8:59 AM | 6 (4.0%) | 13 (5.8%) |
| 9:00 AM to 9:59 AM | 11 (7.3%) | 0 (0.0%) |
| 10:00 AM to 10:59 AM | 0 (0.0%) | 0 (0.0%) |
| 11:00 AM to 11:59 AM | 0 (0.0%) | 0 (0.0%) |
| 12:00 PM to 3:59 PM | 0 (0.0%) | 28 (12.5%) |
| 4:00 PM to 11:59 PM | 2 (1.3%) | 0 (0.0%) |
| Total | 150 (100.0%) | 224 (100.0%) |
Housing Occupancy in Mount Ida
Occupancy by Ownership in Mount Ida
Of the total 550 dwellings in Mount Ida, owner-occupied units account for 328 (59.6%), while renter-occupied units make up 222 (40.4%).
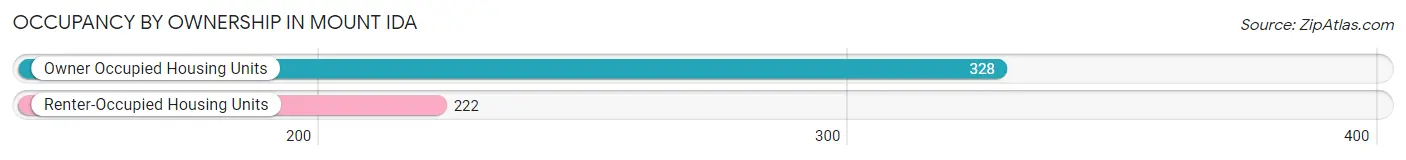
| Occupancy | # Housing Units | % Housing Units |
| Owner Occupied Housing Units | 328 | 59.6% |
| Renter-Occupied Housing Units | 222 | 40.4% |
| Total Occupied Housing Units | 550 | 100.0% |
Occupancy by Household Size in Mount Ida
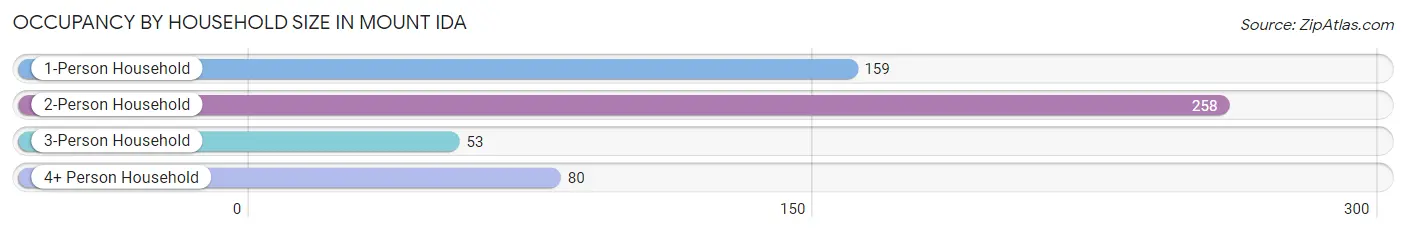
| Household Size | # Housing Units | % Housing Units |
| 1-Person Household | 159 | 28.9% |
| 2-Person Household | 258 | 46.9% |
| 3-Person Household | 53 | 9.6% |
| 4+ Person Household | 80 | 14.5% |
| Total Housing Units | 550 | 100.0% |
Occupancy by Ownership by Household Size in Mount Ida
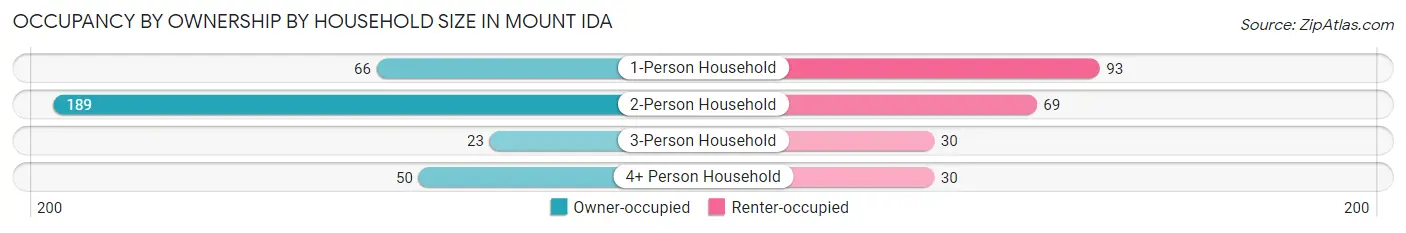
| Household Size | Owner-occupied | Renter-occupied |
| 1-Person Household | 66 (41.5%) | 93 (58.5%) |
| 2-Person Household | 189 (73.3%) | 69 (26.7%) |
| 3-Person Household | 23 (43.4%) | 30 (56.6%) |
| 4+ Person Household | 50 (62.5%) | 30 (37.5%) |
| Total Housing Units | 328 (59.6%) | 222 (40.4%) |
Occupancy by Educational Attainment in Mount Ida
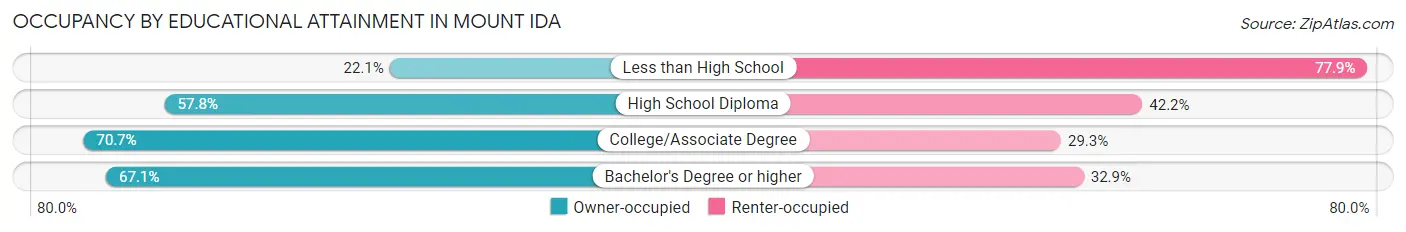
| Household Size | Owner-occupied | Renter-occupied |
| Less than High School | 21 (22.1%) | 74 (77.9%) |
| High School Diploma | 52 (57.8%) | 38 (42.2%) |
| College/Associate Degree | 200 (70.7%) | 83 (29.3%) |
| Bachelor's Degree or higher | 55 (67.1%) | 27 (32.9%) |
Occupancy by Age of Householder in Mount Ida
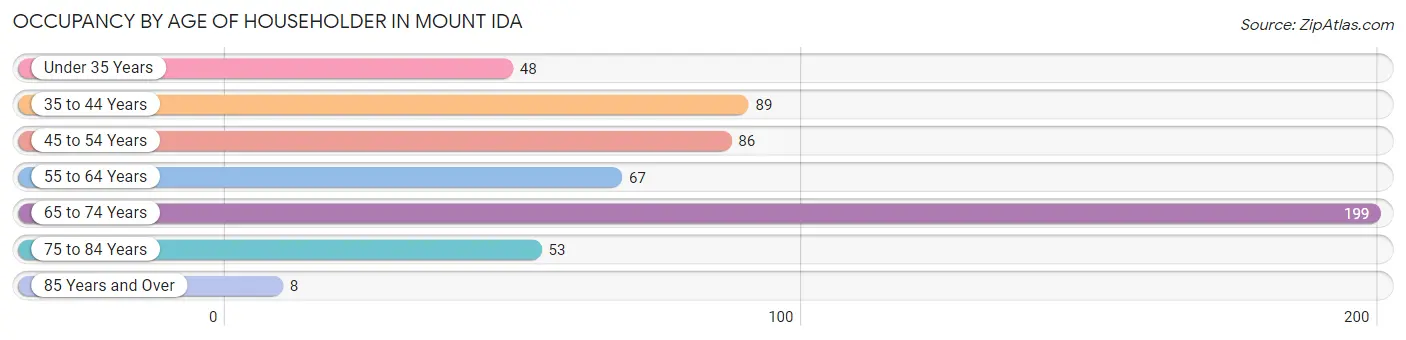
| Age Bracket | # Households | % Households |
| Under 35 Years | 48 | 8.7% |
| 35 to 44 Years | 89 | 16.2% |
| 45 to 54 Years | 86 | 15.6% |
| 55 to 64 Years | 67 | 12.2% |
| 65 to 74 Years | 199 | 36.2% |
| 75 to 84 Years | 53 | 9.6% |
| 85 Years and Over | 8 | 1.5% |
| Total | 550 | 100.0% |
Housing Finances in Mount Ida
Median Income by Occupancy in Mount Ida
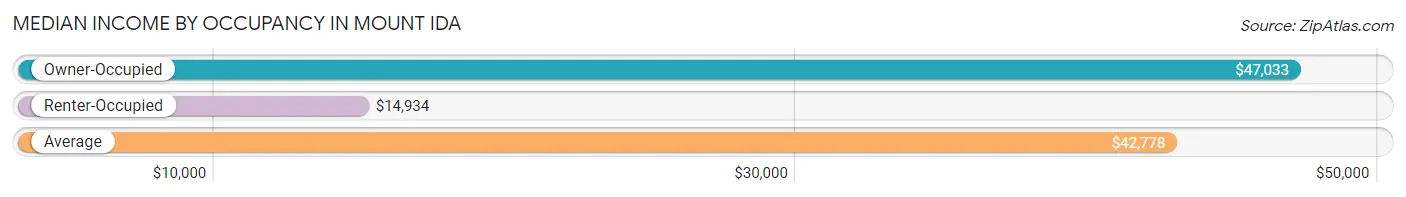
| Occupancy Type | # Households | Median Income |
| Owner-Occupied | 328 (59.6%) | $47,033 |
| Renter-Occupied | 222 (40.4%) | $14,934 |
| Average | 550 (100.0%) | $42,778 |
Occupancy by Householder Income Bracket in Mount Ida
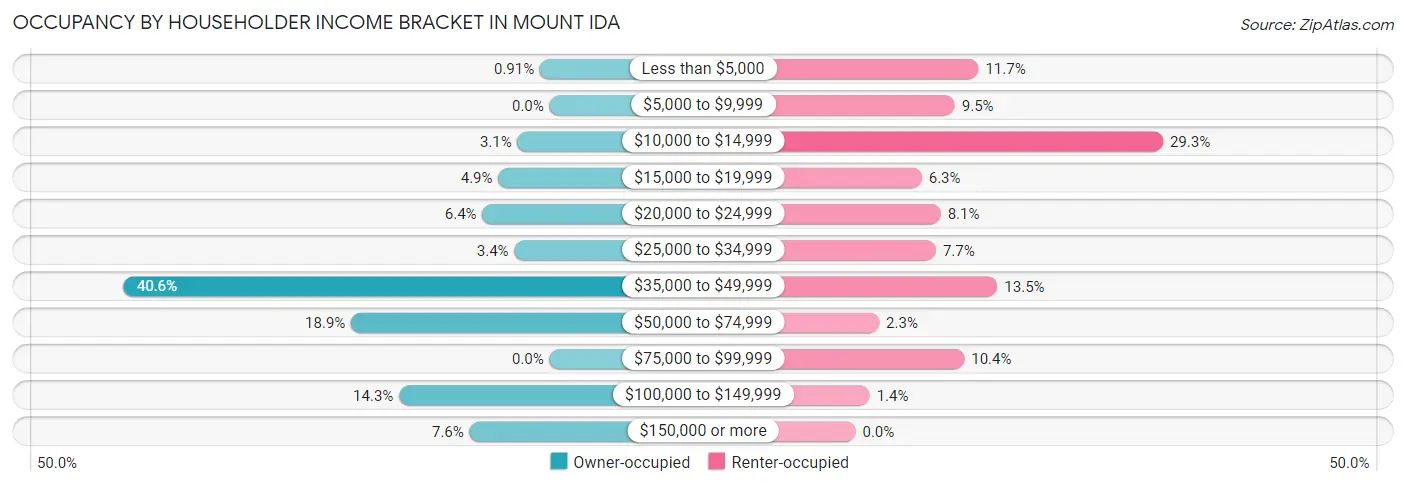
| Income Bracket | Owner-occupied | Renter-occupied |
| Less than $5,000 | 3 (0.9%) | 26 (11.7%) |
| $5,000 to $9,999 | 0 (0.0%) | 21 (9.5%) |
| $10,000 to $14,999 | 10 (3.0%) | 65 (29.3%) |
| $15,000 to $19,999 | 16 (4.9%) | 14 (6.3%) |
| $20,000 to $24,999 | 21 (6.4%) | 18 (8.1%) |
| $25,000 to $34,999 | 11 (3.4%) | 17 (7.7%) |
| $35,000 to $49,999 | 133 (40.6%) | 30 (13.5%) |
| $50,000 to $74,999 | 62 (18.9%) | 5 (2.2%) |
| $75,000 to $99,999 | 0 (0.0%) | 23 (10.4%) |
| $100,000 to $149,999 | 47 (14.3%) | 3 (1.3%) |
| $150,000 or more | 25 (7.6%) | 0 (0.0%) |
| Total | 328 (100.0%) | 222 (100.0%) |
Monthly Housing Cost Tiers in Mount Ida
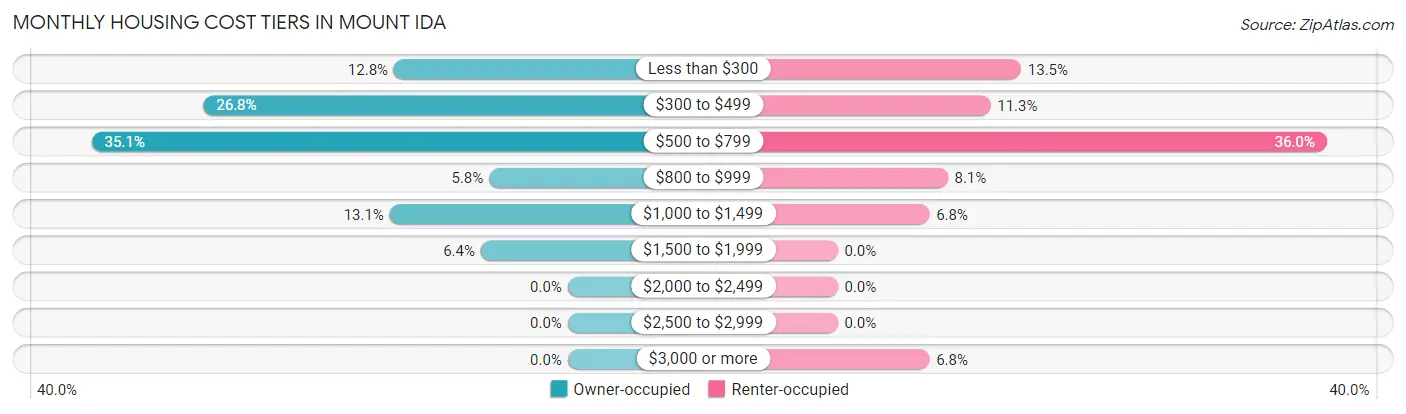
| Monthly Cost | Owner-occupied | Renter-occupied |
| Less than $300 | 42 (12.8%) | 30 (13.5%) |
| $300 to $499 | 88 (26.8%) | 25 (11.3%) |
| $500 to $799 | 115 (35.1%) | 80 (36.0%) |
| $800 to $999 | 19 (5.8%) | 18 (8.1%) |
| $1,000 to $1,499 | 43 (13.1%) | 15 (6.8%) |
| $1,500 to $1,999 | 21 (6.4%) | 0 (0.0%) |
| $2,000 to $2,499 | 0 (0.0%) | 0 (0.0%) |
| $2,500 to $2,999 | 0 (0.0%) | 0 (0.0%) |
| $3,000 or more | 0 (0.0%) | 15 (6.8%) |
| Total | 328 (100.0%) | 222 (100.0%) |
Physical Housing Characteristics in Mount Ida
Housing Structures in Mount Ida
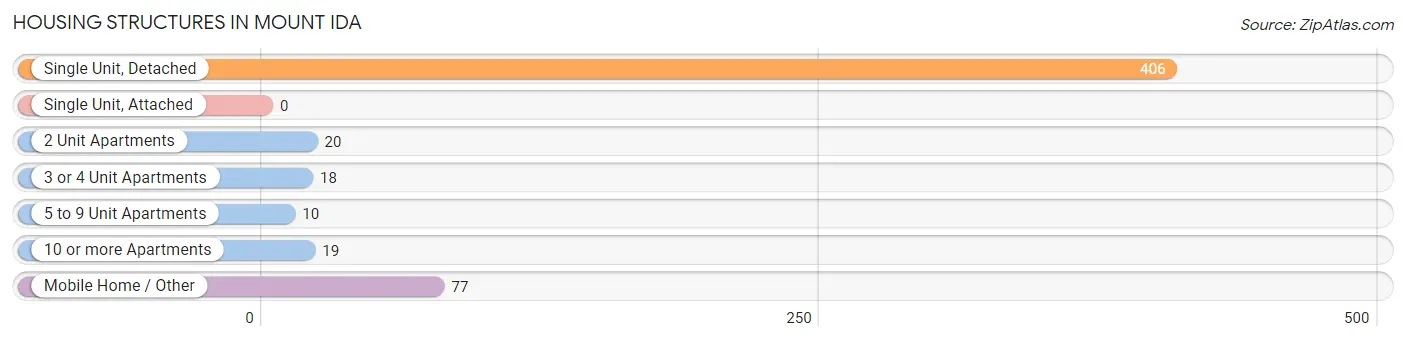
| Structure Type | # Housing Units | % Housing Units |
| Single Unit, Detached | 406 | 73.8% |
| Single Unit, Attached | 0 | 0.0% |
| 2 Unit Apartments | 20 | 3.6% |
| 3 or 4 Unit Apartments | 18 | 3.3% |
| 5 to 9 Unit Apartments | 10 | 1.8% |
| 10 or more Apartments | 19 | 3.5% |
| Mobile Home / Other | 77 | 14.0% |
| Total | 550 | 100.0% |
Housing Structures by Occupancy in Mount Ida
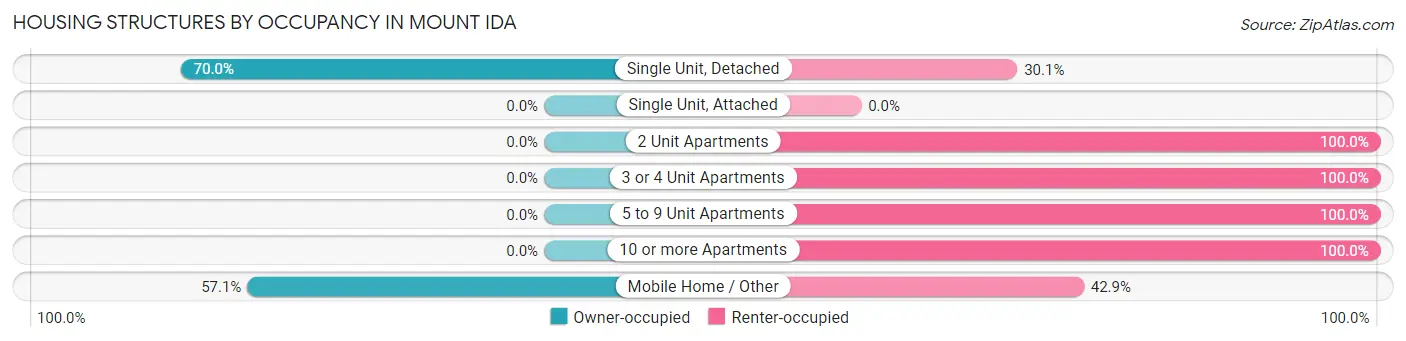
| Structure Type | Owner-occupied | Renter-occupied |
| Single Unit, Detached | 284 (70.0%) | 122 (30.0%) |
| Single Unit, Attached | 0 (0.0%) | 0 (0.0%) |
| 2 Unit Apartments | 0 (0.0%) | 20 (100.0%) |
| 3 or 4 Unit Apartments | 0 (0.0%) | 18 (100.0%) |
| 5 to 9 Unit Apartments | 0 (0.0%) | 10 (100.0%) |
| 10 or more Apartments | 0 (0.0%) | 19 (100.0%) |
| Mobile Home / Other | 44 (57.1%) | 33 (42.9%) |
| Total | 328 (59.6%) | 222 (40.4%) |
Housing Structures by Number of Rooms in Mount Ida
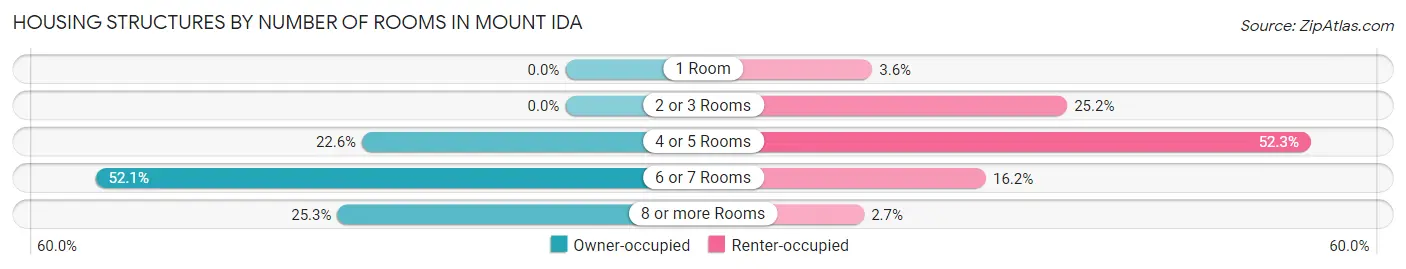
| Number of Rooms | Owner-occupied | Renter-occupied |
| 1 Room | 0 (0.0%) | 8 (3.6%) |
| 2 or 3 Rooms | 0 (0.0%) | 56 (25.2%) |
| 4 or 5 Rooms | 74 (22.6%) | 116 (52.2%) |
| 6 or 7 Rooms | 171 (52.1%) | 36 (16.2%) |
| 8 or more Rooms | 83 (25.3%) | 6 (2.7%) |
| Total | 328 (100.0%) | 222 (100.0%) |
Housing Structure by Heating Type in Mount Ida
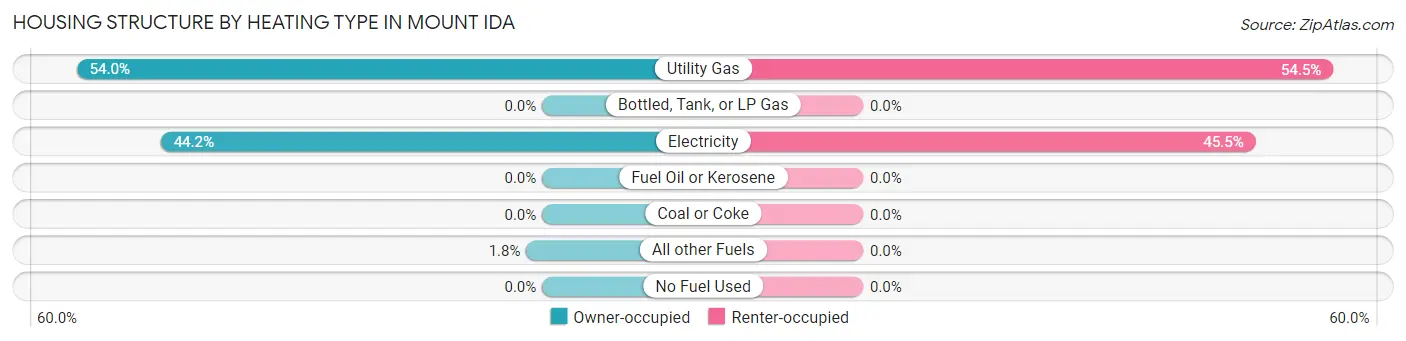
| Heating Type | Owner-occupied | Renter-occupied |
| Utility Gas | 177 (54.0%) | 121 (54.5%) |
| Bottled, Tank, or LP Gas | 0 (0.0%) | 0 (0.0%) |
| Electricity | 145 (44.2%) | 101 (45.5%) |
| Fuel Oil or Kerosene | 0 (0.0%) | 0 (0.0%) |
| Coal or Coke | 0 (0.0%) | 0 (0.0%) |
| All other Fuels | 6 (1.8%) | 0 (0.0%) |
| No Fuel Used | 0 (0.0%) | 0 (0.0%) |
| Total | 328 (100.0%) | 222 (100.0%) |
Household Vehicle Usage in Mount Ida
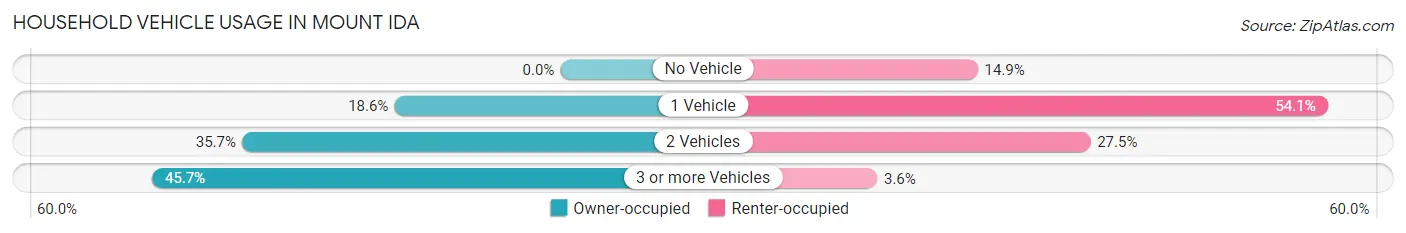
| Vehicles per Household | Owner-occupied | Renter-occupied |
| No Vehicle | 0 (0.0%) | 33 (14.9%) |
| 1 Vehicle | 61 (18.6%) | 120 (54.0%) |
| 2 Vehicles | 117 (35.7%) | 61 (27.5%) |
| 3 or more Vehicles | 150 (45.7%) | 8 (3.6%) |
| Total | 328 (100.0%) | 222 (100.0%) |
Real Estate & Mortgages in Mount Ida
Real Estate and Mortgage Overview in Mount Ida
| Characteristic | Without Mortgage | With Mortgage |
| Housing Units | 215 | 113 |
| Median Property Value | $161,300 | $117,500 |
| Median Household Income | $46,183 | $5 |
| Monthly Housing Costs | $449 | $0 |
| Real Estate Taxes | - | - |
Property Value by Mortgage Status in Mount Ida
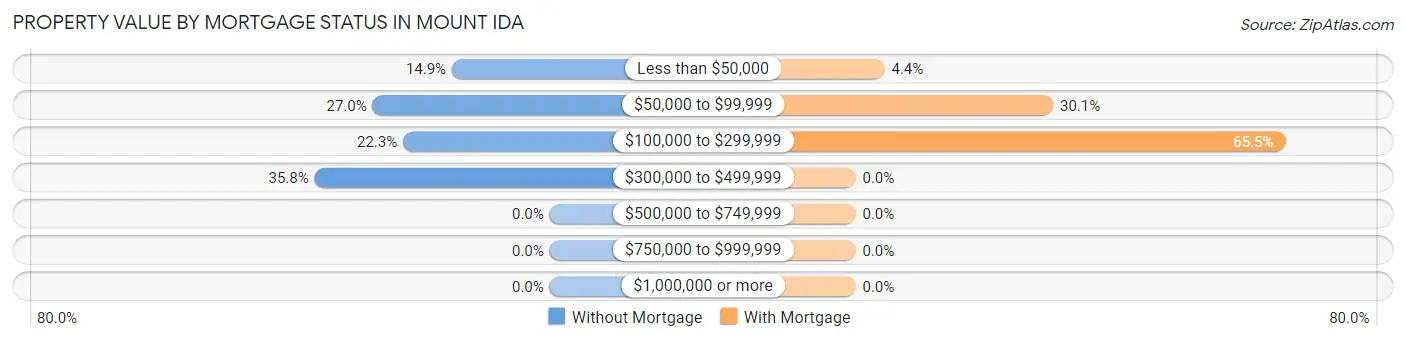
| Property Value | Without Mortgage | With Mortgage |
| Less than $50,000 | 32 (14.9%) | 5 (4.4%) |
| $50,000 to $99,999 | 58 (27.0%) | 34 (30.1%) |
| $100,000 to $299,999 | 48 (22.3%) | 74 (65.5%) |
| $300,000 to $499,999 | 77 (35.8%) | 0 (0.0%) |
| $500,000 to $749,999 | 0 (0.0%) | 0 (0.0%) |
| $750,000 to $999,999 | 0 (0.0%) | 0 (0.0%) |
| $1,000,000 or more | 0 (0.0%) | 0 (0.0%) |
| Total | 215 (100.0%) | 113 (100.0%) |
Household Income by Mortgage Status in Mount Ida
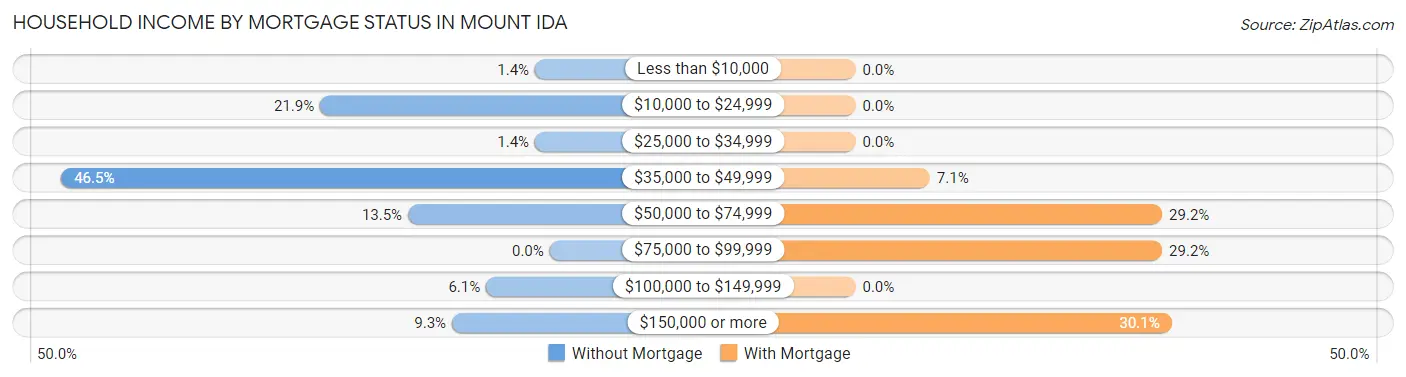
| Household Income | Without Mortgage | With Mortgage |
| Less than $10,000 | 3 (1.4%) | 0 (0.0%) |
| $10,000 to $24,999 | 47 (21.9%) | 0 (0.0%) |
| $25,000 to $34,999 | 3 (1.4%) | 0 (0.0%) |
| $35,000 to $49,999 | 100 (46.5%) | 8 (7.1%) |
| $50,000 to $74,999 | 29 (13.5%) | 33 (29.2%) |
| $75,000 to $99,999 | 0 (0.0%) | 33 (29.2%) |
| $100,000 to $149,999 | 13 (6.0%) | 0 (0.0%) |
| $150,000 or more | 20 (9.3%) | 34 (30.1%) |
| Total | 215 (100.0%) | 113 (100.0%) |
Property Value to Household Income Ratio in Mount Ida
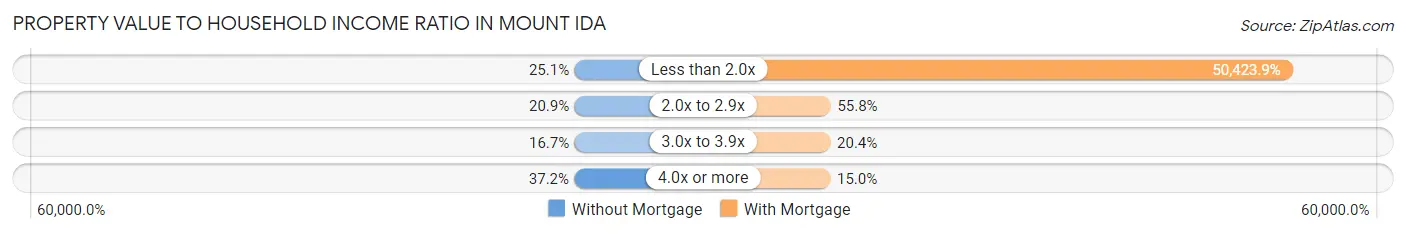
| Value-to-Income Ratio | Without Mortgage | With Mortgage |
| Less than 2.0x | 54 (25.1%) | 56,979 (50,423.9%) |
| 2.0x to 2.9x | 45 (20.9%) | 63 (55.7%) |
| 3.0x to 3.9x | 36 (16.7%) | 23 (20.3%) |
| 4.0x or more | 80 (37.2%) | 17 (15.0%) |
| Total | 215 (100.0%) | 113 (100.0%) |
Real Estate Taxes by Mortgage Status in Mount Ida
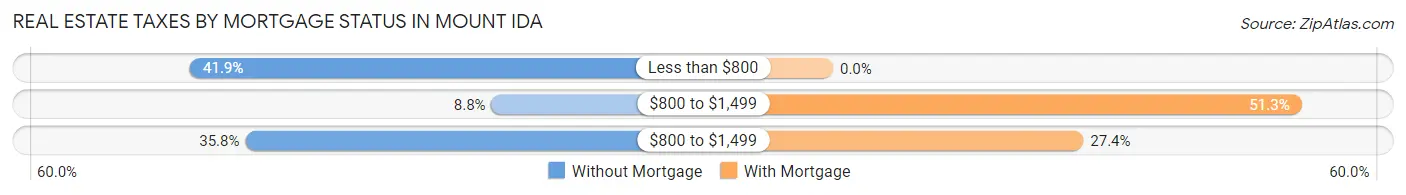
| Property Taxes | Without Mortgage | With Mortgage |
| Less than $800 | 90 (41.9%) | 0 (0.0%) |
| $800 to $1,499 | 19 (8.8%) | 58 (51.3%) |
| $800 to $1,499 | 77 (35.8%) | 31 (27.4%) |
| Total | 215 (100.0%) | 113 (100.0%) |
Health & Disability in Mount Ida
Health Insurance Coverage by Age in Mount Ida
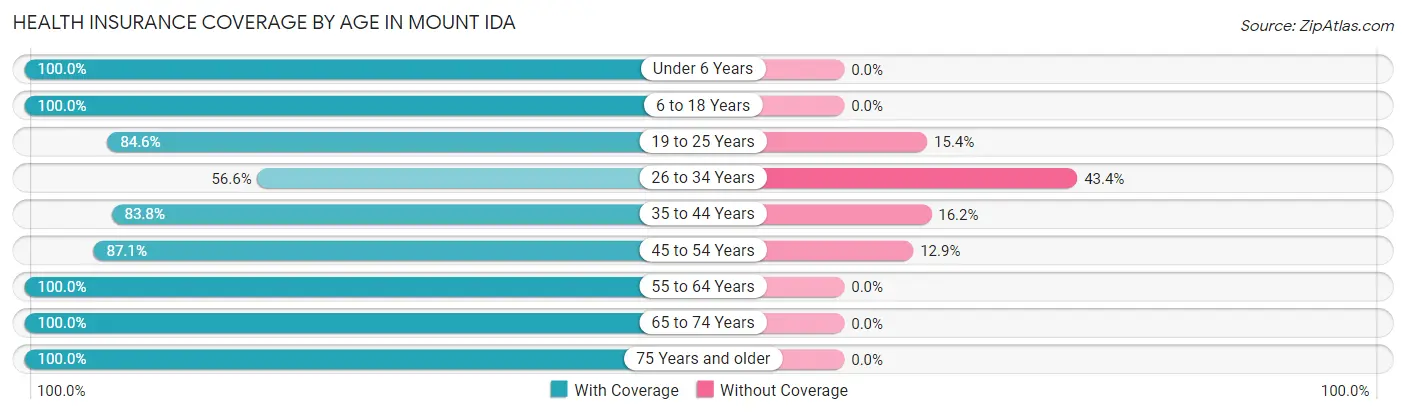
| Age Bracket | With Coverage | Without Coverage |
| Under 6 Years | 115 (100.0%) | 0 (0.0%) |
| 6 to 18 Years | 183 (100.0%) | 0 (0.0%) |
| 19 to 25 Years | 115 (84.6%) | 21 (15.4%) |
| 26 to 34 Years | 56 (56.6%) | 43 (43.4%) |
| 35 to 44 Years | 124 (83.8%) | 24 (16.2%) |
| 45 to 54 Years | 122 (87.1%) | 18 (12.9%) |
| 55 to 64 Years | 119 (100.0%) | 0 (0.0%) |
| 65 to 74 Years | 276 (100.0%) | 0 (0.0%) |
| 75 Years and older | 79 (100.0%) | 0 (0.0%) |
| Total | 1,189 (91.8%) | 106 (8.2%) |
Health Insurance Coverage by Citizenship Status in Mount Ida
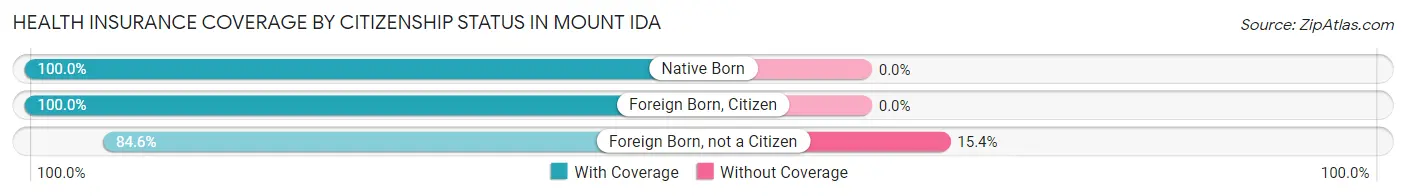
| Citizenship Status | With Coverage | Without Coverage |
| Native Born | 115 (100.0%) | 0 (0.0%) |
| Foreign Born, Citizen | 183 (100.0%) | 0 (0.0%) |
| Foreign Born, not a Citizen | 115 (84.6%) | 21 (15.4%) |
Health Insurance Coverage by Household Income in Mount Ida
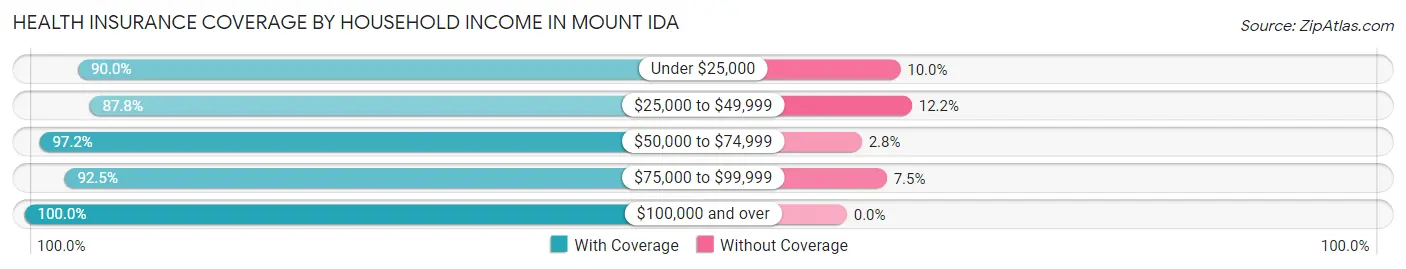
| Household Income | With Coverage | Without Coverage |
| Under $25,000 | 305 (90.0%) | 34 (10.0%) |
| $25,000 to $49,999 | 418 (87.8%) | 58 (12.2%) |
| $50,000 to $74,999 | 209 (97.2%) | 6 (2.8%) |
| $75,000 to $99,999 | 99 (92.5%) | 8 (7.5%) |
| $100,000 and over | 158 (100.0%) | 0 (0.0%) |
Public vs Private Health Insurance Coverage by Age in Mount Ida
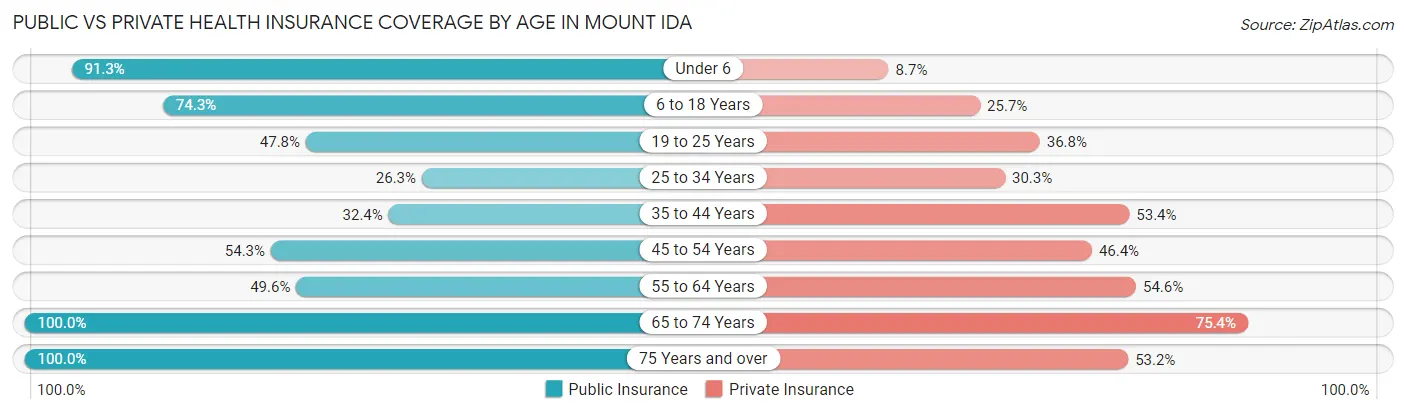
| Age Bracket | Public Insurance | Private Insurance |
| Under 6 | 105 (91.3%) | 10 (8.7%) |
| 6 to 18 Years | 136 (74.3%) | 47 (25.7%) |
| 19 to 25 Years | 65 (47.8%) | 50 (36.8%) |
| 25 to 34 Years | 26 (26.3%) | 30 (30.3%) |
| 35 to 44 Years | 48 (32.4%) | 79 (53.4%) |
| 45 to 54 Years | 76 (54.3%) | 65 (46.4%) |
| 55 to 64 Years | 59 (49.6%) | 65 (54.6%) |
| 65 to 74 Years | 276 (100.0%) | 208 (75.4%) |
| 75 Years and over | 79 (100.0%) | 42 (53.2%) |
| Total | 870 (67.2%) | 596 (46.0%) |
Disability Status by Sex by Age in Mount Ida
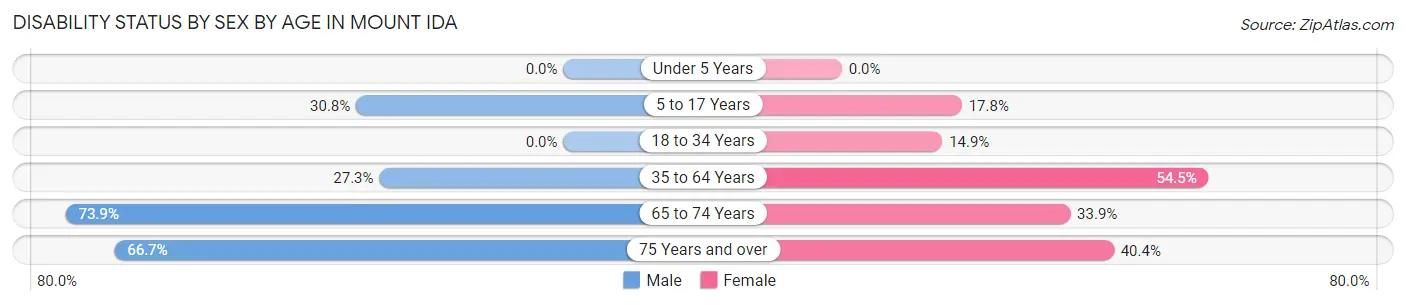
| Age Bracket | Male | Female |
| Under 5 Years | 0 (0.0%) | 0 (0.0%) |
| 5 to 17 Years | 36 (30.8%) | 13 (17.8%) |
| 18 to 34 Years | 0 (0.0%) | 17 (14.9%) |
| 35 to 64 Years | 56 (27.3%) | 110 (54.5%) |
| 65 to 74 Years | 119 (73.9%) | 39 (33.9%) |
| 75 Years and over | 18 (66.7%) | 21 (40.4%) |
Disability Class by Sex by Age in Mount Ida
Disability Class: Hearing Difficulty
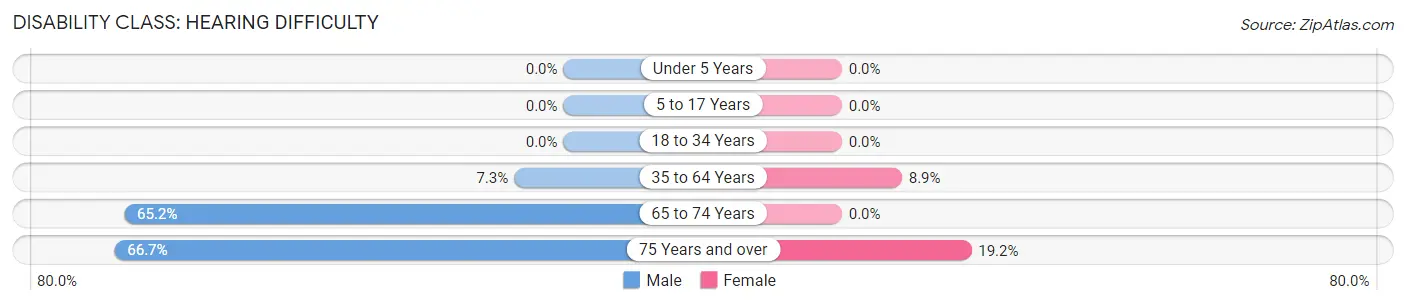
| Age Bracket | Male | Female |
| Under 5 Years | 0 (0.0%) | 0 (0.0%) |
| 5 to 17 Years | 0 (0.0%) | 0 (0.0%) |
| 18 to 34 Years | 0 (0.0%) | 0 (0.0%) |
| 35 to 64 Years | 15 (7.3%) | 18 (8.9%) |
| 65 to 74 Years | 105 (65.2%) | 0 (0.0%) |
| 75 Years and over | 18 (66.7%) | 10 (19.2%) |
Disability Class: Vision Difficulty
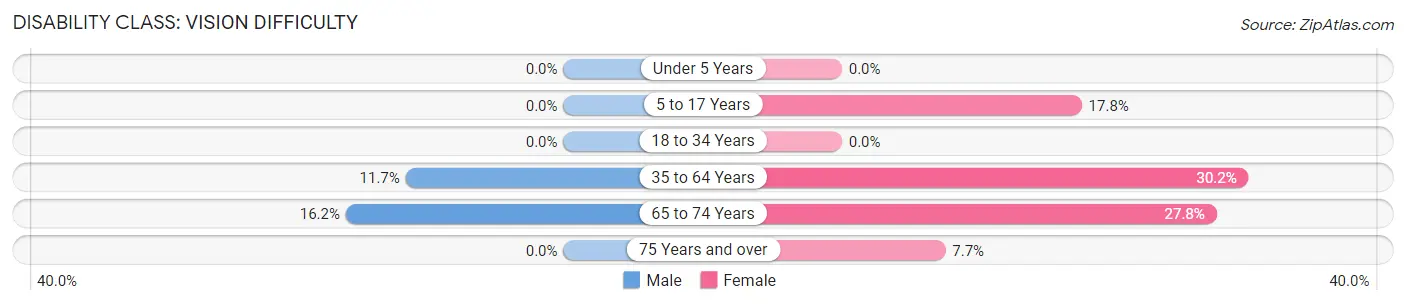
| Age Bracket | Male | Female |
| Under 5 Years | 0 (0.0%) | 0 (0.0%) |
| 5 to 17 Years | 0 (0.0%) | 13 (17.8%) |
| 18 to 34 Years | 0 (0.0%) | 0 (0.0%) |
| 35 to 64 Years | 24 (11.7%) | 61 (30.2%) |
| 65 to 74 Years | 26 (16.2%) | 32 (27.8%) |
| 75 Years and over | 0 (0.0%) | 4 (7.7%) |
Disability Class: Cognitive Difficulty
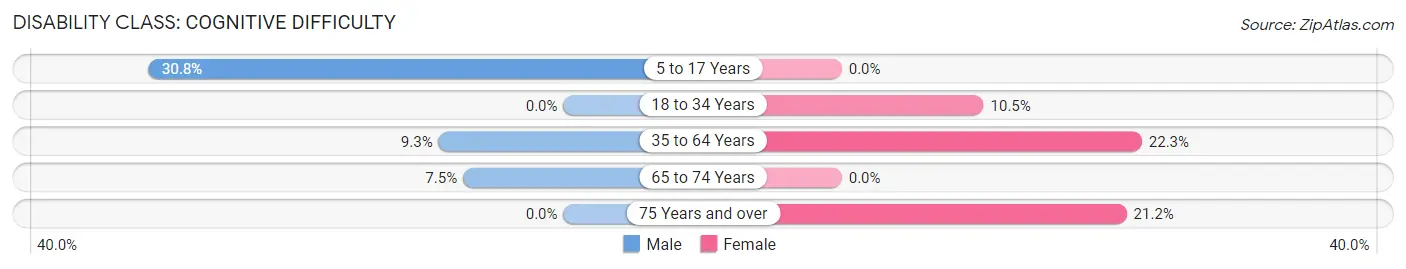
| Age Bracket | Male | Female |
| 5 to 17 Years | 36 (30.8%) | 0 (0.0%) |
| 18 to 34 Years | 0 (0.0%) | 12 (10.5%) |
| 35 to 64 Years | 19 (9.3%) | 45 (22.3%) |
| 65 to 74 Years | 12 (7.4%) | 0 (0.0%) |
| 75 Years and over | 0 (0.0%) | 11 (21.1%) |
Disability Class: Ambulatory Difficulty
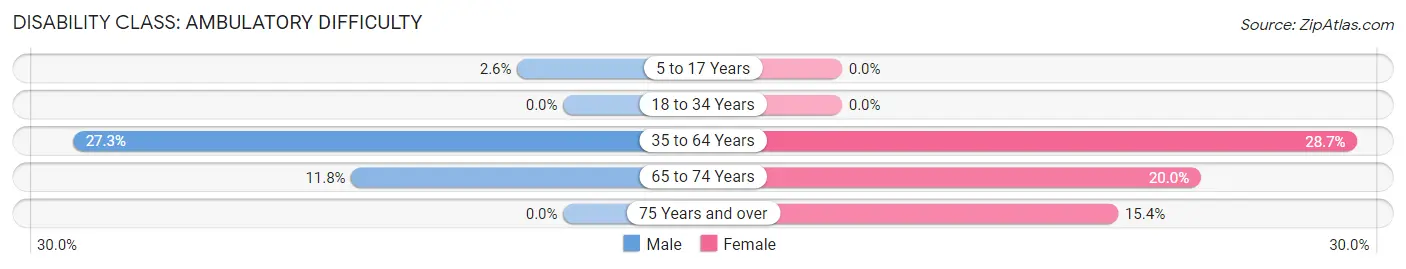
| Age Bracket | Male | Female |
| 5 to 17 Years | 3 (2.6%) | 0 (0.0%) |
| 18 to 34 Years | 0 (0.0%) | 0 (0.0%) |
| 35 to 64 Years | 56 (27.3%) | 58 (28.7%) |
| 65 to 74 Years | 19 (11.8%) | 23 (20.0%) |
| 75 Years and over | 0 (0.0%) | 8 (15.4%) |
Disability Class: Self-Care Difficulty
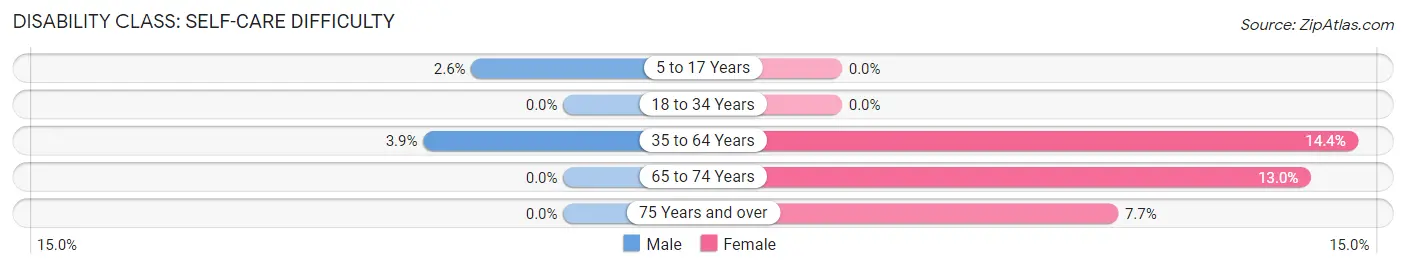
| Age Bracket | Male | Female |
| 5 to 17 Years | 3 (2.6%) | 0 (0.0%) |
| 18 to 34 Years | 0 (0.0%) | 0 (0.0%) |
| 35 to 64 Years | 8 (3.9%) | 29 (14.4%) |
| 65 to 74 Years | 0 (0.0%) | 15 (13.0%) |
| 75 Years and over | 0 (0.0%) | 4 (7.7%) |
Technology Access in Mount Ida
Computing Device Access in Mount Ida
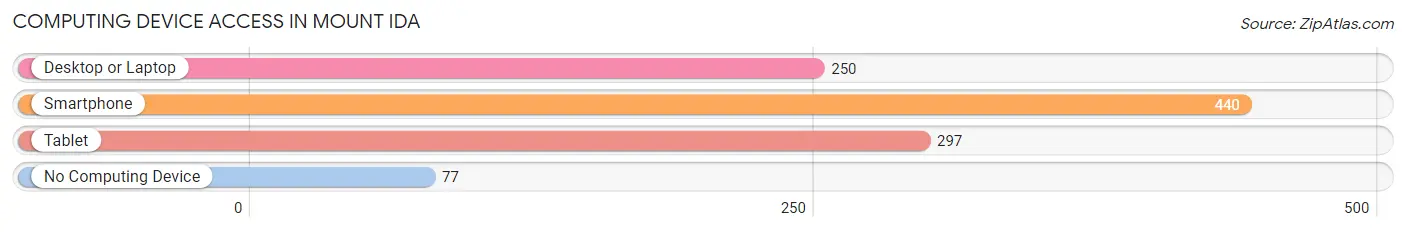
| Device Type | # Households | % Households |
| Desktop or Laptop | 250 | 45.5% |
| Smartphone | 440 | 80.0% |
| Tablet | 297 | 54.0% |
| No Computing Device | 77 | 14.0% |
| Total | 550 | 100.0% |
Internet Access in Mount Ida
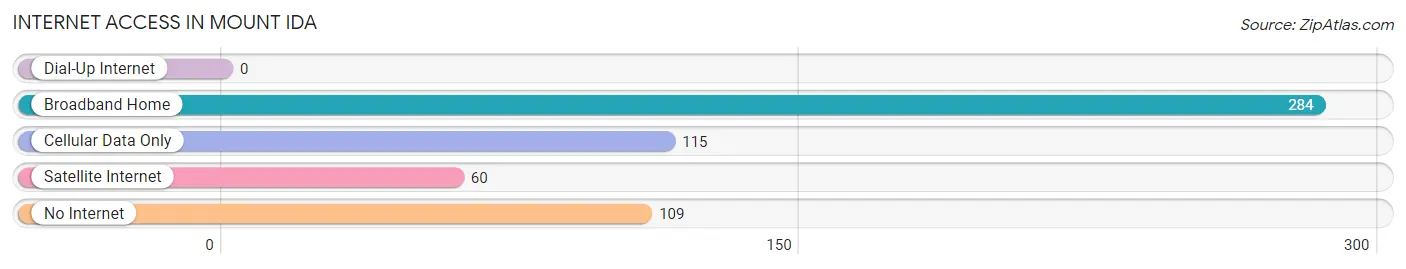
| Internet Type | # Households | % Households |
| Dial-Up Internet | 0 | 0.0% |
| Broadband Home | 284 | 51.6% |
| Cellular Data Only | 115 | 20.9% |
| Satellite Internet | 60 | 10.9% |
| No Internet | 109 | 19.8% |
| Total | 550 | 100.0% |
Mount Ida Summary
Mount Ida is a small city located in Montgomery County, Arkansas. It is situated in the Ouachita Mountains, and is the county seat of Montgomery County. The city has a population of 2,890 as of the 2010 census.
History
Mount Ida was founded in 1842 by a group of settlers from Georgia. The city was named after Mount Ida, a mountain in Greece. The city was incorporated in 1881.
In the late 19th century, Mount Ida was a bustling center of commerce and industry. The city was home to several sawmills, gristmills, and a cotton gin. The city also had a hotel, a bank, and a post office.
In the early 20th century, Mount Ida was a popular tourist destination. The city was home to several resorts, including the Mount Ida Hotel, which was built in 1910. The hotel was a popular destination for visitors from all over the country.
In the late 20th century, Mount Ida began to decline. The sawmills and gristmills closed, and the cotton gin was destroyed by fire. The hotel closed in the 1970s, and the bank closed in the 1980s.
Geography
Mount Ida is located in the Ouachita Mountains of western Arkansas. The city is situated at the intersection of U.S. Route 270 and Arkansas Highway 27. The city is located about 30 miles south of Hot Springs, Arkansas, and about 50 miles north of Texarkana, Arkansas.
The city has a total area of 4.2 square miles, all of which is land. The city is located at an elevation of 1,068 feet above sea level.
Economy
The economy of Mount Ida is largely based on tourism. The city is home to several resorts, including the Mount Ida Hotel, which was built in 1910. The city is also home to several antique stores, art galleries, and other tourist attractions.
The city is also home to several manufacturing companies, including a furniture manufacturer and a plastics manufacturer.
Demographics
As of the 2010 census, the population of Mount Ida was 2,890. The racial makeup of the city was 95.3% White, 0.7% African American, 0.3% Native American, 0.2% Asian, 0.1% Pacific Islander, 1.7% from other races, and 1.9% from two or more races. Hispanic or Latino of any race were 3.2% of the population.
The median household income in Mount Ida was $30,938, and the median family income was $37,813. The per capita income for the city was $17,845. About 17.2% of the population was below the poverty line.
Common Questions
What is Per Capita Income in Mount Ida?
Per Capita income in Mount Ida is $22,928.
What is the Median Family Income in Mount Ida?
Median Family Income in Mount Ida is $46,133.
What is the Median Household income in Mount Ida?
Median Household Income in Mount Ida is $42,778.
What is Income or Wage Gap in Mount Ida?
Income or Wage Gap in Mount Ida is 42.9%.
Women in Mount Ida earn 57.1 cents for every dollar earned by a man.
What is Inequality or Gini Index in Mount Ida?
Inequality or Gini Index in Mount Ida is 0.50.
What is the Total Population of Mount Ida?
Total Population of Mount Ida is 1,410.
What is the Total Male Population of Mount Ida?
Total Male Population of Mount Ida is 739.
What is the Total Female Population of Mount Ida?
Total Female Population of Mount Ida is 671.
What is the Ratio of Males per 100 Females in Mount Ida?
There are 110.13 Males per 100 Females in Mount Ida.
What is the Ratio of Females per 100 Males in Mount Ida?
There are 90.80 Females per 100 Males in Mount Ida.
What is the Median Population Age in Mount Ida?
Median Population Age in Mount Ida is 46.5 Years.
What is the Average Family Size in Mount Ida
Average Family Size in Mount Ida is 2.9 People.
What is the Average Household Size in Mount Ida
Average Household Size in Mount Ida is 2.4 People.
How Large is the Labor Force in Mount Ida?
There are 408 People in the Labor Forcein in Mount Ida.
What is the Percentage of People in the Labor Force in Mount Ida?
35.7% of People are in the Labor Force in Mount Ida.
What is the Unemployment Rate in Mount Ida?
Unemployment Rate in Mount Ida is 7.1%.