Morrilton, AR Map & Demographics
Morrilton Map
Morrilton Overview
$25,733
PER CAPITA INCOME
$52,567
AVG FAMILY INCOME
$43,608
AVG HOUSEHOLD INCOME
34.3%
WAGE / INCOME GAP [ % ]
65.7¢/ $1
WAGE / INCOME GAP [ $ ]
$11,278
FAMILY INCOME DEFICIT
0.51
INEQUALITY / GINI INDEX
6,980
TOTAL POPULATION
3,076
MALE POPULATION
3,904
FEMALE POPULATION
78.79
MALES / 100 FEMALES
126.92
FEMALES / 100 MALES
37.4
MEDIAN AGE
3.0
AVG FAMILY SIZE
2.4
AVG HOUSEHOLD SIZE
3,077
LABOR FORCE [ PEOPLE ]
56.8%
PERCENT IN LABOR FORCE
9.8%
UNEMPLOYMENT RATE
Morrilton Zip Codes
Morrilton Area Codes
Income in Morrilton
Income Overview in Morrilton
Per Capita Income in Morrilton is $25,733, while median incomes of families and households are $52,567 and $43,608 respectively.
| Characteristic | Number | Measure |
| Per Capita Income | 6,980 | $25,733 |
| Median Family Income | 1,804 | $52,567 |
| Mean Family Income | 1,804 | $67,846 |
| Median Household Income | 2,834 | $43,608 |
| Mean Household Income | 2,834 | $61,469 |
| Income Deficit | 1,804 | $11,278 |
| Wage / Income Gap (%) | 6,980 | 34.27% |
| Wage / Income Gap ($) | 6,980 | 65.73¢ per $1 |
| Gini / Inequality Index | 6,980 | 0.51 |
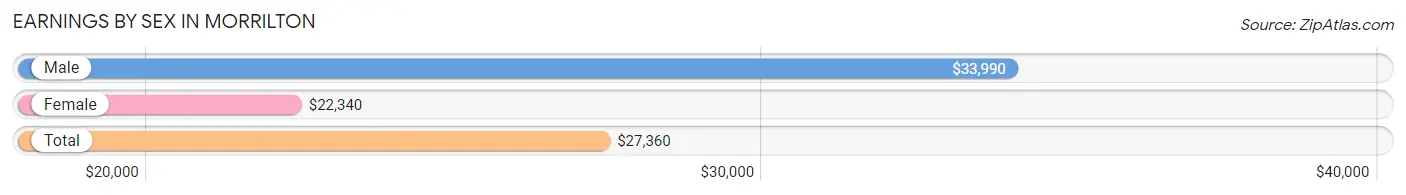
Earnings by Sex in Morrilton
Average Earnings in Morrilton are $27,360, $33,990 for men and $22,340 for women, a difference of 34.3%.
| Sex | Number | Average Earnings |
| Male | 1,440 (45.0%) | $33,990 |
| Female | 1,757 (55.0%) | $22,340 |
| Total | 3,197 (100.0%) | $27,360 |
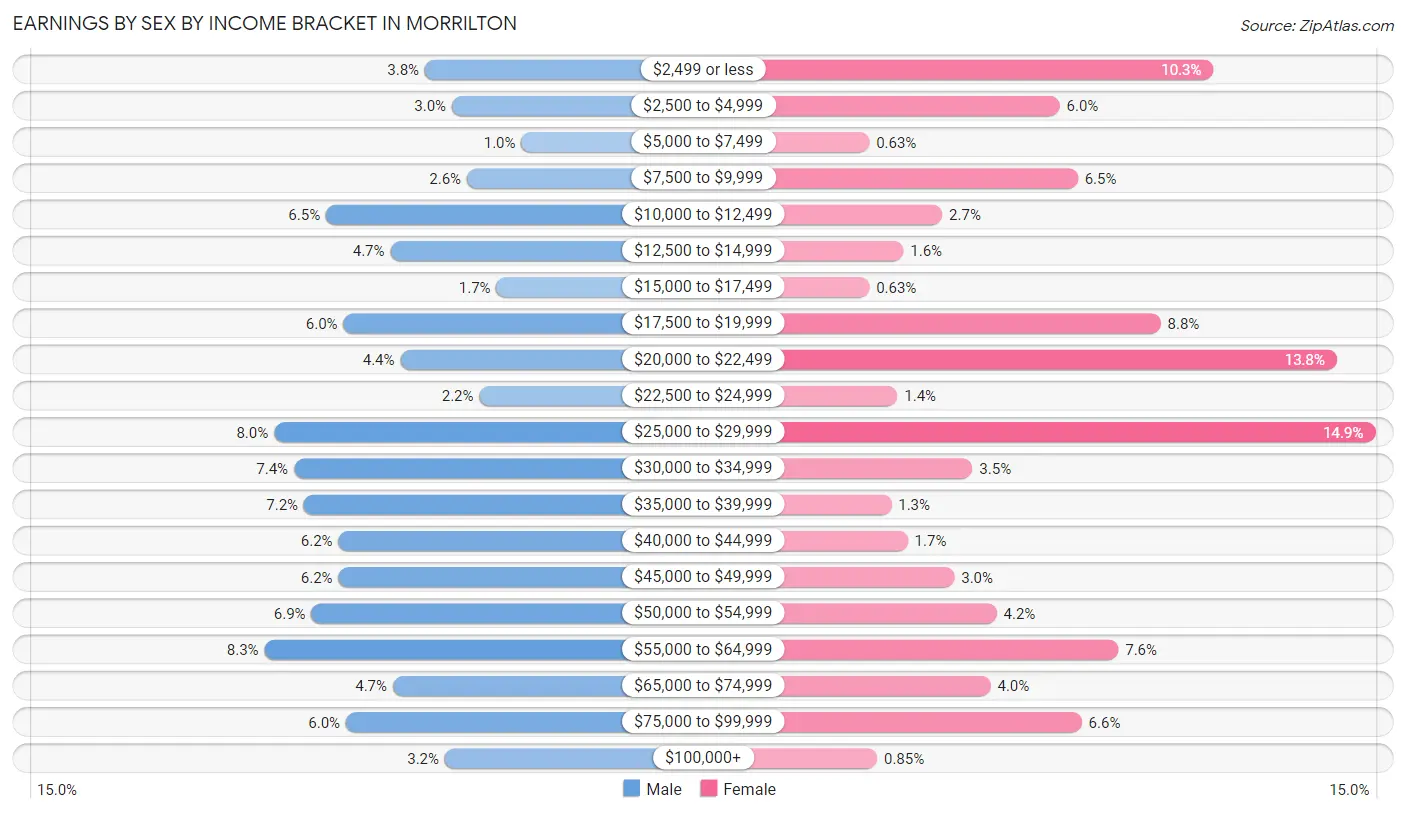
Earnings by Sex by Income Bracket in Morrilton
The most common earnings brackets in Morrilton are $55,000 to $64,999 for men (119 | 8.3%) and $25,000 to $29,999 for women (261 | 14.8%).
| Income | Male | Female |
| $2,499 or less | 54 (3.7%) | 181 (10.3%) |
| $2,500 to $4,999 | 43 (3.0%) | 105 (6.0%) |
| $5,000 to $7,499 | 15 (1.0%) | 11 (0.6%) |
| $7,500 to $9,999 | 37 (2.6%) | 114 (6.5%) |
| $10,000 to $12,499 | 94 (6.5%) | 47 (2.7%) |
| $12,500 to $14,999 | 68 (4.7%) | 28 (1.6%) |
| $15,000 to $17,499 | 25 (1.7%) | 11 (0.6%) |
| $17,500 to $19,999 | 87 (6.0%) | 155 (8.8%) |
| $20,000 to $22,499 | 64 (4.4%) | 242 (13.8%) |
| $22,500 to $24,999 | 32 (2.2%) | 25 (1.4%) |
| $25,000 to $29,999 | 115 (8.0%) | 261 (14.8%) |
| $30,000 to $34,999 | 107 (7.4%) | 62 (3.5%) |
| $35,000 to $39,999 | 103 (7.1%) | 22 (1.3%) |
| $40,000 to $44,999 | 89 (6.2%) | 30 (1.7%) |
| $45,000 to $49,999 | 89 (6.2%) | 53 (3.0%) |
| $50,000 to $54,999 | 100 (6.9%) | 74 (4.2%) |
| $55,000 to $64,999 | 119 (8.3%) | 134 (7.6%) |
| $65,000 to $74,999 | 67 (4.6%) | 71 (4.0%) |
| $75,000 to $99,999 | 86 (6.0%) | 116 (6.6%) |
| $100,000+ | 46 (3.2%) | 15 (0.9%) |
| Total | 1,440 (100.0%) | 1,757 (100.0%) |
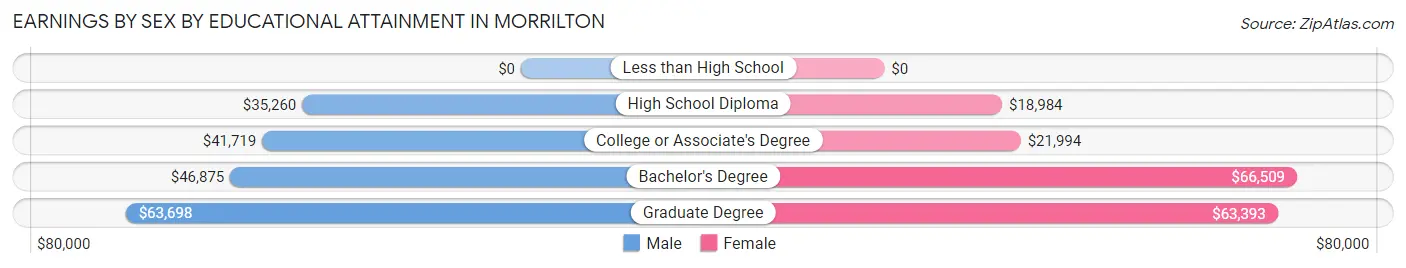
Earnings by Sex by Educational Attainment in Morrilton
Average earnings in Morrilton are $39,113 for men and $25,528 for women, a difference of 34.7%. Men with an educational attainment of graduate degree enjoy the highest average annual earnings of $63,698, while those with high school diploma education earn the least with $35,260. Women with an educational attainment of bachelor's degree earn the most with the average annual earnings of $66,509, while those with high school diploma education have the smallest earnings of $18,984.
| Educational Attainment | Male Income | Female Income |
| Less than High School | - | - |
| High School Diploma | $35,260 | $18,984 |
| College or Associate's Degree | $41,719 | $21,994 |
| Bachelor's Degree | $46,875 | $66,509 |
| Graduate Degree | $63,698 | $63,393 |
| Total | $39,113 | $25,528 |
Family Income in Morrilton
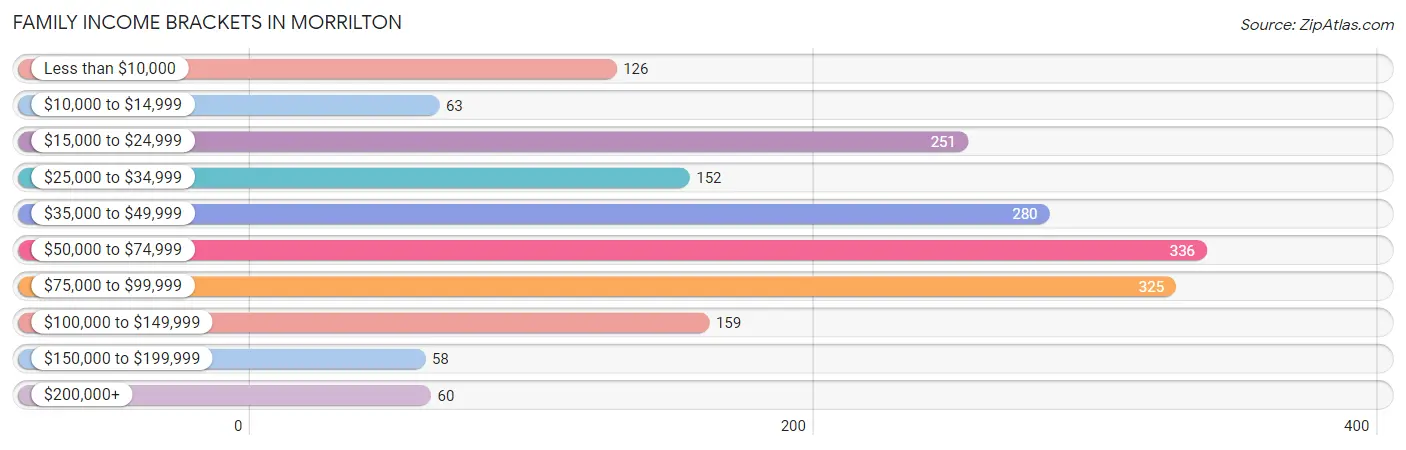
Family Income Brackets in Morrilton
According to the Morrilton family income data, there are 336 families falling into the $50,000 to $74,999 income range, which is the most common income bracket and makes up 18.6% of all families. Conversely, the $150,000 to $199,999 income bracket is the least frequent group with only 58 families (3.2%) belonging to this category.
| Income Bracket | # Families | % Families |
| Less than $10,000 | 126 | 7.0% |
| $10,000 to $14,999 | 63 | 3.5% |
| $15,000 to $24,999 | 251 | 13.9% |
| $25,000 to $34,999 | 152 | 8.4% |
| $35,000 to $49,999 | 280 | 15.5% |
| $50,000 to $74,999 | 336 | 18.6% |
| $75,000 to $99,999 | 325 | 18.0% |
| $100,000 to $149,999 | 159 | 8.8% |
| $150,000 to $199,999 | 58 | 3.2% |
| $200,000+ | 60 | 3.3% |
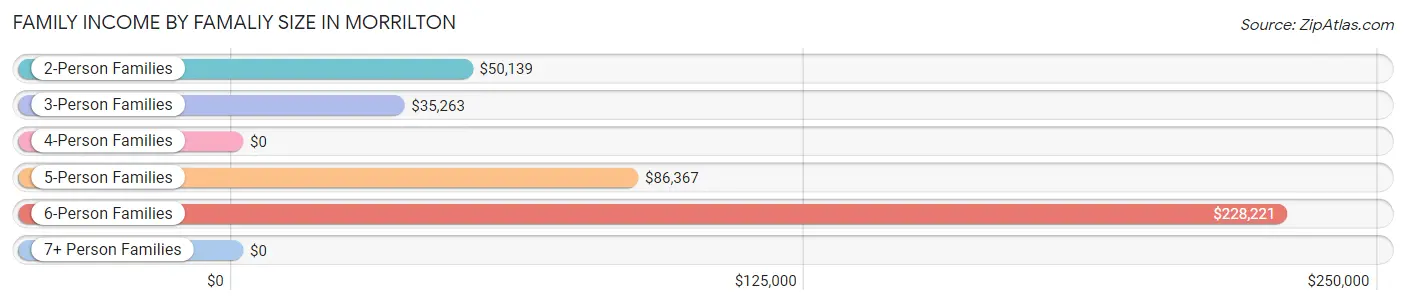
Family Income by Famaliy Size in Morrilton
6-person families (37 | 2.1%) account for the highest median family income in Morrilton with $228,221 per family, while 6-person families (37 | 2.1%) have the highest median income of $38,037 per family member.
| Income Bracket | # Families | Median Income |
| 2-Person Families | 966 (53.5%) | $50,139 |
| 3-Person Families | 344 (19.1%) | $35,263 |
| 4-Person Families | 300 (16.6%) | $0 |
| 5-Person Families | 153 (8.5%) | $86,367 |
| 6-Person Families | 37 (2.1%) | $228,221 |
| 7+ Person Families | 4 (0.2%) | $0 |
| Total | 1,804 (100.0%) | $52,567 |
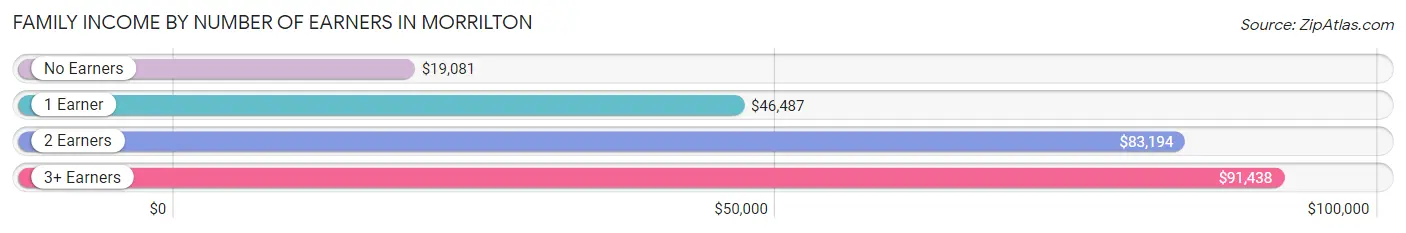
Family Income by Number of Earners in Morrilton
The median family income in Morrilton is $52,567, with families comprising 3+ earners (199) having the highest median family income of $91,438, while families with no earners (427) have the lowest median family income of $19,081, accounting for 11.0% and 23.7% of families, respectively.
| Number of Earners | # Families | Median Income |
| No Earners | 427 (23.7%) | $19,081 |
| 1 Earner | 728 (40.4%) | $46,487 |
| 2 Earners | 450 (24.9%) | $83,194 |
| 3+ Earners | 199 (11.0%) | $91,438 |
| Total | 1,804 (100.0%) | $52,567 |
Household Income in Morrilton
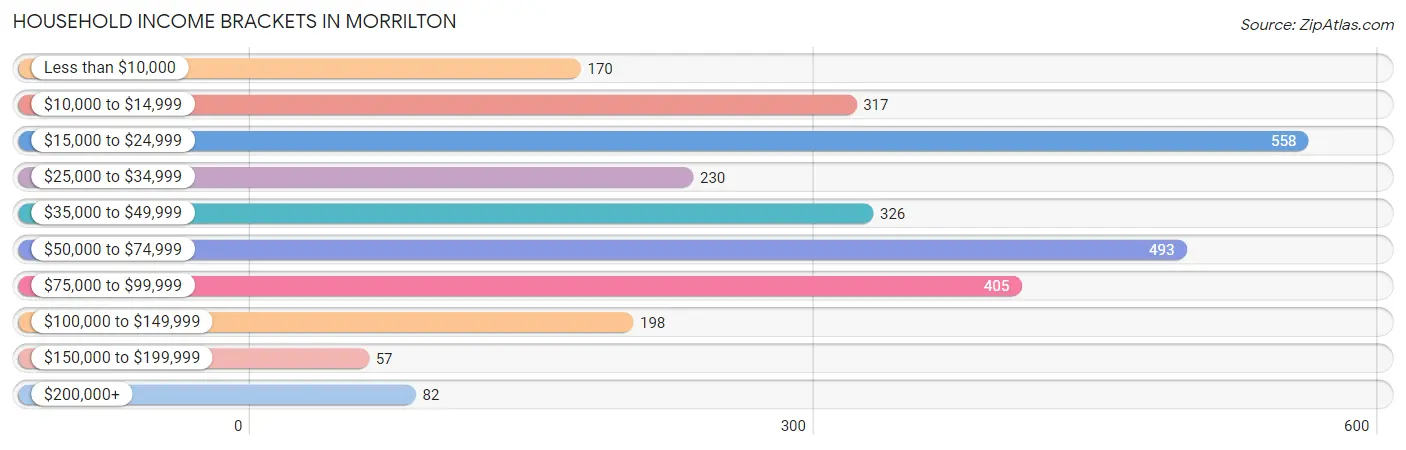
Household Income Brackets in Morrilton
With 558 households falling in the category, the $15,000 to $24,999 income range is the most frequent in Morrilton, accounting for 19.7% of all households. In contrast, only 57 households (2.0%) fall into the $150,000 to $199,999 income bracket, making it the least populous group.
| Income Bracket | # Households | % Households |
| Less than $10,000 | 170 | 6.0% |
| $10,000 to $14,999 | 317 | 11.2% |
| $15,000 to $24,999 | 558 | 19.7% |
| $25,000 to $34,999 | 230 | 8.1% |
| $35,000 to $49,999 | 326 | 11.5% |
| $50,000 to $74,999 | 493 | 17.4% |
| $75,000 to $99,999 | 405 | 14.3% |
| $100,000 to $149,999 | 198 | 7.0% |
| $150,000 to $199,999 | 57 | 2.0% |
| $200,000+ | 82 | 2.9% |
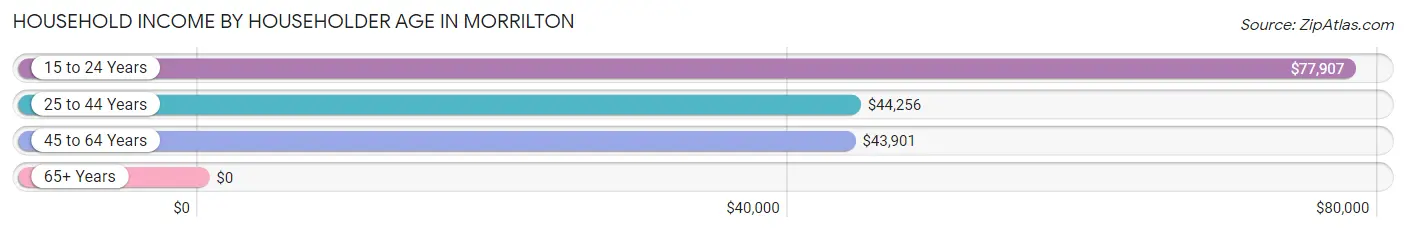
Household Income by Householder Age in Morrilton
The median household income in Morrilton is $43,608, with the highest median household income of $77,907 found in the 15 to 24 years age bracket for the primary householder. A total of 102 households (3.6%) fall into this category. Meanwhile, the 65+ years age bracket for the primary householder has the lowest median household income of $0, with 850 households (30.0%) in this group.
| Income Bracket | # Households | Median Income |
| 15 to 24 Years | 102 (3.6%) | $77,907 |
| 25 to 44 Years | 813 (28.7%) | $44,256 |
| 45 to 64 Years | 1,069 (37.7%) | $43,901 |
| 65+ Years | 850 (30.0%) | $0 |
| Total | 2,834 (100.0%) | $43,608 |
Poverty in Morrilton
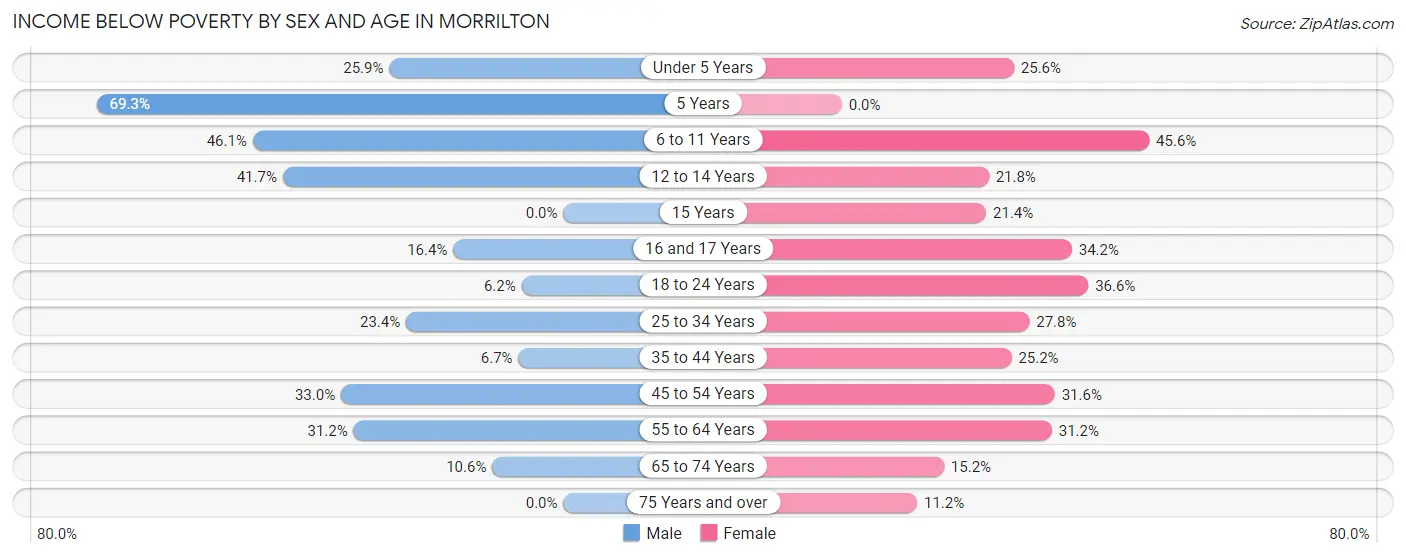
Income Below Poverty by Sex and Age in Morrilton
With 22.3% poverty level for males and 27.8% for females among the residents of Morrilton, 5 year old males and 6 to 11 year old females are the most vulnerable to poverty, with 79 males (69.3%) and 220 females (45.6%) in their respective age groups living below the poverty level.
| Age Bracket | Male | Female |
| Under 5 Years | 53 (25.9%) | 35 (25.6%) |
| 5 Years | 79 (69.3%) | 0 (0.0%) |
| 6 to 11 Years | 101 (46.1%) | 220 (45.6%) |
| 12 to 14 Years | 40 (41.7%) | 41 (21.8%) |
| 15 Years | 0 (0.0%) | 6 (21.4%) |
| 16 and 17 Years | 17 (16.4%) | 14 (34.2%) |
| 18 to 24 Years | 26 (6.2%) | 105 (36.6%) |
| 25 to 34 Years | 71 (23.4%) | 162 (27.8%) |
| 35 to 44 Years | 20 (6.7%) | 100 (25.2%) |
| 45 to 54 Years | 107 (33.0%) | 154 (31.6%) |
| 55 to 64 Years | 133 (31.1%) | 135 (31.2%) |
| 65 to 74 Years | 32 (10.6%) | 52 (15.2%) |
| 75 Years and over | 0 (0.0%) | 41 (11.2%) |
| Total | 679 (22.3%) | 1,065 (27.8%) |
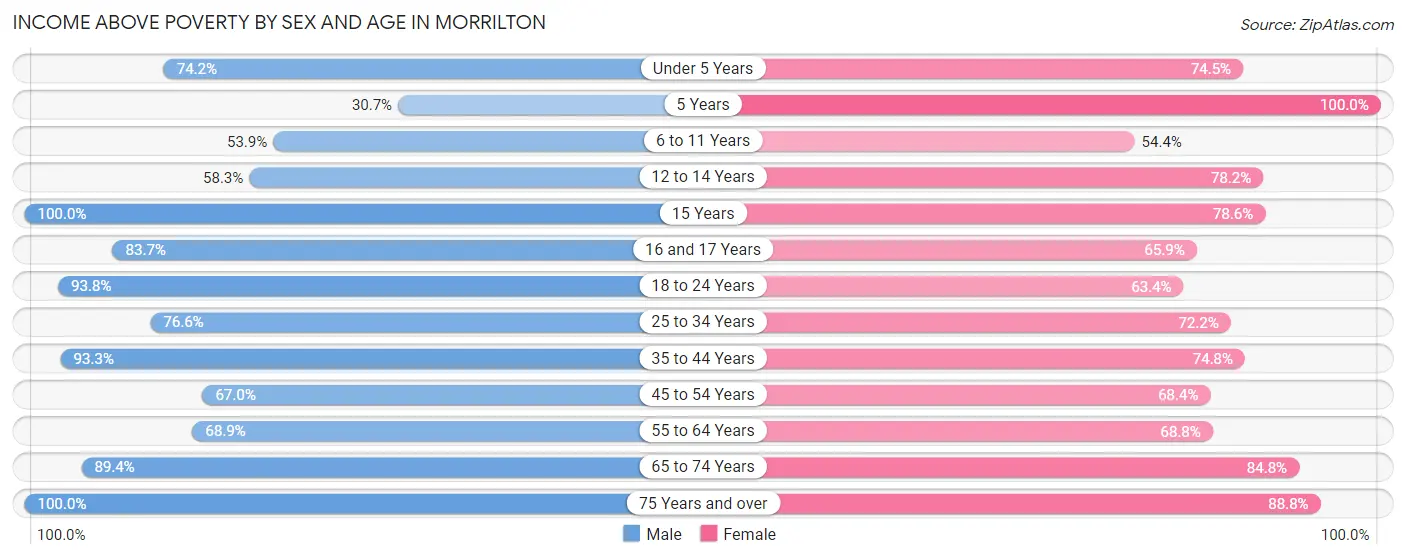
Income Above Poverty by Sex and Age in Morrilton
According to the poverty statistics in Morrilton, males aged 15 years and females aged 5 years are the age groups that are most secure financially, with 100.0% of males and 100.0% of females in these age groups living above the poverty line.
| Age Bracket | Male | Female |
| Under 5 Years | 152 (74.2%) | 102 (74.5%) |
| 5 Years | 35 (30.7%) | 65 (100.0%) |
| 6 to 11 Years | 118 (53.9%) | 262 (54.4%) |
| 12 to 14 Years | 56 (58.3%) | 147 (78.2%) |
| 15 Years | 21 (100.0%) | 22 (78.6%) |
| 16 and 17 Years | 87 (83.7%) | 27 (65.8%) |
| 18 to 24 Years | 393 (93.8%) | 182 (63.4%) |
| 25 to 34 Years | 233 (76.6%) | 420 (72.2%) |
| 35 to 44 Years | 280 (93.3%) | 297 (74.8%) |
| 45 to 54 Years | 217 (67.0%) | 333 (68.4%) |
| 55 to 64 Years | 294 (68.9%) | 298 (68.8%) |
| 65 to 74 Years | 271 (89.4%) | 291 (84.8%) |
| 75 Years and over | 206 (100.0%) | 326 (88.8%) |
| Total | 2,363 (77.7%) | 2,772 (72.2%) |
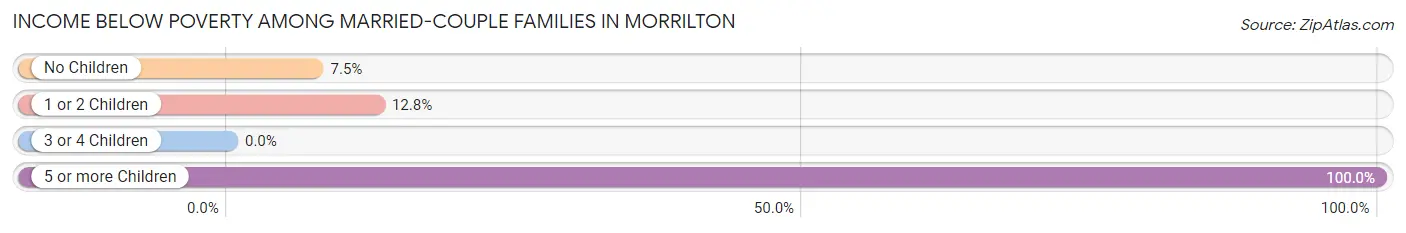
Income Below Poverty Among Married-Couple Families in Morrilton
The poverty statistics for married-couple families in Morrilton show that 10.3% or 90 of the total 874 families live below the poverty line. Families with 5 or more children have the highest poverty rate of 100.0%, comprising of 4 families. On the other hand, families with 3 or 4 children have the lowest poverty rate of 0.0%, which includes 0 families.
| Children | Above Poverty | Below Poverty |
| No Children | 385 (92.5%) | 31 (7.4%) |
| 1 or 2 Children | 375 (87.2%) | 55 (12.8%) |
| 3 or 4 Children | 24 (100.0%) | 0 (0.0%) |
| 5 or more Children | 0 (0.0%) | 4 (100.0%) |
| Total | 784 (89.7%) | 90 (10.3%) |
Income Below Poverty Among Single-Parent Households in Morrilton
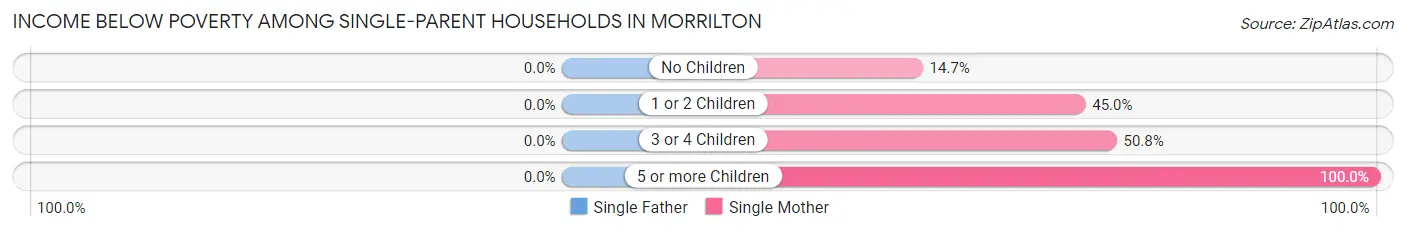
| Children | Single Father | Single Mother |
| No Children | 0 (0.0%) | 49 (14.7%) |
| 1 or 2 Children | 0 (0.0%) | 158 (45.0%) |
| 3 or 4 Children | 0 (0.0%) | 61 (50.8%) |
| 5 or more Children | 0 (0.0%) | 8 (100.0%) |
| Total | 0 (0.0%) | 276 (34.0%) |
Income Below Poverty Among Married-Couple vs Single-Parent Households in Morrilton
The poverty data for Morrilton shows that 90 of the married-couple family households (10.3%) and 276 of the single-parent households (29.7%) are living below the poverty level. Within the married-couple family households, those with 5 or more children have the highest poverty rate, with 4 households (100.0%) falling below the poverty line. Among the single-parent households, those with 5 or more children have the highest poverty rate, with 8 household (100.0%) living below poverty.
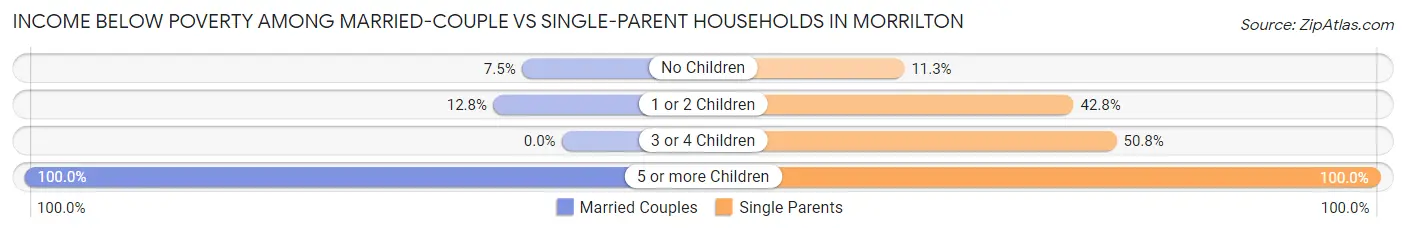
| Children | Married-Couple Families | Single-Parent Households |
| No Children | 31 (7.4%) | 49 (11.3%) |
| 1 or 2 Children | 55 (12.8%) | 158 (42.8%) |
| 3 or 4 Children | 0 (0.0%) | 61 (50.8%) |
| 5 or more Children | 4 (100.0%) | 8 (100.0%) |
| Total | 90 (10.3%) | 276 (29.7%) |
Race in Morrilton
The most populous races in Morrilton are White / Caucasian (5,452 | 78.1%), Black / African American (1,124 | 16.1%), and Hispanic or Latino (498 | 7.1%).
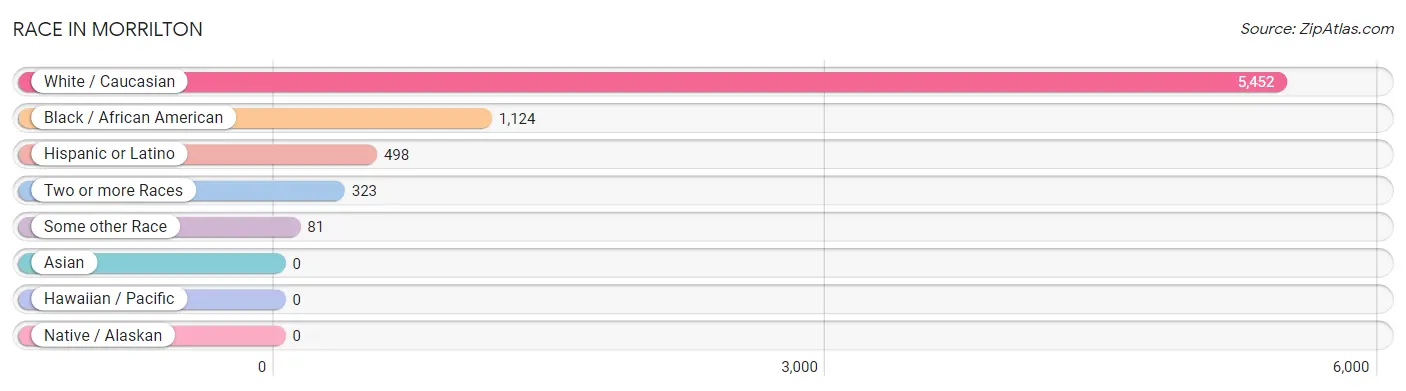
| Race | # Population | % Population |
| Asian | 0 | 0.0% |
| Black / African American | 1,124 | 16.1% |
| Hawaiian / Pacific | 0 | 0.0% |
| Hispanic or Latino | 498 | 7.1% |
| Native / Alaskan | 0 | 0.0% |
| White / Caucasian | 5,452 | 78.1% |
| Two or more Races | 323 | 4.6% |
| Some other Race | 81 | 1.2% |
| Total | 6,980 | 100.0% |
Ancestry in Morrilton
The most populous ancestries reported in Morrilton are American (955 | 13.7%), English (792 | 11.4%), German (688 | 9.9%), Irish (547 | 7.8%), and Mexican (498 | 7.1%), together accounting for 49.9% of all Morrilton residents.
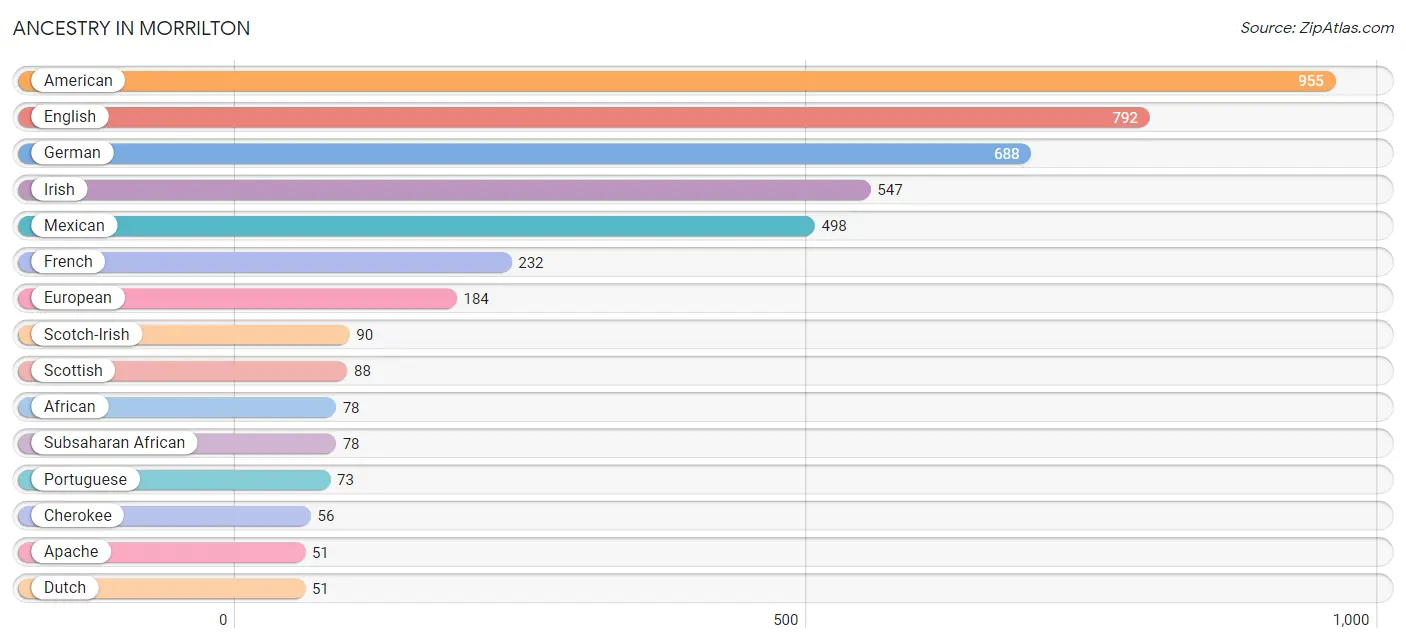
| Ancestry | # Population | % Population |
| African | 78 | 1.1% |
| American | 955 | 13.7% |
| Apache | 51 | 0.7% |
| British | 20 | 0.3% |
| Cherokee | 56 | 0.8% |
| Choctaw | 22 | 0.3% |
| Dutch | 51 | 0.7% |
| Dutch West Indian | 49 | 0.7% |
| English | 792 | 11.4% |
| European | 184 | 2.6% |
| French | 232 | 3.3% |
| German | 688 | 9.9% |
| Irish | 547 | 7.8% |
| Italian | 33 | 0.5% |
| Mexican | 498 | 7.1% |
| Northern European | 2 | 0.0% |
| Norwegian | 45 | 0.6% |
| Polish | 42 | 0.6% |
| Portuguese | 73 | 1.1% |
| Scotch-Irish | 90 | 1.3% |
| Scottish | 88 | 1.3% |
| Subsaharan African | 78 | 1.1% |
| Swedish | 19 | 0.3% |
| Swiss | 18 | 0.3% |
| Welsh | 14 | 0.2% | View All 25 Rows |
Immigrants in Morrilton
The most numerous immigrant groups reported in Morrilton came from Central America (275 | 3.9%), Latin America (275 | 3.9%), and Mexico (275 | 3.9%), together accounting for 11.8% of all Morrilton residents.
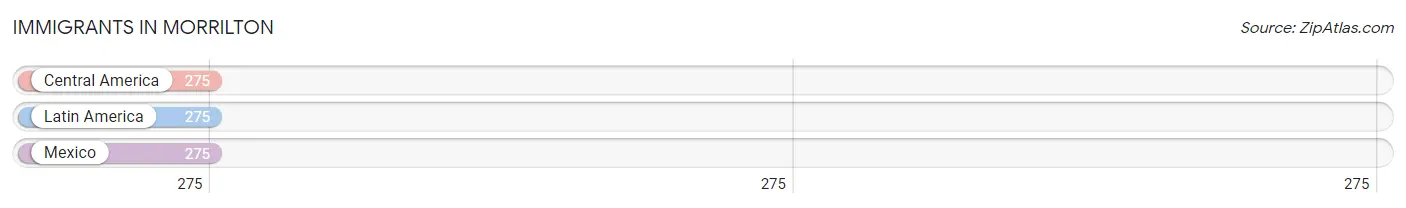
| Immigration Origin | # Population | % Population |
| Central America | 275 | 3.9% |
| Latin America | 275 | 3.9% |
| Mexico | 275 | 3.9% | View All 3 Rows |
Sex and Age in Morrilton
Sex and Age in Morrilton
The most populous age groups in Morrilton are 20 to 24 Years (279 | 9.1%) for men and 5 to 9 Years (387 | 9.9%) for women.
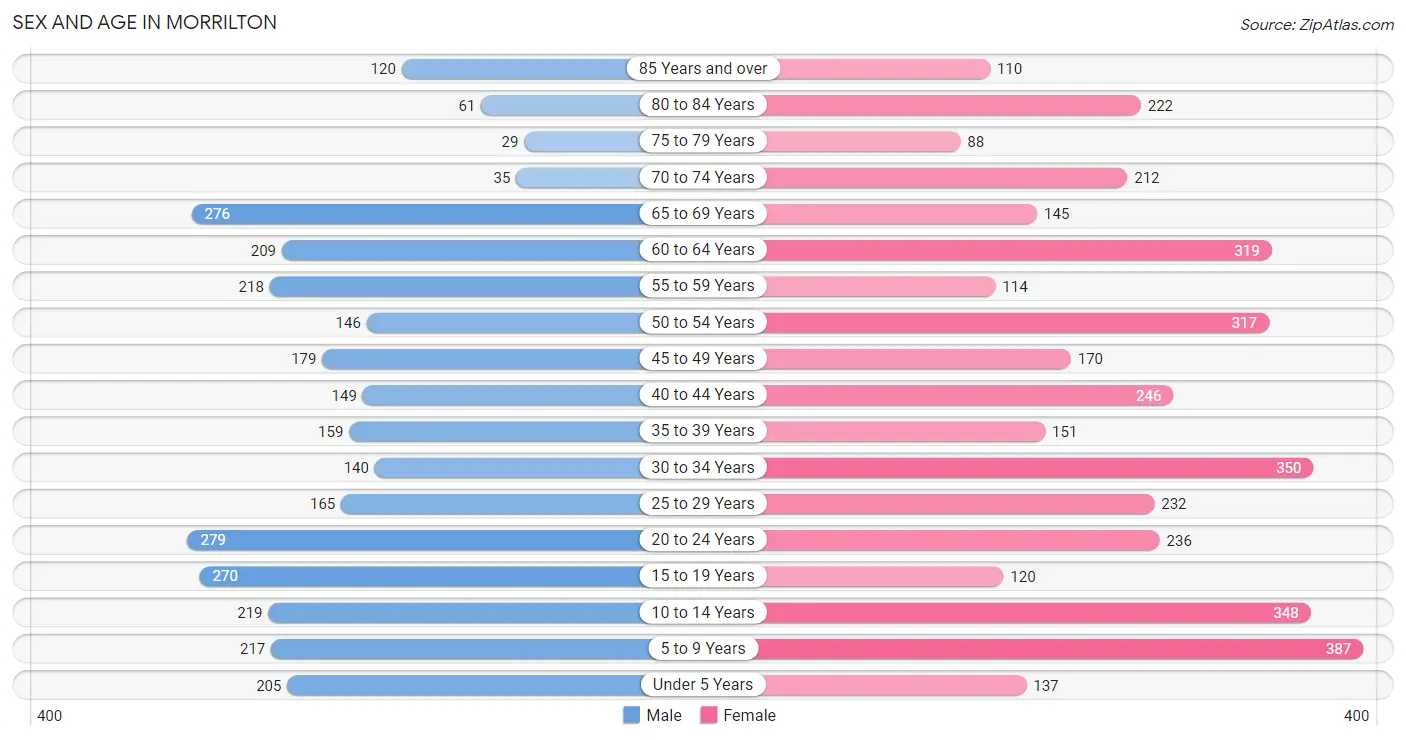
| Age Bracket | Male | Female |
| Under 5 Years | 205 (6.7%) | 137 (3.5%) |
| 5 to 9 Years | 217 (7.0%) | 387 (9.9%) |
| 10 to 14 Years | 219 (7.1%) | 348 (8.9%) |
| 15 to 19 Years | 270 (8.8%) | 120 (3.1%) |
| 20 to 24 Years | 279 (9.1%) | 236 (6.0%) |
| 25 to 29 Years | 165 (5.4%) | 232 (5.9%) |
| 30 to 34 Years | 140 (4.5%) | 350 (9.0%) |
| 35 to 39 Years | 159 (5.2%) | 151 (3.9%) |
| 40 to 44 Years | 149 (4.8%) | 246 (6.3%) |
| 45 to 49 Years | 179 (5.8%) | 170 (4.3%) |
| 50 to 54 Years | 146 (4.8%) | 317 (8.1%) |
| 55 to 59 Years | 218 (7.1%) | 114 (2.9%) |
| 60 to 64 Years | 209 (6.8%) | 319 (8.2%) |
| 65 to 69 Years | 276 (9.0%) | 145 (3.7%) |
| 70 to 74 Years | 35 (1.1%) | 212 (5.4%) |
| 75 to 79 Years | 29 (0.9%) | 88 (2.2%) |
| 80 to 84 Years | 61 (2.0%) | 222 (5.7%) |
| 85 Years and over | 120 (3.9%) | 110 (2.8%) |
| Total | 3,076 (100.0%) | 3,904 (100.0%) |
Families and Households in Morrilton
Median Family Size in Morrilton
The median family size in Morrilton is 3.00 persons per family, with married-couple families (874 | 48.4%) accounting for the largest median family size of 3.4 persons per family. On the other hand, single male/father families (118 | 6.5%) represent the smallest median family size with 1.83 persons per family.
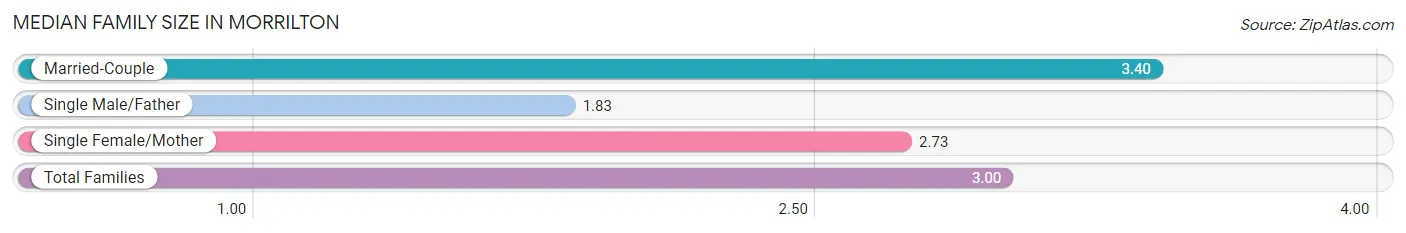
| Family Type | # Families | Family Size |
| Married-Couple | 874 (48.4%) | 3.40 |
| Single Male/Father | 118 (6.5%) | 1.83 |
| Single Female/Mother | 812 (45.0%) | 2.73 |
| Total Families | 1,804 (100.0%) | 3.00 |
Median Household Size in Morrilton
The median household size in Morrilton is 2.40 persons per household, with married-couple households (874 | 30.8%) accounting for the largest median household size of 3.46 persons per household. non-family households (1,030 | 36.3%) represent the smallest median household size with 1.16 persons per household.
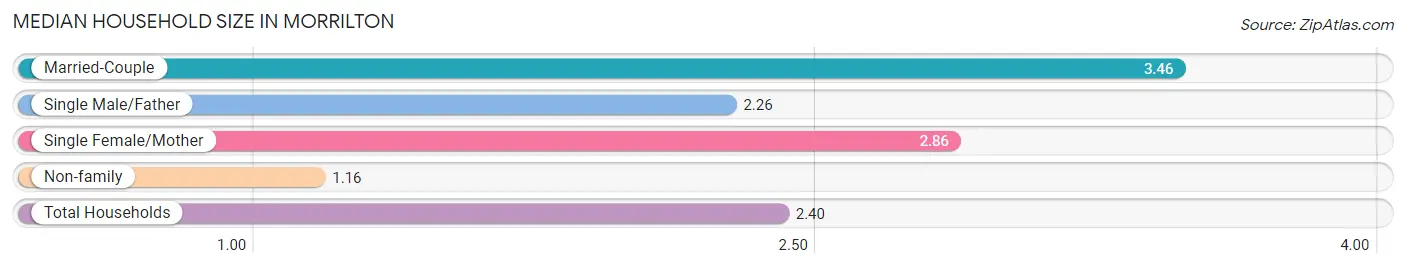
| Household Type | # Households | Household Size |
| Married-Couple | 874 (30.8%) | 3.46 |
| Single Male/Father | 118 (4.2%) | 2.26 |
| Single Female/Mother | 812 (28.6%) | 2.86 |
| Non-family | 1,030 (36.3%) | 1.16 |
| Total Households | 2,834 (100.0%) | 2.40 |
Household Size by Marriage Status in Morrilton
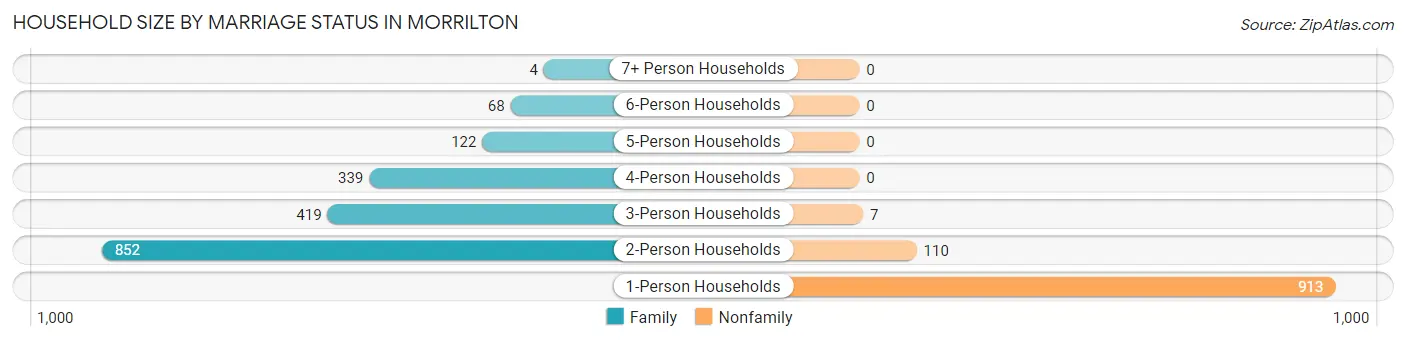
Out of a total of 2,834 households in Morrilton, 1,804 (63.7%) are family households, while 1,030 (36.3%) are nonfamily households. The most numerous type of family households are 2-person households, comprising 852, and the most common type of nonfamily households are 1-person households, comprising 913.
| Household Size | Family Households | Nonfamily Households |
| 1-Person Households | - | 913 (32.2%) |
| 2-Person Households | 852 (30.1%) | 110 (3.9%) |
| 3-Person Households | 419 (14.8%) | 7 (0.3%) |
| 4-Person Households | 339 (12.0%) | 0 (0.0%) |
| 5-Person Households | 122 (4.3%) | 0 (0.0%) |
| 6-Person Households | 68 (2.4%) | 0 (0.0%) |
| 7+ Person Households | 4 (0.1%) | 0 (0.0%) |
| Total | 1,804 (63.7%) | 1,030 (36.3%) |
Female Fertility in Morrilton
Fertility by Age in Morrilton
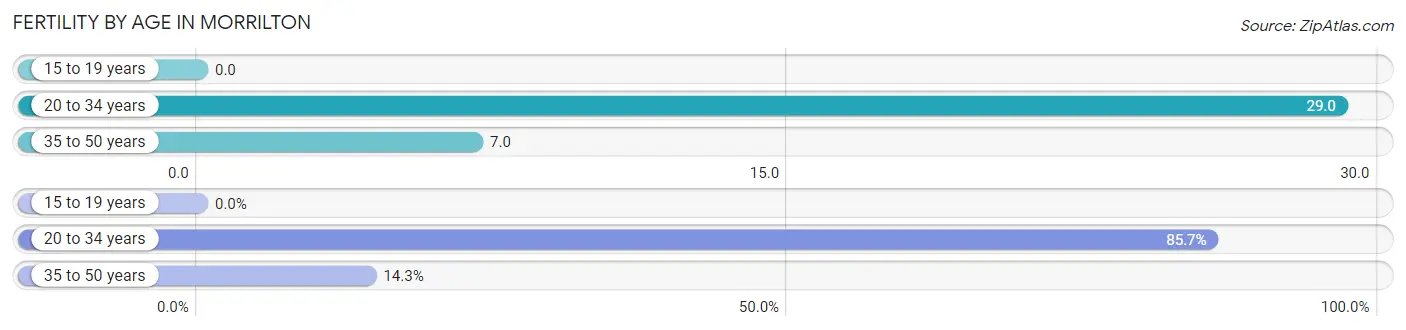
Average fertility rate in Morrilton is 18.0 births per 1,000 women. Women in the age bracket of 20 to 34 years have the highest fertility rate with 29.0 births per 1,000 women. Women in the age bracket of 20 to 34 years acount for 85.7% of all women with births.
| Age Bracket | Women with Births | Births / 1,000 Women |
| 15 to 19 years | 0 (0.0%) | 0.0 |
| 20 to 34 years | 24 (85.7%) | 29.0 |
| 35 to 50 years | 4 (14.3%) | 7.0 |
| Total | 28 (100.0%) | 18.0 |
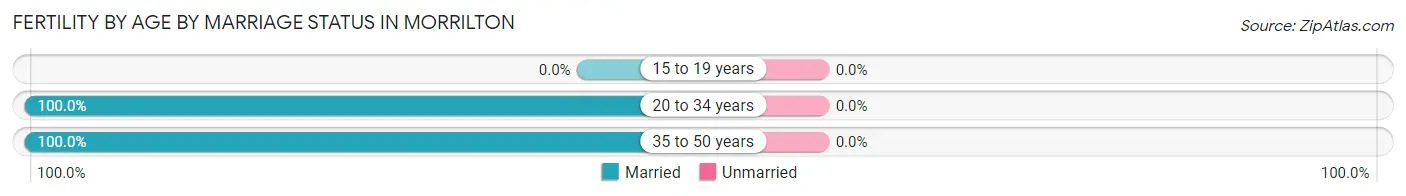
Fertility by Age by Marriage Status in Morrilton
| Age Bracket | Married | Unmarried |
| 15 to 19 years | 0 (0.0%) | 0 (0.0%) |
| 20 to 34 years | 24 (100.0%) | 0 (0.0%) |
| 35 to 50 years | 4 (100.0%) | 0 (0.0%) |
| Total | 28 (100.0%) | 0 (0.0%) |
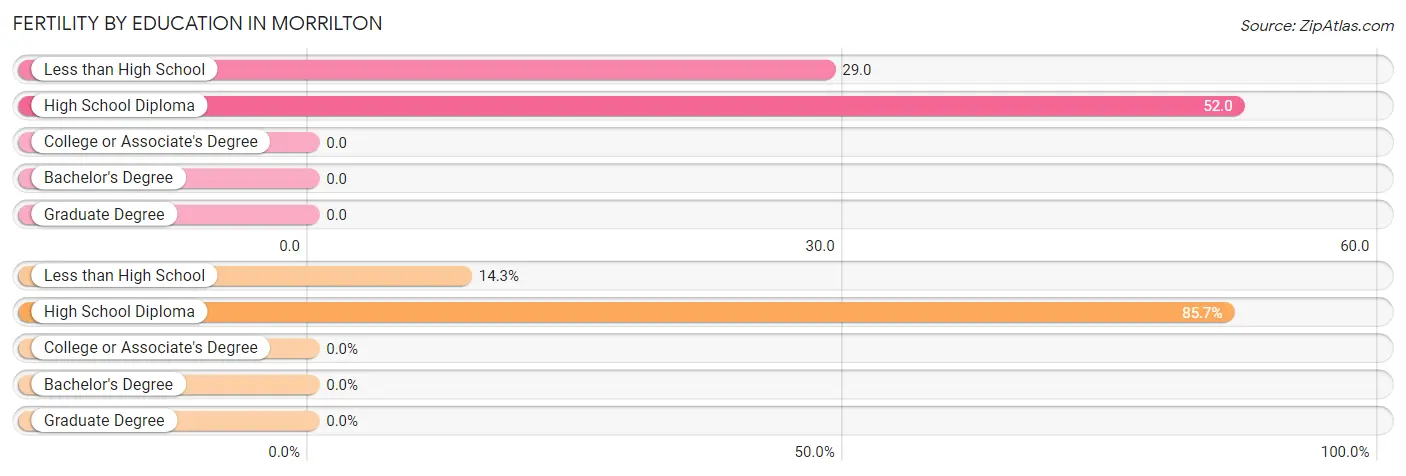
Fertility by Education in Morrilton
| Educational Attainment | Women with Births | Births / 1,000 Women |
| Less than High School | 4 (14.3%) | 29.0 |
| High School Diploma | 24 (85.7%) | 52.0 |
| College or Associate's Degree | 0 (0.0%) | 0.0 |
| Bachelor's Degree | 0 (0.0%) | 0.0 |
| Graduate Degree | 0 (0.0%) | 0.0 |
| Total | 28 (100.0%) | 18.0 |
Fertility by Education by Marriage Status in Morrilton
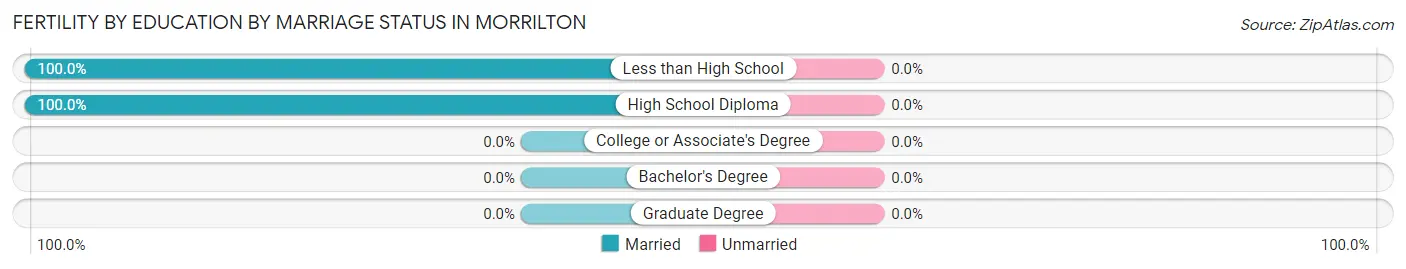
| Educational Attainment | Married | Unmarried |
| Less than High School | 4 (100.0%) | 0 (0.0%) |
| High School Diploma | 24 (100.0%) | 0 (0.0%) |
| College or Associate's Degree | 0 (0.0%) | 0 (0.0%) |
| Bachelor's Degree | 0 (0.0%) | 0 (0.0%) |
| Graduate Degree | 0 (0.0%) | 0 (0.0%) |
| Total | 28 (100.0%) | 0 (0.0%) |
Employment Characteristics in Morrilton
Employment by Class of Employer in Morrilton
Among the 2,742 employed individuals in Morrilton, private company employees (2,025 | 73.9%), not-for-profit organizations (253 | 9.2%), and state government employees (170 | 6.2%) make up the most common classes of employment.
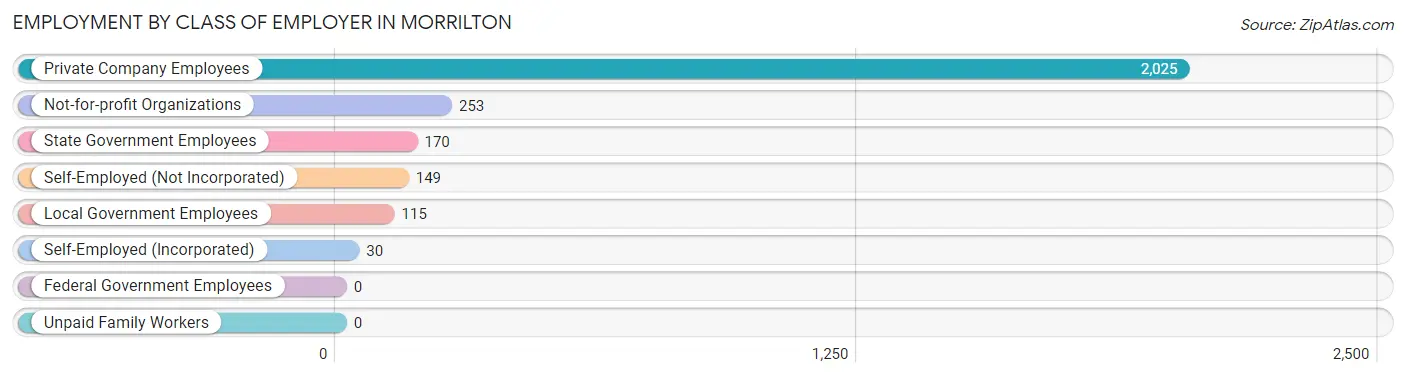
| Employer Class | # Employees | % Employees |
| Private Company Employees | 2,025 | 73.9% |
| Self-Employed (Incorporated) | 30 | 1.1% |
| Self-Employed (Not Incorporated) | 149 | 5.4% |
| Not-for-profit Organizations | 253 | 9.2% |
| Local Government Employees | 115 | 4.2% |
| State Government Employees | 170 | 6.2% |
| Federal Government Employees | 0 | 0.0% |
| Unpaid Family Workers | 0 | 0.0% |
| Total | 2,742 | 100.0% |
Employment Status by Age in Morrilton
According to the labor force statistics for Morrilton, out of the total population over 16 years of age (5,418), 56.8% or 3,077 individuals are in the labor force, with 9.8% or 302 of them unemployed. The age group with the highest labor force participation rate is 20 to 24 years, with 90.5% or 466 individuals in the labor force. Within the labor force, the 20 to 24 years age range has the highest percentage of unemployed individuals, with 28.1% or 131 of them being unemployed.
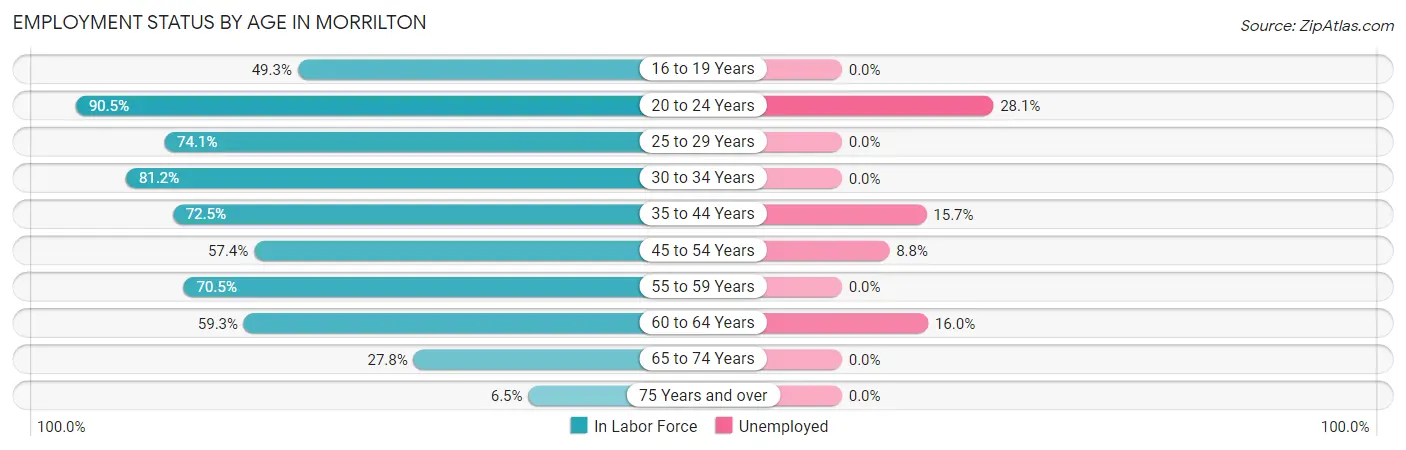
| Age Bracket | In Labor Force | Unemployed |
| 16 to 19 Years | 168 (49.3%) | 0 (0.0%) |
| 20 to 24 Years | 466 (90.5%) | 131 (28.1%) |
| 25 to 29 Years | 294 (74.1%) | 0 (0.0%) |
| 30 to 34 Years | 398 (81.2%) | 0 (0.0%) |
| 35 to 44 Years | 511 (72.5%) | 80 (15.7%) |
| 45 to 54 Years | 466 (57.4%) | 41 (8.8%) |
| 55 to 59 Years | 234 (70.5%) | 0 (0.0%) |
| 60 to 64 Years | 313 (59.3%) | 50 (16.0%) |
| 65 to 74 Years | 186 (27.8%) | 0 (0.0%) |
| 75 Years and over | 41 (6.5%) | 0 (0.0%) |
| Total | 3,077 (56.8%) | 302 (9.8%) |
Employment Status by Educational Attainment in Morrilton
According to labor force statistics for Morrilton, 67.9% of individuals (2,216) out of the total population between 25 and 64 years of age (3,264) are in the labor force, with 7.7% or 171 of them being unemployed. The group with the highest labor force participation rate are those with the educational attainment of bachelor's degree or higher, with 86.0% or 490 individuals in the labor force. Within the labor force, individuals with high school diploma education have the highest percentage of unemployment, with 11.1% or 110 of them being unemployed.
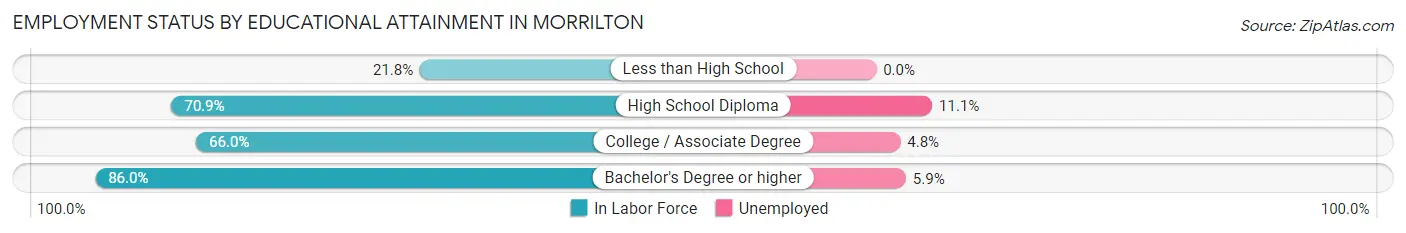
| Educational Attainment | In Labor Force | Unemployed |
| Less than High School | 60 (21.8%) | 0 (0.0%) |
| High School Diploma | 993 (70.9%) | 156 (11.1%) |
| College / Associate Degree | 672 (66.0%) | 49 (4.8%) |
| Bachelor's Degree or higher | 490 (86.0%) | 34 (5.9%) |
| Total | 2,216 (67.9%) | 251 (7.7%) |
Employment Occupations by Sex in Morrilton
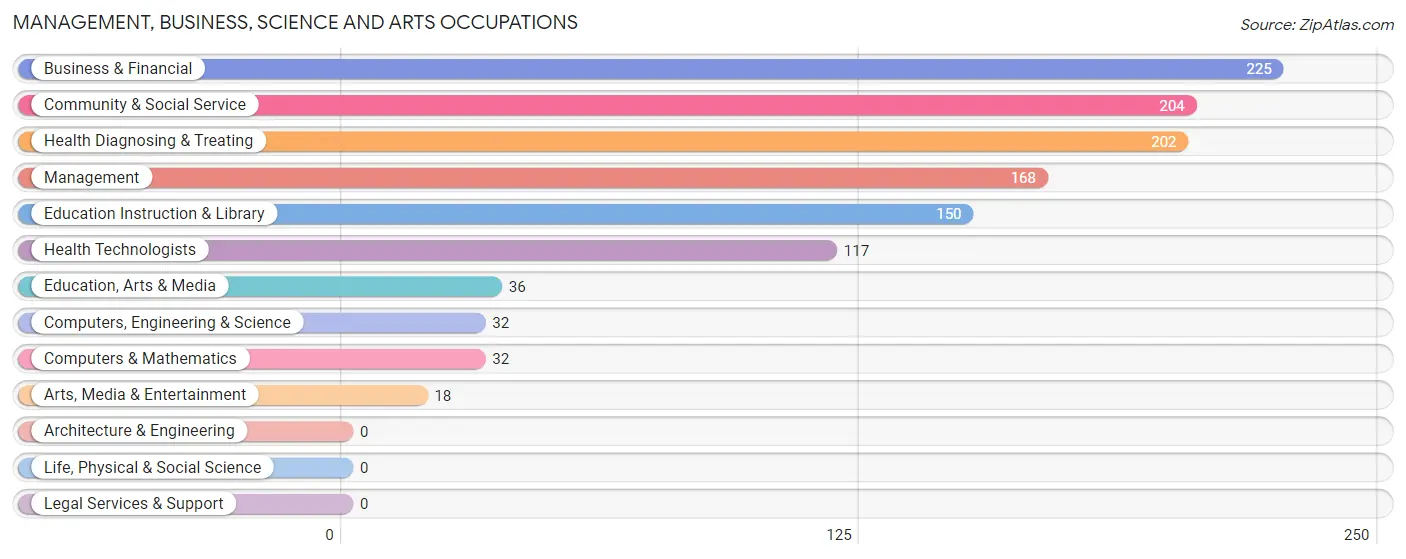
Management, Business, Science and Arts Occupations
The most common Management, Business, Science and Arts occupations in Morrilton are Business & Financial (225 | 8.1%), Community & Social Service (204 | 7.3%), Health Diagnosing & Treating (202 | 7.3%), Management (168 | 6.0%), and Education Instruction & Library (150 | 5.4%).
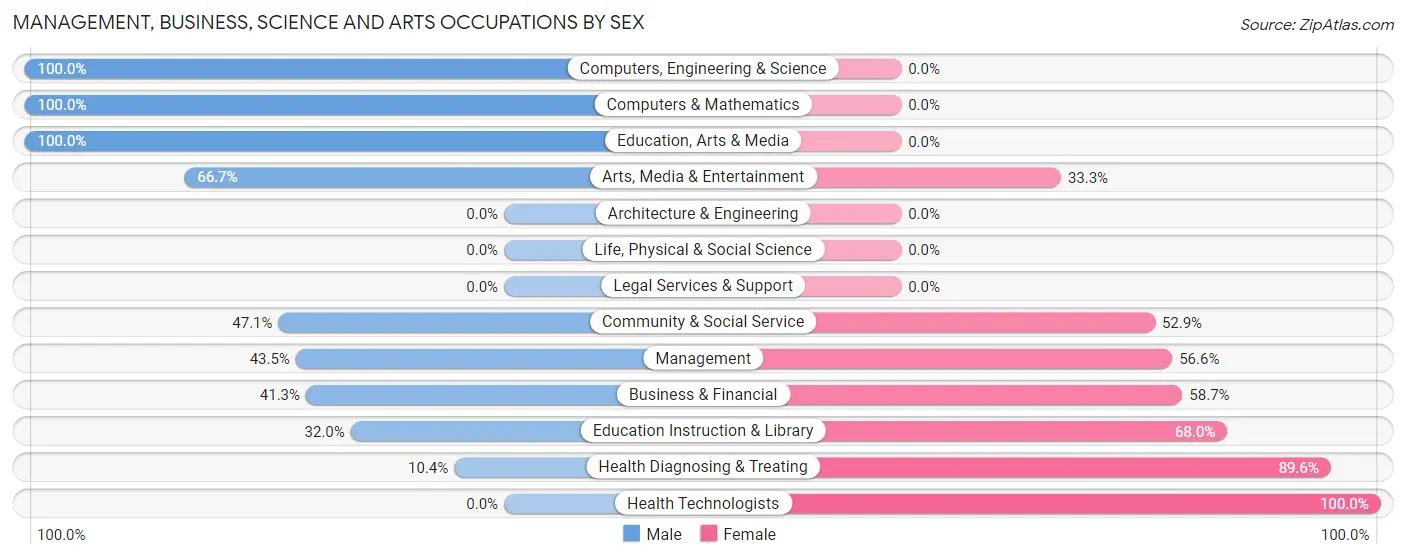
Management, Business, Science and Arts Occupations by Sex
Within the Management, Business, Science and Arts occupations in Morrilton, the most male-oriented occupations are Computers, Engineering & Science (100.0%), Computers & Mathematics (100.0%), and Education, Arts & Media (100.0%), while the most female-oriented occupations are Health Technologists (100.0%), Health Diagnosing & Treating (89.6%), and Education Instruction & Library (68.0%).
| Occupation | Male | Female |
| Management | 73 (43.4%) | 95 (56.6%) |
| Business & Financial | 93 (41.3%) | 132 (58.7%) |
| Computers, Engineering & Science | 32 (100.0%) | 0 (0.0%) |
| Computers & Mathematics | 32 (100.0%) | 0 (0.0%) |
| Architecture & Engineering | 0 (0.0%) | 0 (0.0%) |
| Life, Physical & Social Science | 0 (0.0%) | 0 (0.0%) |
| Community & Social Service | 96 (47.1%) | 108 (52.9%) |
| Education, Arts & Media | 36 (100.0%) | 0 (0.0%) |
| Legal Services & Support | 0 (0.0%) | 0 (0.0%) |
| Education Instruction & Library | 48 (32.0%) | 102 (68.0%) |
| Arts, Media & Entertainment | 12 (66.7%) | 6 (33.3%) |
| Health Diagnosing & Treating | 21 (10.4%) | 181 (89.6%) |
| Health Technologists | 0 (0.0%) | 117 (100.0%) |
| Total (Category) | 315 (37.9%) | 516 (62.1%) |
| Total (Overall) | 1,298 (46.8%) | 1,477 (53.2%) |
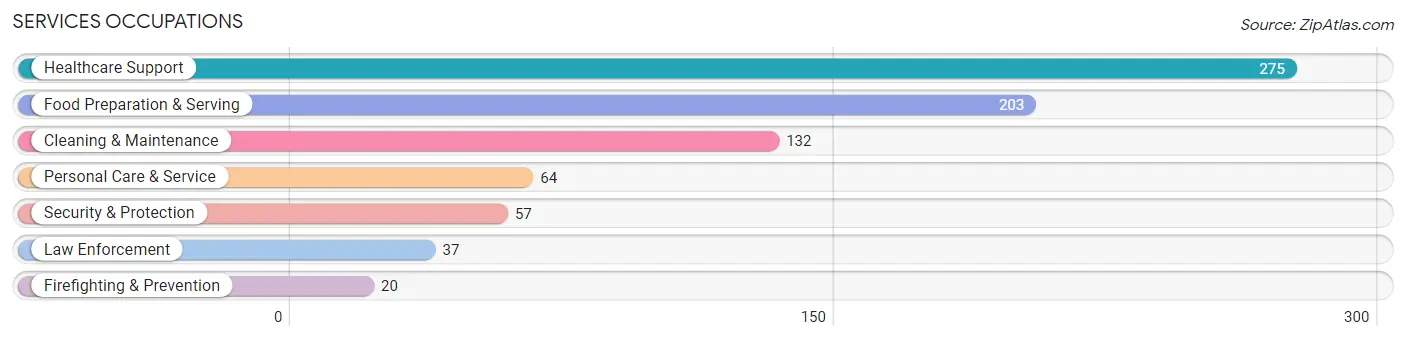
Services Occupations
The most common Services occupations in Morrilton are Healthcare Support (275 | 9.9%), Food Preparation & Serving (203 | 7.3%), Cleaning & Maintenance (132 | 4.8%), Personal Care & Service (64 | 2.3%), and Security & Protection (57 | 2.1%).
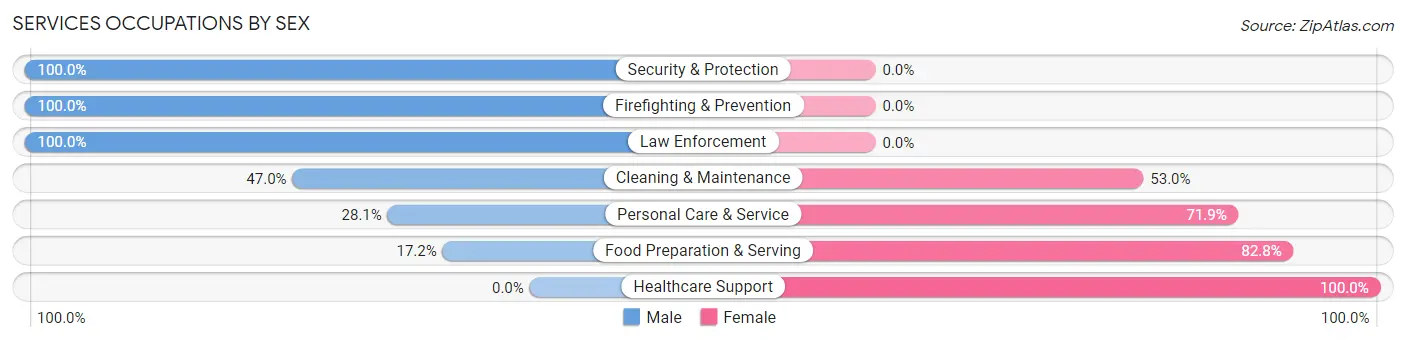
Services Occupations by Sex
Within the Services occupations in Morrilton, the most male-oriented occupations are Security & Protection (100.0%), Firefighting & Prevention (100.0%), and Law Enforcement (100.0%), while the most female-oriented occupations are Healthcare Support (100.0%), Food Preparation & Serving (82.8%), and Personal Care & Service (71.9%).
| Occupation | Male | Female |
| Healthcare Support | 0 (0.0%) | 275 (100.0%) |
| Security & Protection | 57 (100.0%) | 0 (0.0%) |
| Firefighting & Prevention | 20 (100.0%) | 0 (0.0%) |
| Law Enforcement | 37 (100.0%) | 0 (0.0%) |
| Food Preparation & Serving | 35 (17.2%) | 168 (82.8%) |
| Cleaning & Maintenance | 62 (47.0%) | 70 (53.0%) |
| Personal Care & Service | 18 (28.1%) | 46 (71.9%) |
| Total (Category) | 172 (23.5%) | 559 (76.5%) |
| Total (Overall) | 1,298 (46.8%) | 1,477 (53.2%) |
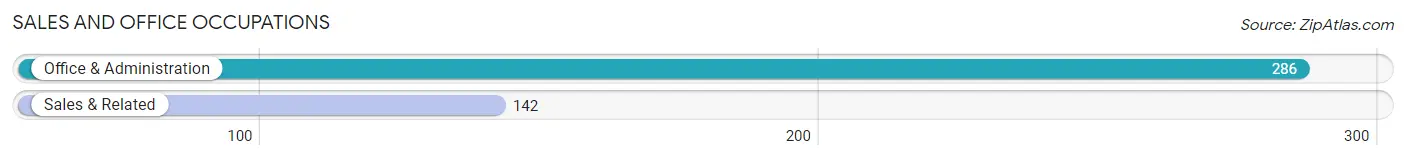
Sales and Office Occupations
The most common Sales and Office occupations in Morrilton are Office & Administration (286 | 10.3%), and Sales & Related (142 | 5.1%).
Sales and Office Occupations by Sex
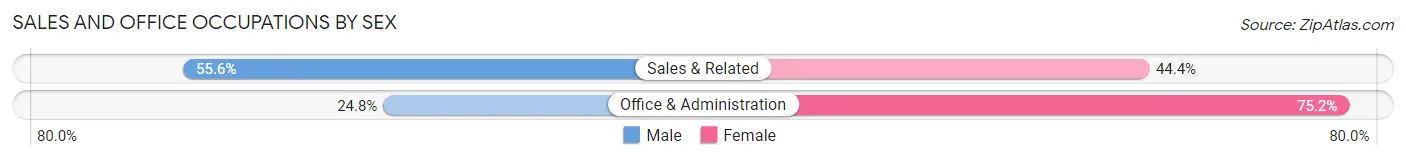
| Occupation | Male | Female |
| Sales & Related | 79 (55.6%) | 63 (44.4%) |
| Office & Administration | 71 (24.8%) | 215 (75.2%) |
| Total (Category) | 150 (35.0%) | 278 (64.9%) |
| Total (Overall) | 1,298 (46.8%) | 1,477 (53.2%) |
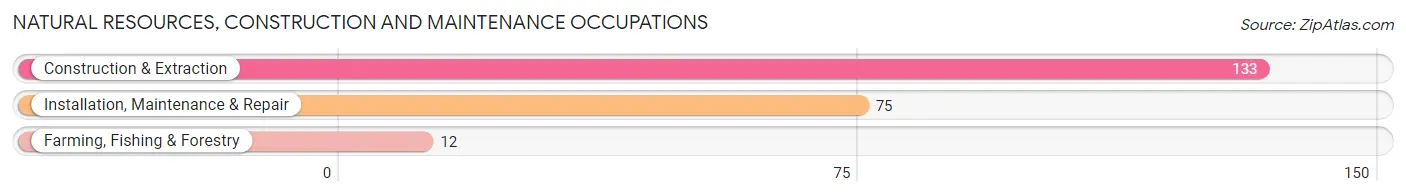
Natural Resources, Construction and Maintenance Occupations
The most common Natural Resources, Construction and Maintenance occupations in Morrilton are Construction & Extraction (133 | 4.8%), Installation, Maintenance & Repair (75 | 2.7%), and Farming, Fishing & Forestry (12 | 0.4%).
Natural Resources, Construction and Maintenance Occupations by Sex
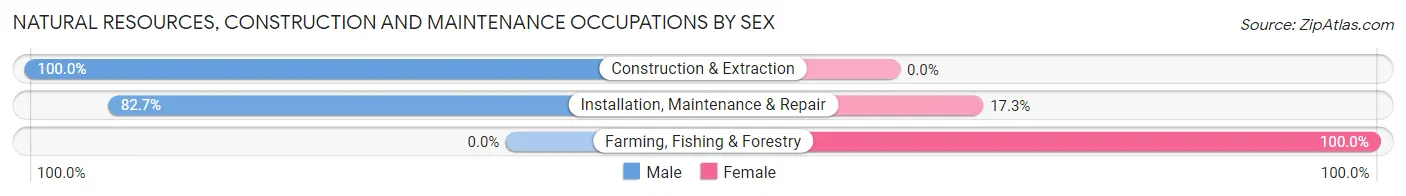
| Occupation | Male | Female |
| Farming, Fishing & Forestry | 0 (0.0%) | 12 (100.0%) |
| Construction & Extraction | 133 (100.0%) | 0 (0.0%) |
| Installation, Maintenance & Repair | 62 (82.7%) | 13 (17.3%) |
| Total (Category) | 195 (88.6%) | 25 (11.4%) |
| Total (Overall) | 1,298 (46.8%) | 1,477 (53.2%) |
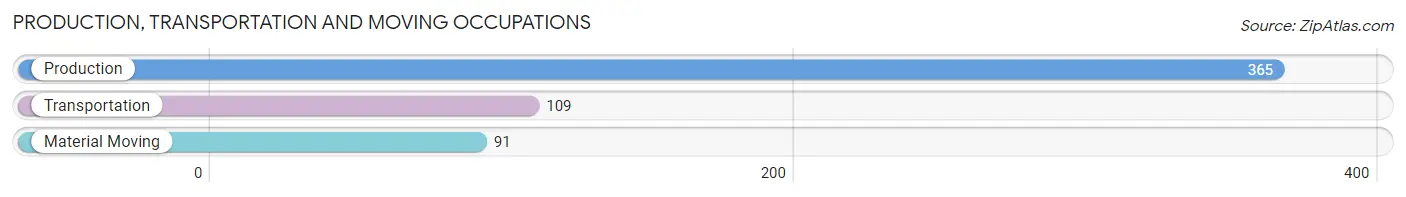
Production, Transportation and Moving Occupations
The most common Production, Transportation and Moving occupations in Morrilton are Production (365 | 13.2%), Transportation (109 | 3.9%), and Material Moving (91 | 3.3%).
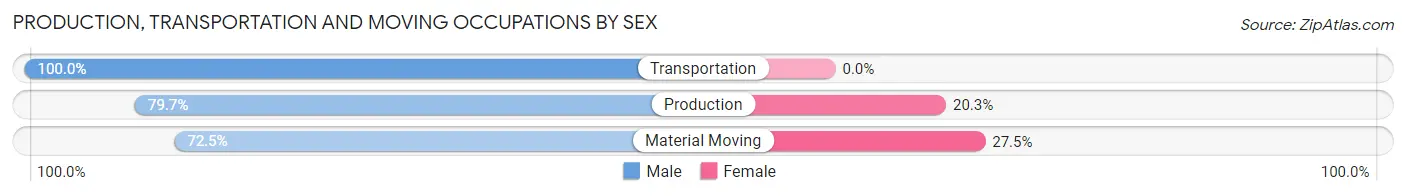
Production, Transportation and Moving Occupations by Sex
| Occupation | Male | Female |
| Production | 291 (79.7%) | 74 (20.3%) |
| Transportation | 109 (100.0%) | 0 (0.0%) |
| Material Moving | 66 (72.5%) | 25 (27.5%) |
| Total (Category) | 466 (82.5%) | 99 (17.5%) |
| Total (Overall) | 1,298 (46.8%) | 1,477 (53.2%) |
Employment Industries by Sex in Morrilton
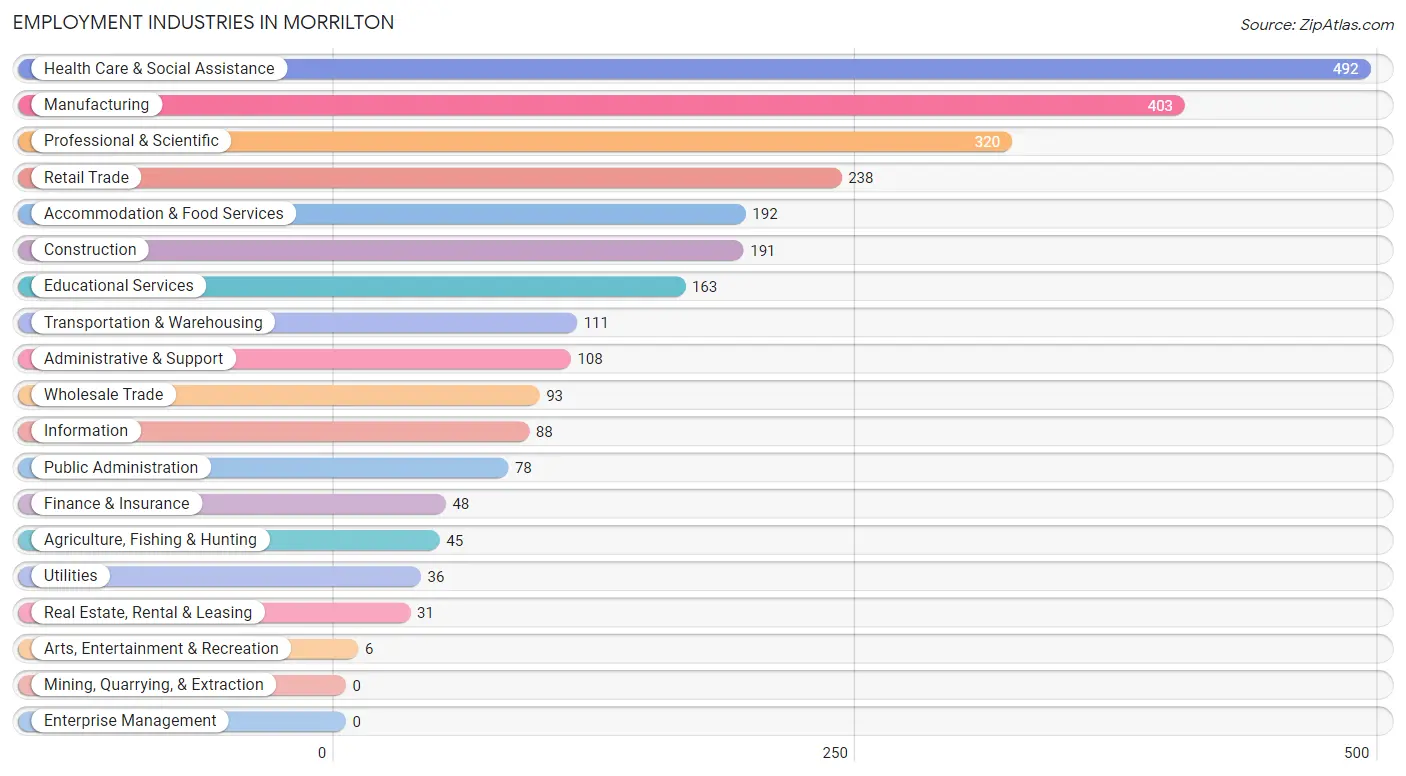
Employment Industries in Morrilton
The major employment industries in Morrilton include Health Care & Social Assistance (492 | 17.7%), Manufacturing (403 | 14.5%), Professional & Scientific (320 | 11.5%), Retail Trade (238 | 8.6%), and Accommodation & Food Services (192 | 6.9%).
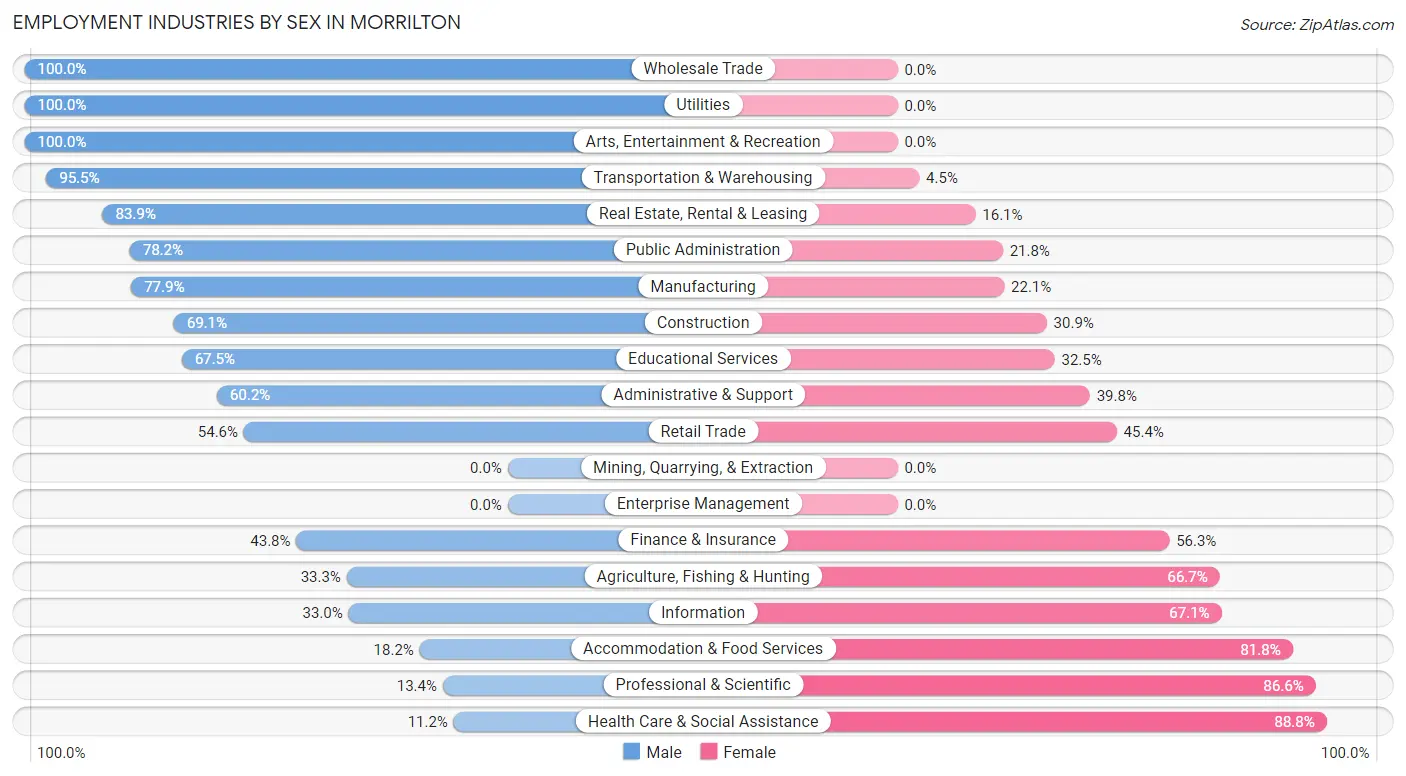
Employment Industries by Sex in Morrilton
The Morrilton industries that see more men than women are Wholesale Trade (100.0%), Utilities (100.0%), and Arts, Entertainment & Recreation (100.0%), whereas the industries that tend to have a higher number of women are Health Care & Social Assistance (88.8%), Professional & Scientific (86.6%), and Accommodation & Food Services (81.8%).
| Industry | Male | Female |
| Agriculture, Fishing & Hunting | 15 (33.3%) | 30 (66.7%) |
| Mining, Quarrying, & Extraction | 0 (0.0%) | 0 (0.0%) |
| Construction | 132 (69.1%) | 59 (30.9%) |
| Manufacturing | 314 (77.9%) | 89 (22.1%) |
| Wholesale Trade | 93 (100.0%) | 0 (0.0%) |
| Retail Trade | 130 (54.6%) | 108 (45.4%) |
| Transportation & Warehousing | 106 (95.5%) | 5 (4.5%) |
| Utilities | 36 (100.0%) | 0 (0.0%) |
| Information | 29 (33.0%) | 59 (67.0%) |
| Finance & Insurance | 21 (43.8%) | 27 (56.2%) |
| Real Estate, Rental & Leasing | 26 (83.9%) | 5 (16.1%) |
| Professional & Scientific | 43 (13.4%) | 277 (86.6%) |
| Enterprise Management | 0 (0.0%) | 0 (0.0%) |
| Administrative & Support | 65 (60.2%) | 43 (39.8%) |
| Educational Services | 110 (67.5%) | 53 (32.5%) |
| Health Care & Social Assistance | 55 (11.2%) | 437 (88.8%) |
| Arts, Entertainment & Recreation | 6 (100.0%) | 0 (0.0%) |
| Accommodation & Food Services | 35 (18.2%) | 157 (81.8%) |
| Public Administration | 61 (78.2%) | 17 (21.8%) |
| Total | 1,298 (46.8%) | 1,477 (53.2%) |
Education in Morrilton
School Enrollment in Morrilton
The most common levels of schooling among the 1,833 students in Morrilton are middle school (538 | 29.3%), elementary school (413 | 22.5%), and college / undergraduate (379 | 20.7%).
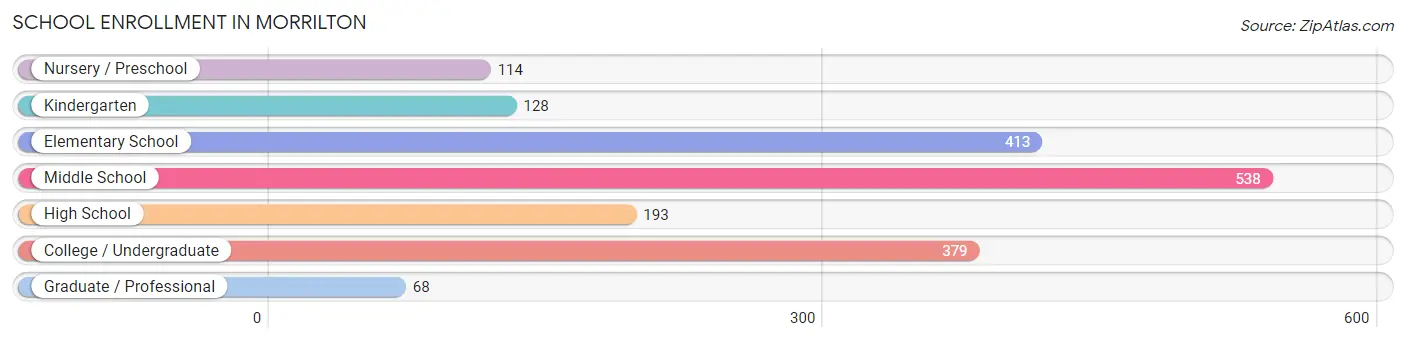
| School Level | # Students | % Students |
| Nursery / Preschool | 114 | 6.2% |
| Kindergarten | 128 | 7.0% |
| Elementary School | 413 | 22.5% |
| Middle School | 538 | 29.3% |
| High School | 193 | 10.5% |
| College / Undergraduate | 379 | 20.7% |
| Graduate / Professional | 68 | 3.7% |
| Total | 1,833 | 100.0% |
School Enrollment by Age by Funding Source in Morrilton
Out of a total of 1,833 students who are enrolled in schools in Morrilton, 181 (9.9%) attend a private institution, while the remaining 1,652 (90.1%) are enrolled in public schools. The age group of 3 to 4 year olds has the highest likelihood of being enrolled in private schools, with 16 (45.7% in the age bracket) enrolled. Conversely, the age group of 15 to 17 year olds has the lowest likelihood of being enrolled in a private school, with 191 (100.0% in the age bracket) attending a public institution.
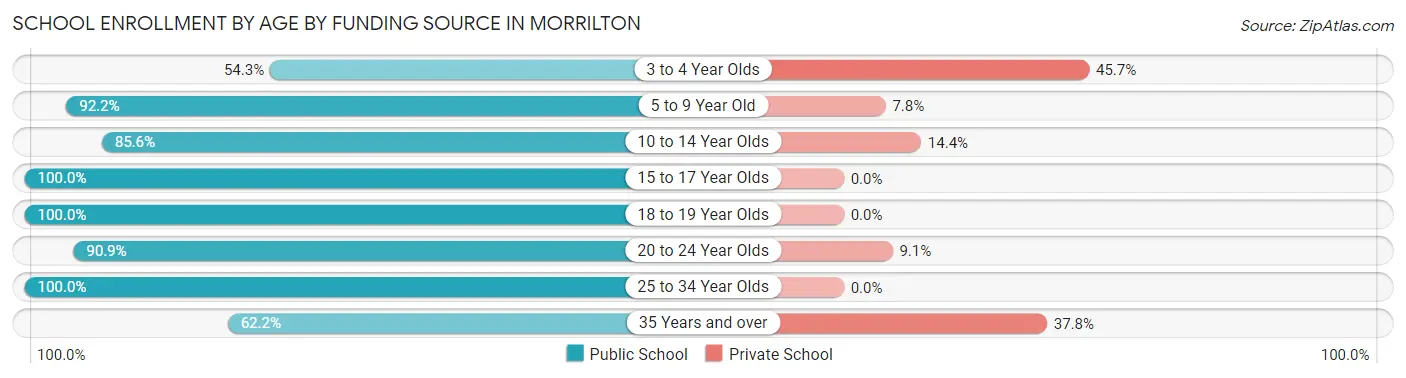
| Age Bracket | Public School | Private School |
| 3 to 4 Year Olds | 19 (54.3%) | 16 (45.7%) |
| 5 to 9 Year Old | 557 (92.2%) | 47 (7.8%) |
| 10 to 14 Year Olds | 470 (85.6%) | 79 (14.4%) |
| 15 to 17 Year Olds | 191 (100.0%) | 0 (0.0%) |
| 18 to 19 Year Olds | 135 (100.0%) | 0 (0.0%) |
| 20 to 24 Year Olds | 110 (90.9%) | 11 (9.1%) |
| 25 to 34 Year Olds | 124 (100.0%) | 0 (0.0%) |
| 35 Years and over | 46 (62.2%) | 28 (37.8%) |
| Total | 1,652 (90.1%) | 181 (9.9%) |
Educational Attainment by Field of Study in Morrilton
Education (169 | 22.9%), business (128 | 17.4%), science & technology (118 | 16.0%), visual & performing arts (70 | 9.5%), and engineering (46 | 6.2%) are the most common fields of study among 737 individuals in Morrilton who have obtained a bachelor's degree or higher.
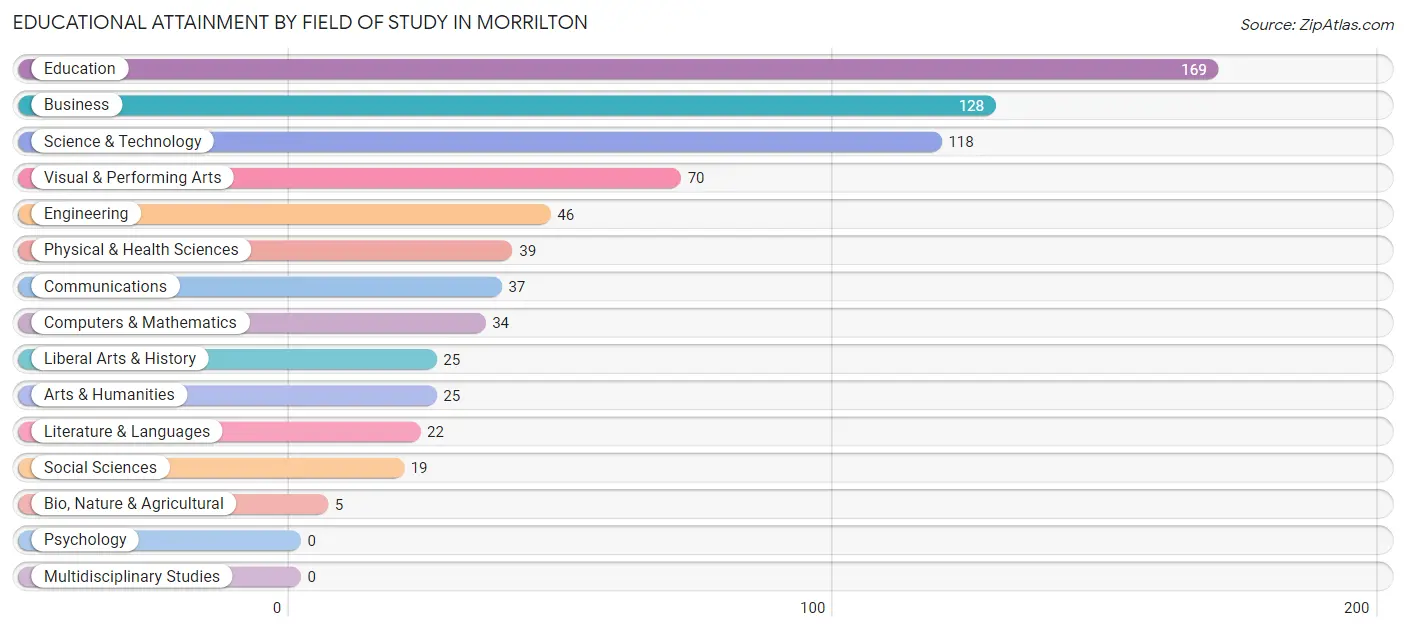
| Field of Study | # Graduates | % Graduates |
| Computers & Mathematics | 34 | 4.6% |
| Bio, Nature & Agricultural | 5 | 0.7% |
| Physical & Health Sciences | 39 | 5.3% |
| Psychology | 0 | 0.0% |
| Social Sciences | 19 | 2.6% |
| Engineering | 46 | 6.2% |
| Multidisciplinary Studies | 0 | 0.0% |
| Science & Technology | 118 | 16.0% |
| Business | 128 | 17.4% |
| Education | 169 | 22.9% |
| Literature & Languages | 22 | 3.0% |
| Liberal Arts & History | 25 | 3.4% |
| Visual & Performing Arts | 70 | 9.5% |
| Communications | 37 | 5.0% |
| Arts & Humanities | 25 | 3.4% |
| Total | 737 | 100.0% |
Transportation & Commute in Morrilton
Vehicle Availability by Sex in Morrilton
The most prevalent vehicle ownership categories in Morrilton are males with 2 vehicles (502, accounting for 39.5%) and females with 2 vehicles (450, making up 34.1%).
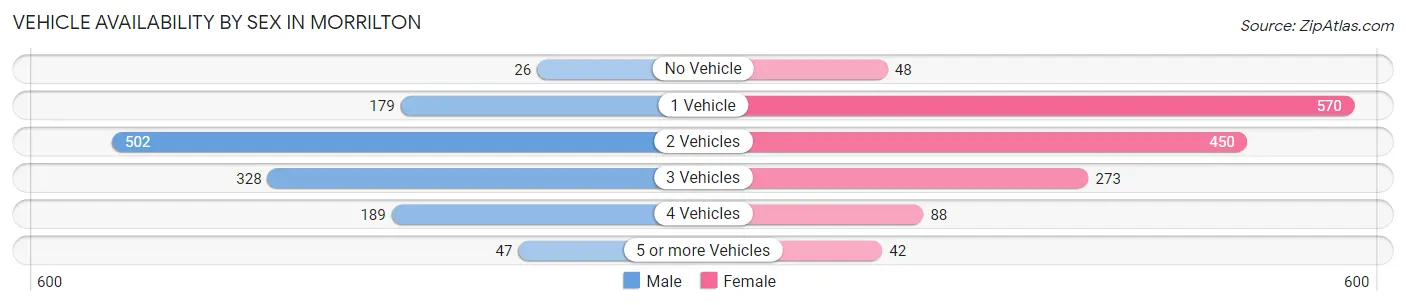
| Vehicles Available | Male | Female |
| No Vehicle | 26 (2.1%) | 48 (3.3%) |
| 1 Vehicle | 179 (14.1%) | 570 (38.8%) |
| 2 Vehicles | 502 (39.5%) | 450 (30.6%) |
| 3 Vehicles | 328 (25.8%) | 273 (18.6%) |
| 4 Vehicles | 189 (14.9%) | 88 (6.0%) |
| 5 or more Vehicles | 47 (3.7%) | 42 (2.9%) |
| Total | 1,271 (100.0%) | 1,471 (100.0%) |
Commute Time in Morrilton
The most frequently occuring commute durations in Morrilton are 5 to 9 minutes (758 commuters, 29.8%), 30 to 34 minutes (388 commuters, 15.2%), and 15 to 19 minutes (326 commuters, 12.8%).
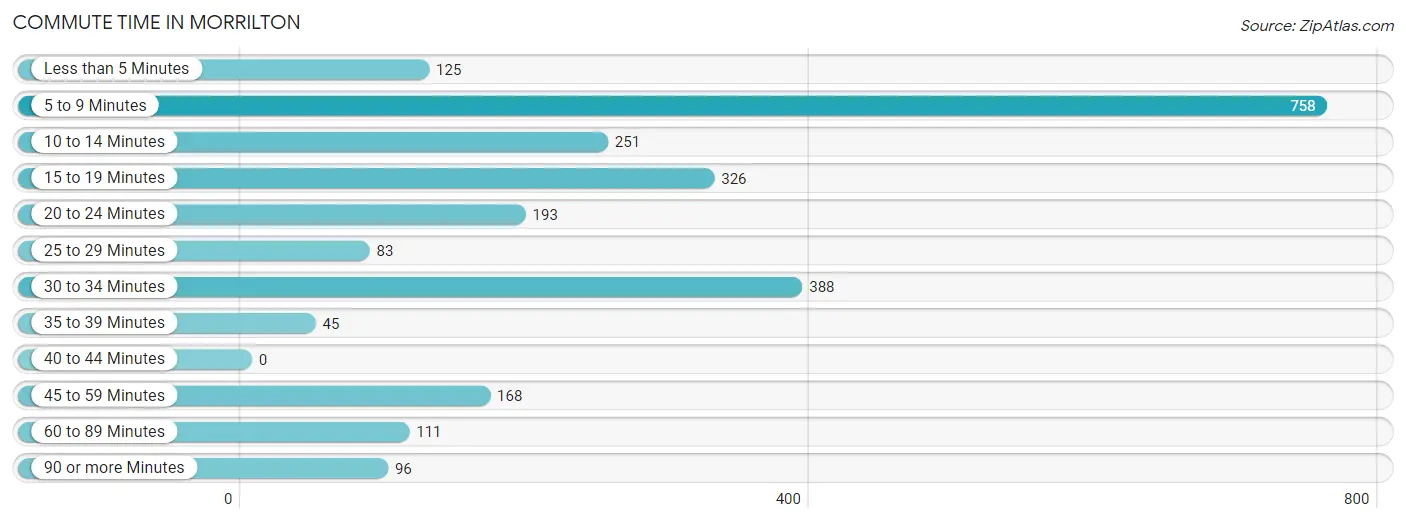
| Commute Time | # Commuters | % Commuters |
| Less than 5 Minutes | 125 | 4.9% |
| 5 to 9 Minutes | 758 | 29.8% |
| 10 to 14 Minutes | 251 | 9.9% |
| 15 to 19 Minutes | 326 | 12.8% |
| 20 to 24 Minutes | 193 | 7.6% |
| 25 to 29 Minutes | 83 | 3.3% |
| 30 to 34 Minutes | 388 | 15.2% |
| 35 to 39 Minutes | 45 | 1.8% |
| 40 to 44 Minutes | 0 | 0.0% |
| 45 to 59 Minutes | 168 | 6.6% |
| 60 to 89 Minutes | 111 | 4.4% |
| 90 or more Minutes | 96 | 3.8% |
Commute Time by Sex in Morrilton
The most common commute times in Morrilton are 5 to 9 minutes (365 commuters, 31.0%) for males and 5 to 9 minutes (393 commuters, 28.8%) for females.
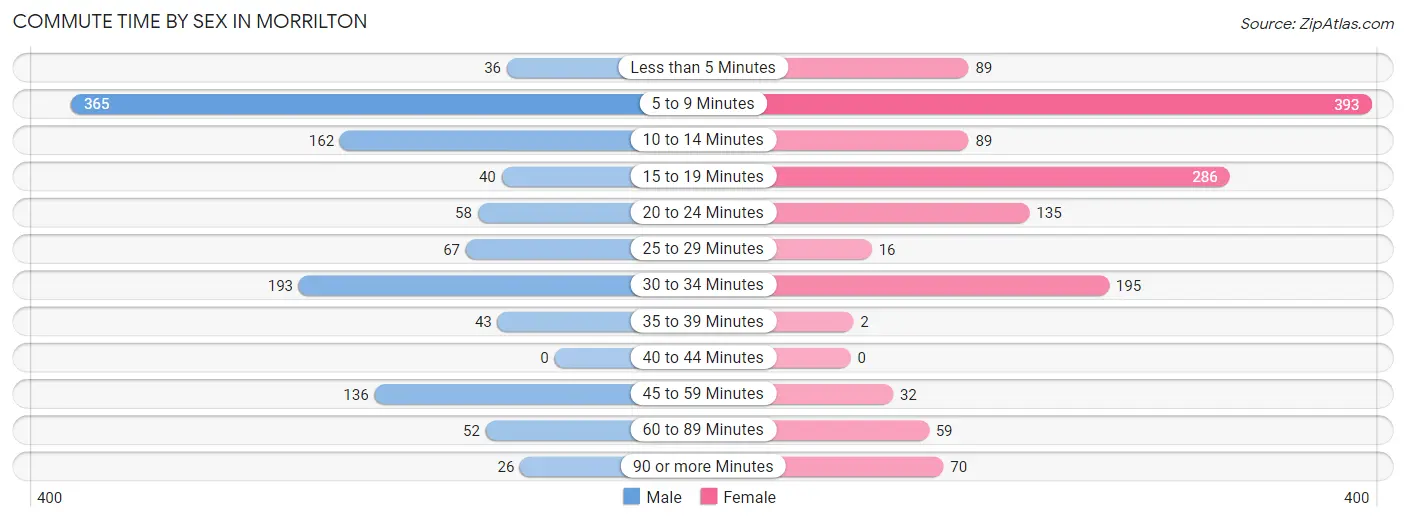
| Commute Time | Male | Female |
| Less than 5 Minutes | 36 (3.1%) | 89 (6.5%) |
| 5 to 9 Minutes | 365 (31.0%) | 393 (28.8%) |
| 10 to 14 Minutes | 162 (13.8%) | 89 (6.5%) |
| 15 to 19 Minutes | 40 (3.4%) | 286 (20.9%) |
| 20 to 24 Minutes | 58 (4.9%) | 135 (9.9%) |
| 25 to 29 Minutes | 67 (5.7%) | 16 (1.2%) |
| 30 to 34 Minutes | 193 (16.4%) | 195 (14.3%) |
| 35 to 39 Minutes | 43 (3.6%) | 2 (0.2%) |
| 40 to 44 Minutes | 0 (0.0%) | 0 (0.0%) |
| 45 to 59 Minutes | 136 (11.5%) | 32 (2.3%) |
| 60 to 89 Minutes | 52 (4.4%) | 59 (4.3%) |
| 90 or more Minutes | 26 (2.2%) | 70 (5.1%) |
Time of Departure to Work by Sex in Morrilton
The most frequent times of departure to work in Morrilton are 6:00 AM to 6:29 AM (197, 16.7%) for males and 7:00 AM to 7:29 AM (373, 27.3%) for females.
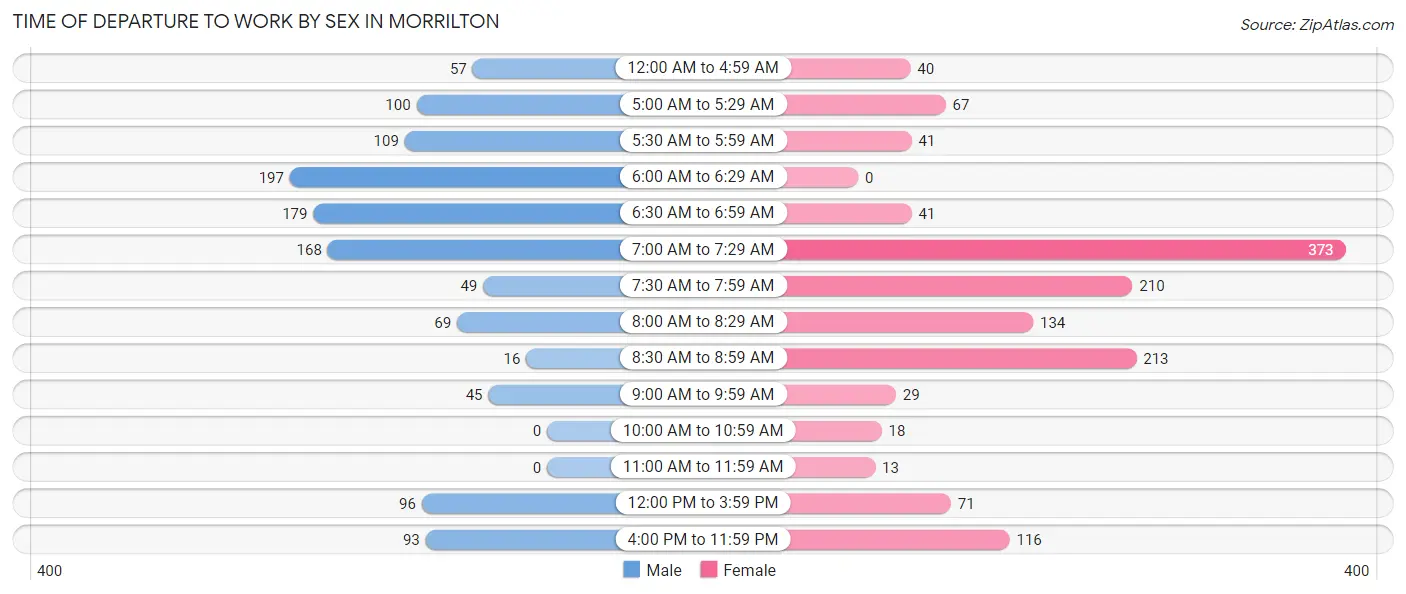
| Time of Departure | Male | Female |
| 12:00 AM to 4:59 AM | 57 (4.8%) | 40 (2.9%) |
| 5:00 AM to 5:29 AM | 100 (8.5%) | 67 (4.9%) |
| 5:30 AM to 5:59 AM | 109 (9.2%) | 41 (3.0%) |
| 6:00 AM to 6:29 AM | 197 (16.7%) | 0 (0.0%) |
| 6:30 AM to 6:59 AM | 179 (15.2%) | 41 (3.0%) |
| 7:00 AM to 7:29 AM | 168 (14.3%) | 373 (27.3%) |
| 7:30 AM to 7:59 AM | 49 (4.2%) | 210 (15.4%) |
| 8:00 AM to 8:29 AM | 69 (5.9%) | 134 (9.8%) |
| 8:30 AM to 8:59 AM | 16 (1.4%) | 213 (15.6%) |
| 9:00 AM to 9:59 AM | 45 (3.8%) | 29 (2.1%) |
| 10:00 AM to 10:59 AM | 0 (0.0%) | 18 (1.3%) |
| 11:00 AM to 11:59 AM | 0 (0.0%) | 13 (0.9%) |
| 12:00 PM to 3:59 PM | 96 (8.2%) | 71 (5.2%) |
| 4:00 PM to 11:59 PM | 93 (7.9%) | 116 (8.5%) |
| Total | 1,178 (100.0%) | 1,366 (100.0%) |
Housing Occupancy in Morrilton
Occupancy by Ownership in Morrilton
Of the total 2,834 dwellings in Morrilton, owner-occupied units account for 1,330 (46.9%), while renter-occupied units make up 1,504 (53.1%).
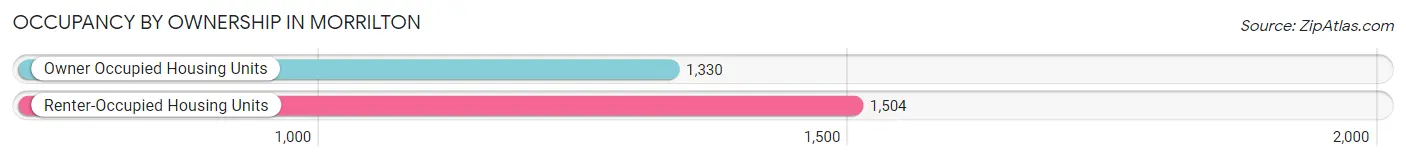
| Occupancy | # Housing Units | % Housing Units |
| Owner Occupied Housing Units | 1,330 | 46.9% |
| Renter-Occupied Housing Units | 1,504 | 53.1% |
| Total Occupied Housing Units | 2,834 | 100.0% |
Occupancy by Household Size in Morrilton
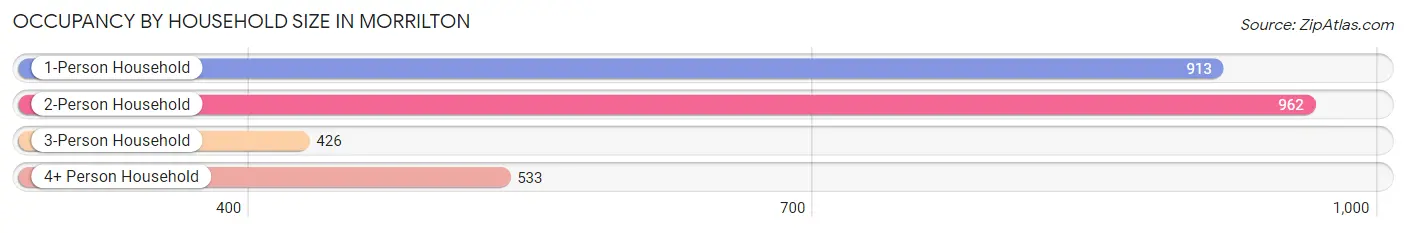
| Household Size | # Housing Units | % Housing Units |
| 1-Person Household | 913 | 32.2% |
| 2-Person Household | 962 | 33.9% |
| 3-Person Household | 426 | 15.0% |
| 4+ Person Household | 533 | 18.8% |
| Total Housing Units | 2,834 | 100.0% |
Occupancy by Ownership by Household Size in Morrilton
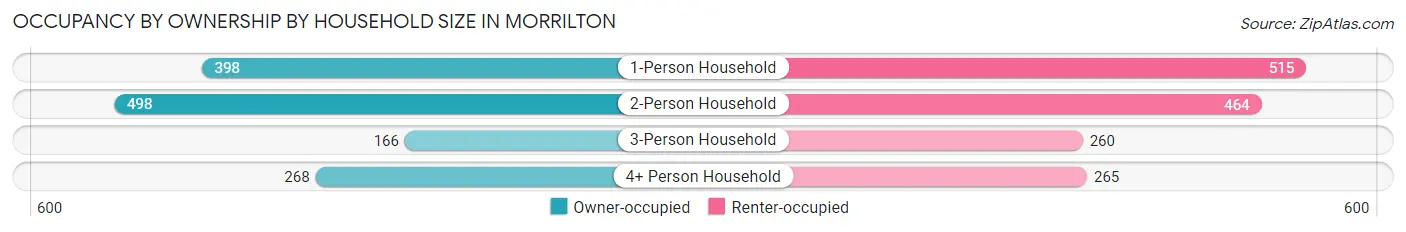
| Household Size | Owner-occupied | Renter-occupied |
| 1-Person Household | 398 (43.6%) | 515 (56.4%) |
| 2-Person Household | 498 (51.8%) | 464 (48.2%) |
| 3-Person Household | 166 (39.0%) | 260 (61.0%) |
| 4+ Person Household | 268 (50.3%) | 265 (49.7%) |
| Total Housing Units | 1,330 (46.9%) | 1,504 (53.1%) |
Occupancy by Educational Attainment in Morrilton
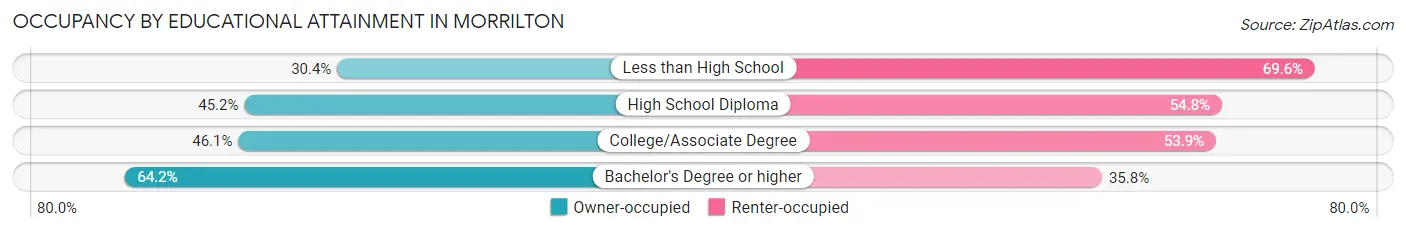
| Household Size | Owner-occupied | Renter-occupied |
| Less than High School | 101 (30.4%) | 231 (69.6%) |
| High School Diploma | 448 (45.2%) | 544 (54.8%) |
| College/Associate Degree | 480 (46.1%) | 561 (53.9%) |
| Bachelor's Degree or higher | 301 (64.2%) | 168 (35.8%) |
Occupancy by Age of Householder in Morrilton
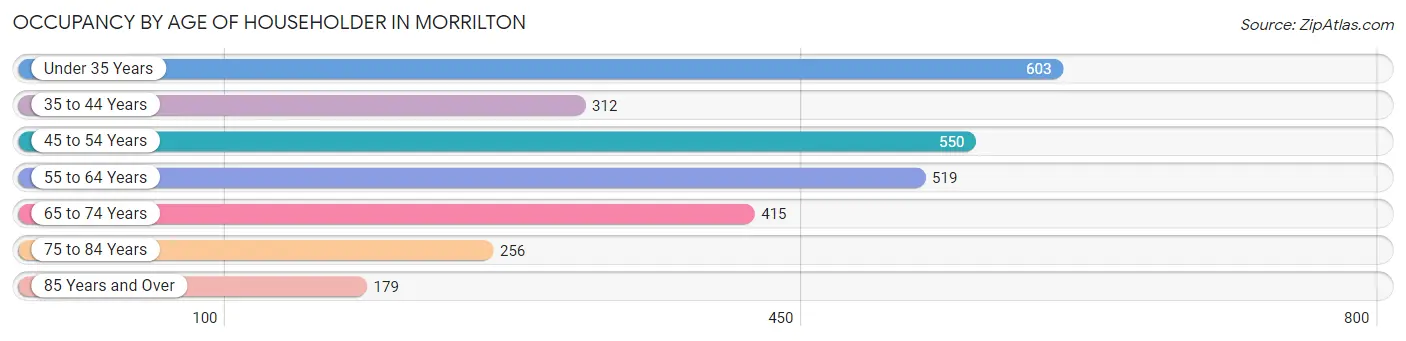
| Age Bracket | # Households | % Households |
| Under 35 Years | 603 | 21.3% |
| 35 to 44 Years | 312 | 11.0% |
| 45 to 54 Years | 550 | 19.4% |
| 55 to 64 Years | 519 | 18.3% |
| 65 to 74 Years | 415 | 14.6% |
| 75 to 84 Years | 256 | 9.0% |
| 85 Years and Over | 179 | 6.3% |
| Total | 2,834 | 100.0% |
Housing Finances in Morrilton
Median Income by Occupancy in Morrilton
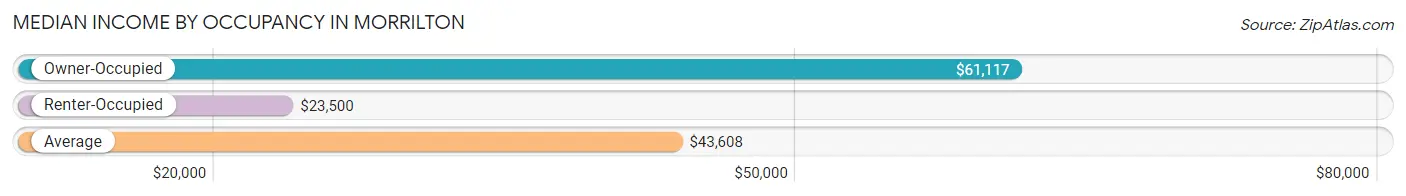
| Occupancy Type | # Households | Median Income |
| Owner-Occupied | 1,330 (46.9%) | $61,117 |
| Renter-Occupied | 1,504 (53.1%) | $23,500 |
| Average | 2,834 (100.0%) | $43,608 |
Occupancy by Householder Income Bracket in Morrilton
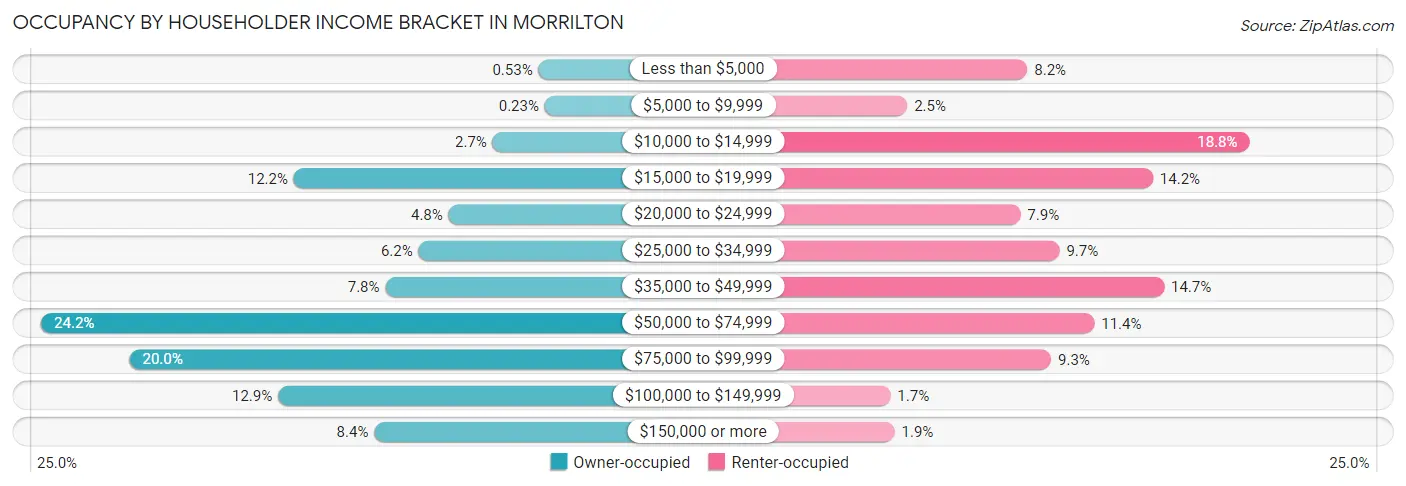
| Income Bracket | Owner-occupied | Renter-occupied |
| Less than $5,000 | 7 (0.5%) | 123 (8.2%) |
| $5,000 to $9,999 | 3 (0.2%) | 37 (2.5%) |
| $10,000 to $14,999 | 36 (2.7%) | 282 (18.8%) |
| $15,000 to $19,999 | 162 (12.2%) | 213 (14.2%) |
| $20,000 to $24,999 | 64 (4.8%) | 118 (7.9%) |
| $25,000 to $34,999 | 83 (6.2%) | 146 (9.7%) |
| $35,000 to $49,999 | 104 (7.8%) | 221 (14.7%) |
| $50,000 to $74,999 | 322 (24.2%) | 171 (11.4%) |
| $75,000 to $99,999 | 266 (20.0%) | 140 (9.3%) |
| $100,000 to $149,999 | 172 (12.9%) | 25 (1.7%) |
| $150,000 or more | 111 (8.4%) | 28 (1.9%) |
| Total | 1,330 (100.0%) | 1,504 (100.0%) |
Monthly Housing Cost Tiers in Morrilton
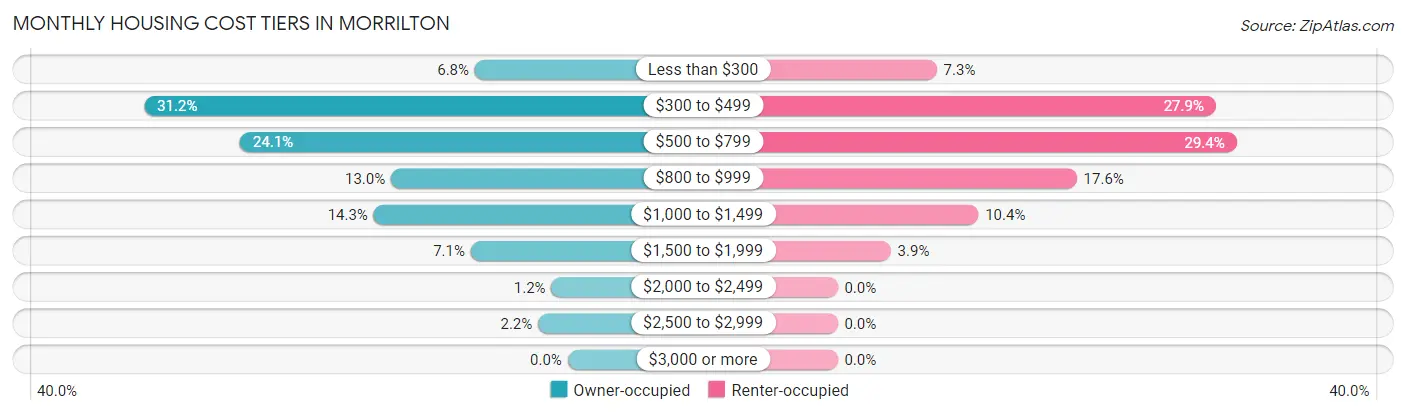
| Monthly Cost | Owner-occupied | Renter-occupied |
| Less than $300 | 91 (6.8%) | 110 (7.3%) |
| $300 to $499 | 415 (31.2%) | 419 (27.9%) |
| $500 to $799 | 321 (24.1%) | 442 (29.4%) |
| $800 to $999 | 173 (13.0%) | 265 (17.6%) |
| $1,000 to $1,499 | 190 (14.3%) | 156 (10.4%) |
| $1,500 to $1,999 | 95 (7.1%) | 59 (3.9%) |
| $2,000 to $2,499 | 16 (1.2%) | 0 (0.0%) |
| $2,500 to $2,999 | 29 (2.2%) | 0 (0.0%) |
| $3,000 or more | 0 (0.0%) | 0 (0.0%) |
| Total | 1,330 (100.0%) | 1,504 (100.0%) |
Physical Housing Characteristics in Morrilton
Housing Structures in Morrilton
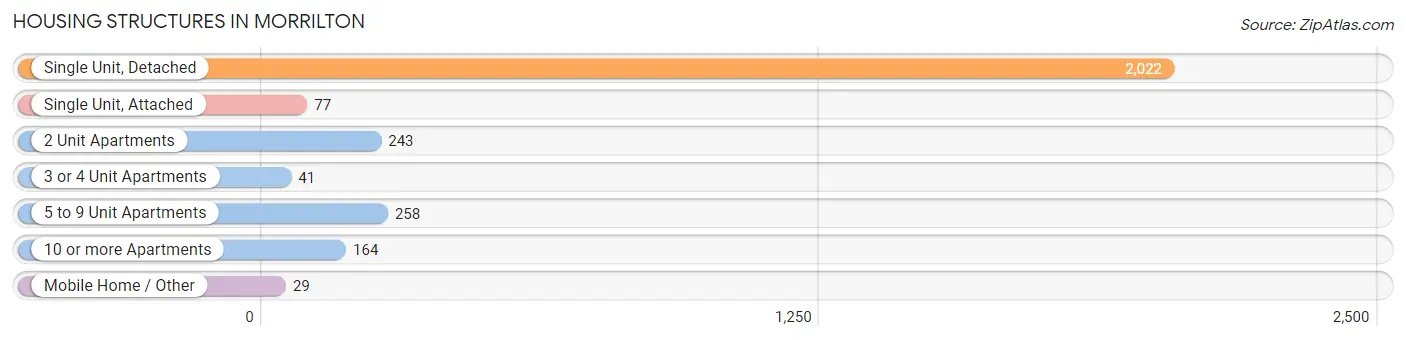
| Structure Type | # Housing Units | % Housing Units |
| Single Unit, Detached | 2,022 | 71.4% |
| Single Unit, Attached | 77 | 2.7% |
| 2 Unit Apartments | 243 | 8.6% |
| 3 or 4 Unit Apartments | 41 | 1.5% |
| 5 to 9 Unit Apartments | 258 | 9.1% |
| 10 or more Apartments | 164 | 5.8% |
| Mobile Home / Other | 29 | 1.0% |
| Total | 2,834 | 100.0% |
Housing Structures by Occupancy in Morrilton
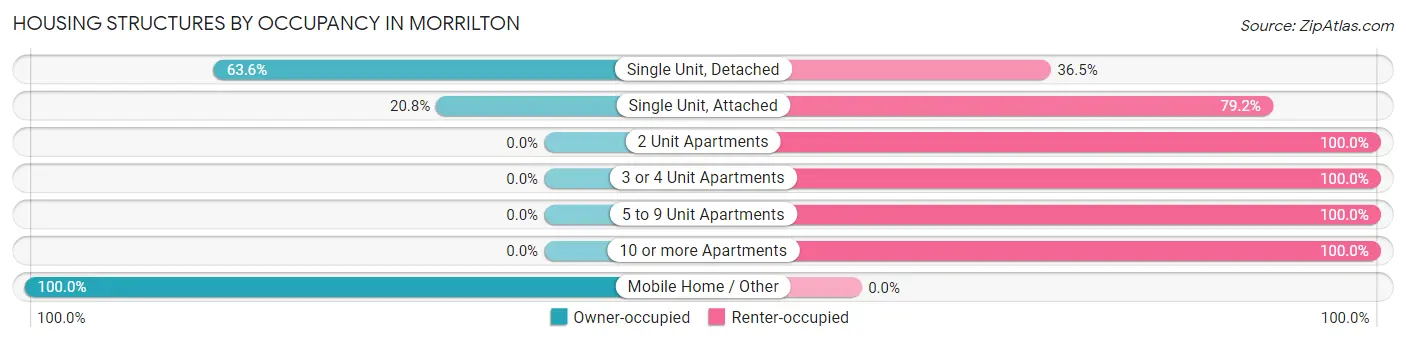
| Structure Type | Owner-occupied | Renter-occupied |
| Single Unit, Detached | 1,285 (63.5%) | 737 (36.4%) |
| Single Unit, Attached | 16 (20.8%) | 61 (79.2%) |
| 2 Unit Apartments | 0 (0.0%) | 243 (100.0%) |
| 3 or 4 Unit Apartments | 0 (0.0%) | 41 (100.0%) |
| 5 to 9 Unit Apartments | 0 (0.0%) | 258 (100.0%) |
| 10 or more Apartments | 0 (0.0%) | 164 (100.0%) |
| Mobile Home / Other | 29 (100.0%) | 0 (0.0%) |
| Total | 1,330 (46.9%) | 1,504 (53.1%) |
Housing Structures by Number of Rooms in Morrilton
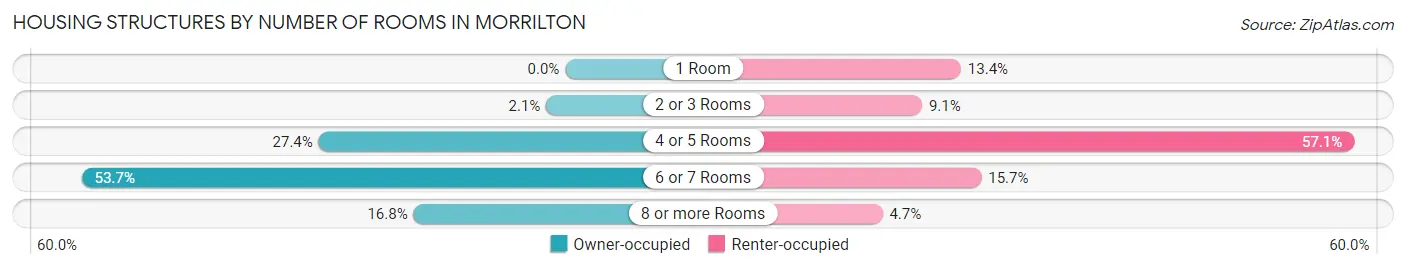
| Number of Rooms | Owner-occupied | Renter-occupied |
| 1 Room | 0 (0.0%) | 202 (13.4%) |
| 2 or 3 Rooms | 28 (2.1%) | 137 (9.1%) |
| 4 or 5 Rooms | 364 (27.4%) | 858 (57.1%) |
| 6 or 7 Rooms | 714 (53.7%) | 236 (15.7%) |
| 8 or more Rooms | 224 (16.8%) | 71 (4.7%) |
| Total | 1,330 (100.0%) | 1,504 (100.0%) |
Housing Structure by Heating Type in Morrilton
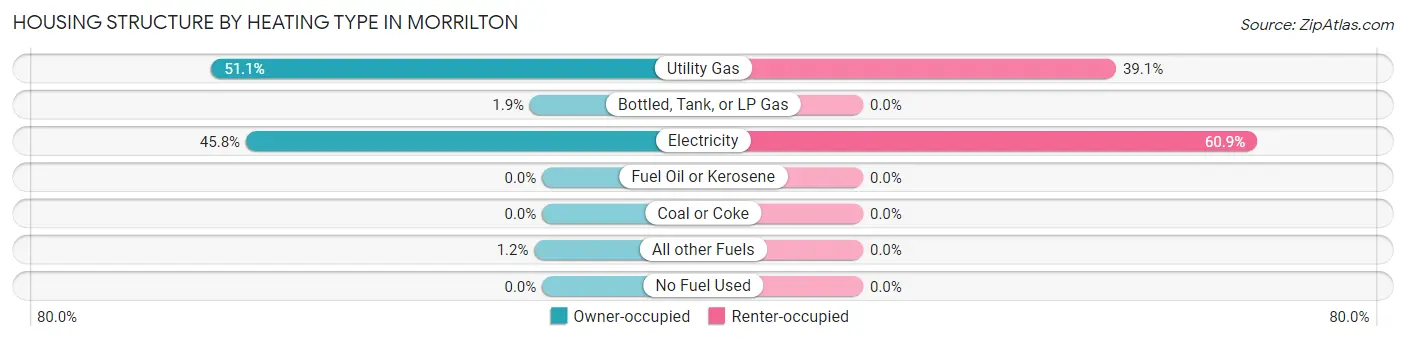
| Heating Type | Owner-occupied | Renter-occupied |
| Utility Gas | 680 (51.1%) | 588 (39.1%) |
| Bottled, Tank, or LP Gas | 25 (1.9%) | 0 (0.0%) |
| Electricity | 609 (45.8%) | 916 (60.9%) |
| Fuel Oil or Kerosene | 0 (0.0%) | 0 (0.0%) |
| Coal or Coke | 0 (0.0%) | 0 (0.0%) |
| All other Fuels | 16 (1.2%) | 0 (0.0%) |
| No Fuel Used | 0 (0.0%) | 0 (0.0%) |
| Total | 1,330 (100.0%) | 1,504 (100.0%) |
Household Vehicle Usage in Morrilton
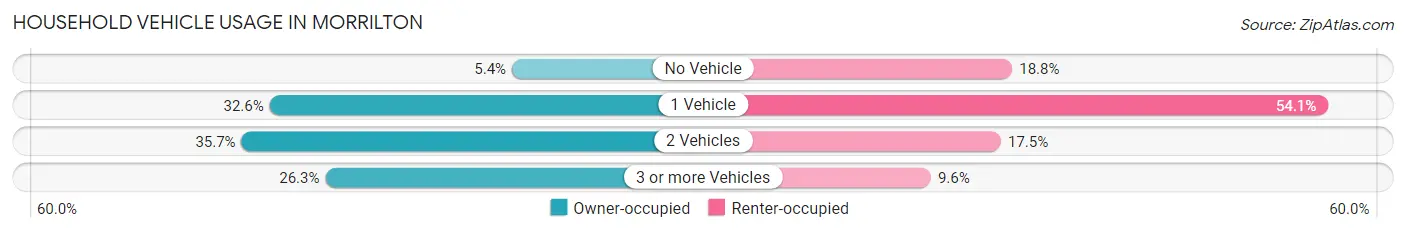
| Vehicles per Household | Owner-occupied | Renter-occupied |
| No Vehicle | 72 (5.4%) | 282 (18.8%) |
| 1 Vehicle | 433 (32.6%) | 814 (54.1%) |
| 2 Vehicles | 475 (35.7%) | 263 (17.5%) |
| 3 or more Vehicles | 350 (26.3%) | 145 (9.6%) |
| Total | 1,330 (100.0%) | 1,504 (100.0%) |
Real Estate & Mortgages in Morrilton
Real Estate and Mortgage Overview in Morrilton
| Characteristic | Without Mortgage | With Mortgage |
| Housing Units | 598 | 732 |
| Median Property Value | $152,300 | $124,200 |
| Median Household Income | $45,096 | $72 |
| Monthly Housing Costs | $445 | $0 |
| Real Estate Taxes | $929 | $58 |
Property Value by Mortgage Status in Morrilton
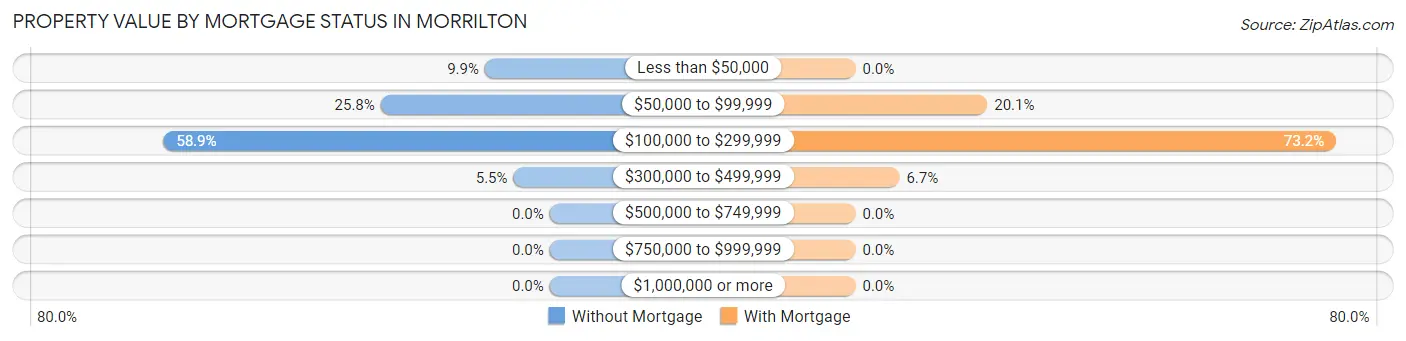
| Property Value | Without Mortgage | With Mortgage |
| Less than $50,000 | 59 (9.9%) | 0 (0.0%) |
| $50,000 to $99,999 | 154 (25.8%) | 147 (20.1%) |
| $100,000 to $299,999 | 352 (58.9%) | 536 (73.2%) |
| $300,000 to $499,999 | 33 (5.5%) | 49 (6.7%) |
| $500,000 to $749,999 | 0 (0.0%) | 0 (0.0%) |
| $750,000 to $999,999 | 0 (0.0%) | 0 (0.0%) |
| $1,000,000 or more | 0 (0.0%) | 0 (0.0%) |
| Total | 598 (100.0%) | 732 (100.0%) |
Household Income by Mortgage Status in Morrilton
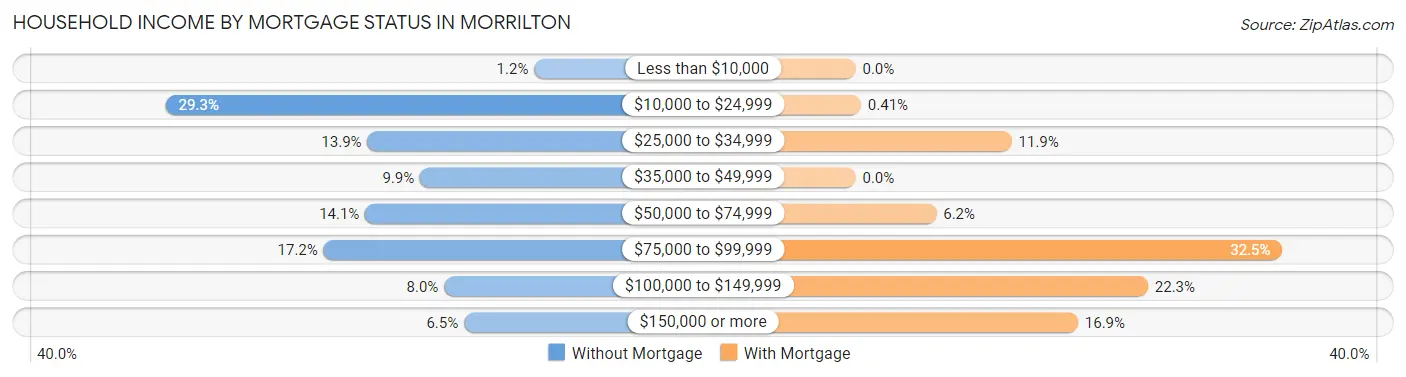
| Household Income | Without Mortgage | With Mortgage |
| Less than $10,000 | 7 (1.2%) | 0 (0.0%) |
| $10,000 to $24,999 | 175 (29.3%) | 3 (0.4%) |
| $25,000 to $34,999 | 83 (13.9%) | 87 (11.9%) |
| $35,000 to $49,999 | 59 (9.9%) | 0 (0.0%) |
| $50,000 to $74,999 | 84 (14.1%) | 45 (6.1%) |
| $75,000 to $99,999 | 103 (17.2%) | 238 (32.5%) |
| $100,000 to $149,999 | 48 (8.0%) | 163 (22.3%) |
| $150,000 or more | 39 (6.5%) | 124 (16.9%) |
| Total | 598 (100.0%) | 732 (100.0%) |
Property Value to Household Income Ratio in Morrilton
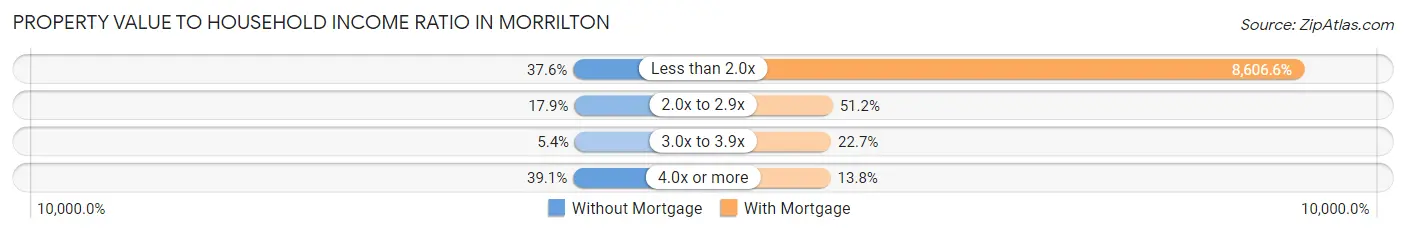
| Value-to-Income Ratio | Without Mortgage | With Mortgage |
| Less than 2.0x | 225 (37.6%) | 63,000 (8,606.6%) |
| 2.0x to 2.9x | 107 (17.9%) | 375 (51.2%) |
| 3.0x to 3.9x | 32 (5.3%) | 166 (22.7%) |
| 4.0x or more | 234 (39.1%) | 101 (13.8%) |
| Total | 598 (100.0%) | 732 (100.0%) |
Real Estate Taxes by Mortgage Status in Morrilton
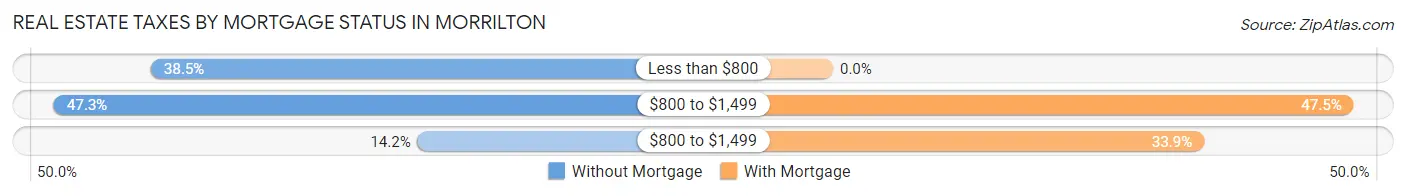
| Property Taxes | Without Mortgage | With Mortgage |
| Less than $800 | 230 (38.5%) | 0 (0.0%) |
| $800 to $1,499 | 283 (47.3%) | 348 (47.5%) |
| $800 to $1,499 | 85 (14.2%) | 248 (33.9%) |
| Total | 598 (100.0%) | 732 (100.0%) |
Health & Disability in Morrilton
Health Insurance Coverage by Age in Morrilton
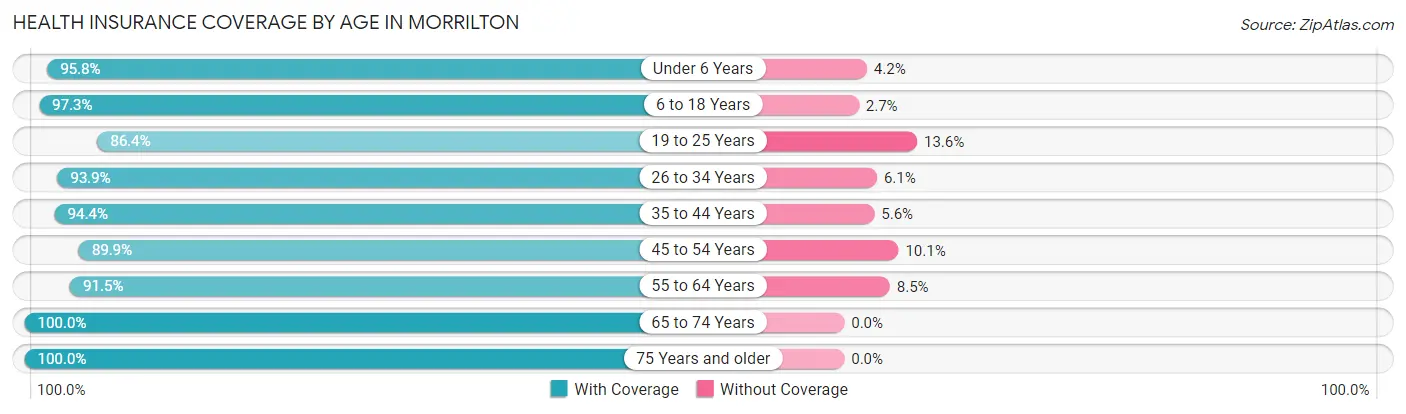
| Age Bracket | With Coverage | Without Coverage |
| Under 6 Years | 499 (95.8%) | 22 (4.2%) |
| 6 to 18 Years | 1,220 (97.3%) | 34 (2.7%) |
| 19 to 25 Years | 580 (86.4%) | 91 (13.6%) |
| 26 to 34 Years | 801 (93.9%) | 52 (6.1%) |
| 35 to 44 Years | 658 (94.4%) | 39 (5.6%) |
| 45 to 54 Years | 729 (89.9%) | 82 (10.1%) |
| 55 to 64 Years | 787 (91.5%) | 73 (8.5%) |
| 65 to 74 Years | 646 (100.0%) | 0 (0.0%) |
| 75 Years and older | 573 (100.0%) | 0 (0.0%) |
| Total | 6,493 (94.3%) | 393 (5.7%) |
Health Insurance Coverage by Citizenship Status in Morrilton
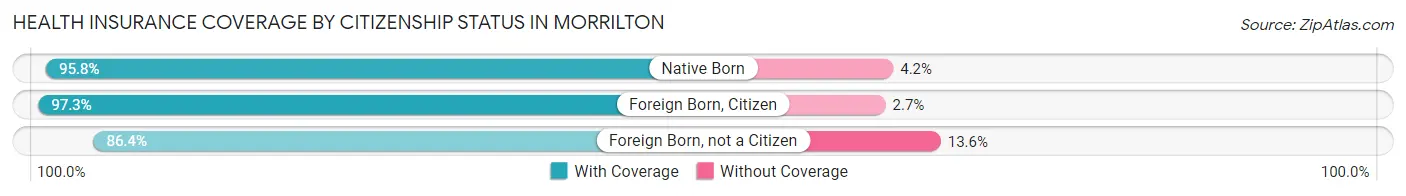
| Citizenship Status | With Coverage | Without Coverage |
| Native Born | 499 (95.8%) | 22 (4.2%) |
| Foreign Born, Citizen | 1,220 (97.3%) | 34 (2.7%) |
| Foreign Born, not a Citizen | 580 (86.4%) | 91 (13.6%) |
Health Insurance Coverage by Household Income in Morrilton
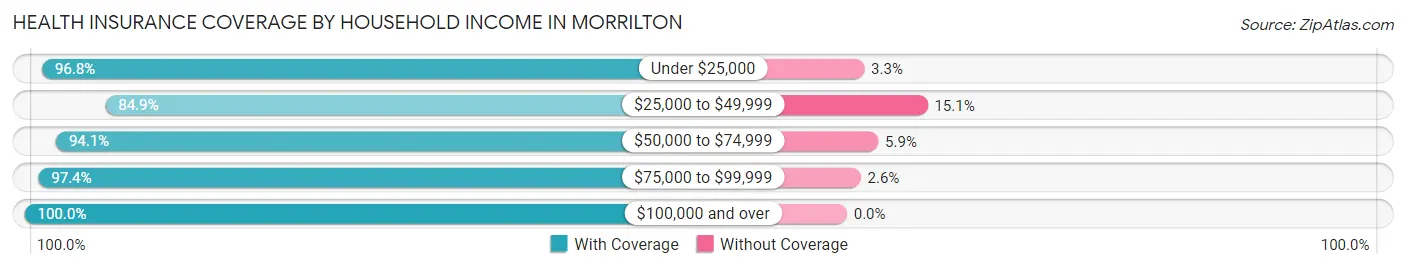
| Household Income | With Coverage | Without Coverage |
| Under $25,000 | 1,787 (96.8%) | 60 (3.3%) |
| $25,000 to $49,999 | 1,241 (84.9%) | 221 (15.1%) |
| $50,000 to $74,999 | 1,040 (94.1%) | 65 (5.9%) |
| $75,000 to $99,999 | 1,129 (97.4%) | 30 (2.6%) |
| $100,000 and over | 1,230 (100.0%) | 0 (0.0%) |
Public vs Private Health Insurance Coverage by Age in Morrilton
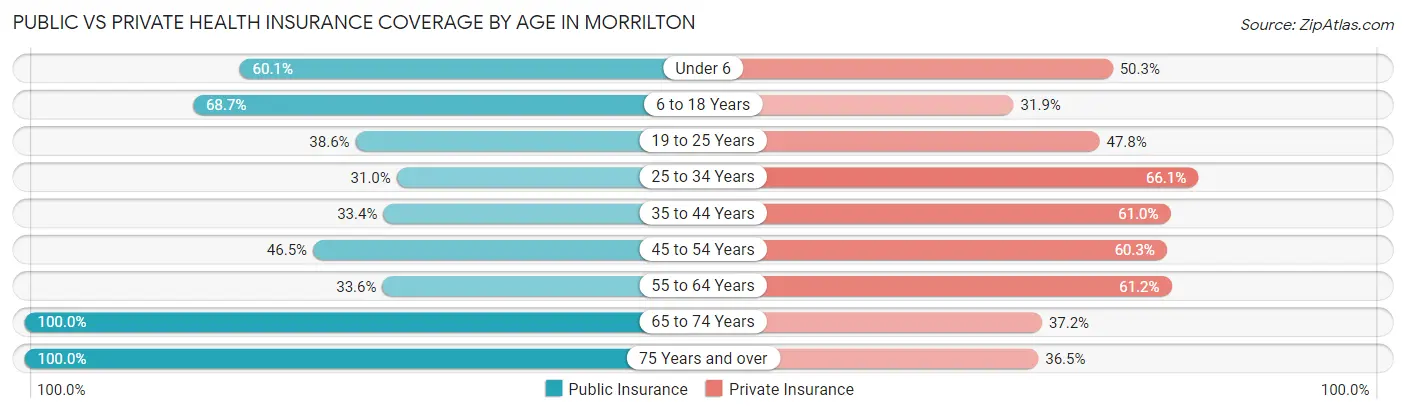
| Age Bracket | Public Insurance | Private Insurance |
| Under 6 | 313 (60.1%) | 262 (50.3%) |
| 6 to 18 Years | 862 (68.7%) | 400 (31.9%) |
| 19 to 25 Years | 259 (38.6%) | 321 (47.8%) |
| 25 to 34 Years | 264 (30.9%) | 564 (66.1%) |
| 35 to 44 Years | 233 (33.4%) | 425 (61.0%) |
| 45 to 54 Years | 377 (46.5%) | 489 (60.3%) |
| 55 to 64 Years | 289 (33.6%) | 526 (61.2%) |
| 65 to 74 Years | 646 (100.0%) | 240 (37.1%) |
| 75 Years and over | 573 (100.0%) | 209 (36.5%) |
| Total | 3,816 (55.4%) | 3,436 (49.9%) |
Disability Status by Sex by Age in Morrilton
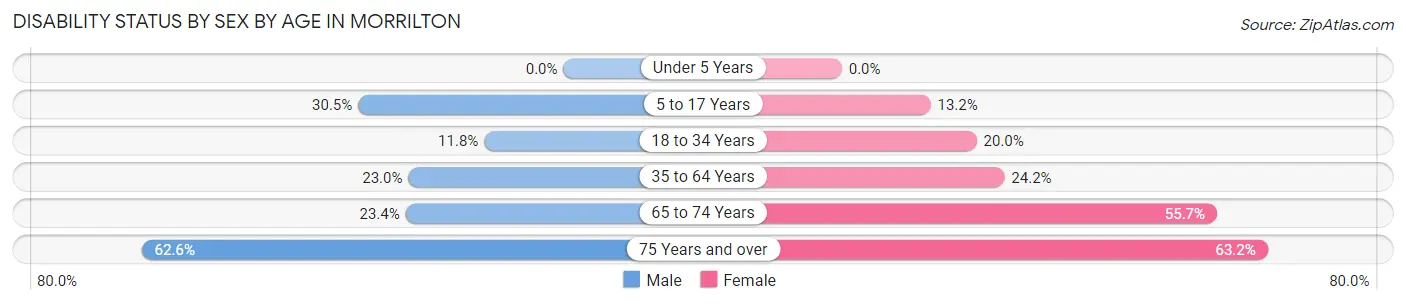
| Age Bracket | Male | Female |
| Under 5 Years | 0 (0.0%) | 0 (0.0%) |
| 5 to 17 Years | 171 (30.5%) | 106 (13.2%) |
| 18 to 34 Years | 85 (11.8%) | 174 (20.0%) |
| 35 to 64 Years | 242 (23.0%) | 318 (24.1%) |
| 65 to 74 Years | 71 (23.4%) | 191 (55.7%) |
| 75 Years and over | 129 (62.6%) | 232 (63.2%) |
Disability Class by Sex by Age in Morrilton
Disability Class: Hearing Difficulty
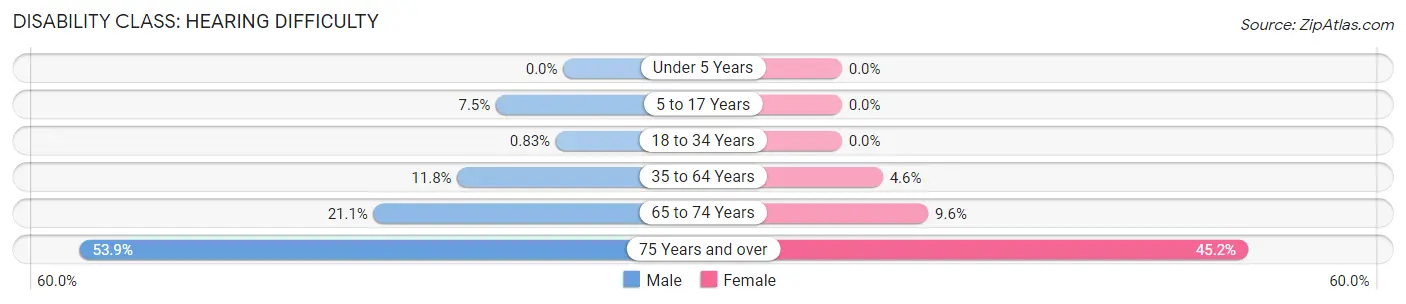
| Age Bracket | Male | Female |
| Under 5 Years | 0 (0.0%) | 0 (0.0%) |
| 5 to 17 Years | 42 (7.5%) | 0 (0.0%) |
| 18 to 34 Years | 6 (0.8%) | 0 (0.0%) |
| 35 to 64 Years | 124 (11.8%) | 60 (4.6%) |
| 65 to 74 Years | 64 (21.1%) | 33 (9.6%) |
| 75 Years and over | 111 (53.9%) | 166 (45.2%) |
Disability Class: Vision Difficulty
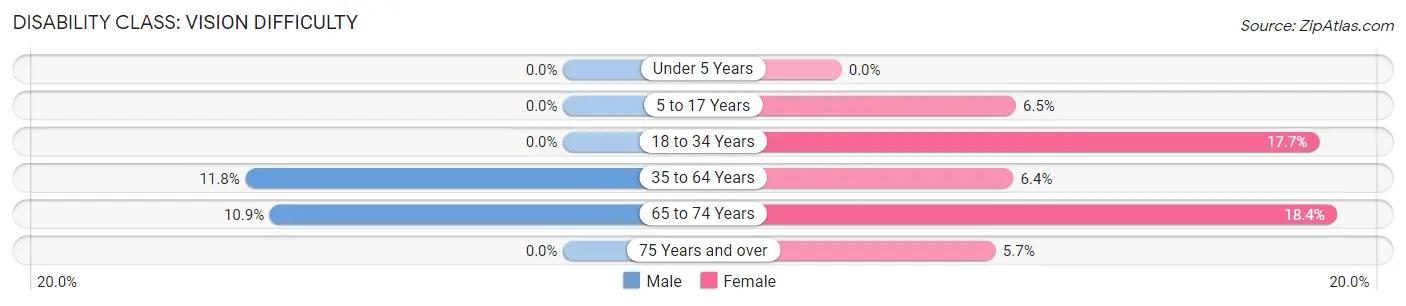
| Age Bracket | Male | Female |
| Under 5 Years | 0 (0.0%) | 0 (0.0%) |
| 5 to 17 Years | 0 (0.0%) | 52 (6.5%) |
| 18 to 34 Years | 0 (0.0%) | 154 (17.7%) |
| 35 to 64 Years | 124 (11.8%) | 84 (6.4%) |
| 65 to 74 Years | 33 (10.9%) | 63 (18.4%) |
| 75 Years and over | 0 (0.0%) | 21 (5.7%) |
Disability Class: Cognitive Difficulty
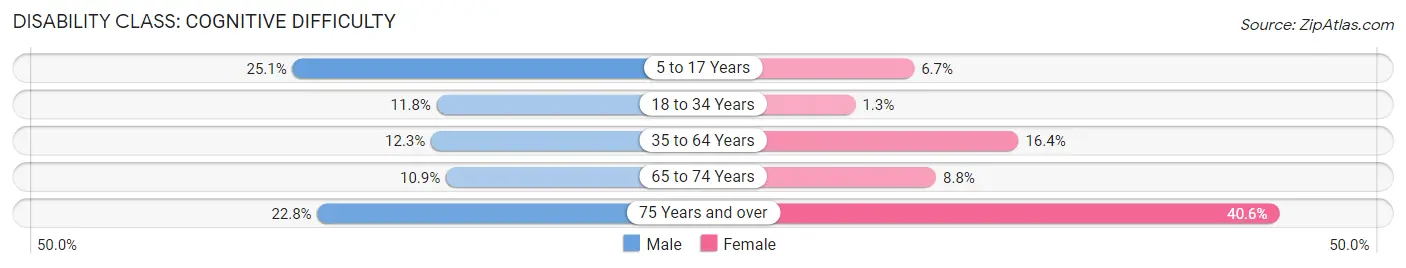
| Age Bracket | Male | Female |
| 5 to 17 Years | 141 (25.1%) | 54 (6.7%) |
| 18 to 34 Years | 85 (11.8%) | 11 (1.3%) |
| 35 to 64 Years | 129 (12.3%) | 216 (16.4%) |
| 65 to 74 Years | 33 (10.9%) | 30 (8.7%) |
| 75 Years and over | 47 (22.8%) | 149 (40.6%) |
Disability Class: Ambulatory Difficulty
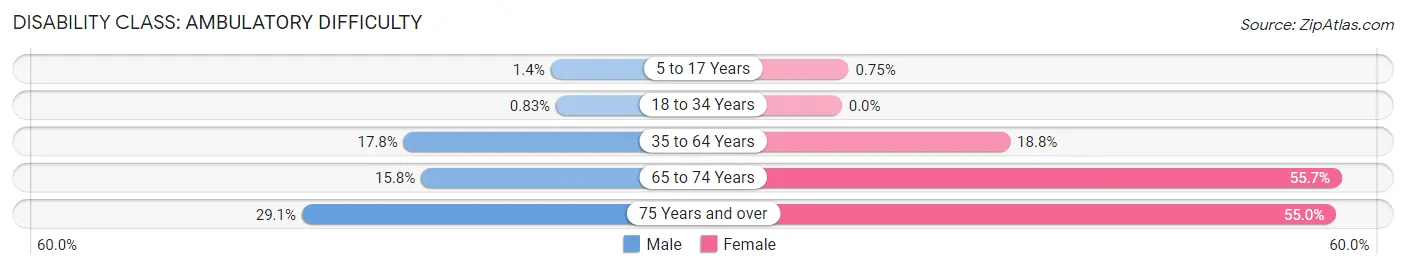
| Age Bracket | Male | Female |
| 5 to 17 Years | 8 (1.4%) | 6 (0.7%) |
| 18 to 34 Years | 6 (0.8%) | 0 (0.0%) |
| 35 to 64 Years | 187 (17.8%) | 247 (18.8%) |
| 65 to 74 Years | 48 (15.8%) | 191 (55.7%) |
| 75 Years and over | 60 (29.1%) | 202 (55.0%) |
Disability Class: Self-Care Difficulty
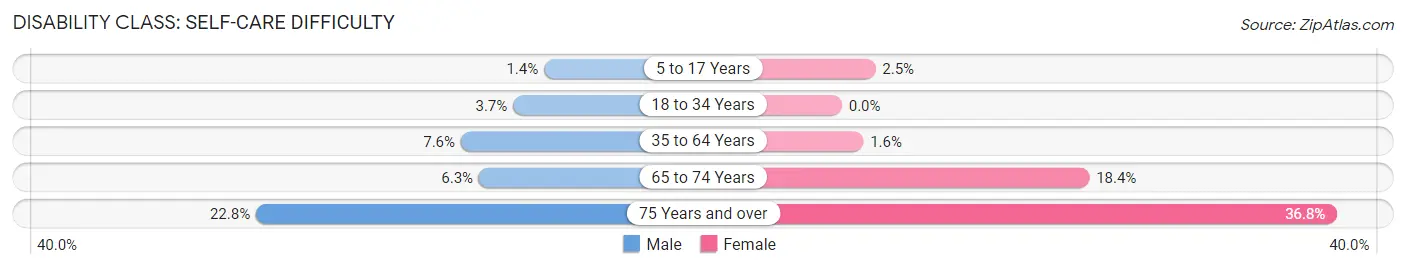
| Age Bracket | Male | Female |
| 5 to 17 Years | 8 (1.4%) | 20 (2.5%) |
| 18 to 34 Years | 27 (3.7%) | 0 (0.0%) |
| 35 to 64 Years | 80 (7.6%) | 21 (1.6%) |
| 65 to 74 Years | 19 (6.3%) | 63 (18.4%) |
| 75 Years and over | 47 (22.8%) | 135 (36.8%) |
Technology Access in Morrilton
Computing Device Access in Morrilton
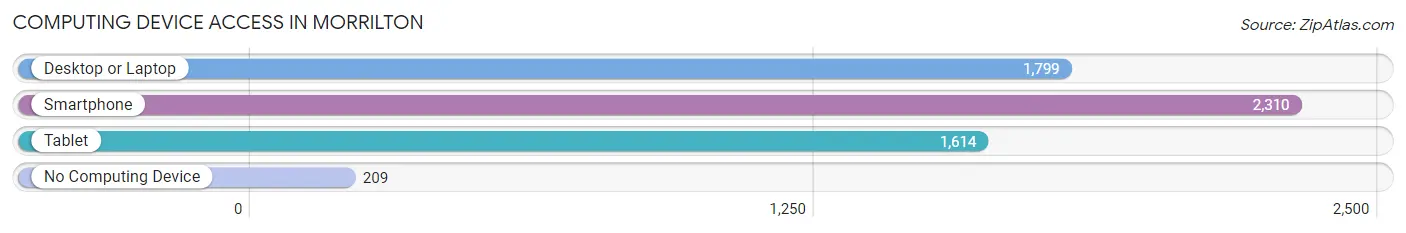
| Device Type | # Households | % Households |
| Desktop or Laptop | 1,799 | 63.5% |
| Smartphone | 2,310 | 81.5% |
| Tablet | 1,614 | 57.0% |
| No Computing Device | 209 | 7.4% |
| Total | 2,834 | 100.0% |
Internet Access in Morrilton
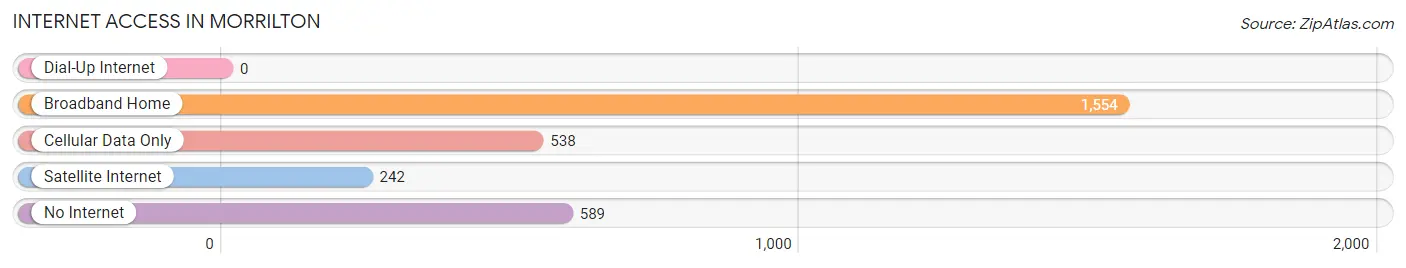
| Internet Type | # Households | % Households |
| Dial-Up Internet | 0 | 0.0% |
| Broadband Home | 1,554 | 54.8% |
| Cellular Data Only | 538 | 19.0% |
| Satellite Internet | 242 | 8.5% |
| No Internet | 589 | 20.8% |
| Total | 2,834 | 100.0% |
Morrilton Summary
Morrilton, Arkansas is a city located in Conway County, Arkansas. It is the county seat of Conway County and is located in the Arkansas River Valley. The city is situated on the Arkansas River and is approximately 50 miles northwest of Little Rock. The population of Morrilton was 6,767 at the 2010 census, an increase of 8.3% since 2000.
History
Morrilton was founded in 1851 by William H. Morrill, a surveyor and land speculator from New York. The city was originally named Morrillton, but the name was changed to Morrilton in 1883. The city was incorporated in 1887.
Morrilton was an important stop on the Butterfield Overland Mail route, which ran from St. Louis to San Francisco. The route passed through Morrilton on its way to Fort Smith.
During the Civil War, Morrilton was the site of a Confederate camp and a Union supply depot. The city was also the site of a skirmish between Union and Confederate forces in 1863.
Geography
Morrilton is located in the Arkansas River Valley, at the intersection of Interstate 40 and U.S. Route 64. The city is situated on the Arkansas River, approximately 50 miles northwest of Little Rock. The city has a total area of 8.3 square miles, all of which is land.
Economy
Morrilton’s economy is largely based on agriculture and manufacturing. The city is home to several large poultry processing plants, as well as a number of smaller businesses. The city is also home to a number of retail stores, restaurants, and other businesses.
Demographics
As of the 2010 census, there were 6,767 people, 2,717 households, and 1,717 families residing in the city. The population density was 814.3 people per square mile. The racial makeup of the city was 79.2% White, 17.2% African American, 0.4% Native American, 0.5% Asian, 0.1% Pacific Islander, 1.2% from other races, and 1.4% from two or more races. Hispanic or Latino of any race were 2.7% of the population.
The median income for a household in the city was $30,938, and the median income for a family was $37,917. The per capita income for the city was $17,845. About 17.2% of families and 20.3% of the population were below the poverty line, including 28.2% of those under age 18 and 14.2% of those age 65 or over.
Morrilton is served by the Morrilton School District, which includes Morrilton High School, Morrilton Junior High School, and Morrilton Elementary School. The city is also home to the University of Arkansas Community College at Morrilton.
Common Questions
What is Per Capita Income in Morrilton?
Per Capita income in Morrilton is $25,733.
What is the Median Family Income in Morrilton?
Median Family Income in Morrilton is $52,567.
What is the Median Household income in Morrilton?
Median Household Income in Morrilton is $43,608.
What is Income or Wage Gap in Morrilton?
Income or Wage Gap in Morrilton is 34.3%.
Women in Morrilton earn 65.7 cents for every dollar earned by a man.
What is Family Income Deficit in Morrilton?
Family Income Deficit in Morrilton is $11,278.
Families that are below poverty line in Morrilton earn $11,278 less on average than the poverty threshold level.
What is Inequality or Gini Index in Morrilton?
Inequality or Gini Index in Morrilton is 0.51.
What is the Total Population of Morrilton?
Total Population of Morrilton is 6,980.
What is the Total Male Population of Morrilton?
Total Male Population of Morrilton is 3,076.
What is the Total Female Population of Morrilton?
Total Female Population of Morrilton is 3,904.
What is the Ratio of Males per 100 Females in Morrilton?
There are 78.79 Males per 100 Females in Morrilton.
What is the Ratio of Females per 100 Males in Morrilton?
There are 126.92 Females per 100 Males in Morrilton.
What is the Median Population Age in Morrilton?
Median Population Age in Morrilton is 37.4 Years.
What is the Average Family Size in Morrilton
Average Family Size in Morrilton is 3.0 People.
What is the Average Household Size in Morrilton
Average Household Size in Morrilton is 2.4 People.
How Large is the Labor Force in Morrilton?
There are 3,077 People in the Labor Forcein in Morrilton.
What is the Percentage of People in the Labor Force in Morrilton?
56.8% of People are in the Labor Force in Morrilton.
What is the Unemployment Rate in Morrilton?
Unemployment Rate in Morrilton is 9.8%.