Monette, AR Map & Demographics
Monette Map
Monette Overview
$30,386
PER CAPITA INCOME
$78,000
AVG FAMILY INCOME
$47,684
AVG HOUSEHOLD INCOME
1.2%
WAGE / INCOME GAP [ % ]
98.8¢/ $1
WAGE / INCOME GAP [ $ ]
0.43
INEQUALITY / GINI INDEX
1,346
TOTAL POPULATION
654
MALE POPULATION
692
FEMALE POPULATION
94.51
MALES / 100 FEMALES
105.81
FEMALES / 100 MALES
46.9
MEDIAN AGE
2.7
AVG FAMILY SIZE
2.2
AVG HOUSEHOLD SIZE
596
LABOR FORCE [ PEOPLE ]
52.2%
PERCENT IN LABOR FORCE
4.6%
UNEMPLOYMENT RATE
Monette Zip Codes
Monette Area Codes
Income in Monette
Income Overview in Monette
Per Capita Income in Monette is $30,386, while median incomes of families and households are $78,000 and $47,684 respectively.
| Characteristic | Number | Measure |
| Per Capita Income | 1,346 | $30,386 |
| Median Family Income | 316 | $78,000 |
| Mean Family Income | 316 | $85,093 |
| Median Household Income | 583 | $47,684 |
| Mean Household Income | 583 | $67,345 |
| Income Deficit | 316 | $0 |
| Wage / Income Gap (%) | 1,346 | 1.23% |
| Wage / Income Gap ($) | 1,346 | 98.77¢ per $1 |
| Gini / Inequality Index | 1,346 | 0.43 |
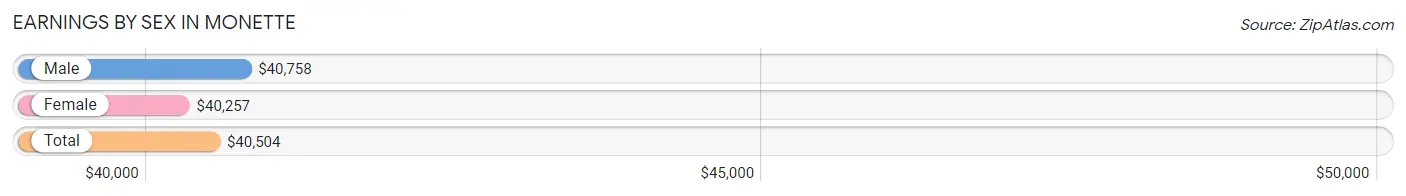
Earnings by Sex in Monette
Average Earnings in Monette are $40,504, $40,758 for men and $40,257 for women, a difference of 1.2%.
| Sex | Number | Average Earnings |
| Male | 354 (55.9%) | $40,758 |
| Female | 279 (44.1%) | $40,257 |
| Total | 633 (100.0%) | $40,504 |
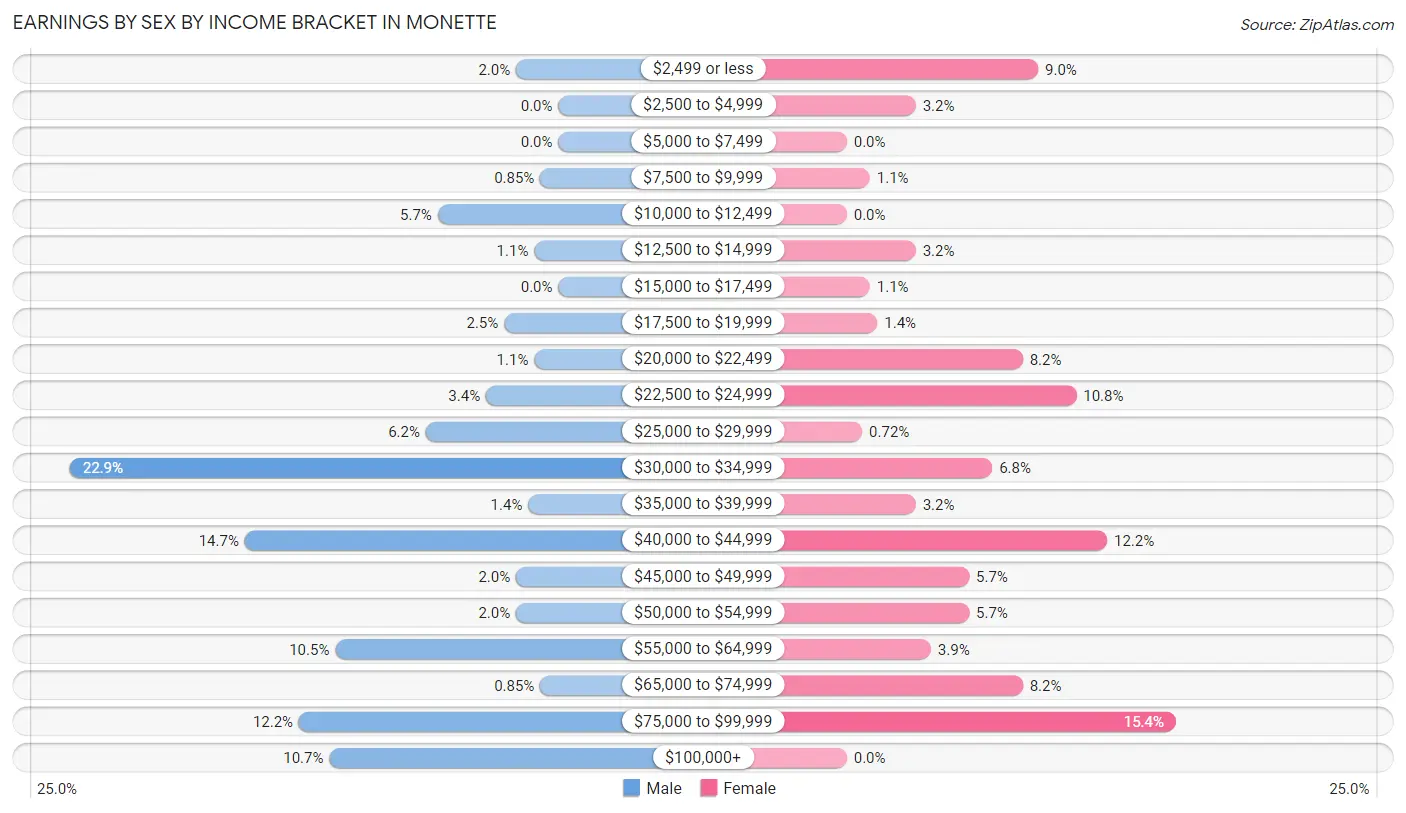
Earnings by Sex by Income Bracket in Monette
The most common earnings brackets in Monette are $30,000 to $34,999 for men (81 | 22.9%) and $75,000 to $99,999 for women (43 | 15.4%).
| Income | Male | Female |
| $2,499 or less | 7 (2.0%) | 25 (9.0%) |
| $2,500 to $4,999 | 0 (0.0%) | 9 (3.2%) |
| $5,000 to $7,499 | 0 (0.0%) | 0 (0.0%) |
| $7,500 to $9,999 | 3 (0.9%) | 3 (1.1%) |
| $10,000 to $12,499 | 20 (5.7%) | 0 (0.0%) |
| $12,500 to $14,999 | 4 (1.1%) | 9 (3.2%) |
| $15,000 to $17,499 | 0 (0.0%) | 3 (1.1%) |
| $17,500 to $19,999 | 9 (2.5%) | 4 (1.4%) |
| $20,000 to $22,499 | 4 (1.1%) | 23 (8.2%) |
| $22,500 to $24,999 | 12 (3.4%) | 30 (10.7%) |
| $25,000 to $29,999 | 22 (6.2%) | 2 (0.7%) |
| $30,000 to $34,999 | 81 (22.9%) | 19 (6.8%) |
| $35,000 to $39,999 | 5 (1.4%) | 9 (3.2%) |
| $40,000 to $44,999 | 52 (14.7%) | 34 (12.2%) |
| $45,000 to $49,999 | 7 (2.0%) | 16 (5.7%) |
| $50,000 to $54,999 | 7 (2.0%) | 16 (5.7%) |
| $55,000 to $64,999 | 37 (10.4%) | 11 (3.9%) |
| $65,000 to $74,999 | 3 (0.9%) | 23 (8.2%) |
| $75,000 to $99,999 | 43 (12.1%) | 43 (15.4%) |
| $100,000+ | 38 (10.7%) | 0 (0.0%) |
| Total | 354 (100.0%) | 279 (100.0%) |
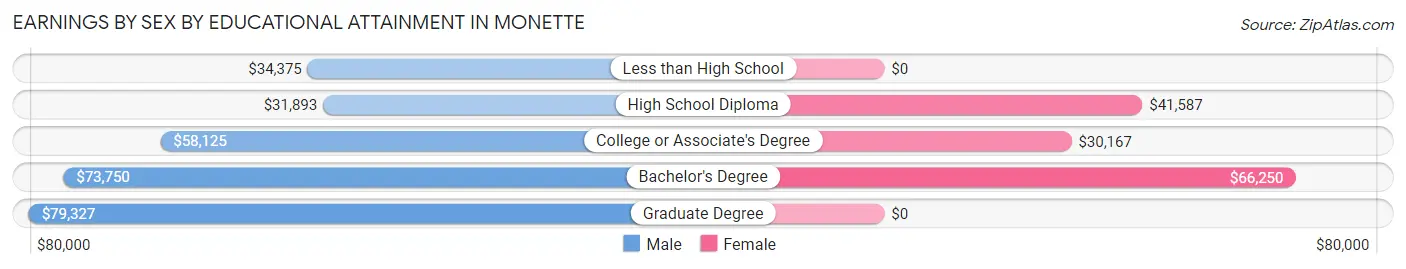
Earnings by Sex by Educational Attainment in Monette
Average earnings in Monette are $41,098 for men and $41,875 for women, a difference of 1.9%. Men with an educational attainment of graduate degree enjoy the highest average annual earnings of $79,327, while those with high school diploma education earn the least with $31,893. Women with an educational attainment of bachelor's degree earn the most with the average annual earnings of $66,250, while those with college or associate's degree education have the smallest earnings of $30,167.
| Educational Attainment | Male Income | Female Income |
| Less than High School | $34,375 | $0 |
| High School Diploma | $31,893 | $41,587 |
| College or Associate's Degree | $58,125 | $30,167 |
| Bachelor's Degree | $73,750 | $66,250 |
| Graduate Degree | $79,327 | $0 |
| Total | $41,098 | $41,875 |
Family Income in Monette
Family Income Brackets in Monette
According to the Monette family income data, there are 59 families falling into the $75,000 to $99,999 income range, which is the most common income bracket and makes up 18.7% of all families. Conversely, the $10,000 to $14,999 income bracket is the least frequent group with only 1 families (0.3%) belonging to this category.
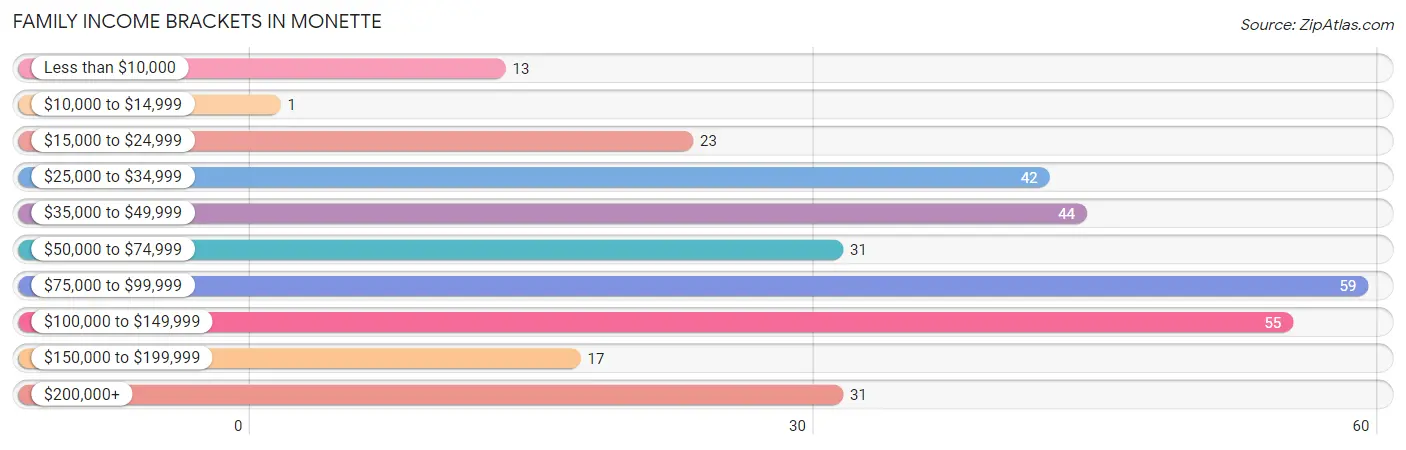
| Income Bracket | # Families | % Families |
| Less than $10,000 | 13 | 4.1% |
| $10,000 to $14,999 | 1 | 0.3% |
| $15,000 to $24,999 | 23 | 7.3% |
| $25,000 to $34,999 | 42 | 13.3% |
| $35,000 to $49,999 | 44 | 13.9% |
| $50,000 to $74,999 | 31 | 9.8% |
| $75,000 to $99,999 | 59 | 18.7% |
| $100,000 to $149,999 | 55 | 17.4% |
| $150,000 to $199,999 | 17 | 5.4% |
| $200,000+ | 31 | 9.8% |
Family Income by Famaliy Size in Monette
4-person families (43 | 13.6%) account for the highest median family income in Monette with $107,188 per family, while 2-person families (198 | 62.7%) have the highest median income of $27,857 per family member.
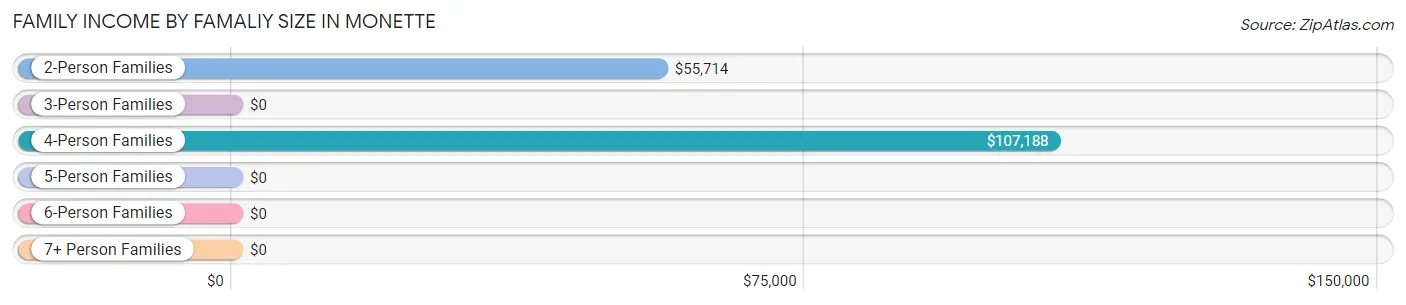
| Income Bracket | # Families | Median Income |
| 2-Person Families | 198 (62.7%) | $55,714 |
| 3-Person Families | 66 (20.9%) | $0 |
| 4-Person Families | 43 (13.6%) | $107,188 |
| 5-Person Families | 9 (2.9%) | $0 |
| 6-Person Families | 0 (0.0%) | $0 |
| 7+ Person Families | 0 (0.0%) | $0 |
| Total | 316 (100.0%) | $78,000 |
Family Income by Number of Earners in Monette
The median family income in Monette is $78,000, with families comprising 3+ earners (21) having the highest median family income of $116,023, while families with no earners (71) have the lowest median family income of $31,058, accounting for 6.7% and 22.5% of families, respectively.
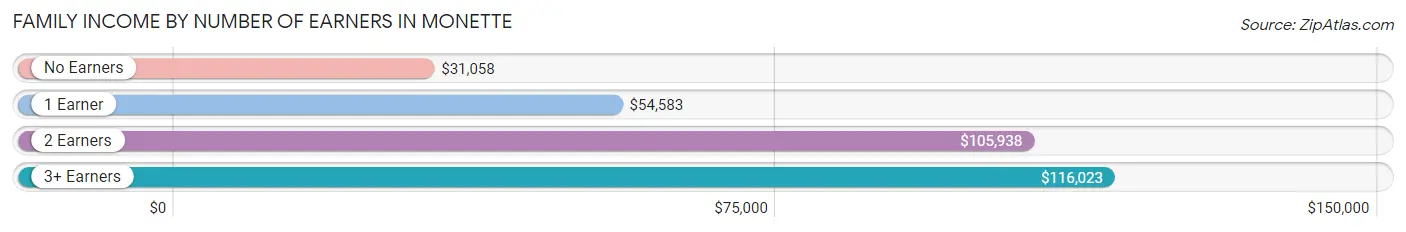
| Number of Earners | # Families | Median Income |
| No Earners | 71 (22.5%) | $31,058 |
| 1 Earner | 91 (28.8%) | $54,583 |
| 2 Earners | 133 (42.1%) | $105,938 |
| 3+ Earners | 21 (6.7%) | $116,023 |
| Total | 316 (100.0%) | $78,000 |
Household Income in Monette
Household Income Brackets in Monette
With 116 households falling in the category, the $100,000 to $149,999 income range is the most frequent in Monette, accounting for 19.9% of all households. In contrast, only 17 households (2.9%) fall into the $150,000 to $199,999 income bracket, making it the least populous group.
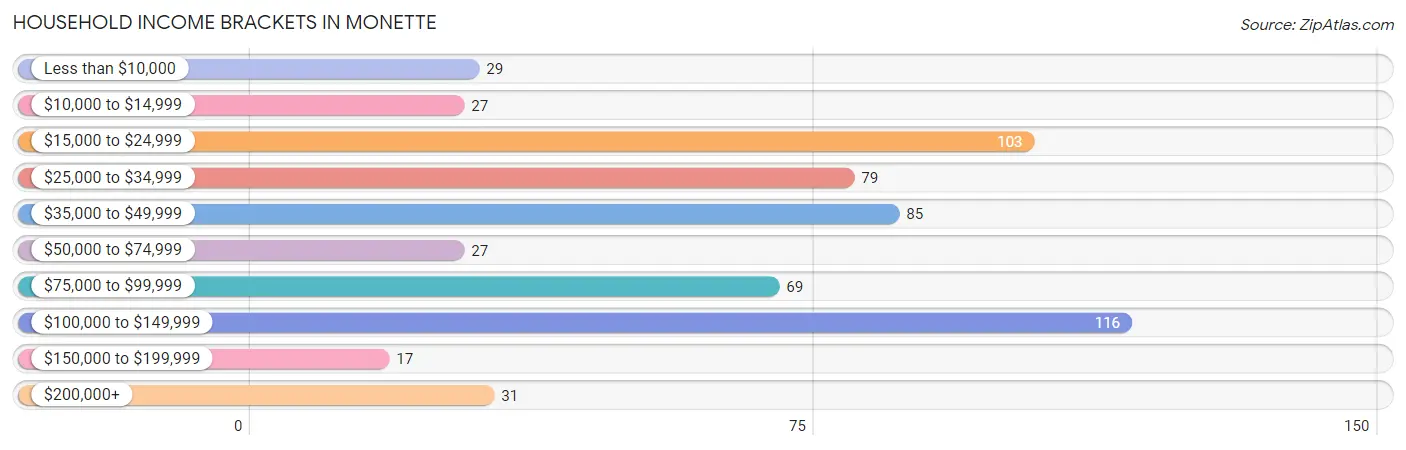
| Income Bracket | # Households | % Households |
| Less than $10,000 | 29 | 5.0% |
| $10,000 to $14,999 | 27 | 4.6% |
| $15,000 to $24,999 | 103 | 17.7% |
| $25,000 to $34,999 | 79 | 13.6% |
| $35,000 to $49,999 | 85 | 14.6% |
| $50,000 to $74,999 | 27 | 4.6% |
| $75,000 to $99,999 | 69 | 11.8% |
| $100,000 to $149,999 | 116 | 19.9% |
| $150,000 to $199,999 | 17 | 2.9% |
| $200,000+ | 31 | 5.3% |
Household Income by Householder Age in Monette
The median household income in Monette is $47,684, with the highest median household income of $84,107 found in the 25 to 44 years age bracket for the primary householder. A total of 139 households (23.8%) fall into this category. Meanwhile, the 15 to 24 years age bracket for the primary householder has the lowest median household income of $0, with 18 households (3.1%) in this group.
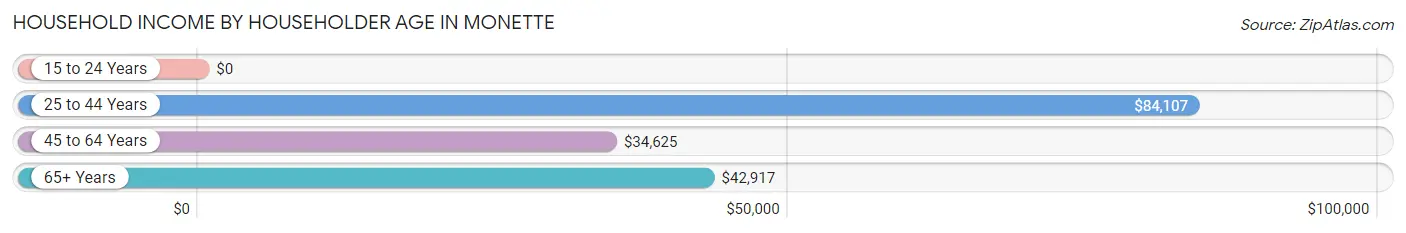
| Income Bracket | # Households | Median Income |
| 15 to 24 Years | 18 (3.1%) | $0 |
| 25 to 44 Years | 139 (23.8%) | $84,107 |
| 45 to 64 Years | 215 (36.9%) | $34,625 |
| 65+ Years | 211 (36.2%) | $42,917 |
| Total | 583 (100.0%) | $47,684 |
Poverty in Monette
Income Below Poverty by Sex and Age in Monette
With 11.8% poverty level for males and 22.4% for females among the residents of Monette, under 5 year old males and 16 and 17 year old females are the most vulnerable to poverty, with 25 males (100.0%) and 14 females (87.5%) in their respective age groups living below the poverty level.
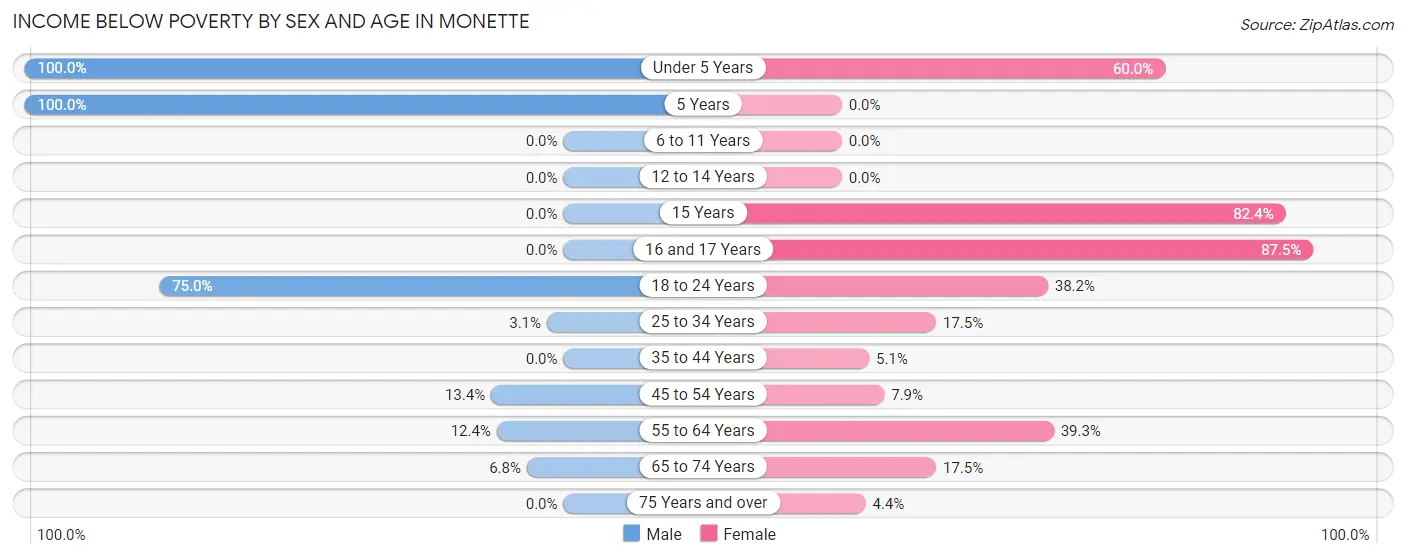
| Age Bracket | Male | Female |
| Under 5 Years | 25 (100.0%) | 21 (60.0%) |
| 5 Years | 15 (100.0%) | 0 (0.0%) |
| 6 to 11 Years | 0 (0.0%) | 0 (0.0%) |
| 12 to 14 Years | 0 (0.0%) | 0 (0.0%) |
| 15 Years | 0 (0.0%) | 14 (82.4%) |
| 16 and 17 Years | 0 (0.0%) | 14 (87.5%) |
| 18 to 24 Years | 9 (75.0%) | 13 (38.2%) |
| 25 to 34 Years | 3 (3.1%) | 14 (17.5%) |
| 35 to 44 Years | 0 (0.0%) | 4 (5.1%) |
| 45 to 54 Years | 9 (13.4%) | 6 (7.9%) |
| 55 to 64 Years | 12 (12.4%) | 35 (39.3%) |
| 65 to 74 Years | 4 (6.8%) | 14 (17.5%) |
| 75 Years and over | 0 (0.0%) | 3 (4.4%) |
| Total | 77 (11.8%) | 138 (22.4%) |
Income Above Poverty by Sex and Age in Monette
According to the poverty statistics in Monette, males aged 6 to 11 years and females aged 6 to 11 years are the age groups that are most secure financially, with 100.0% of males and 100.0% of females in these age groups living above the poverty line.
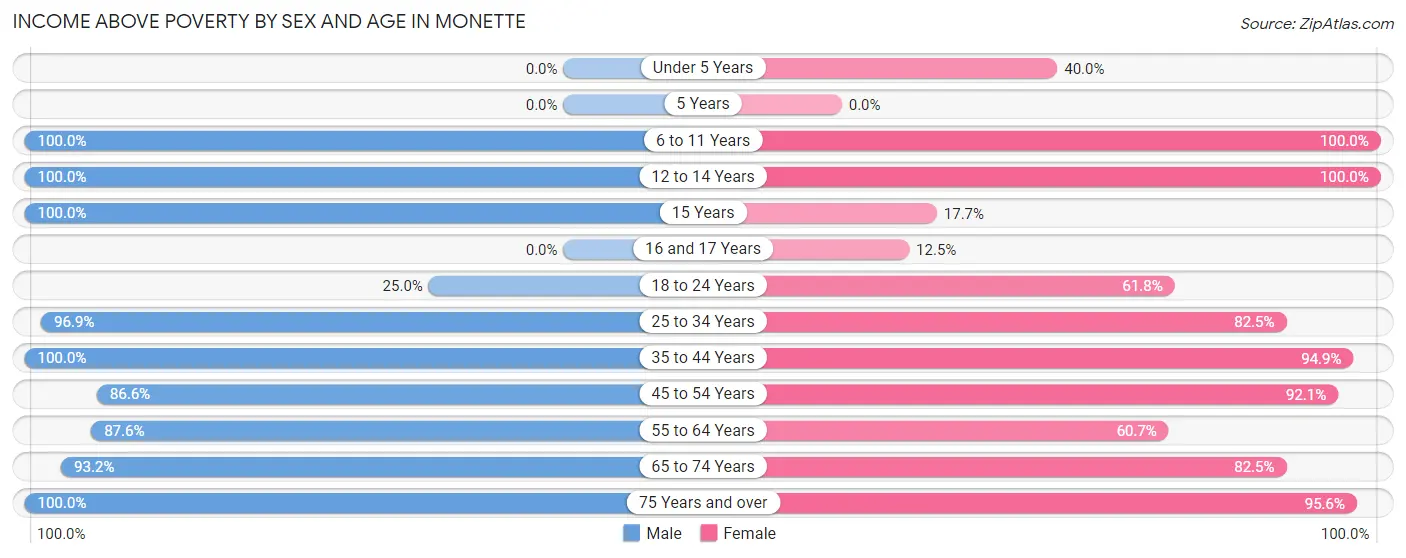
| Age Bracket | Male | Female |
| Under 5 Years | 0 (0.0%) | 14 (40.0%) |
| 5 Years | 0 (0.0%) | 0 (0.0%) |
| 6 to 11 Years | 32 (100.0%) | 23 (100.0%) |
| 12 to 14 Years | 28 (100.0%) | 19 (100.0%) |
| 15 Years | 11 (100.0%) | 3 (17.6%) |
| 16 and 17 Years | 0 (0.0%) | 2 (12.5%) |
| 18 to 24 Years | 3 (25.0%) | 21 (61.8%) |
| 25 to 34 Years | 95 (96.9%) | 66 (82.5%) |
| 35 to 44 Years | 124 (100.0%) | 75 (94.9%) |
| 45 to 54 Years | 58 (86.6%) | 70 (92.1%) |
| 55 to 64 Years | 85 (87.6%) | 54 (60.7%) |
| 65 to 74 Years | 55 (93.2%) | 66 (82.5%) |
| 75 Years and over | 82 (100.0%) | 65 (95.6%) |
| Total | 573 (88.1%) | 478 (77.6%) |
Income Below Poverty Among Married-Couple Families in Monette
The poverty statistics for married-couple families in Monette show that 4.2% or 9 of the total 213 families live below the poverty line. Families with 1 or 2 children have the highest poverty rate of 11.5%, comprising of 6 families. On the other hand, families with no children have the lowest poverty rate of 1.9%, which includes 3 families.
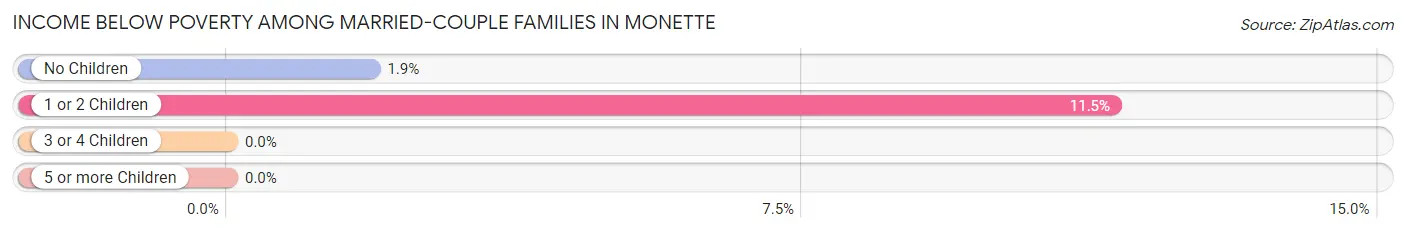
| Children | Above Poverty | Below Poverty |
| No Children | 158 (98.1%) | 3 (1.9%) |
| 1 or 2 Children | 46 (88.5%) | 6 (11.5%) |
| 3 or 4 Children | 0 (0.0%) | 0 (0.0%) |
| 5 or more Children | 0 (0.0%) | 0 (0.0%) |
| Total | 204 (95.8%) | 9 (4.2%) |
Income Below Poverty Among Single-Parent Households in Monette
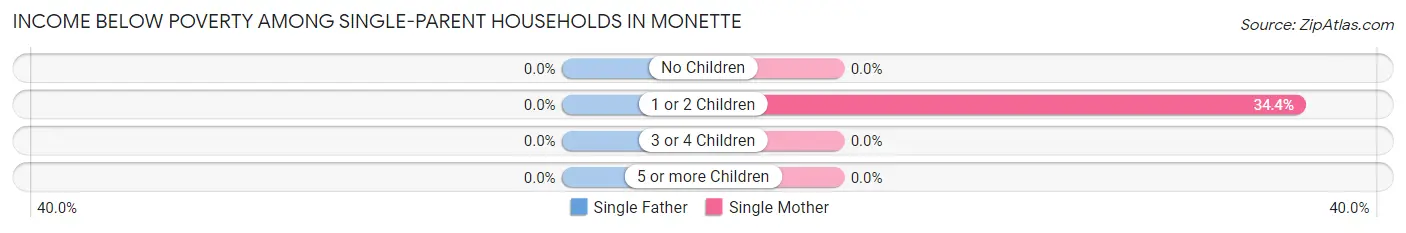
| Children | Single Father | Single Mother |
| No Children | 0 (0.0%) | 0 (0.0%) |
| 1 or 2 Children | 0 (0.0%) | 21 (34.4%) |
| 3 or 4 Children | 0 (0.0%) | 0 (0.0%) |
| 5 or more Children | 0 (0.0%) | 0 (0.0%) |
| Total | 0 (0.0%) | 21 (25.3%) |
Income Below Poverty Among Married-Couple vs Single-Parent Households in Monette
The poverty data for Monette shows that 9 of the married-couple family households (4.2%) and 21 of the single-parent households (20.4%) are living below the poverty level. Within the married-couple family households, those with 1 or 2 children have the highest poverty rate, with 6 households (11.5%) falling below the poverty line. Among the single-parent households, those with 1 or 2 children have the highest poverty rate, with 21 household (25.9%) living below poverty.
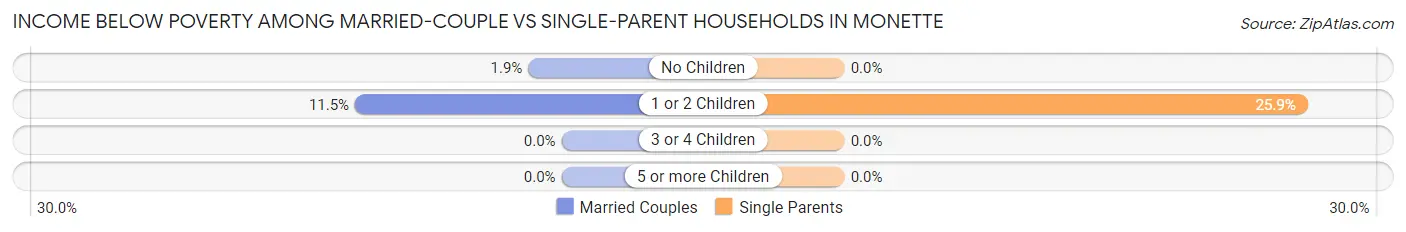
| Children | Married-Couple Families | Single-Parent Households |
| No Children | 3 (1.9%) | 0 (0.0%) |
| 1 or 2 Children | 6 (11.5%) | 21 (25.9%) |
| 3 or 4 Children | 0 (0.0%) | 0 (0.0%) |
| 5 or more Children | 0 (0.0%) | 0 (0.0%) |
| Total | 9 (4.2%) | 21 (20.4%) |
Race in Monette
The most populous races in Monette are White / Caucasian (1,252 | 93.0%), Hispanic or Latino (93 | 6.9%), and Two or more Races (39 | 2.9%).
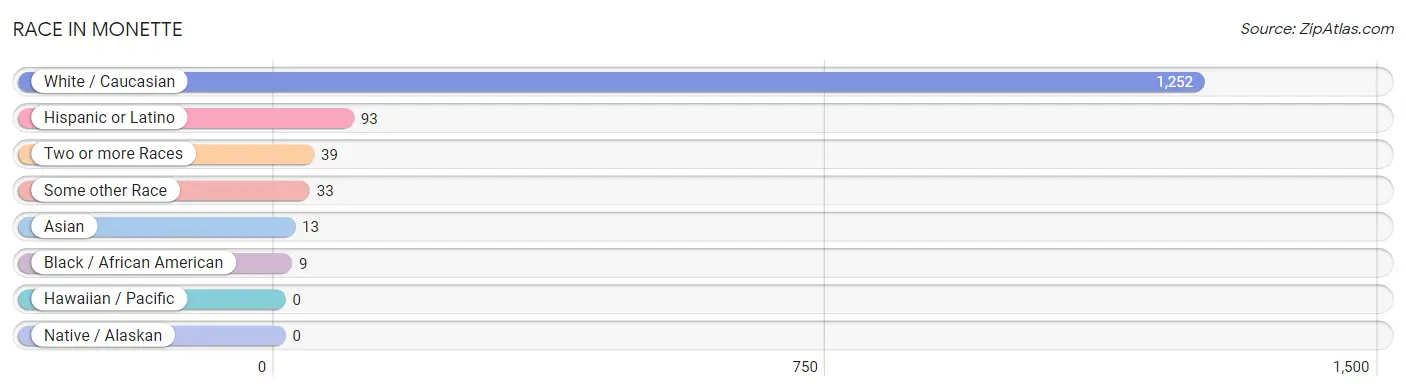
| Race | # Population | % Population |
| Asian | 13 | 1.0% |
| Black / African American | 9 | 0.7% |
| Hawaiian / Pacific | 0 | 0.0% |
| Hispanic or Latino | 93 | 6.9% |
| Native / Alaskan | 0 | 0.0% |
| White / Caucasian | 1,252 | 93.0% |
| Two or more Races | 39 | 2.9% |
| Some other Race | 33 | 2.5% |
| Total | 1,346 | 100.0% |
Ancestry in Monette
The most populous ancestries reported in Monette are Irish (288 | 21.4%), American (199 | 14.8%), German (153 | 11.4%), Scottish (65 | 4.8%), and English (59 | 4.4%), together accounting for 56.8% of all Monette residents.
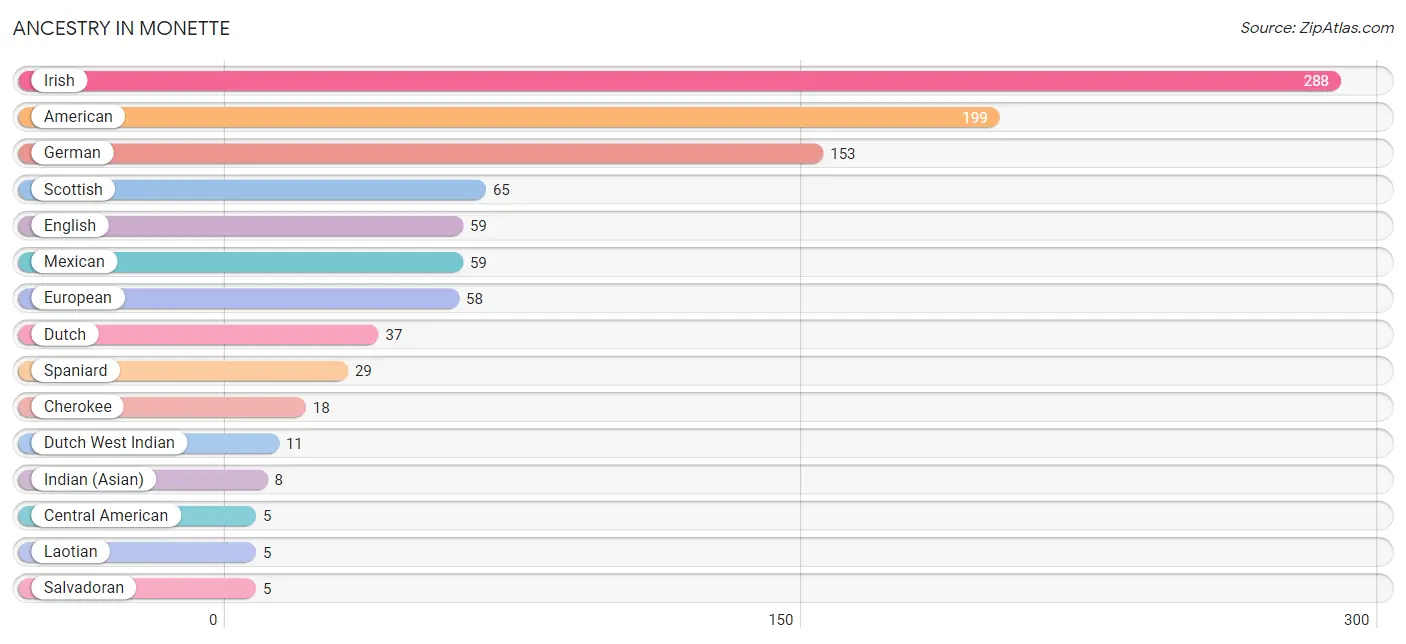
| Ancestry | # Population | % Population |
| American | 199 | 14.8% |
| Central American | 5 | 0.4% |
| Cherokee | 18 | 1.3% |
| Dutch | 37 | 2.8% |
| Dutch West Indian | 11 | 0.8% |
| English | 59 | 4.4% |
| European | 58 | 4.3% |
| German | 153 | 11.4% |
| Indian (Asian) | 8 | 0.6% |
| Irish | 288 | 21.4% |
| Laotian | 5 | 0.4% |
| Mexican | 59 | 4.4% |
| Osage | 2 | 0.2% |
| Salvadoran | 5 | 0.4% |
| Scotch-Irish | 4 | 0.3% |
| Scottish | 65 | 4.8% |
| Spaniard | 29 | 2.1% | View All 17 Rows |
Immigrants in Monette
The most numerous immigrant groups reported in Monette came from Central America (16 | 1.2%), Latin America (16 | 1.2%), Asia (13 | 1.0%), Mexico (11 | 0.8%), and China (8 | 0.6%), together accounting for 4.8% of all Monette residents.
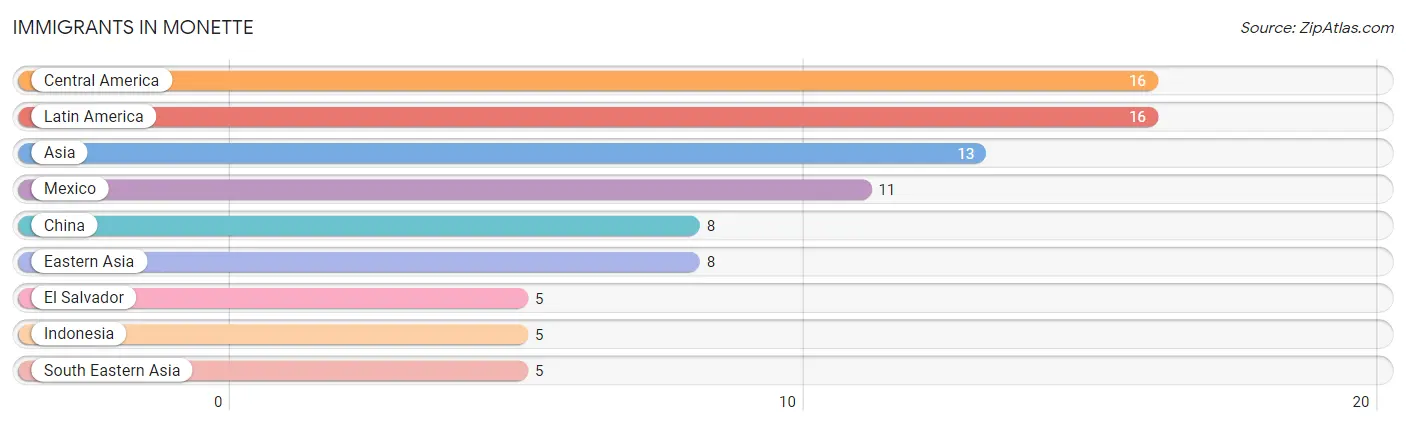
| Immigration Origin | # Population | % Population |
| Asia | 13 | 1.0% |
| Central America | 16 | 1.2% |
| China | 8 | 0.6% |
| Eastern Asia | 8 | 0.6% |
| El Salvador | 5 | 0.4% |
| Indonesia | 5 | 0.4% |
| Latin America | 16 | 1.2% |
| Mexico | 11 | 0.8% |
| South Eastern Asia | 5 | 0.4% | View All 9 Rows |
Sex and Age in Monette
Sex and Age in Monette
The most populous age groups in Monette are 40 to 44 Years (99 | 15.1%) for men and 85 Years and over (74 | 10.7%) for women.
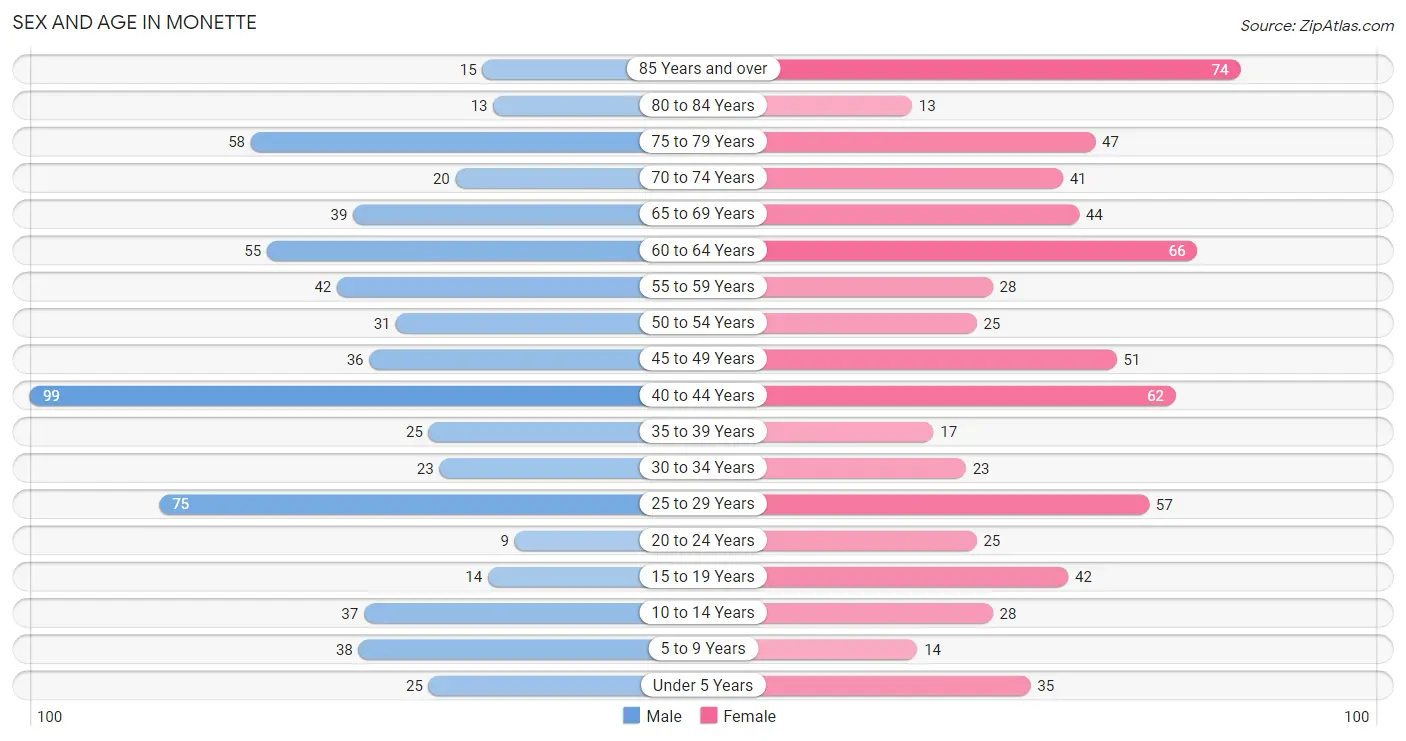
| Age Bracket | Male | Female |
| Under 5 Years | 25 (3.8%) | 35 (5.1%) |
| 5 to 9 Years | 38 (5.8%) | 14 (2.0%) |
| 10 to 14 Years | 37 (5.7%) | 28 (4.1%) |
| 15 to 19 Years | 14 (2.1%) | 42 (6.1%) |
| 20 to 24 Years | 9 (1.4%) | 25 (3.6%) |
| 25 to 29 Years | 75 (11.5%) | 57 (8.2%) |
| 30 to 34 Years | 23 (3.5%) | 23 (3.3%) |
| 35 to 39 Years | 25 (3.8%) | 17 (2.5%) |
| 40 to 44 Years | 99 (15.1%) | 62 (9.0%) |
| 45 to 49 Years | 36 (5.5%) | 51 (7.4%) |
| 50 to 54 Years | 31 (4.7%) | 25 (3.6%) |
| 55 to 59 Years | 42 (6.4%) | 28 (4.1%) |
| 60 to 64 Years | 55 (8.4%) | 66 (9.5%) |
| 65 to 69 Years | 39 (6.0%) | 44 (6.4%) |
| 70 to 74 Years | 20 (3.1%) | 41 (5.9%) |
| 75 to 79 Years | 58 (8.9%) | 47 (6.8%) |
| 80 to 84 Years | 13 (2.0%) | 13 (1.9%) |
| 85 Years and over | 15 (2.3%) | 74 (10.7%) |
| Total | 654 (100.0%) | 692 (100.0%) |
Families and Households in Monette
Median Family Size in Monette
The median family size in Monette is 2.67 persons per family, with single female/mother families (83 | 26.3%) accounting for the largest median family size of 2.77 persons per family. On the other hand, single male/father families (20 | 6.3%) represent the smallest median family size with 1.85 persons per family.
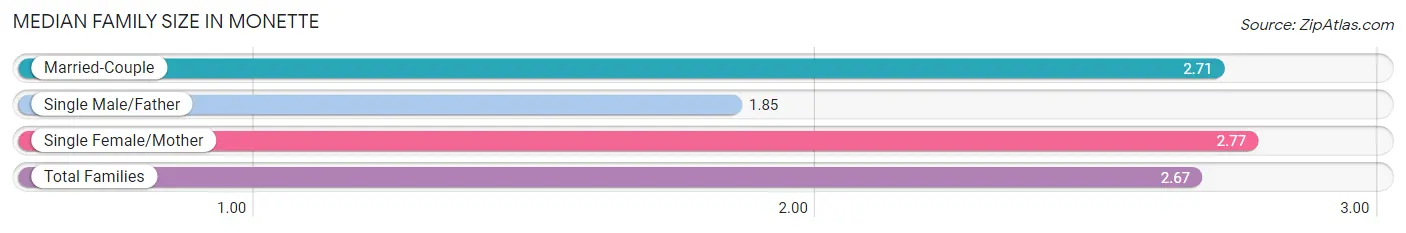
| Family Type | # Families | Family Size |
| Married-Couple | 213 (67.4%) | 2.71 |
| Single Male/Father | 20 (6.3%) | 1.85 |
| Single Female/Mother | 83 (26.3%) | 2.77 |
| Total Families | 316 (100.0%) | 2.67 |
Median Household Size in Monette
The median household size in Monette is 2.17 persons per household, with single female/mother households (83 | 14.2%) accounting for the largest median household size of 3.17 persons per household. non-family households (267 | 45.8%) represent the smallest median household size with 1.44 persons per household.
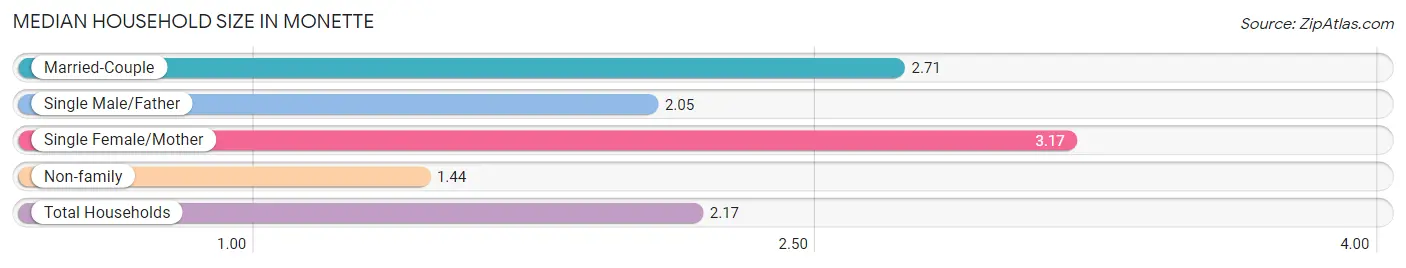
| Household Type | # Households | Household Size |
| Married-Couple | 213 (36.5%) | 2.71 |
| Single Male/Father | 20 (3.4%) | 2.05 |
| Single Female/Mother | 83 (14.2%) | 3.17 |
| Non-family | 267 (45.8%) | 1.44 |
| Total Households | 583 (100.0%) | 2.17 |
Household Size by Marriage Status in Monette
Out of a total of 583 households in Monette, 316 (54.2%) are family households, while 267 (45.8%) are nonfamily households. The most numerous type of family households are 2-person households, comprising 192, and the most common type of nonfamily households are 1-person households, comprising 200.
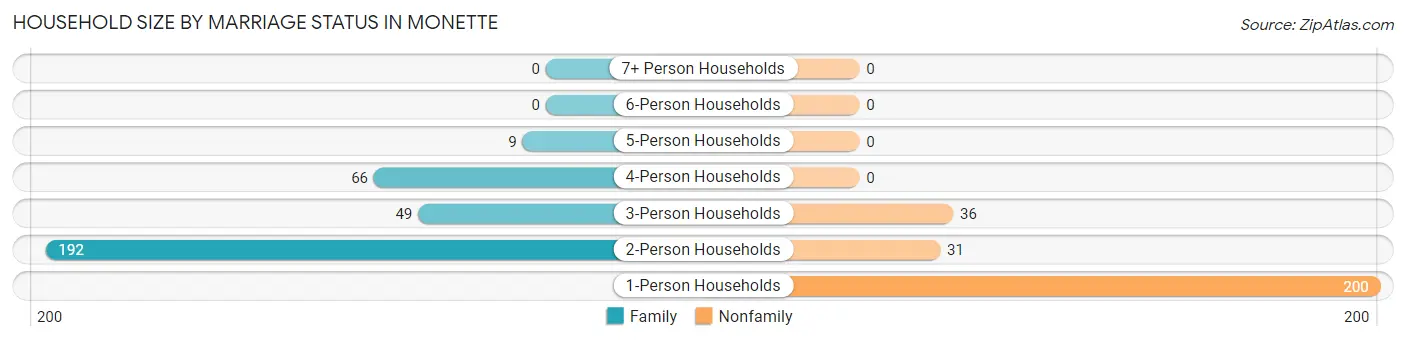
| Household Size | Family Households | Nonfamily Households |
| 1-Person Households | - | 200 (34.3%) |
| 2-Person Households | 192 (32.9%) | 31 (5.3%) |
| 3-Person Households | 49 (8.4%) | 36 (6.2%) |
| 4-Person Households | 66 (11.3%) | 0 (0.0%) |
| 5-Person Households | 9 (1.5%) | 0 (0.0%) |
| 6-Person Households | 0 (0.0%) | 0 (0.0%) |
| 7+ Person Households | 0 (0.0%) | 0 (0.0%) |
| Total | 316 (54.2%) | 267 (45.8%) |
Female Fertility in Monette
Fertility by Age in Monette
Average fertility rate in Monette is 29.0 births per 1,000 women. Women in the age bracket of 20 to 34 years have the highest fertility rate with 38.0 births per 1,000 women. Women in the age bracket of 20 to 34 years acount for 50.0% of all women with births.
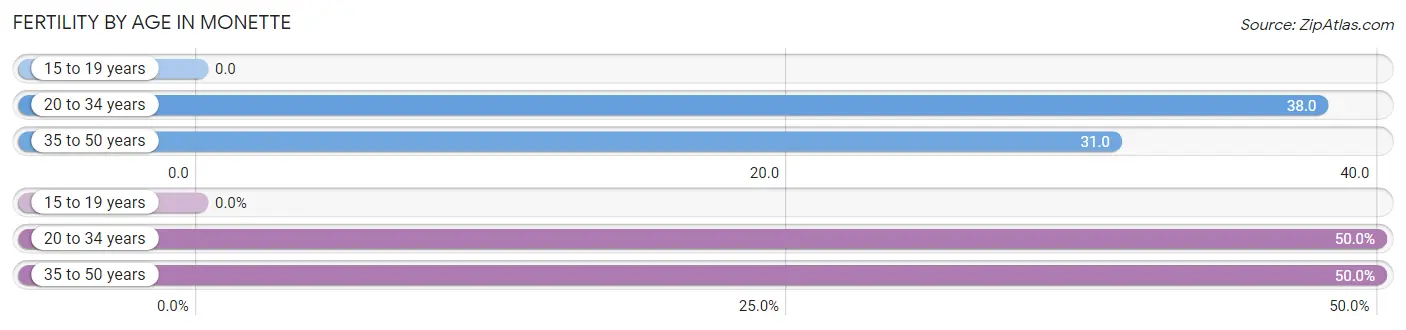
| Age Bracket | Women with Births | Births / 1,000 Women |
| 15 to 19 years | 0 (0.0%) | 0.0 |
| 20 to 34 years | 4 (50.0%) | 38.0 |
| 35 to 50 years | 4 (50.0%) | 31.0 |
| Total | 8 (100.0%) | 29.0 |
Fertility by Age by Marriage Status in Monette
50.0% of women with births (8) in Monette are married. The highest percentage of unmarried women with births falls into 35 to 50 years age bracket with 100.0% of them unmarried at the time of birth, while the lowest percentage of unmarried women with births belong to 20 to 34 years age bracket with 0.0% of them unmarried.
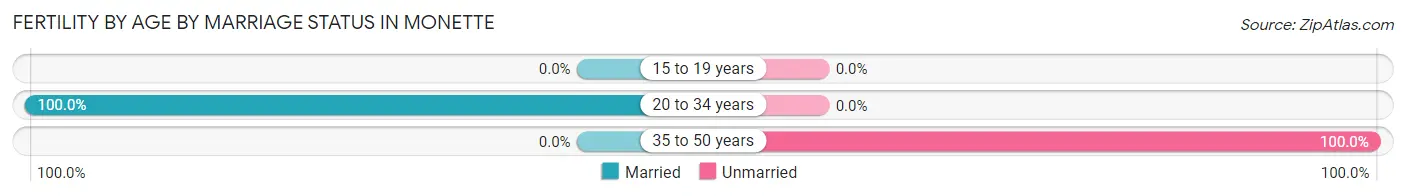
| Age Bracket | Married | Unmarried |
| 15 to 19 years | 0 (0.0%) | 0 (0.0%) |
| 20 to 34 years | 4 (100.0%) | 0 (0.0%) |
| 35 to 50 years | 0 (0.0%) | 4 (100.0%) |
| Total | 4 (50.0%) | 4 (50.0%) |
Fertility by Education in Monette
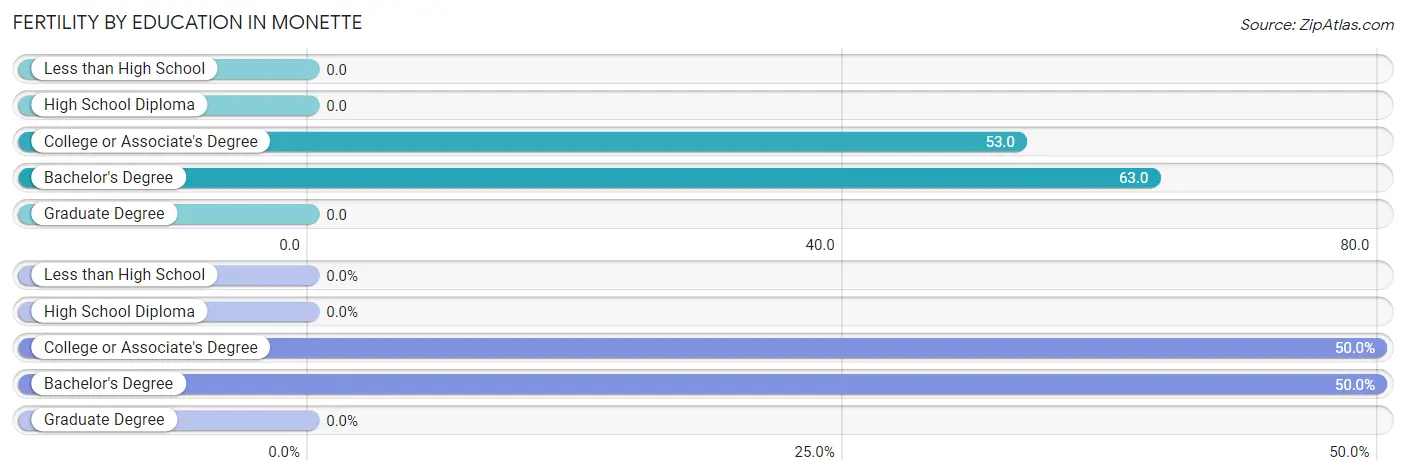
| Educational Attainment | Women with Births | Births / 1,000 Women |
| Less than High School | 0 (0.0%) | 0.0 |
| High School Diploma | 0 (0.0%) | 0.0 |
| College or Associate's Degree | 4 (50.0%) | 53.0 |
| Bachelor's Degree | 4 (50.0%) | 63.0 |
| Graduate Degree | 0 (0.0%) | 0.0 |
| Total | 8 (100.0%) | 29.0 |
Fertility by Education by Marriage Status in Monette
50.0% of women with births in Monette are unmarried. Women with the educational attainment of college or associate's degree are most likely to be married with 100.0% of them married at childbirth, while women with the educational attainment of bachelor's degree are least likely to be married with 100.0% of them unmarried at childbirth.
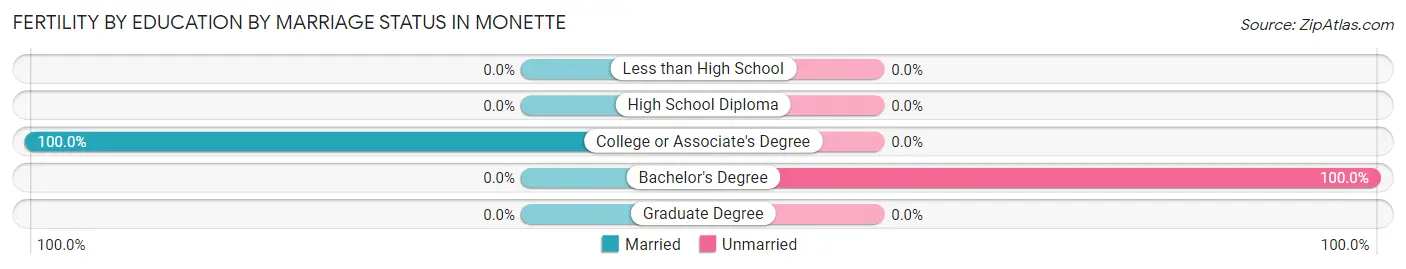
| Educational Attainment | Married | Unmarried |
| Less than High School | 0 (0.0%) | 0 (0.0%) |
| High School Diploma | 0 (0.0%) | 0 (0.0%) |
| College or Associate's Degree | 4 (100.0%) | 0 (0.0%) |
| Bachelor's Degree | 0 (0.0%) | 4 (100.0%) |
| Graduate Degree | 0 (0.0%) | 0 (0.0%) |
| Total | 4 (50.0%) | 4 (50.0%) |
Employment Characteristics in Monette
Employment by Class of Employer in Monette
Among the 524 employed individuals in Monette, private company employees (362 | 69.1%), not-for-profit organizations (47 | 9.0%), and state government employees (35 | 6.7%) make up the most common classes of employment.
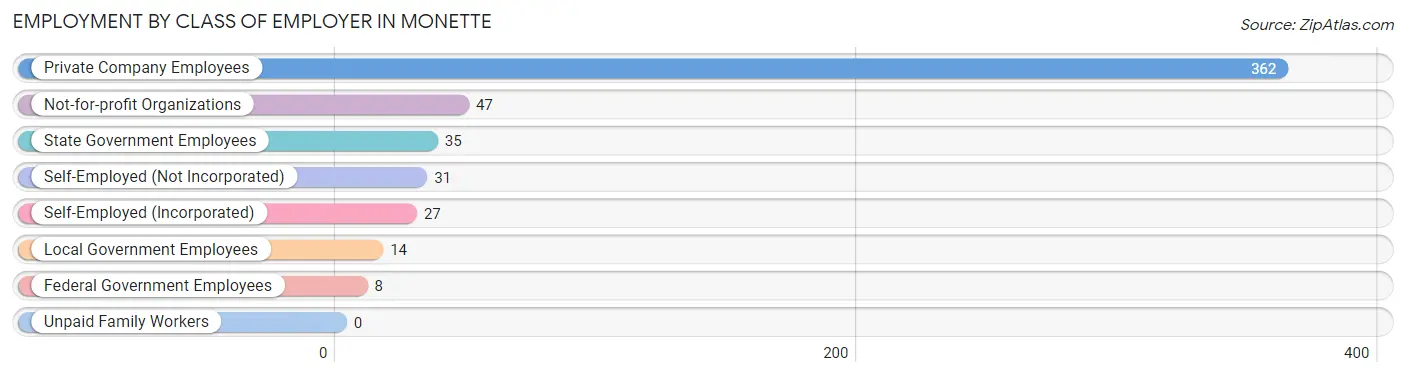
| Employer Class | # Employees | % Employees |
| Private Company Employees | 362 | 69.1% |
| Self-Employed (Incorporated) | 27 | 5.1% |
| Self-Employed (Not Incorporated) | 31 | 5.9% |
| Not-for-profit Organizations | 47 | 9.0% |
| Local Government Employees | 14 | 2.7% |
| State Government Employees | 35 | 6.7% |
| Federal Government Employees | 8 | 1.5% |
| Unpaid Family Workers | 0 | 0.0% |
| Total | 524 | 100.0% |
Employment Status by Age in Monette
According to the labor force statistics for Monette, out of the total population over 16 years of age (1,141), 52.2% or 596 individuals are in the labor force, with 4.6% or 27 of them unemployed. The age group with the highest labor force participation rate is 30 to 34 years, with 100.0% or 46 individuals in the labor force. Within the labor force, the 16 to 19 years age range has the highest percentage of unemployed individuals, with 60.9% or 14 of them being unemployed.
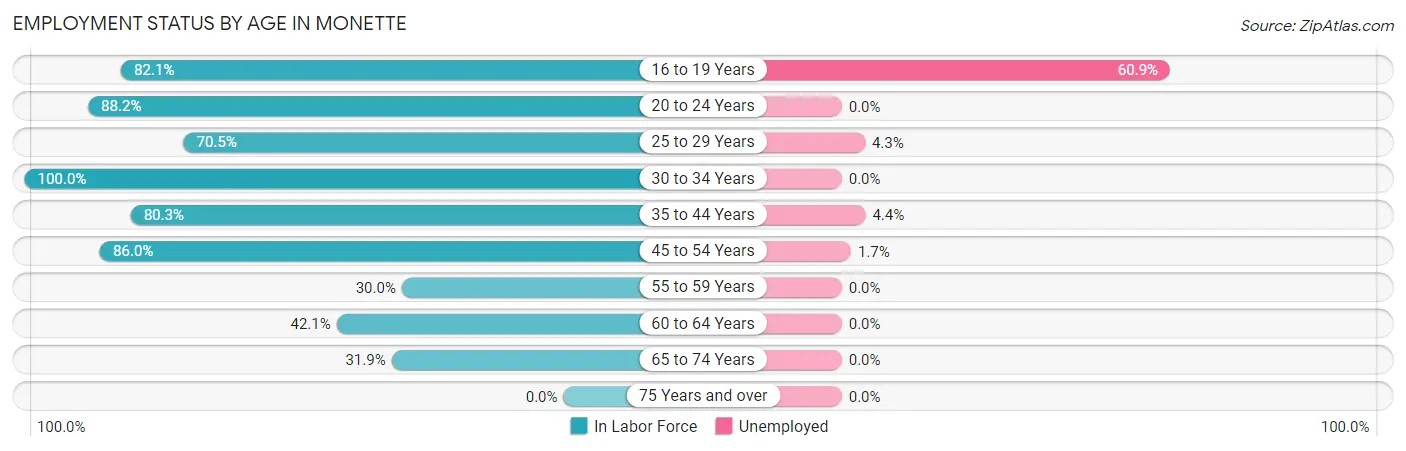
| Age Bracket | In Labor Force | Unemployed |
| 16 to 19 Years | 23 (82.1%) | 14 (60.9%) |
| 20 to 24 Years | 30 (88.2%) | 0 (0.0%) |
| 25 to 29 Years | 93 (70.5%) | 4 (4.3%) |
| 30 to 34 Years | 46 (100.0%) | 0 (0.0%) |
| 35 to 44 Years | 163 (80.3%) | 7 (4.4%) |
| 45 to 54 Years | 123 (86.0%) | 2 (1.7%) |
| 55 to 59 Years | 21 (30.0%) | 0 (0.0%) |
| 60 to 64 Years | 51 (42.1%) | 0 (0.0%) |
| 65 to 74 Years | 46 (31.9%) | 0 (0.0%) |
| 75 Years and over | 0 (0.0%) | 0 (0.0%) |
| Total | 596 (52.2%) | 27 (4.6%) |
Employment Status by Educational Attainment in Monette
According to labor force statistics for Monette, 69.5% of individuals (497) out of the total population between 25 and 64 years of age (715) are in the labor force, with 2.7% or 13 of them being unemployed. The group with the highest labor force participation rate are those with the educational attainment of college / associate degree, with 83.0% or 132 individuals in the labor force. Within the labor force, individuals with high school diploma education have the highest percentage of unemployment, with 3.8% or 9 of them being unemployed.
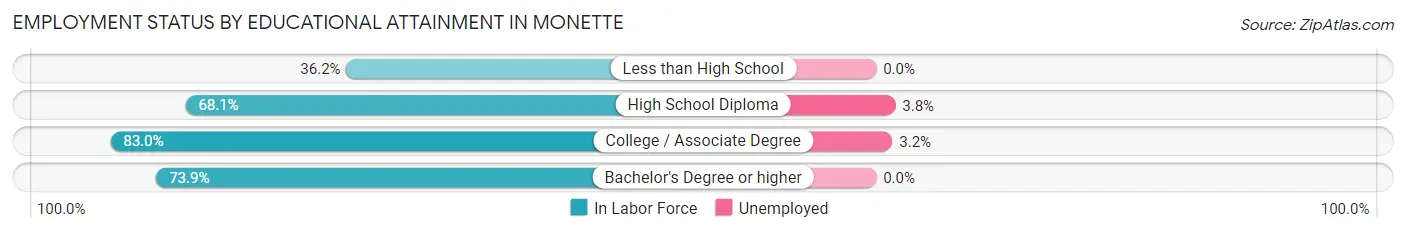
| Educational Attainment | In Labor Force | Unemployed |
| Less than High School | 25 (36.2%) | 0 (0.0%) |
| High School Diploma | 235 (68.1%) | 13 (3.8%) |
| College / Associate Degree | 132 (83.0%) | 5 (3.2%) |
| Bachelor's Degree or higher | 105 (73.9%) | 0 (0.0%) |
| Total | 497 (69.5%) | 19 (2.7%) |
Employment Occupations by Sex in Monette
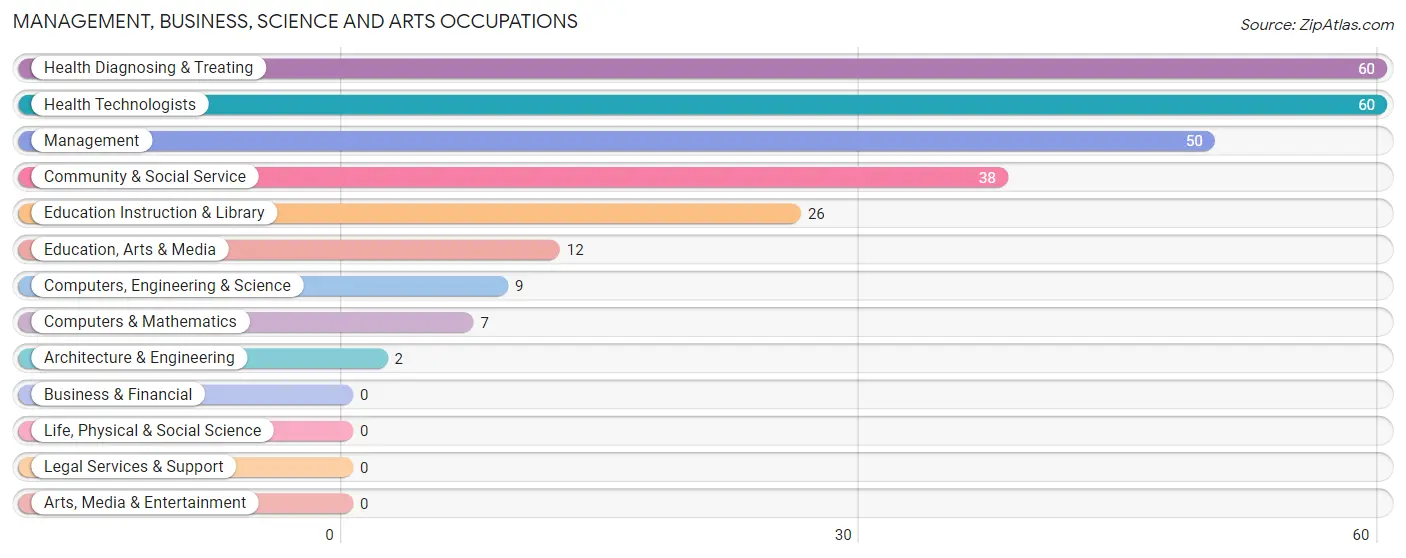
Management, Business, Science and Arts Occupations
The most common Management, Business, Science and Arts occupations in Monette are Health Diagnosing & Treating (60 | 10.7%), Health Technologists (60 | 10.7%), Management (50 | 8.9%), Community & Social Service (38 | 6.8%), and Education Instruction & Library (26 | 4.6%).
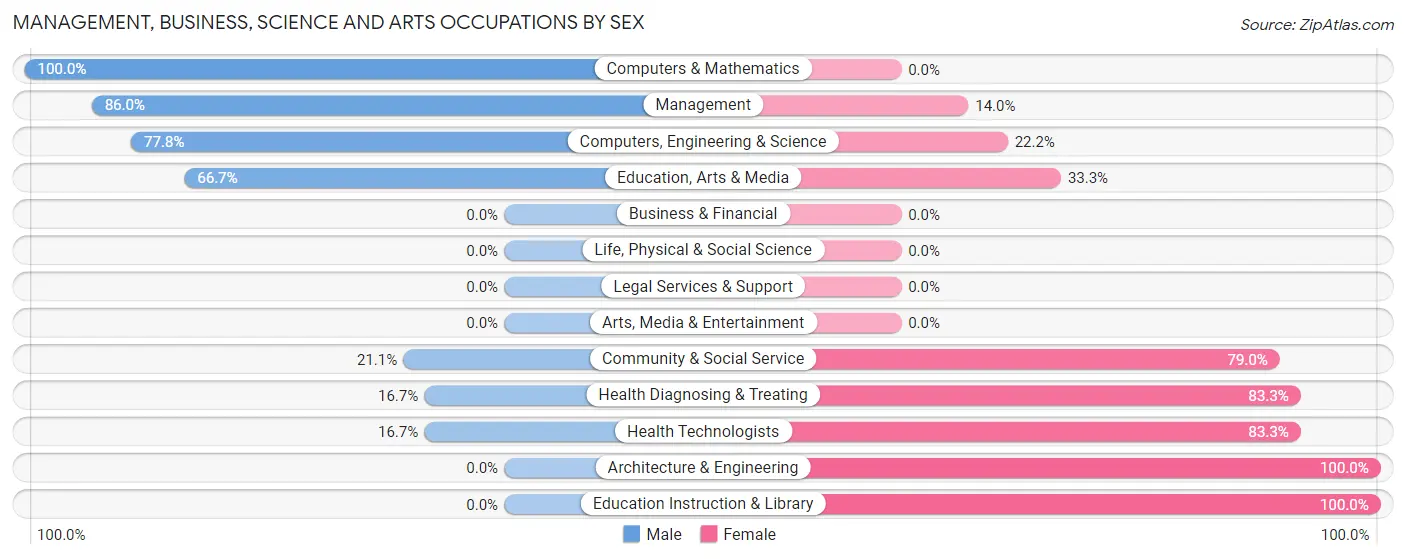
Management, Business, Science and Arts Occupations by Sex
Within the Management, Business, Science and Arts occupations in Monette, the most male-oriented occupations are Computers & Mathematics (100.0%), Management (86.0%), and Computers, Engineering & Science (77.8%), while the most female-oriented occupations are Architecture & Engineering (100.0%), Education Instruction & Library (100.0%), and Health Diagnosing & Treating (83.3%).
| Occupation | Male | Female |
| Management | 43 (86.0%) | 7 (14.0%) |
| Business & Financial | 0 (0.0%) | 0 (0.0%) |
| Computers, Engineering & Science | 7 (77.8%) | 2 (22.2%) |
| Computers & Mathematics | 7 (100.0%) | 0 (0.0%) |
| Architecture & Engineering | 0 (0.0%) | 2 (100.0%) |
| Life, Physical & Social Science | 0 (0.0%) | 0 (0.0%) |
| Community & Social Service | 8 (21.0%) | 30 (78.9%) |
| Education, Arts & Media | 8 (66.7%) | 4 (33.3%) |
| Legal Services & Support | 0 (0.0%) | 0 (0.0%) |
| Education Instruction & Library | 0 (0.0%) | 26 (100.0%) |
| Arts, Media & Entertainment | 0 (0.0%) | 0 (0.0%) |
| Health Diagnosing & Treating | 10 (16.7%) | 50 (83.3%) |
| Health Technologists | 10 (16.7%) | 50 (83.3%) |
| Total (Category) | 68 (43.3%) | 89 (56.7%) |
| Total (Overall) | 306 (54.5%) | 255 (45.5%) |
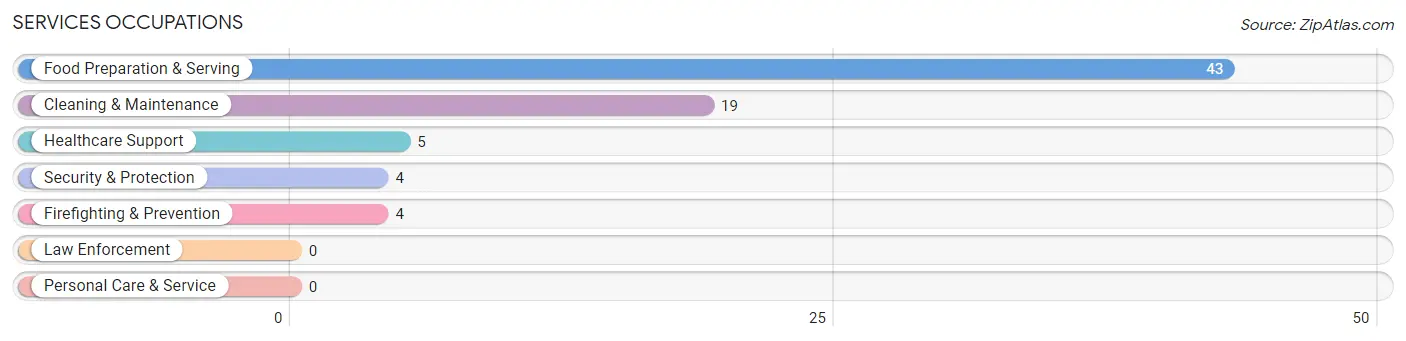
Services Occupations
The most common Services occupations in Monette are Food Preparation & Serving (43 | 7.7%), Cleaning & Maintenance (19 | 3.4%), Healthcare Support (5 | 0.9%), Security & Protection (4 | 0.7%), and Firefighting & Prevention (4 | 0.7%).
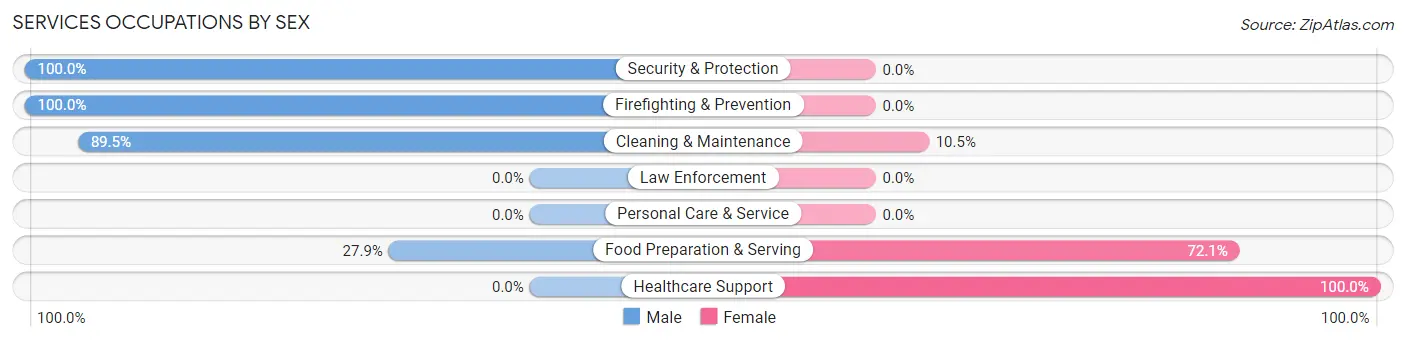
Services Occupations by Sex
Within the Services occupations in Monette, the most male-oriented occupations are Security & Protection (100.0%), Firefighting & Prevention (100.0%), and Cleaning & Maintenance (89.5%), while the most female-oriented occupations are Healthcare Support (100.0%), Food Preparation & Serving (72.1%), and Cleaning & Maintenance (10.5%).
| Occupation | Male | Female |
| Healthcare Support | 0 (0.0%) | 5 (100.0%) |
| Security & Protection | 4 (100.0%) | 0 (0.0%) |
| Firefighting & Prevention | 4 (100.0%) | 0 (0.0%) |
| Law Enforcement | 0 (0.0%) | 0 (0.0%) |
| Food Preparation & Serving | 12 (27.9%) | 31 (72.1%) |
| Cleaning & Maintenance | 17 (89.5%) | 2 (10.5%) |
| Personal Care & Service | 0 (0.0%) | 0 (0.0%) |
| Total (Category) | 33 (46.5%) | 38 (53.5%) |
| Total (Overall) | 306 (54.5%) | 255 (45.5%) |
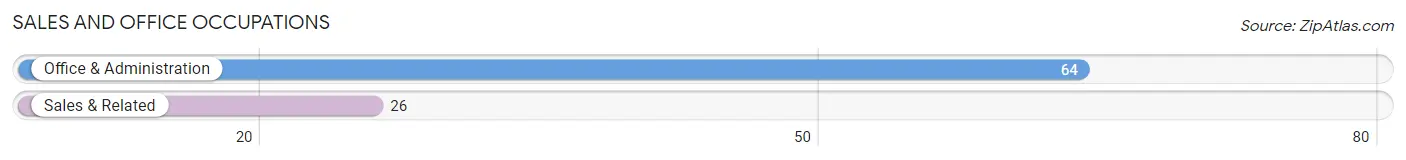
Sales and Office Occupations
The most common Sales and Office occupations in Monette are Office & Administration (64 | 11.4%), and Sales & Related (26 | 4.6%).
Sales and Office Occupations by Sex
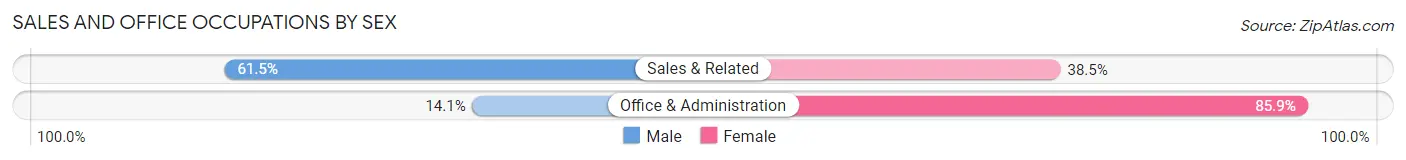
| Occupation | Male | Female |
| Sales & Related | 16 (61.5%) | 10 (38.5%) |
| Office & Administration | 9 (14.1%) | 55 (85.9%) |
| Total (Category) | 25 (27.8%) | 65 (72.2%) |
| Total (Overall) | 306 (54.5%) | 255 (45.5%) |
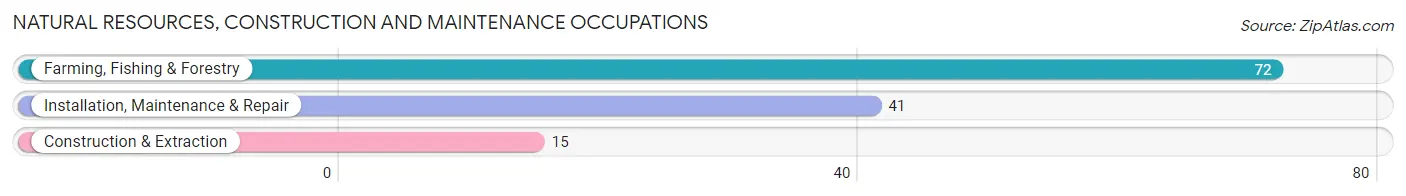
Natural Resources, Construction and Maintenance Occupations
The most common Natural Resources, Construction and Maintenance occupations in Monette are Farming, Fishing & Forestry (72 | 12.8%), Installation, Maintenance & Repair (41 | 7.3%), and Construction & Extraction (15 | 2.7%).
Natural Resources, Construction and Maintenance Occupations by Sex
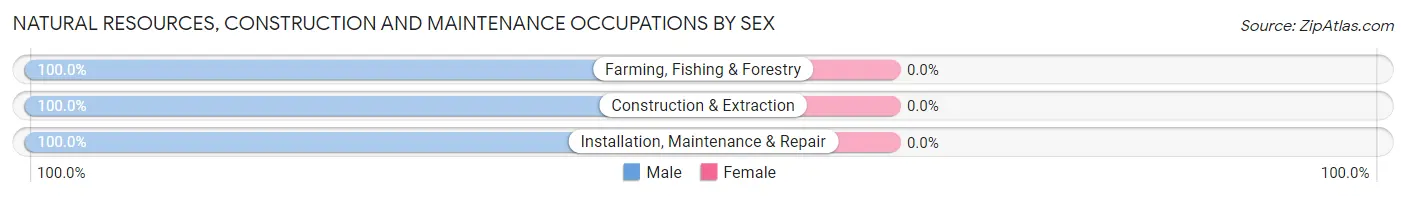
| Occupation | Male | Female |
| Farming, Fishing & Forestry | 72 (100.0%) | 0 (0.0%) |
| Construction & Extraction | 15 (100.0%) | 0 (0.0%) |
| Installation, Maintenance & Repair | 41 (100.0%) | 0 (0.0%) |
| Total (Category) | 128 (100.0%) | 0 (0.0%) |
| Total (Overall) | 306 (54.5%) | 255 (45.5%) |
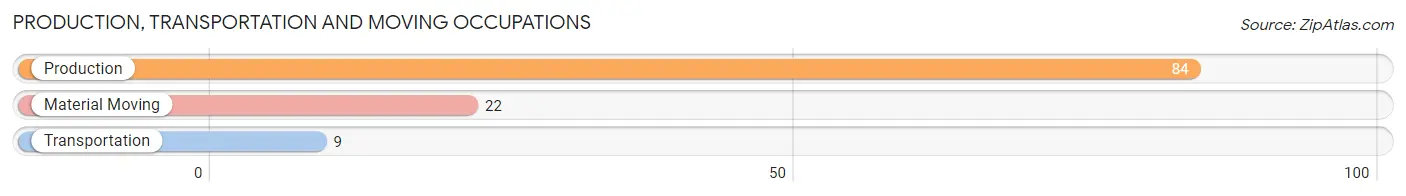
Production, Transportation and Moving Occupations
The most common Production, Transportation and Moving occupations in Monette are Production (84 | 15.0%), Material Moving (22 | 3.9%), and Transportation (9 | 1.6%).
Production, Transportation and Moving Occupations by Sex
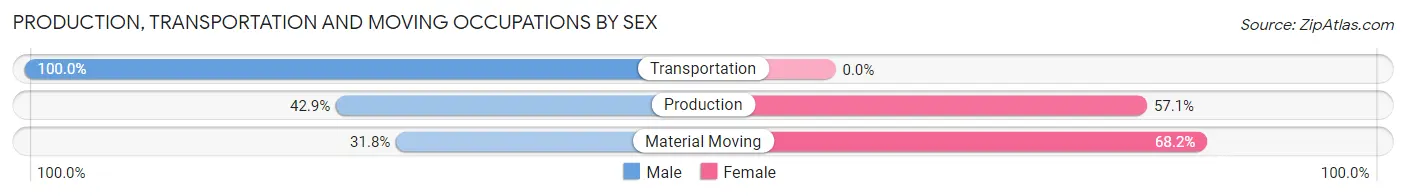
| Occupation | Male | Female |
| Production | 36 (42.9%) | 48 (57.1%) |
| Transportation | 9 (100.0%) | 0 (0.0%) |
| Material Moving | 7 (31.8%) | 15 (68.2%) |
| Total (Category) | 52 (45.2%) | 63 (54.8%) |
| Total (Overall) | 306 (54.5%) | 255 (45.5%) |
Employment Industries by Sex in Monette
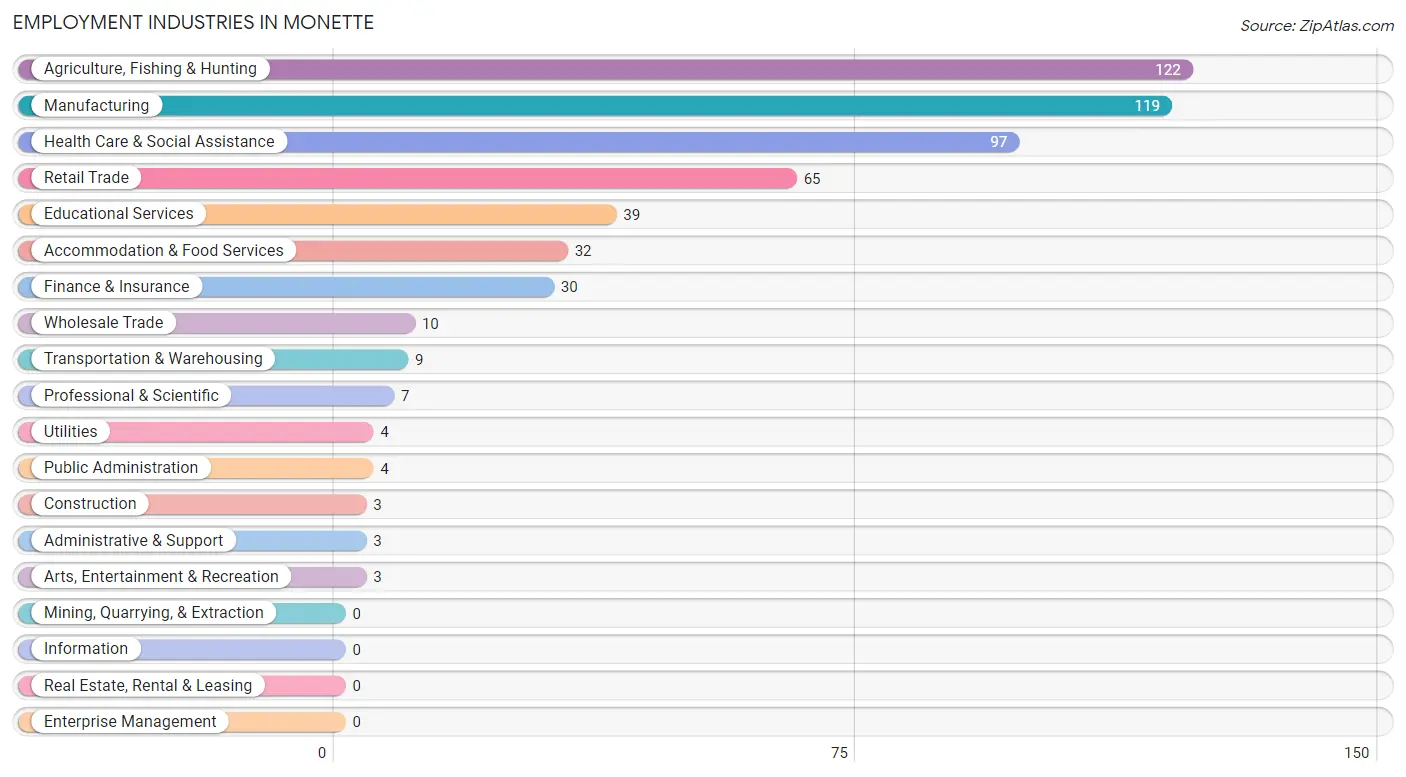
Employment Industries in Monette
The major employment industries in Monette include Agriculture, Fishing & Hunting (122 | 21.7%), Manufacturing (119 | 21.2%), Health Care & Social Assistance (97 | 17.3%), Retail Trade (65 | 11.6%), and Educational Services (39 | 7.0%).
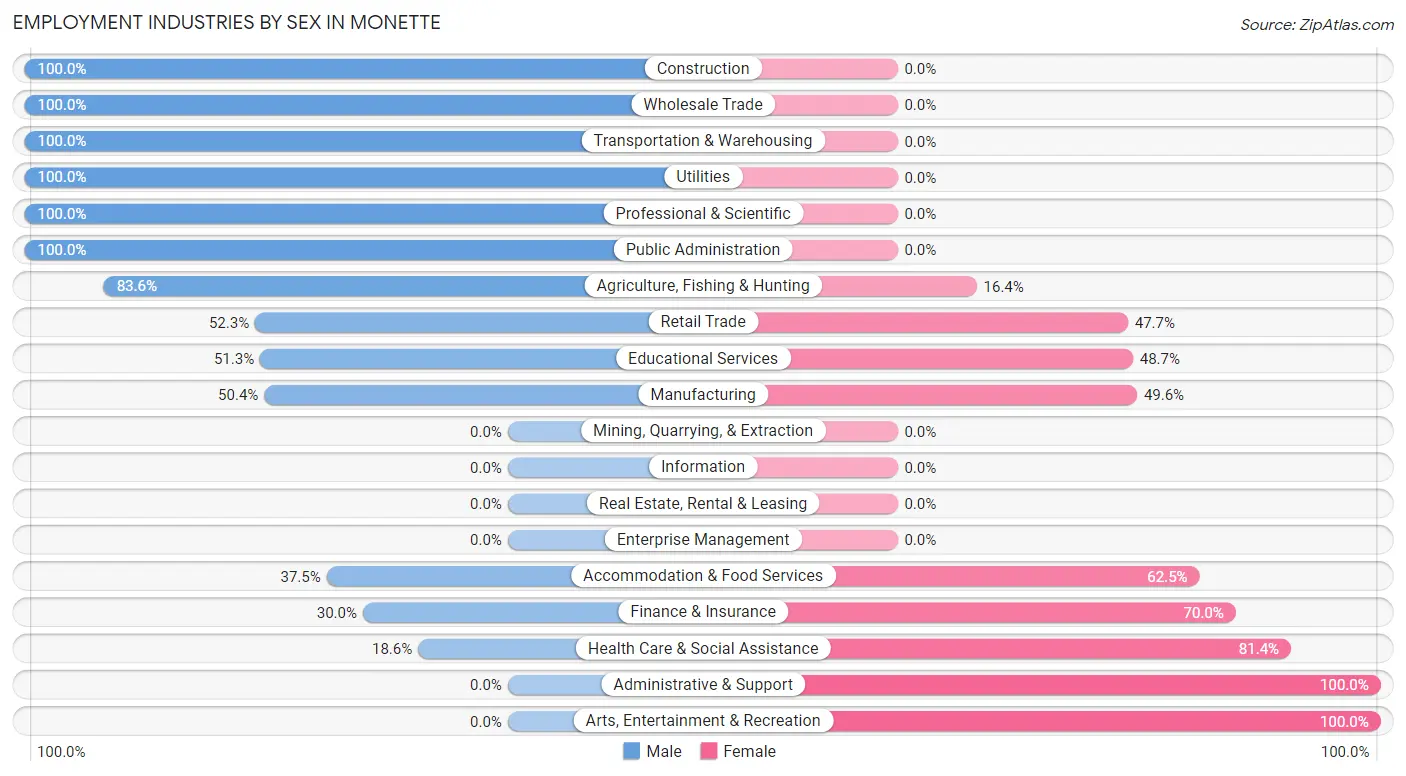
Employment Industries by Sex in Monette
The Monette industries that see more men than women are Construction (100.0%), Wholesale Trade (100.0%), and Transportation & Warehousing (100.0%), whereas the industries that tend to have a higher number of women are Administrative & Support (100.0%), Arts, Entertainment & Recreation (100.0%), and Health Care & Social Assistance (81.4%).
| Industry | Male | Female |
| Agriculture, Fishing & Hunting | 102 (83.6%) | 20 (16.4%) |
| Mining, Quarrying, & Extraction | 0 (0.0%) | 0 (0.0%) |
| Construction | 3 (100.0%) | 0 (0.0%) |
| Manufacturing | 60 (50.4%) | 59 (49.6%) |
| Wholesale Trade | 10 (100.0%) | 0 (0.0%) |
| Retail Trade | 34 (52.3%) | 31 (47.7%) |
| Transportation & Warehousing | 9 (100.0%) | 0 (0.0%) |
| Utilities | 4 (100.0%) | 0 (0.0%) |
| Information | 0 (0.0%) | 0 (0.0%) |
| Finance & Insurance | 9 (30.0%) | 21 (70.0%) |
| Real Estate, Rental & Leasing | 0 (0.0%) | 0 (0.0%) |
| Professional & Scientific | 7 (100.0%) | 0 (0.0%) |
| Enterprise Management | 0 (0.0%) | 0 (0.0%) |
| Administrative & Support | 0 (0.0%) | 3 (100.0%) |
| Educational Services | 20 (51.3%) | 19 (48.7%) |
| Health Care & Social Assistance | 18 (18.6%) | 79 (81.4%) |
| Arts, Entertainment & Recreation | 0 (0.0%) | 3 (100.0%) |
| Accommodation & Food Services | 12 (37.5%) | 20 (62.5%) |
| Public Administration | 4 (100.0%) | 0 (0.0%) |
| Total | 306 (54.5%) | 255 (45.5%) |
Education in Monette
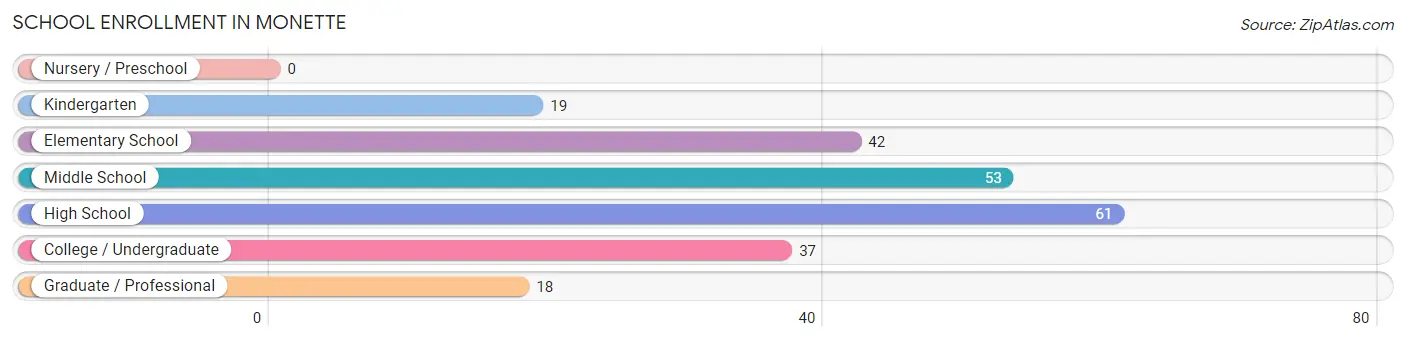
School Enrollment in Monette
The most common levels of schooling among the 230 students in Monette are high school (61 | 26.5%), middle school (53 | 23.0%), and elementary school (42 | 18.3%).
| School Level | # Students | % Students |
| Nursery / Preschool | 0 | 0.0% |
| Kindergarten | 19 | 8.3% |
| Elementary School | 42 | 18.3% |
| Middle School | 53 | 23.0% |
| High School | 61 | 26.5% |
| College / Undergraduate | 37 | 16.1% |
| Graduate / Professional | 18 | 7.8% |
| Total | 230 | 100.0% |
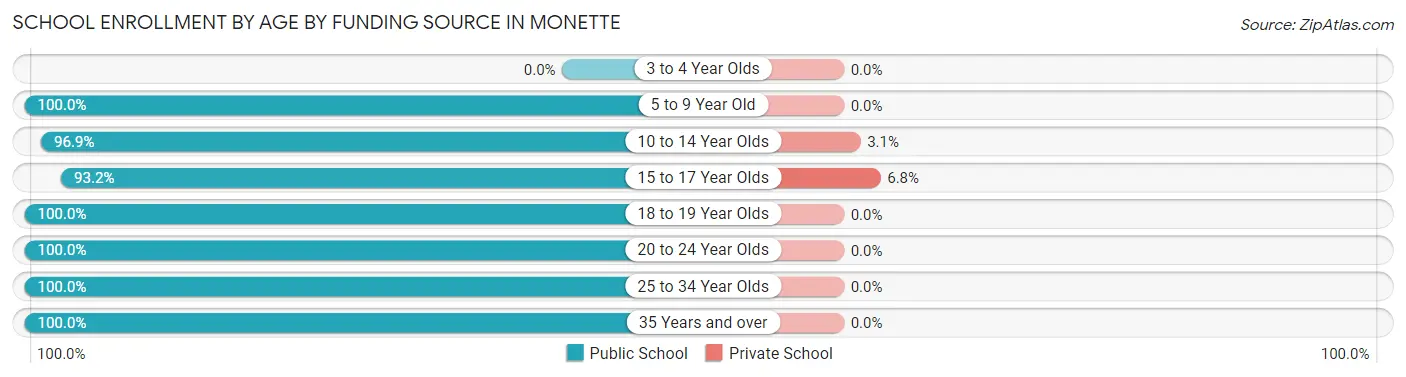
School Enrollment by Age by Funding Source in Monette
Out of a total of 230 students who are enrolled in schools in Monette, 5 (2.2%) attend a private institution, while the remaining 225 (97.8%) are enrolled in public schools. The age group of 15 to 17 year olds has the highest likelihood of being enrolled in private schools, with 3 (6.8% in the age bracket) enrolled. Conversely, the age group of 5 to 9 year old has the lowest likelihood of being enrolled in a private school, with 52 (100.0% in the age bracket) attending a public institution.
| Age Bracket | Public School | Private School |
| 3 to 4 Year Olds | 0 (0.0%) | 0 (0.0%) |
| 5 to 9 Year Old | 52 (100.0%) | 0 (0.0%) |
| 10 to 14 Year Olds | 63 (96.9%) | 2 (3.1%) |
| 15 to 17 Year Olds | 41 (93.2%) | 3 (6.8%) |
| 18 to 19 Year Olds | 12 (100.0%) | 0 (0.0%) |
| 20 to 24 Year Olds | 16 (100.0%) | 0 (0.0%) |
| 25 to 34 Year Olds | 21 (100.0%) | 0 (0.0%) |
| 35 Years and over | 20 (100.0%) | 0 (0.0%) |
| Total | 225 (97.8%) | 5 (2.2%) |
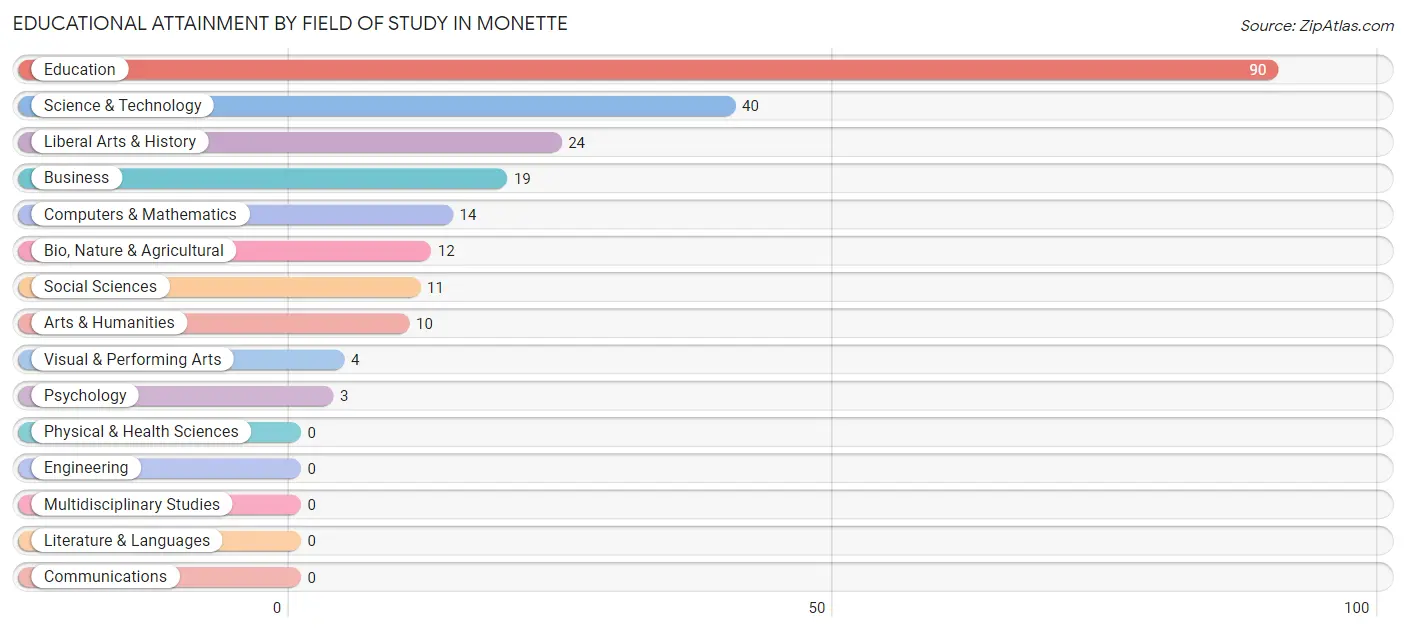
Educational Attainment by Field of Study in Monette
Education (90 | 39.7%), science & technology (40 | 17.6%), liberal arts & history (24 | 10.6%), business (19 | 8.4%), and computers & mathematics (14 | 6.2%) are the most common fields of study among 227 individuals in Monette who have obtained a bachelor's degree or higher.
| Field of Study | # Graduates | % Graduates |
| Computers & Mathematics | 14 | 6.2% |
| Bio, Nature & Agricultural | 12 | 5.3% |
| Physical & Health Sciences | 0 | 0.0% |
| Psychology | 3 | 1.3% |
| Social Sciences | 11 | 4.9% |
| Engineering | 0 | 0.0% |
| Multidisciplinary Studies | 0 | 0.0% |
| Science & Technology | 40 | 17.6% |
| Business | 19 | 8.4% |
| Education | 90 | 39.7% |
| Literature & Languages | 0 | 0.0% |
| Liberal Arts & History | 24 | 10.6% |
| Visual & Performing Arts | 4 | 1.8% |
| Communications | 0 | 0.0% |
| Arts & Humanities | 10 | 4.4% |
| Total | 227 | 100.0% |
Transportation & Commute in Monette
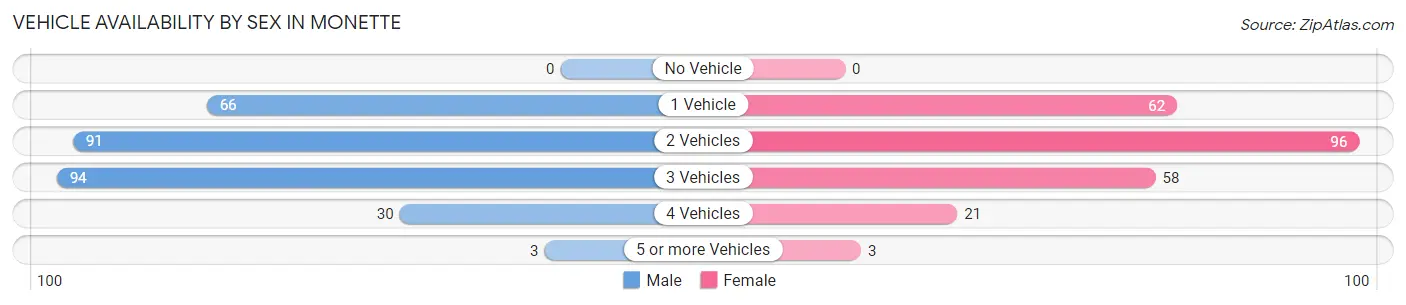
Vehicle Availability by Sex in Monette
The most prevalent vehicle ownership categories in Monette are males with 3 vehicles (94, accounting for 33.1%) and females with 3 vehicles (58, making up 39.2%).
| Vehicles Available | Male | Female |
| No Vehicle | 0 (0.0%) | 0 (0.0%) |
| 1 Vehicle | 66 (23.2%) | 62 (25.8%) |
| 2 Vehicles | 91 (32.0%) | 96 (40.0%) |
| 3 Vehicles | 94 (33.1%) | 58 (24.2%) |
| 4 Vehicles | 30 (10.6%) | 21 (8.7%) |
| 5 or more Vehicles | 3 (1.1%) | 3 (1.3%) |
| Total | 284 (100.0%) | 240 (100.0%) |
Commute Time in Monette
The most frequently occuring commute durations in Monette are 30 to 34 minutes (114 commuters, 22.1%), 35 to 39 minutes (86 commuters, 16.7%), and 45 to 59 minutes (64 commuters, 12.4%).
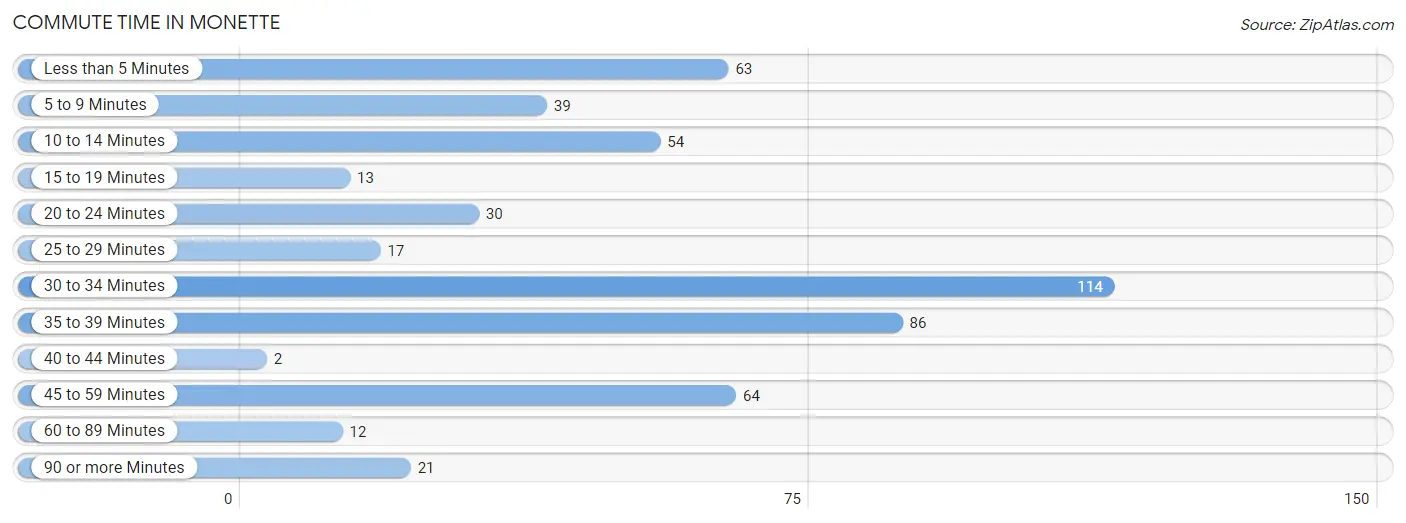
| Commute Time | # Commuters | % Commuters |
| Less than 5 Minutes | 63 | 12.2% |
| 5 to 9 Minutes | 39 | 7.6% |
| 10 to 14 Minutes | 54 | 10.5% |
| 15 to 19 Minutes | 13 | 2.5% |
| 20 to 24 Minutes | 30 | 5.8% |
| 25 to 29 Minutes | 17 | 3.3% |
| 30 to 34 Minutes | 114 | 22.1% |
| 35 to 39 Minutes | 86 | 16.7% |
| 40 to 44 Minutes | 2 | 0.4% |
| 45 to 59 Minutes | 64 | 12.4% |
| 60 to 89 Minutes | 12 | 2.3% |
| 90 or more Minutes | 21 | 4.1% |
Commute Time by Sex in Monette
The most common commute times in Monette are 30 to 34 minutes (60 commuters, 21.7%) for males and 30 to 34 minutes (54 commuters, 22.7%) for females.
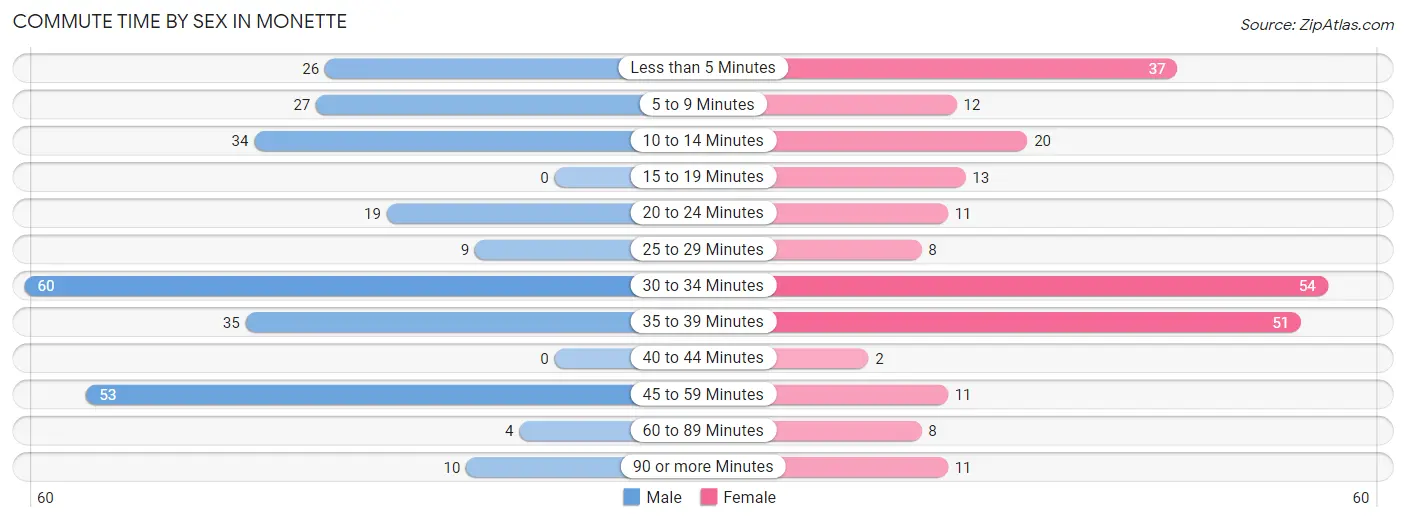
| Commute Time | Male | Female |
| Less than 5 Minutes | 26 (9.4%) | 37 (15.5%) |
| 5 to 9 Minutes | 27 (9.8%) | 12 (5.0%) |
| 10 to 14 Minutes | 34 (12.3%) | 20 (8.4%) |
| 15 to 19 Minutes | 0 (0.0%) | 13 (5.5%) |
| 20 to 24 Minutes | 19 (6.9%) | 11 (4.6%) |
| 25 to 29 Minutes | 9 (3.3%) | 8 (3.4%) |
| 30 to 34 Minutes | 60 (21.7%) | 54 (22.7%) |
| 35 to 39 Minutes | 35 (12.6%) | 51 (21.4%) |
| 40 to 44 Minutes | 0 (0.0%) | 2 (0.8%) |
| 45 to 59 Minutes | 53 (19.1%) | 11 (4.6%) |
| 60 to 89 Minutes | 4 (1.4%) | 8 (3.4%) |
| 90 or more Minutes | 10 (3.6%) | 11 (4.6%) |
Time of Departure to Work by Sex in Monette
The most frequent times of departure to work in Monette are 6:30 AM to 6:59 AM (57, 20.6%) for males and 7:00 AM to 7:29 AM (52, 21.8%) for females.
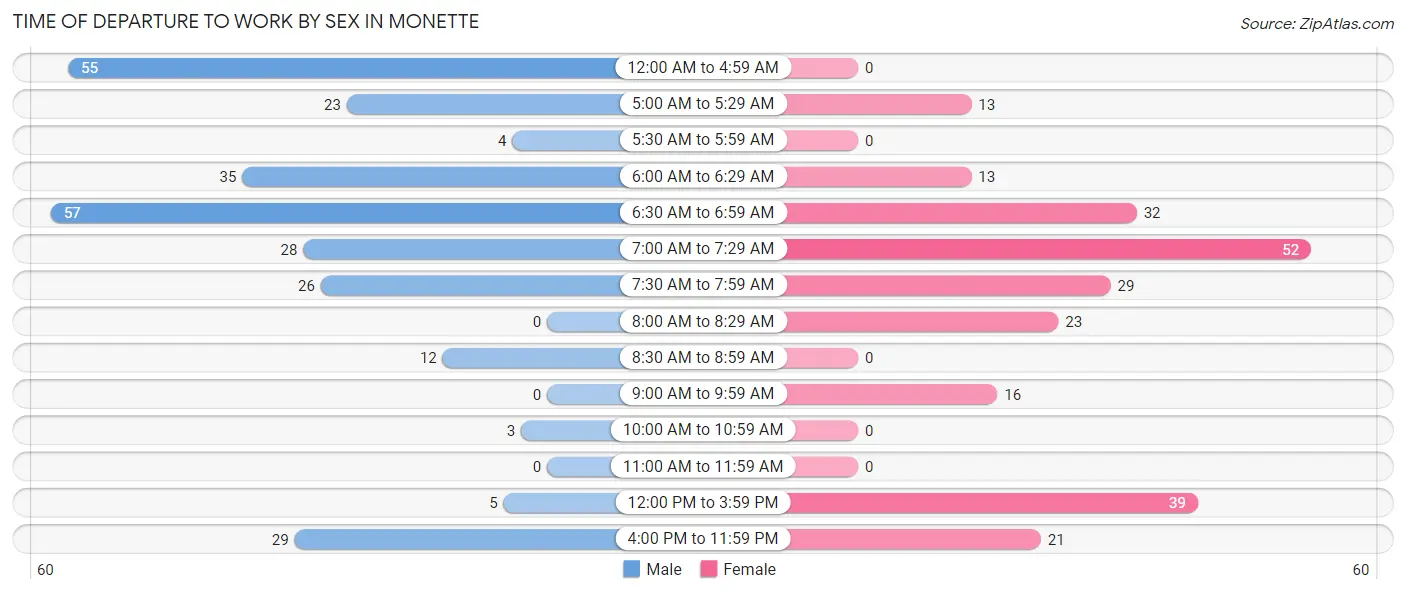
| Time of Departure | Male | Female |
| 12:00 AM to 4:59 AM | 55 (19.9%) | 0 (0.0%) |
| 5:00 AM to 5:29 AM | 23 (8.3%) | 13 (5.5%) |
| 5:30 AM to 5:59 AM | 4 (1.4%) | 0 (0.0%) |
| 6:00 AM to 6:29 AM | 35 (12.6%) | 13 (5.5%) |
| 6:30 AM to 6:59 AM | 57 (20.6%) | 32 (13.5%) |
| 7:00 AM to 7:29 AM | 28 (10.1%) | 52 (21.8%) |
| 7:30 AM to 7:59 AM | 26 (9.4%) | 29 (12.2%) |
| 8:00 AM to 8:29 AM | 0 (0.0%) | 23 (9.7%) |
| 8:30 AM to 8:59 AM | 12 (4.3%) | 0 (0.0%) |
| 9:00 AM to 9:59 AM | 0 (0.0%) | 16 (6.7%) |
| 10:00 AM to 10:59 AM | 3 (1.1%) | 0 (0.0%) |
| 11:00 AM to 11:59 AM | 0 (0.0%) | 0 (0.0%) |
| 12:00 PM to 3:59 PM | 5 (1.8%) | 39 (16.4%) |
| 4:00 PM to 11:59 PM | 29 (10.5%) | 21 (8.8%) |
| Total | 277 (100.0%) | 238 (100.0%) |
Housing Occupancy in Monette
Occupancy by Ownership in Monette
Of the total 583 dwellings in Monette, owner-occupied units account for 385 (66.0%), while renter-occupied units make up 198 (34.0%).
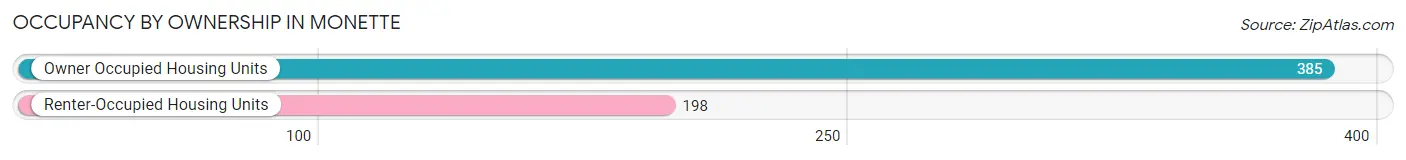
| Occupancy | # Housing Units | % Housing Units |
| Owner Occupied Housing Units | 385 | 66.0% |
| Renter-Occupied Housing Units | 198 | 34.0% |
| Total Occupied Housing Units | 583 | 100.0% |
Occupancy by Household Size in Monette
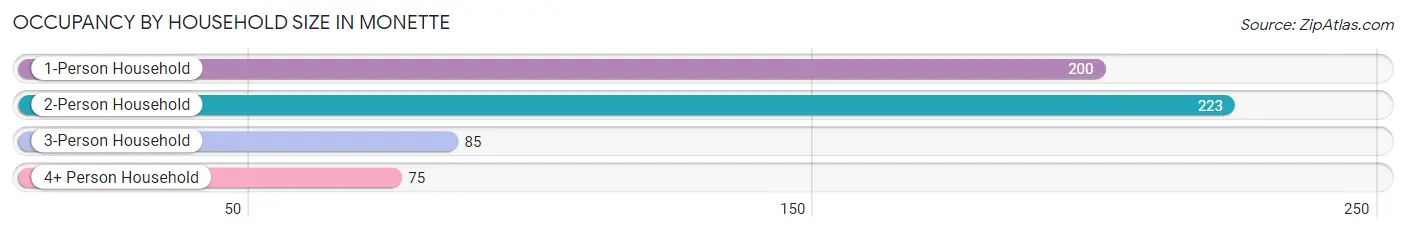
| Household Size | # Housing Units | % Housing Units |
| 1-Person Household | 200 | 34.3% |
| 2-Person Household | 223 | 38.3% |
| 3-Person Household | 85 | 14.6% |
| 4+ Person Household | 75 | 12.9% |
| Total Housing Units | 583 | 100.0% |
Occupancy by Ownership by Household Size in Monette
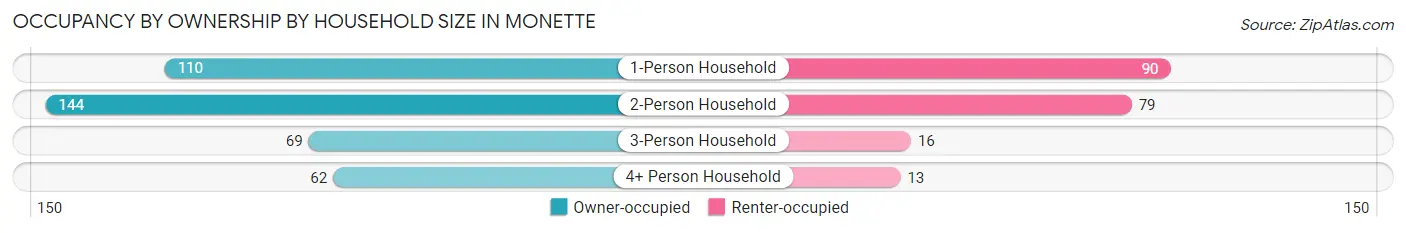
| Household Size | Owner-occupied | Renter-occupied |
| 1-Person Household | 110 (55.0%) | 90 (45.0%) |
| 2-Person Household | 144 (64.6%) | 79 (35.4%) |
| 3-Person Household | 69 (81.2%) | 16 (18.8%) |
| 4+ Person Household | 62 (82.7%) | 13 (17.3%) |
| Total Housing Units | 385 (66.0%) | 198 (34.0%) |
Occupancy by Educational Attainment in Monette
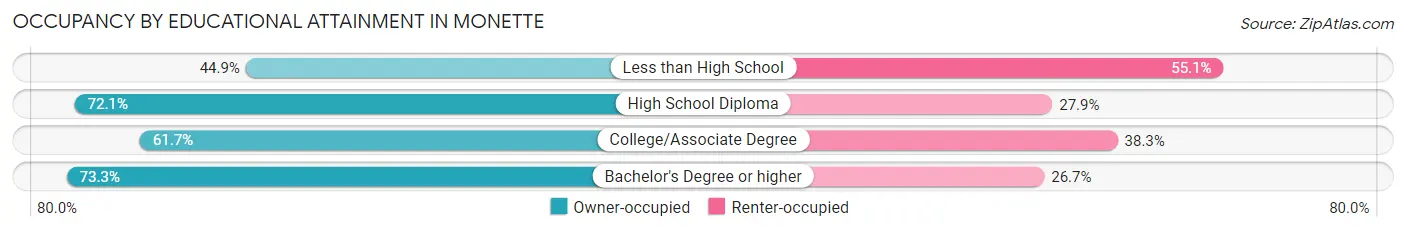
| Household Size | Owner-occupied | Renter-occupied |
| Less than High School | 31 (44.9%) | 38 (55.1%) |
| High School Diploma | 147 (72.1%) | 57 (27.9%) |
| College/Associate Degree | 108 (61.7%) | 67 (38.3%) |
| Bachelor's Degree or higher | 99 (73.3%) | 36 (26.7%) |
Occupancy by Age of Householder in Monette
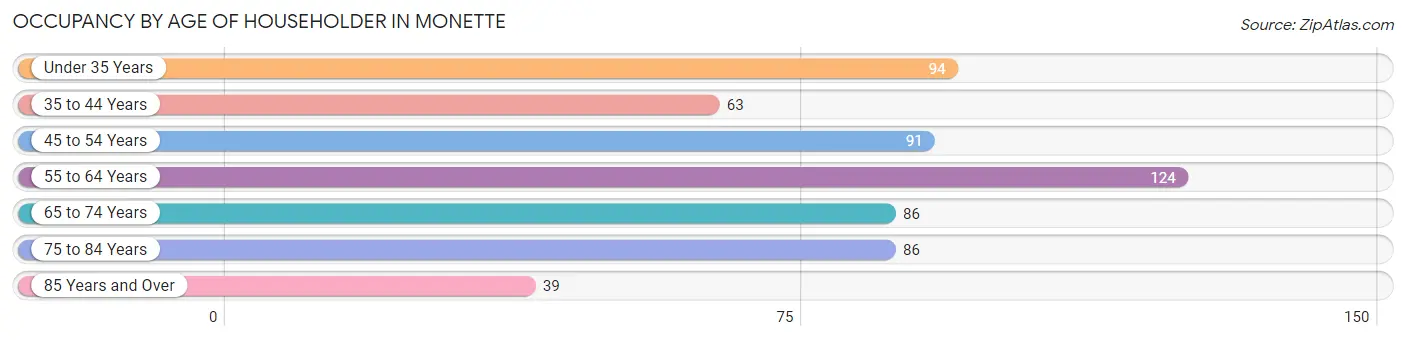
| Age Bracket | # Households | % Households |
| Under 35 Years | 94 | 16.1% |
| 35 to 44 Years | 63 | 10.8% |
| 45 to 54 Years | 91 | 15.6% |
| 55 to 64 Years | 124 | 21.3% |
| 65 to 74 Years | 86 | 14.7% |
| 75 to 84 Years | 86 | 14.7% |
| 85 Years and Over | 39 | 6.7% |
| Total | 583 | 100.0% |
Housing Finances in Monette
Median Income by Occupancy in Monette
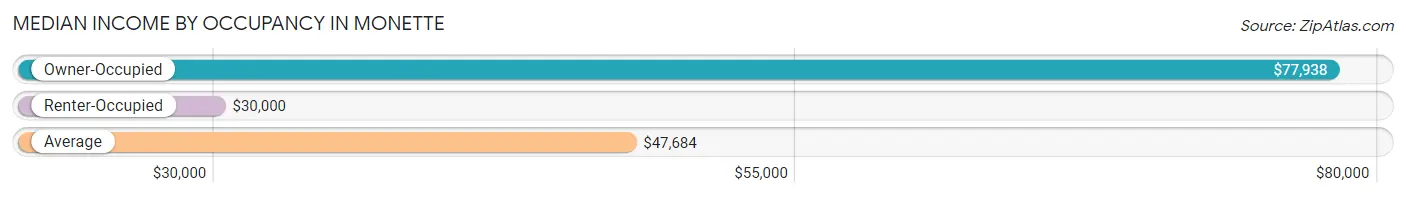
| Occupancy Type | # Households | Median Income |
| Owner-Occupied | 385 (66.0%) | $77,938 |
| Renter-Occupied | 198 (34.0%) | $30,000 |
| Average | 583 (100.0%) | $47,684 |
Occupancy by Householder Income Bracket in Monette
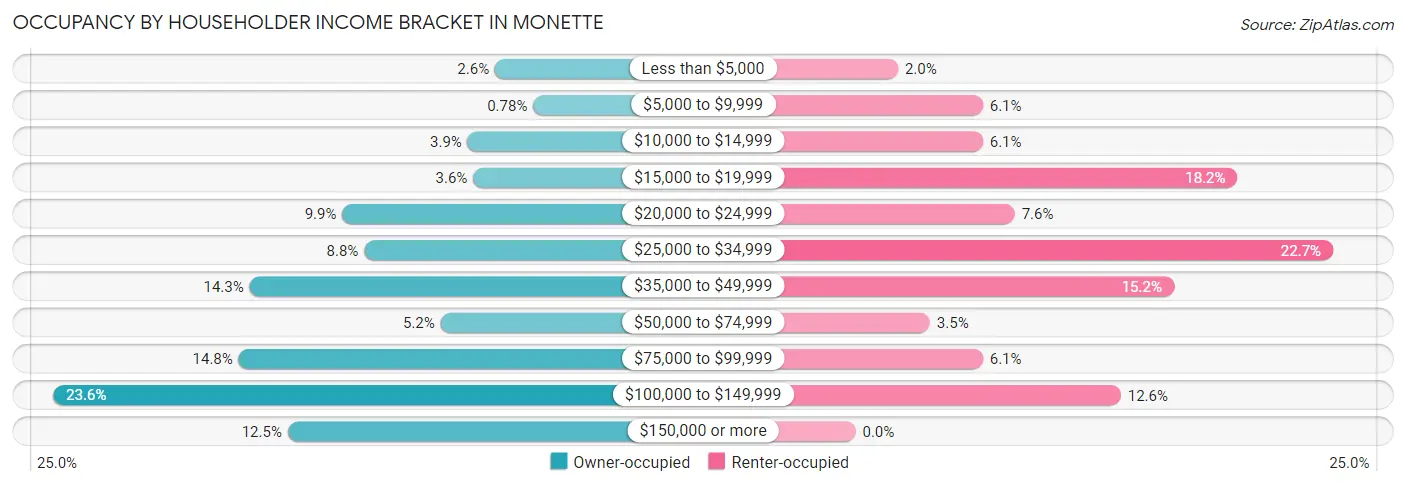
| Income Bracket | Owner-occupied | Renter-occupied |
| Less than $5,000 | 10 (2.6%) | 4 (2.0%) |
| $5,000 to $9,999 | 3 (0.8%) | 12 (6.1%) |
| $10,000 to $14,999 | 15 (3.9%) | 12 (6.1%) |
| $15,000 to $19,999 | 14 (3.6%) | 36 (18.2%) |
| $20,000 to $24,999 | 38 (9.9%) | 15 (7.6%) |
| $25,000 to $34,999 | 34 (8.8%) | 45 (22.7%) |
| $35,000 to $49,999 | 55 (14.3%) | 30 (15.1%) |
| $50,000 to $74,999 | 20 (5.2%) | 7 (3.5%) |
| $75,000 to $99,999 | 57 (14.8%) | 12 (6.1%) |
| $100,000 to $149,999 | 91 (23.6%) | 25 (12.6%) |
| $150,000 or more | 48 (12.5%) | 0 (0.0%) |
| Total | 385 (100.0%) | 198 (100.0%) |
Monthly Housing Cost Tiers in Monette
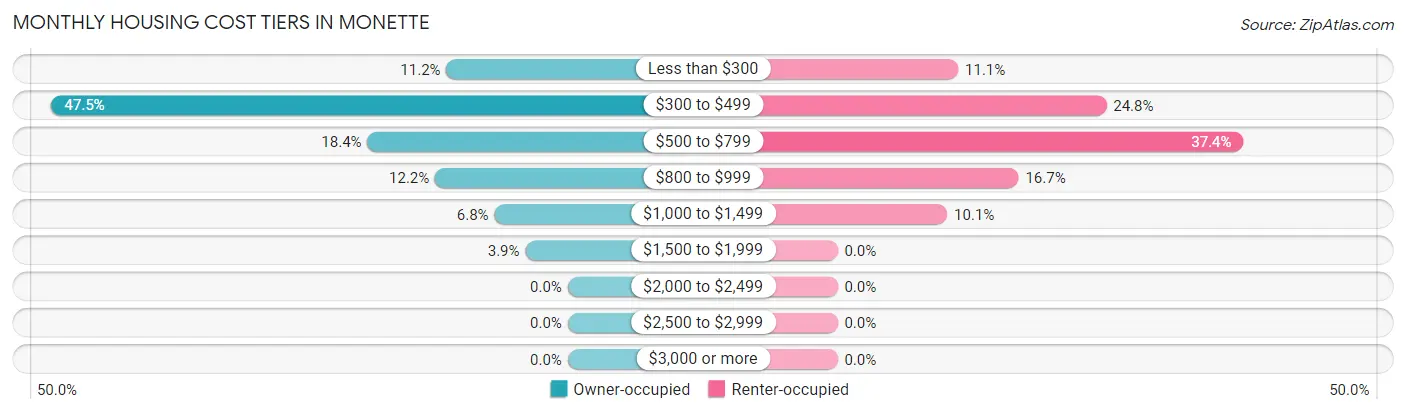
| Monthly Cost | Owner-occupied | Renter-occupied |
| Less than $300 | 43 (11.2%) | 22 (11.1%) |
| $300 to $499 | 183 (47.5%) | 49 (24.7%) |
| $500 to $799 | 71 (18.4%) | 74 (37.4%) |
| $800 to $999 | 47 (12.2%) | 33 (16.7%) |
| $1,000 to $1,499 | 26 (6.8%) | 20 (10.1%) |
| $1,500 to $1,999 | 15 (3.9%) | 0 (0.0%) |
| $2,000 to $2,499 | 0 (0.0%) | 0 (0.0%) |
| $2,500 to $2,999 | 0 (0.0%) | 0 (0.0%) |
| $3,000 or more | 0 (0.0%) | 0 (0.0%) |
| Total | 385 (100.0%) | 198 (100.0%) |
Physical Housing Characteristics in Monette
Housing Structures in Monette
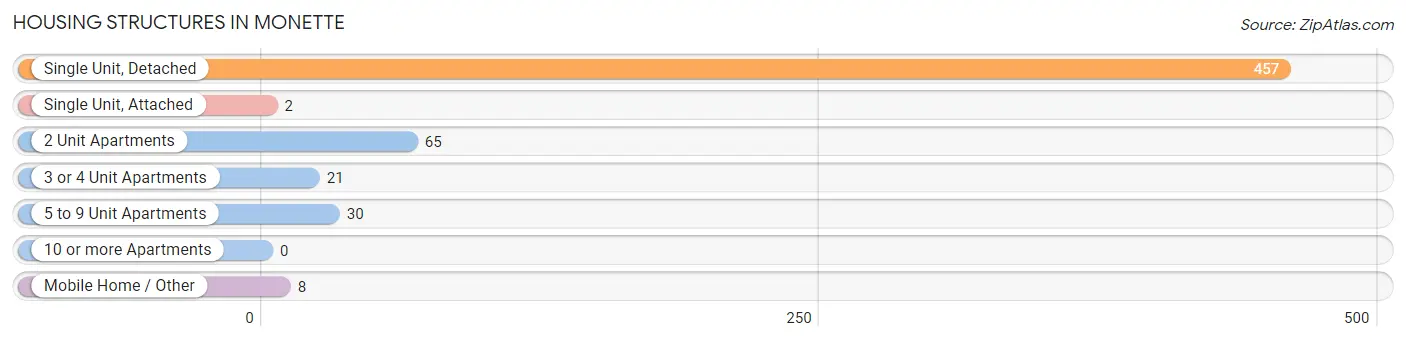
| Structure Type | # Housing Units | % Housing Units |
| Single Unit, Detached | 457 | 78.4% |
| Single Unit, Attached | 2 | 0.3% |
| 2 Unit Apartments | 65 | 11.2% |
| 3 or 4 Unit Apartments | 21 | 3.6% |
| 5 to 9 Unit Apartments | 30 | 5.1% |
| 10 or more Apartments | 0 | 0.0% |
| Mobile Home / Other | 8 | 1.4% |
| Total | 583 | 100.0% |
Housing Structures by Occupancy in Monette
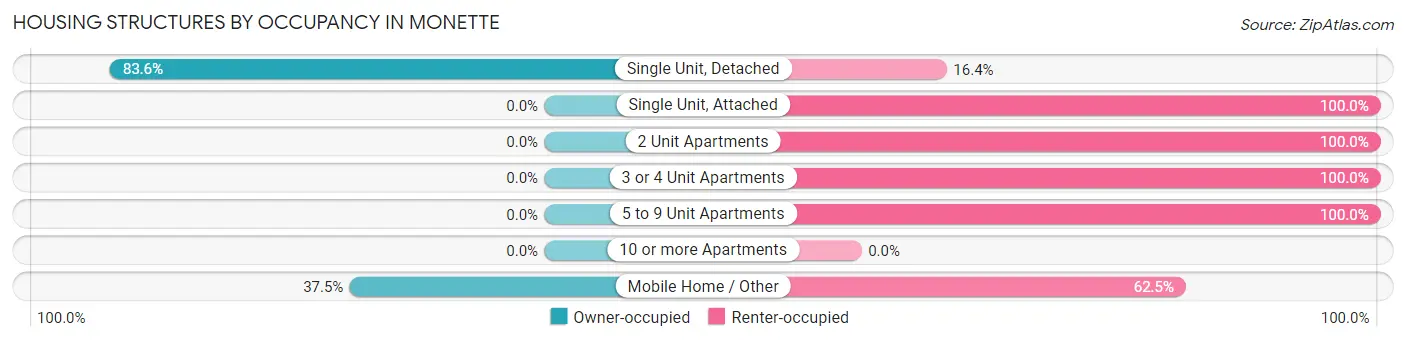
| Structure Type | Owner-occupied | Renter-occupied |
| Single Unit, Detached | 382 (83.6%) | 75 (16.4%) |
| Single Unit, Attached | 0 (0.0%) | 2 (100.0%) |
| 2 Unit Apartments | 0 (0.0%) | 65 (100.0%) |
| 3 or 4 Unit Apartments | 0 (0.0%) | 21 (100.0%) |
| 5 to 9 Unit Apartments | 0 (0.0%) | 30 (100.0%) |
| 10 or more Apartments | 0 (0.0%) | 0 (0.0%) |
| Mobile Home / Other | 3 (37.5%) | 5 (62.5%) |
| Total | 385 (66.0%) | 198 (34.0%) |
Housing Structures by Number of Rooms in Monette
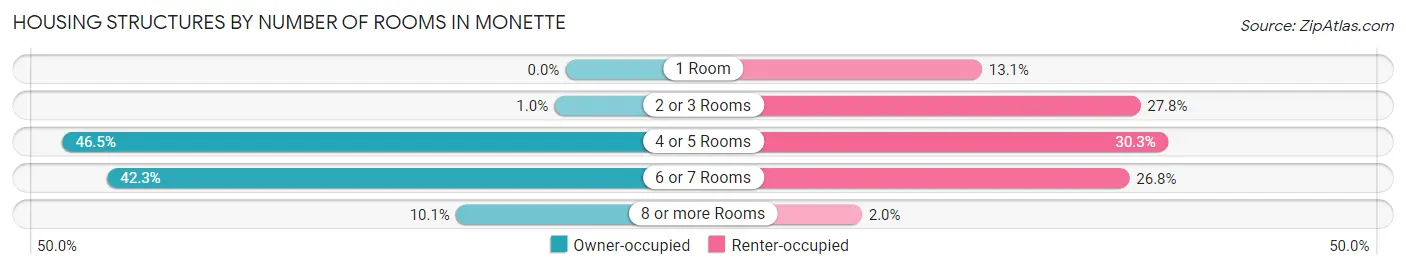
| Number of Rooms | Owner-occupied | Renter-occupied |
| 1 Room | 0 (0.0%) | 26 (13.1%) |
| 2 or 3 Rooms | 4 (1.0%) | 55 (27.8%) |
| 4 or 5 Rooms | 179 (46.5%) | 60 (30.3%) |
| 6 or 7 Rooms | 163 (42.3%) | 53 (26.8%) |
| 8 or more Rooms | 39 (10.1%) | 4 (2.0%) |
| Total | 385 (100.0%) | 198 (100.0%) |
Housing Structure by Heating Type in Monette
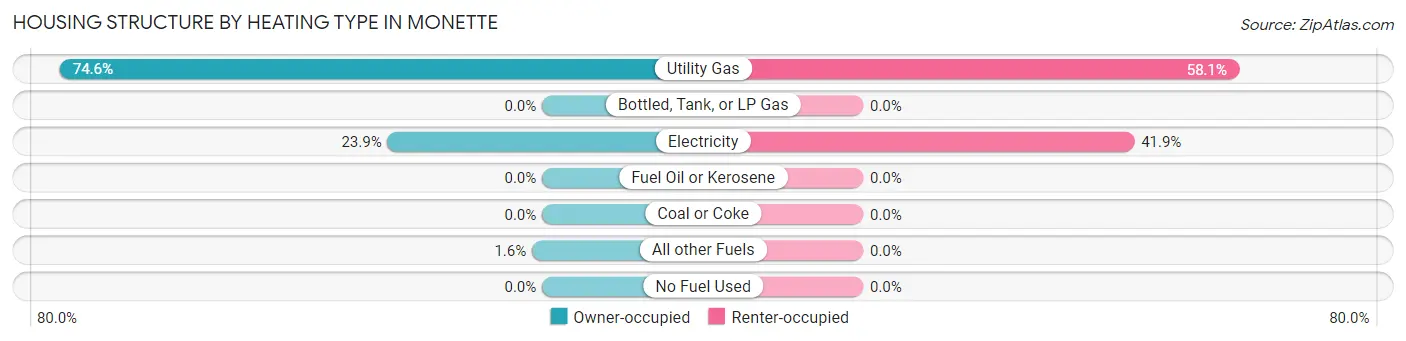
| Heating Type | Owner-occupied | Renter-occupied |
| Utility Gas | 287 (74.6%) | 115 (58.1%) |
| Bottled, Tank, or LP Gas | 0 (0.0%) | 0 (0.0%) |
| Electricity | 92 (23.9%) | 83 (41.9%) |
| Fuel Oil or Kerosene | 0 (0.0%) | 0 (0.0%) |
| Coal or Coke | 0 (0.0%) | 0 (0.0%) |
| All other Fuels | 6 (1.6%) | 0 (0.0%) |
| No Fuel Used | 0 (0.0%) | 0 (0.0%) |
| Total | 385 (100.0%) | 198 (100.0%) |
Household Vehicle Usage in Monette
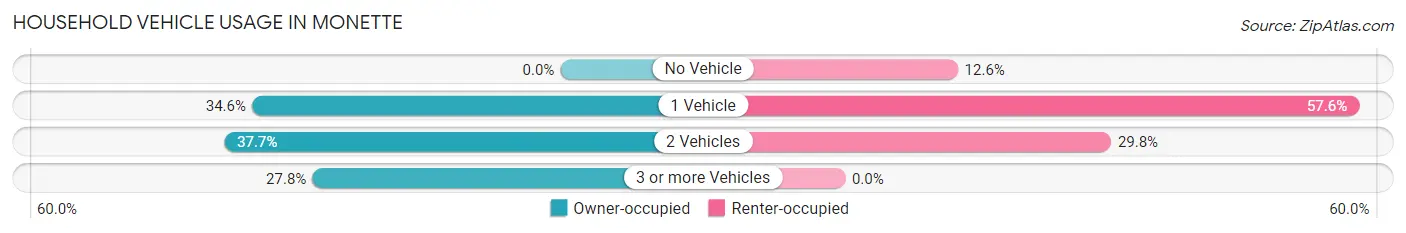
| Vehicles per Household | Owner-occupied | Renter-occupied |
| No Vehicle | 0 (0.0%) | 25 (12.6%) |
| 1 Vehicle | 133 (34.5%) | 114 (57.6%) |
| 2 Vehicles | 145 (37.7%) | 59 (29.8%) |
| 3 or more Vehicles | 107 (27.8%) | 0 (0.0%) |
| Total | 385 (100.0%) | 198 (100.0%) |
Real Estate & Mortgages in Monette
Real Estate and Mortgage Overview in Monette
| Characteristic | Without Mortgage | With Mortgage |
| Housing Units | 284 | 101 |
| Median Property Value | $107,300 | $116,800 |
| Median Household Income | $78,056 | $3 |
| Monthly Housing Costs | $386 | $0 |
| Real Estate Taxes | $442 | $11 |
Property Value by Mortgage Status in Monette
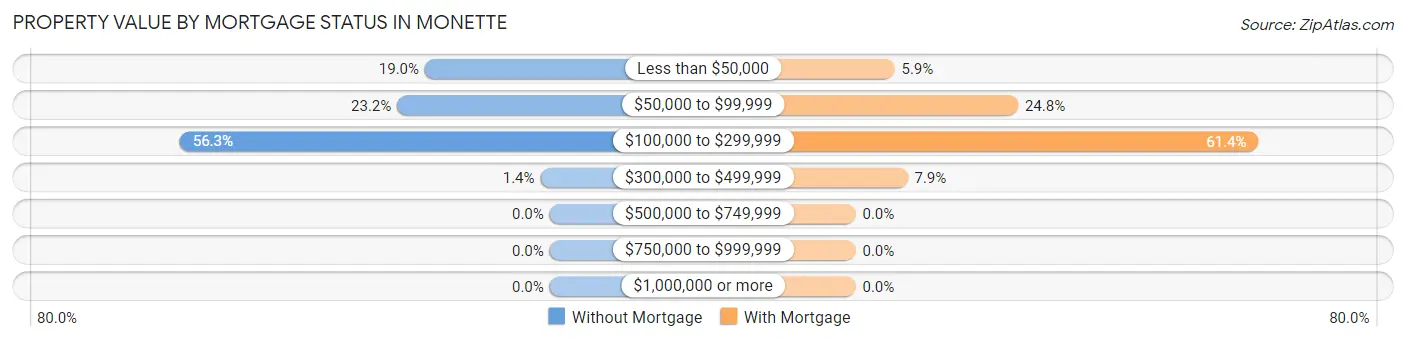
| Property Value | Without Mortgage | With Mortgage |
| Less than $50,000 | 54 (19.0%) | 6 (5.9%) |
| $50,000 to $99,999 | 66 (23.2%) | 25 (24.7%) |
| $100,000 to $299,999 | 160 (56.3%) | 62 (61.4%) |
| $300,000 to $499,999 | 4 (1.4%) | 8 (7.9%) |
| $500,000 to $749,999 | 0 (0.0%) | 0 (0.0%) |
| $750,000 to $999,999 | 0 (0.0%) | 0 (0.0%) |
| $1,000,000 or more | 0 (0.0%) | 0 (0.0%) |
| Total | 284 (100.0%) | 101 (100.0%) |
Household Income by Mortgage Status in Monette
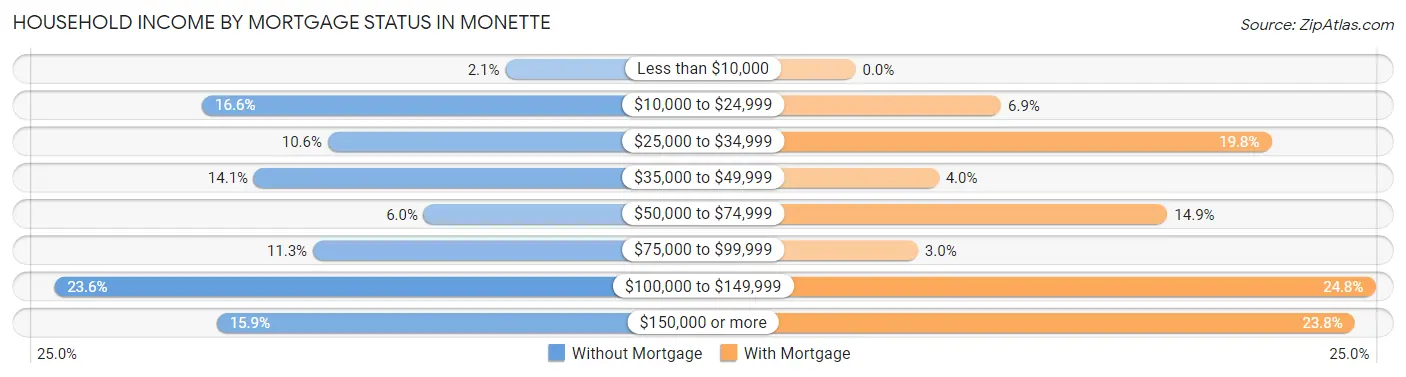
| Household Income | Without Mortgage | With Mortgage |
| Less than $10,000 | 6 (2.1%) | 0 (0.0%) |
| $10,000 to $24,999 | 47 (16.6%) | 7 (6.9%) |
| $25,000 to $34,999 | 30 (10.6%) | 20 (19.8%) |
| $35,000 to $49,999 | 40 (14.1%) | 4 (4.0%) |
| $50,000 to $74,999 | 17 (6.0%) | 15 (14.8%) |
| $75,000 to $99,999 | 32 (11.3%) | 3 (3.0%) |
| $100,000 to $149,999 | 67 (23.6%) | 25 (24.7%) |
| $150,000 or more | 45 (15.9%) | 24 (23.8%) |
| Total | 284 (100.0%) | 101 (100.0%) |
Property Value to Household Income Ratio in Monette
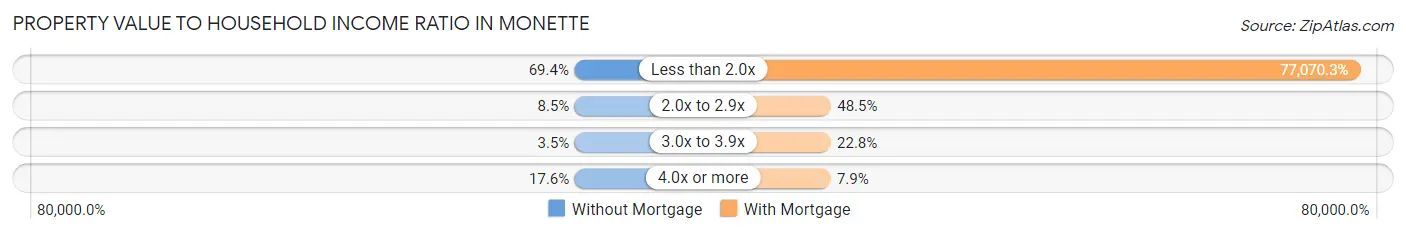
| Value-to-Income Ratio | Without Mortgage | With Mortgage |
| Less than 2.0x | 197 (69.4%) | 77,841 (77,070.3%) |
| 2.0x to 2.9x | 24 (8.5%) | 49 (48.5%) |
| 3.0x to 3.9x | 10 (3.5%) | 23 (22.8%) |
| 4.0x or more | 50 (17.6%) | 8 (7.9%) |
| Total | 284 (100.0%) | 101 (100.0%) |
Real Estate Taxes by Mortgage Status in Monette
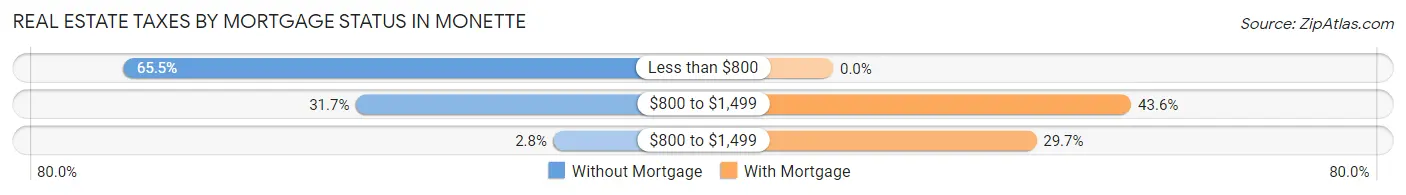
| Property Taxes | Without Mortgage | With Mortgage |
| Less than $800 | 186 (65.5%) | 0 (0.0%) |
| $800 to $1,499 | 90 (31.7%) | 44 (43.6%) |
| $800 to $1,499 | 8 (2.8%) | 30 (29.7%) |
| Total | 284 (100.0%) | 101 (100.0%) |
Health & Disability in Monette
Health Insurance Coverage by Age in Monette
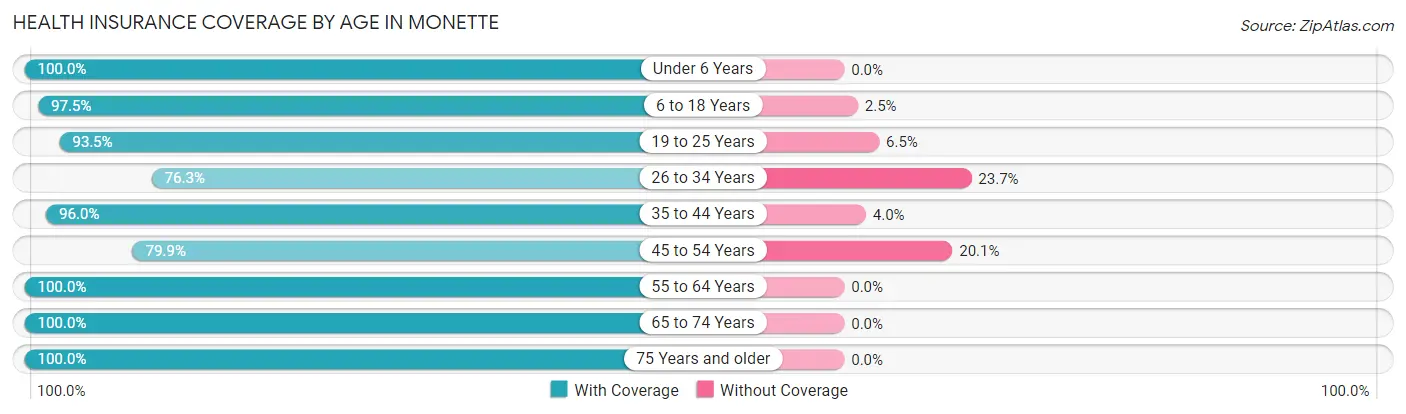
| Age Bracket | With Coverage | Without Coverage |
| Under 6 Years | 75 (100.0%) | 0 (0.0%) |
| 6 to 18 Years | 154 (97.5%) | 4 (2.5%) |
| 19 to 25 Years | 72 (93.5%) | 5 (6.5%) |
| 26 to 34 Years | 103 (76.3%) | 32 (23.7%) |
| 35 to 44 Years | 191 (96.0%) | 8 (4.0%) |
| 45 to 54 Years | 111 (79.9%) | 28 (20.1%) |
| 55 to 64 Years | 186 (100.0%) | 0 (0.0%) |
| 65 to 74 Years | 139 (100.0%) | 0 (0.0%) |
| 75 Years and older | 150 (100.0%) | 0 (0.0%) |
| Total | 1,181 (93.9%) | 77 (6.1%) |
Health Insurance Coverage by Citizenship Status in Monette
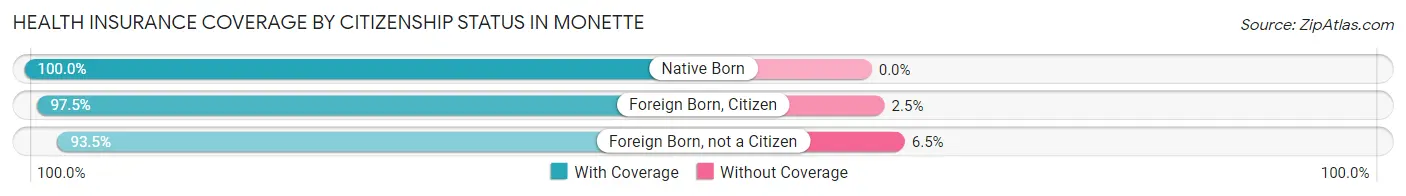
| Citizenship Status | With Coverage | Without Coverage |
| Native Born | 75 (100.0%) | 0 (0.0%) |
| Foreign Born, Citizen | 154 (97.5%) | 4 (2.5%) |
| Foreign Born, not a Citizen | 72 (93.5%) | 5 (6.5%) |
Health Insurance Coverage by Household Income in Monette
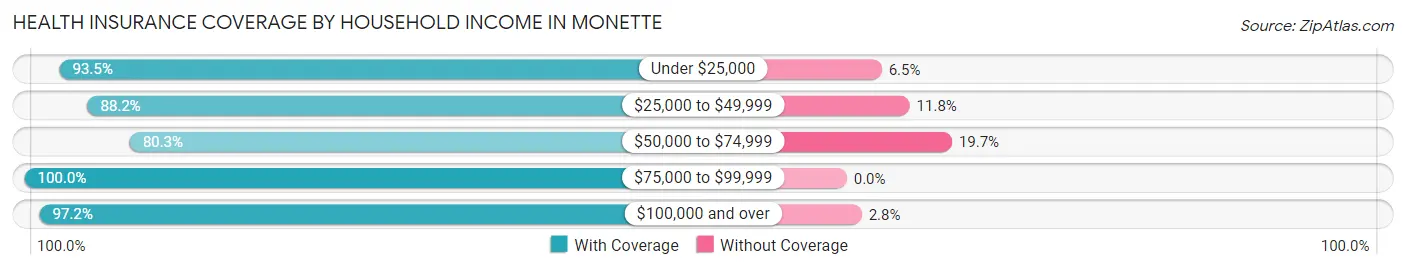
| Household Income | With Coverage | Without Coverage |
| Under $25,000 | 200 (93.5%) | 14 (6.5%) |
| $25,000 to $49,999 | 277 (88.2%) | 37 (11.8%) |
| $50,000 to $74,999 | 53 (80.3%) | 13 (19.7%) |
| $75,000 to $99,999 | 199 (100.0%) | 0 (0.0%) |
| $100,000 and over | 452 (97.2%) | 13 (2.8%) |
Public vs Private Health Insurance Coverage by Age in Monette
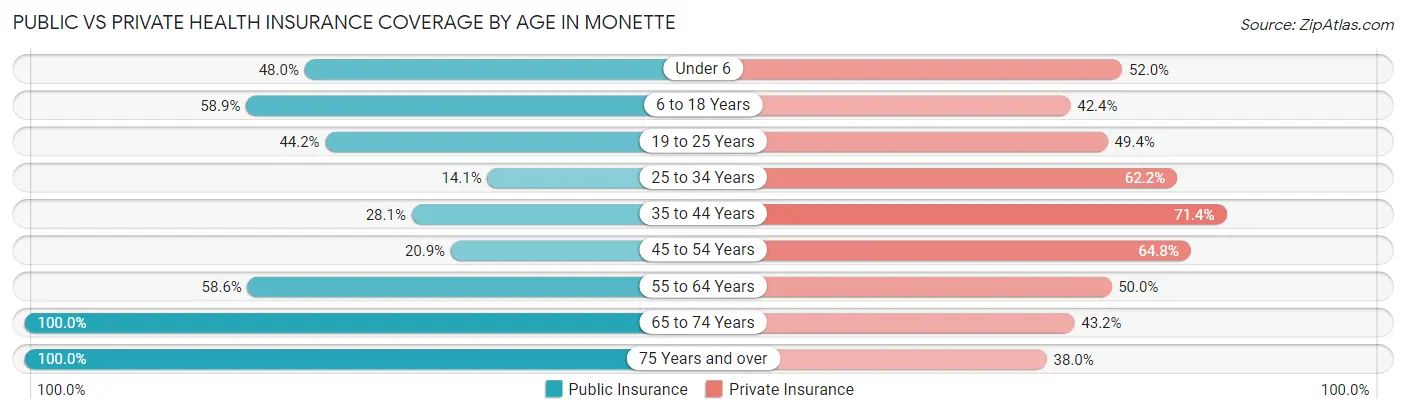
| Age Bracket | Public Insurance | Private Insurance |
| Under 6 | 36 (48.0%) | 39 (52.0%) |
| 6 to 18 Years | 93 (58.9%) | 67 (42.4%) |
| 19 to 25 Years | 34 (44.2%) | 38 (49.3%) |
| 25 to 34 Years | 19 (14.1%) | 84 (62.2%) |
| 35 to 44 Years | 56 (28.1%) | 142 (71.4%) |
| 45 to 54 Years | 29 (20.9%) | 90 (64.7%) |
| 55 to 64 Years | 109 (58.6%) | 93 (50.0%) |
| 65 to 74 Years | 139 (100.0%) | 60 (43.2%) |
| 75 Years and over | 150 (100.0%) | 57 (38.0%) |
| Total | 665 (52.9%) | 670 (53.3%) |
Disability Status by Sex by Age in Monette
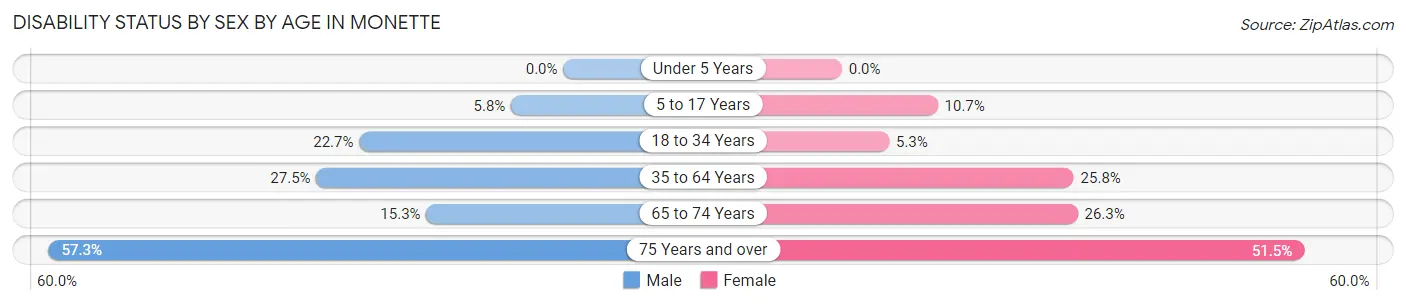
| Age Bracket | Male | Female |
| Under 5 Years | 0 (0.0%) | 0 (0.0%) |
| 5 to 17 Years | 5 (5.8%) | 8 (10.7%) |
| 18 to 34 Years | 25 (22.7%) | 6 (5.3%) |
| 35 to 64 Years | 77 (27.5%) | 63 (25.8%) |
| 65 to 74 Years | 9 (15.2%) | 21 (26.3%) |
| 75 Years and over | 47 (57.3%) | 35 (51.5%) |
Disability Class by Sex by Age in Monette
Disability Class: Hearing Difficulty
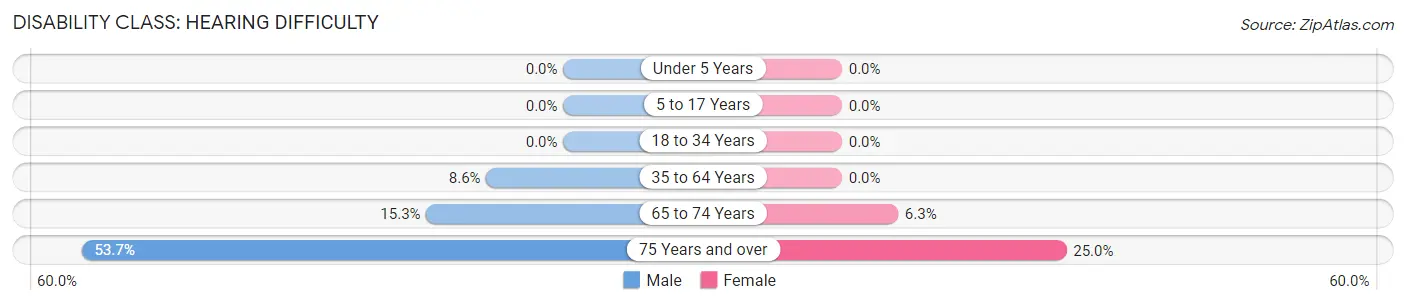
| Age Bracket | Male | Female |
| Under 5 Years | 0 (0.0%) | 0 (0.0%) |
| 5 to 17 Years | 0 (0.0%) | 0 (0.0%) |
| 18 to 34 Years | 0 (0.0%) | 0 (0.0%) |
| 35 to 64 Years | 24 (8.6%) | 0 (0.0%) |
| 65 to 74 Years | 9 (15.2%) | 5 (6.2%) |
| 75 Years and over | 44 (53.7%) | 17 (25.0%) |
Disability Class: Vision Difficulty
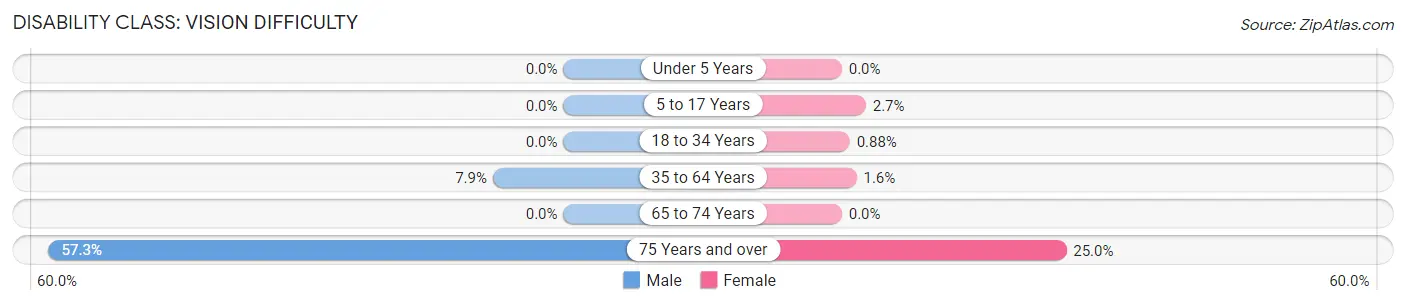
| Age Bracket | Male | Female |
| Under 5 Years | 0 (0.0%) | 0 (0.0%) |
| 5 to 17 Years | 0 (0.0%) | 2 (2.7%) |
| 18 to 34 Years | 0 (0.0%) | 1 (0.9%) |
| 35 to 64 Years | 22 (7.9%) | 4 (1.6%) |
| 65 to 74 Years | 0 (0.0%) | 0 (0.0%) |
| 75 Years and over | 47 (57.3%) | 17 (25.0%) |
Disability Class: Cognitive Difficulty
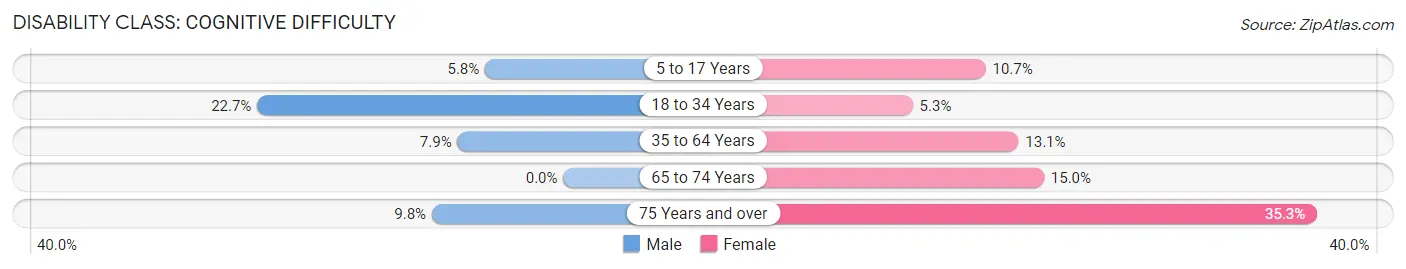
| Age Bracket | Male | Female |
| 5 to 17 Years | 5 (5.8%) | 8 (10.7%) |
| 18 to 34 Years | 25 (22.7%) | 6 (5.3%) |
| 35 to 64 Years | 22 (7.9%) | 32 (13.1%) |
| 65 to 74 Years | 0 (0.0%) | 12 (15.0%) |
| 75 Years and over | 8 (9.8%) | 24 (35.3%) |
Disability Class: Ambulatory Difficulty
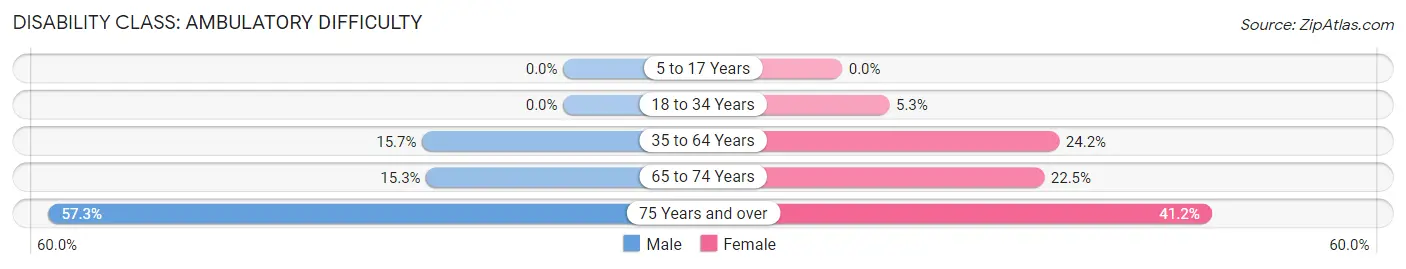
| Age Bracket | Male | Female |
| 5 to 17 Years | 0 (0.0%) | 0 (0.0%) |
| 18 to 34 Years | 0 (0.0%) | 6 (5.3%) |
| 35 to 64 Years | 44 (15.7%) | 59 (24.2%) |
| 65 to 74 Years | 9 (15.2%) | 18 (22.5%) |
| 75 Years and over | 47 (57.3%) | 28 (41.2%) |
Disability Class: Self-Care Difficulty
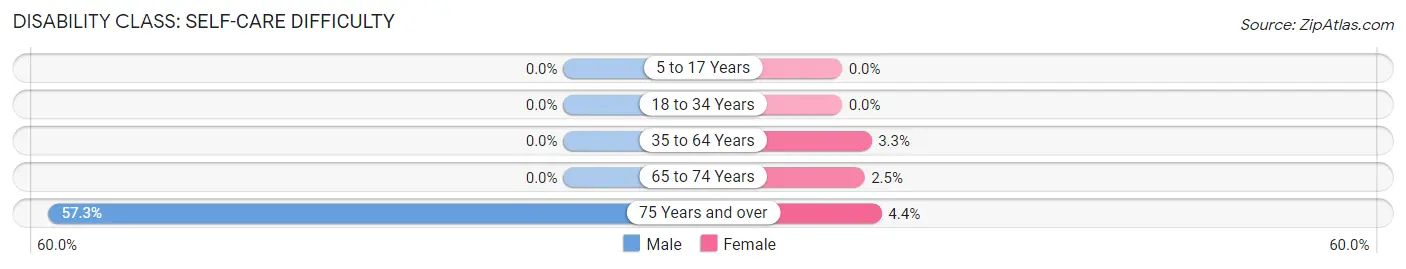
| Age Bracket | Male | Female |
| 5 to 17 Years | 0 (0.0%) | 0 (0.0%) |
| 18 to 34 Years | 0 (0.0%) | 0 (0.0%) |
| 35 to 64 Years | 0 (0.0%) | 8 (3.3%) |
| 65 to 74 Years | 0 (0.0%) | 2 (2.5%) |
| 75 Years and over | 47 (57.3%) | 3 (4.4%) |
Technology Access in Monette
Computing Device Access in Monette
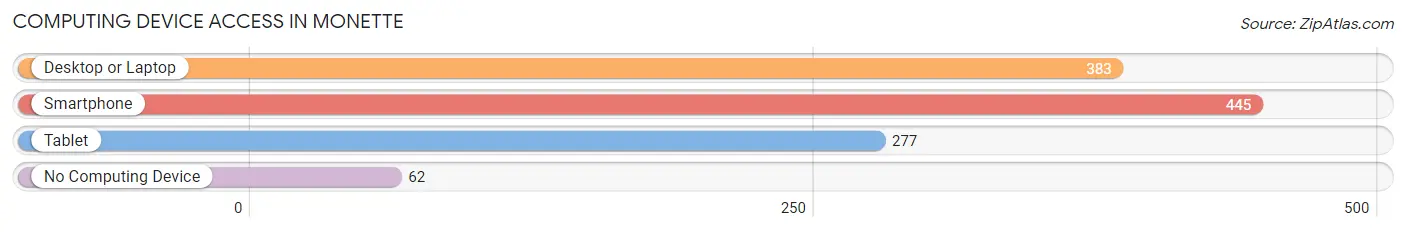
| Device Type | # Households | % Households |
| Desktop or Laptop | 383 | 65.7% |
| Smartphone | 445 | 76.3% |
| Tablet | 277 | 47.5% |
| No Computing Device | 62 | 10.6% |
| Total | 583 | 100.0% |
Internet Access in Monette
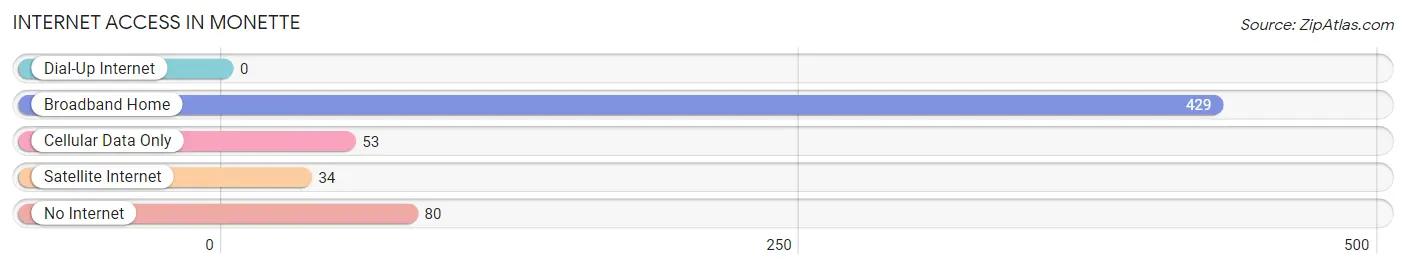
| Internet Type | # Households | % Households |
| Dial-Up Internet | 0 | 0.0% |
| Broadband Home | 429 | 73.6% |
| Cellular Data Only | 53 | 9.1% |
| Satellite Internet | 34 | 5.8% |
| No Internet | 80 | 13.7% |
| Total | 583 | 100.0% |
Monette Summary
Monette, Arkansas is a small town located in the northeastern corner of the state, in Mississippi County. It is situated on the banks of the St. Francis River, and is home to a population of just over 1,000 people. The town was founded in 1883, and has a rich history of farming, logging, and other industries.
Geography
Monette is located in the northeast corner of Arkansas, in Mississippi County. It is situated on the banks of the St. Francis River, and is surrounded by the towns of Manila, Leachville, and Black Oak. The town is located in the Mississippi Alluvial Plain, which is a flat, fertile region of the state. The climate in Monette is humid subtropical, with hot, humid summers and mild winters.
Economy
Monette’s economy is largely based on agriculture and manufacturing. The town is home to several large farms, which produce cotton, soybeans, corn, and other crops. There are also several manufacturing plants in the area, which produce a variety of products, including furniture, clothing, and automotive parts. In addition, Monette is home to several small businesses, including restaurants, shops, and other services.
Demographics
As of the 2010 census, Monette had a population of 1,072 people. The racial makeup of the town was 95.2% White, 0.7% African American, 0.3% Native American, 0.2% Asian, 0.1% Pacific Islander, and 3.5% from other races. The median household income in Monette was $30,938, and the median age was 40.7 years.
History
Monette was founded in 1883 by a group of settlers from Tennessee. The town was named after the wife of one of the settlers, Mary Monette. The town quickly grew, and by the early 1900s, it had become a thriving agricultural center. The town was also home to several sawmills and other industries.
In the 1950s, Monette began to decline, as many of the town’s industries moved away. However, the town has since seen a resurgence, and is now home to several small businesses and farms. Monette is also home to a number of historic sites, including the Monette Depot, which was built in 1883, and the Monette Cemetery, which dates back to the 1800s.
Monette is a small town with a rich history and a bright future. It is home to a diverse population, and is a great place to live and work. The town is surrounded by beautiful scenery, and is a great place to explore and enjoy the outdoors. Monette is a great place to call home.
Common Questions
What is Per Capita Income in Monette?
Per Capita income in Monette is $30,386.
What is the Median Family Income in Monette?
Median Family Income in Monette is $78,000.
What is the Median Household income in Monette?
Median Household Income in Monette is $47,684.
What is Income or Wage Gap in Monette?
Income or Wage Gap in Monette is 1.2%.
Women in Monette earn 98.8 cents for every dollar earned by a man.
What is Inequality or Gini Index in Monette?
Inequality or Gini Index in Monette is 0.43.
What is the Total Population of Monette?
Total Population of Monette is 1,346.
What is the Total Male Population of Monette?
Total Male Population of Monette is 654.
What is the Total Female Population of Monette?
Total Female Population of Monette is 692.
What is the Ratio of Males per 100 Females in Monette?
There are 94.51 Males per 100 Females in Monette.
What is the Ratio of Females per 100 Males in Monette?
There are 105.81 Females per 100 Males in Monette.
What is the Median Population Age in Monette?
Median Population Age in Monette is 46.9 Years.
What is the Average Family Size in Monette
Average Family Size in Monette is 2.7 People.
What is the Average Household Size in Monette
Average Household Size in Monette is 2.2 People.
How Large is the Labor Force in Monette?
There are 596 People in the Labor Forcein in Monette.
What is the Percentage of People in the Labor Force in Monette?
52.2% of People are in the Labor Force in Monette.
What is the Unemployment Rate in Monette?
Unemployment Rate in Monette is 4.6%.