Minturn, AR Map & Demographics
Minturn Map
Minturn Overview
$22,420
PER CAPITA INCOME
$53,750
AVG HOUSEHOLD INCOME
0.31
INEQUALITY / GINI INDEX
41
TOTAL POPULATION
18
MALE POPULATION
23
FEMALE POPULATION
78.26
MALES / 100 FEMALES
127.78
FEMALES / 100 MALES
46.2
MEDIAN AGE
2.8
AVG FAMILY SIZE
2.4
AVG HOUSEHOLD SIZE
24
LABOR FORCE [ PEOPLE ]
72.7%
PERCENT IN LABOR FORCE
29.2%
UNEMPLOYMENT RATE
Minturn Zip Codes
Minturn Area Codes
Income in Minturn
Income Overview in Minturn
| Characteristic | Number | Measure |
| Per Capita Income | 41 | $22,420 |
| Median Family Income | 11 | $0 |
| Mean Family Income | 11 | $49,673 |
| Median Household Income | 17 | $53,750 |
| Mean Household Income | 17 | $53,359 |
| Income Deficit | 11 | $0 |
| Wage / Income Gap (%) | 41 | 0.00% |
| Wage / Income Gap ($) | 41 | 100.00¢ per $1 |
| Gini / Inequality Index | 41 | 0.31 |
Earnings by Sex in Minturn
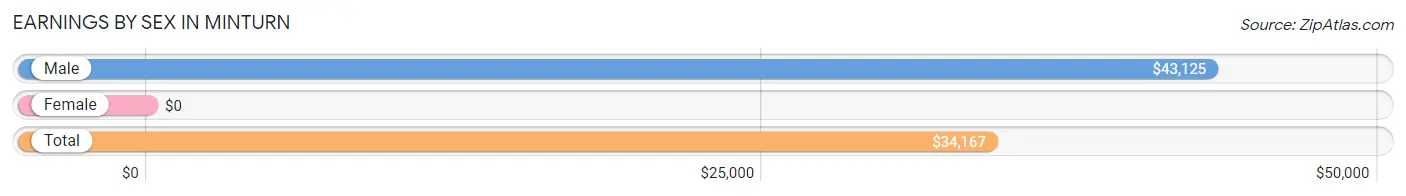
| Sex | Number | Average Earnings |
| Male | 11 (45.8%) | $43,125 |
| Female | 13 (54.2%) | $0 |
| Total | 24 (100.0%) | $34,167 |
Earnings by Sex by Income Bracket in Minturn
The most common earnings brackets in Minturn are $40,000 to $44,999 for men (5 | 45.5%) and $2,499 or less for women (3 | 23.1%).
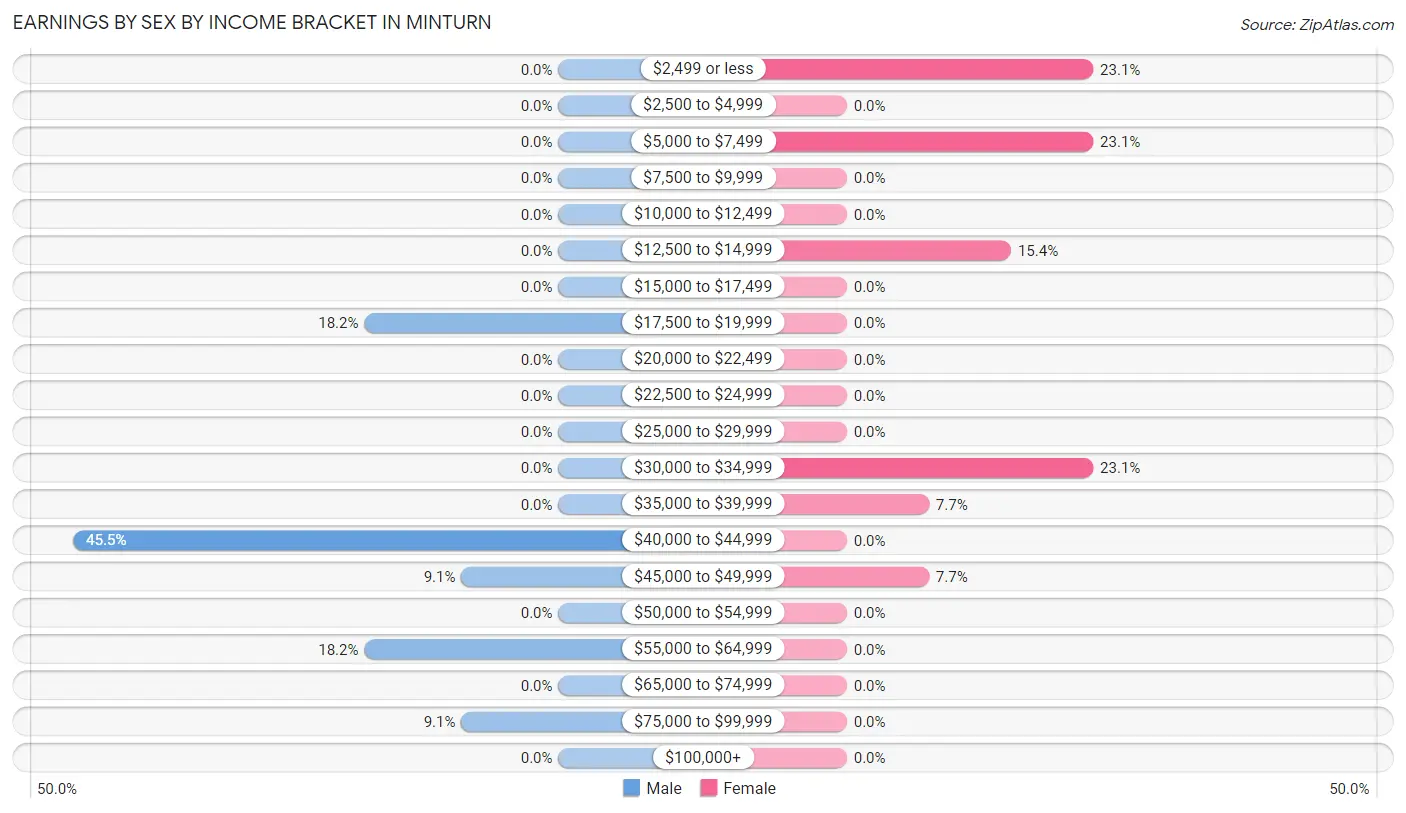
| Income | Male | Female |
| $2,499 or less | 0 (0.0%) | 3 (23.1%) |
| $2,500 to $4,999 | 0 (0.0%) | 0 (0.0%) |
| $5,000 to $7,499 | 0 (0.0%) | 3 (23.1%) |
| $7,500 to $9,999 | 0 (0.0%) | 0 (0.0%) |
| $10,000 to $12,499 | 0 (0.0%) | 0 (0.0%) |
| $12,500 to $14,999 | 0 (0.0%) | 2 (15.4%) |
| $15,000 to $17,499 | 0 (0.0%) | 0 (0.0%) |
| $17,500 to $19,999 | 2 (18.2%) | 0 (0.0%) |
| $20,000 to $22,499 | 0 (0.0%) | 0 (0.0%) |
| $22,500 to $24,999 | 0 (0.0%) | 0 (0.0%) |
| $25,000 to $29,999 | 0 (0.0%) | 0 (0.0%) |
| $30,000 to $34,999 | 0 (0.0%) | 3 (23.1%) |
| $35,000 to $39,999 | 0 (0.0%) | 1 (7.7%) |
| $40,000 to $44,999 | 5 (45.5%) | 0 (0.0%) |
| $45,000 to $49,999 | 1 (9.1%) | 1 (7.7%) |
| $50,000 to $54,999 | 0 (0.0%) | 0 (0.0%) |
| $55,000 to $64,999 | 2 (18.2%) | 0 (0.0%) |
| $65,000 to $74,999 | 0 (0.0%) | 0 (0.0%) |
| $75,000 to $99,999 | 1 (9.1%) | 0 (0.0%) |
| $100,000+ | 0 (0.0%) | 0 (0.0%) |
| Total | 11 (100.0%) | 13 (100.0%) |
Earnings by Sex by Educational Attainment in Minturn
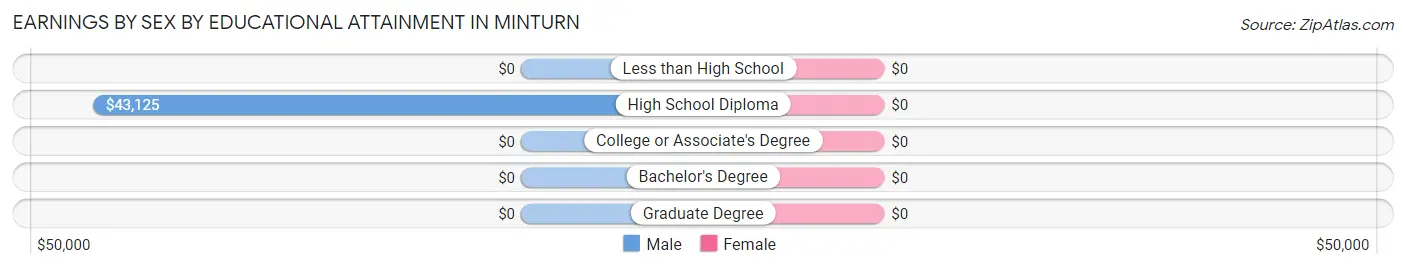
| Educational Attainment | Male Income | Female Income |
| Less than High School | - | - |
| High School Diploma | $43,125 | $0 |
| College or Associate's Degree | - | - |
| Bachelor's Degree | - | - |
| Graduate Degree | - | - |
| Total | $43,125 | $0 |
Family Income in Minturn
Family Income Brackets in Minturn
According to the Minturn family income data, there are 3 families falling into the $15,000 to $24,999 income range, which is the most common income bracket and makes up 27.3% of all families.
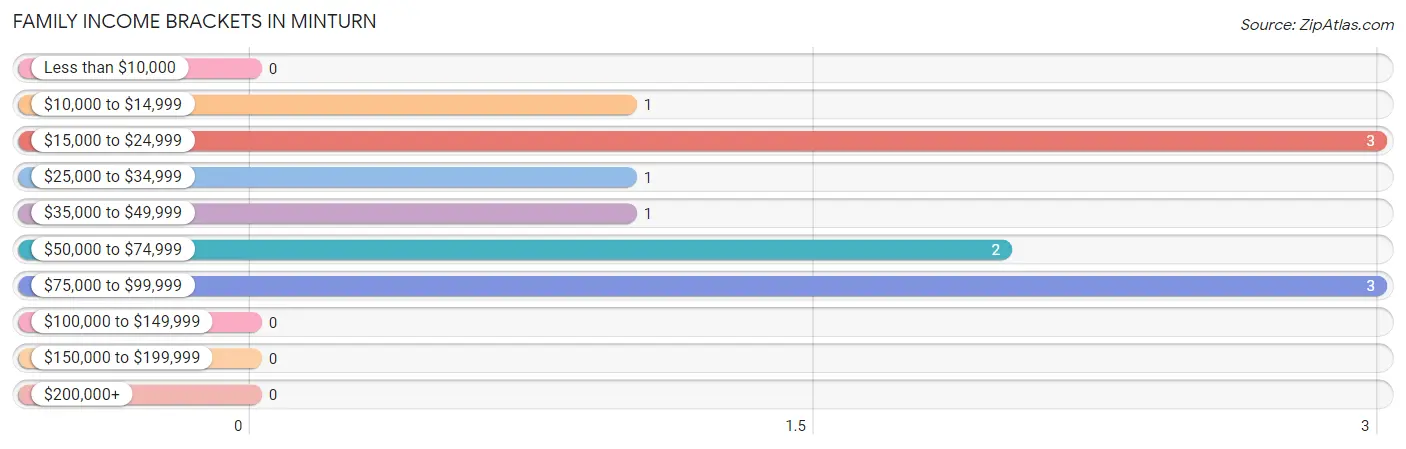
| Income Bracket | # Families | % Families |
| Less than $10,000 | 0 | 0.0% |
| $10,000 to $14,999 | 1 | 9.1% |
| $15,000 to $24,999 | 3 | 27.3% |
| $25,000 to $34,999 | 1 | 9.1% |
| $35,000 to $49,999 | 1 | 9.1% |
| $50,000 to $74,999 | 2 | 18.2% |
| $75,000 to $99,999 | 3 | 27.3% |
| $100,000 to $149,999 | 0 | 0.0% |
| $150,000 to $199,999 | 0 | 0.0% |
| $200,000+ | 0 | 0.0% |
Family Income by Famaliy Size in Minturn
2-person families (6 | 54.5%) account for the highest median family income in Minturn with $46,250 per family, while 2-person families (6 | 54.5%) have the highest median income of $23,125 per family member.
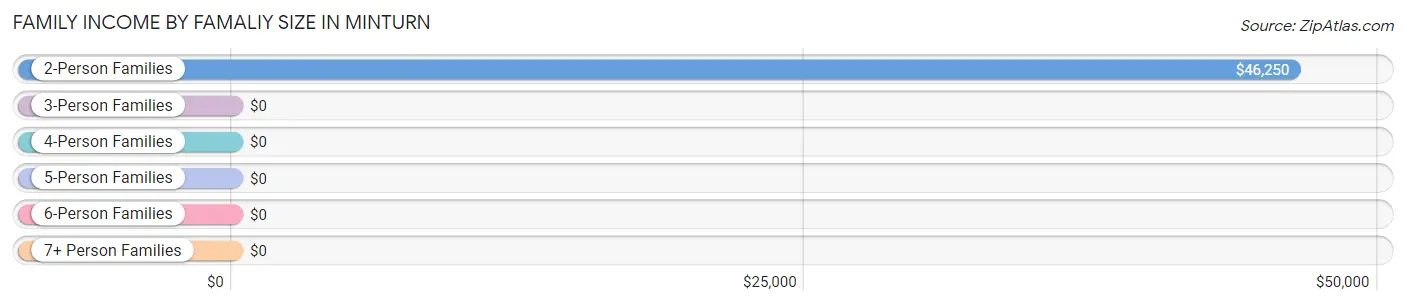
| Income Bracket | # Families | Median Income |
| 2-Person Families | 6 (54.5%) | $46,250 |
| 3-Person Families | 1 (9.1%) | $0 |
| 4-Person Families | 4 (36.4%) | $0 |
| 5-Person Families | 0 (0.0%) | $0 |
| 6-Person Families | 0 (0.0%) | $0 |
| 7+ Person Families | 0 (0.0%) | $0 |
| Total | 11 (100.0%) | $0 |
Family Income by Number of Earners in Minturn
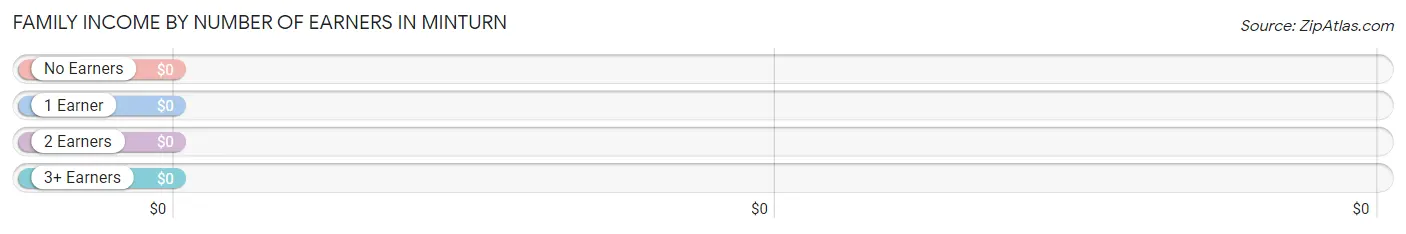
| Number of Earners | # Families | Median Income |
| No Earners | 2 (18.2%) | $0 |
| 1 Earner | 3 (27.3%) | $0 |
| 2 Earners | 6 (54.5%) | $0 |
| 3+ Earners | 0 (0.0%) | $0 |
| Total | 11 (100.0%) | $0 |
Household Income in Minturn
Household Income Brackets in Minturn
With 5 households falling in the category, the $50,000 to $74,999 income range is the most frequent in Minturn, accounting for 29.4% of all households.
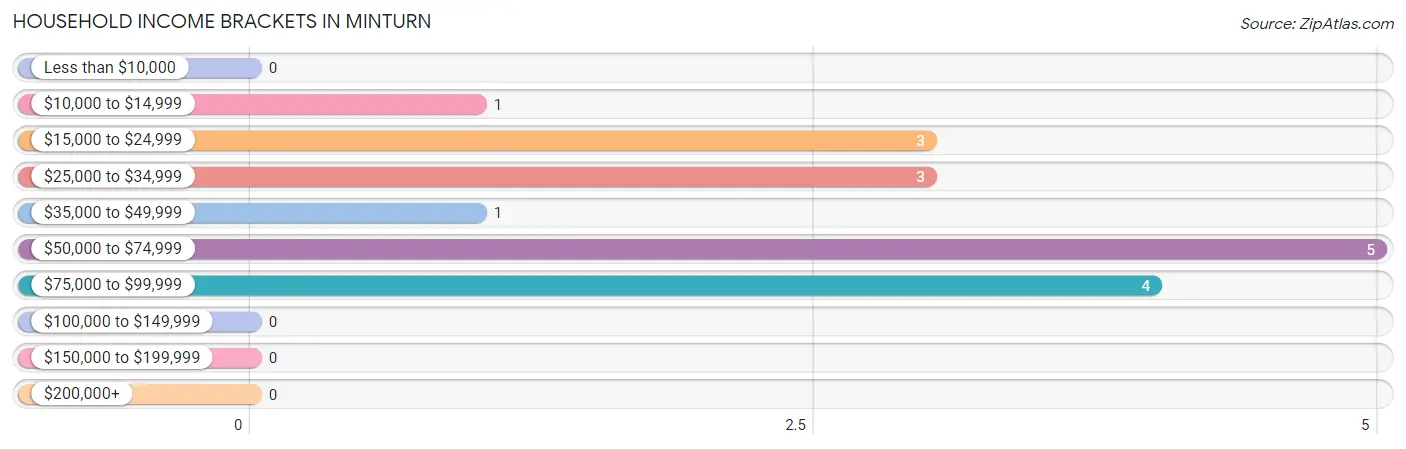
| Income Bracket | # Households | % Households |
| Less than $10,000 | 0 | 0.0% |
| $10,000 to $14,999 | 1 | 5.9% |
| $15,000 to $24,999 | 3 | 17.6% |
| $25,000 to $34,999 | 3 | 17.6% |
| $35,000 to $49,999 | 1 | 5.9% |
| $50,000 to $74,999 | 5 | 29.4% |
| $75,000 to $99,999 | 4 | 23.5% |
| $100,000 to $149,999 | 0 | 0.0% |
| $150,000 to $199,999 | 0 | 0.0% |
| $200,000+ | 0 | 0.0% |
Household Income by Householder Age in Minturn
The median household income in Minturn is $53,750, with the highest median household income of $31,250 found in the 65+ years age bracket for the primary householder. A total of 7 households (41.2%) fall into this category.
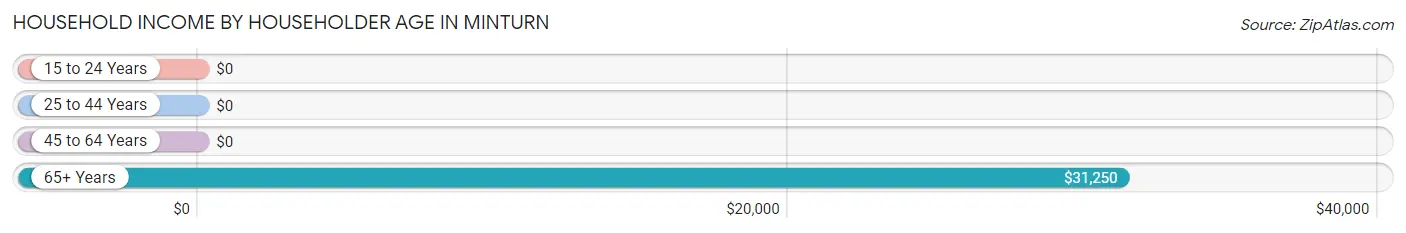
| Income Bracket | # Households | Median Income |
| 15 to 24 Years | 0 (0.0%) | $0 |
| 25 to 44 Years | 5 (29.4%) | $0 |
| 45 to 64 Years | 5 (29.4%) | $0 |
| 65+ Years | 7 (41.2%) | $31,250 |
| Total | 17 (100.0%) | $53,750 |
Poverty in Minturn
Income Below Poverty by Sex and Age in Minturn
With 16.7% poverty level for males and 34.8% for females among the residents of Minturn, 25 to 34 year old males and under 5 year old females are the most vulnerable to poverty, with 2 males (40.0%) and 2 females (100.0%) in their respective age groups living below the poverty level.
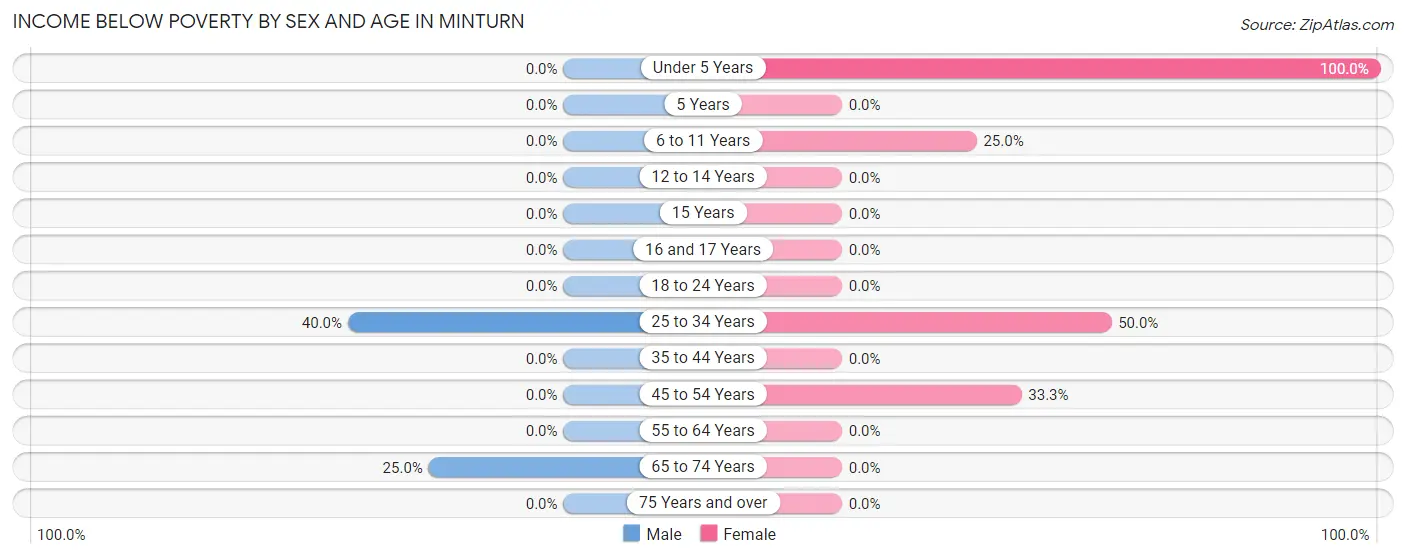
| Age Bracket | Male | Female |
| Under 5 Years | 0 (0.0%) | 2 (100.0%) |
| 5 Years | 0 (0.0%) | 0 (0.0%) |
| 6 to 11 Years | 0 (0.0%) | 1 (25.0%) |
| 12 to 14 Years | 0 (0.0%) | 0 (0.0%) |
| 15 Years | 0 (0.0%) | 0 (0.0%) |
| 16 and 17 Years | 0 (0.0%) | 0 (0.0%) |
| 18 to 24 Years | 0 (0.0%) | 0 (0.0%) |
| 25 to 34 Years | 2 (40.0%) | 3 (50.0%) |
| 35 to 44 Years | 0 (0.0%) | 0 (0.0%) |
| 45 to 54 Years | 0 (0.0%) | 2 (33.3%) |
| 55 to 64 Years | 0 (0.0%) | 0 (0.0%) |
| 65 to 74 Years | 1 (25.0%) | 0 (0.0%) |
| 75 Years and over | 0 (0.0%) | 0 (0.0%) |
| Total | 3 (16.7%) | 8 (34.8%) |
Income Above Poverty by Sex and Age in Minturn
According to the poverty statistics in Minturn, males aged under 5 years and females aged 65 to 74 years are the age groups that are most secure financially, with 100.0% of males and 100.0% of females in these age groups living above the poverty line.
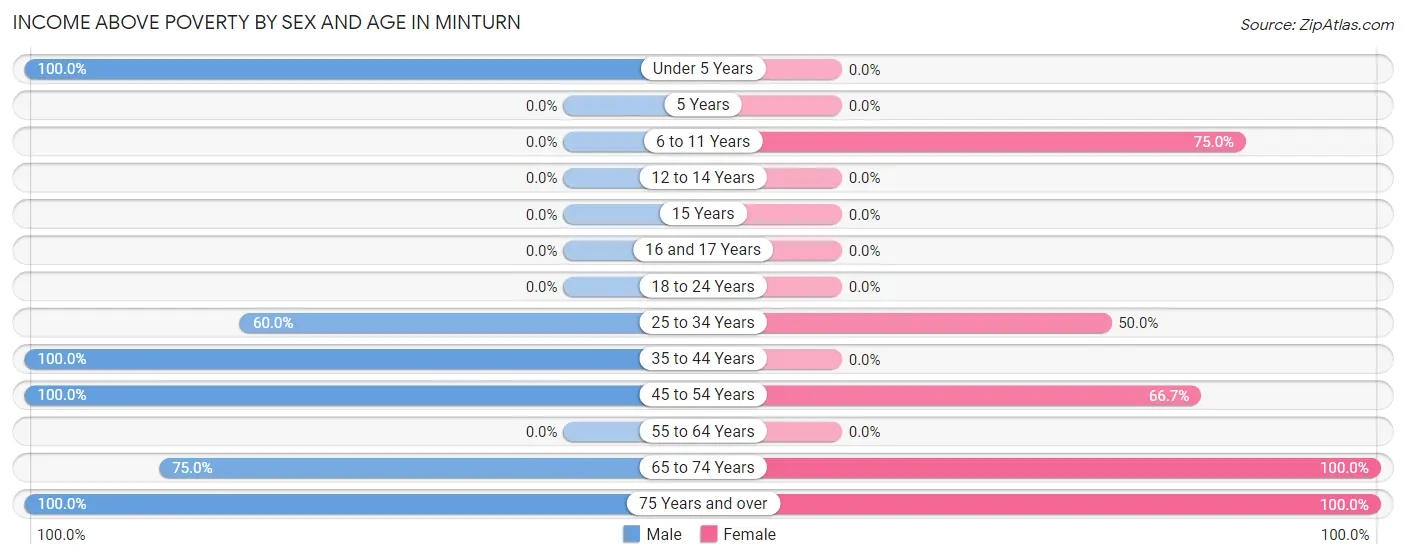
| Age Bracket | Male | Female |
| Under 5 Years | 2 (100.0%) | 0 (0.0%) |
| 5 Years | 0 (0.0%) | 0 (0.0%) |
| 6 to 11 Years | 0 (0.0%) | 3 (75.0%) |
| 12 to 14 Years | 0 (0.0%) | 0 (0.0%) |
| 15 Years | 0 (0.0%) | 0 (0.0%) |
| 16 and 17 Years | 0 (0.0%) | 0 (0.0%) |
| 18 to 24 Years | 0 (0.0%) | 0 (0.0%) |
| 25 to 34 Years | 3 (60.0%) | 3 (50.0%) |
| 35 to 44 Years | 1 (100.0%) | 0 (0.0%) |
| 45 to 54 Years | 5 (100.0%) | 4 (66.7%) |
| 55 to 64 Years | 0 (0.0%) | 0 (0.0%) |
| 65 to 74 Years | 3 (75.0%) | 2 (100.0%) |
| 75 Years and over | 1 (100.0%) | 3 (100.0%) |
| Total | 15 (83.3%) | 15 (65.2%) |
Income Below Poverty Among Married-Couple Families in Minturn
The poverty statistics for married-couple families in Minturn show that 40.0% or 4 of the total 10 families live below the poverty line. Families with 1 or 2 children have the highest poverty rate of 75.0%, comprising of 3 families. On the other hand, families with no children have the lowest poverty rate of 16.7%, which includes 1 families.
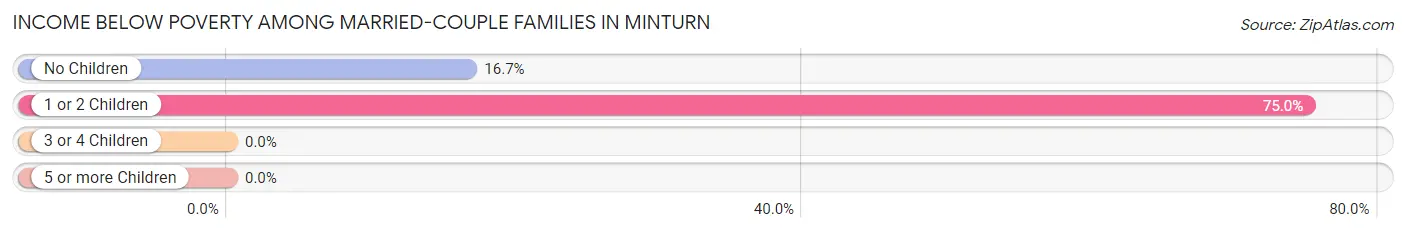
| Children | Above Poverty | Below Poverty |
| No Children | 5 (83.3%) | 1 (16.7%) |
| 1 or 2 Children | 1 (25.0%) | 3 (75.0%) |
| 3 or 4 Children | 0 (0.0%) | 0 (0.0%) |
| 5 or more Children | 0 (0.0%) | 0 (0.0%) |
| Total | 6 (60.0%) | 4 (40.0%) |
Income Below Poverty Among Single-Parent Households in Minturn
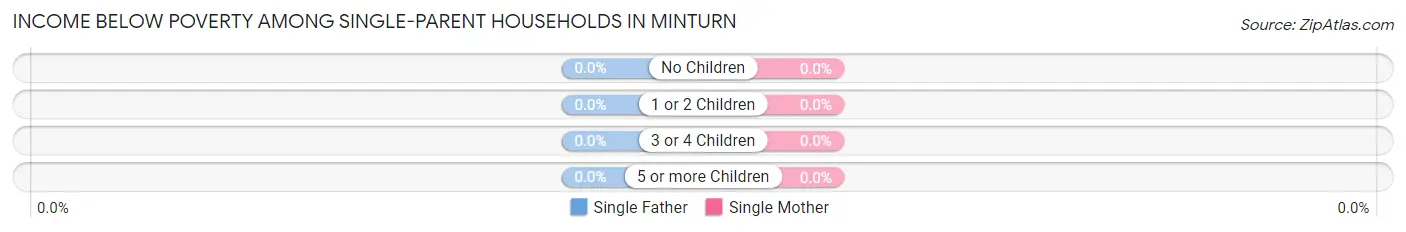
| Children | Single Father | Single Mother |
| No Children | 0 (0.0%) | 0 (0.0%) |
| 1 or 2 Children | 0 (0.0%) | 0 (0.0%) |
| 3 or 4 Children | 0 (0.0%) | 0 (0.0%) |
| 5 or more Children | 0 (0.0%) | 0 (0.0%) |
| Total | 0 (0.0%) | 0 (0.0%) |
Income Below Poverty Among Married-Couple vs Single-Parent Households in Minturn
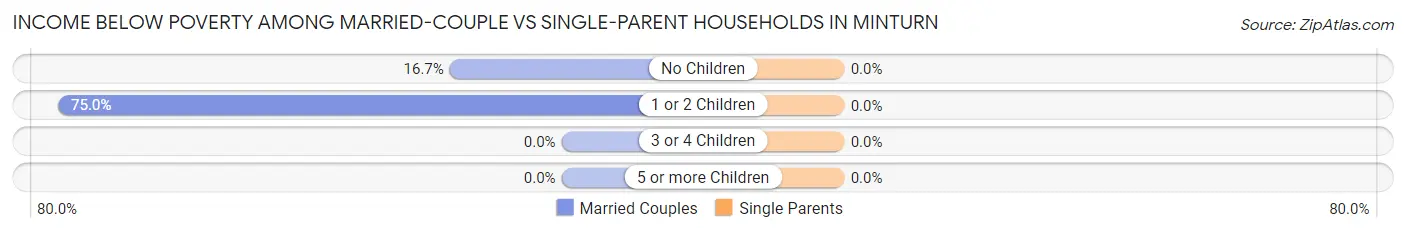
| Children | Married-Couple Families | Single-Parent Households |
| No Children | 1 (16.7%) | 0 (0.0%) |
| 1 or 2 Children | 3 (75.0%) | 0 (0.0%) |
| 3 or 4 Children | 0 (0.0%) | 0 (0.0%) |
| 5 or more Children | 0 (0.0%) | 0 (0.0%) |
| Total | 4 (40.0%) | 0 (0.0%) |
Race in Minturn
The most populous races in Minturn are , and White / Caucasian (41 | 100.0%).
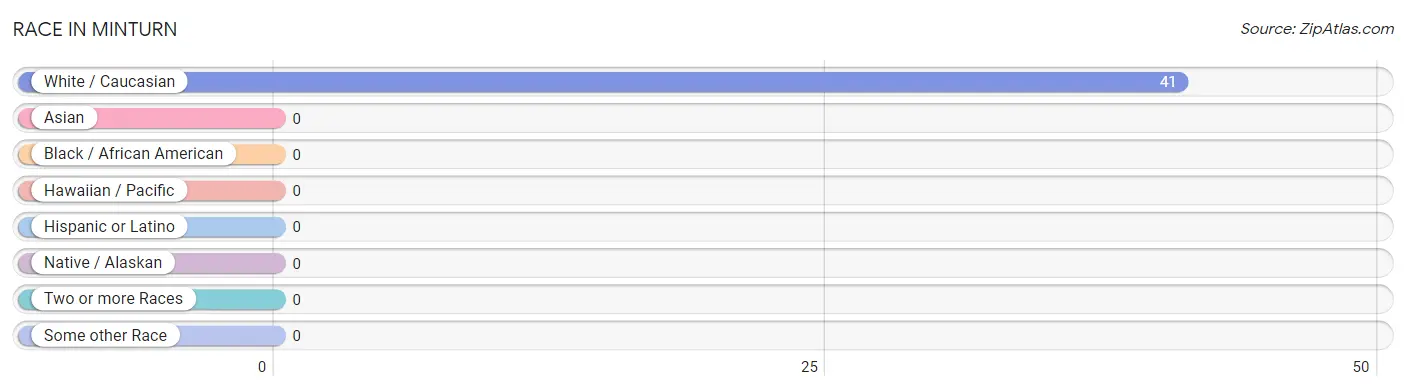
| Race | # Population | % Population |
| Asian | 0 | 0.0% |
| Black / African American | 0 | 0.0% |
| Hawaiian / Pacific | 0 | 0.0% |
| Hispanic or Latino | 0 | 0.0% |
| Native / Alaskan | 0 | 0.0% |
| White / Caucasian | 41 | 100.0% |
| Two or more Races | 0 | 0.0% |
| Some other Race | 0 | 0.0% |
| Total | 41 | 100.0% |
Ancestry in Minturn
The most populous ancestries reported in Minturn are German (12 | 29.3%), American (10 | 24.4%), and Irish (4 | 9.8%), together accounting for 63.4% of all Minturn residents.
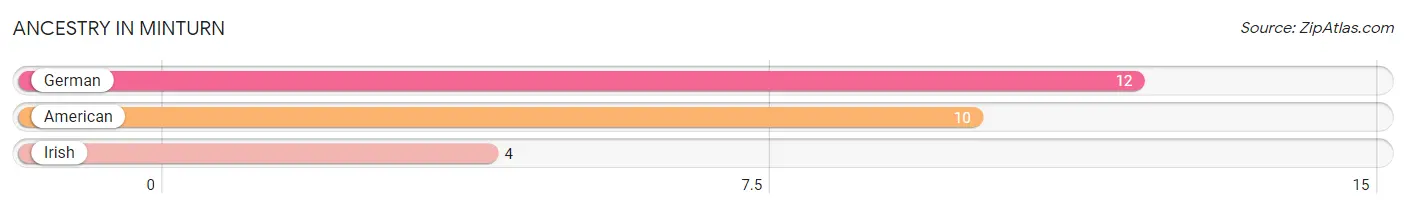
| Ancestry | # Population | % Population |
| American | 10 | 24.4% |
| German | 12 | 29.3% |
| Irish | 4 | 9.8% | View All 3 Rows |
Immigrants in Minturn

| Immigration Origin | # Population | % Population | View All 0 Rows |
Sex and Age in Minturn
Sex and Age in Minturn
The most populous age groups in Minturn are 50 to 54 Years (5 | 27.8%) for men and 30 to 34 Years (6 | 26.1%) for women.
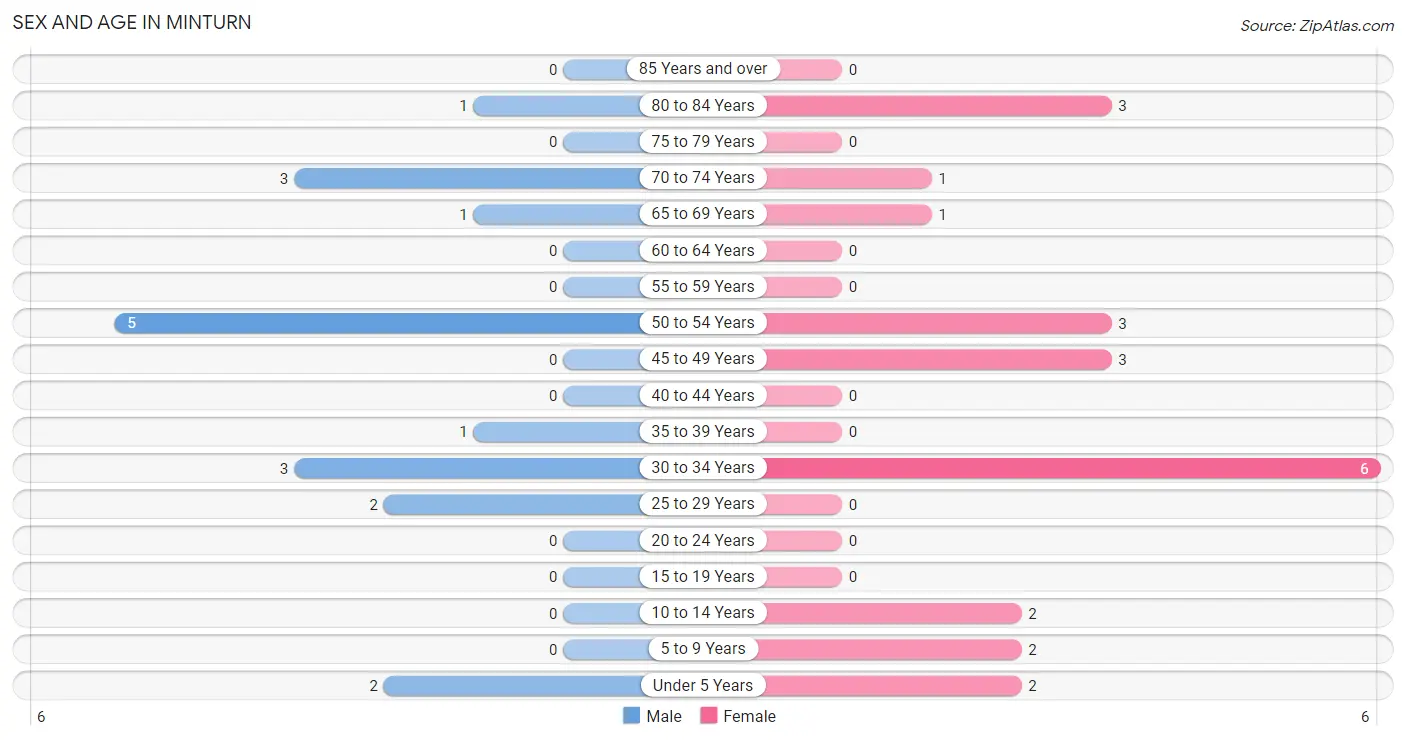
| Age Bracket | Male | Female |
| Under 5 Years | 2 (11.1%) | 2 (8.7%) |
| 5 to 9 Years | 0 (0.0%) | 2 (8.7%) |
| 10 to 14 Years | 0 (0.0%) | 2 (8.7%) |
| 15 to 19 Years | 0 (0.0%) | 0 (0.0%) |
| 20 to 24 Years | 0 (0.0%) | 0 (0.0%) |
| 25 to 29 Years | 2 (11.1%) | 0 (0.0%) |
| 30 to 34 Years | 3 (16.7%) | 6 (26.1%) |
| 35 to 39 Years | 1 (5.6%) | 0 (0.0%) |
| 40 to 44 Years | 0 (0.0%) | 0 (0.0%) |
| 45 to 49 Years | 0 (0.0%) | 3 (13.0%) |
| 50 to 54 Years | 5 (27.8%) | 3 (13.0%) |
| 55 to 59 Years | 0 (0.0%) | 0 (0.0%) |
| 60 to 64 Years | 0 (0.0%) | 0 (0.0%) |
| 65 to 69 Years | 1 (5.6%) | 1 (4.3%) |
| 70 to 74 Years | 3 (16.7%) | 1 (4.3%) |
| 75 to 79 Years | 0 (0.0%) | 0 (0.0%) |
| 80 to 84 Years | 1 (5.6%) | 3 (13.0%) |
| 85 Years and over | 0 (0.0%) | 0 (0.0%) |
| Total | 18 (100.0%) | 23 (100.0%) |
Families and Households in Minturn
Median Family Size in Minturn
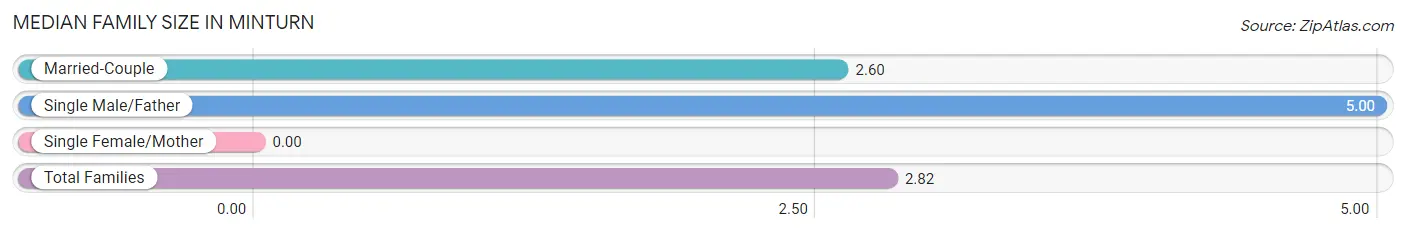
| Family Type | # Families | Family Size |
| Married-Couple | 10 (90.9%) | 2.60 |
| Single Male/Father | 1 (9.1%) | 5.00 |
| Single Female/Mother | 0 (0.0%) | - |
| Total Families | 11 (100.0%) | 2.82 |
Median Household Size in Minturn
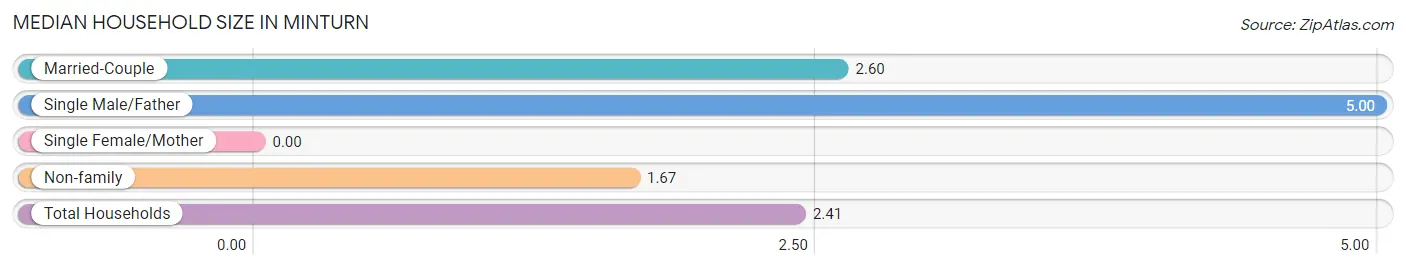
| Household Type | # Households | Household Size |
| Married-Couple | 10 (58.8%) | 2.60 |
| Single Male/Father | 1 (5.9%) | 5.00 |
| Single Female/Mother | 0 (0.0%) | - |
| Non-family | 6 (35.3%) | 1.67 |
| Total Households | 17 (100.0%) | 2.41 |
Household Size by Marriage Status in Minturn
Out of a total of 17 households in Minturn, 11 (64.7%) are family households, while 6 (35.3%) are nonfamily households. The most numerous type of family households are 2-person households, comprising 6, and the most common type of nonfamily households are 2-person households, comprising 4.
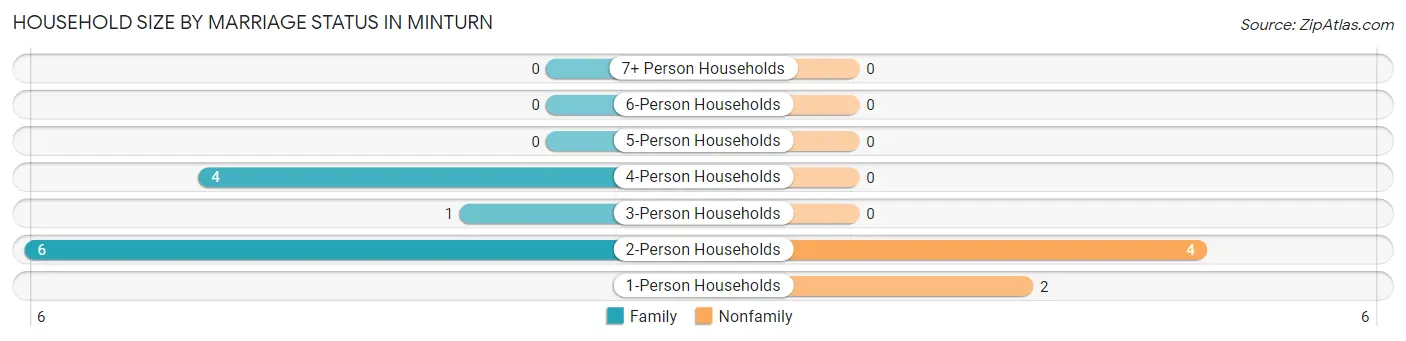
| Household Size | Family Households | Nonfamily Households |
| 1-Person Households | - | 2 (11.8%) |
| 2-Person Households | 6 (35.3%) | 4 (23.5%) |
| 3-Person Households | 1 (5.9%) | 0 (0.0%) |
| 4-Person Households | 4 (23.5%) | 0 (0.0%) |
| 5-Person Households | 0 (0.0%) | 0 (0.0%) |
| 6-Person Households | 0 (0.0%) | 0 (0.0%) |
| 7+ Person Households | 0 (0.0%) | 0 (0.0%) |
| Total | 11 (64.7%) | 6 (35.3%) |
Female Fertility in Minturn
Fertility by Age in Minturn
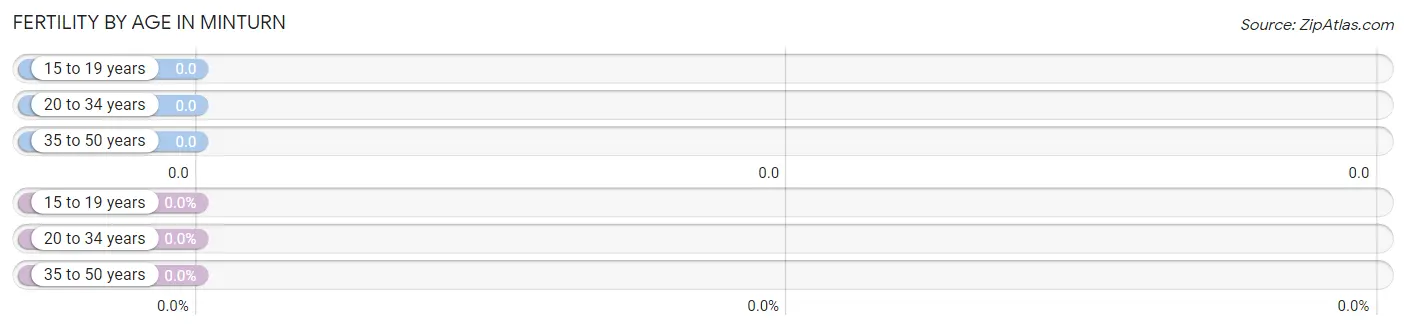
| Age Bracket | Women with Births | Births / 1,000 Women |
| 15 to 19 years | 0 (0.0%) | 0.0 |
| 20 to 34 years | 0 (0.0%) | 0.0 |
| 35 to 50 years | 0 (0.0%) | 0.0 |
| Total | 0 (0.0%) | 0.0 |
Fertility by Age by Marriage Status in Minturn
| Age Bracket | Married | Unmarried |
| 15 to 19 years | 0 (0.0%) | 0 (0.0%) |
| 20 to 34 years | 0 (0.0%) | 0 (0.0%) |
| 35 to 50 years | 0 (0.0%) | 0 (0.0%) |
| Total | 0 (0.0%) | 0 (0.0%) |
Fertility by Education in Minturn
| Educational Attainment | Women with Births | Births / 1,000 Women |
| Less than High School | 0 (0.0%) | 0.0 |
| High School Diploma | 0 (0.0%) | 0.0 |
| College or Associate's Degree | 0 (0.0%) | 0.0 |
| Bachelor's Degree | 0 (0.0%) | 0.0 |
| Graduate Degree | 0 (0.0%) | 0.0 |
| Total | 0 (0.0%) | 0.0 |
Fertility by Education by Marriage Status in Minturn
| Educational Attainment | Married | Unmarried |
| Less than High School | 0 (0.0%) | 0 (0.0%) |
| High School Diploma | 0 (0.0%) | 0 (0.0%) |
| College or Associate's Degree | 0 (0.0%) | 0 (0.0%) |
| Bachelor's Degree | 0 (0.0%) | 0 (0.0%) |
| Graduate Degree | 0 (0.0%) | 0 (0.0%) |
| Total | 0 (0.0%) | 0 (0.0%) |
Employment Characteristics in Minturn
Employment by Class of Employer in Minturn
Among the 17 employed individuals in Minturn, private company employees (12 | 70.6%), state government employees (2 | 11.8%), and self-employed (incorporated) (1 | 5.9%) make up the most common classes of employment.
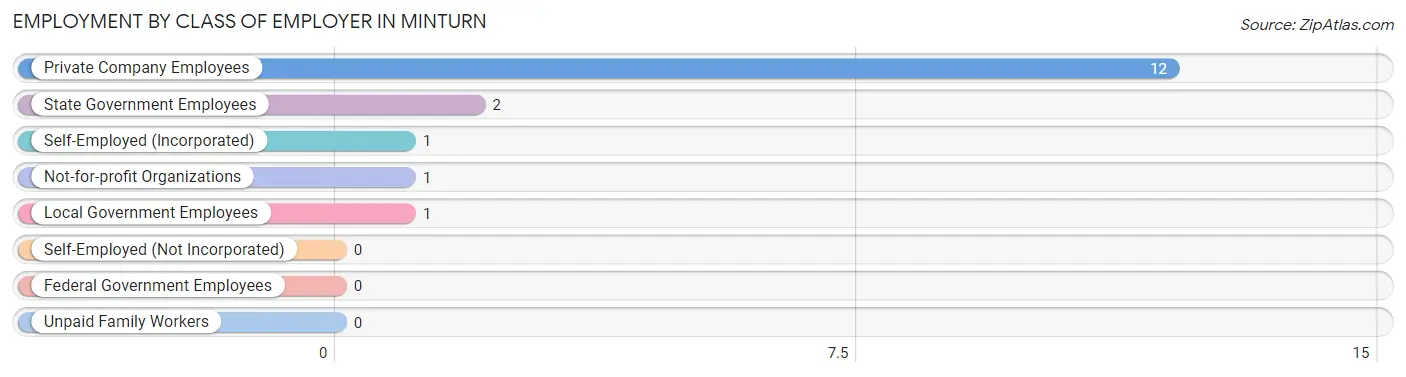
| Employer Class | # Employees | % Employees |
| Private Company Employees | 12 | 70.6% |
| Self-Employed (Incorporated) | 1 | 5.9% |
| Self-Employed (Not Incorporated) | 0 | 0.0% |
| Not-for-profit Organizations | 1 | 5.9% |
| Local Government Employees | 1 | 5.9% |
| State Government Employees | 2 | 11.8% |
| Federal Government Employees | 0 | 0.0% |
| Unpaid Family Workers | 0 | 0.0% |
| Total | 17 | 100.0% |
Employment Status by Age in Minturn
According to the labor force statistics for Minturn, out of the total population over 16 years of age (33), 72.7% or 24 individuals are in the labor force, with 29.2% or 7 of them unemployed. The age group with the highest labor force participation rate is 25 to 29 years, with 100.0% or 2 individuals in the labor force. Within the labor force, the 25 to 29 years age range has the highest percentage of unemployed individuals, with 100.0% or 2 of them being unemployed.
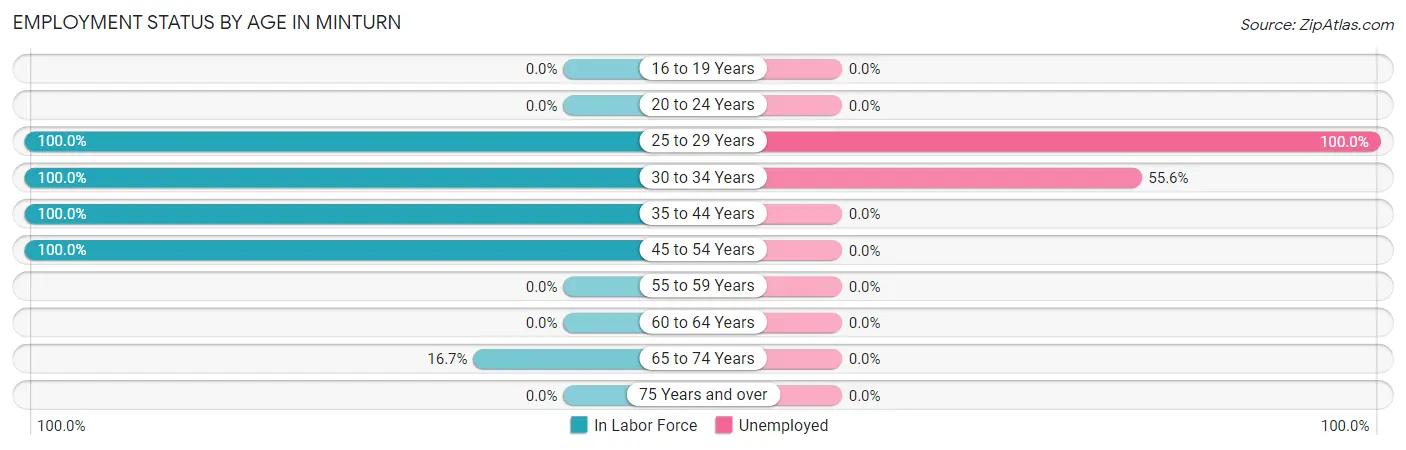
| Age Bracket | In Labor Force | Unemployed |
| 16 to 19 Years | 0 (0.0%) | 0 (0.0%) |
| 20 to 24 Years | 0 (0.0%) | 0 (0.0%) |
| 25 to 29 Years | 2 (100.0%) | 2 (100.0%) |
| 30 to 34 Years | 9 (100.0%) | 5 (55.6%) |
| 35 to 44 Years | 1 (100.0%) | 0 (0.0%) |
| 45 to 54 Years | 11 (100.0%) | 0 (0.0%) |
| 55 to 59 Years | 0 (0.0%) | 0 (0.0%) |
| 60 to 64 Years | 0 (0.0%) | 0 (0.0%) |
| 65 to 74 Years | 1 (16.7%) | 0 (0.0%) |
| 75 Years and over | 0 (0.0%) | 0 (0.0%) |
| Total | 24 (72.7%) | 7 (29.2%) |
Employment Status by Educational Attainment in Minturn
According to labor force statistics for Minturn, 100.0% of individuals (23) out of the total population between 25 and 64 years of age (23) are in the labor force, with 30.4% or 7 of them being unemployed. The group with the highest labor force participation rate are those with the educational attainment of less than high school, with 100.0% or 1 individuals in the labor force. Within the labor force, individuals with college / associate degree education have the highest percentage of unemployment, with 50.0% or 2 of them being unemployed.
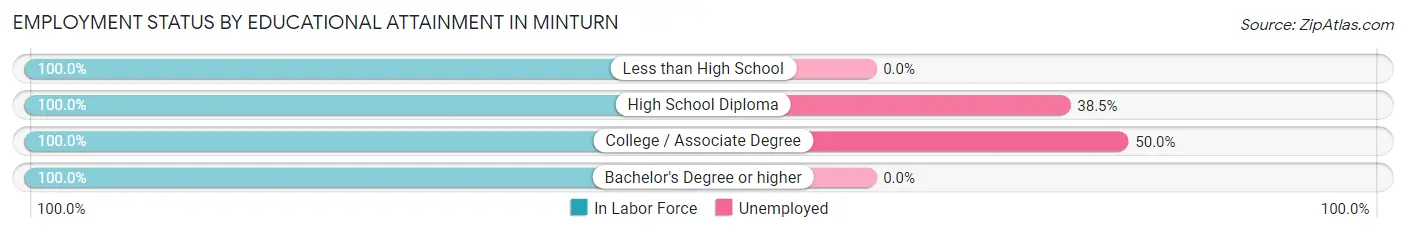
| Educational Attainment | In Labor Force | Unemployed |
| Less than High School | 1 (100.0%) | 0 (0.0%) |
| High School Diploma | 13 (100.0%) | 5 (38.5%) |
| College / Associate Degree | 4 (100.0%) | 2 (50.0%) |
| Bachelor's Degree or higher | 5 (100.0%) | 0 (0.0%) |
| Total | 23 (100.0%) | 7 (30.4%) |
Employment Occupations by Sex in Minturn
Management, Business, Science and Arts Occupations
The most common Management, Business, Science and Arts occupations in Minturn are Community & Social Service (3 | 17.6%), Education Instruction & Library (3 | 17.6%), Management (2 | 11.8%), Computers, Engineering & Science (1 | 5.9%), and Architecture & Engineering (1 | 5.9%).
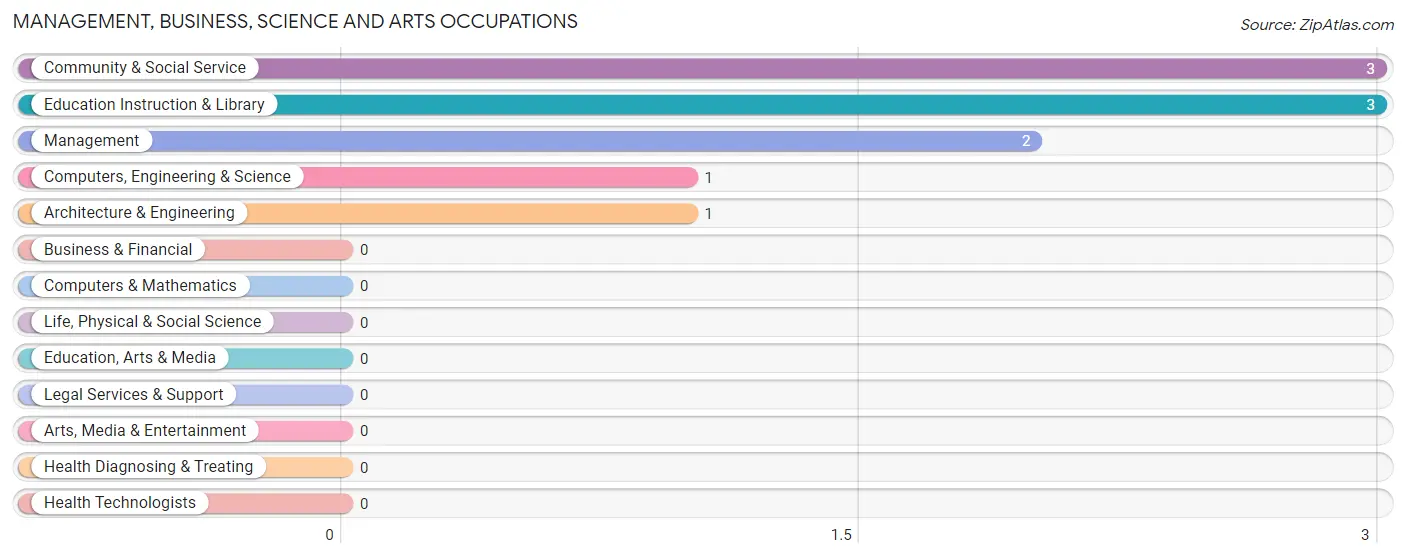
Management, Business, Science and Arts Occupations by Sex
Within the Management, Business, Science and Arts occupations in Minturn, the most male-oriented occupations are Computers, Engineering & Science (100.0%), and Architecture & Engineering (100.0%), while the most female-oriented occupations are Management (100.0%), Community & Social Service (100.0%), and Education Instruction & Library (100.0%).
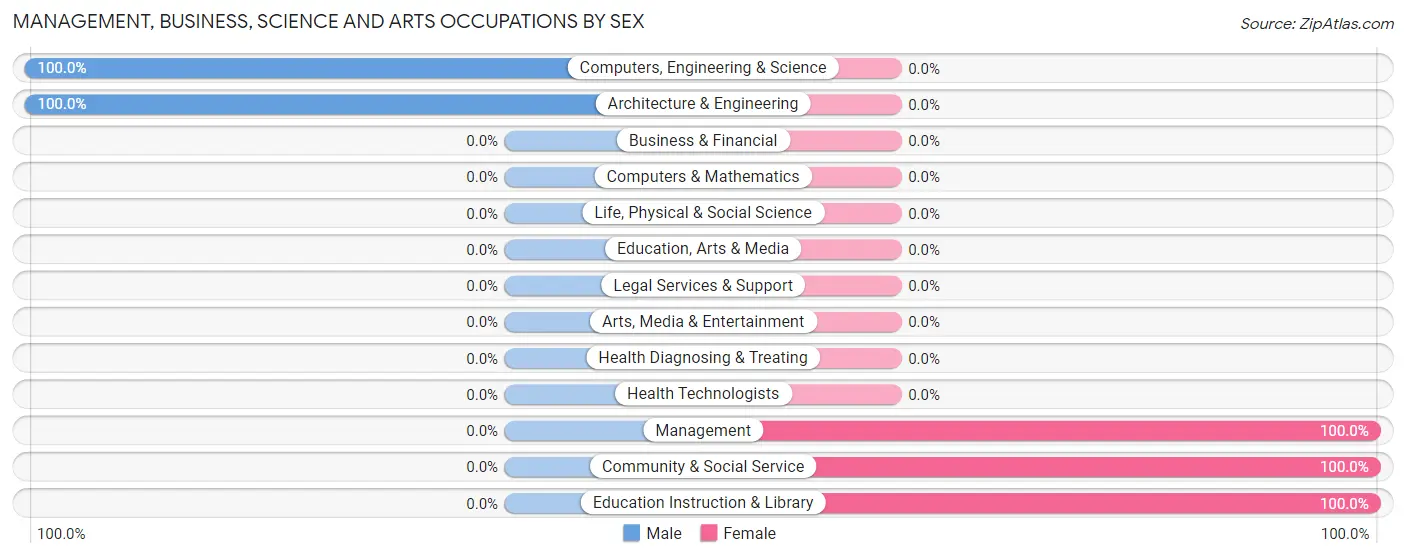
| Occupation | Male | Female |
| Management | 0 (0.0%) | 2 (100.0%) |
| Business & Financial | 0 (0.0%) | 0 (0.0%) |
| Computers, Engineering & Science | 1 (100.0%) | 0 (0.0%) |
| Computers & Mathematics | 0 (0.0%) | 0 (0.0%) |
| Architecture & Engineering | 1 (100.0%) | 0 (0.0%) |
| Life, Physical & Social Science | 0 (0.0%) | 0 (0.0%) |
| Community & Social Service | 0 (0.0%) | 3 (100.0%) |
| Education, Arts & Media | 0 (0.0%) | 0 (0.0%) |
| Legal Services & Support | 0 (0.0%) | 0 (0.0%) |
| Education Instruction & Library | 0 (0.0%) | 3 (100.0%) |
| Arts, Media & Entertainment | 0 (0.0%) | 0 (0.0%) |
| Health Diagnosing & Treating | 0 (0.0%) | 0 (0.0%) |
| Health Technologists | 0 (0.0%) | 0 (0.0%) |
| Total (Category) | 1 (16.7%) | 5 (83.3%) |
| Total (Overall) | 7 (41.2%) | 10 (58.8%) |
Services Occupations
The most common Services occupations in Minturn are , and Healthcare Support (2 | 11.8%).
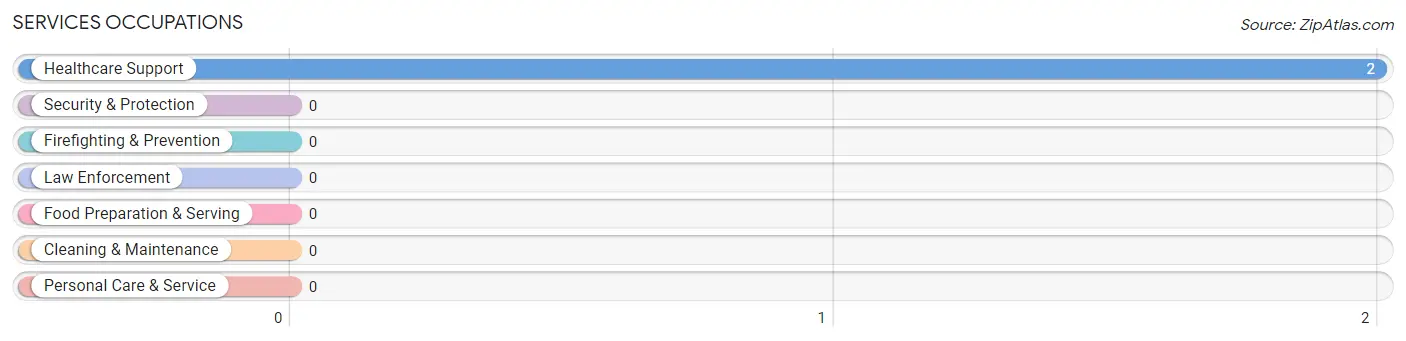
Services Occupations by Sex
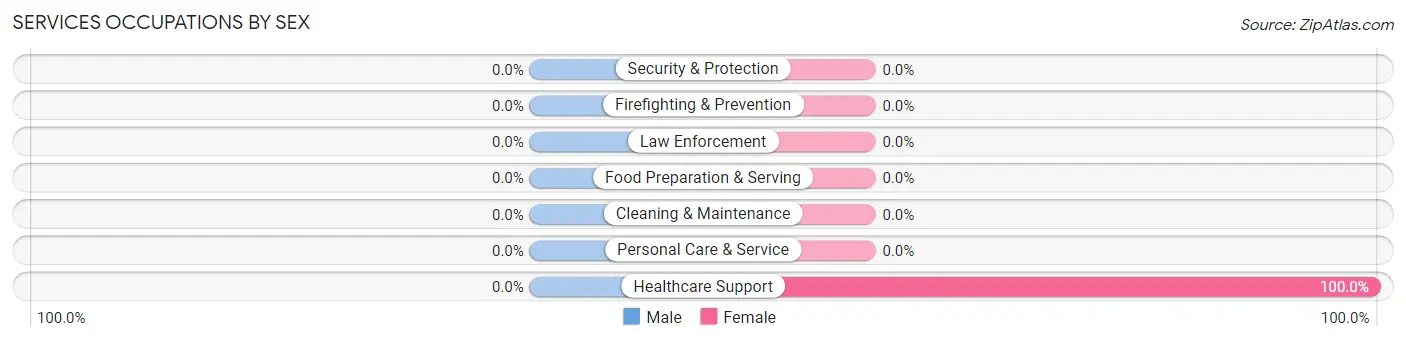
| Occupation | Male | Female |
| Healthcare Support | 0 (0.0%) | 2 (100.0%) |
| Security & Protection | 0 (0.0%) | 0 (0.0%) |
| Firefighting & Prevention | 0 (0.0%) | 0 (0.0%) |
| Law Enforcement | 0 (0.0%) | 0 (0.0%) |
| Food Preparation & Serving | 0 (0.0%) | 0 (0.0%) |
| Cleaning & Maintenance | 0 (0.0%) | 0 (0.0%) |
| Personal Care & Service | 0 (0.0%) | 0 (0.0%) |
| Total (Category) | 0 (0.0%) | 2 (100.0%) |
| Total (Overall) | 7 (41.2%) | 10 (58.8%) |
Sales and Office Occupations
The most common Sales and Office occupations in Minturn are , and Office & Administration (3 | 17.6%).
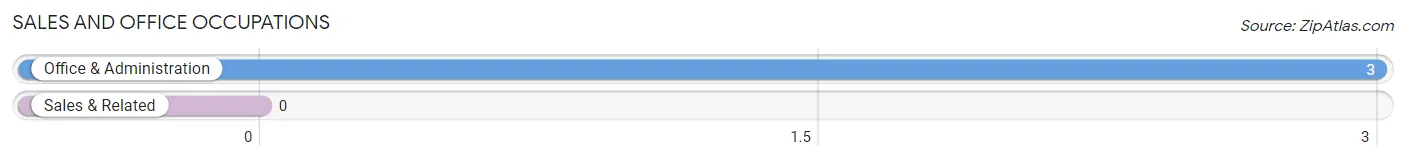
Sales and Office Occupations by Sex
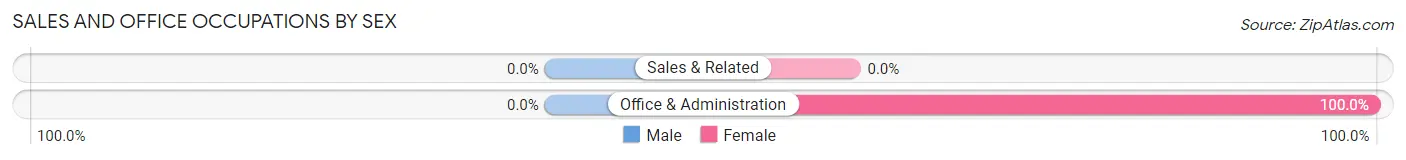
| Occupation | Male | Female |
| Sales & Related | 0 (0.0%) | 0 (0.0%) |
| Office & Administration | 0 (0.0%) | 3 (100.0%) |
| Total (Category) | 0 (0.0%) | 3 (100.0%) |
| Total (Overall) | 7 (41.2%) | 10 (58.8%) |
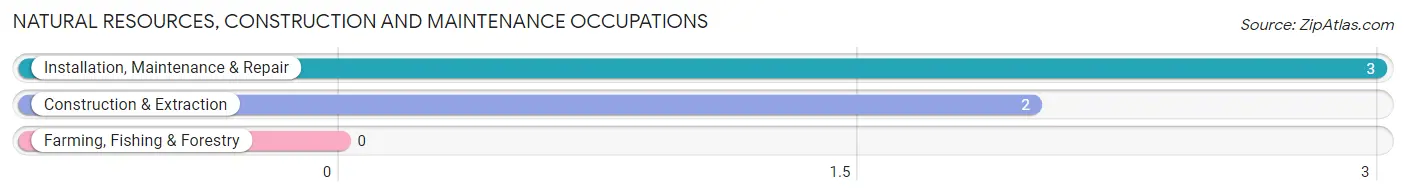
Natural Resources, Construction and Maintenance Occupations
The most common Natural Resources, Construction and Maintenance occupations in Minturn are Installation, Maintenance & Repair (3 | 17.6%), and Construction & Extraction (2 | 11.8%).
Natural Resources, Construction and Maintenance Occupations by Sex
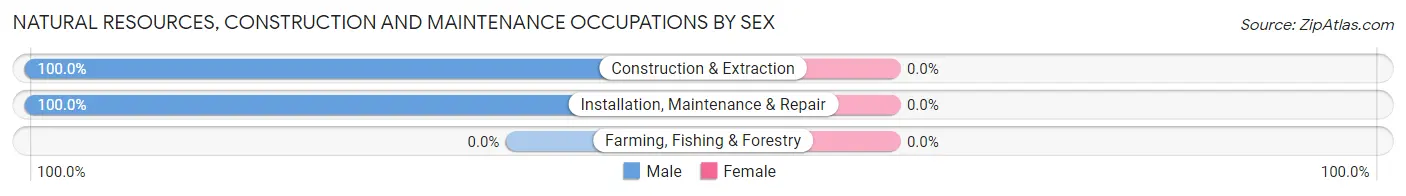
| Occupation | Male | Female |
| Farming, Fishing & Forestry | 0 (0.0%) | 0 (0.0%) |
| Construction & Extraction | 2 (100.0%) | 0 (0.0%) |
| Installation, Maintenance & Repair | 3 (100.0%) | 0 (0.0%) |
| Total (Category) | 5 (100.0%) | 0 (0.0%) |
| Total (Overall) | 7 (41.2%) | 10 (58.8%) |
Production, Transportation and Moving Occupations
The most common Production, Transportation and Moving occupations in Minturn are , and Transportation (1 | 5.9%).
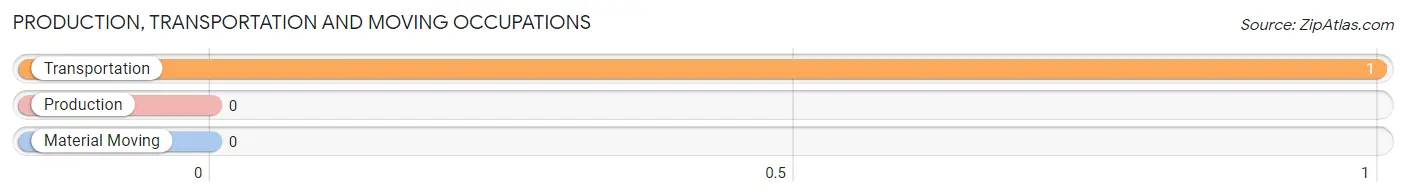
Production, Transportation and Moving Occupations by Sex
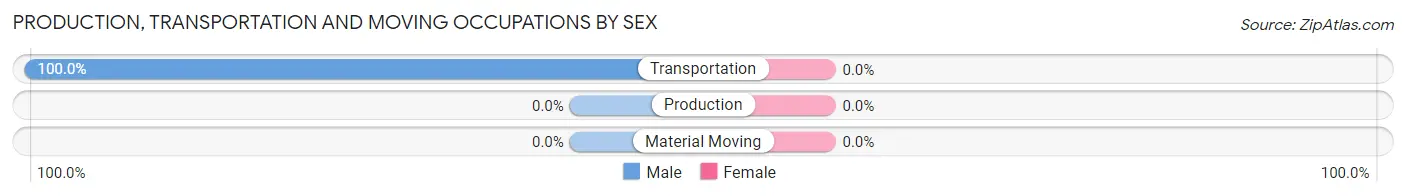
| Occupation | Male | Female |
| Production | 0 (0.0%) | 0 (0.0%) |
| Transportation | 1 (100.0%) | 0 (0.0%) |
| Material Moving | 0 (0.0%) | 0 (0.0%) |
| Total (Category) | 1 (100.0%) | 0 (0.0%) |
| Total (Overall) | 7 (41.2%) | 10 (58.8%) |
Employment Industries by Sex in Minturn
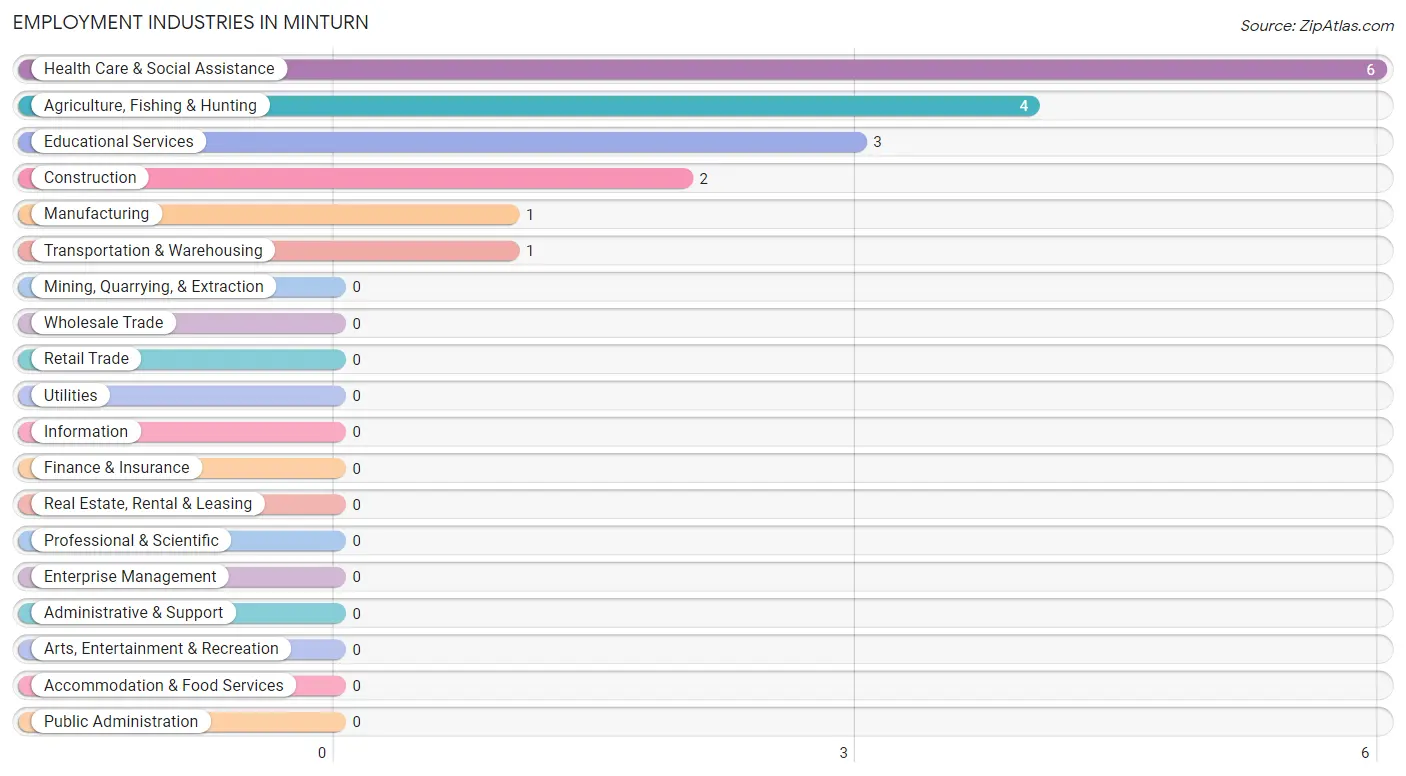
Employment Industries in Minturn
The major employment industries in Minturn include Health Care & Social Assistance (6 | 35.3%), Agriculture, Fishing & Hunting (4 | 23.5%), Educational Services (3 | 17.6%), Construction (2 | 11.8%), and Manufacturing (1 | 5.9%).
Employment Industries by Sex in Minturn
The Minturn industries that see more men than women are Construction (100.0%), Manufacturing (100.0%), and Transportation & Warehousing (100.0%), whereas the industries that tend to have a higher number of women are Educational Services (100.0%), Health Care & Social Assistance (100.0%), and Agriculture, Fishing & Hunting (25.0%).
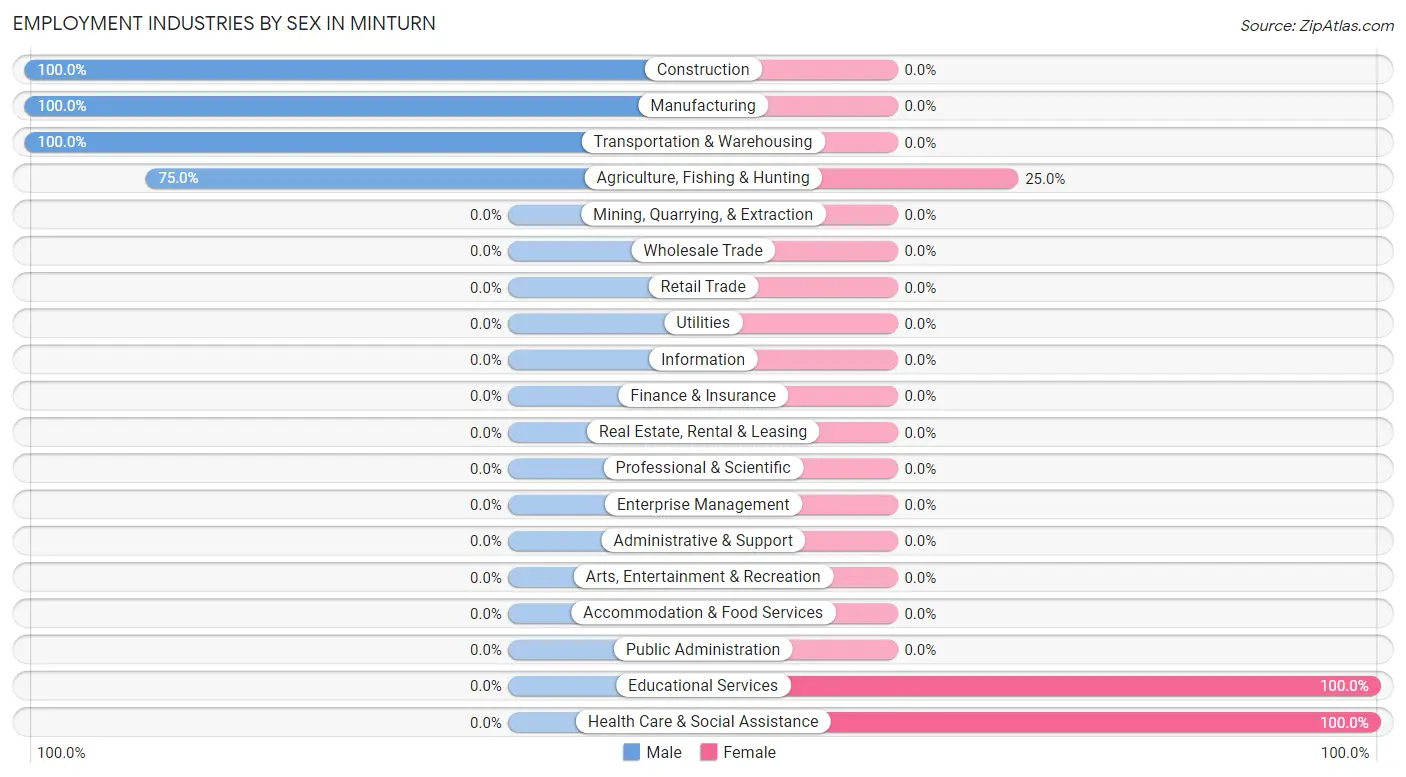
| Industry | Male | Female |
| Agriculture, Fishing & Hunting | 3 (75.0%) | 1 (25.0%) |
| Mining, Quarrying, & Extraction | 0 (0.0%) | 0 (0.0%) |
| Construction | 2 (100.0%) | 0 (0.0%) |
| Manufacturing | 1 (100.0%) | 0 (0.0%) |
| Wholesale Trade | 0 (0.0%) | 0 (0.0%) |
| Retail Trade | 0 (0.0%) | 0 (0.0%) |
| Transportation & Warehousing | 1 (100.0%) | 0 (0.0%) |
| Utilities | 0 (0.0%) | 0 (0.0%) |
| Information | 0 (0.0%) | 0 (0.0%) |
| Finance & Insurance | 0 (0.0%) | 0 (0.0%) |
| Real Estate, Rental & Leasing | 0 (0.0%) | 0 (0.0%) |
| Professional & Scientific | 0 (0.0%) | 0 (0.0%) |
| Enterprise Management | 0 (0.0%) | 0 (0.0%) |
| Administrative & Support | 0 (0.0%) | 0 (0.0%) |
| Educational Services | 0 (0.0%) | 3 (100.0%) |
| Health Care & Social Assistance | 0 (0.0%) | 6 (100.0%) |
| Arts, Entertainment & Recreation | 0 (0.0%) | 0 (0.0%) |
| Accommodation & Food Services | 0 (0.0%) | 0 (0.0%) |
| Public Administration | 0 (0.0%) | 0 (0.0%) |
| Total | 7 (41.2%) | 10 (58.8%) |
Education in Minturn
School Enrollment in Minturn
The most common levels of schooling among the 8 students in Minturn are nursery / preschool (4 | 50.0%), middle school (2 | 25.0%), and kindergarten (1 | 12.5%).
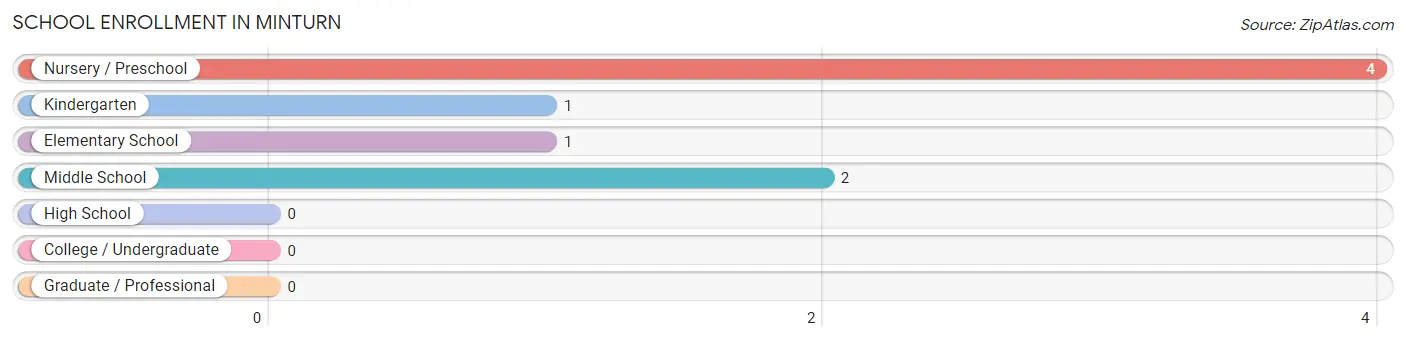
| School Level | # Students | % Students |
| Nursery / Preschool | 4 | 50.0% |
| Kindergarten | 1 | 12.5% |
| Elementary School | 1 | 12.5% |
| Middle School | 2 | 25.0% |
| High School | 0 | 0.0% |
| College / Undergraduate | 0 | 0.0% |
| Graduate / Professional | 0 | 0.0% |
| Total | 8 | 100.0% |
School Enrollment by Age by Funding Source in Minturn
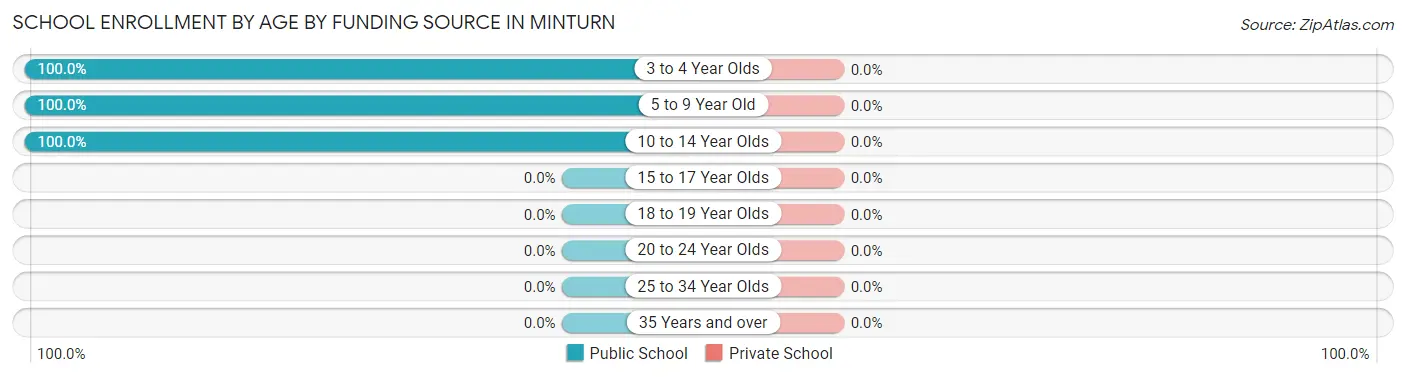
| Age Bracket | Public School | Private School |
| 3 to 4 Year Olds | 4 (100.0%) | 0 (0.0%) |
| 5 to 9 Year Old | 2 (100.0%) | 0 (0.0%) |
| 10 to 14 Year Olds | 2 (100.0%) | 0 (0.0%) |
| 15 to 17 Year Olds | 0 (0.0%) | 0 (0.0%) |
| 18 to 19 Year Olds | 0 (0.0%) | 0 (0.0%) |
| 20 to 24 Year Olds | 0 (0.0%) | 0 (0.0%) |
| 25 to 34 Year Olds | 0 (0.0%) | 0 (0.0%) |
| 35 Years and over | 0 (0.0%) | 0 (0.0%) |
| Total | 8 (100.0%) | 0 (0.0%) |
Educational Attainment by Field of Study in Minturn
Visual & performing arts (2 | 28.6%), bio, nature & agricultural (1 | 14.3%), psychology (1 | 14.3%), social sciences (1 | 14.3%), and engineering (1 | 14.3%) are the most common fields of study among 7 individuals in Minturn who have obtained a bachelor's degree or higher.
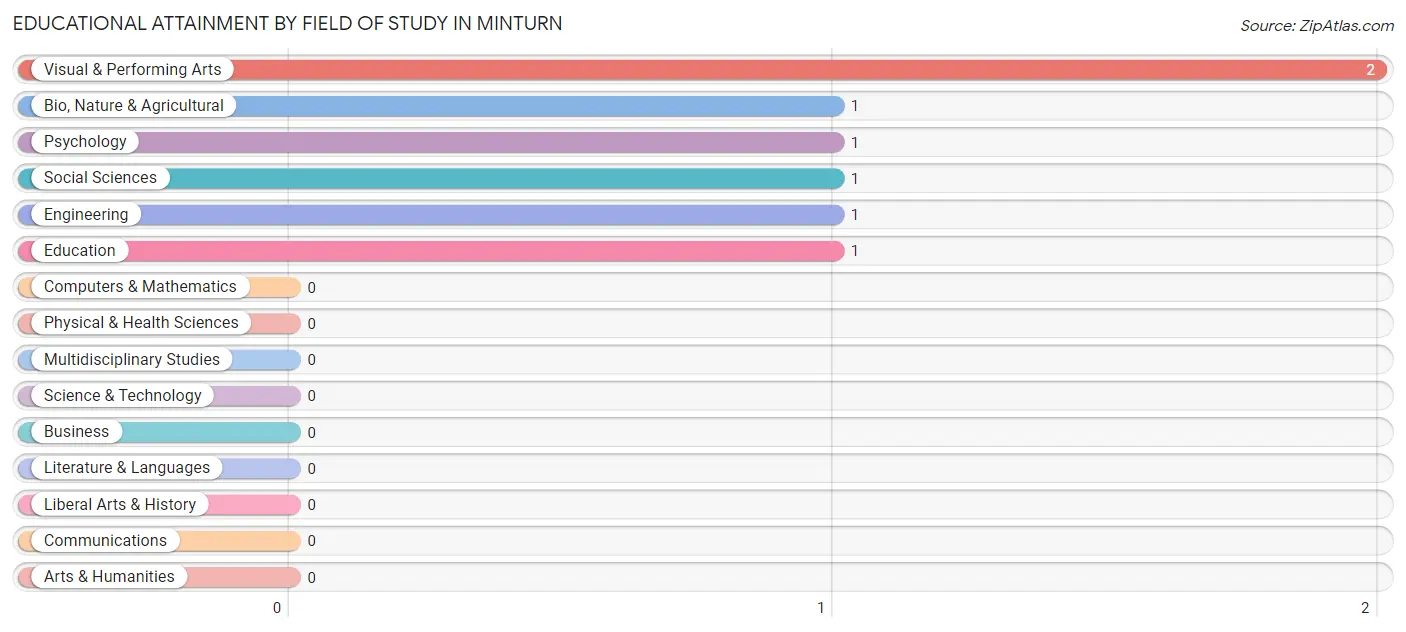
| Field of Study | # Graduates | % Graduates |
| Computers & Mathematics | 0 | 0.0% |
| Bio, Nature & Agricultural | 1 | 14.3% |
| Physical & Health Sciences | 0 | 0.0% |
| Psychology | 1 | 14.3% |
| Social Sciences | 1 | 14.3% |
| Engineering | 1 | 14.3% |
| Multidisciplinary Studies | 0 | 0.0% |
| Science & Technology | 0 | 0.0% |
| Business | 0 | 0.0% |
| Education | 1 | 14.3% |
| Literature & Languages | 0 | 0.0% |
| Liberal Arts & History | 0 | 0.0% |
| Visual & Performing Arts | 2 | 28.6% |
| Communications | 0 | 0.0% |
| Arts & Humanities | 0 | 0.0% |
| Total | 7 | 100.0% |
Transportation & Commute in Minturn
Vehicle Availability by Sex in Minturn
The most prevalent vehicle ownership categories in Minturn are males with 2 vehicles (7, accounting for 100.0%) and females with 2 vehicles (10, making up 70.0%).
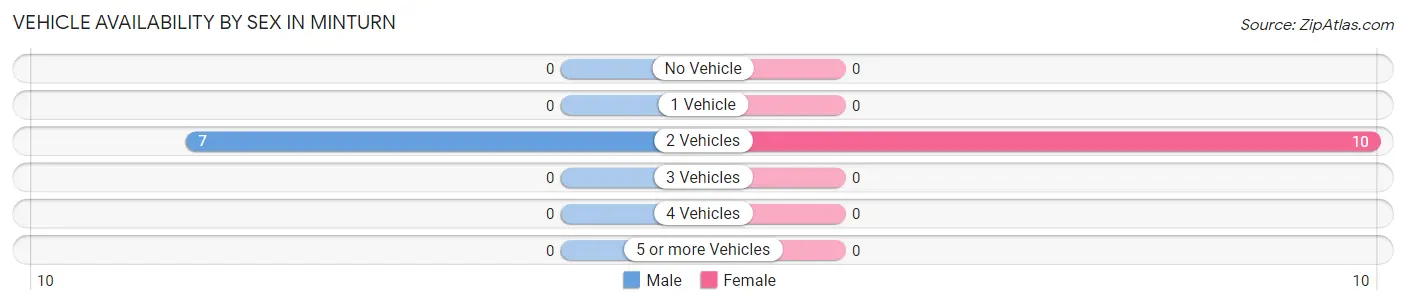
| Vehicles Available | Male | Female |
| No Vehicle | 0 (0.0%) | 0 (0.0%) |
| 1 Vehicle | 0 (0.0%) | 0 (0.0%) |
| 2 Vehicles | 7 (100.0%) | 10 (100.0%) |
| 3 Vehicles | 0 (0.0%) | 0 (0.0%) |
| 4 Vehicles | 0 (0.0%) | 0 (0.0%) |
| 5 or more Vehicles | 0 (0.0%) | 0 (0.0%) |
| Total | 7 (100.0%) | 10 (100.0%) |
Commute Time in Minturn
The most frequently occuring commute durations in Minturn are 5 to 9 minutes (4 commuters, 25.0%), 45 to 59 minutes (4 commuters, 25.0%), and 15 to 19 minutes (2 commuters, 12.5%).
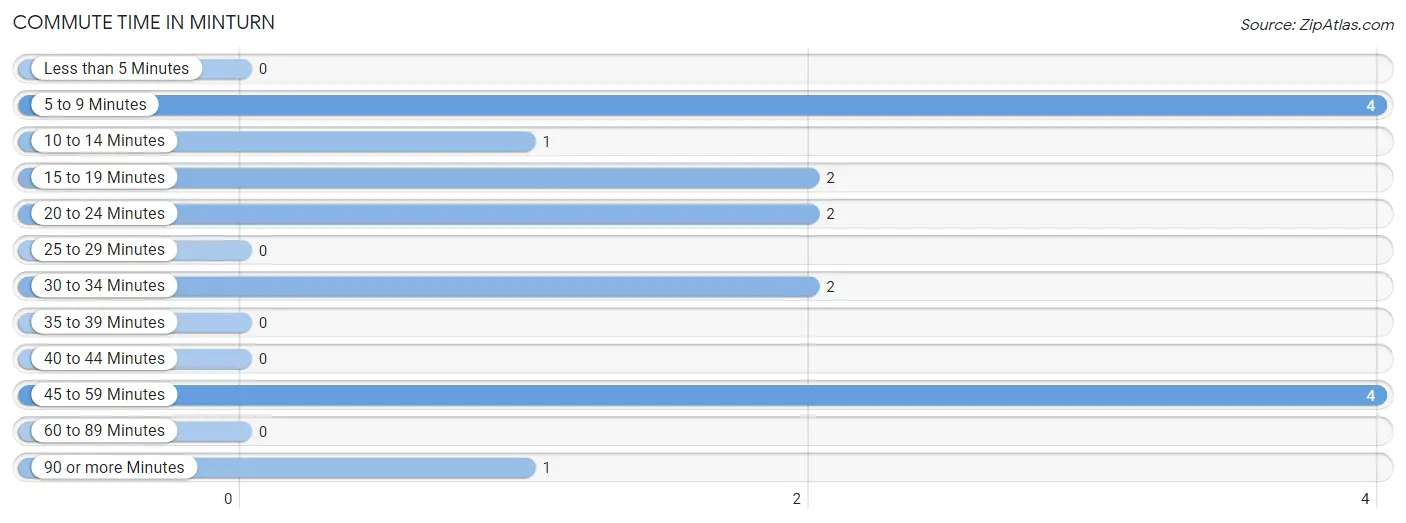
| Commute Time | # Commuters | % Commuters |
| Less than 5 Minutes | 0 | 0.0% |
| 5 to 9 Minutes | 4 | 25.0% |
| 10 to 14 Minutes | 1 | 6.2% |
| 15 to 19 Minutes | 2 | 12.5% |
| 20 to 24 Minutes | 2 | 12.5% |
| 25 to 29 Minutes | 0 | 0.0% |
| 30 to 34 Minutes | 2 | 12.5% |
| 35 to 39 Minutes | 0 | 0.0% |
| 40 to 44 Minutes | 0 | 0.0% |
| 45 to 59 Minutes | 4 | 25.0% |
| 60 to 89 Minutes | 0 | 0.0% |
| 90 or more Minutes | 1 | 6.2% |
Commute Time by Sex in Minturn
The most common commute times in Minturn are 5 to 9 minutes (3 commuters, 42.9%) for males and 45 to 59 minutes (3 commuters, 33.3%) for females.
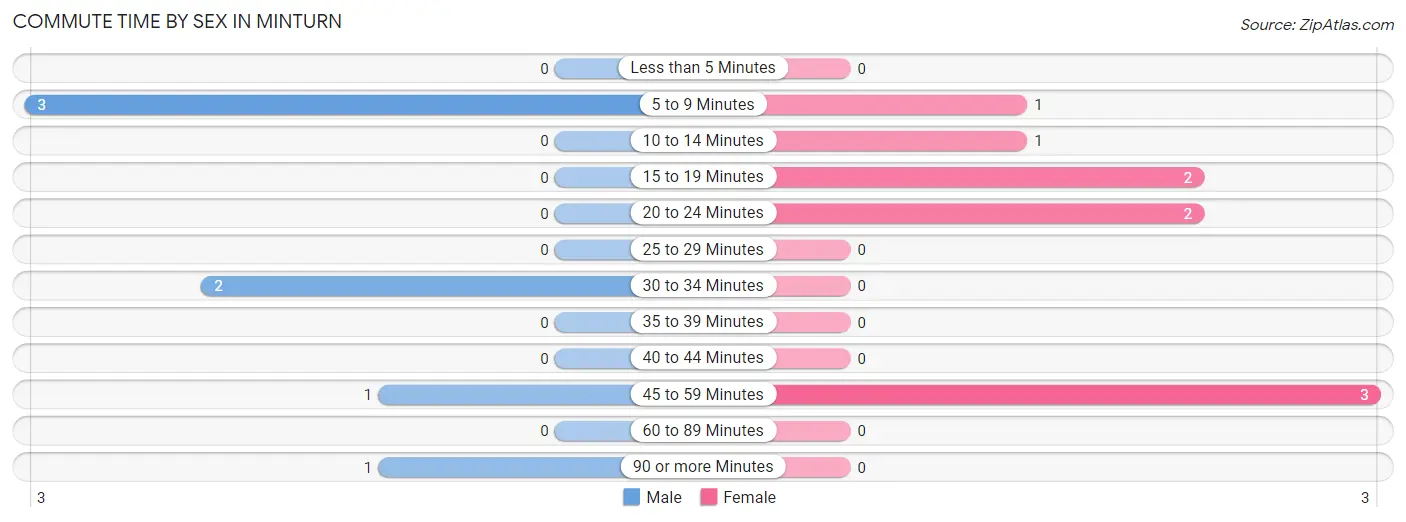
| Commute Time | Male | Female |
| Less than 5 Minutes | 0 (0.0%) | 0 (0.0%) |
| 5 to 9 Minutes | 3 (42.9%) | 1 (11.1%) |
| 10 to 14 Minutes | 0 (0.0%) | 1 (11.1%) |
| 15 to 19 Minutes | 0 (0.0%) | 2 (22.2%) |
| 20 to 24 Minutes | 0 (0.0%) | 2 (22.2%) |
| 25 to 29 Minutes | 0 (0.0%) | 0 (0.0%) |
| 30 to 34 Minutes | 2 (28.6%) | 0 (0.0%) |
| 35 to 39 Minutes | 0 (0.0%) | 0 (0.0%) |
| 40 to 44 Minutes | 0 (0.0%) | 0 (0.0%) |
| 45 to 59 Minutes | 1 (14.3%) | 3 (33.3%) |
| 60 to 89 Minutes | 0 (0.0%) | 0 (0.0%) |
| 90 or more Minutes | 1 (14.3%) | 0 (0.0%) |
Time of Departure to Work by Sex in Minturn
The most frequent times of departure to work in Minturn are 6:00 AM to 6:29 AM (4, 57.1%) for males and 7:00 AM to 7:29 AM (4, 44.4%) for females.
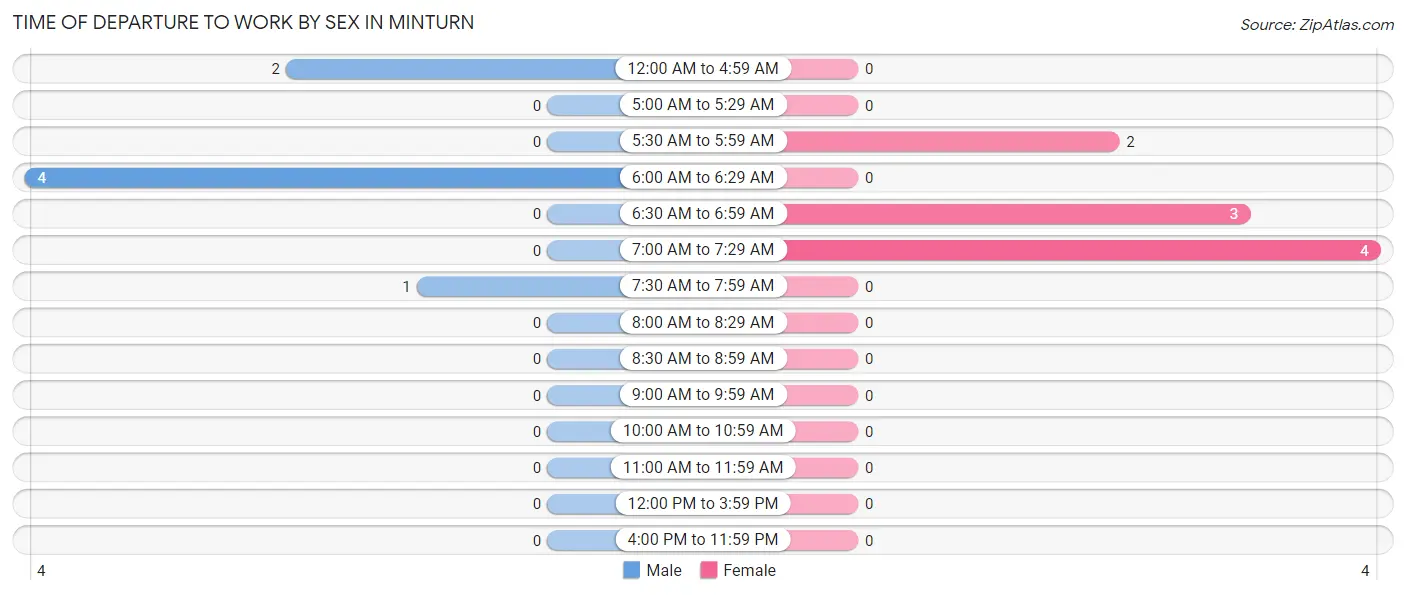
| Time of Departure | Male | Female |
| 12:00 AM to 4:59 AM | 2 (28.6%) | 0 (0.0%) |
| 5:00 AM to 5:29 AM | 0 (0.0%) | 0 (0.0%) |
| 5:30 AM to 5:59 AM | 0 (0.0%) | 2 (22.2%) |
| 6:00 AM to 6:29 AM | 4 (57.1%) | 0 (0.0%) |
| 6:30 AM to 6:59 AM | 0 (0.0%) | 3 (33.3%) |
| 7:00 AM to 7:29 AM | 0 (0.0%) | 4 (44.4%) |
| 7:30 AM to 7:59 AM | 1 (14.3%) | 0 (0.0%) |
| 8:00 AM to 8:29 AM | 0 (0.0%) | 0 (0.0%) |
| 8:30 AM to 8:59 AM | 0 (0.0%) | 0 (0.0%) |
| 9:00 AM to 9:59 AM | 0 (0.0%) | 0 (0.0%) |
| 10:00 AM to 10:59 AM | 0 (0.0%) | 0 (0.0%) |
| 11:00 AM to 11:59 AM | 0 (0.0%) | 0 (0.0%) |
| 12:00 PM to 3:59 PM | 0 (0.0%) | 0 (0.0%) |
| 4:00 PM to 11:59 PM | 0 (0.0%) | 0 (0.0%) |
| Total | 7 (100.0%) | 9 (100.0%) |
Housing Occupancy in Minturn
Occupancy by Ownership in Minturn
Of the total 17 dwellings in Minturn, owner-occupied units account for 13 (76.5%), while renter-occupied units make up 4 (23.5%).
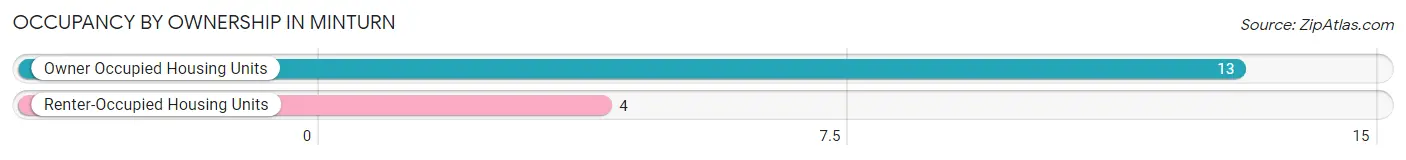
| Occupancy | # Housing Units | % Housing Units |
| Owner Occupied Housing Units | 13 | 76.5% |
| Renter-Occupied Housing Units | 4 | 23.5% |
| Total Occupied Housing Units | 17 | 100.0% |
Occupancy by Household Size in Minturn
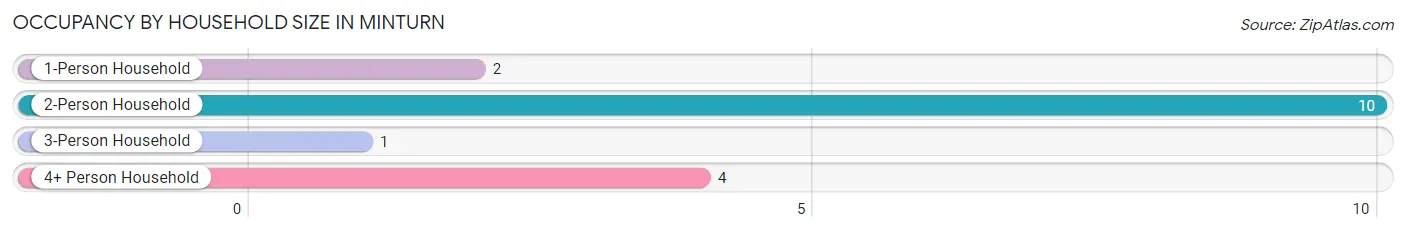
| Household Size | # Housing Units | % Housing Units |
| 1-Person Household | 2 | 11.8% |
| 2-Person Household | 10 | 58.8% |
| 3-Person Household | 1 | 5.9% |
| 4+ Person Household | 4 | 23.5% |
| Total Housing Units | 17 | 100.0% |
Occupancy by Ownership by Household Size in Minturn
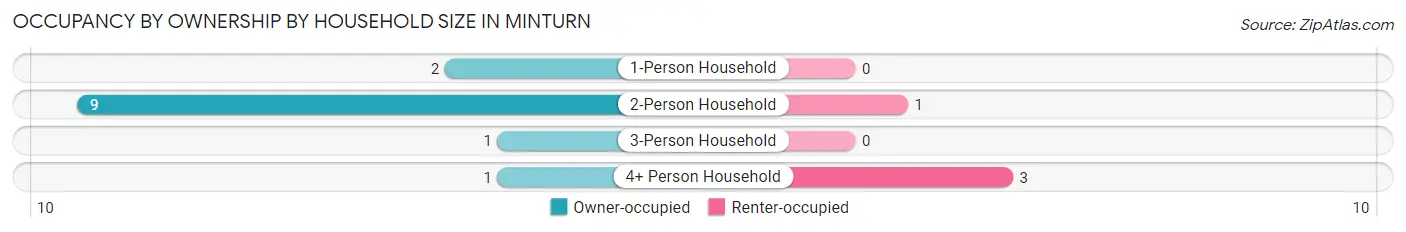
| Household Size | Owner-occupied | Renter-occupied |
| 1-Person Household | 2 (100.0%) | 0 (0.0%) |
| 2-Person Household | 9 (90.0%) | 1 (10.0%) |
| 3-Person Household | 1 (100.0%) | 0 (0.0%) |
| 4+ Person Household | 1 (25.0%) | 3 (75.0%) |
| Total Housing Units | 13 (76.5%) | 4 (23.5%) |
Occupancy by Educational Attainment in Minturn
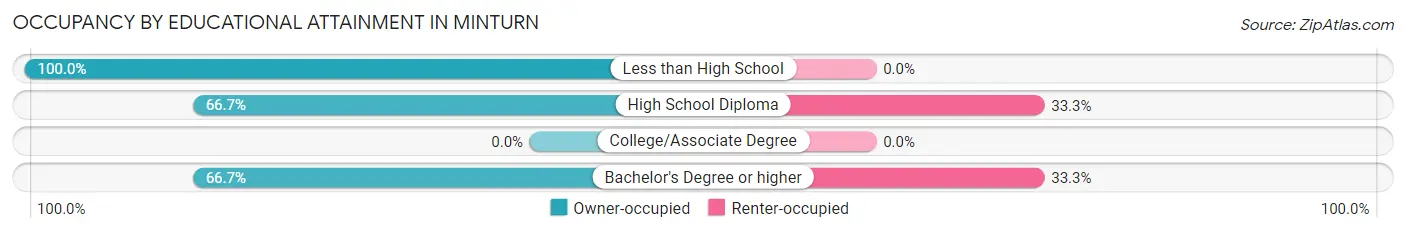
| Household Size | Owner-occupied | Renter-occupied |
| Less than High School | 5 (100.0%) | 0 (0.0%) |
| High School Diploma | 6 (66.7%) | 3 (33.3%) |
| College/Associate Degree | 0 (0.0%) | 0 (0.0%) |
| Bachelor's Degree or higher | 2 (66.7%) | 1 (33.3%) |
Occupancy by Age of Householder in Minturn
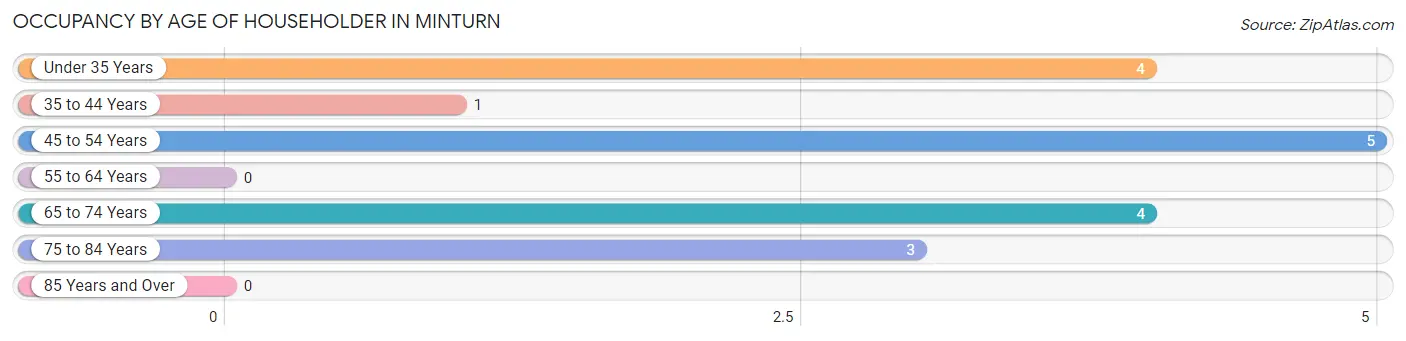
| Age Bracket | # Households | % Households |
| Under 35 Years | 4 | 23.5% |
| 35 to 44 Years | 1 | 5.9% |
| 45 to 54 Years | 5 | 29.4% |
| 55 to 64 Years | 0 | 0.0% |
| 65 to 74 Years | 4 | 23.5% |
| 75 to 84 Years | 3 | 17.6% |
| 85 Years and Over | 0 | 0.0% |
| Total | 17 | 100.0% |
Housing Finances in Minturn
Median Income by Occupancy in Minturn
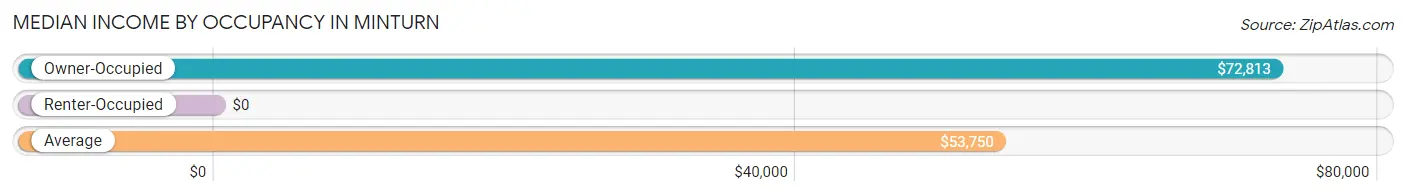
| Occupancy Type | # Households | Median Income |
| Owner-Occupied | 13 (76.5%) | $72,813 |
| Renter-Occupied | 4 (23.5%) | $0 |
| Average | 17 (100.0%) | $53,750 |
Occupancy by Householder Income Bracket in Minturn
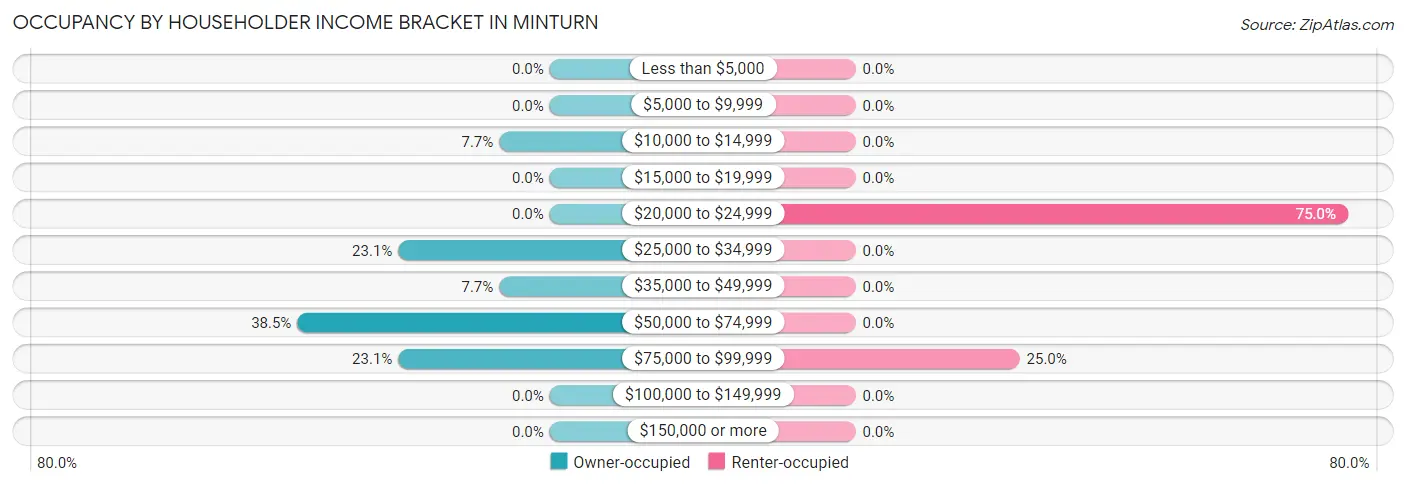
| Income Bracket | Owner-occupied | Renter-occupied |
| Less than $5,000 | 0 (0.0%) | 0 (0.0%) |
| $5,000 to $9,999 | 0 (0.0%) | 0 (0.0%) |
| $10,000 to $14,999 | 1 (7.7%) | 0 (0.0%) |
| $15,000 to $19,999 | 0 (0.0%) | 0 (0.0%) |
| $20,000 to $24,999 | 0 (0.0%) | 3 (75.0%) |
| $25,000 to $34,999 | 3 (23.1%) | 0 (0.0%) |
| $35,000 to $49,999 | 1 (7.7%) | 0 (0.0%) |
| $50,000 to $74,999 | 5 (38.5%) | 0 (0.0%) |
| $75,000 to $99,999 | 3 (23.1%) | 1 (25.0%) |
| $100,000 to $149,999 | 0 (0.0%) | 0 (0.0%) |
| $150,000 or more | 0 (0.0%) | 0 (0.0%) |
| Total | 13 (100.0%) | 4 (100.0%) |
Monthly Housing Cost Tiers in Minturn
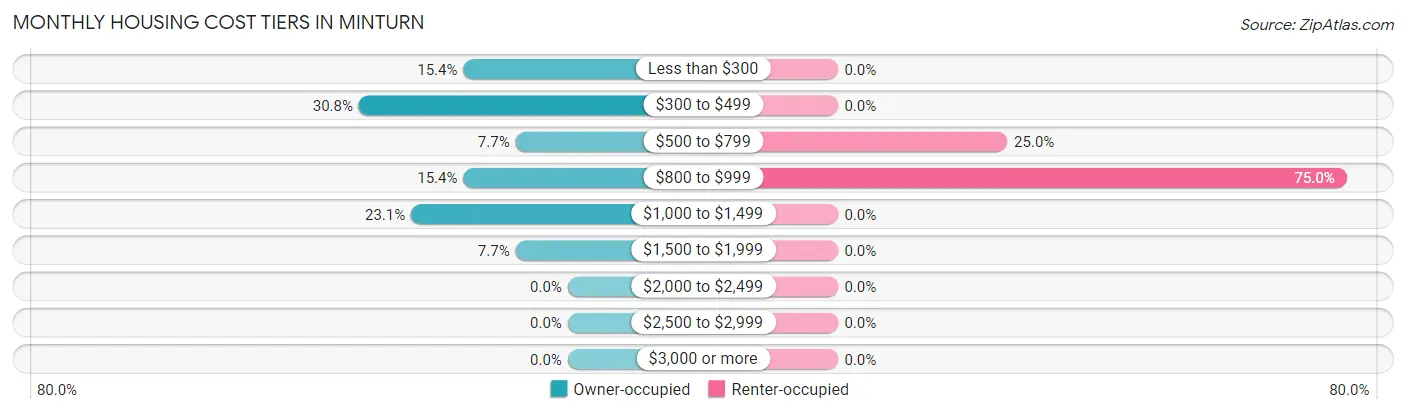
| Monthly Cost | Owner-occupied | Renter-occupied |
| Less than $300 | 2 (15.4%) | 0 (0.0%) |
| $300 to $499 | 4 (30.8%) | 0 (0.0%) |
| $500 to $799 | 1 (7.7%) | 1 (25.0%) |
| $800 to $999 | 2 (15.4%) | 3 (75.0%) |
| $1,000 to $1,499 | 3 (23.1%) | 0 (0.0%) |
| $1,500 to $1,999 | 1 (7.7%) | 0 (0.0%) |
| $2,000 to $2,499 | 0 (0.0%) | 0 (0.0%) |
| $2,500 to $2,999 | 0 (0.0%) | 0 (0.0%) |
| $3,000 or more | 0 (0.0%) | 0 (0.0%) |
| Total | 13 (100.0%) | 4 (100.0%) |
Physical Housing Characteristics in Minturn
Housing Structures in Minturn
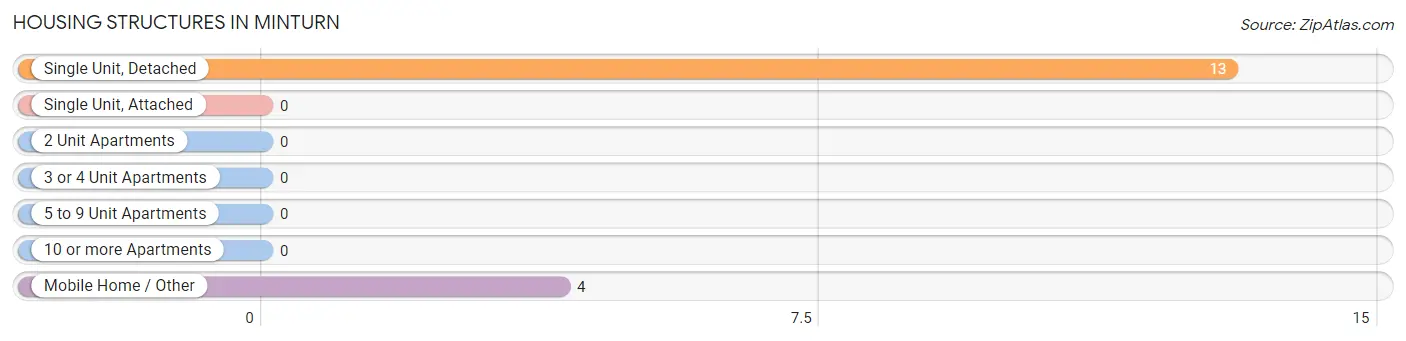
| Structure Type | # Housing Units | % Housing Units |
| Single Unit, Detached | 13 | 76.5% |
| Single Unit, Attached | 0 | 0.0% |
| 2 Unit Apartments | 0 | 0.0% |
| 3 or 4 Unit Apartments | 0 | 0.0% |
| 5 to 9 Unit Apartments | 0 | 0.0% |
| 10 or more Apartments | 0 | 0.0% |
| Mobile Home / Other | 4 | 23.5% |
| Total | 17 | 100.0% |
Housing Structures by Occupancy in Minturn
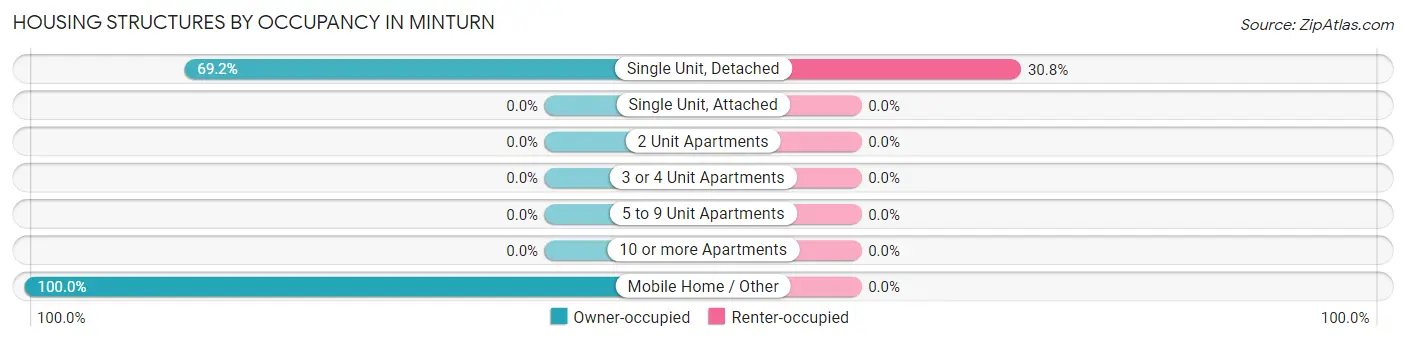
| Structure Type | Owner-occupied | Renter-occupied |
| Single Unit, Detached | 9 (69.2%) | 4 (30.8%) |
| Single Unit, Attached | 0 (0.0%) | 0 (0.0%) |
| 2 Unit Apartments | 0 (0.0%) | 0 (0.0%) |
| 3 or 4 Unit Apartments | 0 (0.0%) | 0 (0.0%) |
| 5 to 9 Unit Apartments | 0 (0.0%) | 0 (0.0%) |
| 10 or more Apartments | 0 (0.0%) | 0 (0.0%) |
| Mobile Home / Other | 4 (100.0%) | 0 (0.0%) |
| Total | 13 (76.5%) | 4 (23.5%) |
Housing Structures by Number of Rooms in Minturn
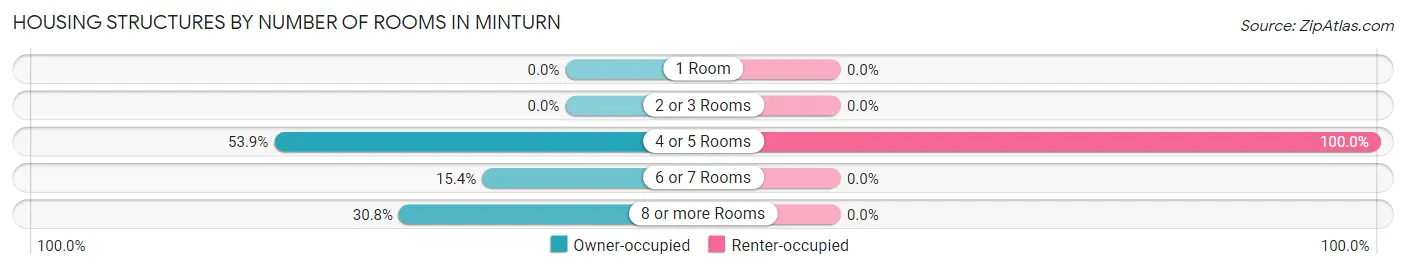
| Number of Rooms | Owner-occupied | Renter-occupied |
| 1 Room | 0 (0.0%) | 0 (0.0%) |
| 2 or 3 Rooms | 0 (0.0%) | 0 (0.0%) |
| 4 or 5 Rooms | 7 (53.8%) | 4 (100.0%) |
| 6 or 7 Rooms | 2 (15.4%) | 0 (0.0%) |
| 8 or more Rooms | 4 (30.8%) | 0 (0.0%) |
| Total | 13 (100.0%) | 4 (100.0%) |
Housing Structure by Heating Type in Minturn
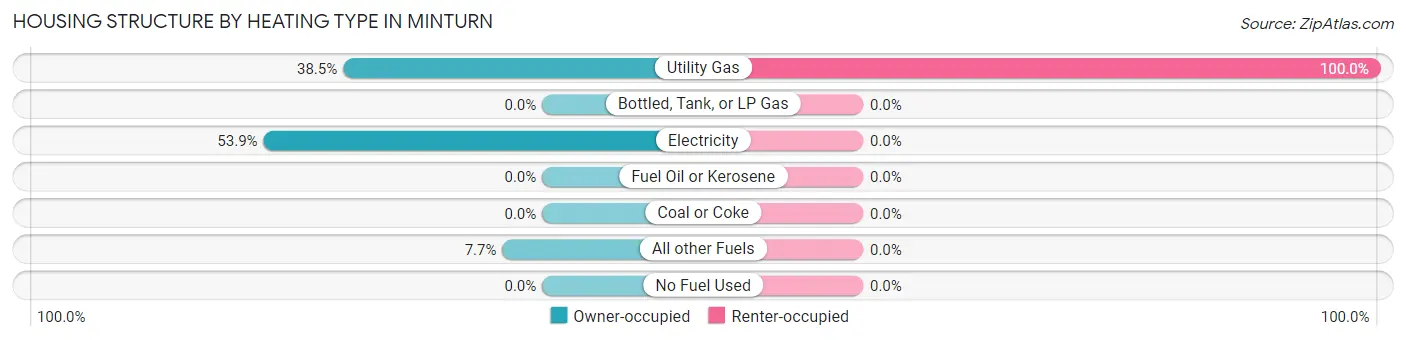
| Heating Type | Owner-occupied | Renter-occupied |
| Utility Gas | 5 (38.5%) | 4 (100.0%) |
| Bottled, Tank, or LP Gas | 0 (0.0%) | 0 (0.0%) |
| Electricity | 7 (53.8%) | 0 (0.0%) |
| Fuel Oil or Kerosene | 0 (0.0%) | 0 (0.0%) |
| Coal or Coke | 0 (0.0%) | 0 (0.0%) |
| All other Fuels | 1 (7.7%) | 0 (0.0%) |
| No Fuel Used | 0 (0.0%) | 0 (0.0%) |
| Total | 13 (100.0%) | 4 (100.0%) |
Household Vehicle Usage in Minturn
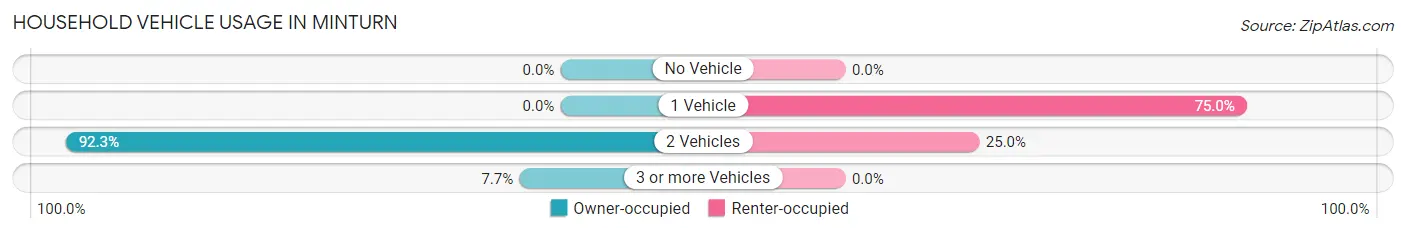
| Vehicles per Household | Owner-occupied | Renter-occupied |
| No Vehicle | 0 (0.0%) | 0 (0.0%) |
| 1 Vehicle | 0 (0.0%) | 3 (75.0%) |
| 2 Vehicles | 12 (92.3%) | 1 (25.0%) |
| 3 or more Vehicles | 1 (7.7%) | 0 (0.0%) |
| Total | 13 (100.0%) | 4 (100.0%) |
Real Estate & Mortgages in Minturn
Real Estate and Mortgage Overview in Minturn
| Characteristic | Without Mortgage | With Mortgage |
| Housing Units | 6 | 7 |
| Median Property Value | - | - |
| Median Household Income | $28,750 | $0 |
| Monthly Housing Costs | $425 | $0 |
| Real Estate Taxes | - | - |
Property Value by Mortgage Status in Minturn
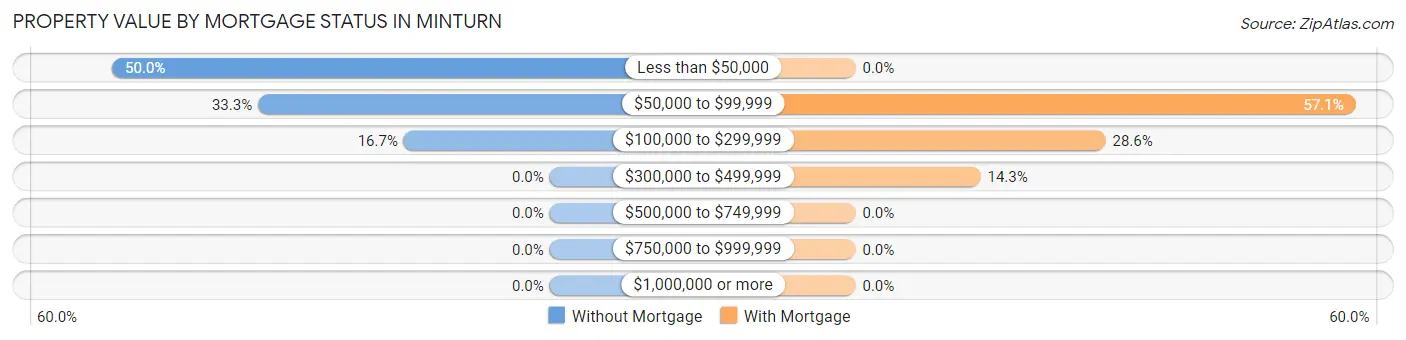
| Property Value | Without Mortgage | With Mortgage |
| Less than $50,000 | 3 (50.0%) | 0 (0.0%) |
| $50,000 to $99,999 | 2 (33.3%) | 4 (57.1%) |
| $100,000 to $299,999 | 1 (16.7%) | 2 (28.6%) |
| $300,000 to $499,999 | 0 (0.0%) | 1 (14.3%) |
| $500,000 to $749,999 | 0 (0.0%) | 0 (0.0%) |
| $750,000 to $999,999 | 0 (0.0%) | 0 (0.0%) |
| $1,000,000 or more | 0 (0.0%) | 0 (0.0%) |
| Total | 6 (100.0%) | 7 (100.0%) |
Household Income by Mortgage Status in Minturn
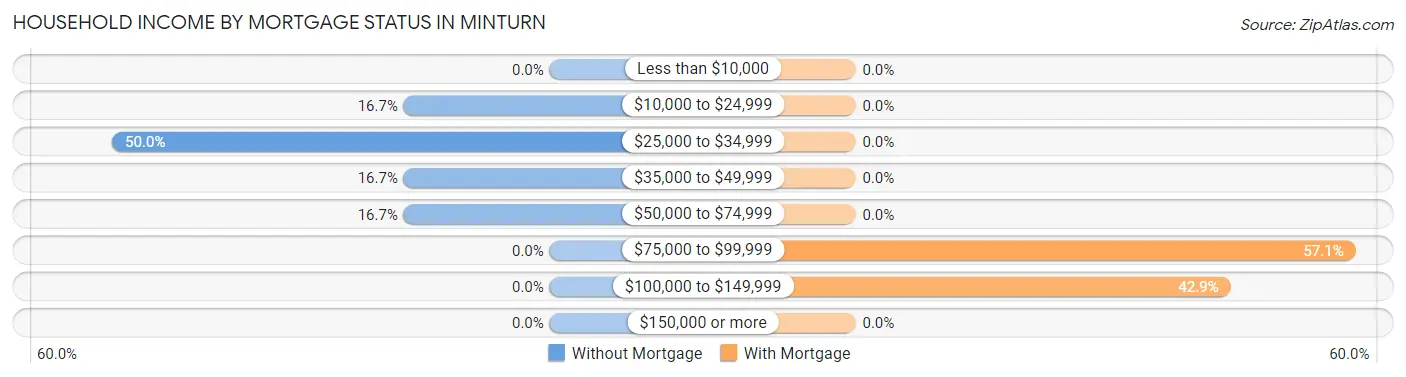
| Household Income | Without Mortgage | With Mortgage |
| Less than $10,000 | 0 (0.0%) | 0 (0.0%) |
| $10,000 to $24,999 | 1 (16.7%) | 0 (0.0%) |
| $25,000 to $34,999 | 3 (50.0%) | 0 (0.0%) |
| $35,000 to $49,999 | 1 (16.7%) | 0 (0.0%) |
| $50,000 to $74,999 | 1 (16.7%) | 0 (0.0%) |
| $75,000 to $99,999 | 0 (0.0%) | 4 (57.1%) |
| $100,000 to $149,999 | 0 (0.0%) | 3 (42.9%) |
| $150,000 or more | 0 (0.0%) | 0 (0.0%) |
| Total | 6 (100.0%) | 7 (100.0%) |
Property Value to Household Income Ratio in Minturn
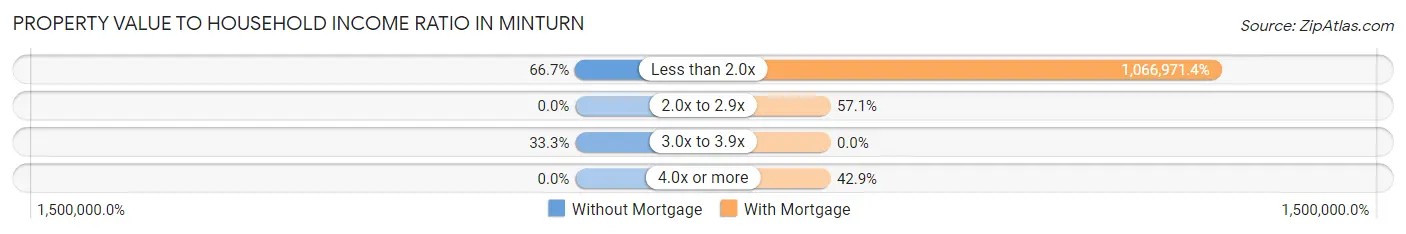
| Value-to-Income Ratio | Without Mortgage | With Mortgage |
| Less than 2.0x | 4 (66.7%) | 74,688 (1,066,971.4%) |
| 2.0x to 2.9x | 0 (0.0%) | 4 (57.1%) |
| 3.0x to 3.9x | 2 (33.3%) | 0 (0.0%) |
| 4.0x or more | 0 (0.0%) | 3 (42.9%) |
| Total | 6 (100.0%) | 7 (100.0%) |
Real Estate Taxes by Mortgage Status in Minturn
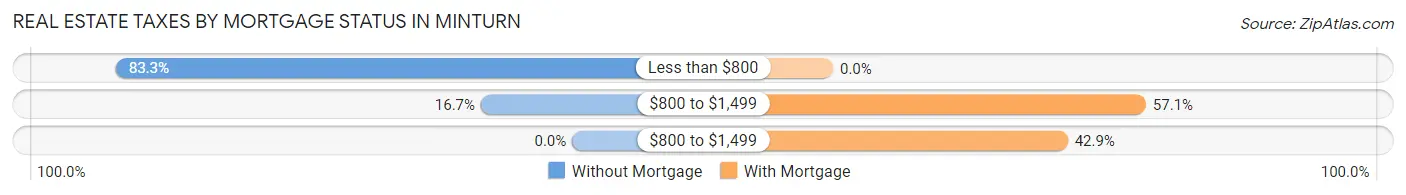
| Property Taxes | Without Mortgage | With Mortgage |
| Less than $800 | 5 (83.3%) | 0 (0.0%) |
| $800 to $1,499 | 1 (16.7%) | 4 (57.1%) |
| $800 to $1,499 | 0 (0.0%) | 3 (42.9%) |
| Total | 6 (100.0%) | 7 (100.0%) |
Health & Disability in Minturn
Health Insurance Coverage by Age in Minturn
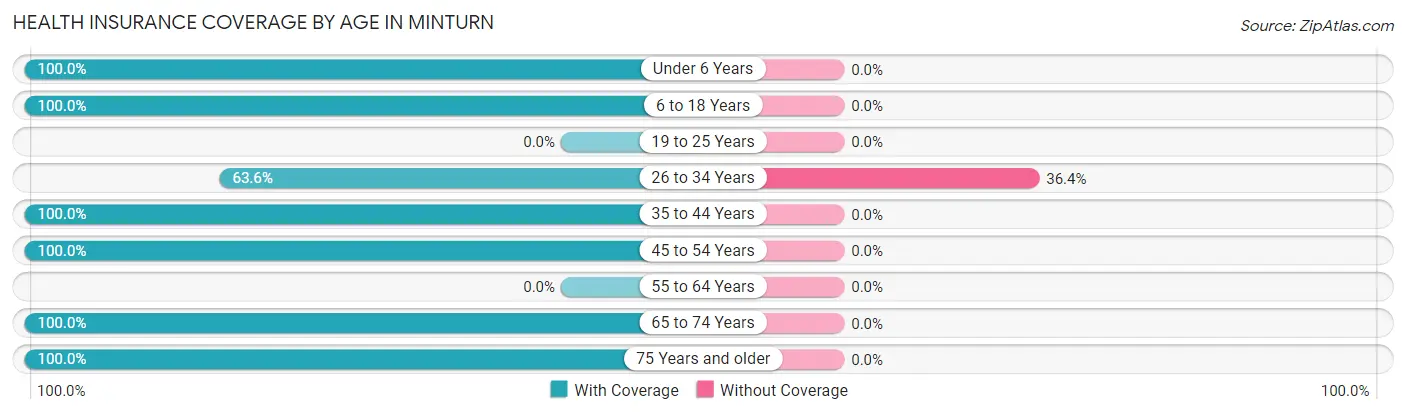
| Age Bracket | With Coverage | Without Coverage |
| Under 6 Years | 4 (100.0%) | 0 (0.0%) |
| 6 to 18 Years | 4 (100.0%) | 0 (0.0%) |
| 19 to 25 Years | 0 (0.0%) | 0 (0.0%) |
| 26 to 34 Years | 7 (63.6%) | 4 (36.4%) |
| 35 to 44 Years | 1 (100.0%) | 0 (0.0%) |
| 45 to 54 Years | 11 (100.0%) | 0 (0.0%) |
| 55 to 64 Years | 0 (0.0%) | 0 (0.0%) |
| 65 to 74 Years | 6 (100.0%) | 0 (0.0%) |
| 75 Years and older | 4 (100.0%) | 0 (0.0%) |
| Total | 37 (90.2%) | 4 (9.8%) |
Health Insurance Coverage by Citizenship Status in Minturn
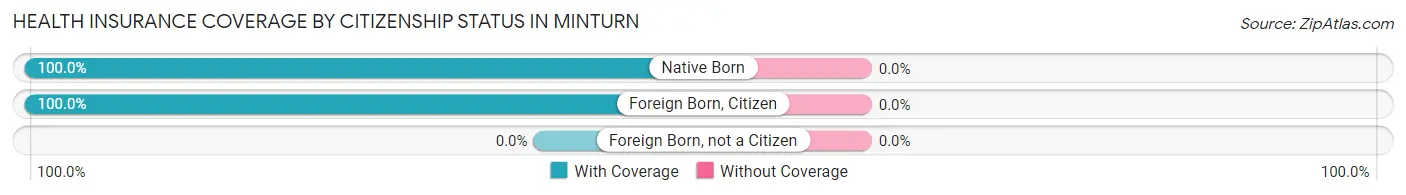
| Citizenship Status | With Coverage | Without Coverage |
| Native Born | 4 (100.0%) | 0 (0.0%) |
| Foreign Born, Citizen | 4 (100.0%) | 0 (0.0%) |
| Foreign Born, not a Citizen | 0 (0.0%) | 0 (0.0%) |
Health Insurance Coverage by Household Income in Minturn
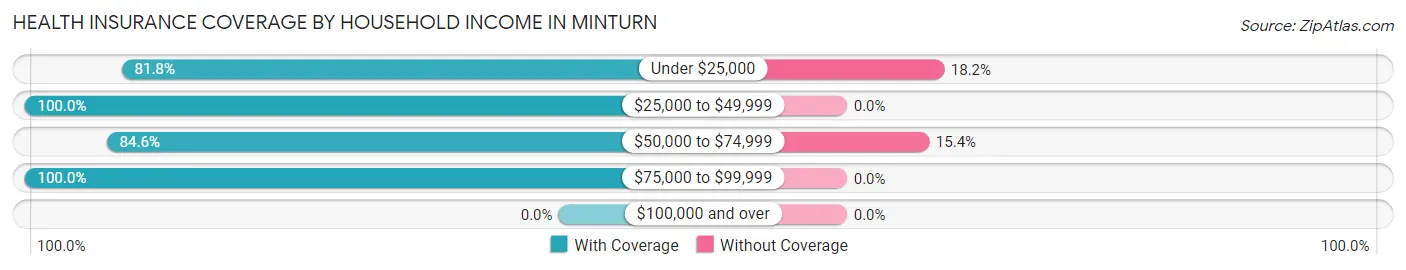
| Household Income | With Coverage | Without Coverage |
| Under $25,000 | 9 (81.8%) | 2 (18.2%) |
| $25,000 to $49,999 | 6 (100.0%) | 0 (0.0%) |
| $50,000 to $74,999 | 11 (84.6%) | 2 (15.4%) |
| $75,000 to $99,999 | 11 (100.0%) | 0 (0.0%) |
| $100,000 and over | 0 (0.0%) | 0 (0.0%) |
Public vs Private Health Insurance Coverage by Age in Minturn
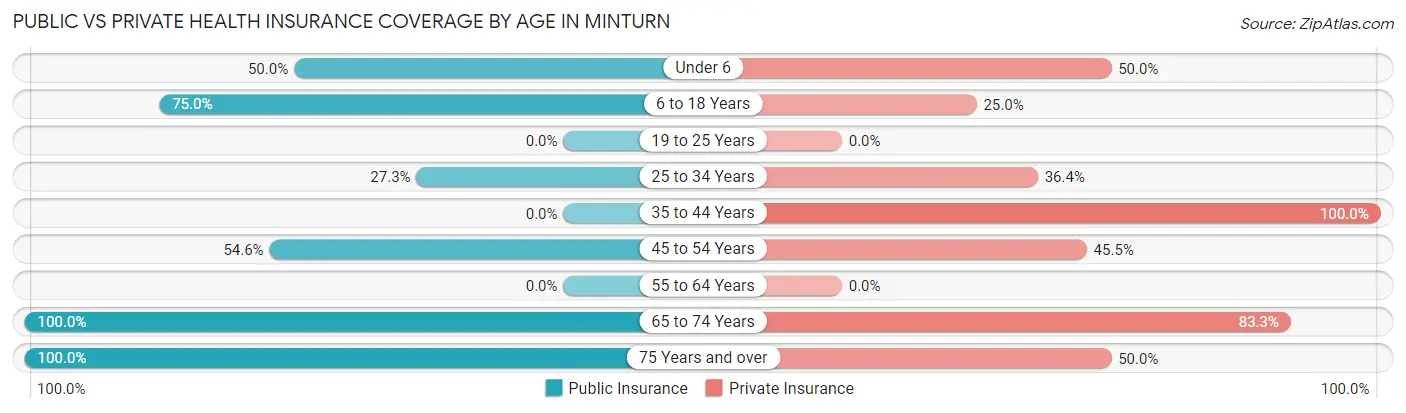
| Age Bracket | Public Insurance | Private Insurance |
| Under 6 | 2 (50.0%) | 2 (50.0%) |
| 6 to 18 Years | 3 (75.0%) | 1 (25.0%) |
| 19 to 25 Years | 0 (0.0%) | 0 (0.0%) |
| 25 to 34 Years | 3 (27.3%) | 4 (36.4%) |
| 35 to 44 Years | 0 (0.0%) | 1 (100.0%) |
| 45 to 54 Years | 6 (54.5%) | 5 (45.5%) |
| 55 to 64 Years | 0 (0.0%) | 0 (0.0%) |
| 65 to 74 Years | 6 (100.0%) | 5 (83.3%) |
| 75 Years and over | 4 (100.0%) | 2 (50.0%) |
| Total | 24 (58.5%) | 20 (48.8%) |
Disability Status by Sex by Age in Minturn
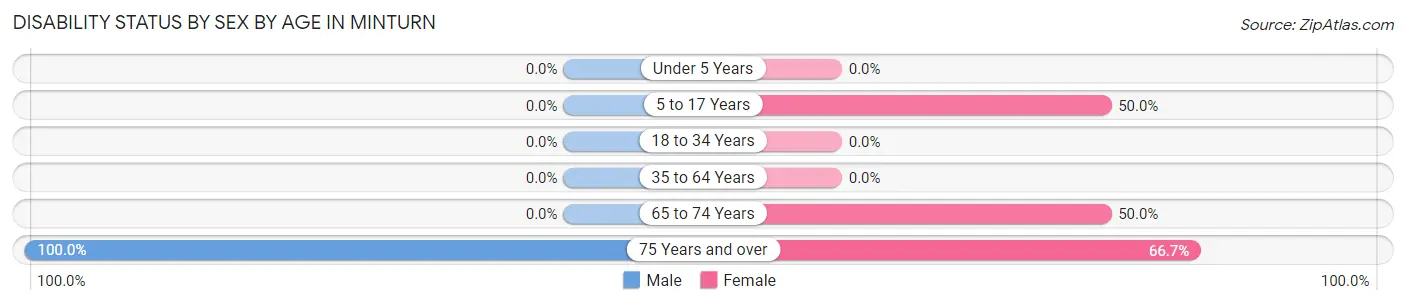
| Age Bracket | Male | Female |
| Under 5 Years | 0 (0.0%) | 0 (0.0%) |
| 5 to 17 Years | 0 (0.0%) | 2 (50.0%) |
| 18 to 34 Years | 0 (0.0%) | 0 (0.0%) |
| 35 to 64 Years | 0 (0.0%) | 0 (0.0%) |
| 65 to 74 Years | 0 (0.0%) | 1 (50.0%) |
| 75 Years and over | 1 (100.0%) | 2 (66.7%) |
Disability Class by Sex by Age in Minturn
Disability Class: Hearing Difficulty
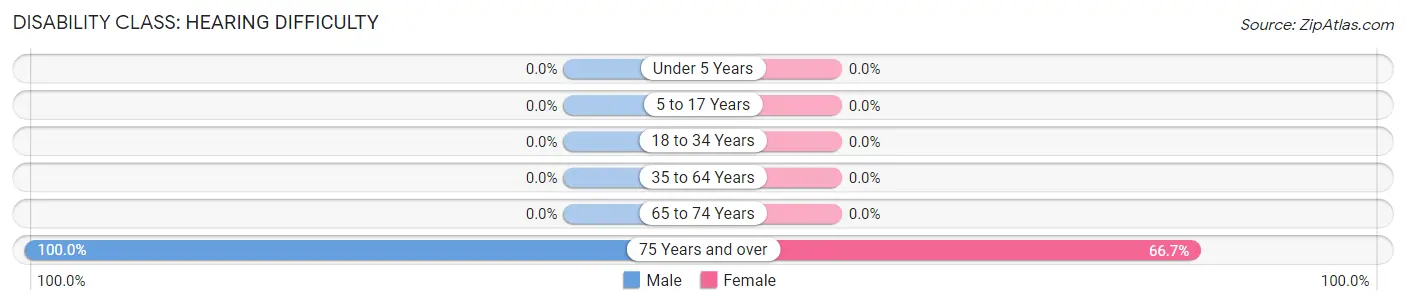
| Age Bracket | Male | Female |
| Under 5 Years | 0 (0.0%) | 0 (0.0%) |
| 5 to 17 Years | 0 (0.0%) | 0 (0.0%) |
| 18 to 34 Years | 0 (0.0%) | 0 (0.0%) |
| 35 to 64 Years | 0 (0.0%) | 0 (0.0%) |
| 65 to 74 Years | 0 (0.0%) | 0 (0.0%) |
| 75 Years and over | 1 (100.0%) | 2 (66.7%) |
Disability Class: Vision Difficulty
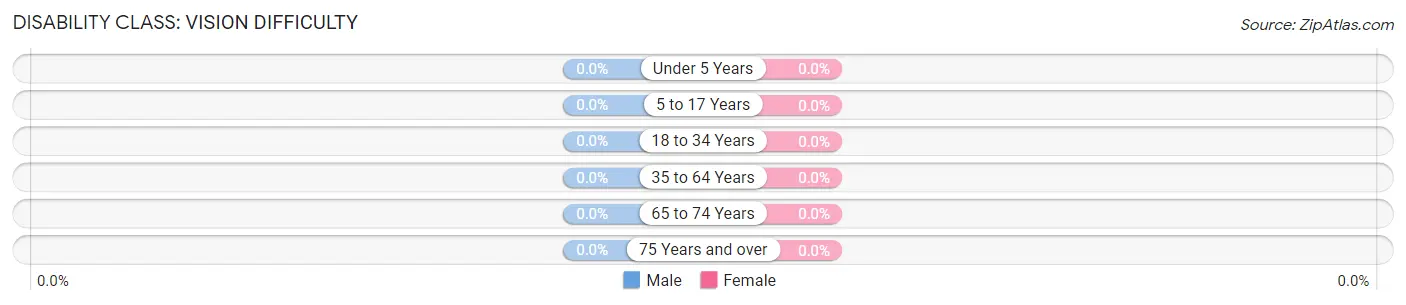
| Age Bracket | Male | Female |
| Under 5 Years | 0 (0.0%) | 0 (0.0%) |
| 5 to 17 Years | 0 (0.0%) | 0 (0.0%) |
| 18 to 34 Years | 0 (0.0%) | 0 (0.0%) |
| 35 to 64 Years | 0 (0.0%) | 0 (0.0%) |
| 65 to 74 Years | 0 (0.0%) | 0 (0.0%) |
| 75 Years and over | 0 (0.0%) | 0 (0.0%) |
Disability Class: Cognitive Difficulty
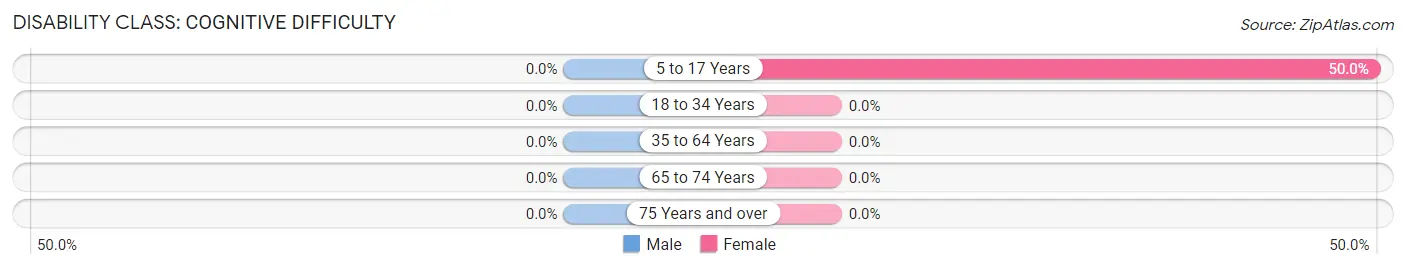
| Age Bracket | Male | Female |
| 5 to 17 Years | 0 (0.0%) | 2 (50.0%) |
| 18 to 34 Years | 0 (0.0%) | 0 (0.0%) |
| 35 to 64 Years | 0 (0.0%) | 0 (0.0%) |
| 65 to 74 Years | 0 (0.0%) | 0 (0.0%) |
| 75 Years and over | 0 (0.0%) | 0 (0.0%) |
Disability Class: Ambulatory Difficulty
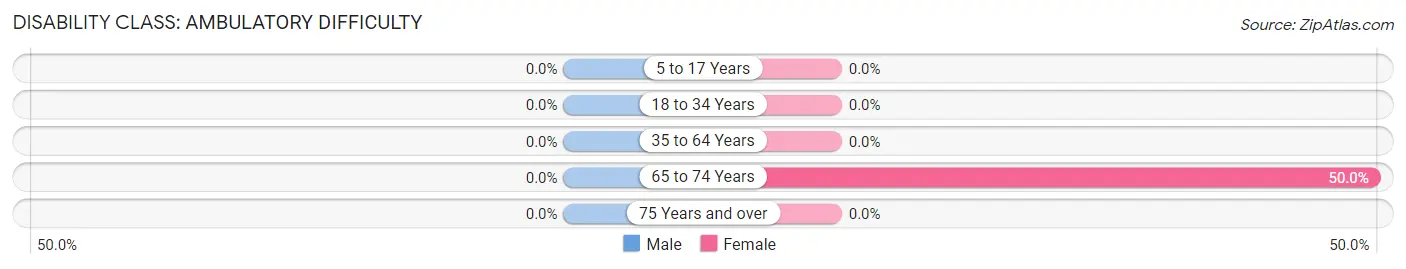
| Age Bracket | Male | Female |
| 5 to 17 Years | 0 (0.0%) | 0 (0.0%) |
| 18 to 34 Years | 0 (0.0%) | 0 (0.0%) |
| 35 to 64 Years | 0 (0.0%) | 0 (0.0%) |
| 65 to 74 Years | 0 (0.0%) | 1 (50.0%) |
| 75 Years and over | 0 (0.0%) | 0 (0.0%) |
Disability Class: Self-Care Difficulty
| Age Bracket | Male | Female |
| 5 to 17 Years | 0 (0.0%) | 0 (0.0%) |
| 18 to 34 Years | 0 (0.0%) | 0 (0.0%) |
| 35 to 64 Years | 0 (0.0%) | 0 (0.0%) |
| 65 to 74 Years | 0 (0.0%) | 0 (0.0%) |
| 75 Years and over | 0 (0.0%) | 0 (0.0%) |
Technology Access in Minturn
Computing Device Access in Minturn
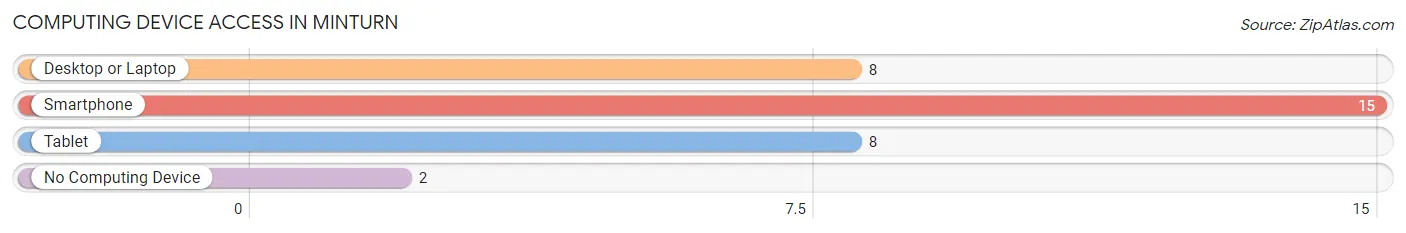
| Device Type | # Households | % Households |
| Desktop or Laptop | 8 | 47.1% |
| Smartphone | 15 | 88.2% |
| Tablet | 8 | 47.1% |
| No Computing Device | 2 | 11.8% |
| Total | 17 | 100.0% |
Internet Access in Minturn
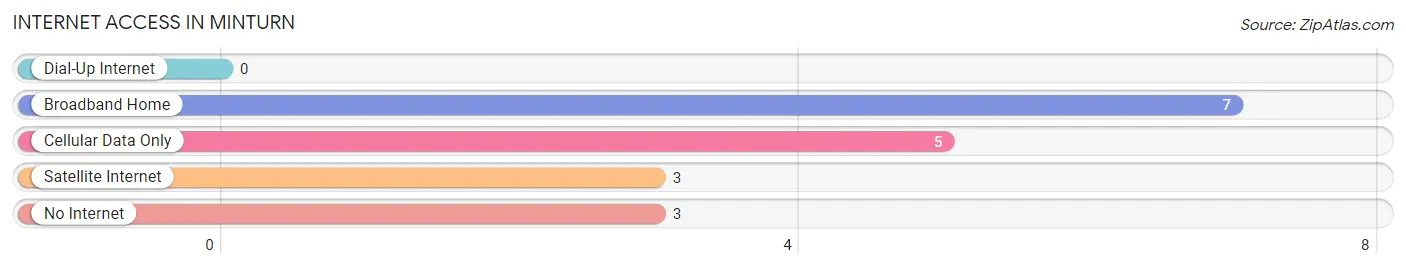
| Internet Type | # Households | % Households |
| Dial-Up Internet | 0 | 0.0% |
| Broadband Home | 7 | 41.2% |
| Cellular Data Only | 5 | 29.4% |
| Satellite Internet | 3 | 17.6% |
| No Internet | 3 | 17.6% |
| Total | 17 | 100.0% |
Minturn Summary
Minturn is a small town located in Arkansas, United States. It is situated in the northern part of the state, in the Arkansas Delta region. The town is located in Lee County, and is part of the Little Rock-North Little Rock-Conway Metropolitan Statistical Area. The population of Minturn was estimated to be 545 in the year 2020.
History
Minturn was founded in 1883 by the Arkansas and Louisiana Railroad. The town was named after the Minturn family, who were prominent landowners in the area. The town was incorporated in 1887.
Minturn was a thriving agricultural community in the early 20th century. Cotton was the main crop grown in the area, and the town was home to several cotton gins. The town also had a sawmill, a gristmill, and a brickyard.
In the late 20th century, Minturn began to decline. The cotton industry in the area declined, and the town's population began to decrease. The town's economy shifted to focus on tourism, as the town is located near several lakes and rivers.
Geography
Minturn is located in the Arkansas Delta region, in the northern part of the state. The town is situated in Lee County, and is part of the Little Rock-North Little Rock-Conway Metropolitan Statistical Area. The town is located at the intersection of Arkansas Highway 1 and Arkansas Highway 17.
The town is located in a flat, low-lying area, with an elevation of approximately 200 feet. The town is located near several lakes and rivers, including the White River, the Arkansas River, and the Cache River.
Economy
Minturn's economy is largely based on tourism. The town is located near several lakes and rivers, which attract visitors for fishing, boating, and other recreational activities. The town is also home to several restaurants, hotels, and other businesses that cater to tourists.
The town is also home to several small businesses, including a grocery store, a hardware store, and a gas station. The town is also home to a few manufacturing companies, which produce furniture, clothing, and other products.
Demographics
Minturn has a population of 545, according to the 2020 census. The town has a median age of 39.7 years, and a median household income of $37,917. The town is predominantly white, with a population that is 97.3% white, 0.7% African American, 0.4% Native American, 0.4% Asian, and 0.2% other.
Conclusion
Minturn is a small town located in Arkansas, United States. It is situated in the northern part of the state, in the Arkansas Delta region. The town is located in Lee County, and is part of the Little Rock-North Little Rock-Conway Metropolitan Statistical Area. The population of Minturn was estimated to be 545 in the year 2020. The town's economy is largely based on tourism, as it is located near several lakes and rivers. The town is predominantly white, with a population that is 97.3% white, 0.7% African American, 0.4% Native American, 0.4% Asian, and 0.2% other.
Common Questions
What is Per Capita Income in Minturn?
Per Capita income in Minturn is $22,420.
What is the Median Household income in Minturn?
Median Household Income in Minturn is $53,750.
What is Inequality or Gini Index in Minturn?
Inequality or Gini Index in Minturn is 0.31.
What is the Total Population of Minturn?
Total Population of Minturn is 41.
What is the Total Male Population of Minturn?
Total Male Population of Minturn is 18.
What is the Total Female Population of Minturn?
Total Female Population of Minturn is 23.
What is the Ratio of Males per 100 Females in Minturn?
There are 78.26 Males per 100 Females in Minturn.
What is the Ratio of Females per 100 Males in Minturn?
There are 127.78 Females per 100 Males in Minturn.
What is the Median Population Age in Minturn?
Median Population Age in Minturn is 46.2 Years.
What is the Average Family Size in Minturn
Average Family Size in Minturn is 2.8 People.
What is the Average Household Size in Minturn
Average Household Size in Minturn is 2.4 People.
How Large is the Labor Force in Minturn?
There are 24 People in the Labor Forcein in Minturn.
What is the Percentage of People in the Labor Force in Minturn?
72.7% of People are in the Labor Force in Minturn.
What is the Unemployment Rate in Minturn?
Unemployment Rate in Minturn is 29.2%.