Menifee, AR Map & Demographics
Menifee Map
Menifee Overview
$35,507
PER CAPITA INCOME
$86,875
AVG FAMILY INCOME
$59,886
AVG HOUSEHOLD INCOME
32.7%
WAGE / INCOME GAP [ % ]
67.3¢/ $1
WAGE / INCOME GAP [ $ ]
0.25
INEQUALITY / GINI INDEX
234
TOTAL POPULATION
134
MALE POPULATION
100
FEMALE POPULATION
134.00
MALES / 100 FEMALES
74.63
FEMALES / 100 MALES
53.7
MEDIAN AGE
2.6
AVG FAMILY SIZE
2.1
AVG HOUSEHOLD SIZE
118
LABOR FORCE [ PEOPLE ]
62.1%
PERCENT IN LABOR FORCE
5.1%
UNEMPLOYMENT RATE
Menifee Zip Codes
Menifee Area Codes
Income in Menifee
Income Overview in Menifee
Per Capita Income in Menifee is $35,507, while median incomes of families and households are $86,875 and $59,886 respectively.
| Characteristic | Number | Measure |
| Per Capita Income | 234 | $35,507 |
| Median Family Income | 75 | $86,875 |
| Mean Family Income | 75 | $75,643 |
| Median Household Income | 112 | $59,886 |
| Mean Household Income | 112 | $70,042 |
| Income Deficit | 75 | $0 |
| Wage / Income Gap (%) | 234 | 32.67% |
| Wage / Income Gap ($) | 234 | 67.33¢ per $1 |
| Gini / Inequality Index | 234 | 0.25 |
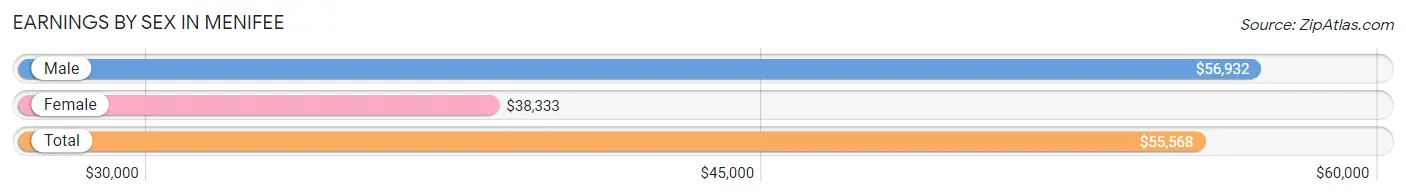
Earnings by Sex in Menifee
Average Earnings in Menifee are $55,568, $56,932 for men and $38,333 for women, a difference of 32.7%.
| Sex | Number | Average Earnings |
| Male | 78 (66.1%) | $56,932 |
| Female | 40 (33.9%) | $38,333 |
| Total | 118 (100.0%) | $55,568 |
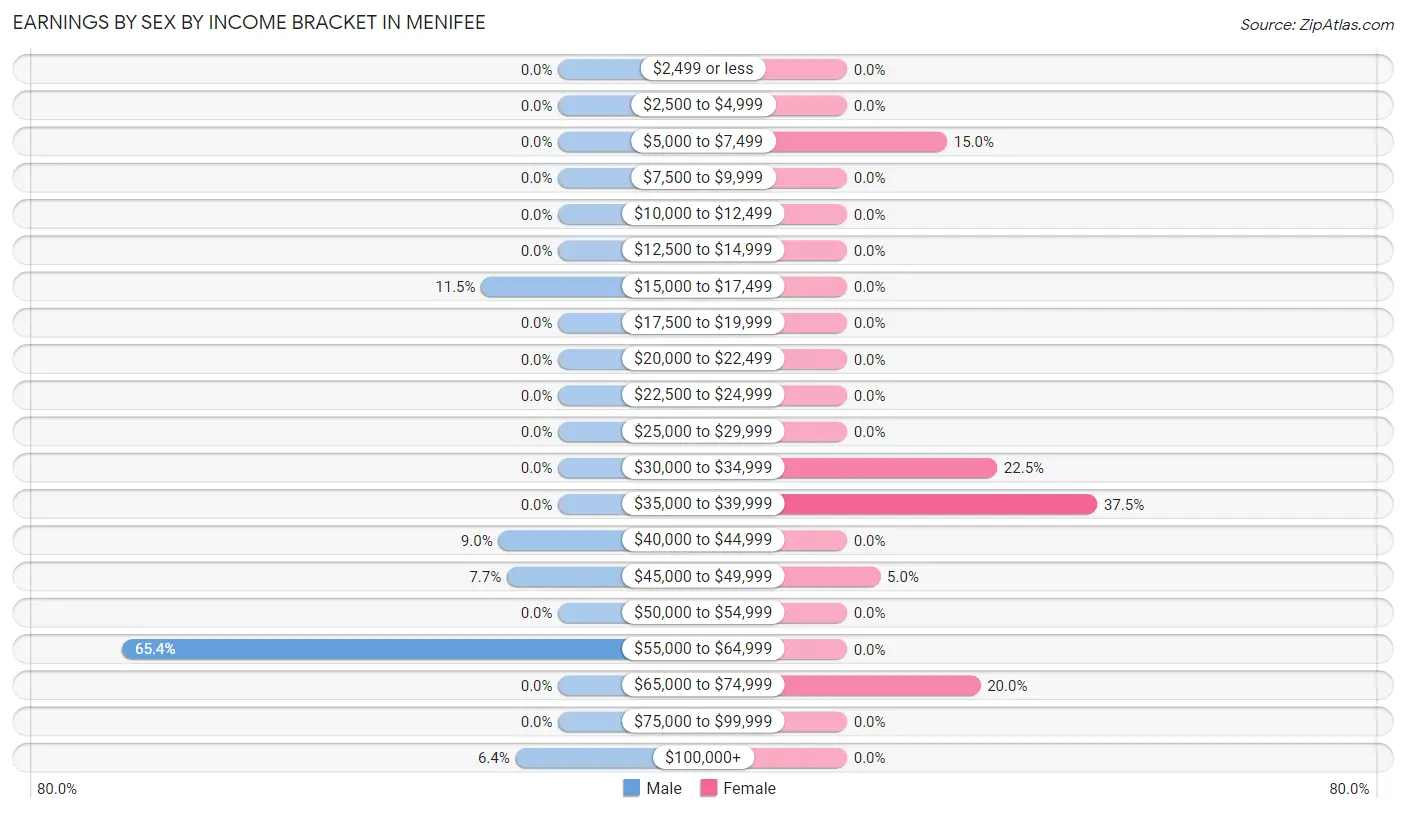
Earnings by Sex by Income Bracket in Menifee
The most common earnings brackets in Menifee are $55,000 to $64,999 for men (51 | 65.4%) and $35,000 to $39,999 for women (15 | 37.5%).
| Income | Male | Female |
| $2,499 or less | 0 (0.0%) | 0 (0.0%) |
| $2,500 to $4,999 | 0 (0.0%) | 0 (0.0%) |
| $5,000 to $7,499 | 0 (0.0%) | 6 (15.0%) |
| $7,500 to $9,999 | 0 (0.0%) | 0 (0.0%) |
| $10,000 to $12,499 | 0 (0.0%) | 0 (0.0%) |
| $12,500 to $14,999 | 0 (0.0%) | 0 (0.0%) |
| $15,000 to $17,499 | 9 (11.5%) | 0 (0.0%) |
| $17,500 to $19,999 | 0 (0.0%) | 0 (0.0%) |
| $20,000 to $22,499 | 0 (0.0%) | 0 (0.0%) |
| $22,500 to $24,999 | 0 (0.0%) | 0 (0.0%) |
| $25,000 to $29,999 | 0 (0.0%) | 0 (0.0%) |
| $30,000 to $34,999 | 0 (0.0%) | 9 (22.5%) |
| $35,000 to $39,999 | 0 (0.0%) | 15 (37.5%) |
| $40,000 to $44,999 | 7 (9.0%) | 0 (0.0%) |
| $45,000 to $49,999 | 6 (7.7%) | 2 (5.0%) |
| $50,000 to $54,999 | 0 (0.0%) | 0 (0.0%) |
| $55,000 to $64,999 | 51 (65.4%) | 0 (0.0%) |
| $65,000 to $74,999 | 0 (0.0%) | 8 (20.0%) |
| $75,000 to $99,999 | 0 (0.0%) | 0 (0.0%) |
| $100,000+ | 5 (6.4%) | 0 (0.0%) |
| Total | 78 (100.0%) | 40 (100.0%) |
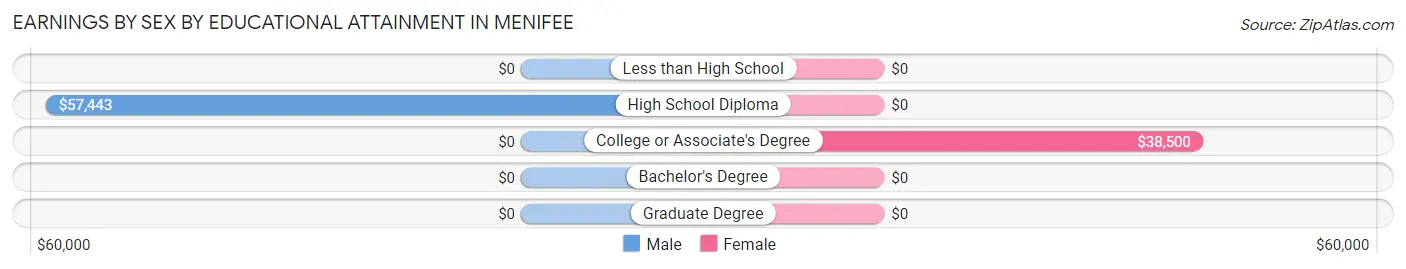
Earnings by Sex by Educational Attainment in Menifee
Average earnings in Menifee are $56,932 for men and $38,333 for women, a difference of 32.7%. Men with an educational attainment of high school diploma enjoy the highest average annual earnings of $57,443, while those with high school diploma education earn the least with $57,443. Women with an educational attainment of college or associate's degree earn the most with the average annual earnings of $38,500, while those with college or associate's degree education have the smallest earnings of $38,500.
| Educational Attainment | Male Income | Female Income |
| Less than High School | - | - |
| High School Diploma | $57,443 | $0 |
| College or Associate's Degree | - | - |
| Bachelor's Degree | - | - |
| Graduate Degree | - | - |
| Total | $56,932 | $38,333 |
Family Income in Menifee
Family Income Brackets in Menifee
According to the Menifee family income data, there are 32 families falling into the $100,000 to $149,999 income range, which is the most common income bracket and makes up 42.7% of all families.
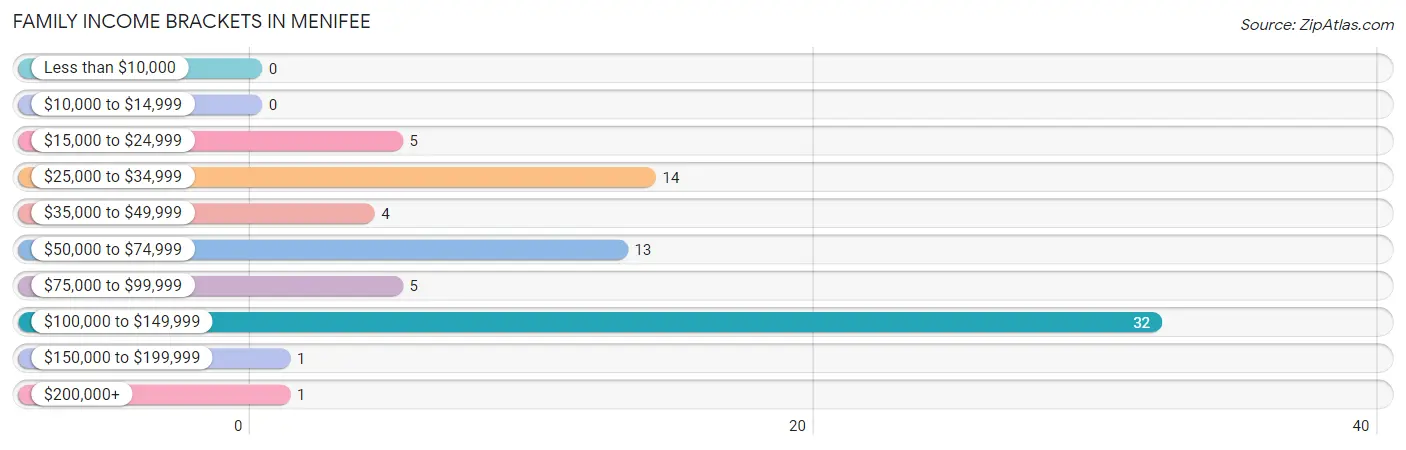
| Income Bracket | # Families | % Families |
| Less than $10,000 | 0 | 0.0% |
| $10,000 to $14,999 | 0 | 0.0% |
| $15,000 to $24,999 | 5 | 6.7% |
| $25,000 to $34,999 | 14 | 18.7% |
| $35,000 to $49,999 | 4 | 5.3% |
| $50,000 to $74,999 | 13 | 17.3% |
| $75,000 to $99,999 | 5 | 6.7% |
| $100,000 to $149,999 | 32 | 42.7% |
| $150,000 to $199,999 | 1 | 1.3% |
| $200,000+ | 1 | 1.3% |
Family Income by Famaliy Size in Menifee
3-person families (9 | 12.0%) account for the highest median family income in Menifee with $115,313 per family, while 2-person families (59 | 78.7%) have the highest median income of $44,792 per family member.
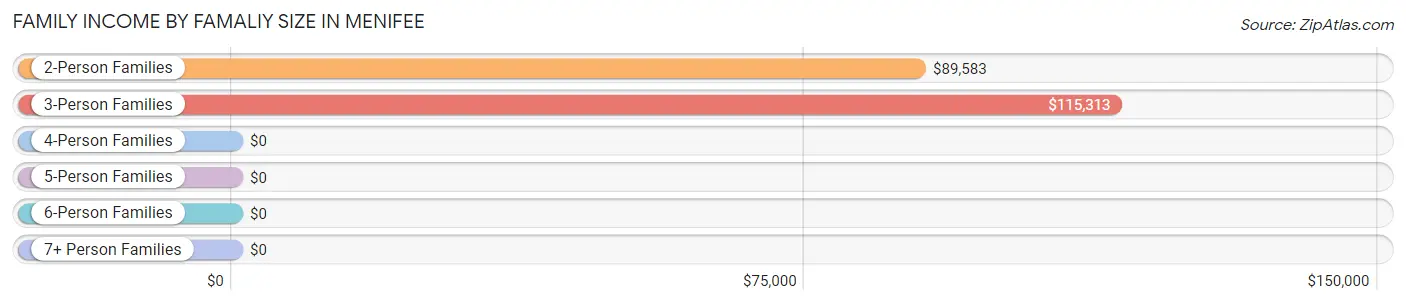
| Income Bracket | # Families | Median Income |
| 2-Person Families | 59 (78.7%) | $89,583 |
| 3-Person Families | 9 (12.0%) | $115,313 |
| 4-Person Families | 0 (0.0%) | $0 |
| 5-Person Families | 7 (9.3%) | $0 |
| 6-Person Families | 0 (0.0%) | $0 |
| 7+ Person Families | 0 (0.0%) | $0 |
| Total | 75 (100.0%) | $86,875 |
Family Income by Number of Earners in Menifee
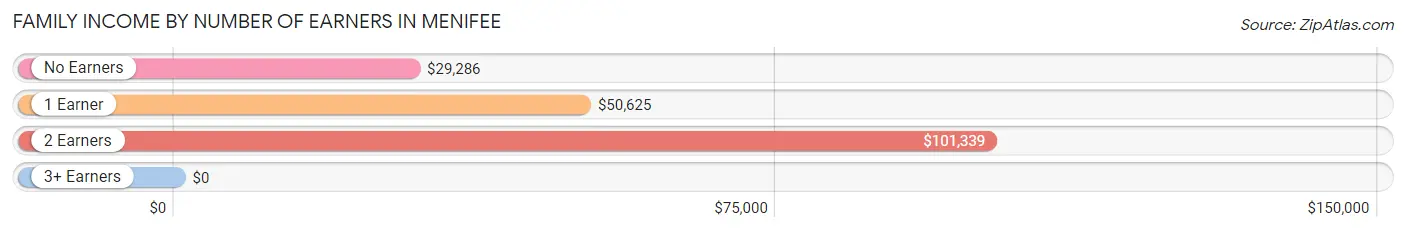
| Number of Earners | # Families | Median Income |
| No Earners | 20 (26.7%) | $29,286 |
| 1 Earner | 19 (25.3%) | $50,625 |
| 2 Earners | 36 (48.0%) | $101,339 |
| 3+ Earners | 0 (0.0%) | $0 |
| Total | 75 (100.0%) | $86,875 |
Household Income in Menifee
Household Income Brackets in Menifee
With 46 households falling in the category, the $50,000 to $74,999 income range is the most frequent in Menifee, accounting for 41.1% of all households.
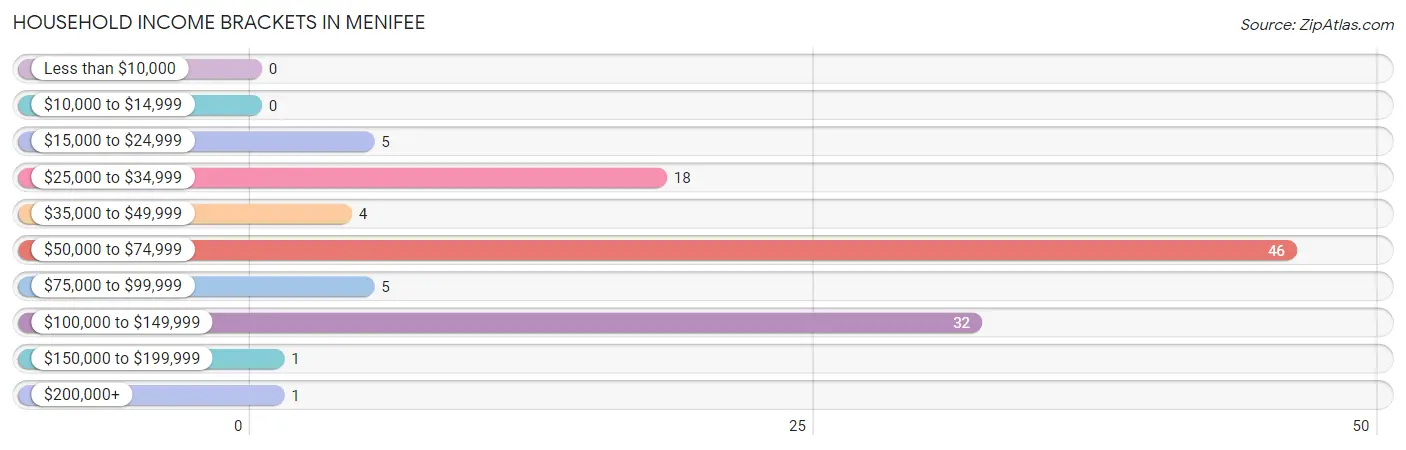
| Income Bracket | # Households | % Households |
| Less than $10,000 | 0 | 0.0% |
| $10,000 to $14,999 | 0 | 0.0% |
| $15,000 to $24,999 | 5 | 4.5% |
| $25,000 to $34,999 | 18 | 16.1% |
| $35,000 to $49,999 | 4 | 3.6% |
| $50,000 to $74,999 | 46 | 41.1% |
| $75,000 to $99,999 | 5 | 4.5% |
| $100,000 to $149,999 | 32 | 28.6% |
| $150,000 to $199,999 | 1 | 0.9% |
| $200,000+ | 1 | 0.9% |
Household Income by Householder Age in Menifee
The median household income in Menifee is $59,886, with the highest median household income of $67,778 found in the 65+ years age bracket for the primary householder. A total of 22 households (19.6%) fall into this category.
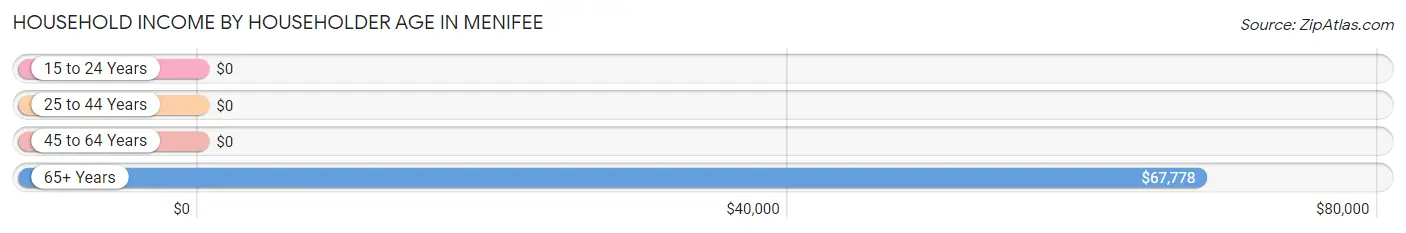
| Income Bracket | # Households | Median Income |
| 15 to 24 Years | 0 (0.0%) | $0 |
| 25 to 44 Years | 8 (7.1%) | $0 |
| 45 to 64 Years | 82 (73.2%) | $0 |
| 65+ Years | 22 (19.6%) | $67,778 |
| Total | 112 (100.0%) | $59,886 |
Poverty in Menifee
Income Below Poverty by Sex and Age in Menifee
With 26.9% poverty level for males and 23.0% for females among the residents of Menifee, 12 to 14 year old males and 12 to 14 year old females are the most vulnerable to poverty, with 12 males (100.0%) and 13 females (100.0%) in their respective age groups living below the poverty level.
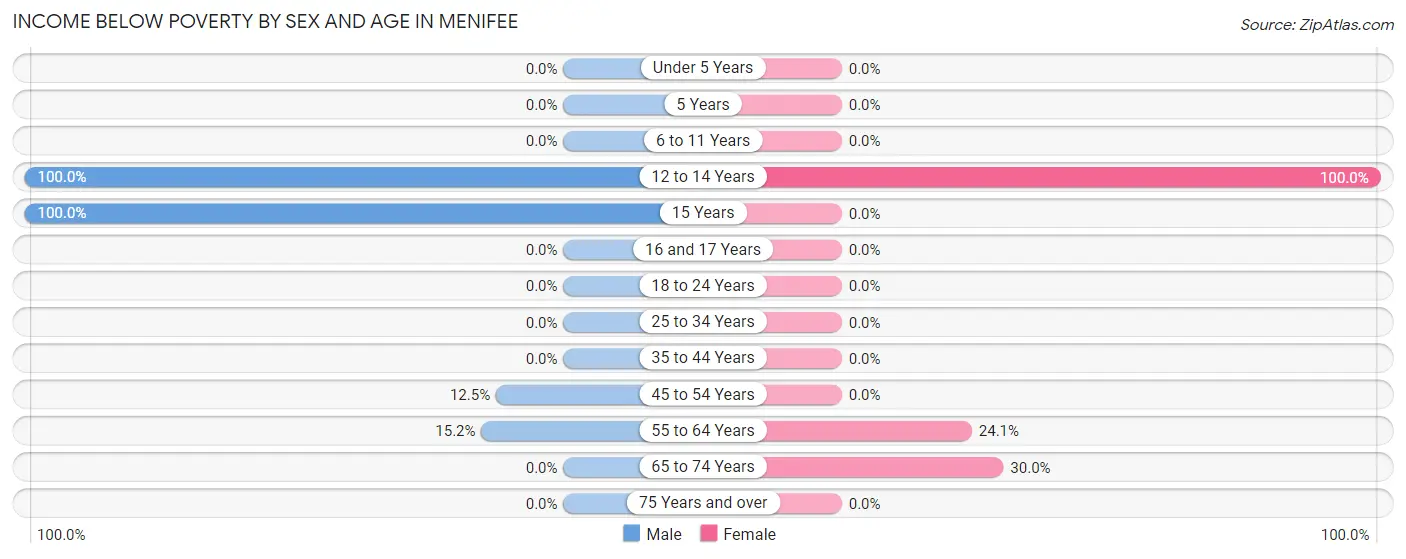
| Age Bracket | Male | Female |
| Under 5 Years | 0 (0.0%) | 0 (0.0%) |
| 5 Years | 0 (0.0%) | 0 (0.0%) |
| 6 to 11 Years | 0 (0.0%) | 0 (0.0%) |
| 12 to 14 Years | 12 (100.0%) | 13 (100.0%) |
| 15 Years | 13 (100.0%) | 0 (0.0%) |
| 16 and 17 Years | 0 (0.0%) | 0 (0.0%) |
| 18 to 24 Years | 0 (0.0%) | 0 (0.0%) |
| 25 to 34 Years | 0 (0.0%) | 0 (0.0%) |
| 35 to 44 Years | 0 (0.0%) | 0 (0.0%) |
| 45 to 54 Years | 4 (12.5%) | 0 (0.0%) |
| 55 to 64 Years | 7 (15.2%) | 7 (24.1%) |
| 65 to 74 Years | 0 (0.0%) | 3 (30.0%) |
| 75 Years and over | 0 (0.0%) | 0 (0.0%) |
| Total | 36 (26.9%) | 23 (23.0%) |
Income Above Poverty by Sex and Age in Menifee
According to the poverty statistics in Menifee, males aged 25 to 34 years and females aged 5 years are the age groups that are most secure financially, with 100.0% of males and 100.0% of females in these age groups living above the poverty line.
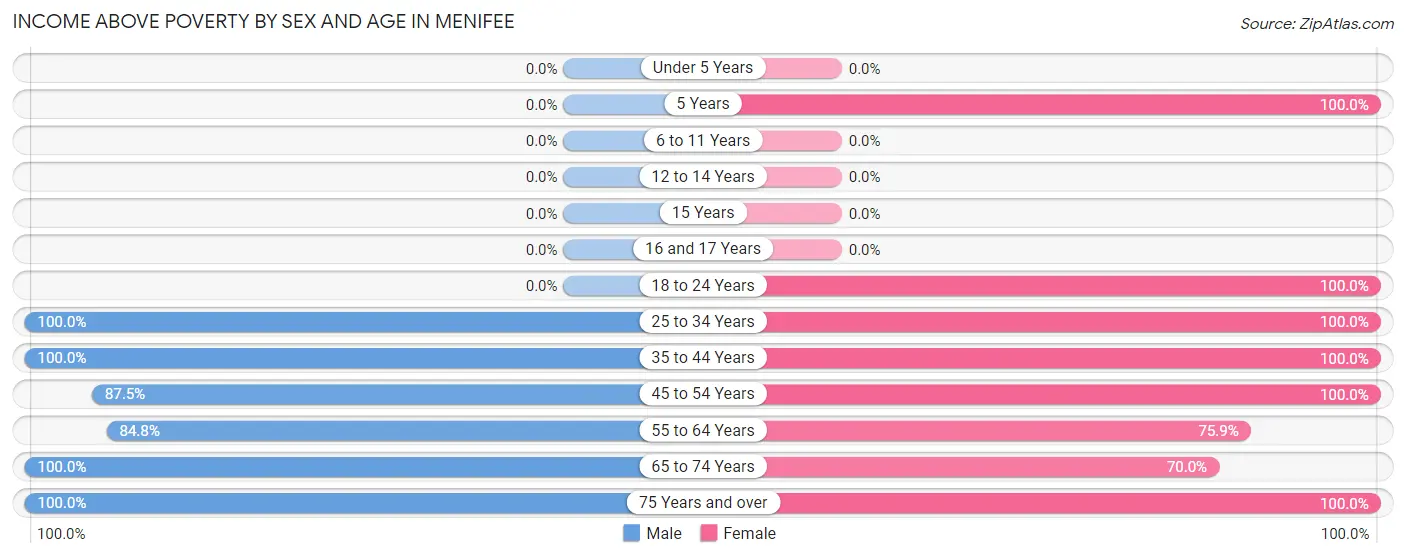
| Age Bracket | Male | Female |
| Under 5 Years | 0 (0.0%) | 0 (0.0%) |
| 5 Years | 0 (0.0%) | 6 (100.0%) |
| 6 to 11 Years | 0 (0.0%) | 0 (0.0%) |
| 12 to 14 Years | 0 (0.0%) | 0 (0.0%) |
| 15 Years | 0 (0.0%) | 0 (0.0%) |
| 16 and 17 Years | 0 (0.0%) | 0 (0.0%) |
| 18 to 24 Years | 0 (0.0%) | 8 (100.0%) |
| 25 to 34 Years | 8 (100.0%) | 4 (100.0%) |
| 35 to 44 Years | 1 (100.0%) | 4 (100.0%) |
| 45 to 54 Years | 28 (87.5%) | 21 (100.0%) |
| 55 to 64 Years | 39 (84.8%) | 22 (75.9%) |
| 65 to 74 Years | 16 (100.0%) | 7 (70.0%) |
| 75 Years and over | 6 (100.0%) | 5 (100.0%) |
| Total | 98 (73.1%) | 77 (77.0%) |
Income Below Poverty Among Married-Couple Families in Menifee
The poverty statistics for married-couple families in Menifee show that 11.9% or 7 of the total 59 families live below the poverty line. Families with 3 or 4 children have the highest poverty rate of 100.0%, comprising of 7 families. On the other hand, families with no children have the lowest poverty rate of 0.0%, which includes 0 families.
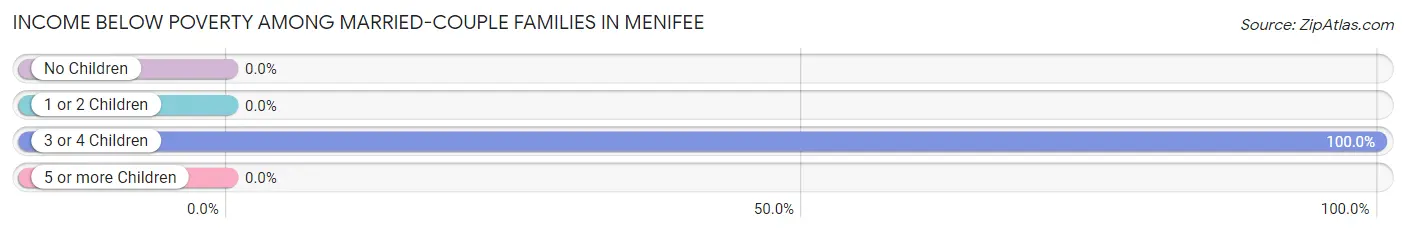
| Children | Above Poverty | Below Poverty |
| No Children | 52 (100.0%) | 0 (0.0%) |
| 1 or 2 Children | 0 (0.0%) | 0 (0.0%) |
| 3 or 4 Children | 0 (0.0%) | 7 (100.0%) |
| 5 or more Children | 0 (0.0%) | 0 (0.0%) |
| Total | 52 (88.1%) | 7 (11.9%) |
Income Below Poverty Among Single-Parent Households in Menifee
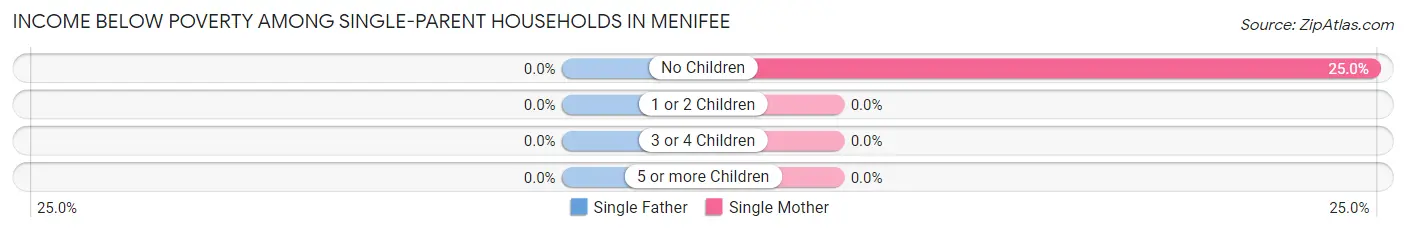
| Children | Single Father | Single Mother |
| No Children | 0 (0.0%) | 3 (25.0%) |
| 1 or 2 Children | 0 (0.0%) | 0 (0.0%) |
| 3 or 4 Children | 0 (0.0%) | 0 (0.0%) |
| 5 or more Children | 0 (0.0%) | 0 (0.0%) |
| Total | 0 (0.0%) | 3 (18.8%) |
Income Below Poverty Among Married-Couple vs Single-Parent Households in Menifee
The poverty data for Menifee shows that 7 of the married-couple family households (11.9%) and 3 of the single-parent households (18.8%) are living below the poverty level. Within the married-couple family households, those with 3 or 4 children have the highest poverty rate, with 7 households (100.0%) falling below the poverty line. Among the single-parent households, those with no children have the highest poverty rate, with 3 household (25.0%) living below poverty.
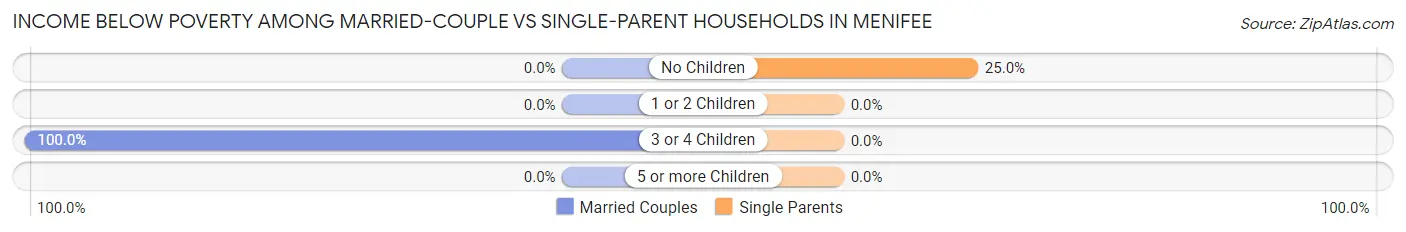
| Children | Married-Couple Families | Single-Parent Households |
| No Children | 0 (0.0%) | 3 (25.0%) |
| 1 or 2 Children | 0 (0.0%) | 0 (0.0%) |
| 3 or 4 Children | 7 (100.0%) | 0 (0.0%) |
| 5 or more Children | 0 (0.0%) | 0 (0.0%) |
| Total | 7 (11.9%) | 3 (18.8%) |
Race in Menifee
The most populous races in Menifee are Black / African American (215 | 91.9%), White / Caucasian (15 | 6.4%), and Two or more Races (4 | 1.7%).
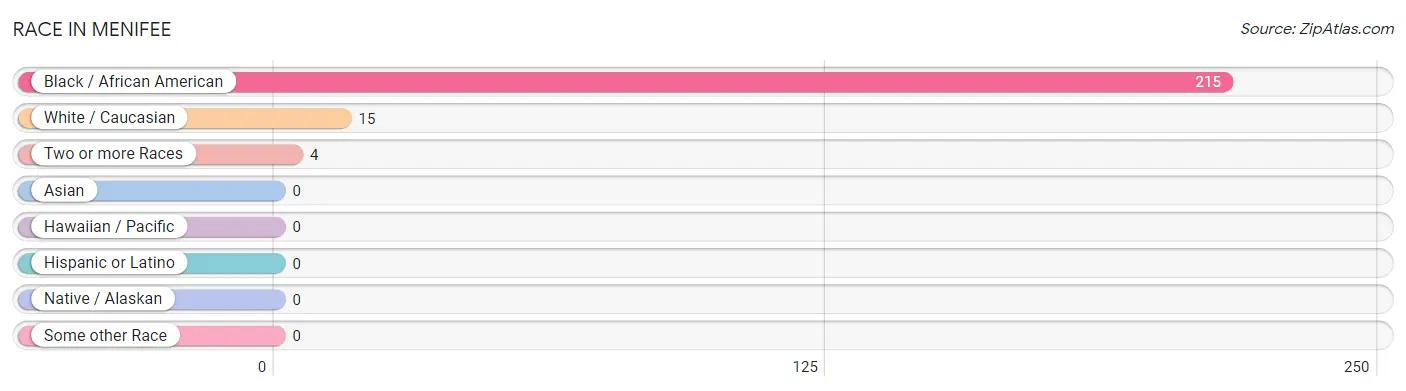
| Race | # Population | % Population |
| Asian | 0 | 0.0% |
| Black / African American | 215 | 91.9% |
| Hawaiian / Pacific | 0 | 0.0% |
| Hispanic or Latino | 0 | 0.0% |
| Native / Alaskan | 0 | 0.0% |
| White / Caucasian | 15 | 6.4% |
| Two or more Races | 4 | 1.7% |
| Some other Race | 0 | 0.0% |
| Total | 234 | 100.0% |
Ancestry in Menifee
The most populous ancestries reported in Menifee are American (14 | 6.0%), African (8 | 3.4%), Irish (8 | 3.4%), Subsaharan African (8 | 3.4%), and Scotch-Irish (3 | 1.3%), together accounting for 17.5% of all Menifee residents.
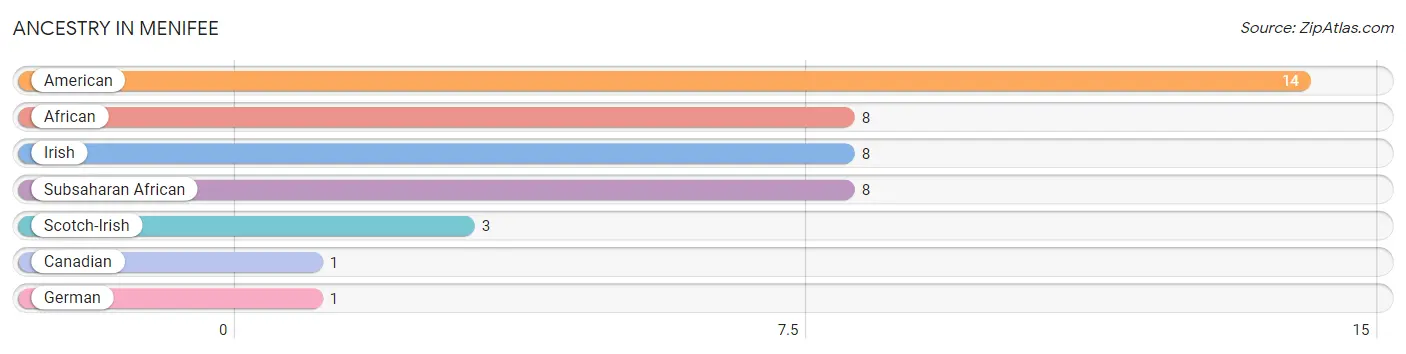
| Ancestry | # Population | % Population |
| African | 8 | 3.4% |
| American | 14 | 6.0% |
| Canadian | 1 | 0.4% |
| German | 1 | 0.4% |
| Irish | 8 | 3.4% |
| Scotch-Irish | 3 | 1.3% |
| Subsaharan African | 8 | 3.4% | View All 7 Rows |
Immigrants in Menifee

| Immigration Origin | # Population | % Population | View All 0 Rows |
Sex and Age in Menifee
Sex and Age in Menifee
The most populous age groups in Menifee are 45 to 49 Years (32 | 23.9%) for men and 50 to 54 Years (21 | 21.0%) for women.
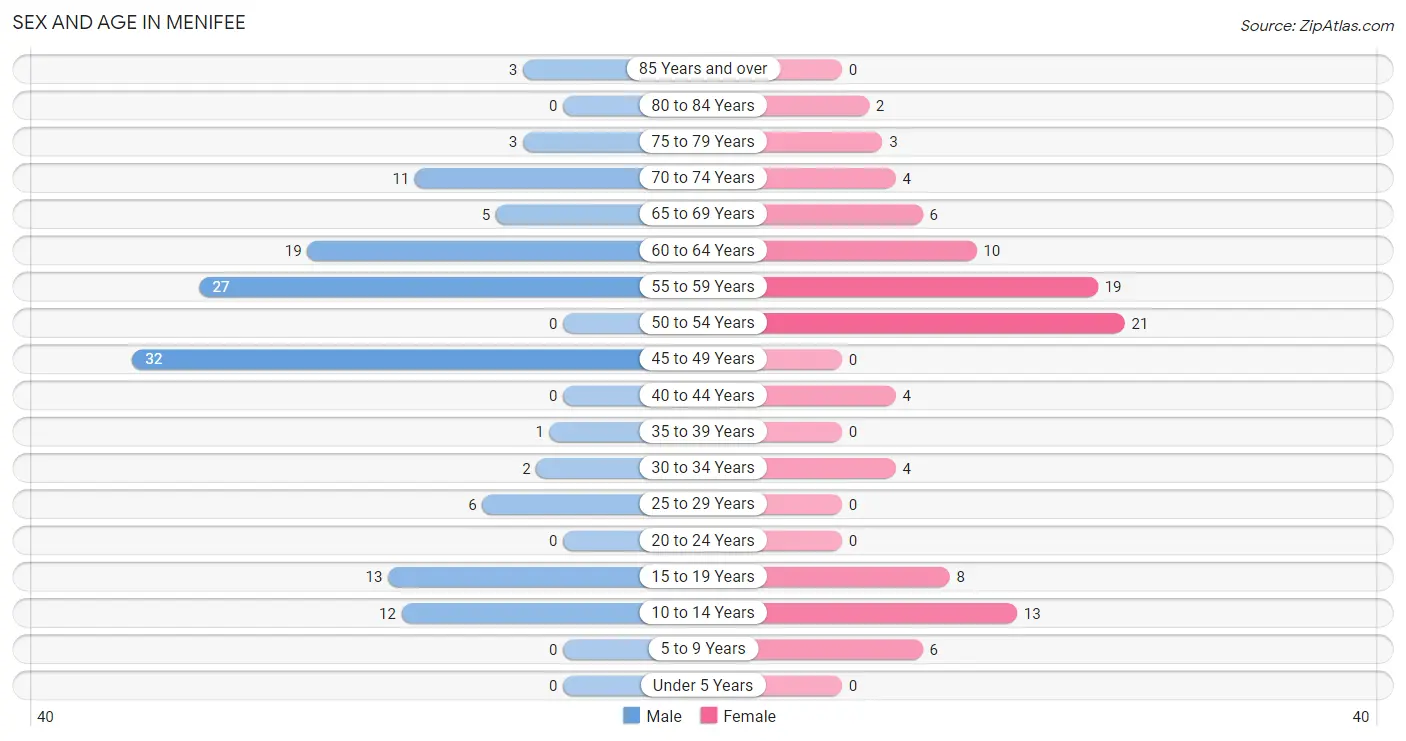
| Age Bracket | Male | Female |
| Under 5 Years | 0 (0.0%) | 0 (0.0%) |
| 5 to 9 Years | 0 (0.0%) | 6 (6.0%) |
| 10 to 14 Years | 12 (9.0%) | 13 (13.0%) |
| 15 to 19 Years | 13 (9.7%) | 8 (8.0%) |
| 20 to 24 Years | 0 (0.0%) | 0 (0.0%) |
| 25 to 29 Years | 6 (4.5%) | 0 (0.0%) |
| 30 to 34 Years | 2 (1.5%) | 4 (4.0%) |
| 35 to 39 Years | 1 (0.7%) | 0 (0.0%) |
| 40 to 44 Years | 0 (0.0%) | 4 (4.0%) |
| 45 to 49 Years | 32 (23.9%) | 0 (0.0%) |
| 50 to 54 Years | 0 (0.0%) | 21 (21.0%) |
| 55 to 59 Years | 27 (20.2%) | 19 (19.0%) |
| 60 to 64 Years | 19 (14.2%) | 10 (10.0%) |
| 65 to 69 Years | 5 (3.7%) | 6 (6.0%) |
| 70 to 74 Years | 11 (8.2%) | 4 (4.0%) |
| 75 to 79 Years | 3 (2.2%) | 3 (3.0%) |
| 80 to 84 Years | 0 (0.0%) | 2 (2.0%) |
| 85 Years and over | 3 (2.2%) | 0 (0.0%) |
| Total | 134 (100.0%) | 100 (100.0%) |
Families and Households in Menifee
Median Family Size in Menifee
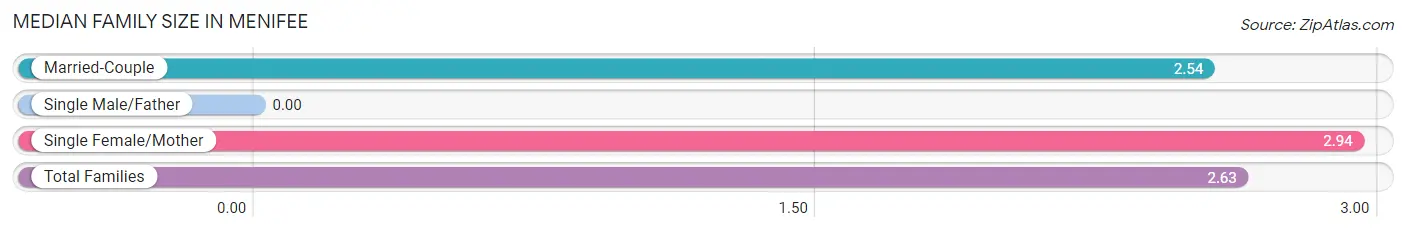
| Family Type | # Families | Family Size |
| Married-Couple | 59 (78.7%) | 2.54 |
| Single Male/Father | 0 (0.0%) | - |
| Single Female/Mother | 16 (21.3%) | 2.94 |
| Total Families | 75 (100.0%) | 2.63 |
Median Household Size in Menifee
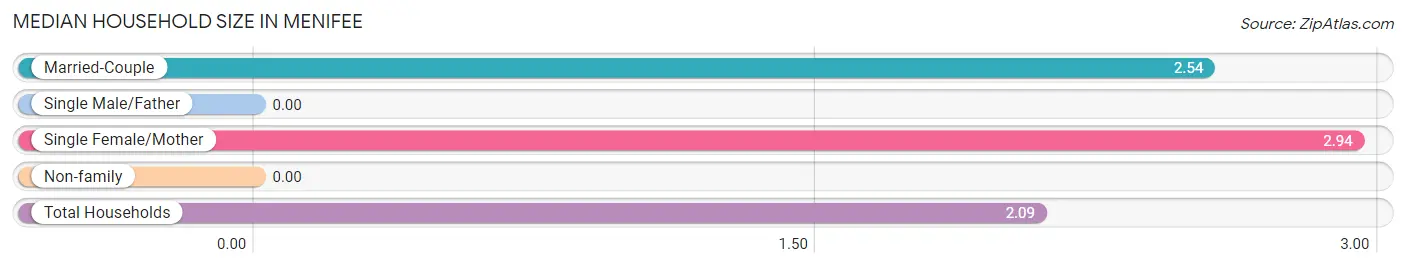
| Household Type | # Households | Household Size |
| Married-Couple | 59 (52.7%) | 2.54 |
| Single Male/Father | 0 (0.0%) | - |
| Single Female/Mother | 16 (14.3%) | 2.94 |
| Non-family | 37 (33.0%) | - |
| Total Households | 112 (100.0%) | 2.09 |
Household Size by Marriage Status in Menifee
Out of a total of 112 households in Menifee, 75 (67.0%) are family households, while 37 (33.0%) are nonfamily households. The most numerous type of family households are 2-person households, comprising 59, and the most common type of nonfamily households are 1-person households, comprising 37.
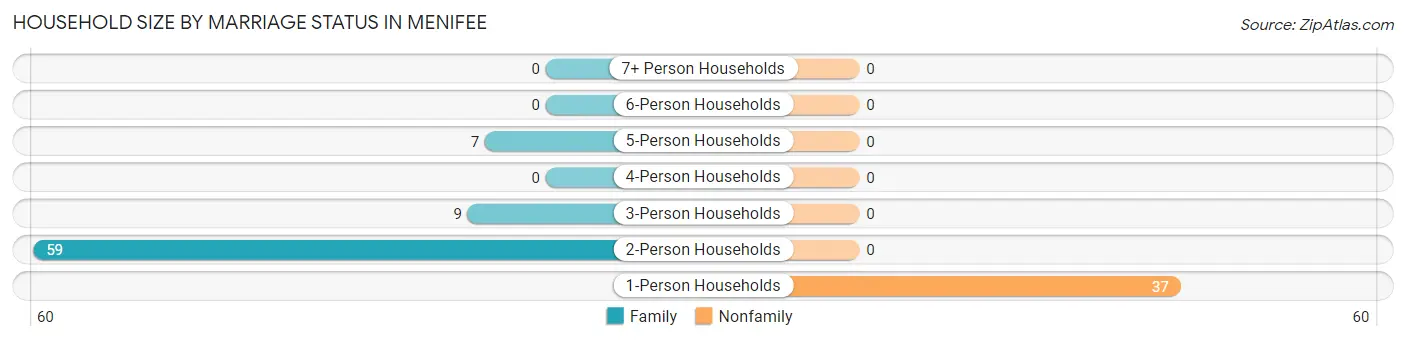
| Household Size | Family Households | Nonfamily Households |
| 1-Person Households | - | 37 (33.0%) |
| 2-Person Households | 59 (52.7%) | 0 (0.0%) |
| 3-Person Households | 9 (8.0%) | 0 (0.0%) |
| 4-Person Households | 0 (0.0%) | 0 (0.0%) |
| 5-Person Households | 7 (6.2%) | 0 (0.0%) |
| 6-Person Households | 0 (0.0%) | 0 (0.0%) |
| 7+ Person Households | 0 (0.0%) | 0 (0.0%) |
| Total | 75 (67.0%) | 37 (33.0%) |
Female Fertility in Menifee
Fertility by Age in Menifee
| Age Bracket | Women with Births | Births / 1,000 Women |
| 15 to 19 years | 0 (0.0%) | 0.0 |
| 20 to 34 years | 0 (0.0%) | 0.0 |
| 35 to 50 years | 0 (0.0%) | 0.0 |
| Total | 0 (0.0%) | 0.0 |
Fertility by Age by Marriage Status in Menifee
| Age Bracket | Married | Unmarried |
| 15 to 19 years | 0 (0.0%) | 0 (0.0%) |
| 20 to 34 years | 0 (0.0%) | 0 (0.0%) |
| 35 to 50 years | 0 (0.0%) | 0 (0.0%) |
| Total | 0 (0.0%) | 0 (0.0%) |
Fertility by Education in Menifee
| Educational Attainment | Women with Births | Births / 1,000 Women |
| Less than High School | 0 (0.0%) | 0.0 |
| High School Diploma | 0 (0.0%) | 0.0 |
| College or Associate's Degree | 0 (0.0%) | 0.0 |
| Bachelor's Degree | 0 (0.0%) | 0.0 |
| Graduate Degree | 0 (0.0%) | 0.0 |
| Total | 0 (0.0%) | 0.0 |
Fertility by Education by Marriage Status in Menifee
| Educational Attainment | Married | Unmarried |
| Less than High School | 0 (0.0%) | 0 (0.0%) |
| High School Diploma | 0 (0.0%) | 0 (0.0%) |
| College or Associate's Degree | 0 (0.0%) | 0 (0.0%) |
| Bachelor's Degree | 0 (0.0%) | 0 (0.0%) |
| Graduate Degree | 0 (0.0%) | 0 (0.0%) |
| Total | 0 (0.0%) | 0 (0.0%) |
Employment Characteristics in Menifee
Employment by Class of Employer in Menifee
Among the 112 employed individuals in Menifee, private company employees (95 | 84.8%), state government employees (10 | 8.9%), and not-for-profit organizations (4 | 3.6%) make up the most common classes of employment.
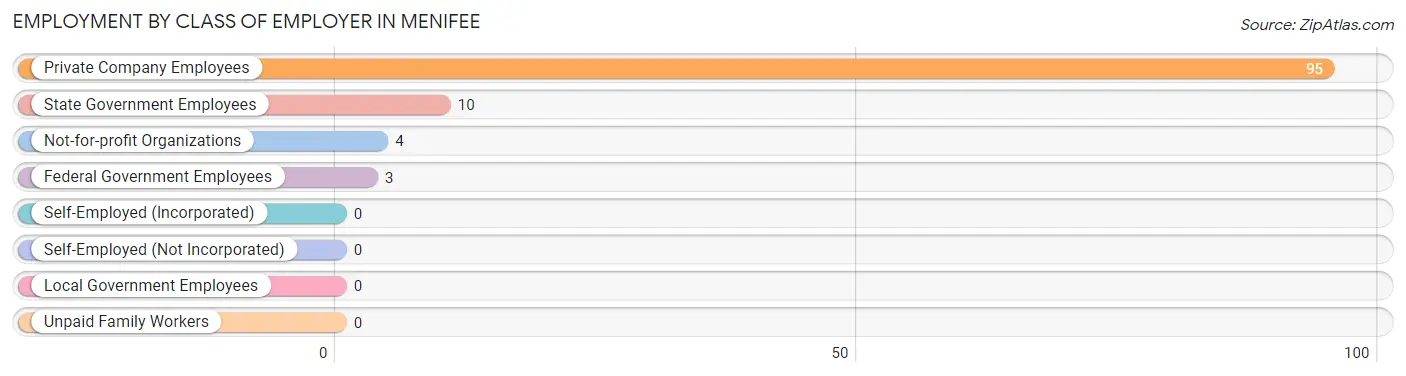
| Employer Class | # Employees | % Employees |
| Private Company Employees | 95 | 84.8% |
| Self-Employed (Incorporated) | 0 | 0.0% |
| Self-Employed (Not Incorporated) | 0 | 0.0% |
| Not-for-profit Organizations | 4 | 3.6% |
| Local Government Employees | 0 | 0.0% |
| State Government Employees | 10 | 8.9% |
| Federal Government Employees | 3 | 2.7% |
| Unpaid Family Workers | 0 | 0.0% |
| Total | 112 | 100.0% |
Employment Status by Age in Menifee
According to the labor force statistics for Menifee, out of the total population over 16 years of age (190), 62.1% or 118 individuals are in the labor force, with 5.1% or 6 of them unemployed. The age group with the highest labor force participation rate is 25 to 29 years, with 100.0% or 6 individuals in the labor force. Within the labor force, the 60 to 64 years age range has the highest percentage of unemployed individuals, with 54.5% or 6 of them being unemployed.
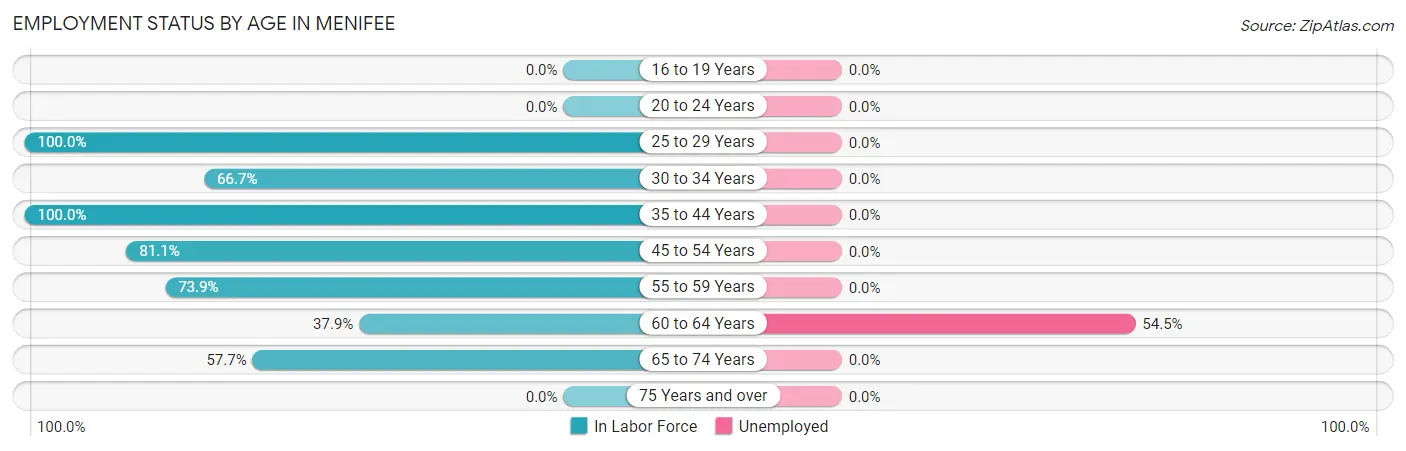
| Age Bracket | In Labor Force | Unemployed |
| 16 to 19 Years | 0 (0.0%) | 0 (0.0%) |
| 20 to 24 Years | 0 (0.0%) | 0 (0.0%) |
| 25 to 29 Years | 6 (100.0%) | 0 (0.0%) |
| 30 to 34 Years | 4 (66.7%) | 0 (0.0%) |
| 35 to 44 Years | 5 (100.0%) | 0 (0.0%) |
| 45 to 54 Years | 43 (81.1%) | 0 (0.0%) |
| 55 to 59 Years | 34 (73.9%) | 0 (0.0%) |
| 60 to 64 Years | 11 (37.9%) | 6 (54.5%) |
| 65 to 74 Years | 15 (57.7%) | 0 (0.0%) |
| 75 Years and over | 0 (0.0%) | 0 (0.0%) |
| Total | 118 (62.1%) | 6 (5.1%) |
Employment Status by Educational Attainment in Menifee
According to labor force statistics for Menifee, 71.0% of individuals (103) out of the total population between 25 and 64 years of age (145) are in the labor force, with 5.8% or 6 of them being unemployed. The group with the highest labor force participation rate are those with the educational attainment of high school diploma, with 88.7% or 63 individuals in the labor force. Within the labor force, individuals with college / associate degree education have the highest percentage of unemployment, with 19.4% or 6 of them being unemployed.
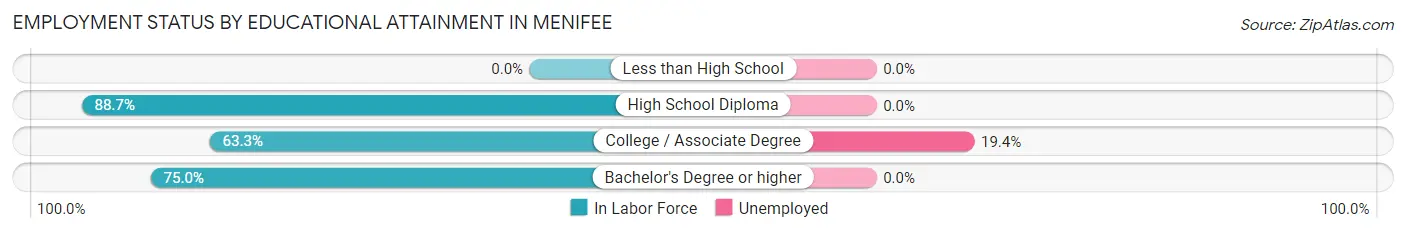
| Educational Attainment | In Labor Force | Unemployed |
| Less than High School | 0 (0.0%) | 0 (0.0%) |
| High School Diploma | 63 (88.7%) | 0 (0.0%) |
| College / Associate Degree | 31 (63.3%) | 10 (19.4%) |
| Bachelor's Degree or higher | 9 (75.0%) | 0 (0.0%) |
| Total | 103 (71.0%) | 8 (5.8%) |
Employment Occupations by Sex in Menifee
Management, Business, Science and Arts Occupations
The most common Management, Business, Science and Arts occupations in Menifee are Business & Financial (6 | 5.4%), Management (5 | 4.5%), and Health Diagnosing & Treating (4 | 3.6%).
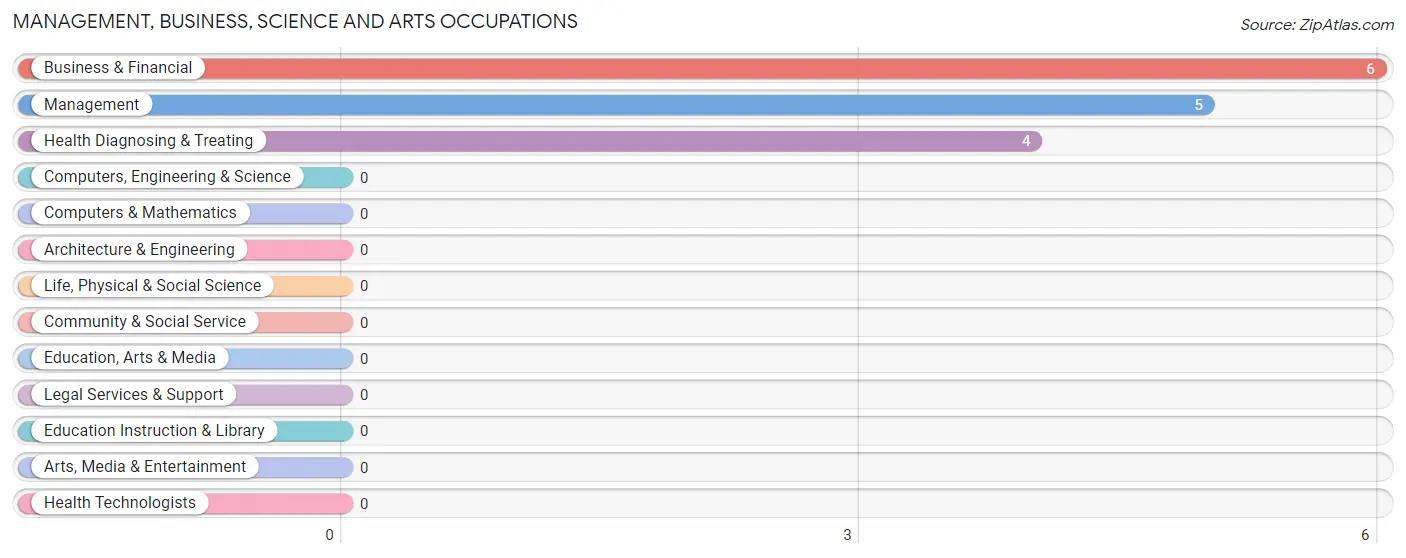
Management, Business, Science and Arts Occupations by Sex
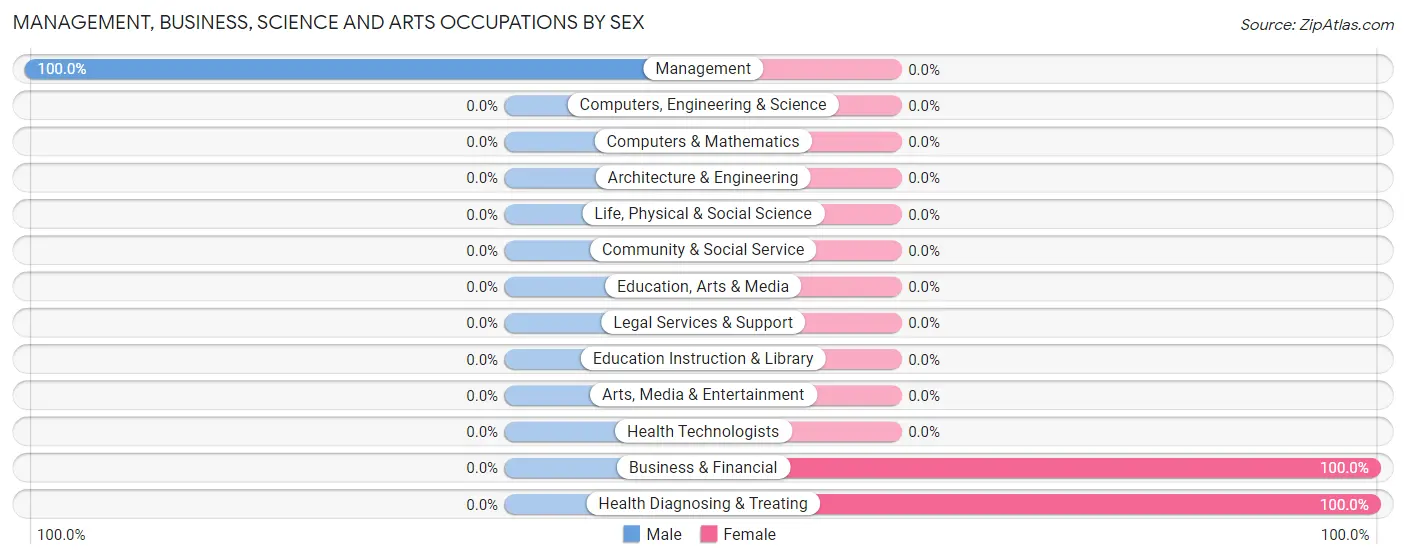
| Occupation | Male | Female |
| Management | 5 (100.0%) | 0 (0.0%) |
| Business & Financial | 0 (0.0%) | 6 (100.0%) |
| Computers, Engineering & Science | 0 (0.0%) | 0 (0.0%) |
| Computers & Mathematics | 0 (0.0%) | 0 (0.0%) |
| Architecture & Engineering | 0 (0.0%) | 0 (0.0%) |
| Life, Physical & Social Science | 0 (0.0%) | 0 (0.0%) |
| Community & Social Service | 0 (0.0%) | 0 (0.0%) |
| Education, Arts & Media | 0 (0.0%) | 0 (0.0%) |
| Legal Services & Support | 0 (0.0%) | 0 (0.0%) |
| Education Instruction & Library | 0 (0.0%) | 0 (0.0%) |
| Arts, Media & Entertainment | 0 (0.0%) | 0 (0.0%) |
| Health Diagnosing & Treating | 0 (0.0%) | 4 (100.0%) |
| Health Technologists | 0 (0.0%) | 0 (0.0%) |
| Total (Category) | 5 (33.3%) | 10 (66.7%) |
| Total (Overall) | 78 (69.6%) | 34 (30.4%) |
Services Occupations
Services Occupations by Sex
| Occupation | Male | Female |
| Healthcare Support | 0 (0.0%) | 0 (0.0%) |
| Security & Protection | 0 (0.0%) | 0 (0.0%) |
| Firefighting & Prevention | 0 (0.0%) | 0 (0.0%) |
| Law Enforcement | 0 (0.0%) | 0 (0.0%) |
| Food Preparation & Serving | 0 (0.0%) | 0 (0.0%) |
| Cleaning & Maintenance | 0 (0.0%) | 0 (0.0%) |
| Personal Care & Service | 0 (0.0%) | 0 (0.0%) |
| Total (Category) | 0 (0.0%) | 0 (0.0%) |
| Total (Overall) | 78 (69.6%) | 34 (30.4%) |
Sales and Office Occupations
The most common Sales and Office occupations in Menifee are Office & Administration (19 | 17.0%), and Sales & Related (6 | 5.4%).
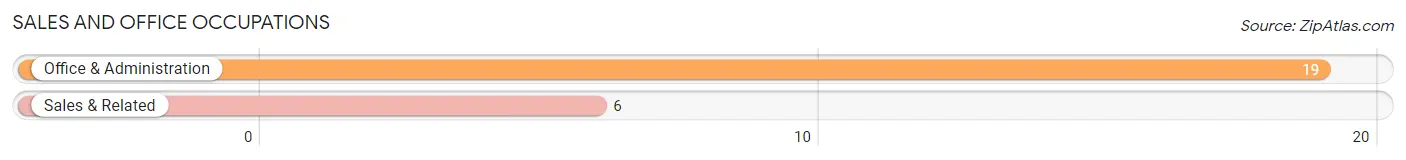
Sales and Office Occupations by Sex

| Occupation | Male | Female |
| Sales & Related | 6 (100.0%) | 0 (0.0%) |
| Office & Administration | 3 (15.8%) | 16 (84.2%) |
| Total (Category) | 9 (36.0%) | 16 (64.0%) |
| Total (Overall) | 78 (69.6%) | 34 (30.4%) |
Natural Resources, Construction and Maintenance Occupations
The most common Natural Resources, Construction and Maintenance occupations in Menifee are , and Installation, Maintenance & Repair (1 | 0.9%).
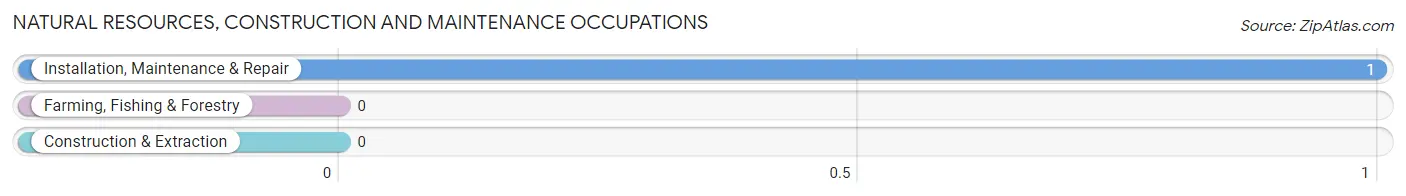
Natural Resources, Construction and Maintenance Occupations by Sex
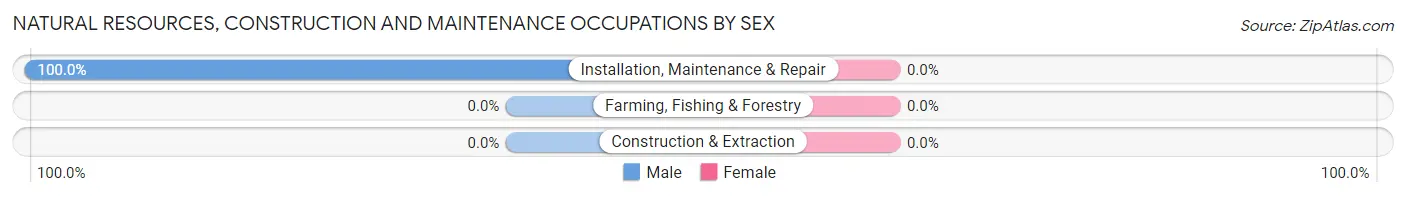
| Occupation | Male | Female |
| Farming, Fishing & Forestry | 0 (0.0%) | 0 (0.0%) |
| Construction & Extraction | 0 (0.0%) | 0 (0.0%) |
| Installation, Maintenance & Repair | 1 (100.0%) | 0 (0.0%) |
| Total (Category) | 1 (100.0%) | 0 (0.0%) |
| Total (Overall) | 78 (69.6%) | 34 (30.4%) |
Production, Transportation and Moving Occupations
The most common Production, Transportation and Moving occupations in Menifee are Production (62 | 55.4%), and Transportation (9 | 8.0%).
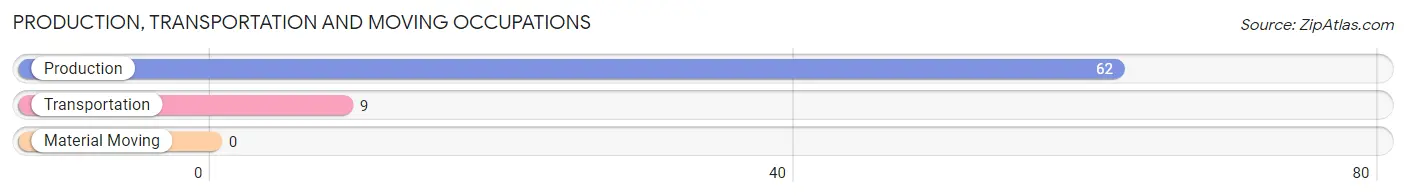
Production, Transportation and Moving Occupations by Sex
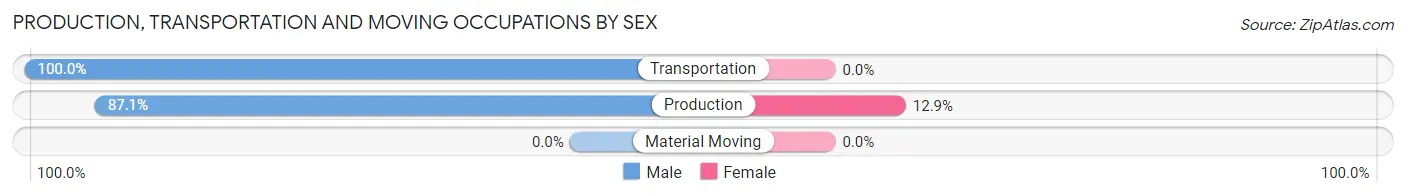
| Occupation | Male | Female |
| Production | 54 (87.1%) | 8 (12.9%) |
| Transportation | 9 (100.0%) | 0 (0.0%) |
| Material Moving | 0 (0.0%) | 0 (0.0%) |
| Total (Category) | 63 (88.7%) | 8 (11.3%) |
| Total (Overall) | 78 (69.6%) | 34 (30.4%) |
Employment Industries by Sex in Menifee
Employment Industries in Menifee
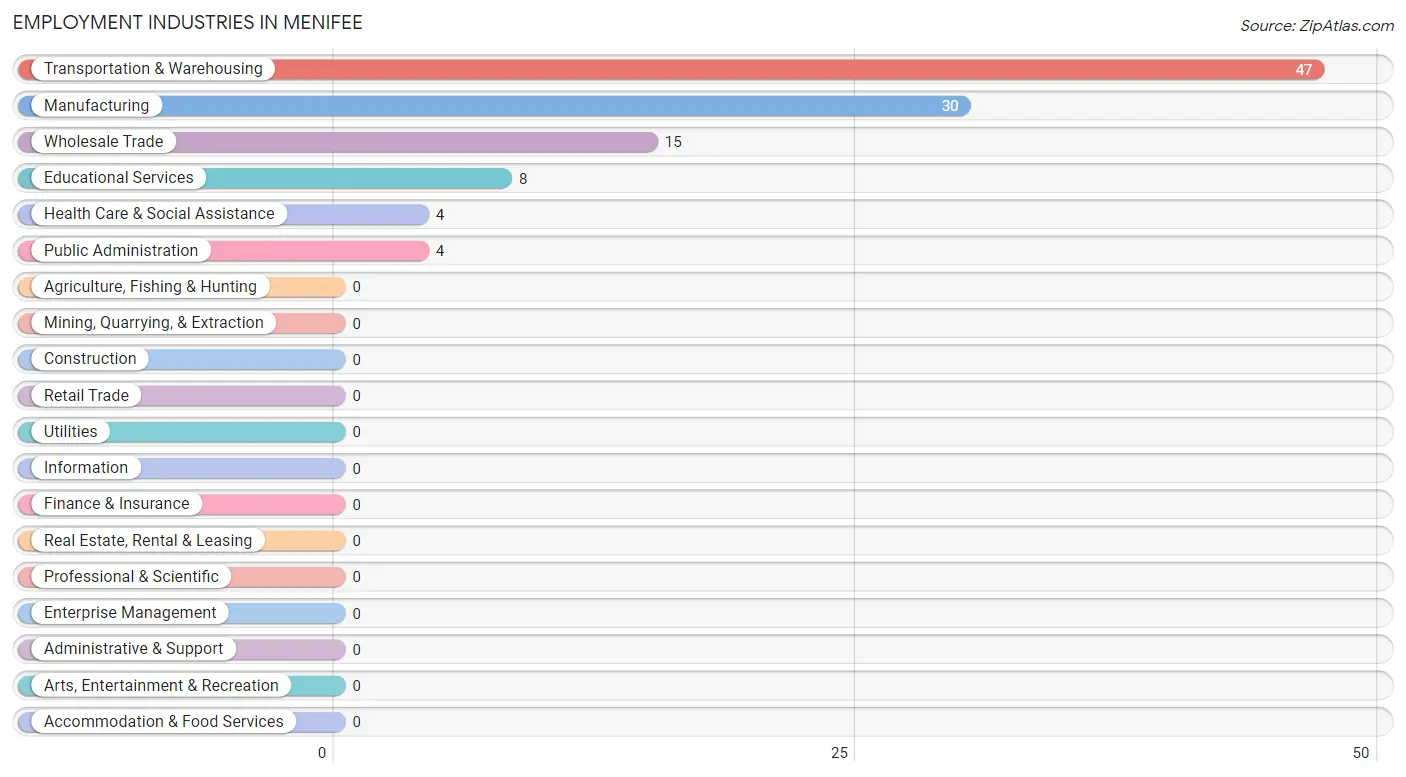
The major employment industries in Menifee include Transportation & Warehousing (47 | 42.0%), Manufacturing (30 | 26.8%), Wholesale Trade (15 | 13.4%), Educational Services (8 | 7.1%), and Health Care & Social Assistance (4 | 3.6%).
Employment Industries by Sex in Menifee
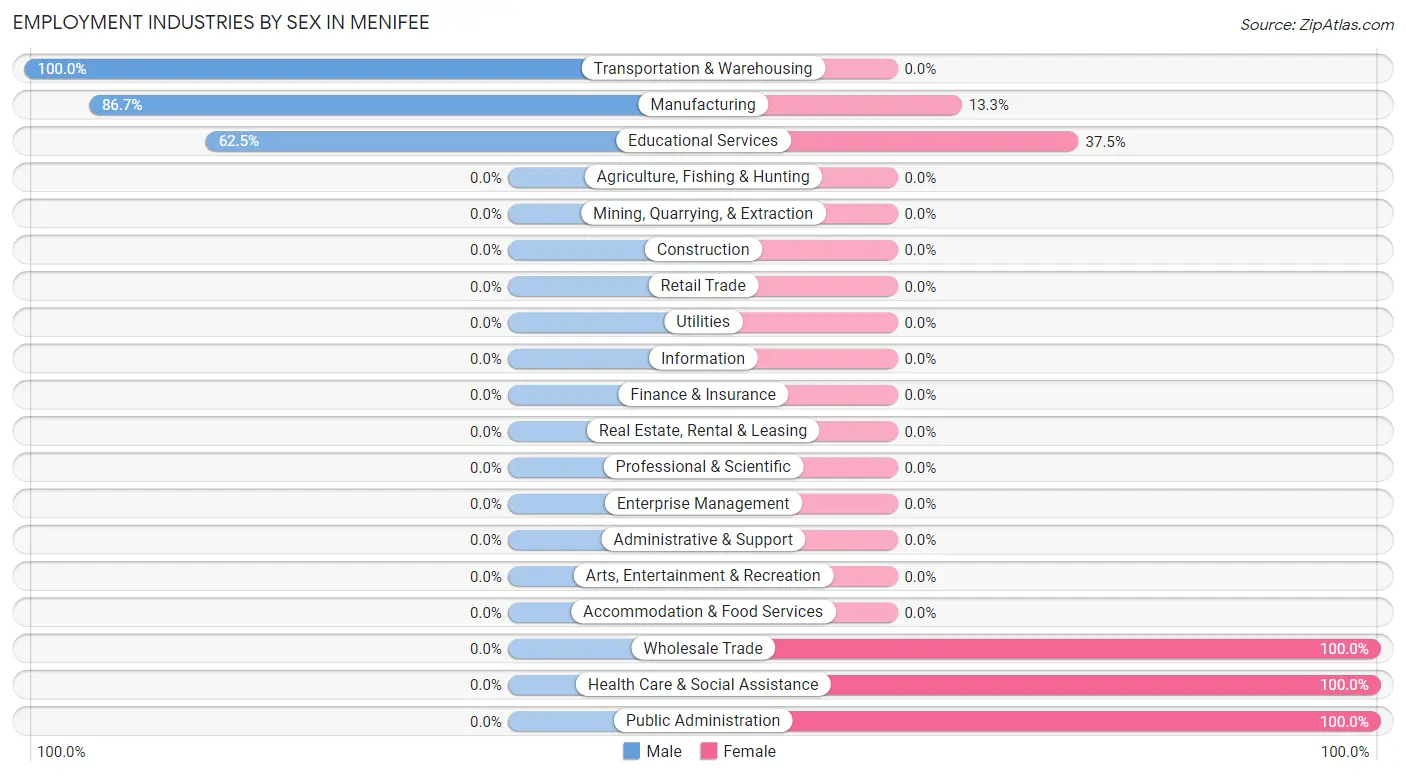
The Menifee industries that see more men than women are Transportation & Warehousing (100.0%), Manufacturing (86.7%), and Educational Services (62.5%), whereas the industries that tend to have a higher number of women are Wholesale Trade (100.0%), Health Care & Social Assistance (100.0%), and Public Administration (100.0%).
| Industry | Male | Female |
| Agriculture, Fishing & Hunting | 0 (0.0%) | 0 (0.0%) |
| Mining, Quarrying, & Extraction | 0 (0.0%) | 0 (0.0%) |
| Construction | 0 (0.0%) | 0 (0.0%) |
| Manufacturing | 26 (86.7%) | 4 (13.3%) |
| Wholesale Trade | 0 (0.0%) | 15 (100.0%) |
| Retail Trade | 0 (0.0%) | 0 (0.0%) |
| Transportation & Warehousing | 47 (100.0%) | 0 (0.0%) |
| Utilities | 0 (0.0%) | 0 (0.0%) |
| Information | 0 (0.0%) | 0 (0.0%) |
| Finance & Insurance | 0 (0.0%) | 0 (0.0%) |
| Real Estate, Rental & Leasing | 0 (0.0%) | 0 (0.0%) |
| Professional & Scientific | 0 (0.0%) | 0 (0.0%) |
| Enterprise Management | 0 (0.0%) | 0 (0.0%) |
| Administrative & Support | 0 (0.0%) | 0 (0.0%) |
| Educational Services | 5 (62.5%) | 3 (37.5%) |
| Health Care & Social Assistance | 0 (0.0%) | 4 (100.0%) |
| Arts, Entertainment & Recreation | 0 (0.0%) | 0 (0.0%) |
| Accommodation & Food Services | 0 (0.0%) | 0 (0.0%) |
| Public Administration | 0 (0.0%) | 4 (100.0%) |
| Total | 78 (69.6%) | 34 (30.4%) |
Education in Menifee
School Enrollment in Menifee
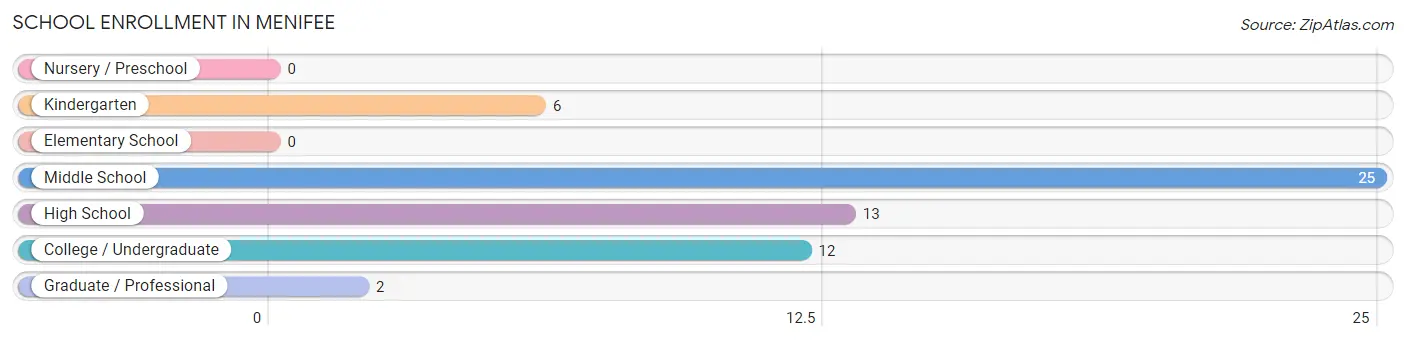
The most common levels of schooling among the 58 students in Menifee are middle school (25 | 43.1%), high school (13 | 22.4%), and college / undergraduate (12 | 20.7%).
| School Level | # Students | % Students |
| Nursery / Preschool | 0 | 0.0% |
| Kindergarten | 6 | 10.3% |
| Elementary School | 0 | 0.0% |
| Middle School | 25 | 43.1% |
| High School | 13 | 22.4% |
| College / Undergraduate | 12 | 20.7% |
| Graduate / Professional | 2 | 3.5% |
| Total | 58 | 100.0% |
School Enrollment by Age by Funding Source in Menifee
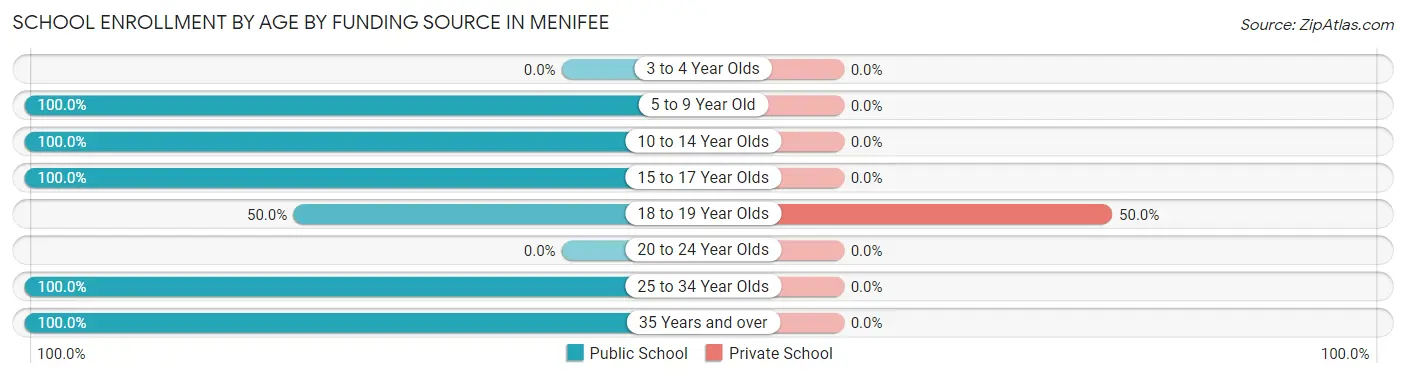
Out of a total of 58 students who are enrolled in schools in Menifee, 4 (6.9%) attend a private institution, while the remaining 54 (93.1%) are enrolled in public schools. The age group of 18 to 19 year olds has the highest likelihood of being enrolled in private schools, with 4 (50.0% in the age bracket) enrolled. Conversely, the age group of 5 to 9 year old has the lowest likelihood of being enrolled in a private school, with 6 (100.0% in the age bracket) attending a public institution.
| Age Bracket | Public School | Private School |
| 3 to 4 Year Olds | 0 (0.0%) | 0 (0.0%) |
| 5 to 9 Year Old | 6 (100.0%) | 0 (0.0%) |
| 10 to 14 Year Olds | 25 (100.0%) | 0 (0.0%) |
| 15 to 17 Year Olds | 13 (100.0%) | 0 (0.0%) |
| 18 to 19 Year Olds | 4 (50.0%) | 4 (50.0%) |
| 20 to 24 Year Olds | 0 (0.0%) | 0 (0.0%) |
| 25 to 34 Year Olds | 4 (100.0%) | 0 (0.0%) |
| 35 Years and over | 2 (100.0%) | 0 (0.0%) |
| Total | 54 (93.1%) | 4 (6.9%) |
Educational Attainment by Field of Study in Menifee
Social sciences (5 | 25.0%), science & technology (5 | 25.0%), education (5 | 25.0%), physical & health sciences (4 | 20.0%), and business (1 | 5.0%) are the most common fields of study among 20 individuals in Menifee who have obtained a bachelor's degree or higher.
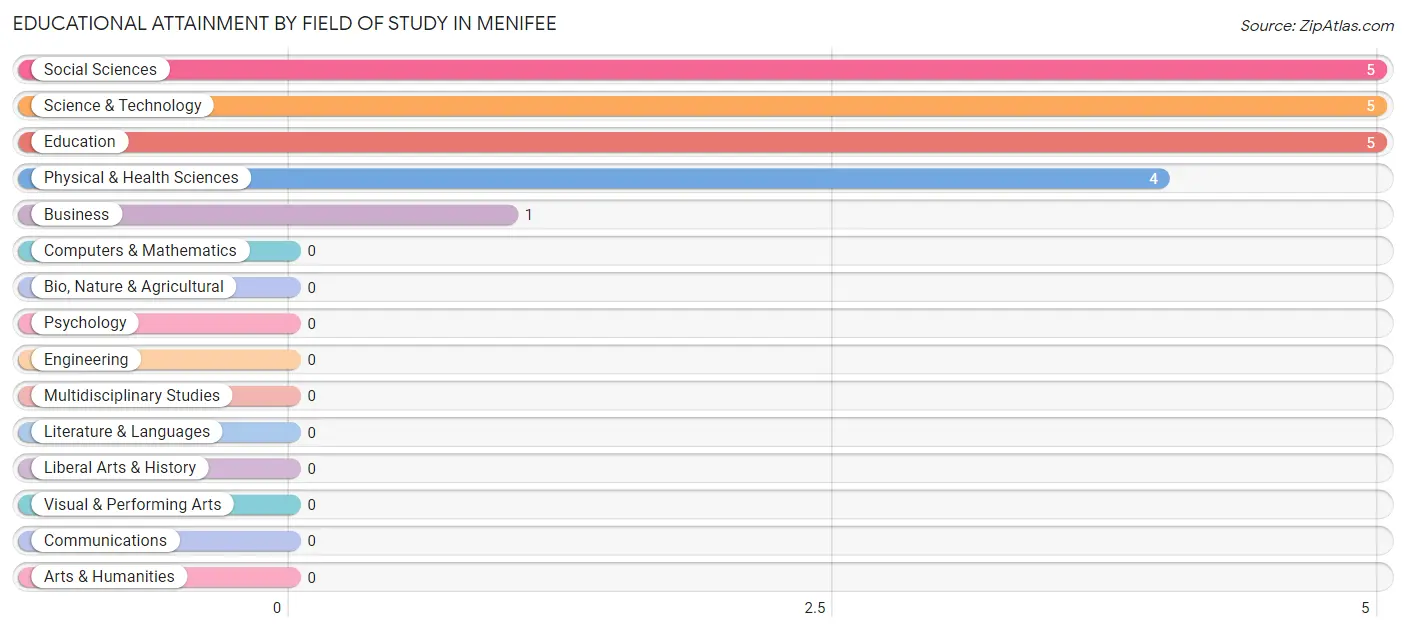
| Field of Study | # Graduates | % Graduates |
| Computers & Mathematics | 0 | 0.0% |
| Bio, Nature & Agricultural | 0 | 0.0% |
| Physical & Health Sciences | 4 | 20.0% |
| Psychology | 0 | 0.0% |
| Social Sciences | 5 | 25.0% |
| Engineering | 0 | 0.0% |
| Multidisciplinary Studies | 0 | 0.0% |
| Science & Technology | 5 | 25.0% |
| Business | 1 | 5.0% |
| Education | 5 | 25.0% |
| Literature & Languages | 0 | 0.0% |
| Liberal Arts & History | 0 | 0.0% |
| Visual & Performing Arts | 0 | 0.0% |
| Communications | 0 | 0.0% |
| Arts & Humanities | 0 | 0.0% |
| Total | 20 | 100.0% |
Transportation & Commute in Menifee
Vehicle Availability by Sex in Menifee
The most prevalent vehicle ownership categories in Menifee are males with 1 vehicle (42, accounting for 53.8%) and females with 1 vehicle (27, making up 123.5%).
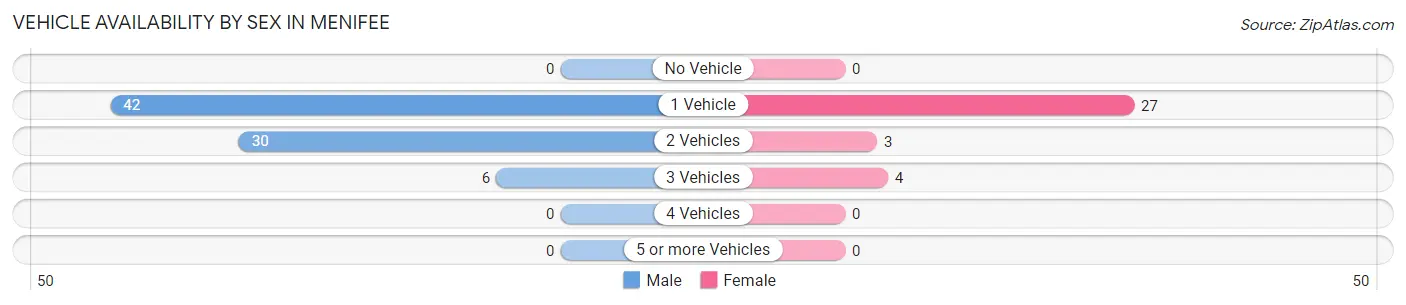
| Vehicles Available | Male | Female |
| No Vehicle | 0 (0.0%) | 0 (0.0%) |
| 1 Vehicle | 42 (53.8%) | 27 (79.4%) |
| 2 Vehicles | 30 (38.5%) | 3 (8.8%) |
| 3 Vehicles | 6 (7.7%) | 4 (11.8%) |
| 4 Vehicles | 0 (0.0%) | 0 (0.0%) |
| 5 or more Vehicles | 0 (0.0%) | 0 (0.0%) |
| Total | 78 (100.0%) | 34 (100.0%) |
Commute Time in Menifee
The most frequently occuring commute durations in Menifee are 10 to 14 minutes (30 commuters, 26.8%), 90 or more minutes (28 commuters, 25.0%), and 20 to 24 minutes (15 commuters, 13.4%).
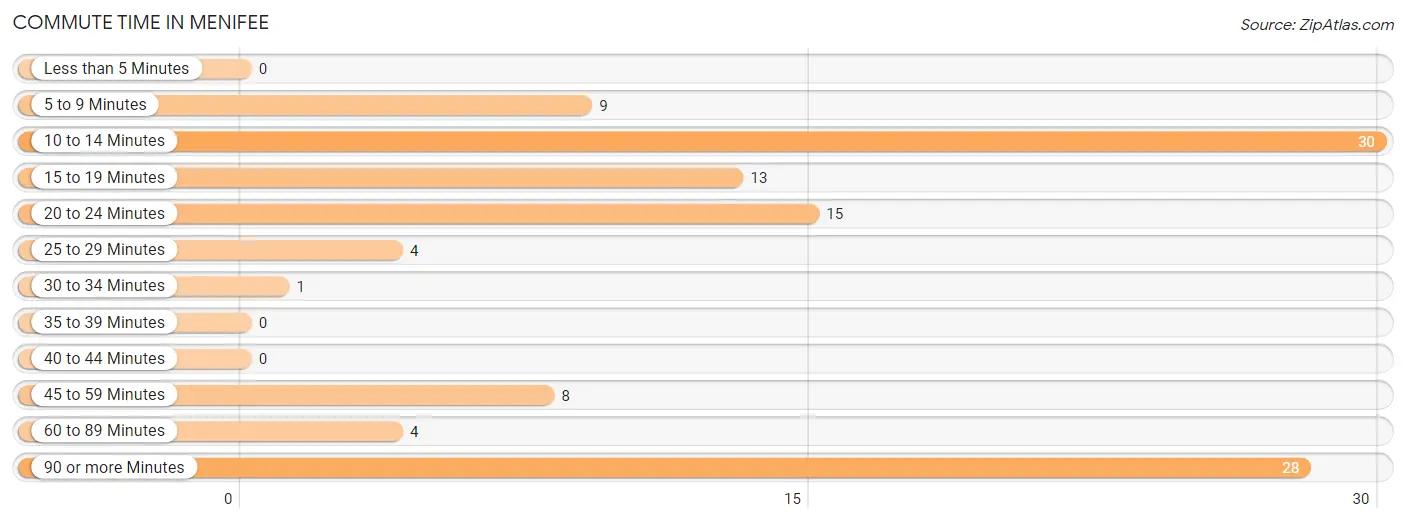
| Commute Time | # Commuters | % Commuters |
| Less than 5 Minutes | 0 | 0.0% |
| 5 to 9 Minutes | 9 | 8.0% |
| 10 to 14 Minutes | 30 | 26.8% |
| 15 to 19 Minutes | 13 | 11.6% |
| 20 to 24 Minutes | 15 | 13.4% |
| 25 to 29 Minutes | 4 | 3.6% |
| 30 to 34 Minutes | 1 | 0.9% |
| 35 to 39 Minutes | 0 | 0.0% |
| 40 to 44 Minutes | 0 | 0.0% |
| 45 to 59 Minutes | 8 | 7.1% |
| 60 to 89 Minutes | 4 | 3.6% |
| 90 or more Minutes | 28 | 25.0% |
Commute Time by Sex in Menifee
The most common commute times in Menifee are 90 or more minutes (28 commuters, 35.9%) for males and 20 to 24 minutes (15 commuters, 44.1%) for females.
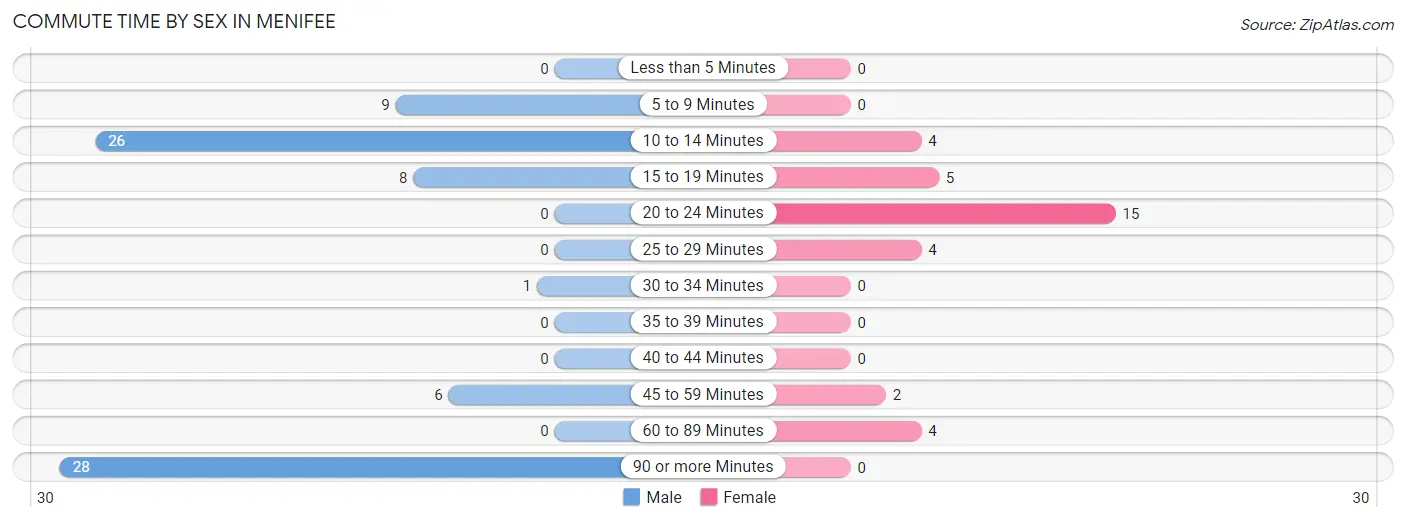
| Commute Time | Male | Female |
| Less than 5 Minutes | 0 (0.0%) | 0 (0.0%) |
| 5 to 9 Minutes | 9 (11.5%) | 0 (0.0%) |
| 10 to 14 Minutes | 26 (33.3%) | 4 (11.8%) |
| 15 to 19 Minutes | 8 (10.3%) | 5 (14.7%) |
| 20 to 24 Minutes | 0 (0.0%) | 15 (44.1%) |
| 25 to 29 Minutes | 0 (0.0%) | 4 (11.8%) |
| 30 to 34 Minutes | 1 (1.3%) | 0 (0.0%) |
| 35 to 39 Minutes | 0 (0.0%) | 0 (0.0%) |
| 40 to 44 Minutes | 0 (0.0%) | 0 (0.0%) |
| 45 to 59 Minutes | 6 (7.7%) | 2 (5.9%) |
| 60 to 89 Minutes | 0 (0.0%) | 4 (11.8%) |
| 90 or more Minutes | 28 (35.9%) | 0 (0.0%) |
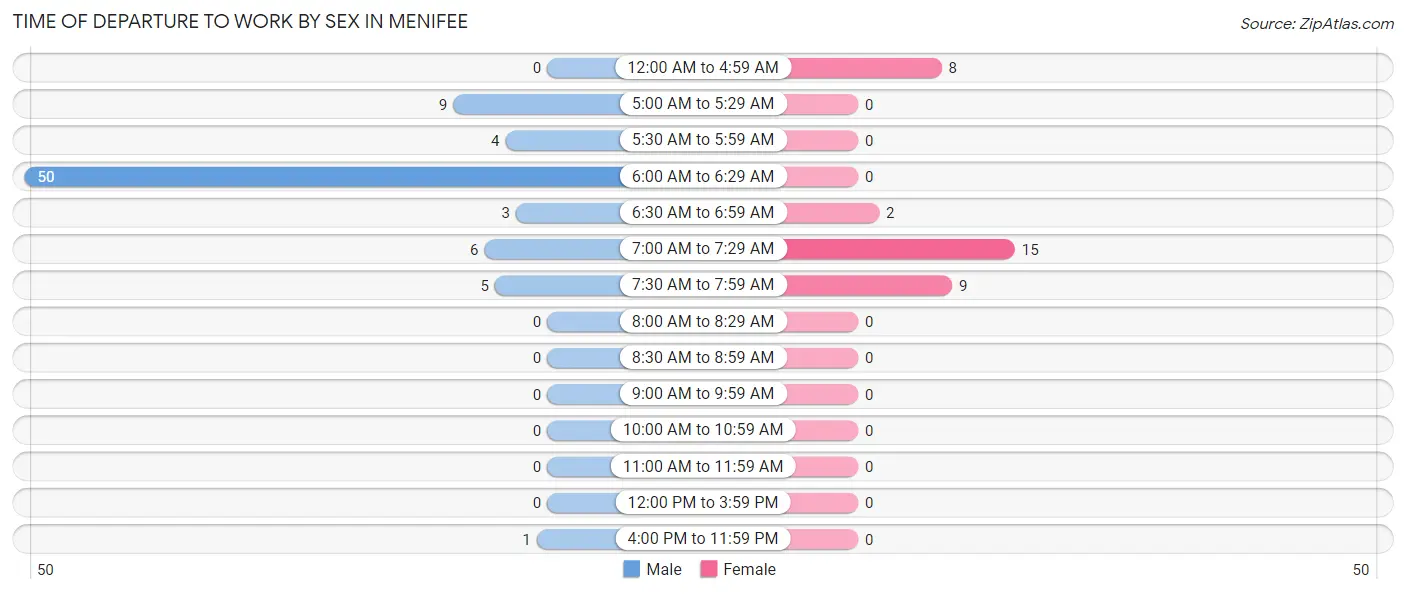
Time of Departure to Work by Sex in Menifee
The most frequent times of departure to work in Menifee are 6:00 AM to 6:29 AM (50, 64.1%) for males and 7:00 AM to 7:29 AM (15, 44.1%) for females.
| Time of Departure | Male | Female |
| 12:00 AM to 4:59 AM | 0 (0.0%) | 8 (23.5%) |
| 5:00 AM to 5:29 AM | 9 (11.5%) | 0 (0.0%) |
| 5:30 AM to 5:59 AM | 4 (5.1%) | 0 (0.0%) |
| 6:00 AM to 6:29 AM | 50 (64.1%) | 0 (0.0%) |
| 6:30 AM to 6:59 AM | 3 (3.8%) | 2 (5.9%) |
| 7:00 AM to 7:29 AM | 6 (7.7%) | 15 (44.1%) |
| 7:30 AM to 7:59 AM | 5 (6.4%) | 9 (26.5%) |
| 8:00 AM to 8:29 AM | 0 (0.0%) | 0 (0.0%) |
| 8:30 AM to 8:59 AM | 0 (0.0%) | 0 (0.0%) |
| 9:00 AM to 9:59 AM | 0 (0.0%) | 0 (0.0%) |
| 10:00 AM to 10:59 AM | 0 (0.0%) | 0 (0.0%) |
| 11:00 AM to 11:59 AM | 0 (0.0%) | 0 (0.0%) |
| 12:00 PM to 3:59 PM | 0 (0.0%) | 0 (0.0%) |
| 4:00 PM to 11:59 PM | 1 (1.3%) | 0 (0.0%) |
| Total | 78 (100.0%) | 34 (100.0%) |
Housing Occupancy in Menifee
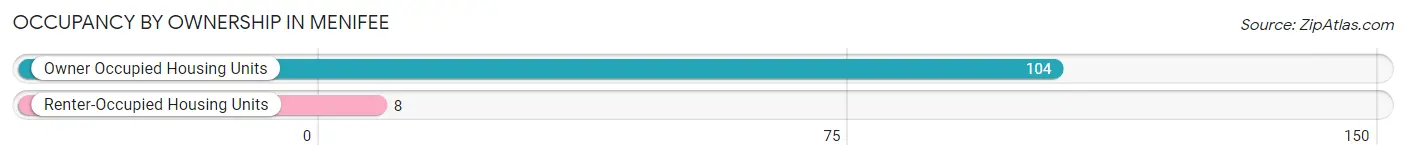
Occupancy by Ownership in Menifee
Of the total 112 dwellings in Menifee, owner-occupied units account for 104 (92.9%), while renter-occupied units make up 8 (7.1%).
| Occupancy | # Housing Units | % Housing Units |
| Owner Occupied Housing Units | 104 | 92.9% |
| Renter-Occupied Housing Units | 8 | 7.1% |
| Total Occupied Housing Units | 112 | 100.0% |
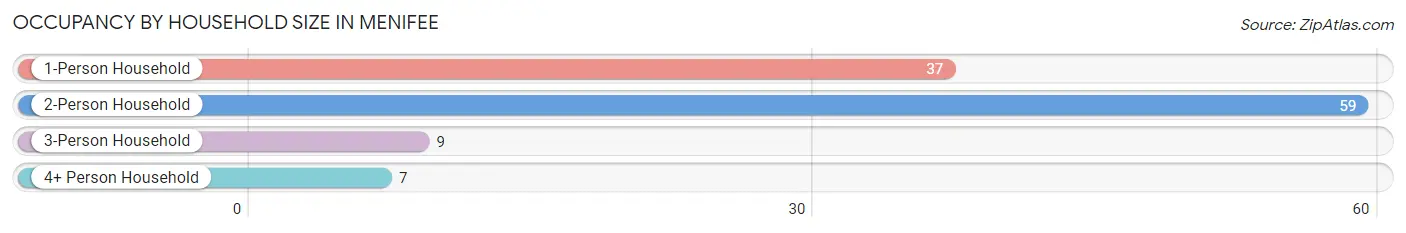
Occupancy by Household Size in Menifee
| Household Size | # Housing Units | % Housing Units |
| 1-Person Household | 37 | 33.0% |
| 2-Person Household | 59 | 52.7% |
| 3-Person Household | 9 | 8.0% |
| 4+ Person Household | 7 | 6.2% |
| Total Housing Units | 112 | 100.0% |
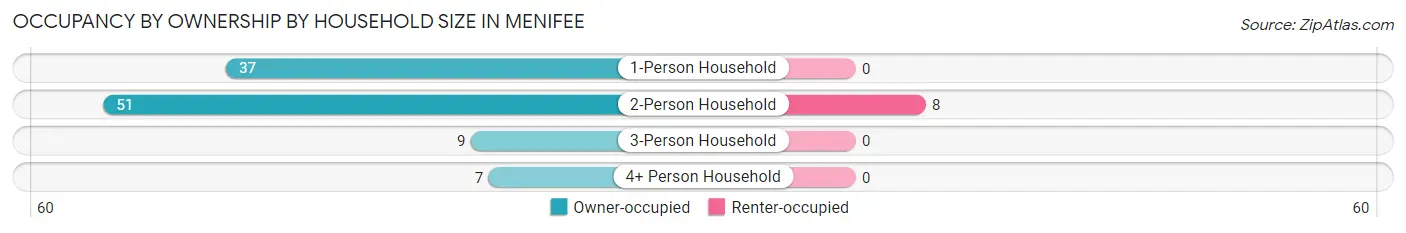
Occupancy by Ownership by Household Size in Menifee
| Household Size | Owner-occupied | Renter-occupied |
| 1-Person Household | 37 (100.0%) | 0 (0.0%) |
| 2-Person Household | 51 (86.4%) | 8 (13.6%) |
| 3-Person Household | 9 (100.0%) | 0 (0.0%) |
| 4+ Person Household | 7 (100.0%) | 0 (0.0%) |
| Total Housing Units | 104 (92.9%) | 8 (7.1%) |
Occupancy by Educational Attainment in Menifee
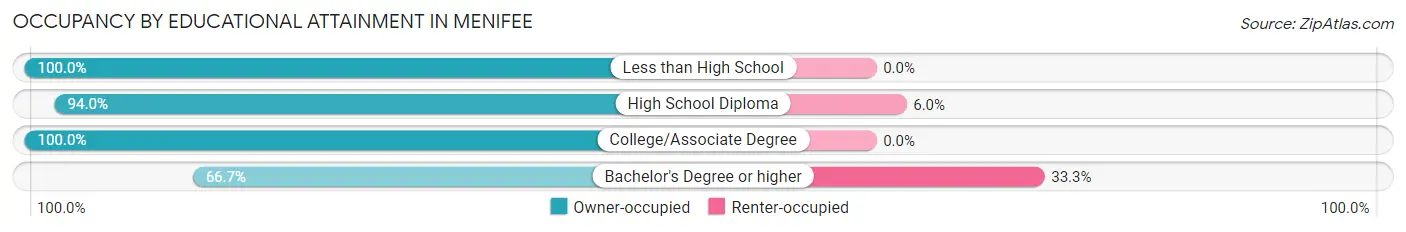
| Household Size | Owner-occupied | Renter-occupied |
| Less than High School | 2 (100.0%) | 0 (0.0%) |
| High School Diploma | 63 (94.0%) | 4 (6.0%) |
| College/Associate Degree | 31 (100.0%) | 0 (0.0%) |
| Bachelor's Degree or higher | 8 (66.7%) | 4 (33.3%) |
Occupancy by Age of Householder in Menifee
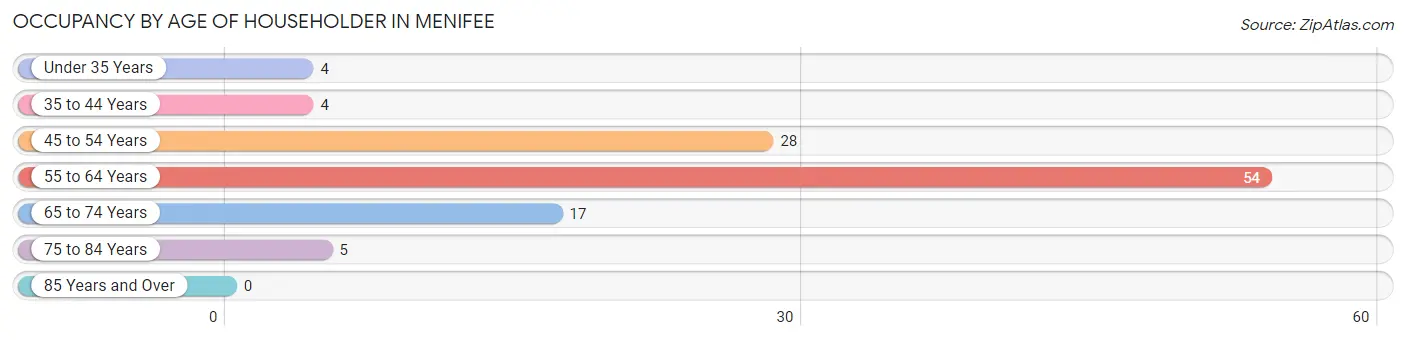
| Age Bracket | # Households | % Households |
| Under 35 Years | 4 | 3.6% |
| 35 to 44 Years | 4 | 3.6% |
| 45 to 54 Years | 28 | 25.0% |
| 55 to 64 Years | 54 | 48.2% |
| 65 to 74 Years | 17 | 15.2% |
| 75 to 84 Years | 5 | 4.5% |
| 85 Years and Over | 0 | 0.0% |
| Total | 112 | 100.0% |
Housing Finances in Menifee
Median Income by Occupancy in Menifee
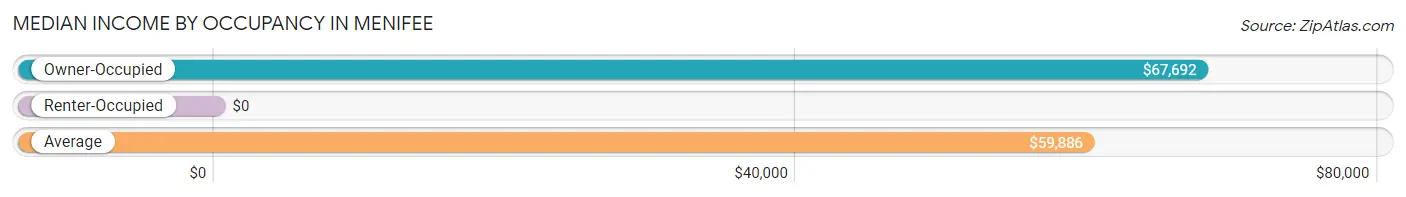
| Occupancy Type | # Households | Median Income |
| Owner-Occupied | 104 (92.9%) | $67,692 |
| Renter-Occupied | 8 (7.1%) | $0 |
| Average | 112 (100.0%) | $59,886 |
Occupancy by Householder Income Bracket in Menifee
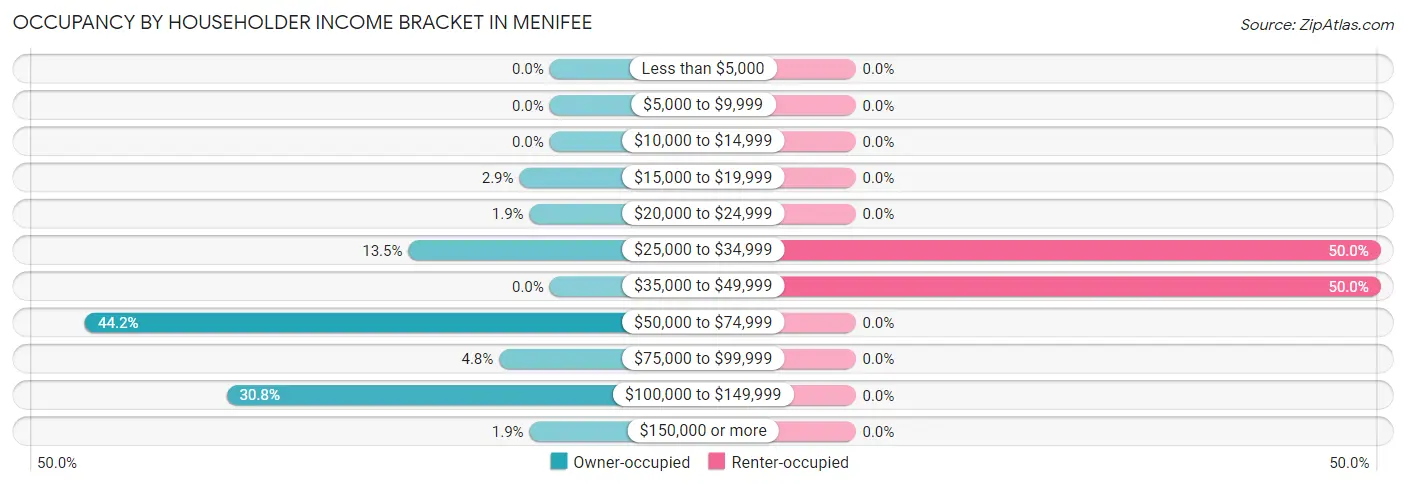
| Income Bracket | Owner-occupied | Renter-occupied |
| Less than $5,000 | 0 (0.0%) | 0 (0.0%) |
| $5,000 to $9,999 | 0 (0.0%) | 0 (0.0%) |
| $10,000 to $14,999 | 0 (0.0%) | 0 (0.0%) |
| $15,000 to $19,999 | 3 (2.9%) | 0 (0.0%) |
| $20,000 to $24,999 | 2 (1.9%) | 0 (0.0%) |
| $25,000 to $34,999 | 14 (13.5%) | 4 (50.0%) |
| $35,000 to $49,999 | 0 (0.0%) | 4 (50.0%) |
| $50,000 to $74,999 | 46 (44.2%) | 0 (0.0%) |
| $75,000 to $99,999 | 5 (4.8%) | 0 (0.0%) |
| $100,000 to $149,999 | 32 (30.8%) | 0 (0.0%) |
| $150,000 or more | 2 (1.9%) | 0 (0.0%) |
| Total | 104 (100.0%) | 8 (100.0%) |
Monthly Housing Cost Tiers in Menifee
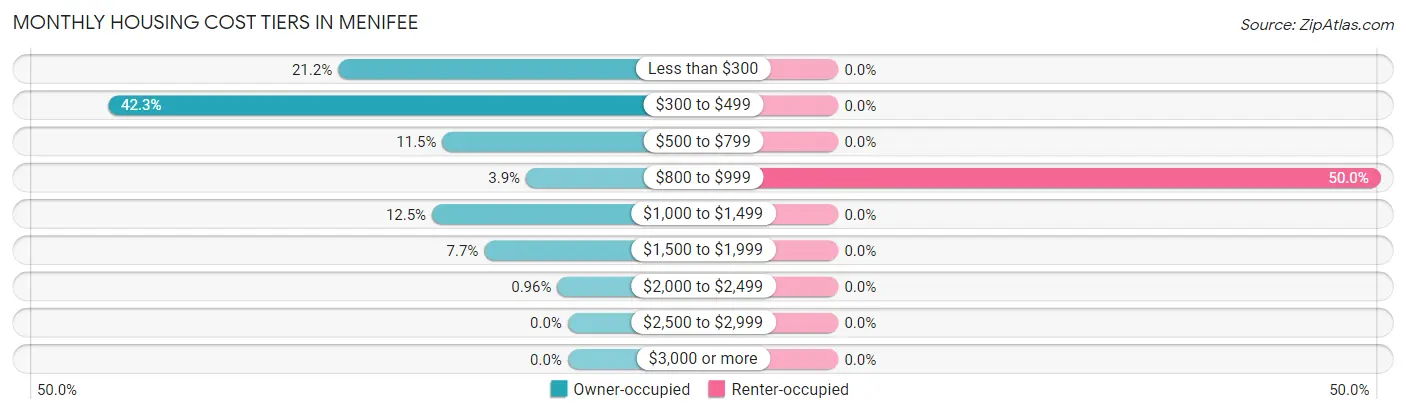
| Monthly Cost | Owner-occupied | Renter-occupied |
| Less than $300 | 22 (21.1%) | 0 (0.0%) |
| $300 to $499 | 44 (42.3%) | 0 (0.0%) |
| $500 to $799 | 12 (11.5%) | 0 (0.0%) |
| $800 to $999 | 4 (3.8%) | 4 (50.0%) |
| $1,000 to $1,499 | 13 (12.5%) | 0 (0.0%) |
| $1,500 to $1,999 | 8 (7.7%) | 0 (0.0%) |
| $2,000 to $2,499 | 1 (1.0%) | 0 (0.0%) |
| $2,500 to $2,999 | 0 (0.0%) | 0 (0.0%) |
| $3,000 or more | 0 (0.0%) | 0 (0.0%) |
| Total | 104 (100.0%) | 8 (100.0%) |
Physical Housing Characteristics in Menifee
Housing Structures in Menifee
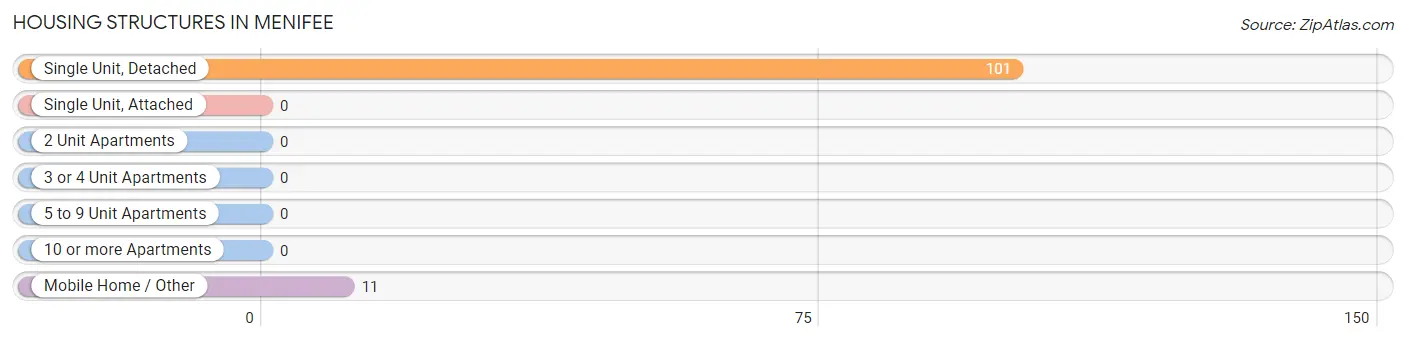
| Structure Type | # Housing Units | % Housing Units |
| Single Unit, Detached | 101 | 90.2% |
| Single Unit, Attached | 0 | 0.0% |
| 2 Unit Apartments | 0 | 0.0% |
| 3 or 4 Unit Apartments | 0 | 0.0% |
| 5 to 9 Unit Apartments | 0 | 0.0% |
| 10 or more Apartments | 0 | 0.0% |
| Mobile Home / Other | 11 | 9.8% |
| Total | 112 | 100.0% |
Housing Structures by Occupancy in Menifee
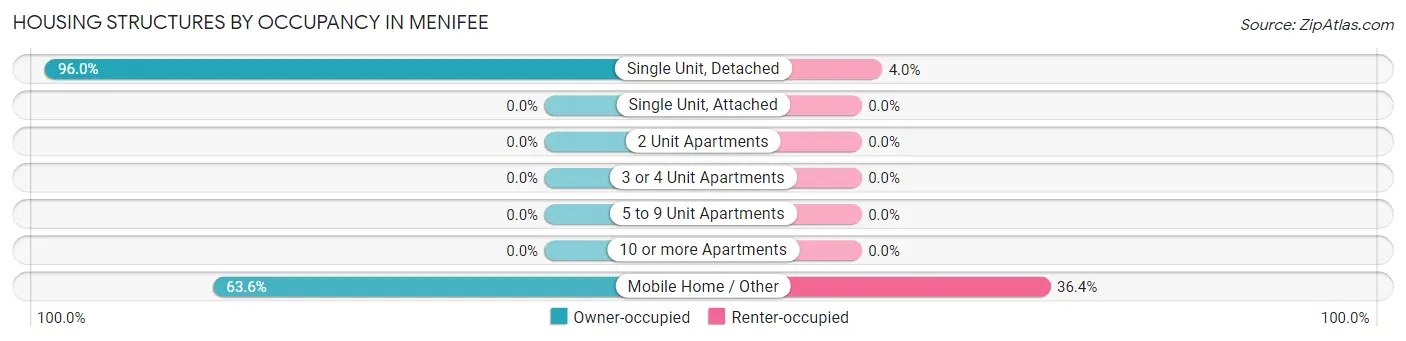
| Structure Type | Owner-occupied | Renter-occupied |
| Single Unit, Detached | 97 (96.0%) | 4 (4.0%) |
| Single Unit, Attached | 0 (0.0%) | 0 (0.0%) |
| 2 Unit Apartments | 0 (0.0%) | 0 (0.0%) |
| 3 or 4 Unit Apartments | 0 (0.0%) | 0 (0.0%) |
| 5 to 9 Unit Apartments | 0 (0.0%) | 0 (0.0%) |
| 10 or more Apartments | 0 (0.0%) | 0 (0.0%) |
| Mobile Home / Other | 7 (63.6%) | 4 (36.4%) |
| Total | 104 (92.9%) | 8 (7.1%) |
Housing Structures by Number of Rooms in Menifee
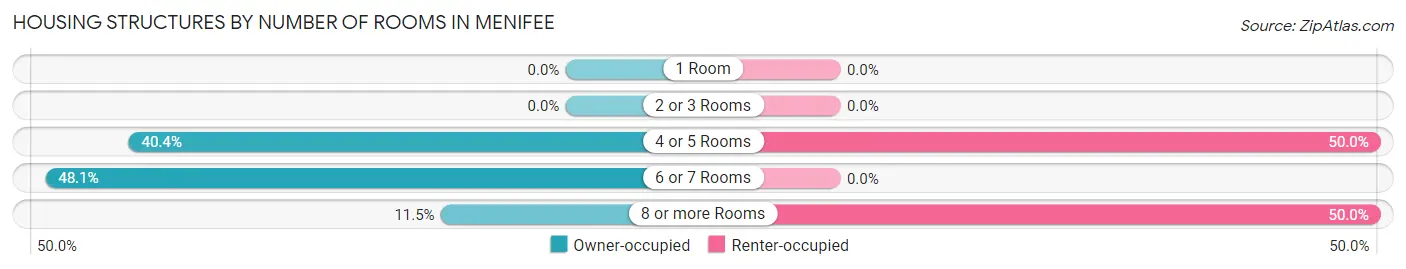
| Number of Rooms | Owner-occupied | Renter-occupied |
| 1 Room | 0 (0.0%) | 0 (0.0%) |
| 2 or 3 Rooms | 0 (0.0%) | 0 (0.0%) |
| 4 or 5 Rooms | 42 (40.4%) | 4 (50.0%) |
| 6 or 7 Rooms | 50 (48.1%) | 0 (0.0%) |
| 8 or more Rooms | 12 (11.5%) | 4 (50.0%) |
| Total | 104 (100.0%) | 8 (100.0%) |
Housing Structure by Heating Type in Menifee
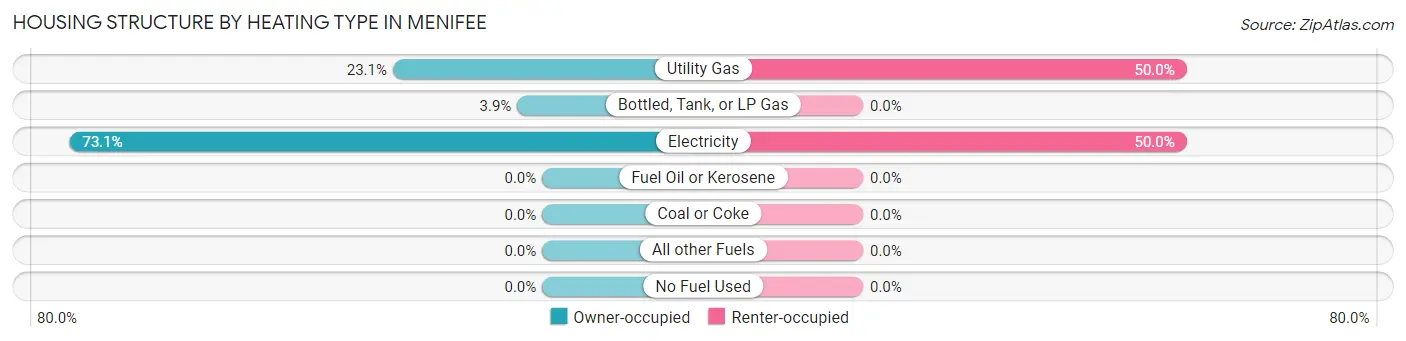
| Heating Type | Owner-occupied | Renter-occupied |
| Utility Gas | 24 (23.1%) | 4 (50.0%) |
| Bottled, Tank, or LP Gas | 4 (3.8%) | 0 (0.0%) |
| Electricity | 76 (73.1%) | 4 (50.0%) |
| Fuel Oil or Kerosene | 0 (0.0%) | 0 (0.0%) |
| Coal or Coke | 0 (0.0%) | 0 (0.0%) |
| All other Fuels | 0 (0.0%) | 0 (0.0%) |
| No Fuel Used | 0 (0.0%) | 0 (0.0%) |
| Total | 104 (100.0%) | 8 (100.0%) |
Household Vehicle Usage in Menifee
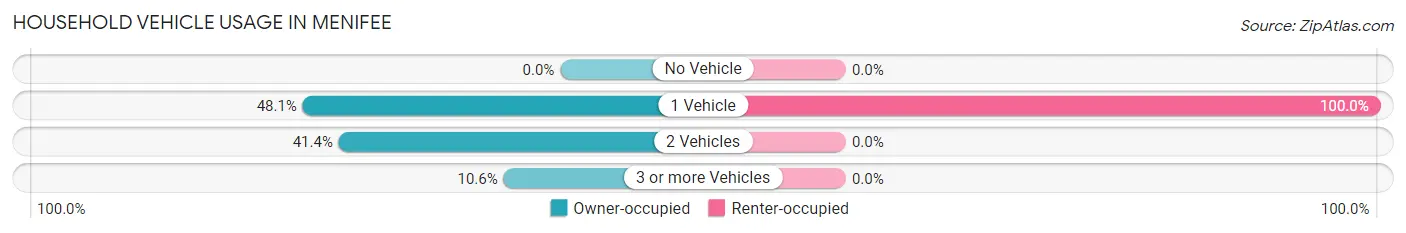
| Vehicles per Household | Owner-occupied | Renter-occupied |
| No Vehicle | 0 (0.0%) | 0 (0.0%) |
| 1 Vehicle | 50 (48.1%) | 8 (100.0%) |
| 2 Vehicles | 43 (41.3%) | 0 (0.0%) |
| 3 or more Vehicles | 11 (10.6%) | 0 (0.0%) |
| Total | 104 (100.0%) | 8 (100.0%) |
Real Estate & Mortgages in Menifee
Real Estate and Mortgage Overview in Menifee
| Characteristic | Without Mortgage | With Mortgage |
| Housing Units | 68 | 36 |
| Median Property Value | - | - |
| Median Household Income | $68,611 | $1 |
| Monthly Housing Costs | $360 | $0 |
| Real Estate Taxes | - | - |
Property Value by Mortgage Status in Menifee
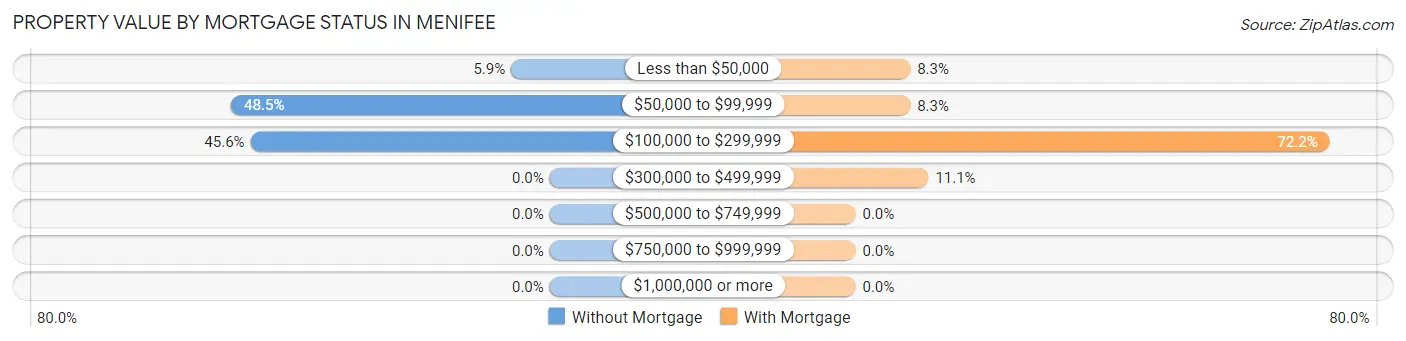
| Property Value | Without Mortgage | With Mortgage |
| Less than $50,000 | 4 (5.9%) | 3 (8.3%) |
| $50,000 to $99,999 | 33 (48.5%) | 3 (8.3%) |
| $100,000 to $299,999 | 31 (45.6%) | 26 (72.2%) |
| $300,000 to $499,999 | 0 (0.0%) | 4 (11.1%) |
| $500,000 to $749,999 | 0 (0.0%) | 0 (0.0%) |
| $750,000 to $999,999 | 0 (0.0%) | 0 (0.0%) |
| $1,000,000 or more | 0 (0.0%) | 0 (0.0%) |
| Total | 68 (100.0%) | 36 (100.0%) |
Household Income by Mortgage Status in Menifee
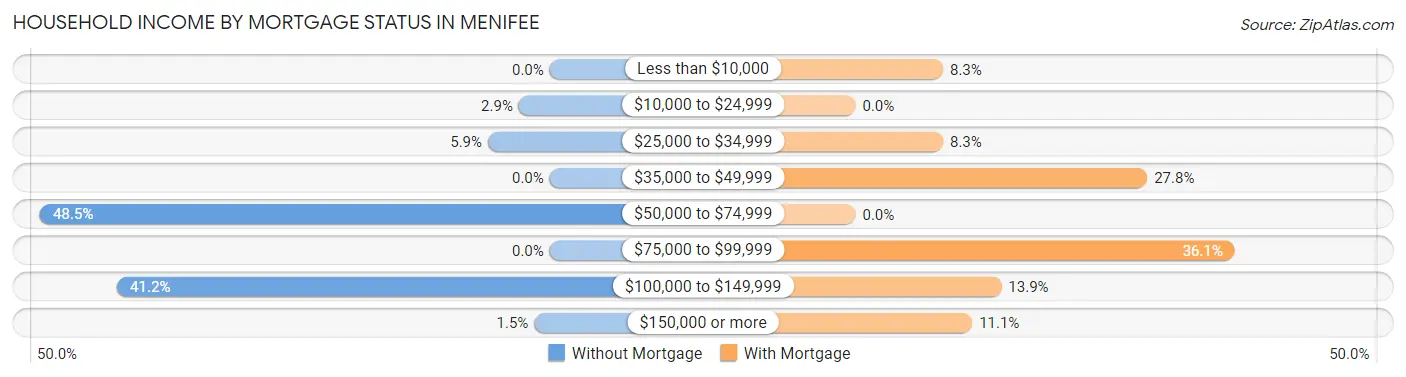
| Household Income | Without Mortgage | With Mortgage |
| Less than $10,000 | 0 (0.0%) | 3 (8.3%) |
| $10,000 to $24,999 | 2 (2.9%) | 0 (0.0%) |
| $25,000 to $34,999 | 4 (5.9%) | 3 (8.3%) |
| $35,000 to $49,999 | 0 (0.0%) | 10 (27.8%) |
| $50,000 to $74,999 | 33 (48.5%) | 0 (0.0%) |
| $75,000 to $99,999 | 0 (0.0%) | 13 (36.1%) |
| $100,000 to $149,999 | 28 (41.2%) | 5 (13.9%) |
| $150,000 or more | 1 (1.5%) | 4 (11.1%) |
| Total | 68 (100.0%) | 36 (100.0%) |
Property Value to Household Income Ratio in Menifee
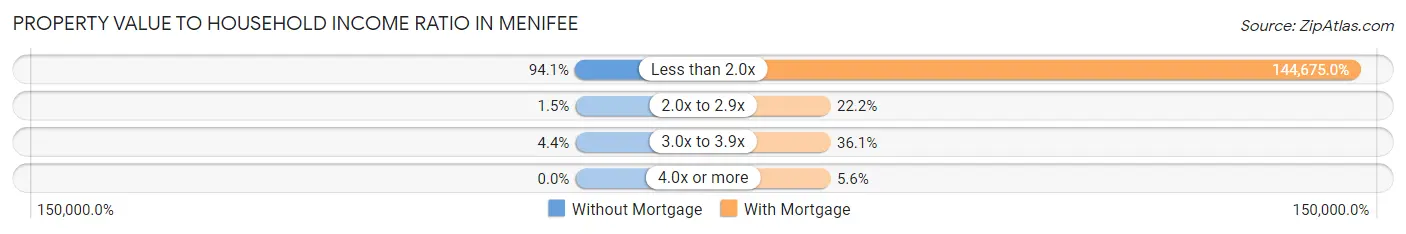
| Value-to-Income Ratio | Without Mortgage | With Mortgage |
| Less than 2.0x | 64 (94.1%) | 52,083 (144,675.0%) |
| 2.0x to 2.9x | 1 (1.5%) | 8 (22.2%) |
| 3.0x to 3.9x | 3 (4.4%) | 13 (36.1%) |
| 4.0x or more | 0 (0.0%) | 2 (5.6%) |
| Total | 68 (100.0%) | 36 (100.0%) |
Real Estate Taxes by Mortgage Status in Menifee
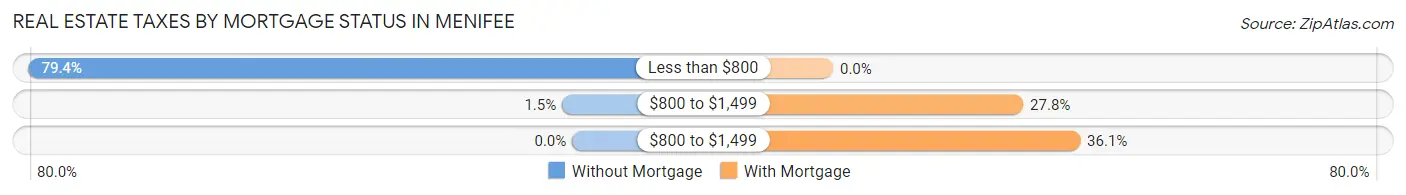
| Property Taxes | Without Mortgage | With Mortgage |
| Less than $800 | 54 (79.4%) | 0 (0.0%) |
| $800 to $1,499 | 1 (1.5%) | 10 (27.8%) |
| $800 to $1,499 | 0 (0.0%) | 13 (36.1%) |
| Total | 68 (100.0%) | 36 (100.0%) |
Health & Disability in Menifee
Health Insurance Coverage by Age in Menifee

| Age Bracket | With Coverage | Without Coverage |
| Under 6 Years | 0 (0.0%) | 6 (100.0%) |
| 6 to 18 Years | 42 (100.0%) | 0 (0.0%) |
| 19 to 25 Years | 10 (100.0%) | 0 (0.0%) |
| 26 to 34 Years | 2 (33.3%) | 4 (66.7%) |
| 35 to 44 Years | 4 (80.0%) | 1 (20.0%) |
| 45 to 54 Years | 53 (100.0%) | 0 (0.0%) |
| 55 to 64 Years | 69 (92.0%) | 6 (8.0%) |
| 65 to 74 Years | 26 (100.0%) | 0 (0.0%) |
| 75 Years and older | 11 (100.0%) | 0 (0.0%) |
| Total | 217 (92.7%) | 17 (7.3%) |
Health Insurance Coverage by Citizenship Status in Menifee
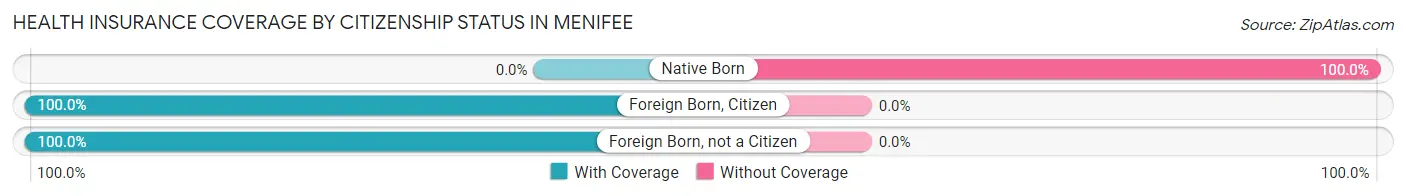
| Citizenship Status | With Coverage | Without Coverage |
| Native Born | 0 (0.0%) | 6 (100.0%) |
| Foreign Born, Citizen | 42 (100.0%) | 0 (0.0%) |
| Foreign Born, not a Citizen | 10 (100.0%) | 0 (0.0%) |
Health Insurance Coverage by Household Income in Menifee
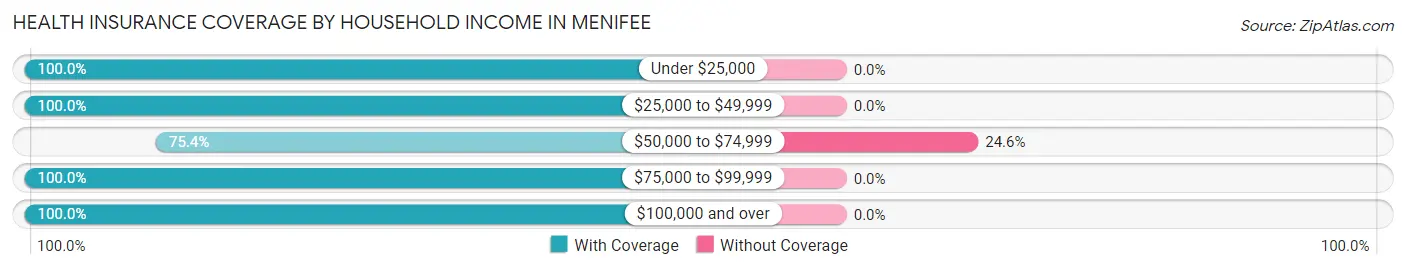
| Household Income | With Coverage | Without Coverage |
| Under $25,000 | 11 (100.0%) | 0 (0.0%) |
| $25,000 to $49,999 | 78 (100.0%) | 0 (0.0%) |
| $50,000 to $74,999 | 52 (75.4%) | 17 (24.6%) |
| $75,000 to $99,999 | 9 (100.0%) | 0 (0.0%) |
| $100,000 and over | 67 (100.0%) | 0 (0.0%) |
Public vs Private Health Insurance Coverage by Age in Menifee
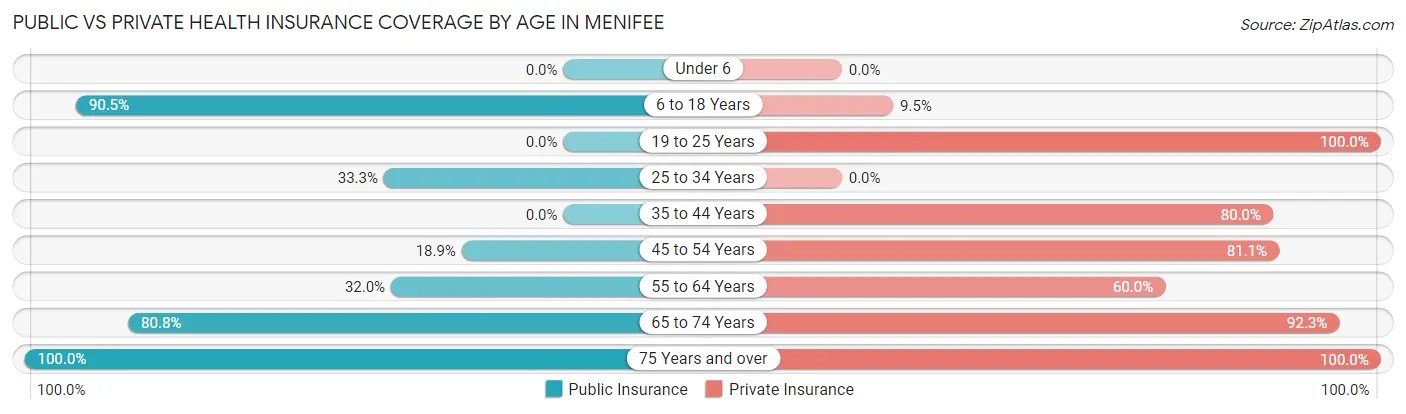
| Age Bracket | Public Insurance | Private Insurance |
| Under 6 | 0 (0.0%) | 0 (0.0%) |
| 6 to 18 Years | 38 (90.5%) | 4 (9.5%) |
| 19 to 25 Years | 0 (0.0%) | 10 (100.0%) |
| 25 to 34 Years | 2 (33.3%) | 0 (0.0%) |
| 35 to 44 Years | 0 (0.0%) | 4 (80.0%) |
| 45 to 54 Years | 10 (18.9%) | 43 (81.1%) |
| 55 to 64 Years | 24 (32.0%) | 45 (60.0%) |
| 65 to 74 Years | 21 (80.8%) | 24 (92.3%) |
| 75 Years and over | 11 (100.0%) | 11 (100.0%) |
| Total | 106 (45.3%) | 141 (60.3%) |
Disability Status by Sex by Age in Menifee
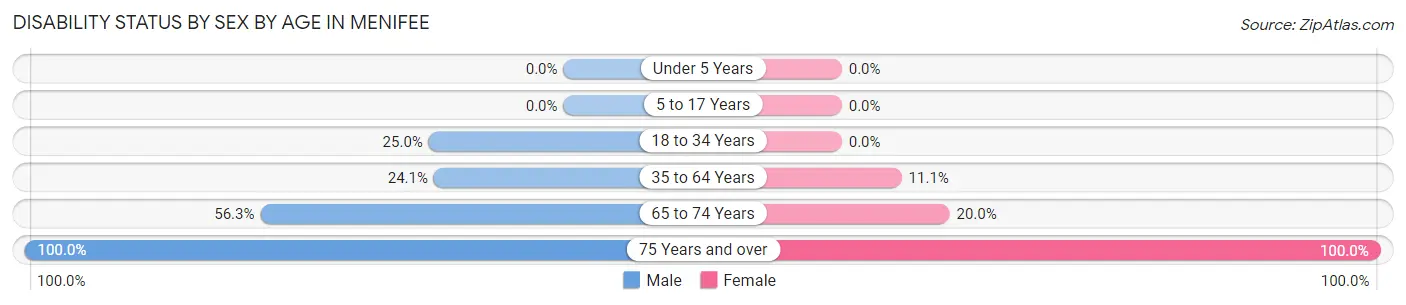
| Age Bracket | Male | Female |
| Under 5 Years | 0 (0.0%) | 0 (0.0%) |
| 5 to 17 Years | 0 (0.0%) | 0 (0.0%) |
| 18 to 34 Years | 2 (25.0%) | 0 (0.0%) |
| 35 to 64 Years | 19 (24.0%) | 6 (11.1%) |
| 65 to 74 Years | 9 (56.2%) | 2 (20.0%) |
| 75 Years and over | 6 (100.0%) | 5 (100.0%) |
Disability Class by Sex by Age in Menifee
Disability Class: Hearing Difficulty
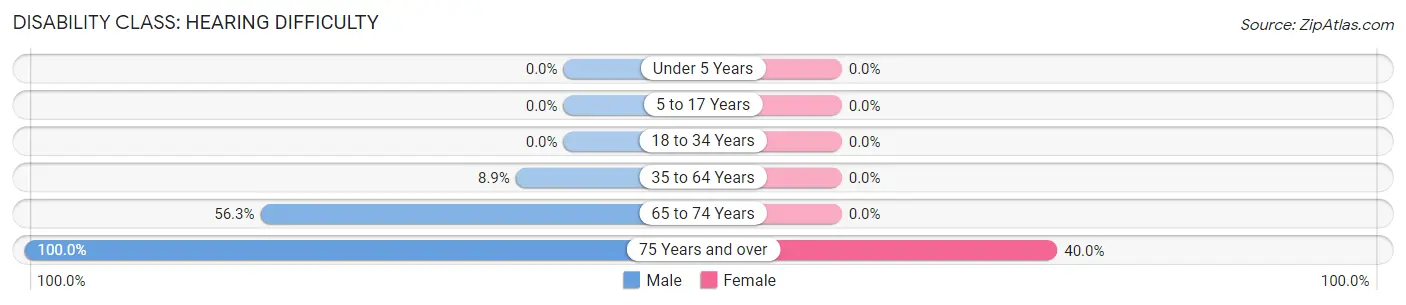
| Age Bracket | Male | Female |
| Under 5 Years | 0 (0.0%) | 0 (0.0%) |
| 5 to 17 Years | 0 (0.0%) | 0 (0.0%) |
| 18 to 34 Years | 0 (0.0%) | 0 (0.0%) |
| 35 to 64 Years | 7 (8.9%) | 0 (0.0%) |
| 65 to 74 Years | 9 (56.2%) | 0 (0.0%) |
| 75 Years and over | 6 (100.0%) | 2 (40.0%) |
Disability Class: Vision Difficulty
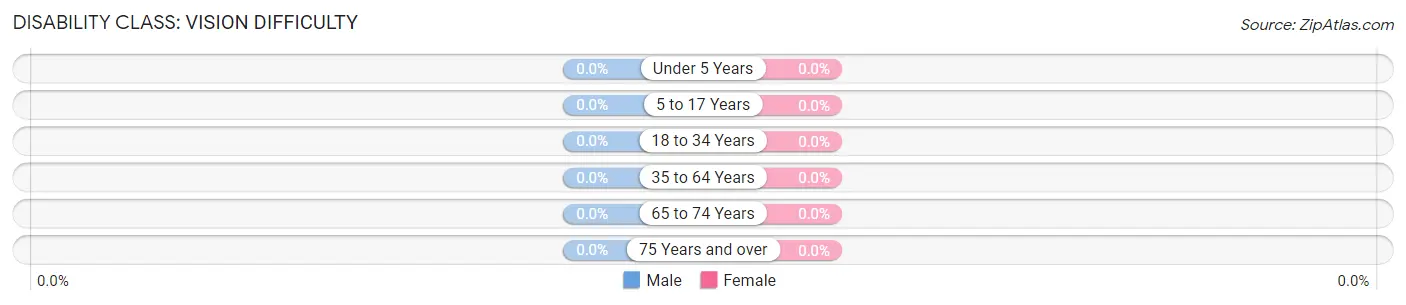
| Age Bracket | Male | Female |
| Under 5 Years | 0 (0.0%) | 0 (0.0%) |
| 5 to 17 Years | 0 (0.0%) | 0 (0.0%) |
| 18 to 34 Years | 0 (0.0%) | 0 (0.0%) |
| 35 to 64 Years | 0 (0.0%) | 0 (0.0%) |
| 65 to 74 Years | 0 (0.0%) | 0 (0.0%) |
| 75 Years and over | 0 (0.0%) | 0 (0.0%) |
Disability Class: Cognitive Difficulty
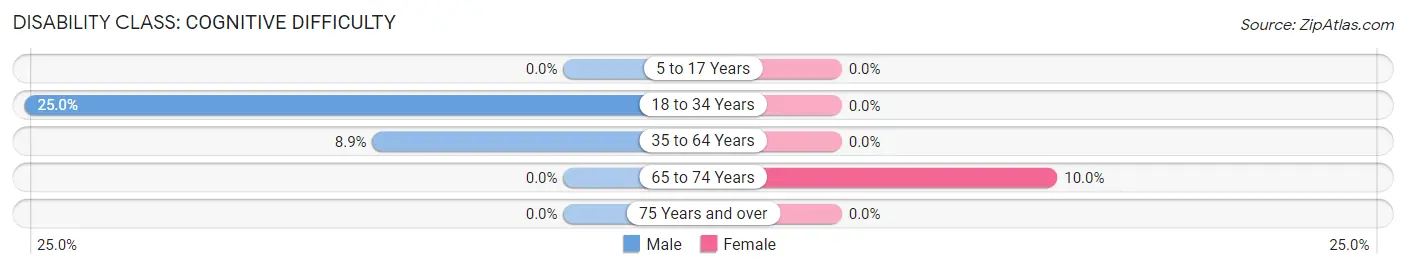
| Age Bracket | Male | Female |
| 5 to 17 Years | 0 (0.0%) | 0 (0.0%) |
| 18 to 34 Years | 2 (25.0%) | 0 (0.0%) |
| 35 to 64 Years | 7 (8.9%) | 0 (0.0%) |
| 65 to 74 Years | 0 (0.0%) | 1 (10.0%) |
| 75 Years and over | 0 (0.0%) | 0 (0.0%) |
Disability Class: Ambulatory Difficulty
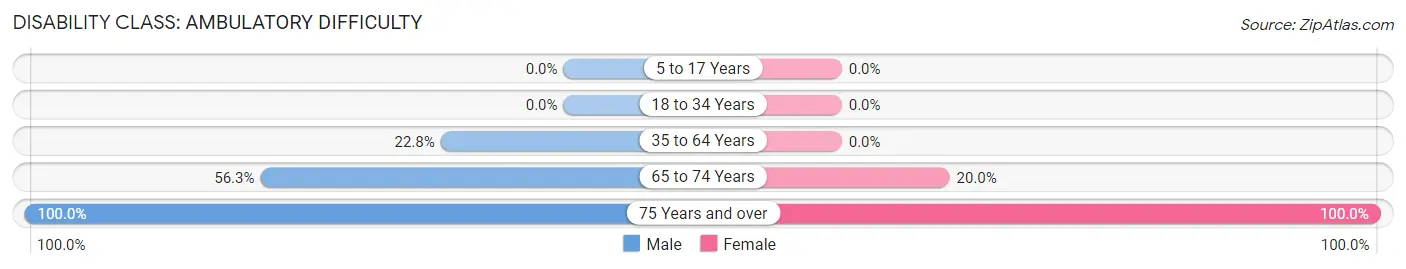
| Age Bracket | Male | Female |
| 5 to 17 Years | 0 (0.0%) | 0 (0.0%) |
| 18 to 34 Years | 0 (0.0%) | 0 (0.0%) |
| 35 to 64 Years | 18 (22.8%) | 0 (0.0%) |
| 65 to 74 Years | 9 (56.2%) | 2 (20.0%) |
| 75 Years and over | 6 (100.0%) | 5 (100.0%) |
Disability Class: Self-Care Difficulty
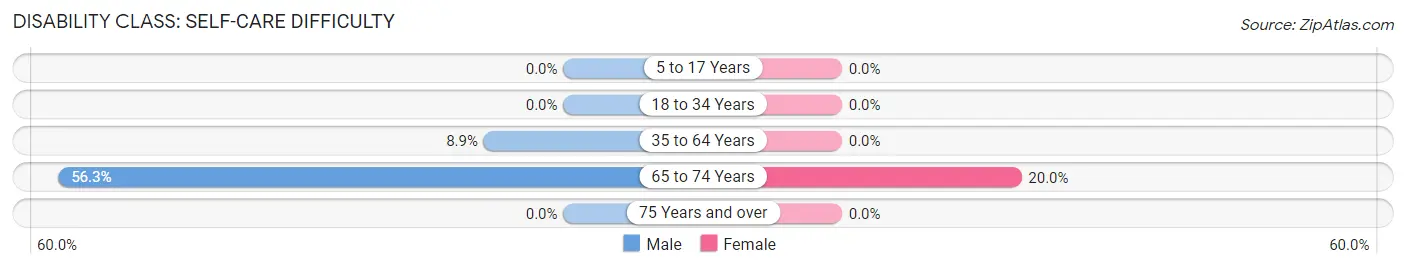
| Age Bracket | Male | Female |
| 5 to 17 Years | 0 (0.0%) | 0 (0.0%) |
| 18 to 34 Years | 0 (0.0%) | 0 (0.0%) |
| 35 to 64 Years | 7 (8.9%) | 0 (0.0%) |
| 65 to 74 Years | 9 (56.2%) | 2 (20.0%) |
| 75 Years and over | 0 (0.0%) | 0 (0.0%) |
Technology Access in Menifee
Computing Device Access in Menifee
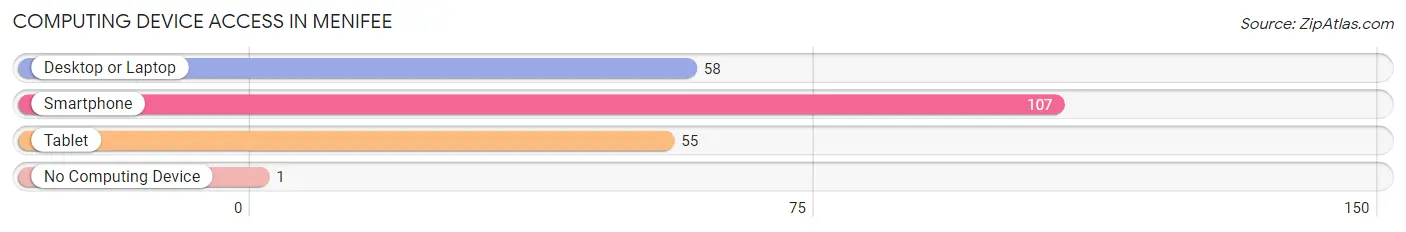
| Device Type | # Households | % Households |
| Desktop or Laptop | 58 | 51.8% |
| Smartphone | 107 | 95.5% |
| Tablet | 55 | 49.1% |
| No Computing Device | 1 | 0.9% |
| Total | 112 | 100.0% |
Internet Access in Menifee
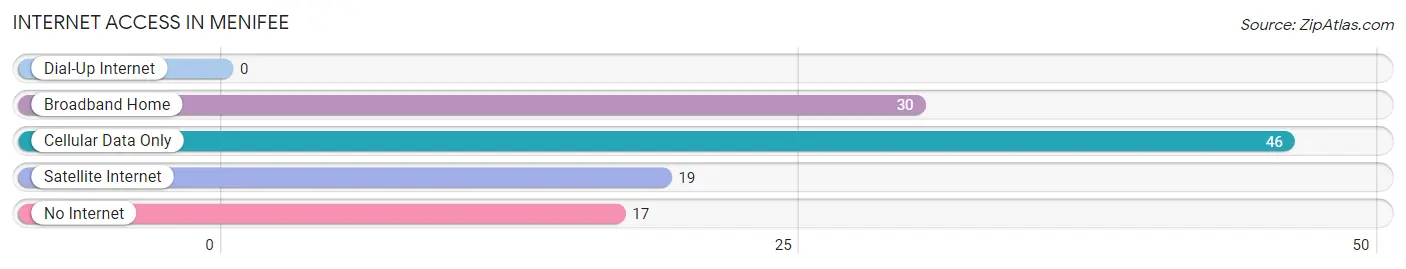
| Internet Type | # Households | % Households |
| Dial-Up Internet | 0 | 0.0% |
| Broadband Home | 30 | 26.8% |
| Cellular Data Only | 46 | 41.1% |
| Satellite Internet | 19 | 17.0% |
| No Internet | 17 | 15.2% |
| Total | 112 | 100.0% |
Menifee Summary
Menifee, Arkansas is a small town located in the foothills of the Ozark Mountains in the northwest corner of the state. It is situated in the White River Valley, which is part of the Mississippi River watershed. The town is located in the county of Newton, and is part of the Harrison-Newton-Baxter Combined Statistical Area. The population of Menifee was estimated to be 1,072 in 2019.
History
Menifee was founded in 1883 by a group of settlers from the nearby town of Harrison. The town was named after the Menifee family, who were among the first settlers in the area. The town was originally a farming community, and the main crops grown were cotton, corn, and wheat. The town was also home to a number of sawmills and gristmills.
In the early 1900s, Menifee began to experience a period of growth and development. The town was incorporated in 1906, and the first mayor was elected in 1907. The town was home to a number of businesses, including a bank, a hotel, a general store, and a blacksmith shop.
In the 1920s, Menifee experienced a period of decline. The Great Depression caused many of the businesses in the town to close, and the population began to decline. The town was able to survive, however, and in the 1940s, the population began to increase again.
Geography
Menifee is located in the northwest corner of Arkansas, in the White River Valley. The town is situated in the foothills of the Ozark Mountains, and is surrounded by rolling hills and forests. The town is located near the Buffalo National River, which is a popular destination for outdoor recreation.
The climate in Menifee is humid subtropical, with hot summers and mild winters. The average annual temperature is around 64°F, and the average annual precipitation is around 45 inches.
Economy
The economy of Menifee is largely based on agriculture and tourism. The town is home to a number of farms, which produce a variety of crops, including cotton, corn, and wheat. The town is also home to a number of tourist attractions, including the Buffalo National River and the Ozark National Forest.
The town is also home to a number of small businesses, including restaurants, shops, and other services. The town is home to a number of manufacturing companies, which produce a variety of products, including furniture, clothing, and electronics.
Demographics
The population of Menifee was estimated to be 1,072 in 2019. The town is predominantly white, with a small African American population. The median household income in the town is around $35,000, and the median home value is around $90,000. The town has a low unemployment rate, and the poverty rate is below the national average.
Common Questions
What is Per Capita Income in Menifee?
Per Capita income in Menifee is $35,507.
What is the Median Family Income in Menifee?
Median Family Income in Menifee is $86,875.
What is the Median Household income in Menifee?
Median Household Income in Menifee is $59,886.
What is Income or Wage Gap in Menifee?
Income or Wage Gap in Menifee is 32.7%.
Women in Menifee earn 67.3 cents for every dollar earned by a man.
What is Inequality or Gini Index in Menifee?
Inequality or Gini Index in Menifee is 0.25.
What is the Total Population of Menifee?
Total Population of Menifee is 234.
What is the Total Male Population of Menifee?
Total Male Population of Menifee is 134.
What is the Total Female Population of Menifee?
Total Female Population of Menifee is 100.
What is the Ratio of Males per 100 Females in Menifee?
There are 134.00 Males per 100 Females in Menifee.
What is the Ratio of Females per 100 Males in Menifee?
There are 74.63 Females per 100 Males in Menifee.
What is the Median Population Age in Menifee?
Median Population Age in Menifee is 53.7 Years.
What is the Average Family Size in Menifee
Average Family Size in Menifee is 2.6 People.
What is the Average Household Size in Menifee
Average Household Size in Menifee is 2.1 People.
How Large is the Labor Force in Menifee?
There are 118 People in the Labor Forcein in Menifee.
What is the Percentage of People in the Labor Force in Menifee?
62.1% of People are in the Labor Force in Menifee.
What is the Unemployment Rate in Menifee?
Unemployment Rate in Menifee is 5.1%.