Mena, AR Map & Demographics
Mena Map
Mena Overview
$31,725
PER CAPITA INCOME
$69,400
AVG FAMILY INCOME
$53,288
AVG HOUSEHOLD INCOME
23.5%
WAGE / INCOME GAP [ % ]
76.5¢/ $1
WAGE / INCOME GAP [ $ ]
0.50
INEQUALITY / GINI INDEX
5,605
TOTAL POPULATION
2,603
MALE POPULATION
3,002
FEMALE POPULATION
86.71
MALES / 100 FEMALES
115.33
FEMALES / 100 MALES
38.5
MEDIAN AGE
3.5
AVG FAMILY SIZE
2.5
AVG HOUSEHOLD SIZE
2,709
LABOR FORCE [ PEOPLE ]
59.1%
PERCENT IN LABOR FORCE
10.6%
UNEMPLOYMENT RATE
Mena Zip Codes
Mena Area Codes
Income in Mena
Income Overview in Mena
Per Capita Income in Mena is $31,725, while median incomes of families and households are $69,400 and $53,288 respectively.
| Characteristic | Number | Measure |
| Per Capita Income | 5,605 | $31,725 |
| Median Family Income | 1,136 | $69,400 |
| Mean Family Income | 1,136 | $86,043 |
| Median Household Income | 2,214 | $53,288 |
| Mean Household Income | 2,214 | $76,330 |
| Income Deficit | 1,136 | $0 |
| Wage / Income Gap (%) | 5,605 | 23.51% |
| Wage / Income Gap ($) | 5,605 | 76.49¢ per $1 |
| Gini / Inequality Index | 5,605 | 0.50 |
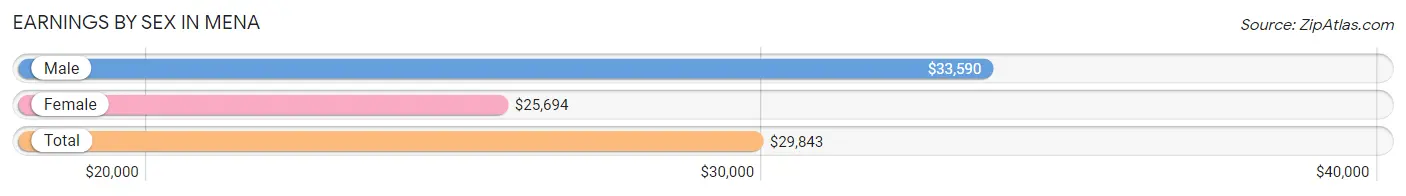
Earnings by Sex in Mena
Average Earnings in Mena are $29,843, $33,590 for men and $25,694 for women, a difference of 23.5%.
| Sex | Number | Average Earnings |
| Male | 1,543 (56.2%) | $33,590 |
| Female | 1,202 (43.8%) | $25,694 |
| Total | 2,745 (100.0%) | $29,843 |
Earnings by Sex by Income Bracket in Mena
The most common earnings brackets in Mena are $25,000 to $29,999 for men (218 | 14.1%) and $35,000 to $39,999 for women (138 | 11.5%).
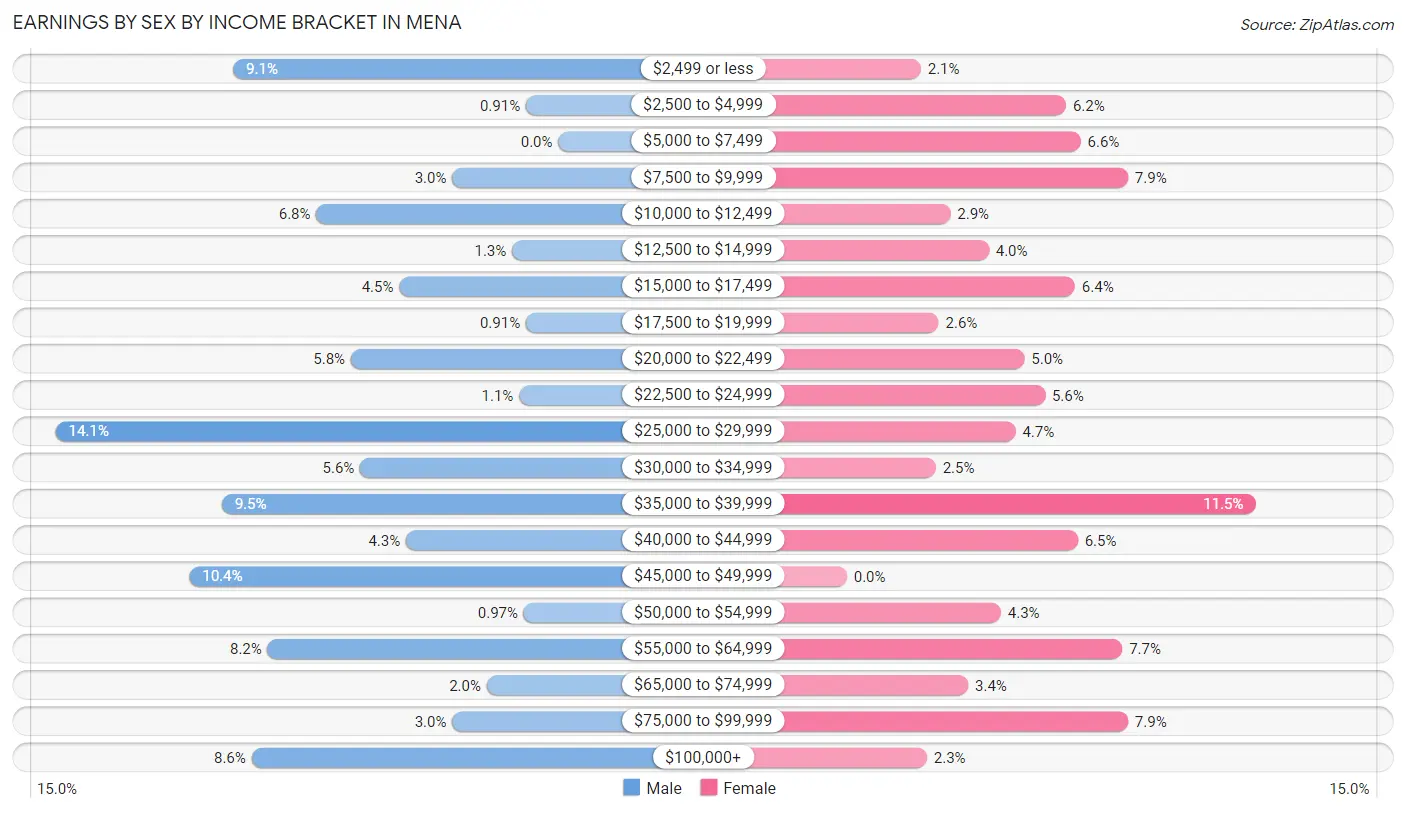
| Income | Male | Female |
| $2,499 or less | 141 (9.1%) | 25 (2.1%) |
| $2,500 to $4,999 | 14 (0.9%) | 74 (6.2%) |
| $5,000 to $7,499 | 0 (0.0%) | 79 (6.6%) |
| $7,500 to $9,999 | 46 (3.0%) | 95 (7.9%) |
| $10,000 to $12,499 | 105 (6.8%) | 35 (2.9%) |
| $12,500 to $14,999 | 20 (1.3%) | 48 (4.0%) |
| $15,000 to $17,499 | 69 (4.5%) | 77 (6.4%) |
| $17,500 to $19,999 | 14 (0.9%) | 31 (2.6%) |
| $20,000 to $22,499 | 90 (5.8%) | 60 (5.0%) |
| $22,500 to $24,999 | 17 (1.1%) | 67 (5.6%) |
| $25,000 to $29,999 | 218 (14.1%) | 57 (4.7%) |
| $30,000 to $34,999 | 86 (5.6%) | 30 (2.5%) |
| $35,000 to $39,999 | 146 (9.5%) | 138 (11.5%) |
| $40,000 to $44,999 | 66 (4.3%) | 78 (6.5%) |
| $45,000 to $49,999 | 160 (10.4%) | 0 (0.0%) |
| $50,000 to $54,999 | 15 (1.0%) | 52 (4.3%) |
| $55,000 to $64,999 | 126 (8.2%) | 93 (7.7%) |
| $65,000 to $74,999 | 31 (2.0%) | 41 (3.4%) |
| $75,000 to $99,999 | 46 (3.0%) | 95 (7.9%) |
| $100,000+ | 133 (8.6%) | 27 (2.2%) |
| Total | 1,543 (100.0%) | 1,202 (100.0%) |
Earnings by Sex by Educational Attainment in Mena
Average earnings in Mena are $39,250 for men and $38,391 for women, a difference of 2.2%. Men with an educational attainment of graduate degree enjoy the highest average annual earnings of $125,707, while those with less than high school education earn the least with $28,963. Women with an educational attainment of graduate degree earn the most with the average annual earnings of $70,817, while those with high school diploma education have the smallest earnings of $20,904.
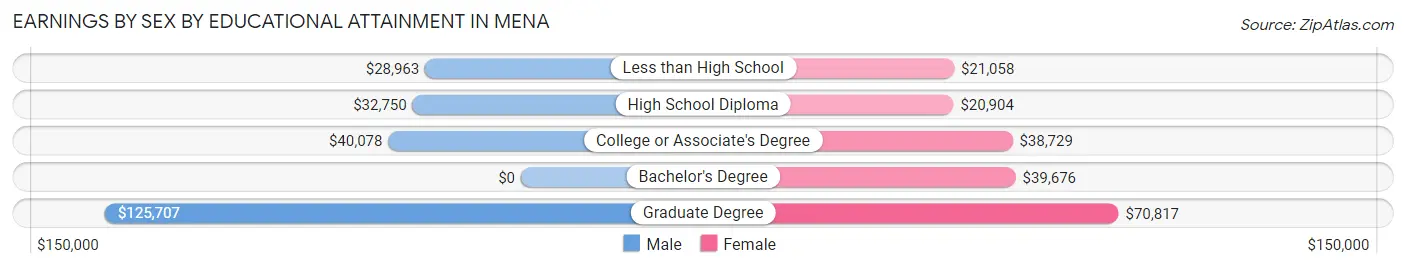
| Educational Attainment | Male Income | Female Income |
| Less than High School | $28,963 | $21,058 |
| High School Diploma | $32,750 | $20,904 |
| College or Associate's Degree | $40,078 | $38,729 |
| Bachelor's Degree | - | - |
| Graduate Degree | $125,707 | $70,817 |
| Total | $39,250 | $38,391 |
Family Income in Mena
Family Income Brackets in Mena
According to the Mena family income data, there are 329 families falling into the $75,000 to $99,999 income range, which is the most common income bracket and makes up 29.0% of all families.
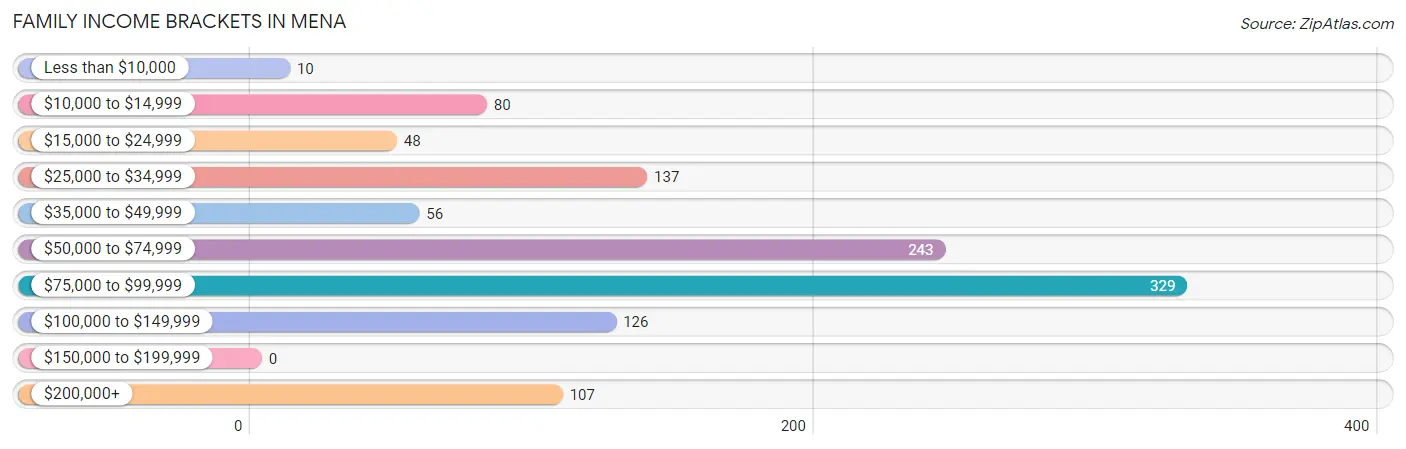
| Income Bracket | # Families | % Families |
| Less than $10,000 | 10 | 0.9% |
| $10,000 to $14,999 | 80 | 7.0% |
| $15,000 to $24,999 | 48 | 4.2% |
| $25,000 to $34,999 | 137 | 12.1% |
| $35,000 to $49,999 | 56 | 4.9% |
| $50,000 to $74,999 | 243 | 21.4% |
| $75,000 to $99,999 | 329 | 29.0% |
| $100,000 to $149,999 | 126 | 11.1% |
| $150,000 to $199,999 | 0 | 0.0% |
| $200,000+ | 107 | 9.4% |
Family Income by Famaliy Size in Mena
5-person families (235 | 20.7%) account for the highest median family income in Mena with $83,604 per family, while 2-person families (536 | 47.2%) have the highest median income of $29,787 per family member.
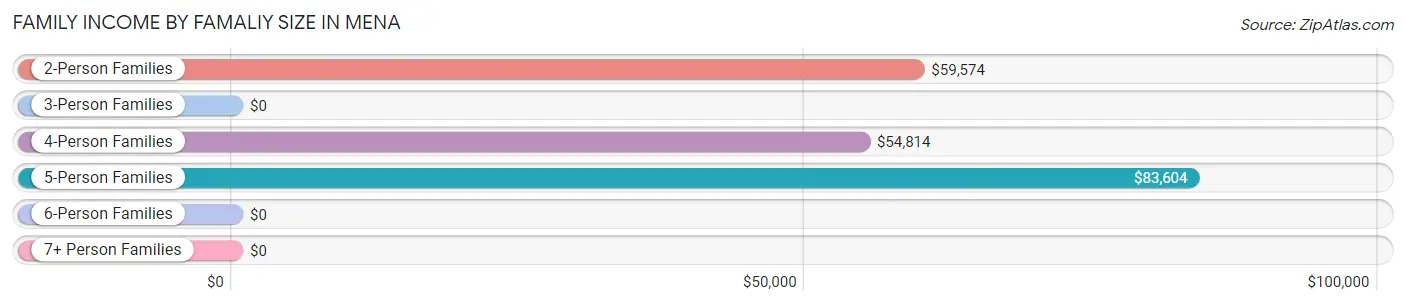
| Income Bracket | # Families | Median Income |
| 2-Person Families | 536 (47.2%) | $59,574 |
| 3-Person Families | 184 (16.2%) | $0 |
| 4-Person Families | 151 (13.3%) | $54,814 |
| 5-Person Families | 235 (20.7%) | $83,604 |
| 6-Person Families | 12 (1.1%) | $0 |
| 7+ Person Families | 18 (1.6%) | $0 |
| Total | 1,136 (100.0%) | $69,400 |
Family Income by Number of Earners in Mena
The median family income in Mena is $69,400, with families comprising 3+ earners (67) having the highest median family income of $88,646, while families with 1 earner (221) have the lowest median family income of $30,288, accounting for 5.9% and 19.5% of families, respectively.
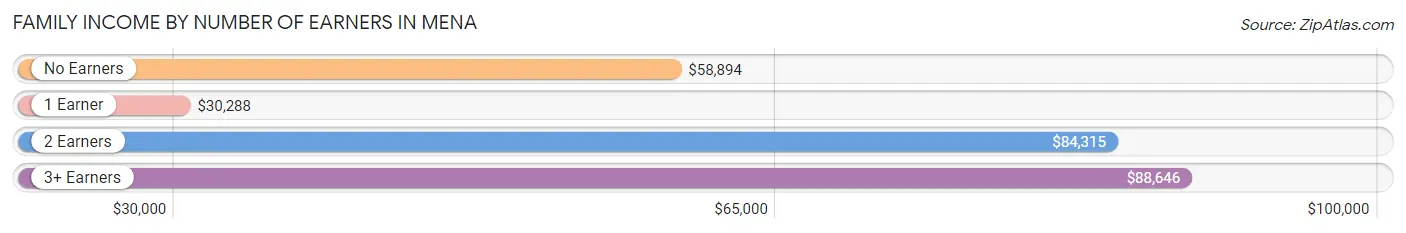
| Number of Earners | # Families | Median Income |
| No Earners | 191 (16.8%) | $58,894 |
| 1 Earner | 221 (19.5%) | $30,288 |
| 2 Earners | 657 (57.8%) | $84,315 |
| 3+ Earners | 67 (5.9%) | $88,646 |
| Total | 1,136 (100.0%) | $69,400 |
Household Income in Mena
Household Income Brackets in Mena
With 469 households falling in the category, the $75,000 to $99,999 income range is the most frequent in Mena, accounting for 21.2% of all households.
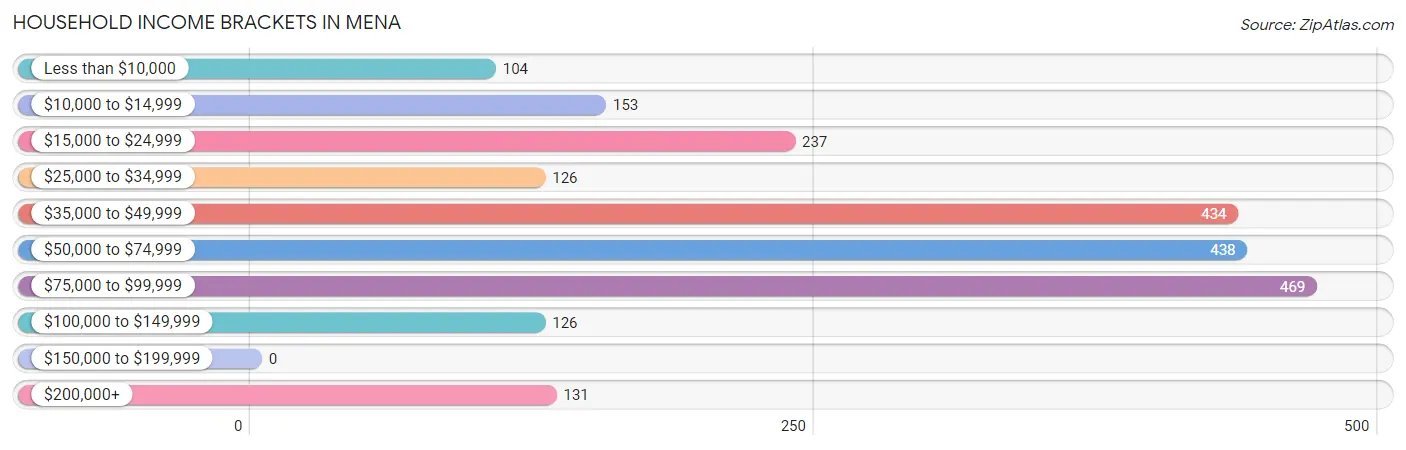
| Income Bracket | # Households | % Households |
| Less than $10,000 | 104 | 4.7% |
| $10,000 to $14,999 | 153 | 6.9% |
| $15,000 to $24,999 | 237 | 10.7% |
| $25,000 to $34,999 | 126 | 5.7% |
| $35,000 to $49,999 | 434 | 19.6% |
| $50,000 to $74,999 | 438 | 19.8% |
| $75,000 to $99,999 | 469 | 21.2% |
| $100,000 to $149,999 | 126 | 5.7% |
| $150,000 to $199,999 | 0 | 0.0% |
| $200,000+ | 131 | 5.9% |
Household Income by Householder Age in Mena
The median household income in Mena is $53,288, with the highest median household income of $61,833 found in the 45 to 64 years age bracket for the primary householder. A total of 900 households (40.6%) fall into this category. Meanwhile, the 15 to 24 years age bracket for the primary householder has the lowest median household income of $24,211, with 142 households (6.4%) in this group.
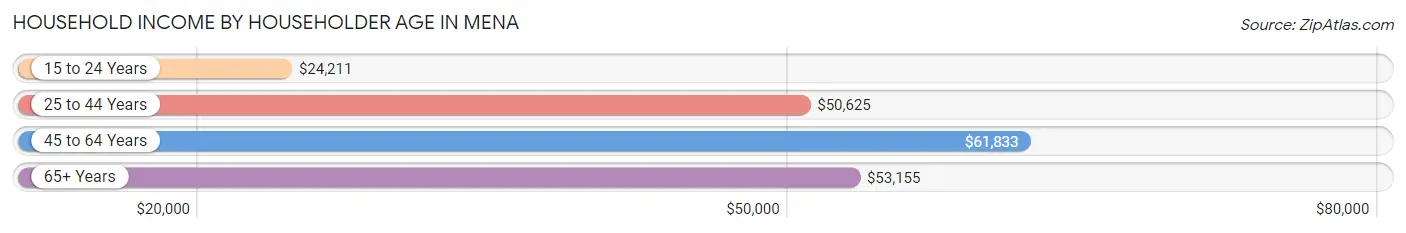
| Income Bracket | # Households | Median Income |
| 15 to 24 Years | 142 (6.4%) | $24,211 |
| 25 to 44 Years | 537 (24.2%) | $50,625 |
| 45 to 64 Years | 900 (40.6%) | $61,833 |
| 65+ Years | 635 (28.7%) | $53,155 |
| Total | 2,214 (100.0%) | $53,288 |
Poverty in Mena
Income Below Poverty by Sex and Age in Mena
With 14.8% poverty level for males and 20.4% for females among the residents of Mena, under 5 year old males and 18 to 24 year old females are the most vulnerable to poverty, with 71 males (57.7%) and 180 females (49.9%) in their respective age groups living below the poverty level.
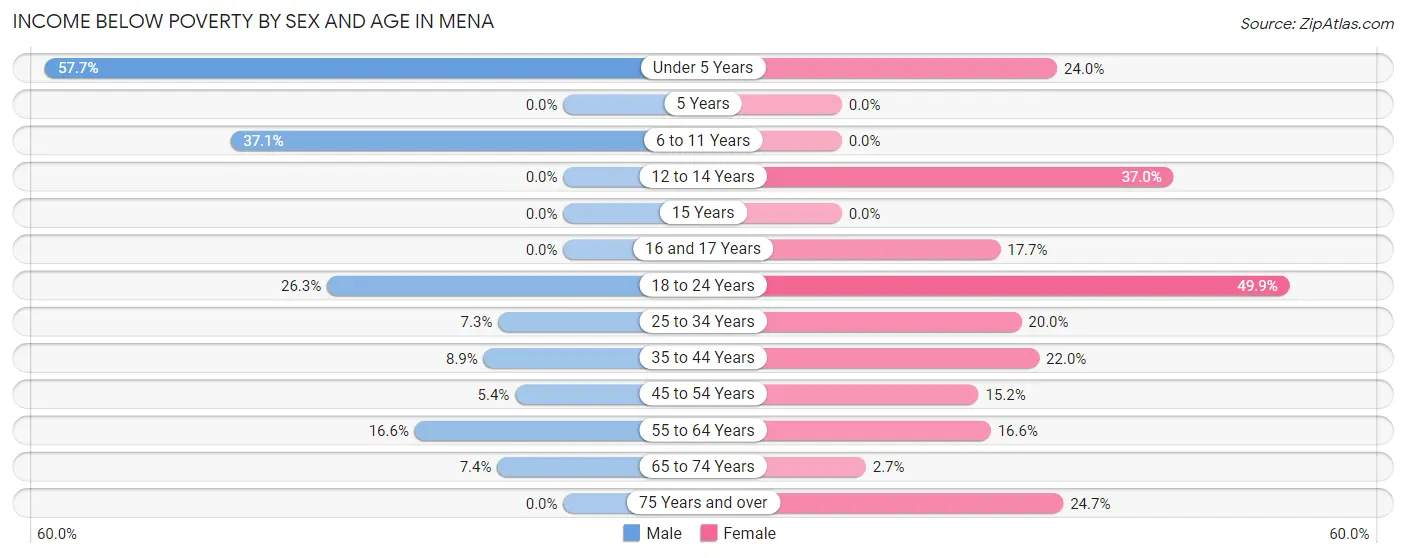
| Age Bracket | Male | Female |
| Under 5 Years | 71 (57.7%) | 53 (24.0%) |
| 5 Years | 0 (0.0%) | 0 (0.0%) |
| 6 to 11 Years | 56 (37.1%) | 0 (0.0%) |
| 12 to 14 Years | 0 (0.0%) | 34 (37.0%) |
| 15 Years | 0 (0.0%) | 0 (0.0%) |
| 16 and 17 Years | 0 (0.0%) | 9 (17.6%) |
| 18 to 24 Years | 95 (26.3%) | 180 (49.9%) |
| 25 to 34 Years | 24 (7.2%) | 76 (20.0%) |
| 35 to 44 Years | 23 (8.9%) | 40 (22.0%) |
| 45 to 54 Years | 17 (5.4%) | 53 (15.2%) |
| 55 to 64 Years | 68 (16.6%) | 71 (16.6%) |
| 65 to 74 Years | 24 (7.4%) | 7 (2.7%) |
| 75 Years and over | 0 (0.0%) | 73 (24.7%) |
| Total | 378 (14.8%) | 596 (20.4%) |
Income Above Poverty by Sex and Age in Mena
According to the poverty statistics in Mena, males aged 5 years and females aged 5 years are the age groups that are most secure financially, with 100.0% of males and 100.0% of females in these age groups living above the poverty line.
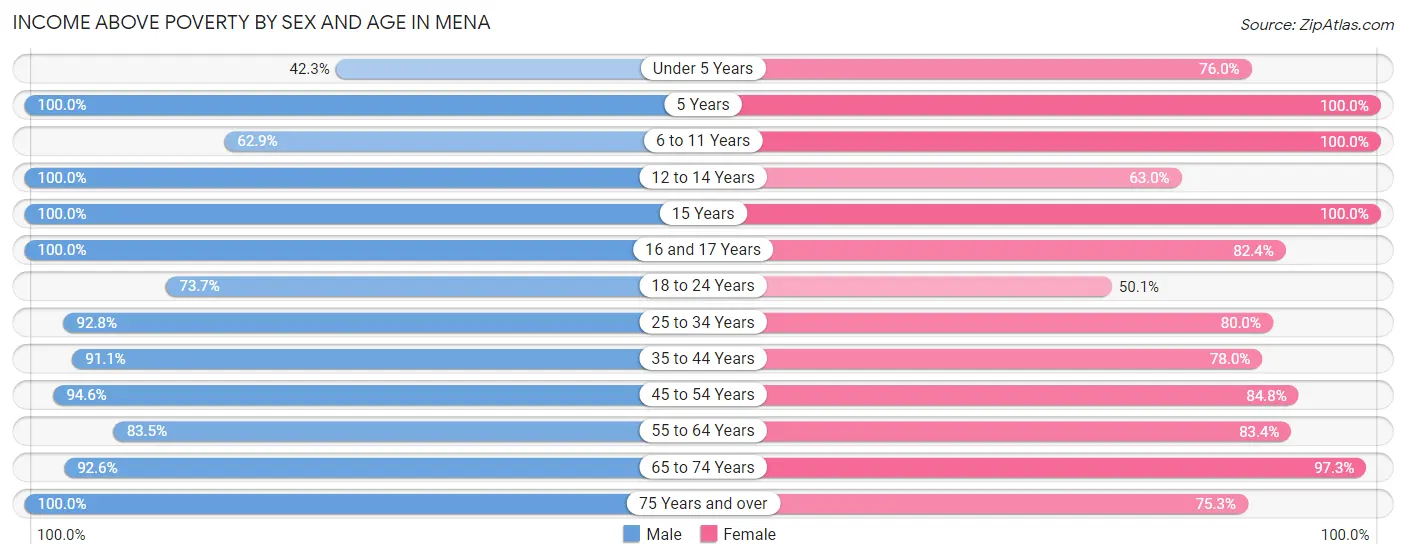
| Age Bracket | Male | Female |
| Under 5 Years | 52 (42.3%) | 168 (76.0%) |
| 5 Years | 62 (100.0%) | 35 (100.0%) |
| 6 to 11 Years | 95 (62.9%) | 220 (100.0%) |
| 12 to 14 Years | 64 (100.0%) | 58 (63.0%) |
| 15 Years | 16 (100.0%) | 38 (100.0%) |
| 16 and 17 Years | 43 (100.0%) | 42 (82.4%) |
| 18 to 24 Years | 266 (73.7%) | 181 (50.1%) |
| 25 to 34 Years | 307 (92.7%) | 304 (80.0%) |
| 35 to 44 Years | 236 (91.1%) | 142 (78.0%) |
| 45 to 54 Years | 300 (94.6%) | 295 (84.8%) |
| 55 to 64 Years | 343 (83.5%) | 357 (83.4%) |
| 65 to 74 Years | 302 (92.6%) | 255 (97.3%) |
| 75 Years and over | 94 (100.0%) | 223 (75.3%) |
| Total | 2,180 (85.2%) | 2,318 (79.5%) |
Income Below Poverty Among Married-Couple Families in Mena
The poverty statistics for married-couple families in Mena show that 5.9% or 52 of the total 887 families live below the poverty line. Families with 1 or 2 children have the highest poverty rate of 7.9%, comprising of 10 families. On the other hand, families with 3 or 4 children have the lowest poverty rate of 0.0%, which includes 0 families.
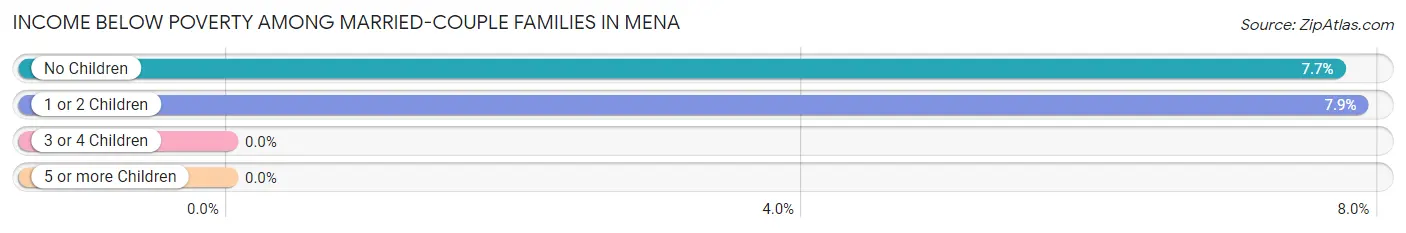
| Children | Above Poverty | Below Poverty |
| No Children | 503 (92.3%) | 42 (7.7%) |
| 1 or 2 Children | 117 (92.1%) | 10 (7.9%) |
| 3 or 4 Children | 209 (100.0%) | 0 (0.0%) |
| 5 or more Children | 6 (100.0%) | 0 (0.0%) |
| Total | 835 (94.1%) | 52 (5.9%) |
Income Below Poverty Among Single-Parent Households in Mena
According to the poverty data in Mena, 69.2% or 27 single-father households and 42.4% or 89 single-mother households are living below the poverty line. Among single-father households, those with 3 or 4 children have the highest poverty rate, with 27 households (100.0%) experiencing poverty. Likewise, among single-mother households, those with 3 or 4 children have the highest poverty rate, with 13 households (100.0%) falling below the poverty line.
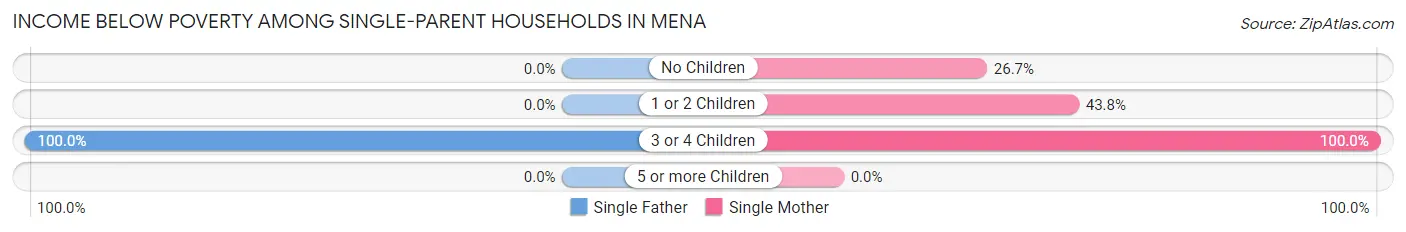
| Children | Single Father | Single Mother |
| No Children | 0 (0.0%) | 16 (26.7%) |
| 1 or 2 Children | 0 (0.0%) | 60 (43.8%) |
| 3 or 4 Children | 27 (100.0%) | 13 (100.0%) |
| 5 or more Children | 0 (0.0%) | 0 (0.0%) |
| Total | 27 (69.2%) | 89 (42.4%) |
Income Below Poverty Among Married-Couple vs Single-Parent Households in Mena
The poverty data for Mena shows that 52 of the married-couple family households (5.9%) and 116 of the single-parent households (46.6%) are living below the poverty level. Within the married-couple family households, those with 1 or 2 children have the highest poverty rate, with 10 households (7.9%) falling below the poverty line. Among the single-parent households, those with 3 or 4 children have the highest poverty rate, with 40 household (100.0%) living below poverty.
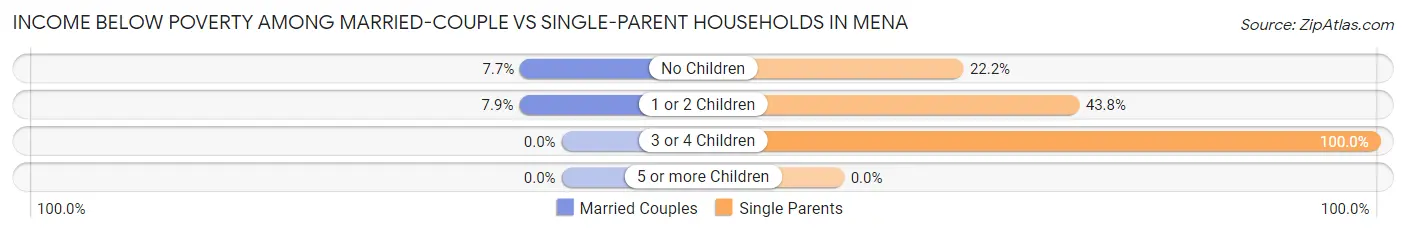
| Children | Married-Couple Families | Single-Parent Households |
| No Children | 42 (7.7%) | 16 (22.2%) |
| 1 or 2 Children | 10 (7.9%) | 60 (43.8%) |
| 3 or 4 Children | 0 (0.0%) | 40 (100.0%) |
| 5 or more Children | 0 (0.0%) | 0 (0.0%) |
| Total | 52 (5.9%) | 116 (46.6%) |
Race in Mena
The most populous races in Mena are White / Caucasian (5,234 | 93.4%), Two or more Races (235 | 4.2%), and Hispanic or Latino (197 | 3.5%).
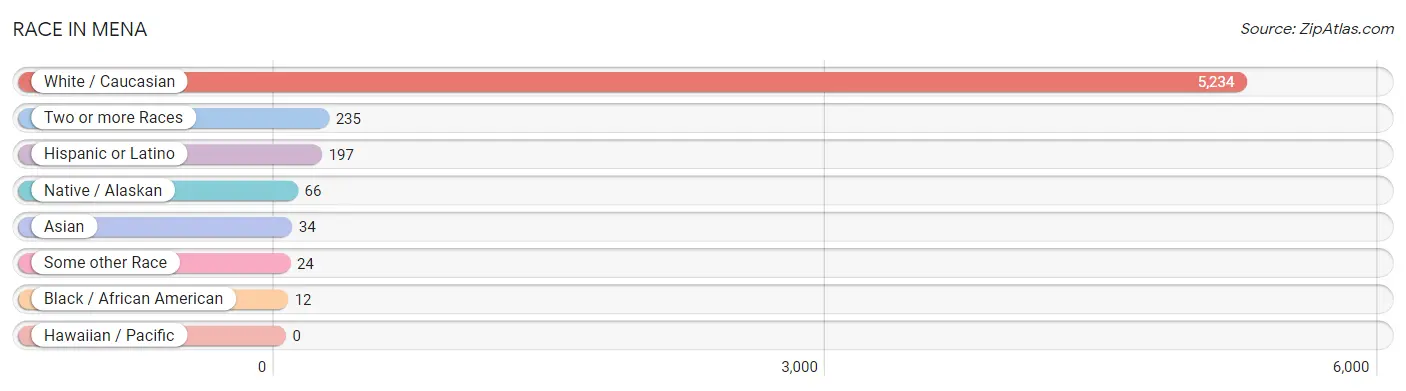
| Race | # Population | % Population |
| Asian | 34 | 0.6% |
| Black / African American | 12 | 0.2% |
| Hawaiian / Pacific | 0 | 0.0% |
| Hispanic or Latino | 197 | 3.5% |
| Native / Alaskan | 66 | 1.2% |
| White / Caucasian | 5,234 | 93.4% |
| Two or more Races | 235 | 4.2% |
| Some other Race | 24 | 0.4% |
| Total | 5,605 | 100.0% |
Ancestry in Mena
The most populous ancestries reported in Mena are Irish (870 | 15.5%), English (648 | 11.6%), German (525 | 9.4%), American (420 | 7.5%), and Mexican (197 | 3.5%), together accounting for 47.5% of all Mena residents.
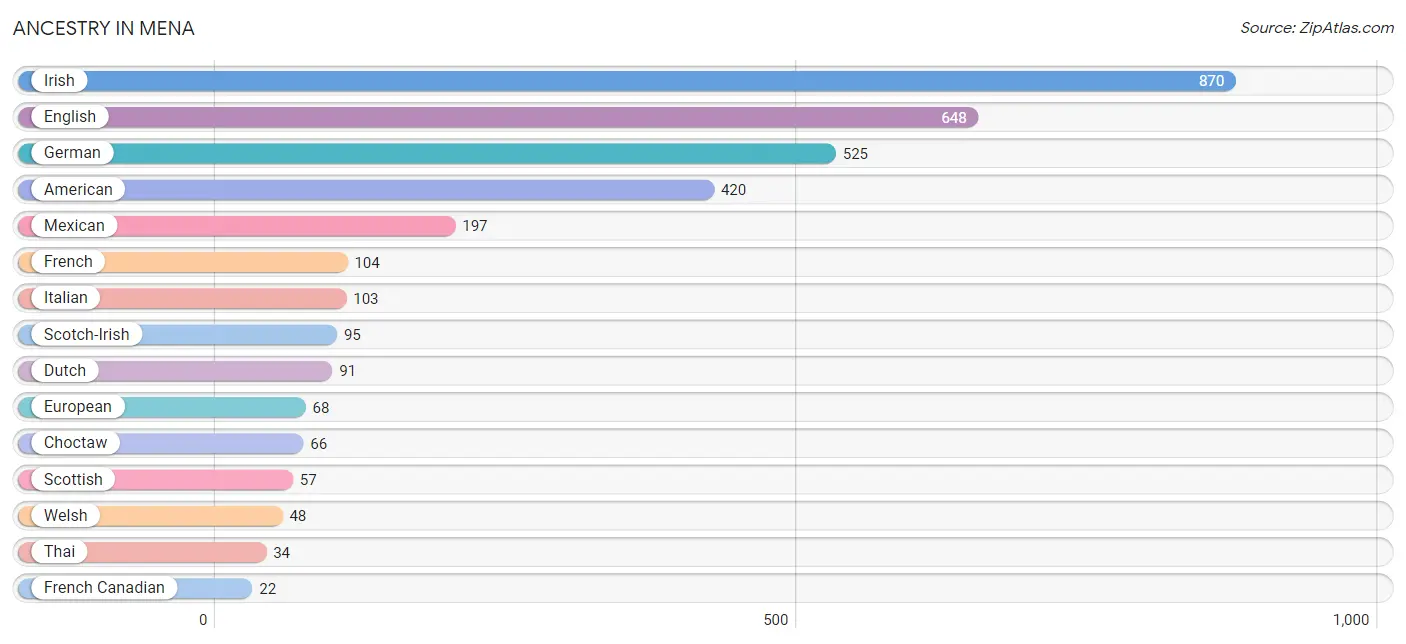
| Ancestry | # Population | % Population |
| American | 420 | 7.5% |
| Cherokee | 10 | 0.2% |
| Choctaw | 66 | 1.2% |
| Creek | 14 | 0.3% |
| Dutch | 91 | 1.6% |
| Dutch West Indian | 13 | 0.2% |
| English | 648 | 11.6% |
| European | 68 | 1.2% |
| French | 104 | 1.9% |
| French Canadian | 22 | 0.4% |
| German | 525 | 9.4% |
| Icelander | 19 | 0.3% |
| Indian (Asian) | 9 | 0.2% |
| Irish | 870 | 15.5% |
| Italian | 103 | 1.8% |
| Mexican | 197 | 3.5% |
| Norwegian | 6 | 0.1% |
| Pakistani | 9 | 0.2% |
| Pennsylvania German | 15 | 0.3% |
| Potawatomi | 21 | 0.4% |
| Scandinavian | 17 | 0.3% |
| Scotch-Irish | 95 | 1.7% |
| Scottish | 57 | 1.0% |
| Swedish | 7 | 0.1% |
| Thai | 34 | 0.6% |
| Tongan | 17 | 0.3% |
| Welsh | 48 | 0.9% | View All 27 Rows |
Immigrants in Mena
The most numerous immigrant groups reported in Mena came from Central America (67 | 1.2%), Latin America (67 | 1.2%), Mexico (67 | 1.2%), Canada (53 | 0.9%), and Asia (18 | 0.3%), together accounting for 4.9% of all Mena residents.
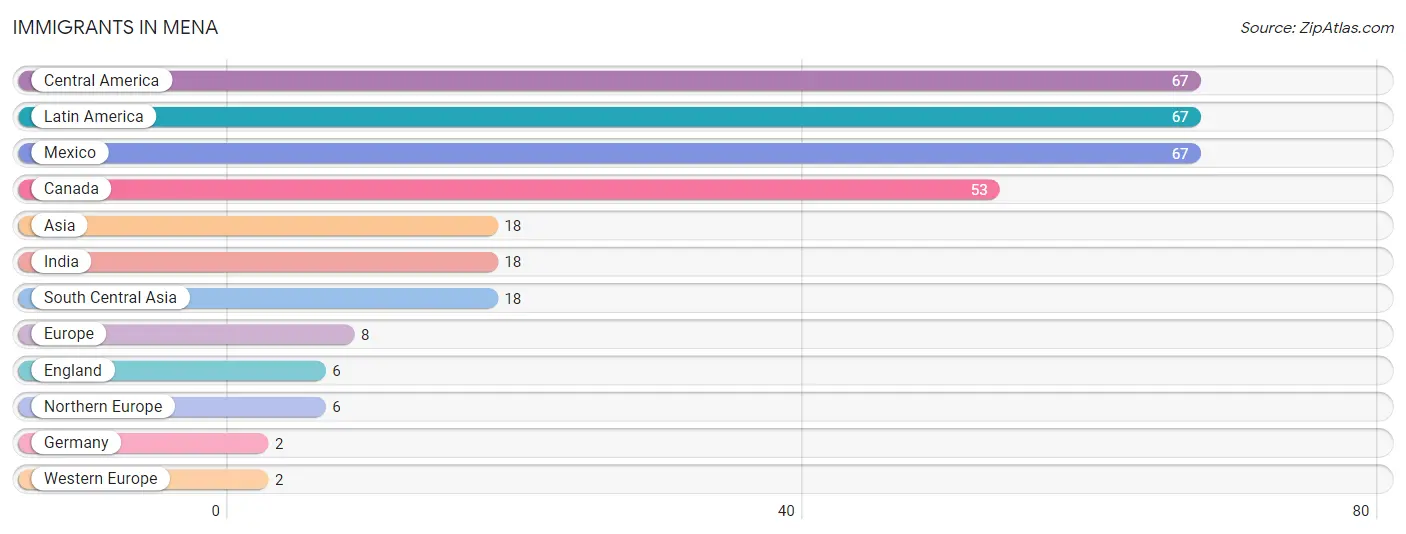
| Immigration Origin | # Population | % Population |
| Asia | 18 | 0.3% |
| Canada | 53 | 0.9% |
| Central America | 67 | 1.2% |
| England | 6 | 0.1% |
| Europe | 8 | 0.1% |
| Germany | 2 | 0.0% |
| India | 18 | 0.3% |
| Latin America | 67 | 1.2% |
| Mexico | 67 | 1.2% |
| Northern Europe | 6 | 0.1% |
| South Central Asia | 18 | 0.3% |
| Western Europe | 2 | 0.0% | View All 12 Rows |
Sex and Age in Mena
Sex and Age in Mena
The most populous age groups in Mena are 30 to 34 Years (273 | 10.5%) for men and 20 to 24 Years (271 | 9.0%) for women.
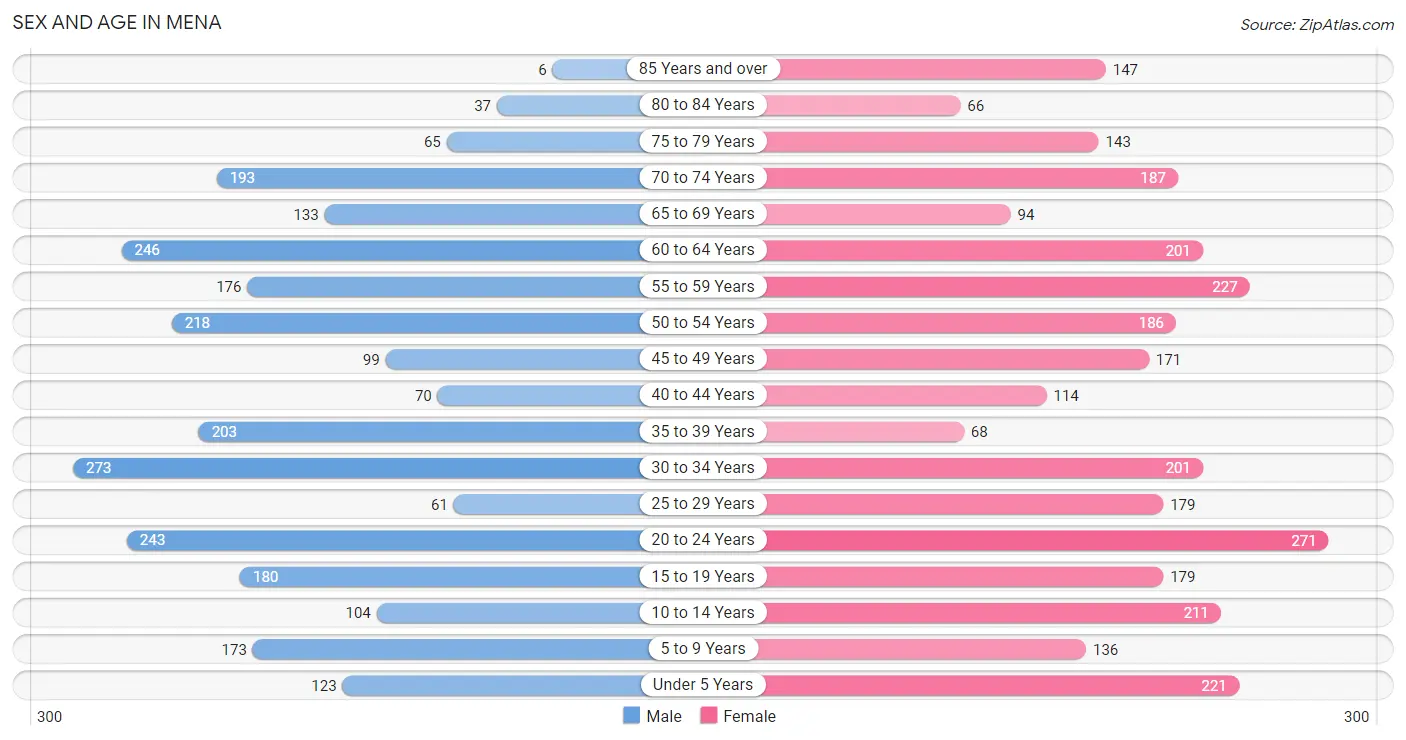
| Age Bracket | Male | Female |
| Under 5 Years | 123 (4.7%) | 221 (7.4%) |
| 5 to 9 Years | 173 (6.7%) | 136 (4.5%) |
| 10 to 14 Years | 104 (4.0%) | 211 (7.0%) |
| 15 to 19 Years | 180 (6.9%) | 179 (6.0%) |
| 20 to 24 Years | 243 (9.3%) | 271 (9.0%) |
| 25 to 29 Years | 61 (2.3%) | 179 (6.0%) |
| 30 to 34 Years | 273 (10.5%) | 201 (6.7%) |
| 35 to 39 Years | 203 (7.8%) | 68 (2.3%) |
| 40 to 44 Years | 70 (2.7%) | 114 (3.8%) |
| 45 to 49 Years | 99 (3.8%) | 171 (5.7%) |
| 50 to 54 Years | 218 (8.4%) | 186 (6.2%) |
| 55 to 59 Years | 176 (6.8%) | 227 (7.6%) |
| 60 to 64 Years | 246 (9.5%) | 201 (6.7%) |
| 65 to 69 Years | 133 (5.1%) | 94 (3.1%) |
| 70 to 74 Years | 193 (7.4%) | 187 (6.2%) |
| 75 to 79 Years | 65 (2.5%) | 143 (4.8%) |
| 80 to 84 Years | 37 (1.4%) | 66 (2.2%) |
| 85 Years and over | 6 (0.2%) | 147 (4.9%) |
| Total | 2,603 (100.0%) | 3,002 (100.0%) |
Families and Households in Mena
Median Family Size in Mena
The median family size in Mena is 3.55 persons per family, with single male/father families (39 | 3.4%) accounting for the largest median family size of 6.23 persons per family. On the other hand, single female/mother families (210 | 18.5%) represent the smallest median family size with 3.38 persons per family.
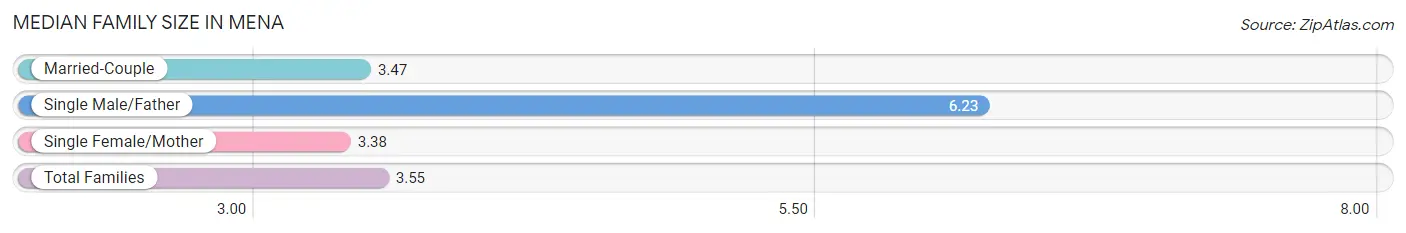
| Family Type | # Families | Family Size |
| Married-Couple | 887 (78.1%) | 3.47 |
| Single Male/Father | 39 (3.4%) | 6.23 |
| Single Female/Mother | 210 (18.5%) | 3.38 |
| Total Families | 1,136 (100.0%) | 3.55 |
Median Household Size in Mena
The median household size in Mena is 2.47 persons per household, with single male/father households (39 | 1.8%) accounting for the largest median household size of 7.33 persons per household. non-family households (1,078 | 48.7%) represent the smallest median household size with 1.13 persons per household.
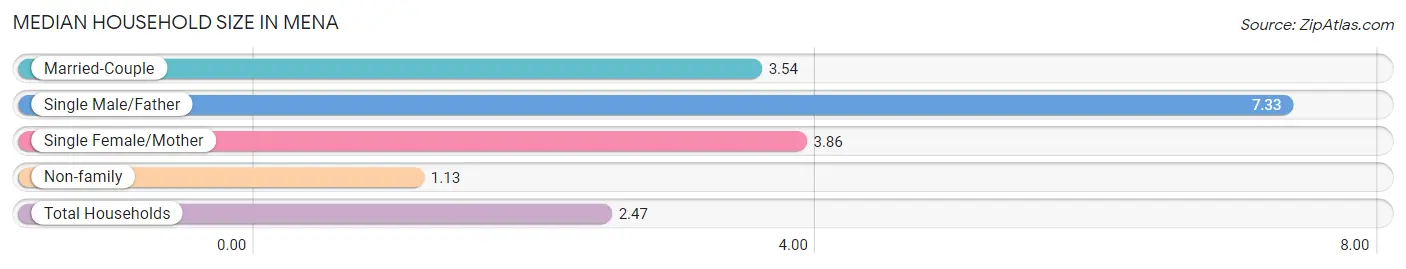
| Household Type | # Households | Household Size |
| Married-Couple | 887 (40.1%) | 3.54 |
| Single Male/Father | 39 (1.8%) | 7.33 |
| Single Female/Mother | 210 (9.5%) | 3.86 |
| Non-family | 1,078 (48.7%) | 1.13 |
| Total Households | 2,214 (100.0%) | 2.47 |
Household Size by Marriage Status in Mena
Out of a total of 2,214 households in Mena, 1,136 (51.3%) are family households, while 1,078 (48.7%) are nonfamily households. The most numerous type of family households are 2-person households, comprising 484, and the most common type of nonfamily households are 1-person households, comprising 971.
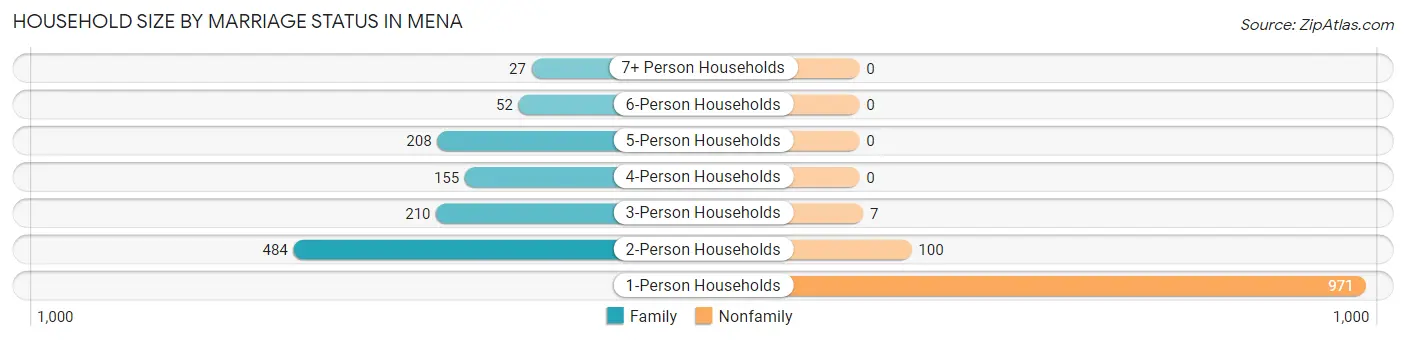
| Household Size | Family Households | Nonfamily Households |
| 1-Person Households | - | 971 (43.9%) |
| 2-Person Households | 484 (21.9%) | 100 (4.5%) |
| 3-Person Households | 210 (9.5%) | 7 (0.3%) |
| 4-Person Households | 155 (7.0%) | 0 (0.0%) |
| 5-Person Households | 208 (9.4%) | 0 (0.0%) |
| 6-Person Households | 52 (2.4%) | 0 (0.0%) |
| 7+ Person Households | 27 (1.2%) | 0 (0.0%) |
| Total | 1,136 (51.3%) | 1,078 (48.7%) |
Female Fertility in Mena
Fertility by Age in Mena
Average fertility rate in Mena is 171.0 births per 1,000 women. Women in the age bracket of 15 to 19 years have the highest fertility rate with 413.0 births per 1,000 women. Women in the age bracket of 20 to 34 years acount for 51.5% of all women with births.
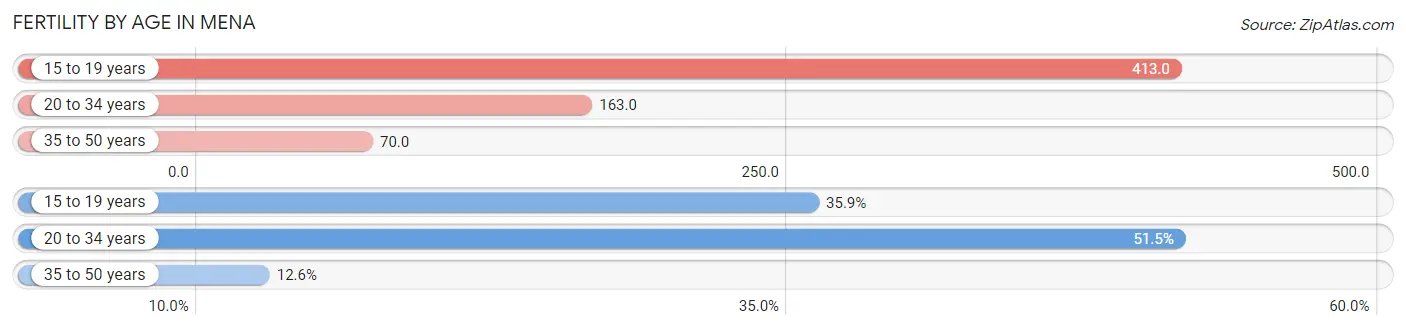
| Age Bracket | Women with Births | Births / 1,000 Women |
| 15 to 19 years | 74 (35.9%) | 413.0 |
| 20 to 34 years | 106 (51.5%) | 163.0 |
| 35 to 50 years | 26 (12.6%) | 70.0 |
| Total | 206 (100.0%) | 171.0 |
Fertility by Age by Marriage Status in Mena
87.4% of women with births (206) in Mena are married. The highest percentage of unmarried women with births falls into 15 to 19 years age bracket with 35.1% of them unmarried at the time of birth, while the lowest percentage of unmarried women with births belong to 20 to 34 years age bracket with 0.0% of them unmarried.
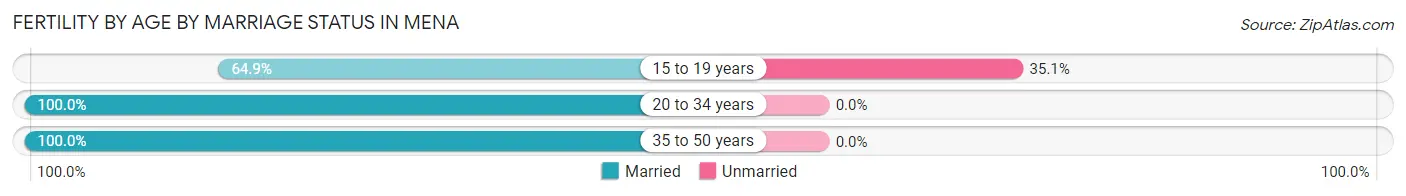
| Age Bracket | Married | Unmarried |
| 15 to 19 years | 48 (64.9%) | 26 (35.1%) |
| 20 to 34 years | 106 (100.0%) | 0 (0.0%) |
| 35 to 50 years | 26 (100.0%) | 0 (0.0%) |
| Total | 180 (87.4%) | 26 (12.6%) |
Fertility by Education in Mena
Average fertility rate in Mena is 171.0 births per 1,000 women. Women with the education attainment of graduate degree have the highest fertility rate of 813.0 births per 1,000 women, while women with the education attainment of high school diploma have the lowest fertility at 30.0 births per 1,000 women. Women with the education attainment of college or associate's degree represent 37.4% of all women with births.
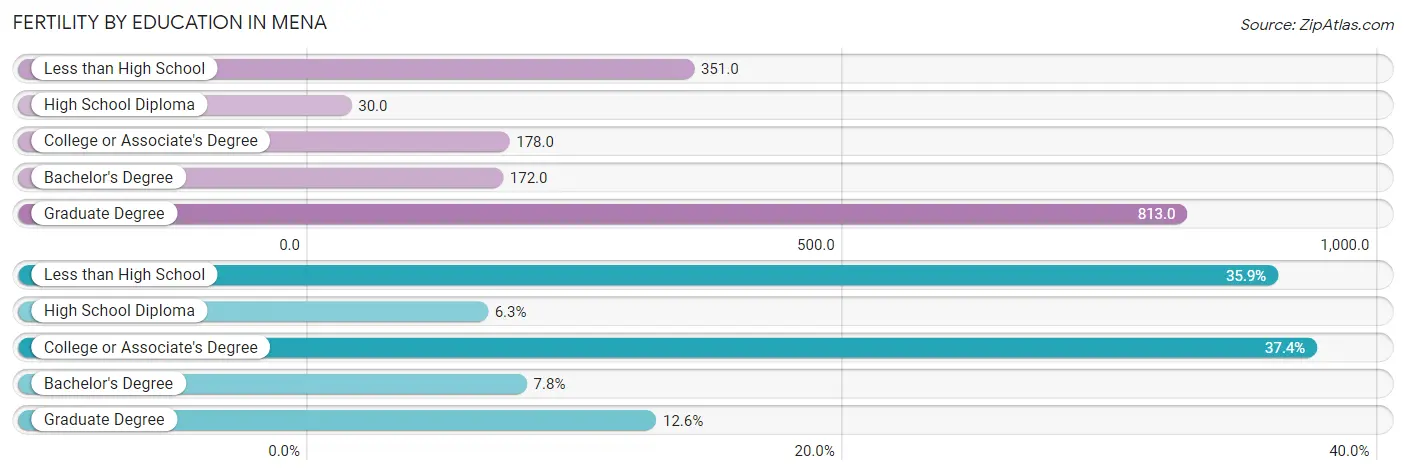
| Educational Attainment | Women with Births | Births / 1,000 Women |
| Less than High School | 74 (35.9%) | 351.0 |
| High School Diploma | 13 (6.3%) | 30.0 |
| College or Associate's Degree | 77 (37.4%) | 178.0 |
| Bachelor's Degree | 16 (7.8%) | 172.0 |
| Graduate Degree | 26 (12.6%) | 813.0 |
| Total | 206 (100.0%) | 171.0 |
Fertility by Education by Marriage Status in Mena
12.6% of women with births in Mena are unmarried. Women with the educational attainment of high school diploma are most likely to be married with 100.0% of them married at childbirth, while women with the educational attainment of less than high school are least likely to be married with 35.1% of them unmarried at childbirth.
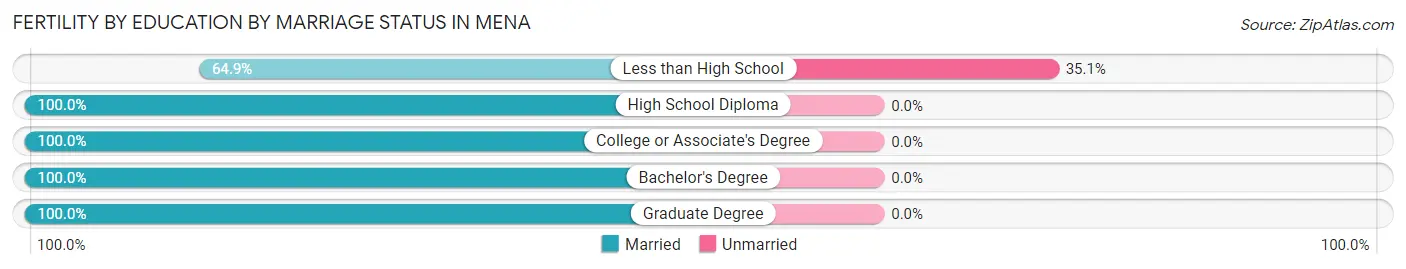
| Educational Attainment | Married | Unmarried |
| Less than High School | 48 (64.9%) | 26 (35.1%) |
| High School Diploma | 13 (100.0%) | 0 (0.0%) |
| College or Associate's Degree | 77 (100.0%) | 0 (0.0%) |
| Bachelor's Degree | 16 (100.0%) | 0 (0.0%) |
| Graduate Degree | 26 (100.0%) | 0 (0.0%) |
| Total | 180 (87.4%) | 26 (12.6%) |
Employment Characteristics in Mena
Employment by Class of Employer in Mena
Among the 2,314 employed individuals in Mena, private company employees (1,328 | 57.4%), self-employed (not incorporated) (265 | 11.5%), and self-employed (incorporated) (201 | 8.7%) make up the most common classes of employment.
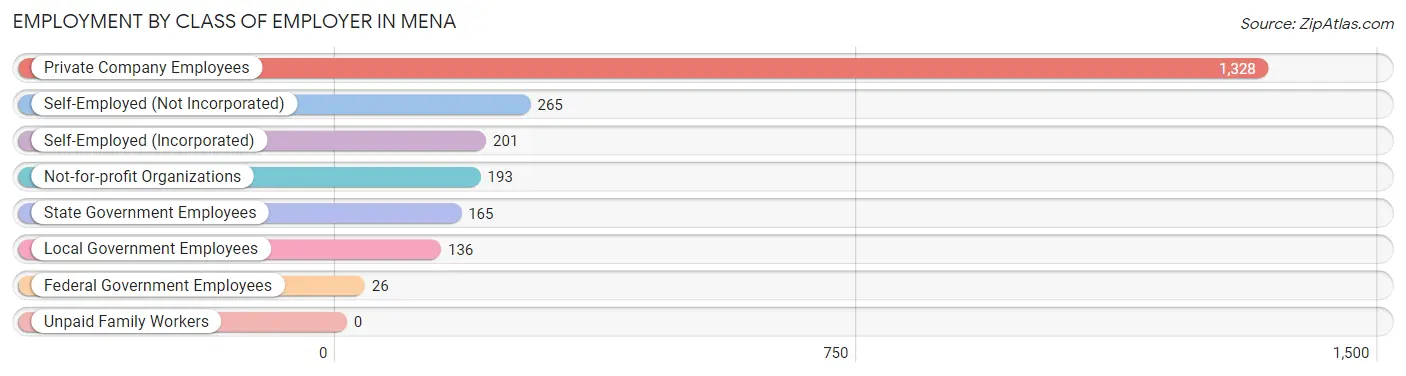
| Employer Class | # Employees | % Employees |
| Private Company Employees | 1,328 | 57.4% |
| Self-Employed (Incorporated) | 201 | 8.7% |
| Self-Employed (Not Incorporated) | 265 | 11.5% |
| Not-for-profit Organizations | 193 | 8.3% |
| Local Government Employees | 136 | 5.9% |
| State Government Employees | 165 | 7.1% |
| Federal Government Employees | 26 | 1.1% |
| Unpaid Family Workers | 0 | 0.0% |
| Total | 2,314 | 100.0% |
Employment Status by Age in Mena
According to the labor force statistics for Mena, out of the total population over 16 years of age (4,583), 59.1% or 2,709 individuals are in the labor force, with 10.6% or 287 of them unemployed. The age group with the highest labor force participation rate is 30 to 34 years, with 91.1% or 432 individuals in the labor force. Within the labor force, the 25 to 29 years age range has the highest percentage of unemployed individuals, with 78.2% or 140 of them being unemployed.
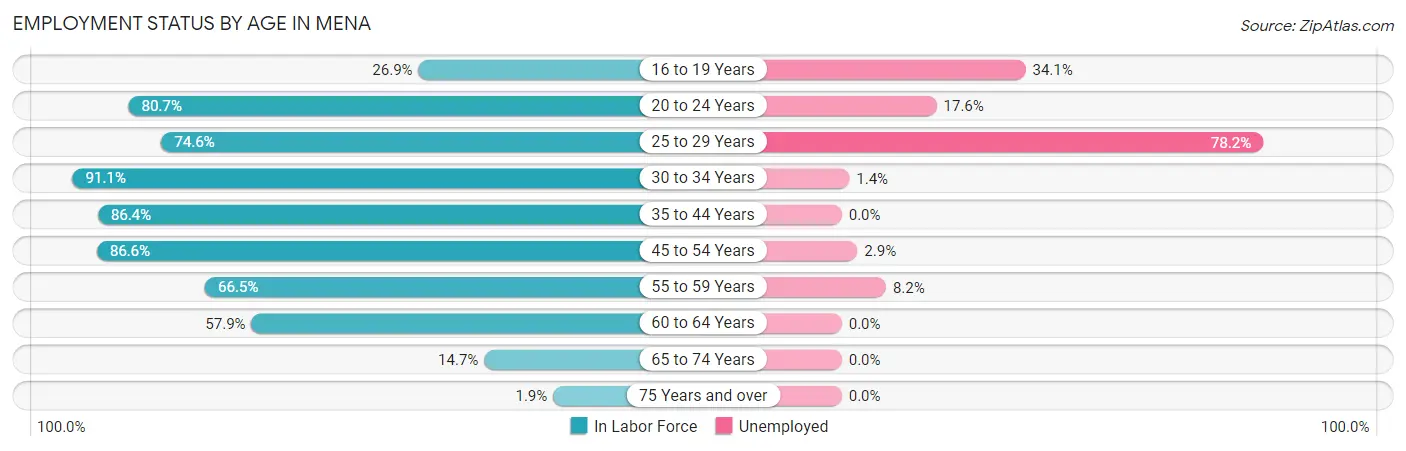
| Age Bracket | In Labor Force | Unemployed |
| 16 to 19 Years | 82 (26.9%) | 28 (34.1%) |
| 20 to 24 Years | 415 (80.7%) | 73 (17.6%) |
| 25 to 29 Years | 179 (74.6%) | 140 (78.2%) |
| 30 to 34 Years | 432 (91.1%) | 6 (1.4%) |
| 35 to 44 Years | 393 (86.4%) | 0 (0.0%) |
| 45 to 54 Years | 584 (86.6%) | 17 (2.9%) |
| 55 to 59 Years | 268 (66.5%) | 22 (8.2%) |
| 60 to 64 Years | 259 (57.9%) | 0 (0.0%) |
| 65 to 74 Years | 89 (14.7%) | 0 (0.0%) |
| 75 Years and over | 9 (1.9%) | 0 (0.0%) |
| Total | 2,709 (59.1%) | 287 (10.6%) |
Employment Status by Educational Attainment in Mena
According to labor force statistics for Mena, 78.5% of individuals (2,114) out of the total population between 25 and 64 years of age (2,693) are in the labor force, with 8.8% or 186 of them being unemployed. The group with the highest labor force participation rate are those with the educational attainment of bachelor's degree or higher, with 89.2% or 380 individuals in the labor force. Within the labor force, individuals with high school diploma education have the highest percentage of unemployment, with 14.2% or 120 of them being unemployed.
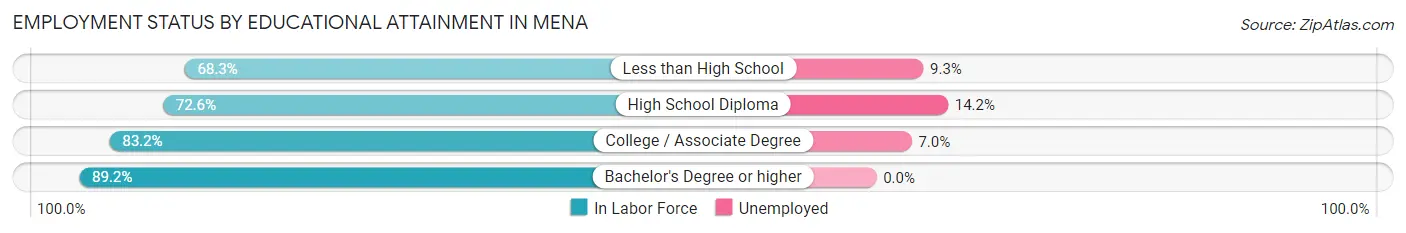
| Educational Attainment | In Labor Force | Unemployed |
| Less than High School | 129 (68.3%) | 18 (9.3%) |
| High School Diploma | 844 (72.6%) | 165 (14.2%) |
| College / Associate Degree | 762 (83.2%) | 64 (7.0%) |
| Bachelor's Degree or higher | 380 (89.2%) | 0 (0.0%) |
| Total | 2,114 (78.5%) | 237 (8.8%) |
Employment Occupations by Sex in Mena
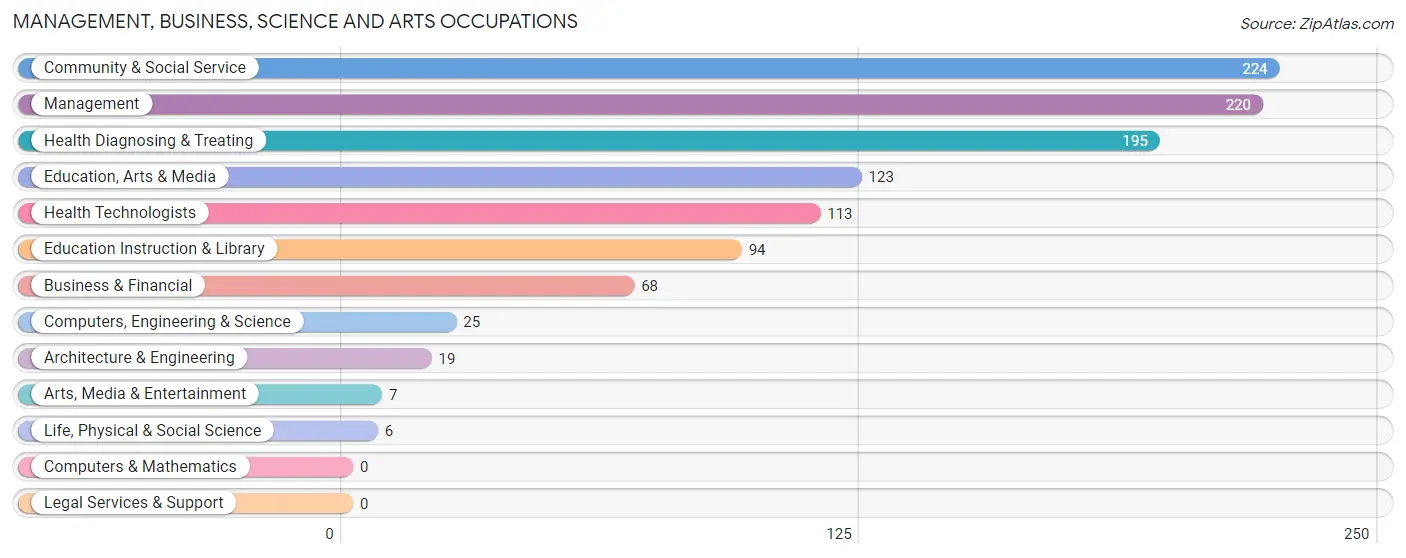
Management, Business, Science and Arts Occupations
The most common Management, Business, Science and Arts occupations in Mena are Community & Social Service (224 | 9.3%), Management (220 | 9.1%), Health Diagnosing & Treating (195 | 8.1%), Education, Arts & Media (123 | 5.1%), and Health Technologists (113 | 4.7%).
Management, Business, Science and Arts Occupations by Sex
Within the Management, Business, Science and Arts occupations in Mena, the most male-oriented occupations are Arts, Media & Entertainment (100.0%), Management (72.7%), and Education, Arts & Media (54.5%), while the most female-oriented occupations are Business & Financial (100.0%), Computers, Engineering & Science (100.0%), and Architecture & Engineering (100.0%).
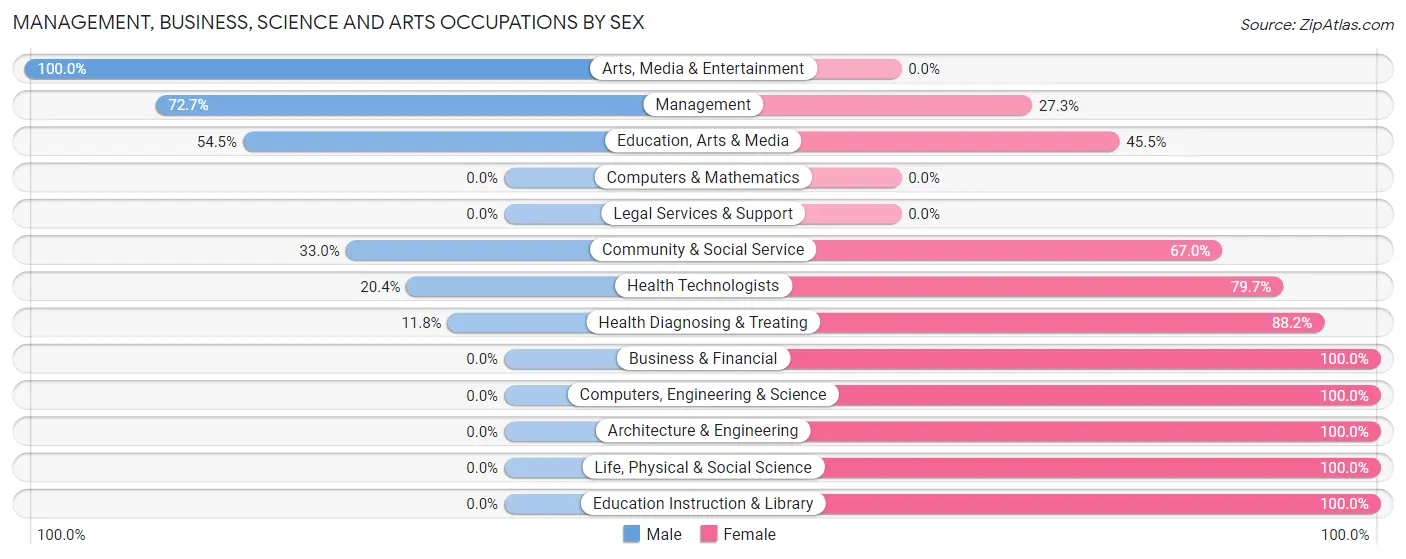
| Occupation | Male | Female |
| Management | 160 (72.7%) | 60 (27.3%) |
| Business & Financial | 0 (0.0%) | 68 (100.0%) |
| Computers, Engineering & Science | 0 (0.0%) | 25 (100.0%) |
| Computers & Mathematics | 0 (0.0%) | 0 (0.0%) |
| Architecture & Engineering | 0 (0.0%) | 19 (100.0%) |
| Life, Physical & Social Science | 0 (0.0%) | 6 (100.0%) |
| Community & Social Service | 74 (33.0%) | 150 (67.0%) |
| Education, Arts & Media | 67 (54.5%) | 56 (45.5%) |
| Legal Services & Support | 0 (0.0%) | 0 (0.0%) |
| Education Instruction & Library | 0 (0.0%) | 94 (100.0%) |
| Arts, Media & Entertainment | 7 (100.0%) | 0 (0.0%) |
| Health Diagnosing & Treating | 23 (11.8%) | 172 (88.2%) |
| Health Technologists | 23 (20.3%) | 90 (79.6%) |
| Total (Category) | 257 (35.1%) | 475 (64.9%) |
| Total (Overall) | 1,333 (55.2%) | 1,082 (44.8%) |
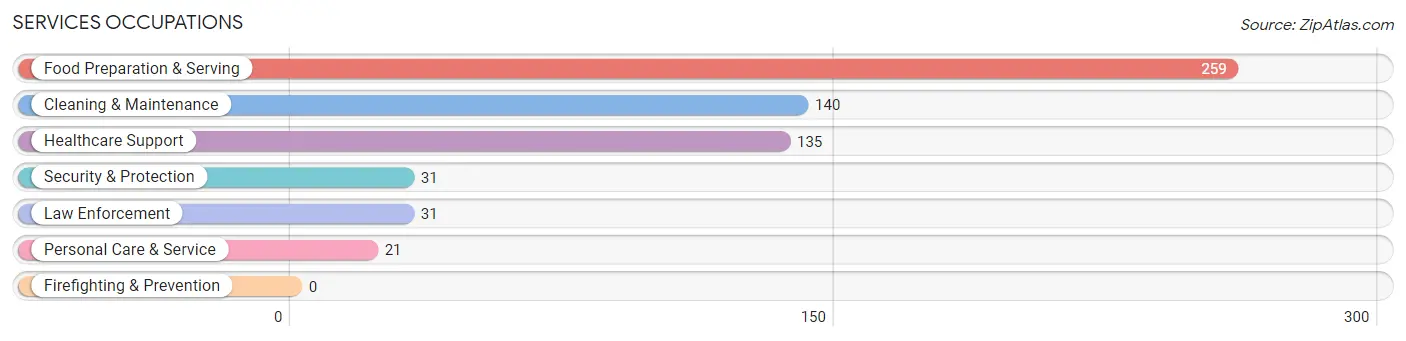
Services Occupations
The most common Services occupations in Mena are Food Preparation & Serving (259 | 10.7%), Cleaning & Maintenance (140 | 5.8%), Healthcare Support (135 | 5.6%), Security & Protection (31 | 1.3%), and Law Enforcement (31 | 1.3%).
Services Occupations by Sex
Within the Services occupations in Mena, the most male-oriented occupations are Food Preparation & Serving (87.6%), Cleaning & Maintenance (65.7%), and Security & Protection (16.1%), while the most female-oriented occupations are Healthcare Support (100.0%), Personal Care & Service (100.0%), and Security & Protection (83.9%).
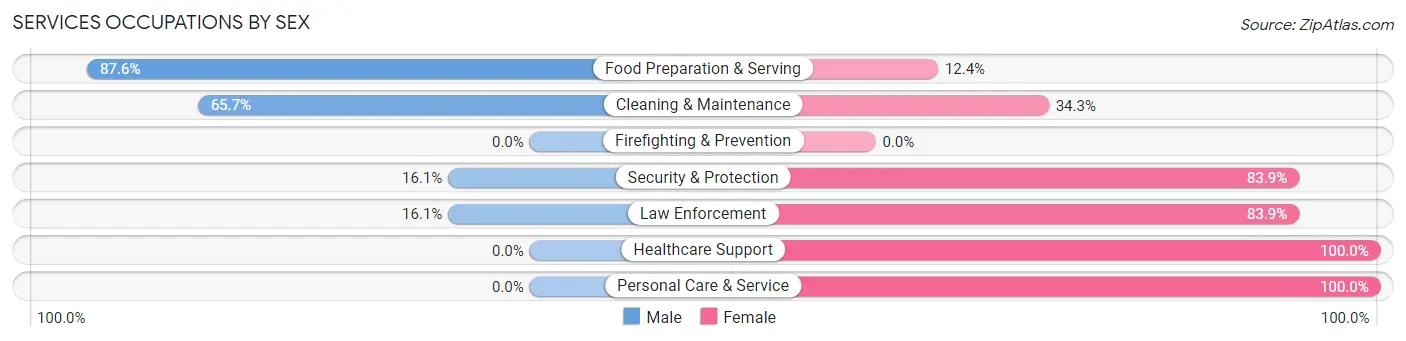
| Occupation | Male | Female |
| Healthcare Support | 0 (0.0%) | 135 (100.0%) |
| Security & Protection | 5 (16.1%) | 26 (83.9%) |
| Firefighting & Prevention | 0 (0.0%) | 0 (0.0%) |
| Law Enforcement | 5 (16.1%) | 26 (83.9%) |
| Food Preparation & Serving | 227 (87.6%) | 32 (12.4%) |
| Cleaning & Maintenance | 92 (65.7%) | 48 (34.3%) |
| Personal Care & Service | 0 (0.0%) | 21 (100.0%) |
| Total (Category) | 324 (55.3%) | 262 (44.7%) |
| Total (Overall) | 1,333 (55.2%) | 1,082 (44.8%) |
Sales and Office Occupations
The most common Sales and Office occupations in Mena are Sales & Related (232 | 9.6%), and Office & Administration (206 | 8.5%).

Sales and Office Occupations by Sex

| Occupation | Male | Female |
| Sales & Related | 144 (62.1%) | 88 (37.9%) |
| Office & Administration | 12 (5.8%) | 194 (94.2%) |
| Total (Category) | 156 (35.6%) | 282 (64.4%) |
| Total (Overall) | 1,333 (55.2%) | 1,082 (44.8%) |
Natural Resources, Construction and Maintenance Occupations
The most common Natural Resources, Construction and Maintenance occupations in Mena are Installation, Maintenance & Repair (110 | 4.5%), Construction & Extraction (98 | 4.1%), and Farming, Fishing & Forestry (68 | 2.8%).
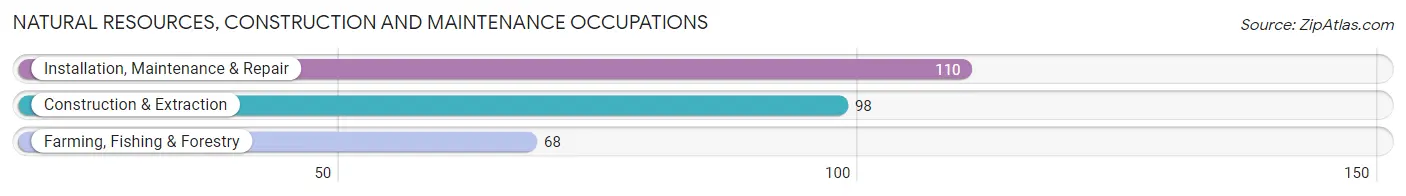
Natural Resources, Construction and Maintenance Occupations by Sex

| Occupation | Male | Female |
| Farming, Fishing & Forestry | 68 (100.0%) | 0 (0.0%) |
| Construction & Extraction | 98 (100.0%) | 0 (0.0%) |
| Installation, Maintenance & Repair | 110 (100.0%) | 0 (0.0%) |
| Total (Category) | 276 (100.0%) | 0 (0.0%) |
| Total (Overall) | 1,333 (55.2%) | 1,082 (44.8%) |
Production, Transportation and Moving Occupations
The most common Production, Transportation and Moving occupations in Mena are Production (239 | 9.9%), Material Moving (86 | 3.6%), and Transportation (58 | 2.4%).
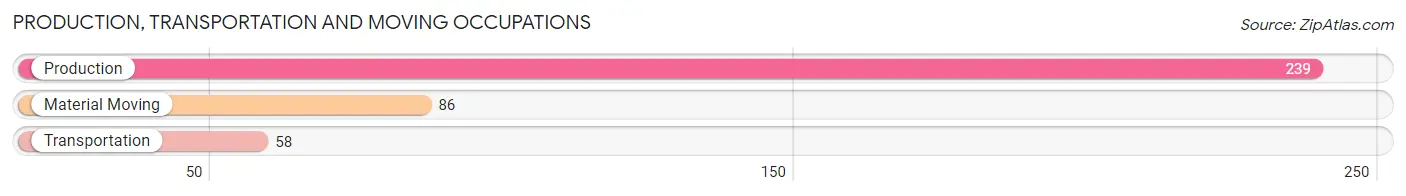
Production, Transportation and Moving Occupations by Sex
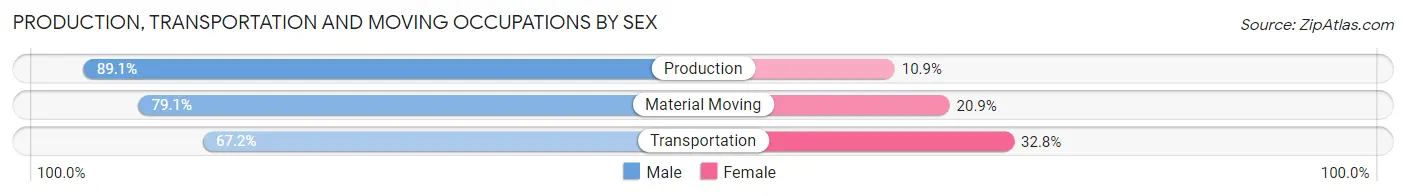
| Occupation | Male | Female |
| Production | 213 (89.1%) | 26 (10.9%) |
| Transportation | 39 (67.2%) | 19 (32.8%) |
| Material Moving | 68 (79.1%) | 18 (20.9%) |
| Total (Category) | 320 (83.6%) | 63 (16.5%) |
| Total (Overall) | 1,333 (55.2%) | 1,082 (44.8%) |
Employment Industries by Sex in Mena
Employment Industries in Mena
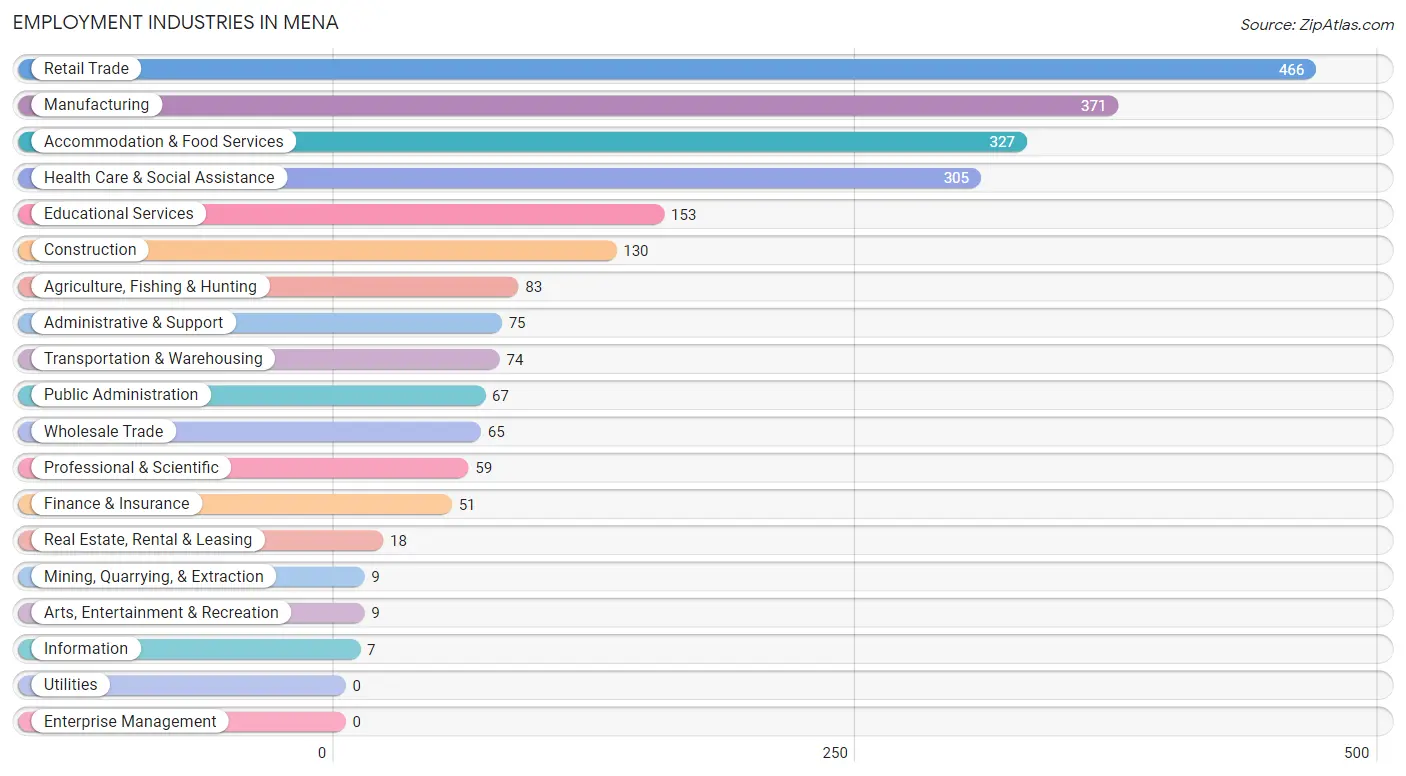
The major employment industries in Mena include Retail Trade (466 | 19.3%), Manufacturing (371 | 15.4%), Accommodation & Food Services (327 | 13.5%), Health Care & Social Assistance (305 | 12.6%), and Educational Services (153 | 6.3%).
Employment Industries by Sex in Mena
The Mena industries that see more men than women are Agriculture, Fishing & Hunting (100.0%), Mining, Quarrying, & Extraction (100.0%), and Construction (100.0%), whereas the industries that tend to have a higher number of women are Real Estate, Rental & Leasing (100.0%), Arts, Entertainment & Recreation (100.0%), and Wholesale Trade (90.8%).
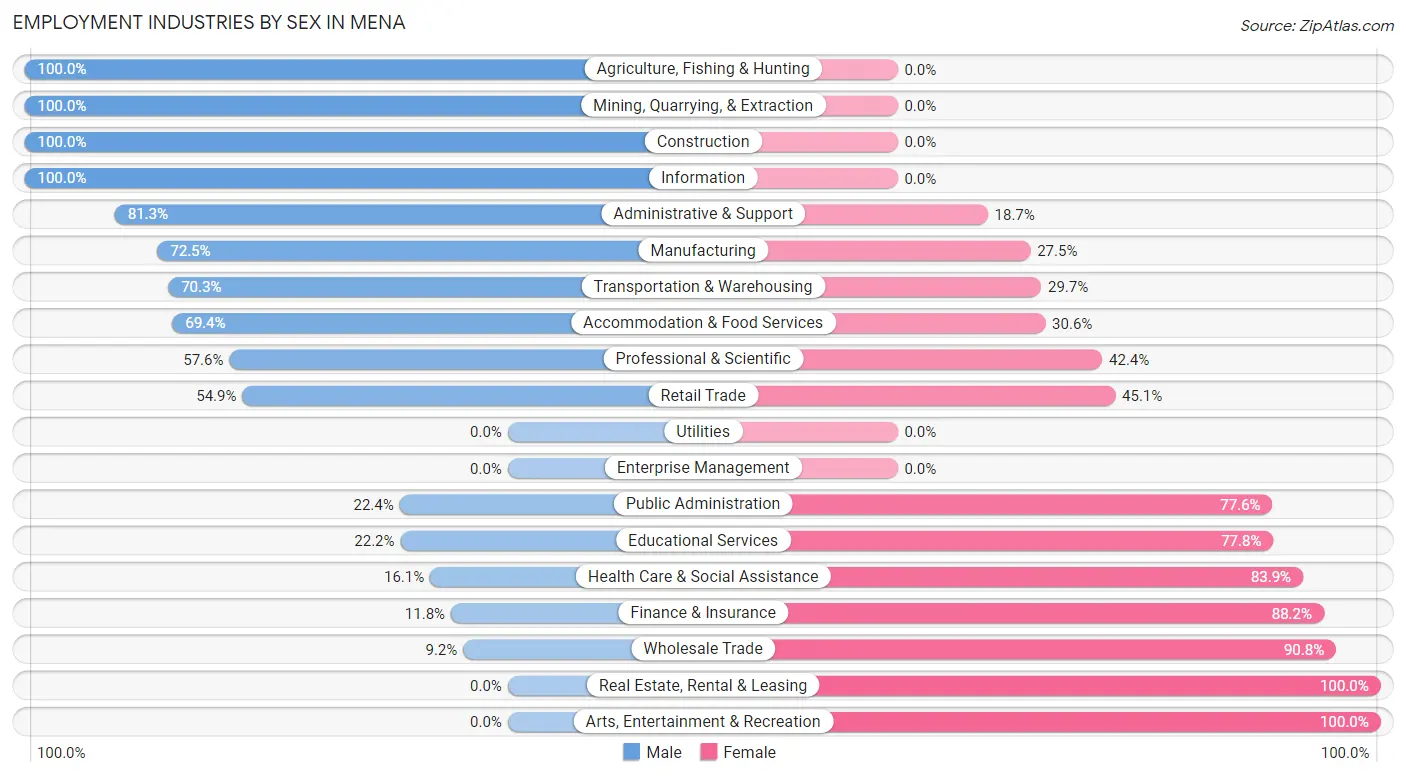
| Industry | Male | Female |
| Agriculture, Fishing & Hunting | 83 (100.0%) | 0 (0.0%) |
| Mining, Quarrying, & Extraction | 9 (100.0%) | 0 (0.0%) |
| Construction | 130 (100.0%) | 0 (0.0%) |
| Manufacturing | 269 (72.5%) | 102 (27.5%) |
| Wholesale Trade | 6 (9.2%) | 59 (90.8%) |
| Retail Trade | 256 (54.9%) | 210 (45.1%) |
| Transportation & Warehousing | 52 (70.3%) | 22 (29.7%) |
| Utilities | 0 (0.0%) | 0 (0.0%) |
| Information | 7 (100.0%) | 0 (0.0%) |
| Finance & Insurance | 6 (11.8%) | 45 (88.2%) |
| Real Estate, Rental & Leasing | 0 (0.0%) | 18 (100.0%) |
| Professional & Scientific | 34 (57.6%) | 25 (42.4%) |
| Enterprise Management | 0 (0.0%) | 0 (0.0%) |
| Administrative & Support | 61 (81.3%) | 14 (18.7%) |
| Educational Services | 34 (22.2%) | 119 (77.8%) |
| Health Care & Social Assistance | 49 (16.1%) | 256 (83.9%) |
| Arts, Entertainment & Recreation | 0 (0.0%) | 9 (100.0%) |
| Accommodation & Food Services | 227 (69.4%) | 100 (30.6%) |
| Public Administration | 15 (22.4%) | 52 (77.6%) |
| Total | 1,333 (55.2%) | 1,082 (44.8%) |
Education in Mena
School Enrollment in Mena
The most common levels of schooling among the 1,009 students in Mena are elementary school (223 | 22.1%), high school (203 | 20.1%), and middle school (195 | 19.3%).
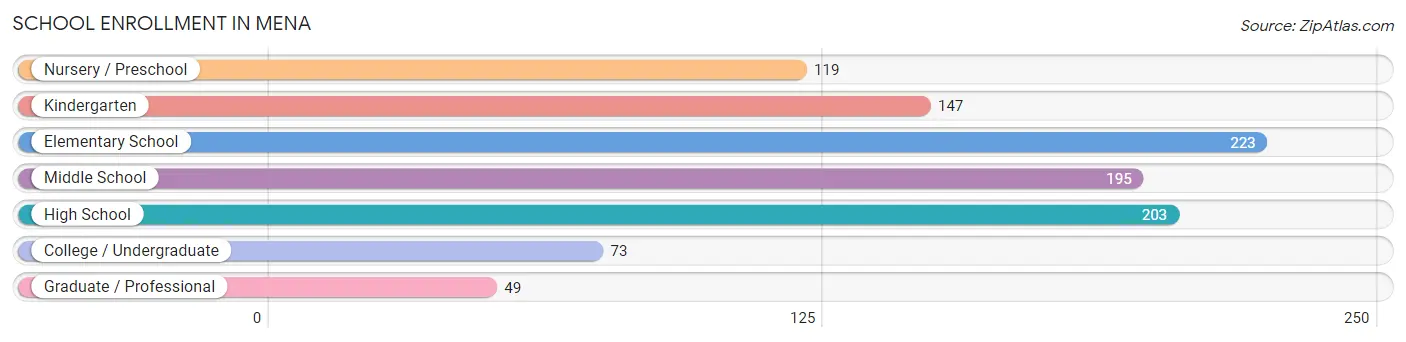
| School Level | # Students | % Students |
| Nursery / Preschool | 119 | 11.8% |
| Kindergarten | 147 | 14.6% |
| Elementary School | 223 | 22.1% |
| Middle School | 195 | 19.3% |
| High School | 203 | 20.1% |
| College / Undergraduate | 73 | 7.2% |
| Graduate / Professional | 49 | 4.9% |
| Total | 1,009 | 100.0% |
School Enrollment by Age by Funding Source in Mena
Out of a total of 1,009 students who are enrolled in schools in Mena, 115 (11.4%) attend a private institution, while the remaining 894 (88.6%) are enrolled in public schools. The age group of 3 to 4 year olds has the highest likelihood of being enrolled in private schools, with 55 (48.2% in the age bracket) enrolled. Conversely, the age group of 10 to 14 year olds has the lowest likelihood of being enrolled in a private school, with 305 (100.0% in the age bracket) attending a public institution.
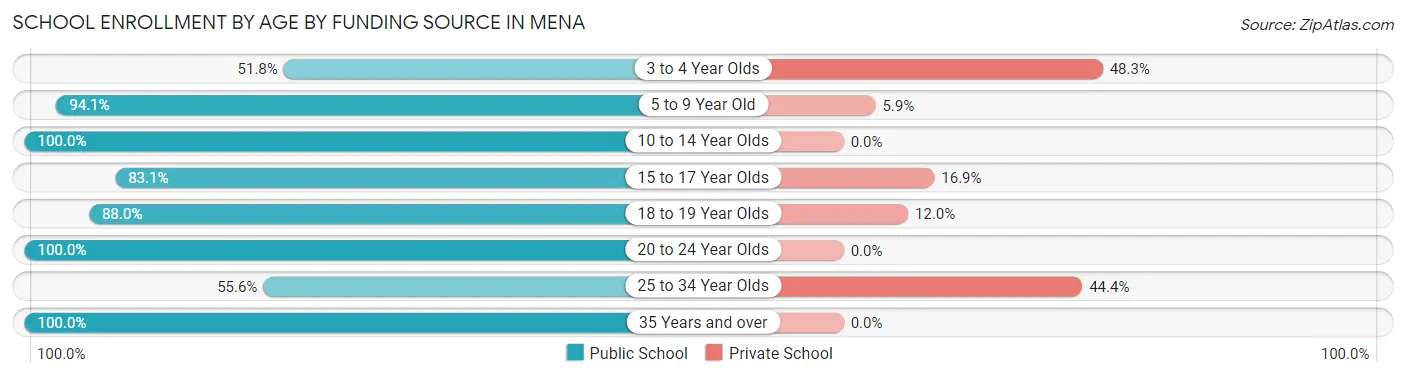
| Age Bracket | Public School | Private School |
| 3 to 4 Year Olds | 59 (51.7%) | 55 (48.2%) |
| 5 to 9 Year Old | 270 (94.1%) | 17 (5.9%) |
| 10 to 14 Year Olds | 305 (100.0%) | 0 (0.0%) |
| 15 to 17 Year Olds | 123 (83.1%) | 25 (16.9%) |
| 18 to 19 Year Olds | 44 (88.0%) | 6 (12.0%) |
| 20 to 24 Year Olds | 19 (100.0%) | 0 (0.0%) |
| 25 to 34 Year Olds | 15 (55.6%) | 12 (44.4%) |
| 35 Years and over | 59 (100.0%) | 0 (0.0%) |
| Total | 894 (88.6%) | 115 (11.4%) |
Educational Attainment by Field of Study in Mena
Business (160 | 23.7%), education (132 | 19.5%), communications (105 | 15.5%), science & technology (79 | 11.7%), and arts & humanities (71 | 10.5%) are the most common fields of study among 676 individuals in Mena who have obtained a bachelor's degree or higher.
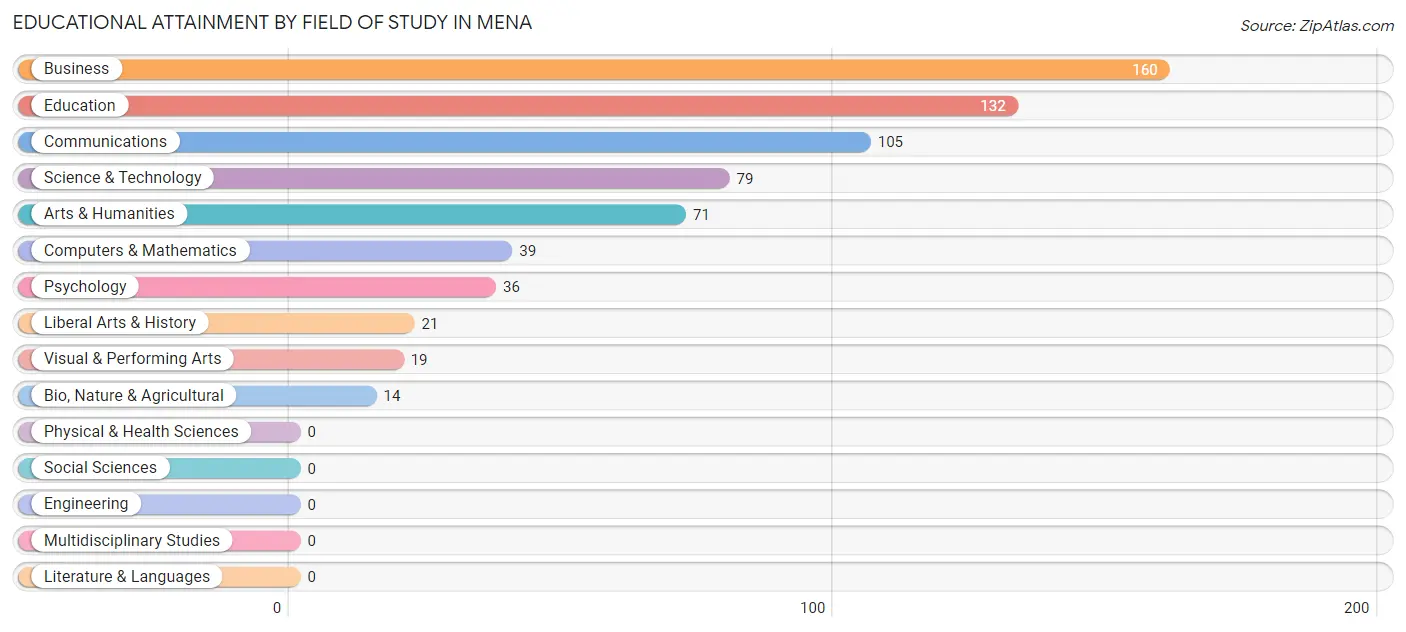
| Field of Study | # Graduates | % Graduates |
| Computers & Mathematics | 39 | 5.8% |
| Bio, Nature & Agricultural | 14 | 2.1% |
| Physical & Health Sciences | 0 | 0.0% |
| Psychology | 36 | 5.3% |
| Social Sciences | 0 | 0.0% |
| Engineering | 0 | 0.0% |
| Multidisciplinary Studies | 0 | 0.0% |
| Science & Technology | 79 | 11.7% |
| Business | 160 | 23.7% |
| Education | 132 | 19.5% |
| Literature & Languages | 0 | 0.0% |
| Liberal Arts & History | 21 | 3.1% |
| Visual & Performing Arts | 19 | 2.8% |
| Communications | 105 | 15.5% |
| Arts & Humanities | 71 | 10.5% |
| Total | 676 | 100.0% |
Transportation & Commute in Mena
Vehicle Availability by Sex in Mena
The most prevalent vehicle ownership categories in Mena are males with 2 vehicles (548, accounting for 43.1%) and females with 2 vehicles (574, making up 52.6%).
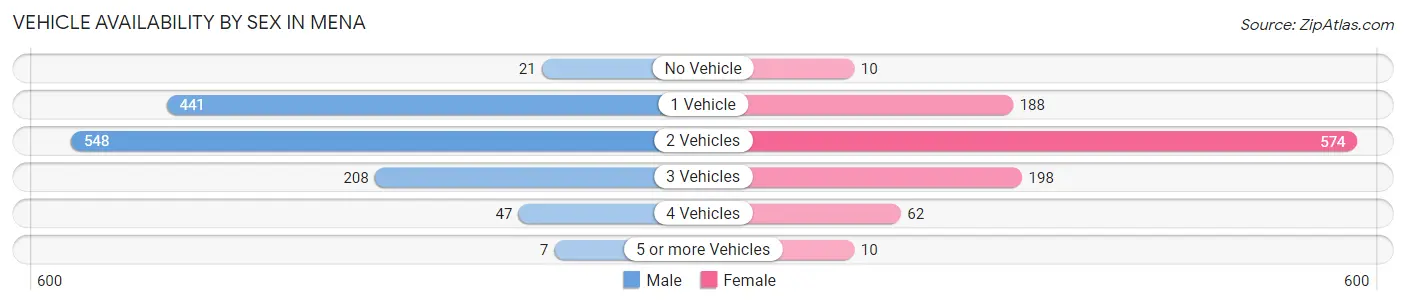
| Vehicles Available | Male | Female |
| No Vehicle | 21 (1.7%) | 10 (1.0%) |
| 1 Vehicle | 441 (34.7%) | 188 (18.0%) |
| 2 Vehicles | 548 (43.1%) | 574 (55.1%) |
| 3 Vehicles | 208 (16.4%) | 198 (19.0%) |
| 4 Vehicles | 47 (3.7%) | 62 (5.9%) |
| 5 or more Vehicles | 7 (0.5%) | 10 (1.0%) |
| Total | 1,272 (100.0%) | 1,042 (100.0%) |
Commute Time in Mena
The most frequently occuring commute durations in Mena are 5 to 9 minutes (827 commuters, 36.3%), 10 to 14 minutes (436 commuters, 19.1%), and 15 to 19 minutes (323 commuters, 14.2%).
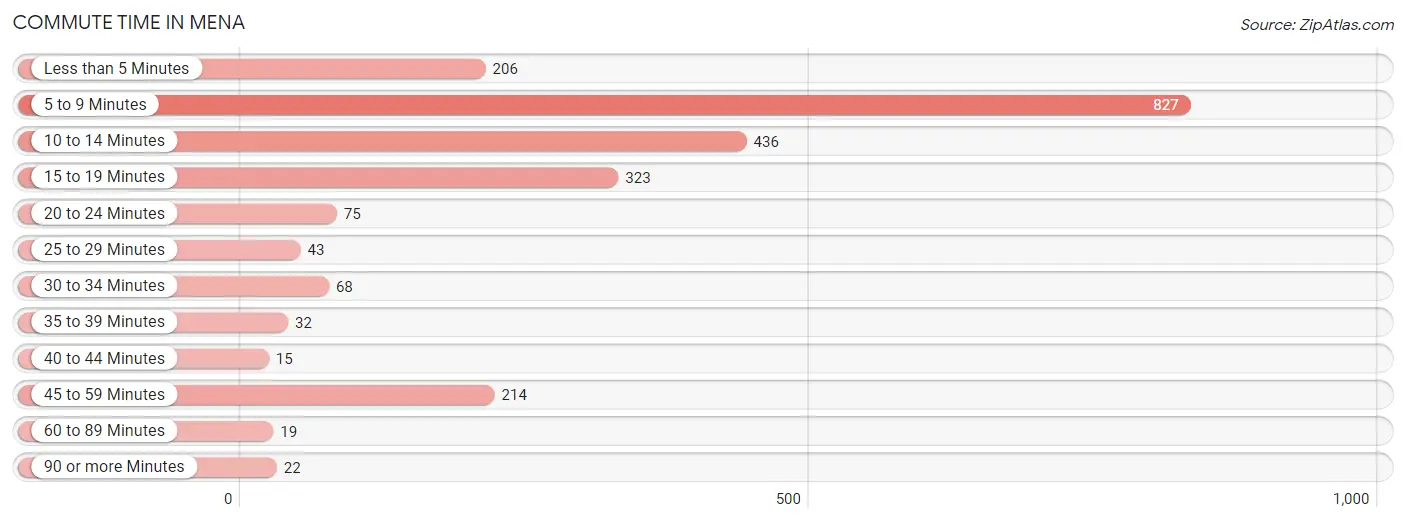
| Commute Time | # Commuters | % Commuters |
| Less than 5 Minutes | 206 | 9.0% |
| 5 to 9 Minutes | 827 | 36.3% |
| 10 to 14 Minutes | 436 | 19.1% |
| 15 to 19 Minutes | 323 | 14.2% |
| 20 to 24 Minutes | 75 | 3.3% |
| 25 to 29 Minutes | 43 | 1.9% |
| 30 to 34 Minutes | 68 | 3.0% |
| 35 to 39 Minutes | 32 | 1.4% |
| 40 to 44 Minutes | 15 | 0.7% |
| 45 to 59 Minutes | 214 | 9.4% |
| 60 to 89 Minutes | 19 | 0.8% |
| 90 or more Minutes | 22 | 1.0% |
Commute Time by Sex in Mena
The most common commute times in Mena are 5 to 9 minutes (415 commuters, 32.6%) for males and 5 to 9 minutes (412 commuters, 40.9%) for females.
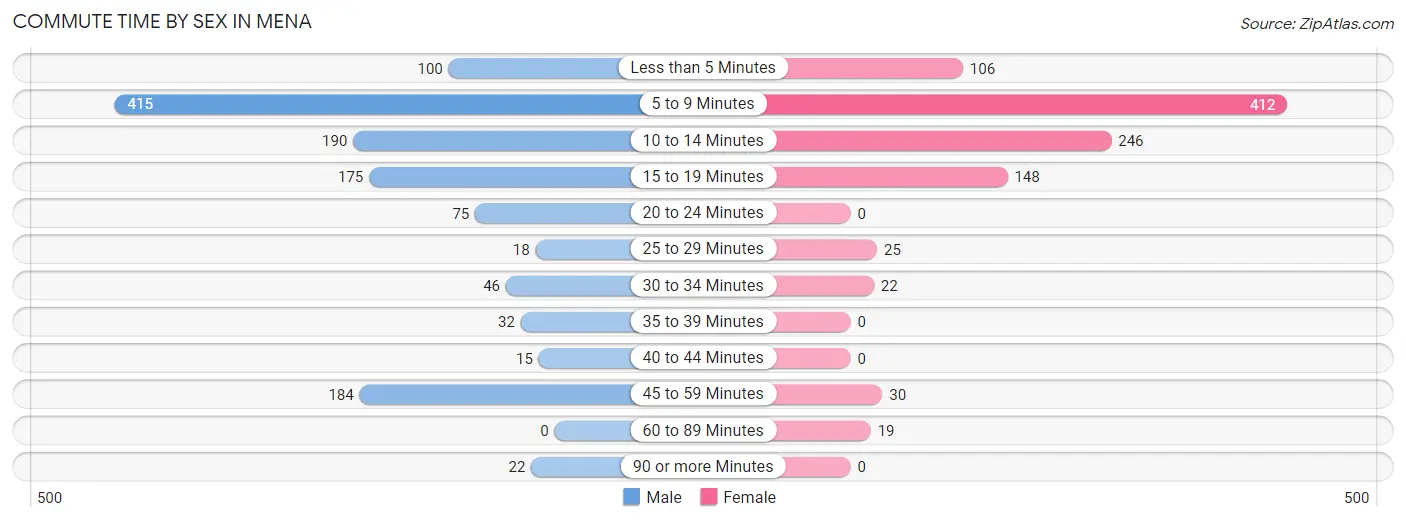
| Commute Time | Male | Female |
| Less than 5 Minutes | 100 (7.9%) | 106 (10.5%) |
| 5 to 9 Minutes | 415 (32.6%) | 412 (40.9%) |
| 10 to 14 Minutes | 190 (14.9%) | 246 (24.4%) |
| 15 to 19 Minutes | 175 (13.8%) | 148 (14.7%) |
| 20 to 24 Minutes | 75 (5.9%) | 0 (0.0%) |
| 25 to 29 Minutes | 18 (1.4%) | 25 (2.5%) |
| 30 to 34 Minutes | 46 (3.6%) | 22 (2.2%) |
| 35 to 39 Minutes | 32 (2.5%) | 0 (0.0%) |
| 40 to 44 Minutes | 15 (1.2%) | 0 (0.0%) |
| 45 to 59 Minutes | 184 (14.5%) | 30 (3.0%) |
| 60 to 89 Minutes | 0 (0.0%) | 19 (1.9%) |
| 90 or more Minutes | 22 (1.7%) | 0 (0.0%) |
Time of Departure to Work by Sex in Mena
The most frequent times of departure to work in Mena are 7:30 AM to 7:59 AM (206, 16.2%) for males and 7:30 AM to 7:59 AM (194, 19.3%) for females.
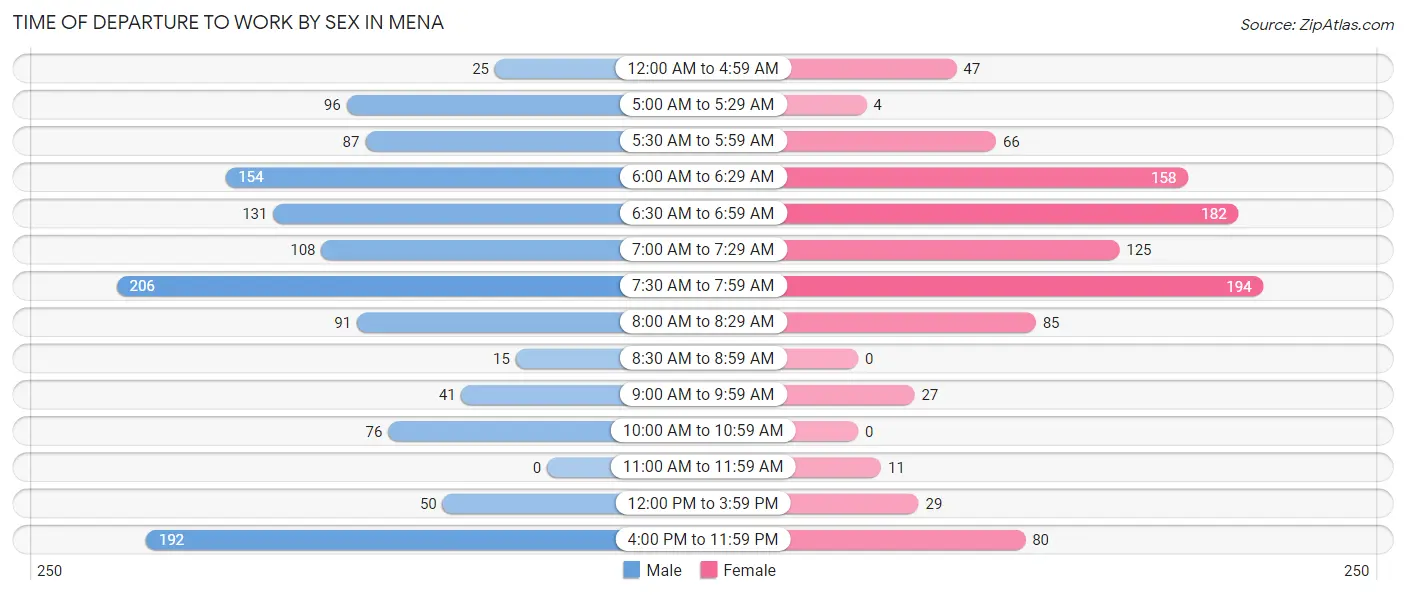
| Time of Departure | Male | Female |
| 12:00 AM to 4:59 AM | 25 (2.0%) | 47 (4.7%) |
| 5:00 AM to 5:29 AM | 96 (7.5%) | 4 (0.4%) |
| 5:30 AM to 5:59 AM | 87 (6.8%) | 66 (6.6%) |
| 6:00 AM to 6:29 AM | 154 (12.1%) | 158 (15.7%) |
| 6:30 AM to 6:59 AM | 131 (10.3%) | 182 (18.1%) |
| 7:00 AM to 7:29 AM | 108 (8.5%) | 125 (12.4%) |
| 7:30 AM to 7:59 AM | 206 (16.2%) | 194 (19.3%) |
| 8:00 AM to 8:29 AM | 91 (7.1%) | 85 (8.4%) |
| 8:30 AM to 8:59 AM | 15 (1.2%) | 0 (0.0%) |
| 9:00 AM to 9:59 AM | 41 (3.2%) | 27 (2.7%) |
| 10:00 AM to 10:59 AM | 76 (6.0%) | 0 (0.0%) |
| 11:00 AM to 11:59 AM | 0 (0.0%) | 11 (1.1%) |
| 12:00 PM to 3:59 PM | 50 (3.9%) | 29 (2.9%) |
| 4:00 PM to 11:59 PM | 192 (15.1%) | 80 (7.9%) |
| Total | 1,272 (100.0%) | 1,008 (100.0%) |
Housing Occupancy in Mena
Occupancy by Ownership in Mena
Of the total 2,214 dwellings in Mena, owner-occupied units account for 1,559 (70.4%), while renter-occupied units make up 655 (29.6%).
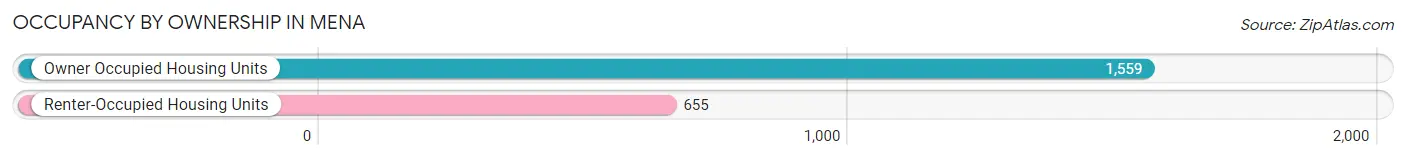
| Occupancy | # Housing Units | % Housing Units |
| Owner Occupied Housing Units | 1,559 | 70.4% |
| Renter-Occupied Housing Units | 655 | 29.6% |
| Total Occupied Housing Units | 2,214 | 100.0% |
Occupancy by Household Size in Mena
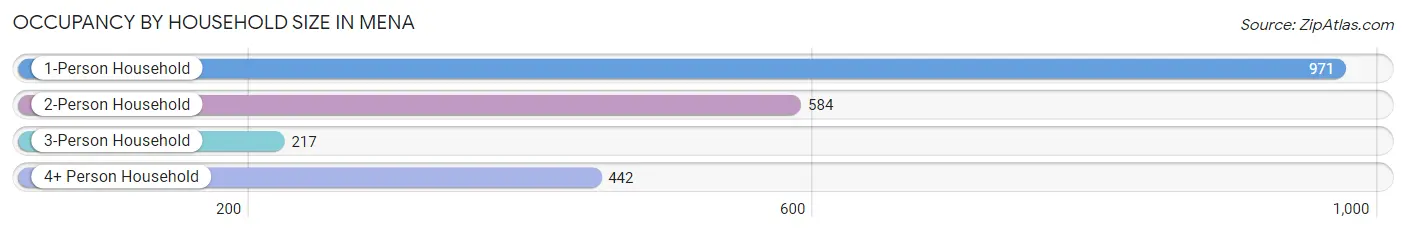
| Household Size | # Housing Units | % Housing Units |
| 1-Person Household | 971 | 43.9% |
| 2-Person Household | 584 | 26.4% |
| 3-Person Household | 217 | 9.8% |
| 4+ Person Household | 442 | 20.0% |
| Total Housing Units | 2,214 | 100.0% |
Occupancy by Ownership by Household Size in Mena
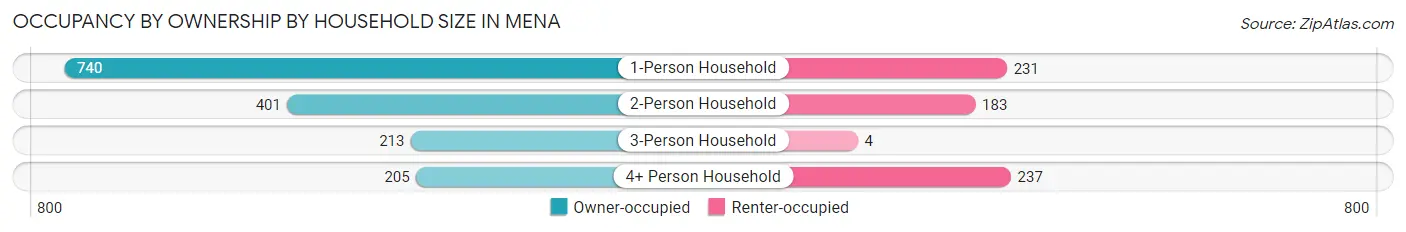
| Household Size | Owner-occupied | Renter-occupied |
| 1-Person Household | 740 (76.2%) | 231 (23.8%) |
| 2-Person Household | 401 (68.7%) | 183 (31.3%) |
| 3-Person Household | 213 (98.2%) | 4 (1.8%) |
| 4+ Person Household | 205 (46.4%) | 237 (53.6%) |
| Total Housing Units | 1,559 (70.4%) | 655 (29.6%) |
Occupancy by Educational Attainment in Mena
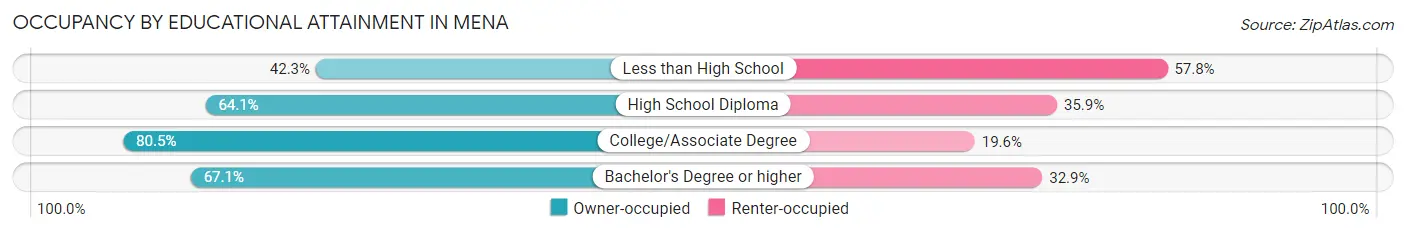
| Household Size | Owner-occupied | Renter-occupied |
| Less than High School | 79 (42.2%) | 108 (57.8%) |
| High School Diploma | 372 (64.1%) | 208 (35.9%) |
| College/Associate Degree | 827 (80.4%) | 201 (19.6%) |
| Bachelor's Degree or higher | 281 (67.1%) | 138 (32.9%) |
Occupancy by Age of Householder in Mena
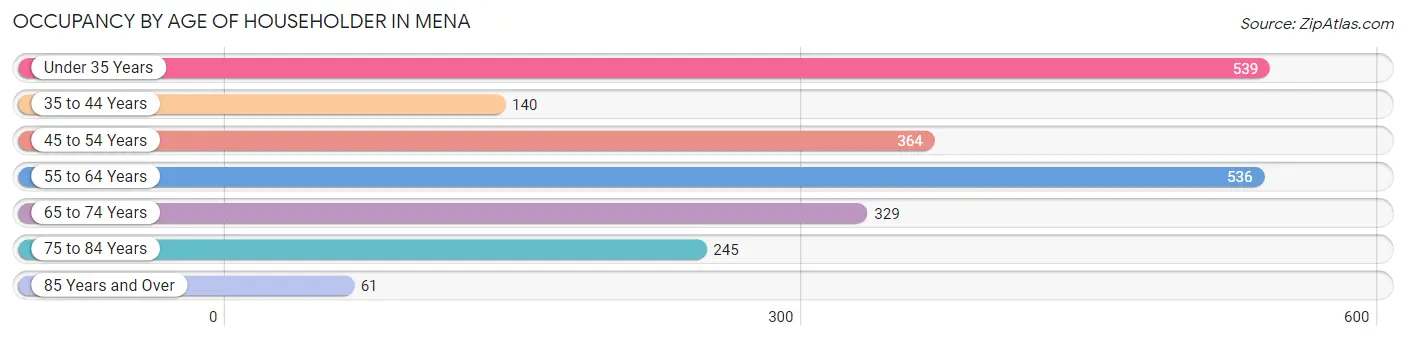
| Age Bracket | # Households | % Households |
| Under 35 Years | 539 | 24.3% |
| 35 to 44 Years | 140 | 6.3% |
| 45 to 54 Years | 364 | 16.4% |
| 55 to 64 Years | 536 | 24.2% |
| 65 to 74 Years | 329 | 14.9% |
| 75 to 84 Years | 245 | 11.1% |
| 85 Years and Over | 61 | 2.8% |
| Total | 2,214 | 100.0% |
Housing Finances in Mena
Median Income by Occupancy in Mena
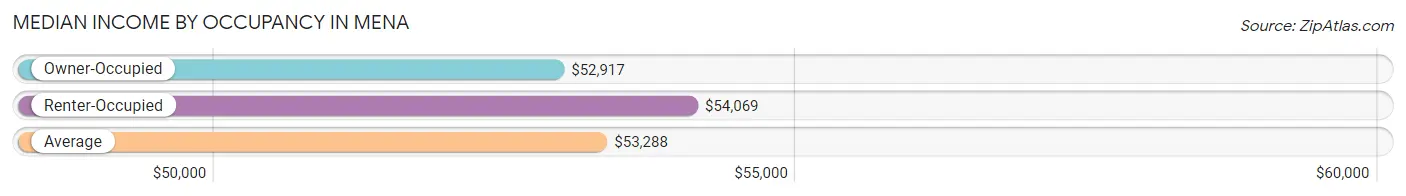
| Occupancy Type | # Households | Median Income |
| Owner-Occupied | 1,559 (70.4%) | $52,917 |
| Renter-Occupied | 655 (29.6%) | $54,069 |
| Average | 2,214 (100.0%) | $53,288 |
Occupancy by Householder Income Bracket in Mena
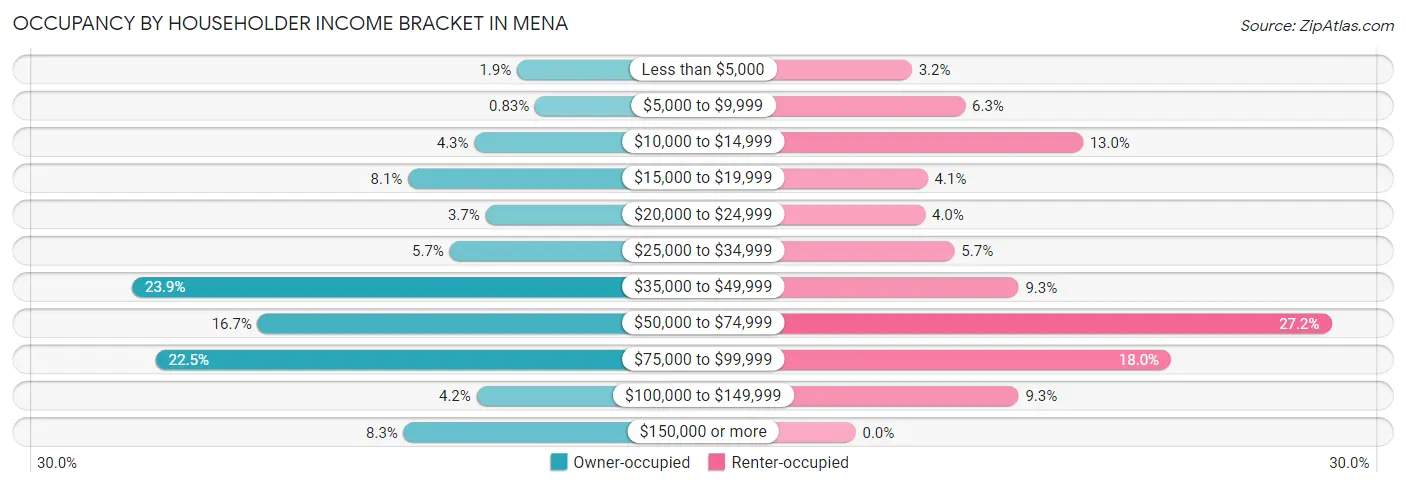
| Income Bracket | Owner-occupied | Renter-occupied |
| Less than $5,000 | 29 (1.9%) | 21 (3.2%) |
| $5,000 to $9,999 | 13 (0.8%) | 41 (6.3%) |
| $10,000 to $14,999 | 67 (4.3%) | 85 (13.0%) |
| $15,000 to $19,999 | 126 (8.1%) | 27 (4.1%) |
| $20,000 to $24,999 | 57 (3.7%) | 26 (4.0%) |
| $25,000 to $34,999 | 89 (5.7%) | 37 (5.7%) |
| $35,000 to $49,999 | 372 (23.9%) | 61 (9.3%) |
| $50,000 to $74,999 | 260 (16.7%) | 178 (27.2%) |
| $75,000 to $99,999 | 351 (22.5%) | 118 (18.0%) |
| $100,000 to $149,999 | 65 (4.2%) | 61 (9.3%) |
| $150,000 or more | 130 (8.3%) | 0 (0.0%) |
| Total | 1,559 (100.0%) | 655 (100.0%) |
Monthly Housing Cost Tiers in Mena
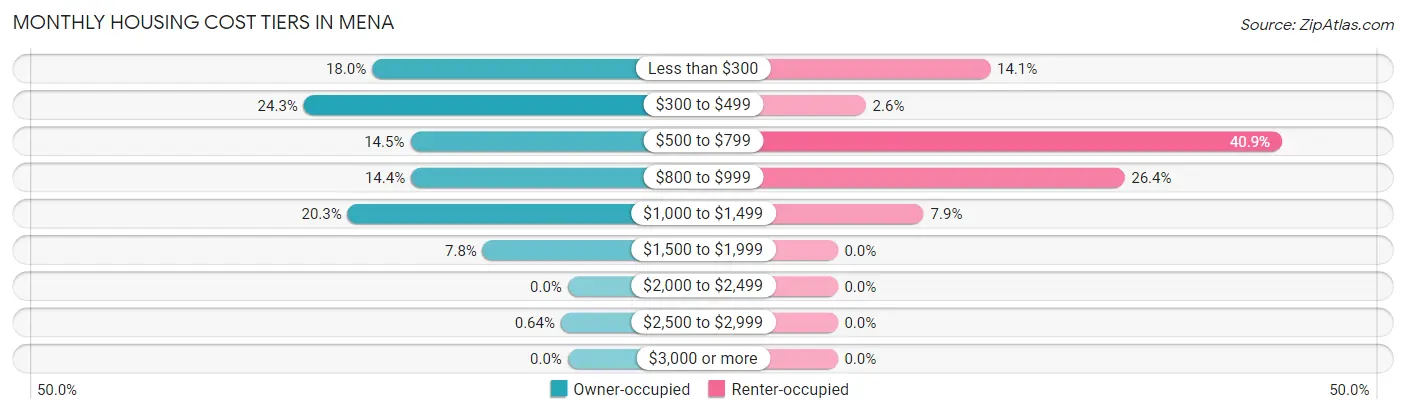
| Monthly Cost | Owner-occupied | Renter-occupied |
| Less than $300 | 281 (18.0%) | 92 (14.1%) |
| $300 to $499 | 379 (24.3%) | 17 (2.6%) |
| $500 to $799 | 226 (14.5%) | 268 (40.9%) |
| $800 to $999 | 225 (14.4%) | 173 (26.4%) |
| $1,000 to $1,499 | 316 (20.3%) | 52 (7.9%) |
| $1,500 to $1,999 | 122 (7.8%) | 0 (0.0%) |
| $2,000 to $2,499 | 0 (0.0%) | 0 (0.0%) |
| $2,500 to $2,999 | 10 (0.6%) | 0 (0.0%) |
| $3,000 or more | 0 (0.0%) | 0 (0.0%) |
| Total | 1,559 (100.0%) | 655 (100.0%) |
Physical Housing Characteristics in Mena
Housing Structures in Mena
| Structure Type | # Housing Units | % Housing Units |
| Single Unit, Detached | 1,688 | 76.2% |
| Single Unit, Attached | 40 | 1.8% |
| 2 Unit Apartments | 14 | 0.6% |
| 3 or 4 Unit Apartments | 71 | 3.2% |
| 5 to 9 Unit Apartments | 0 | 0.0% |
| 10 or more Apartments | 120 | 5.4% |
| Mobile Home / Other | 281 | 12.7% |
| Total | 2,214 | 100.0% |
Housing Structures by Occupancy in Mena
| Structure Type | Owner-occupied | Renter-occupied |
| Single Unit, Detached | 1,317 (78.0%) | 371 (22.0%) |
| Single Unit, Attached | 40 (100.0%) | 0 (0.0%) |
| 2 Unit Apartments | 0 (0.0%) | 14 (100.0%) |
| 3 or 4 Unit Apartments | 0 (0.0%) | 71 (100.0%) |
| 5 to 9 Unit Apartments | 0 (0.0%) | 0 (0.0%) |
| 10 or more Apartments | 6 (5.0%) | 114 (95.0%) |
| Mobile Home / Other | 196 (69.8%) | 85 (30.2%) |
| Total | 1,559 (70.4%) | 655 (29.6%) |
Housing Structures by Number of Rooms in Mena
| Number of Rooms | Owner-occupied | Renter-occupied |
| 1 Room | 0 (0.0%) | 27 (4.1%) |
| 2 or 3 Rooms | 67 (4.3%) | 136 (20.8%) |
| 4 or 5 Rooms | 559 (35.9%) | 329 (50.2%) |
| 6 or 7 Rooms | 625 (40.1%) | 157 (24.0%) |
| 8 or more Rooms | 308 (19.8%) | 6 (0.9%) |
| Total | 1,559 (100.0%) | 655 (100.0%) |
Housing Structure by Heating Type in Mena
| Heating Type | Owner-occupied | Renter-occupied |
| Utility Gas | 527 (33.8%) | 147 (22.4%) |
| Bottled, Tank, or LP Gas | 56 (3.6%) | 0 (0.0%) |
| Electricity | 838 (53.7%) | 508 (77.6%) |
| Fuel Oil or Kerosene | 0 (0.0%) | 0 (0.0%) |
| Coal or Coke | 0 (0.0%) | 0 (0.0%) |
| All other Fuels | 116 (7.4%) | 0 (0.0%) |
| No Fuel Used | 22 (1.4%) | 0 (0.0%) |
| Total | 1,559 (100.0%) | 655 (100.0%) |
Household Vehicle Usage in Mena
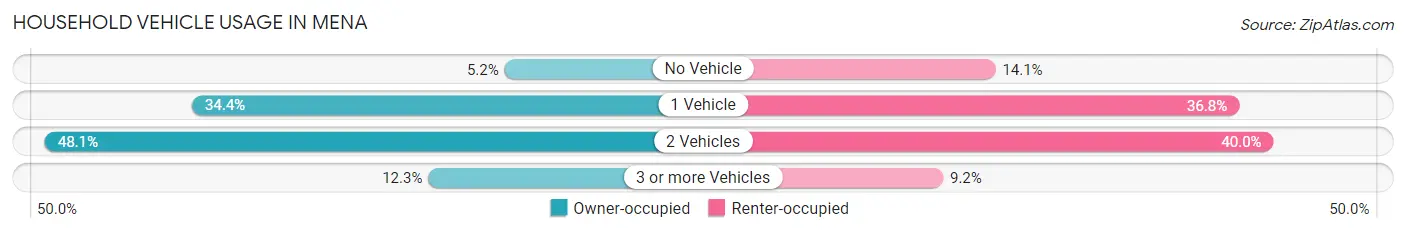
| Vehicles per Household | Owner-occupied | Renter-occupied |
| No Vehicle | 81 (5.2%) | 92 (14.1%) |
| 1 Vehicle | 536 (34.4%) | 241 (36.8%) |
| 2 Vehicles | 750 (48.1%) | 262 (40.0%) |
| 3 or more Vehicles | 192 (12.3%) | 60 (9.2%) |
| Total | 1,559 (100.0%) | 655 (100.0%) |
Real Estate & Mortgages in Mena
Real Estate and Mortgage Overview in Mena
| Characteristic | Without Mortgage | With Mortgage |
| Housing Units | 881 | 678 |
| Median Property Value | $103,800 | $119,300 |
| Median Household Income | $43,872 | $32 |
| Monthly Housing Costs | $342 | $0 |
| Real Estate Taxes | $508 | $0 |
Property Value by Mortgage Status in Mena
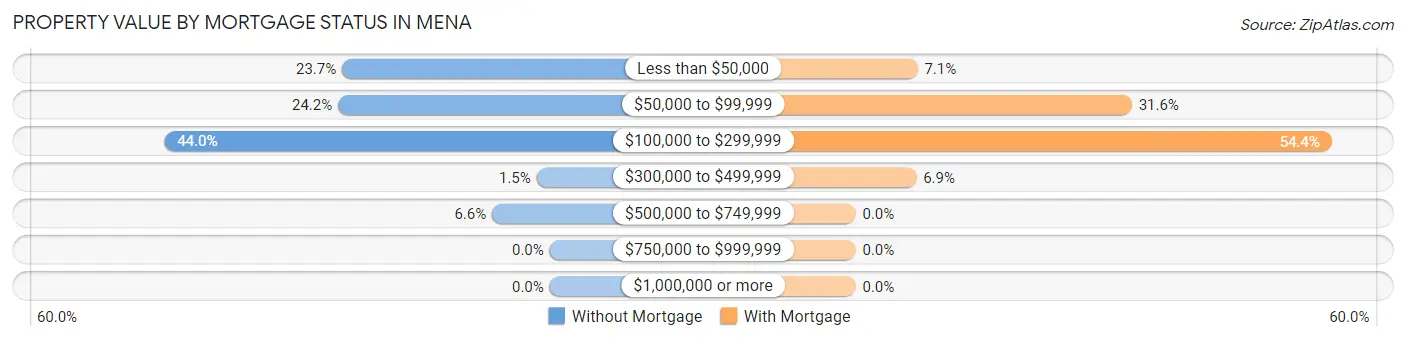
| Property Value | Without Mortgage | With Mortgage |
| Less than $50,000 | 209 (23.7%) | 48 (7.1%) |
| $50,000 to $99,999 | 213 (24.2%) | 214 (31.6%) |
| $100,000 to $299,999 | 388 (44.0%) | 369 (54.4%) |
| $300,000 to $499,999 | 13 (1.5%) | 47 (6.9%) |
| $500,000 to $749,999 | 58 (6.6%) | 0 (0.0%) |
| $750,000 to $999,999 | 0 (0.0%) | 0 (0.0%) |
| $1,000,000 or more | 0 (0.0%) | 0 (0.0%) |
| Total | 881 (100.0%) | 678 (100.0%) |
Household Income by Mortgage Status in Mena
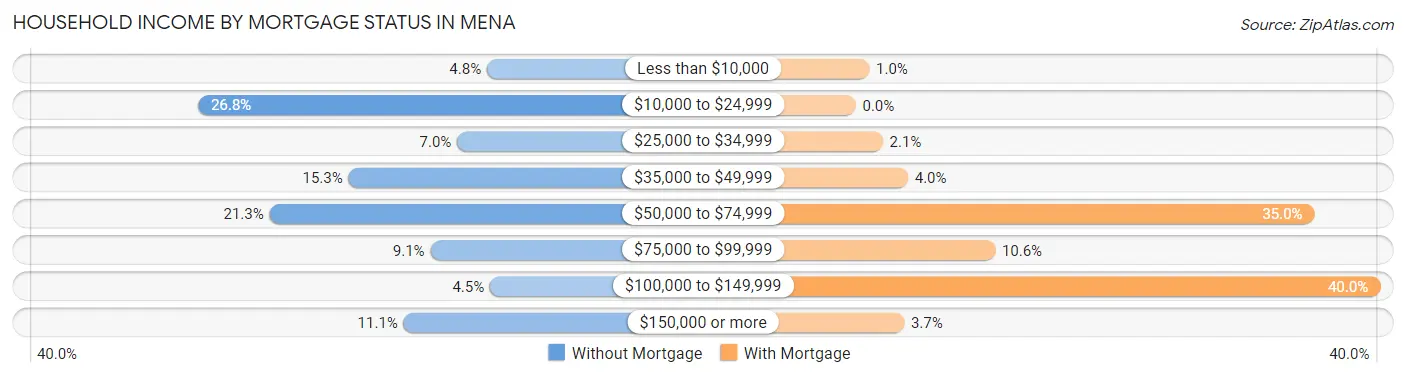
| Household Income | Without Mortgage | With Mortgage |
| Less than $10,000 | 42 (4.8%) | 7 (1.0%) |
| $10,000 to $24,999 | 236 (26.8%) | 0 (0.0%) |
| $25,000 to $34,999 | 62 (7.0%) | 14 (2.1%) |
| $35,000 to $49,999 | 135 (15.3%) | 27 (4.0%) |
| $50,000 to $74,999 | 188 (21.3%) | 237 (35.0%) |
| $75,000 to $99,999 | 80 (9.1%) | 72 (10.6%) |
| $100,000 to $149,999 | 40 (4.5%) | 271 (40.0%) |
| $150,000 or more | 98 (11.1%) | 25 (3.7%) |
| Total | 881 (100.0%) | 678 (100.0%) |
Property Value to Household Income Ratio in Mena
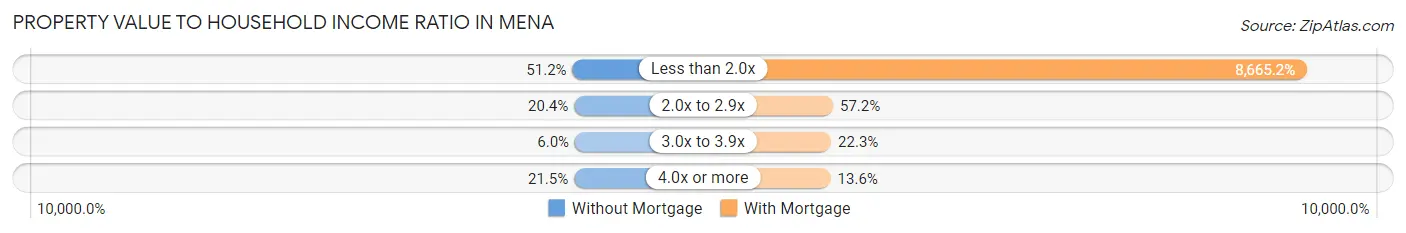
| Value-to-Income Ratio | Without Mortgage | With Mortgage |
| Less than 2.0x | 451 (51.2%) | 58,750 (8,665.2%) |
| 2.0x to 2.9x | 180 (20.4%) | 388 (57.2%) |
| 3.0x to 3.9x | 53 (6.0%) | 151 (22.3%) |
| 4.0x or more | 189 (21.4%) | 92 (13.6%) |
| Total | 881 (100.0%) | 678 (100.0%) |
Real Estate Taxes by Mortgage Status in Mena

| Property Taxes | Without Mortgage | With Mortgage |
| Less than $800 | 496 (56.3%) | 0 (0.0%) |
| $800 to $1,499 | 135 (15.3%) | 428 (63.1%) |
| $800 to $1,499 | 99 (11.2%) | 181 (26.7%) |
| Total | 881 (100.0%) | 678 (100.0%) |
Health & Disability in Mena
Health Insurance Coverage by Age in Mena
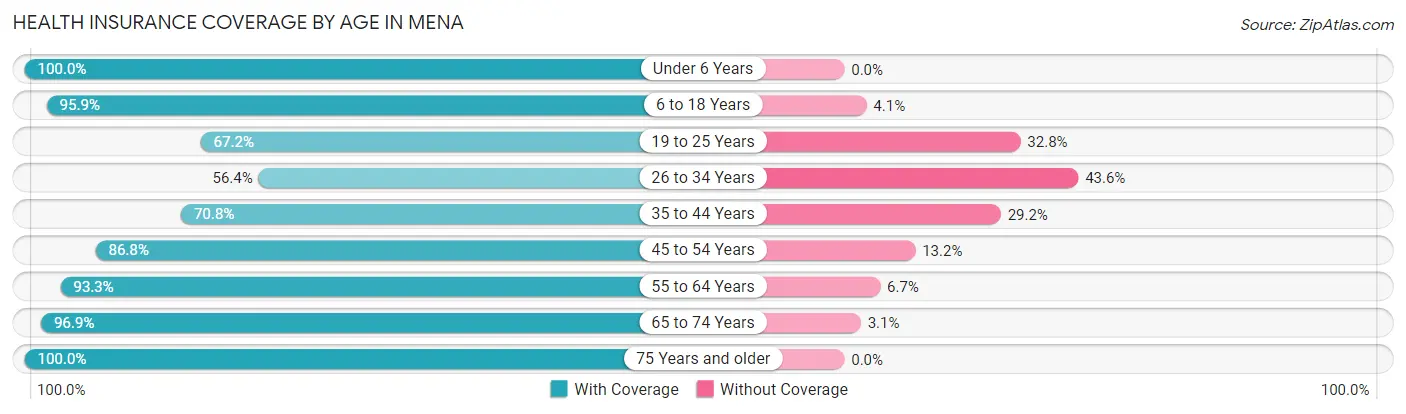
| Age Bracket | With Coverage | Without Coverage |
| Under 6 Years | 441 (100.0%) | 0 (0.0%) |
| 6 to 18 Years | 721 (95.9%) | 31 (4.1%) |
| 19 to 25 Years | 458 (67.2%) | 224 (32.8%) |
| 26 to 34 Years | 380 (56.4%) | 294 (43.6%) |
| 35 to 44 Years | 306 (70.8%) | 126 (29.2%) |
| 45 to 54 Years | 577 (86.8%) | 88 (13.2%) |
| 55 to 64 Years | 783 (93.3%) | 56 (6.7%) |
| 65 to 74 Years | 570 (96.9%) | 18 (3.1%) |
| 75 Years and older | 390 (100.0%) | 0 (0.0%) |
| Total | 4,626 (84.7%) | 837 (15.3%) |
Health Insurance Coverage by Citizenship Status in Mena

| Citizenship Status | With Coverage | Without Coverage |
| Native Born | 441 (100.0%) | 0 (0.0%) |
| Foreign Born, Citizen | 721 (95.9%) | 31 (4.1%) |
| Foreign Born, not a Citizen | 458 (67.2%) | 224 (32.8%) |
Health Insurance Coverage by Household Income in Mena
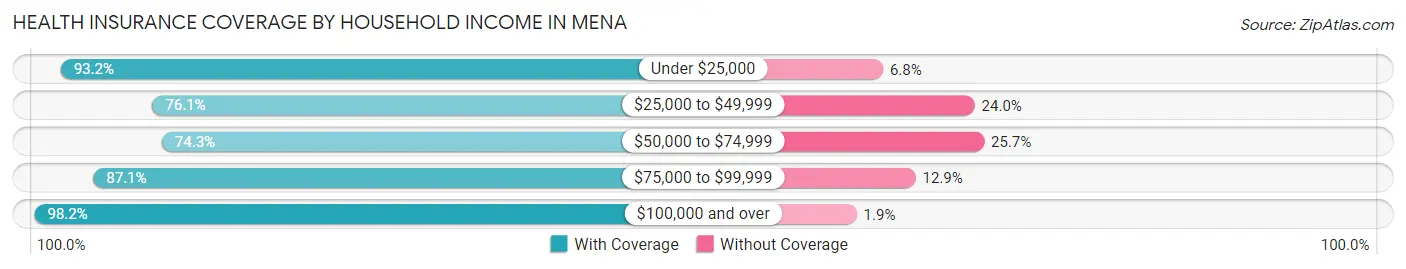
| Household Income | With Coverage | Without Coverage |
| Under $25,000 | 633 (93.2%) | 46 (6.8%) |
| $25,000 to $49,999 | 946 (76.0%) | 298 (23.9%) |
| $50,000 to $74,999 | 742 (74.3%) | 257 (25.7%) |
| $75,000 to $99,999 | 1,494 (87.1%) | 221 (12.9%) |
| $100,000 and over | 798 (98.2%) | 15 (1.8%) |
Public vs Private Health Insurance Coverage by Age in Mena
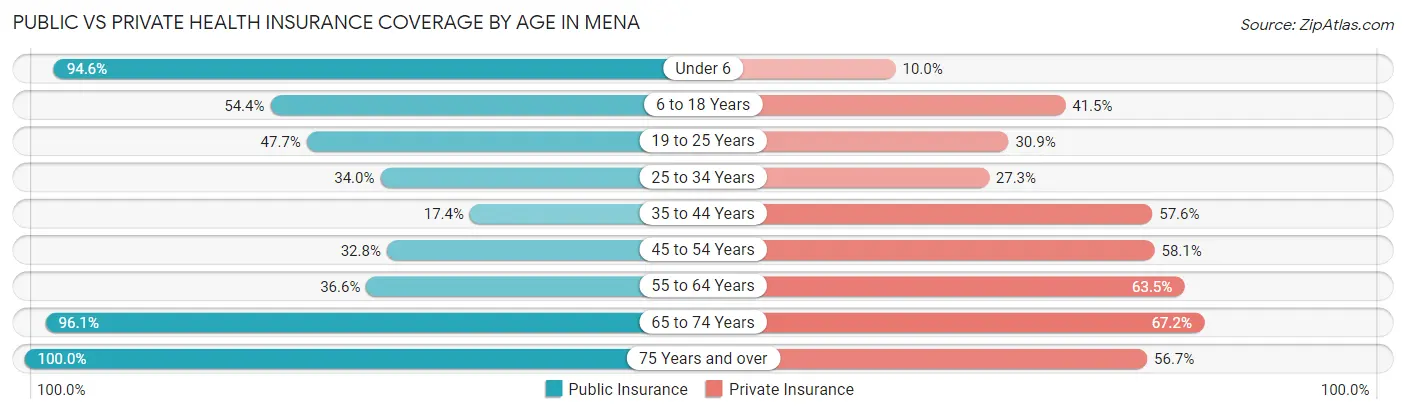
| Age Bracket | Public Insurance | Private Insurance |
| Under 6 | 417 (94.6%) | 44 (10.0%) |
| 6 to 18 Years | 409 (54.4%) | 312 (41.5%) |
| 19 to 25 Years | 325 (47.6%) | 211 (30.9%) |
| 25 to 34 Years | 229 (34.0%) | 184 (27.3%) |
| 35 to 44 Years | 75 (17.4%) | 249 (57.6%) |
| 45 to 54 Years | 218 (32.8%) | 386 (58.1%) |
| 55 to 64 Years | 307 (36.6%) | 533 (63.5%) |
| 65 to 74 Years | 565 (96.1%) | 395 (67.2%) |
| 75 Years and over | 390 (100.0%) | 221 (56.7%) |
| Total | 2,935 (53.7%) | 2,535 (46.4%) |
Disability Status by Sex by Age in Mena
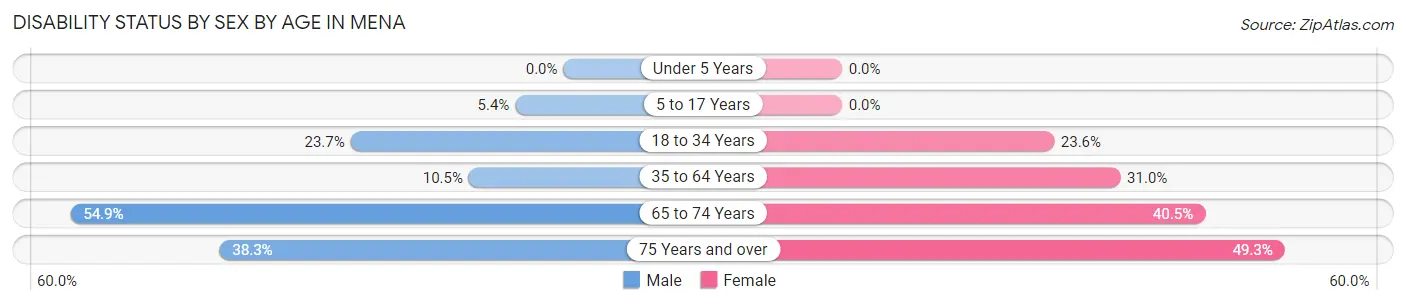
| Age Bracket | Male | Female |
| Under 5 Years | 0 (0.0%) | 0 (0.0%) |
| 5 to 17 Years | 18 (5.4%) | 0 (0.0%) |
| 18 to 34 Years | 164 (23.7%) | 175 (23.6%) |
| 35 to 64 Years | 103 (10.5%) | 297 (31.0%) |
| 65 to 74 Years | 179 (54.9%) | 106 (40.5%) |
| 75 Years and over | 36 (38.3%) | 146 (49.3%) |
Disability Class by Sex by Age in Mena
Disability Class: Hearing Difficulty
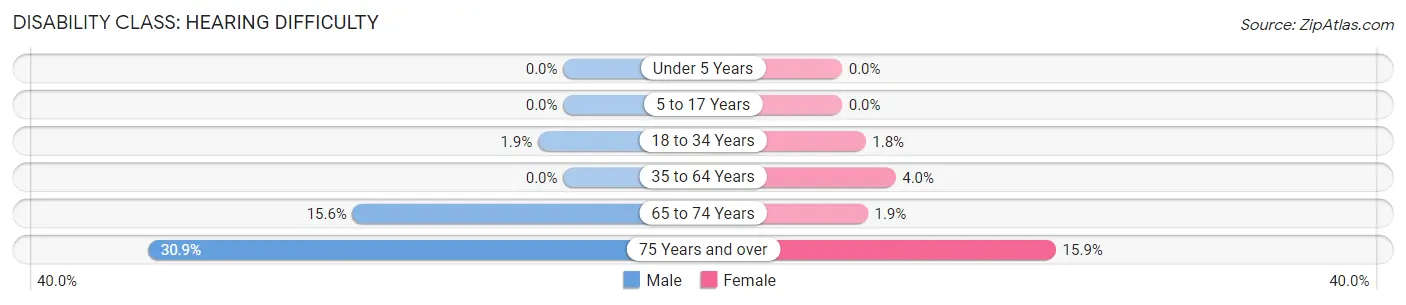
| Age Bracket | Male | Female |
| Under 5 Years | 0 (0.0%) | 0 (0.0%) |
| 5 to 17 Years | 0 (0.0%) | 0 (0.0%) |
| 18 to 34 Years | 13 (1.9%) | 13 (1.8%) |
| 35 to 64 Years | 0 (0.0%) | 38 (4.0%) |
| 65 to 74 Years | 51 (15.6%) | 5 (1.9%) |
| 75 Years and over | 29 (30.8%) | 47 (15.9%) |
Disability Class: Vision Difficulty
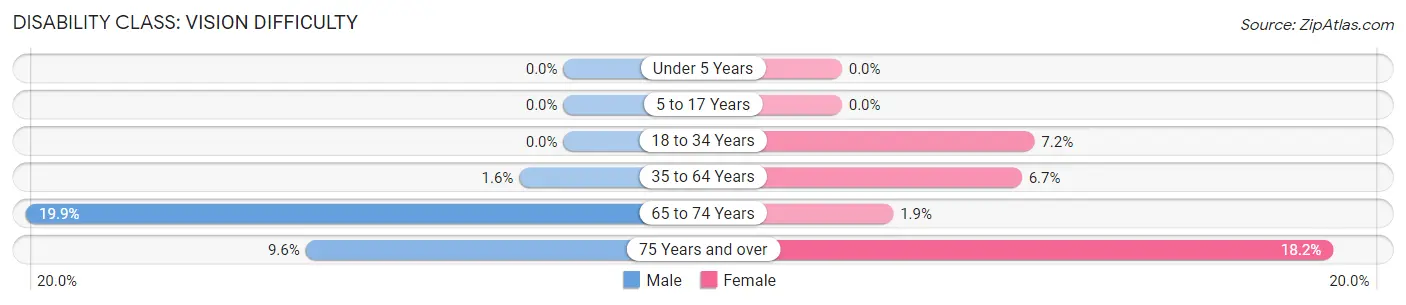
| Age Bracket | Male | Female |
| Under 5 Years | 0 (0.0%) | 0 (0.0%) |
| 5 to 17 Years | 0 (0.0%) | 0 (0.0%) |
| 18 to 34 Years | 0 (0.0%) | 53 (7.1%) |
| 35 to 64 Years | 16 (1.6%) | 64 (6.7%) |
| 65 to 74 Years | 65 (19.9%) | 5 (1.9%) |
| 75 Years and over | 9 (9.6%) | 54 (18.2%) |
Disability Class: Cognitive Difficulty
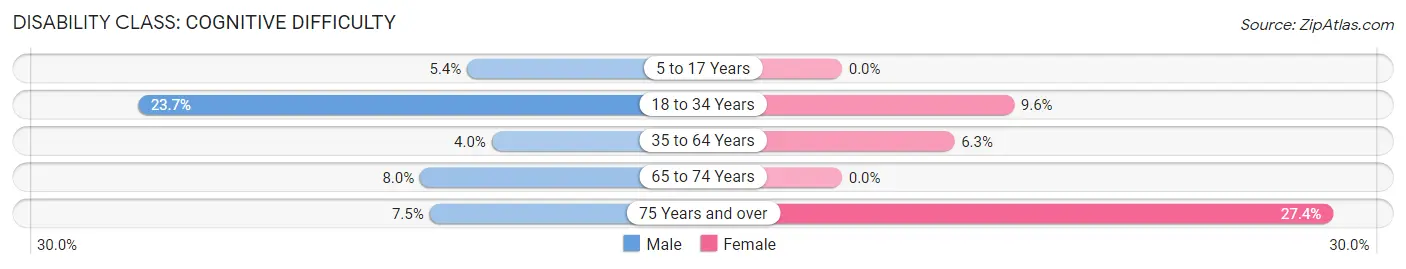
| Age Bracket | Male | Female |
| 5 to 17 Years | 18 (5.4%) | 0 (0.0%) |
| 18 to 34 Years | 164 (23.7%) | 71 (9.6%) |
| 35 to 64 Years | 39 (4.0%) | 60 (6.3%) |
| 65 to 74 Years | 26 (8.0%) | 0 (0.0%) |
| 75 Years and over | 7 (7.4%) | 81 (27.4%) |
Disability Class: Ambulatory Difficulty
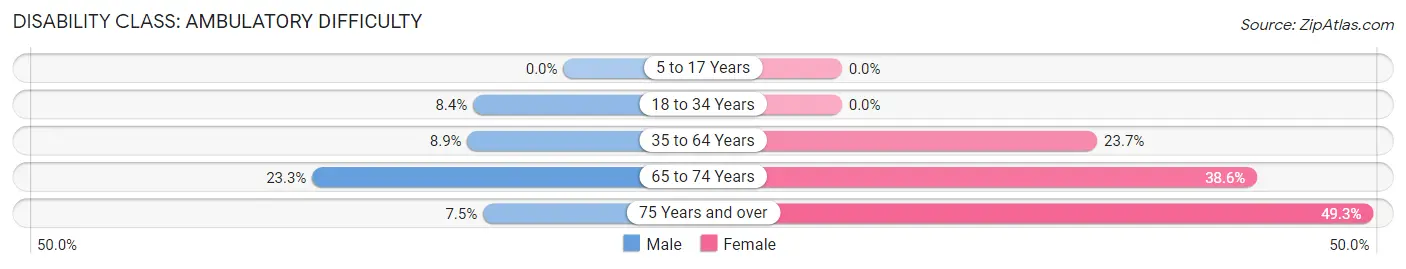
| Age Bracket | Male | Female |
| 5 to 17 Years | 0 (0.0%) | 0 (0.0%) |
| 18 to 34 Years | 58 (8.4%) | 0 (0.0%) |
| 35 to 64 Years | 87 (8.9%) | 227 (23.7%) |
| 65 to 74 Years | 76 (23.3%) | 101 (38.6%) |
| 75 Years and over | 7 (7.4%) | 146 (49.3%) |
Disability Class: Self-Care Difficulty
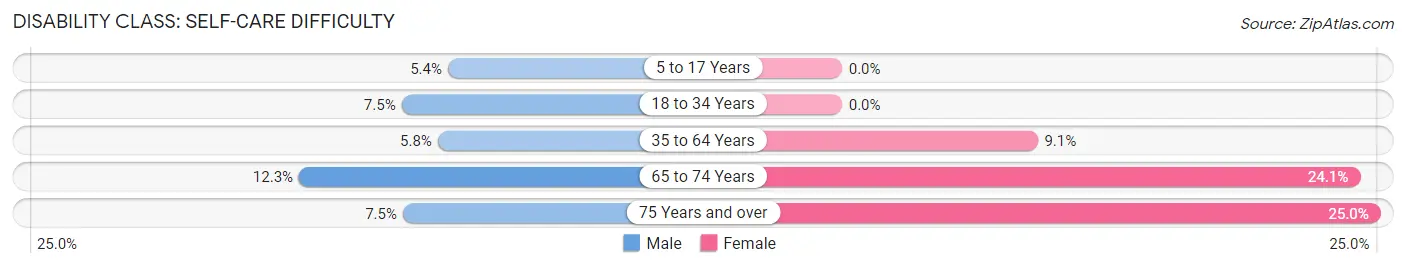
| Age Bracket | Male | Female |
| 5 to 17 Years | 18 (5.4%) | 0 (0.0%) |
| 18 to 34 Years | 52 (7.5%) | 0 (0.0%) |
| 35 to 64 Years | 57 (5.8%) | 87 (9.1%) |
| 65 to 74 Years | 40 (12.3%) | 63 (24.0%) |
| 75 Years and over | 7 (7.4%) | 74 (25.0%) |
Technology Access in Mena
Computing Device Access in Mena
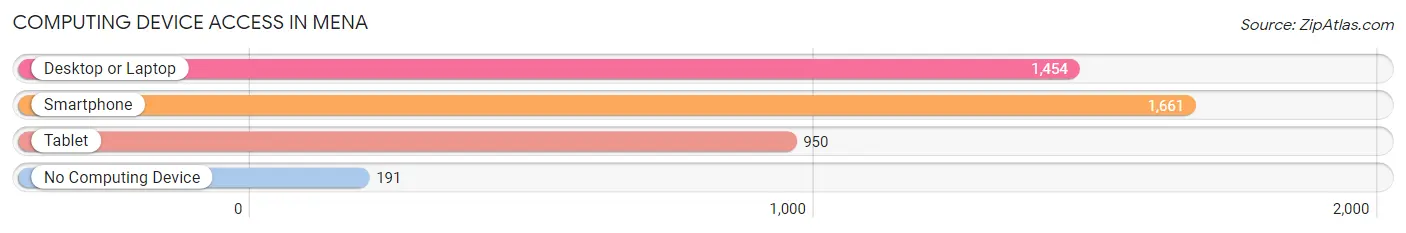
| Device Type | # Households | % Households |
| Desktop or Laptop | 1,454 | 65.7% |
| Smartphone | 1,661 | 75.0% |
| Tablet | 950 | 42.9% |
| No Computing Device | 191 | 8.6% |
| Total | 2,214 | 100.0% |
Internet Access in Mena
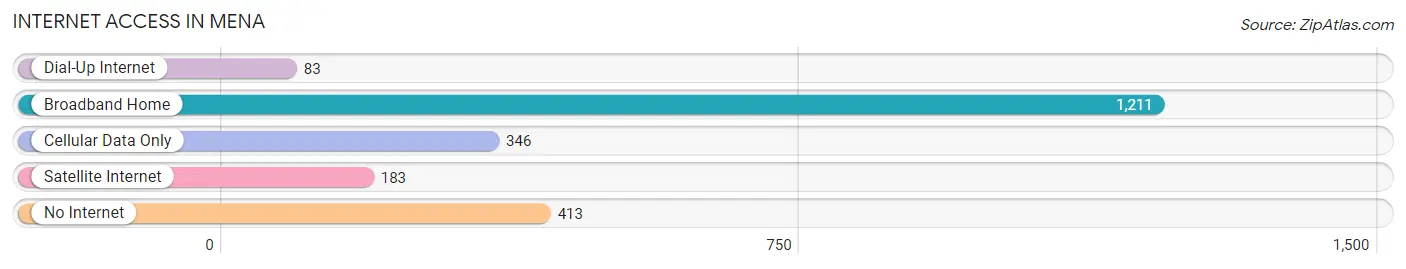
| Internet Type | # Households | % Households |
| Dial-Up Internet | 83 | 3.7% |
| Broadband Home | 1,211 | 54.7% |
| Cellular Data Only | 346 | 15.6% |
| Satellite Internet | 183 | 8.3% |
| No Internet | 413 | 18.6% |
| Total | 2,214 | 100.0% |
Mena Summary
Mena, Arkansas is a city located in Polk County in the Ouachita Mountains of western Arkansas. It is the county seat of Polk County and is located near the Oklahoma border. The city has a population of 5,631 as of the 2010 census.
Geography
Mena is located at the intersection of U.S. Route 71 and Arkansas Highway 8. It is situated in the Ouachita Mountains, which are part of the larger Ozark Mountains. The city is located in the Ouachita National Forest, which is the only national forest in Arkansas. The city is surrounded by the Ouachita National Forest and is located near the Talimena Scenic Drive, which is a 54-mile stretch of road that runs through the Ouachita Mountains.
The city has a total area of 5.3 square miles, all of which is land. The elevation of Mena is 1,072 feet above sea level. The city is located in the Central Standard Time Zone and observes Daylight Saving Time.
History
Mena was founded in 1887 by the St. Louis and San Francisco Railway. The city was named after Mena, Arkansas, which was the name of a nearby post office. The city was incorporated in 1889 and was the county seat of Polk County.
The city was a major timber producer in the early 20th century and was home to several sawmills. The city was also a major producer of apples and was known as the “Apple Capital of Arkansas”. The city was also home to a large number of poultry farms.
Economy
Mena’s economy is largely based on tourism and the timber industry. The city is home to several sawmills and is a major producer of lumber. The city is also home to several poultry farms and is a major producer of eggs.
The city is also home to several tourist attractions, including the Mena Starlite Drive-In Theater, the Mena Art Gallery, and the Mena Depot Museum. The city is also home to the Ouachita National Forest, which is a popular destination for camping, hiking, and fishing.
Demographics
As of the 2010 census, Mena had a population of 5,631. The racial makeup of the city was 95.3% White, 0.7% African American, 0.7% Native American, 0.3% Asian, 0.1% Pacific Islander, 1.2% from other races, and 1.9% from two or more races. Hispanic or Latino of any race were 3.2% of the population.
The median income for a household in Mena was $30,938 and the median income for a family was $37,917. The per capita income for the city was $17,845. About 16.2% of families and 19.2% of the population were below the poverty line, including 25.2% of those under age 18 and 14.2% of those age 65 or over.
Conclusion
Mena, Arkansas is a city located in Polk County in the Ouachita Mountains of western Arkansas. It is the county seat of Polk County and is located near the Oklahoma border. The city has a population of 5,631 as of the 2010 census. The city’s economy is largely based on tourism and the timber industry. The city is home to several sawmills and is a major producer of lumber. The city is also home to several tourist attractions, including the Mena Starlite Drive-In Theater, the Mena Art Gallery, and the Mena Depot Museum. The racial makeup of the city was 95.3% White, 0.7% African American, 0.7% Native American, 0.3% Asian, 0.1% Pacific Islander, 1.2% from other races, and 1.9% from two or more races. The median income for a household in Mena was $30,938 and the median income for a family was $37,917.
Common Questions
What is Per Capita Income in Mena?
Per Capita income in Mena is $31,725.
What is the Median Family Income in Mena?
Median Family Income in Mena is $69,400.
What is the Median Household income in Mena?
Median Household Income in Mena is $53,288.
What is Income or Wage Gap in Mena?
Income or Wage Gap in Mena is 23.5%.
Women in Mena earn 76.5 cents for every dollar earned by a man.
What is Inequality or Gini Index in Mena?
Inequality or Gini Index in Mena is 0.50.
What is the Total Population of Mena?
Total Population of Mena is 5,605.
What is the Total Male Population of Mena?
Total Male Population of Mena is 2,603.
What is the Total Female Population of Mena?
Total Female Population of Mena is 3,002.
What is the Ratio of Males per 100 Females in Mena?
There are 86.71 Males per 100 Females in Mena.
What is the Ratio of Females per 100 Males in Mena?
There are 115.33 Females per 100 Males in Mena.
What is the Median Population Age in Mena?
Median Population Age in Mena is 38.5 Years.
What is the Average Family Size in Mena
Average Family Size in Mena is 3.5 People.
What is the Average Household Size in Mena
Average Household Size in Mena is 2.5 People.
How Large is the Labor Force in Mena?
There are 2,709 People in the Labor Forcein in Mena.
What is the Percentage of People in the Labor Force in Mena?
59.1% of People are in the Labor Force in Mena.
What is the Unemployment Rate in Mena?
Unemployment Rate in Mena is 10.6%.