Marianna, AR Map & Demographics
Marianna Map
Marianna Overview
$15,392
PER CAPITA INCOME
$29,038
AVG FAMILY INCOME
$21,057
AVG HOUSEHOLD INCOME
39.2%
WAGE / INCOME GAP [ % ]
60.8¢/ $1
WAGE / INCOME GAP [ $ ]
$12,862
FAMILY INCOME DEFICIT
0.51
INEQUALITY / GINI INDEX
3,575
TOTAL POPULATION
1,371
MALE POPULATION
2,204
FEMALE POPULATION
62.21
MALES / 100 FEMALES
160.76
FEMALES / 100 MALES
41.7
MEDIAN AGE
3.8
AVG FAMILY SIZE
2.8
AVG HOUSEHOLD SIZE
1,329
LABOR FORCE [ PEOPLE ]
46.5%
PERCENT IN LABOR FORCE
21.1%
UNEMPLOYMENT RATE
Marianna Zip Codes
Marianna Area Codes
Income in Marianna
Income Overview in Marianna
Per Capita Income in Marianna is $15,392, while median incomes of families and households are $29,038 and $21,057 respectively.
| Characteristic | Number | Measure |
| Per Capita Income | 3,575 | $15,392 |
| Median Family Income | 772 | $29,038 |
| Mean Family Income | 772 | $41,527 |
| Median Household Income | 1,240 | $21,057 |
| Mean Household Income | 1,240 | $35,050 |
| Income Deficit | 772 | $12,862 |
| Wage / Income Gap (%) | 3,575 | 39.16% |
| Wage / Income Gap ($) | 3,575 | 60.84¢ per $1 |
| Gini / Inequality Index | 3,575 | 0.51 |
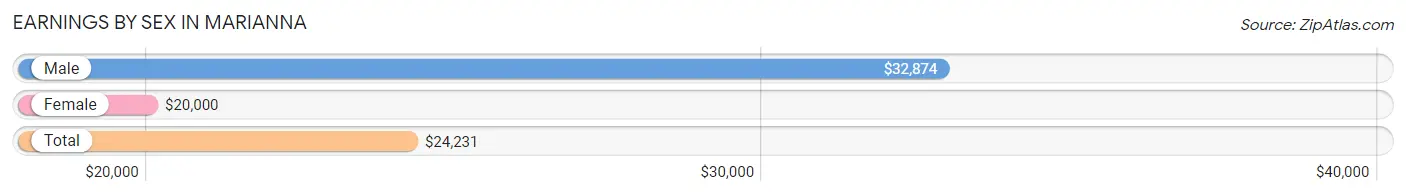
Earnings by Sex in Marianna
Average Earnings in Marianna are $24,231, $32,874 for men and $20,000 for women, a difference of 39.2%.
| Sex | Number | Average Earnings |
| Male | 854 (60.9%) | $32,874 |
| Female | 548 (39.1%) | $20,000 |
| Total | 1,402 (100.0%) | $24,231 |
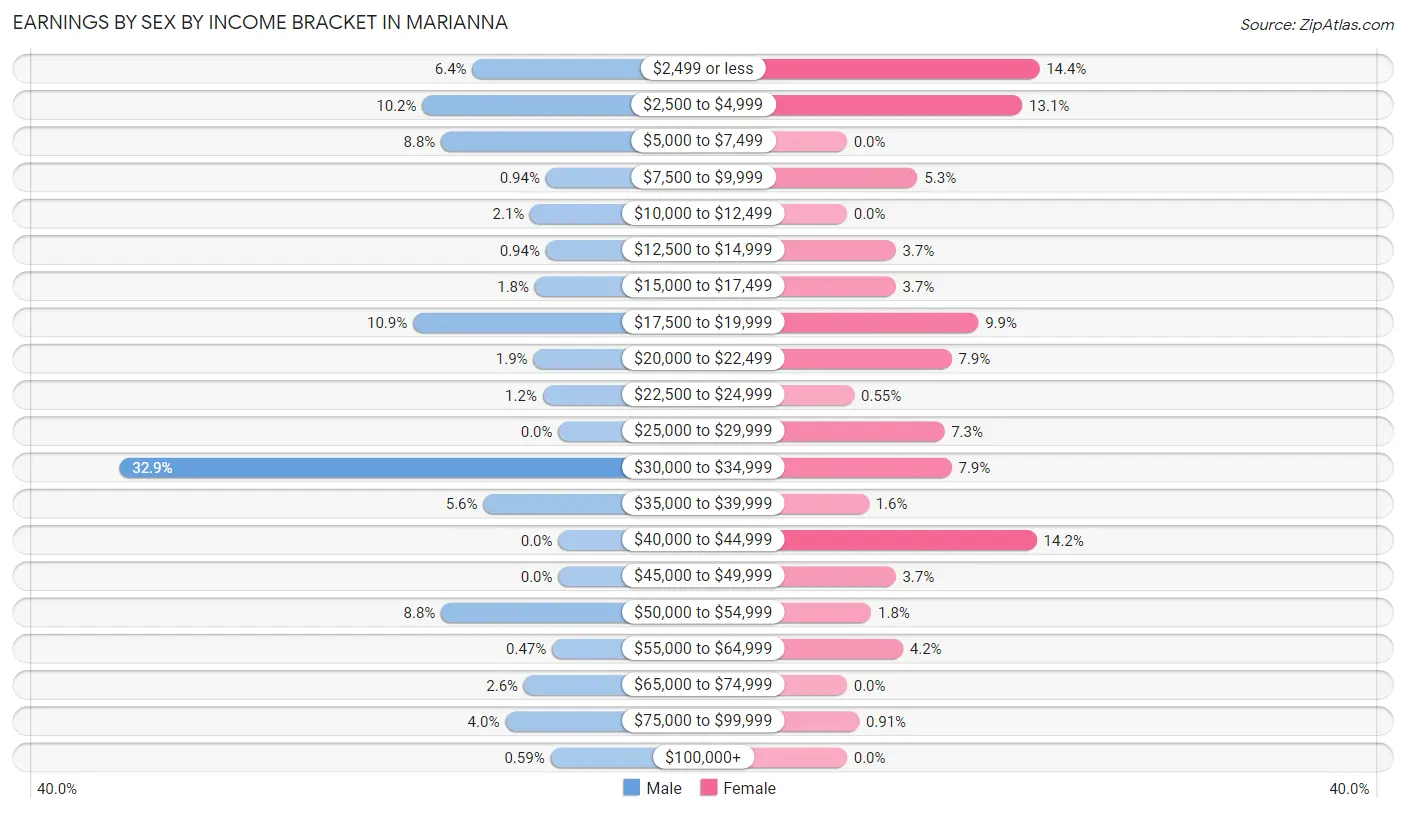
Earnings by Sex by Income Bracket in Marianna
The most common earnings brackets in Marianna are $30,000 to $34,999 for men (281 | 32.9%) and $2,499 or less for women (79 | 14.4%).
| Income | Male | Female |
| $2,499 or less | 55 (6.4%) | 79 (14.4%) |
| $2,500 to $4,999 | 87 (10.2%) | 72 (13.1%) |
| $5,000 to $7,499 | 75 (8.8%) | 0 (0.0%) |
| $7,500 to $9,999 | 8 (0.9%) | 29 (5.3%) |
| $10,000 to $12,499 | 18 (2.1%) | 0 (0.0%) |
| $12,500 to $14,999 | 8 (0.9%) | 20 (3.6%) |
| $15,000 to $17,499 | 15 (1.8%) | 20 (3.6%) |
| $17,500 to $19,999 | 93 (10.9%) | 54 (9.9%) |
| $20,000 to $22,499 | 16 (1.9%) | 43 (7.9%) |
| $22,500 to $24,999 | 10 (1.2%) | 3 (0.5%) |
| $25,000 to $29,999 | 0 (0.0%) | 40 (7.3%) |
| $30,000 to $34,999 | 281 (32.9%) | 43 (7.9%) |
| $35,000 to $39,999 | 48 (5.6%) | 9 (1.6%) |
| $40,000 to $44,999 | 0 (0.0%) | 78 (14.2%) |
| $45,000 to $49,999 | 0 (0.0%) | 20 (3.6%) |
| $50,000 to $54,999 | 75 (8.8%) | 10 (1.8%) |
| $55,000 to $64,999 | 4 (0.5%) | 23 (4.2%) |
| $65,000 to $74,999 | 22 (2.6%) | 0 (0.0%) |
| $75,000 to $99,999 | 34 (4.0%) | 5 (0.9%) |
| $100,000+ | 5 (0.6%) | 0 (0.0%) |
| Total | 854 (100.0%) | 548 (100.0%) |
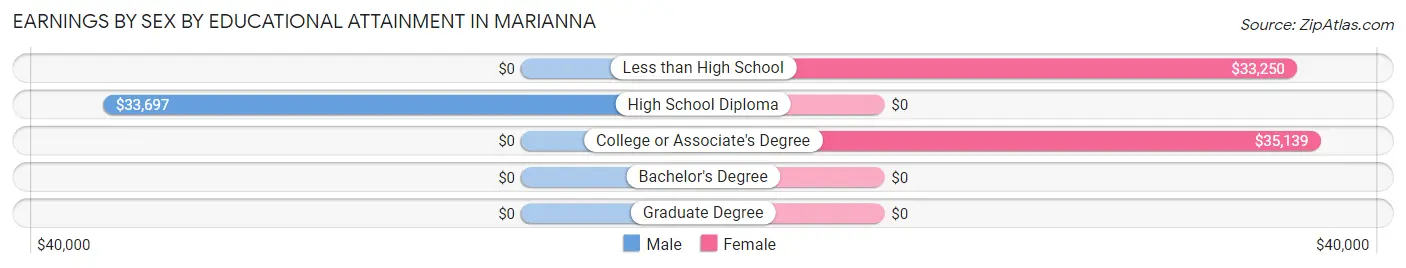
Earnings by Sex by Educational Attainment in Marianna
Average earnings in Marianna are $33,492 for men and $22,180 for women, a difference of 33.8%. Men with an educational attainment of high school diploma enjoy the highest average annual earnings of $33,697, while those with high school diploma education earn the least with $33,697. Women with an educational attainment of college or associate's degree earn the most with the average annual earnings of $35,139, while those with less than high school education have the smallest earnings of $33,250.
| Educational Attainment | Male Income | Female Income |
| Less than High School | - | - |
| High School Diploma | $33,697 | $0 |
| College or Associate's Degree | - | - |
| Bachelor's Degree | - | - |
| Graduate Degree | - | - |
| Total | $33,492 | $22,180 |
Family Income in Marianna
Family Income Brackets in Marianna
According to the Marianna family income data, there are 198 families falling into the $50,000 to $74,999 income range, which is the most common income bracket and makes up 25.7% of all families.
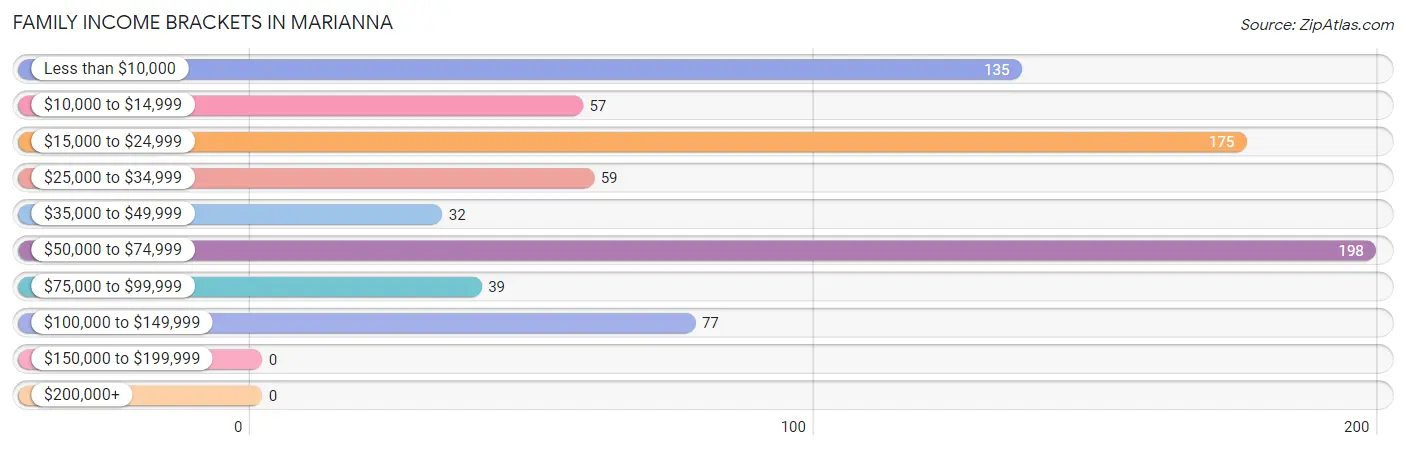
| Income Bracket | # Families | % Families |
| Less than $10,000 | 135 | 17.5% |
| $10,000 to $14,999 | 57 | 7.4% |
| $15,000 to $24,999 | 175 | 22.7% |
| $25,000 to $34,999 | 59 | 7.6% |
| $35,000 to $49,999 | 32 | 4.1% |
| $50,000 to $74,999 | 198 | 25.6% |
| $75,000 to $99,999 | 39 | 5.1% |
| $100,000 to $149,999 | 77 | 10.0% |
| $150,000 to $199,999 | 0 | 0.0% |
| $200,000+ | 0 | 0.0% |
Family Income by Famaliy Size in Marianna
3-person families (308 | 39.9%) account for the highest median family income in Marianna with $50,114 per family, while 3-person families (308 | 39.9%) have the highest median income of $16,705 per family member.
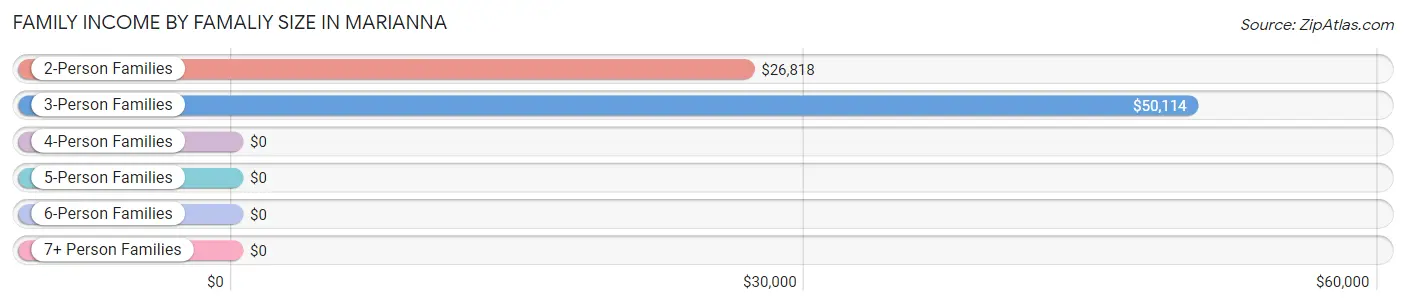
| Income Bracket | # Families | Median Income |
| 2-Person Families | 356 (46.1%) | $26,818 |
| 3-Person Families | 308 (39.9%) | $50,114 |
| 4-Person Families | 90 (11.7%) | $0 |
| 5-Person Families | 13 (1.7%) | $0 |
| 6-Person Families | 5 (0.6%) | $0 |
| 7+ Person Families | 0 (0.0%) | $0 |
| Total | 772 (100.0%) | $29,038 |
Family Income by Number of Earners in Marianna
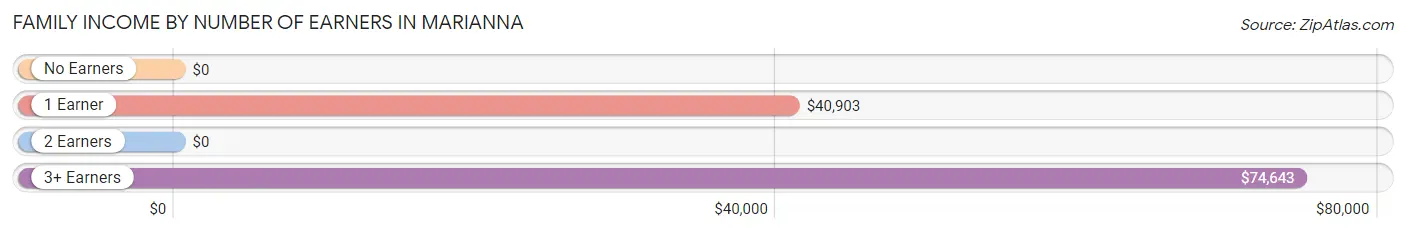
| Number of Earners | # Families | Median Income |
| No Earners | 200 (25.9%) | $0 |
| 1 Earner | 393 (50.9%) | $40,903 |
| 2 Earners | 143 (18.5%) | $0 |
| 3+ Earners | 36 (4.7%) | $74,643 |
| Total | 772 (100.0%) | $29,038 |
Household Income in Marianna
Household Income Brackets in Marianna
With 362 households falling in the category, the $15,000 to $24,999 income range is the most frequent in Marianna, accounting for 29.2% of all households.
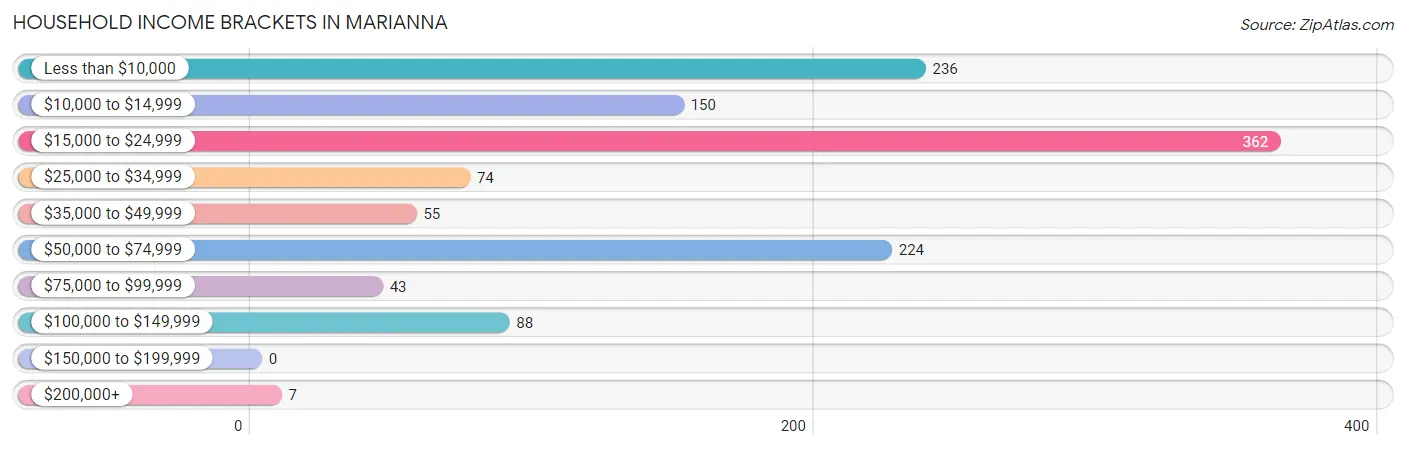
| Income Bracket | # Households | % Households |
| Less than $10,000 | 236 | 19.0% |
| $10,000 to $14,999 | 150 | 12.1% |
| $15,000 to $24,999 | 362 | 29.2% |
| $25,000 to $34,999 | 74 | 6.0% |
| $35,000 to $49,999 | 55 | 4.4% |
| $50,000 to $74,999 | 224 | 18.1% |
| $75,000 to $99,999 | 43 | 3.5% |
| $100,000 to $149,999 | 88 | 7.1% |
| $150,000 to $199,999 | 0 | 0.0% |
| $200,000+ | 7 | 0.6% |
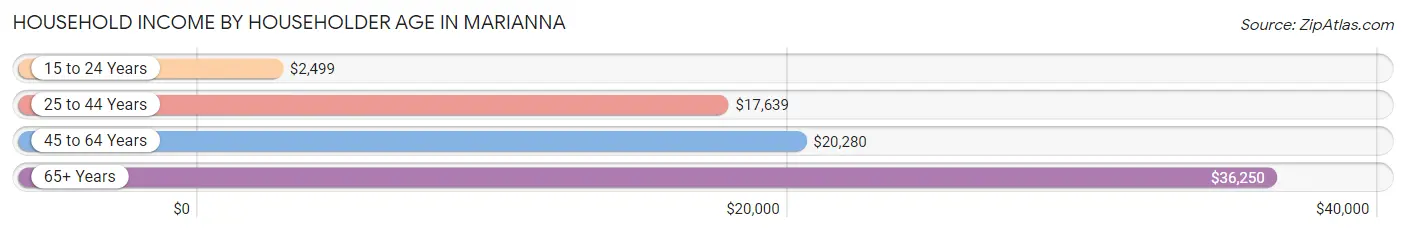
Household Income by Householder Age in Marianna
The median household income in Marianna is $21,057, with the highest median household income of $36,250 found in the 65+ years age bracket for the primary householder. A total of 490 households (39.5%) fall into this category. Meanwhile, the 15 to 24 years age bracket for the primary householder has the lowest median household income of $2,499, with 70 households (5.7%) in this group.
| Income Bracket | # Households | Median Income |
| 15 to 24 Years | 70 (5.7%) | $2,499 |
| 25 to 44 Years | 301 (24.3%) | $17,639 |
| 45 to 64 Years | 379 (30.6%) | $20,280 |
| 65+ Years | 490 (39.5%) | $36,250 |
| Total | 1,240 (100.0%) | $21,057 |
Poverty in Marianna
Income Below Poverty by Sex and Age in Marianna
With 31.2% poverty level for males and 43.1% for females among the residents of Marianna, under 5 year old males and 18 to 24 year old females are the most vulnerable to poverty, with 110 males (100.0%) and 227 females (79.9%) in their respective age groups living below the poverty level.
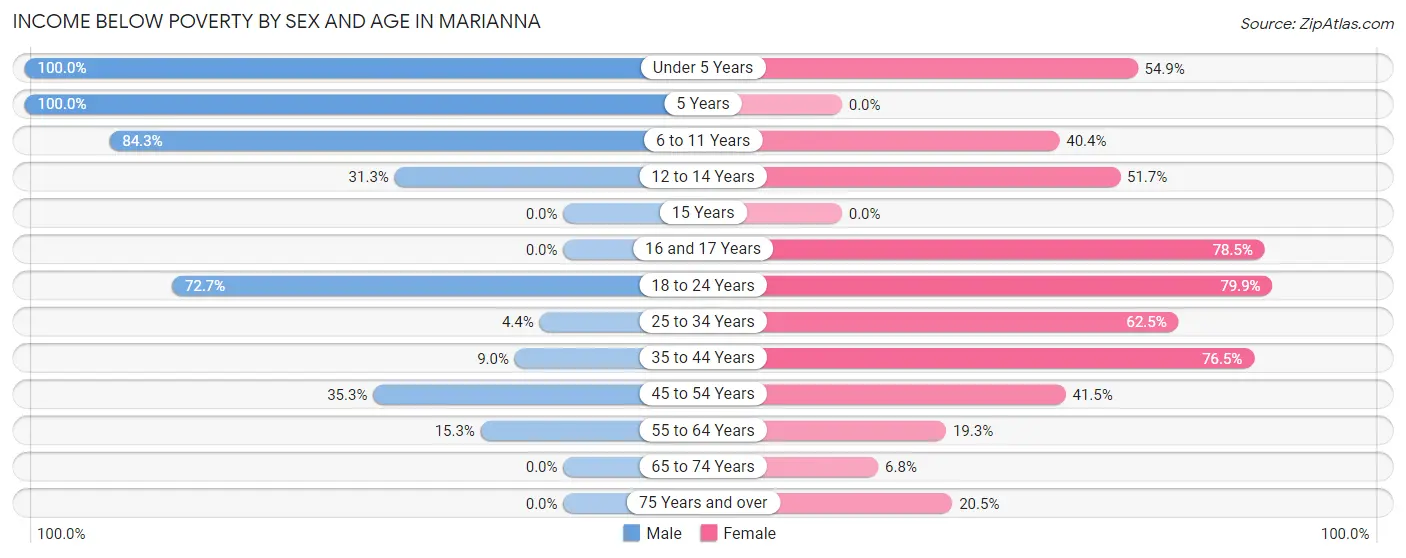
| Age Bracket | Male | Female |
| Under 5 Years | 110 (100.0%) | 73 (54.9%) |
| 5 Years | 25 (100.0%) | 0 (0.0%) |
| 6 to 11 Years | 75 (84.3%) | 65 (40.4%) |
| 12 to 14 Years | 31 (31.3%) | 47 (51.6%) |
| 15 Years | 0 (0.0%) | 0 (0.0%) |
| 16 and 17 Years | 0 (0.0%) | 84 (78.5%) |
| 18 to 24 Years | 93 (72.7%) | 227 (79.9%) |
| 25 to 34 Years | 8 (4.4%) | 35 (62.5%) |
| 35 to 44 Years | 29 (9.0%) | 137 (76.5%) |
| 45 to 54 Years | 18 (35.3%) | 147 (41.5%) |
| 55 to 64 Years | 27 (15.3%) | 53 (19.3%) |
| 65 to 74 Years | 0 (0.0%) | 21 (6.8%) |
| 75 Years and over | 0 (0.0%) | 41 (20.5%) |
| Total | 416 (31.2%) | 930 (43.1%) |
Income Above Poverty by Sex and Age in Marianna
According to the poverty statistics in Marianna, males aged 16 and 17 years and females aged 15 years are the age groups that are most secure financially, with 100.0% of males and 100.0% of females in these age groups living above the poverty line.
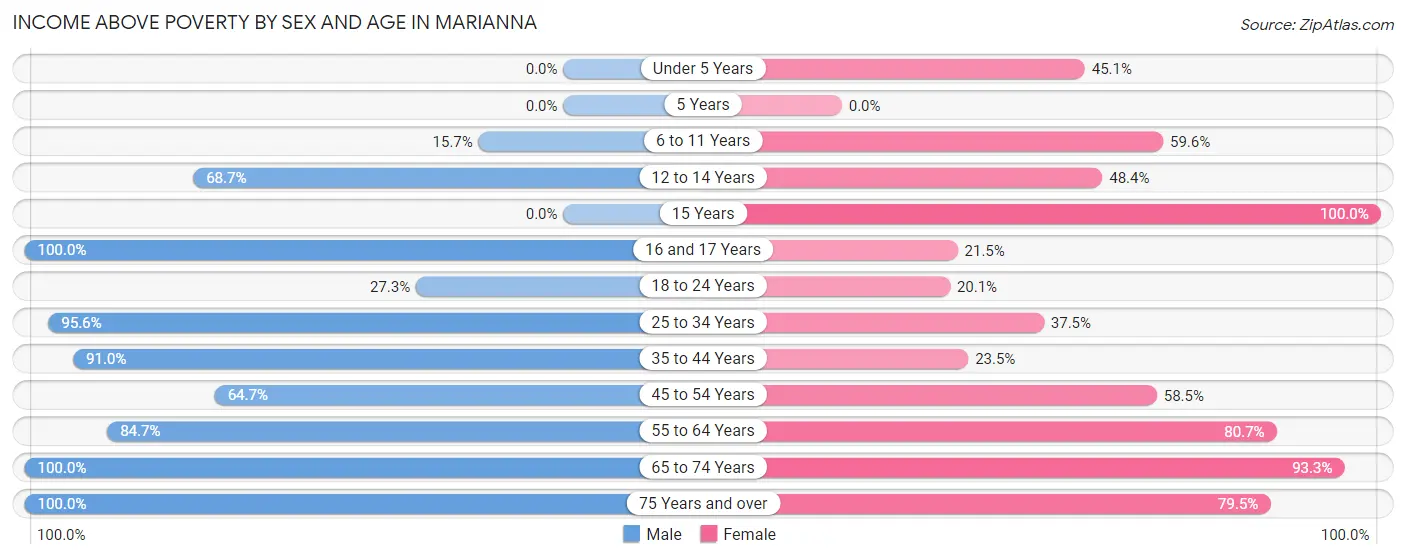
| Age Bracket | Male | Female |
| Under 5 Years | 0 (0.0%) | 60 (45.1%) |
| 5 Years | 0 (0.0%) | 0 (0.0%) |
| 6 to 11 Years | 14 (15.7%) | 96 (59.6%) |
| 12 to 14 Years | 68 (68.7%) | 44 (48.3%) |
| 15 Years | 0 (0.0%) | 6 (100.0%) |
| 16 and 17 Years | 14 (100.0%) | 23 (21.5%) |
| 18 to 24 Years | 35 (27.3%) | 57 (20.1%) |
| 25 to 34 Years | 173 (95.6%) | 21 (37.5%) |
| 35 to 44 Years | 293 (91.0%) | 42 (23.5%) |
| 45 to 54 Years | 33 (64.7%) | 207 (58.5%) |
| 55 to 64 Years | 149 (84.7%) | 221 (80.7%) |
| 65 to 74 Years | 82 (100.0%) | 290 (93.2%) |
| 75 Years and over | 57 (100.0%) | 159 (79.5%) |
| Total | 918 (68.8%) | 1,226 (56.9%) |
Income Below Poverty Among Married-Couple Families in Marianna
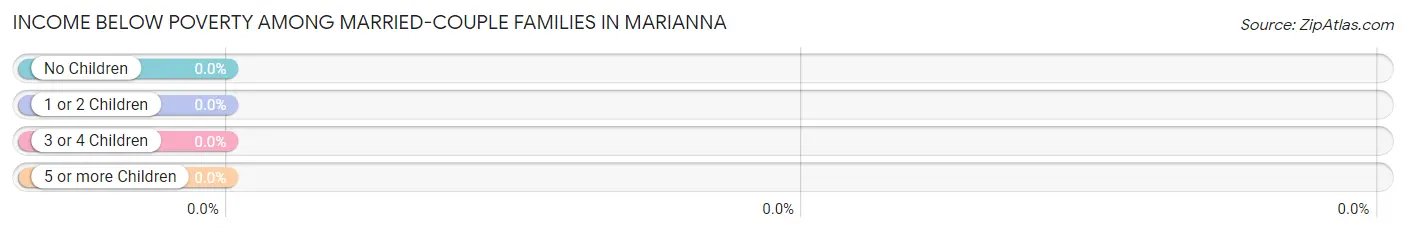
| Children | Above Poverty | Below Poverty |
| No Children | 197 (100.0%) | 0 (0.0%) |
| 1 or 2 Children | 54 (100.0%) | 0 (0.0%) |
| 3 or 4 Children | 0 (0.0%) | 0 (0.0%) |
| 5 or more Children | 0 (0.0%) | 0 (0.0%) |
| Total | 251 (100.0%) | 0 (0.0%) |
Income Below Poverty Among Single-Parent Households in Marianna
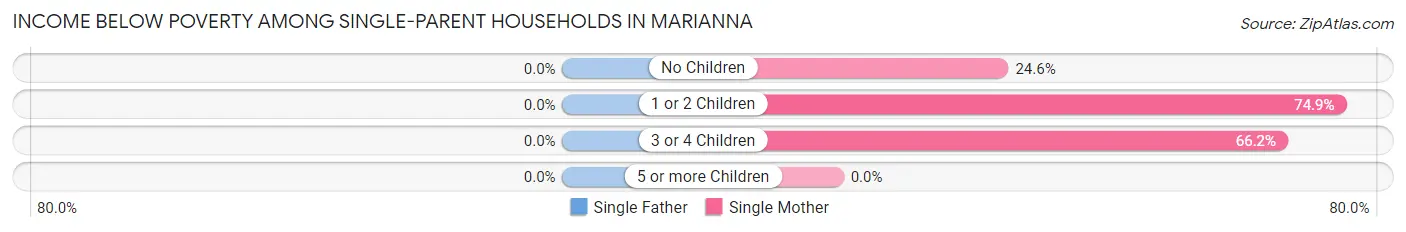
| Children | Single Father | Single Mother |
| No Children | 0 (0.0%) | 56 (24.6%) |
| 1 or 2 Children | 0 (0.0%) | 164 (74.9%) |
| 3 or 4 Children | 0 (0.0%) | 45 (66.2%) |
| 5 or more Children | 0 (0.0%) | 0 (0.0%) |
| Total | 0 (0.0%) | 265 (51.5%) |
Income Below Poverty Among Married-Couple vs Single-Parent Households in Marianna
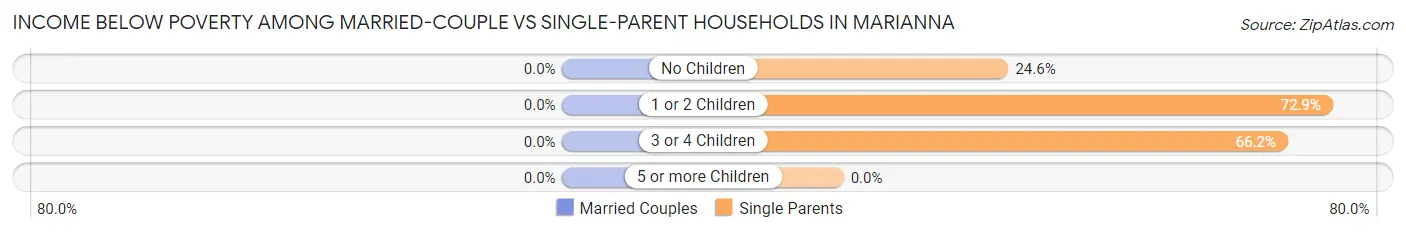
| Children | Married-Couple Families | Single-Parent Households |
| No Children | 0 (0.0%) | 56 (24.6%) |
| 1 or 2 Children | 0 (0.0%) | 164 (72.9%) |
| 3 or 4 Children | 0 (0.0%) | 45 (66.2%) |
| 5 or more Children | 0 (0.0%) | 0 (0.0%) |
| Total | 0 (0.0%) | 265 (50.9%) |
Race in Marianna
The most populous races in Marianna are Black / African American (2,889 | 80.8%), White / Caucasian (631 | 17.6%), and Two or more Races (54 | 1.5%).
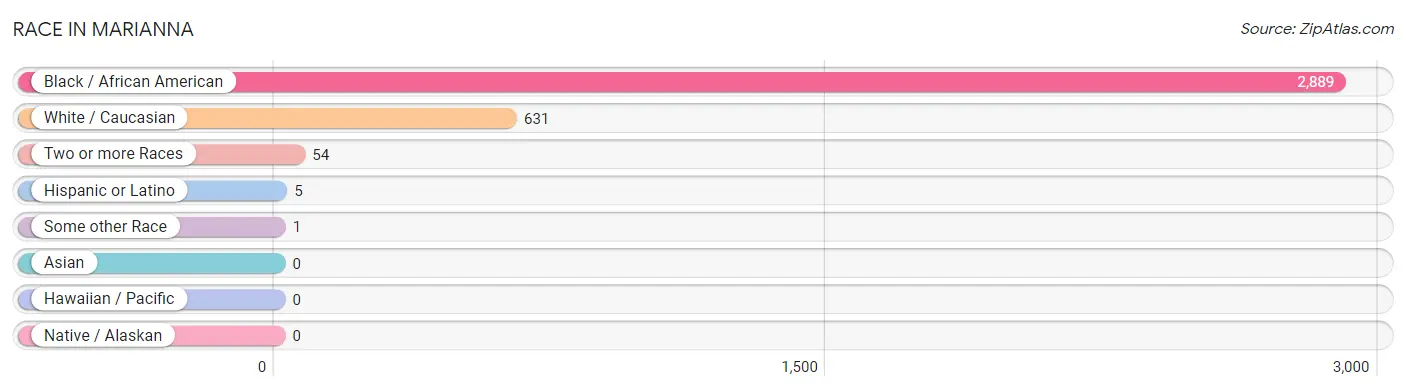
| Race | # Population | % Population |
| Asian | 0 | 0.0% |
| Black / African American | 2,889 | 80.8% |
| Hawaiian / Pacific | 0 | 0.0% |
| Hispanic or Latino | 5 | 0.1% |
| Native / Alaskan | 0 | 0.0% |
| White / Caucasian | 631 | 17.6% |
| Two or more Races | 54 | 1.5% |
| Some other Race | 1 | 0.0% |
| Total | 3,575 | 100.0% |
Ancestry in Marianna
The most populous ancestries reported in Marianna are Italian (110 | 3.1%), German (100 | 2.8%), American (83 | 2.3%), English (65 | 1.8%), and Scottish (59 | 1.7%), together accounting for 11.7% of all Marianna residents.
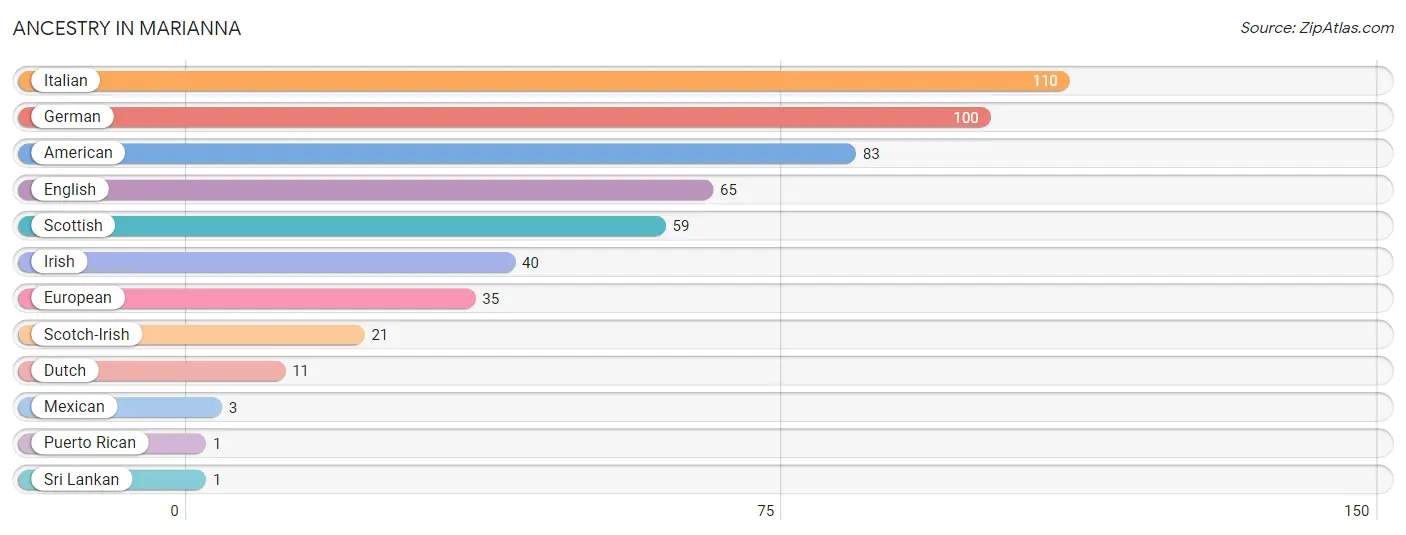
| Ancestry | # Population | % Population |
| American | 83 | 2.3% |
| Dutch | 11 | 0.3% |
| English | 65 | 1.8% |
| European | 35 | 1.0% |
| German | 100 | 2.8% |
| Irish | 40 | 1.1% |
| Italian | 110 | 3.1% |
| Mexican | 3 | 0.1% |
| Puerto Rican | 1 | 0.0% |
| Scotch-Irish | 21 | 0.6% |
| Scottish | 59 | 1.7% |
| Sri Lankan | 1 | 0.0% | View All 12 Rows |
Immigrants in Marianna
The most numerous immigrant groups reported in Marianna came from Europe (2 | 0.1%), Germany (2 | 0.1%), and Western Europe (2 | 0.1%), together accounting for 0.2% of all Marianna residents.
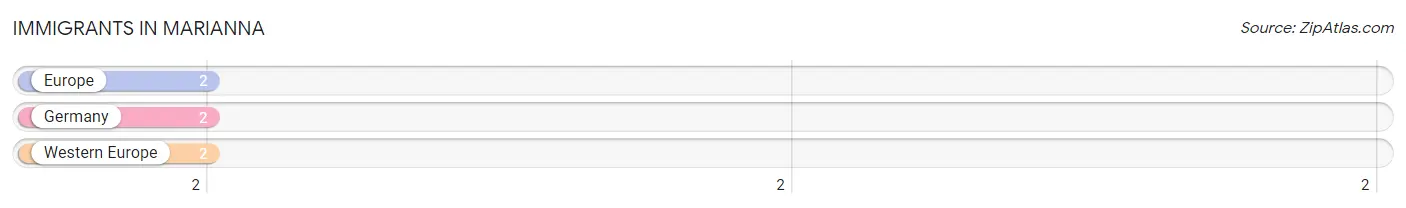
| Immigration Origin | # Population | % Population |
| Europe | 2 | 0.1% |
| Germany | 2 | 0.1% |
| Western Europe | 2 | 0.1% | View All 3 Rows |
Sex and Age in Marianna
Sex and Age in Marianna
The most populous age groups in Marianna are 40 to 44 Years (324 | 23.6%) for men and 15 to 19 Years (250 | 11.3%) for women.
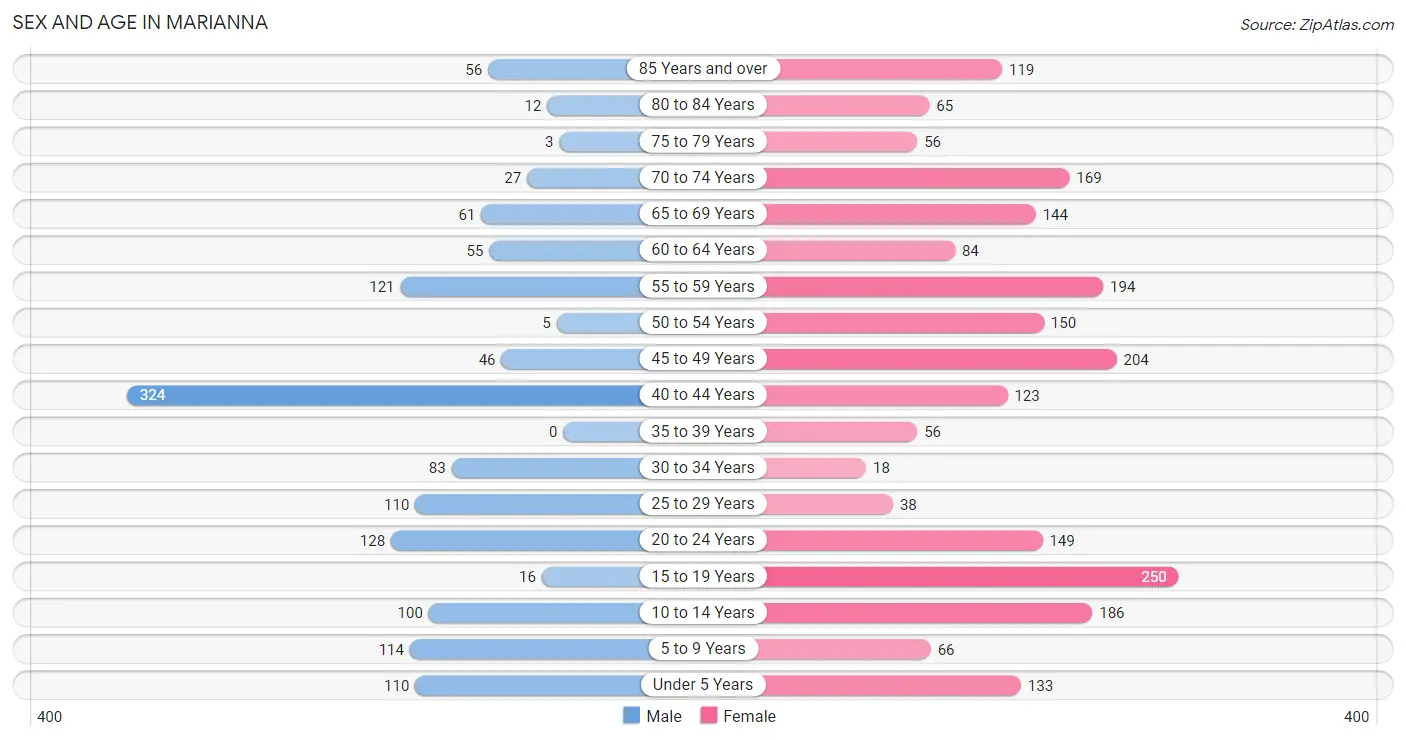
| Age Bracket | Male | Female |
| Under 5 Years | 110 (8.0%) | 133 (6.0%) |
| 5 to 9 Years | 114 (8.3%) | 66 (3.0%) |
| 10 to 14 Years | 100 (7.3%) | 186 (8.4%) |
| 15 to 19 Years | 16 (1.2%) | 250 (11.3%) |
| 20 to 24 Years | 128 (9.3%) | 149 (6.8%) |
| 25 to 29 Years | 110 (8.0%) | 38 (1.7%) |
| 30 to 34 Years | 83 (6.0%) | 18 (0.8%) |
| 35 to 39 Years | 0 (0.0%) | 56 (2.5%) |
| 40 to 44 Years | 324 (23.6%) | 123 (5.6%) |
| 45 to 49 Years | 46 (3.4%) | 204 (9.3%) |
| 50 to 54 Years | 5 (0.4%) | 150 (6.8%) |
| 55 to 59 Years | 121 (8.8%) | 194 (8.8%) |
| 60 to 64 Years | 55 (4.0%) | 84 (3.8%) |
| 65 to 69 Years | 61 (4.4%) | 144 (6.5%) |
| 70 to 74 Years | 27 (2.0%) | 169 (7.7%) |
| 75 to 79 Years | 3 (0.2%) | 56 (2.5%) |
| 80 to 84 Years | 12 (0.9%) | 65 (2.9%) |
| 85 Years and over | 56 (4.1%) | 119 (5.4%) |
| Total | 1,371 (100.0%) | 2,204 (100.0%) |
Families and Households in Marianna
Median Family Size in Marianna
The median family size in Marianna is 3.78 persons per family, with single female/mother families (515 | 66.7%) accounting for the largest median family size of 4.29 persons per family. On the other hand, single male/father families (6 | 0.8%) represent the smallest median family size with 2.00 persons per family.
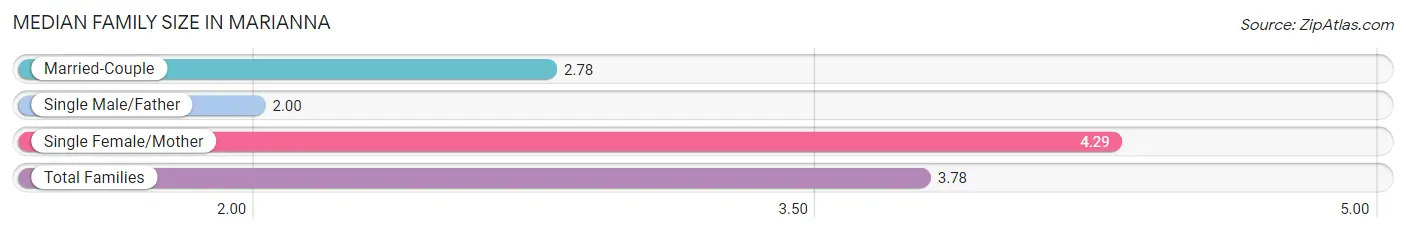
| Family Type | # Families | Family Size |
| Married-Couple | 251 (32.5%) | 2.78 |
| Single Male/Father | 6 (0.8%) | 2.00 |
| Single Female/Mother | 515 (66.7%) | 4.29 |
| Total Families | 772 (100.0%) | 3.78 |
Median Household Size in Marianna
The median household size in Marianna is 2.81 persons per household, with single female/mother households (515 | 41.5%) accounting for the largest median household size of 4.4 persons per household. non-family households (468 | 37.7%) represent the smallest median household size with 1.10 persons per household.
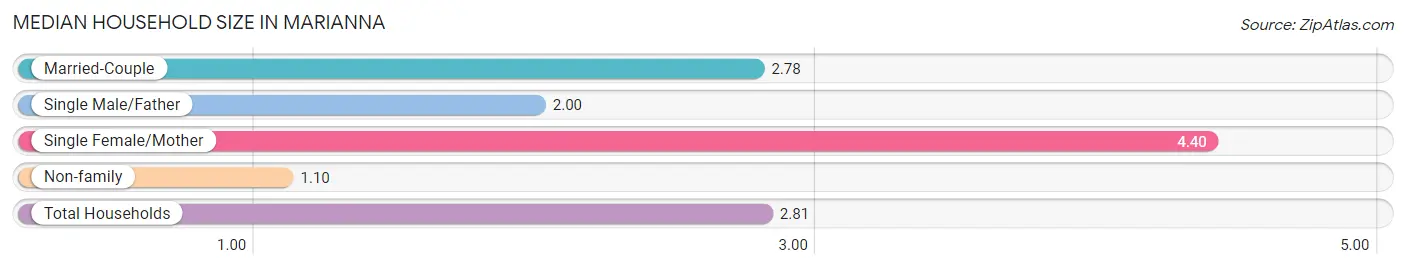
| Household Type | # Households | Household Size |
| Married-Couple | 251 (20.2%) | 2.78 |
| Single Male/Father | 6 (0.5%) | 2.00 |
| Single Female/Mother | 515 (41.5%) | 4.40 |
| Non-family | 468 (37.7%) | 1.10 |
| Total Households | 1,240 (100.0%) | 2.81 |
Household Size by Marriage Status in Marianna
Out of a total of 1,240 households in Marianna, 772 (62.3%) are family households, while 468 (37.7%) are nonfamily households. The most numerous type of family households are 2-person households, comprising 345, and the most common type of nonfamily households are 1-person households, comprising 453.
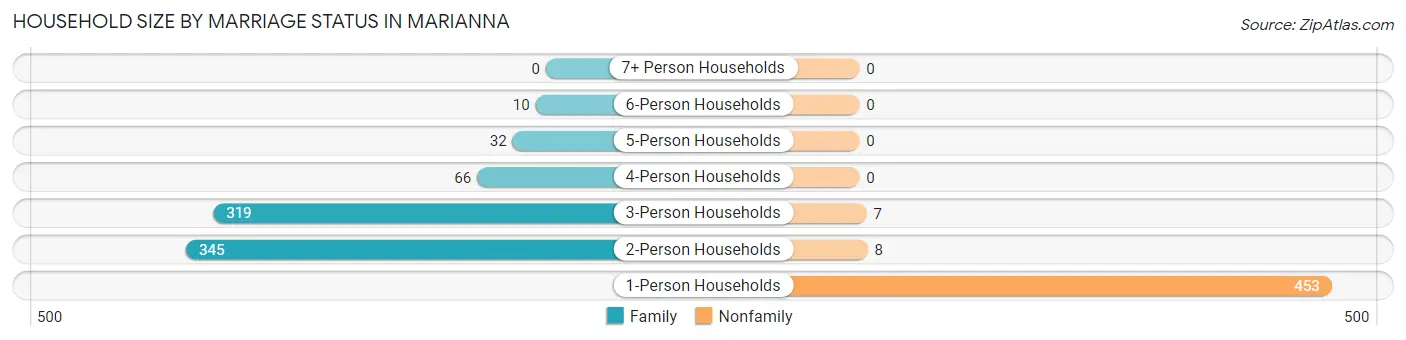
| Household Size | Family Households | Nonfamily Households |
| 1-Person Households | - | 453 (36.5%) |
| 2-Person Households | 345 (27.8%) | 8 (0.6%) |
| 3-Person Households | 319 (25.7%) | 7 (0.6%) |
| 4-Person Households | 66 (5.3%) | 0 (0.0%) |
| 5-Person Households | 32 (2.6%) | 0 (0.0%) |
| 6-Person Households | 10 (0.8%) | 0 (0.0%) |
| 7+ Person Households | 0 (0.0%) | 0 (0.0%) |
| Total | 772 (62.3%) | 468 (37.7%) |
Female Fertility in Marianna
Fertility by Age in Marianna
Average fertility rate in Marianna is 121.0 births per 1,000 women. Women in the age bracket of 20 to 34 years have the highest fertility rate with 298.0 births per 1,000 women. Women in the age bracket of 20 to 34 years acount for 58.7% of all women with births.
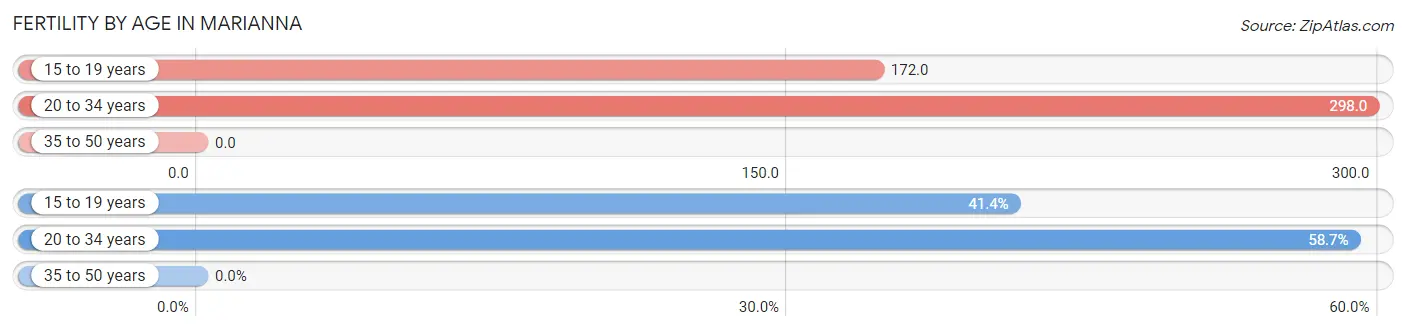
| Age Bracket | Women with Births | Births / 1,000 Women |
| 15 to 19 years | 43 (41.3%) | 172.0 |
| 20 to 34 years | 61 (58.7%) | 298.0 |
| 35 to 50 years | 0 (0.0%) | 0.0 |
| Total | 104 (100.0%) | 121.0 |
Fertility by Age by Marriage Status in Marianna
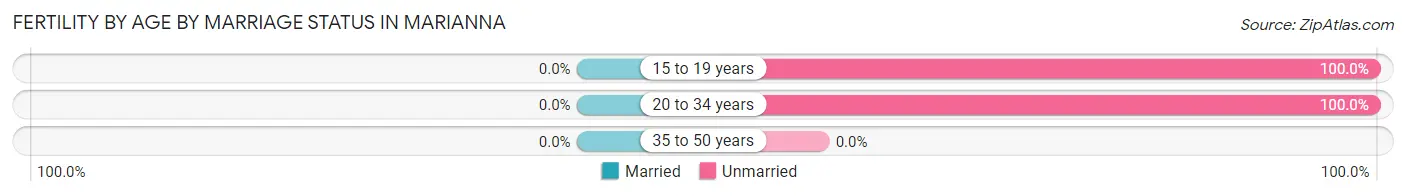
| Age Bracket | Married | Unmarried |
| 15 to 19 years | 0 (0.0%) | 43 (100.0%) |
| 20 to 34 years | 0 (0.0%) | 61 (100.0%) |
| 35 to 50 years | 0 (0.0%) | 0 (0.0%) |
| Total | 0 (0.0%) | 104 (100.0%) |
Fertility by Education in Marianna
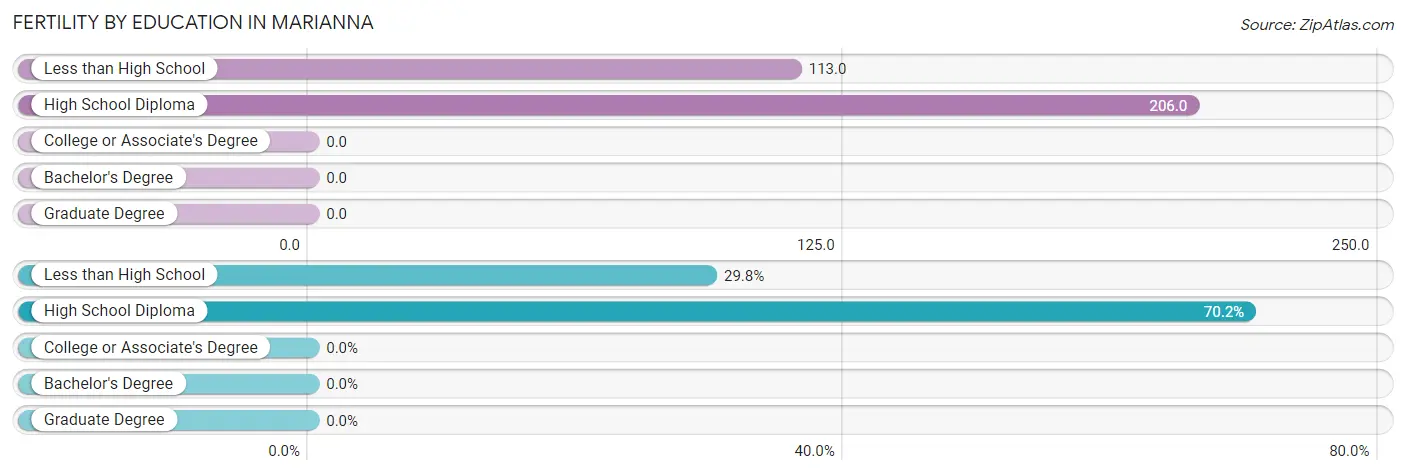
| Educational Attainment | Women with Births | Births / 1,000 Women |
| Less than High School | 31 (29.8%) | 113.0 |
| High School Diploma | 73 (70.2%) | 206.0 |
| College or Associate's Degree | 0 (0.0%) | 0.0 |
| Bachelor's Degree | 0 (0.0%) | 0.0 |
| Graduate Degree | 0 (0.0%) | 0.0 |
| Total | 104 (100.0%) | 121.0 |
Fertility by Education by Marriage Status in Marianna
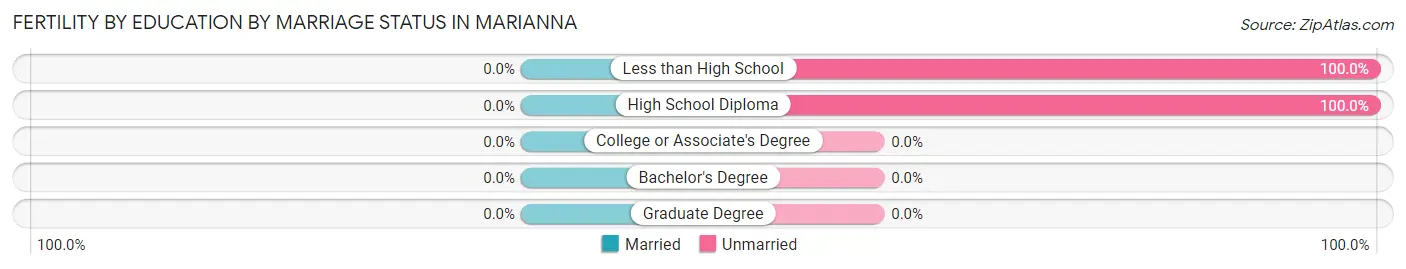
| Educational Attainment | Married | Unmarried |
| Less than High School | 0 (0.0%) | 31 (100.0%) |
| High School Diploma | 0 (0.0%) | 73 (100.0%) |
| College or Associate's Degree | 0 (0.0%) | 0 (0.0%) |
| Bachelor's Degree | 0 (0.0%) | 0 (0.0%) |
| Graduate Degree | 0 (0.0%) | 0 (0.0%) |
| Total | 0 (0.0%) | 104 (100.0%) |
Employment Characteristics in Marianna
Employment by Class of Employer in Marianna
Among the 1,050 employed individuals in Marianna, private company employees (599 | 57.1%), local government employees (116 | 11.1%), and state government employees (115 | 11.0%) make up the most common classes of employment.
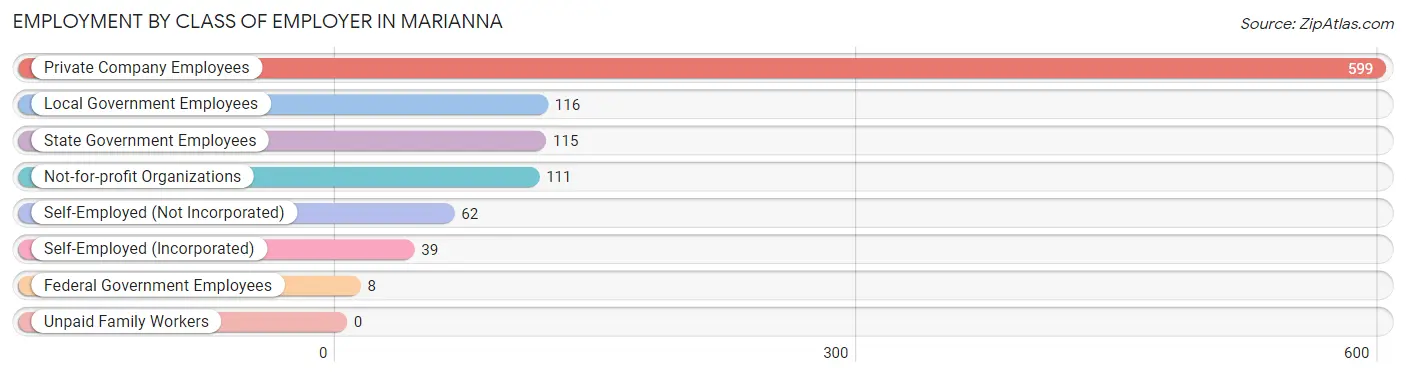
| Employer Class | # Employees | % Employees |
| Private Company Employees | 599 | 57.1% |
| Self-Employed (Incorporated) | 39 | 3.7% |
| Self-Employed (Not Incorporated) | 62 | 5.9% |
| Not-for-profit Organizations | 111 | 10.6% |
| Local Government Employees | 116 | 11.1% |
| State Government Employees | 115 | 11.0% |
| Federal Government Employees | 8 | 0.8% |
| Unpaid Family Workers | 0 | 0.0% |
| Total | 1,050 | 100.0% |
Employment Status by Age in Marianna
According to the labor force statistics for Marianna, out of the total population over 16 years of age (2,858), 46.5% or 1,329 individuals are in the labor force, with 21.1% or 280 of them unemployed. The age group with the highest labor force participation rate is 30 to 34 years, with 99.0% or 100 individuals in the labor force. Within the labor force, the 20 to 24 years age range has the highest percentage of unemployed individuals, with 47.0% or 87 of them being unemployed.
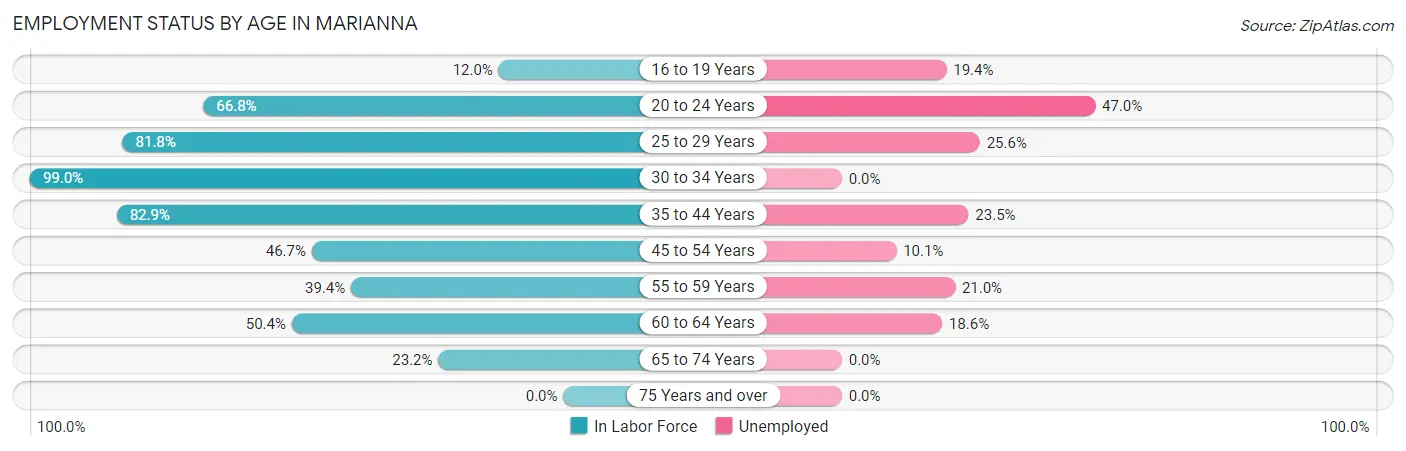
| Age Bracket | In Labor Force | Unemployed |
| 16 to 19 Years | 31 (12.0%) | 6 (19.4%) |
| 20 to 24 Years | 185 (66.8%) | 87 (47.0%) |
| 25 to 29 Years | 121 (81.8%) | 31 (25.6%) |
| 30 to 34 Years | 100 (99.0%) | 0 (0.0%) |
| 35 to 44 Years | 417 (82.9%) | 98 (23.5%) |
| 45 to 54 Years | 189 (46.7%) | 19 (10.1%) |
| 55 to 59 Years | 124 (39.4%) | 26 (21.0%) |
| 60 to 64 Years | 70 (50.4%) | 13 (18.6%) |
| 65 to 74 Years | 93 (23.2%) | 0 (0.0%) |
| 75 Years and over | 0 (0.0%) | 0 (0.0%) |
| Total | 1,329 (46.5%) | 280 (21.1%) |
Employment Status by Educational Attainment in Marianna
According to labor force statistics for Marianna, 63.4% of individuals (1,021) out of the total population between 25 and 64 years of age (1,611) are in the labor force, with 18.3% or 187 of them being unemployed. The group with the highest labor force participation rate are those with the educational attainment of college / associate degree, with 78.8% or 420 individuals in the labor force. Within the labor force, individuals with less than high school education have the highest percentage of unemployment, with 57.1% or 20 of them being unemployed.
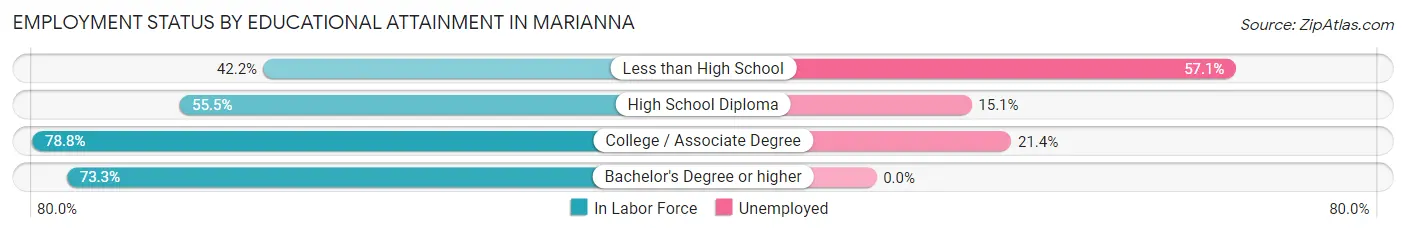
| Educational Attainment | In Labor Force | Unemployed |
| Less than High School | 35 (42.2%) | 47 (57.1%) |
| High School Diploma | 511 (55.5%) | 139 (15.1%) |
| College / Associate Degree | 420 (78.8%) | 114 (21.4%) |
| Bachelor's Degree or higher | 55 (73.3%) | 0 (0.0%) |
| Total | 1,021 (63.4%) | 295 (18.3%) |
Employment Occupations by Sex in Marianna
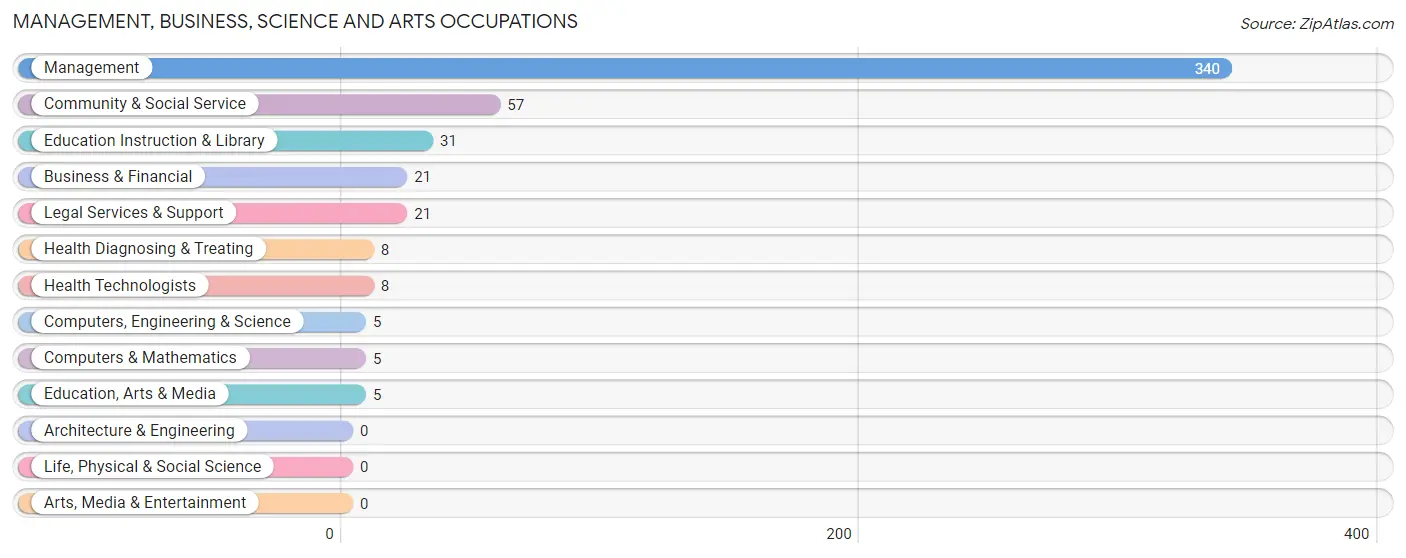
Management, Business, Science and Arts Occupations
The most common Management, Business, Science and Arts occupations in Marianna are Management (340 | 32.4%), Community & Social Service (57 | 5.4%), Education Instruction & Library (31 | 2.9%), Business & Financial (21 | 2.0%), and Legal Services & Support (21 | 2.0%).
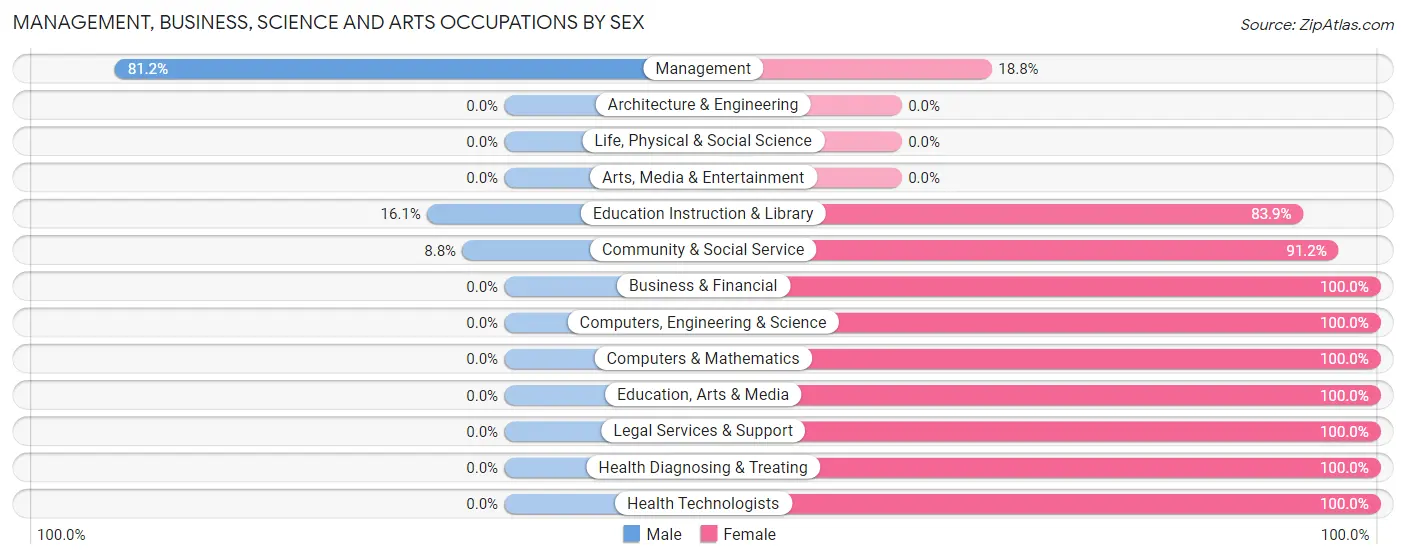
Management, Business, Science and Arts Occupations by Sex
Within the Management, Business, Science and Arts occupations in Marianna, the most male-oriented occupations are Management (81.2%), Education Instruction & Library (16.1%), and Community & Social Service (8.8%), while the most female-oriented occupations are Business & Financial (100.0%), Computers, Engineering & Science (100.0%), and Computers & Mathematics (100.0%).
| Occupation | Male | Female |
| Management | 276 (81.2%) | 64 (18.8%) |
| Business & Financial | 0 (0.0%) | 21 (100.0%) |
| Computers, Engineering & Science | 0 (0.0%) | 5 (100.0%) |
| Computers & Mathematics | 0 (0.0%) | 5 (100.0%) |
| Architecture & Engineering | 0 (0.0%) | 0 (0.0%) |
| Life, Physical & Social Science | 0 (0.0%) | 0 (0.0%) |
| Community & Social Service | 5 (8.8%) | 52 (91.2%) |
| Education, Arts & Media | 0 (0.0%) | 5 (100.0%) |
| Legal Services & Support | 0 (0.0%) | 21 (100.0%) |
| Education Instruction & Library | 5 (16.1%) | 26 (83.9%) |
| Arts, Media & Entertainment | 0 (0.0%) | 0 (0.0%) |
| Health Diagnosing & Treating | 0 (0.0%) | 8 (100.0%) |
| Health Technologists | 0 (0.0%) | 8 (100.0%) |
| Total (Category) | 281 (65.2%) | 150 (34.8%) |
| Total (Overall) | 648 (61.7%) | 402 (38.3%) |
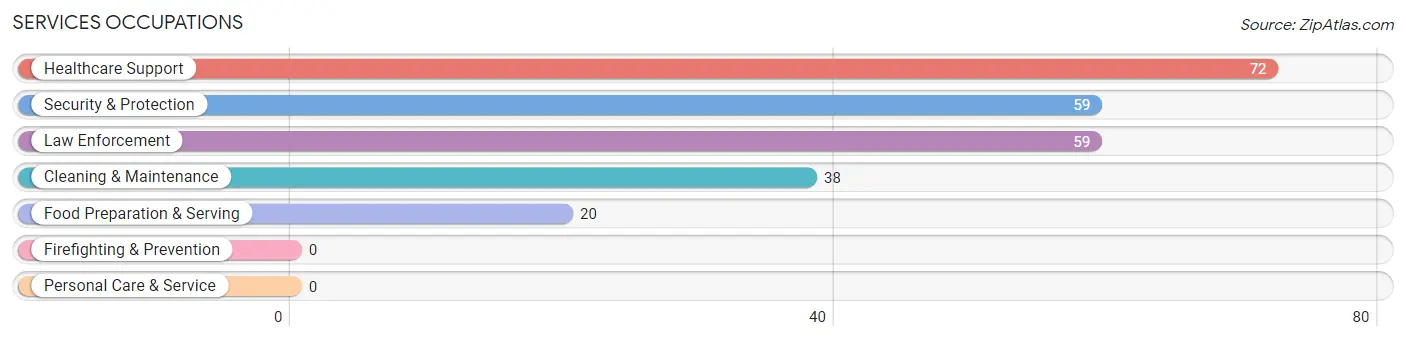
Services Occupations
The most common Services occupations in Marianna are Healthcare Support (72 | 6.9%), Security & Protection (59 | 5.6%), Law Enforcement (59 | 5.6%), Cleaning & Maintenance (38 | 3.6%), and Food Preparation & Serving (20 | 1.9%).
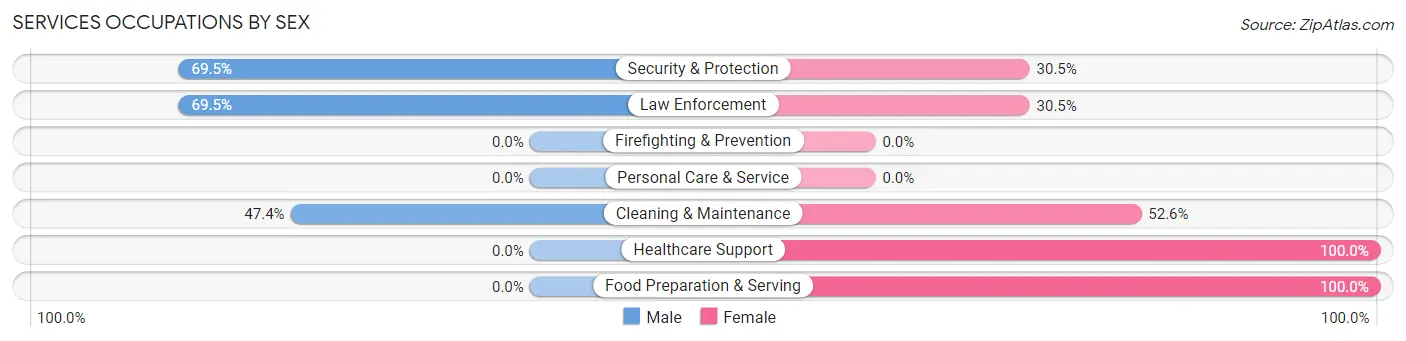
Services Occupations by Sex
Within the Services occupations in Marianna, the most male-oriented occupations are Security & Protection (69.5%), Law Enforcement (69.5%), and Cleaning & Maintenance (47.4%), while the most female-oriented occupations are Healthcare Support (100.0%), Food Preparation & Serving (100.0%), and Cleaning & Maintenance (52.6%).
| Occupation | Male | Female |
| Healthcare Support | 0 (0.0%) | 72 (100.0%) |
| Security & Protection | 41 (69.5%) | 18 (30.5%) |
| Firefighting & Prevention | 0 (0.0%) | 0 (0.0%) |
| Law Enforcement | 41 (69.5%) | 18 (30.5%) |
| Food Preparation & Serving | 0 (0.0%) | 20 (100.0%) |
| Cleaning & Maintenance | 18 (47.4%) | 20 (52.6%) |
| Personal Care & Service | 0 (0.0%) | 0 (0.0%) |
| Total (Category) | 59 (31.2%) | 130 (68.8%) |
| Total (Overall) | 648 (61.7%) | 402 (38.3%) |
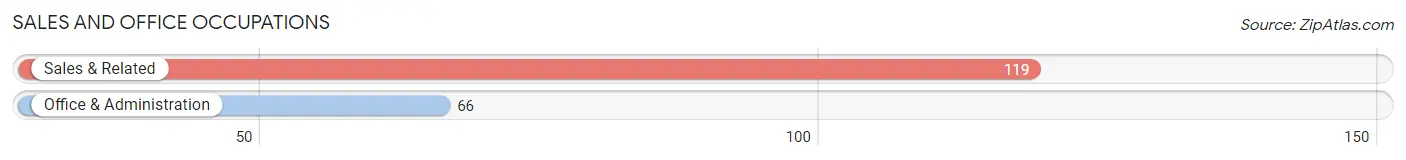
Sales and Office Occupations
The most common Sales and Office occupations in Marianna are Sales & Related (119 | 11.3%), and Office & Administration (66 | 6.3%).
Sales and Office Occupations by Sex
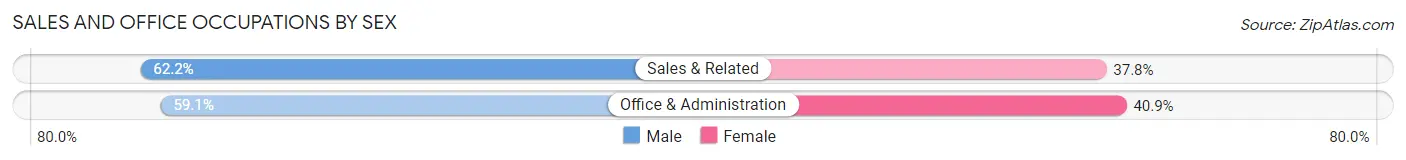
| Occupation | Male | Female |
| Sales & Related | 74 (62.2%) | 45 (37.8%) |
| Office & Administration | 39 (59.1%) | 27 (40.9%) |
| Total (Category) | 113 (61.1%) | 72 (38.9%) |
| Total (Overall) | 648 (61.7%) | 402 (38.3%) |
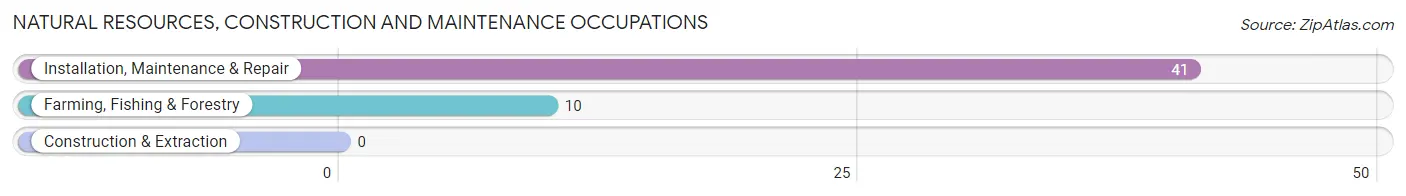
Natural Resources, Construction and Maintenance Occupations
The most common Natural Resources, Construction and Maintenance occupations in Marianna are Installation, Maintenance & Repair (41 | 3.9%), and Farming, Fishing & Forestry (10 | 0.9%).
Natural Resources, Construction and Maintenance Occupations by Sex
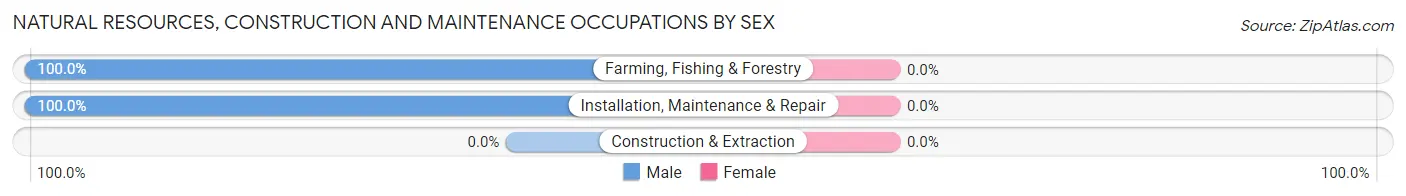
| Occupation | Male | Female |
| Farming, Fishing & Forestry | 10 (100.0%) | 0 (0.0%) |
| Construction & Extraction | 0 (0.0%) | 0 (0.0%) |
| Installation, Maintenance & Repair | 41 (100.0%) | 0 (0.0%) |
| Total (Category) | 51 (100.0%) | 0 (0.0%) |
| Total (Overall) | 648 (61.7%) | 402 (38.3%) |
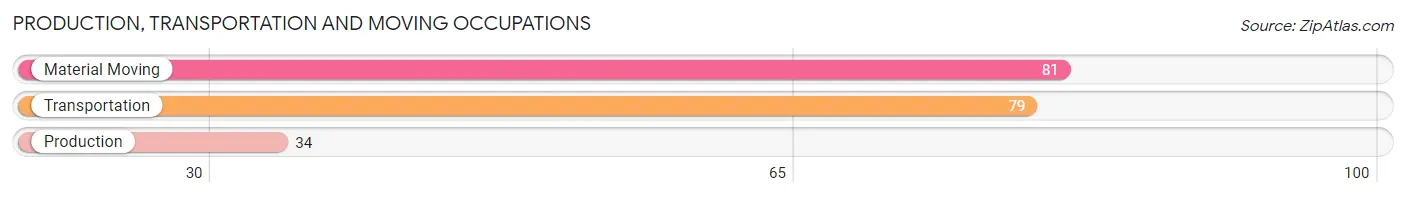
Production, Transportation and Moving Occupations
The most common Production, Transportation and Moving occupations in Marianna are Material Moving (81 | 7.7%), Transportation (79 | 7.5%), and Production (34 | 3.2%).
Production, Transportation and Moving Occupations by Sex
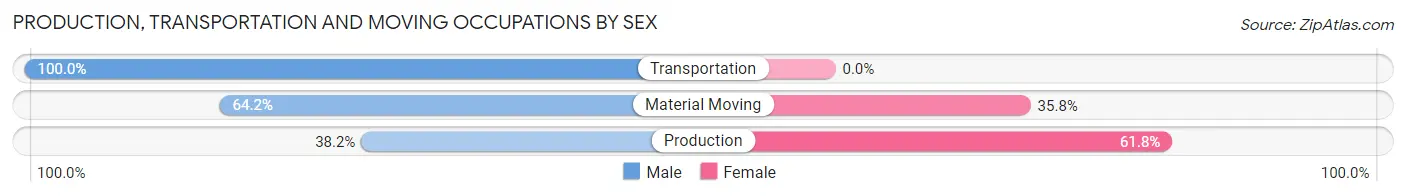
| Occupation | Male | Female |
| Production | 13 (38.2%) | 21 (61.8%) |
| Transportation | 79 (100.0%) | 0 (0.0%) |
| Material Moving | 52 (64.2%) | 29 (35.8%) |
| Total (Category) | 144 (74.2%) | 50 (25.8%) |
| Total (Overall) | 648 (61.7%) | 402 (38.3%) |
Employment Industries by Sex in Marianna
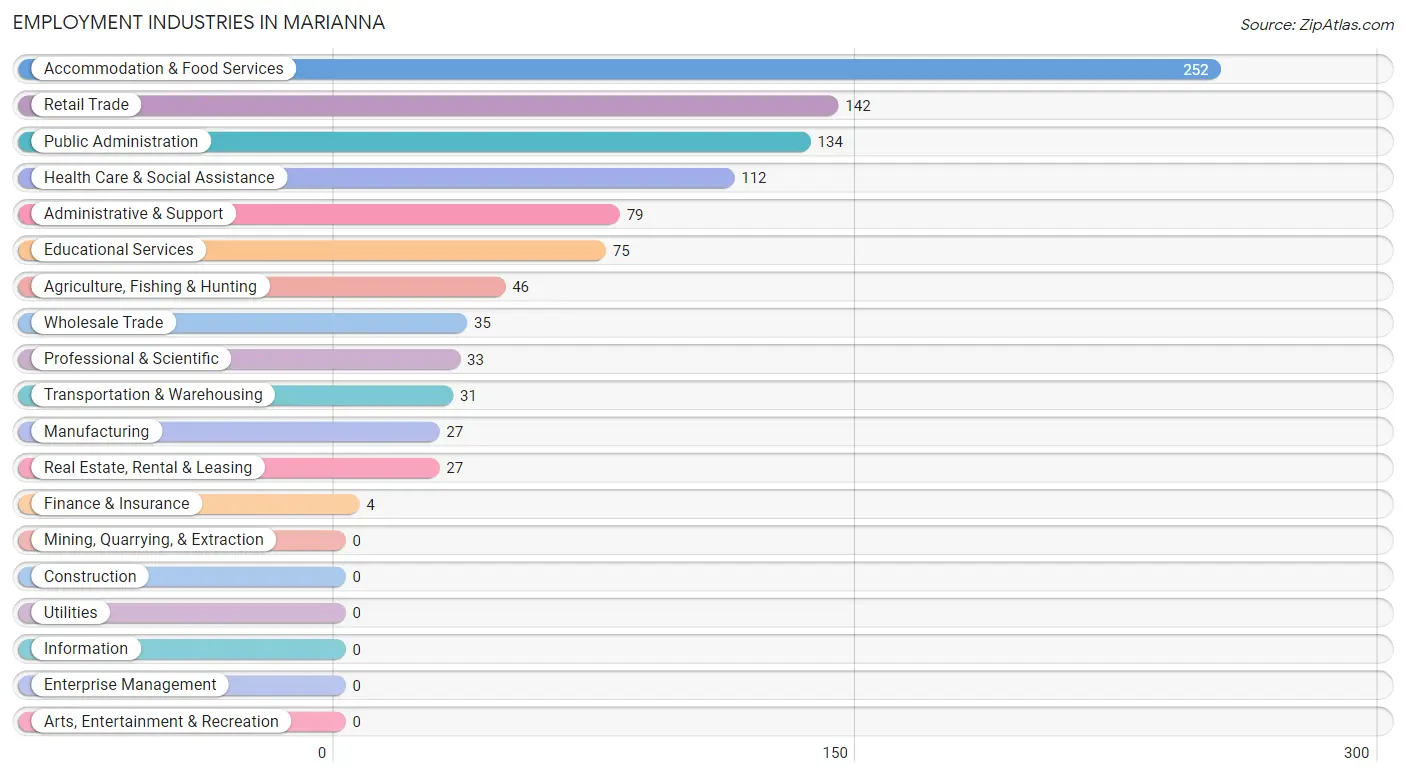
Employment Industries in Marianna
The major employment industries in Marianna include Accommodation & Food Services (252 | 24.0%), Retail Trade (142 | 13.5%), Public Administration (134 | 12.8%), Health Care & Social Assistance (112 | 10.7%), and Administrative & Support (79 | 7.5%).
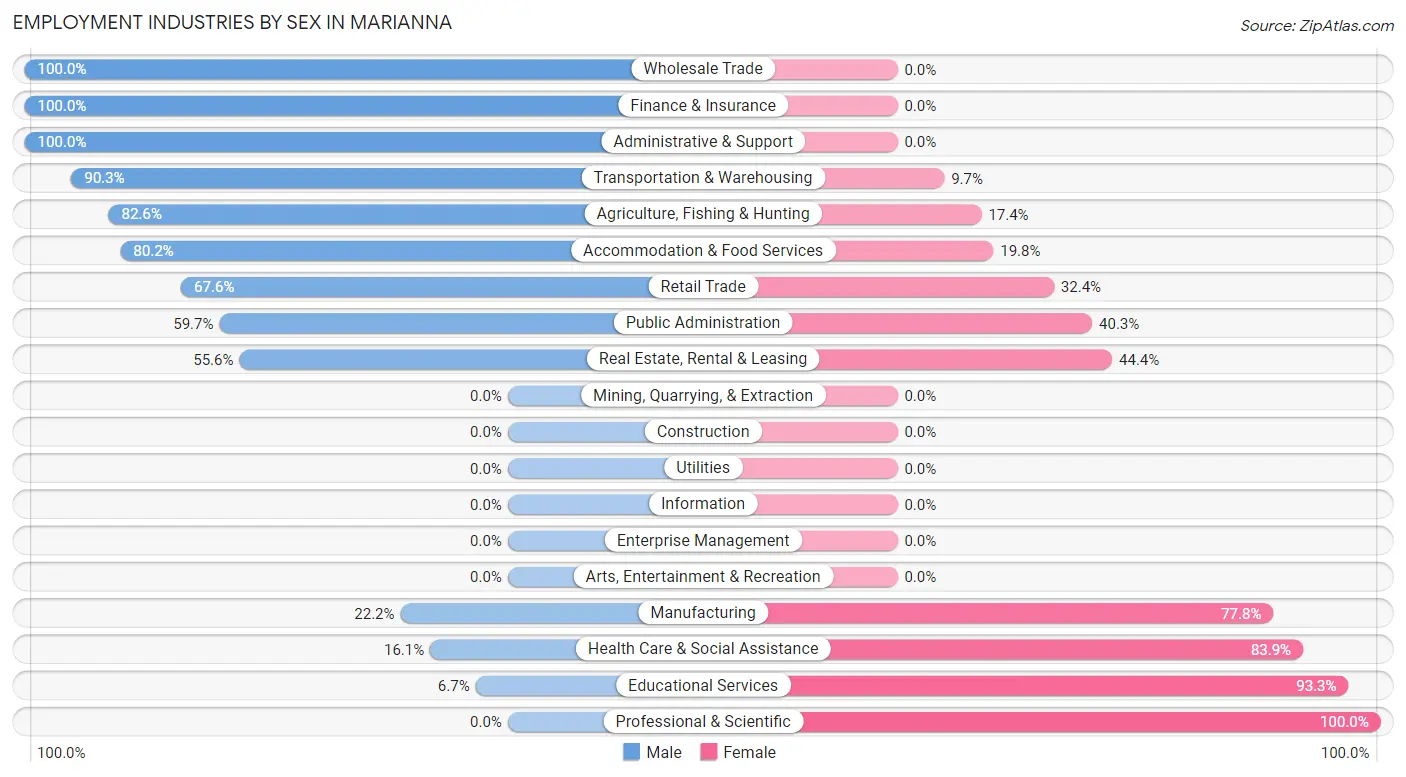
Employment Industries by Sex in Marianna
The Marianna industries that see more men than women are Wholesale Trade (100.0%), Finance & Insurance (100.0%), and Administrative & Support (100.0%), whereas the industries that tend to have a higher number of women are Professional & Scientific (100.0%), Educational Services (93.3%), and Health Care & Social Assistance (83.9%).
| Industry | Male | Female |
| Agriculture, Fishing & Hunting | 38 (82.6%) | 8 (17.4%) |
| Mining, Quarrying, & Extraction | 0 (0.0%) | 0 (0.0%) |
| Construction | 0 (0.0%) | 0 (0.0%) |
| Manufacturing | 6 (22.2%) | 21 (77.8%) |
| Wholesale Trade | 35 (100.0%) | 0 (0.0%) |
| Retail Trade | 96 (67.6%) | 46 (32.4%) |
| Transportation & Warehousing | 28 (90.3%) | 3 (9.7%) |
| Utilities | 0 (0.0%) | 0 (0.0%) |
| Information | 0 (0.0%) | 0 (0.0%) |
| Finance & Insurance | 4 (100.0%) | 0 (0.0%) |
| Real Estate, Rental & Leasing | 15 (55.6%) | 12 (44.4%) |
| Professional & Scientific | 0 (0.0%) | 33 (100.0%) |
| Enterprise Management | 0 (0.0%) | 0 (0.0%) |
| Administrative & Support | 79 (100.0%) | 0 (0.0%) |
| Educational Services | 5 (6.7%) | 70 (93.3%) |
| Health Care & Social Assistance | 18 (16.1%) | 94 (83.9%) |
| Arts, Entertainment & Recreation | 0 (0.0%) | 0 (0.0%) |
| Accommodation & Food Services | 202 (80.2%) | 50 (19.8%) |
| Public Administration | 80 (59.7%) | 54 (40.3%) |
| Total | 648 (61.7%) | 402 (38.3%) |
Education in Marianna
School Enrollment in Marianna
The most common levels of schooling among the 697 students in Marianna are high school (254 | 36.4%), middle school (186 | 26.7%), and elementary school (185 | 26.5%).
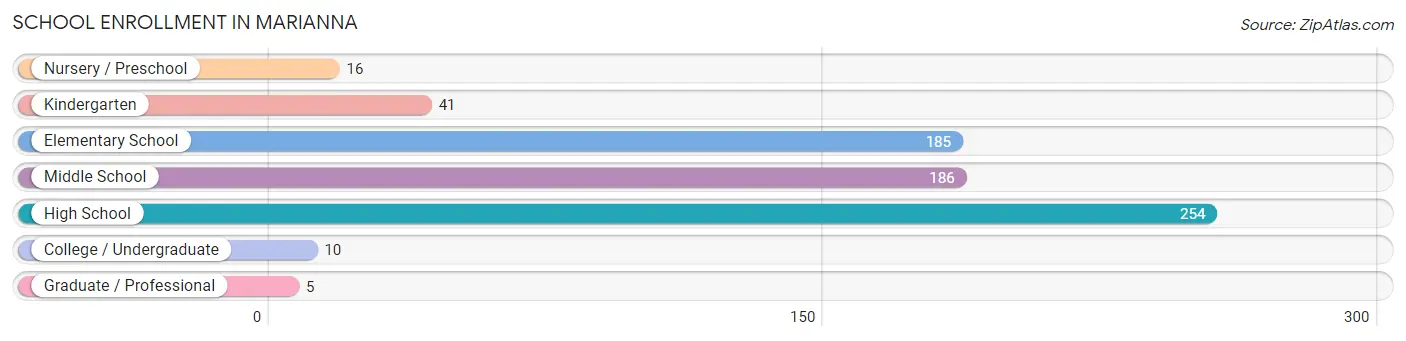
| School Level | # Students | % Students |
| Nursery / Preschool | 16 | 2.3% |
| Kindergarten | 41 | 5.9% |
| Elementary School | 185 | 26.5% |
| Middle School | 186 | 26.7% |
| High School | 254 | 36.4% |
| College / Undergraduate | 10 | 1.4% |
| Graduate / Professional | 5 | 0.7% |
| Total | 697 | 100.0% |
School Enrollment by Age by Funding Source in Marianna
Out of a total of 697 students who are enrolled in schools in Marianna, 2 (0.3%) attend a private institution, while the remaining 695 (99.7%) are enrolled in public schools. The age group of 15 to 17 year olds has the highest likelihood of being enrolled in private schools, with 2 (1.6% in the age bracket) enrolled. Conversely, the age group of 3 to 4 year olds has the lowest likelihood of being enrolled in a private school, with 16 (100.0% in the age bracket) attending a public institution.
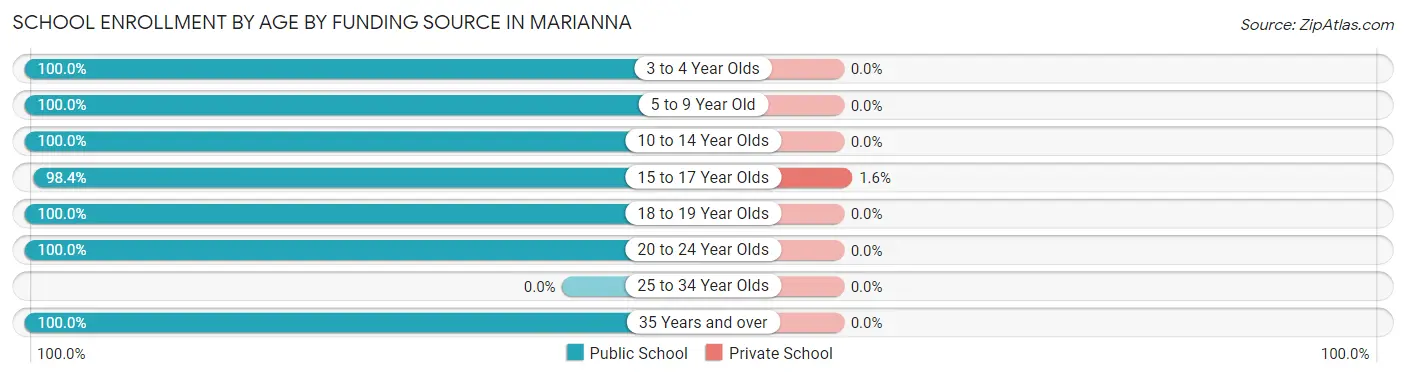
| Age Bracket | Public School | Private School |
| 3 to 4 Year Olds | 16 (100.0%) | 0 (0.0%) |
| 5 to 9 Year Old | 148 (100.0%) | 0 (0.0%) |
| 10 to 14 Year Olds | 279 (100.0%) | 0 (0.0%) |
| 15 to 17 Year Olds | 123 (98.4%) | 2 (1.6%) |
| 18 to 19 Year Olds | 108 (100.0%) | 0 (0.0%) |
| 20 to 24 Year Olds | 10 (100.0%) | 0 (0.0%) |
| 25 to 34 Year Olds | 0 (0.0%) | 0 (0.0%) |
| 35 Years and over | 11 (100.0%) | 0 (0.0%) |
| Total | 695 (99.7%) | 2 (0.3%) |
Educational Attainment by Field of Study in Marianna
Bio, nature & agricultural (24 | 21.2%), psychology (23 | 20.3%), business (20 | 17.7%), education (18 | 15.9%), and literature & languages (16 | 14.2%) are the most common fields of study among 113 individuals in Marianna who have obtained a bachelor's degree or higher.
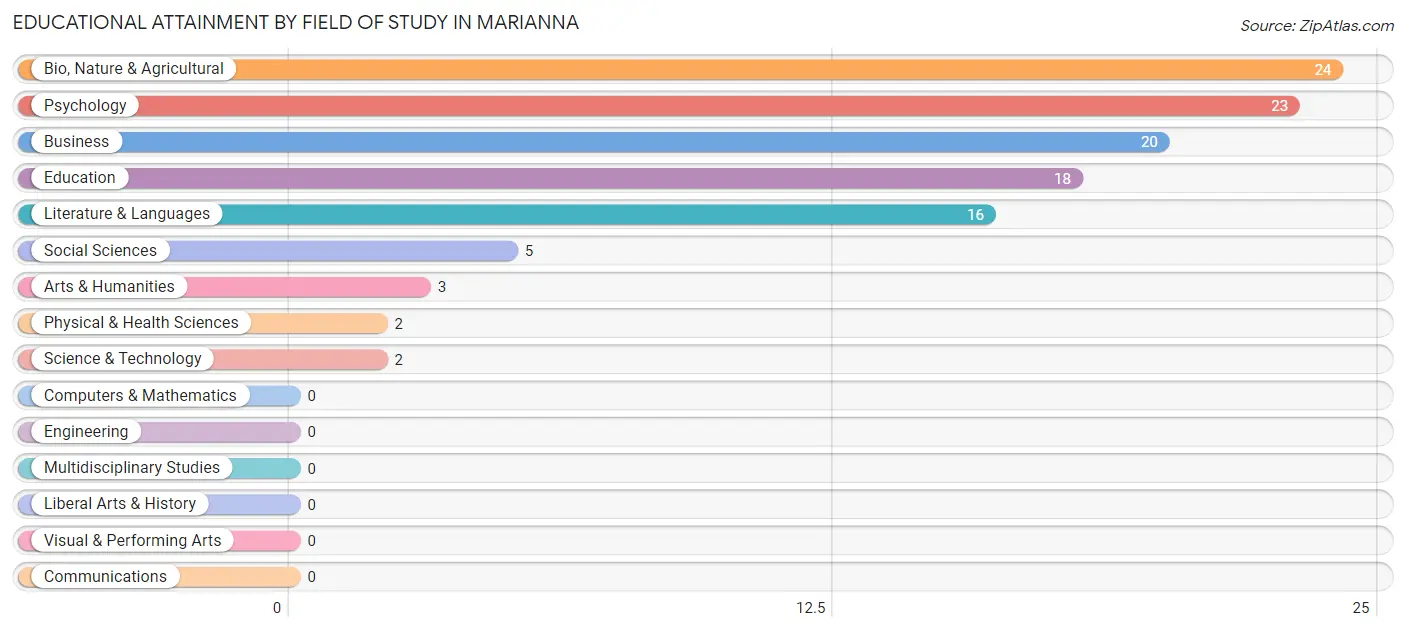
| Field of Study | # Graduates | % Graduates |
| Computers & Mathematics | 0 | 0.0% |
| Bio, Nature & Agricultural | 24 | 21.2% |
| Physical & Health Sciences | 2 | 1.8% |
| Psychology | 23 | 20.3% |
| Social Sciences | 5 | 4.4% |
| Engineering | 0 | 0.0% |
| Multidisciplinary Studies | 0 | 0.0% |
| Science & Technology | 2 | 1.8% |
| Business | 20 | 17.7% |
| Education | 18 | 15.9% |
| Literature & Languages | 16 | 14.2% |
| Liberal Arts & History | 0 | 0.0% |
| Visual & Performing Arts | 0 | 0.0% |
| Communications | 0 | 0.0% |
| Arts & Humanities | 3 | 2.6% |
| Total | 113 | 100.0% |
Transportation & Commute in Marianna
Vehicle Availability by Sex in Marianna
The most prevalent vehicle ownership categories in Marianna are males with 1 vehicle (281, accounting for 43.4%) and females with 1 vehicle (130, making up 69.9%).
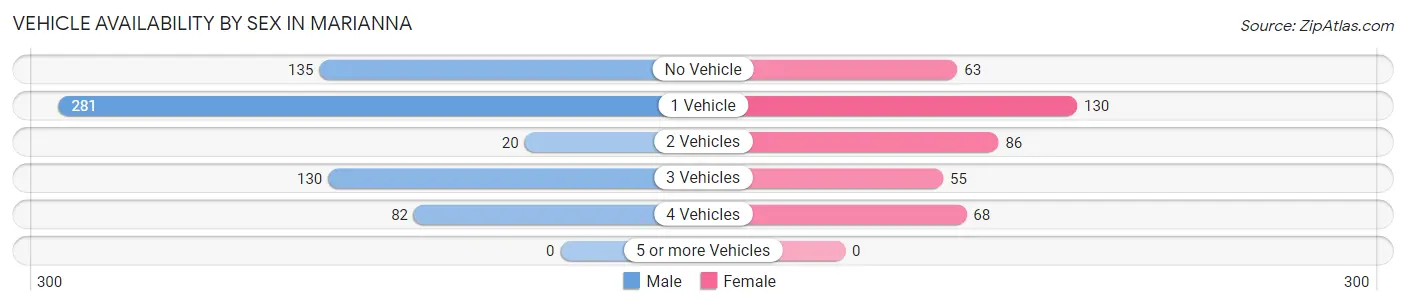
| Vehicles Available | Male | Female |
| No Vehicle | 135 (20.8%) | 63 (15.7%) |
| 1 Vehicle | 281 (43.4%) | 130 (32.3%) |
| 2 Vehicles | 20 (3.1%) | 86 (21.4%) |
| 3 Vehicles | 130 (20.1%) | 55 (13.7%) |
| 4 Vehicles | 82 (12.7%) | 68 (16.9%) |
| 5 or more Vehicles | 0 (0.0%) | 0 (0.0%) |
| Total | 648 (100.0%) | 402 (100.0%) |
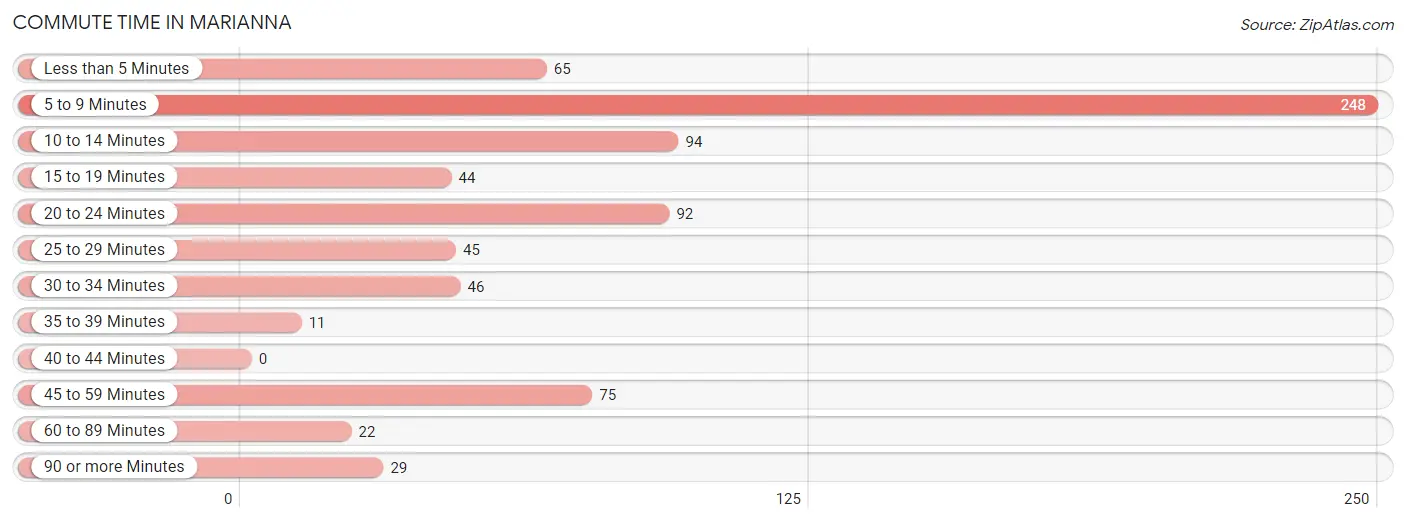
Commute Time in Marianna
The most frequently occuring commute durations in Marianna are 5 to 9 minutes (248 commuters, 32.2%), 10 to 14 minutes (94 commuters, 12.2%), and 20 to 24 minutes (92 commuters, 11.9%).
| Commute Time | # Commuters | % Commuters |
| Less than 5 Minutes | 65 | 8.4% |
| 5 to 9 Minutes | 248 | 32.2% |
| 10 to 14 Minutes | 94 | 12.2% |
| 15 to 19 Minutes | 44 | 5.7% |
| 20 to 24 Minutes | 92 | 11.9% |
| 25 to 29 Minutes | 45 | 5.8% |
| 30 to 34 Minutes | 46 | 6.0% |
| 35 to 39 Minutes | 11 | 1.4% |
| 40 to 44 Minutes | 0 | 0.0% |
| 45 to 59 Minutes | 75 | 9.7% |
| 60 to 89 Minutes | 22 | 2.9% |
| 90 or more Minutes | 29 | 3.8% |
Commute Time by Sex in Marianna
The most common commute times in Marianna are 5 to 9 minutes (192 commuters, 46.5%) for males and 45 to 59 minutes (75 commuters, 20.9%) for females.
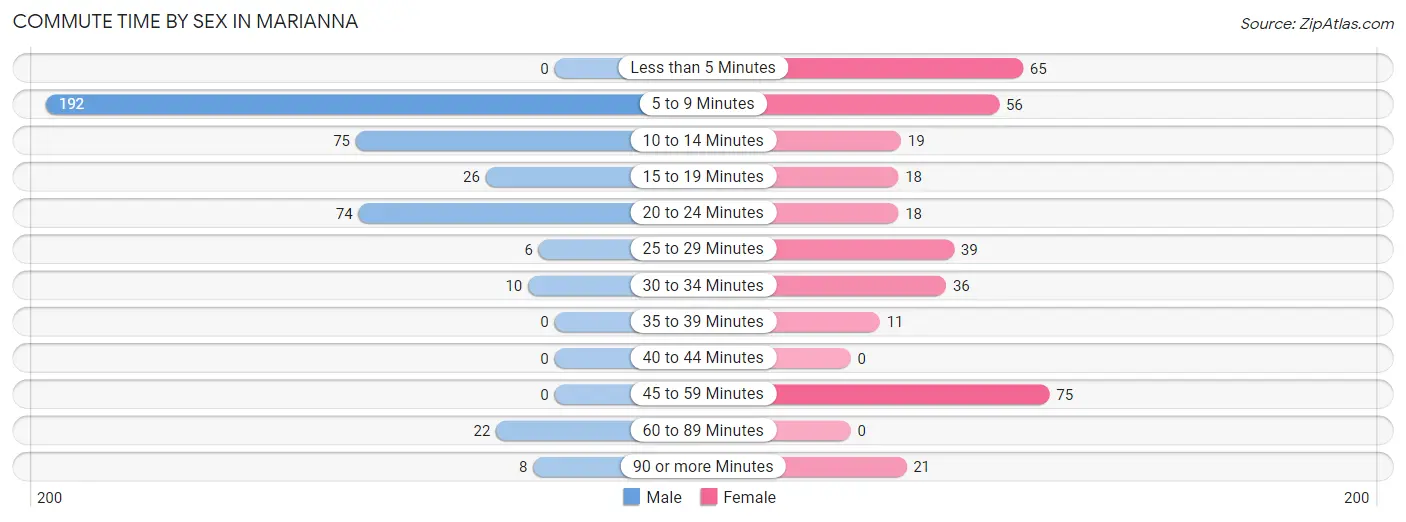
| Commute Time | Male | Female |
| Less than 5 Minutes | 0 (0.0%) | 65 (18.2%) |
| 5 to 9 Minutes | 192 (46.5%) | 56 (15.6%) |
| 10 to 14 Minutes | 75 (18.2%) | 19 (5.3%) |
| 15 to 19 Minutes | 26 (6.3%) | 18 (5.0%) |
| 20 to 24 Minutes | 74 (17.9%) | 18 (5.0%) |
| 25 to 29 Minutes | 6 (1.5%) | 39 (10.9%) |
| 30 to 34 Minutes | 10 (2.4%) | 36 (10.1%) |
| 35 to 39 Minutes | 0 (0.0%) | 11 (3.1%) |
| 40 to 44 Minutes | 0 (0.0%) | 0 (0.0%) |
| 45 to 59 Minutes | 0 (0.0%) | 75 (20.9%) |
| 60 to 89 Minutes | 22 (5.3%) | 0 (0.0%) |
| 90 or more Minutes | 8 (1.9%) | 21 (5.9%) |
Time of Departure to Work by Sex in Marianna
The most frequent times of departure to work in Marianna are 6:30 AM to 6:59 AM (156, 37.8%) for males and 8:00 AM to 8:29 AM (116, 32.4%) for females.
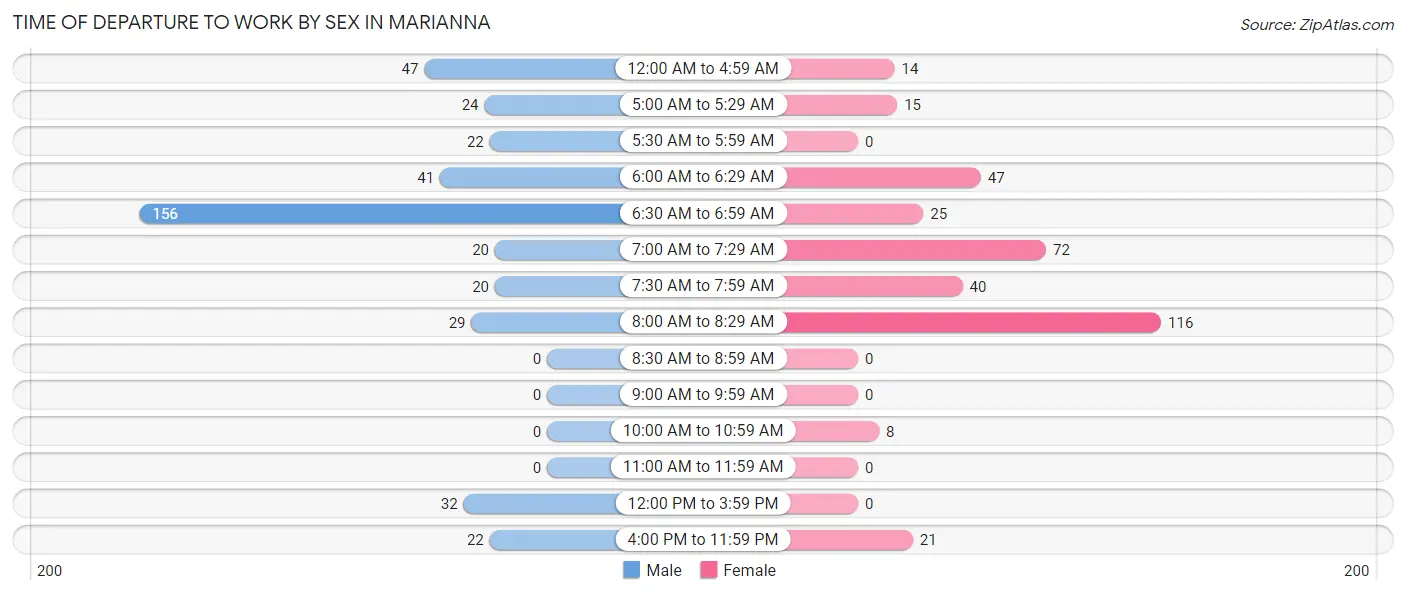
| Time of Departure | Male | Female |
| 12:00 AM to 4:59 AM | 47 (11.4%) | 14 (3.9%) |
| 5:00 AM to 5:29 AM | 24 (5.8%) | 15 (4.2%) |
| 5:30 AM to 5:59 AM | 22 (5.3%) | 0 (0.0%) |
| 6:00 AM to 6:29 AM | 41 (9.9%) | 47 (13.1%) |
| 6:30 AM to 6:59 AM | 156 (37.8%) | 25 (7.0%) |
| 7:00 AM to 7:29 AM | 20 (4.8%) | 72 (20.1%) |
| 7:30 AM to 7:59 AM | 20 (4.8%) | 40 (11.2%) |
| 8:00 AM to 8:29 AM | 29 (7.0%) | 116 (32.4%) |
| 8:30 AM to 8:59 AM | 0 (0.0%) | 0 (0.0%) |
| 9:00 AM to 9:59 AM | 0 (0.0%) | 0 (0.0%) |
| 10:00 AM to 10:59 AM | 0 (0.0%) | 8 (2.2%) |
| 11:00 AM to 11:59 AM | 0 (0.0%) | 0 (0.0%) |
| 12:00 PM to 3:59 PM | 32 (7.7%) | 0 (0.0%) |
| 4:00 PM to 11:59 PM | 22 (5.3%) | 21 (5.9%) |
| Total | 413 (100.0%) | 358 (100.0%) |
Housing Occupancy in Marianna
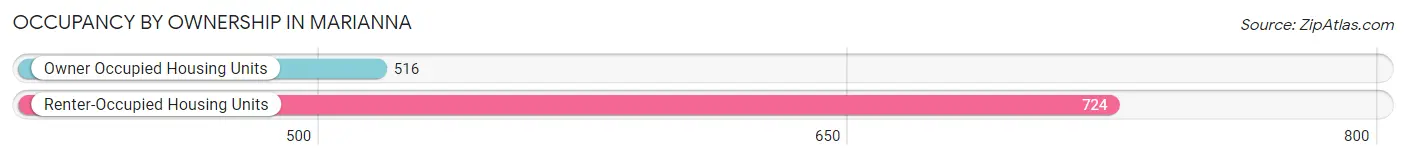
Occupancy by Ownership in Marianna
Of the total 1,240 dwellings in Marianna, owner-occupied units account for 516 (41.6%), while renter-occupied units make up 724 (58.4%).
| Occupancy | # Housing Units | % Housing Units |
| Owner Occupied Housing Units | 516 | 41.6% |
| Renter-Occupied Housing Units | 724 | 58.4% |
| Total Occupied Housing Units | 1,240 | 100.0% |
Occupancy by Household Size in Marianna
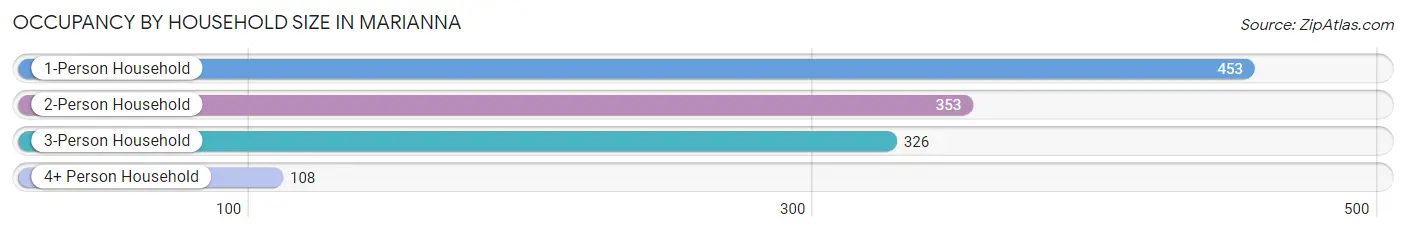
| Household Size | # Housing Units | % Housing Units |
| 1-Person Household | 453 | 36.5% |
| 2-Person Household | 353 | 28.5% |
| 3-Person Household | 326 | 26.3% |
| 4+ Person Household | 108 | 8.7% |
| Total Housing Units | 1,240 | 100.0% |
Occupancy by Ownership by Household Size in Marianna
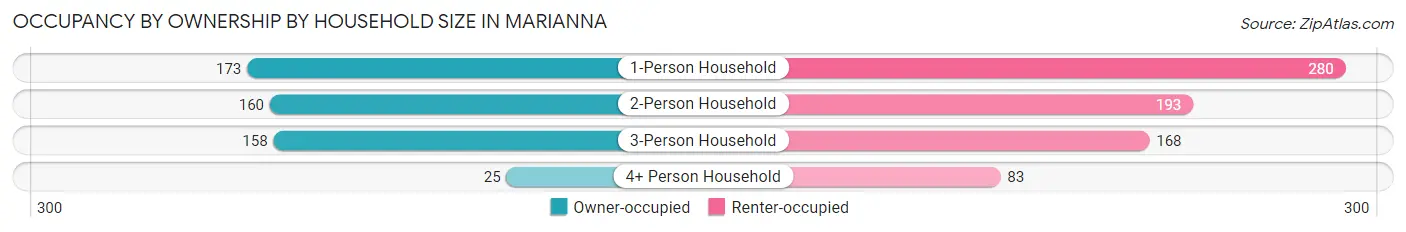
| Household Size | Owner-occupied | Renter-occupied |
| 1-Person Household | 173 (38.2%) | 280 (61.8%) |
| 2-Person Household | 160 (45.3%) | 193 (54.7%) |
| 3-Person Household | 158 (48.5%) | 168 (51.5%) |
| 4+ Person Household | 25 (23.2%) | 83 (76.8%) |
| Total Housing Units | 516 (41.6%) | 724 (58.4%) |
Occupancy by Educational Attainment in Marianna
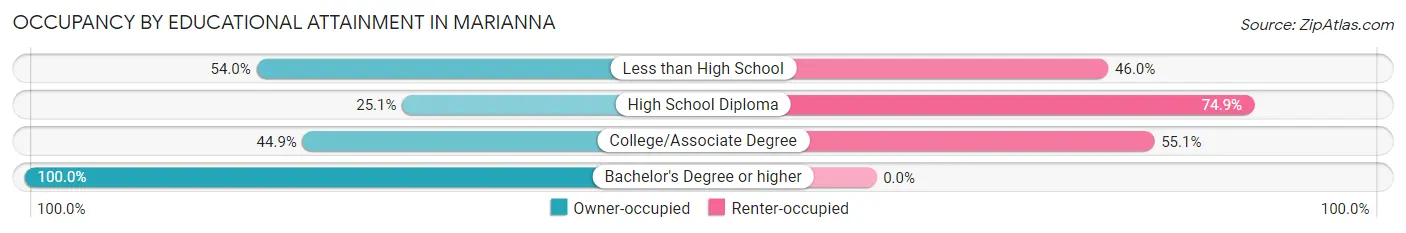
| Household Size | Owner-occupied | Renter-occupied |
| Less than High School | 128 (54.0%) | 109 (46.0%) |
| High School Diploma | 109 (25.1%) | 325 (74.9%) |
| College/Associate Degree | 236 (44.9%) | 290 (55.1%) |
| Bachelor's Degree or higher | 43 (100.0%) | 0 (0.0%) |
Occupancy by Age of Householder in Marianna
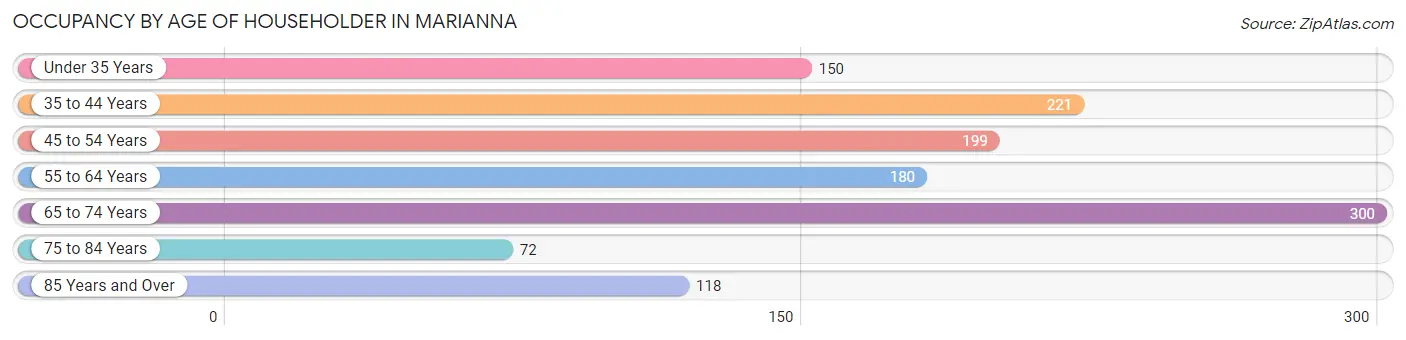
| Age Bracket | # Households | % Households |
| Under 35 Years | 150 | 12.1% |
| 35 to 44 Years | 221 | 17.8% |
| 45 to 54 Years | 199 | 16.1% |
| 55 to 64 Years | 180 | 14.5% |
| 65 to 74 Years | 300 | 24.2% |
| 75 to 84 Years | 72 | 5.8% |
| 85 Years and Over | 118 | 9.5% |
| Total | 1,240 | 100.0% |
Housing Finances in Marianna
Median Income by Occupancy in Marianna
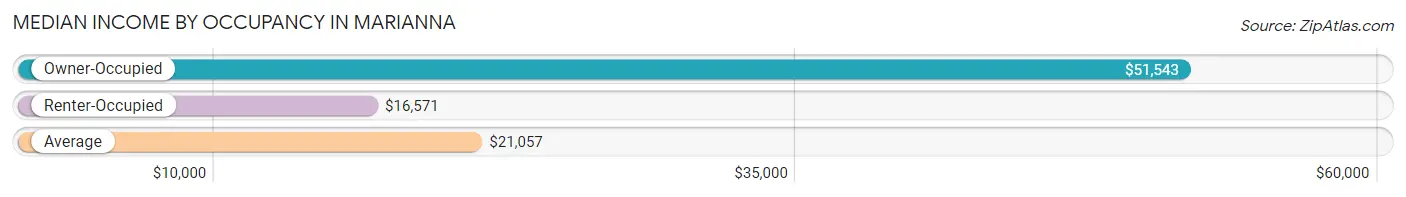
| Occupancy Type | # Households | Median Income |
| Owner-Occupied | 516 (41.6%) | $51,543 |
| Renter-Occupied | 724 (58.4%) | $16,571 |
| Average | 1,240 (100.0%) | $21,057 |
Occupancy by Householder Income Bracket in Marianna
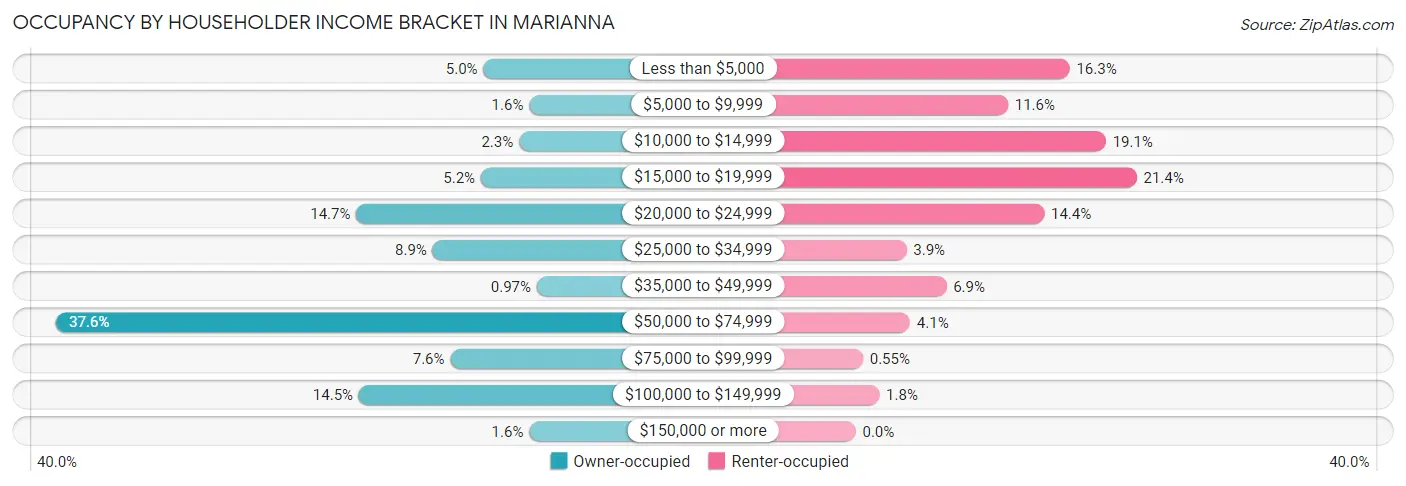
| Income Bracket | Owner-occupied | Renter-occupied |
| Less than $5,000 | 26 (5.0%) | 118 (16.3%) |
| $5,000 to $9,999 | 8 (1.5%) | 84 (11.6%) |
| $10,000 to $14,999 | 12 (2.3%) | 138 (19.1%) |
| $15,000 to $19,999 | 27 (5.2%) | 155 (21.4%) |
| $20,000 to $24,999 | 76 (14.7%) | 104 (14.4%) |
| $25,000 to $34,999 | 46 (8.9%) | 28 (3.9%) |
| $35,000 to $49,999 | 5 (1.0%) | 50 (6.9%) |
| $50,000 to $74,999 | 194 (37.6%) | 30 (4.1%) |
| $75,000 to $99,999 | 39 (7.6%) | 4 (0.5%) |
| $100,000 to $149,999 | 75 (14.5%) | 13 (1.8%) |
| $150,000 or more | 8 (1.5%) | 0 (0.0%) |
| Total | 516 (100.0%) | 724 (100.0%) |
Monthly Housing Cost Tiers in Marianna
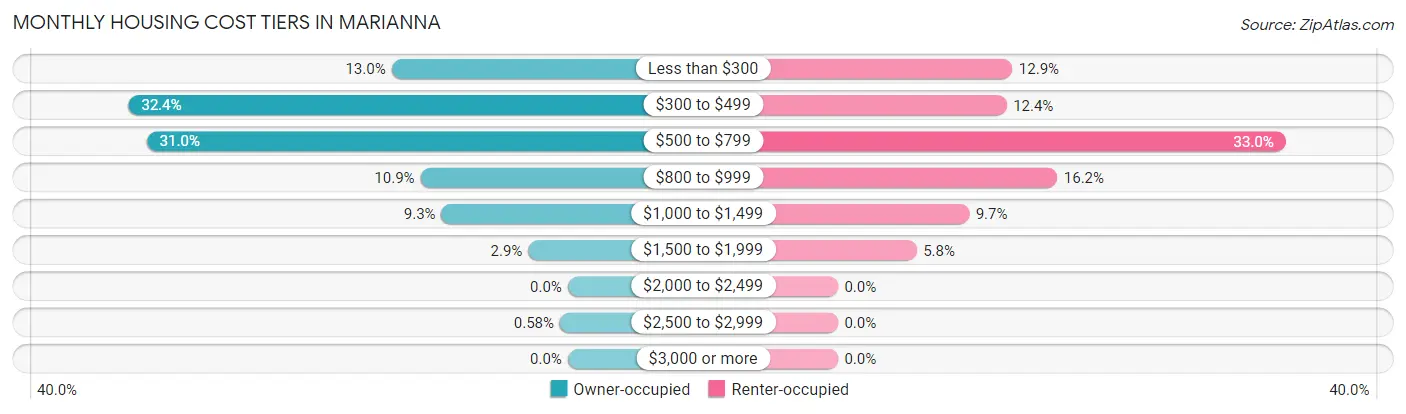
| Monthly Cost | Owner-occupied | Renter-occupied |
| Less than $300 | 67 (13.0%) | 93 (12.9%) |
| $300 to $499 | 167 (32.4%) | 90 (12.4%) |
| $500 to $799 | 160 (31.0%) | 239 (33.0%) |
| $800 to $999 | 56 (10.8%) | 117 (16.2%) |
| $1,000 to $1,499 | 48 (9.3%) | 70 (9.7%) |
| $1,500 to $1,999 | 15 (2.9%) | 42 (5.8%) |
| $2,000 to $2,499 | 0 (0.0%) | 0 (0.0%) |
| $2,500 to $2,999 | 3 (0.6%) | 0 (0.0%) |
| $3,000 or more | 0 (0.0%) | 0 (0.0%) |
| Total | 516 (100.0%) | 724 (100.0%) |
Physical Housing Characteristics in Marianna
Housing Structures in Marianna
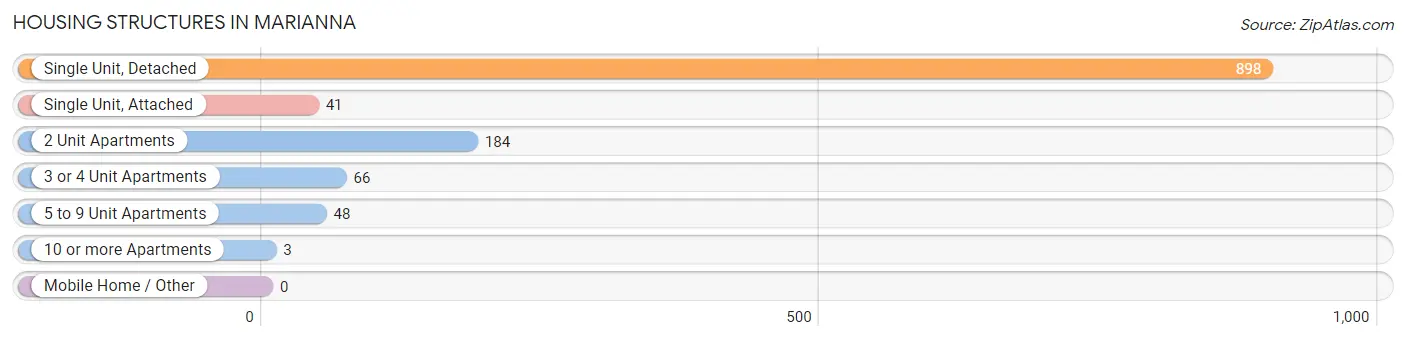
| Structure Type | # Housing Units | % Housing Units |
| Single Unit, Detached | 898 | 72.4% |
| Single Unit, Attached | 41 | 3.3% |
| 2 Unit Apartments | 184 | 14.8% |
| 3 or 4 Unit Apartments | 66 | 5.3% |
| 5 to 9 Unit Apartments | 48 | 3.9% |
| 10 or more Apartments | 3 | 0.2% |
| Mobile Home / Other | 0 | 0.0% |
| Total | 1,240 | 100.0% |
Housing Structures by Occupancy in Marianna
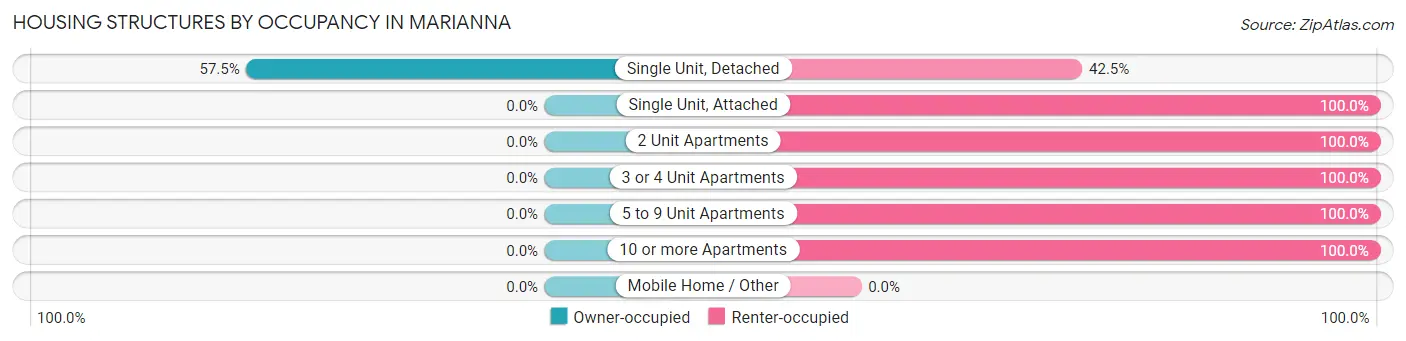
| Structure Type | Owner-occupied | Renter-occupied |
| Single Unit, Detached | 516 (57.5%) | 382 (42.5%) |
| Single Unit, Attached | 0 (0.0%) | 41 (100.0%) |
| 2 Unit Apartments | 0 (0.0%) | 184 (100.0%) |
| 3 or 4 Unit Apartments | 0 (0.0%) | 66 (100.0%) |
| 5 to 9 Unit Apartments | 0 (0.0%) | 48 (100.0%) |
| 10 or more Apartments | 0 (0.0%) | 3 (100.0%) |
| Mobile Home / Other | 0 (0.0%) | 0 (0.0%) |
| Total | 516 (41.6%) | 724 (58.4%) |
Housing Structures by Number of Rooms in Marianna
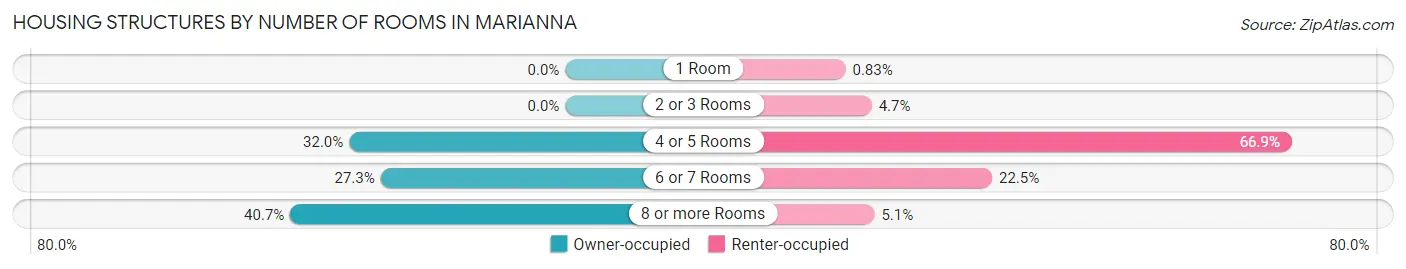
| Number of Rooms | Owner-occupied | Renter-occupied |
| 1 Room | 0 (0.0%) | 6 (0.8%) |
| 2 or 3 Rooms | 0 (0.0%) | 34 (4.7%) |
| 4 or 5 Rooms | 165 (32.0%) | 484 (66.8%) |
| 6 or 7 Rooms | 141 (27.3%) | 163 (22.5%) |
| 8 or more Rooms | 210 (40.7%) | 37 (5.1%) |
| Total | 516 (100.0%) | 724 (100.0%) |
Housing Structure by Heating Type in Marianna
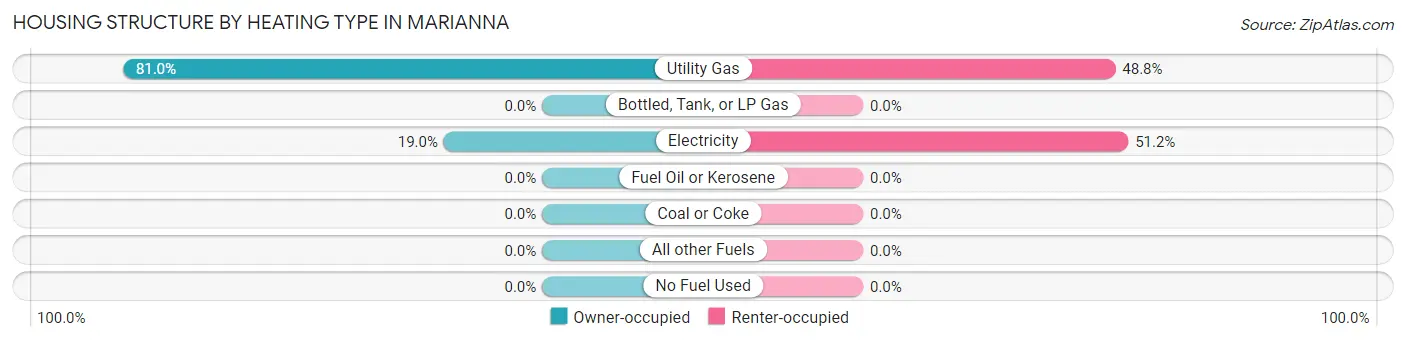
| Heating Type | Owner-occupied | Renter-occupied |
| Utility Gas | 418 (81.0%) | 353 (48.8%) |
| Bottled, Tank, or LP Gas | 0 (0.0%) | 0 (0.0%) |
| Electricity | 98 (19.0%) | 371 (51.2%) |
| Fuel Oil or Kerosene | 0 (0.0%) | 0 (0.0%) |
| Coal or Coke | 0 (0.0%) | 0 (0.0%) |
| All other Fuels | 0 (0.0%) | 0 (0.0%) |
| No Fuel Used | 0 (0.0%) | 0 (0.0%) |
| Total | 516 (100.0%) | 724 (100.0%) |
Household Vehicle Usage in Marianna
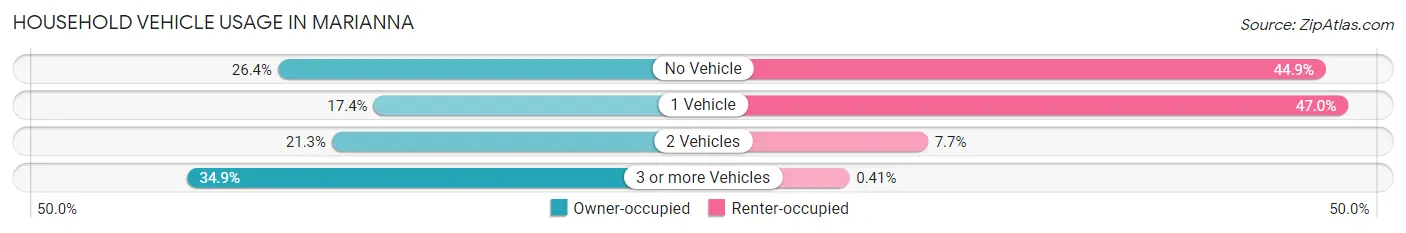
| Vehicles per Household | Owner-occupied | Renter-occupied |
| No Vehicle | 136 (26.4%) | 325 (44.9%) |
| 1 Vehicle | 90 (17.4%) | 340 (47.0%) |
| 2 Vehicles | 110 (21.3%) | 56 (7.7%) |
| 3 or more Vehicles | 180 (34.9%) | 3 (0.4%) |
| Total | 516 (100.0%) | 724 (100.0%) |
Real Estate & Mortgages in Marianna
Real Estate and Mortgage Overview in Marianna
| Characteristic | Without Mortgage | With Mortgage |
| Housing Units | 377 | 139 |
| Median Property Value | $78,800 | $0 |
| Median Household Income | $50,866 | $0 |
| Monthly Housing Costs | $464 | $0 |
| Real Estate Taxes | $572 | $0 |
Property Value by Mortgage Status in Marianna
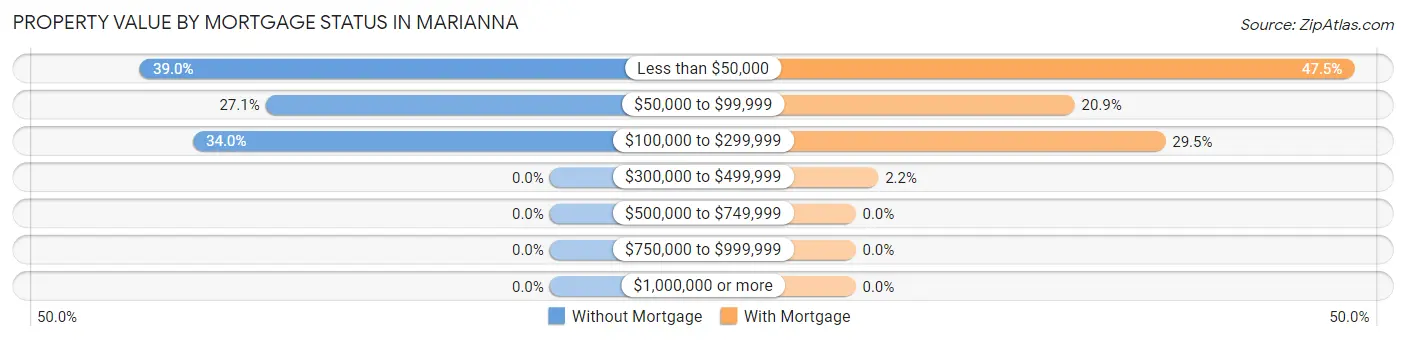
| Property Value | Without Mortgage | With Mortgage |
| Less than $50,000 | 147 (39.0%) | 66 (47.5%) |
| $50,000 to $99,999 | 102 (27.1%) | 29 (20.9%) |
| $100,000 to $299,999 | 128 (34.0%) | 41 (29.5%) |
| $300,000 to $499,999 | 0 (0.0%) | 3 (2.2%) |
| $500,000 to $749,999 | 0 (0.0%) | 0 (0.0%) |
| $750,000 to $999,999 | 0 (0.0%) | 0 (0.0%) |
| $1,000,000 or more | 0 (0.0%) | 0 (0.0%) |
| Total | 377 (100.0%) | 139 (100.0%) |
Household Income by Mortgage Status in Marianna
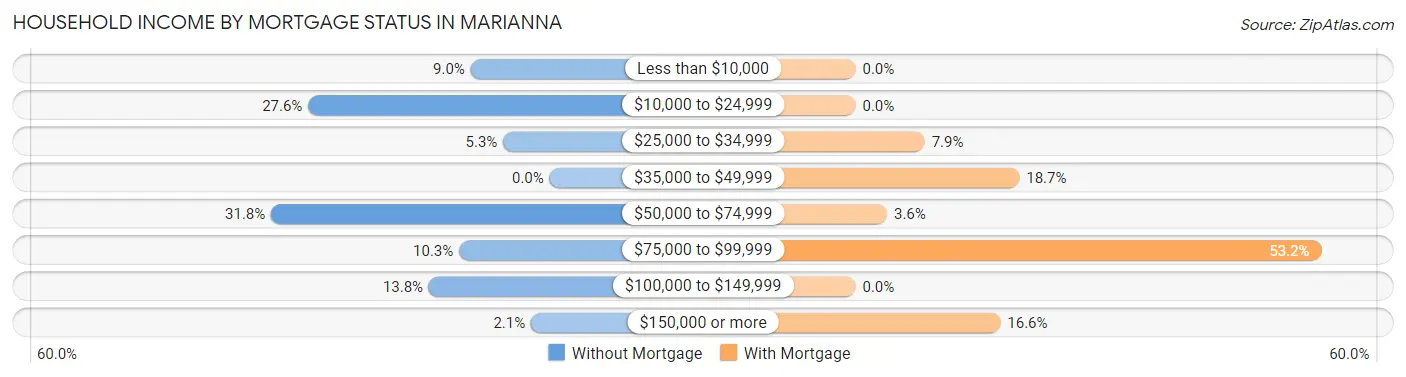
| Household Income | Without Mortgage | With Mortgage |
| Less than $10,000 | 34 (9.0%) | 0 (0.0%) |
| $10,000 to $24,999 | 104 (27.6%) | 0 (0.0%) |
| $25,000 to $34,999 | 20 (5.3%) | 11 (7.9%) |
| $35,000 to $49,999 | 0 (0.0%) | 26 (18.7%) |
| $50,000 to $74,999 | 120 (31.8%) | 5 (3.6%) |
| $75,000 to $99,999 | 39 (10.3%) | 74 (53.2%) |
| $100,000 to $149,999 | 52 (13.8%) | 0 (0.0%) |
| $150,000 or more | 8 (2.1%) | 23 (16.6%) |
| Total | 377 (100.0%) | 139 (100.0%) |
Property Value to Household Income Ratio in Marianna
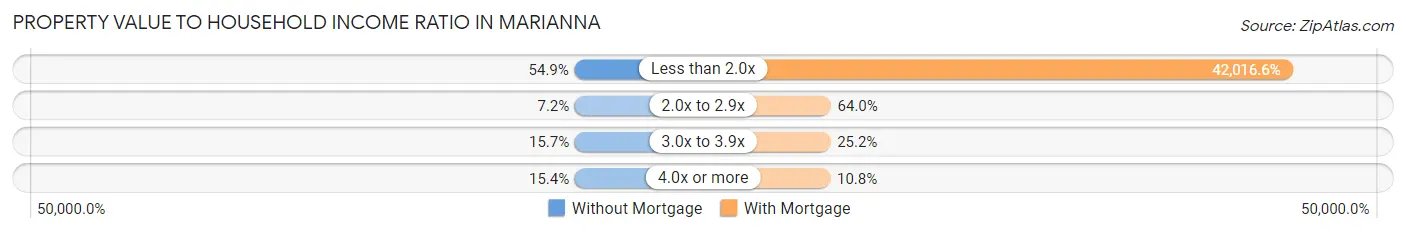
| Value-to-Income Ratio | Without Mortgage | With Mortgage |
| Less than 2.0x | 207 (54.9%) | 58,403 (42,016.6%) |
| 2.0x to 2.9x | 27 (7.2%) | 89 (64.0%) |
| 3.0x to 3.9x | 59 (15.7%) | 35 (25.2%) |
| 4.0x or more | 58 (15.4%) | 15 (10.8%) |
| Total | 377 (100.0%) | 139 (100.0%) |
Real Estate Taxes by Mortgage Status in Marianna
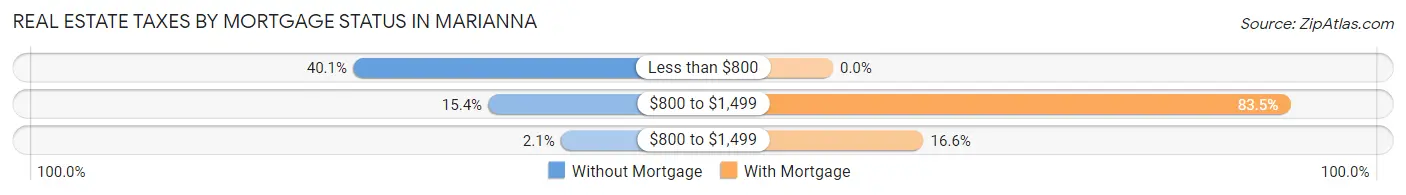
| Property Taxes | Without Mortgage | With Mortgage |
| Less than $800 | 151 (40.1%) | 0 (0.0%) |
| $800 to $1,499 | 58 (15.4%) | 116 (83.5%) |
| $800 to $1,499 | 8 (2.1%) | 23 (16.6%) |
| Total | 377 (100.0%) | 139 (100.0%) |
Health & Disability in Marianna
Health Insurance Coverage by Age in Marianna
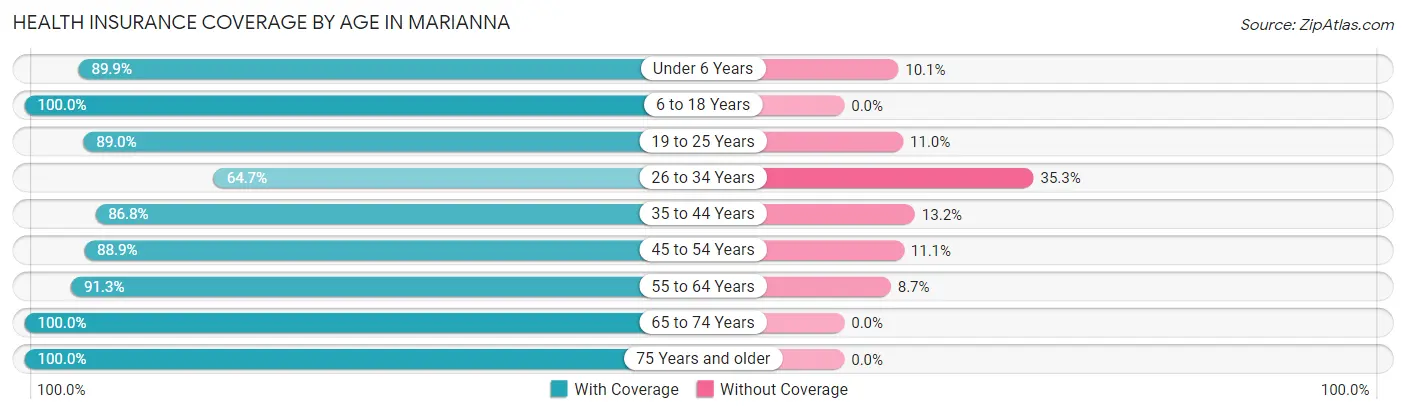
| Age Bracket | With Coverage | Without Coverage |
| Under 6 Years | 241 (89.9%) | 27 (10.1%) |
| 6 to 18 Years | 598 (100.0%) | 0 (0.0%) |
| 19 to 25 Years | 414 (89.0%) | 51 (11.0%) |
| 26 to 34 Years | 99 (64.7%) | 54 (35.3%) |
| 35 to 44 Years | 435 (86.8%) | 66 (13.2%) |
| 45 to 54 Years | 360 (88.9%) | 45 (11.1%) |
| 55 to 64 Years | 411 (91.3%) | 39 (8.7%) |
| 65 to 74 Years | 393 (100.0%) | 0 (0.0%) |
| 75 Years and older | 257 (100.0%) | 0 (0.0%) |
| Total | 3,208 (91.9%) | 282 (8.1%) |
Health Insurance Coverage by Citizenship Status in Marianna
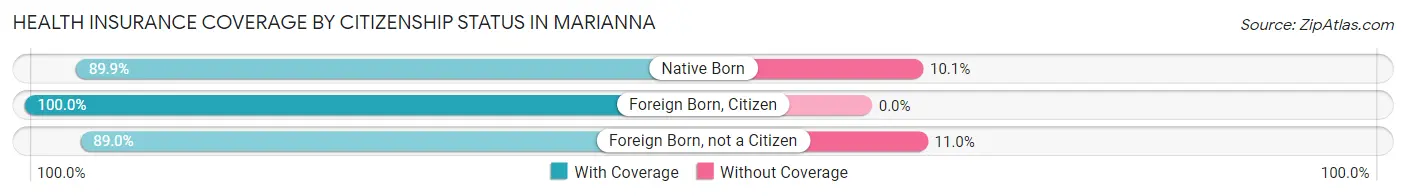
| Citizenship Status | With Coverage | Without Coverage |
| Native Born | 241 (89.9%) | 27 (10.1%) |
| Foreign Born, Citizen | 598 (100.0%) | 0 (0.0%) |
| Foreign Born, not a Citizen | 414 (89.0%) | 51 (11.0%) |
Health Insurance Coverage by Household Income in Marianna
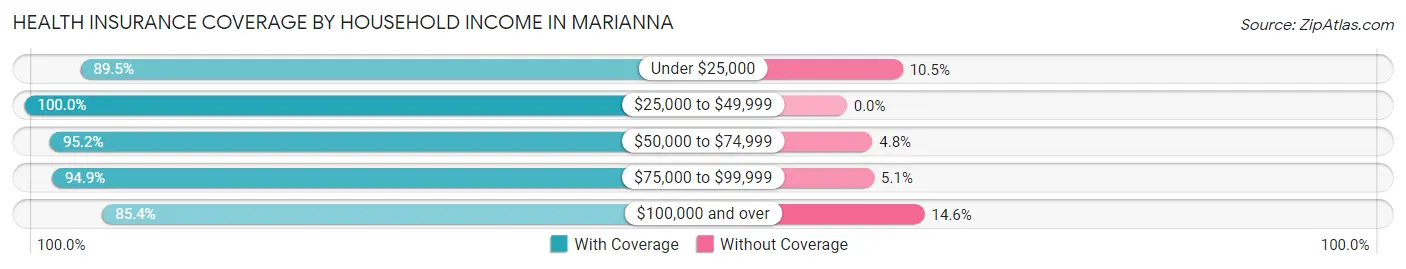
| Household Income | With Coverage | Without Coverage |
| Under $25,000 | 1,589 (89.5%) | 186 (10.5%) |
| $25,000 to $49,999 | 407 (100.0%) | 0 (0.0%) |
| $50,000 to $74,999 | 777 (95.2%) | 39 (4.8%) |
| $75,000 to $99,999 | 148 (94.9%) | 8 (5.1%) |
| $100,000 and over | 287 (85.4%) | 49 (14.6%) |
Public vs Private Health Insurance Coverage by Age in Marianna
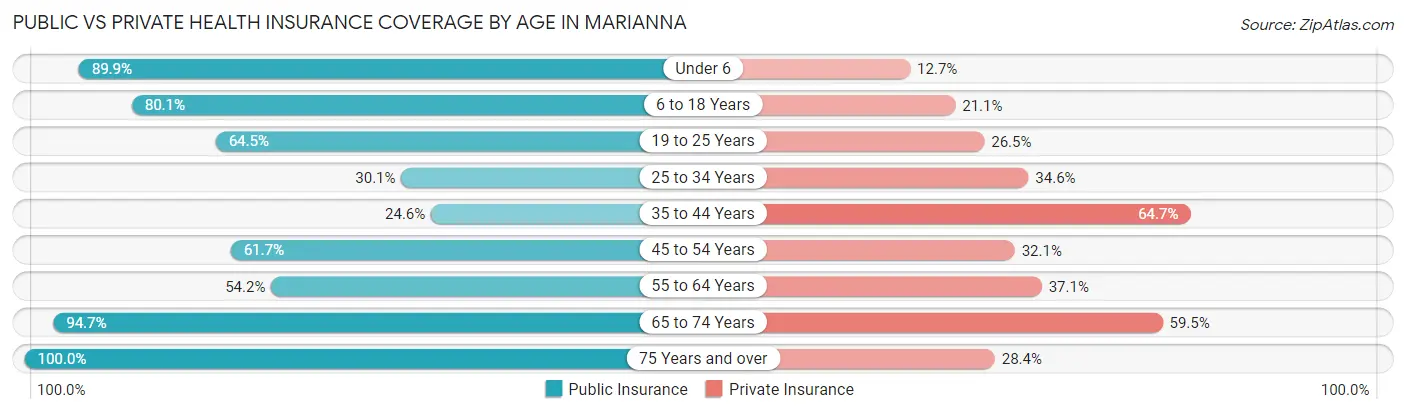
| Age Bracket | Public Insurance | Private Insurance |
| Under 6 | 241 (89.9%) | 34 (12.7%) |
| 6 to 18 Years | 479 (80.1%) | 126 (21.1%) |
| 19 to 25 Years | 300 (64.5%) | 123 (26.5%) |
| 25 to 34 Years | 46 (30.1%) | 53 (34.6%) |
| 35 to 44 Years | 123 (24.5%) | 324 (64.7%) |
| 45 to 54 Years | 250 (61.7%) | 130 (32.1%) |
| 55 to 64 Years | 244 (54.2%) | 167 (37.1%) |
| 65 to 74 Years | 372 (94.7%) | 234 (59.5%) |
| 75 Years and over | 257 (100.0%) | 73 (28.4%) |
| Total | 2,312 (66.2%) | 1,264 (36.2%) |
Disability Status by Sex by Age in Marianna
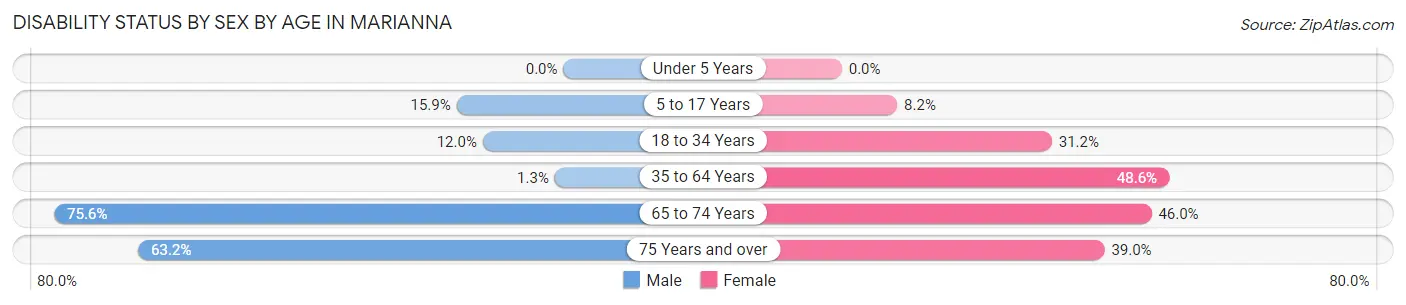
| Age Bracket | Male | Female |
| Under 5 Years | 0 (0.0%) | 0 (0.0%) |
| 5 to 17 Years | 36 (15.9%) | 30 (8.2%) |
| 18 to 34 Years | 37 (12.0%) | 106 (31.2%) |
| 35 to 64 Years | 7 (1.3%) | 392 (48.6%) |
| 65 to 74 Years | 62 (75.6%) | 143 (46.0%) |
| 75 Years and over | 36 (63.2%) | 78 (39.0%) |
Disability Class by Sex by Age in Marianna
Disability Class: Hearing Difficulty
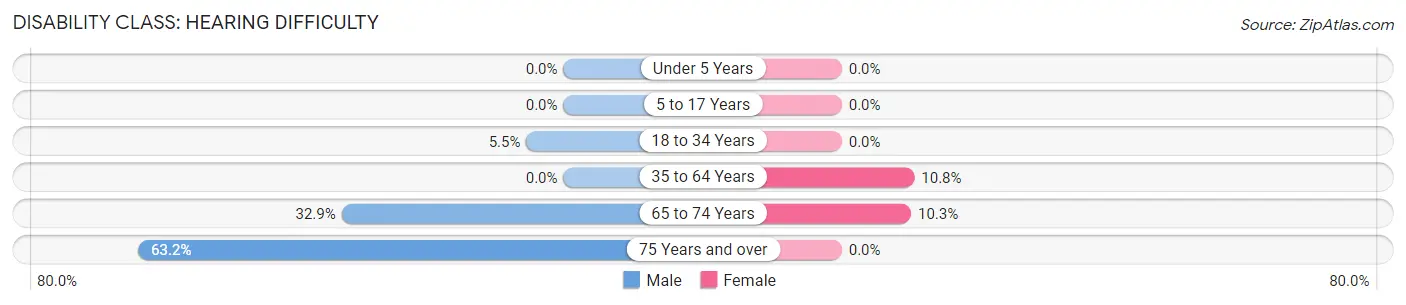
| Age Bracket | Male | Female |
| Under 5 Years | 0 (0.0%) | 0 (0.0%) |
| 5 to 17 Years | 0 (0.0%) | 0 (0.0%) |
| 18 to 34 Years | 17 (5.5%) | 0 (0.0%) |
| 35 to 64 Years | 0 (0.0%) | 87 (10.8%) |
| 65 to 74 Years | 27 (32.9%) | 32 (10.3%) |
| 75 Years and over | 36 (63.2%) | 0 (0.0%) |
Disability Class: Vision Difficulty
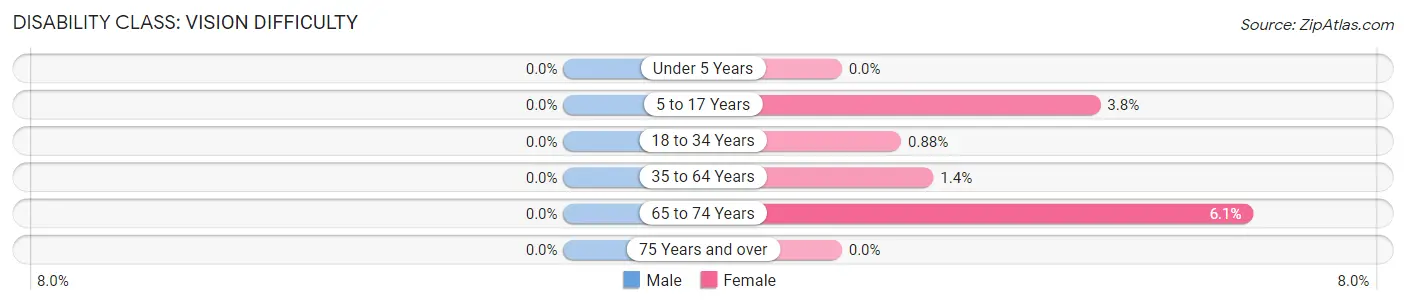
| Age Bracket | Male | Female |
| Under 5 Years | 0 (0.0%) | 0 (0.0%) |
| 5 to 17 Years | 0 (0.0%) | 14 (3.8%) |
| 18 to 34 Years | 0 (0.0%) | 3 (0.9%) |
| 35 to 64 Years | 0 (0.0%) | 11 (1.4%) |
| 65 to 74 Years | 0 (0.0%) | 19 (6.1%) |
| 75 Years and over | 0 (0.0%) | 0 (0.0%) |
Disability Class: Cognitive Difficulty
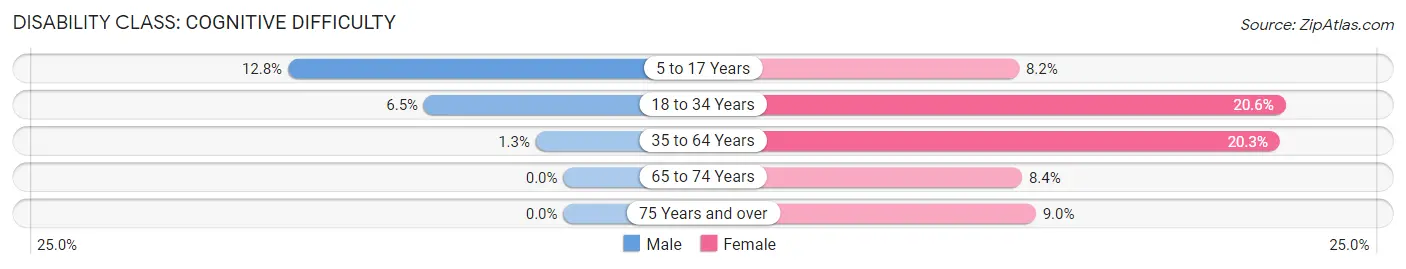
| Age Bracket | Male | Female |
| 5 to 17 Years | 29 (12.8%) | 30 (8.2%) |
| 18 to 34 Years | 20 (6.5%) | 70 (20.6%) |
| 35 to 64 Years | 7 (1.3%) | 164 (20.3%) |
| 65 to 74 Years | 0 (0.0%) | 26 (8.4%) |
| 75 Years and over | 0 (0.0%) | 18 (9.0%) |
Disability Class: Ambulatory Difficulty
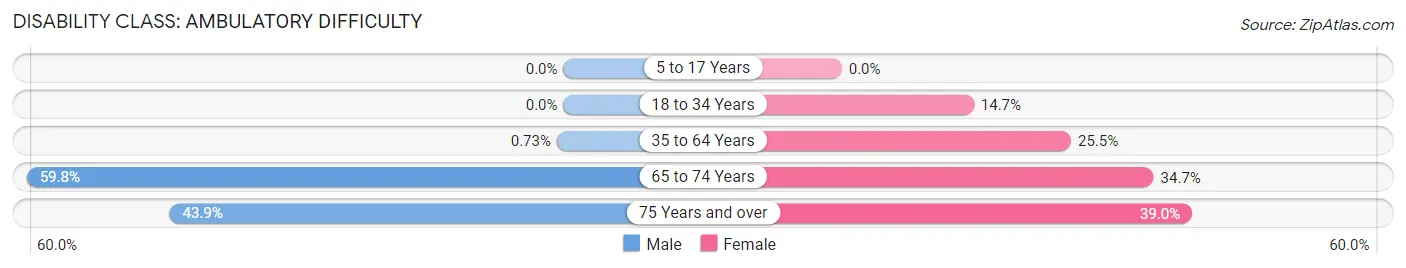
| Age Bracket | Male | Female |
| 5 to 17 Years | 0 (0.0%) | 0 (0.0%) |
| 18 to 34 Years | 0 (0.0%) | 50 (14.7%) |
| 35 to 64 Years | 4 (0.7%) | 206 (25.5%) |
| 65 to 74 Years | 49 (59.8%) | 108 (34.7%) |
| 75 Years and over | 25 (43.9%) | 78 (39.0%) |
Disability Class: Self-Care Difficulty
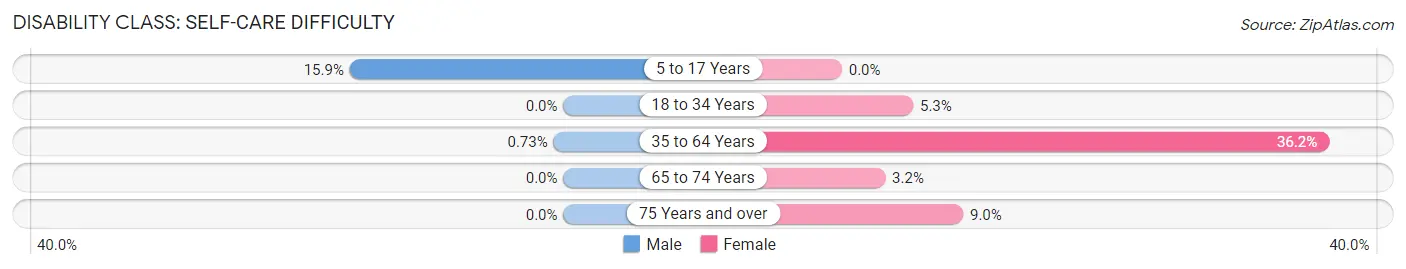
| Age Bracket | Male | Female |
| 5 to 17 Years | 36 (15.9%) | 0 (0.0%) |
| 18 to 34 Years | 0 (0.0%) | 18 (5.3%) |
| 35 to 64 Years | 4 (0.7%) | 292 (36.2%) |
| 65 to 74 Years | 0 (0.0%) | 10 (3.2%) |
| 75 Years and over | 0 (0.0%) | 18 (9.0%) |
Technology Access in Marianna
Computing Device Access in Marianna
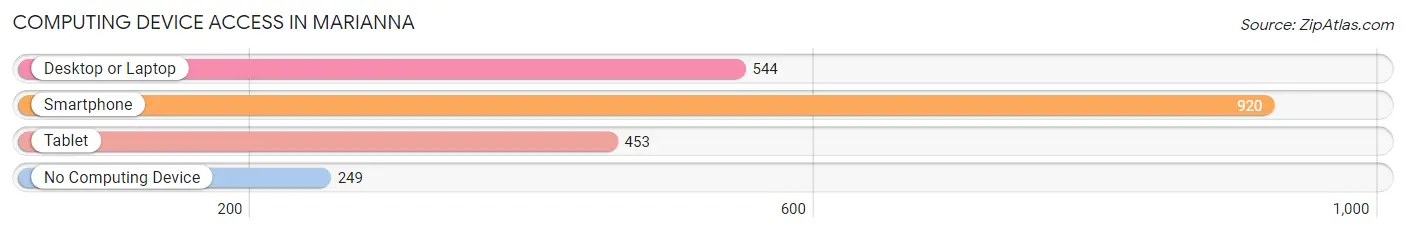
| Device Type | # Households | % Households |
| Desktop or Laptop | 544 | 43.9% |
| Smartphone | 920 | 74.2% |
| Tablet | 453 | 36.5% |
| No Computing Device | 249 | 20.1% |
| Total | 1,240 | 100.0% |
Internet Access in Marianna
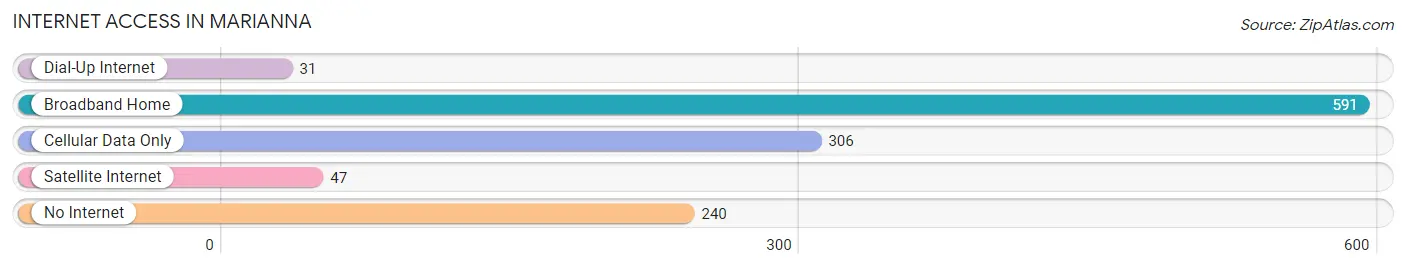
| Internet Type | # Households | % Households |
| Dial-Up Internet | 31 | 2.5% |
| Broadband Home | 591 | 47.7% |
| Cellular Data Only | 306 | 24.7% |
| Satellite Internet | 47 | 3.8% |
| No Internet | 240 | 19.4% |
| Total | 1,240 | 100.0% |
Marianna Summary
Marianna, Arkansas is a small city located in Lee County in the eastern part of the state. It is situated on the banks of the L'Anguille River, and is the county seat of Lee County. The city has a population of around 5,000 people, and is part of the Memphis Metropolitan Statistical Area.
History
Marianna was founded in 1848 by a group of settlers from Tennessee. The city was named after the daughter of one of the settlers, and was incorporated in 1853. The city was an important trading center during the Civil War, and was the site of a major battle in 1863. After the war, the city experienced a period of growth and prosperity, and by the early 1900s, it had become a major agricultural center.
Geography
Marianna is located in the eastern part of Arkansas, in Lee County. It is situated on the banks of the L'Anguille River, and is about 30 miles south of Memphis, Tennessee. The city has a total area of 4.2 square miles, all of which is land. The city has a humid subtropical climate, with hot, humid summers and mild winters.
Economy
Marianna's economy is largely based on agriculture. The city is home to several large farms, and is a major producer of cotton, soybeans, and rice. The city also has a number of manufacturing and service-based businesses, including a furniture factory, a printing company, and a number of restaurants and retail stores.
Demographics
As of the 2010 census, the population of Marianna was 5,039. The racial makeup of the city was 57.3% White, 37.7% African American, 0.3% Native American, 0.4% Asian, 0.1% Pacific Islander, and 4.2% from other races. The median household income was $25,945, and the median family income was $31,944. The per capita income was $14,945.
Marianna is a small city with a rich history and a diverse economy. It is home to a number of farms and businesses, and is a major producer of cotton, soybeans, and rice. The city has a population of around 5,000 people, and is part of the Memphis Metropolitan Statistical Area.
Common Questions
What is Per Capita Income in Marianna?
Per Capita income in Marianna is $15,392.
What is the Median Family Income in Marianna?
Median Family Income in Marianna is $29,038.
What is the Median Household income in Marianna?
Median Household Income in Marianna is $21,057.
What is Income or Wage Gap in Marianna?
Income or Wage Gap in Marianna is 39.2%.
Women in Marianna earn 60.8 cents for every dollar earned by a man.
What is Family Income Deficit in Marianna?
Family Income Deficit in Marianna is $12,862.
Families that are below poverty line in Marianna earn $12,862 less on average than the poverty threshold level.
What is Inequality or Gini Index in Marianna?
Inequality or Gini Index in Marianna is 0.51.
What is the Total Population of Marianna?
Total Population of Marianna is 3,575.
What is the Total Male Population of Marianna?
Total Male Population of Marianna is 1,371.
What is the Total Female Population of Marianna?
Total Female Population of Marianna is 2,204.
What is the Ratio of Males per 100 Females in Marianna?
There are 62.21 Males per 100 Females in Marianna.
What is the Ratio of Females per 100 Males in Marianna?
There are 160.76 Females per 100 Males in Marianna.
What is the Median Population Age in Marianna?
Median Population Age in Marianna is 41.7 Years.
What is the Average Family Size in Marianna
Average Family Size in Marianna is 3.8 People.
What is the Average Household Size in Marianna
Average Household Size in Marianna is 2.8 People.
How Large is the Labor Force in Marianna?
There are 1,329 People in the Labor Forcein in Marianna.
What is the Percentage of People in the Labor Force in Marianna?
46.5% of People are in the Labor Force in Marianna.
What is the Unemployment Rate in Marianna?
Unemployment Rate in Marianna is 21.1%.