Mammoth Spring, AR Map & Demographics
Mammoth Spring Map
Mammoth Spring Overview
$21,617
PER CAPITA INCOME
$55,795
AVG FAMILY INCOME
$39,118
AVG HOUSEHOLD INCOME
43.9%
WAGE / INCOME GAP [ % ]
56.1¢/ $1
WAGE / INCOME GAP [ $ ]
0.47
INEQUALITY / GINI INDEX
1,037
TOTAL POPULATION
491
MALE POPULATION
546
FEMALE POPULATION
89.93
MALES / 100 FEMALES
111.20
FEMALES / 100 MALES
38.7
MEDIAN AGE
3.5
AVG FAMILY SIZE
2.8
AVG HOUSEHOLD SIZE
411
LABOR FORCE [ PEOPLE ]
53.7%
PERCENT IN LABOR FORCE
3.6%
UNEMPLOYMENT RATE
Mammoth Spring Zip Codes
Mammoth Spring Area Codes
Income in Mammoth Spring
Income Overview in Mammoth Spring
Per Capita Income in Mammoth Spring is $21,617, while median incomes of families and households are $55,795 and $39,118 respectively.
| Characteristic | Number | Measure |
| Per Capita Income | 1,037 | $21,617 |
| Median Family Income | 263 | $55,795 |
| Mean Family Income | 263 | $71,887 |
| Median Household Income | 368 | $39,118 |
| Mean Household Income | 368 | $60,344 |
| Income Deficit | 263 | $0 |
| Wage / Income Gap (%) | 1,037 | 43.88% |
| Wage / Income Gap ($) | 1,037 | 56.12¢ per $1 |
| Gini / Inequality Index | 1,037 | 0.47 |
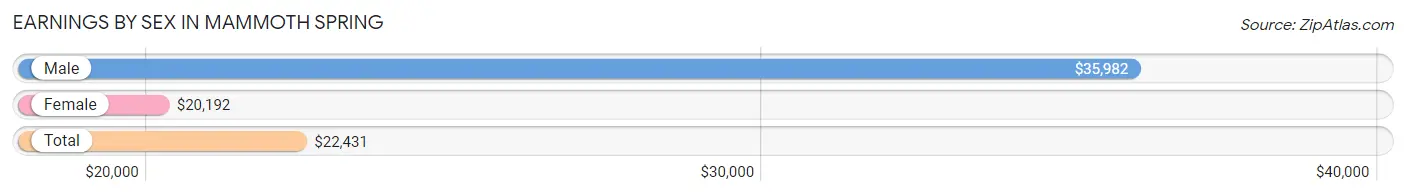
Earnings by Sex in Mammoth Spring
Average Earnings in Mammoth Spring are $22,431, $35,982 for men and $20,192 for women, a difference of 43.9%.
| Sex | Number | Average Earnings |
| Male | 222 (52.4%) | $35,982 |
| Female | 202 (47.6%) | $20,192 |
| Total | 424 (100.0%) | $22,431 |
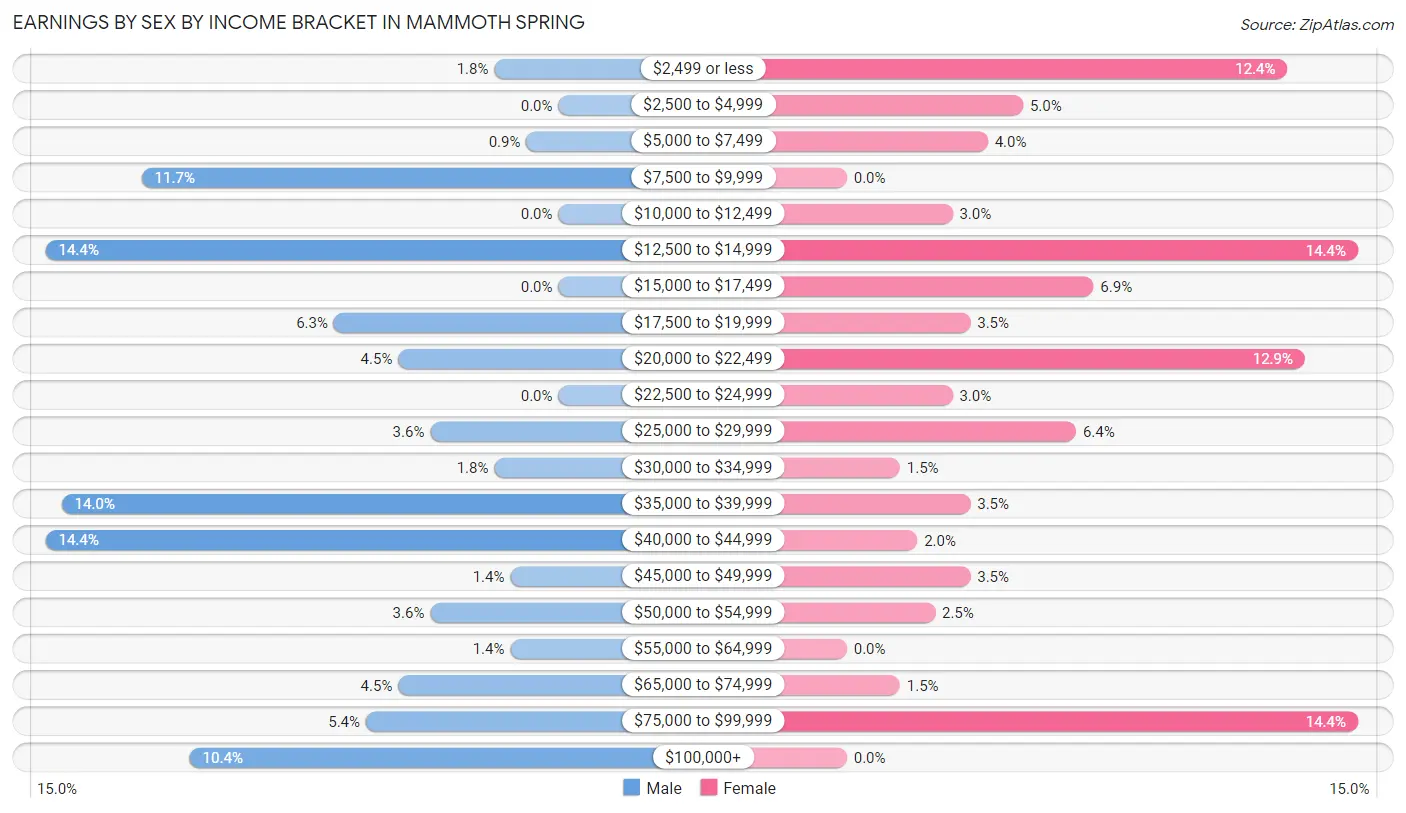
Earnings by Sex by Income Bracket in Mammoth Spring
The most common earnings brackets in Mammoth Spring are $12,500 to $14,999 for men (32 | 14.4%) and $12,500 to $14,999 for women (29 | 14.4%).
| Income | Male | Female |
| $2,499 or less | 4 (1.8%) | 25 (12.4%) |
| $2,500 to $4,999 | 0 (0.0%) | 10 (5.0%) |
| $5,000 to $7,499 | 2 (0.9%) | 8 (4.0%) |
| $7,500 to $9,999 | 26 (11.7%) | 0 (0.0%) |
| $10,000 to $12,499 | 0 (0.0%) | 6 (3.0%) |
| $12,500 to $14,999 | 32 (14.4%) | 29 (14.4%) |
| $15,000 to $17,499 | 0 (0.0%) | 14 (6.9%) |
| $17,500 to $19,999 | 14 (6.3%) | 7 (3.5%) |
| $20,000 to $22,499 | 10 (4.5%) | 26 (12.9%) |
| $22,500 to $24,999 | 0 (0.0%) | 6 (3.0%) |
| $25,000 to $29,999 | 8 (3.6%) | 13 (6.4%) |
| $30,000 to $34,999 | 4 (1.8%) | 3 (1.5%) |
| $35,000 to $39,999 | 31 (14.0%) | 7 (3.5%) |
| $40,000 to $44,999 | 32 (14.4%) | 4 (2.0%) |
| $45,000 to $49,999 | 3 (1.3%) | 7 (3.5%) |
| $50,000 to $54,999 | 8 (3.6%) | 5 (2.5%) |
| $55,000 to $64,999 | 3 (1.3%) | 0 (0.0%) |
| $65,000 to $74,999 | 10 (4.5%) | 3 (1.5%) |
| $75,000 to $99,999 | 12 (5.4%) | 29 (14.4%) |
| $100,000+ | 23 (10.4%) | 0 (0.0%) |
| Total | 222 (100.0%) | 202 (100.0%) |
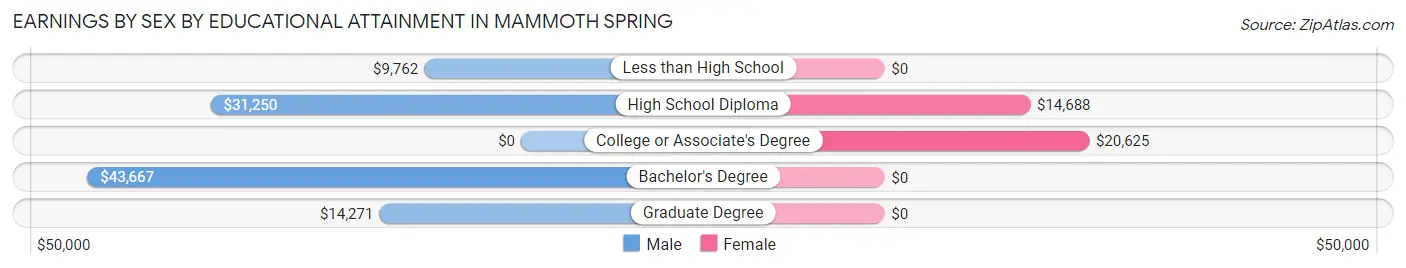
Earnings by Sex by Educational Attainment in Mammoth Spring
Average earnings in Mammoth Spring are $36,346 for men and $21,154 for women, a difference of 41.8%. Men with an educational attainment of bachelor's degree enjoy the highest average annual earnings of $43,667, while those with less than high school education earn the least with $9,762. Women with an educational attainment of college or associate's degree earn the most with the average annual earnings of $20,625, while those with high school diploma education have the smallest earnings of $14,688.
| Educational Attainment | Male Income | Female Income |
| Less than High School | $9,762 | $0 |
| High School Diploma | $31,250 | $14,688 |
| College or Associate's Degree | - | - |
| Bachelor's Degree | $43,667 | $0 |
| Graduate Degree | $14,271 | $0 |
| Total | $36,346 | $21,154 |
Family Income in Mammoth Spring
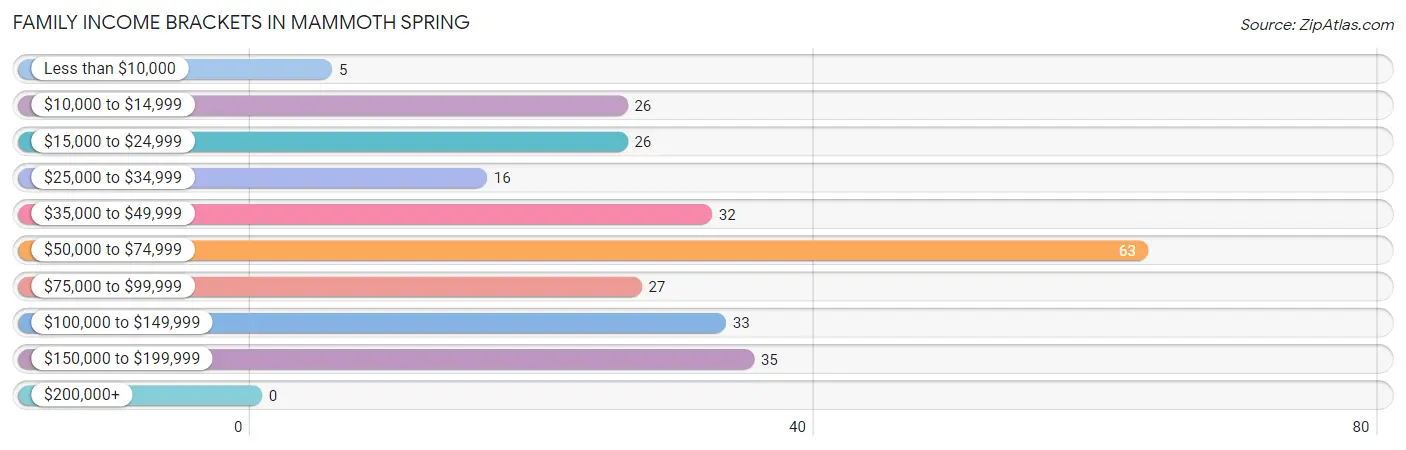
Family Income Brackets in Mammoth Spring
According to the Mammoth Spring family income data, there are 63 families falling into the $50,000 to $74,999 income range, which is the most common income bracket and makes up 23.9% of all families.
| Income Bracket | # Families | % Families |
| Less than $10,000 | 5 | 1.9% |
| $10,000 to $14,999 | 26 | 9.9% |
| $15,000 to $24,999 | 26 | 9.9% |
| $25,000 to $34,999 | 16 | 6.1% |
| $35,000 to $49,999 | 32 | 12.2% |
| $50,000 to $74,999 | 63 | 24.0% |
| $75,000 to $99,999 | 27 | 10.3% |
| $100,000 to $149,999 | 33 | 12.5% |
| $150,000 to $199,999 | 35 | 13.3% |
| $200,000+ | 0 | 0.0% |
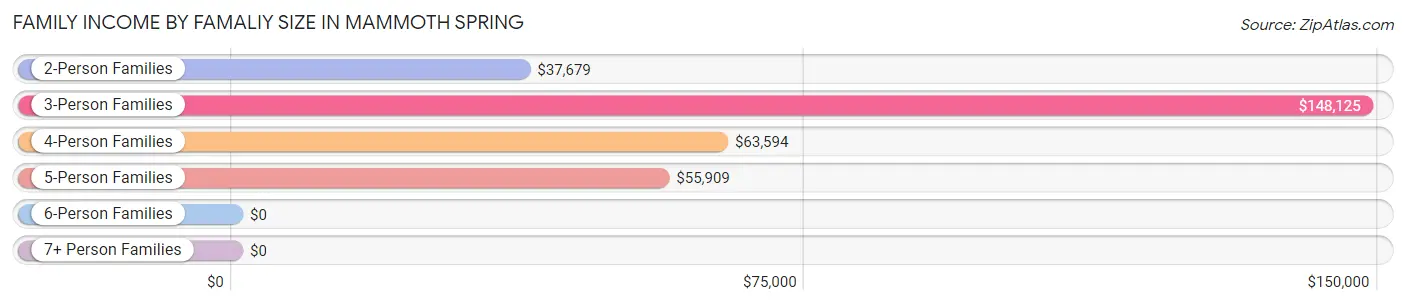
Family Income by Famaliy Size in Mammoth Spring
3-person families (56 | 21.3%) account for the highest median family income in Mammoth Spring with $148,125 per family, while 3-person families (56 | 21.3%) have the highest median income of $49,375 per family member.
| Income Bracket | # Families | Median Income |
| 2-Person Families | 129 (49.0%) | $37,679 |
| 3-Person Families | 56 (21.3%) | $148,125 |
| 4-Person Families | 35 (13.3%) | $63,594 |
| 5-Person Families | 28 (10.6%) | $55,909 |
| 6-Person Families | 5 (1.9%) | $0 |
| 7+ Person Families | 10 (3.8%) | $0 |
| Total | 263 (100.0%) | $55,795 |
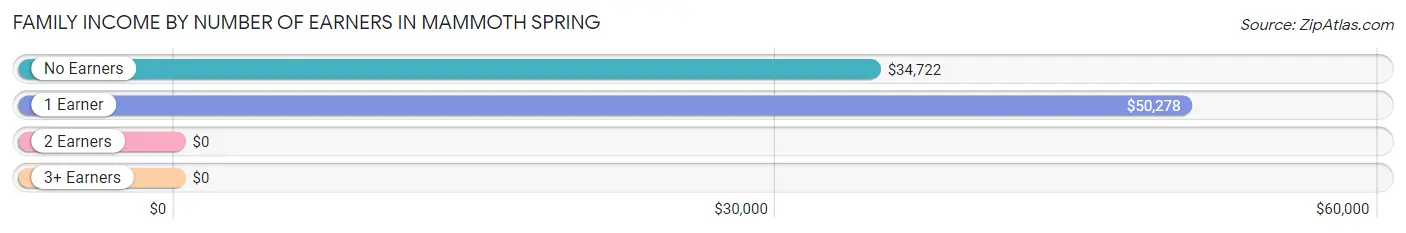
Family Income by Number of Earners in Mammoth Spring
| Number of Earners | # Families | Median Income |
| No Earners | 60 (22.8%) | $34,722 |
| 1 Earner | 76 (28.9%) | $50,278 |
| 2 Earners | 103 (39.2%) | $0 |
| 3+ Earners | 24 (9.1%) | $0 |
| Total | 263 (100.0%) | $55,795 |
Household Income in Mammoth Spring
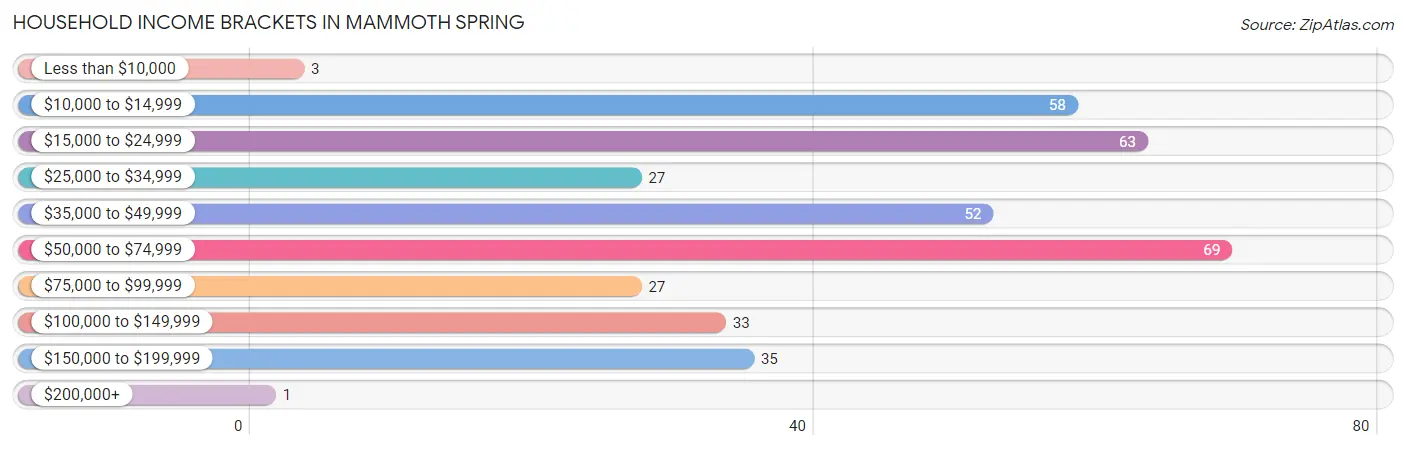
Household Income Brackets in Mammoth Spring
With 69 households falling in the category, the $50,000 to $74,999 income range is the most frequent in Mammoth Spring, accounting for 18.8% of all households. In contrast, only 1 households (0.3%) fall into the $200,000+ income bracket, making it the least populous group.
| Income Bracket | # Households | % Households |
| Less than $10,000 | 3 | 0.8% |
| $10,000 to $14,999 | 58 | 15.8% |
| $15,000 to $24,999 | 63 | 17.1% |
| $25,000 to $34,999 | 27 | 7.3% |
| $35,000 to $49,999 | 52 | 14.1% |
| $50,000 to $74,999 | 69 | 18.8% |
| $75,000 to $99,999 | 27 | 7.3% |
| $100,000 to $149,999 | 33 | 9.0% |
| $150,000 to $199,999 | 35 | 9.5% |
| $200,000+ | 1 | 0.3% |
Household Income by Householder Age in Mammoth Spring
The median household income in Mammoth Spring is $39,118, with the highest median household income of $57,813 found in the 45 to 64 years age bracket for the primary householder. A total of 59 households (16.0%) fall into this category. Meanwhile, the 65+ years age bracket for the primary householder has the lowest median household income of $33,889, with 180 households (48.9%) in this group.
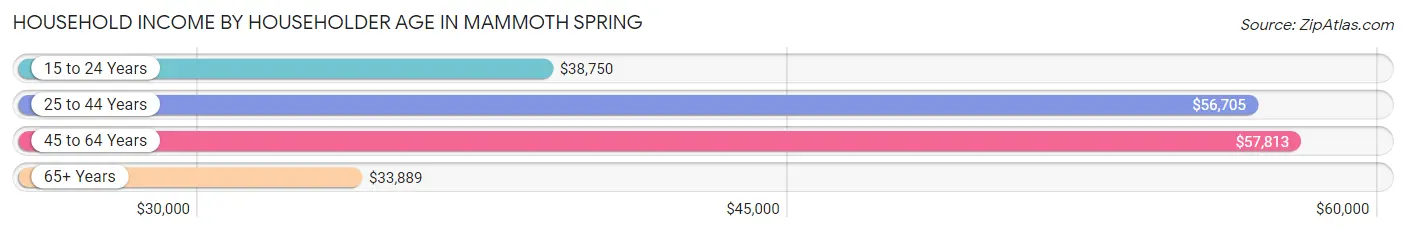
| Income Bracket | # Households | Median Income |
| 15 to 24 Years | 12 (3.3%) | $38,750 |
| 25 to 44 Years | 117 (31.8%) | $56,705 |
| 45 to 64 Years | 59 (16.0%) | $57,813 |
| 65+ Years | 180 (48.9%) | $33,889 |
| Total | 368 (100.0%) | $39,118 |
Poverty in Mammoth Spring
Income Below Poverty by Sex and Age in Mammoth Spring
With 18.3% poverty level for males and 26.4% for females among the residents of Mammoth Spring, 16 and 17 year old males and 15 year old females are the most vulnerable to poverty, with 3 males (60.0%) and 8 females (72.7%) in their respective age groups living below the poverty level.
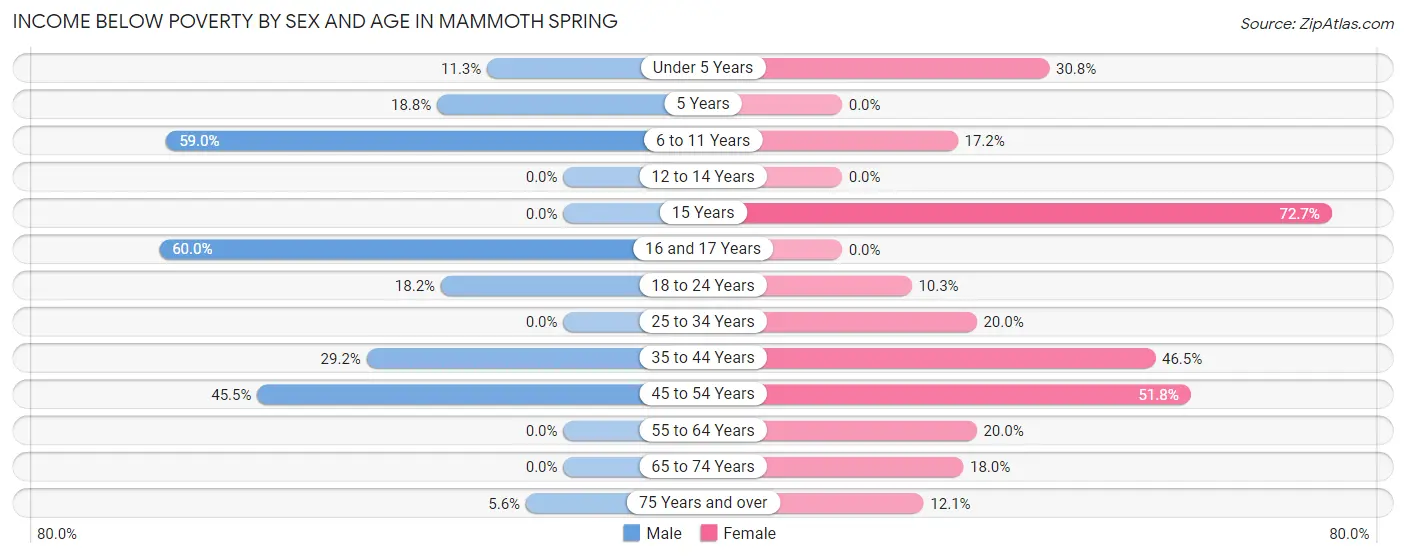
| Age Bracket | Male | Female |
| Under 5 Years | 6 (11.3%) | 8 (30.8%) |
| 5 Years | 3 (18.8%) | 0 (0.0%) |
| 6 to 11 Years | 23 (59.0%) | 11 (17.2%) |
| 12 to 14 Years | 0 (0.0%) | 0 (0.0%) |
| 15 Years | 0 (0.0%) | 8 (72.7%) |
| 16 and 17 Years | 3 (60.0%) | 0 (0.0%) |
| 18 to 24 Years | 2 (18.2%) | 3 (10.3%) |
| 25 to 34 Years | 0 (0.0%) | 15 (20.0%) |
| 35 to 44 Years | 26 (29.2%) | 40 (46.5%) |
| 45 to 54 Years | 25 (45.5%) | 29 (51.8%) |
| 55 to 64 Years | 0 (0.0%) | 4 (20.0%) |
| 65 to 74 Years | 0 (0.0%) | 18 (18.0%) |
| 75 Years and over | 2 (5.6%) | 8 (12.1%) |
| Total | 90 (18.3%) | 144 (26.4%) |
Income Above Poverty by Sex and Age in Mammoth Spring
According to the poverty statistics in Mammoth Spring, males aged 12 to 14 years and females aged 16 and 17 years are the age groups that are most secure financially, with 100.0% of males and 100.0% of females in these age groups living above the poverty line.
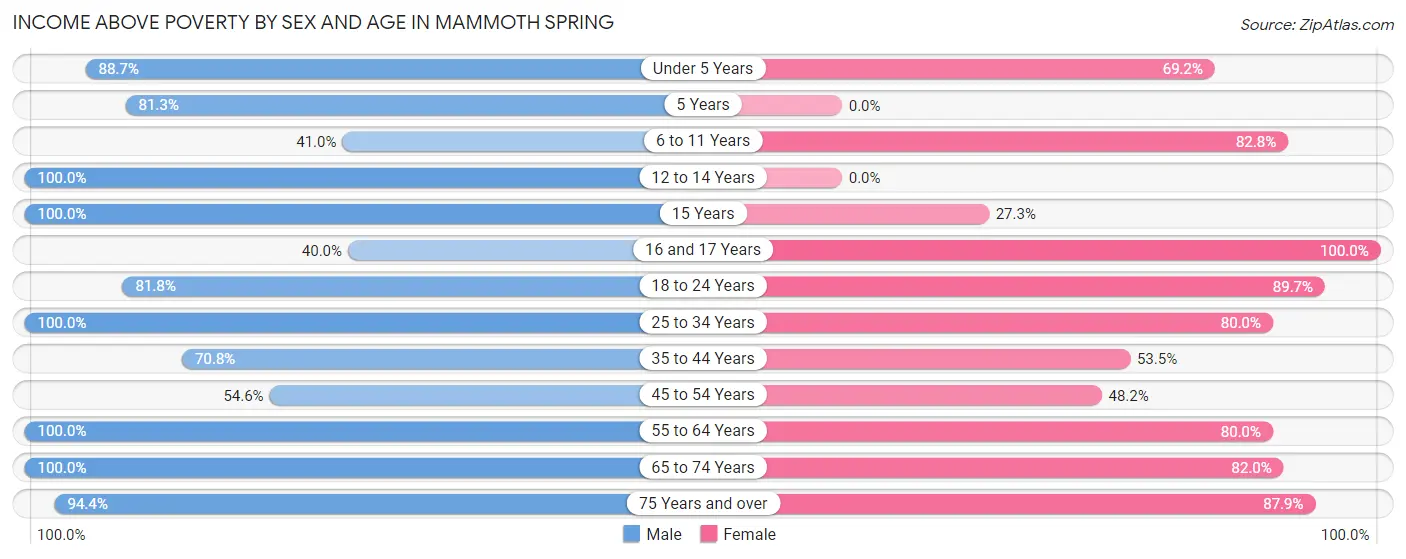
| Age Bracket | Male | Female |
| Under 5 Years | 47 (88.7%) | 18 (69.2%) |
| 5 Years | 13 (81.2%) | 0 (0.0%) |
| 6 to 11 Years | 16 (41.0%) | 53 (82.8%) |
| 12 to 14 Years | 61 (100.0%) | 0 (0.0%) |
| 15 Years | 1 (100.0%) | 3 (27.3%) |
| 16 and 17 Years | 2 (40.0%) | 13 (100.0%) |
| 18 to 24 Years | 9 (81.8%) | 26 (89.7%) |
| 25 to 34 Years | 30 (100.0%) | 60 (80.0%) |
| 35 to 44 Years | 63 (70.8%) | 46 (53.5%) |
| 45 to 54 Years | 30 (54.5%) | 27 (48.2%) |
| 55 to 64 Years | 37 (100.0%) | 16 (80.0%) |
| 65 to 74 Years | 58 (100.0%) | 82 (82.0%) |
| 75 Years and over | 34 (94.4%) | 58 (87.9%) |
| Total | 401 (81.7%) | 402 (73.6%) |
Income Below Poverty Among Married-Couple Families in Mammoth Spring
The poverty statistics for married-couple families in Mammoth Spring show that 7.4% or 15 of the total 203 families live below the poverty line. Families with 3 or 4 children have the highest poverty rate of 23.3%, comprising of 10 families. On the other hand, families with no children have the lowest poverty rate of 0.0%, which includes 0 families.
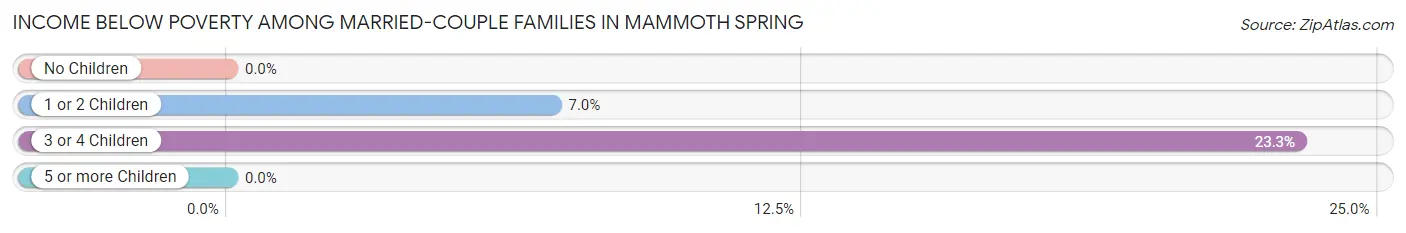
| Children | Above Poverty | Below Poverty |
| No Children | 89 (100.0%) | 0 (0.0%) |
| 1 or 2 Children | 66 (93.0%) | 5 (7.0%) |
| 3 or 4 Children | 33 (76.7%) | 10 (23.3%) |
| 5 or more Children | 0 (0.0%) | 0 (0.0%) |
| Total | 188 (92.6%) | 15 (7.4%) |
Income Below Poverty Among Single-Parent Households in Mammoth Spring
According to the poverty data in Mammoth Spring, 56.5% or 13 single-father households and 51.3% or 19 single-mother households are living below the poverty line. Among single-father households, those with 1 or 2 children have the highest poverty rate, with 13 households (100.0%) experiencing poverty. Likewise, among single-mother households, those with 3 or 4 children have the highest poverty rate, with 3 households (100.0%) falling below the poverty line.
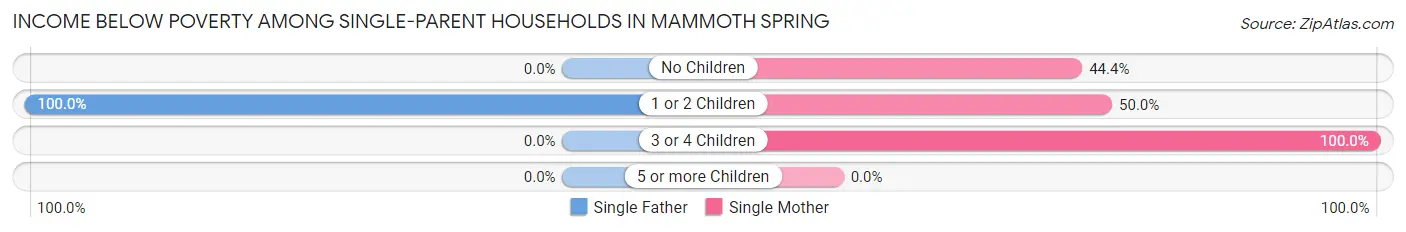
| Children | Single Father | Single Mother |
| No Children | 0 (0.0%) | 8 (44.4%) |
| 1 or 2 Children | 13 (100.0%) | 8 (50.0%) |
| 3 or 4 Children | 0 (0.0%) | 3 (100.0%) |
| 5 or more Children | 0 (0.0%) | 0 (0.0%) |
| Total | 13 (56.5%) | 19 (51.3%) |
Income Below Poverty Among Married-Couple vs Single-Parent Households in Mammoth Spring
The poverty data for Mammoth Spring shows that 15 of the married-couple family households (7.4%) and 32 of the single-parent households (53.3%) are living below the poverty level. Within the married-couple family households, those with 3 or 4 children have the highest poverty rate, with 10 households (23.3%) falling below the poverty line. Among the single-parent households, those with 3 or 4 children have the highest poverty rate, with 3 household (100.0%) living below poverty.
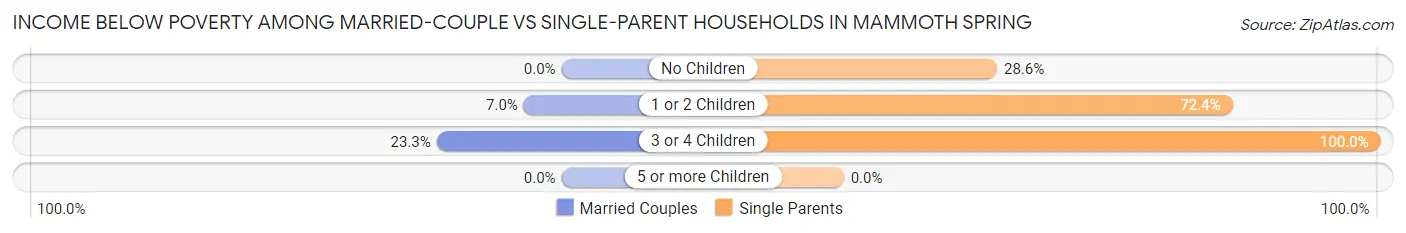
| Children | Married-Couple Families | Single-Parent Households |
| No Children | 0 (0.0%) | 8 (28.6%) |
| 1 or 2 Children | 5 (7.0%) | 21 (72.4%) |
| 3 or 4 Children | 10 (23.3%) | 3 (100.0%) |
| 5 or more Children | 0 (0.0%) | 0 (0.0%) |
| Total | 15 (7.4%) | 32 (53.3%) |
Race in Mammoth Spring
The most populous races in Mammoth Spring are White / Caucasian (969 | 93.4%), and Two or more Races (68 | 6.6%).
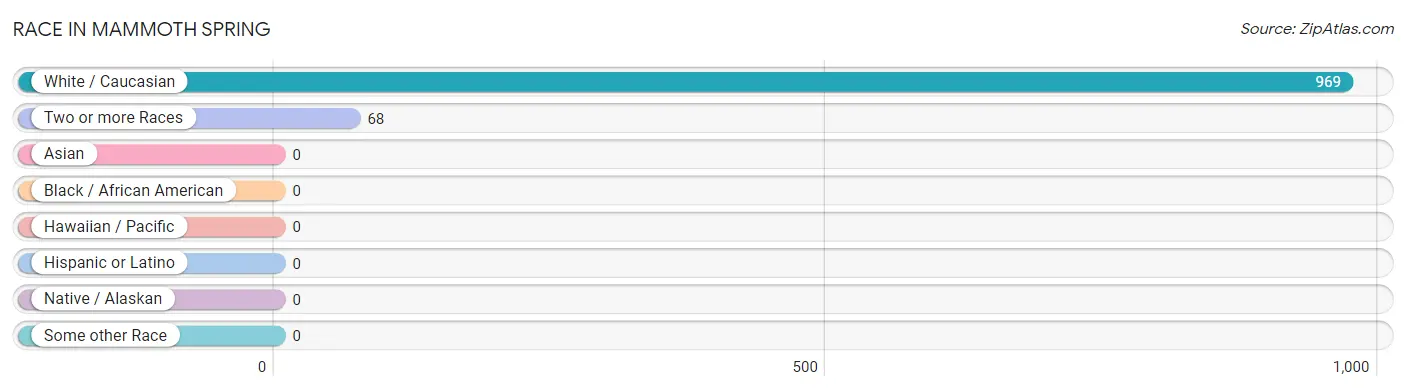
| Race | # Population | % Population |
| Asian | 0 | 0.0% |
| Black / African American | 0 | 0.0% |
| Hawaiian / Pacific | 0 | 0.0% |
| Hispanic or Latino | 0 | 0.0% |
| Native / Alaskan | 0 | 0.0% |
| White / Caucasian | 969 | 93.4% |
| Two or more Races | 68 | 6.6% |
| Some other Race | 0 | 0.0% |
| Total | 1,037 | 100.0% |
Ancestry in Mammoth Spring
The most populous ancestries reported in Mammoth Spring are Irish (218 | 21.0%), English (146 | 14.1%), American (139 | 13.4%), German (76 | 7.3%), and Italian (62 | 6.0%), together accounting for 61.8% of all Mammoth Spring residents.
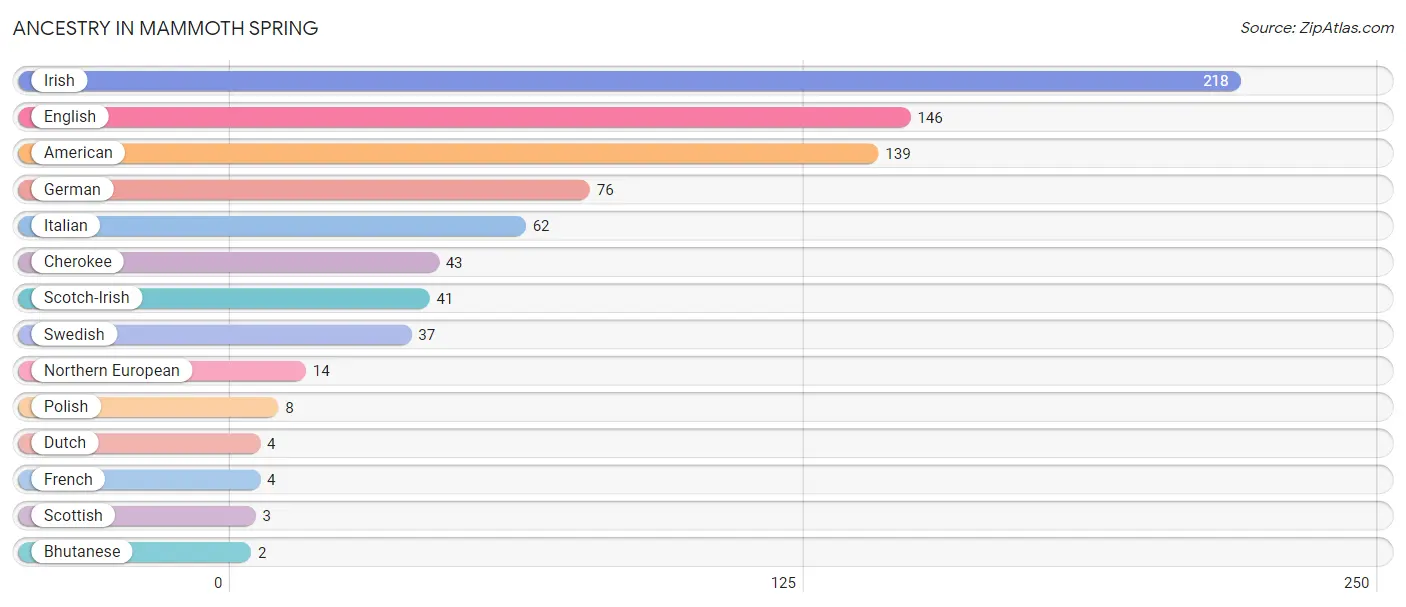
| Ancestry | # Population | % Population |
| American | 139 | 13.4% |
| Bhutanese | 2 | 0.2% |
| Cherokee | 43 | 4.2% |
| Dutch | 4 | 0.4% |
| English | 146 | 14.1% |
| French | 4 | 0.4% |
| German | 76 | 7.3% |
| Irish | 218 | 21.0% |
| Italian | 62 | 6.0% |
| Northern European | 14 | 1.3% |
| Polish | 8 | 0.8% |
| Scotch-Irish | 41 | 4.0% |
| Scottish | 3 | 0.3% |
| Swedish | 37 | 3.6% | View All 14 Rows |
Immigrants in Mammoth Spring

| Immigration Origin | # Population | % Population | View All 0 Rows |
Sex and Age in Mammoth Spring
Sex and Age in Mammoth Spring
The most populous age groups in Mammoth Spring are 10 to 14 Years (93 | 18.9%) for men and 35 to 39 Years (80 | 14.6%) for women.
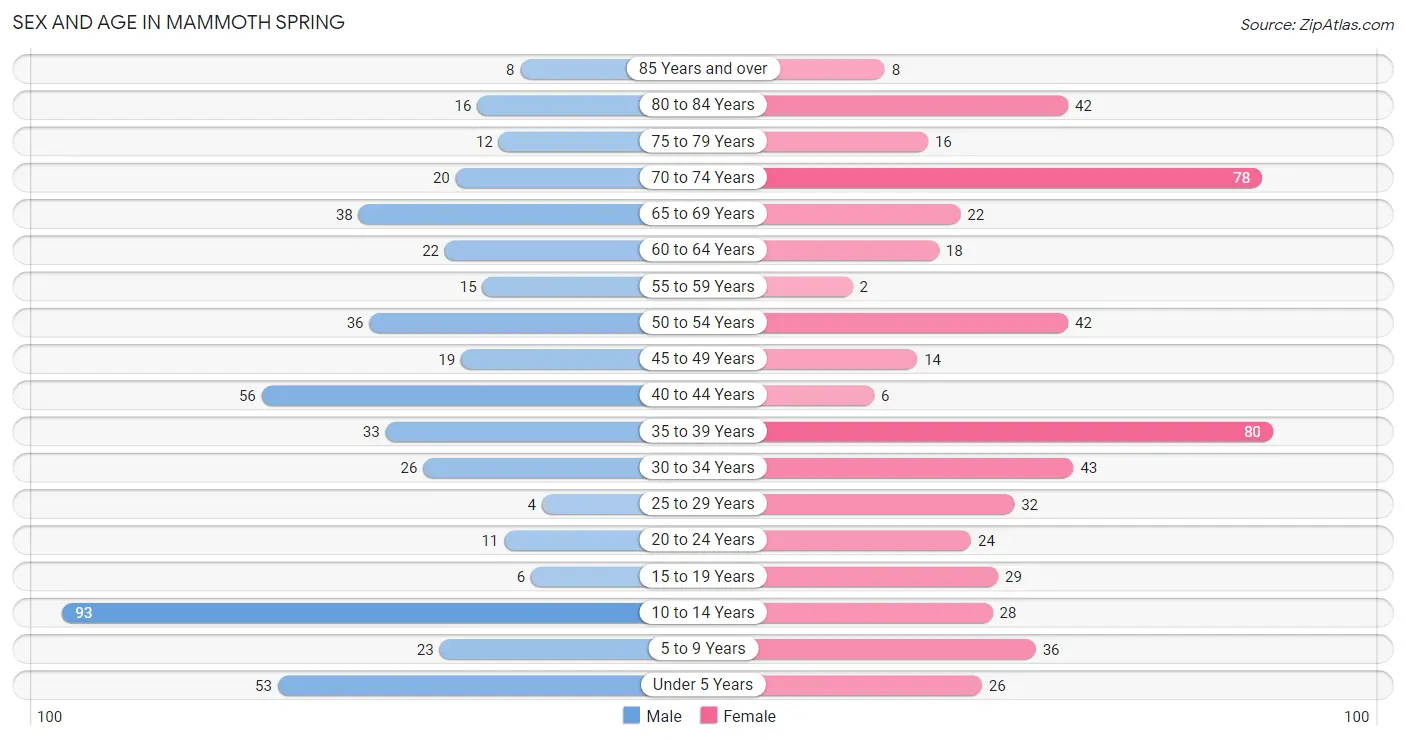
| Age Bracket | Male | Female |
| Under 5 Years | 53 (10.8%) | 26 (4.8%) |
| 5 to 9 Years | 23 (4.7%) | 36 (6.6%) |
| 10 to 14 Years | 93 (18.9%) | 28 (5.1%) |
| 15 to 19 Years | 6 (1.2%) | 29 (5.3%) |
| 20 to 24 Years | 11 (2.2%) | 24 (4.4%) |
| 25 to 29 Years | 4 (0.8%) | 32 (5.9%) |
| 30 to 34 Years | 26 (5.3%) | 43 (7.9%) |
| 35 to 39 Years | 33 (6.7%) | 80 (14.6%) |
| 40 to 44 Years | 56 (11.4%) | 6 (1.1%) |
| 45 to 49 Years | 19 (3.9%) | 14 (2.6%) |
| 50 to 54 Years | 36 (7.3%) | 42 (7.7%) |
| 55 to 59 Years | 15 (3.0%) | 2 (0.4%) |
| 60 to 64 Years | 22 (4.5%) | 18 (3.3%) |
| 65 to 69 Years | 38 (7.7%) | 22 (4.0%) |
| 70 to 74 Years | 20 (4.1%) | 78 (14.3%) |
| 75 to 79 Years | 12 (2.4%) | 16 (2.9%) |
| 80 to 84 Years | 16 (3.3%) | 42 (7.7%) |
| 85 Years and over | 8 (1.6%) | 8 (1.5%) |
| Total | 491 (100.0%) | 546 (100.0%) |
Families and Households in Mammoth Spring
Median Family Size in Mammoth Spring
The median family size in Mammoth Spring is 3.45 persons per family, with single male/father families (23 | 8.7%) accounting for the largest median family size of 3.74 persons per family. On the other hand, single female/mother families (37 | 14.1%) represent the smallest median family size with 3.11 persons per family.
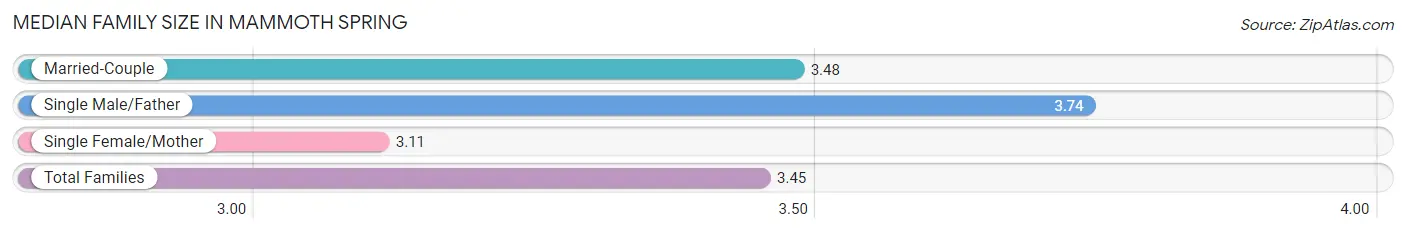
| Family Type | # Families | Family Size |
| Married-Couple | 203 (77.2%) | 3.48 |
| Single Male/Father | 23 (8.7%) | 3.74 |
| Single Female/Mother | 37 (14.1%) | 3.11 |
| Total Families | 263 (100.0%) | 3.45 |
Median Household Size in Mammoth Spring
The median household size in Mammoth Spring is 2.82 persons per household, with single male/father households (23 | 6.2%) accounting for the largest median household size of 3.83 persons per household. non-family households (105 | 28.5%) represent the smallest median household size with 1.04 persons per household.
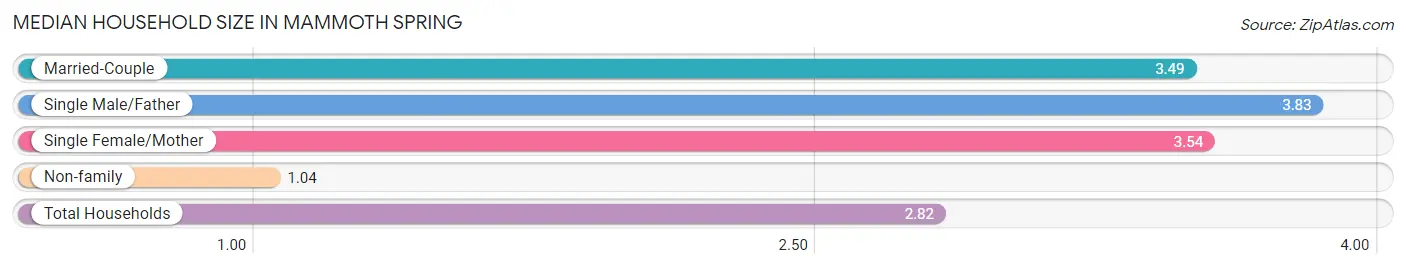
| Household Type | # Households | Household Size |
| Married-Couple | 203 (55.2%) | 3.49 |
| Single Male/Father | 23 (6.2%) | 3.83 |
| Single Female/Mother | 37 (10.1%) | 3.54 |
| Non-family | 105 (28.5%) | 1.04 |
| Total Households | 368 (100.0%) | 2.82 |
Household Size by Marriage Status in Mammoth Spring
Out of a total of 368 households in Mammoth Spring, 263 (71.5%) are family households, while 105 (28.5%) are nonfamily households. The most numerous type of family households are 2-person households, comprising 123, and the most common type of nonfamily households are 1-person households, comprising 101.
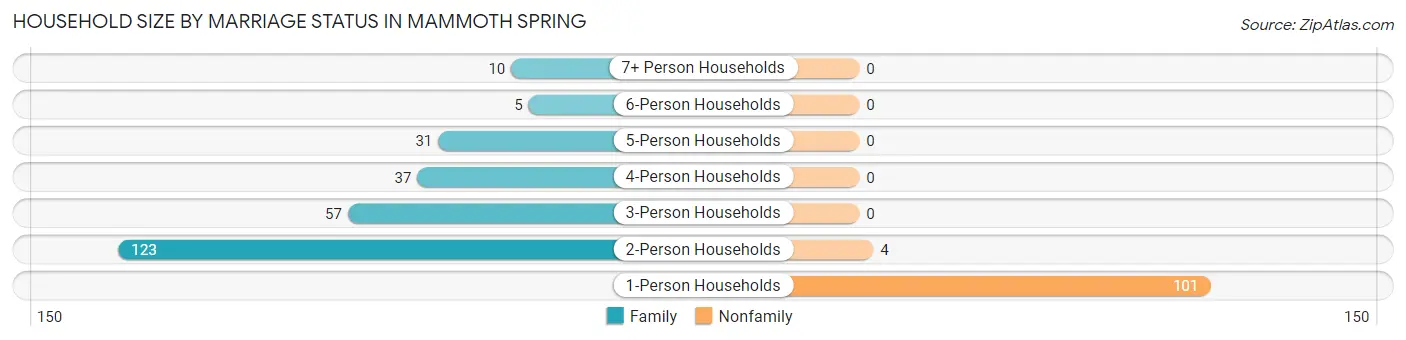
| Household Size | Family Households | Nonfamily Households |
| 1-Person Households | - | 101 (27.5%) |
| 2-Person Households | 123 (33.4%) | 4 (1.1%) |
| 3-Person Households | 57 (15.5%) | 0 (0.0%) |
| 4-Person Households | 37 (10.1%) | 0 (0.0%) |
| 5-Person Households | 31 (8.4%) | 0 (0.0%) |
| 6-Person Households | 5 (1.4%) | 0 (0.0%) |
| 7+ Person Households | 10 (2.7%) | 0 (0.0%) |
| Total | 263 (71.5%) | 105 (28.5%) |
Female Fertility in Mammoth Spring
Fertility by Age in Mammoth Spring
Average fertility rate in Mammoth Spring is 91.0 births per 1,000 women. Women in the age bracket of 35 to 50 years have the highest fertility rate with 147.0 births per 1,000 women. Women in the age bracket of 35 to 50 years acount for 71.4% of all women with births.
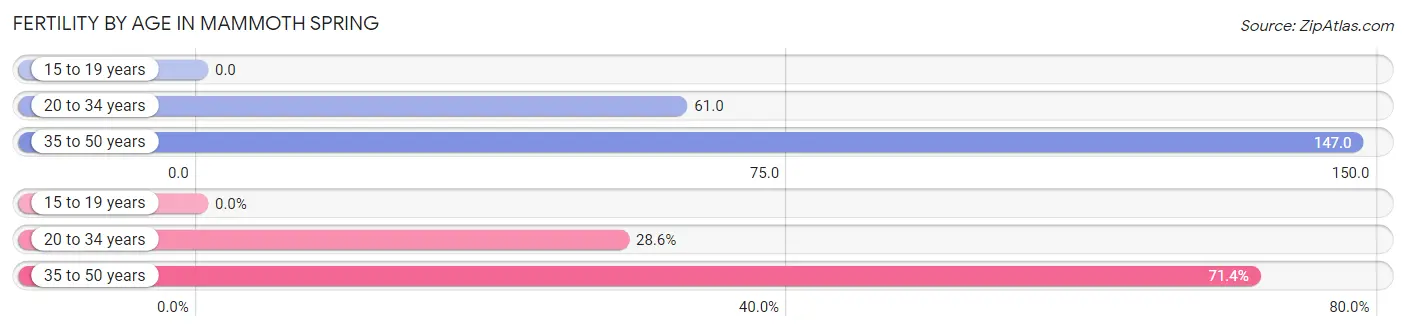
| Age Bracket | Women with Births | Births / 1,000 Women |
| 15 to 19 years | 0 (0.0%) | 0.0 |
| 20 to 34 years | 6 (28.6%) | 61.0 |
| 35 to 50 years | 15 (71.4%) | 147.0 |
| Total | 21 (100.0%) | 91.0 |
Fertility by Age by Marriage Status in Mammoth Spring
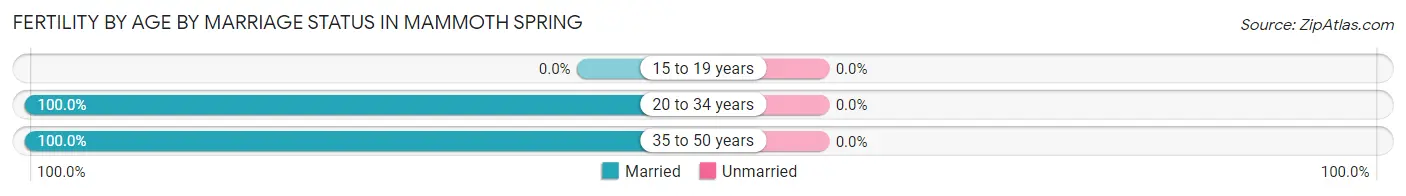
| Age Bracket | Married | Unmarried |
| 15 to 19 years | 0 (0.0%) | 0 (0.0%) |
| 20 to 34 years | 6 (100.0%) | 0 (0.0%) |
| 35 to 50 years | 15 (100.0%) | 0 (0.0%) |
| Total | 21 (100.0%) | 0 (0.0%) |
Fertility by Education in Mammoth Spring
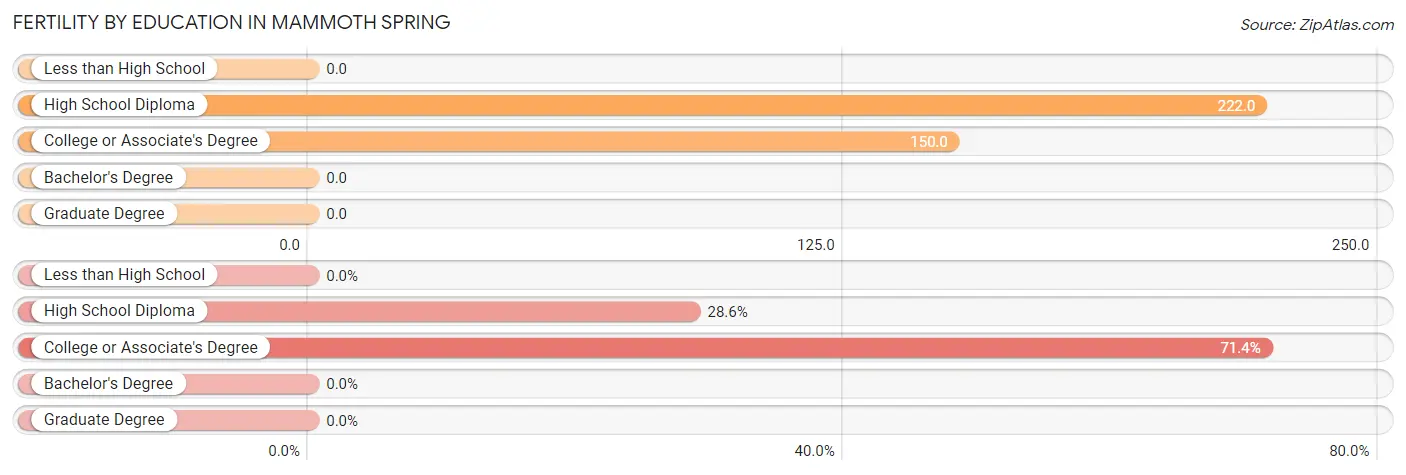
| Educational Attainment | Women with Births | Births / 1,000 Women |
| Less than High School | 0 (0.0%) | 0.0 |
| High School Diploma | 6 (28.6%) | 222.0 |
| College or Associate's Degree | 15 (71.4%) | 150.0 |
| Bachelor's Degree | 0 (0.0%) | 0.0 |
| Graduate Degree | 0 (0.0%) | 0.0 |
| Total | 21 (100.0%) | 91.0 |
Fertility by Education by Marriage Status in Mammoth Spring
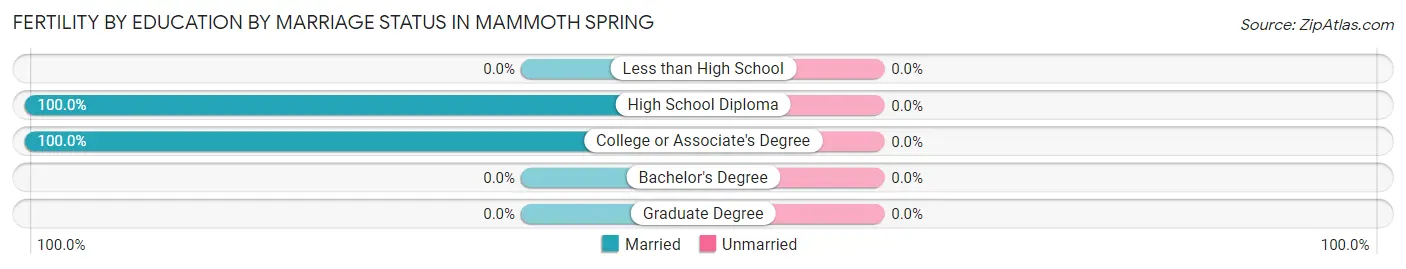
| Educational Attainment | Married | Unmarried |
| Less than High School | 0 (0.0%) | 0 (0.0%) |
| High School Diploma | 6 (100.0%) | 0 (0.0%) |
| College or Associate's Degree | 15 (100.0%) | 0 (0.0%) |
| Bachelor's Degree | 0 (0.0%) | 0 (0.0%) |
| Graduate Degree | 0 (0.0%) | 0 (0.0%) |
| Total | 21 (100.0%) | 0 (0.0%) |
Employment Characteristics in Mammoth Spring
Employment by Class of Employer in Mammoth Spring
Among the 396 employed individuals in Mammoth Spring, private company employees (225 | 56.8%), self-employed (not incorporated) (55 | 13.9%), and local government employees (36 | 9.1%) make up the most common classes of employment.
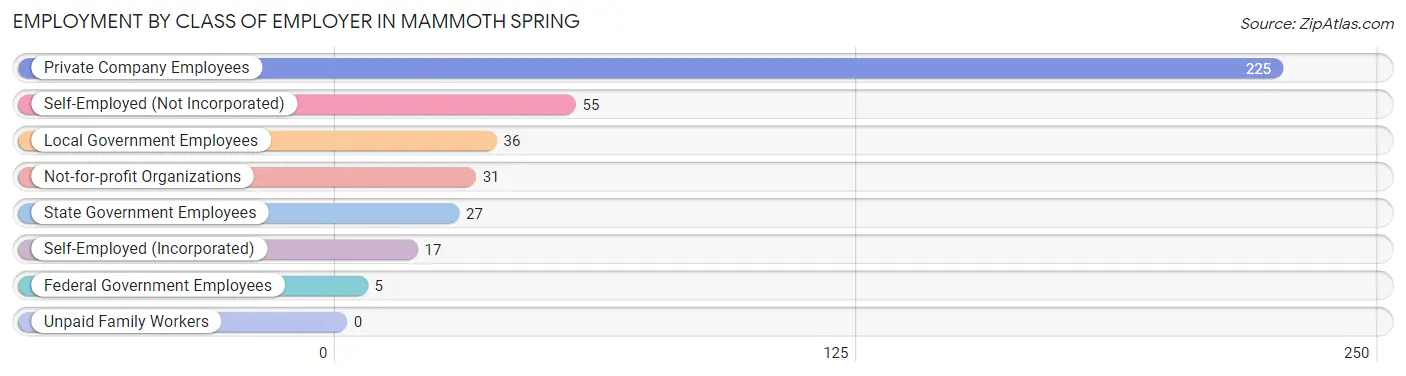
| Employer Class | # Employees | % Employees |
| Private Company Employees | 225 | 56.8% |
| Self-Employed (Incorporated) | 17 | 4.3% |
| Self-Employed (Not Incorporated) | 55 | 13.9% |
| Not-for-profit Organizations | 31 | 7.8% |
| Local Government Employees | 36 | 9.1% |
| State Government Employees | 27 | 6.8% |
| Federal Government Employees | 5 | 1.3% |
| Unpaid Family Workers | 0 | 0.0% |
| Total | 396 | 100.0% |
Employment Status by Age in Mammoth Spring
According to the labor force statistics for Mammoth Spring, out of the total population over 16 years of age (766), 53.7% or 411 individuals are in the labor force, with 3.6% or 15 of them unemployed. The age group with the highest labor force participation rate is 30 to 34 years, with 100.0% or 69 individuals in the labor force. Within the labor force, the 20 to 24 years age range has the highest percentage of unemployed individuals, with 31.3% or 5 of them being unemployed.
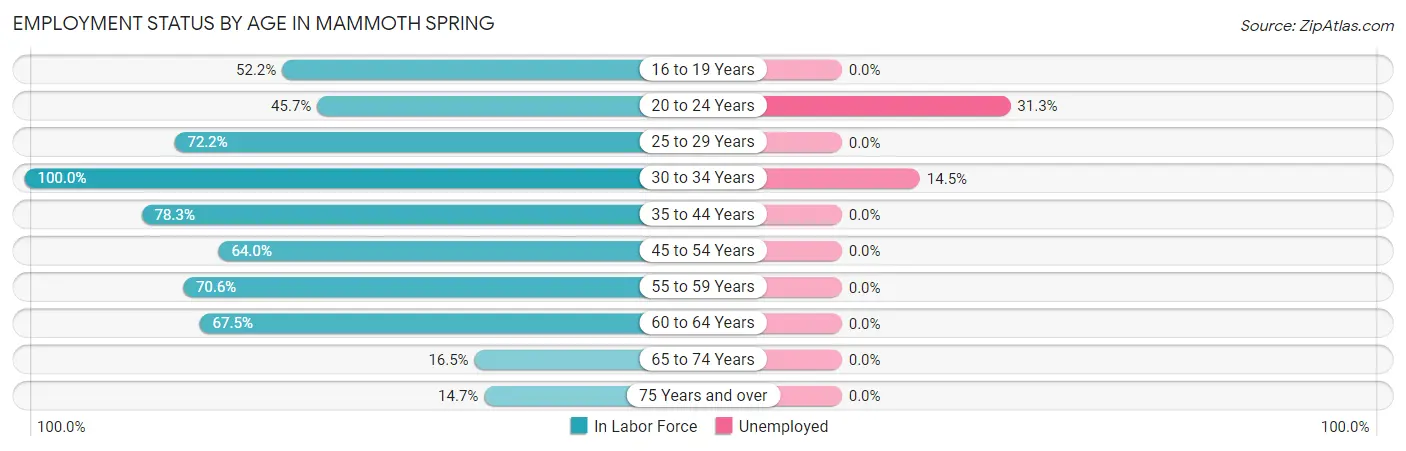
| Age Bracket | In Labor Force | Unemployed |
| 16 to 19 Years | 12 (52.2%) | 0 (0.0%) |
| 20 to 24 Years | 16 (45.7%) | 5 (31.3%) |
| 25 to 29 Years | 26 (72.2%) | 0 (0.0%) |
| 30 to 34 Years | 69 (100.0%) | 10 (14.5%) |
| 35 to 44 Years | 137 (78.3%) | 0 (0.0%) |
| 45 to 54 Years | 71 (64.0%) | 0 (0.0%) |
| 55 to 59 Years | 12 (70.6%) | 0 (0.0%) |
| 60 to 64 Years | 27 (67.5%) | 0 (0.0%) |
| 65 to 74 Years | 26 (16.5%) | 0 (0.0%) |
| 75 Years and over | 15 (14.7%) | 0 (0.0%) |
| Total | 411 (53.7%) | 15 (3.6%) |
Employment Status by Educational Attainment in Mammoth Spring
According to labor force statistics for Mammoth Spring, 76.3% of individuals (342) out of the total population between 25 and 64 years of age (448) are in the labor force, with 2.9% or 10 of them being unemployed. The group with the highest labor force participation rate are those with the educational attainment of bachelor's degree or higher, with 97.1% or 100 individuals in the labor force. Within the labor force, individuals with college / associate degree education have the highest percentage of unemployment, with 7.7% or 10 of them being unemployed.
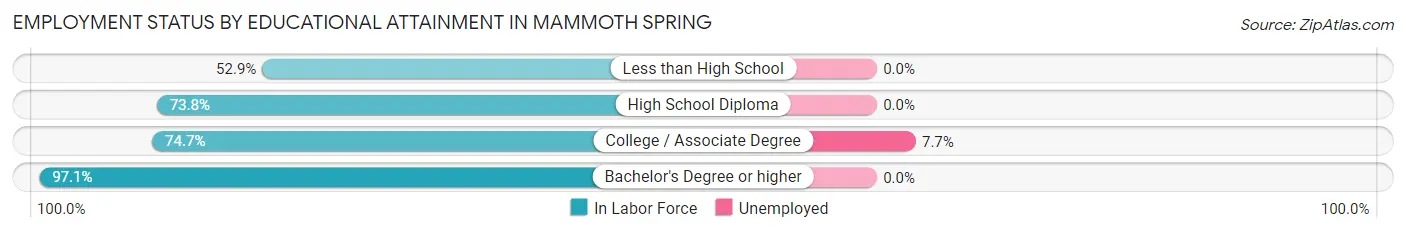
| Educational Attainment | In Labor Force | Unemployed |
| Less than High School | 36 (52.9%) | 0 (0.0%) |
| High School Diploma | 76 (73.8%) | 0 (0.0%) |
| College / Associate Degree | 130 (74.7%) | 13 (7.7%) |
| Bachelor's Degree or higher | 100 (97.1%) | 0 (0.0%) |
| Total | 342 (76.3%) | 13 (2.9%) |
Employment Occupations by Sex in Mammoth Spring
Management, Business, Science and Arts Occupations
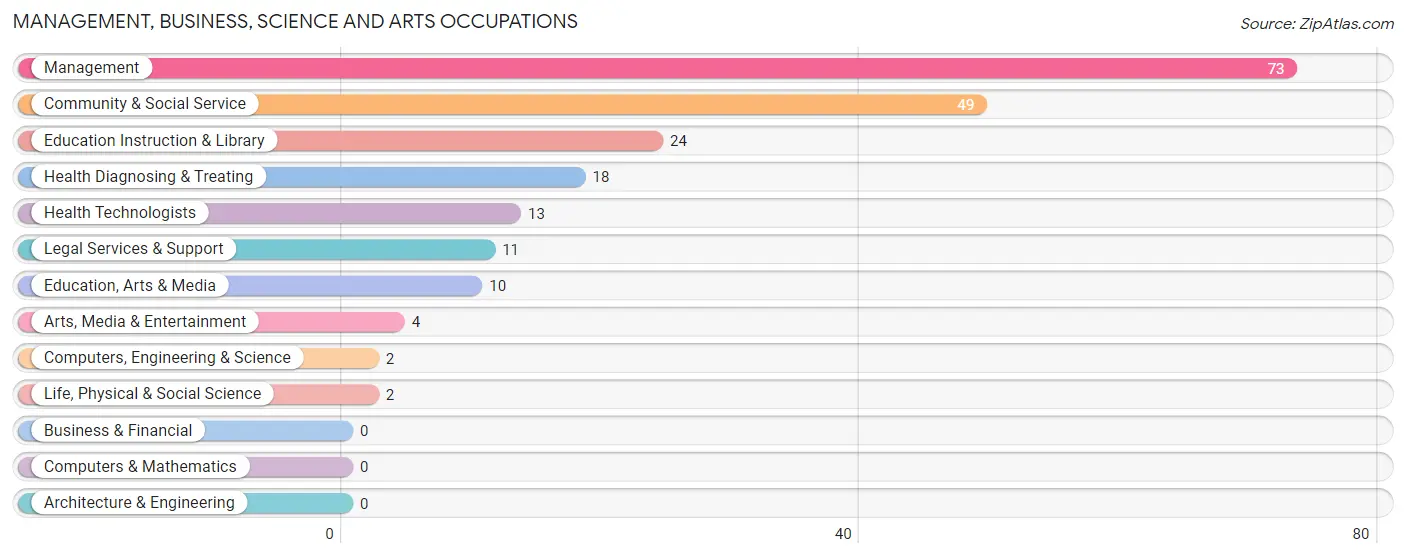
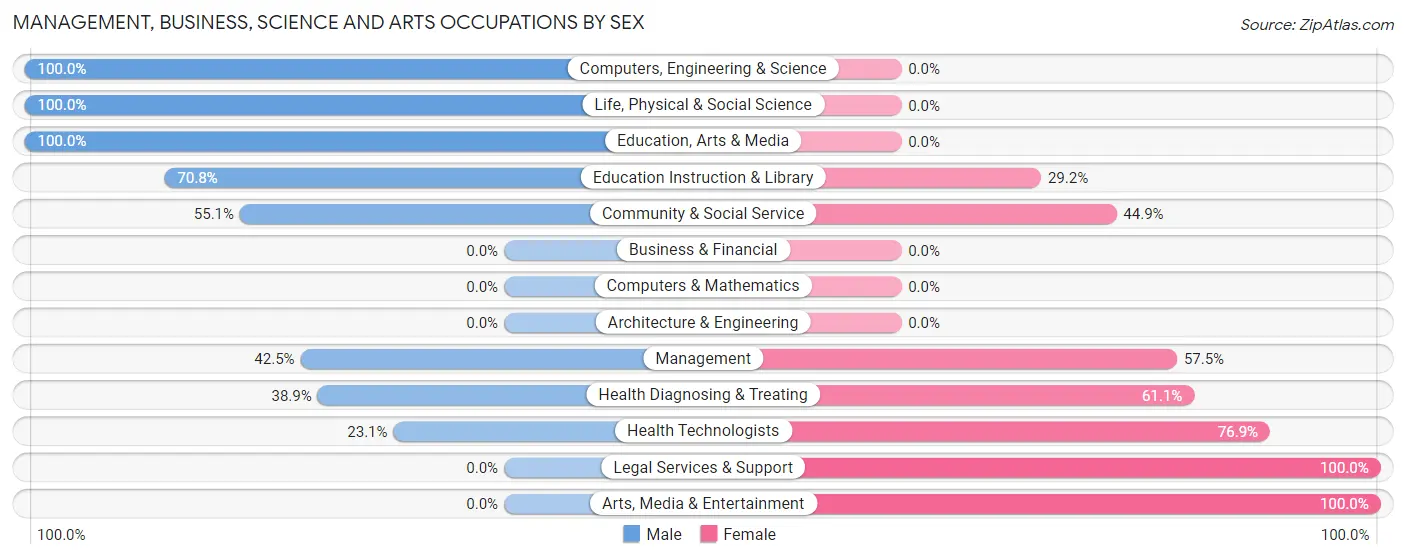
The most common Management, Business, Science and Arts occupations in Mammoth Spring are Management (73 | 18.4%), Community & Social Service (49 | 12.4%), Education Instruction & Library (24 | 6.1%), Health Diagnosing & Treating (18 | 4.5%), and Health Technologists (13 | 3.3%).
Management, Business, Science and Arts Occupations by Sex
Within the Management, Business, Science and Arts occupations in Mammoth Spring, the most male-oriented occupations are Computers, Engineering & Science (100.0%), Life, Physical & Social Science (100.0%), and Education, Arts & Media (100.0%), while the most female-oriented occupations are Legal Services & Support (100.0%), Arts, Media & Entertainment (100.0%), and Health Technologists (76.9%).
| Occupation | Male | Female |
| Management | 31 (42.5%) | 42 (57.5%) |
| Business & Financial | 0 (0.0%) | 0 (0.0%) |
| Computers, Engineering & Science | 2 (100.0%) | 0 (0.0%) |
| Computers & Mathematics | 0 (0.0%) | 0 (0.0%) |
| Architecture & Engineering | 0 (0.0%) | 0 (0.0%) |
| Life, Physical & Social Science | 2 (100.0%) | 0 (0.0%) |
| Community & Social Service | 27 (55.1%) | 22 (44.9%) |
| Education, Arts & Media | 10 (100.0%) | 0 (0.0%) |
| Legal Services & Support | 0 (0.0%) | 11 (100.0%) |
| Education Instruction & Library | 17 (70.8%) | 7 (29.2%) |
| Arts, Media & Entertainment | 0 (0.0%) | 4 (100.0%) |
| Health Diagnosing & Treating | 7 (38.9%) | 11 (61.1%) |
| Health Technologists | 3 (23.1%) | 10 (76.9%) |
| Total (Category) | 67 (47.2%) | 75 (52.8%) |
| Total (Overall) | 218 (55.0%) | 178 (45.0%) |
Services Occupations
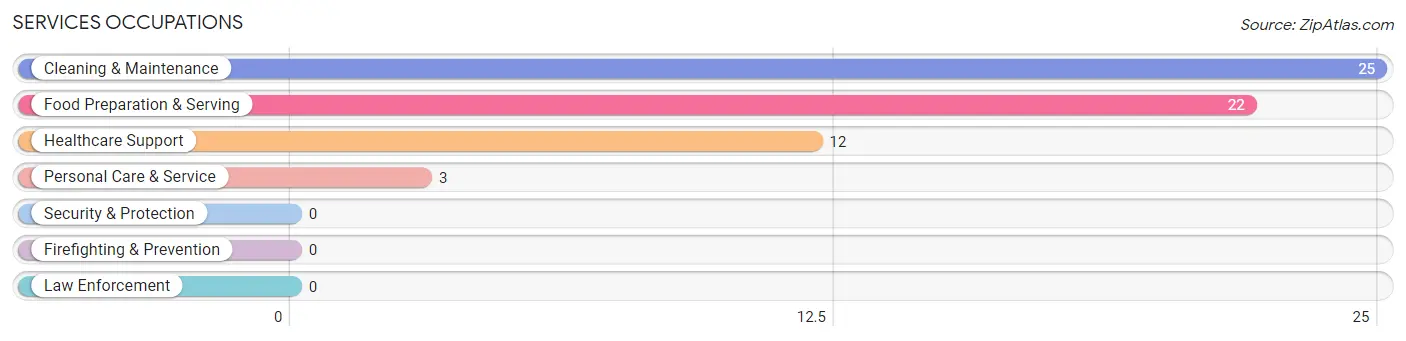
The most common Services occupations in Mammoth Spring are Cleaning & Maintenance (25 | 6.3%), Food Preparation & Serving (22 | 5.6%), Healthcare Support (12 | 3.0%), and Personal Care & Service (3 | 0.8%).
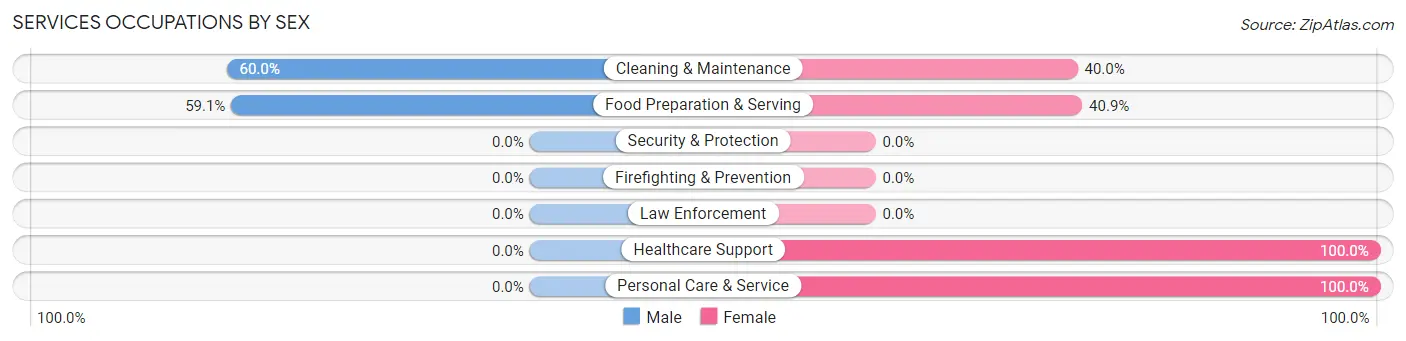
Services Occupations by Sex
Within the Services occupations in Mammoth Spring, the most male-oriented occupations are Cleaning & Maintenance (60.0%), and Food Preparation & Serving (59.1%), while the most female-oriented occupations are Healthcare Support (100.0%), Personal Care & Service (100.0%), and Food Preparation & Serving (40.9%).
| Occupation | Male | Female |
| Healthcare Support | 0 (0.0%) | 12 (100.0%) |
| Security & Protection | 0 (0.0%) | 0 (0.0%) |
| Firefighting & Prevention | 0 (0.0%) | 0 (0.0%) |
| Law Enforcement | 0 (0.0%) | 0 (0.0%) |
| Food Preparation & Serving | 13 (59.1%) | 9 (40.9%) |
| Cleaning & Maintenance | 15 (60.0%) | 10 (40.0%) |
| Personal Care & Service | 0 (0.0%) | 3 (100.0%) |
| Total (Category) | 28 (45.2%) | 34 (54.8%) |
| Total (Overall) | 218 (55.0%) | 178 (45.0%) |
Sales and Office Occupations
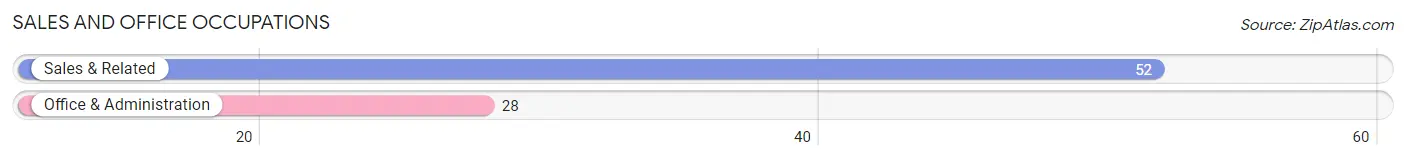
The most common Sales and Office occupations in Mammoth Spring are Sales & Related (52 | 13.1%), and Office & Administration (28 | 7.1%).
Sales and Office Occupations by Sex
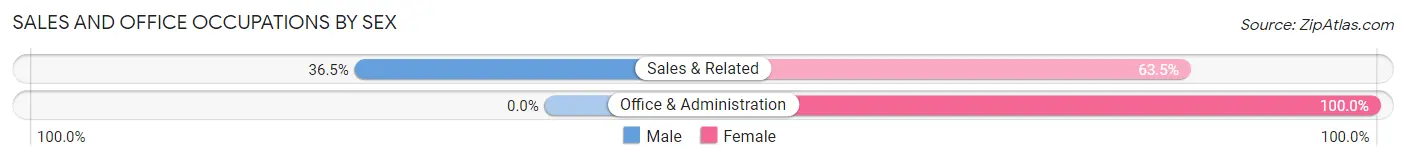
| Occupation | Male | Female |
| Sales & Related | 19 (36.5%) | 33 (63.5%) |
| Office & Administration | 0 (0.0%) | 28 (100.0%) |
| Total (Category) | 19 (23.7%) | 61 (76.2%) |
| Total (Overall) | 218 (55.0%) | 178 (45.0%) |
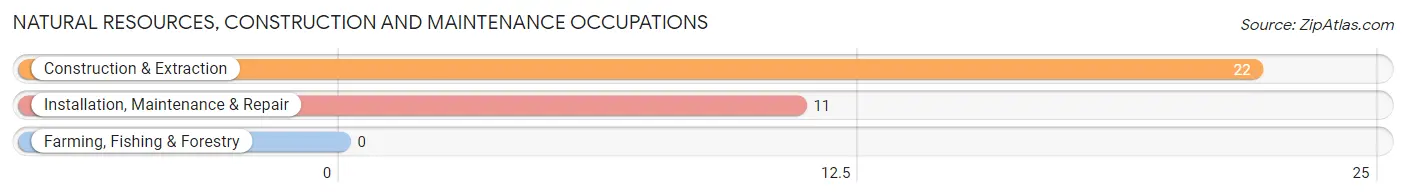
Natural Resources, Construction and Maintenance Occupations
The most common Natural Resources, Construction and Maintenance occupations in Mammoth Spring are Construction & Extraction (22 | 5.6%), and Installation, Maintenance & Repair (11 | 2.8%).
Natural Resources, Construction and Maintenance Occupations by Sex
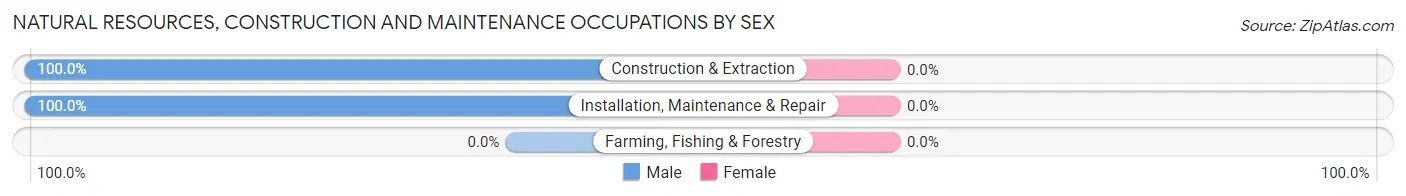
| Occupation | Male | Female |
| Farming, Fishing & Forestry | 0 (0.0%) | 0 (0.0%) |
| Construction & Extraction | 22 (100.0%) | 0 (0.0%) |
| Installation, Maintenance & Repair | 11 (100.0%) | 0 (0.0%) |
| Total (Category) | 33 (100.0%) | 0 (0.0%) |
| Total (Overall) | 218 (55.0%) | 178 (45.0%) |
Production, Transportation and Moving Occupations
The most common Production, Transportation and Moving occupations in Mammoth Spring are Transportation (42 | 10.6%), Material Moving (32 | 8.1%), and Production (5 | 1.3%).
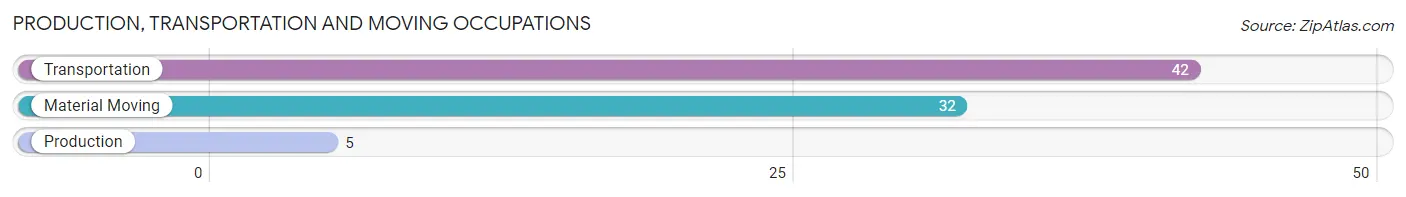
Production, Transportation and Moving Occupations by Sex
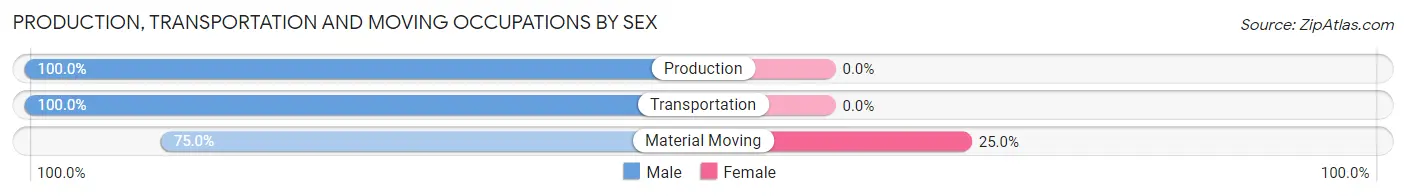
| Occupation | Male | Female |
| Production | 5 (100.0%) | 0 (0.0%) |
| Transportation | 42 (100.0%) | 0 (0.0%) |
| Material Moving | 24 (75.0%) | 8 (25.0%) |
| Total (Category) | 71 (89.9%) | 8 (10.1%) |
| Total (Overall) | 218 (55.0%) | 178 (45.0%) |
Employment Industries by Sex in Mammoth Spring
Employment Industries in Mammoth Spring
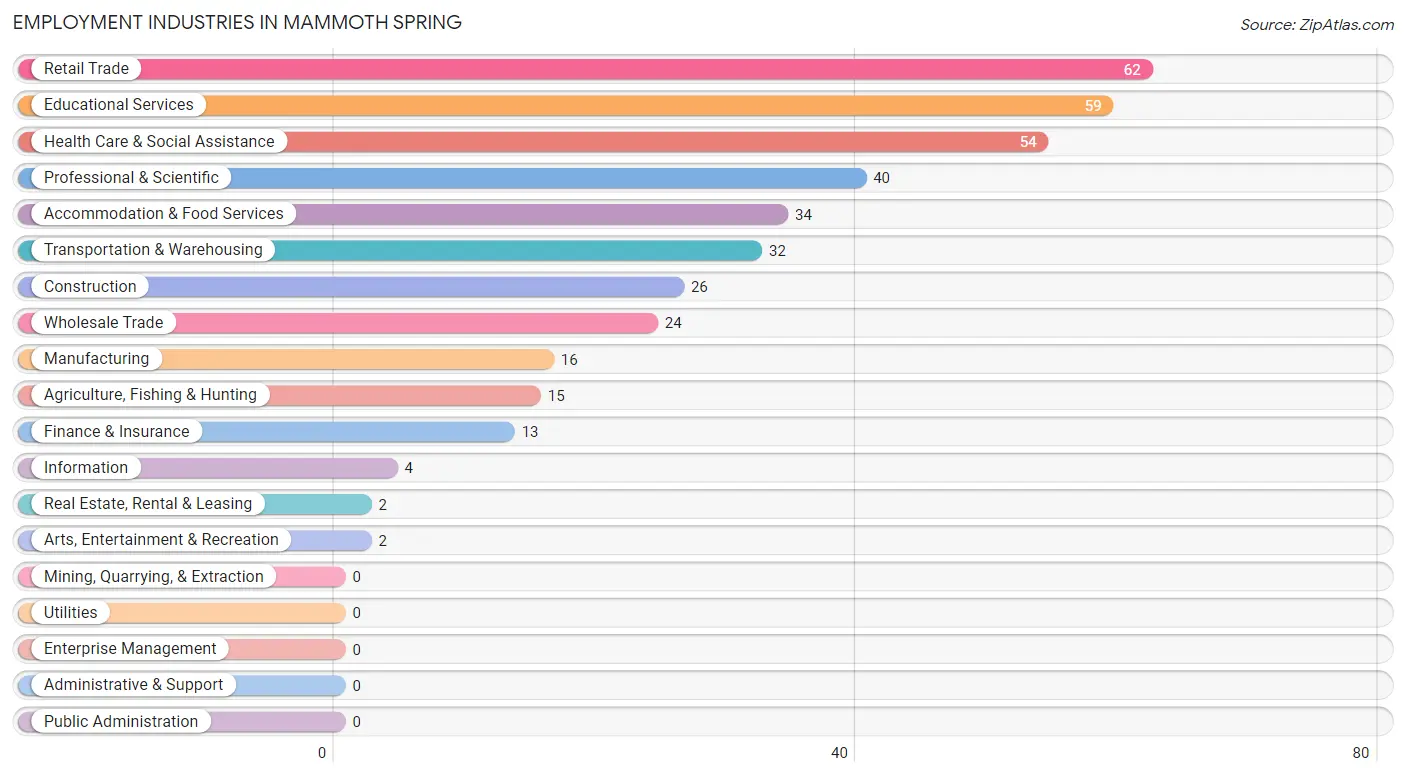
The major employment industries in Mammoth Spring include Retail Trade (62 | 15.7%), Educational Services (59 | 14.9%), Health Care & Social Assistance (54 | 13.6%), Professional & Scientific (40 | 10.1%), and Accommodation & Food Services (34 | 8.6%).
Employment Industries by Sex in Mammoth Spring
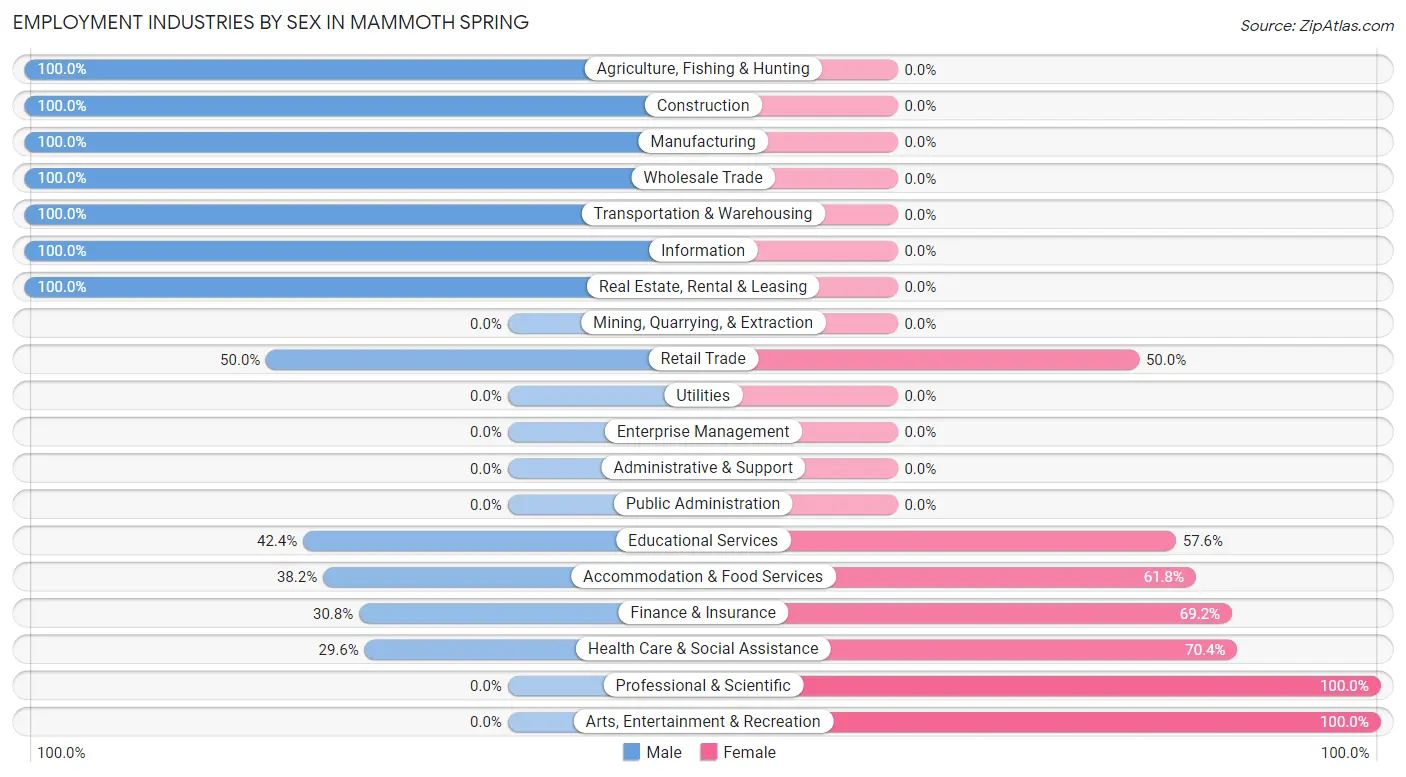
The Mammoth Spring industries that see more men than women are Agriculture, Fishing & Hunting (100.0%), Construction (100.0%), and Manufacturing (100.0%), whereas the industries that tend to have a higher number of women are Professional & Scientific (100.0%), Arts, Entertainment & Recreation (100.0%), and Health Care & Social Assistance (70.4%).
| Industry | Male | Female |
| Agriculture, Fishing & Hunting | 15 (100.0%) | 0 (0.0%) |
| Mining, Quarrying, & Extraction | 0 (0.0%) | 0 (0.0%) |
| Construction | 26 (100.0%) | 0 (0.0%) |
| Manufacturing | 16 (100.0%) | 0 (0.0%) |
| Wholesale Trade | 24 (100.0%) | 0 (0.0%) |
| Retail Trade | 31 (50.0%) | 31 (50.0%) |
| Transportation & Warehousing | 32 (100.0%) | 0 (0.0%) |
| Utilities | 0 (0.0%) | 0 (0.0%) |
| Information | 4 (100.0%) | 0 (0.0%) |
| Finance & Insurance | 4 (30.8%) | 9 (69.2%) |
| Real Estate, Rental & Leasing | 2 (100.0%) | 0 (0.0%) |
| Professional & Scientific | 0 (0.0%) | 40 (100.0%) |
| Enterprise Management | 0 (0.0%) | 0 (0.0%) |
| Administrative & Support | 0 (0.0%) | 0 (0.0%) |
| Educational Services | 25 (42.4%) | 34 (57.6%) |
| Health Care & Social Assistance | 16 (29.6%) | 38 (70.4%) |
| Arts, Entertainment & Recreation | 0 (0.0%) | 2 (100.0%) |
| Accommodation & Food Services | 13 (38.2%) | 21 (61.8%) |
| Public Administration | 0 (0.0%) | 0 (0.0%) |
| Total | 218 (55.0%) | 178 (45.0%) |
Education in Mammoth Spring
School Enrollment in Mammoth Spring
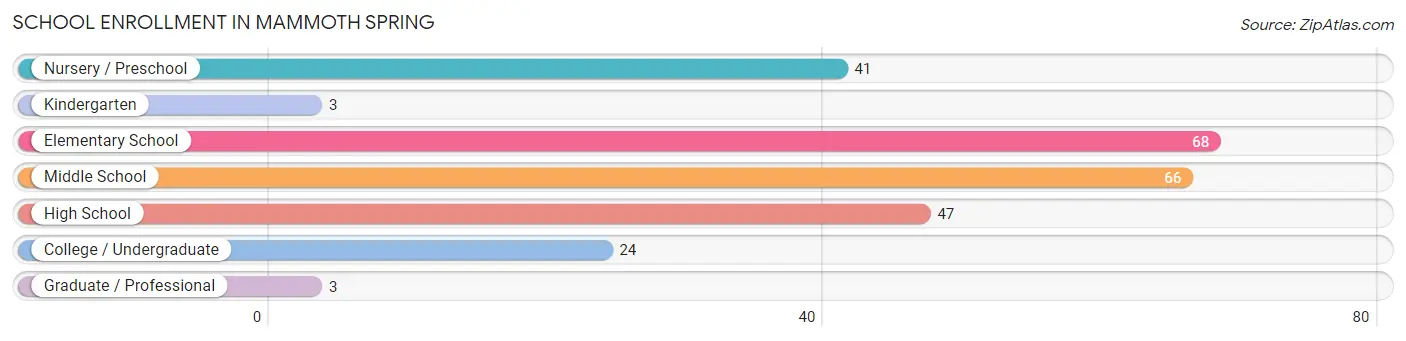
The most common levels of schooling among the 252 students in Mammoth Spring are elementary school (68 | 27.0%), middle school (66 | 26.2%), and high school (47 | 18.6%).
| School Level | # Students | % Students |
| Nursery / Preschool | 41 | 16.3% |
| Kindergarten | 3 | 1.2% |
| Elementary School | 68 | 27.0% |
| Middle School | 66 | 26.2% |
| High School | 47 | 18.6% |
| College / Undergraduate | 24 | 9.5% |
| Graduate / Professional | 3 | 1.2% |
| Total | 252 | 100.0% |
School Enrollment by Age by Funding Source in Mammoth Spring
Out of a total of 252 students who are enrolled in schools in Mammoth Spring, 29 (11.5%) attend a private institution, while the remaining 223 (88.5%) are enrolled in public schools. The age group of 15 to 17 year olds has the highest likelihood of being enrolled in private schools, with 5 (20.0% in the age bracket) enrolled. Conversely, the age group of 5 to 9 year old has the lowest likelihood of being enrolled in a private school, with 55 (100.0% in the age bracket) attending a public institution.
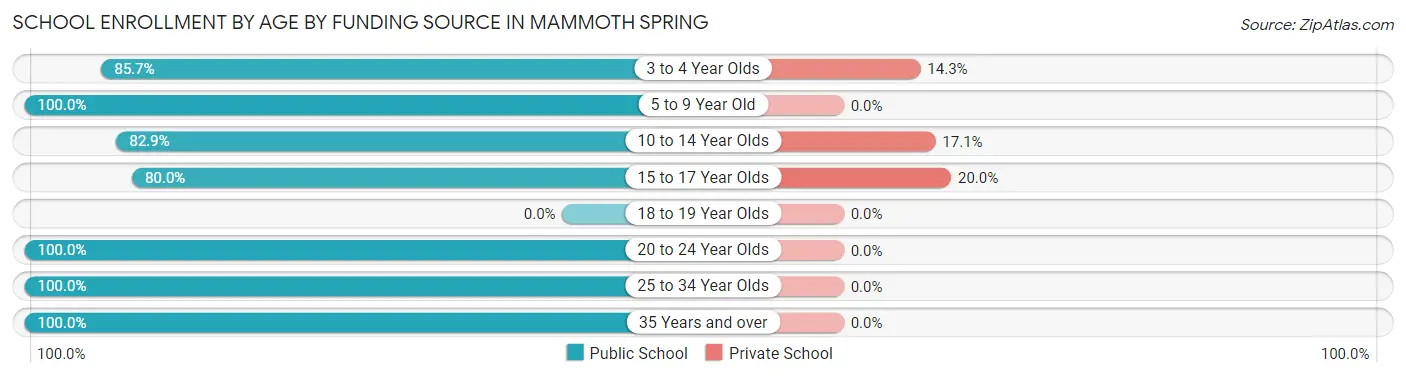
| Age Bracket | Public School | Private School |
| 3 to 4 Year Olds | 24 (85.7%) | 4 (14.3%) |
| 5 to 9 Year Old | 55 (100.0%) | 0 (0.0%) |
| 10 to 14 Year Olds | 97 (82.9%) | 20 (17.1%) |
| 15 to 17 Year Olds | 20 (80.0%) | 5 (20.0%) |
| 18 to 19 Year Olds | 0 (0.0%) | 0 (0.0%) |
| 20 to 24 Year Olds | 13 (100.0%) | 0 (0.0%) |
| 25 to 34 Year Olds | 8 (100.0%) | 0 (0.0%) |
| 35 Years and over | 6 (100.0%) | 0 (0.0%) |
| Total | 223 (88.5%) | 29 (11.5%) |
Educational Attainment by Field of Study in Mammoth Spring
Education (64 | 39.0%), literature & languages (21 | 12.8%), social sciences (19 | 11.6%), bio, nature & agricultural (17 | 10.4%), and liberal arts & history (16 | 9.8%) are the most common fields of study among 164 individuals in Mammoth Spring who have obtained a bachelor's degree or higher.
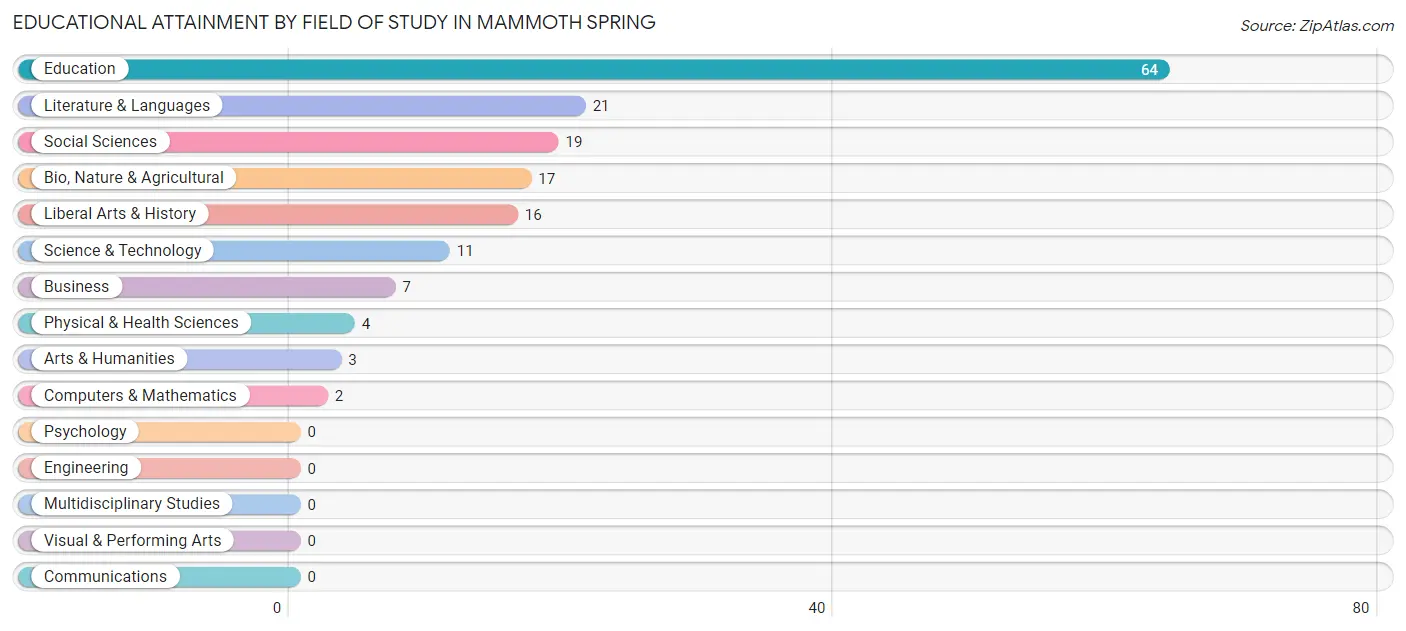
| Field of Study | # Graduates | % Graduates |
| Computers & Mathematics | 2 | 1.2% |
| Bio, Nature & Agricultural | 17 | 10.4% |
| Physical & Health Sciences | 4 | 2.4% |
| Psychology | 0 | 0.0% |
| Social Sciences | 19 | 11.6% |
| Engineering | 0 | 0.0% |
| Multidisciplinary Studies | 0 | 0.0% |
| Science & Technology | 11 | 6.7% |
| Business | 7 | 4.3% |
| Education | 64 | 39.0% |
| Literature & Languages | 21 | 12.8% |
| Liberal Arts & History | 16 | 9.8% |
| Visual & Performing Arts | 0 | 0.0% |
| Communications | 0 | 0.0% |
| Arts & Humanities | 3 | 1.8% |
| Total | 164 | 100.0% |
Transportation & Commute in Mammoth Spring
Vehicle Availability by Sex in Mammoth Spring
The most prevalent vehicle ownership categories in Mammoth Spring are males with 2 vehicles (110, accounting for 50.5%) and females with 2 vehicles (109, making up 61.8%).
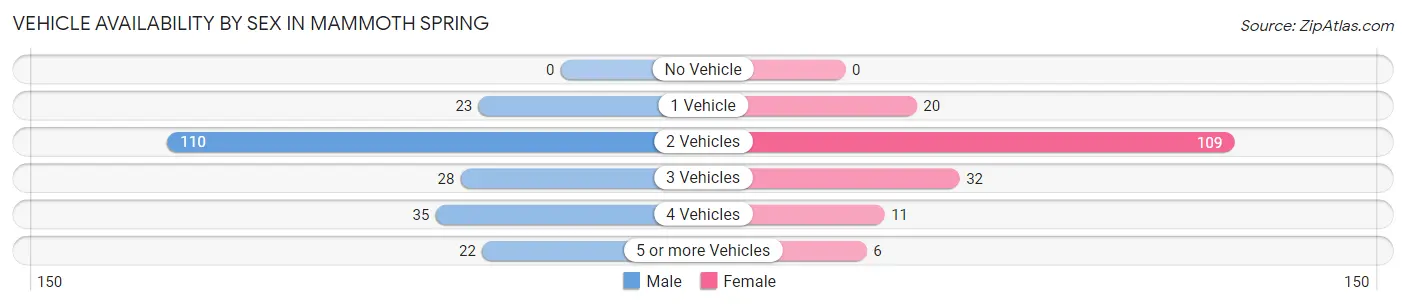
| Vehicles Available | Male | Female |
| No Vehicle | 0 (0.0%) | 0 (0.0%) |
| 1 Vehicle | 23 (10.5%) | 20 (11.2%) |
| 2 Vehicles | 110 (50.5%) | 109 (61.2%) |
| 3 Vehicles | 28 (12.8%) | 32 (18.0%) |
| 4 Vehicles | 35 (16.1%) | 11 (6.2%) |
| 5 or more Vehicles | 22 (10.1%) | 6 (3.4%) |
| Total | 218 (100.0%) | 178 (100.0%) |
Commute Time in Mammoth Spring
The most frequently occuring commute durations in Mammoth Spring are 5 to 9 minutes (92 commuters, 25.7%), less than 5 minutes (88 commuters, 24.6%), and 30 to 34 minutes (57 commuters, 15.9%).
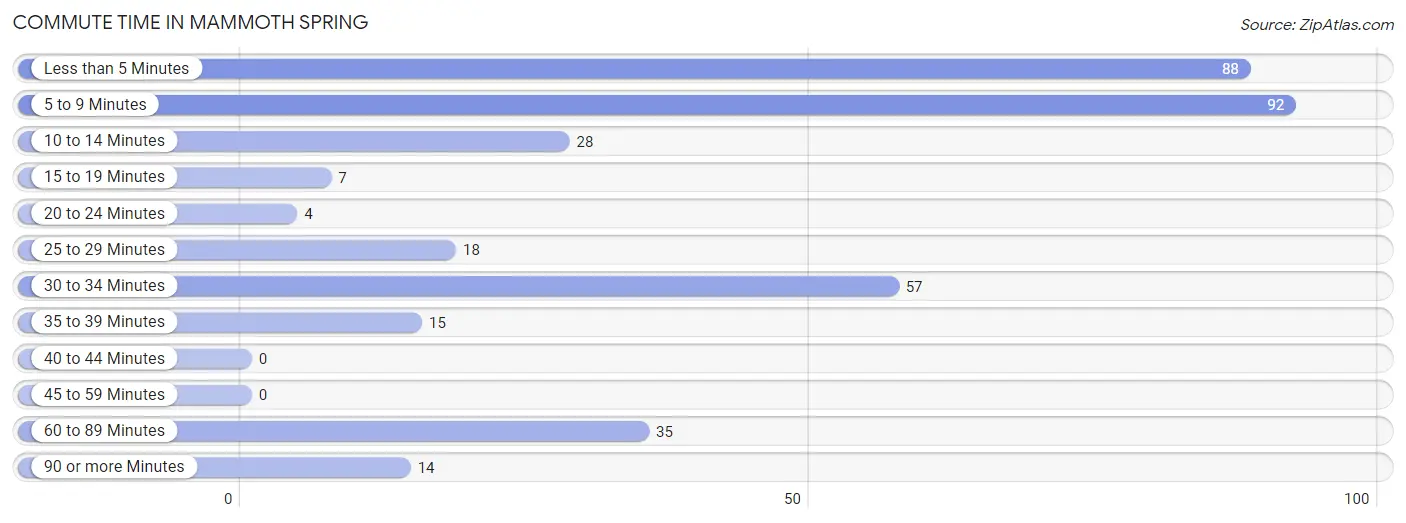
| Commute Time | # Commuters | % Commuters |
| Less than 5 Minutes | 88 | 24.6% |
| 5 to 9 Minutes | 92 | 25.7% |
| 10 to 14 Minutes | 28 | 7.8% |
| 15 to 19 Minutes | 7 | 2.0% |
| 20 to 24 Minutes | 4 | 1.1% |
| 25 to 29 Minutes | 18 | 5.0% |
| 30 to 34 Minutes | 57 | 15.9% |
| 35 to 39 Minutes | 15 | 4.2% |
| 40 to 44 Minutes | 0 | 0.0% |
| 45 to 59 Minutes | 0 | 0.0% |
| 60 to 89 Minutes | 35 | 9.8% |
| 90 or more Minutes | 14 | 3.9% |
Commute Time by Sex in Mammoth Spring
The most common commute times in Mammoth Spring are 5 to 9 minutes (56 commuters, 27.5%) for males and less than 5 minutes (60 commuters, 39.0%) for females.
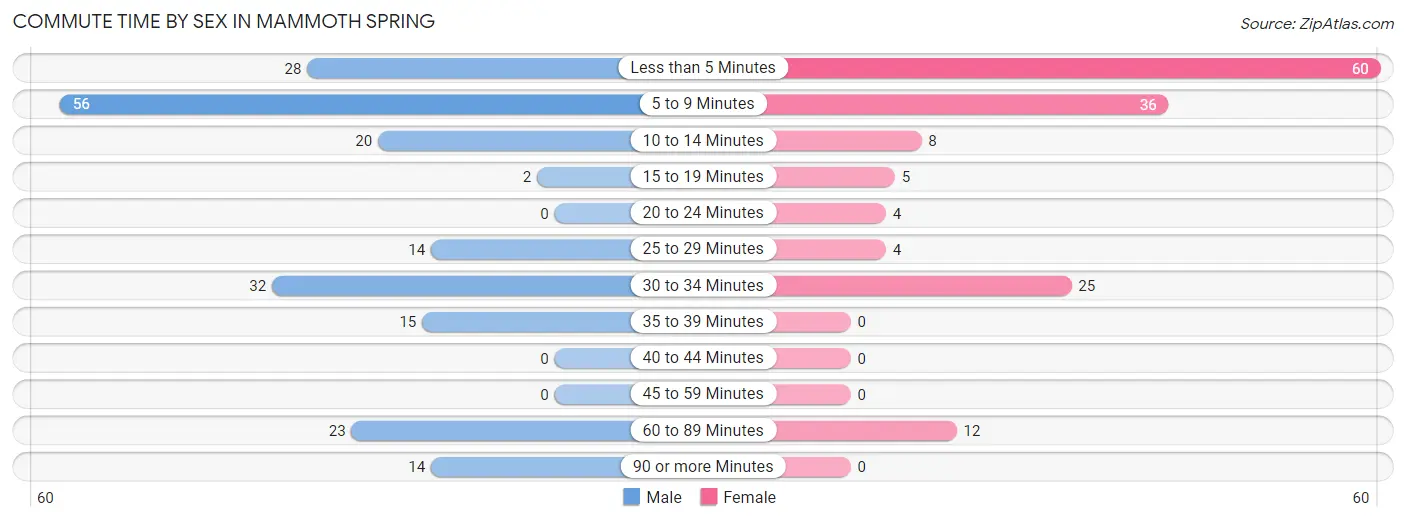
| Commute Time | Male | Female |
| Less than 5 Minutes | 28 (13.7%) | 60 (39.0%) |
| 5 to 9 Minutes | 56 (27.5%) | 36 (23.4%) |
| 10 to 14 Minutes | 20 (9.8%) | 8 (5.2%) |
| 15 to 19 Minutes | 2 (1.0%) | 5 (3.3%) |
| 20 to 24 Minutes | 0 (0.0%) | 4 (2.6%) |
| 25 to 29 Minutes | 14 (6.9%) | 4 (2.6%) |
| 30 to 34 Minutes | 32 (15.7%) | 25 (16.2%) |
| 35 to 39 Minutes | 15 (7.3%) | 0 (0.0%) |
| 40 to 44 Minutes | 0 (0.0%) | 0 (0.0%) |
| 45 to 59 Minutes | 0 (0.0%) | 0 (0.0%) |
| 60 to 89 Minutes | 23 (11.3%) | 12 (7.8%) |
| 90 or more Minutes | 14 (6.9%) | 0 (0.0%) |
Time of Departure to Work by Sex in Mammoth Spring
The most frequent times of departure to work in Mammoth Spring are 12:00 AM to 4:59 AM (35, 17.2%) for males and 7:30 AM to 7:59 AM (33, 21.4%) for females.
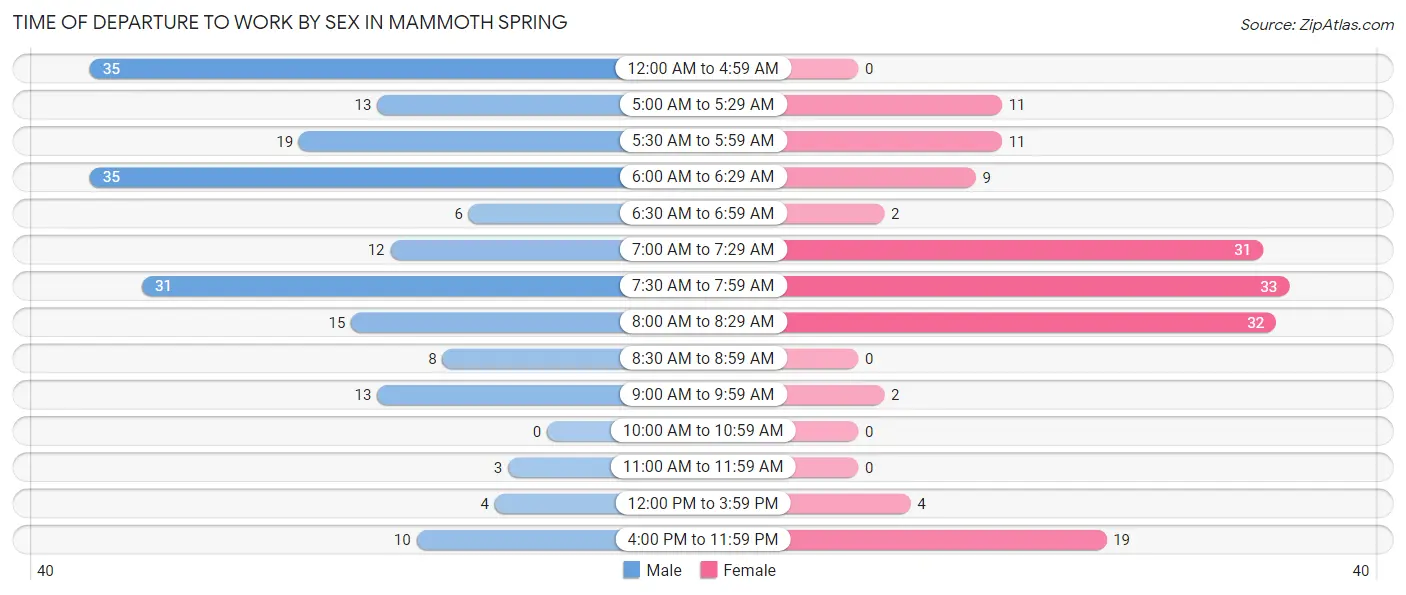
| Time of Departure | Male | Female |
| 12:00 AM to 4:59 AM | 35 (17.2%) | 0 (0.0%) |
| 5:00 AM to 5:29 AM | 13 (6.4%) | 11 (7.1%) |
| 5:30 AM to 5:59 AM | 19 (9.3%) | 11 (7.1%) |
| 6:00 AM to 6:29 AM | 35 (17.2%) | 9 (5.8%) |
| 6:30 AM to 6:59 AM | 6 (2.9%) | 2 (1.3%) |
| 7:00 AM to 7:29 AM | 12 (5.9%) | 31 (20.1%) |
| 7:30 AM to 7:59 AM | 31 (15.2%) | 33 (21.4%) |
| 8:00 AM to 8:29 AM | 15 (7.3%) | 32 (20.8%) |
| 8:30 AM to 8:59 AM | 8 (3.9%) | 0 (0.0%) |
| 9:00 AM to 9:59 AM | 13 (6.4%) | 2 (1.3%) |
| 10:00 AM to 10:59 AM | 0 (0.0%) | 0 (0.0%) |
| 11:00 AM to 11:59 AM | 3 (1.5%) | 0 (0.0%) |
| 12:00 PM to 3:59 PM | 4 (2.0%) | 4 (2.6%) |
| 4:00 PM to 11:59 PM | 10 (4.9%) | 19 (12.3%) |
| Total | 204 (100.0%) | 154 (100.0%) |
Housing Occupancy in Mammoth Spring
Occupancy by Ownership in Mammoth Spring
Of the total 368 dwellings in Mammoth Spring, owner-occupied units account for 290 (78.8%), while renter-occupied units make up 78 (21.2%).
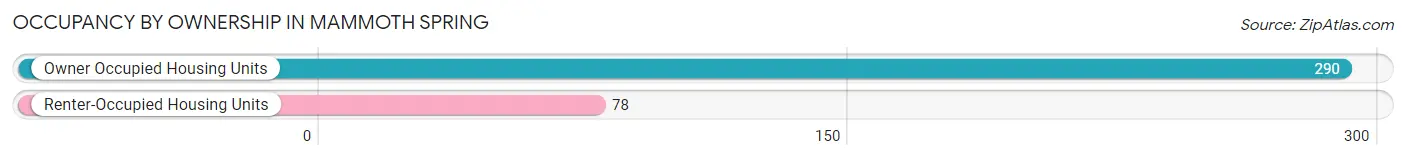
| Occupancy | # Housing Units | % Housing Units |
| Owner Occupied Housing Units | 290 | 78.8% |
| Renter-Occupied Housing Units | 78 | 21.2% |
| Total Occupied Housing Units | 368 | 100.0% |
Occupancy by Household Size in Mammoth Spring
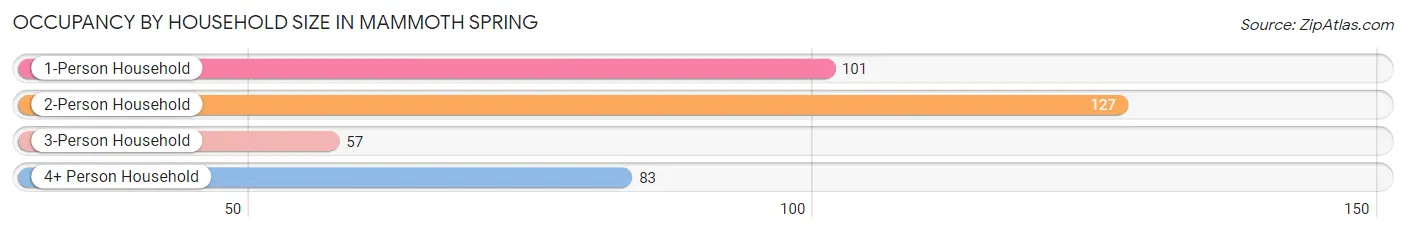
| Household Size | # Housing Units | % Housing Units |
| 1-Person Household | 101 | 27.5% |
| 2-Person Household | 127 | 34.5% |
| 3-Person Household | 57 | 15.5% |
| 4+ Person Household | 83 | 22.6% |
| Total Housing Units | 368 | 100.0% |
Occupancy by Ownership by Household Size in Mammoth Spring
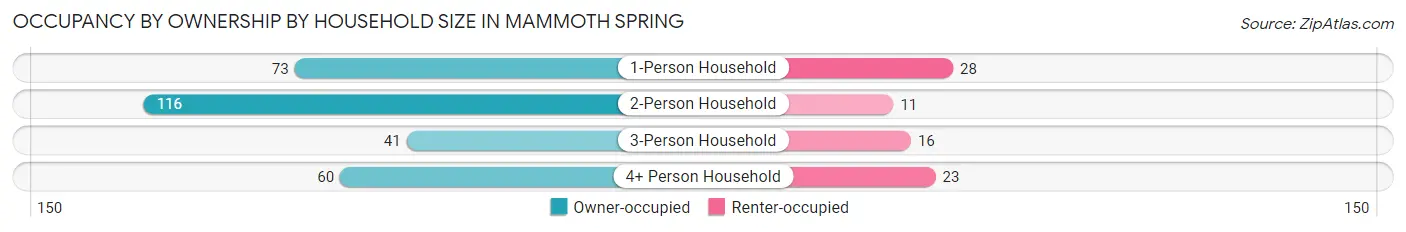
| Household Size | Owner-occupied | Renter-occupied |
| 1-Person Household | 73 (72.3%) | 28 (27.7%) |
| 2-Person Household | 116 (91.3%) | 11 (8.7%) |
| 3-Person Household | 41 (71.9%) | 16 (28.1%) |
| 4+ Person Household | 60 (72.3%) | 23 (27.7%) |
| Total Housing Units | 290 (78.8%) | 78 (21.2%) |
Occupancy by Educational Attainment in Mammoth Spring
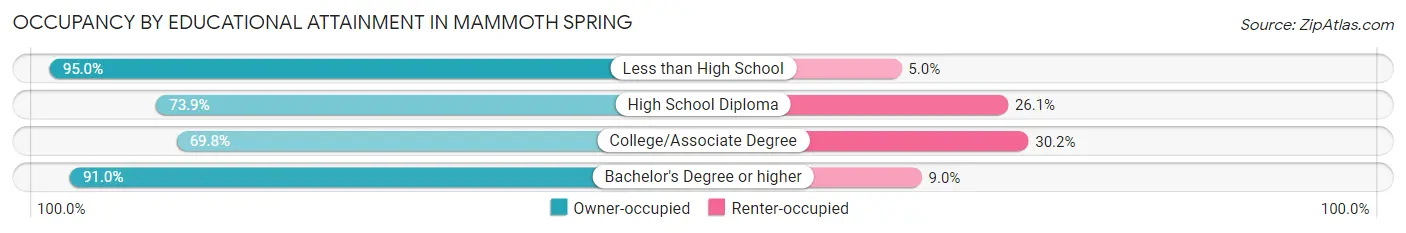
| Household Size | Owner-occupied | Renter-occupied |
| Less than High School | 19 (95.0%) | 1 (5.0%) |
| High School Diploma | 82 (73.9%) | 29 (26.1%) |
| College/Associate Degree | 88 (69.8%) | 38 (30.2%) |
| Bachelor's Degree or higher | 101 (91.0%) | 10 (9.0%) |
Occupancy by Age of Householder in Mammoth Spring
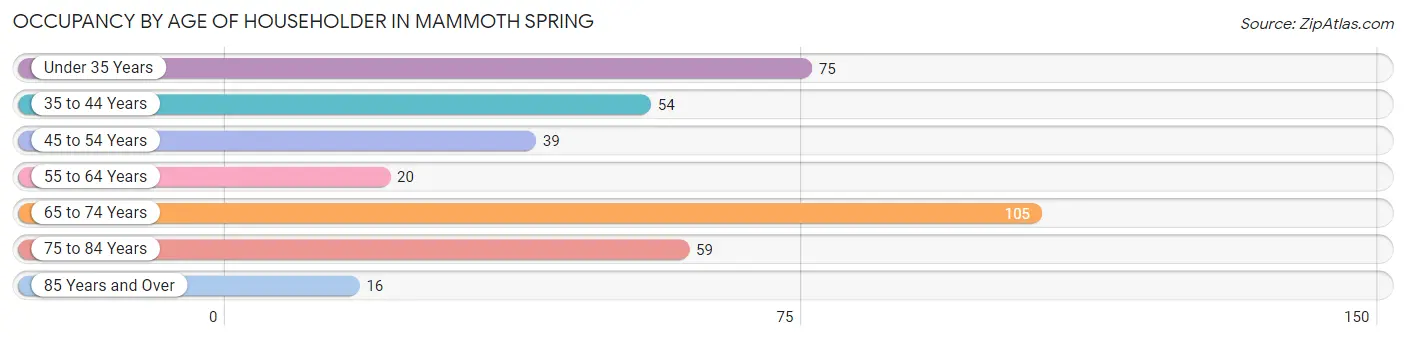
| Age Bracket | # Households | % Households |
| Under 35 Years | 75 | 20.4% |
| 35 to 44 Years | 54 | 14.7% |
| 45 to 54 Years | 39 | 10.6% |
| 55 to 64 Years | 20 | 5.4% |
| 65 to 74 Years | 105 | 28.5% |
| 75 to 84 Years | 59 | 16.0% |
| 85 Years and Over | 16 | 4.3% |
| Total | 368 | 100.0% |
Housing Finances in Mammoth Spring
Median Income by Occupancy in Mammoth Spring
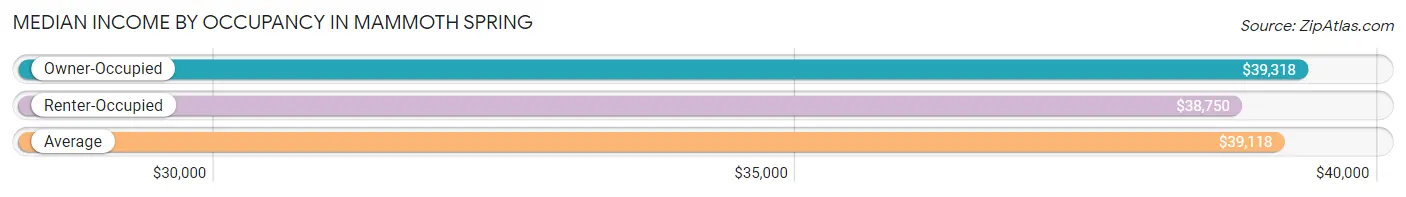
| Occupancy Type | # Households | Median Income |
| Owner-Occupied | 290 (78.8%) | $39,318 |
| Renter-Occupied | 78 (21.2%) | $38,750 |
| Average | 368 (100.0%) | $39,118 |
Occupancy by Householder Income Bracket in Mammoth Spring
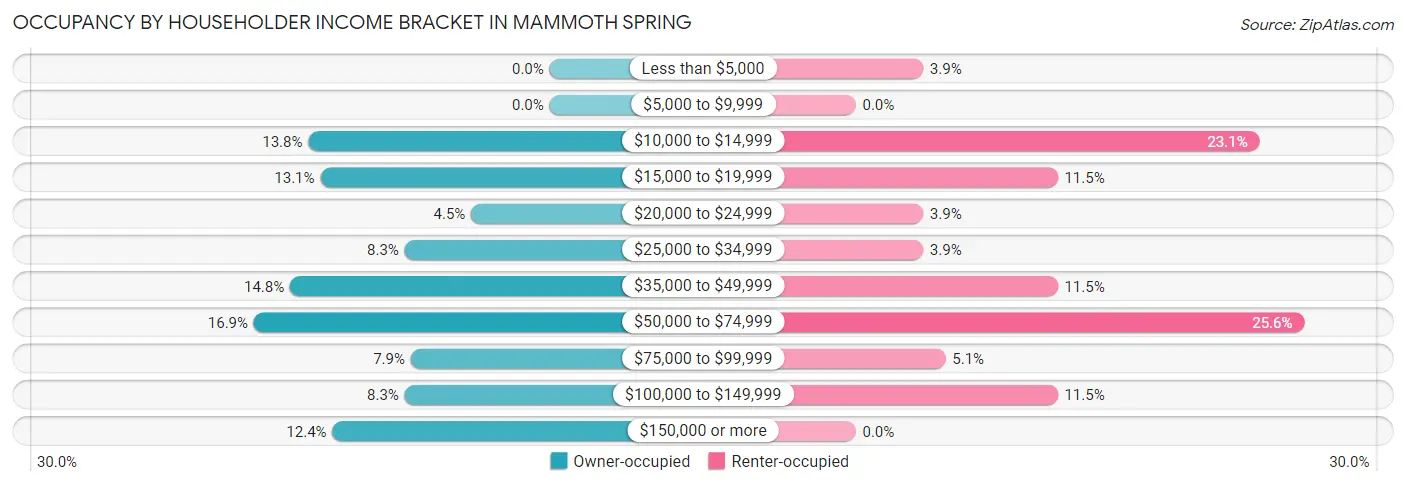
| Income Bracket | Owner-occupied | Renter-occupied |
| Less than $5,000 | 0 (0.0%) | 3 (3.8%) |
| $5,000 to $9,999 | 0 (0.0%) | 0 (0.0%) |
| $10,000 to $14,999 | 40 (13.8%) | 18 (23.1%) |
| $15,000 to $19,999 | 38 (13.1%) | 9 (11.5%) |
| $20,000 to $24,999 | 13 (4.5%) | 3 (3.8%) |
| $25,000 to $34,999 | 24 (8.3%) | 3 (3.8%) |
| $35,000 to $49,999 | 43 (14.8%) | 9 (11.5%) |
| $50,000 to $74,999 | 49 (16.9%) | 20 (25.6%) |
| $75,000 to $99,999 | 23 (7.9%) | 4 (5.1%) |
| $100,000 to $149,999 | 24 (8.3%) | 9 (11.5%) |
| $150,000 or more | 36 (12.4%) | 0 (0.0%) |
| Total | 290 (100.0%) | 78 (100.0%) |
Monthly Housing Cost Tiers in Mammoth Spring
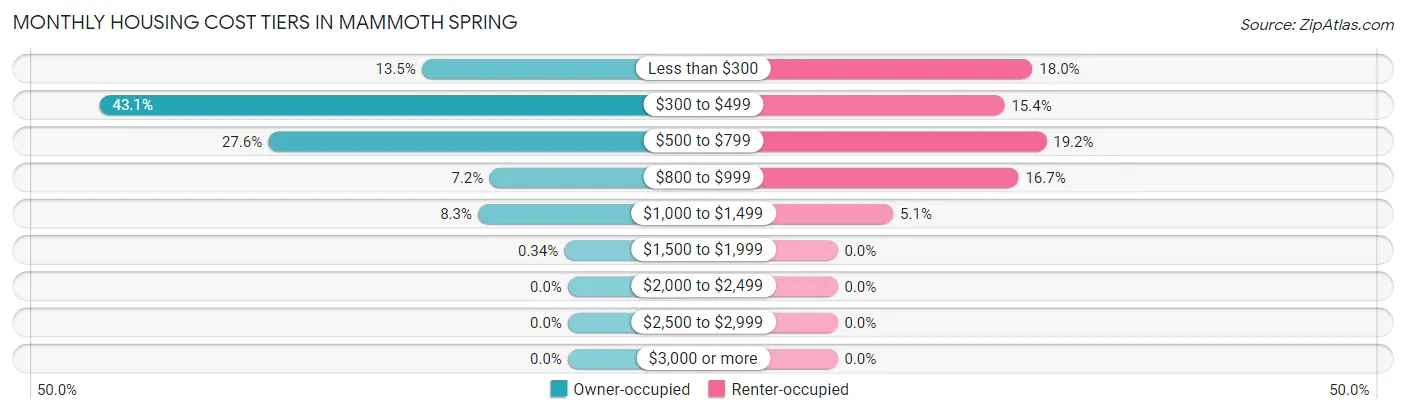
| Monthly Cost | Owner-occupied | Renter-occupied |
| Less than $300 | 39 (13.5%) | 14 (17.9%) |
| $300 to $499 | 125 (43.1%) | 12 (15.4%) |
| $500 to $799 | 80 (27.6%) | 15 (19.2%) |
| $800 to $999 | 21 (7.2%) | 13 (16.7%) |
| $1,000 to $1,499 | 24 (8.3%) | 4 (5.1%) |
| $1,500 to $1,999 | 1 (0.3%) | 0 (0.0%) |
| $2,000 to $2,499 | 0 (0.0%) | 0 (0.0%) |
| $2,500 to $2,999 | 0 (0.0%) | 0 (0.0%) |
| $3,000 or more | 0 (0.0%) | 0 (0.0%) |
| Total | 290 (100.0%) | 78 (100.0%) |
Physical Housing Characteristics in Mammoth Spring
Housing Structures in Mammoth Spring
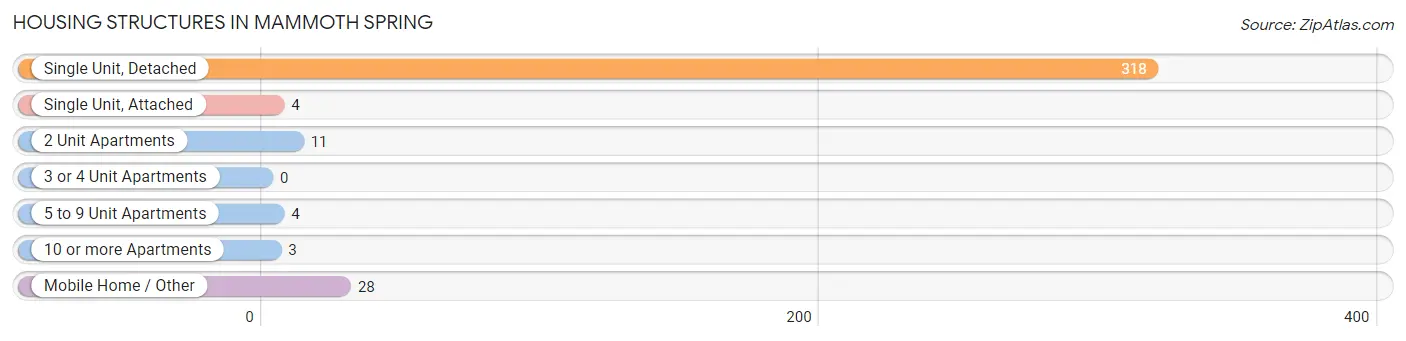
| Structure Type | # Housing Units | % Housing Units |
| Single Unit, Detached | 318 | 86.4% |
| Single Unit, Attached | 4 | 1.1% |
| 2 Unit Apartments | 11 | 3.0% |
| 3 or 4 Unit Apartments | 0 | 0.0% |
| 5 to 9 Unit Apartments | 4 | 1.1% |
| 10 or more Apartments | 3 | 0.8% |
| Mobile Home / Other | 28 | 7.6% |
| Total | 368 | 100.0% |
Housing Structures by Occupancy in Mammoth Spring
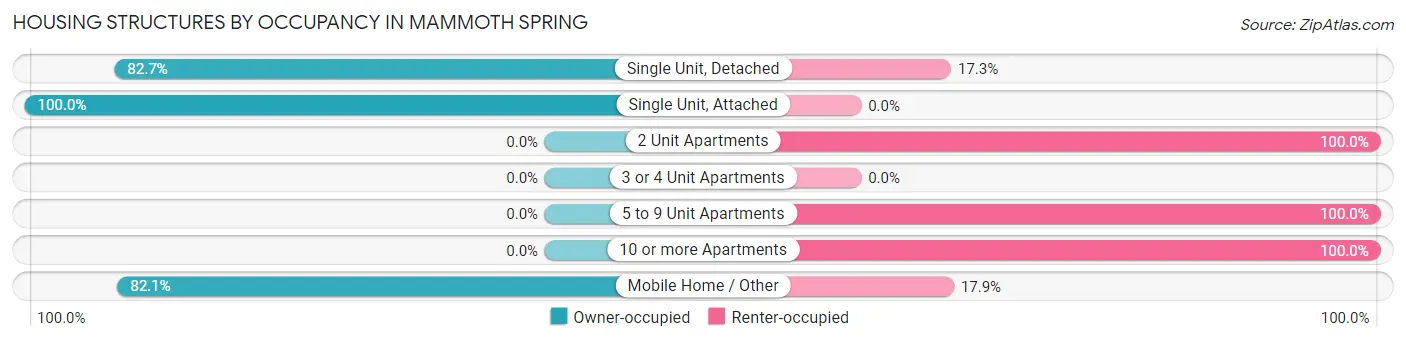
| Structure Type | Owner-occupied | Renter-occupied |
| Single Unit, Detached | 263 (82.7%) | 55 (17.3%) |
| Single Unit, Attached | 4 (100.0%) | 0 (0.0%) |
| 2 Unit Apartments | 0 (0.0%) | 11 (100.0%) |
| 3 or 4 Unit Apartments | 0 (0.0%) | 0 (0.0%) |
| 5 to 9 Unit Apartments | 0 (0.0%) | 4 (100.0%) |
| 10 or more Apartments | 0 (0.0%) | 3 (100.0%) |
| Mobile Home / Other | 23 (82.1%) | 5 (17.9%) |
| Total | 290 (78.8%) | 78 (21.2%) |
Housing Structures by Number of Rooms in Mammoth Spring
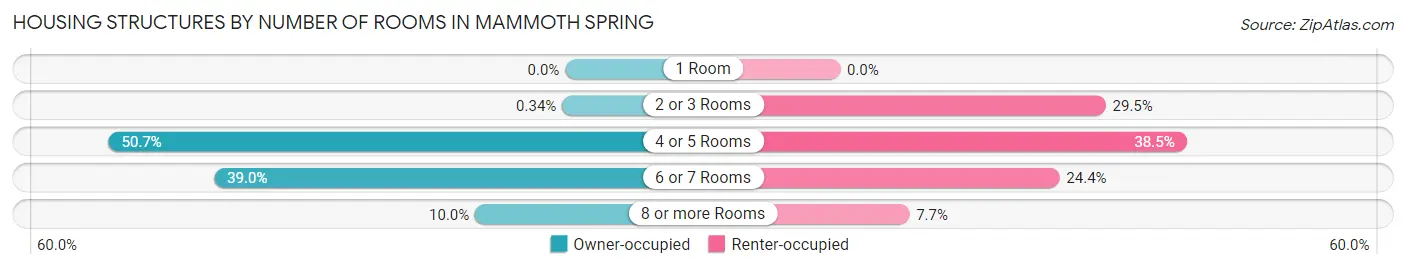
| Number of Rooms | Owner-occupied | Renter-occupied |
| 1 Room | 0 (0.0%) | 0 (0.0%) |
| 2 or 3 Rooms | 1 (0.3%) | 23 (29.5%) |
| 4 or 5 Rooms | 147 (50.7%) | 30 (38.5%) |
| 6 or 7 Rooms | 113 (39.0%) | 19 (24.4%) |
| 8 or more Rooms | 29 (10.0%) | 6 (7.7%) |
| Total | 290 (100.0%) | 78 (100.0%) |
Housing Structure by Heating Type in Mammoth Spring
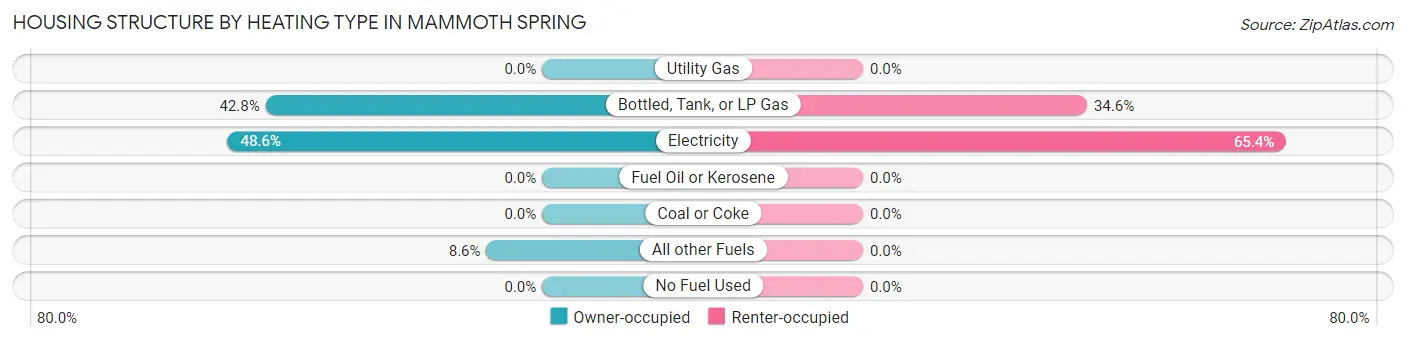
| Heating Type | Owner-occupied | Renter-occupied |
| Utility Gas | 0 (0.0%) | 0 (0.0%) |
| Bottled, Tank, or LP Gas | 124 (42.8%) | 27 (34.6%) |
| Electricity | 141 (48.6%) | 51 (65.4%) |
| Fuel Oil or Kerosene | 0 (0.0%) | 0 (0.0%) |
| Coal or Coke | 0 (0.0%) | 0 (0.0%) |
| All other Fuels | 25 (8.6%) | 0 (0.0%) |
| No Fuel Used | 0 (0.0%) | 0 (0.0%) |
| Total | 290 (100.0%) | 78 (100.0%) |
Household Vehicle Usage in Mammoth Spring
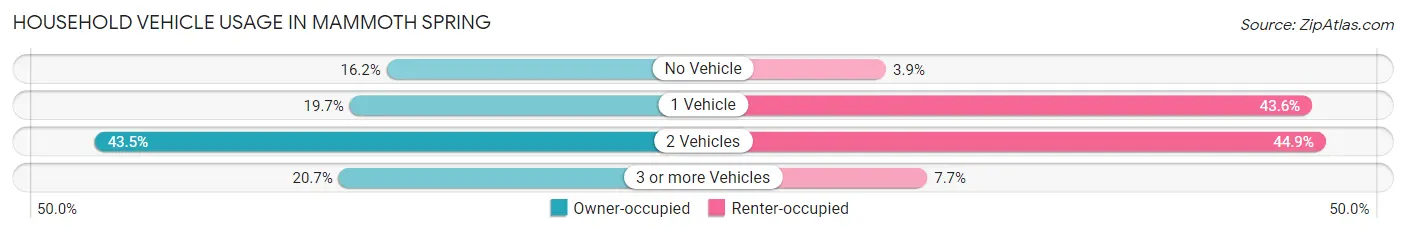
| Vehicles per Household | Owner-occupied | Renter-occupied |
| No Vehicle | 47 (16.2%) | 3 (3.8%) |
| 1 Vehicle | 57 (19.7%) | 34 (43.6%) |
| 2 Vehicles | 126 (43.4%) | 35 (44.9%) |
| 3 or more Vehicles | 60 (20.7%) | 6 (7.7%) |
| Total | 290 (100.0%) | 78 (100.0%) |
Real Estate & Mortgages in Mammoth Spring
Real Estate and Mortgage Overview in Mammoth Spring
| Characteristic | Without Mortgage | With Mortgage |
| Housing Units | 182 | 108 |
| Median Property Value | $90,200 | $100,000 |
| Median Household Income | $36,932 | $11 |
| Monthly Housing Costs | $413 | $0 |
| Real Estate Taxes | $452 | $4 |
Property Value by Mortgage Status in Mammoth Spring
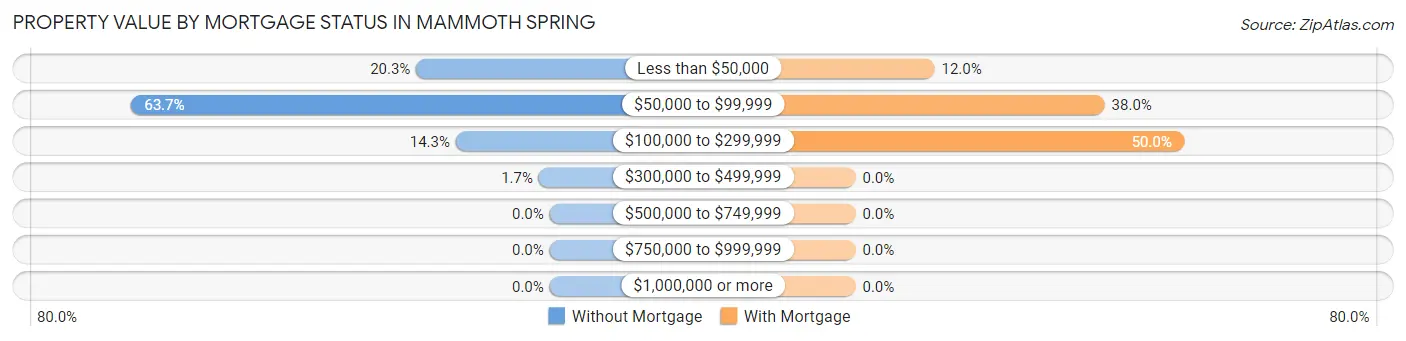
| Property Value | Without Mortgage | With Mortgage |
| Less than $50,000 | 37 (20.3%) | 13 (12.0%) |
| $50,000 to $99,999 | 116 (63.7%) | 41 (38.0%) |
| $100,000 to $299,999 | 26 (14.3%) | 54 (50.0%) |
| $300,000 to $499,999 | 3 (1.7%) | 0 (0.0%) |
| $500,000 to $749,999 | 0 (0.0%) | 0 (0.0%) |
| $750,000 to $999,999 | 0 (0.0%) | 0 (0.0%) |
| $1,000,000 or more | 0 (0.0%) | 0 (0.0%) |
| Total | 182 (100.0%) | 108 (100.0%) |
Household Income by Mortgage Status in Mammoth Spring
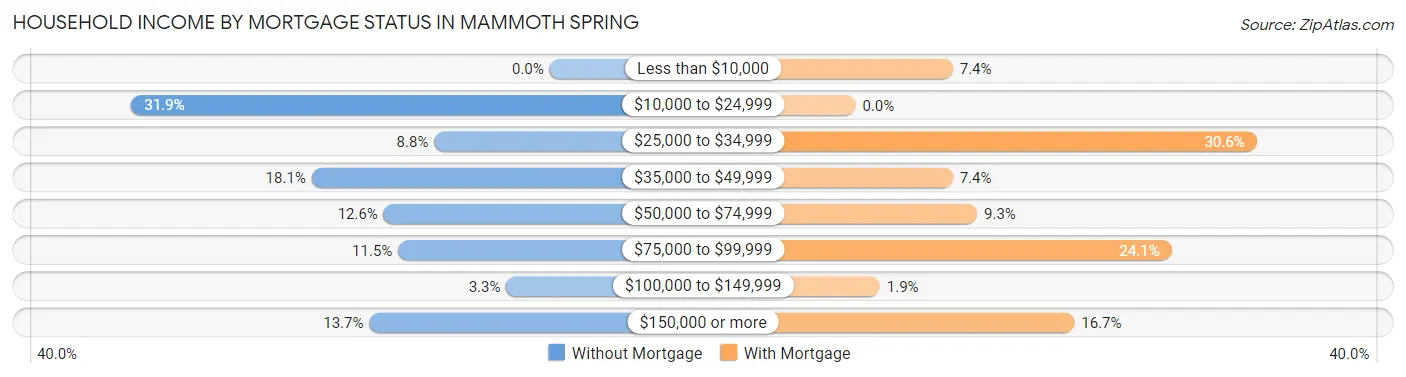
| Household Income | Without Mortgage | With Mortgage |
| Less than $10,000 | 0 (0.0%) | 8 (7.4%) |
| $10,000 to $24,999 | 58 (31.9%) | 0 (0.0%) |
| $25,000 to $34,999 | 16 (8.8%) | 33 (30.6%) |
| $35,000 to $49,999 | 33 (18.1%) | 8 (7.4%) |
| $50,000 to $74,999 | 23 (12.6%) | 10 (9.3%) |
| $75,000 to $99,999 | 21 (11.5%) | 26 (24.1%) |
| $100,000 to $149,999 | 6 (3.3%) | 2 (1.8%) |
| $150,000 or more | 25 (13.7%) | 18 (16.7%) |
| Total | 182 (100.0%) | 108 (100.0%) |
Property Value to Household Income Ratio in Mammoth Spring
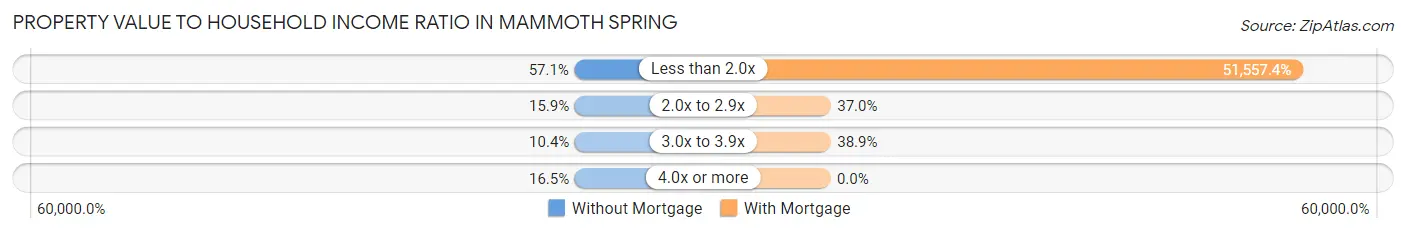
| Value-to-Income Ratio | Without Mortgage | With Mortgage |
| Less than 2.0x | 104 (57.1%) | 55,682 (51,557.4%) |
| 2.0x to 2.9x | 29 (15.9%) | 40 (37.0%) |
| 3.0x to 3.9x | 19 (10.4%) | 42 (38.9%) |
| 4.0x or more | 30 (16.5%) | 0 (0.0%) |
| Total | 182 (100.0%) | 108 (100.0%) |
Real Estate Taxes by Mortgage Status in Mammoth Spring
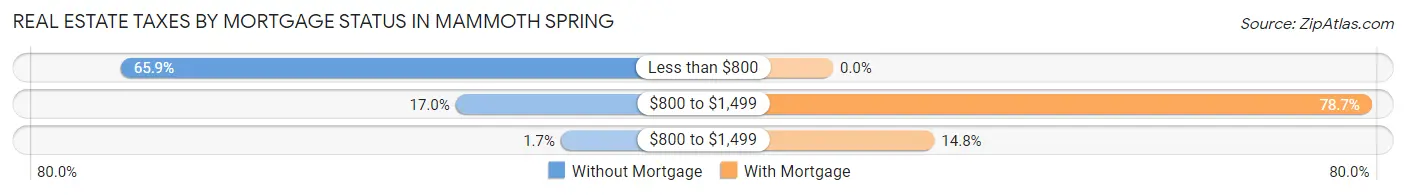
| Property Taxes | Without Mortgage | With Mortgage |
| Less than $800 | 120 (65.9%) | 0 (0.0%) |
| $800 to $1,499 | 31 (17.0%) | 85 (78.7%) |
| $800 to $1,499 | 3 (1.7%) | 16 (14.8%) |
| Total | 182 (100.0%) | 108 (100.0%) |
Health & Disability in Mammoth Spring
Health Insurance Coverage by Age in Mammoth Spring
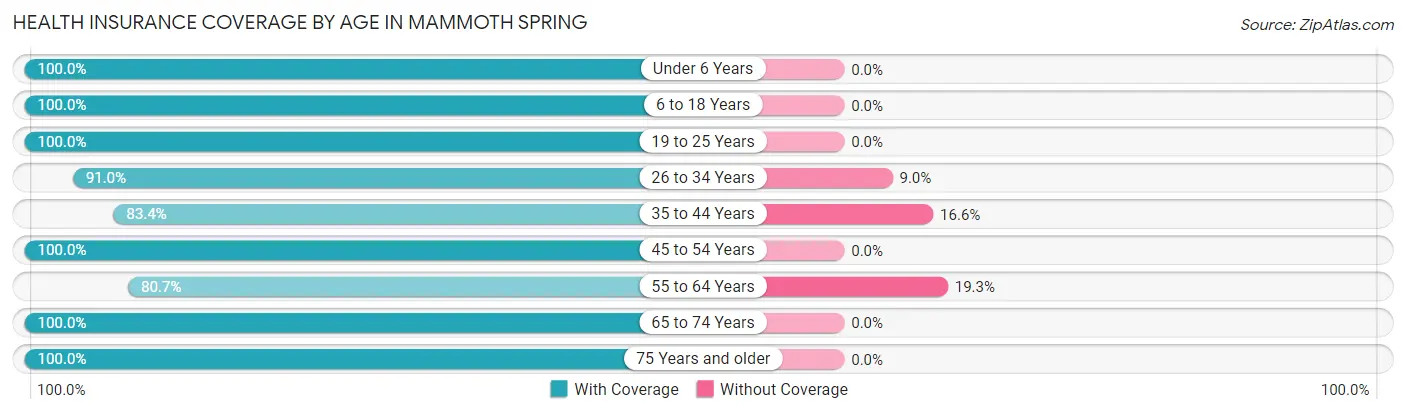
| Age Bracket | With Coverage | Without Coverage |
| Under 6 Years | 95 (100.0%) | 0 (0.0%) |
| 6 to 18 Years | 194 (100.0%) | 0 (0.0%) |
| 19 to 25 Years | 56 (100.0%) | 0 (0.0%) |
| 26 to 34 Years | 81 (91.0%) | 8 (9.0%) |
| 35 to 44 Years | 146 (83.4%) | 29 (16.6%) |
| 45 to 54 Years | 111 (100.0%) | 0 (0.0%) |
| 55 to 64 Years | 46 (80.7%) | 11 (19.3%) |
| 65 to 74 Years | 158 (100.0%) | 0 (0.0%) |
| 75 Years and older | 102 (100.0%) | 0 (0.0%) |
| Total | 989 (95.4%) | 48 (4.6%) |
Health Insurance Coverage by Citizenship Status in Mammoth Spring
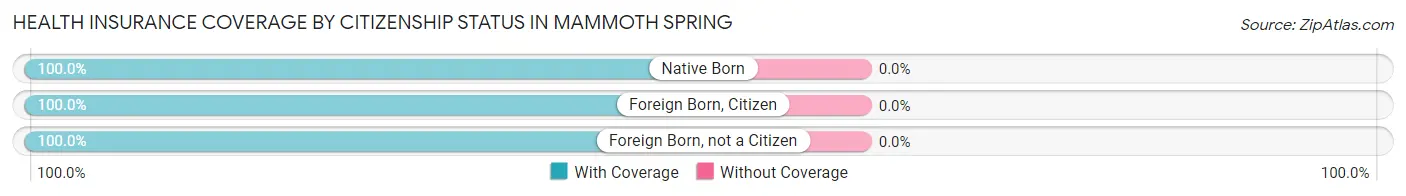
| Citizenship Status | With Coverage | Without Coverage |
| Native Born | 95 (100.0%) | 0 (0.0%) |
| Foreign Born, Citizen | 194 (100.0%) | 0 (0.0%) |
| Foreign Born, not a Citizen | 56 (100.0%) | 0 (0.0%) |
Health Insurance Coverage by Household Income in Mammoth Spring
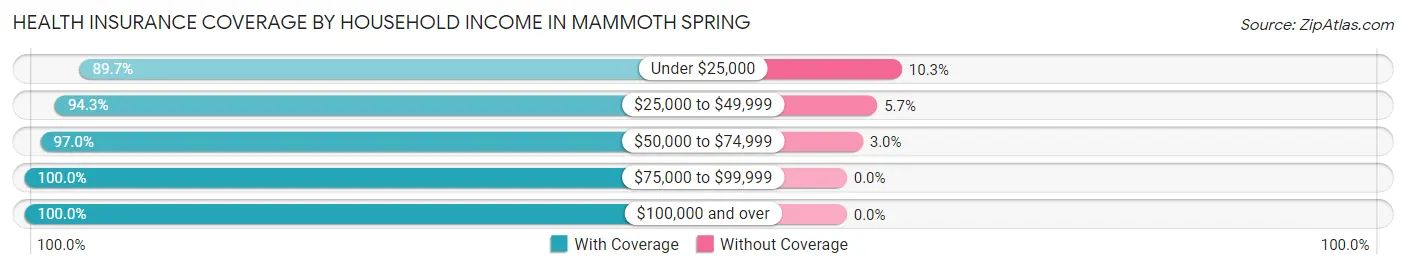
| Household Income | With Coverage | Without Coverage |
| Under $25,000 | 252 (89.7%) | 29 (10.3%) |
| $25,000 to $49,999 | 182 (94.3%) | 11 (5.7%) |
| $50,000 to $74,999 | 259 (97.0%) | 8 (3.0%) |
| $75,000 to $99,999 | 66 (100.0%) | 0 (0.0%) |
| $100,000 and over | 230 (100.0%) | 0 (0.0%) |
Public vs Private Health Insurance Coverage by Age in Mammoth Spring
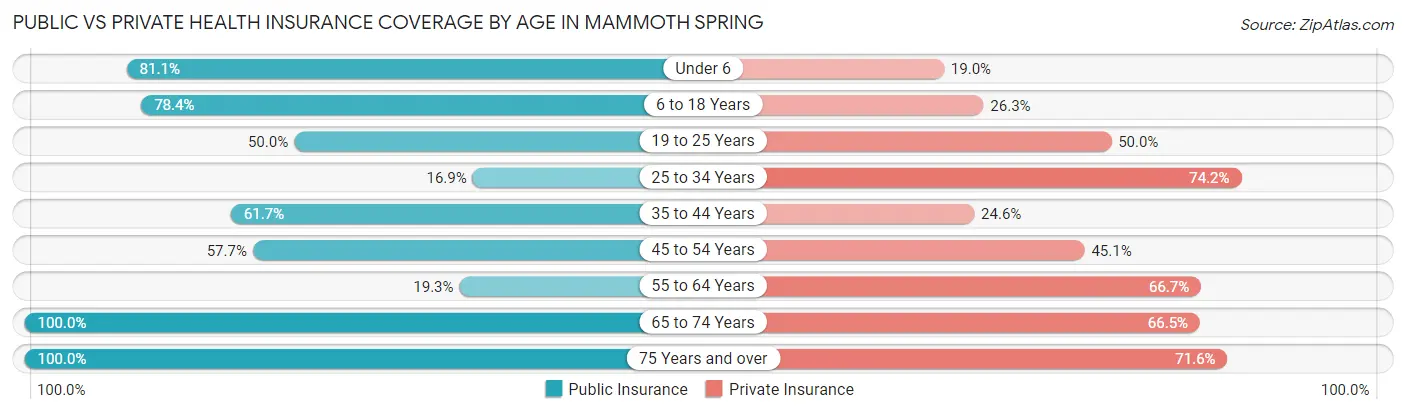
| Age Bracket | Public Insurance | Private Insurance |
| Under 6 | 77 (81.0%) | 18 (19.0%) |
| 6 to 18 Years | 152 (78.3%) | 51 (26.3%) |
| 19 to 25 Years | 28 (50.0%) | 28 (50.0%) |
| 25 to 34 Years | 15 (16.9%) | 66 (74.2%) |
| 35 to 44 Years | 108 (61.7%) | 43 (24.6%) |
| 45 to 54 Years | 64 (57.7%) | 50 (45.1%) |
| 55 to 64 Years | 11 (19.3%) | 38 (66.7%) |
| 65 to 74 Years | 158 (100.0%) | 105 (66.5%) |
| 75 Years and over | 102 (100.0%) | 73 (71.6%) |
| Total | 715 (69.0%) | 472 (45.5%) |
Disability Status by Sex by Age in Mammoth Spring
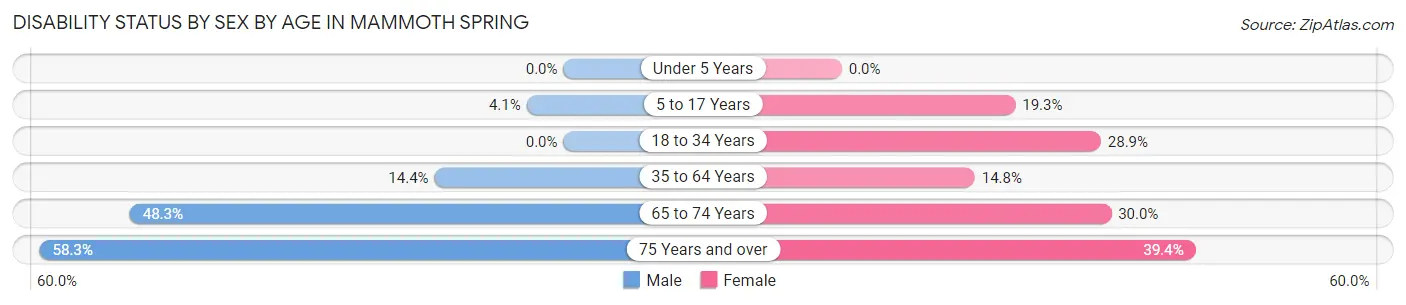
| Age Bracket | Male | Female |
| Under 5 Years | 0 (0.0%) | 0 (0.0%) |
| 5 to 17 Years | 5 (4.1%) | 17 (19.3%) |
| 18 to 34 Years | 0 (0.0%) | 30 (28.8%) |
| 35 to 64 Years | 26 (14.4%) | 24 (14.8%) |
| 65 to 74 Years | 28 (48.3%) | 30 (30.0%) |
| 75 Years and over | 21 (58.3%) | 26 (39.4%) |
Disability Class by Sex by Age in Mammoth Spring
Disability Class: Hearing Difficulty
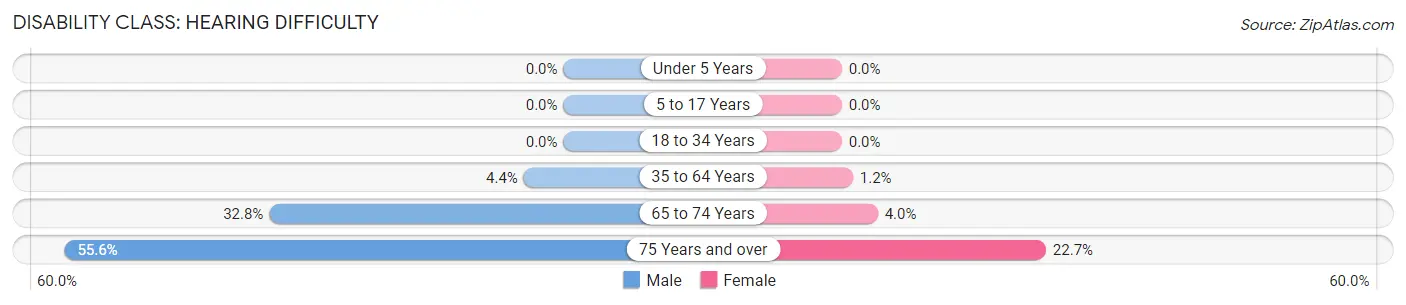
| Age Bracket | Male | Female |
| Under 5 Years | 0 (0.0%) | 0 (0.0%) |
| 5 to 17 Years | 0 (0.0%) | 0 (0.0%) |
| 18 to 34 Years | 0 (0.0%) | 0 (0.0%) |
| 35 to 64 Years | 8 (4.4%) | 2 (1.2%) |
| 65 to 74 Years | 19 (32.8%) | 4 (4.0%) |
| 75 Years and over | 20 (55.6%) | 15 (22.7%) |
Disability Class: Vision Difficulty
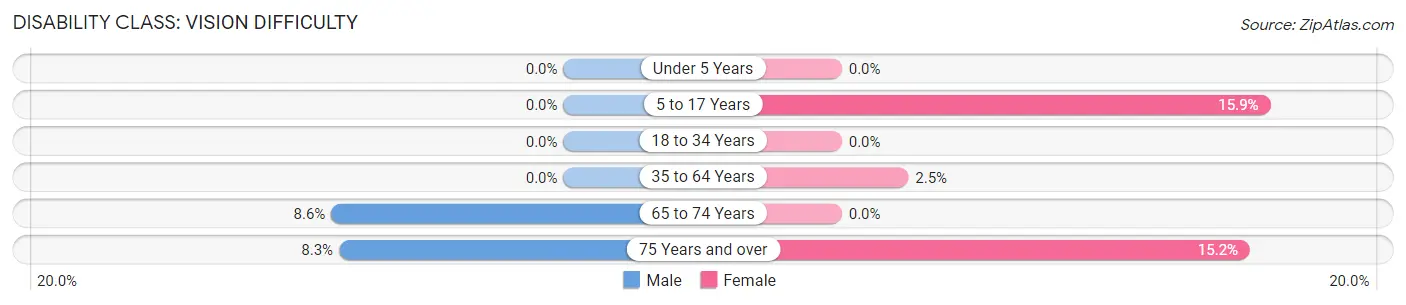
| Age Bracket | Male | Female |
| Under 5 Years | 0 (0.0%) | 0 (0.0%) |
| 5 to 17 Years | 0 (0.0%) | 14 (15.9%) |
| 18 to 34 Years | 0 (0.0%) | 0 (0.0%) |
| 35 to 64 Years | 0 (0.0%) | 4 (2.5%) |
| 65 to 74 Years | 5 (8.6%) | 0 (0.0%) |
| 75 Years and over | 3 (8.3%) | 10 (15.1%) |
Disability Class: Cognitive Difficulty
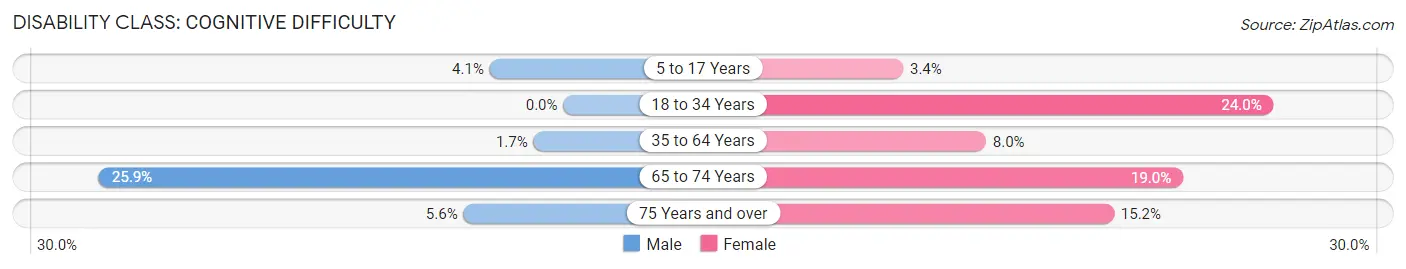
| Age Bracket | Male | Female |
| 5 to 17 Years | 5 (4.1%) | 3 (3.4%) |
| 18 to 34 Years | 0 (0.0%) | 25 (24.0%) |
| 35 to 64 Years | 3 (1.7%) | 13 (8.0%) |
| 65 to 74 Years | 15 (25.9%) | 19 (19.0%) |
| 75 Years and over | 2 (5.6%) | 10 (15.1%) |
Disability Class: Ambulatory Difficulty
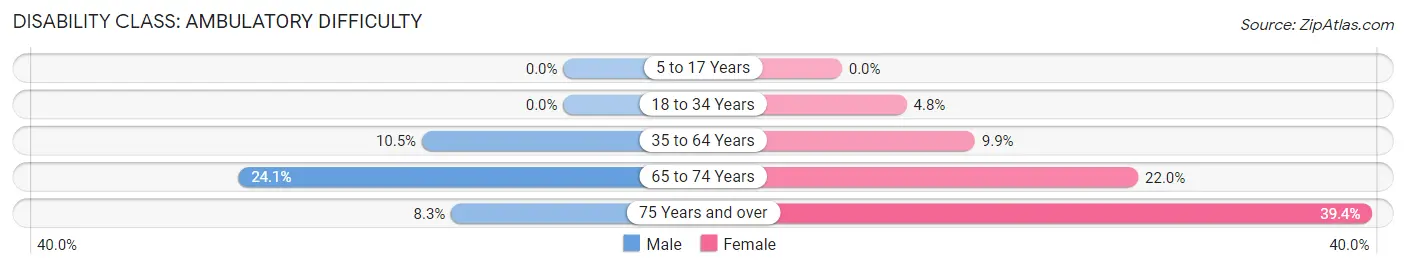
| Age Bracket | Male | Female |
| 5 to 17 Years | 0 (0.0%) | 0 (0.0%) |
| 18 to 34 Years | 0 (0.0%) | 5 (4.8%) |
| 35 to 64 Years | 19 (10.5%) | 16 (9.9%) |
| 65 to 74 Years | 14 (24.1%) | 22 (22.0%) |
| 75 Years and over | 3 (8.3%) | 26 (39.4%) |
Disability Class: Self-Care Difficulty
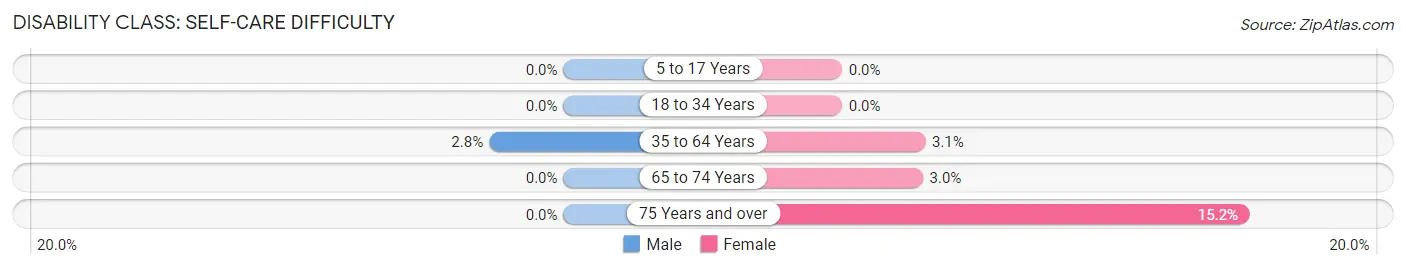
| Age Bracket | Male | Female |
| 5 to 17 Years | 0 (0.0%) | 0 (0.0%) |
| 18 to 34 Years | 0 (0.0%) | 0 (0.0%) |
| 35 to 64 Years | 5 (2.8%) | 5 (3.1%) |
| 65 to 74 Years | 0 (0.0%) | 3 (3.0%) |
| 75 Years and over | 0 (0.0%) | 10 (15.1%) |
Technology Access in Mammoth Spring
Computing Device Access in Mammoth Spring
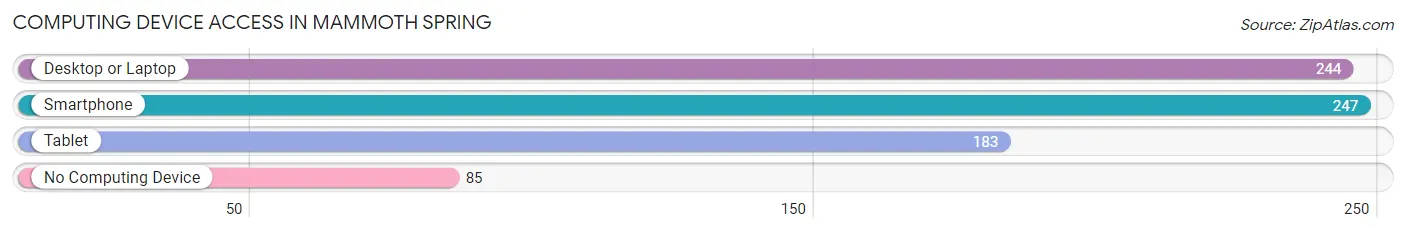
| Device Type | # Households | % Households |
| Desktop or Laptop | 244 | 66.3% |
| Smartphone | 247 | 67.1% |
| Tablet | 183 | 49.7% |
| No Computing Device | 85 | 23.1% |
| Total | 368 | 100.0% |
Internet Access in Mammoth Spring
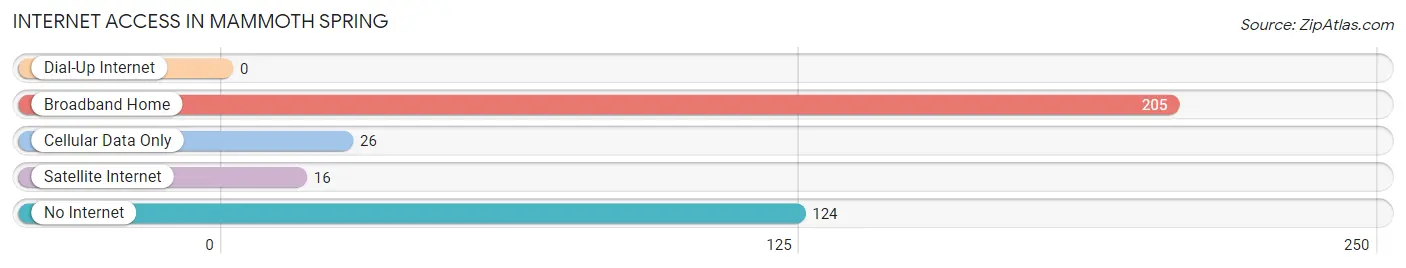
| Internet Type | # Households | % Households |
| Dial-Up Internet | 0 | 0.0% |
| Broadband Home | 205 | 55.7% |
| Cellular Data Only | 26 | 7.1% |
| Satellite Internet | 16 | 4.3% |
| No Internet | 124 | 33.7% |
| Total | 368 | 100.0% |
Mammoth Spring Summary
Mammoth Spring is a city located in the northern part of Arkansas, in the Ozark Mountains. It is the county seat of Fulton County and is located on the Spring River, which is a tributary of the White River. The city is known for its natural springs, which are the largest in the state. The population of Mammoth Spring was 1,125 at the 2010 census.
History
Mammoth Spring was first settled in the early 1800s by settlers from Tennessee and Kentucky. The town was originally known as "Big Spring" due to the large natural spring located in the area. The town was renamed Mammoth Spring in 1883 when the post office was established.
The town was an important stop on the St. Louis-San Francisco Railway, which ran through the area in the late 19th century. The railway brought economic growth to the area and helped to establish Mammoth Spring as an important trading center.
The town was also an important stop on the Butterfield Overland Mail route, which ran from St. Louis to San Francisco in the mid-1800s. The route was used by stagecoaches and mail carriers to transport passengers and mail between the two cities.
Geography
Mammoth Spring is located in the Ozark Mountains of northern Arkansas. The city is situated on the Spring River, which is a tributary of the White River. The city is located at the intersection of U.S. Route 63 and Arkansas Highway 9.
The city has a total area of 1.3 square miles, all of which is land. The city is located at an elevation of 545 feet above sea level.
Economy
Mammoth Spring is a small, rural community with a population of just over 1,000 people. The economy of the city is largely based on agriculture and tourism.
Agriculture is the main industry in the area, with the majority of the population employed in farming and ranching. The city is also home to several small businesses, including restaurants, retail stores, and service providers.
Tourism is also an important part of the local economy. The city is home to the Mammoth Spring State Park, which is a popular destination for visitors. The park features a large natural spring, as well as a variety of outdoor activities, such as fishing, camping, and hiking.
Demographics
As of the 2010 census, the population of Mammoth Spring was 1,125. The racial makeup of the city was 97.2% White, 0.2% African American, 0.2% Native American, 0.2% Asian, 0.2% from other races, and 1.9% from two or more races. Hispanic or Latino of any race were 1.3% of the population.
The median income for a household in the city was $25,000, and the median income for a family was $30,000. The per capita income for the city was $14,000. About 17.2% of the population was below the poverty line.
Common Questions
What is Per Capita Income in Mammoth Spring?
Per Capita income in Mammoth Spring is $21,617.
What is the Median Family Income in Mammoth Spring?
Median Family Income in Mammoth Spring is $55,795.
What is the Median Household income in Mammoth Spring?
Median Household Income in Mammoth Spring is $39,118.
What is Income or Wage Gap in Mammoth Spring?
Income or Wage Gap in Mammoth Spring is 43.9%.
Women in Mammoth Spring earn 56.1 cents for every dollar earned by a man.
What is Inequality or Gini Index in Mammoth Spring?
Inequality or Gini Index in Mammoth Spring is 0.47.
What is the Total Population of Mammoth Spring?
Total Population of Mammoth Spring is 1,037.
What is the Total Male Population of Mammoth Spring?
Total Male Population of Mammoth Spring is 491.
What is the Total Female Population of Mammoth Spring?
Total Female Population of Mammoth Spring is 546.
What is the Ratio of Males per 100 Females in Mammoth Spring?
There are 89.93 Males per 100 Females in Mammoth Spring.
What is the Ratio of Females per 100 Males in Mammoth Spring?
There are 111.20 Females per 100 Males in Mammoth Spring.
What is the Median Population Age in Mammoth Spring?
Median Population Age in Mammoth Spring is 38.7 Years.
What is the Average Family Size in Mammoth Spring
Average Family Size in Mammoth Spring is 3.5 People.
What is the Average Household Size in Mammoth Spring
Average Household Size in Mammoth Spring is 2.8 People.
How Large is the Labor Force in Mammoth Spring?
There are 411 People in the Labor Forcein in Mammoth Spring.
What is the Percentage of People in the Labor Force in Mammoth Spring?
53.7% of People are in the Labor Force in Mammoth Spring.
What is the Unemployment Rate in Mammoth Spring?
Unemployment Rate in Mammoth Spring is 3.6%.