Malvern, AR Map & Demographics
Malvern Map
Malvern Overview
$17,387
PER CAPITA INCOME
$50,672
AVG FAMILY INCOME
$37,210
AVG HOUSEHOLD INCOME
31.2%
WAGE / INCOME GAP [ % ]
68.8¢/ $1
WAGE / INCOME GAP [ $ ]
0.43
INEQUALITY / GINI INDEX
10,859
TOTAL POPULATION
6,170
MALE POPULATION
4,689
FEMALE POPULATION
131.58
MALES / 100 FEMALES
76.00
FEMALES / 100 MALES
39.4
MEDIAN AGE
3.2
AVG FAMILY SIZE
2.5
AVG HOUSEHOLD SIZE
3,975
LABOR FORCE [ PEOPLE ]
44.0%
PERCENT IN LABOR FORCE
7.4%
UNEMPLOYMENT RATE
Malvern Zip Codes
Malvern Area Codes
Income in Malvern
Income Overview in Malvern
Per Capita Income in Malvern is $17,387, while median incomes of families and households are $50,672 and $37,210 respectively.
| Characteristic | Number | Measure |
| Per Capita Income | 10,859 | $17,387 |
| Median Family Income | 2,261 | $50,672 |
| Mean Family Income | 2,261 | $59,264 |
| Median Household Income | 3,421 | $37,210 |
| Mean Household Income | 3,421 | $50,233 |
| Income Deficit | 2,261 | $0 |
| Wage / Income Gap (%) | 10,859 | 31.16% |
| Wage / Income Gap ($) | 10,859 | 68.84¢ per $1 |
| Gini / Inequality Index | 10,859 | 0.43 |
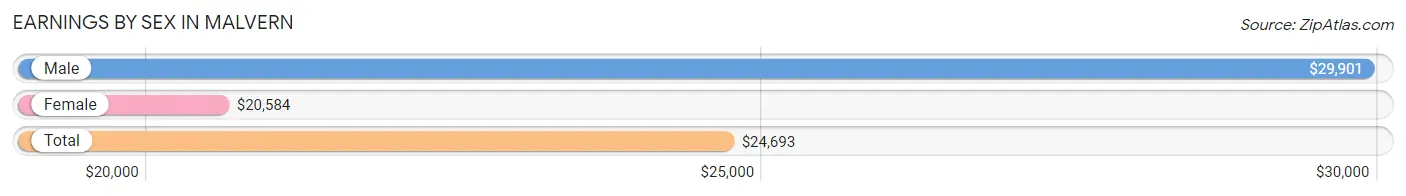
Earnings by Sex in Malvern
Average Earnings in Malvern are $24,693, $29,901 for men and $20,584 for women, a difference of 31.2%.
| Sex | Number | Average Earnings |
| Male | 2,228 (52.4%) | $29,901 |
| Female | 2,022 (47.6%) | $20,584 |
| Total | 4,250 (100.0%) | $24,693 |
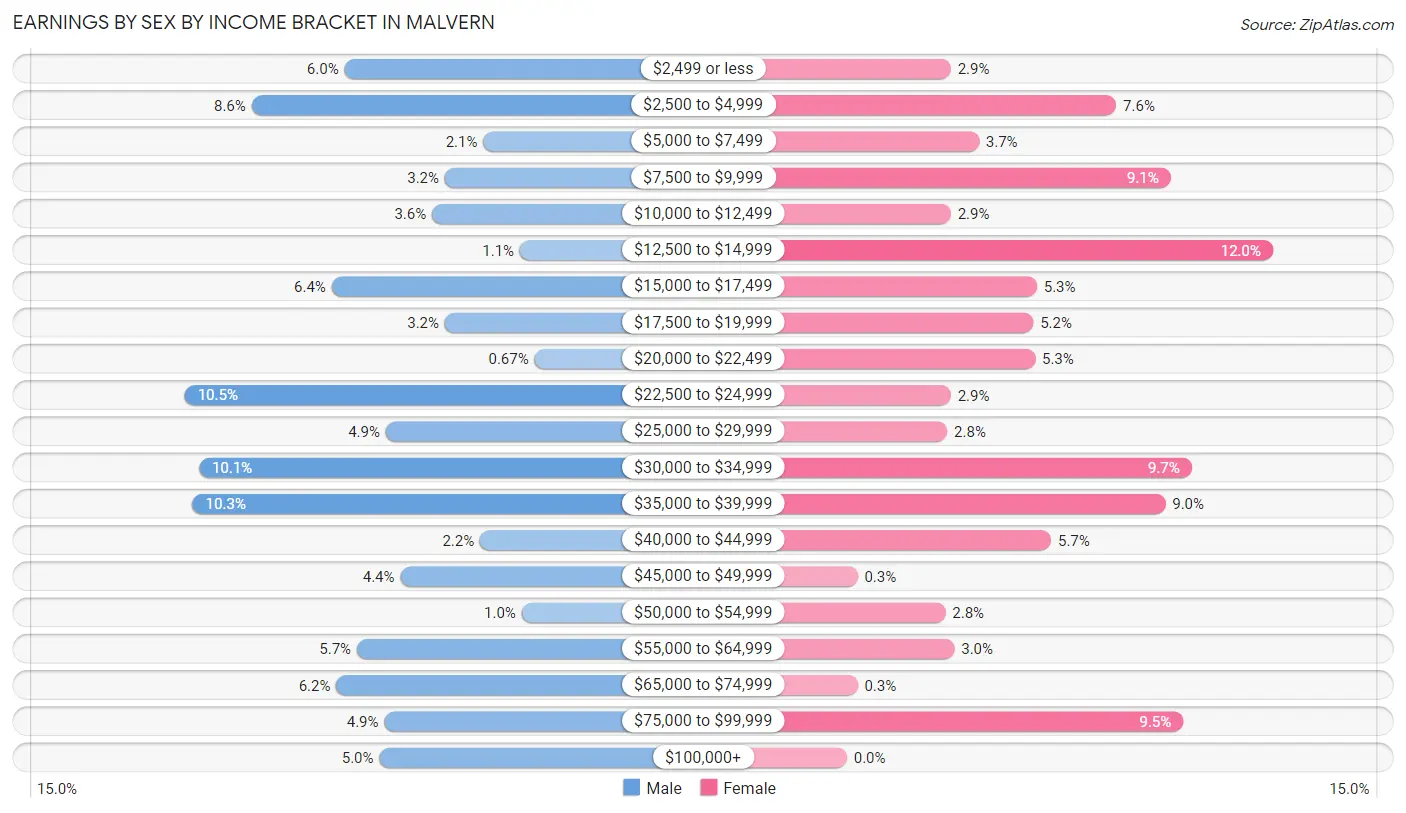
Earnings by Sex by Income Bracket in Malvern
The most common earnings brackets in Malvern are $22,500 to $24,999 for men (234 | 10.5%) and $12,500 to $14,999 for women (242 | 12.0%).
| Income | Male | Female |
| $2,499 or less | 134 (6.0%) | 59 (2.9%) |
| $2,500 to $4,999 | 192 (8.6%) | 153 (7.6%) |
| $5,000 to $7,499 | 47 (2.1%) | 75 (3.7%) |
| $7,500 to $9,999 | 71 (3.2%) | 184 (9.1%) |
| $10,000 to $12,499 | 79 (3.5%) | 59 (2.9%) |
| $12,500 to $14,999 | 24 (1.1%) | 242 (12.0%) |
| $15,000 to $17,499 | 142 (6.4%) | 108 (5.3%) |
| $17,500 to $19,999 | 71 (3.2%) | 106 (5.2%) |
| $20,000 to $22,499 | 15 (0.7%) | 107 (5.3%) |
| $22,500 to $24,999 | 234 (10.5%) | 59 (2.9%) |
| $25,000 to $29,999 | 108 (4.9%) | 57 (2.8%) |
| $30,000 to $34,999 | 225 (10.1%) | 196 (9.7%) |
| $35,000 to $39,999 | 229 (10.3%) | 181 (8.9%) |
| $40,000 to $44,999 | 49 (2.2%) | 116 (5.7%) |
| $45,000 to $49,999 | 99 (4.4%) | 6 (0.3%) |
| $50,000 to $54,999 | 23 (1.0%) | 56 (2.8%) |
| $55,000 to $64,999 | 126 (5.7%) | 61 (3.0%) |
| $65,000 to $74,999 | 139 (6.2%) | 6 (0.3%) |
| $75,000 to $99,999 | 109 (4.9%) | 191 (9.5%) |
| $100,000+ | 112 (5.0%) | 0 (0.0%) |
| Total | 2,228 (100.0%) | 2,022 (100.0%) |
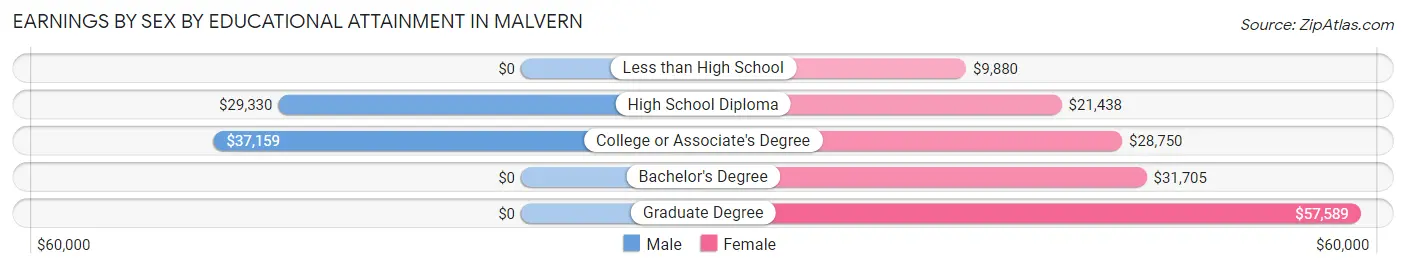
Earnings by Sex by Educational Attainment in Malvern
Average earnings in Malvern are $31,757 for men and $23,093 for women, a difference of 27.3%. Men with an educational attainment of college or associate's degree enjoy the highest average annual earnings of $37,159, while those with high school diploma education earn the least with $29,330. Women with an educational attainment of graduate degree earn the most with the average annual earnings of $57,589, while those with less than high school education have the smallest earnings of $9,880.
| Educational Attainment | Male Income | Female Income |
| Less than High School | - | - |
| High School Diploma | $29,330 | $21,438 |
| College or Associate's Degree | $37,159 | $28,750 |
| Bachelor's Degree | - | - |
| Graduate Degree | - | - |
| Total | $31,757 | $23,093 |
Family Income in Malvern
Family Income Brackets in Malvern
According to the Malvern family income data, there are 606 families falling into the $50,000 to $74,999 income range, which is the most common income bracket and makes up 26.8% of all families. Conversely, the $200,000+ income bracket is the least frequent group with only 5 families (0.2%) belonging to this category.
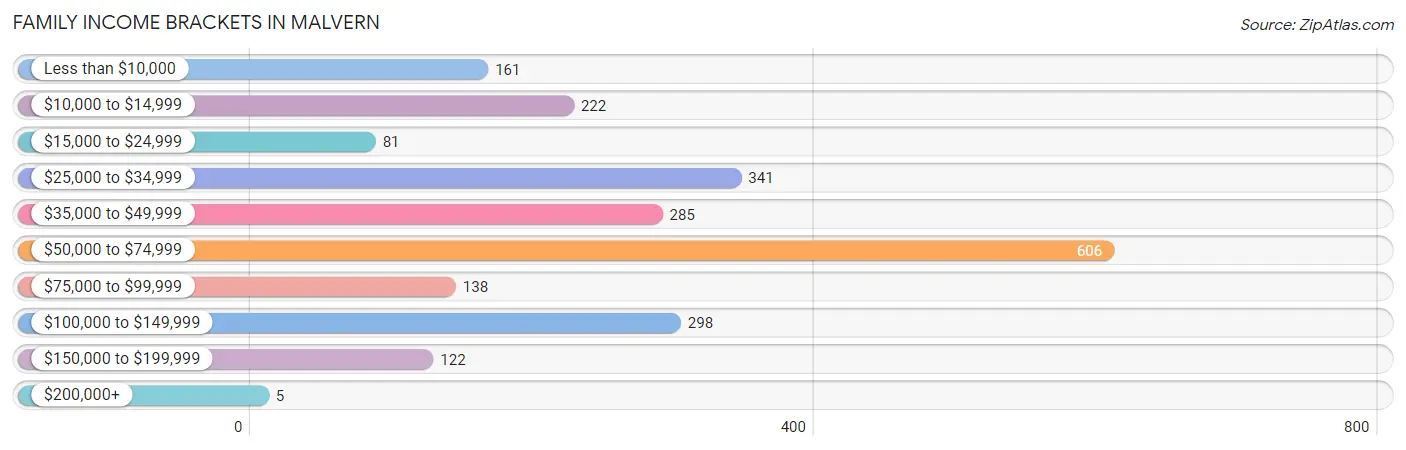
| Income Bracket | # Families | % Families |
| Less than $10,000 | 161 | 7.1% |
| $10,000 to $14,999 | 222 | 9.8% |
| $15,000 to $24,999 | 81 | 3.6% |
| $25,000 to $34,999 | 341 | 15.1% |
| $35,000 to $49,999 | 285 | 12.6% |
| $50,000 to $74,999 | 606 | 26.8% |
| $75,000 to $99,999 | 138 | 6.1% |
| $100,000 to $149,999 | 298 | 13.2% |
| $150,000 to $199,999 | 122 | 5.4% |
| $200,000+ | 5 | 0.2% |
Family Income by Famaliy Size in Malvern
4-person families (334 | 14.8%) account for the highest median family income in Malvern with $60,595 per family, while 2-person families (1,168 | 51.7%) have the highest median income of $21,597 per family member.
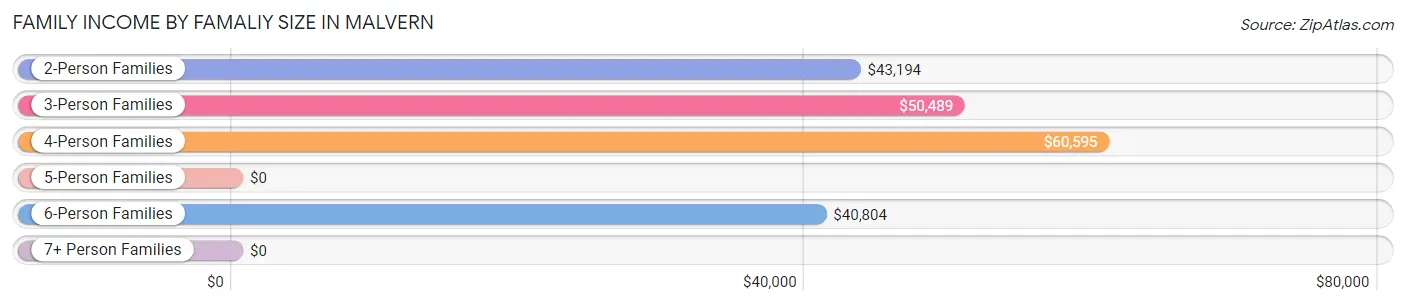
| Income Bracket | # Families | Median Income |
| 2-Person Families | 1,168 (51.7%) | $43,194 |
| 3-Person Families | 476 (21.0%) | $50,489 |
| 4-Person Families | 334 (14.8%) | $60,595 |
| 5-Person Families | 175 (7.7%) | $0 |
| 6-Person Families | 64 (2.8%) | $40,804 |
| 7+ Person Families | 44 (1.9%) | $0 |
| Total | 2,261 (100.0%) | $50,672 |
Family Income by Number of Earners in Malvern
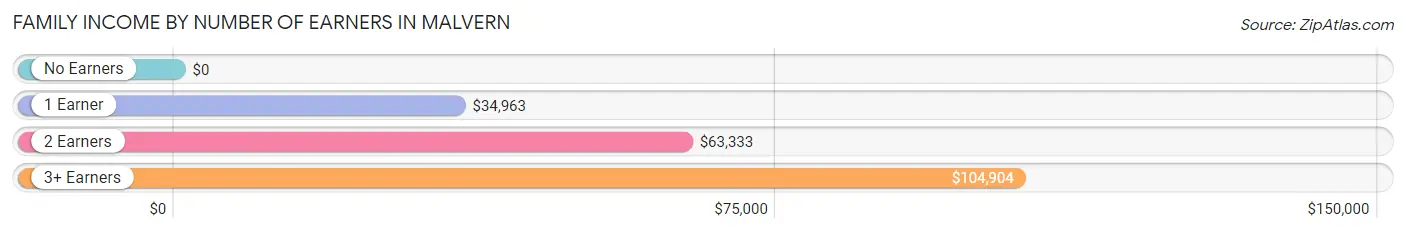
| Number of Earners | # Families | Median Income |
| No Earners | 318 (14.1%) | $0 |
| 1 Earner | 1,083 (47.9%) | $34,963 |
| 2 Earners | 688 (30.4%) | $63,333 |
| 3+ Earners | 172 (7.6%) | $104,904 |
| Total | 2,261 (100.0%) | $50,672 |
Household Income in Malvern
Household Income Brackets in Malvern
With 732 households falling in the category, the $50,000 to $74,999 income range is the most frequent in Malvern, accounting for 21.4% of all households. In contrast, only 3 households (0.1%) fall into the $200,000+ income bracket, making it the least populous group.
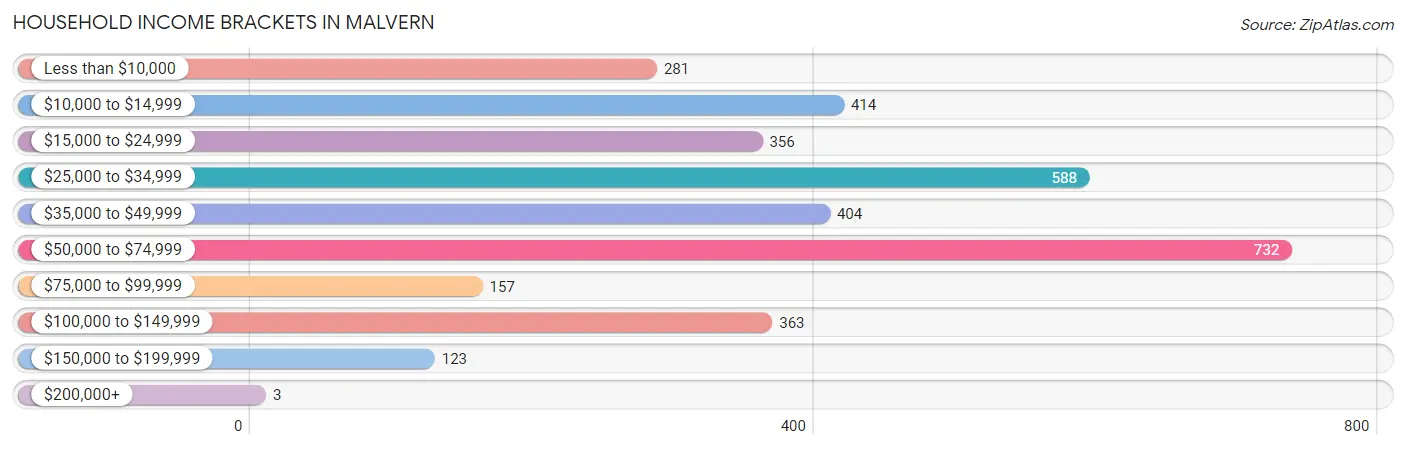
| Income Bracket | # Households | % Households |
| Less than $10,000 | 281 | 8.2% |
| $10,000 to $14,999 | 414 | 12.1% |
| $15,000 to $24,999 | 356 | 10.4% |
| $25,000 to $34,999 | 588 | 17.2% |
| $35,000 to $49,999 | 404 | 11.8% |
| $50,000 to $74,999 | 732 | 21.4% |
| $75,000 to $99,999 | 157 | 4.6% |
| $100,000 to $149,999 | 363 | 10.6% |
| $150,000 to $199,999 | 123 | 3.6% |
| $200,000+ | 3 | 0.1% |
Household Income by Householder Age in Malvern
The median household income in Malvern is $37,210, with the highest median household income of $50,620 found in the 25 to 44 years age bracket for the primary householder. A total of 1,084 households (31.7%) fall into this category. Meanwhile, the 15 to 24 years age bracket for the primary householder has the lowest median household income of $0, with 93 households (2.7%) in this group.

| Income Bracket | # Households | Median Income |
| 15 to 24 Years | 93 (2.7%) | $0 |
| 25 to 44 Years | 1,084 (31.7%) | $50,620 |
| 45 to 64 Years | 1,169 (34.2%) | $36,075 |
| 65+ Years | 1,075 (31.4%) | $31,080 |
| Total | 3,421 (100.0%) | $37,210 |
Poverty in Malvern
Income Below Poverty by Sex and Age in Malvern
With 23.2% poverty level for males and 25.4% for females among the residents of Malvern, under 5 year old males and 6 to 11 year old females are the most vulnerable to poverty, with 141 males (48.1%) and 168 females (52.8%) in their respective age groups living below the poverty level.
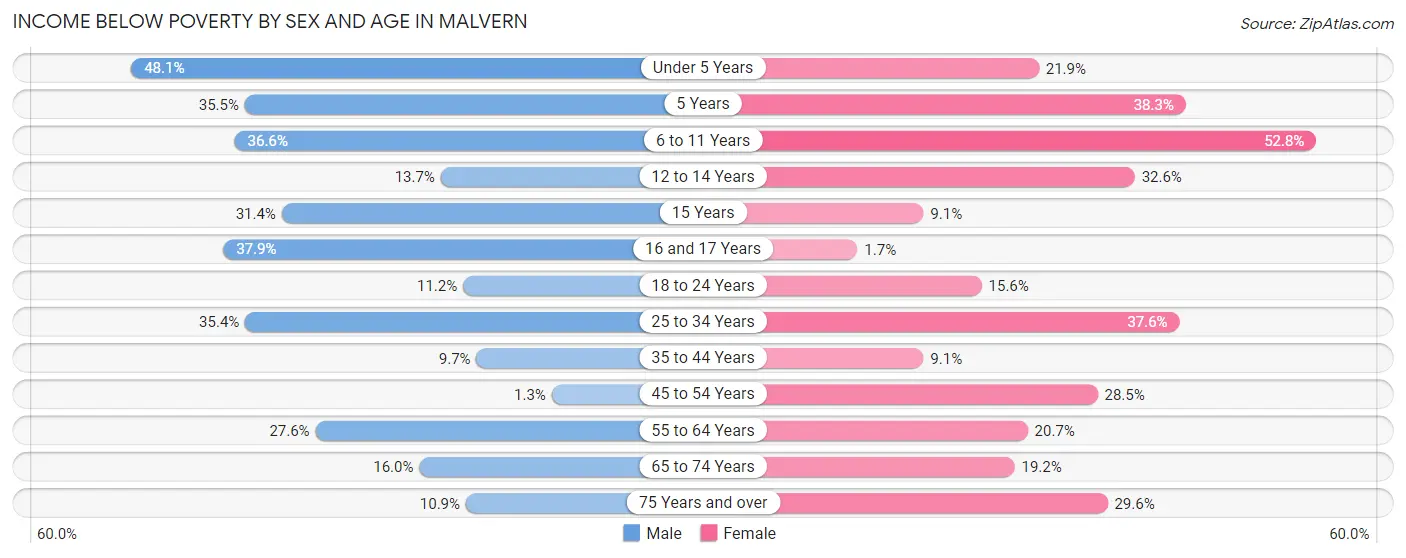
| Age Bracket | Male | Female |
| Under 5 Years | 141 (48.1%) | 52 (21.9%) |
| 5 Years | 11 (35.5%) | 54 (38.3%) |
| 6 to 11 Years | 149 (36.6%) | 168 (52.8%) |
| 12 to 14 Years | 22 (13.7%) | 46 (32.6%) |
| 15 Years | 16 (31.4%) | 4 (9.1%) |
| 16 and 17 Years | 25 (37.9%) | 2 (1.7%) |
| 18 to 24 Years | 44 (11.2%) | 33 (15.6%) |
| 25 to 34 Years | 264 (35.4%) | 270 (37.6%) |
| 35 to 44 Years | 46 (9.7%) | 63 (9.1%) |
| 45 to 54 Years | 5 (1.3%) | 131 (28.5%) |
| 55 to 64 Years | 140 (27.6%) | 95 (20.7%) |
| 65 to 74 Years | 60 (16.0%) | 121 (19.2%) |
| 75 Years and over | 19 (10.9%) | 129 (29.6%) |
| Total | 942 (23.2%) | 1,168 (25.4%) |
Income Above Poverty by Sex and Age in Malvern
According to the poverty statistics in Malvern, males aged 45 to 54 years and females aged 16 and 17 years are the age groups that are most secure financially, with 98.7% of males and 98.3% of females in these age groups living above the poverty line.
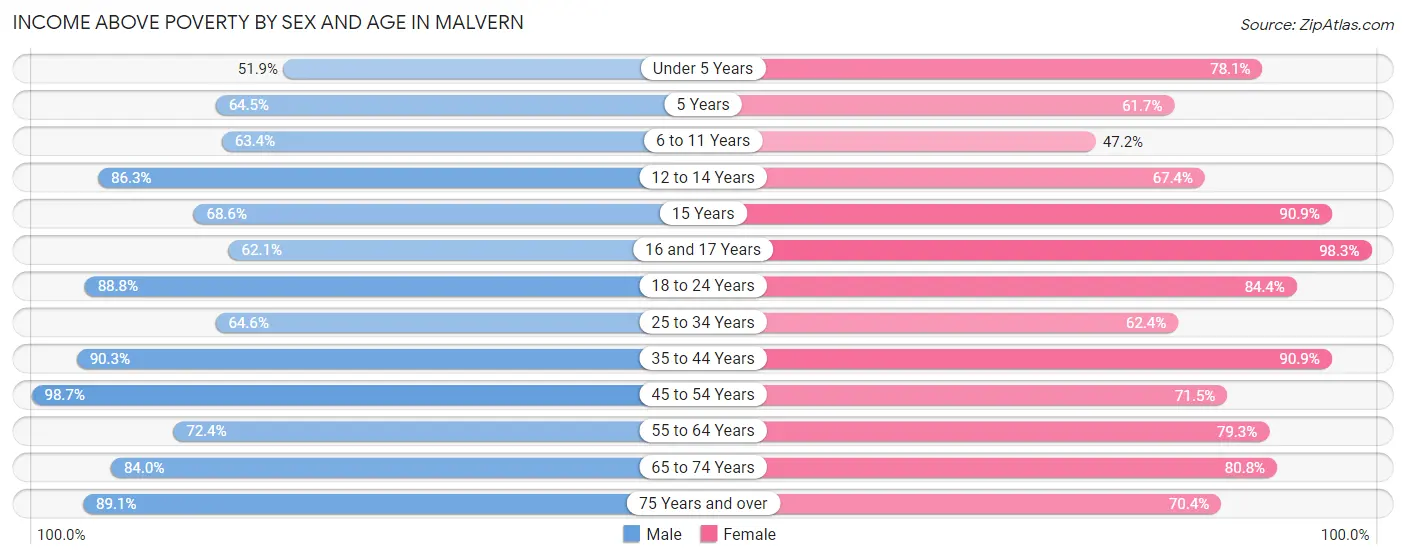
| Age Bracket | Male | Female |
| Under 5 Years | 152 (51.9%) | 185 (78.1%) |
| 5 Years | 20 (64.5%) | 87 (61.7%) |
| 6 to 11 Years | 258 (63.4%) | 150 (47.2%) |
| 12 to 14 Years | 139 (86.3%) | 95 (67.4%) |
| 15 Years | 35 (68.6%) | 40 (90.9%) |
| 16 and 17 Years | 41 (62.1%) | 113 (98.3%) |
| 18 to 24 Years | 350 (88.8%) | 179 (84.4%) |
| 25 to 34 Years | 481 (64.6%) | 448 (62.4%) |
| 35 to 44 Years | 429 (90.3%) | 630 (90.9%) |
| 45 to 54 Years | 380 (98.7%) | 329 (71.5%) |
| 55 to 64 Years | 367 (72.4%) | 364 (79.3%) |
| 65 to 74 Years | 314 (84.0%) | 508 (80.8%) |
| 75 Years and over | 156 (89.1%) | 307 (70.4%) |
| Total | 3,122 (76.8%) | 3,435 (74.6%) |
Income Below Poverty Among Married-Couple Families in Malvern
The poverty statistics for married-couple families in Malvern show that 9.5% or 135 of the total 1,420 families live below the poverty line. Families with 3 or 4 children have the highest poverty rate of 43.0%, comprising of 49 families. On the other hand, families with no children have the lowest poverty rate of 4.9%, which includes 40 families.
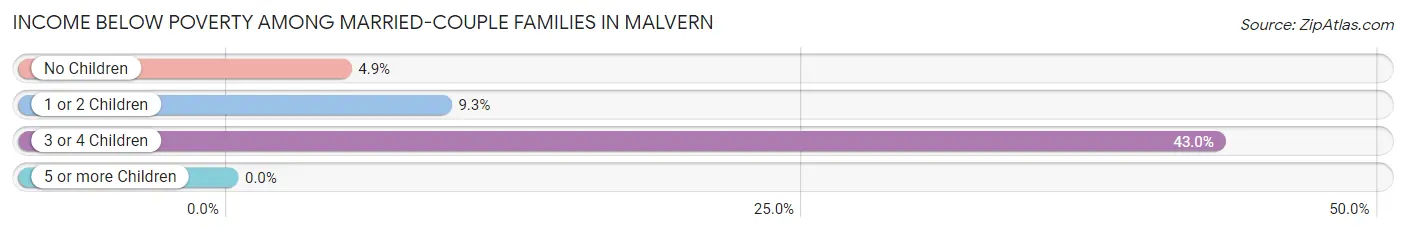
| Children | Above Poverty | Below Poverty |
| No Children | 771 (95.1%) | 40 (4.9%) |
| 1 or 2 Children | 449 (90.7%) | 46 (9.3%) |
| 3 or 4 Children | 65 (57.0%) | 49 (43.0%) |
| 5 or more Children | 0 (0.0%) | 0 (0.0%) |
| Total | 1,285 (90.5%) | 135 (9.5%) |
Income Below Poverty Among Single-Parent Households in Malvern
According to the poverty data in Malvern, 8.8% or 8 single-father households and 47.6% or 357 single-mother households are living below the poverty line. Among single-father households, those with no children have the highest poverty rate, with 8 households (18.2%) experiencing poverty. Likewise, among single-mother households, those with 5 or more children have the highest poverty rate, with 20 households (100.0%) falling below the poverty line.
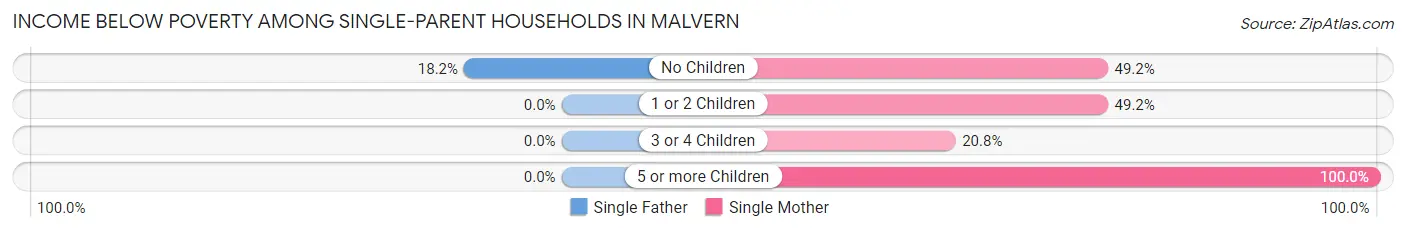
| Children | Single Father | Single Mother |
| No Children | 8 (18.2%) | 145 (49.1%) |
| 1 or 2 Children | 0 (0.0%) | 176 (49.2%) |
| 3 or 4 Children | 0 (0.0%) | 16 (20.8%) |
| 5 or more Children | 0 (0.0%) | 20 (100.0%) |
| Total | 8 (8.8%) | 357 (47.6%) |
Income Below Poverty Among Married-Couple vs Single-Parent Households in Malvern
The poverty data for Malvern shows that 135 of the married-couple family households (9.5%) and 365 of the single-parent households (43.4%) are living below the poverty level. Within the married-couple family households, those with 3 or 4 children have the highest poverty rate, with 49 households (43.0%) falling below the poverty line. Among the single-parent households, those with 5 or more children have the highest poverty rate, with 20 household (100.0%) living below poverty.
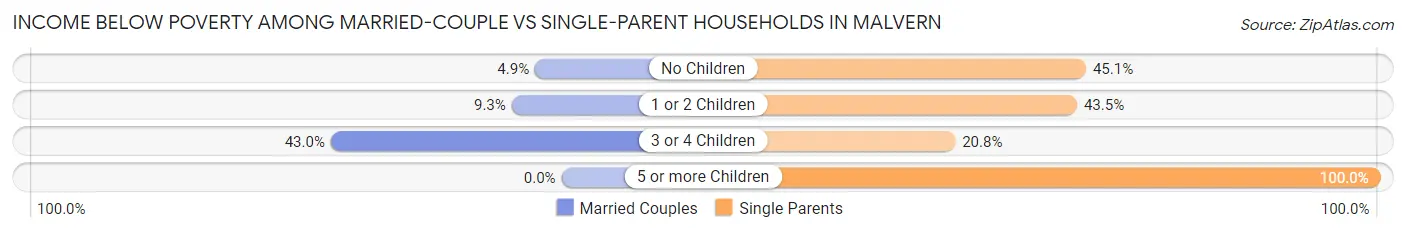
| Children | Married-Couple Families | Single-Parent Households |
| No Children | 40 (4.9%) | 153 (45.1%) |
| 1 or 2 Children | 46 (9.3%) | 176 (43.5%) |
| 3 or 4 Children | 49 (43.0%) | 16 (20.8%) |
| 5 or more Children | 0 (0.0%) | 20 (100.0%) |
| Total | 135 (9.5%) | 365 (43.4%) |
Race in Malvern
The most populous races in Malvern are White / Caucasian (7,023 | 64.7%), Black / African American (3,347 | 30.8%), and Hispanic or Latino (384 | 3.5%).
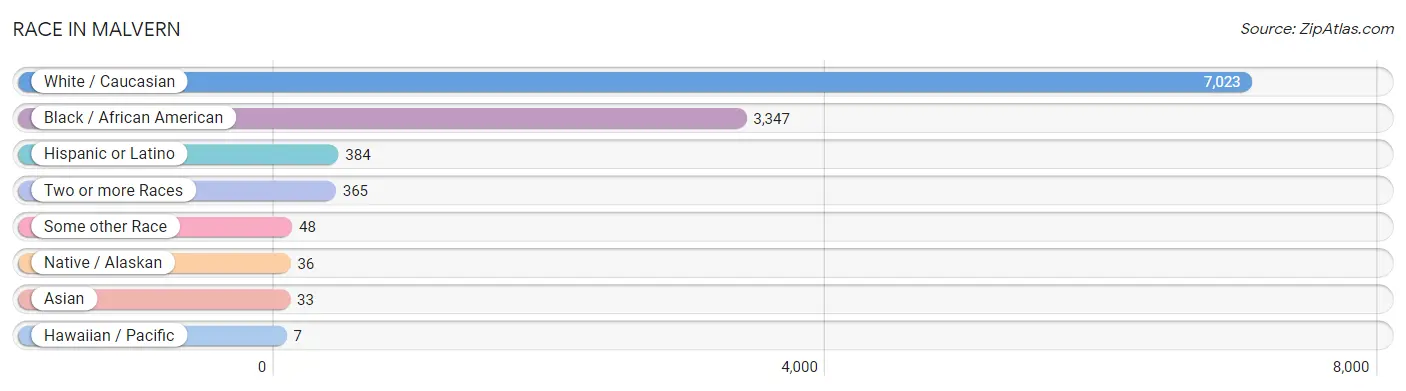
| Race | # Population | % Population |
| Asian | 33 | 0.3% |
| Black / African American | 3,347 | 30.8% |
| Hawaiian / Pacific | 7 | 0.1% |
| Hispanic or Latino | 384 | 3.5% |
| Native / Alaskan | 36 | 0.3% |
| White / Caucasian | 7,023 | 64.7% |
| Two or more Races | 365 | 3.4% |
| Some other Race | 48 | 0.4% |
| Total | 10,859 | 100.0% |
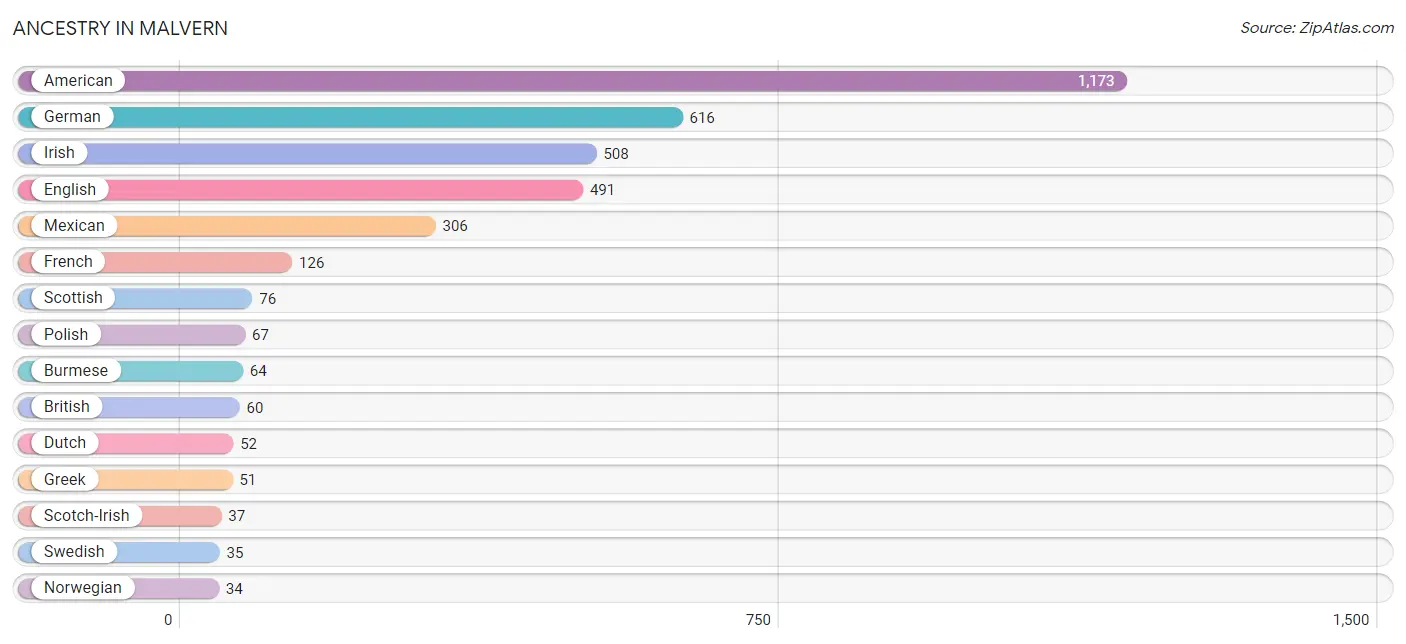
Ancestry in Malvern
The most populous ancestries reported in Malvern are American (1,173 | 10.8%), German (616 | 5.7%), Irish (508 | 4.7%), English (491 | 4.5%), and Mexican (306 | 2.8%), together accounting for 28.5% of all Malvern residents.
| Ancestry | # Population | % Population |
| American | 1,173 | 10.8% |
| Bahamian | 26 | 0.2% |
| British | 60 | 0.5% |
| Burmese | 64 | 0.6% |
| Cherokee | 2 | 0.0% |
| Choctaw | 26 | 0.2% |
| Cuban | 33 | 0.3% |
| Czechoslovakian | 9 | 0.1% |
| Dutch | 52 | 0.5% |
| Dutch West Indian | 7 | 0.1% |
| English | 491 | 4.5% |
| European | 1 | 0.0% |
| French | 126 | 1.2% |
| French Canadian | 22 | 0.2% |
| German | 616 | 5.7% |
| Greek | 51 | 0.5% |
| Haitian | 6 | 0.1% |
| Irish | 508 | 4.7% |
| Italian | 30 | 0.3% |
| Korean | 8 | 0.1% |
| Malaysian | 25 | 0.2% |
| Mexican | 306 | 2.8% |
| Native Hawaiian | 7 | 0.1% |
| Norwegian | 34 | 0.3% |
| Polish | 67 | 0.6% |
| Puerto Rican | 7 | 0.1% |
| Scotch-Irish | 37 | 0.3% |
| Scottish | 76 | 0.7% |
| Swedish | 35 | 0.3% |
| Swiss | 3 | 0.0% | View All 30 Rows |
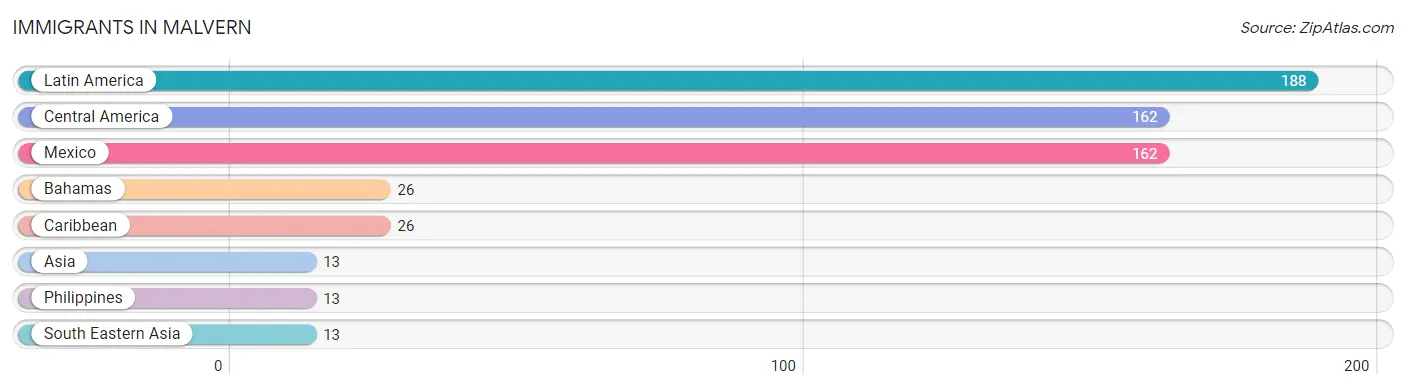
Immigrants in Malvern
The most numerous immigrant groups reported in Malvern came from Latin America (188 | 1.7%), Central America (162 | 1.5%), Mexico (162 | 1.5%), Bahamas (26 | 0.2%), and Caribbean (26 | 0.2%), together accounting for 5.2% of all Malvern residents.
| Immigration Origin | # Population | % Population |
| Asia | 13 | 0.1% |
| Bahamas | 26 | 0.2% |
| Caribbean | 26 | 0.2% |
| Central America | 162 | 1.5% |
| Latin America | 188 | 1.7% |
| Mexico | 162 | 1.5% |
| Philippines | 13 | 0.1% |
| South Eastern Asia | 13 | 0.1% | View All 8 Rows |
Sex and Age in Malvern
Sex and Age in Malvern
The most populous age groups in Malvern are 30 to 34 Years (685 | 11.1%) for men and 25 to 29 Years (412 | 8.8%) for women.
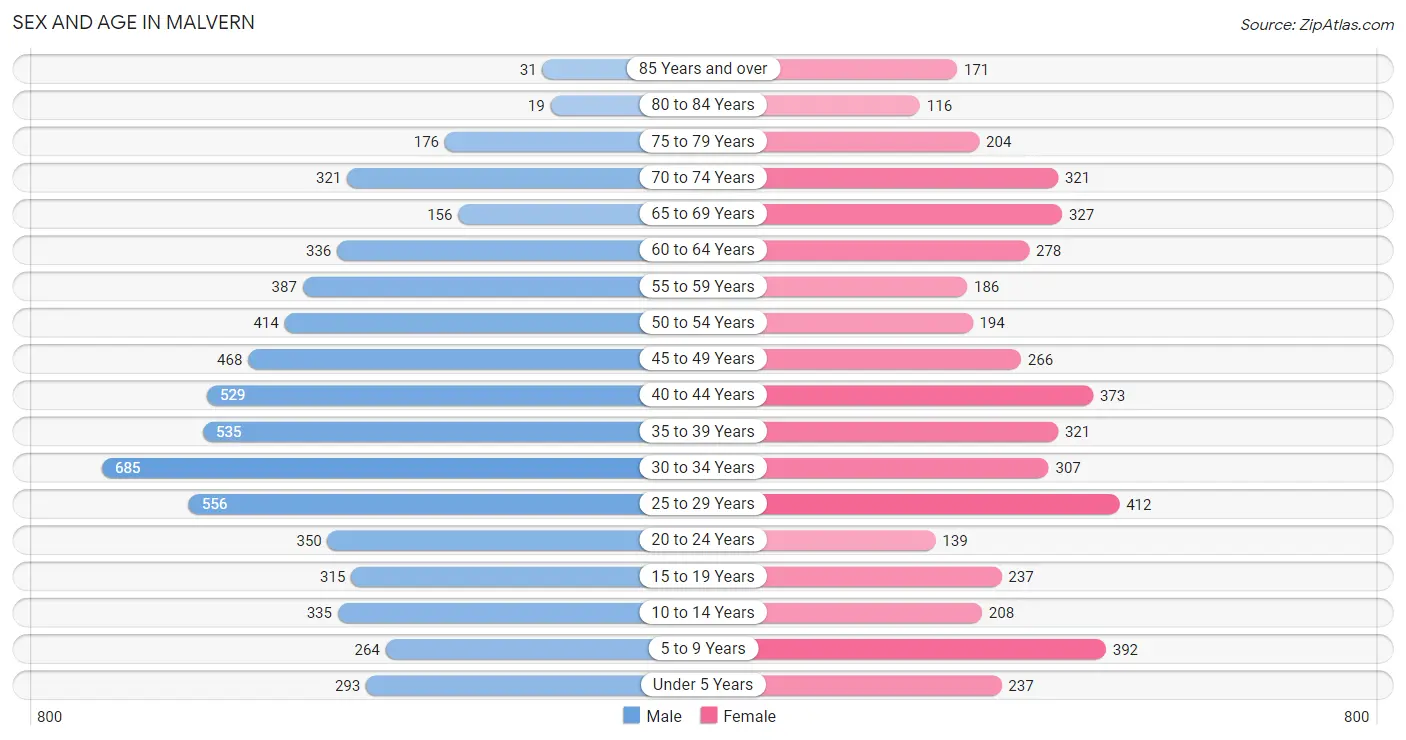
| Age Bracket | Male | Female |
| Under 5 Years | 293 (4.8%) | 237 (5.1%) |
| 5 to 9 Years | 264 (4.3%) | 392 (8.4%) |
| 10 to 14 Years | 335 (5.4%) | 208 (4.4%) |
| 15 to 19 Years | 315 (5.1%) | 237 (5.1%) |
| 20 to 24 Years | 350 (5.7%) | 139 (3.0%) |
| 25 to 29 Years | 556 (9.0%) | 412 (8.8%) |
| 30 to 34 Years | 685 (11.1%) | 307 (6.6%) |
| 35 to 39 Years | 535 (8.7%) | 321 (6.9%) |
| 40 to 44 Years | 529 (8.6%) | 373 (8.0%) |
| 45 to 49 Years | 468 (7.6%) | 266 (5.7%) |
| 50 to 54 Years | 414 (6.7%) | 194 (4.1%) |
| 55 to 59 Years | 387 (6.3%) | 186 (4.0%) |
| 60 to 64 Years | 336 (5.4%) | 278 (5.9%) |
| 65 to 69 Years | 156 (2.5%) | 327 (7.0%) |
| 70 to 74 Years | 321 (5.2%) | 321 (6.9%) |
| 75 to 79 Years | 176 (2.9%) | 204 (4.3%) |
| 80 to 84 Years | 19 (0.3%) | 116 (2.5%) |
| 85 Years and over | 31 (0.5%) | 171 (3.6%) |
| Total | 6,170 (100.0%) | 4,689 (100.0%) |
Families and Households in Malvern
Median Family Size in Malvern
The median family size in Malvern is 3.19 persons per family, with single male/father families (91 | 4.0%) accounting for the largest median family size of 4.62 persons per family. On the other hand, married-couple families (1,420 | 62.8%) represent the smallest median family size with 3.07 persons per family.
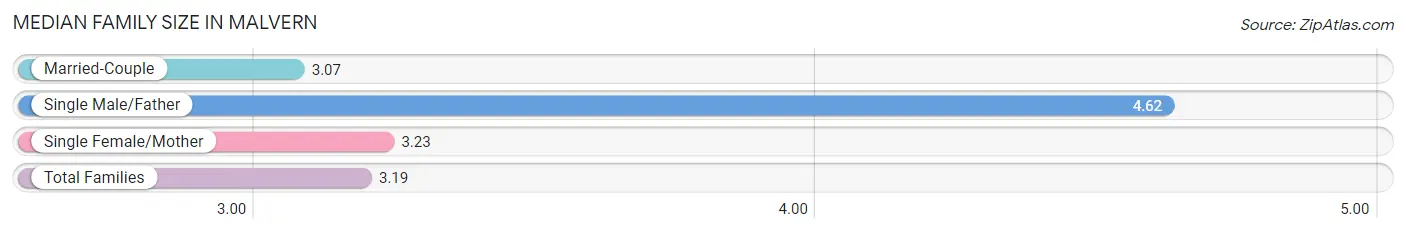
| Family Type | # Families | Family Size |
| Married-Couple | 1,420 (62.8%) | 3.07 |
| Single Male/Father | 91 (4.0%) | 4.62 |
| Single Female/Mother | 750 (33.2%) | 3.23 |
| Total Families | 2,261 (100.0%) | 3.19 |
Median Household Size in Malvern
The median household size in Malvern is 2.53 persons per household, with single male/father households (91 | 2.7%) accounting for the largest median household size of 4.78 persons per household. non-family households (1,160 | 33.9%) represent the smallest median household size with 1.14 persons per household.
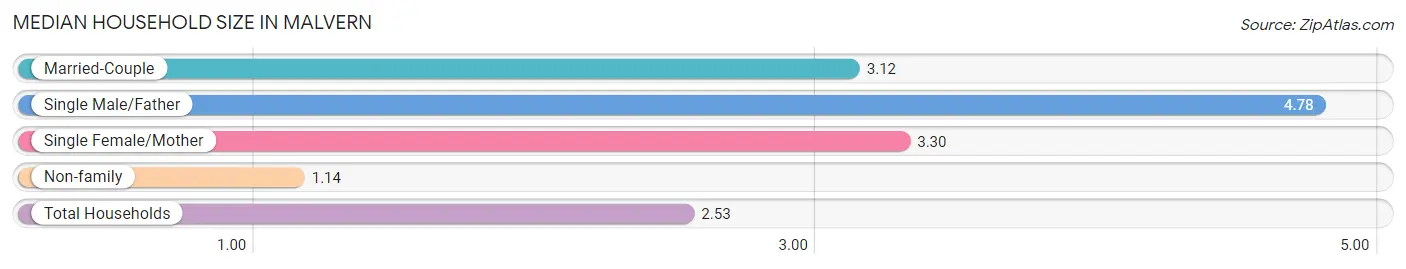
| Household Type | # Households | Household Size |
| Married-Couple | 1,420 (41.5%) | 3.12 |
| Single Male/Father | 91 (2.7%) | 4.78 |
| Single Female/Mother | 750 (21.9%) | 3.30 |
| Non-family | 1,160 (33.9%) | 1.14 |
| Total Households | 3,421 (100.0%) | 2.53 |
Household Size by Marriage Status in Malvern
Out of a total of 3,421 households in Malvern, 2,261 (66.1%) are family households, while 1,160 (33.9%) are nonfamily households. The most numerous type of family households are 2-person households, comprising 1,095, and the most common type of nonfamily households are 1-person households, comprising 1,044.
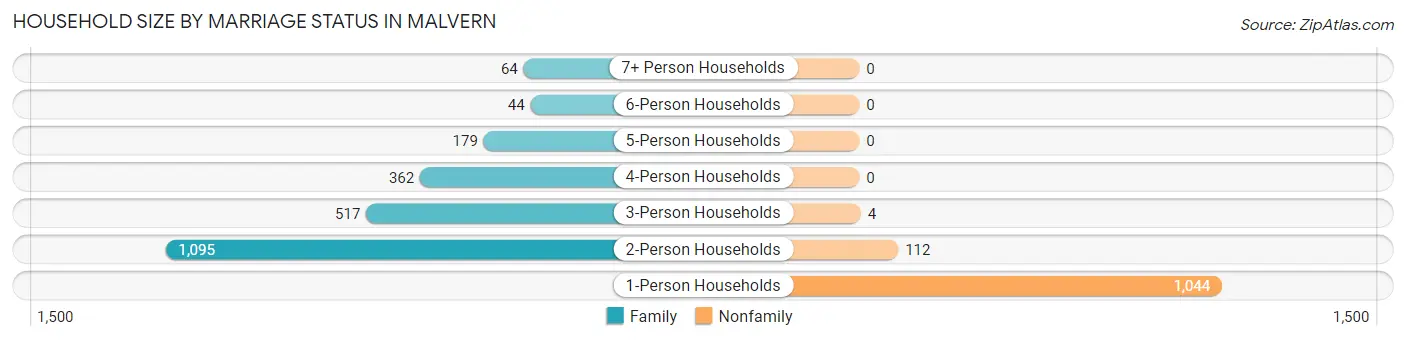
| Household Size | Family Households | Nonfamily Households |
| 1-Person Households | - | 1,044 (30.5%) |
| 2-Person Households | 1,095 (32.0%) | 112 (3.3%) |
| 3-Person Households | 517 (15.1%) | 4 (0.1%) |
| 4-Person Households | 362 (10.6%) | 0 (0.0%) |
| 5-Person Households | 179 (5.2%) | 0 (0.0%) |
| 6-Person Households | 44 (1.3%) | 0 (0.0%) |
| 7+ Person Households | 64 (1.9%) | 0 (0.0%) |
| Total | 2,261 (66.1%) | 1,160 (33.9%) |
Female Fertility in Malvern
Fertility by Age in Malvern
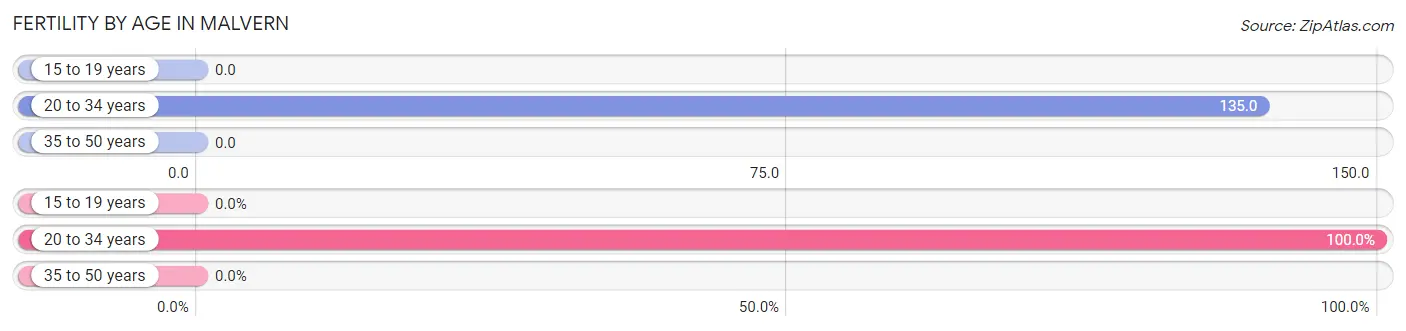
Average fertility rate in Malvern is 56.0 births per 1,000 women. Women in the age bracket of 20 to 34 years have the highest fertility rate with 135.0 births per 1,000 women. Women in the age bracket of 20 to 34 years acount for 100.0% of all women with births.
| Age Bracket | Women with Births | Births / 1,000 Women |
| 15 to 19 years | 0 (0.0%) | 0.0 |
| 20 to 34 years | 116 (100.0%) | 135.0 |
| 35 to 50 years | 0 (0.0%) | 0.0 |
| Total | 116 (100.0%) | 56.0 |
Fertility by Age by Marriage Status in Malvern
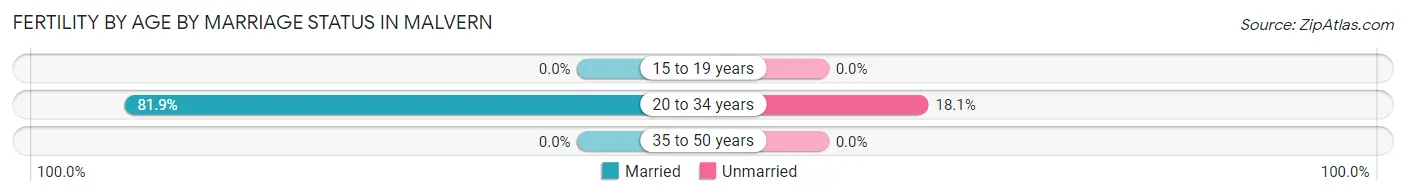
81.9% of women with births (116) in Malvern are married. The highest percentage of unmarried women with births falls into 20 to 34 years age bracket with 18.1% of them unmarried at the time of birth, while the lowest percentage of unmarried women with births belong to 20 to 34 years age bracket with 18.1% of them unmarried.
| Age Bracket | Married | Unmarried |
| 15 to 19 years | 0 (0.0%) | 0 (0.0%) |
| 20 to 34 years | 95 (81.9%) | 21 (18.1%) |
| 35 to 50 years | 0 (0.0%) | 0 (0.0%) |
| Total | 95 (81.9%) | 21 (18.1%) |
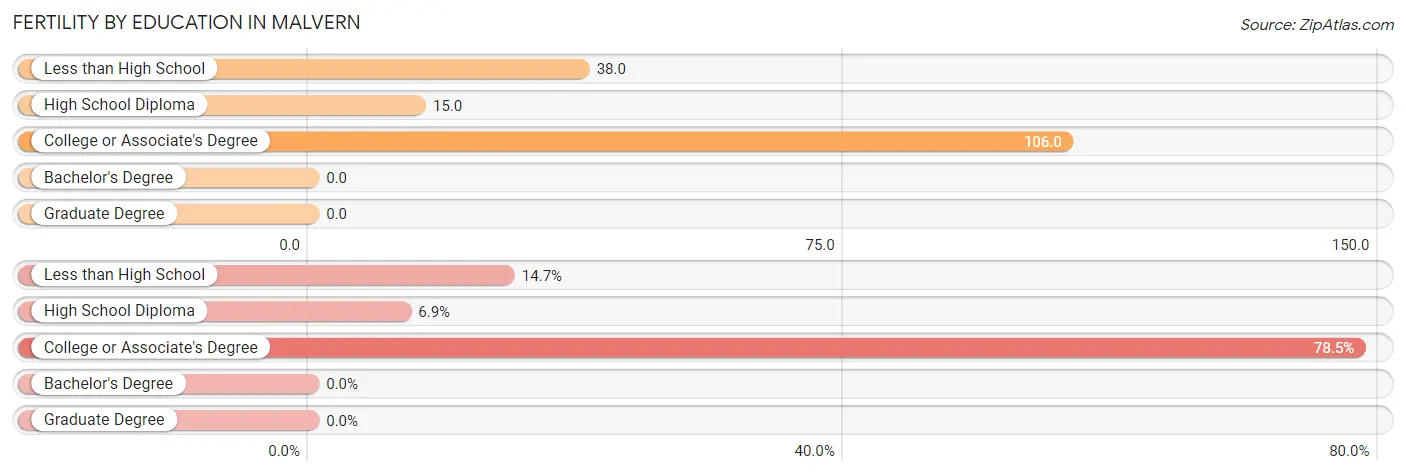
Fertility by Education in Malvern
| Educational Attainment | Women with Births | Births / 1,000 Women |
| Less than High School | 17 (14.7%) | 38.0 |
| High School Diploma | 8 (6.9%) | 15.0 |
| College or Associate's Degree | 91 (78.4%) | 106.0 |
| Bachelor's Degree | 0 (0.0%) | 0.0 |
| Graduate Degree | 0 (0.0%) | 0.0 |
| Total | 116 (100.0%) | 56.0 |
Fertility by Education by Marriage Status in Malvern
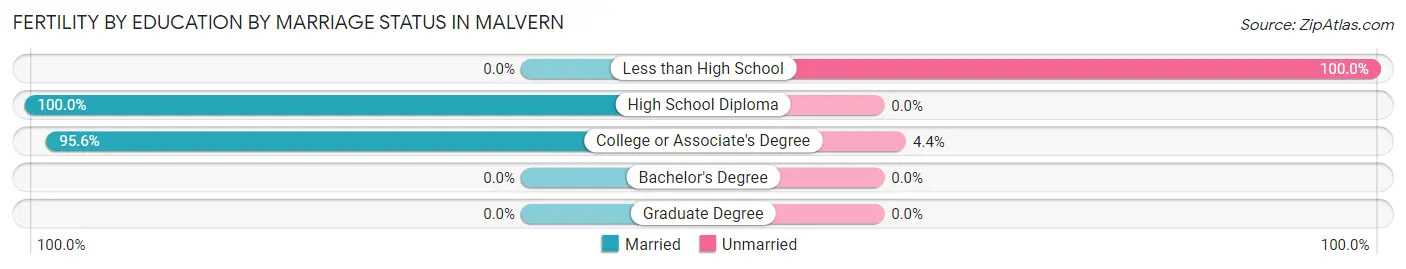
18.1% of women with births in Malvern are unmarried. Women with the educational attainment of high school diploma are most likely to be married with 100.0% of them married at childbirth, while women with the educational attainment of less than high school are least likely to be married with 100.0% of them unmarried at childbirth.
| Educational Attainment | Married | Unmarried |
| Less than High School | 0 (0.0%) | 17 (100.0%) |
| High School Diploma | 8 (100.0%) | 0 (0.0%) |
| College or Associate's Degree | 87 (95.6%) | 4 (4.4%) |
| Bachelor's Degree | 0 (0.0%) | 0 (0.0%) |
| Graduate Degree | 0 (0.0%) | 0 (0.0%) |
| Total | 95 (81.9%) | 21 (18.1%) |
Employment Characteristics in Malvern
Employment by Class of Employer in Malvern
Among the 3,677 employed individuals in Malvern, private company employees (2,657 | 72.3%), state government employees (259 | 7.0%), and not-for-profit organizations (219 | 6.0%) make up the most common classes of employment.
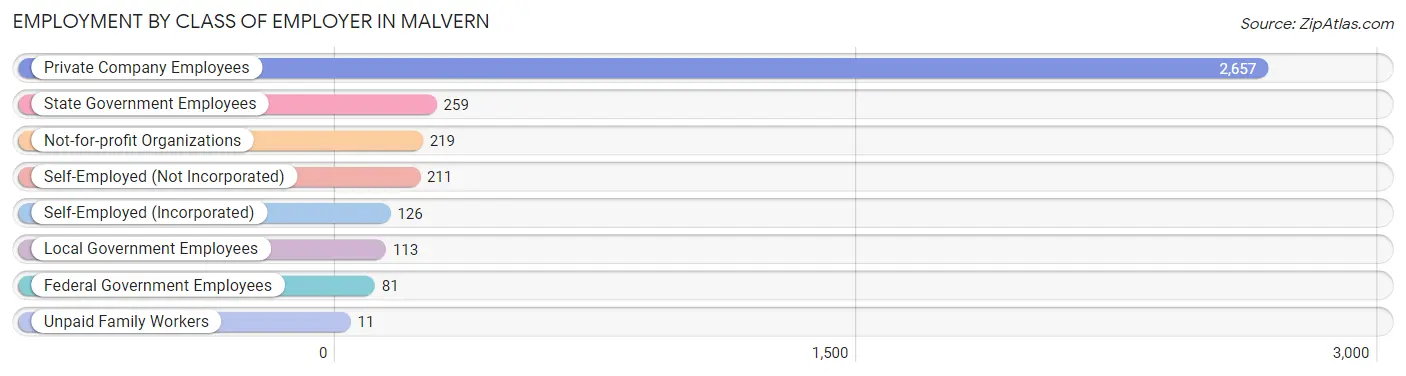
| Employer Class | # Employees | % Employees |
| Private Company Employees | 2,657 | 72.3% |
| Self-Employed (Incorporated) | 126 | 3.4% |
| Self-Employed (Not Incorporated) | 211 | 5.7% |
| Not-for-profit Organizations | 219 | 6.0% |
| Local Government Employees | 113 | 3.1% |
| State Government Employees | 259 | 7.0% |
| Federal Government Employees | 81 | 2.2% |
| Unpaid Family Workers | 11 | 0.3% |
| Total | 3,677 | 100.0% |
Employment Status by Age in Malvern
According to the labor force statistics for Malvern, out of the total population over 16 years of age (9,035), 44.0% or 3,975 individuals are in the labor force, with 7.4% or 294 of them unemployed. The age group with the highest labor force participation rate is 30 to 34 years, with 62.3% or 618 individuals in the labor force. Within the labor force, the 55 to 59 years age range has the highest percentage of unemployed individuals, with 23.8% or 55 of them being unemployed.
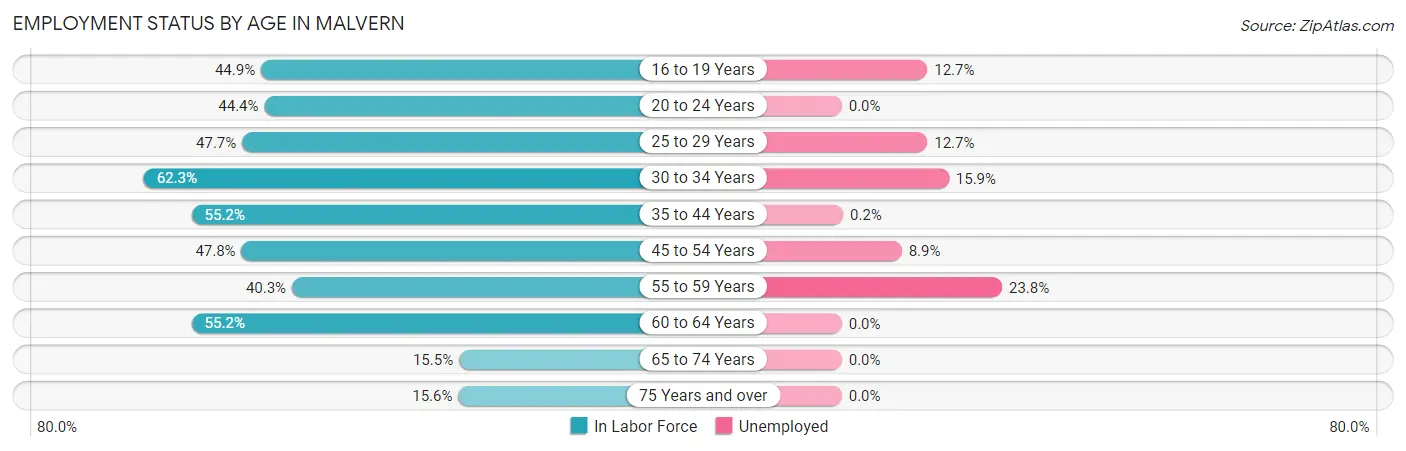
| Age Bracket | In Labor Force | Unemployed |
| 16 to 19 Years | 205 (44.9%) | 26 (12.7%) |
| 20 to 24 Years | 217 (44.4%) | 0 (0.0%) |
| 25 to 29 Years | 462 (47.7%) | 59 (12.7%) |
| 30 to 34 Years | 618 (62.3%) | 98 (15.9%) |
| 35 to 44 Years | 970 (55.2%) | 2 (0.2%) |
| 45 to 54 Years | 641 (47.8%) | 57 (8.9%) |
| 55 to 59 Years | 231 (40.3%) | 55 (23.8%) |
| 60 to 64 Years | 339 (55.2%) | 0 (0.0%) |
| 65 to 74 Years | 174 (15.5%) | 0 (0.0%) |
| 75 Years and over | 112 (15.6%) | 0 (0.0%) |
| Total | 3,975 (44.0%) | 294 (7.4%) |
Employment Status by Educational Attainment in Malvern
According to labor force statistics for Malvern, 52.2% of individuals (3,261) out of the total population between 25 and 64 years of age (6,247) are in the labor force, with 8.3% or 271 of them being unemployed. The group with the highest labor force participation rate are those with the educational attainment of bachelor's degree or higher, with 74.1% or 453 individuals in the labor force. Within the labor force, individuals with less than high school education have the highest percentage of unemployment, with 22.3% or 61 of them being unemployed.
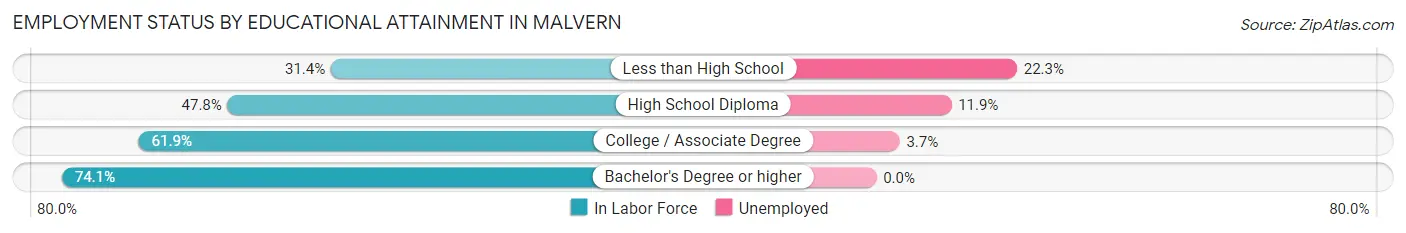
| Educational Attainment | In Labor Force | Unemployed |
| Less than High School | 274 (31.4%) | 195 (22.3%) |
| High School Diploma | 1,402 (47.8%) | 349 (11.9%) |
| College / Associate Degree | 1,132 (61.9%) | 68 (3.7%) |
| Bachelor's Degree or higher | 453 (74.1%) | 0 (0.0%) |
| Total | 3,261 (52.2%) | 519 (8.3%) |
Employment Occupations by Sex in Malvern
Management, Business, Science and Arts Occupations
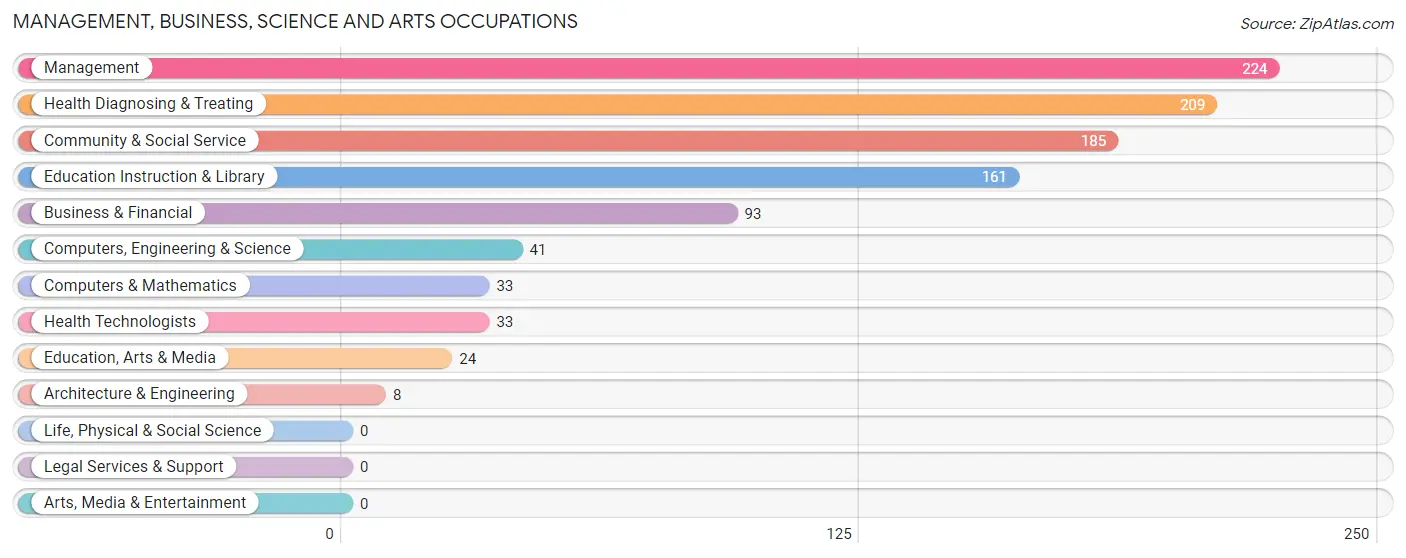
The most common Management, Business, Science and Arts occupations in Malvern are Management (224 | 6.1%), Health Diagnosing & Treating (209 | 5.7%), Community & Social Service (185 | 5.1%), Education Instruction & Library (161 | 4.4%), and Business & Financial (93 | 2.5%).
Management, Business, Science and Arts Occupations by Sex
Within the Management, Business, Science and Arts occupations in Malvern, the most male-oriented occupations are Architecture & Engineering (100.0%), Management (88.8%), and Business & Financial (65.6%), while the most female-oriented occupations are Computers & Mathematics (100.0%), Education Instruction & Library (100.0%), and Health Technologists (100.0%).
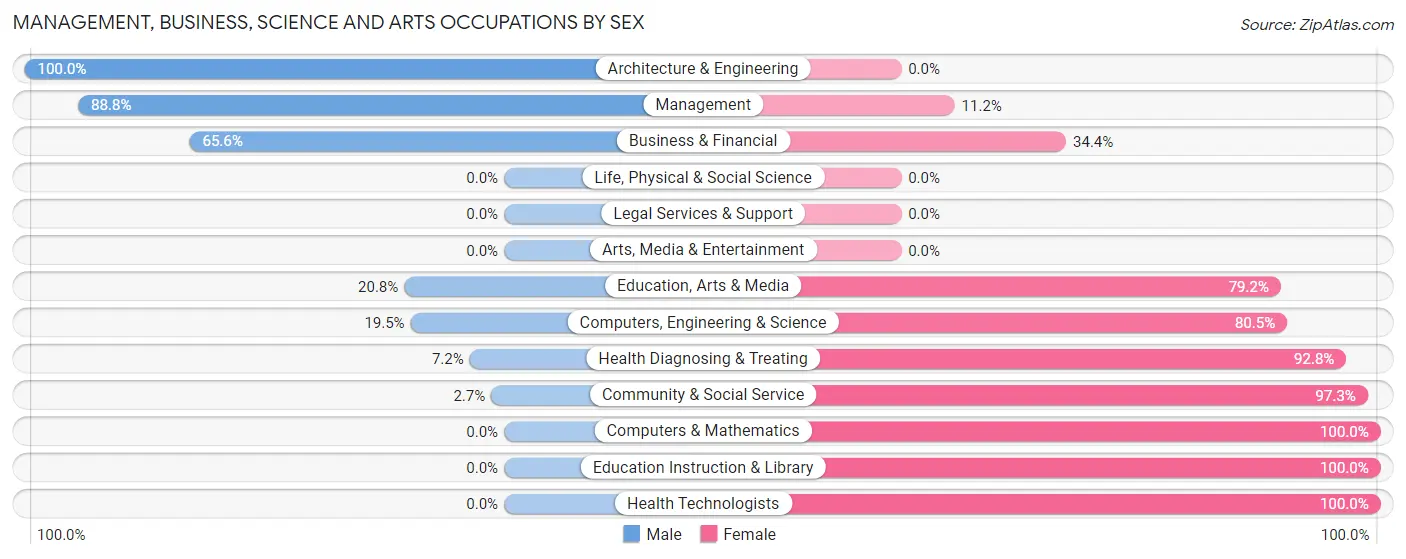
| Occupation | Male | Female |
| Management | 199 (88.8%) | 25 (11.2%) |
| Business & Financial | 61 (65.6%) | 32 (34.4%) |
| Computers, Engineering & Science | 8 (19.5%) | 33 (80.5%) |
| Computers & Mathematics | 0 (0.0%) | 33 (100.0%) |
| Architecture & Engineering | 8 (100.0%) | 0 (0.0%) |
| Life, Physical & Social Science | 0 (0.0%) | 0 (0.0%) |
| Community & Social Service | 5 (2.7%) | 180 (97.3%) |
| Education, Arts & Media | 5 (20.8%) | 19 (79.2%) |
| Legal Services & Support | 0 (0.0%) | 0 (0.0%) |
| Education Instruction & Library | 0 (0.0%) | 161 (100.0%) |
| Arts, Media & Entertainment | 0 (0.0%) | 0 (0.0%) |
| Health Diagnosing & Treating | 15 (7.2%) | 194 (92.8%) |
| Health Technologists | 0 (0.0%) | 33 (100.0%) |
| Total (Category) | 288 (38.3%) | 464 (61.7%) |
| Total (Overall) | 1,807 (49.4%) | 1,849 (50.6%) |
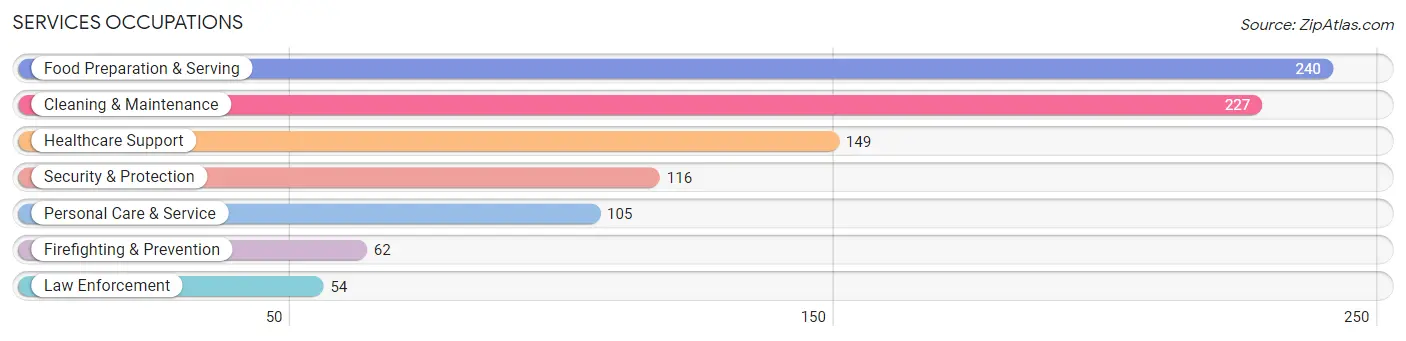
Services Occupations
The most common Services occupations in Malvern are Food Preparation & Serving (240 | 6.6%), Cleaning & Maintenance (227 | 6.2%), Healthcare Support (149 | 4.1%), Security & Protection (116 | 3.2%), and Personal Care & Service (105 | 2.9%).
Services Occupations by Sex
Within the Services occupations in Malvern, the most male-oriented occupations are Firefighting & Prevention (83.9%), Security & Protection (75.0%), and Food Preparation & Serving (66.2%), while the most female-oriented occupations are Personal Care & Service (80.9%), Healthcare Support (79.2%), and Cleaning & Maintenance (60.8%).
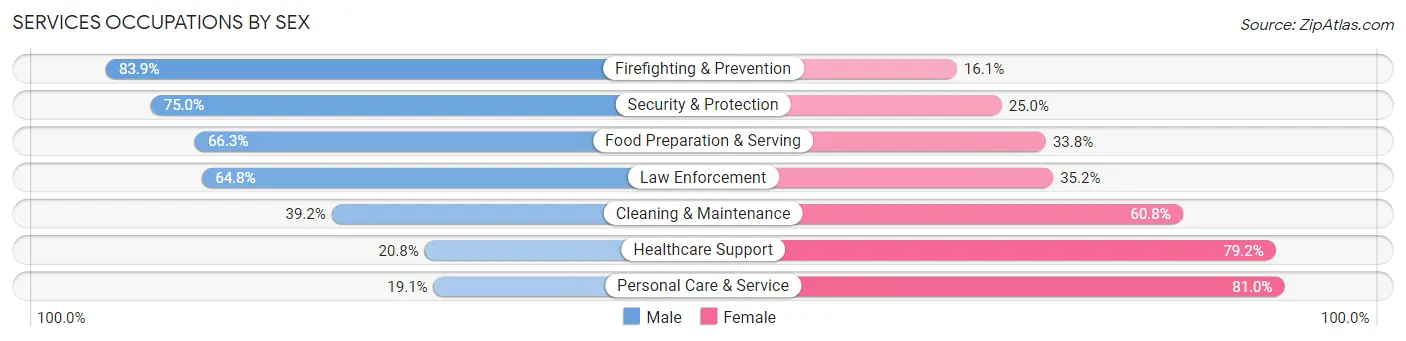
| Occupation | Male | Female |
| Healthcare Support | 31 (20.8%) | 118 (79.2%) |
| Security & Protection | 87 (75.0%) | 29 (25.0%) |
| Firefighting & Prevention | 52 (83.9%) | 10 (16.1%) |
| Law Enforcement | 35 (64.8%) | 19 (35.2%) |
| Food Preparation & Serving | 159 (66.2%) | 81 (33.8%) |
| Cleaning & Maintenance | 89 (39.2%) | 138 (60.8%) |
| Personal Care & Service | 20 (19.1%) | 85 (80.9%) |
| Total (Category) | 386 (46.1%) | 451 (53.9%) |
| Total (Overall) | 1,807 (49.4%) | 1,849 (50.6%) |
Sales and Office Occupations
The most common Sales and Office occupations in Malvern are Office & Administration (511 | 14.0%), and Sales & Related (375 | 10.3%).

Sales and Office Occupations by Sex

| Occupation | Male | Female |
| Sales & Related | 214 (57.1%) | 161 (42.9%) |
| Office & Administration | 65 (12.7%) | 446 (87.3%) |
| Total (Category) | 279 (31.5%) | 607 (68.5%) |
| Total (Overall) | 1,807 (49.4%) | 1,849 (50.6%) |
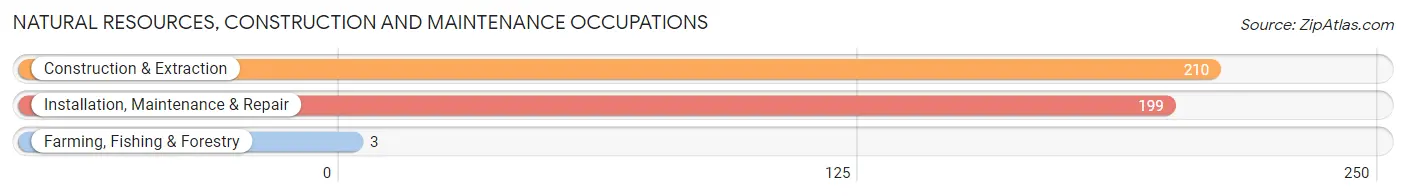
Natural Resources, Construction and Maintenance Occupations
The most common Natural Resources, Construction and Maintenance occupations in Malvern are Construction & Extraction (210 | 5.7%), Installation, Maintenance & Repair (199 | 5.4%), and Farming, Fishing & Forestry (3 | 0.1%).
Natural Resources, Construction and Maintenance Occupations by Sex

| Occupation | Male | Female |
| Farming, Fishing & Forestry | 3 (100.0%) | 0 (0.0%) |
| Construction & Extraction | 184 (87.6%) | 26 (12.4%) |
| Installation, Maintenance & Repair | 56 (28.1%) | 143 (71.9%) |
| Total (Category) | 243 (59.0%) | 169 (41.0%) |
| Total (Overall) | 1,807 (49.4%) | 1,849 (50.6%) |
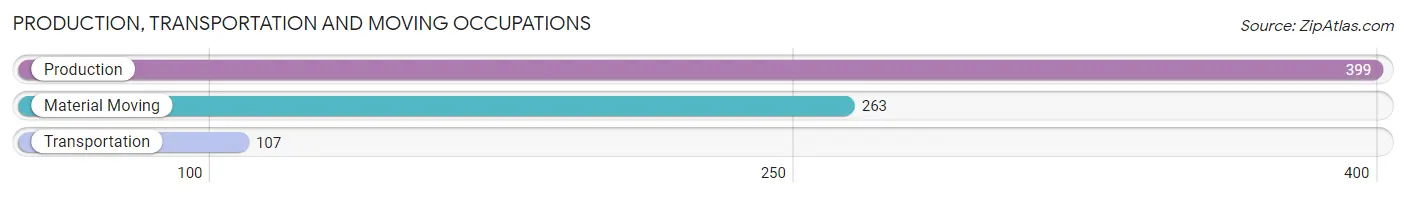
Production, Transportation and Moving Occupations
The most common Production, Transportation and Moving occupations in Malvern are Production (399 | 10.9%), Material Moving (263 | 7.2%), and Transportation (107 | 2.9%).
Production, Transportation and Moving Occupations by Sex
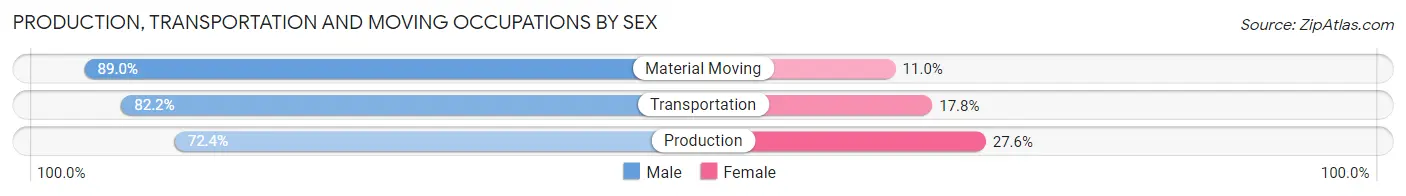
| Occupation | Male | Female |
| Production | 289 (72.4%) | 110 (27.6%) |
| Transportation | 88 (82.2%) | 19 (17.8%) |
| Material Moving | 234 (89.0%) | 29 (11.0%) |
| Total (Category) | 611 (79.4%) | 158 (20.5%) |
| Total (Overall) | 1,807 (49.4%) | 1,849 (50.6%) |
Employment Industries by Sex in Malvern
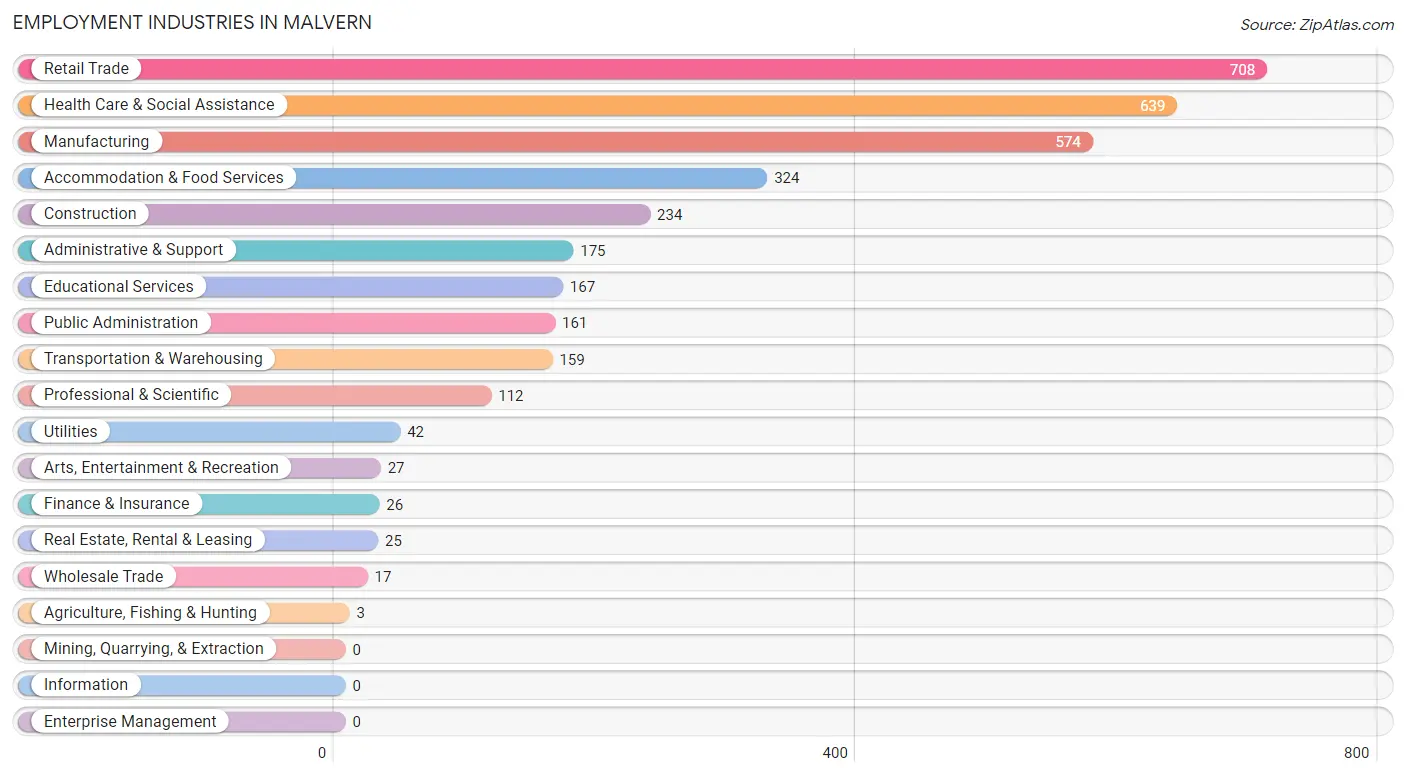
Employment Industries in Malvern
The major employment industries in Malvern include Retail Trade (708 | 19.4%), Health Care & Social Assistance (639 | 17.5%), Manufacturing (574 | 15.7%), Accommodation & Food Services (324 | 8.9%), and Construction (234 | 6.4%).
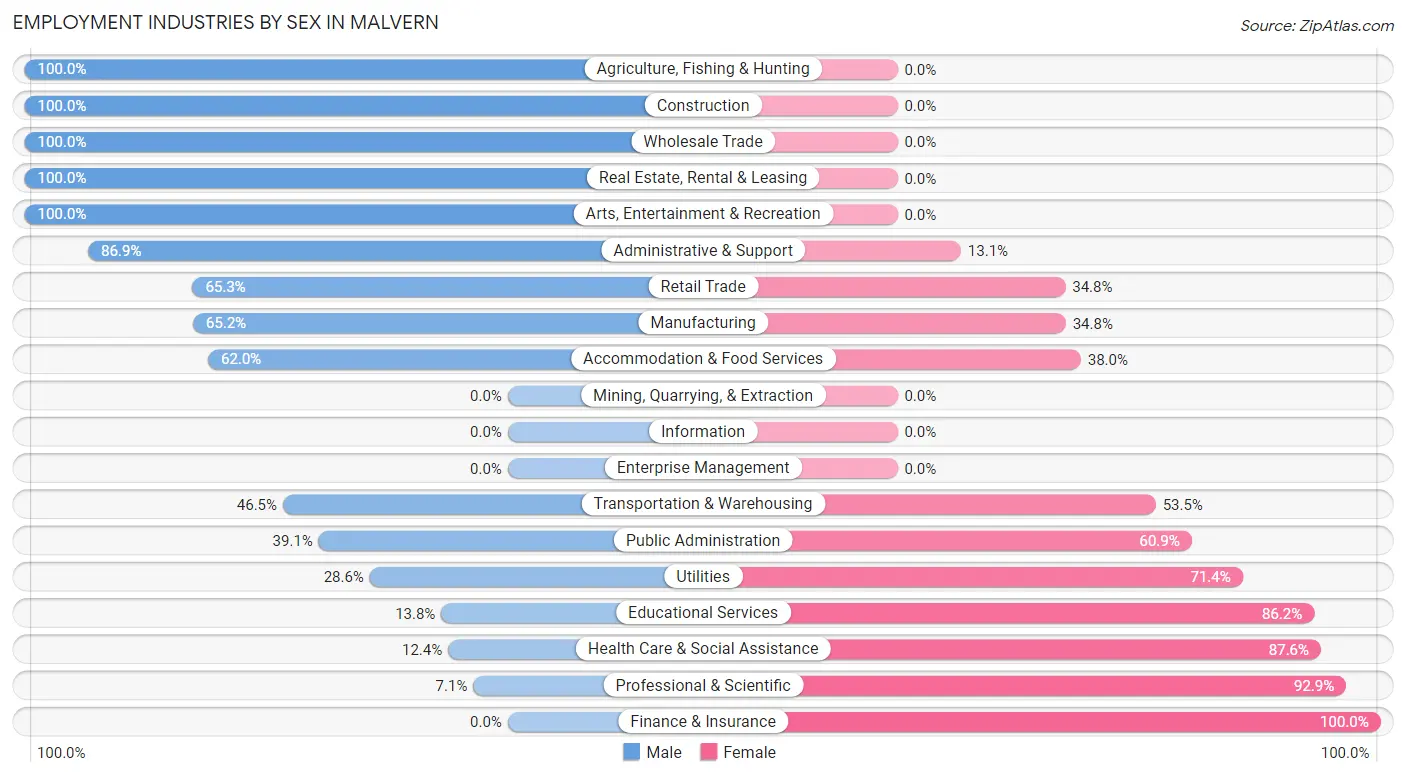
Employment Industries by Sex in Malvern
The Malvern industries that see more men than women are Agriculture, Fishing & Hunting (100.0%), Construction (100.0%), and Wholesale Trade (100.0%), whereas the industries that tend to have a higher number of women are Finance & Insurance (100.0%), Professional & Scientific (92.9%), and Health Care & Social Assistance (87.6%).
| Industry | Male | Female |
| Agriculture, Fishing & Hunting | 3 (100.0%) | 0 (0.0%) |
| Mining, Quarrying, & Extraction | 0 (0.0%) | 0 (0.0%) |
| Construction | 234 (100.0%) | 0 (0.0%) |
| Manufacturing | 374 (65.2%) | 200 (34.8%) |
| Wholesale Trade | 17 (100.0%) | 0 (0.0%) |
| Retail Trade | 462 (65.2%) | 246 (34.7%) |
| Transportation & Warehousing | 74 (46.5%) | 85 (53.5%) |
| Utilities | 12 (28.6%) | 30 (71.4%) |
| Information | 0 (0.0%) | 0 (0.0%) |
| Finance & Insurance | 0 (0.0%) | 26 (100.0%) |
| Real Estate, Rental & Leasing | 25 (100.0%) | 0 (0.0%) |
| Professional & Scientific | 8 (7.1%) | 104 (92.9%) |
| Enterprise Management | 0 (0.0%) | 0 (0.0%) |
| Administrative & Support | 152 (86.9%) | 23 (13.1%) |
| Educational Services | 23 (13.8%) | 144 (86.2%) |
| Health Care & Social Assistance | 79 (12.4%) | 560 (87.6%) |
| Arts, Entertainment & Recreation | 27 (100.0%) | 0 (0.0%) |
| Accommodation & Food Services | 201 (62.0%) | 123 (38.0%) |
| Public Administration | 63 (39.1%) | 98 (60.9%) |
| Total | 1,807 (49.4%) | 1,849 (50.6%) |
Education in Malvern
School Enrollment in Malvern
The most common levels of schooling among the 2,014 students in Malvern are high school (584 | 29.0%), middle school (464 | 23.0%), and elementary school (363 | 18.0%).
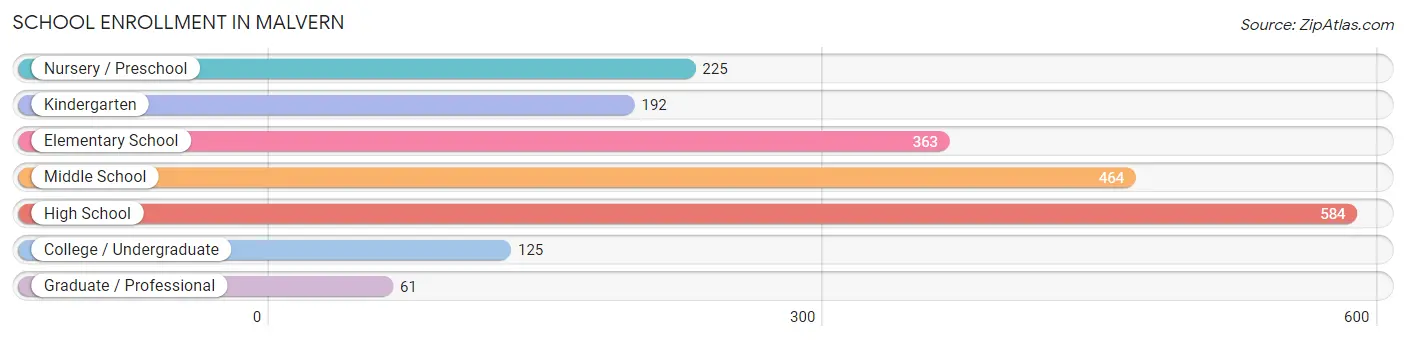
| School Level | # Students | % Students |
| Nursery / Preschool | 225 | 11.2% |
| Kindergarten | 192 | 9.5% |
| Elementary School | 363 | 18.0% |
| Middle School | 464 | 23.0% |
| High School | 584 | 29.0% |
| College / Undergraduate | 125 | 6.2% |
| Graduate / Professional | 61 | 3.0% |
| Total | 2,014 | 100.0% |
School Enrollment by Age by Funding Source in Malvern
Out of a total of 2,014 students who are enrolled in schools in Malvern, 77 (3.8%) attend a private institution, while the remaining 1,937 (96.2%) are enrolled in public schools. The age group of 10 to 14 year olds has the highest likelihood of being enrolled in private schools, with 65 (12.5% in the age bracket) enrolled. Conversely, the age group of 3 to 4 year olds has the lowest likelihood of being enrolled in a private school, with 137 (100.0% in the age bracket) attending a public institution.
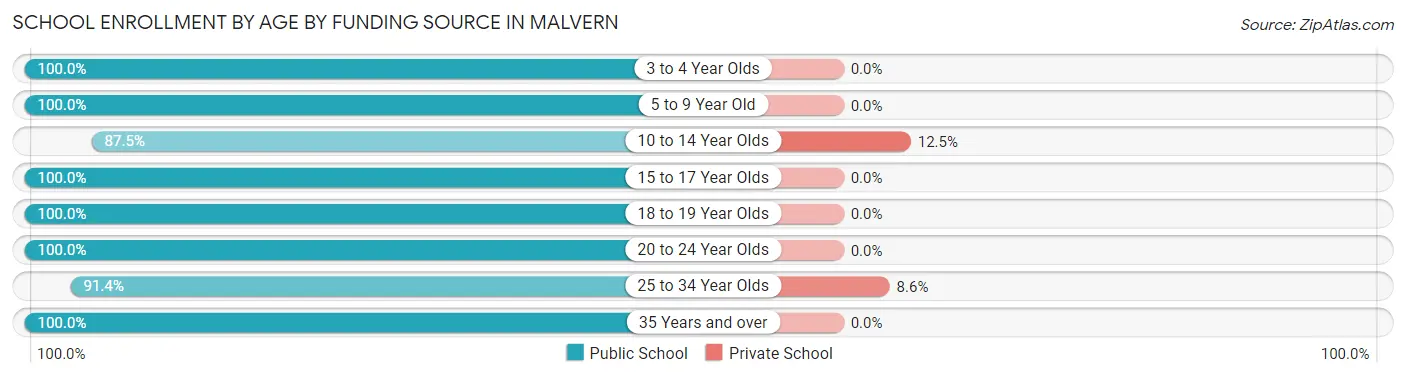
| Age Bracket | Public School | Private School |
| 3 to 4 Year Olds | 137 (100.0%) | 0 (0.0%) |
| 5 to 9 Year Old | 615 (100.0%) | 0 (0.0%) |
| 10 to 14 Year Olds | 455 (87.5%) | 65 (12.5%) |
| 15 to 17 Year Olds | 276 (100.0%) | 0 (0.0%) |
| 18 to 19 Year Olds | 199 (100.0%) | 0 (0.0%) |
| 20 to 24 Year Olds | 41 (100.0%) | 0 (0.0%) |
| 25 to 34 Year Olds | 128 (91.4%) | 12 (8.6%) |
| 35 Years and over | 86 (100.0%) | 0 (0.0%) |
| Total | 1,937 (96.2%) | 77 (3.8%) |
Educational Attainment by Field of Study in Malvern
Education (407 | 40.2%), business (211 | 20.8%), science & technology (125 | 12.3%), visual & performing arts (87 | 8.6%), and liberal arts & history (43 | 4.3%) are the most common fields of study among 1,012 individuals in Malvern who have obtained a bachelor's degree or higher.
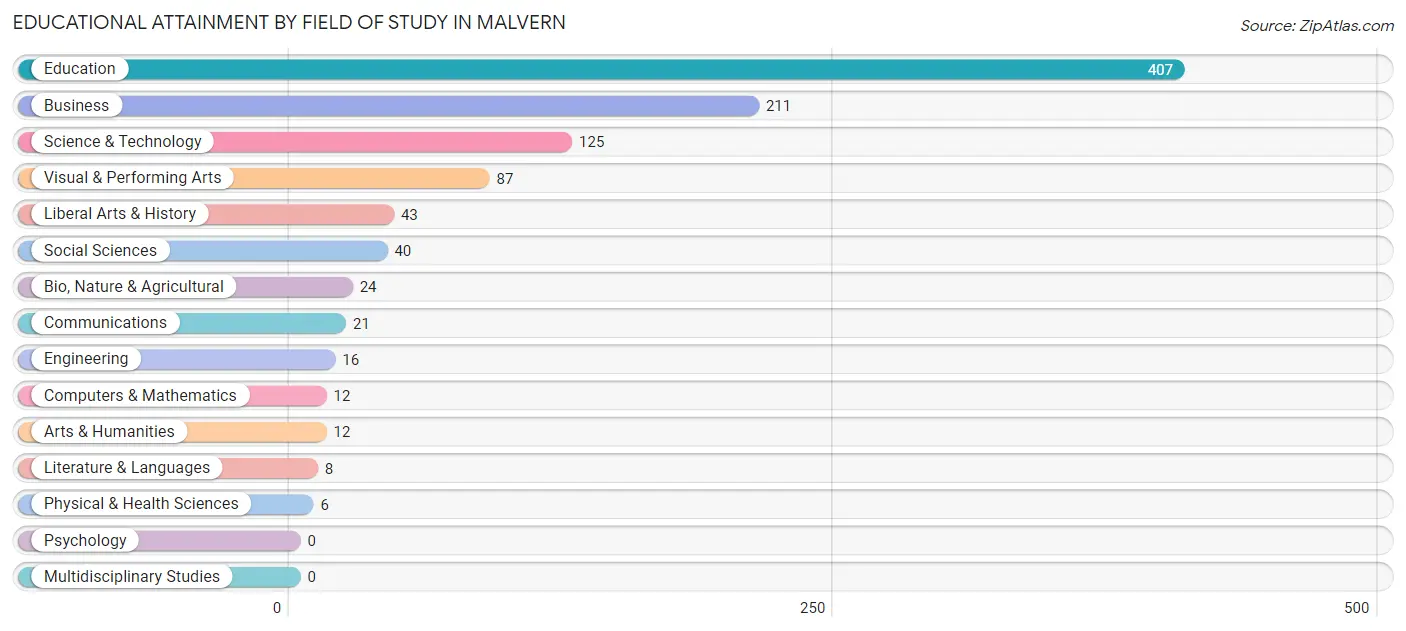
| Field of Study | # Graduates | % Graduates |
| Computers & Mathematics | 12 | 1.2% |
| Bio, Nature & Agricultural | 24 | 2.4% |
| Physical & Health Sciences | 6 | 0.6% |
| Psychology | 0 | 0.0% |
| Social Sciences | 40 | 4.0% |
| Engineering | 16 | 1.6% |
| Multidisciplinary Studies | 0 | 0.0% |
| Science & Technology | 125 | 12.3% |
| Business | 211 | 20.8% |
| Education | 407 | 40.2% |
| Literature & Languages | 8 | 0.8% |
| Liberal Arts & History | 43 | 4.3% |
| Visual & Performing Arts | 87 | 8.6% |
| Communications | 21 | 2.1% |
| Arts & Humanities | 12 | 1.2% |
| Total | 1,012 | 100.0% |
Transportation & Commute in Malvern
Vehicle Availability by Sex in Malvern
The most prevalent vehicle ownership categories in Malvern are males with 2 vehicles (865, accounting for 47.3%) and females with 2 vehicles (565, making up 46.8%).
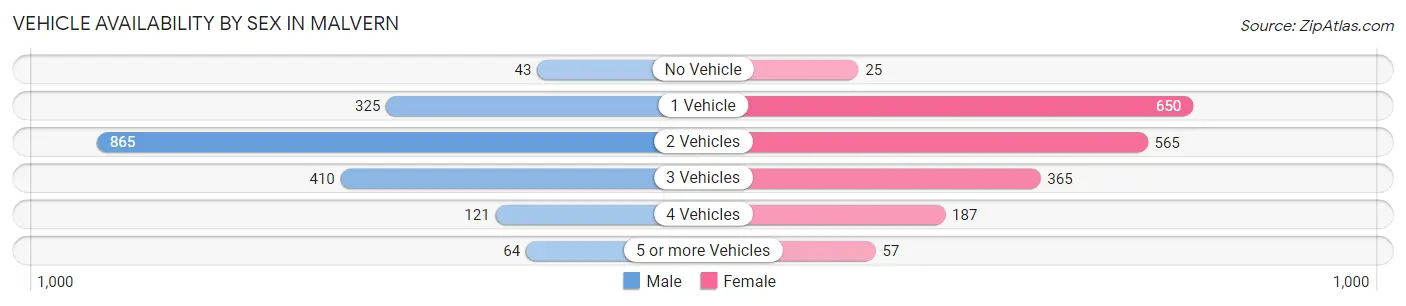
| Vehicles Available | Male | Female |
| No Vehicle | 43 (2.4%) | 25 (1.3%) |
| 1 Vehicle | 325 (17.8%) | 650 (35.1%) |
| 2 Vehicles | 865 (47.3%) | 565 (30.6%) |
| 3 Vehicles | 410 (22.4%) | 365 (19.7%) |
| 4 Vehicles | 121 (6.6%) | 187 (10.1%) |
| 5 or more Vehicles | 64 (3.5%) | 57 (3.1%) |
| Total | 1,828 (100.0%) | 1,849 (100.0%) |
Commute Time in Malvern
The most frequently occuring commute durations in Malvern are 5 to 9 minutes (771 commuters, 21.3%), 10 to 14 minutes (706 commuters, 19.6%), and less than 5 minutes (447 commuters, 12.4%).
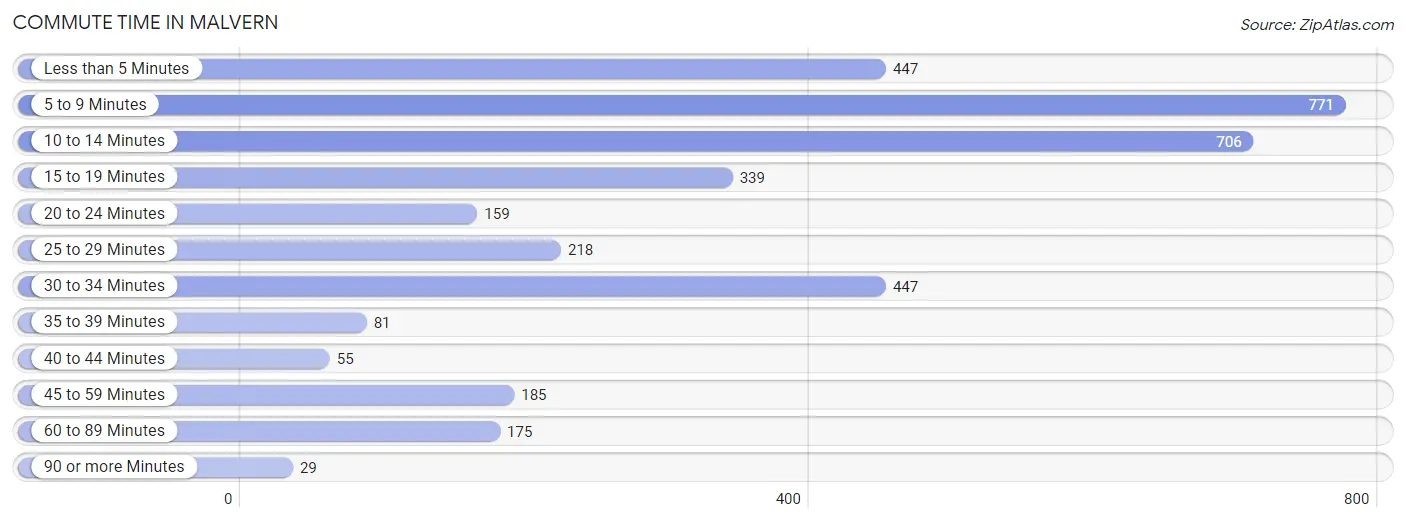
| Commute Time | # Commuters | % Commuters |
| Less than 5 Minutes | 447 | 12.4% |
| 5 to 9 Minutes | 771 | 21.3% |
| 10 to 14 Minutes | 706 | 19.6% |
| 15 to 19 Minutes | 339 | 9.4% |
| 20 to 24 Minutes | 159 | 4.4% |
| 25 to 29 Minutes | 218 | 6.0% |
| 30 to 34 Minutes | 447 | 12.4% |
| 35 to 39 Minutes | 81 | 2.2% |
| 40 to 44 Minutes | 55 | 1.5% |
| 45 to 59 Minutes | 185 | 5.1% |
| 60 to 89 Minutes | 175 | 4.8% |
| 90 or more Minutes | 29 | 0.8% |
Commute Time by Sex in Malvern
The most common commute times in Malvern are 10 to 14 minutes (395 commuters, 22.0%) for males and 5 to 9 minutes (389 commuters, 21.4%) for females.
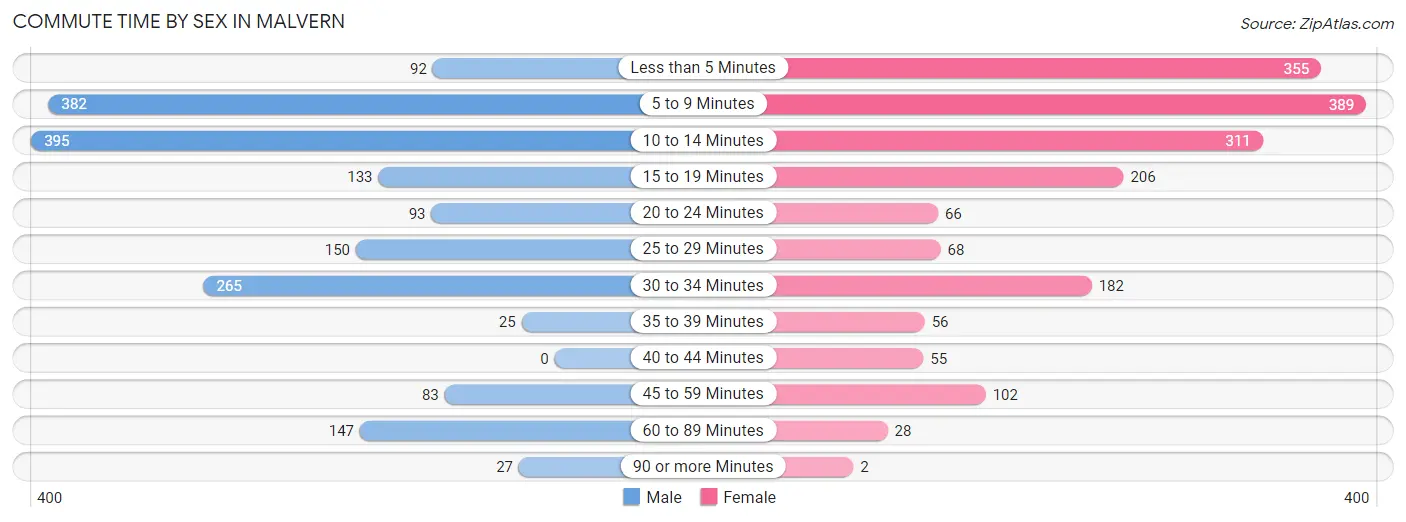
| Commute Time | Male | Female |
| Less than 5 Minutes | 92 (5.1%) | 355 (19.5%) |
| 5 to 9 Minutes | 382 (21.3%) | 389 (21.4%) |
| 10 to 14 Minutes | 395 (22.0%) | 311 (17.1%) |
| 15 to 19 Minutes | 133 (7.4%) | 206 (11.3%) |
| 20 to 24 Minutes | 93 (5.2%) | 66 (3.6%) |
| 25 to 29 Minutes | 150 (8.4%) | 68 (3.7%) |
| 30 to 34 Minutes | 265 (14.8%) | 182 (10.0%) |
| 35 to 39 Minutes | 25 (1.4%) | 56 (3.1%) |
| 40 to 44 Minutes | 0 (0.0%) | 55 (3.0%) |
| 45 to 59 Minutes | 83 (4.6%) | 102 (5.6%) |
| 60 to 89 Minutes | 147 (8.2%) | 28 (1.5%) |
| 90 or more Minutes | 27 (1.5%) | 2 (0.1%) |
Time of Departure to Work by Sex in Malvern
The most frequent times of departure to work in Malvern are 8:00 AM to 8:29 AM (307, 17.1%) for males and 7:30 AM to 7:59 AM (354, 19.5%) for females.
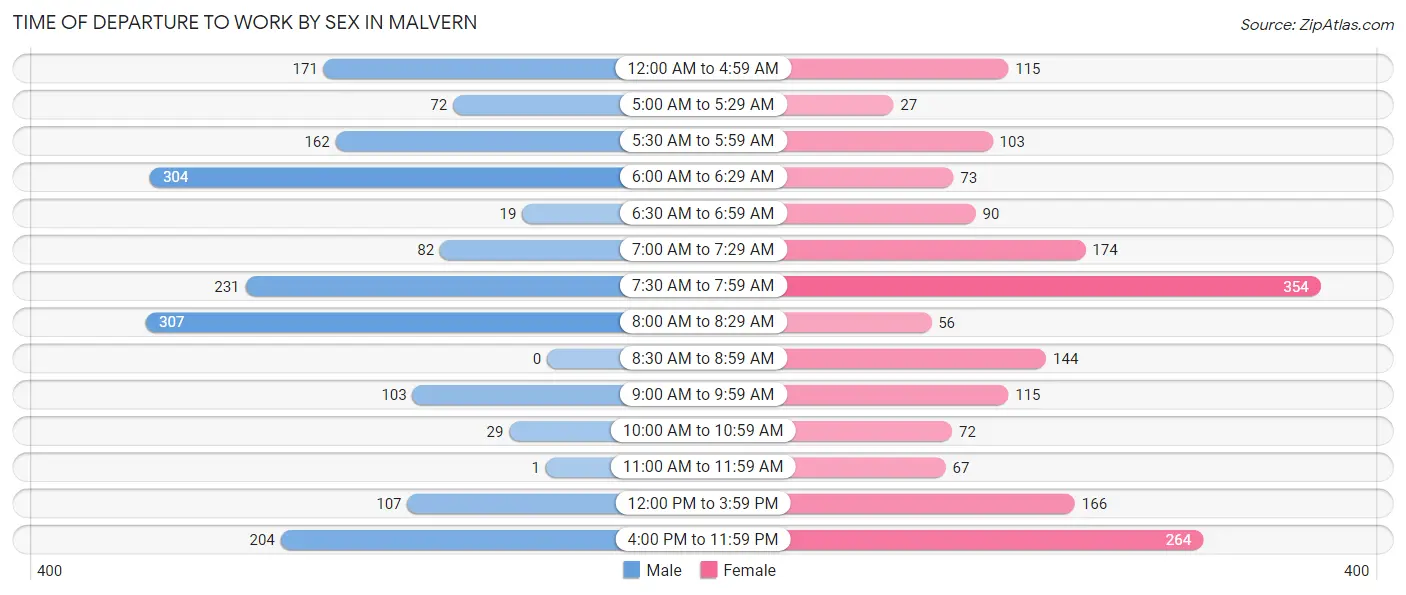
| Time of Departure | Male | Female |
| 12:00 AM to 4:59 AM | 171 (9.5%) | 115 (6.3%) |
| 5:00 AM to 5:29 AM | 72 (4.0%) | 27 (1.5%) |
| 5:30 AM to 5:59 AM | 162 (9.0%) | 103 (5.7%) |
| 6:00 AM to 6:29 AM | 304 (17.0%) | 73 (4.0%) |
| 6:30 AM to 6:59 AM | 19 (1.1%) | 90 (5.0%) |
| 7:00 AM to 7:29 AM | 82 (4.6%) | 174 (9.6%) |
| 7:30 AM to 7:59 AM | 231 (12.9%) | 354 (19.5%) |
| 8:00 AM to 8:29 AM | 307 (17.1%) | 56 (3.1%) |
| 8:30 AM to 8:59 AM | 0 (0.0%) | 144 (7.9%) |
| 9:00 AM to 9:59 AM | 103 (5.8%) | 115 (6.3%) |
| 10:00 AM to 10:59 AM | 29 (1.6%) | 72 (4.0%) |
| 11:00 AM to 11:59 AM | 1 (0.1%) | 67 (3.7%) |
| 12:00 PM to 3:59 PM | 107 (6.0%) | 166 (9.1%) |
| 4:00 PM to 11:59 PM | 204 (11.4%) | 264 (14.5%) |
| Total | 1,792 (100.0%) | 1,820 (100.0%) |
Housing Occupancy in Malvern
Occupancy by Ownership in Malvern
Of the total 3,421 dwellings in Malvern, owner-occupied units account for 1,955 (57.2%), while renter-occupied units make up 1,466 (42.8%).
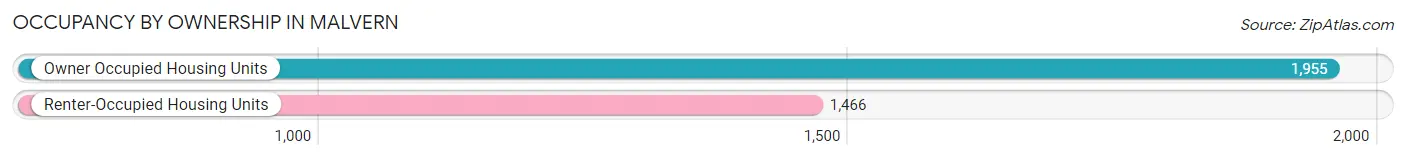
| Occupancy | # Housing Units | % Housing Units |
| Owner Occupied Housing Units | 1,955 | 57.2% |
| Renter-Occupied Housing Units | 1,466 | 42.8% |
| Total Occupied Housing Units | 3,421 | 100.0% |
Occupancy by Household Size in Malvern
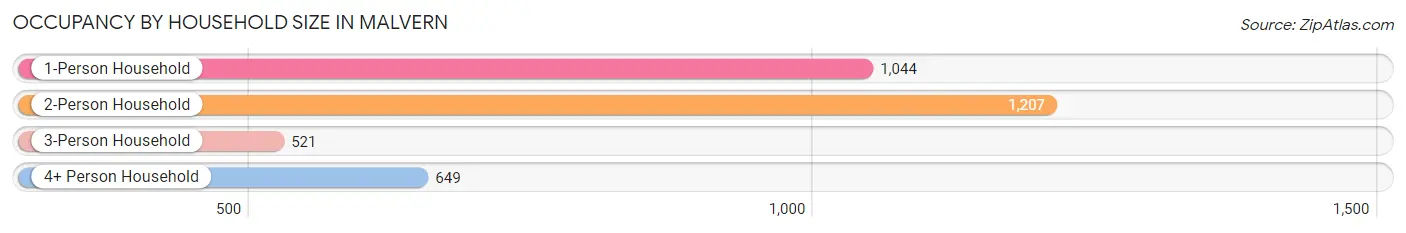
| Household Size | # Housing Units | % Housing Units |
| 1-Person Household | 1,044 | 30.5% |
| 2-Person Household | 1,207 | 35.3% |
| 3-Person Household | 521 | 15.2% |
| 4+ Person Household | 649 | 19.0% |
| Total Housing Units | 3,421 | 100.0% |
Occupancy by Ownership by Household Size in Malvern
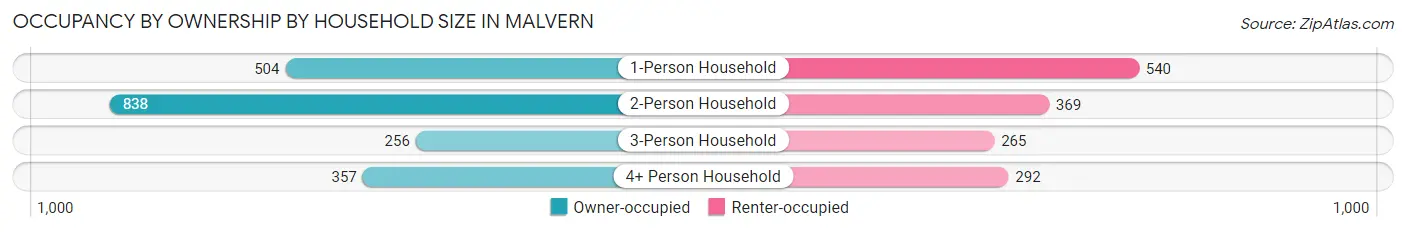
| Household Size | Owner-occupied | Renter-occupied |
| 1-Person Household | 504 (48.3%) | 540 (51.7%) |
| 2-Person Household | 838 (69.4%) | 369 (30.6%) |
| 3-Person Household | 256 (49.1%) | 265 (50.9%) |
| 4+ Person Household | 357 (55.0%) | 292 (45.0%) |
| Total Housing Units | 1,955 (57.2%) | 1,466 (42.8%) |
Occupancy by Educational Attainment in Malvern
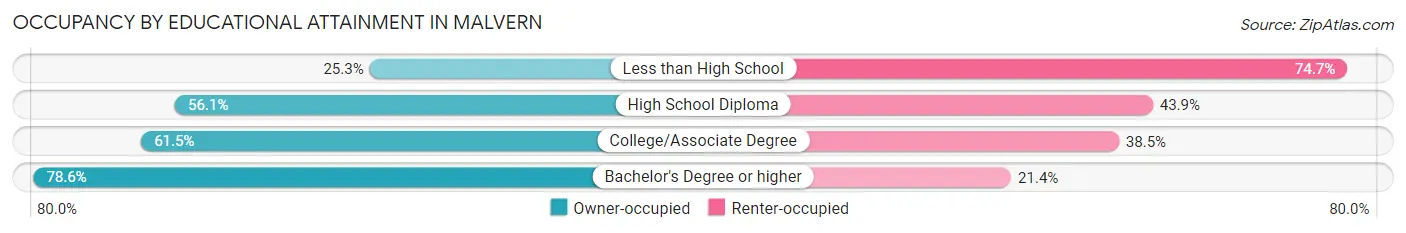
| Household Size | Owner-occupied | Renter-occupied |
| Less than High School | 105 (25.3%) | 310 (74.7%) |
| High School Diploma | 820 (56.1%) | 641 (43.9%) |
| College/Associate Degree | 663 (61.5%) | 415 (38.5%) |
| Bachelor's Degree or higher | 367 (78.6%) | 100 (21.4%) |
Occupancy by Age of Householder in Malvern
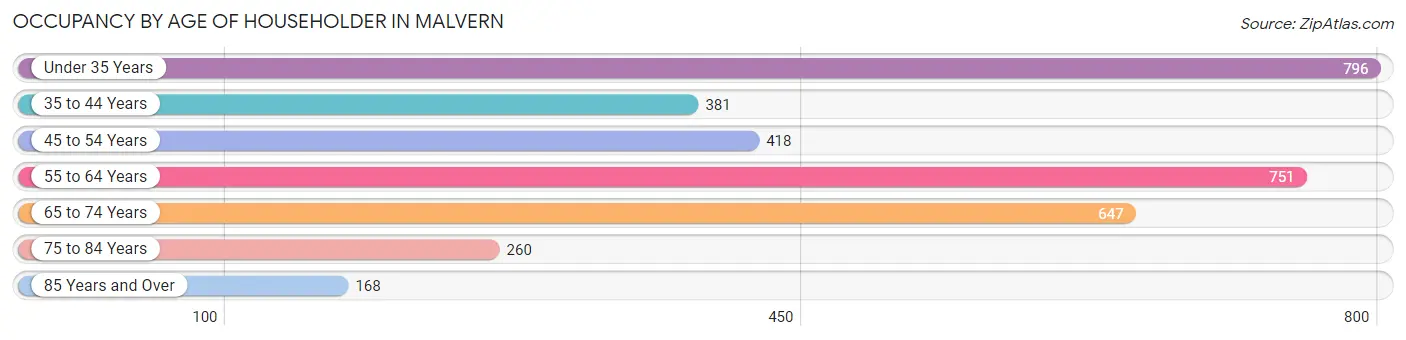
| Age Bracket | # Households | % Households |
| Under 35 Years | 796 | 23.3% |
| 35 to 44 Years | 381 | 11.1% |
| 45 to 54 Years | 418 | 12.2% |
| 55 to 64 Years | 751 | 22.0% |
| 65 to 74 Years | 647 | 18.9% |
| 75 to 84 Years | 260 | 7.6% |
| 85 Years and Over | 168 | 4.9% |
| Total | 3,421 | 100.0% |
Housing Finances in Malvern
Median Income by Occupancy in Malvern
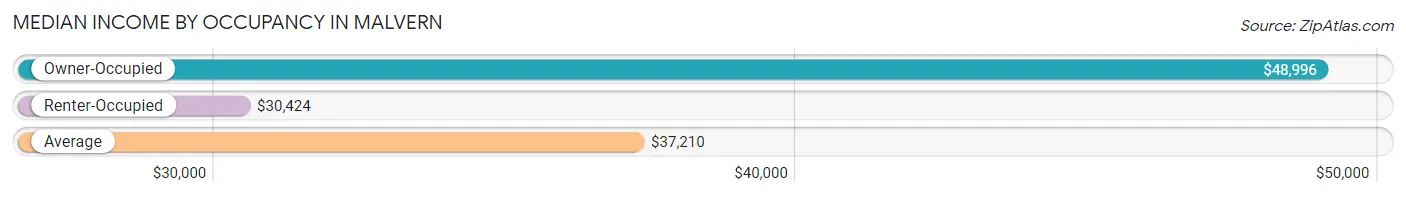
| Occupancy Type | # Households | Median Income |
| Owner-Occupied | 1,955 (57.2%) | $48,996 |
| Renter-Occupied | 1,466 (42.8%) | $30,424 |
| Average | 3,421 (100.0%) | $37,210 |
Occupancy by Householder Income Bracket in Malvern
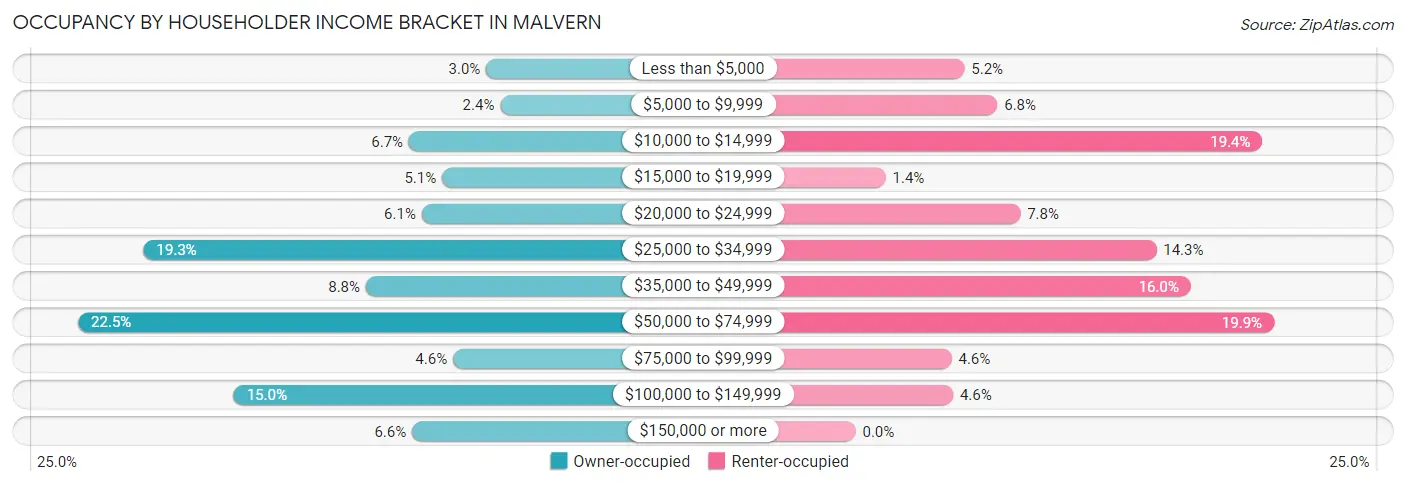
| Income Bracket | Owner-occupied | Renter-occupied |
| Less than $5,000 | 59 (3.0%) | 76 (5.2%) |
| $5,000 to $9,999 | 46 (2.4%) | 99 (6.8%) |
| $10,000 to $14,999 | 131 (6.7%) | 284 (19.4%) |
| $15,000 to $19,999 | 100 (5.1%) | 21 (1.4%) |
| $20,000 to $24,999 | 119 (6.1%) | 115 (7.8%) |
| $25,000 to $34,999 | 378 (19.3%) | 210 (14.3%) |
| $35,000 to $49,999 | 171 (8.7%) | 234 (16.0%) |
| $50,000 to $74,999 | 439 (22.5%) | 292 (19.9%) |
| $75,000 to $99,999 | 90 (4.6%) | 67 (4.6%) |
| $100,000 to $149,999 | 294 (15.0%) | 68 (4.6%) |
| $150,000 or more | 128 (6.6%) | 0 (0.0%) |
| Total | 1,955 (100.0%) | 1,466 (100.0%) |
Monthly Housing Cost Tiers in Malvern
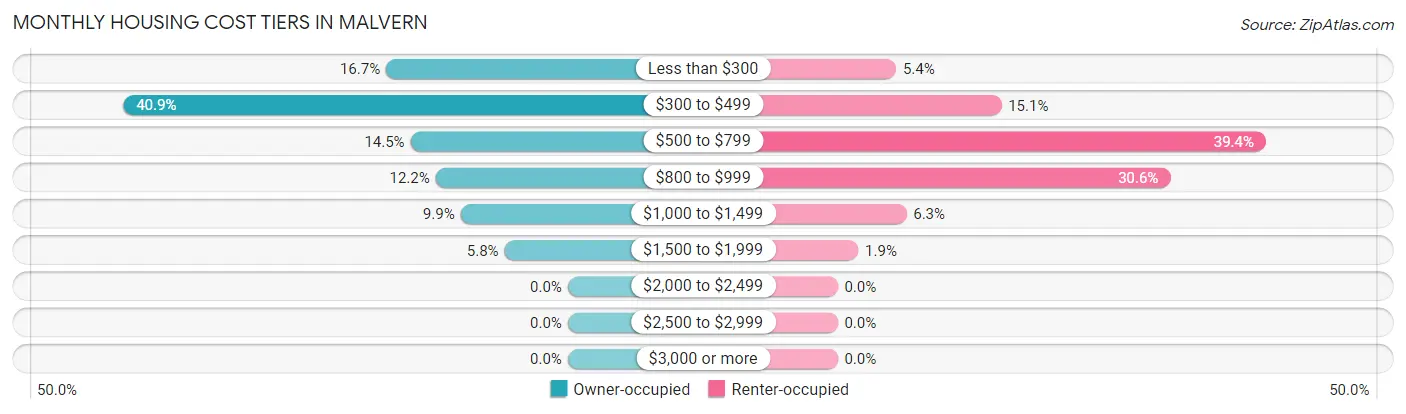
| Monthly Cost | Owner-occupied | Renter-occupied |
| Less than $300 | 327 (16.7%) | 79 (5.4%) |
| $300 to $499 | 800 (40.9%) | 221 (15.1%) |
| $500 to $799 | 283 (14.5%) | 578 (39.4%) |
| $800 to $999 | 238 (12.2%) | 449 (30.6%) |
| $1,000 to $1,499 | 193 (9.9%) | 93 (6.3%) |
| $1,500 to $1,999 | 114 (5.8%) | 28 (1.9%) |
| $2,000 to $2,499 | 0 (0.0%) | 0 (0.0%) |
| $2,500 to $2,999 | 0 (0.0%) | 0 (0.0%) |
| $3,000 or more | 0 (0.0%) | 0 (0.0%) |
| Total | 1,955 (100.0%) | 1,466 (100.0%) |
Physical Housing Characteristics in Malvern
Housing Structures in Malvern
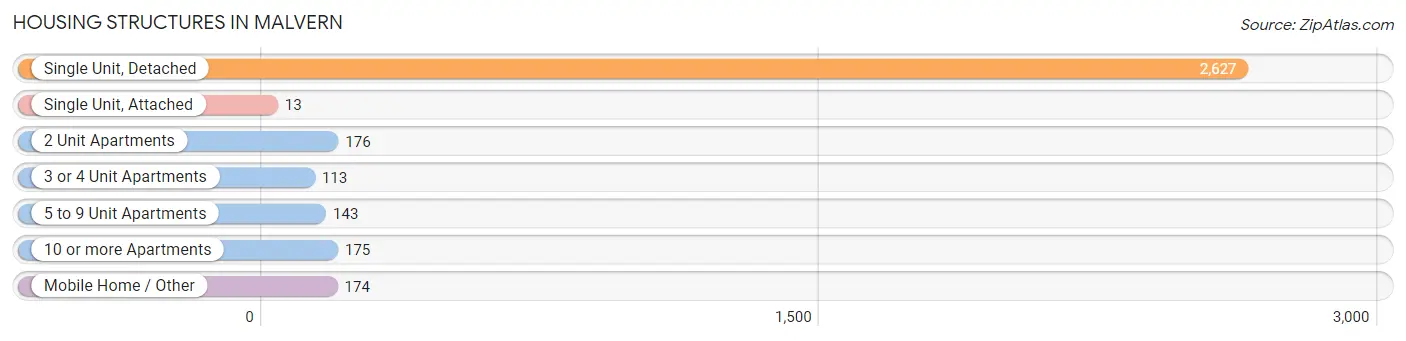
| Structure Type | # Housing Units | % Housing Units |
| Single Unit, Detached | 2,627 | 76.8% |
| Single Unit, Attached | 13 | 0.4% |
| 2 Unit Apartments | 176 | 5.1% |
| 3 or 4 Unit Apartments | 113 | 3.3% |
| 5 to 9 Unit Apartments | 143 | 4.2% |
| 10 or more Apartments | 175 | 5.1% |
| Mobile Home / Other | 174 | 5.1% |
| Total | 3,421 | 100.0% |
Housing Structures by Occupancy in Malvern
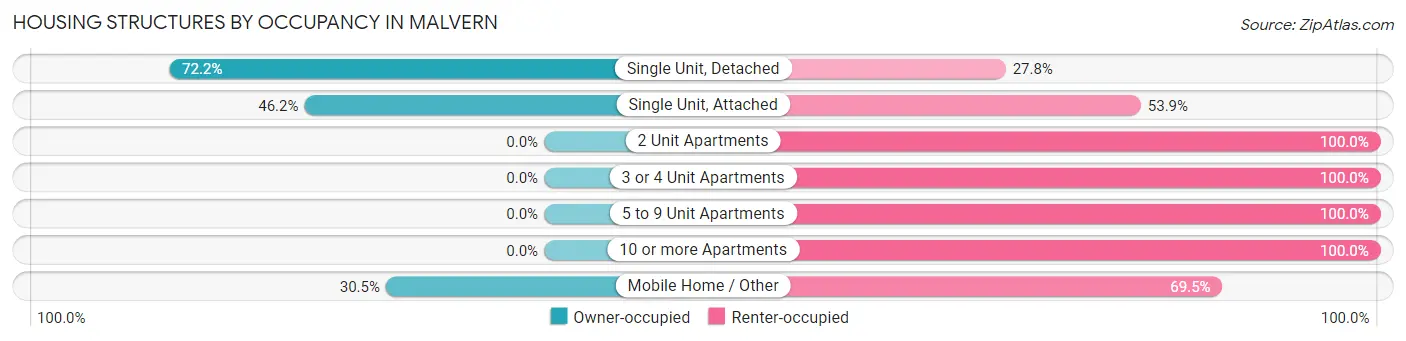
| Structure Type | Owner-occupied | Renter-occupied |
| Single Unit, Detached | 1,896 (72.2%) | 731 (27.8%) |
| Single Unit, Attached | 6 (46.2%) | 7 (53.8%) |
| 2 Unit Apartments | 0 (0.0%) | 176 (100.0%) |
| 3 or 4 Unit Apartments | 0 (0.0%) | 113 (100.0%) |
| 5 to 9 Unit Apartments | 0 (0.0%) | 143 (100.0%) |
| 10 or more Apartments | 0 (0.0%) | 175 (100.0%) |
| Mobile Home / Other | 53 (30.5%) | 121 (69.5%) |
| Total | 1,955 (57.2%) | 1,466 (42.8%) |
Housing Structures by Number of Rooms in Malvern
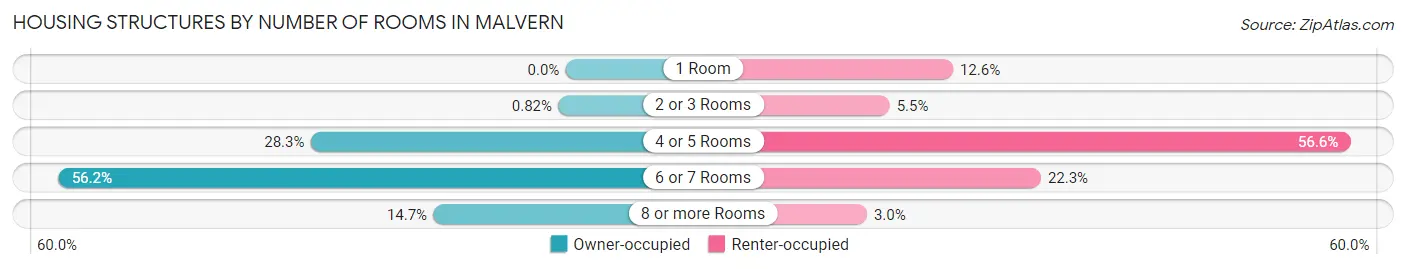
| Number of Rooms | Owner-occupied | Renter-occupied |
| 1 Room | 0 (0.0%) | 184 (12.6%) |
| 2 or 3 Rooms | 16 (0.8%) | 81 (5.5%) |
| 4 or 5 Rooms | 553 (28.3%) | 830 (56.6%) |
| 6 or 7 Rooms | 1,099 (56.2%) | 327 (22.3%) |
| 8 or more Rooms | 287 (14.7%) | 44 (3.0%) |
| Total | 1,955 (100.0%) | 1,466 (100.0%) |
Housing Structure by Heating Type in Malvern
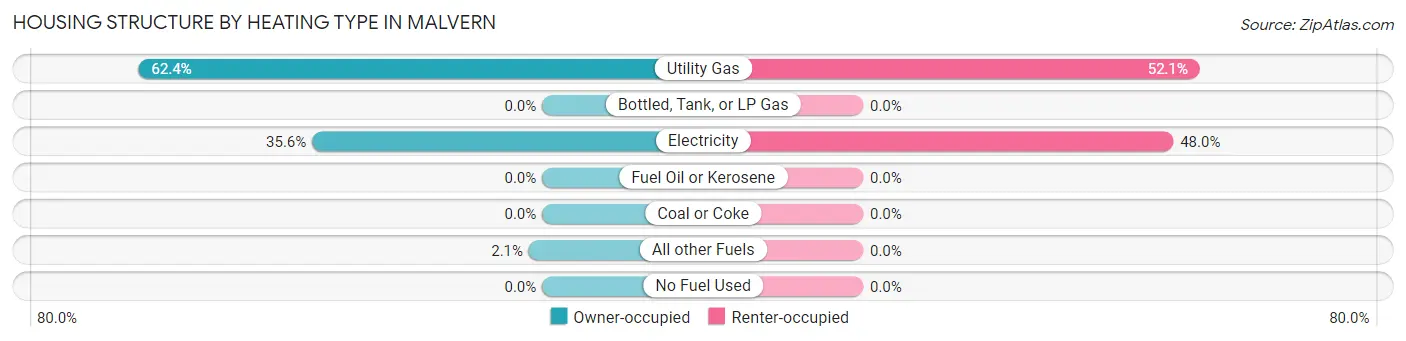
| Heating Type | Owner-occupied | Renter-occupied |
| Utility Gas | 1,220 (62.4%) | 763 (52.0%) |
| Bottled, Tank, or LP Gas | 0 (0.0%) | 0 (0.0%) |
| Electricity | 695 (35.5%) | 703 (47.9%) |
| Fuel Oil or Kerosene | 0 (0.0%) | 0 (0.0%) |
| Coal or Coke | 0 (0.0%) | 0 (0.0%) |
| All other Fuels | 40 (2.1%) | 0 (0.0%) |
| No Fuel Used | 0 (0.0%) | 0 (0.0%) |
| Total | 1,955 (100.0%) | 1,466 (100.0%) |
Household Vehicle Usage in Malvern
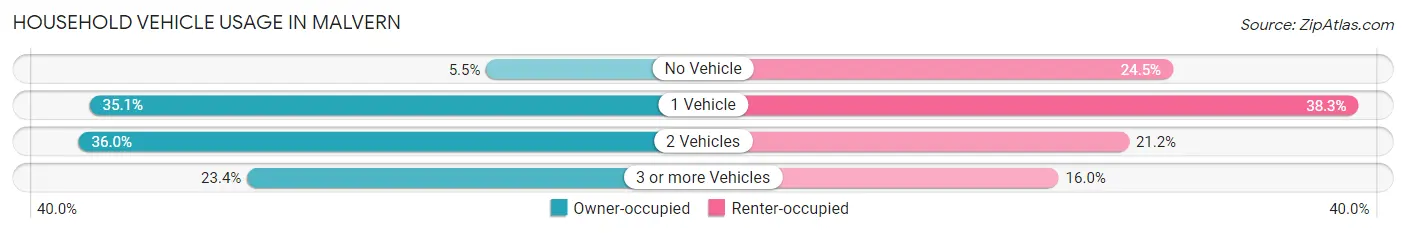
| Vehicles per Household | Owner-occupied | Renter-occupied |
| No Vehicle | 108 (5.5%) | 359 (24.5%) |
| 1 Vehicle | 687 (35.1%) | 562 (38.3%) |
| 2 Vehicles | 703 (36.0%) | 311 (21.2%) |
| 3 or more Vehicles | 457 (23.4%) | 234 (16.0%) |
| Total | 1,955 (100.0%) | 1,466 (100.0%) |
Real Estate & Mortgages in Malvern
Real Estate and Mortgage Overview in Malvern
| Characteristic | Without Mortgage | With Mortgage |
| Housing Units | 1,157 | 798 |
| Median Property Value | $85,100 | $94,900 |
| Median Household Income | $36,319 | $106 |
| Monthly Housing Costs | $339 | $0 |
| Real Estate Taxes | $494 | $120 |
Property Value by Mortgage Status in Malvern
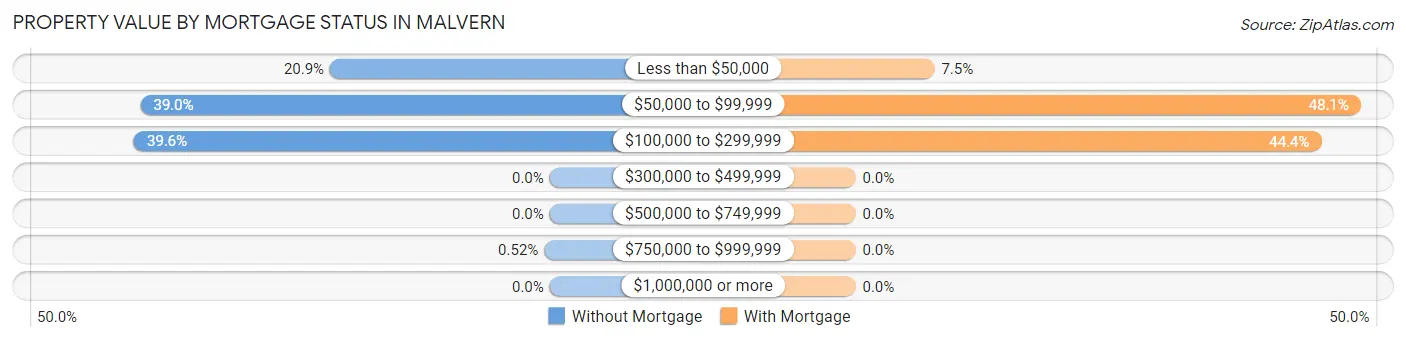
| Property Value | Without Mortgage | With Mortgage |
| Less than $50,000 | 242 (20.9%) | 60 (7.5%) |
| $50,000 to $99,999 | 451 (39.0%) | 384 (48.1%) |
| $100,000 to $299,999 | 458 (39.6%) | 354 (44.4%) |
| $300,000 to $499,999 | 0 (0.0%) | 0 (0.0%) |
| $500,000 to $749,999 | 0 (0.0%) | 0 (0.0%) |
| $750,000 to $999,999 | 6 (0.5%) | 0 (0.0%) |
| $1,000,000 or more | 0 (0.0%) | 0 (0.0%) |
| Total | 1,157 (100.0%) | 798 (100.0%) |
Household Income by Mortgage Status in Malvern
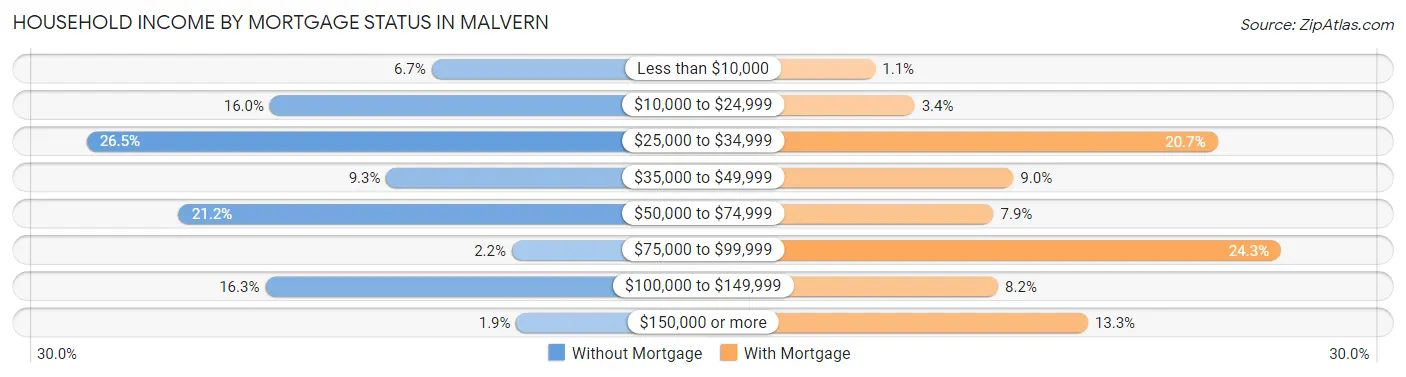
| Household Income | Without Mortgage | With Mortgage |
| Less than $10,000 | 78 (6.7%) | 9 (1.1%) |
| $10,000 to $24,999 | 185 (16.0%) | 27 (3.4%) |
| $25,000 to $34,999 | 306 (26.5%) | 165 (20.7%) |
| $35,000 to $49,999 | 108 (9.3%) | 72 (9.0%) |
| $50,000 to $74,999 | 245 (21.2%) | 63 (7.9%) |
| $75,000 to $99,999 | 25 (2.2%) | 194 (24.3%) |
| $100,000 to $149,999 | 188 (16.3%) | 65 (8.2%) |
| $150,000 or more | 22 (1.9%) | 106 (13.3%) |
| Total | 1,157 (100.0%) | 798 (100.0%) |
Property Value to Household Income Ratio in Malvern
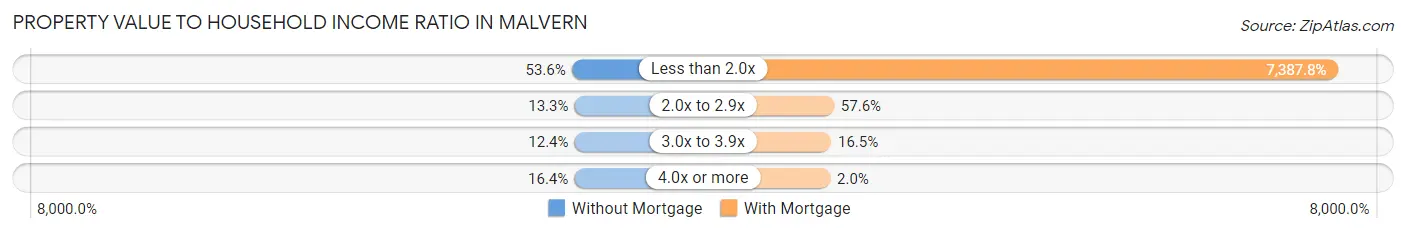
| Value-to-Income Ratio | Without Mortgage | With Mortgage |
| Less than 2.0x | 620 (53.6%) | 58,955 (7,387.8%) |
| 2.0x to 2.9x | 154 (13.3%) | 460 (57.6%) |
| 3.0x to 3.9x | 143 (12.4%) | 132 (16.5%) |
| 4.0x or more | 190 (16.4%) | 16 (2.0%) |
| Total | 1,157 (100.0%) | 798 (100.0%) |
Real Estate Taxes by Mortgage Status in Malvern
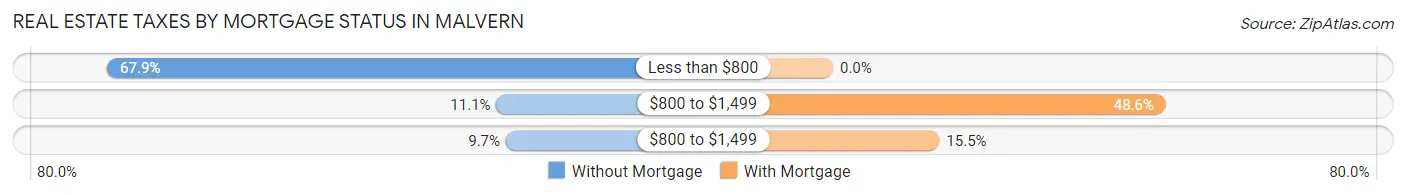
| Property Taxes | Without Mortgage | With Mortgage |
| Less than $800 | 786 (67.9%) | 0 (0.0%) |
| $800 to $1,499 | 128 (11.1%) | 388 (48.6%) |
| $800 to $1,499 | 112 (9.7%) | 124 (15.5%) |
| Total | 1,157 (100.0%) | 798 (100.0%) |
Health & Disability in Malvern
Health Insurance Coverage by Age in Malvern
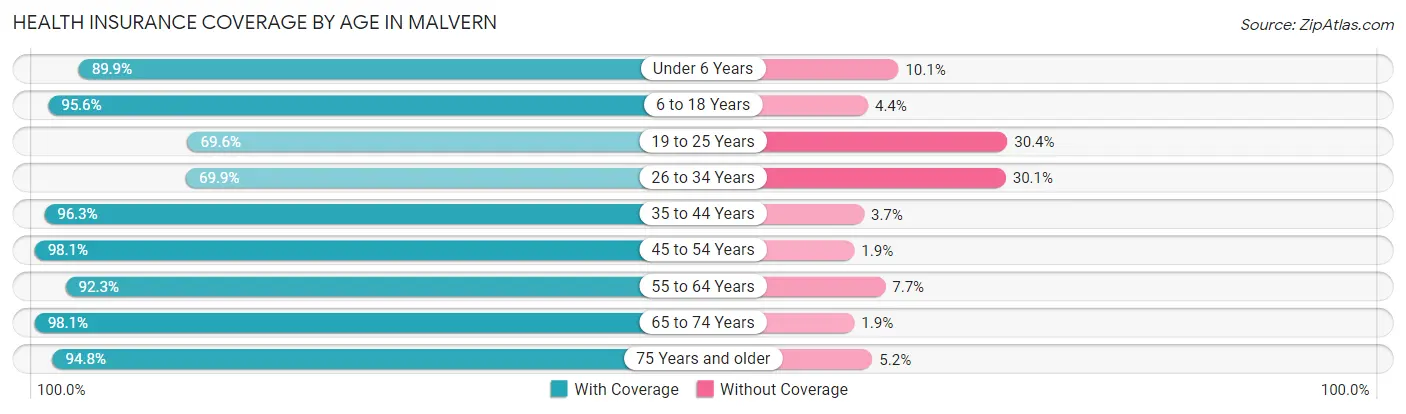
| Age Bracket | With Coverage | Without Coverage |
| Under 6 Years | 631 (89.9%) | 71 (10.1%) |
| 6 to 18 Years | 1,317 (95.6%) | 61 (4.4%) |
| 19 to 25 Years | 421 (69.6%) | 184 (30.4%) |
| 26 to 34 Years | 956 (69.9%) | 412 (30.1%) |
| 35 to 44 Years | 1,125 (96.3%) | 43 (3.7%) |
| 45 to 54 Years | 829 (98.1%) | 16 (1.9%) |
| 55 to 64 Years | 892 (92.3%) | 74 (7.7%) |
| 65 to 74 Years | 984 (98.1%) | 19 (1.9%) |
| 75 Years and older | 579 (94.8%) | 32 (5.2%) |
| Total | 7,734 (89.4%) | 912 (10.5%) |
Health Insurance Coverage by Citizenship Status in Malvern

| Citizenship Status | With Coverage | Without Coverage |
| Native Born | 631 (89.9%) | 71 (10.1%) |
| Foreign Born, Citizen | 1,317 (95.6%) | 61 (4.4%) |
| Foreign Born, not a Citizen | 421 (69.6%) | 184 (30.4%) |
Health Insurance Coverage by Household Income in Malvern

| Household Income | With Coverage | Without Coverage |
| Under $25,000 | 1,699 (87.3%) | 247 (12.7%) |
| $25,000 to $49,999 | 1,917 (80.1%) | 477 (19.9%) |
| $50,000 to $74,999 | 1,873 (95.4%) | 90 (4.6%) |
| $75,000 to $99,999 | 847 (93.3%) | 61 (6.7%) |
| $100,000 and over | 1,398 (97.4%) | 37 (2.6%) |
Public vs Private Health Insurance Coverage by Age in Malvern
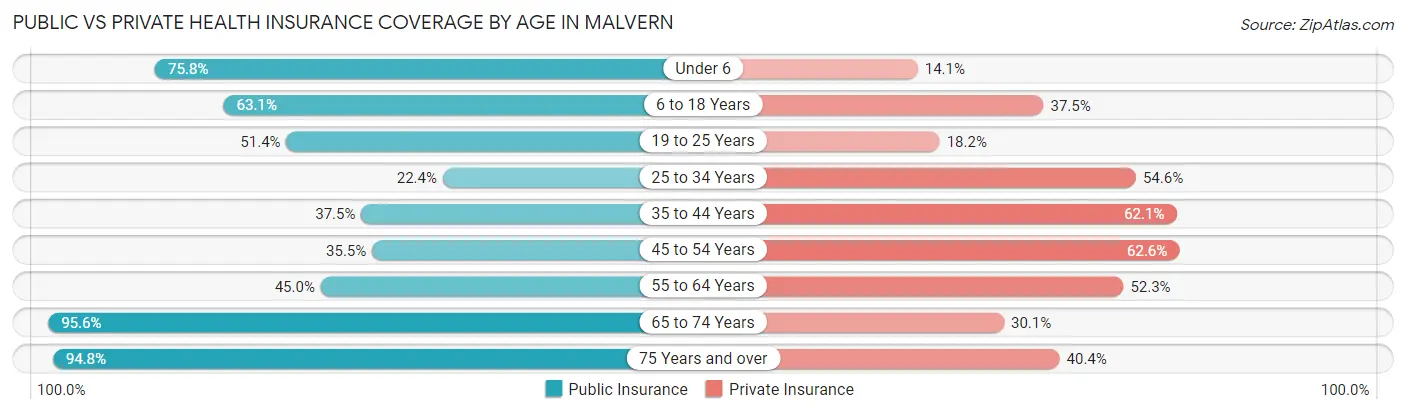
| Age Bracket | Public Insurance | Private Insurance |
| Under 6 | 532 (75.8%) | 99 (14.1%) |
| 6 to 18 Years | 869 (63.1%) | 516 (37.4%) |
| 19 to 25 Years | 311 (51.4%) | 110 (18.2%) |
| 25 to 34 Years | 306 (22.4%) | 747 (54.6%) |
| 35 to 44 Years | 438 (37.5%) | 725 (62.1%) |
| 45 to 54 Years | 300 (35.5%) | 529 (62.6%) |
| 55 to 64 Years | 435 (45.0%) | 505 (52.3%) |
| 65 to 74 Years | 959 (95.6%) | 302 (30.1%) |
| 75 Years and over | 579 (94.8%) | 247 (40.4%) |
| Total | 4,729 (54.7%) | 3,780 (43.7%) |
Disability Status by Sex by Age in Malvern
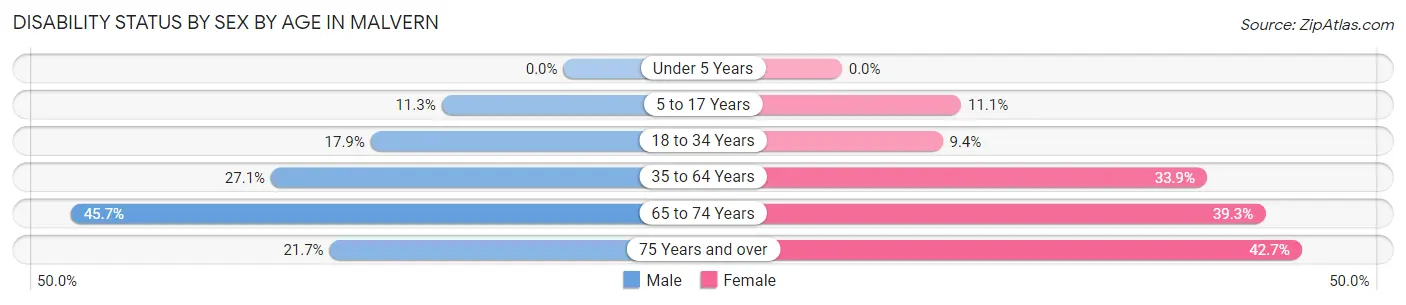
| Age Bracket | Male | Female |
| Under 5 Years | 0 (0.0%) | 0 (0.0%) |
| 5 to 17 Years | 81 (11.3%) | 84 (11.1%) |
| 18 to 34 Years | 200 (17.9%) | 87 (9.3%) |
| 35 to 64 Years | 371 (27.1%) | 546 (33.9%) |
| 65 to 74 Years | 171 (45.7%) | 247 (39.3%) |
| 75 Years and over | 38 (21.7%) | 186 (42.7%) |
Disability Class by Sex by Age in Malvern
Disability Class: Hearing Difficulty
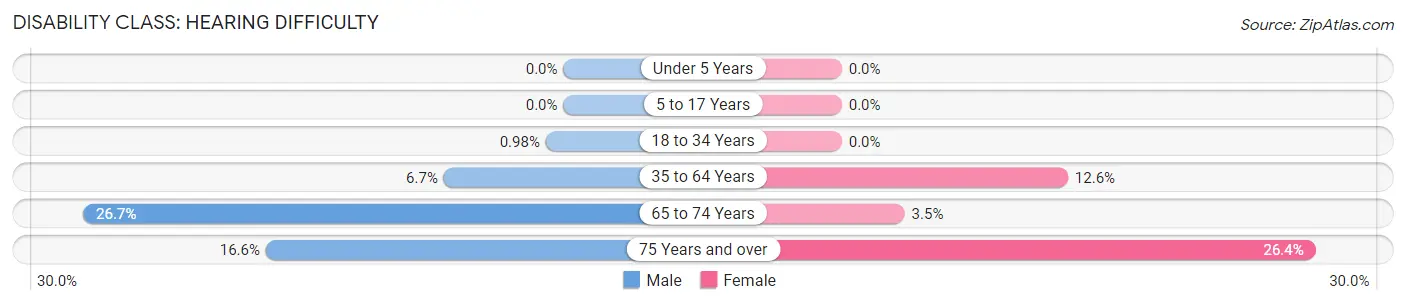
| Age Bracket | Male | Female |
| Under 5 Years | 0 (0.0%) | 0 (0.0%) |
| 5 to 17 Years | 0 (0.0%) | 0 (0.0%) |
| 18 to 34 Years | 11 (1.0%) | 0 (0.0%) |
| 35 to 64 Years | 91 (6.7%) | 203 (12.6%) |
| 65 to 74 Years | 100 (26.7%) | 22 (3.5%) |
| 75 Years and over | 29 (16.6%) | 115 (26.4%) |
Disability Class: Vision Difficulty
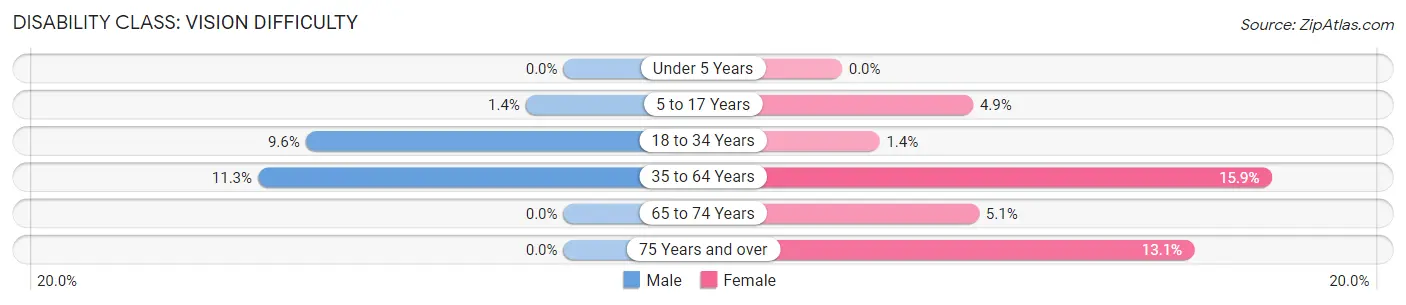
| Age Bracket | Male | Female |
| Under 5 Years | 0 (0.0%) | 0 (0.0%) |
| 5 to 17 Years | 10 (1.4%) | 37 (4.9%) |
| 18 to 34 Years | 107 (9.6%) | 13 (1.4%) |
| 35 to 64 Years | 155 (11.3%) | 257 (15.9%) |
| 65 to 74 Years | 0 (0.0%) | 32 (5.1%) |
| 75 Years and over | 0 (0.0%) | 57 (13.1%) |
Disability Class: Cognitive Difficulty
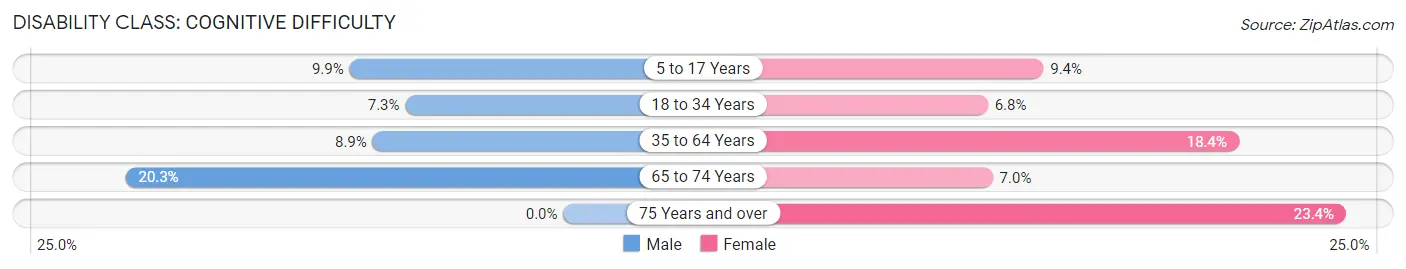
| Age Bracket | Male | Female |
| 5 to 17 Years | 71 (9.9%) | 71 (9.3%) |
| 18 to 34 Years | 82 (7.3%) | 63 (6.8%) |
| 35 to 64 Years | 121 (8.8%) | 297 (18.4%) |
| 65 to 74 Years | 76 (20.3%) | 44 (7.0%) |
| 75 Years and over | 0 (0.0%) | 102 (23.4%) |
Disability Class: Ambulatory Difficulty
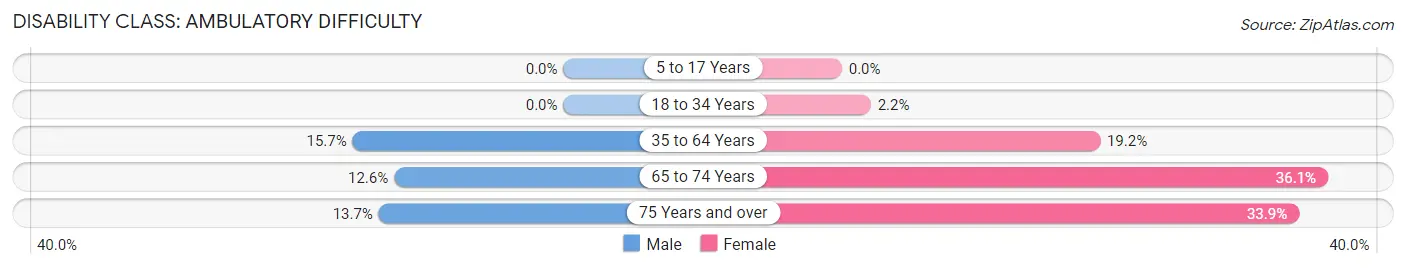
| Age Bracket | Male | Female |
| 5 to 17 Years | 0 (0.0%) | 0 (0.0%) |
| 18 to 34 Years | 0 (0.0%) | 20 (2.1%) |
| 35 to 64 Years | 214 (15.7%) | 309 (19.2%) |
| 65 to 74 Years | 47 (12.6%) | 227 (36.1%) |
| 75 Years and over | 24 (13.7%) | 148 (33.9%) |
Disability Class: Self-Care Difficulty
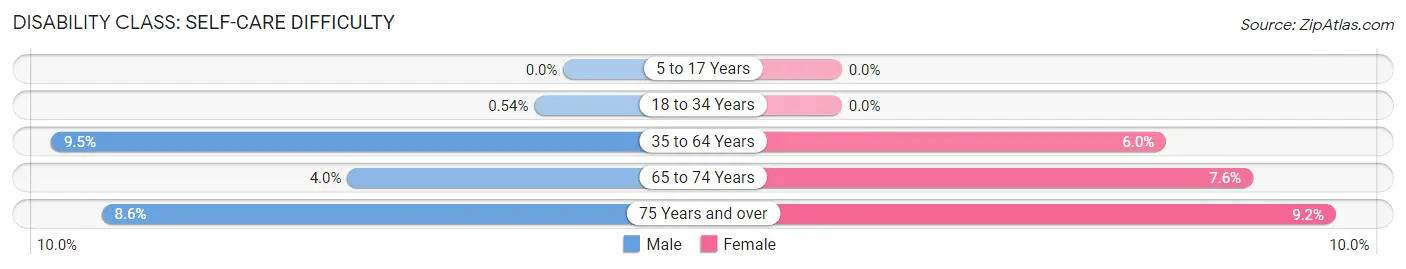
| Age Bracket | Male | Female |
| 5 to 17 Years | 0 (0.0%) | 0 (0.0%) |
| 18 to 34 Years | 6 (0.5%) | 0 (0.0%) |
| 35 to 64 Years | 130 (9.5%) | 97 (6.0%) |
| 65 to 74 Years | 15 (4.0%) | 48 (7.6%) |
| 75 Years and over | 15 (8.6%) | 40 (9.2%) |
Technology Access in Malvern
Computing Device Access in Malvern
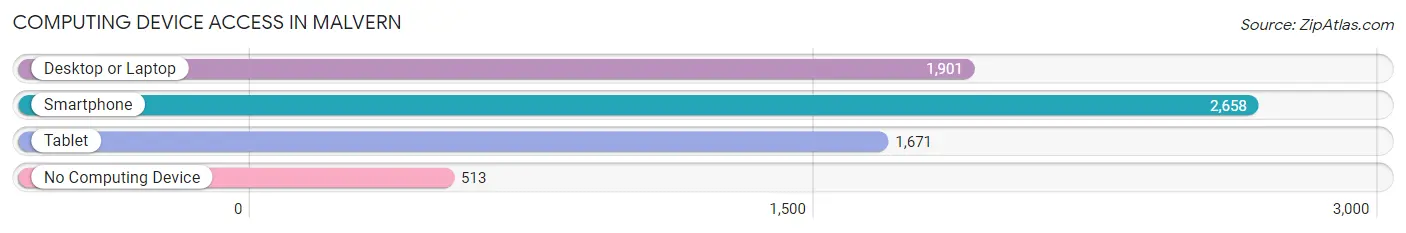
| Device Type | # Households | % Households |
| Desktop or Laptop | 1,901 | 55.6% |
| Smartphone | 2,658 | 77.7% |
| Tablet | 1,671 | 48.8% |
| No Computing Device | 513 | 15.0% |
| Total | 3,421 | 100.0% |
Internet Access in Malvern
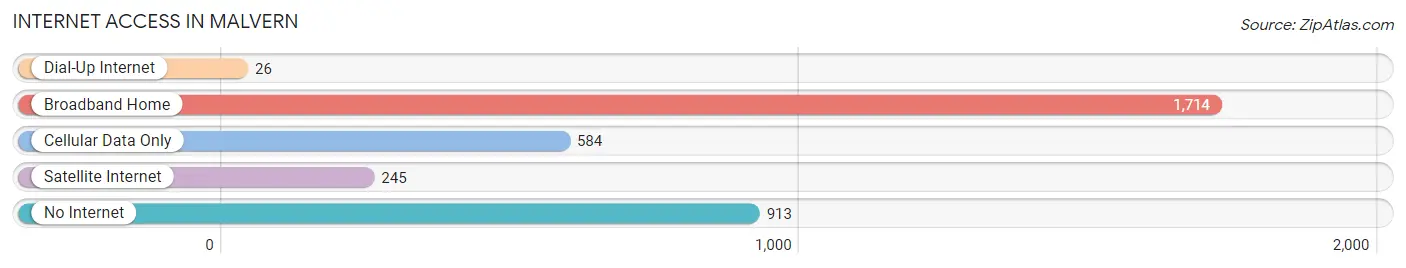
| Internet Type | # Households | % Households |
| Dial-Up Internet | 26 | 0.8% |
| Broadband Home | 1,714 | 50.1% |
| Cellular Data Only | 584 | 17.1% |
| Satellite Internet | 245 | 7.2% |
| No Internet | 913 | 26.7% |
| Total | 3,421 | 100.0% |
Malvern Summary
Malvern is a city located in Hot Spring County, Arkansas, United States. It is situated in the Ouachita Mountains, and is the county seat of Hot Spring County. The population was 10,318 at the 2010 census, making it the largest city in the county.
History
Malvern was founded in 1876 by the St. Louis, Iron Mountain and Southern Railway. The city was named after Malvern Hill, a Civil War battle site in Virginia. The city was incorporated in 1887.
In the late 19th century, Malvern was a major producer of bricks, and the city was known as the "Brick Capital of the World". The city was also a major producer of timber products, and was home to several sawmills.
Geography
Malvern is located at 34°23'25" North, 92°49'45" West (34.3903, -92.8292). According to the United States Census Bureau, the city has a total area of 11.2 square miles (29.0 km2), of which 11.1 square miles (28.7 km2) is land and 0.1 square miles (0.3 km2) is water.
Economy
Malvern's economy is largely based on manufacturing and services. The city is home to several manufacturing plants, including a paper mill, a brick plant, and a steel mill. The city is also home to several retail stores, restaurants, and other businesses.
Demographics
As of the census of 2010, there were 10,318 people, 4,093 households, and 2,619 families residing in the city. The population density was 930.2 people per square mile (358.7/km2). There were 4,521 housing units at an average density of 407.7 per square mile (157.3/km2). The racial makeup of the city was 79.2% White, 16.2% African American, 0.4% Native American, 0.7% Asian, 0.1% Pacific Islander, 1.3% from other races, and 2.1% from two or more races. Hispanic or Latino of any race were 3.2% of the population.
There were 4,093 households, out of which 28.7% had children under the age of 18 living with them, 44.2% were married couples living together, 15.7% had a female householder with no husband present, and 35.3% were non-families. 30.2% of all households were made up of individuals, and 13.2% had someone living alone who was 65 years of age or older. The average household size was 2.41 and the average family size was 2.98.
In the city, the population was spread out, with 24.2% under the age of 18, 8.7% from 18 to 24, 25.7% from 25 to 44, 24.2% from 45 to 64, and 17.2% who were 65 years of age or older. The median age was 38 years. For every 100 females, there were 88.3 males. For every 100 females age 18 and over, there were 84.2 males.
The median income for a household in the city was $30,945, and the median income for a family was $37,917. Males had a median income of $30,945 versus $21,813 for females. The per capita income for the city was $17,845. About 13.2% of families and 16.7% of the population were below the poverty line, including 24.2% of those under age 18 and 11.7% of those age 65 or over.
Common Questions
What is Per Capita Income in Malvern?
Per Capita income in Malvern is $17,387.
What is the Median Family Income in Malvern?
Median Family Income in Malvern is $50,672.
What is the Median Household income in Malvern?
Median Household Income in Malvern is $37,210.
What is Income or Wage Gap in Malvern?
Income or Wage Gap in Malvern is 31.2%.
Women in Malvern earn 68.8 cents for every dollar earned by a man.
What is Inequality or Gini Index in Malvern?
Inequality or Gini Index in Malvern is 0.43.
What is the Total Population of Malvern?
Total Population of Malvern is 10,859.
What is the Total Male Population of Malvern?
Total Male Population of Malvern is 6,170.
What is the Total Female Population of Malvern?
Total Female Population of Malvern is 4,689.
What is the Ratio of Males per 100 Females in Malvern?
There are 131.58 Males per 100 Females in Malvern.
What is the Ratio of Females per 100 Males in Malvern?
There are 76.00 Females per 100 Males in Malvern.
What is the Median Population Age in Malvern?
Median Population Age in Malvern is 39.4 Years.
What is the Average Family Size in Malvern
Average Family Size in Malvern is 3.2 People.
What is the Average Household Size in Malvern
Average Household Size in Malvern is 2.5 People.
How Large is the Labor Force in Malvern?
There are 3,975 People in the Labor Forcein in Malvern.
What is the Percentage of People in the Labor Force in Malvern?
44.0% of People are in the Labor Force in Malvern.
What is the Unemployment Rate in Malvern?
Unemployment Rate in Malvern is 7.4%.