Magazine, AR Map & Demographics
Magazine Map
Magazine Overview
$19,482
PER CAPITA INCOME
$47,167
AVG FAMILY INCOME
$45,735
AVG HOUSEHOLD INCOME
30.9%
WAGE / INCOME GAP [ % ]
69.1¢/ $1
WAGE / INCOME GAP [ $ ]
0.40
INEQUALITY / GINI INDEX
969
TOTAL POPULATION
436
MALE POPULATION
533
FEMALE POPULATION
81.80
MALES / 100 FEMALES
122.25
FEMALES / 100 MALES
32.6
MEDIAN AGE
4.2
AVG FAMILY SIZE
3.5
AVG HOUSEHOLD SIZE
411
LABOR FORCE [ PEOPLE ]
57.8%
PERCENT IN LABOR FORCE
5.4%
UNEMPLOYMENT RATE
Magazine Zip Codes
Magazine Area Codes
Income in Magazine
Income Overview in Magazine
Per Capita Income in Magazine is $19,482, while median incomes of families and households are $47,167 and $45,735 respectively.
| Characteristic | Number | Measure |
| Per Capita Income | 969 | $19,482 |
| Median Family Income | 190 | $47,167 |
| Mean Family Income | 190 | $69,000 |
| Median Household Income | 276 | $45,735 |
| Mean Household Income | 276 | $60,644 |
| Income Deficit | 190 | $0 |
| Wage / Income Gap (%) | 969 | 30.90% |
| Wage / Income Gap ($) | 969 | 69.10¢ per $1 |
| Gini / Inequality Index | 969 | 0.40 |
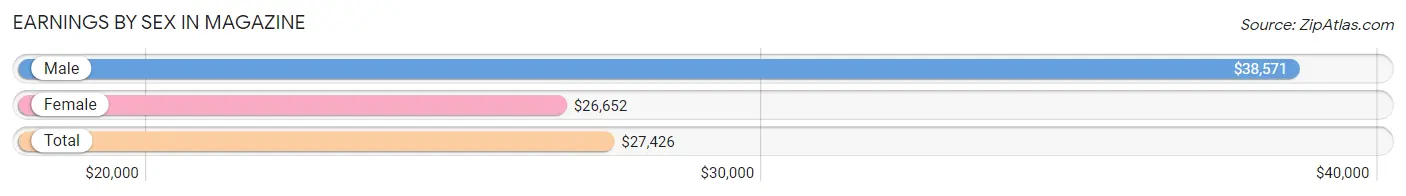
Earnings by Sex in Magazine
Average Earnings in Magazine are $27,426, $38,571 for men and $26,652 for women, a difference of 30.9%.
| Sex | Number | Average Earnings |
| Male | 176 (42.6%) | $38,571 |
| Female | 237 (57.4%) | $26,652 |
| Total | 413 (100.0%) | $27,426 |
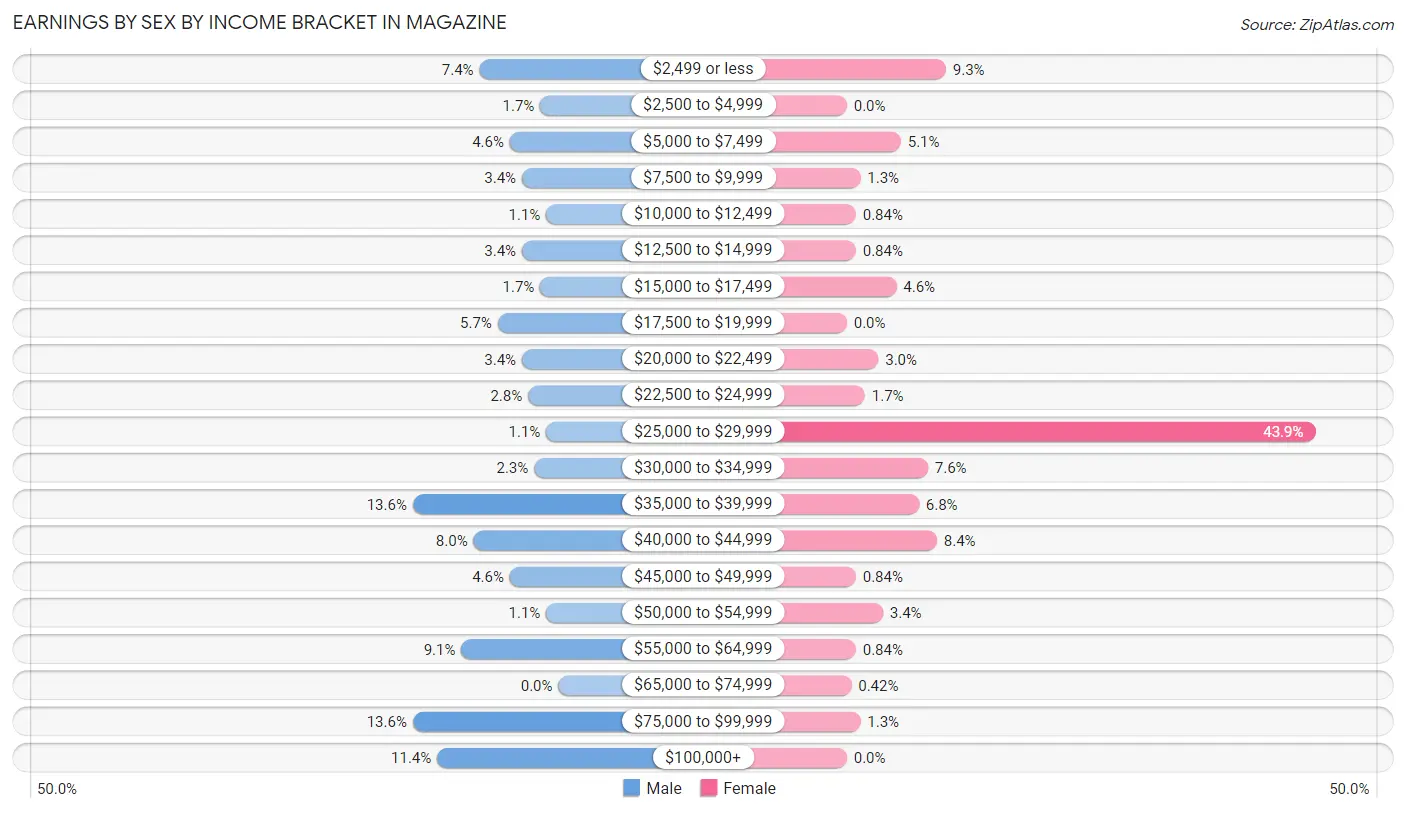
Earnings by Sex by Income Bracket in Magazine
The most common earnings brackets in Magazine are $35,000 to $39,999 for men (24 | 13.6%) and $25,000 to $29,999 for women (104 | 43.9%).
| Income | Male | Female |
| $2,499 or less | 13 (7.4%) | 22 (9.3%) |
| $2,500 to $4,999 | 3 (1.7%) | 0 (0.0%) |
| $5,000 to $7,499 | 8 (4.5%) | 12 (5.1%) |
| $7,500 to $9,999 | 6 (3.4%) | 3 (1.3%) |
| $10,000 to $12,499 | 2 (1.1%) | 2 (0.8%) |
| $12,500 to $14,999 | 6 (3.4%) | 2 (0.8%) |
| $15,000 to $17,499 | 3 (1.7%) | 11 (4.6%) |
| $17,500 to $19,999 | 10 (5.7%) | 0 (0.0%) |
| $20,000 to $22,499 | 6 (3.4%) | 7 (2.9%) |
| $22,500 to $24,999 | 5 (2.8%) | 4 (1.7%) |
| $25,000 to $29,999 | 2 (1.1%) | 104 (43.9%) |
| $30,000 to $34,999 | 4 (2.3%) | 18 (7.6%) |
| $35,000 to $39,999 | 24 (13.6%) | 16 (6.8%) |
| $40,000 to $44,999 | 14 (8.0%) | 20 (8.4%) |
| $45,000 to $49,999 | 8 (4.5%) | 2 (0.8%) |
| $50,000 to $54,999 | 2 (1.1%) | 8 (3.4%) |
| $55,000 to $64,999 | 16 (9.1%) | 2 (0.8%) |
| $65,000 to $74,999 | 0 (0.0%) | 1 (0.4%) |
| $75,000 to $99,999 | 24 (13.6%) | 3 (1.3%) |
| $100,000+ | 20 (11.4%) | 0 (0.0%) |
| Total | 176 (100.0%) | 237 (100.0%) |
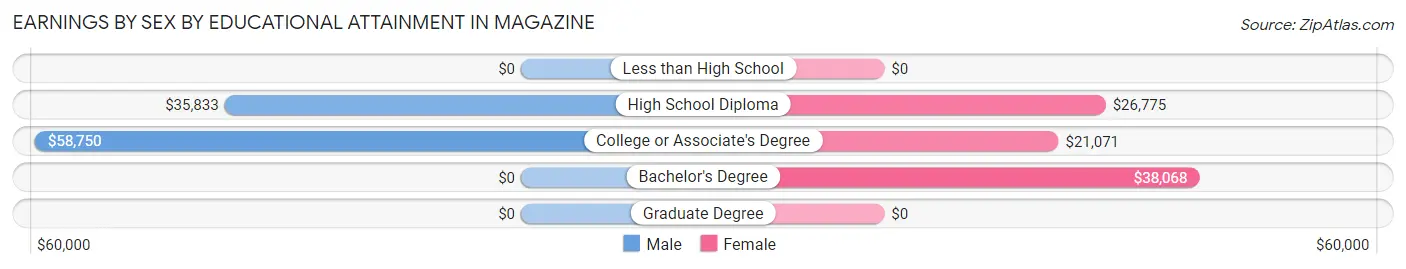
Earnings by Sex by Educational Attainment in Magazine
Average earnings in Magazine are $42,917 for men and $26,790 for women, a difference of 37.6%. Men with an educational attainment of college or associate's degree enjoy the highest average annual earnings of $58,750, while those with high school diploma education earn the least with $35,833. Women with an educational attainment of bachelor's degree earn the most with the average annual earnings of $38,068, while those with college or associate's degree education have the smallest earnings of $21,071.
| Educational Attainment | Male Income | Female Income |
| Less than High School | - | - |
| High School Diploma | $35,833 | $26,775 |
| College or Associate's Degree | $58,750 | $21,071 |
| Bachelor's Degree | - | - |
| Graduate Degree | - | - |
| Total | $42,917 | $26,790 |
Family Income in Magazine
Family Income Brackets in Magazine
According to the Magazine family income data, there are 52 families falling into the $35,000 to $49,999 income range, which is the most common income bracket and makes up 27.4% of all families. Conversely, the $200,000+ income bracket is the least frequent group with only 2 families (1.1%) belonging to this category.
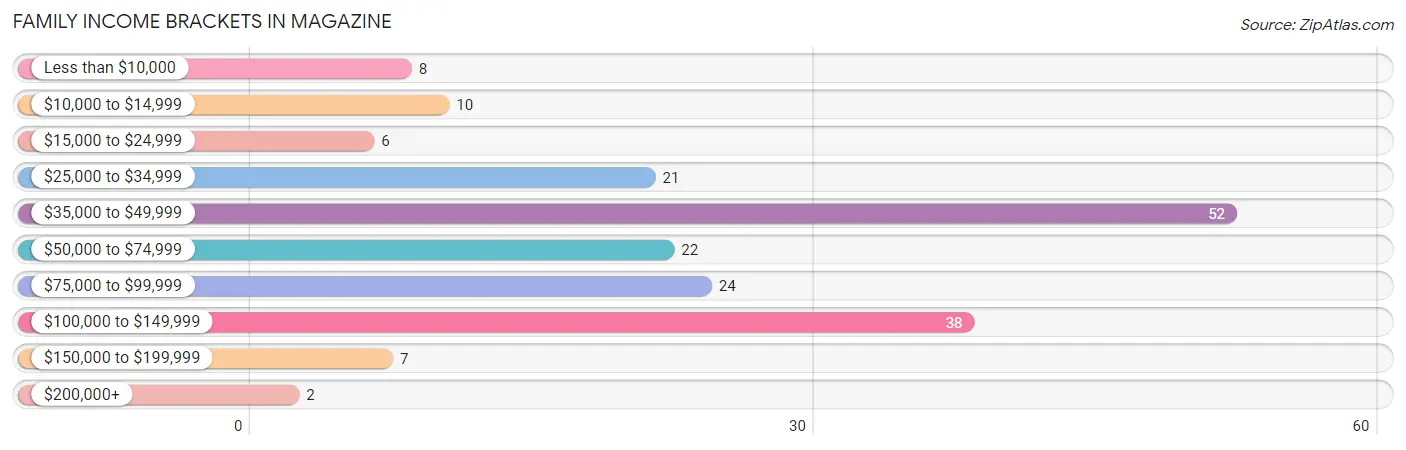
| Income Bracket | # Families | % Families |
| Less than $10,000 | 8 | 4.2% |
| $10,000 to $14,999 | 10 | 5.3% |
| $15,000 to $24,999 | 6 | 3.2% |
| $25,000 to $34,999 | 21 | 11.1% |
| $35,000 to $49,999 | 52 | 27.4% |
| $50,000 to $74,999 | 22 | 11.6% |
| $75,000 to $99,999 | 24 | 12.6% |
| $100,000 to $149,999 | 38 | 20.0% |
| $150,000 to $199,999 | 7 | 3.7% |
| $200,000+ | 2 | 1.1% |
Family Income by Famaliy Size in Magazine
5-person families (15 | 7.9%) account for the highest median family income in Magazine with $96,705 per family, while 5-person families (15 | 7.9%) have the highest median income of $19,341 per family member.
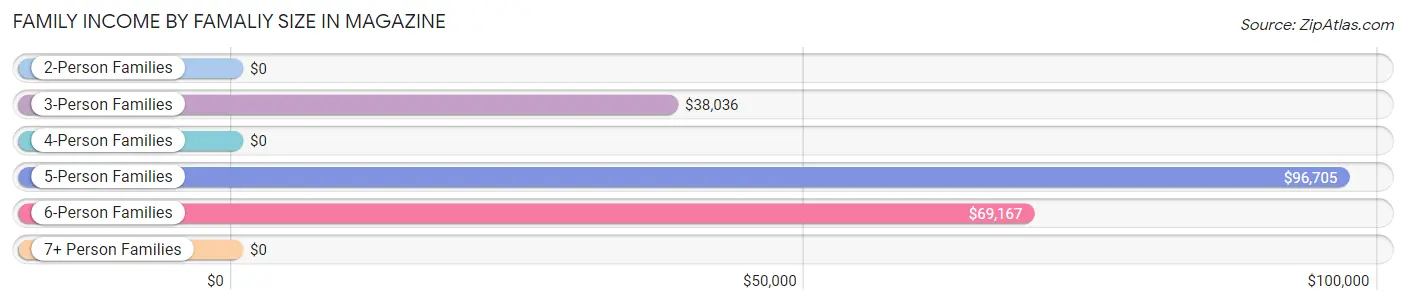
| Income Bracket | # Families | Median Income |
| 2-Person Families | 63 (33.2%) | $0 |
| 3-Person Families | 44 (23.2%) | $38,036 |
| 4-Person Families | 40 (21.0%) | $0 |
| 5-Person Families | 15 (7.9%) | $96,705 |
| 6-Person Families | 12 (6.3%) | $69,167 |
| 7+ Person Families | 16 (8.4%) | $0 |
| Total | 190 (100.0%) | $47,167 |
Family Income by Number of Earners in Magazine
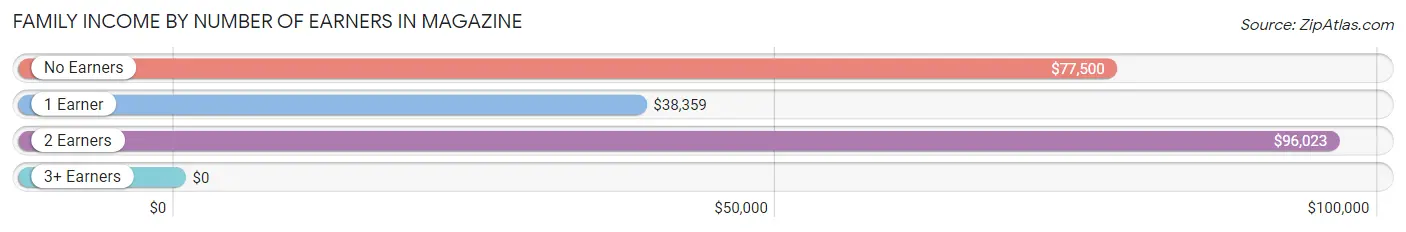
| Number of Earners | # Families | Median Income |
| No Earners | 22 (11.6%) | $77,500 |
| 1 Earner | 75 (39.5%) | $38,359 |
| 2 Earners | 85 (44.7%) | $96,023 |
| 3+ Earners | 8 (4.2%) | $0 |
| Total | 190 (100.0%) | $47,167 |
Household Income in Magazine
Household Income Brackets in Magazine
With 67 households falling in the category, the $35,000 to $49,999 income range is the most frequent in Magazine, accounting for 24.3% of all households. In contrast, only 2 households (0.7%) fall into the $200,000+ income bracket, making it the least populous group.
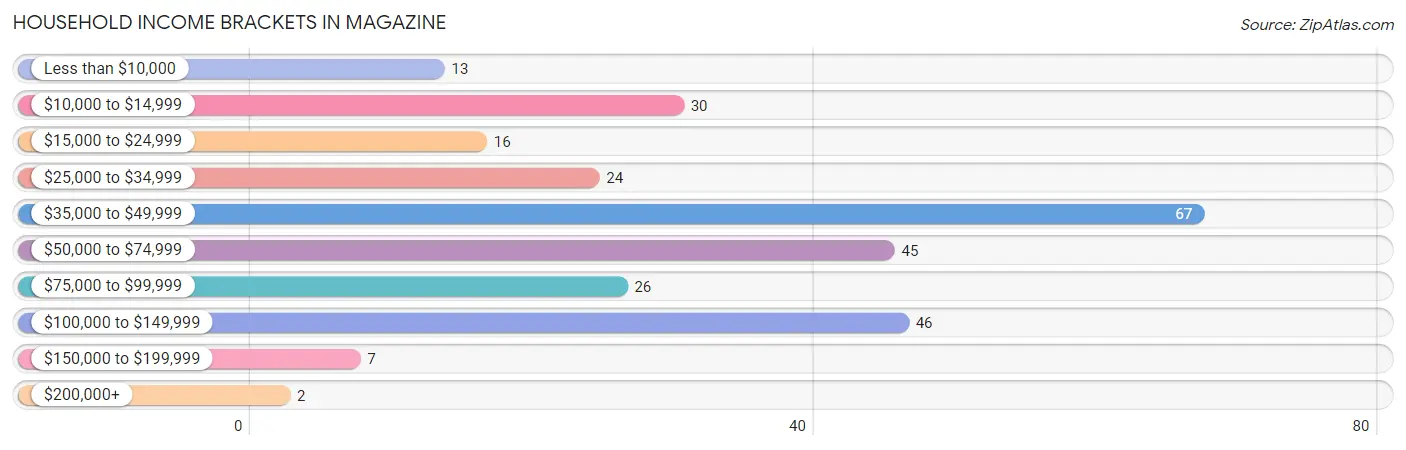
| Income Bracket | # Households | % Households |
| Less than $10,000 | 13 | 4.7% |
| $10,000 to $14,999 | 30 | 10.9% |
| $15,000 to $24,999 | 16 | 5.8% |
| $25,000 to $34,999 | 24 | 8.7% |
| $35,000 to $49,999 | 67 | 24.3% |
| $50,000 to $74,999 | 45 | 16.3% |
| $75,000 to $99,999 | 26 | 9.4% |
| $100,000 to $149,999 | 46 | 16.7% |
| $150,000 to $199,999 | 7 | 2.5% |
| $200,000+ | 2 | 0.7% |
Household Income by Householder Age in Magazine
The median household income in Magazine is $45,735, with the highest median household income of $57,625 found in the 45 to 64 years age bracket for the primary householder. A total of 97 households (35.1%) fall into this category. Meanwhile, the 15 to 24 years age bracket for the primary householder has the lowest median household income of $26,250, with 15 households (5.4%) in this group.
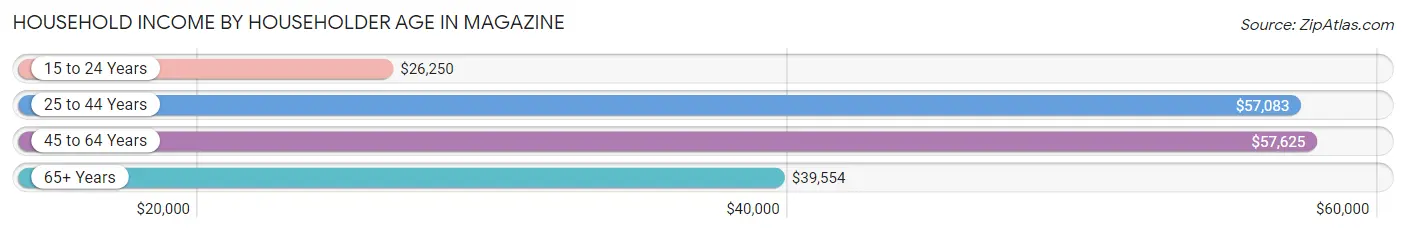
| Income Bracket | # Households | Median Income |
| 15 to 24 Years | 15 (5.4%) | $26,250 |
| 25 to 44 Years | 83 (30.1%) | $57,083 |
| 45 to 64 Years | 97 (35.1%) | $57,625 |
| 65+ Years | 81 (29.3%) | $39,554 |
| Total | 276 (100.0%) | $45,735 |
Poverty in Magazine
Income Below Poverty by Sex and Age in Magazine
With 18.8% poverty level for males and 21.4% for females among the residents of Magazine, 6 to 11 year old males and under 5 year old females are the most vulnerable to poverty, with 14 males (33.3%) and 10 females (55.6%) in their respective age groups living below the poverty level.
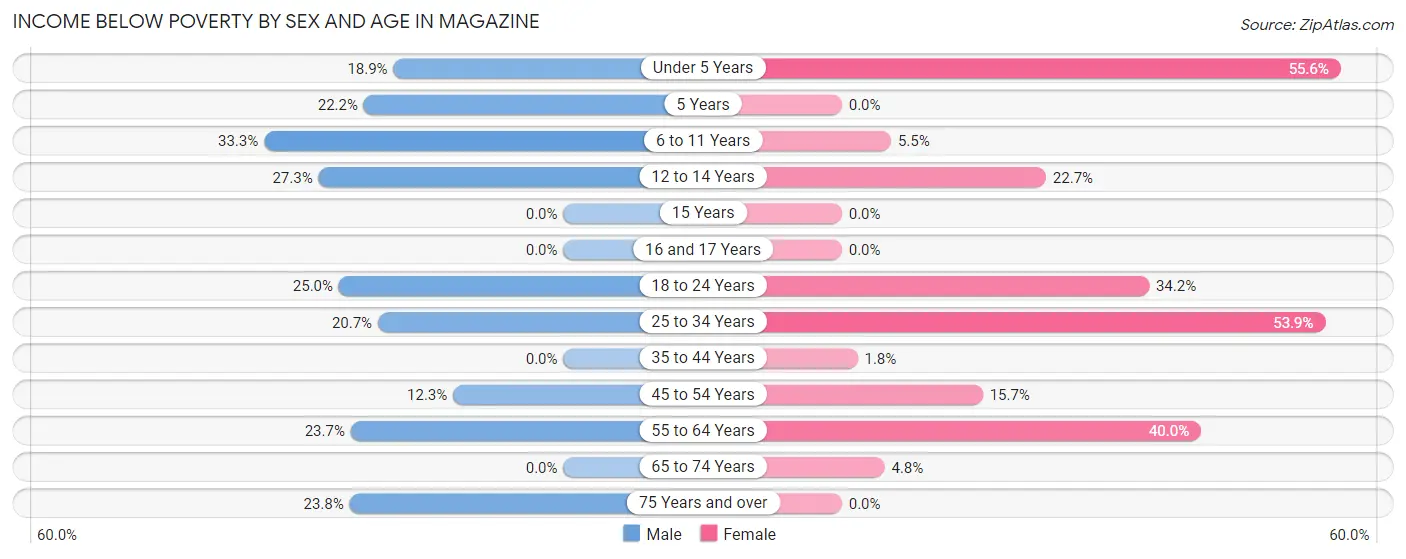
| Age Bracket | Male | Female |
| Under 5 Years | 7 (18.9%) | 10 (55.6%) |
| 5 Years | 6 (22.2%) | 0 (0.0%) |
| 6 to 11 Years | 14 (33.3%) | 4 (5.5%) |
| 12 to 14 Years | 6 (27.3%) | 5 (22.7%) |
| 15 Years | 0 (0.0%) | 0 (0.0%) |
| 16 and 17 Years | 0 (0.0%) | 0 (0.0%) |
| 18 to 24 Years | 9 (25.0%) | 13 (34.2%) |
| 25 to 34 Years | 19 (20.6%) | 49 (53.8%) |
| 35 to 44 Years | 0 (0.0%) | 2 (1.8%) |
| 45 to 54 Years | 7 (12.3%) | 8 (15.7%) |
| 55 to 64 Years | 9 (23.7%) | 22 (40.0%) |
| 65 to 74 Years | 0 (0.0%) | 1 (4.8%) |
| 75 Years and over | 5 (23.8%) | 0 (0.0%) |
| Total | 82 (18.8%) | 114 (21.4%) |
Income Above Poverty by Sex and Age in Magazine
According to the poverty statistics in Magazine, males aged 15 years and females aged 5 years are the age groups that are most secure financially, with 100.0% of males and 100.0% of females in these age groups living above the poverty line.
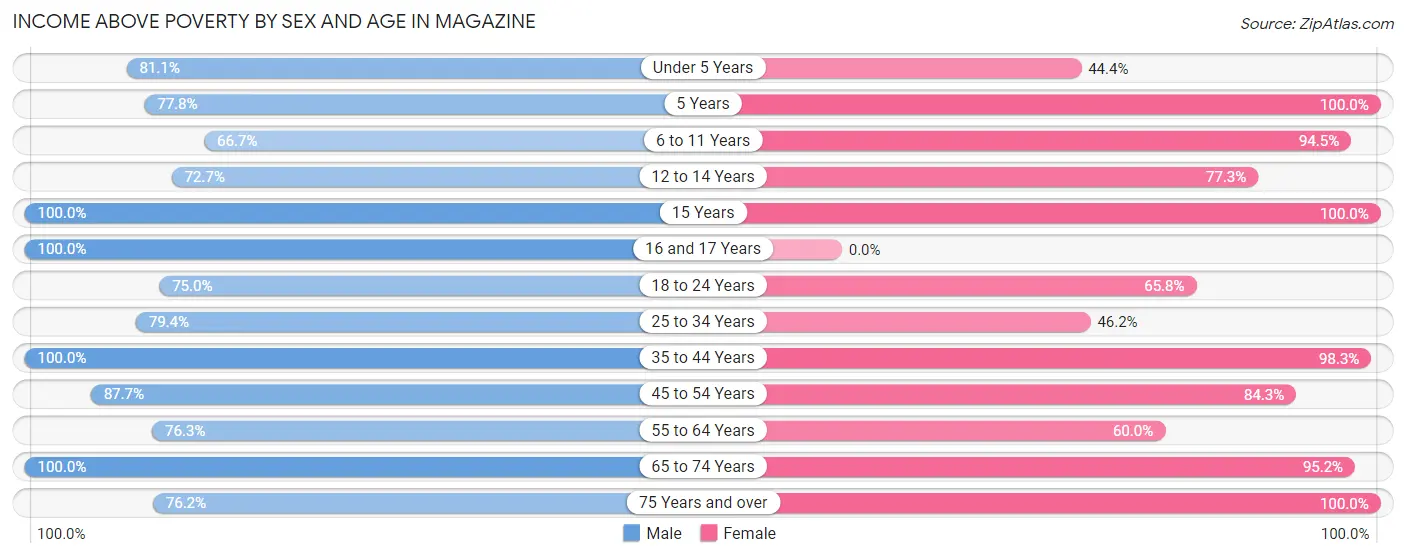
| Age Bracket | Male | Female |
| Under 5 Years | 30 (81.1%) | 8 (44.4%) |
| 5 Years | 21 (77.8%) | 10 (100.0%) |
| 6 to 11 Years | 28 (66.7%) | 69 (94.5%) |
| 12 to 14 Years | 16 (72.7%) | 17 (77.3%) |
| 15 Years | 2 (100.0%) | 5 (100.0%) |
| 16 and 17 Years | 9 (100.0%) | 0 (0.0%) |
| 18 to 24 Years | 27 (75.0%) | 25 (65.8%) |
| 25 to 34 Years | 73 (79.3%) | 42 (46.2%) |
| 35 to 44 Years | 35 (100.0%) | 112 (98.3%) |
| 45 to 54 Years | 50 (87.7%) | 43 (84.3%) |
| 55 to 64 Years | 29 (76.3%) | 33 (60.0%) |
| 65 to 74 Years | 18 (100.0%) | 20 (95.2%) |
| 75 Years and over | 16 (76.2%) | 35 (100.0%) |
| Total | 354 (81.2%) | 419 (78.6%) |
Income Below Poverty Among Married-Couple Families in Magazine
The poverty statistics for married-couple families in Magazine show that 13.1% or 16 of the total 122 families live below the poverty line. Families with 3 or 4 children have the highest poverty rate of 20.0%, comprising of 6 families. On the other hand, families with no children have the lowest poverty rate of 4.1%, which includes 2 families.
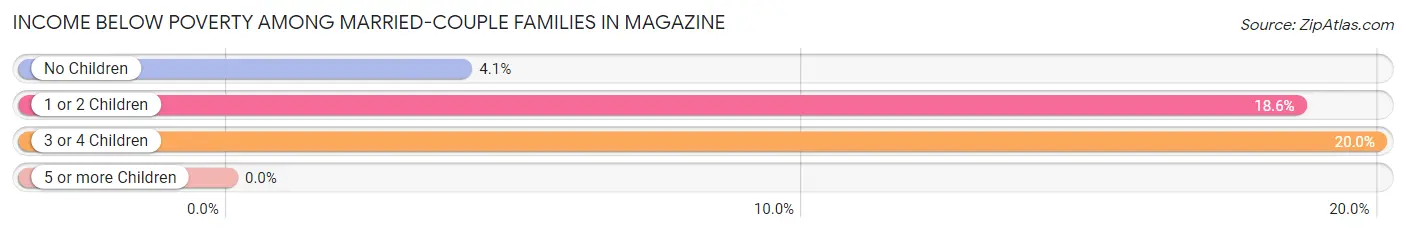
| Children | Above Poverty | Below Poverty |
| No Children | 47 (95.9%) | 2 (4.1%) |
| 1 or 2 Children | 35 (81.4%) | 8 (18.6%) |
| 3 or 4 Children | 24 (80.0%) | 6 (20.0%) |
| 5 or more Children | 0 (0.0%) | 0 (0.0%) |
| Total | 106 (86.9%) | 16 (13.1%) |
Income Below Poverty Among Single-Parent Households in Magazine
According to the poverty data in Magazine, 37.5% or 6 single-father households and 7.7% or 4 single-mother households are living below the poverty line. Among single-father households, those with 1 or 2 children have the highest poverty rate, with 6 households (100.0%) experiencing poverty. Likewise, among single-mother households, those with 3 or 4 children have the highest poverty rate, with 2 households (100.0%) falling below the poverty line.
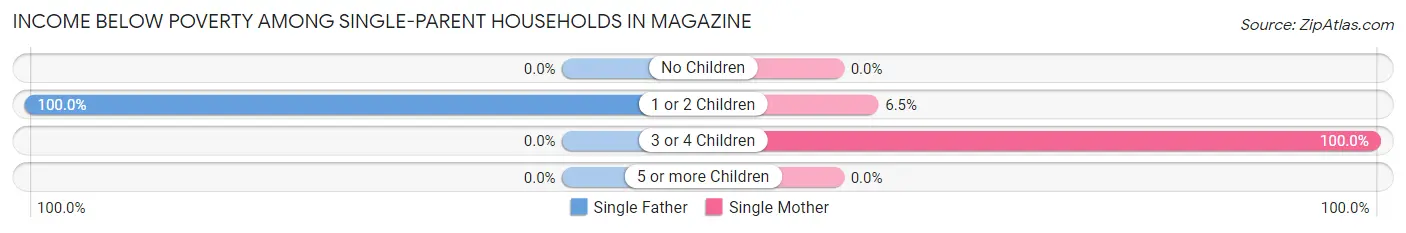
| Children | Single Father | Single Mother |
| No Children | 0 (0.0%) | 0 (0.0%) |
| 1 or 2 Children | 6 (100.0%) | 2 (6.5%) |
| 3 or 4 Children | 0 (0.0%) | 2 (100.0%) |
| 5 or more Children | 0 (0.0%) | 0 (0.0%) |
| Total | 6 (37.5%) | 4 (7.7%) |
Income Below Poverty Among Married-Couple vs Single-Parent Households in Magazine
The poverty data for Magazine shows that 16 of the married-couple family households (13.1%) and 10 of the single-parent households (14.7%) are living below the poverty level. Within the married-couple family households, those with 3 or 4 children have the highest poverty rate, with 6 households (20.0%) falling below the poverty line. Among the single-parent households, those with 3 or 4 children have the highest poverty rate, with 2 household (100.0%) living below poverty.
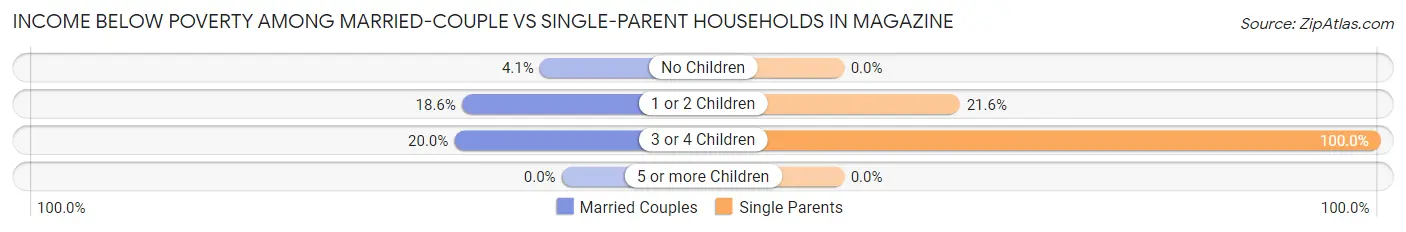
| Children | Married-Couple Families | Single-Parent Households |
| No Children | 2 (4.1%) | 0 (0.0%) |
| 1 or 2 Children | 8 (18.6%) | 8 (21.6%) |
| 3 or 4 Children | 6 (20.0%) | 2 (100.0%) |
| 5 or more Children | 0 (0.0%) | 0 (0.0%) |
| Total | 16 (13.1%) | 10 (14.7%) |
Race in Magazine
The most populous races in Magazine are White / Caucasian (935 | 96.5%), Two or more Races (32 | 3.3%), and Hispanic or Latino (8 | 0.8%).
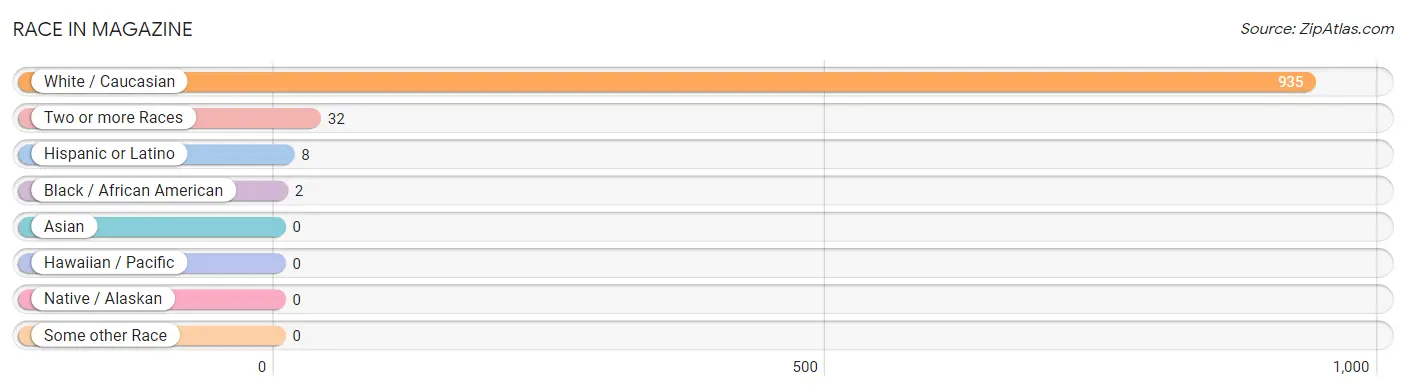
| Race | # Population | % Population |
| Asian | 0 | 0.0% |
| Black / African American | 2 | 0.2% |
| Hawaiian / Pacific | 0 | 0.0% |
| Hispanic or Latino | 8 | 0.8% |
| Native / Alaskan | 0 | 0.0% |
| White / Caucasian | 935 | 96.5% |
| Two or more Races | 32 | 3.3% |
| Some other Race | 0 | 0.0% |
| Total | 969 | 100.0% |
Ancestry in Magazine
The most populous ancestries reported in Magazine are Irish (142 | 14.6%), German (69 | 7.1%), American (40 | 4.1%), Cherokee (29 | 3.0%), and English (20 | 2.1%), together accounting for 30.9% of all Magazine residents.
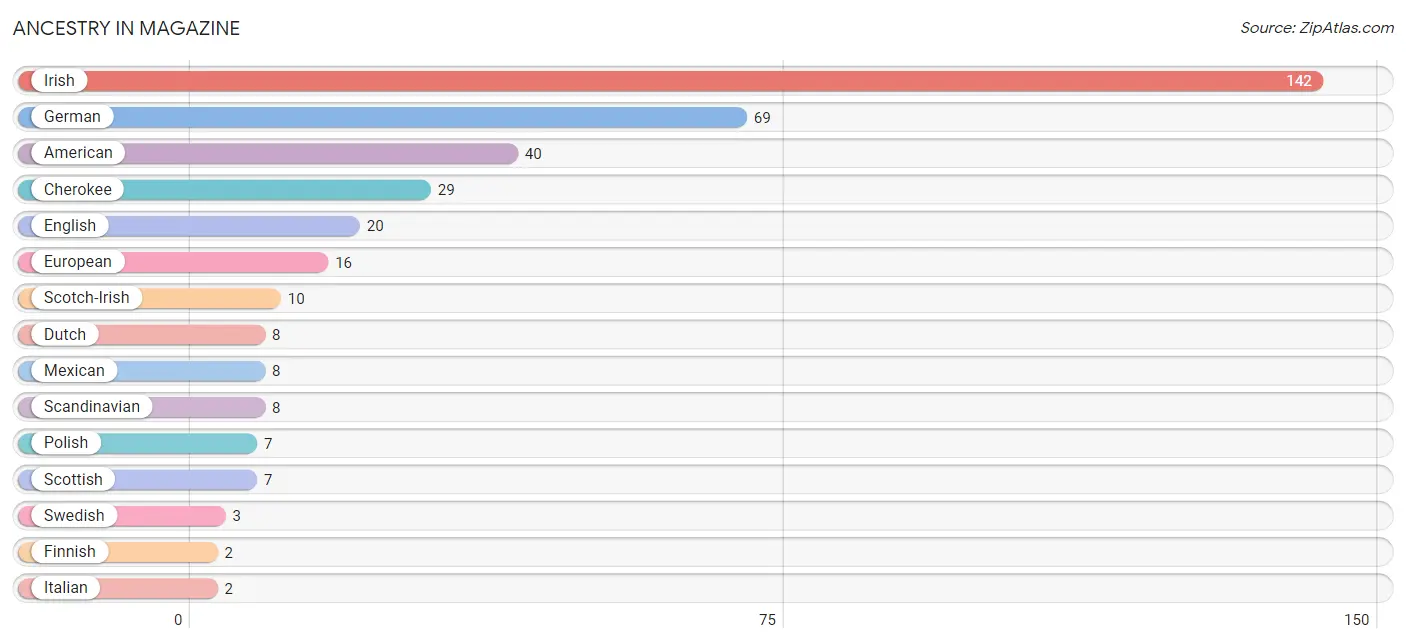
| Ancestry | # Population | % Population |
| American | 40 | 4.1% |
| Cherokee | 29 | 3.0% |
| Dutch | 8 | 0.8% |
| English | 20 | 2.1% |
| European | 16 | 1.7% |
| Finnish | 2 | 0.2% |
| German | 69 | 7.1% |
| Irish | 142 | 14.6% |
| Italian | 2 | 0.2% |
| Mexican | 8 | 0.8% |
| Norwegian | 2 | 0.2% |
| Polish | 7 | 0.7% |
| Scandinavian | 8 | 0.8% |
| Scotch-Irish | 10 | 1.0% |
| Scottish | 7 | 0.7% |
| Swedish | 3 | 0.3% | View All 16 Rows |
Immigrants in Magazine

| Immigration Origin | # Population | % Population | View All 0 Rows |
Sex and Age in Magazine
Sex and Age in Magazine
The most populous age groups in Magazine are 5 to 9 Years (49 | 11.2%) for men and 35 to 39 Years (93 | 17.4%) for women.
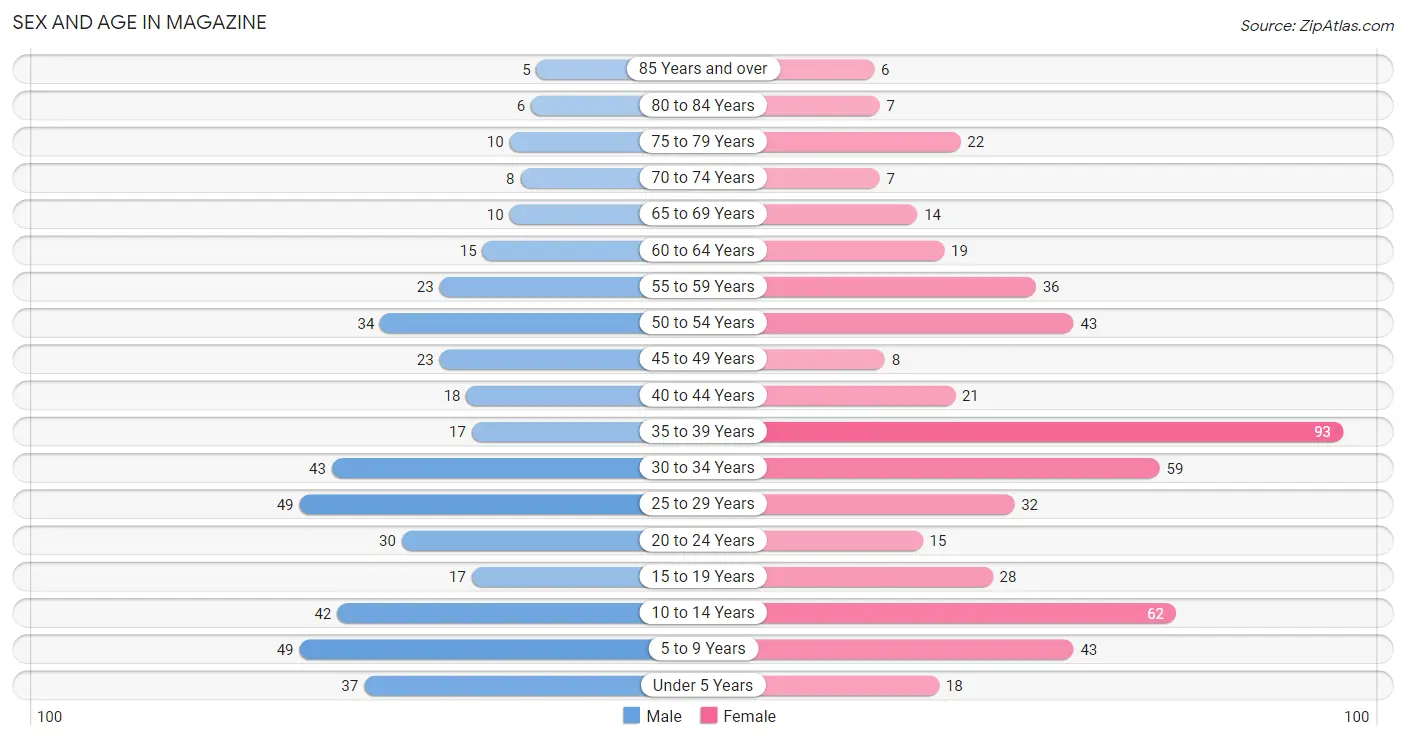
| Age Bracket | Male | Female |
| Under 5 Years | 37 (8.5%) | 18 (3.4%) |
| 5 to 9 Years | 49 (11.2%) | 43 (8.1%) |
| 10 to 14 Years | 42 (9.6%) | 62 (11.6%) |
| 15 to 19 Years | 17 (3.9%) | 28 (5.2%) |
| 20 to 24 Years | 30 (6.9%) | 15 (2.8%) |
| 25 to 29 Years | 49 (11.2%) | 32 (6.0%) |
| 30 to 34 Years | 43 (9.9%) | 59 (11.1%) |
| 35 to 39 Years | 17 (3.9%) | 93 (17.4%) |
| 40 to 44 Years | 18 (4.1%) | 21 (3.9%) |
| 45 to 49 Years | 23 (5.3%) | 8 (1.5%) |
| 50 to 54 Years | 34 (7.8%) | 43 (8.1%) |
| 55 to 59 Years | 23 (5.3%) | 36 (6.8%) |
| 60 to 64 Years | 15 (3.4%) | 19 (3.6%) |
| 65 to 69 Years | 10 (2.3%) | 14 (2.6%) |
| 70 to 74 Years | 8 (1.8%) | 7 (1.3%) |
| 75 to 79 Years | 10 (2.3%) | 22 (4.1%) |
| 80 to 84 Years | 6 (1.4%) | 7 (1.3%) |
| 85 Years and over | 5 (1.1%) | 6 (1.1%) |
| Total | 436 (100.0%) | 533 (100.0%) |
Families and Households in Magazine
Median Family Size in Magazine
The median family size in Magazine is 4.22 persons per family, with single female/mother families (52 | 27.4%) accounting for the largest median family size of 5.29 persons per family. On the other hand, single male/father families (16 | 8.4%) represent the smallest median family size with 2.94 persons per family.
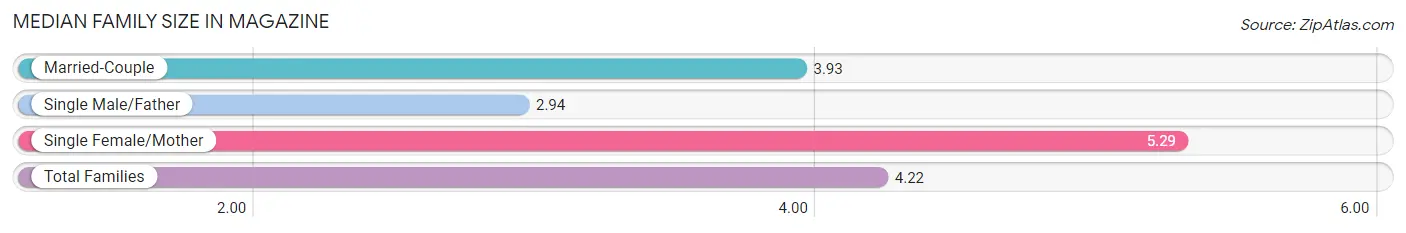
| Family Type | # Families | Family Size |
| Married-Couple | 122 (64.2%) | 3.93 |
| Single Male/Father | 16 (8.4%) | 2.94 |
| Single Female/Mother | 52 (27.4%) | 5.29 |
| Total Families | 190 (100.0%) | 4.22 |
Median Household Size in Magazine
The median household size in Magazine is 3.51 persons per household, with single female/mother households (52 | 18.8%) accounting for the largest median household size of 5.48 persons per household. non-family households (86 | 31.2%) represent the smallest median household size with 1.35 persons per household.
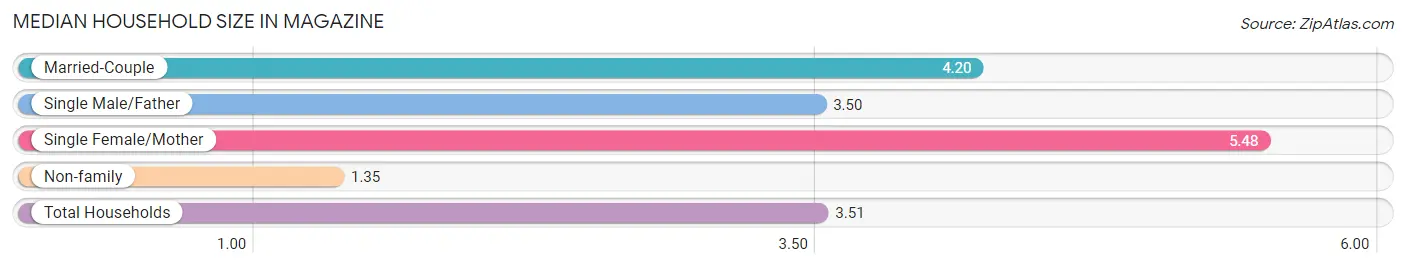
| Household Type | # Households | Household Size |
| Married-Couple | 122 (44.2%) | 4.20 |
| Single Male/Father | 16 (5.8%) | 3.50 |
| Single Female/Mother | 52 (18.8%) | 5.48 |
| Non-family | 86 (31.2%) | 1.35 |
| Total Households | 276 (100.0%) | 3.51 |
Household Size by Marriage Status in Magazine
Out of a total of 276 households in Magazine, 190 (68.8%) are family households, while 86 (31.2%) are nonfamily households. The most numerous type of family households are 2-person households, comprising 63, and the most common type of nonfamily households are 1-person households, comprising 69.
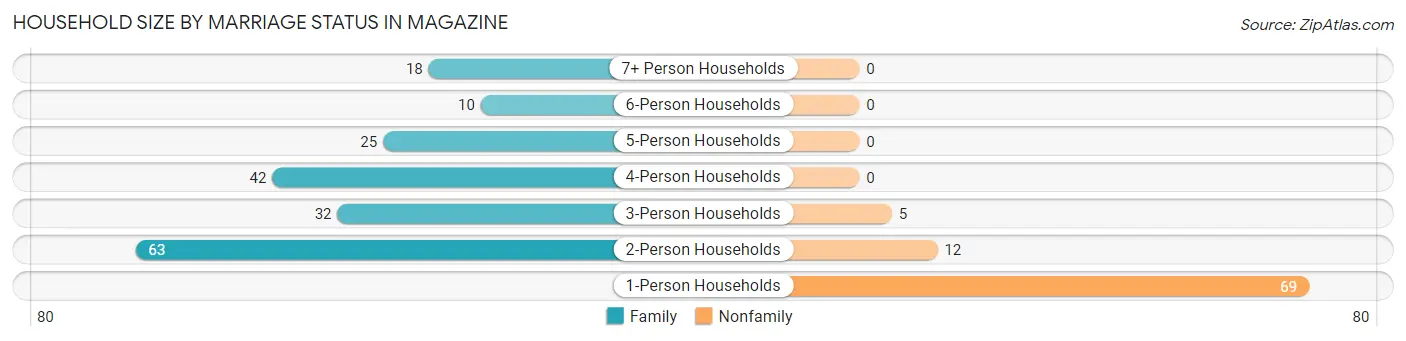
| Household Size | Family Households | Nonfamily Households |
| 1-Person Households | - | 69 (25.0%) |
| 2-Person Households | 63 (22.8%) | 12 (4.3%) |
| 3-Person Households | 32 (11.6%) | 5 (1.8%) |
| 4-Person Households | 42 (15.2%) | 0 (0.0%) |
| 5-Person Households | 25 (9.1%) | 0 (0.0%) |
| 6-Person Households | 10 (3.6%) | 0 (0.0%) |
| 7+ Person Households | 18 (6.5%) | 0 (0.0%) |
| Total | 190 (68.8%) | 86 (31.2%) |
Female Fertility in Magazine
Fertility by Age in Magazine
Average fertility rate in Magazine is 19.0 births per 1,000 women. Women in the age bracket of 20 to 34 years have the highest fertility rate with 47.0 births per 1,000 women. Women in the age bracket of 20 to 34 years acount for 100.0% of all women with births.
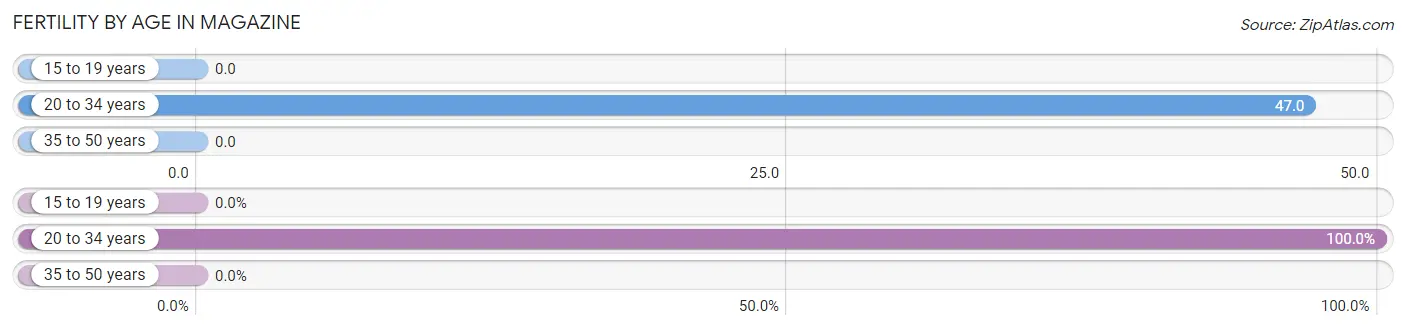
| Age Bracket | Women with Births | Births / 1,000 Women |
| 15 to 19 years | 0 (0.0%) | 0.0 |
| 20 to 34 years | 5 (100.0%) | 47.0 |
| 35 to 50 years | 0 (0.0%) | 0.0 |
| Total | 5 (100.0%) | 19.0 |
Fertility by Age by Marriage Status in Magazine
60.0% of women with births (5) in Magazine are married. The highest percentage of unmarried women with births falls into 20 to 34 years age bracket with 40.0% of them unmarried at the time of birth, while the lowest percentage of unmarried women with births belong to 20 to 34 years age bracket with 40.0% of them unmarried.
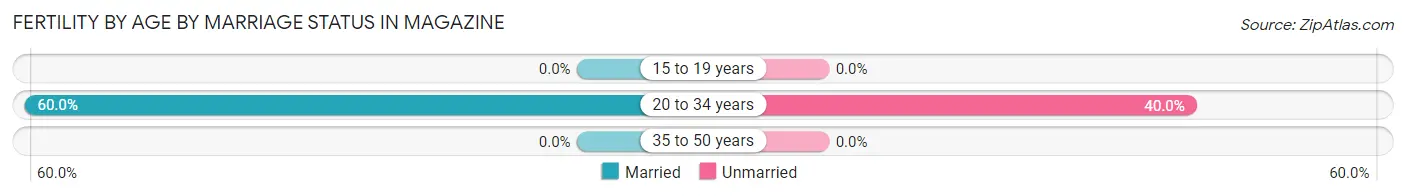
| Age Bracket | Married | Unmarried |
| 15 to 19 years | 0 (0.0%) | 0 (0.0%) |
| 20 to 34 years | 3 (60.0%) | 2 (40.0%) |
| 35 to 50 years | 0 (0.0%) | 0 (0.0%) |
| Total | 3 (60.0%) | 2 (40.0%) |
Fertility by Education in Magazine
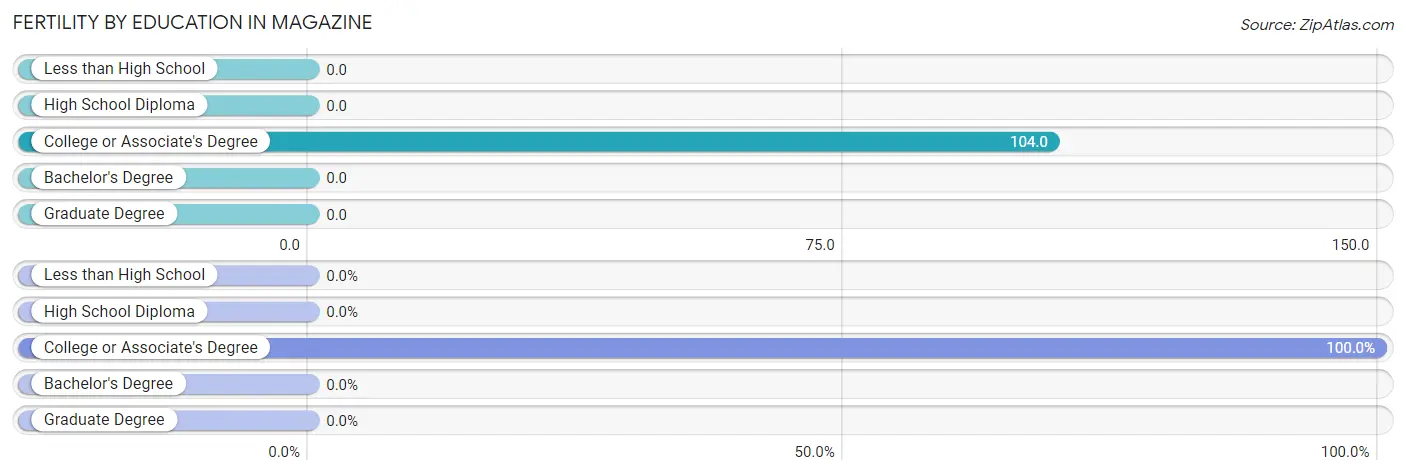
| Educational Attainment | Women with Births | Births / 1,000 Women |
| Less than High School | 0 (0.0%) | 0.0 |
| High School Diploma | 0 (0.0%) | 0.0 |
| College or Associate's Degree | 5 (100.0%) | 104.0 |
| Bachelor's Degree | 0 (0.0%) | 0.0 |
| Graduate Degree | 0 (0.0%) | 0.0 |
| Total | 5 (100.0%) | 19.0 |
Fertility by Education by Marriage Status in Magazine
40.0% of women with births in Magazine are unmarried. Women with the educational attainment of college or associate's degree are most likely to be married with 60.0% of them married at childbirth, while women with the educational attainment of college or associate's degree are least likely to be married with 40.0% of them unmarried at childbirth.
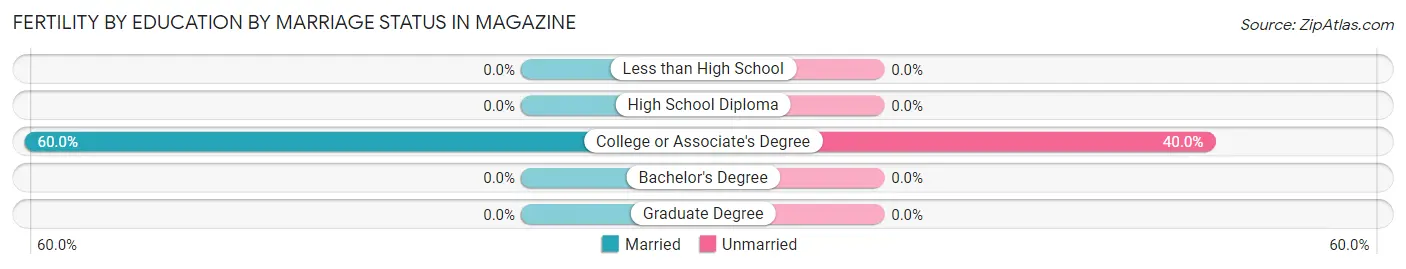
| Educational Attainment | Married | Unmarried |
| Less than High School | 0 (0.0%) | 0 (0.0%) |
| High School Diploma | 0 (0.0%) | 0 (0.0%) |
| College or Associate's Degree | 3 (60.0%) | 2 (40.0%) |
| Bachelor's Degree | 0 (0.0%) | 0 (0.0%) |
| Graduate Degree | 0 (0.0%) | 0 (0.0%) |
| Total | 3 (60.0%) | 2 (40.0%) |
Employment Characteristics in Magazine
Employment by Class of Employer in Magazine
Among the 387 employed individuals in Magazine, private company employees (284 | 73.4%), local government employees (71 | 18.3%), and state government employees (18 | 4.6%) make up the most common classes of employment.
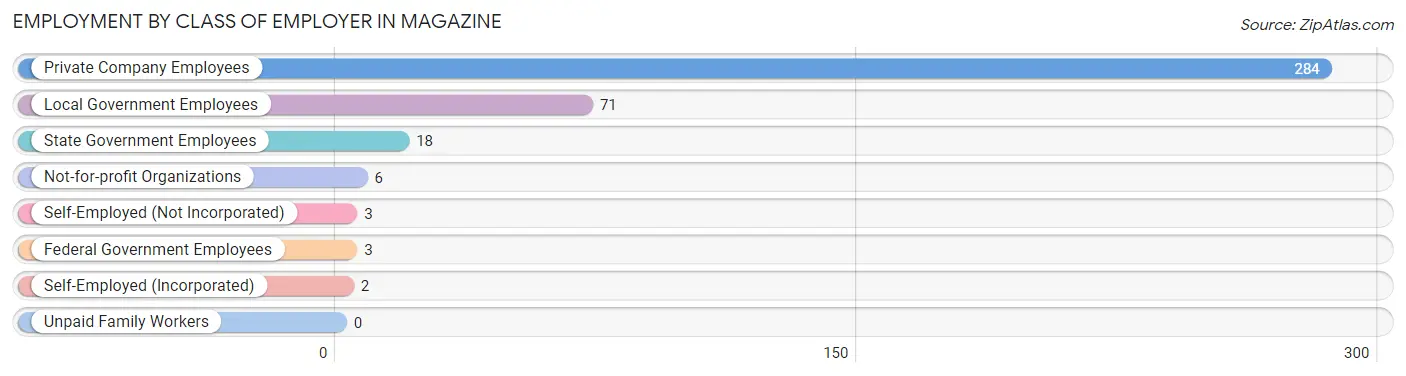
| Employer Class | # Employees | % Employees |
| Private Company Employees | 284 | 73.4% |
| Self-Employed (Incorporated) | 2 | 0.5% |
| Self-Employed (Not Incorporated) | 3 | 0.8% |
| Not-for-profit Organizations | 6 | 1.5% |
| Local Government Employees | 71 | 18.3% |
| State Government Employees | 18 | 4.6% |
| Federal Government Employees | 3 | 0.8% |
| Unpaid Family Workers | 0 | 0.0% |
| Total | 387 | 100.0% |
Employment Status by Age in Magazine
According to the labor force statistics for Magazine, out of the total population over 16 years of age (711), 57.8% or 411 individuals are in the labor force, with 5.4% or 22 of them unemployed. The age group with the highest labor force participation rate is 35 to 44 years, with 87.9% or 131 individuals in the labor force. Within the labor force, the 20 to 24 years age range has the highest percentage of unemployed individuals, with 24.3% or 9 of them being unemployed.
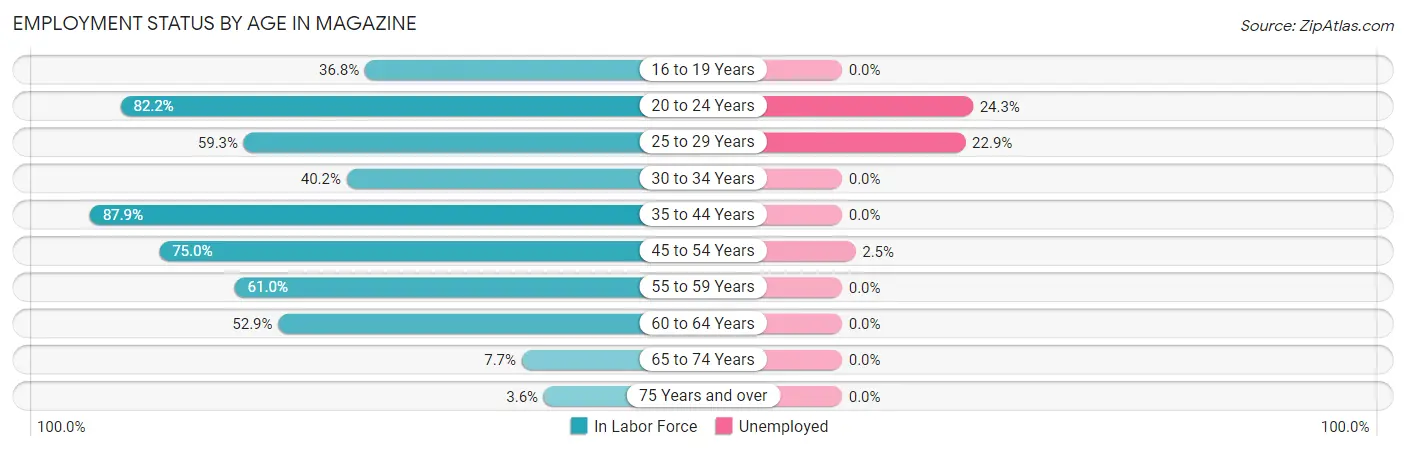
| Age Bracket | In Labor Force | Unemployed |
| 16 to 19 Years | 14 (36.8%) | 0 (0.0%) |
| 20 to 24 Years | 37 (82.2%) | 9 (24.3%) |
| 25 to 29 Years | 48 (59.3%) | 11 (22.9%) |
| 30 to 34 Years | 41 (40.2%) | 0 (0.0%) |
| 35 to 44 Years | 131 (87.9%) | 0 (0.0%) |
| 45 to 54 Years | 81 (75.0%) | 2 (2.5%) |
| 55 to 59 Years | 36 (61.0%) | 0 (0.0%) |
| 60 to 64 Years | 18 (52.9%) | 0 (0.0%) |
| 65 to 74 Years | 3 (7.7%) | 0 (0.0%) |
| 75 Years and over | 2 (3.6%) | 0 (0.0%) |
| Total | 411 (57.8%) | 22 (5.4%) |
Employment Status by Educational Attainment in Magazine
According to labor force statistics for Magazine, 66.6% of individuals (355) out of the total population between 25 and 64 years of age (533) are in the labor force, with 3.7% or 13 of them being unemployed. The group with the highest labor force participation rate are those with the educational attainment of bachelor's degree or higher, with 92.9% or 26 individuals in the labor force. Within the labor force, individuals with college / associate degree education have the highest percentage of unemployment, with 4.3% or 5 of them being unemployed.
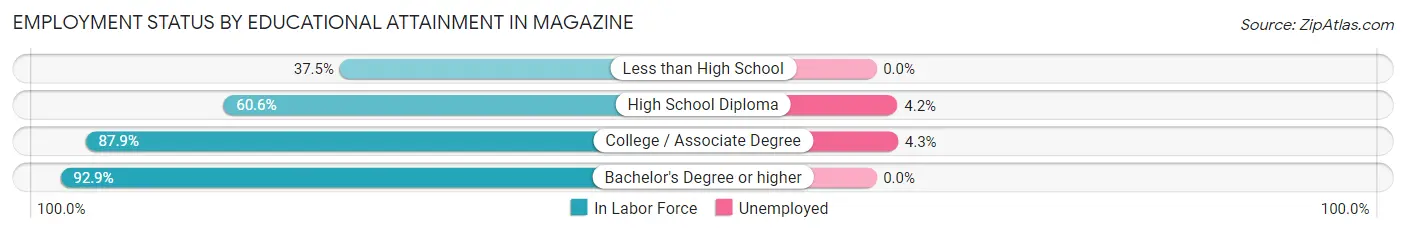
| Educational Attainment | In Labor Force | Unemployed |
| Less than High School | 21 (37.5%) | 0 (0.0%) |
| High School Diploma | 192 (60.6%) | 13 (4.2%) |
| College / Associate Degree | 116 (87.9%) | 6 (4.3%) |
| Bachelor's Degree or higher | 26 (92.9%) | 0 (0.0%) |
| Total | 355 (66.6%) | 20 (3.7%) |
Employment Occupations by Sex in Magazine
Management, Business, Science and Arts Occupations
The most common Management, Business, Science and Arts occupations in Magazine are Community & Social Service (38 | 9.8%), Management (33 | 8.5%), Education Instruction & Library (33 | 8.5%), Health Diagnosing & Treating (16 | 4.1%), and Health Technologists (10 | 2.6%).
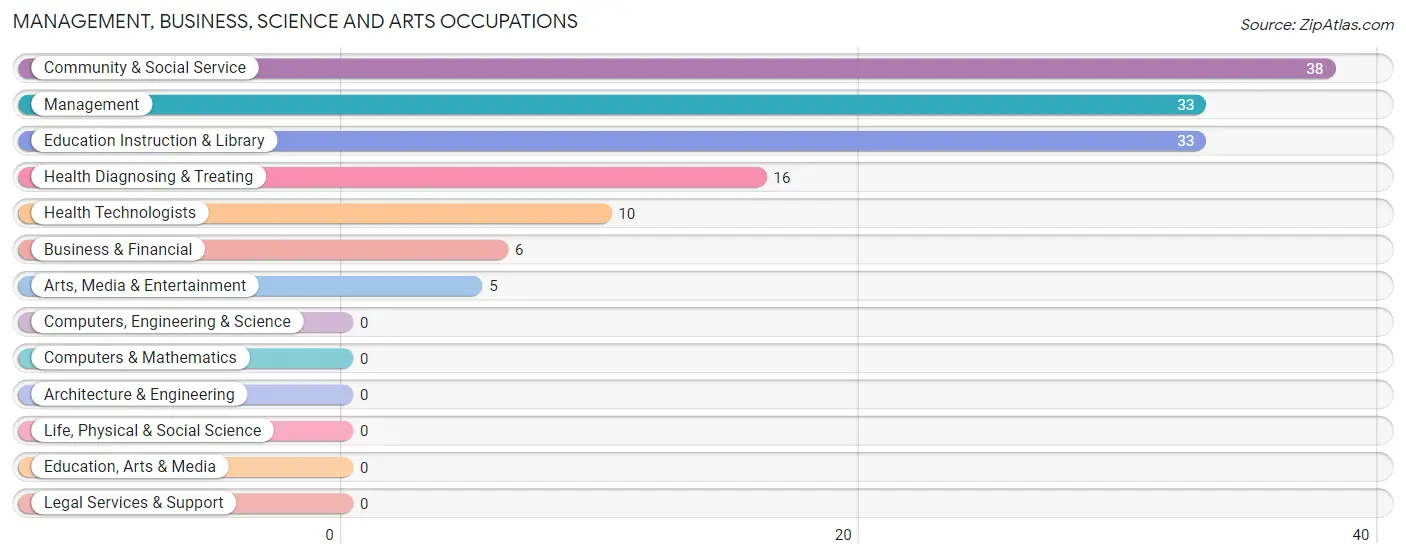
Management, Business, Science and Arts Occupations by Sex
Within the Management, Business, Science and Arts occupations in Magazine, the most male-oriented occupations are Business & Financial (100.0%), Health Technologists (80.0%), and Arts, Media & Entertainment (60.0%), while the most female-oriented occupations are Education Instruction & Library (100.0%), Community & Social Service (92.1%), and Management (66.7%).
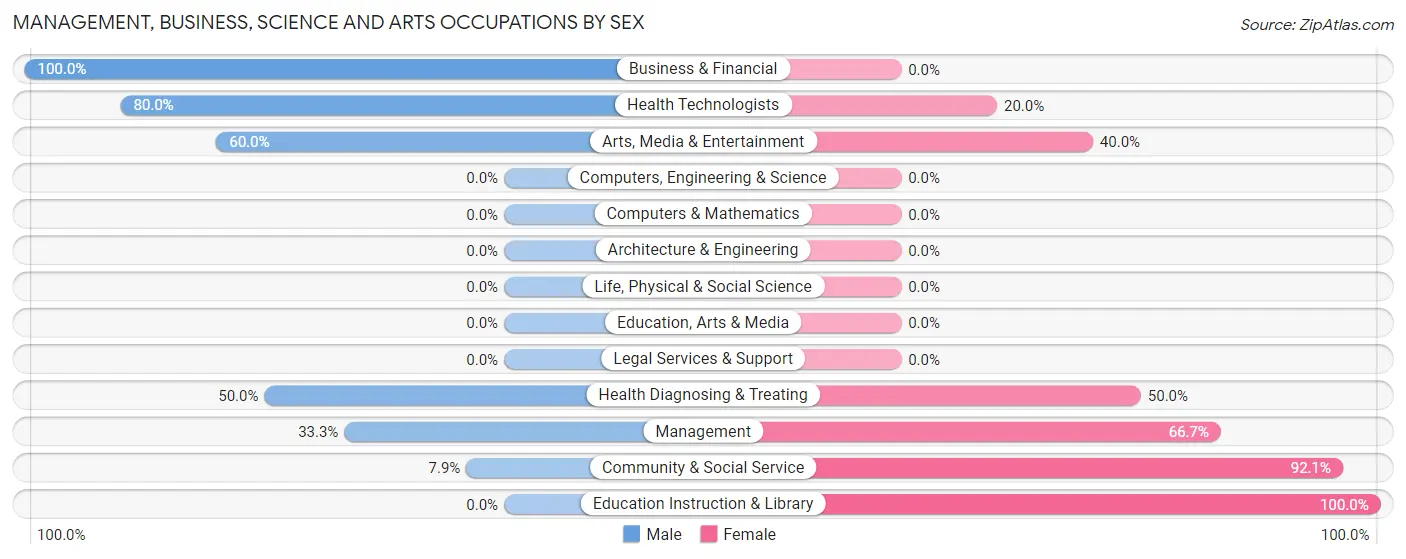
| Occupation | Male | Female |
| Management | 11 (33.3%) | 22 (66.7%) |
| Business & Financial | 6 (100.0%) | 0 (0.0%) |
| Computers, Engineering & Science | 0 (0.0%) | 0 (0.0%) |
| Computers & Mathematics | 0 (0.0%) | 0 (0.0%) |
| Architecture & Engineering | 0 (0.0%) | 0 (0.0%) |
| Life, Physical & Social Science | 0 (0.0%) | 0 (0.0%) |
| Community & Social Service | 3 (7.9%) | 35 (92.1%) |
| Education, Arts & Media | 0 (0.0%) | 0 (0.0%) |
| Legal Services & Support | 0 (0.0%) | 0 (0.0%) |
| Education Instruction & Library | 0 (0.0%) | 33 (100.0%) |
| Arts, Media & Entertainment | 3 (60.0%) | 2 (40.0%) |
| Health Diagnosing & Treating | 8 (50.0%) | 8 (50.0%) |
| Health Technologists | 8 (80.0%) | 2 (20.0%) |
| Total (Category) | 28 (30.1%) | 65 (69.9%) |
| Total (Overall) | 165 (42.4%) | 224 (57.6%) |
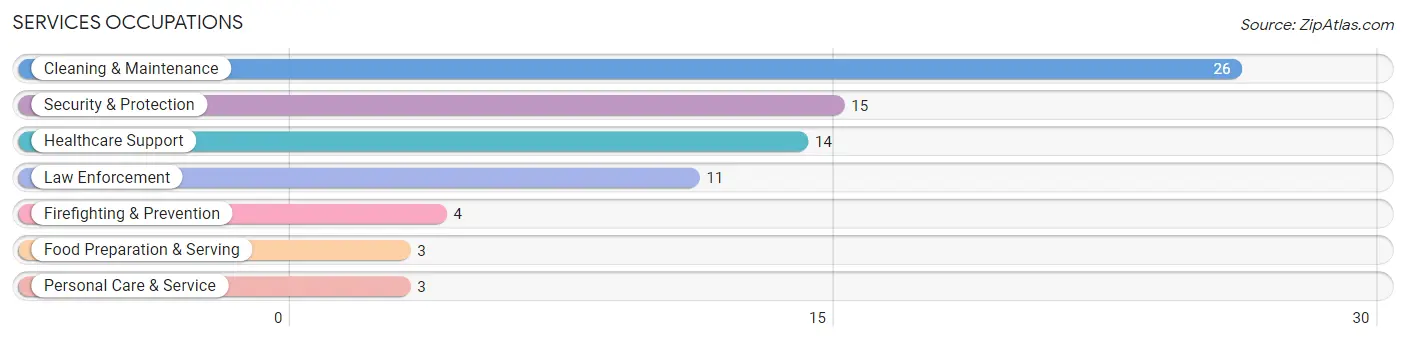
Services Occupations
The most common Services occupations in Magazine are Cleaning & Maintenance (26 | 6.7%), Security & Protection (15 | 3.9%), Healthcare Support (14 | 3.6%), Law Enforcement (11 | 2.8%), and Firefighting & Prevention (4 | 1.0%).
Services Occupations by Sex
Within the Services occupations in Magazine, the most male-oriented occupations are Law Enforcement (100.0%), Food Preparation & Serving (100.0%), and Security & Protection (86.7%), while the most female-oriented occupations are Healthcare Support (100.0%), Personal Care & Service (100.0%), and Cleaning & Maintenance (57.7%).
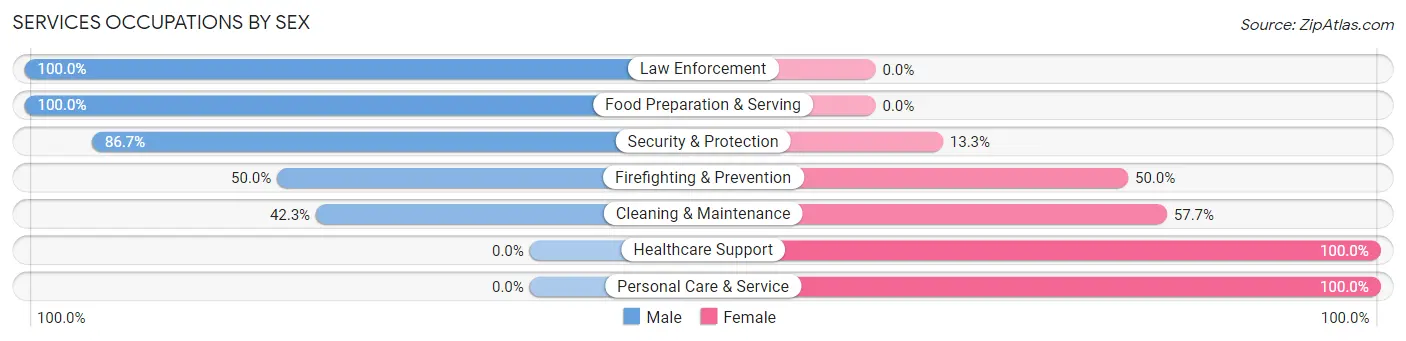
| Occupation | Male | Female |
| Healthcare Support | 0 (0.0%) | 14 (100.0%) |
| Security & Protection | 13 (86.7%) | 2 (13.3%) |
| Firefighting & Prevention | 2 (50.0%) | 2 (50.0%) |
| Law Enforcement | 11 (100.0%) | 0 (0.0%) |
| Food Preparation & Serving | 3 (100.0%) | 0 (0.0%) |
| Cleaning & Maintenance | 11 (42.3%) | 15 (57.7%) |
| Personal Care & Service | 0 (0.0%) | 3 (100.0%) |
| Total (Category) | 27 (44.3%) | 34 (55.7%) |
| Total (Overall) | 165 (42.4%) | 224 (57.6%) |
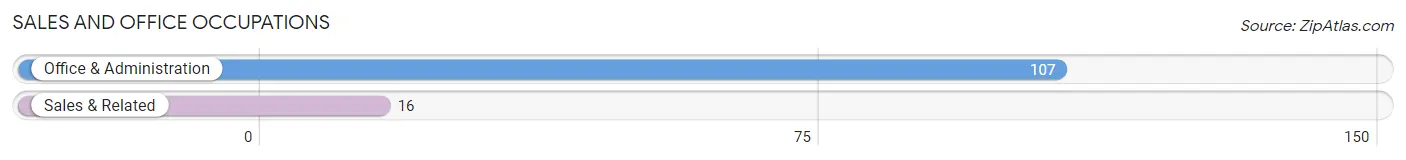
Sales and Office Occupations
The most common Sales and Office occupations in Magazine are Office & Administration (107 | 27.5%), and Sales & Related (16 | 4.1%).
Sales and Office Occupations by Sex
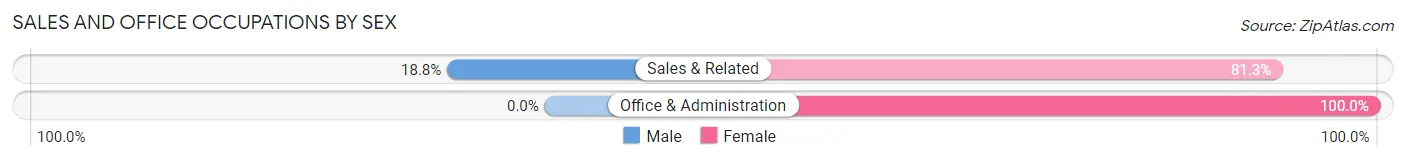
| Occupation | Male | Female |
| Sales & Related | 3 (18.8%) | 13 (81.2%) |
| Office & Administration | 0 (0.0%) | 107 (100.0%) |
| Total (Category) | 3 (2.4%) | 120 (97.6%) |
| Total (Overall) | 165 (42.4%) | 224 (57.6%) |
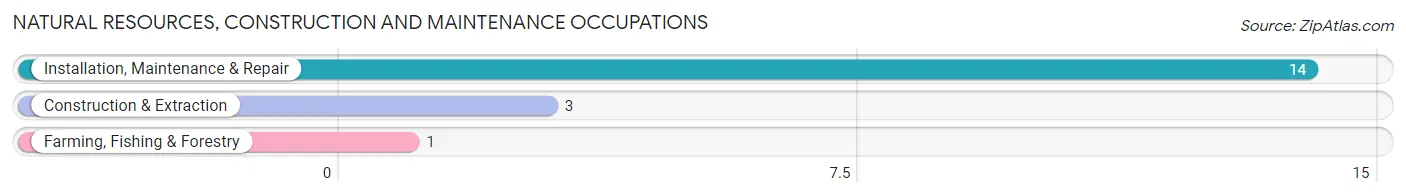
Natural Resources, Construction and Maintenance Occupations
The most common Natural Resources, Construction and Maintenance occupations in Magazine are Installation, Maintenance & Repair (14 | 3.6%), Construction & Extraction (3 | 0.8%), and Farming, Fishing & Forestry (1 | 0.3%).
Natural Resources, Construction and Maintenance Occupations by Sex
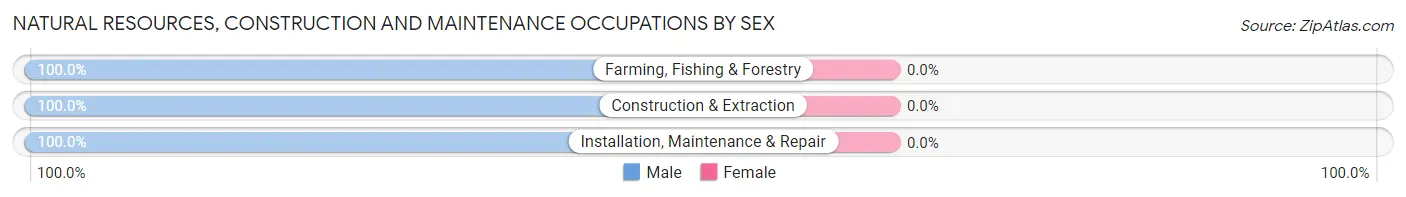
| Occupation | Male | Female |
| Farming, Fishing & Forestry | 1 (100.0%) | 0 (0.0%) |
| Construction & Extraction | 3 (100.0%) | 0 (0.0%) |
| Installation, Maintenance & Repair | 14 (100.0%) | 0 (0.0%) |
| Total (Category) | 18 (100.0%) | 0 (0.0%) |
| Total (Overall) | 165 (42.4%) | 224 (57.6%) |
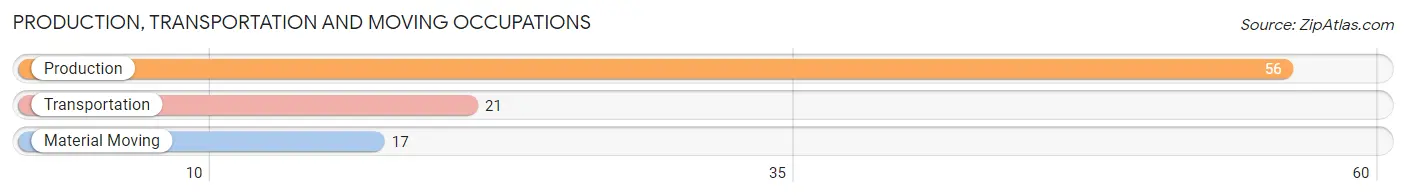
Production, Transportation and Moving Occupations
The most common Production, Transportation and Moving occupations in Magazine are Production (56 | 14.4%), Transportation (21 | 5.4%), and Material Moving (17 | 4.4%).
Production, Transportation and Moving Occupations by Sex
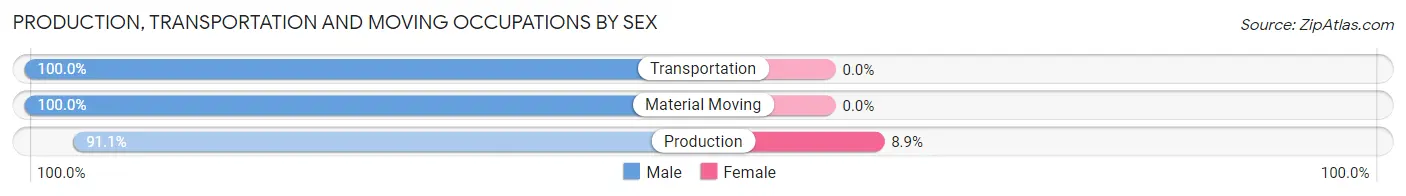
| Occupation | Male | Female |
| Production | 51 (91.1%) | 5 (8.9%) |
| Transportation | 21 (100.0%) | 0 (0.0%) |
| Material Moving | 17 (100.0%) | 0 (0.0%) |
| Total (Category) | 89 (94.7%) | 5 (5.3%) |
| Total (Overall) | 165 (42.4%) | 224 (57.6%) |
Employment Industries by Sex in Magazine
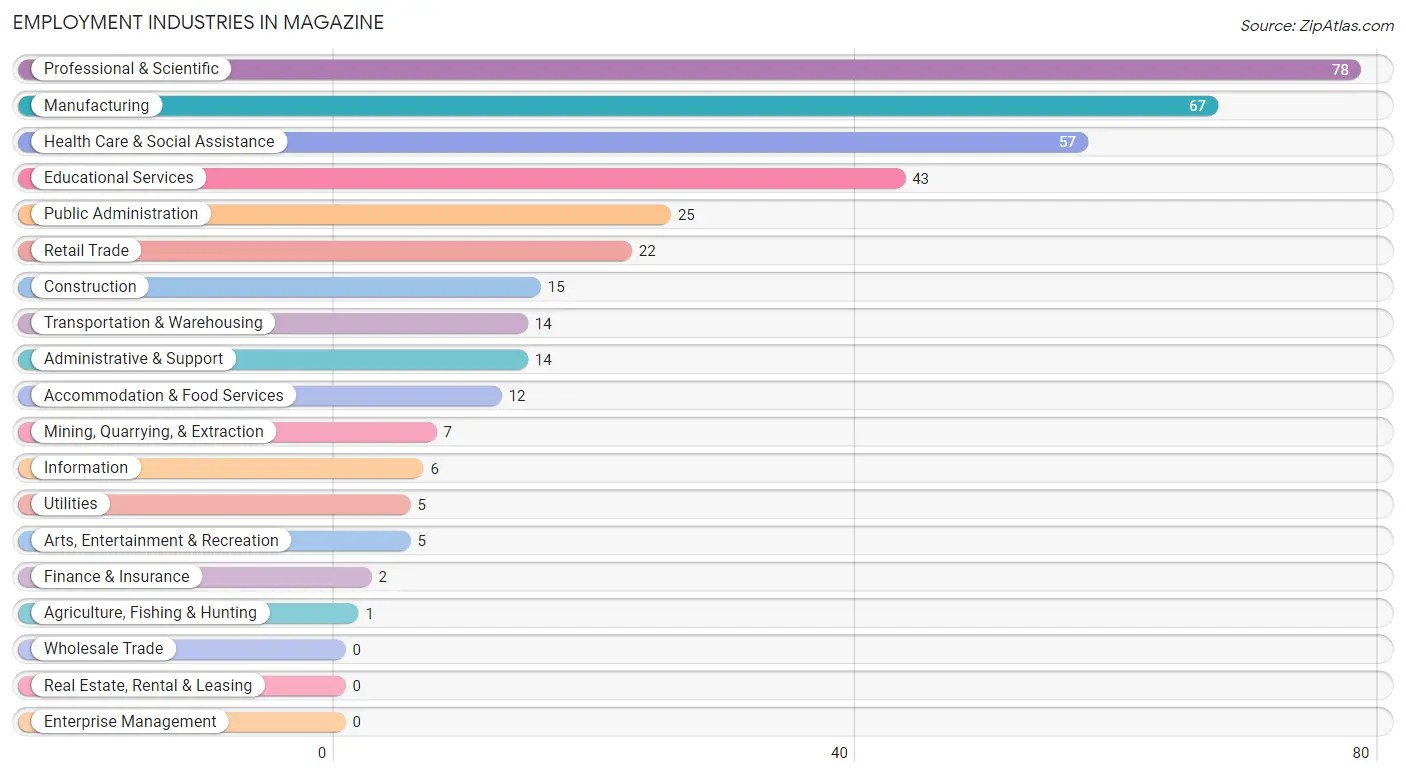
Employment Industries in Magazine
The major employment industries in Magazine include Professional & Scientific (78 | 20.1%), Manufacturing (67 | 17.2%), Health Care & Social Assistance (57 | 14.6%), Educational Services (43 | 11.1%), and Public Administration (25 | 6.4%).
Employment Industries by Sex in Magazine
The Magazine industries that see more men than women are Agriculture, Fishing & Hunting (100.0%), Mining, Quarrying, & Extraction (100.0%), and Transportation & Warehousing (100.0%), whereas the industries that tend to have a higher number of women are Utilities (100.0%), Professional & Scientific (100.0%), and Arts, Entertainment & Recreation (100.0%).
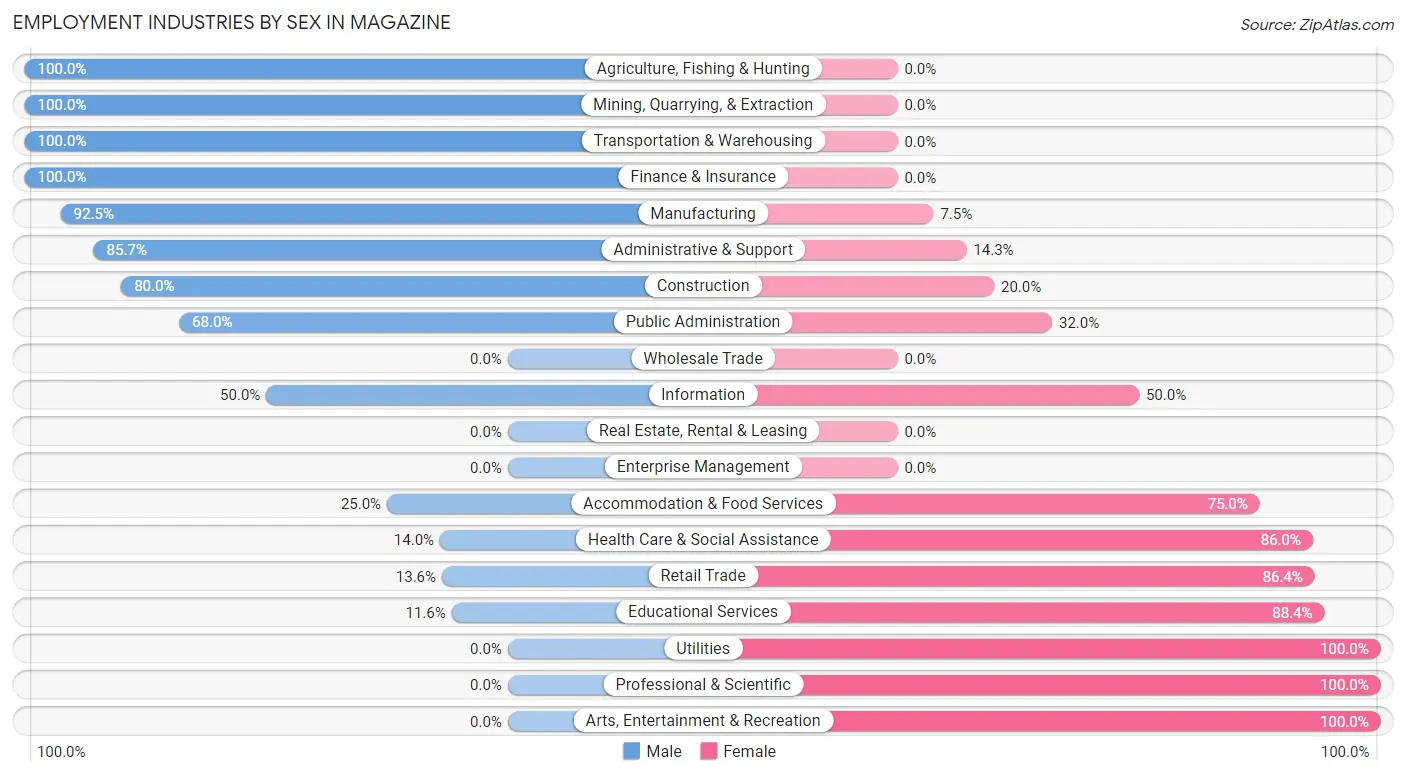
| Industry | Male | Female |
| Agriculture, Fishing & Hunting | 1 (100.0%) | 0 (0.0%) |
| Mining, Quarrying, & Extraction | 7 (100.0%) | 0 (0.0%) |
| Construction | 12 (80.0%) | 3 (20.0%) |
| Manufacturing | 62 (92.5%) | 5 (7.5%) |
| Wholesale Trade | 0 (0.0%) | 0 (0.0%) |
| Retail Trade | 3 (13.6%) | 19 (86.4%) |
| Transportation & Warehousing | 14 (100.0%) | 0 (0.0%) |
| Utilities | 0 (0.0%) | 5 (100.0%) |
| Information | 3 (50.0%) | 3 (50.0%) |
| Finance & Insurance | 2 (100.0%) | 0 (0.0%) |
| Real Estate, Rental & Leasing | 0 (0.0%) | 0 (0.0%) |
| Professional & Scientific | 0 (0.0%) | 78 (100.0%) |
| Enterprise Management | 0 (0.0%) | 0 (0.0%) |
| Administrative & Support | 12 (85.7%) | 2 (14.3%) |
| Educational Services | 5 (11.6%) | 38 (88.4%) |
| Health Care & Social Assistance | 8 (14.0%) | 49 (86.0%) |
| Arts, Entertainment & Recreation | 0 (0.0%) | 5 (100.0%) |
| Accommodation & Food Services | 3 (25.0%) | 9 (75.0%) |
| Public Administration | 17 (68.0%) | 8 (32.0%) |
| Total | 165 (42.4%) | 224 (57.6%) |
Education in Magazine
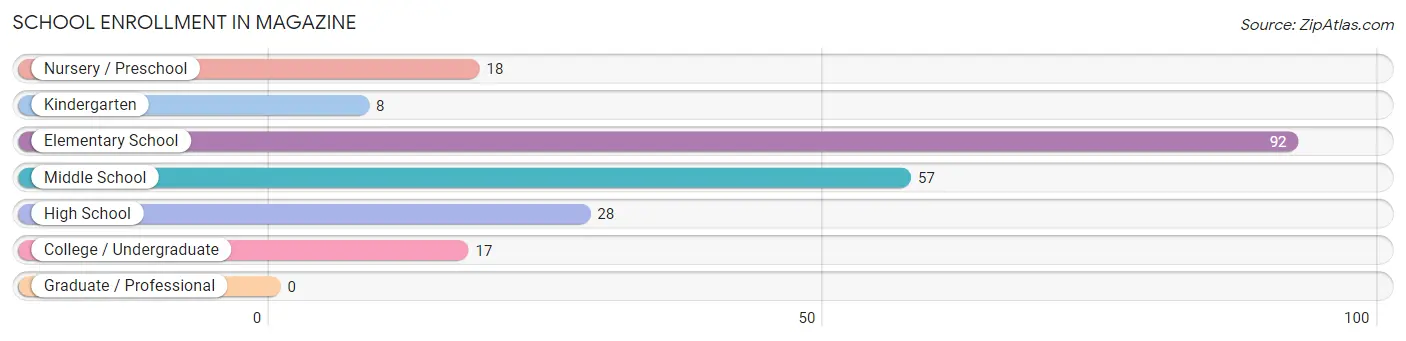
School Enrollment in Magazine
The most common levels of schooling among the 220 students in Magazine are elementary school (92 | 41.8%), middle school (57 | 25.9%), and high school (28 | 12.7%).
| School Level | # Students | % Students |
| Nursery / Preschool | 18 | 8.2% |
| Kindergarten | 8 | 3.6% |
| Elementary School | 92 | 41.8% |
| Middle School | 57 | 25.9% |
| High School | 28 | 12.7% |
| College / Undergraduate | 17 | 7.7% |
| Graduate / Professional | 0 | 0.0% |
| Total | 220 | 100.0% |
School Enrollment by Age by Funding Source in Magazine
Out of a total of 220 students who are enrolled in schools in Magazine, 13 (5.9%) attend a private institution, while the remaining 207 (94.1%) are enrolled in public schools. The age group of 35 years and over has the highest likelihood of being enrolled in private schools, with 6 (75.0% in the age bracket) enrolled. Conversely, the age group of 3 to 4 year olds has the lowest likelihood of being enrolled in a private school, with 18 (100.0% in the age bracket) attending a public institution.
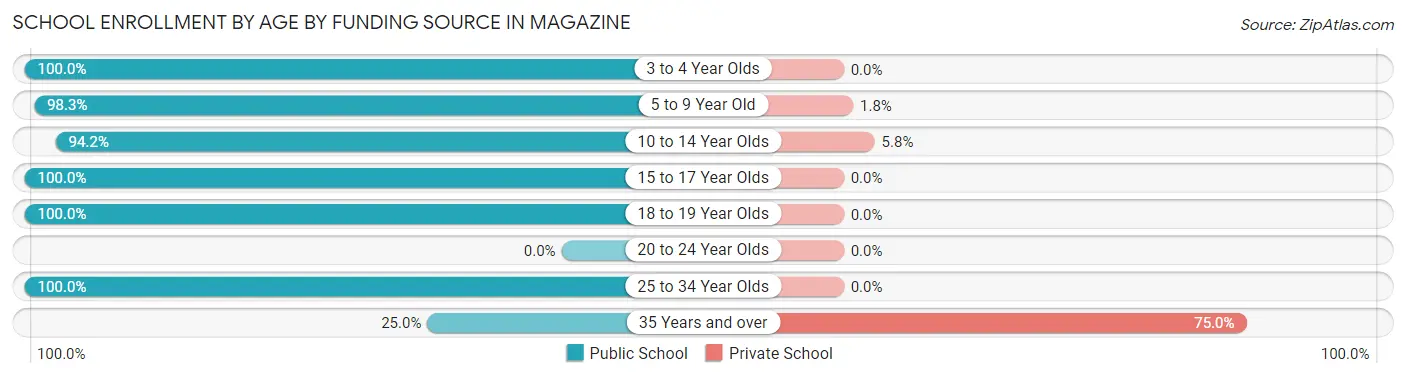
| Age Bracket | Public School | Private School |
| 3 to 4 Year Olds | 18 (100.0%) | 0 (0.0%) |
| 5 to 9 Year Old | 56 (98.3%) | 1 (1.8%) |
| 10 to 14 Year Olds | 98 (94.2%) | 6 (5.8%) |
| 15 to 17 Year Olds | 16 (100.0%) | 0 (0.0%) |
| 18 to 19 Year Olds | 9 (100.0%) | 0 (0.0%) |
| 20 to 24 Year Olds | 0 (0.0%) | 0 (0.0%) |
| 25 to 34 Year Olds | 8 (100.0%) | 0 (0.0%) |
| 35 Years and over | 2 (25.0%) | 6 (75.0%) |
| Total | 207 (94.1%) | 13 (5.9%) |
Educational Attainment by Field of Study in Magazine
Education (17 | 43.6%), bio, nature & agricultural (6 | 15.4%), business (6 | 15.4%), arts & humanities (4 | 10.3%), and computers & mathematics (2 | 5.1%) are the most common fields of study among 39 individuals in Magazine who have obtained a bachelor's degree or higher.
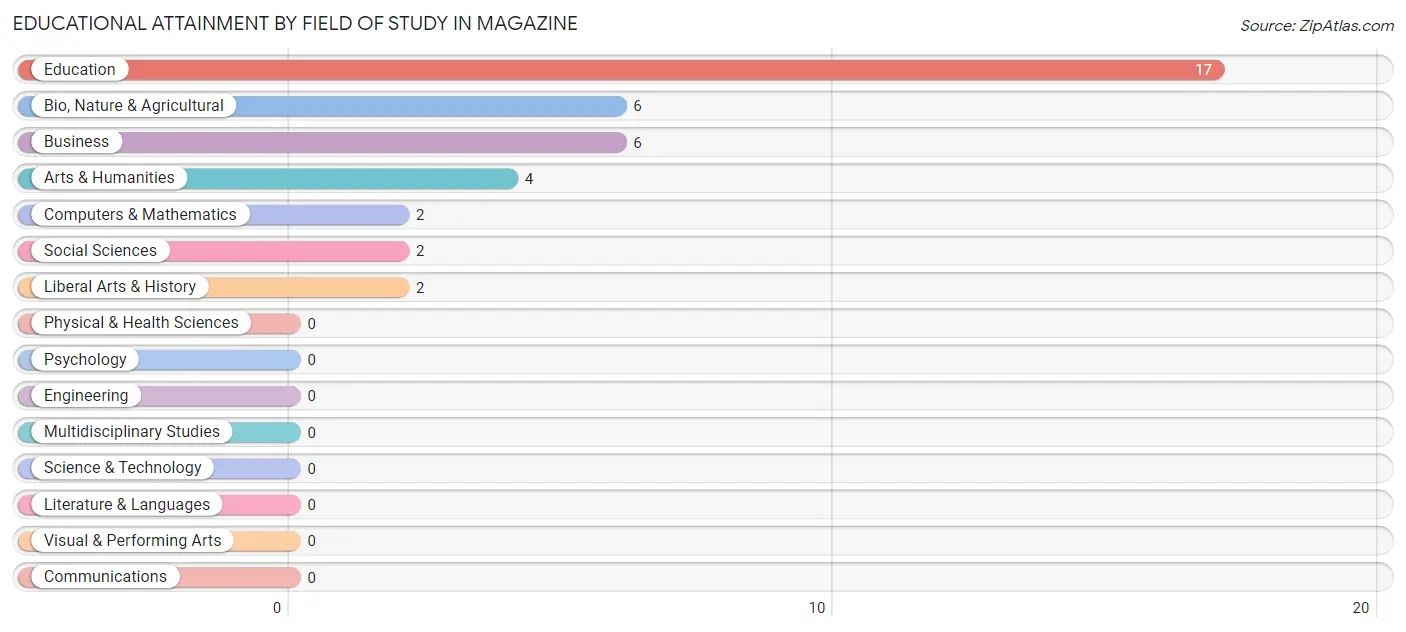
| Field of Study | # Graduates | % Graduates |
| Computers & Mathematics | 2 | 5.1% |
| Bio, Nature & Agricultural | 6 | 15.4% |
| Physical & Health Sciences | 0 | 0.0% |
| Psychology | 0 | 0.0% |
| Social Sciences | 2 | 5.1% |
| Engineering | 0 | 0.0% |
| Multidisciplinary Studies | 0 | 0.0% |
| Science & Technology | 0 | 0.0% |
| Business | 6 | 15.4% |
| Education | 17 | 43.6% |
| Literature & Languages | 0 | 0.0% |
| Liberal Arts & History | 2 | 5.1% |
| Visual & Performing Arts | 0 | 0.0% |
| Communications | 0 | 0.0% |
| Arts & Humanities | 4 | 10.3% |
| Total | 39 | 100.0% |
Transportation & Commute in Magazine
Vehicle Availability by Sex in Magazine
The most prevalent vehicle ownership categories in Magazine are males with 2 vehicles (57, accounting for 34.5%) and females with 2 vehicles (60, making up 25.7%).
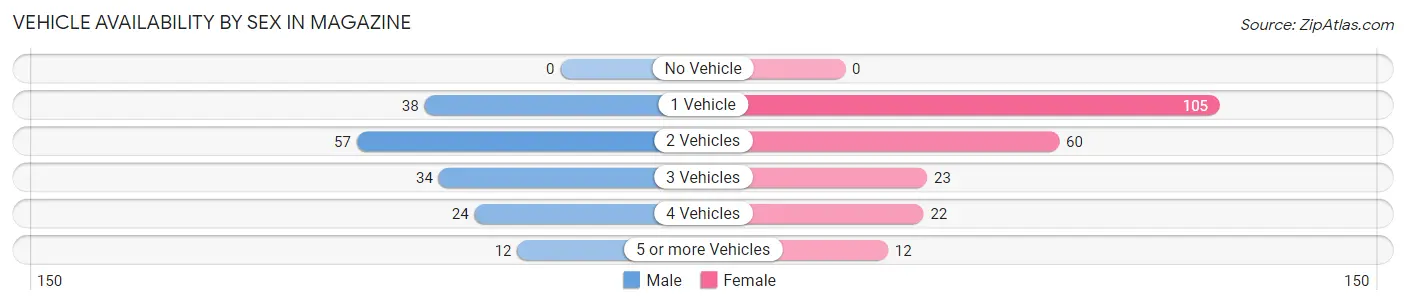
| Vehicles Available | Male | Female |
| No Vehicle | 0 (0.0%) | 0 (0.0%) |
| 1 Vehicle | 38 (23.0%) | 105 (47.3%) |
| 2 Vehicles | 57 (34.5%) | 60 (27.0%) |
| 3 Vehicles | 34 (20.6%) | 23 (10.4%) |
| 4 Vehicles | 24 (14.5%) | 22 (9.9%) |
| 5 or more Vehicles | 12 (7.3%) | 12 (5.4%) |
| Total | 165 (100.0%) | 222 (100.0%) |
Commute Time in Magazine
The most frequently occuring commute durations in Magazine are 60 to 89 minutes (99 commuters, 25.6%), 5 to 9 minutes (95 commuters, 24.5%), and 10 to 14 minutes (51 commuters, 13.2%).
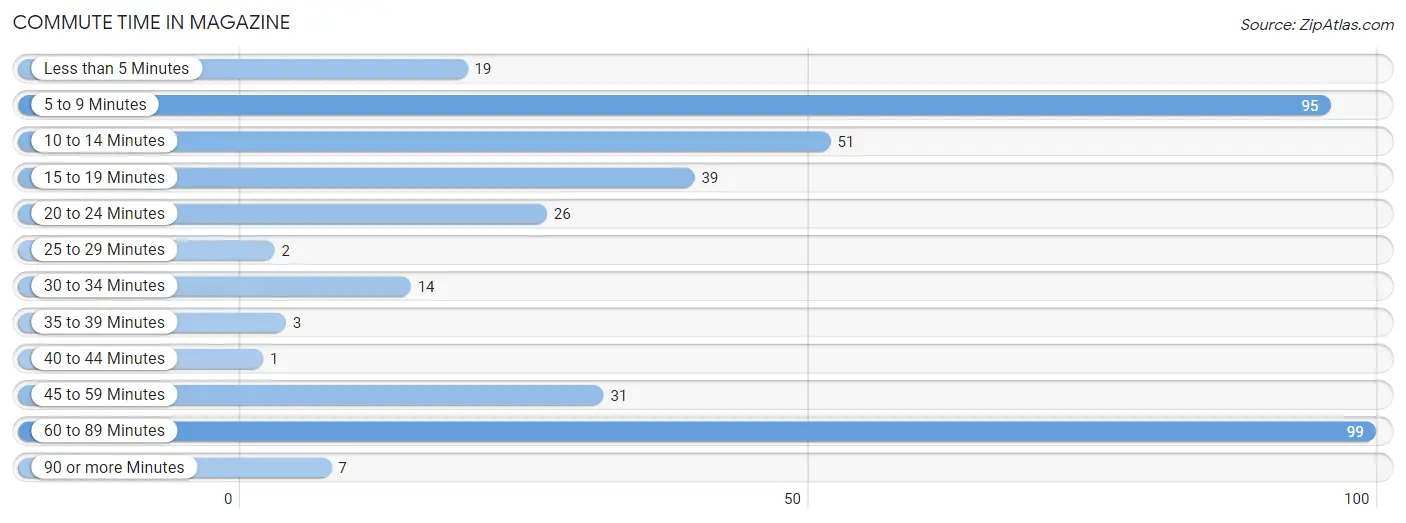
| Commute Time | # Commuters | % Commuters |
| Less than 5 Minutes | 19 | 4.9% |
| 5 to 9 Minutes | 95 | 24.5% |
| 10 to 14 Minutes | 51 | 13.2% |
| 15 to 19 Minutes | 39 | 10.1% |
| 20 to 24 Minutes | 26 | 6.7% |
| 25 to 29 Minutes | 2 | 0.5% |
| 30 to 34 Minutes | 14 | 3.6% |
| 35 to 39 Minutes | 3 | 0.8% |
| 40 to 44 Minutes | 1 | 0.3% |
| 45 to 59 Minutes | 31 | 8.0% |
| 60 to 89 Minutes | 99 | 25.6% |
| 90 or more Minutes | 7 | 1.8% |
Commute Time by Sex in Magazine
The most common commute times in Magazine are 5 to 9 minutes (50 commuters, 30.3%) for males and 60 to 89 minutes (80 commuters, 36.0%) for females.
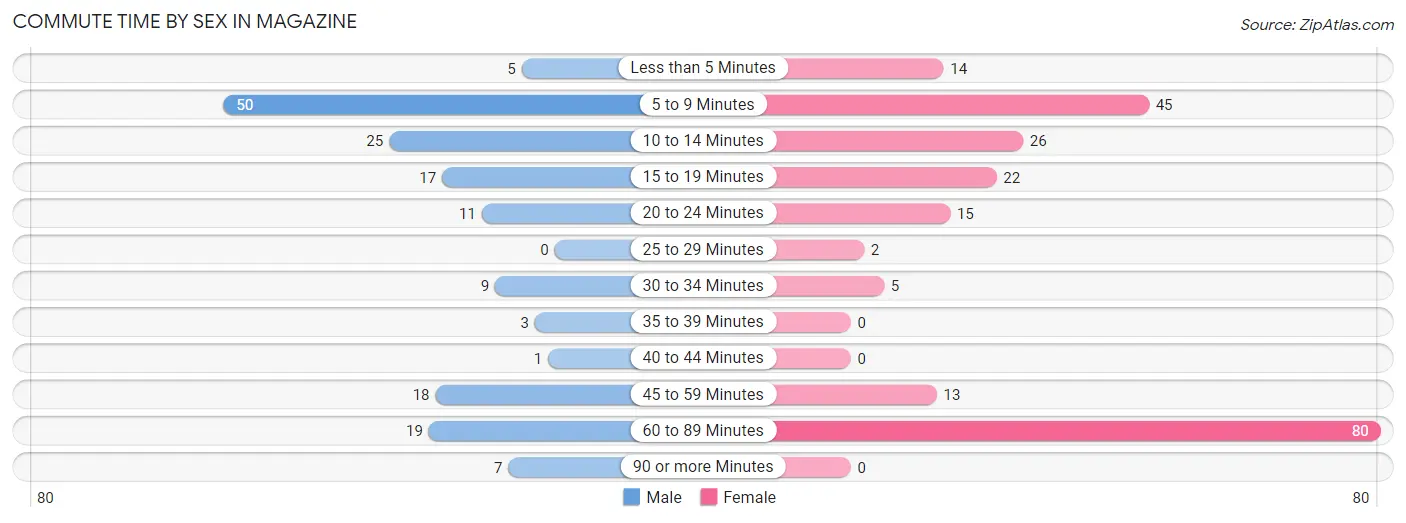
| Commute Time | Male | Female |
| Less than 5 Minutes | 5 (3.0%) | 14 (6.3%) |
| 5 to 9 Minutes | 50 (30.3%) | 45 (20.3%) |
| 10 to 14 Minutes | 25 (15.1%) | 26 (11.7%) |
| 15 to 19 Minutes | 17 (10.3%) | 22 (9.9%) |
| 20 to 24 Minutes | 11 (6.7%) | 15 (6.8%) |
| 25 to 29 Minutes | 0 (0.0%) | 2 (0.9%) |
| 30 to 34 Minutes | 9 (5.4%) | 5 (2.2%) |
| 35 to 39 Minutes | 3 (1.8%) | 0 (0.0%) |
| 40 to 44 Minutes | 1 (0.6%) | 0 (0.0%) |
| 45 to 59 Minutes | 18 (10.9%) | 13 (5.9%) |
| 60 to 89 Minutes | 19 (11.5%) | 80 (36.0%) |
| 90 or more Minutes | 7 (4.2%) | 0 (0.0%) |
Time of Departure to Work by Sex in Magazine
The most frequent times of departure to work in Magazine are 12:00 AM to 4:59 AM (40, 24.2%) for males and 7:00 AM to 7:29 AM (97, 43.7%) for females.
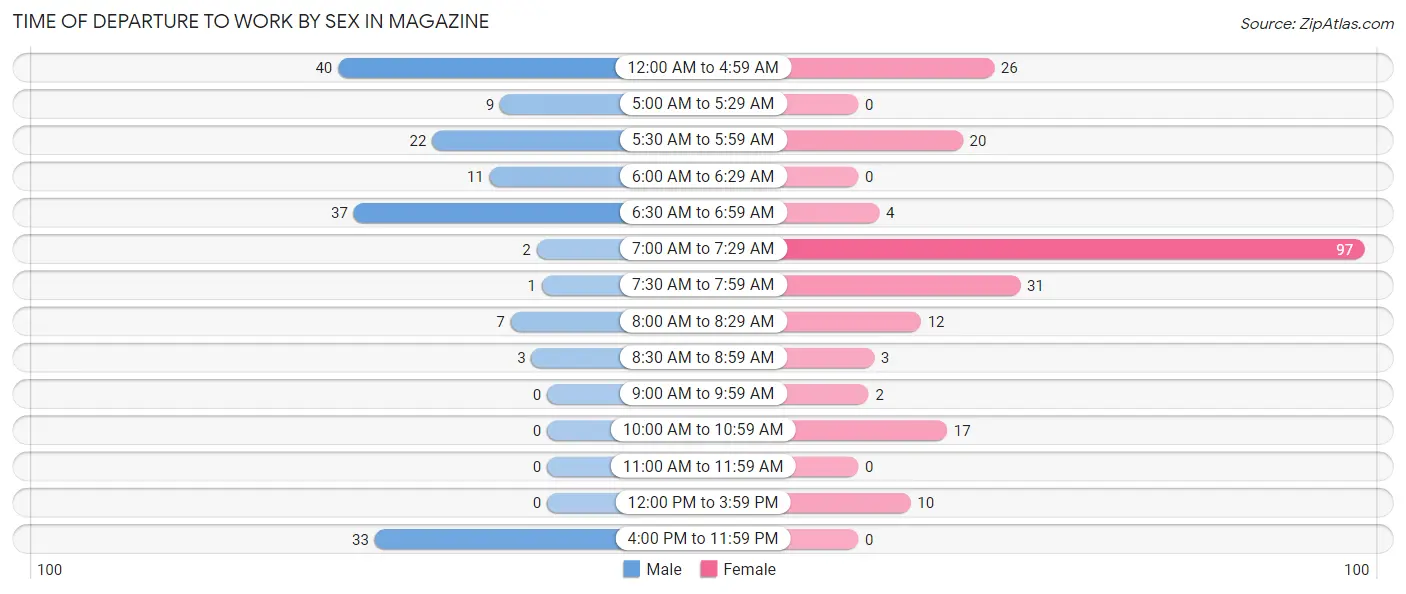
| Time of Departure | Male | Female |
| 12:00 AM to 4:59 AM | 40 (24.2%) | 26 (11.7%) |
| 5:00 AM to 5:29 AM | 9 (5.4%) | 0 (0.0%) |
| 5:30 AM to 5:59 AM | 22 (13.3%) | 20 (9.0%) |
| 6:00 AM to 6:29 AM | 11 (6.7%) | 0 (0.0%) |
| 6:30 AM to 6:59 AM | 37 (22.4%) | 4 (1.8%) |
| 7:00 AM to 7:29 AM | 2 (1.2%) | 97 (43.7%) |
| 7:30 AM to 7:59 AM | 1 (0.6%) | 31 (14.0%) |
| 8:00 AM to 8:29 AM | 7 (4.2%) | 12 (5.4%) |
| 8:30 AM to 8:59 AM | 3 (1.8%) | 3 (1.3%) |
| 9:00 AM to 9:59 AM | 0 (0.0%) | 2 (0.9%) |
| 10:00 AM to 10:59 AM | 0 (0.0%) | 17 (7.7%) |
| 11:00 AM to 11:59 AM | 0 (0.0%) | 0 (0.0%) |
| 12:00 PM to 3:59 PM | 0 (0.0%) | 10 (4.5%) |
| 4:00 PM to 11:59 PM | 33 (20.0%) | 0 (0.0%) |
| Total | 165 (100.0%) | 222 (100.0%) |
Housing Occupancy in Magazine
Occupancy by Ownership in Magazine
Of the total 276 dwellings in Magazine, owner-occupied units account for 191 (69.2%), while renter-occupied units make up 85 (30.8%).
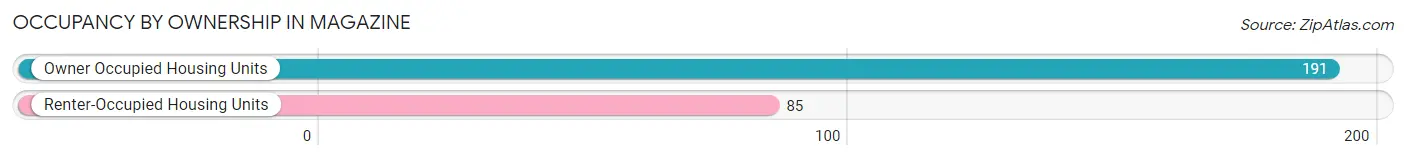
| Occupancy | # Housing Units | % Housing Units |
| Owner Occupied Housing Units | 191 | 69.2% |
| Renter-Occupied Housing Units | 85 | 30.8% |
| Total Occupied Housing Units | 276 | 100.0% |
Occupancy by Household Size in Magazine
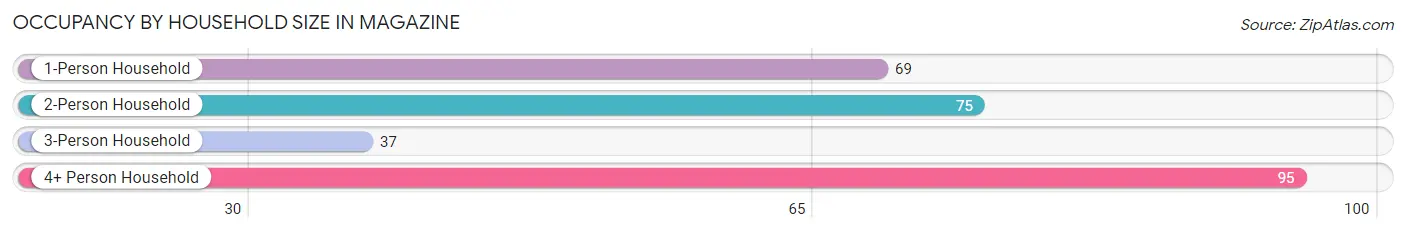
| Household Size | # Housing Units | % Housing Units |
| 1-Person Household | 69 | 25.0% |
| 2-Person Household | 75 | 27.2% |
| 3-Person Household | 37 | 13.4% |
| 4+ Person Household | 95 | 34.4% |
| Total Housing Units | 276 | 100.0% |
Occupancy by Ownership by Household Size in Magazine
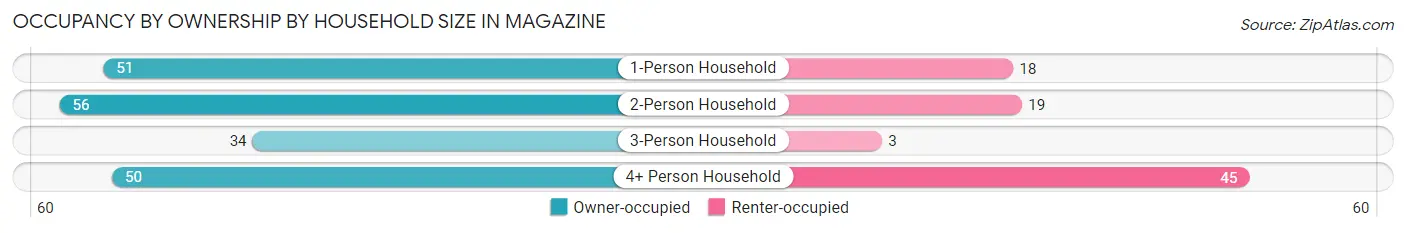
| Household Size | Owner-occupied | Renter-occupied |
| 1-Person Household | 51 (73.9%) | 18 (26.1%) |
| 2-Person Household | 56 (74.7%) | 19 (25.3%) |
| 3-Person Household | 34 (91.9%) | 3 (8.1%) |
| 4+ Person Household | 50 (52.6%) | 45 (47.4%) |
| Total Housing Units | 191 (69.2%) | 85 (30.8%) |
Occupancy by Educational Attainment in Magazine
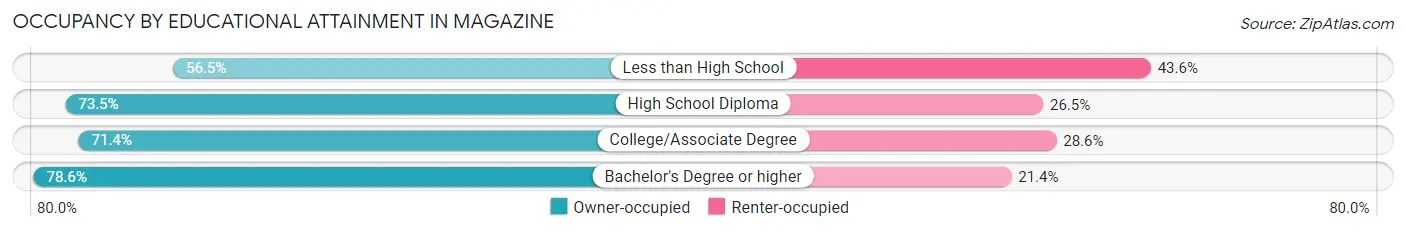
| Household Size | Owner-occupied | Renter-occupied |
| Less than High School | 35 (56.5%) | 27 (43.5%) |
| High School Diploma | 75 (73.5%) | 27 (26.5%) |
| College/Associate Degree | 70 (71.4%) | 28 (28.6%) |
| Bachelor's Degree or higher | 11 (78.6%) | 3 (21.4%) |
Occupancy by Age of Householder in Magazine
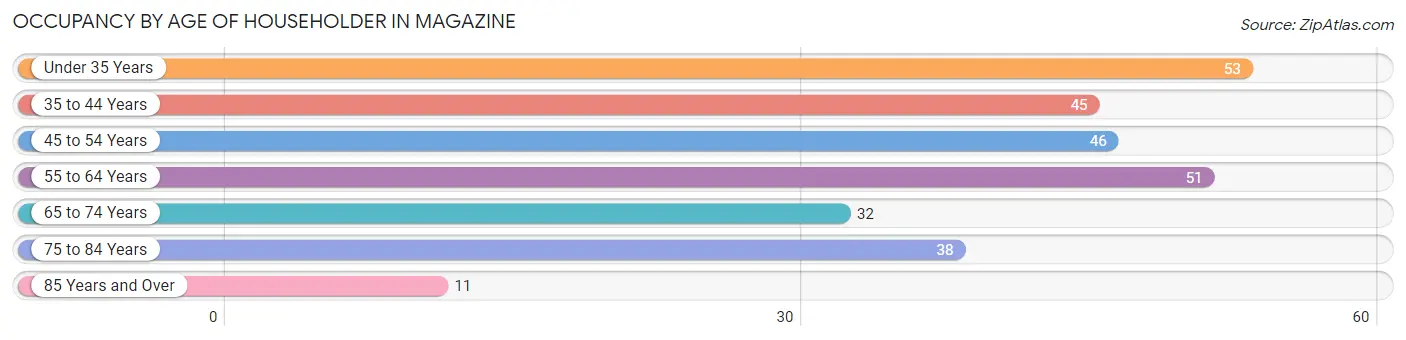
| Age Bracket | # Households | % Households |
| Under 35 Years | 53 | 19.2% |
| 35 to 44 Years | 45 | 16.3% |
| 45 to 54 Years | 46 | 16.7% |
| 55 to 64 Years | 51 | 18.5% |
| 65 to 74 Years | 32 | 11.6% |
| 75 to 84 Years | 38 | 13.8% |
| 85 Years and Over | 11 | 4.0% |
| Total | 276 | 100.0% |
Housing Finances in Magazine
Median Income by Occupancy in Magazine
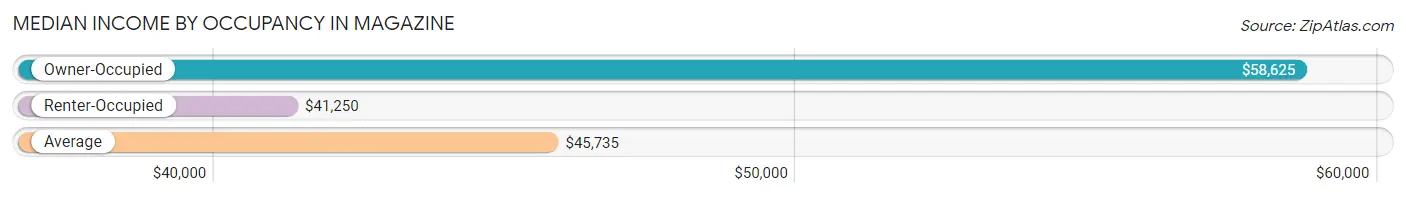
| Occupancy Type | # Households | Median Income |
| Owner-Occupied | 191 (69.2%) | $58,625 |
| Renter-Occupied | 85 (30.8%) | $41,250 |
| Average | 276 (100.0%) | $45,735 |
Occupancy by Householder Income Bracket in Magazine
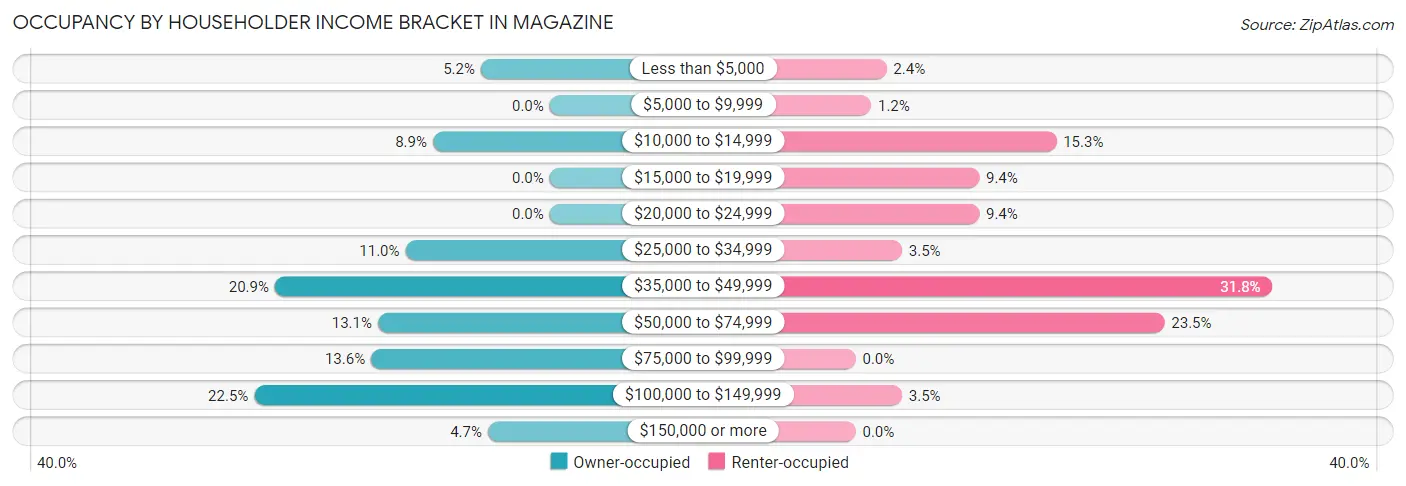
| Income Bracket | Owner-occupied | Renter-occupied |
| Less than $5,000 | 10 (5.2%) | 2 (2.4%) |
| $5,000 to $9,999 | 0 (0.0%) | 1 (1.2%) |
| $10,000 to $14,999 | 17 (8.9%) | 13 (15.3%) |
| $15,000 to $19,999 | 0 (0.0%) | 8 (9.4%) |
| $20,000 to $24,999 | 0 (0.0%) | 8 (9.4%) |
| $25,000 to $34,999 | 21 (11.0%) | 3 (3.5%) |
| $35,000 to $49,999 | 40 (20.9%) | 27 (31.8%) |
| $50,000 to $74,999 | 25 (13.1%) | 20 (23.5%) |
| $75,000 to $99,999 | 26 (13.6%) | 0 (0.0%) |
| $100,000 to $149,999 | 43 (22.5%) | 3 (3.5%) |
| $150,000 or more | 9 (4.7%) | 0 (0.0%) |
| Total | 191 (100.0%) | 85 (100.0%) |
Monthly Housing Cost Tiers in Magazine
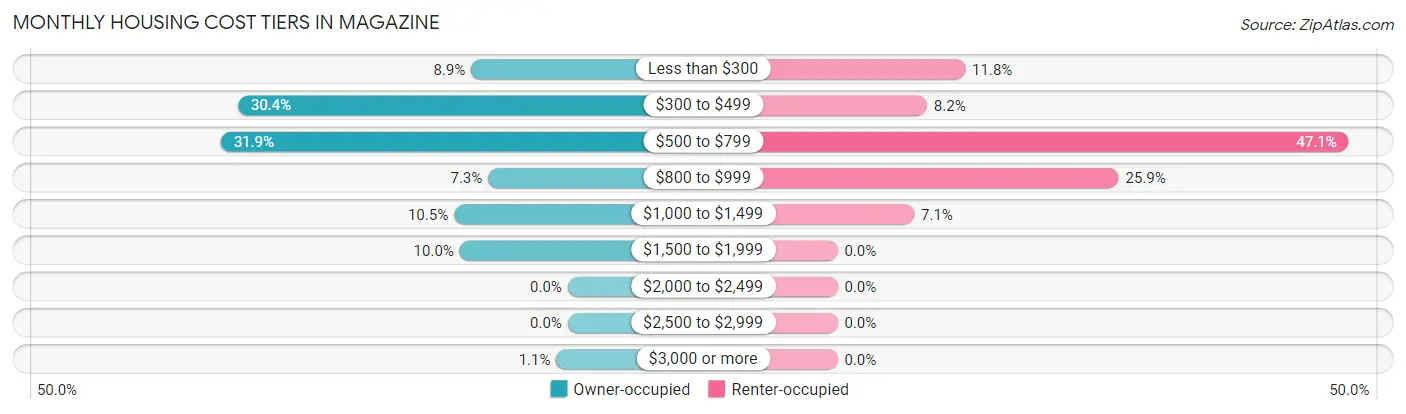
| Monthly Cost | Owner-occupied | Renter-occupied |
| Less than $300 | 17 (8.9%) | 10 (11.8%) |
| $300 to $499 | 58 (30.4%) | 7 (8.2%) |
| $500 to $799 | 61 (31.9%) | 40 (47.1%) |
| $800 to $999 | 14 (7.3%) | 22 (25.9%) |
| $1,000 to $1,499 | 20 (10.5%) | 6 (7.1%) |
| $1,500 to $1,999 | 19 (10.0%) | 0 (0.0%) |
| $2,000 to $2,499 | 0 (0.0%) | 0 (0.0%) |
| $2,500 to $2,999 | 0 (0.0%) | 0 (0.0%) |
| $3,000 or more | 2 (1.1%) | 0 (0.0%) |
| Total | 191 (100.0%) | 85 (100.0%) |
Physical Housing Characteristics in Magazine
Housing Structures in Magazine
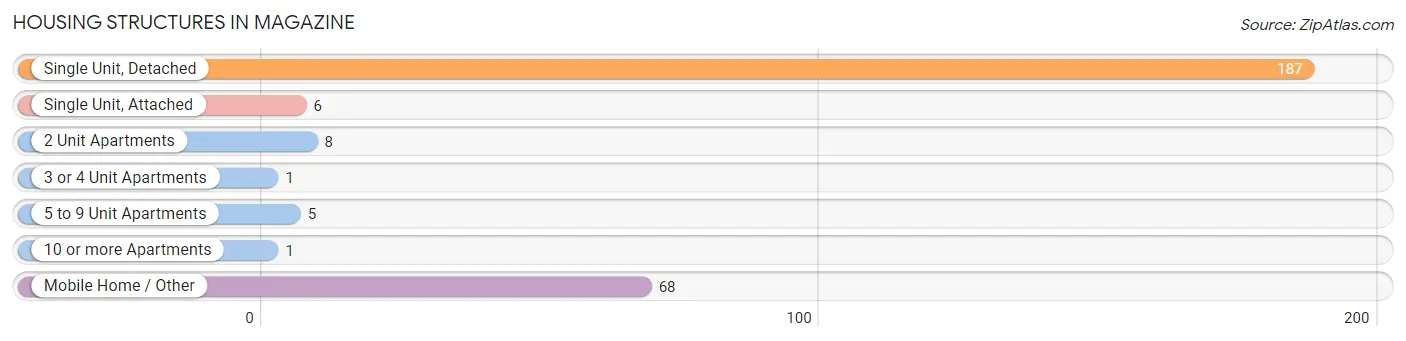
| Structure Type | # Housing Units | % Housing Units |
| Single Unit, Detached | 187 | 67.7% |
| Single Unit, Attached | 6 | 2.2% |
| 2 Unit Apartments | 8 | 2.9% |
| 3 or 4 Unit Apartments | 1 | 0.4% |
| 5 to 9 Unit Apartments | 5 | 1.8% |
| 10 or more Apartments | 1 | 0.4% |
| Mobile Home / Other | 68 | 24.6% |
| Total | 276 | 100.0% |
Housing Structures by Occupancy in Magazine
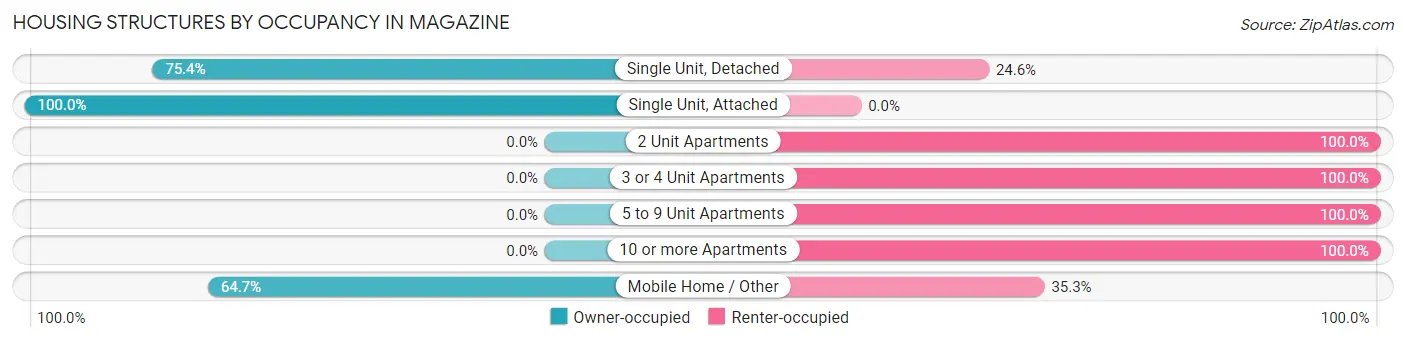
| Structure Type | Owner-occupied | Renter-occupied |
| Single Unit, Detached | 141 (75.4%) | 46 (24.6%) |
| Single Unit, Attached | 6 (100.0%) | 0 (0.0%) |
| 2 Unit Apartments | 0 (0.0%) | 8 (100.0%) |
| 3 or 4 Unit Apartments | 0 (0.0%) | 1 (100.0%) |
| 5 to 9 Unit Apartments | 0 (0.0%) | 5 (100.0%) |
| 10 or more Apartments | 0 (0.0%) | 1 (100.0%) |
| Mobile Home / Other | 44 (64.7%) | 24 (35.3%) |
| Total | 191 (69.2%) | 85 (30.8%) |
Housing Structures by Number of Rooms in Magazine
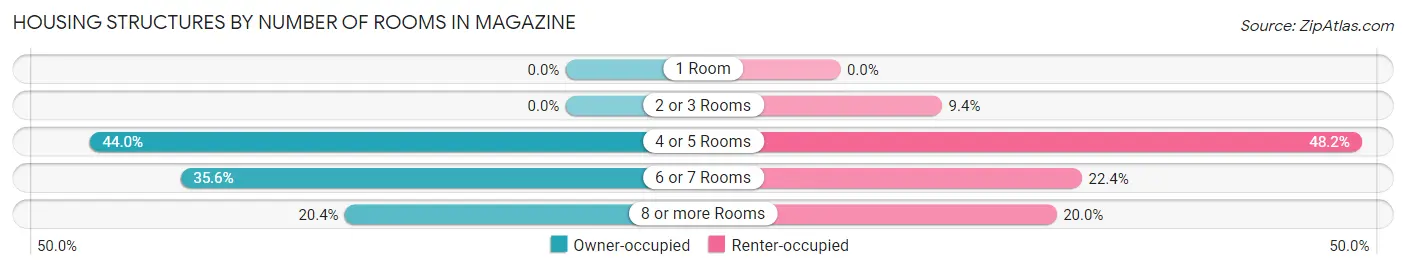
| Number of Rooms | Owner-occupied | Renter-occupied |
| 1 Room | 0 (0.0%) | 0 (0.0%) |
| 2 or 3 Rooms | 0 (0.0%) | 8 (9.4%) |
| 4 or 5 Rooms | 84 (44.0%) | 41 (48.2%) |
| 6 or 7 Rooms | 68 (35.6%) | 19 (22.4%) |
| 8 or more Rooms | 39 (20.4%) | 17 (20.0%) |
| Total | 191 (100.0%) | 85 (100.0%) |
Housing Structure by Heating Type in Magazine
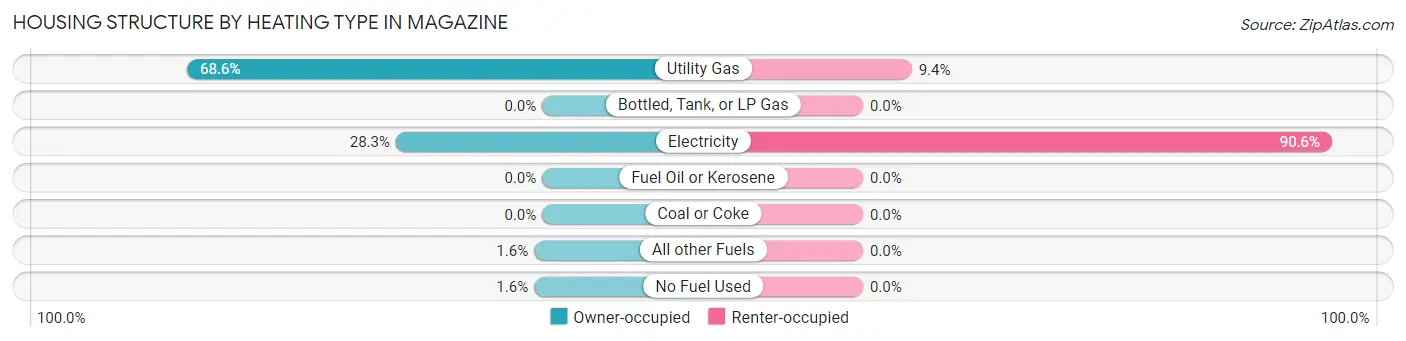
| Heating Type | Owner-occupied | Renter-occupied |
| Utility Gas | 131 (68.6%) | 8 (9.4%) |
| Bottled, Tank, or LP Gas | 0 (0.0%) | 0 (0.0%) |
| Electricity | 54 (28.3%) | 77 (90.6%) |
| Fuel Oil or Kerosene | 0 (0.0%) | 0 (0.0%) |
| Coal or Coke | 0 (0.0%) | 0 (0.0%) |
| All other Fuels | 3 (1.6%) | 0 (0.0%) |
| No Fuel Used | 3 (1.6%) | 0 (0.0%) |
| Total | 191 (100.0%) | 85 (100.0%) |
Household Vehicle Usage in Magazine

| Vehicles per Household | Owner-occupied | Renter-occupied |
| No Vehicle | 0 (0.0%) | 13 (15.3%) |
| 1 Vehicle | 59 (30.9%) | 35 (41.2%) |
| 2 Vehicles | 62 (32.5%) | 30 (35.3%) |
| 3 or more Vehicles | 70 (36.6%) | 7 (8.2%) |
| Total | 191 (100.0%) | 85 (100.0%) |
Real Estate & Mortgages in Magazine
Real Estate and Mortgage Overview in Magazine
| Characteristic | Without Mortgage | With Mortgage |
| Housing Units | 103 | 88 |
| Median Property Value | $59,200 | $0 |
| Median Household Income | $38,661 | $4 |
| Monthly Housing Costs | $367 | $2 |
| Real Estate Taxes | $481 | $0 |
Property Value by Mortgage Status in Magazine
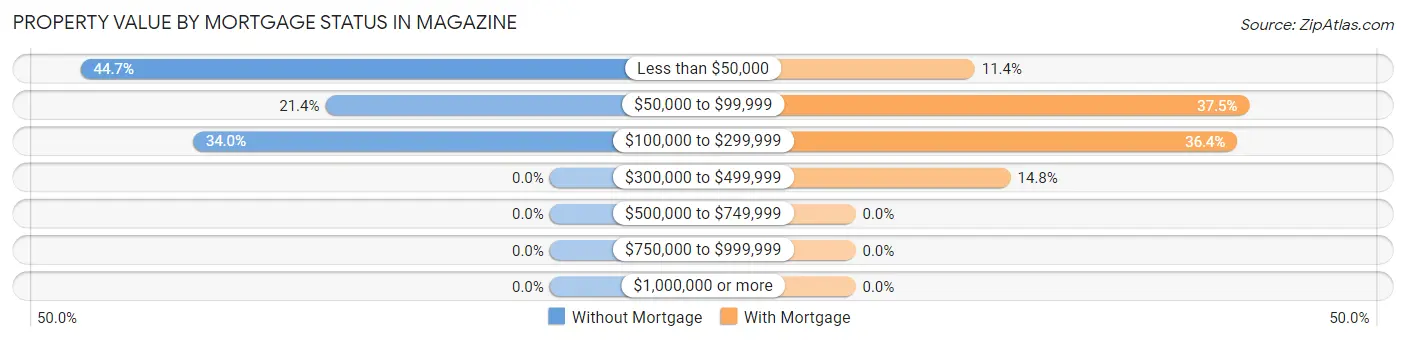
| Property Value | Without Mortgage | With Mortgage |
| Less than $50,000 | 46 (44.7%) | 10 (11.4%) |
| $50,000 to $99,999 | 22 (21.4%) | 33 (37.5%) |
| $100,000 to $299,999 | 35 (34.0%) | 32 (36.4%) |
| $300,000 to $499,999 | 0 (0.0%) | 13 (14.8%) |
| $500,000 to $749,999 | 0 (0.0%) | 0 (0.0%) |
| $750,000 to $999,999 | 0 (0.0%) | 0 (0.0%) |
| $1,000,000 or more | 0 (0.0%) | 0 (0.0%) |
| Total | 103 (100.0%) | 88 (100.0%) |
Household Income by Mortgage Status in Magazine
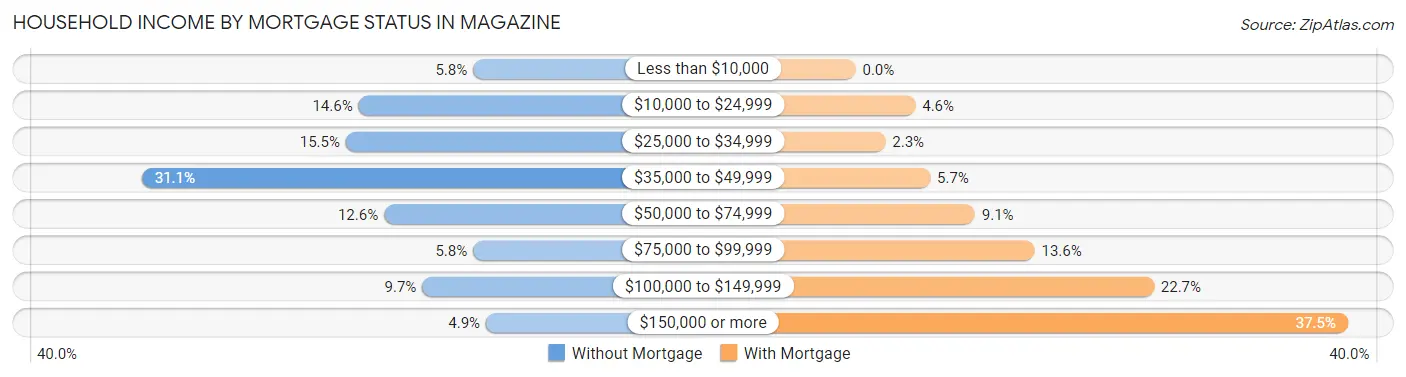
| Household Income | Without Mortgage | With Mortgage |
| Less than $10,000 | 6 (5.8%) | 0 (0.0%) |
| $10,000 to $24,999 | 15 (14.6%) | 4 (4.5%) |
| $25,000 to $34,999 | 16 (15.5%) | 2 (2.3%) |
| $35,000 to $49,999 | 32 (31.1%) | 5 (5.7%) |
| $50,000 to $74,999 | 13 (12.6%) | 8 (9.1%) |
| $75,000 to $99,999 | 6 (5.8%) | 12 (13.6%) |
| $100,000 to $149,999 | 10 (9.7%) | 20 (22.7%) |
| $150,000 or more | 5 (4.9%) | 33 (37.5%) |
| Total | 103 (100.0%) | 88 (100.0%) |
Property Value to Household Income Ratio in Magazine
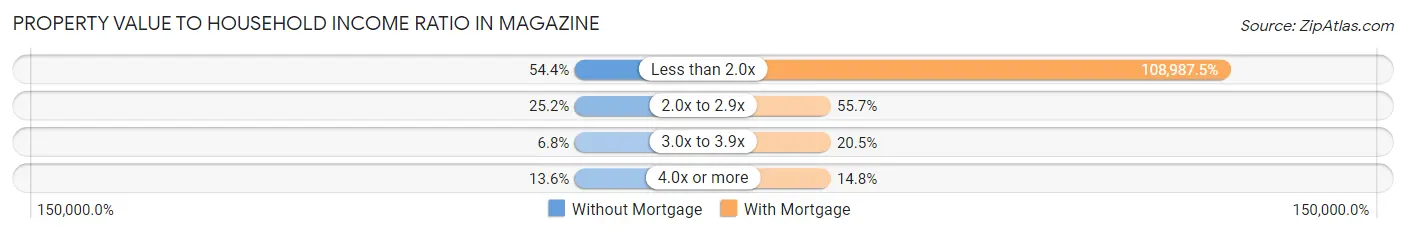
| Value-to-Income Ratio | Without Mortgage | With Mortgage |
| Less than 2.0x | 56 (54.4%) | 95,909 (108,987.5%) |
| 2.0x to 2.9x | 26 (25.2%) | 49 (55.7%) |
| 3.0x to 3.9x | 7 (6.8%) | 18 (20.4%) |
| 4.0x or more | 14 (13.6%) | 13 (14.8%) |
| Total | 103 (100.0%) | 88 (100.0%) |
Real Estate Taxes by Mortgage Status in Magazine
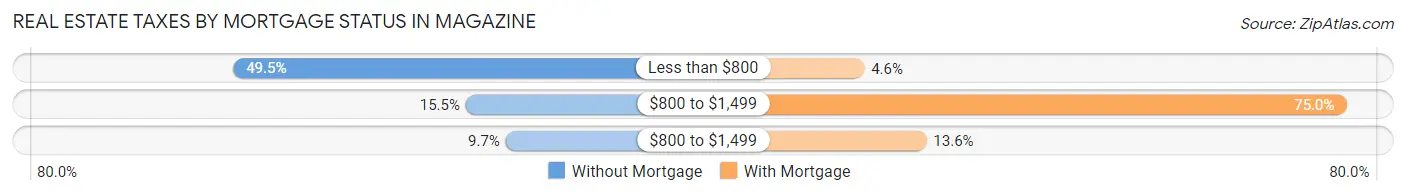
| Property Taxes | Without Mortgage | With Mortgage |
| Less than $800 | 51 (49.5%) | 4 (4.5%) |
| $800 to $1,499 | 16 (15.5%) | 66 (75.0%) |
| $800 to $1,499 | 10 (9.7%) | 12 (13.6%) |
| Total | 103 (100.0%) | 88 (100.0%) |
Health & Disability in Magazine
Health Insurance Coverage by Age in Magazine
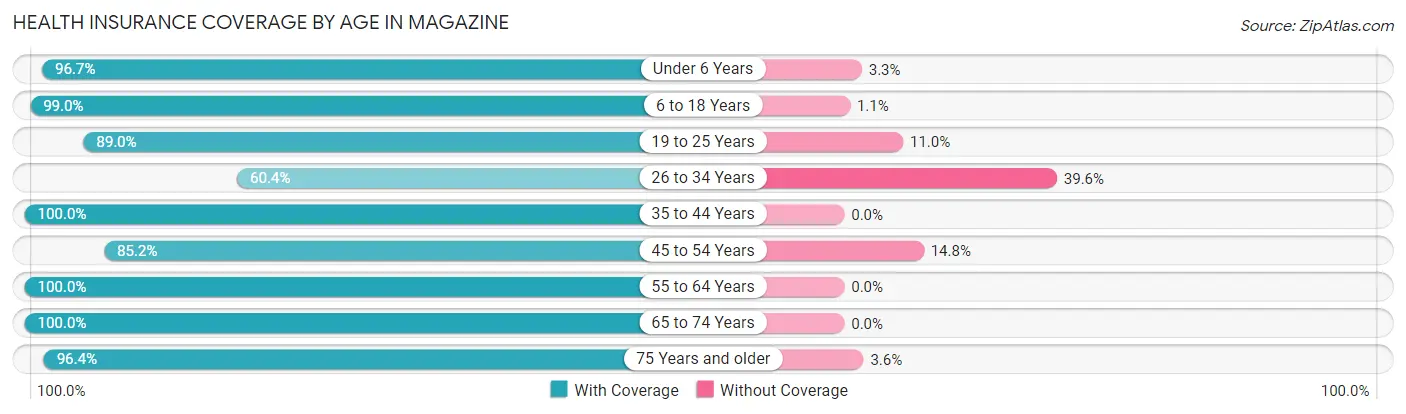
| Age Bracket | With Coverage | Without Coverage |
| Under 6 Years | 89 (96.7%) | 3 (3.3%) |
| 6 to 18 Years | 188 (99.0%) | 2 (1.1%) |
| 19 to 25 Years | 65 (89.0%) | 8 (11.0%) |
| 26 to 34 Years | 102 (60.4%) | 67 (39.6%) |
| 35 to 44 Years | 149 (100.0%) | 0 (0.0%) |
| 45 to 54 Years | 92 (85.2%) | 16 (14.8%) |
| 55 to 64 Years | 93 (100.0%) | 0 (0.0%) |
| 65 to 74 Years | 39 (100.0%) | 0 (0.0%) |
| 75 Years and older | 54 (96.4%) | 2 (3.6%) |
| Total | 871 (89.9%) | 98 (10.1%) |
Health Insurance Coverage by Citizenship Status in Magazine
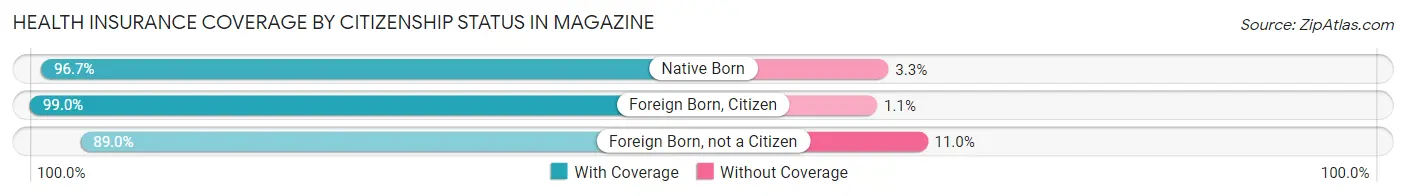
| Citizenship Status | With Coverage | Without Coverage |
| Native Born | 89 (96.7%) | 3 (3.3%) |
| Foreign Born, Citizen | 188 (99.0%) | 2 (1.1%) |
| Foreign Born, not a Citizen | 65 (89.0%) | 8 (11.0%) |
Health Insurance Coverage by Household Income in Magazine
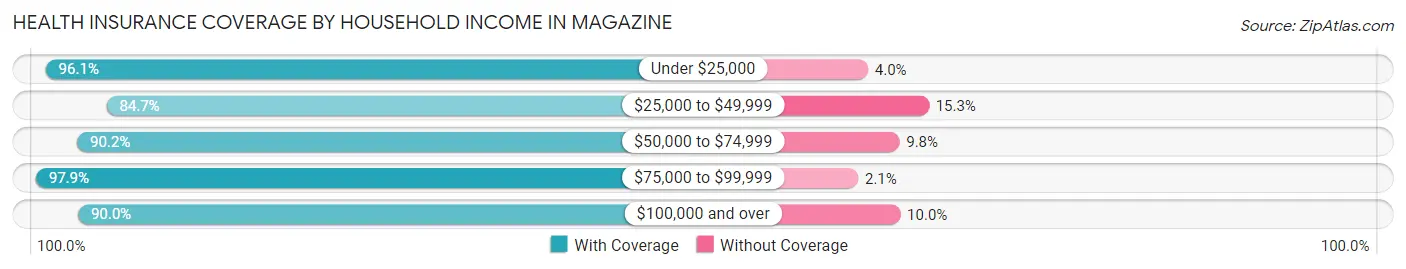
| Household Income | With Coverage | Without Coverage |
| Under $25,000 | 146 (96.1%) | 6 (4.0%) |
| $25,000 to $49,999 | 287 (84.7%) | 52 (15.3%) |
| $50,000 to $74,999 | 156 (90.2%) | 17 (9.8%) |
| $75,000 to $99,999 | 93 (97.9%) | 2 (2.1%) |
| $100,000 and over | 189 (90.0%) | 21 (10.0%) |
Public vs Private Health Insurance Coverage by Age in Magazine
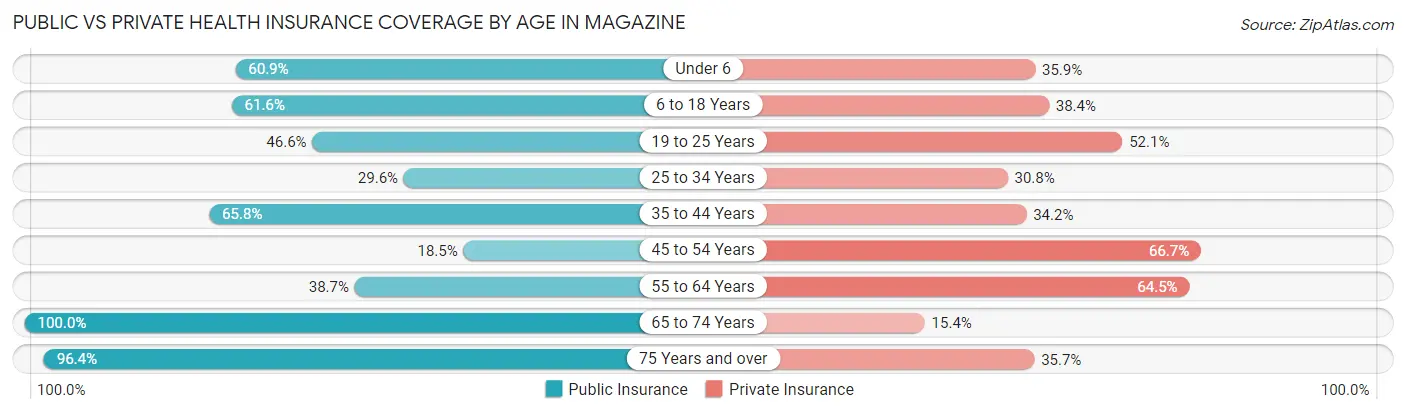
| Age Bracket | Public Insurance | Private Insurance |
| Under 6 | 56 (60.9%) | 33 (35.9%) |
| 6 to 18 Years | 117 (61.6%) | 73 (38.4%) |
| 19 to 25 Years | 34 (46.6%) | 38 (52.0%) |
| 25 to 34 Years | 50 (29.6%) | 52 (30.8%) |
| 35 to 44 Years | 98 (65.8%) | 51 (34.2%) |
| 45 to 54 Years | 20 (18.5%) | 72 (66.7%) |
| 55 to 64 Years | 36 (38.7%) | 60 (64.5%) |
| 65 to 74 Years | 39 (100.0%) | 6 (15.4%) |
| 75 Years and over | 54 (96.4%) | 20 (35.7%) |
| Total | 504 (52.0%) | 405 (41.8%) |
Disability Status by Sex by Age in Magazine
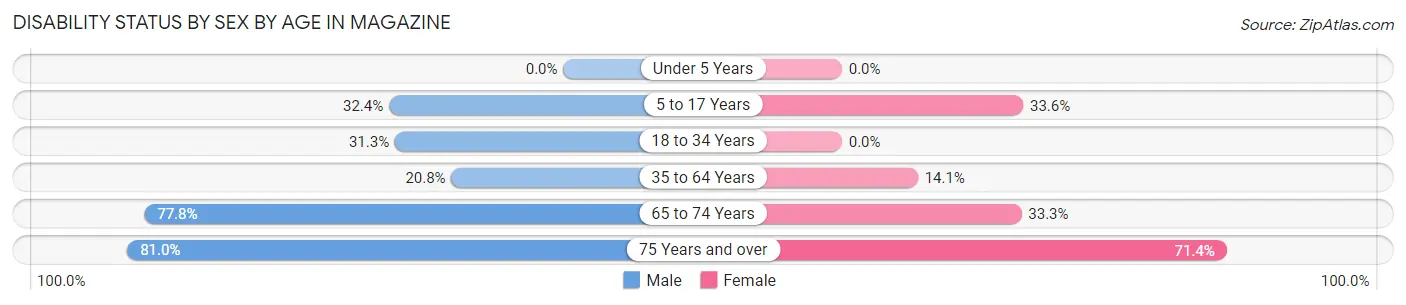
| Age Bracket | Male | Female |
| Under 5 Years | 0 (0.0%) | 0 (0.0%) |
| 5 to 17 Years | 33 (32.4%) | 37 (33.6%) |
| 18 to 34 Years | 40 (31.2%) | 0 (0.0%) |
| 35 to 64 Years | 27 (20.8%) | 31 (14.1%) |
| 65 to 74 Years | 14 (77.8%) | 7 (33.3%) |
| 75 Years and over | 17 (80.9%) | 25 (71.4%) |
Disability Class by Sex by Age in Magazine
Disability Class: Hearing Difficulty
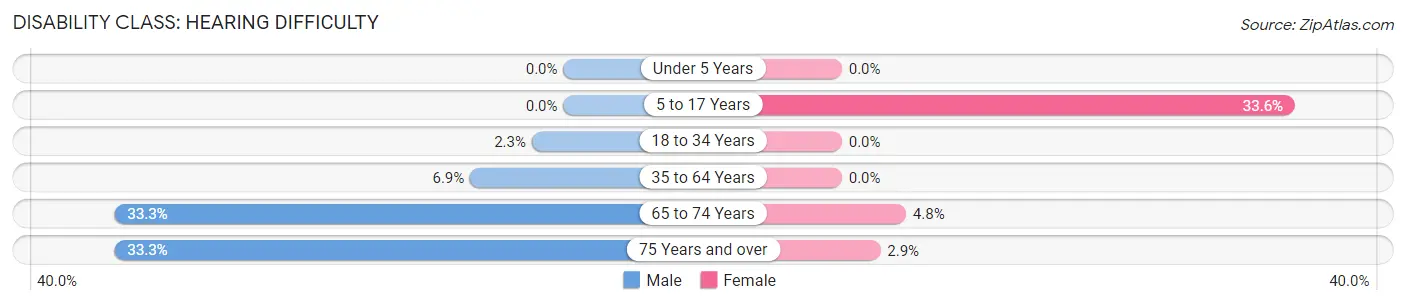
| Age Bracket | Male | Female |
| Under 5 Years | 0 (0.0%) | 0 (0.0%) |
| 5 to 17 Years | 0 (0.0%) | 37 (33.6%) |
| 18 to 34 Years | 3 (2.3%) | 0 (0.0%) |
| 35 to 64 Years | 9 (6.9%) | 0 (0.0%) |
| 65 to 74 Years | 6 (33.3%) | 1 (4.8%) |
| 75 Years and over | 7 (33.3%) | 1 (2.9%) |
Disability Class: Vision Difficulty
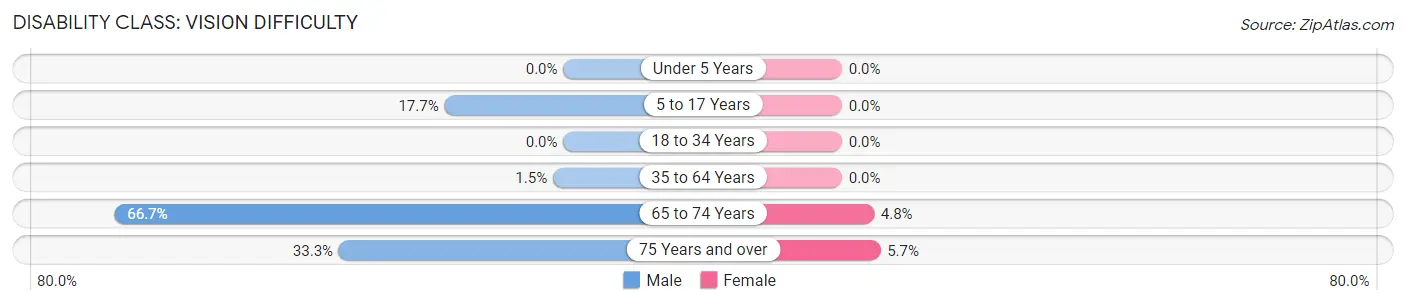
| Age Bracket | Male | Female |
| Under 5 Years | 0 (0.0%) | 0 (0.0%) |
| 5 to 17 Years | 18 (17.6%) | 0 (0.0%) |
| 18 to 34 Years | 0 (0.0%) | 0 (0.0%) |
| 35 to 64 Years | 2 (1.5%) | 0 (0.0%) |
| 65 to 74 Years | 12 (66.7%) | 1 (4.8%) |
| 75 Years and over | 7 (33.3%) | 2 (5.7%) |
Disability Class: Cognitive Difficulty
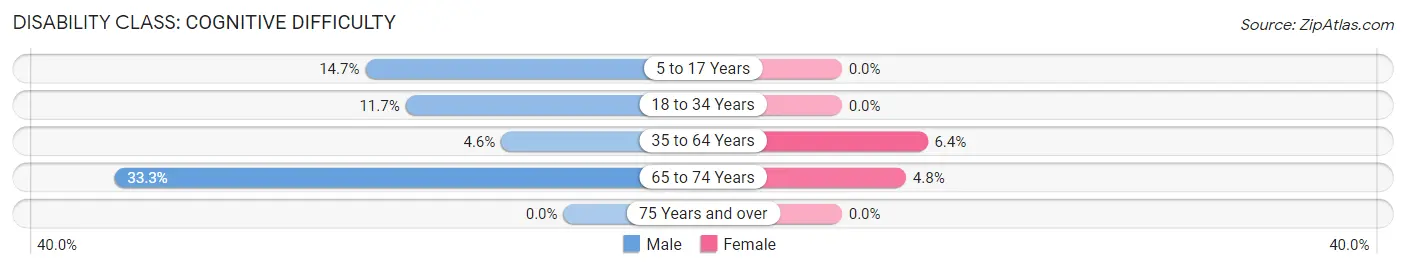
| Age Bracket | Male | Female |
| 5 to 17 Years | 15 (14.7%) | 0 (0.0%) |
| 18 to 34 Years | 15 (11.7%) | 0 (0.0%) |
| 35 to 64 Years | 6 (4.6%) | 14 (6.4%) |
| 65 to 74 Years | 6 (33.3%) | 1 (4.8%) |
| 75 Years and over | 0 (0.0%) | 0 (0.0%) |
Disability Class: Ambulatory Difficulty
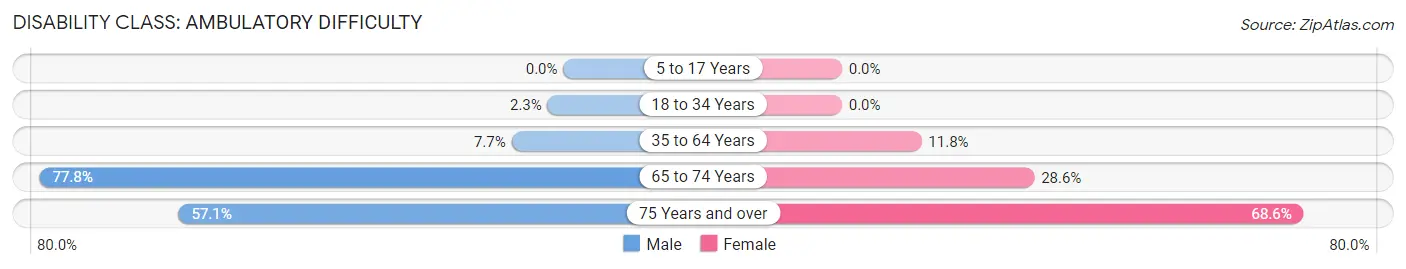
| Age Bracket | Male | Female |
| 5 to 17 Years | 0 (0.0%) | 0 (0.0%) |
| 18 to 34 Years | 3 (2.3%) | 0 (0.0%) |
| 35 to 64 Years | 10 (7.7%) | 26 (11.8%) |
| 65 to 74 Years | 14 (77.8%) | 6 (28.6%) |
| 75 Years and over | 12 (57.1%) | 24 (68.6%) |
Disability Class: Self-Care Difficulty
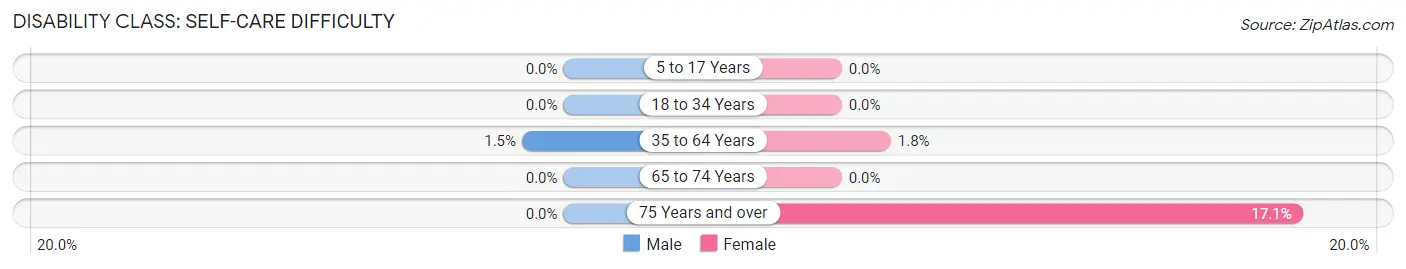
| Age Bracket | Male | Female |
| 5 to 17 Years | 0 (0.0%) | 0 (0.0%) |
| 18 to 34 Years | 0 (0.0%) | 0 (0.0%) |
| 35 to 64 Years | 2 (1.5%) | 4 (1.8%) |
| 65 to 74 Years | 0 (0.0%) | 0 (0.0%) |
| 75 Years and over | 0 (0.0%) | 6 (17.1%) |
Technology Access in Magazine
Computing Device Access in Magazine
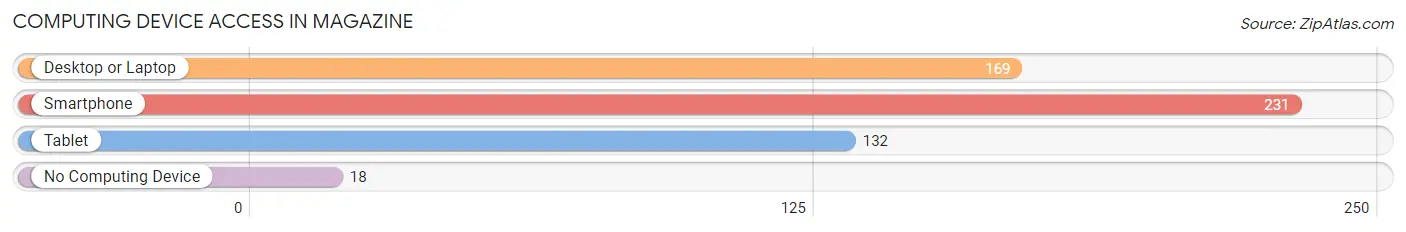
| Device Type | # Households | % Households |
| Desktop or Laptop | 169 | 61.2% |
| Smartphone | 231 | 83.7% |
| Tablet | 132 | 47.8% |
| No Computing Device | 18 | 6.5% |
| Total | 276 | 100.0% |
Internet Access in Magazine
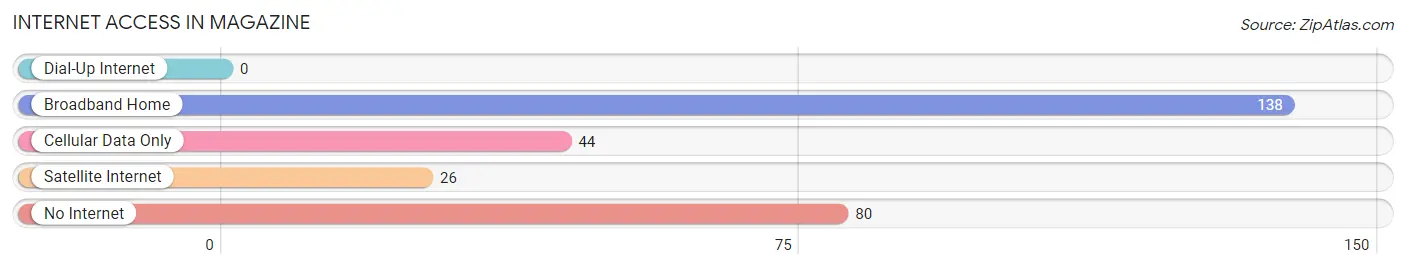
| Internet Type | # Households | % Households |
| Dial-Up Internet | 0 | 0.0% |
| Broadband Home | 138 | 50.0% |
| Cellular Data Only | 44 | 15.9% |
| Satellite Internet | 26 | 9.4% |
| No Internet | 80 | 29.0% |
| Total | 276 | 100.0% |
Magazine Summary
AR History
The history of Arkansas is a long and varied one, stretching back to the earliest days of the United States. The state was first explored by Spanish explorers in the 16th century, and was later claimed by France in the 18th century. The area was ceded to the United States in 1803 as part of the Louisiana Purchase. Arkansas was admitted to the Union in 1836 as the 25th state.
The early history of Arkansas was dominated by Native American tribes, including the Quapaw, Caddo, Osage, and Cherokee. These tribes were displaced by European settlers in the 19th century, and the state was divided into several territories. Arkansas was admitted to the Union in 1836 as the 25th state.
The Civil War had a major impact on Arkansas, as the state was divided between the Union and Confederate forces. The state was the site of several major battles, including the Battle of Pea Ridge and the Battle of Prairie Grove. After the war, Arkansas was readmitted to the Union in 1868.
In the late 19th century, Arkansas experienced a period of economic growth and development. The state was a major producer of cotton, timber, and other agricultural products. The state also experienced a period of industrialization, with the development of railroads, factories, and other infrastructure.
In the 20th century, Arkansas experienced a period of political and social change. The state was the site of the Little Rock Nine, a group of African-American students who were denied entry to a segregated school in 1957. The state also experienced a period of economic growth and development, with the development of the Arkansas River Valley and the growth of the tourism industry.
Geography
Arkansas is located in the south-central United States, bordered by Missouri to the north, Tennessee and Mississippi to the east, Louisiana to the south, and Texas and Oklahoma to the west. The state is divided into 75 counties and contains four distinct geographic regions: the Ozark Mountains in the northwest, the Ouachita Mountains in the west, the Arkansas Delta in the east, and the Arkansas Timberlands in the south.
The state is home to a variety of natural features, including the Ozark National Forest, the Ouachita National Forest, and Hot Springs National Park. Arkansas is also home to several major rivers, including the Arkansas River, the White River, and the Red River.
Economy
The economy of Arkansas is largely based on agriculture, forestry, and manufacturing. The state is a major producer of cotton, rice, soybeans, and other agricultural products. The state is also a major producer of timber, and is home to several large paper mills.
The state is also home to several major industries, including aerospace, automotive, and food processing. The state is also home to several major corporations, including Walmart, Tyson Foods, and J.B. Hunt.
Demographics
As of the 2010 census, the population of Arkansas was 2,915,918. The state is home to a diverse population, with the largest ethnic groups being White (76.2%), African American (15.4%), and Hispanic or Latino (6.3%).
The state is also home to a variety of religious groups, with the largest being Baptist (48.2%), Methodist (11.2%), and Catholic (7.2%). The state is also home to a variety of languages, with the most common being English (90.2%), Spanish (3.7%), and German (1.2%).
Common Questions
What is Per Capita Income in Magazine?
Per Capita income in Magazine is $19,482.
What is the Median Family Income in Magazine?
Median Family Income in Magazine is $47,167.
What is the Median Household income in Magazine?
Median Household Income in Magazine is $45,735.
What is Income or Wage Gap in Magazine?
Income or Wage Gap in Magazine is 30.9%.
Women in Magazine earn 69.1 cents for every dollar earned by a man.
What is Inequality or Gini Index in Magazine?
Inequality or Gini Index in Magazine is 0.40.
What is the Total Population of Magazine?
Total Population of Magazine is 969.
What is the Total Male Population of Magazine?
Total Male Population of Magazine is 436.
What is the Total Female Population of Magazine?
Total Female Population of Magazine is 533.
What is the Ratio of Males per 100 Females in Magazine?
There are 81.80 Males per 100 Females in Magazine.
What is the Ratio of Females per 100 Males in Magazine?
There are 122.25 Females per 100 Males in Magazine.
What is the Median Population Age in Magazine?
Median Population Age in Magazine is 32.6 Years.
What is the Average Family Size in Magazine
Average Family Size in Magazine is 4.2 People.
What is the Average Household Size in Magazine
Average Household Size in Magazine is 3.5 People.
How Large is the Labor Force in Magazine?
There are 411 People in the Labor Forcein in Magazine.
What is the Percentage of People in the Labor Force in Magazine?
57.8% of People are in the Labor Force in Magazine.
What is the Unemployment Rate in Magazine?
Unemployment Rate in Magazine is 5.4%.