Lavaca, AR Map & Demographics
Lavaca Map
Lavaca Overview
$31,598
PER CAPITA INCOME
$93,427
AVG FAMILY INCOME
$87,500
AVG HOUSEHOLD INCOME
47.3%
WAGE / INCOME GAP [ % ]
52.7¢/ $1
WAGE / INCOME GAP [ $ ]
0.31
INEQUALITY / GINI INDEX
2,467
TOTAL POPULATION
1,105
MALE POPULATION
1,362
FEMALE POPULATION
81.13
MALES / 100 FEMALES
123.26
FEMALES / 100 MALES
31.4
MEDIAN AGE
3.2
AVG FAMILY SIZE
2.9
AVG HOUSEHOLD SIZE
1,407
LABOR FORCE [ PEOPLE ]
75.6%
PERCENT IN LABOR FORCE
1.9%
UNEMPLOYMENT RATE
Lavaca Zip Codes
Lavaca Area Codes
Income in Lavaca
Income Overview in Lavaca
Per Capita Income in Lavaca is $31,598, while median incomes of families and households are $93,427 and $87,500 respectively.
| Characteristic | Number | Measure |
| Per Capita Income | 2,467 | $31,598 |
| Median Family Income | 711 | $93,427 |
| Mean Family Income | 711 | $99,674 |
| Median Household Income | 842 | $87,500 |
| Mean Household Income | 842 | $91,620 |
| Income Deficit | 711 | $0 |
| Wage / Income Gap (%) | 2,467 | 47.34% |
| Wage / Income Gap ($) | 2,467 | 52.66¢ per $1 |
| Gini / Inequality Index | 2,467 | 0.31 |
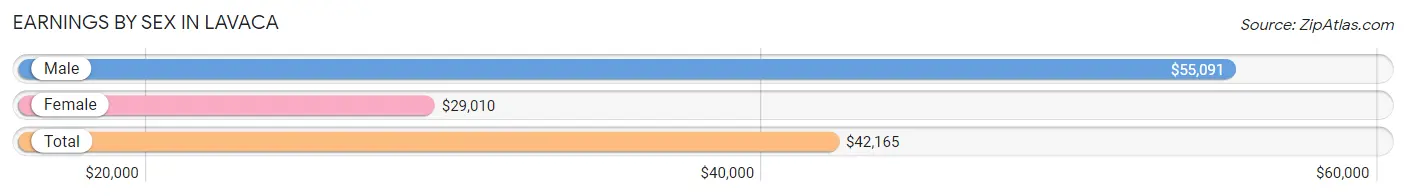
Earnings by Sex in Lavaca
Average Earnings in Lavaca are $42,165, $55,091 for men and $29,010 for women, a difference of 47.3%.
| Sex | Number | Average Earnings |
| Male | 656 (45.9%) | $55,091 |
| Female | 772 (54.1%) | $29,010 |
| Total | 1,428 (100.0%) | $42,165 |
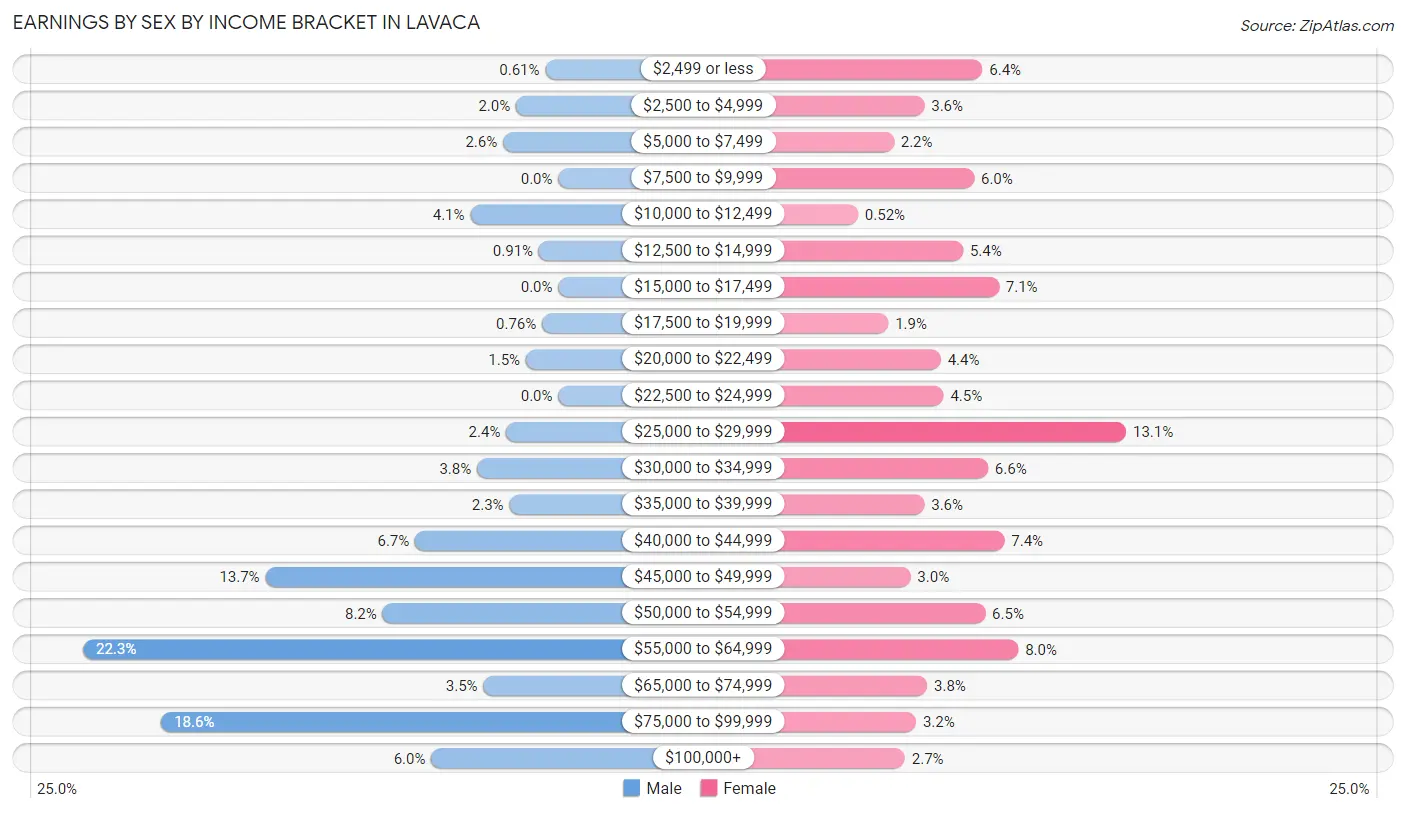
Earnings by Sex by Income Bracket in Lavaca
The most common earnings brackets in Lavaca are $55,000 to $64,999 for men (146 | 22.3%) and $25,000 to $29,999 for women (101 | 13.1%).
| Income | Male | Female |
| $2,499 or less | 4 (0.6%) | 49 (6.4%) |
| $2,500 to $4,999 | 13 (2.0%) | 28 (3.6%) |
| $5,000 to $7,499 | 17 (2.6%) | 17 (2.2%) |
| $7,500 to $9,999 | 0 (0.0%) | 46 (6.0%) |
| $10,000 to $12,499 | 27 (4.1%) | 4 (0.5%) |
| $12,500 to $14,999 | 6 (0.9%) | 42 (5.4%) |
| $15,000 to $17,499 | 0 (0.0%) | 55 (7.1%) |
| $17,500 to $19,999 | 5 (0.8%) | 15 (1.9%) |
| $20,000 to $22,499 | 10 (1.5%) | 34 (4.4%) |
| $22,500 to $24,999 | 0 (0.0%) | 35 (4.5%) |
| $25,000 to $29,999 | 16 (2.4%) | 101 (13.1%) |
| $30,000 to $34,999 | 25 (3.8%) | 51 (6.6%) |
| $35,000 to $39,999 | 15 (2.3%) | 28 (3.6%) |
| $40,000 to $44,999 | 44 (6.7%) | 57 (7.4%) |
| $45,000 to $49,999 | 90 (13.7%) | 23 (3.0%) |
| $50,000 to $54,999 | 54 (8.2%) | 50 (6.5%) |
| $55,000 to $64,999 | 146 (22.3%) | 62 (8.0%) |
| $65,000 to $74,999 | 23 (3.5%) | 29 (3.8%) |
| $75,000 to $99,999 | 122 (18.6%) | 25 (3.2%) |
| $100,000+ | 39 (5.9%) | 21 (2.7%) |
| Total | 656 (100.0%) | 772 (100.0%) |
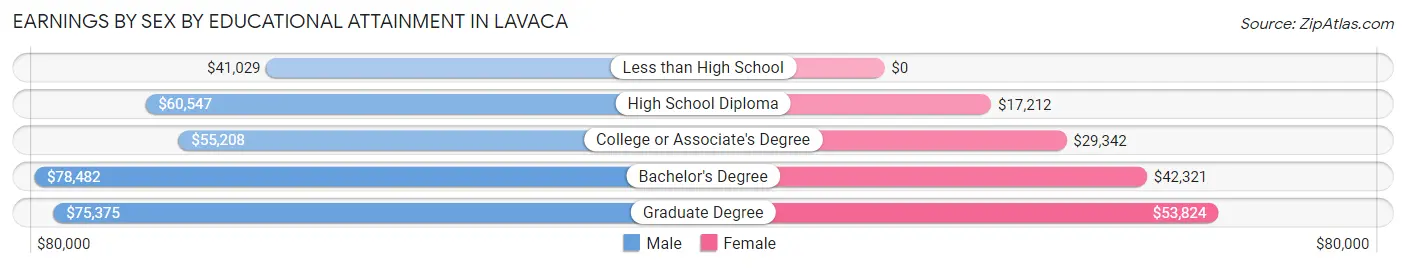
Earnings by Sex by Educational Attainment in Lavaca
Average earnings in Lavaca are $56,568 for men and $36,118 for women, a difference of 36.1%. Men with an educational attainment of bachelor's degree enjoy the highest average annual earnings of $78,482, while those with less than high school education earn the least with $41,029. Women with an educational attainment of graduate degree earn the most with the average annual earnings of $53,824, while those with high school diploma education have the smallest earnings of $17,212.
| Educational Attainment | Male Income | Female Income |
| Less than High School | $41,029 | $0 |
| High School Diploma | $60,547 | $17,212 |
| College or Associate's Degree | $55,208 | $29,342 |
| Bachelor's Degree | $78,482 | $42,321 |
| Graduate Degree | $75,375 | $53,824 |
| Total | $56,568 | $36,118 |
Family Income in Lavaca
Family Income Brackets in Lavaca
According to the Lavaca family income data, there are 237 families falling into the $100,000 to $149,999 income range, which is the most common income bracket and makes up 33.3% of all families. Conversely, the $15,000 to $24,999 income bracket is the least frequent group with only 10 families (1.4%) belonging to this category.
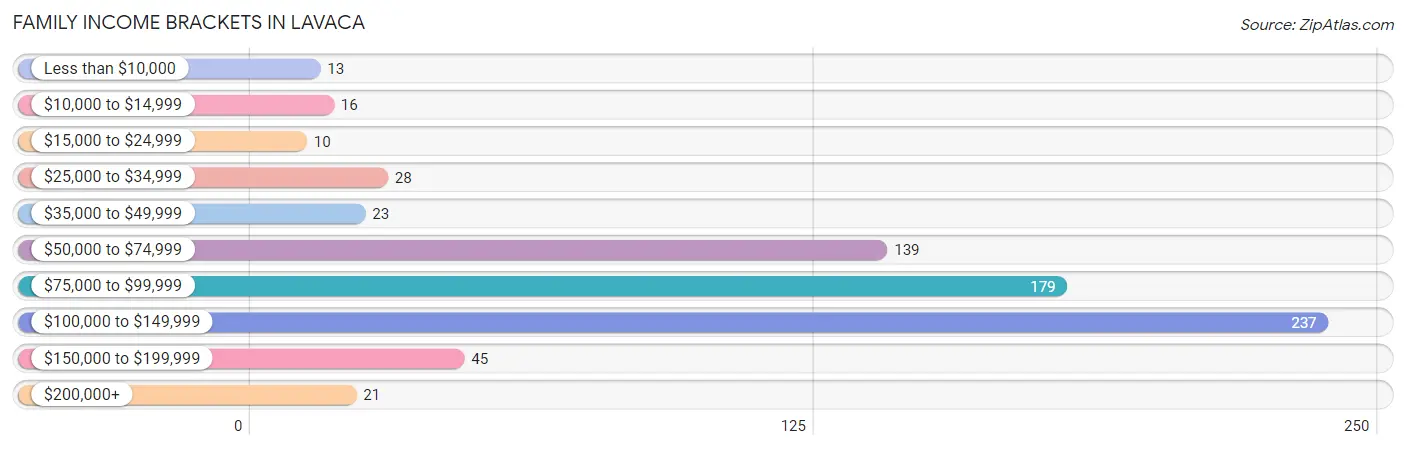
| Income Bracket | # Families | % Families |
| Less than $10,000 | 13 | 1.8% |
| $10,000 to $14,999 | 16 | 2.3% |
| $15,000 to $24,999 | 10 | 1.4% |
| $25,000 to $34,999 | 28 | 3.9% |
| $35,000 to $49,999 | 23 | 3.2% |
| $50,000 to $74,999 | 139 | 19.5% |
| $75,000 to $99,999 | 179 | 25.2% |
| $100,000 to $149,999 | 237 | 33.3% |
| $150,000 to $199,999 | 45 | 6.3% |
| $200,000+ | 21 | 3.0% |
Family Income by Famaliy Size in Lavaca
5-person families (82 | 11.5%) account for the highest median family income in Lavaca with $115,800 per family, while 2-person families (287 | 40.4%) have the highest median income of $47,062 per family member.
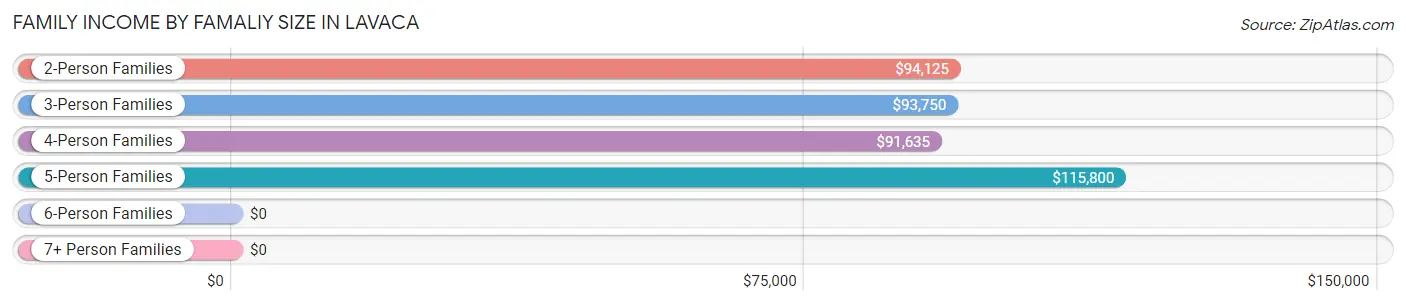
| Income Bracket | # Families | Median Income |
| 2-Person Families | 287 (40.4%) | $94,125 |
| 3-Person Families | 257 (36.1%) | $93,750 |
| 4-Person Families | 61 (8.6%) | $91,635 |
| 5-Person Families | 82 (11.5%) | $115,800 |
| 6-Person Families | 14 (2.0%) | $0 |
| 7+ Person Families | 10 (1.4%) | $0 |
| Total | 711 (100.0%) | $93,427 |
Family Income by Number of Earners in Lavaca
The median family income in Lavaca is $93,427, with families comprising 3+ earners (41) having the highest median family income of $107,250, while families with no earners (53) have the lowest median family income of $37,083, accounting for 5.8% and 7.4% of families, respectively.
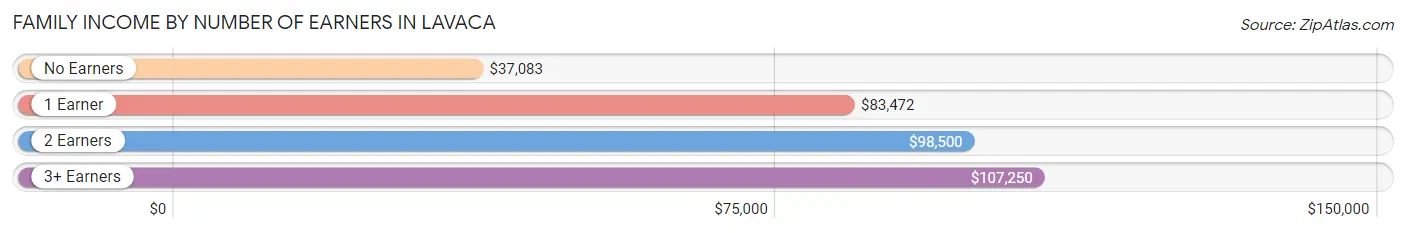
| Number of Earners | # Families | Median Income |
| No Earners | 53 (7.4%) | $37,083 |
| 1 Earner | 137 (19.3%) | $83,472 |
| 2 Earners | 480 (67.5%) | $98,500 |
| 3+ Earners | 41 (5.8%) | $107,250 |
| Total | 711 (100.0%) | $93,427 |
Household Income in Lavaca
Household Income Brackets in Lavaca
With 237 households falling in the category, the $100,000 to $149,999 income range is the most frequent in Lavaca, accounting for 28.1% of all households. In contrast, only 17 households (2.0%) fall into the less than $10,000 income bracket, making it the least populous group.
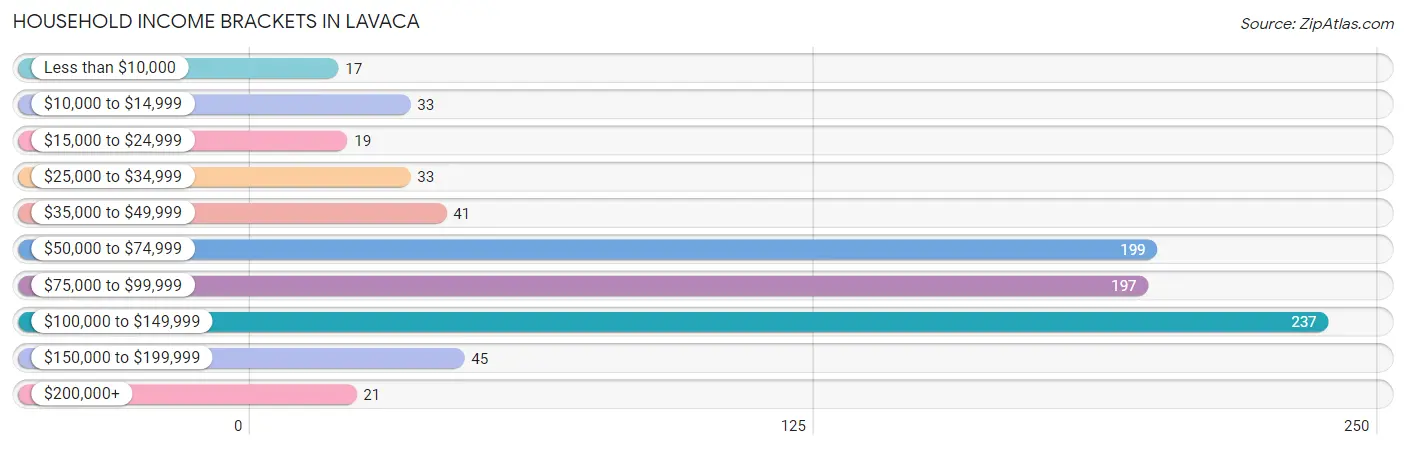
| Income Bracket | # Households | % Households |
| Less than $10,000 | 17 | 2.0% |
| $10,000 to $14,999 | 33 | 3.9% |
| $15,000 to $24,999 | 19 | 2.3% |
| $25,000 to $34,999 | 33 | 3.9% |
| $35,000 to $49,999 | 41 | 4.9% |
| $50,000 to $74,999 | 199 | 23.6% |
| $75,000 to $99,999 | 197 | 23.4% |
| $100,000 to $149,999 | 237 | 28.1% |
| $150,000 to $199,999 | 45 | 5.3% |
| $200,000+ | 21 | 2.5% |
Household Income by Householder Age in Lavaca
The median household income in Lavaca is $87,500, with the highest median household income of $94,615 found in the 25 to 44 years age bracket for the primary householder. A total of 342 households (40.6%) fall into this category. Meanwhile, the 65+ years age bracket for the primary householder has the lowest median household income of $58,417, with 137 households (16.3%) in this group.
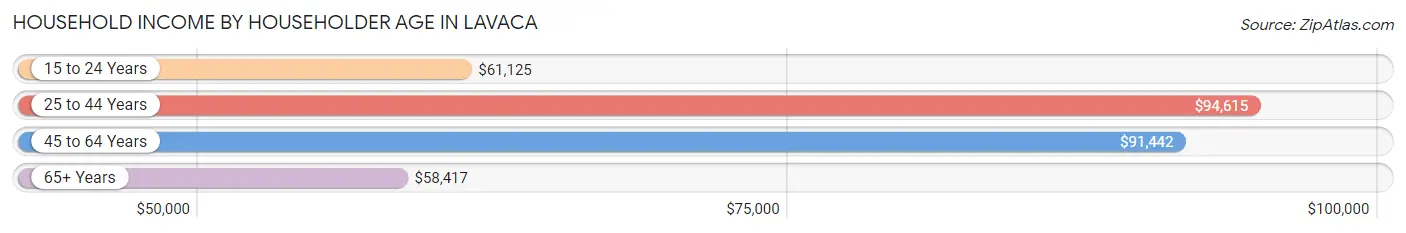
| Income Bracket | # Households | Median Income |
| 15 to 24 Years | 70 (8.3%) | $61,125 |
| 25 to 44 Years | 342 (40.6%) | $94,615 |
| 45 to 64 Years | 293 (34.8%) | $91,442 |
| 65+ Years | 137 (16.3%) | $58,417 |
| Total | 842 (100.0%) | $87,500 |
Poverty in Lavaca
Income Below Poverty by Sex and Age in Lavaca
With 9.8% poverty level for males and 6.2% for females among the residents of Lavaca, 18 to 24 year old males and 55 to 64 year old females are the most vulnerable to poverty, with 53 males (44.9%) and 21 females (15.0%) in their respective age groups living below the poverty level.
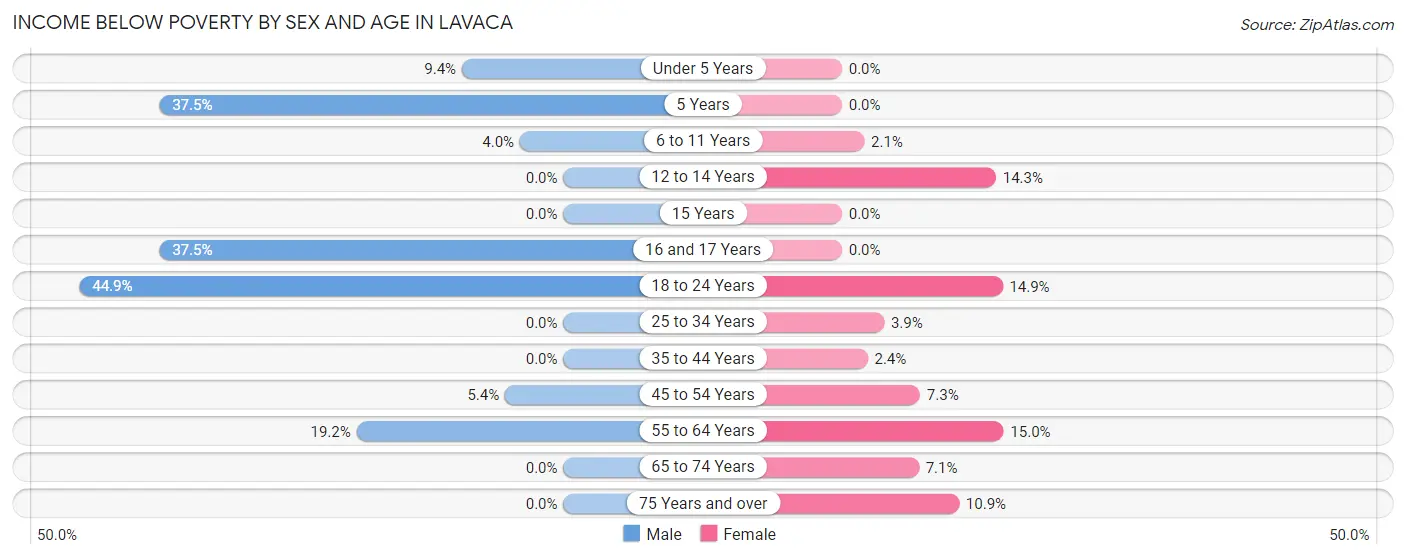
| Age Bracket | Male | Female |
| Under 5 Years | 8 (9.4%) | 0 (0.0%) |
| 5 Years | 6 (37.5%) | 0 (0.0%) |
| 6 to 11 Years | 6 (4.0%) | 3 (2.1%) |
| 12 to 14 Years | 0 (0.0%) | 4 (14.3%) |
| 15 Years | 0 (0.0%) | 0 (0.0%) |
| 16 and 17 Years | 6 (37.5%) | 0 (0.0%) |
| 18 to 24 Years | 53 (44.9%) | 24 (14.9%) |
| 25 to 34 Years | 0 (0.0%) | 7 (3.9%) |
| 35 to 44 Years | 0 (0.0%) | 5 (2.4%) |
| 45 to 54 Years | 10 (5.4%) | 10 (7.2%) |
| 55 to 64 Years | 19 (19.2%) | 21 (15.0%) |
| 65 to 74 Years | 0 (0.0%) | 5 (7.1%) |
| 75 Years and over | 0 (0.0%) | 5 (10.9%) |
| Total | 108 (9.8%) | 84 (6.2%) |
Income Above Poverty by Sex and Age in Lavaca
According to the poverty statistics in Lavaca, males aged 12 to 14 years and females aged under 5 years are the age groups that are most secure financially, with 100.0% of males and 100.0% of females in these age groups living above the poverty line.
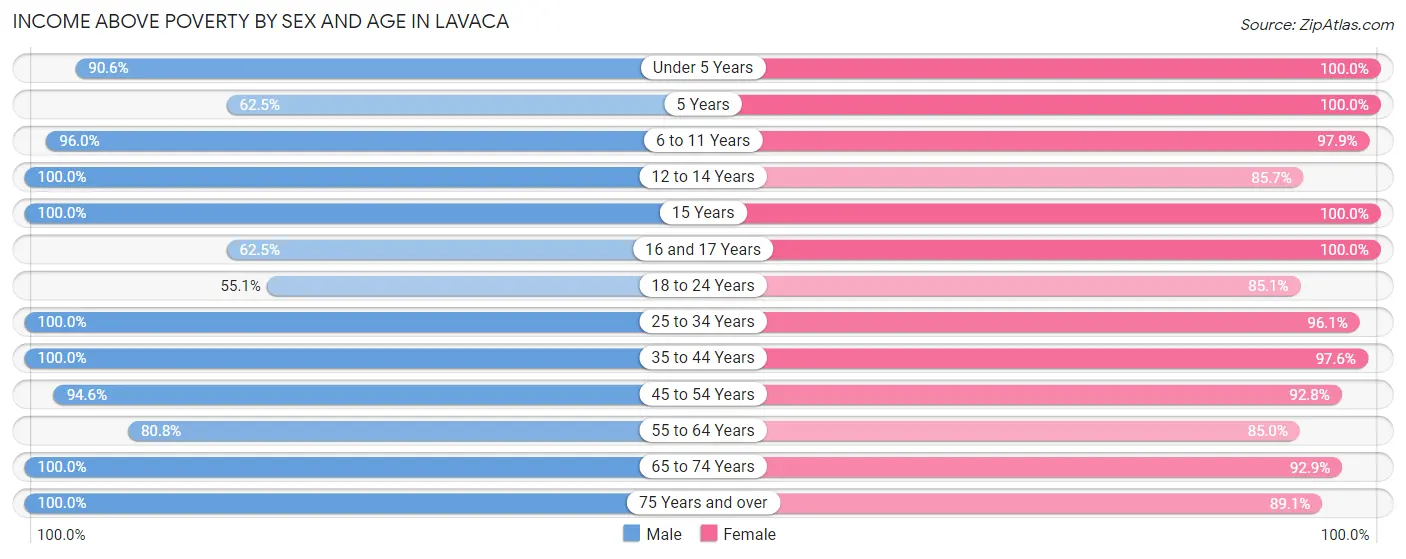
| Age Bracket | Male | Female |
| Under 5 Years | 77 (90.6%) | 100 (100.0%) |
| 5 Years | 10 (62.5%) | 16 (100.0%) |
| 6 to 11 Years | 143 (96.0%) | 142 (97.9%) |
| 12 to 14 Years | 22 (100.0%) | 24 (85.7%) |
| 15 Years | 9 (100.0%) | 36 (100.0%) |
| 16 and 17 Years | 10 (62.5%) | 94 (100.0%) |
| 18 to 24 Years | 65 (55.1%) | 137 (85.1%) |
| 25 to 34 Years | 161 (100.0%) | 172 (96.1%) |
| 35 to 44 Years | 147 (100.0%) | 204 (97.6%) |
| 45 to 54 Years | 175 (94.6%) | 128 (92.7%) |
| 55 to 64 Years | 80 (80.8%) | 119 (85.0%) |
| 65 to 74 Years | 74 (100.0%) | 65 (92.9%) |
| 75 Years and over | 24 (100.0%) | 41 (89.1%) |
| Total | 997 (90.2%) | 1,278 (93.8%) |
Income Below Poverty Among Married-Couple Families in Lavaca
The poverty statistics for married-couple families in Lavaca show that 5.5% or 34 of the total 621 families live below the poverty line. Families with no children have the highest poverty rate of 7.3%, comprising of 21 families. On the other hand, families with 3 or 4 children have the lowest poverty rate of 0.0%, which includes 0 families.
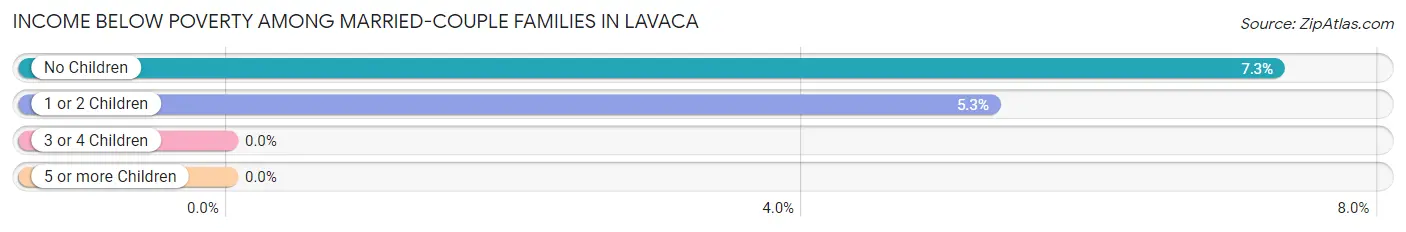
| Children | Above Poverty | Below Poverty |
| No Children | 267 (92.7%) | 21 (7.3%) |
| 1 or 2 Children | 232 (94.7%) | 13 (5.3%) |
| 3 or 4 Children | 78 (100.0%) | 0 (0.0%) |
| 5 or more Children | 10 (100.0%) | 0 (0.0%) |
| Total | 587 (94.5%) | 34 (5.5%) |
Income Below Poverty Among Single-Parent Households in Lavaca
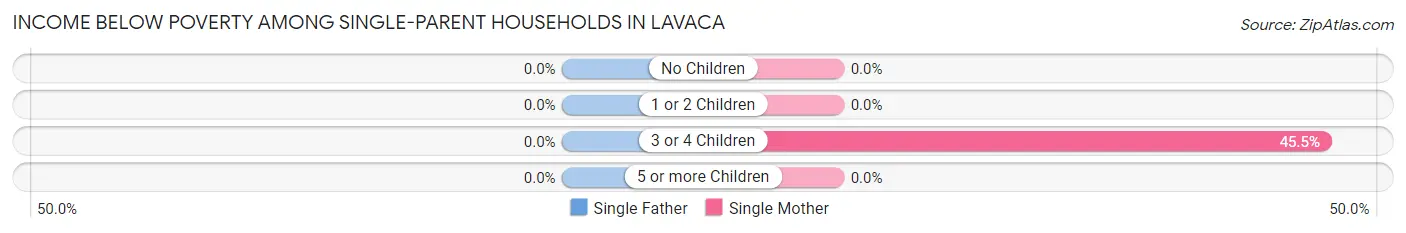
| Children | Single Father | Single Mother |
| No Children | 0 (0.0%) | 0 (0.0%) |
| 1 or 2 Children | 0 (0.0%) | 0 (0.0%) |
| 3 or 4 Children | 0 (0.0%) | 5 (45.5%) |
| 5 or more Children | 0 (0.0%) | 0 (0.0%) |
| Total | 0 (0.0%) | 5 (8.1%) |
Income Below Poverty Among Married-Couple vs Single-Parent Households in Lavaca
The poverty data for Lavaca shows that 34 of the married-couple family households (5.5%) and 5 of the single-parent households (5.6%) are living below the poverty level. Within the married-couple family households, those with no children have the highest poverty rate, with 21 households (7.3%) falling below the poverty line. Among the single-parent households, those with 3 or 4 children have the highest poverty rate, with 5 household (45.5%) living below poverty.
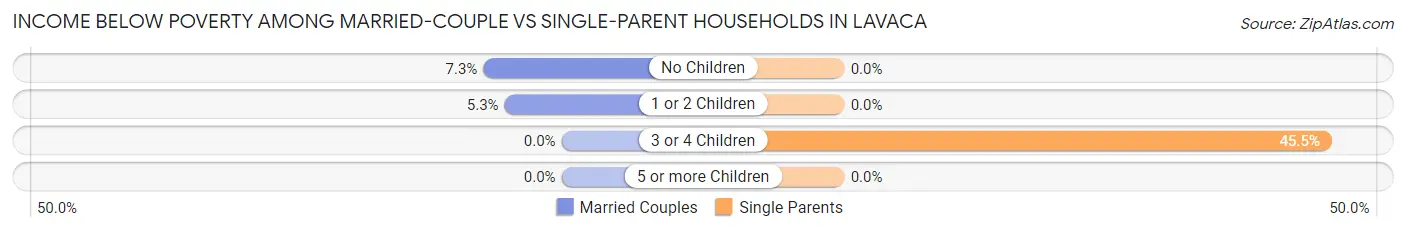
| Children | Married-Couple Families | Single-Parent Households |
| No Children | 21 (7.3%) | 0 (0.0%) |
| 1 or 2 Children | 13 (5.3%) | 0 (0.0%) |
| 3 or 4 Children | 0 (0.0%) | 5 (45.5%) |
| 5 or more Children | 0 (0.0%) | 0 (0.0%) |
| Total | 34 (5.5%) | 5 (5.6%) |
Race in Lavaca
The most populous races in Lavaca are White / Caucasian (2,239 | 90.8%), Two or more Races (206 | 8.4%), and Hispanic or Latino (86 | 3.5%).
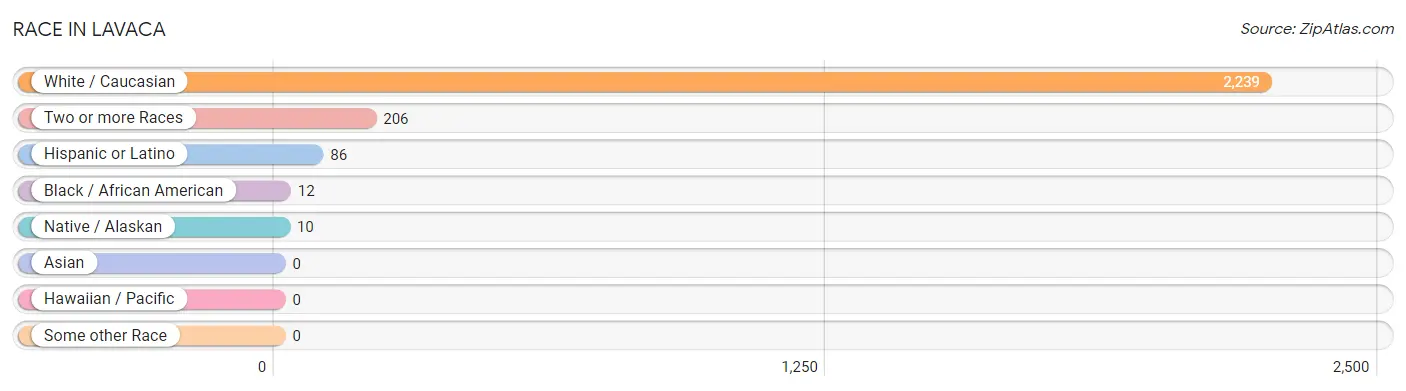
| Race | # Population | % Population |
| Asian | 0 | 0.0% |
| Black / African American | 12 | 0.5% |
| Hawaiian / Pacific | 0 | 0.0% |
| Hispanic or Latino | 86 | 3.5% |
| Native / Alaskan | 10 | 0.4% |
| White / Caucasian | 2,239 | 90.8% |
| Two or more Races | 206 | 8.4% |
| Some other Race | 0 | 0.0% |
| Total | 2,467 | 100.0% |
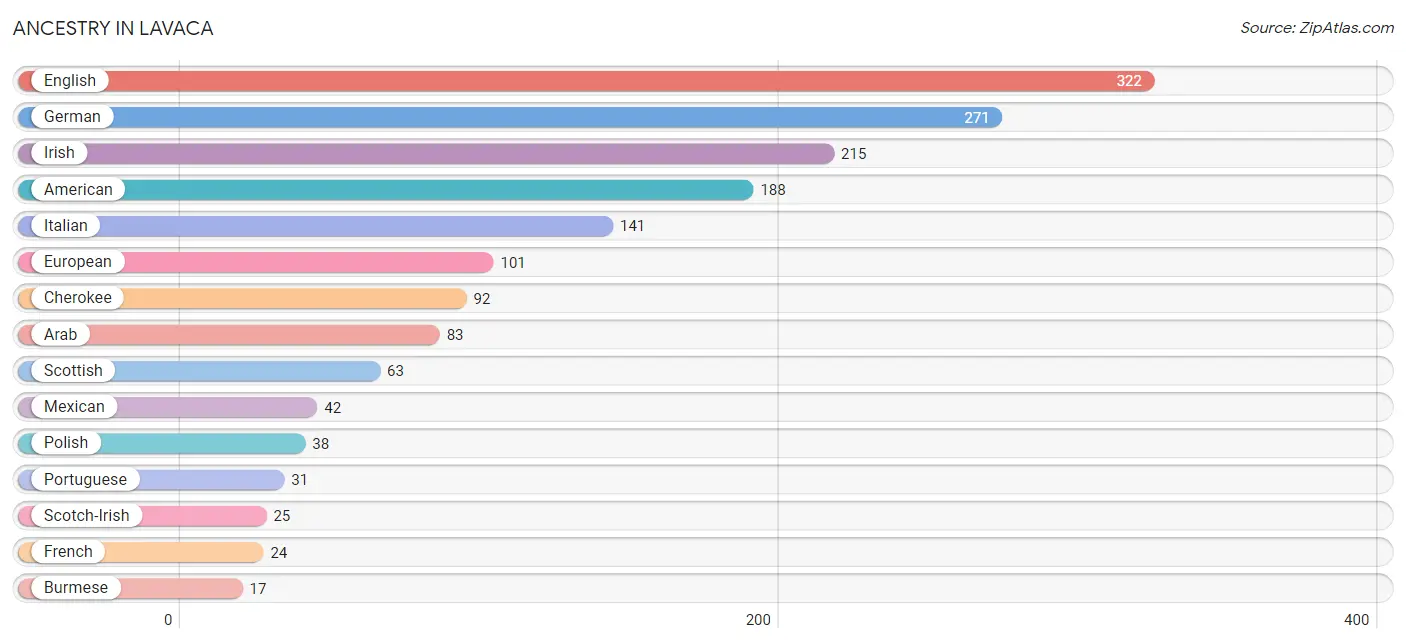
Ancestry in Lavaca
The most populous ancestries reported in Lavaca are English (322 | 13.1%), German (271 | 11.0%), Irish (215 | 8.7%), American (188 | 7.6%), and Italian (141 | 5.7%), together accounting for 46.1% of all Lavaca residents.
| Ancestry | # Population | % Population |
| American | 188 | 7.6% |
| Apache | 10 | 0.4% |
| Arab | 83 | 3.4% |
| Austrian | 7 | 0.3% |
| Bhutanese | 13 | 0.5% |
| British | 16 | 0.6% |
| Burmese | 17 | 0.7% |
| Cherokee | 92 | 3.7% |
| Choctaw | 6 | 0.2% |
| Creek | 6 | 0.2% |
| Dutch | 6 | 0.2% |
| Dutch West Indian | 3 | 0.1% |
| English | 322 | 13.1% |
| European | 101 | 4.1% |
| French | 24 | 1.0% |
| French Canadian | 3 | 0.1% |
| German | 271 | 11.0% |
| Irish | 215 | 8.7% |
| Italian | 141 | 5.7% |
| Mexican | 42 | 1.7% |
| Navajo | 10 | 0.4% |
| Norwegian | 7 | 0.3% |
| Peruvian | 9 | 0.4% |
| Polish | 38 | 1.5% |
| Portuguese | 31 | 1.3% |
| Puerto Rican | 10 | 0.4% |
| Scandinavian | 6 | 0.2% |
| Scotch-Irish | 25 | 1.0% |
| Scottish | 63 | 2.5% |
| Seminole | 13 | 0.5% |
| South American | 9 | 0.4% |
| Spanish | 10 | 0.4% |
| Sri Lankan | 3 | 0.1% |
| Welsh | 4 | 0.2% | View All 34 Rows |
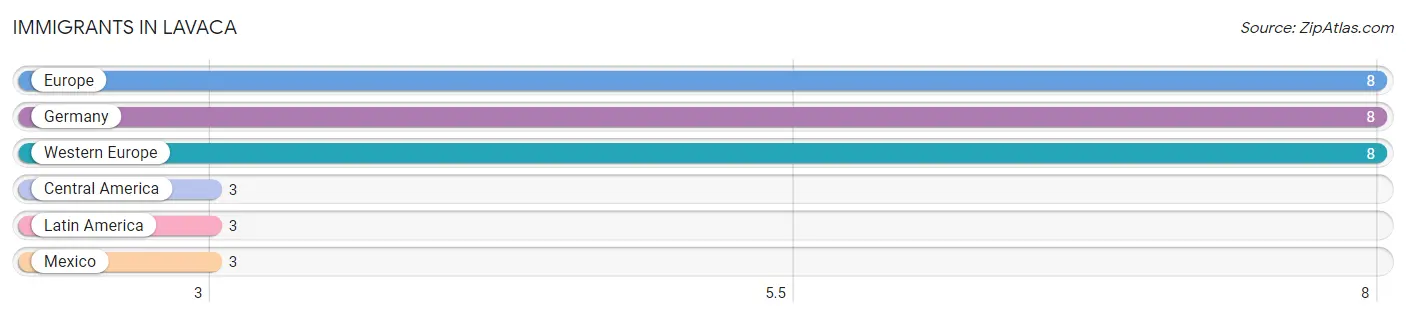
Immigrants in Lavaca
The most numerous immigrant groups reported in Lavaca came from Europe (8 | 0.3%), Germany (8 | 0.3%), Western Europe (8 | 0.3%), Central America (3 | 0.1%), and Latin America (3 | 0.1%), together accounting for 1.2% of all Lavaca residents.
| Immigration Origin | # Population | % Population |
| Central America | 3 | 0.1% |
| Europe | 8 | 0.3% |
| Germany | 8 | 0.3% |
| Latin America | 3 | 0.1% |
| Mexico | 3 | 0.1% |
| Western Europe | 8 | 0.3% | View All 6 Rows |
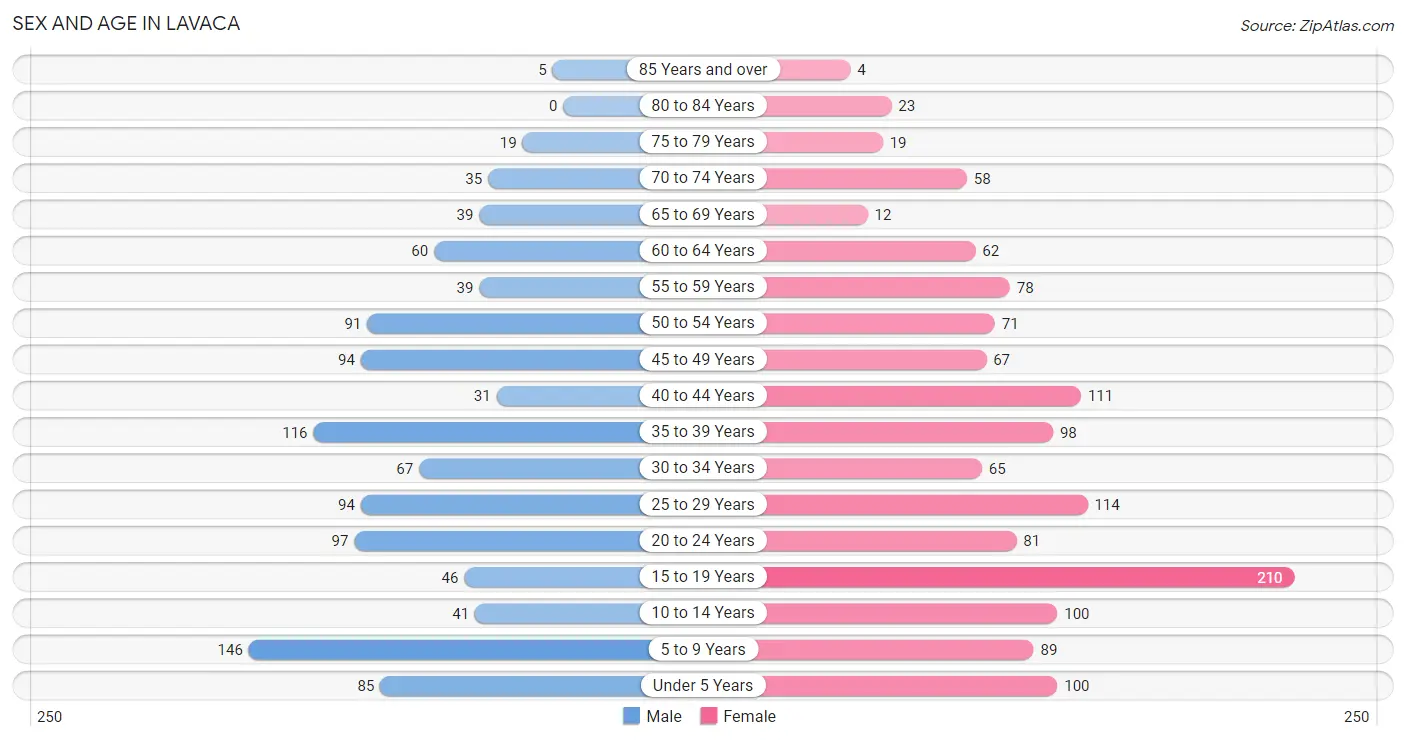
Sex and Age in Lavaca
Sex and Age in Lavaca
The most populous age groups in Lavaca are 5 to 9 Years (146 | 13.2%) for men and 15 to 19 Years (210 | 15.4%) for women.
| Age Bracket | Male | Female |
| Under 5 Years | 85 (7.7%) | 100 (7.3%) |
| 5 to 9 Years | 146 (13.2%) | 89 (6.5%) |
| 10 to 14 Years | 41 (3.7%) | 100 (7.3%) |
| 15 to 19 Years | 46 (4.2%) | 210 (15.4%) |
| 20 to 24 Years | 97 (8.8%) | 81 (5.9%) |
| 25 to 29 Years | 94 (8.5%) | 114 (8.4%) |
| 30 to 34 Years | 67 (6.1%) | 65 (4.8%) |
| 35 to 39 Years | 116 (10.5%) | 98 (7.2%) |
| 40 to 44 Years | 31 (2.8%) | 111 (8.2%) |
| 45 to 49 Years | 94 (8.5%) | 67 (4.9%) |
| 50 to 54 Years | 91 (8.2%) | 71 (5.2%) |
| 55 to 59 Years | 39 (3.5%) | 78 (5.7%) |
| 60 to 64 Years | 60 (5.4%) | 62 (4.5%) |
| 65 to 69 Years | 39 (3.5%) | 12 (0.9%) |
| 70 to 74 Years | 35 (3.2%) | 58 (4.3%) |
| 75 to 79 Years | 19 (1.7%) | 19 (1.4%) |
| 80 to 84 Years | 0 (0.0%) | 23 (1.7%) |
| 85 Years and over | 5 (0.4%) | 4 (0.3%) |
| Total | 1,105 (100.0%) | 1,362 (100.0%) |
Families and Households in Lavaca
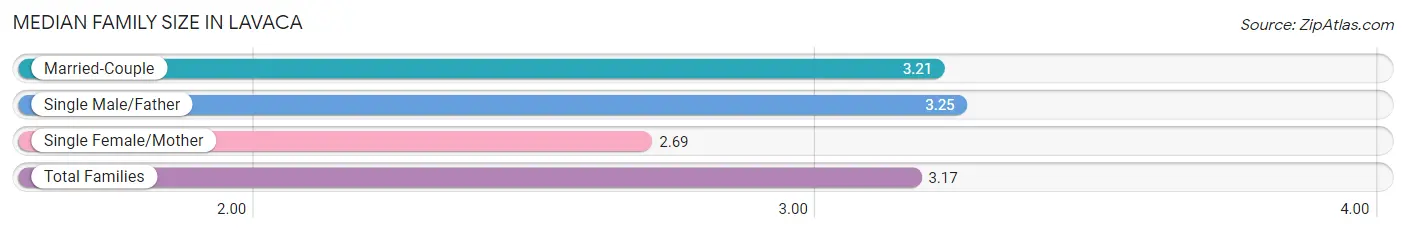
Median Family Size in Lavaca
The median family size in Lavaca is 3.17 persons per family, with single male/father families (28 | 3.9%) accounting for the largest median family size of 3.25 persons per family. On the other hand, single female/mother families (62 | 8.7%) represent the smallest median family size with 2.69 persons per family.
| Family Type | # Families | Family Size |
| Married-Couple | 621 (87.3%) | 3.21 |
| Single Male/Father | 28 (3.9%) | 3.25 |
| Single Female/Mother | 62 (8.7%) | 2.69 |
| Total Families | 711 (100.0%) | 3.17 |
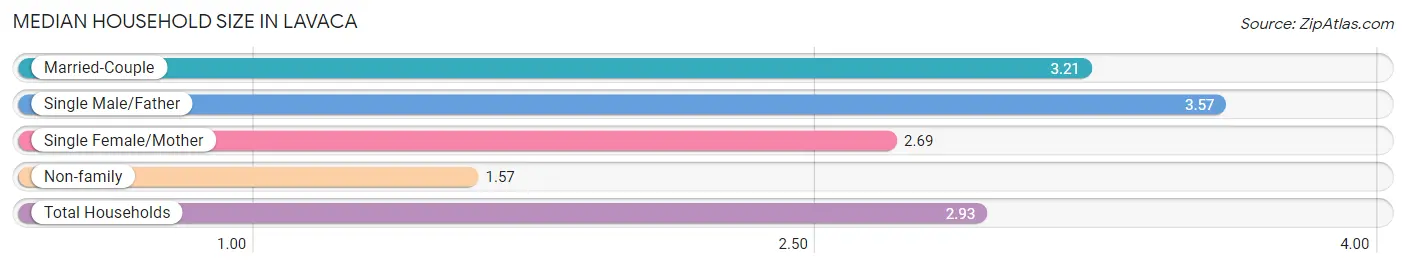
Median Household Size in Lavaca
The median household size in Lavaca is 2.93 persons per household, with single male/father households (28 | 3.3%) accounting for the largest median household size of 3.57 persons per household. non-family households (131 | 15.6%) represent the smallest median household size with 1.57 persons per household.
| Household Type | # Households | Household Size |
| Married-Couple | 621 (73.8%) | 3.21 |
| Single Male/Father | 28 (3.3%) | 3.57 |
| Single Female/Mother | 62 (7.4%) | 2.69 |
| Non-family | 131 (15.6%) | 1.57 |
| Total Households | 842 (100.0%) | 2.93 |
Household Size by Marriage Status in Lavaca
Out of a total of 842 households in Lavaca, 711 (84.4%) are family households, while 131 (15.6%) are nonfamily households. The most numerous type of family households are 2-person households, comprising 287, and the most common type of nonfamily households are 1-person households, comprising 92.
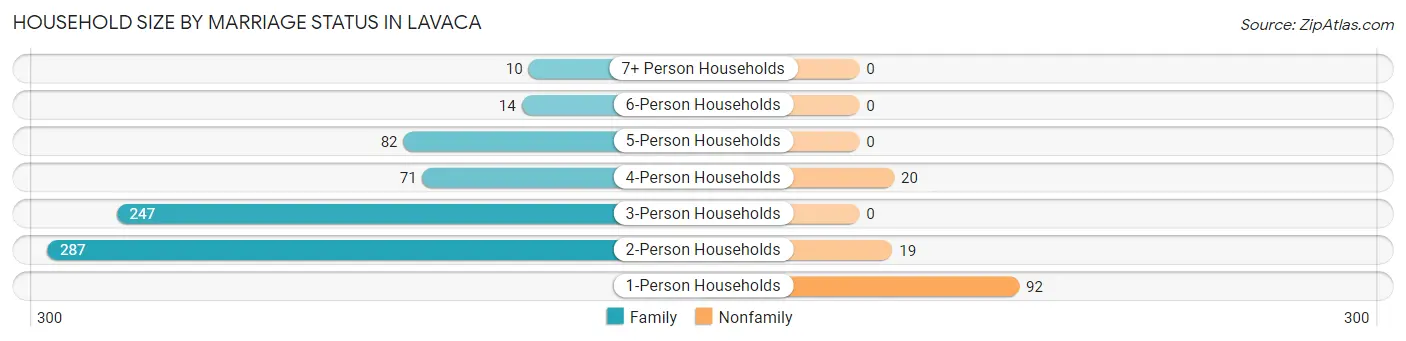
| Household Size | Family Households | Nonfamily Households |
| 1-Person Households | - | 92 (10.9%) |
| 2-Person Households | 287 (34.1%) | 19 (2.3%) |
| 3-Person Households | 247 (29.3%) | 0 (0.0%) |
| 4-Person Households | 71 (8.4%) | 20 (2.4%) |
| 5-Person Households | 82 (9.7%) | 0 (0.0%) |
| 6-Person Households | 14 (1.7%) | 0 (0.0%) |
| 7+ Person Households | 10 (1.2%) | 0 (0.0%) |
| Total | 711 (84.4%) | 131 (15.6%) |
Female Fertility in Lavaca
Fertility by Age in Lavaca
Average fertility rate in Lavaca is 35.0 births per 1,000 women. Women in the age bracket of 20 to 34 years have the highest fertility rate with 85.0 births per 1,000 women. Women in the age bracket of 20 to 34 years acount for 81.5% of all women with births.
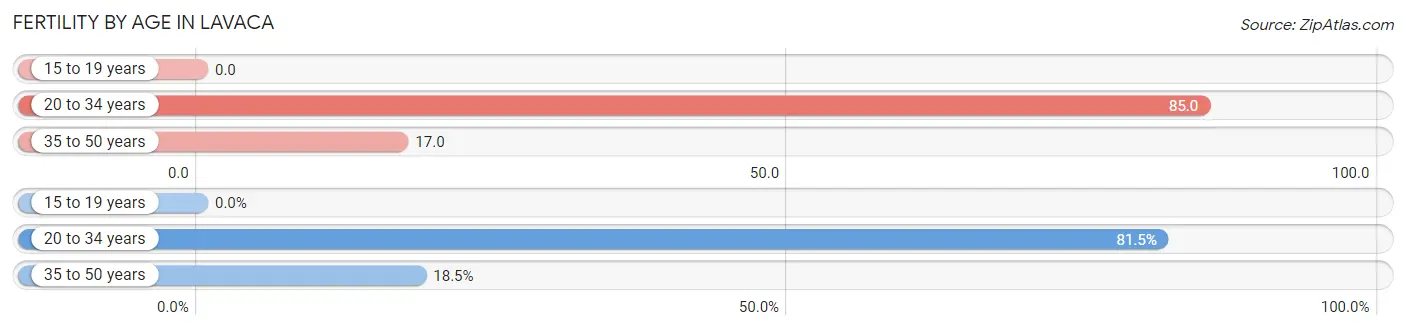
| Age Bracket | Women with Births | Births / 1,000 Women |
| 15 to 19 years | 0 (0.0%) | 0.0 |
| 20 to 34 years | 22 (81.5%) | 85.0 |
| 35 to 50 years | 5 (18.5%) | 17.0 |
| Total | 27 (100.0%) | 35.0 |
Fertility by Age by Marriage Status in Lavaca
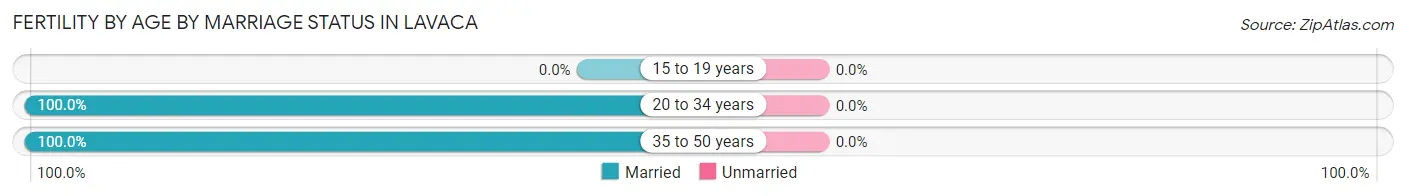
| Age Bracket | Married | Unmarried |
| 15 to 19 years | 0 (0.0%) | 0 (0.0%) |
| 20 to 34 years | 22 (100.0%) | 0 (0.0%) |
| 35 to 50 years | 5 (100.0%) | 0 (0.0%) |
| Total | 27 (100.0%) | 0 (0.0%) |
Fertility by Education in Lavaca
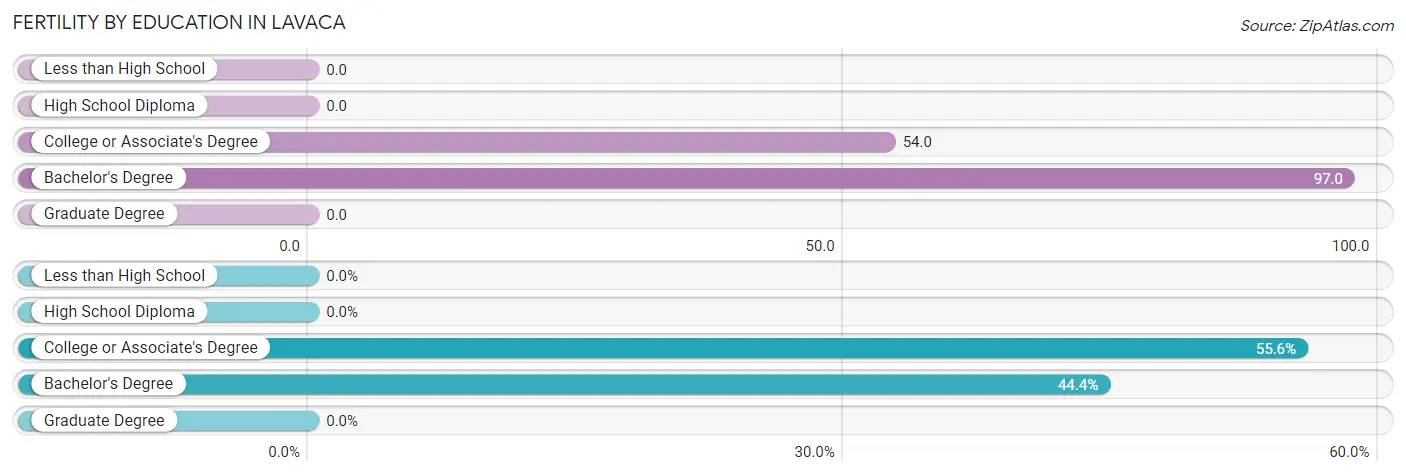
| Educational Attainment | Women with Births | Births / 1,000 Women |
| Less than High School | 0 (0.0%) | 0.0 |
| High School Diploma | 0 (0.0%) | 0.0 |
| College or Associate's Degree | 15 (55.6%) | 54.0 |
| Bachelor's Degree | 12 (44.4%) | 97.0 |
| Graduate Degree | 0 (0.0%) | 0.0 |
| Total | 27 (100.0%) | 35.0 |
Fertility by Education by Marriage Status in Lavaca
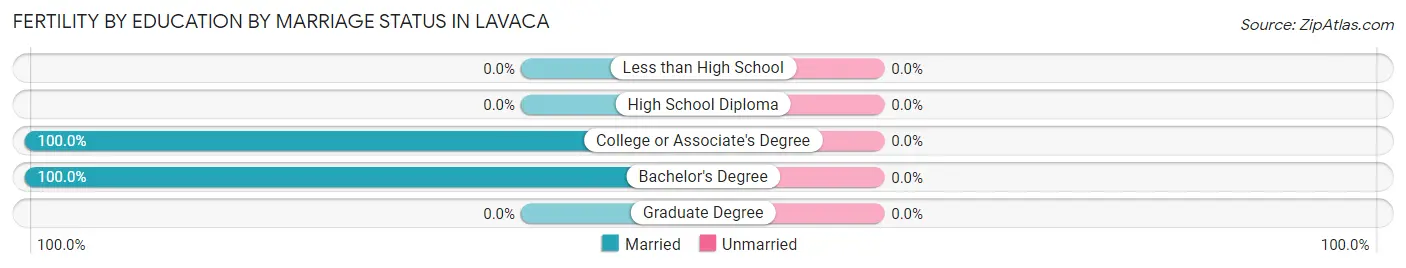
| Educational Attainment | Married | Unmarried |
| Less than High School | 0 (0.0%) | 0 (0.0%) |
| High School Diploma | 0 (0.0%) | 0 (0.0%) |
| College or Associate's Degree | 15 (100.0%) | 0 (0.0%) |
| Bachelor's Degree | 12 (100.0%) | 0 (0.0%) |
| Graduate Degree | 0 (0.0%) | 0 (0.0%) |
| Total | 27 (100.0%) | 0 (0.0%) |
Employment Characteristics in Lavaca
Employment by Class of Employer in Lavaca
Among the 1,365 employed individuals in Lavaca, private company employees (975 | 71.4%), local government employees (168 | 12.3%), and state government employees (96 | 7.0%) make up the most common classes of employment.
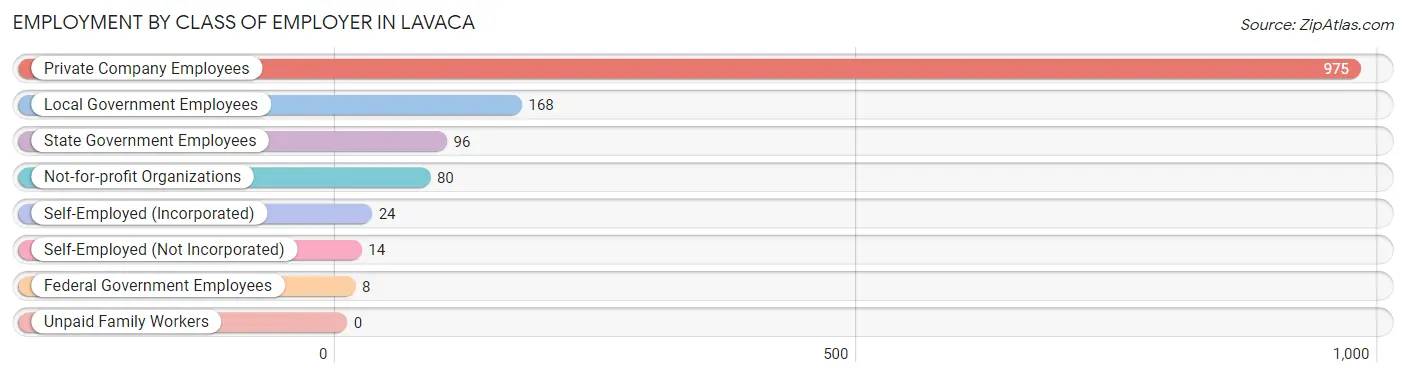
| Employer Class | # Employees | % Employees |
| Private Company Employees | 975 | 71.4% |
| Self-Employed (Incorporated) | 24 | 1.8% |
| Self-Employed (Not Incorporated) | 14 | 1.0% |
| Not-for-profit Organizations | 80 | 5.9% |
| Local Government Employees | 168 | 12.3% |
| State Government Employees | 96 | 7.0% |
| Federal Government Employees | 8 | 0.6% |
| Unpaid Family Workers | 0 | 0.0% |
| Total | 1,365 | 100.0% |
Employment Status by Age in Lavaca
According to the labor force statistics for Lavaca, out of the total population over 16 years of age (1,861), 75.6% or 1,407 individuals are in the labor force, with 1.9% or 27 of them unemployed. The age group with the highest labor force participation rate is 30 to 34 years, with 100.0% or 132 individuals in the labor force. Within the labor force, the 25 to 29 years age range has the highest percentage of unemployed individuals, with 7.8% or 15 of them being unemployed.
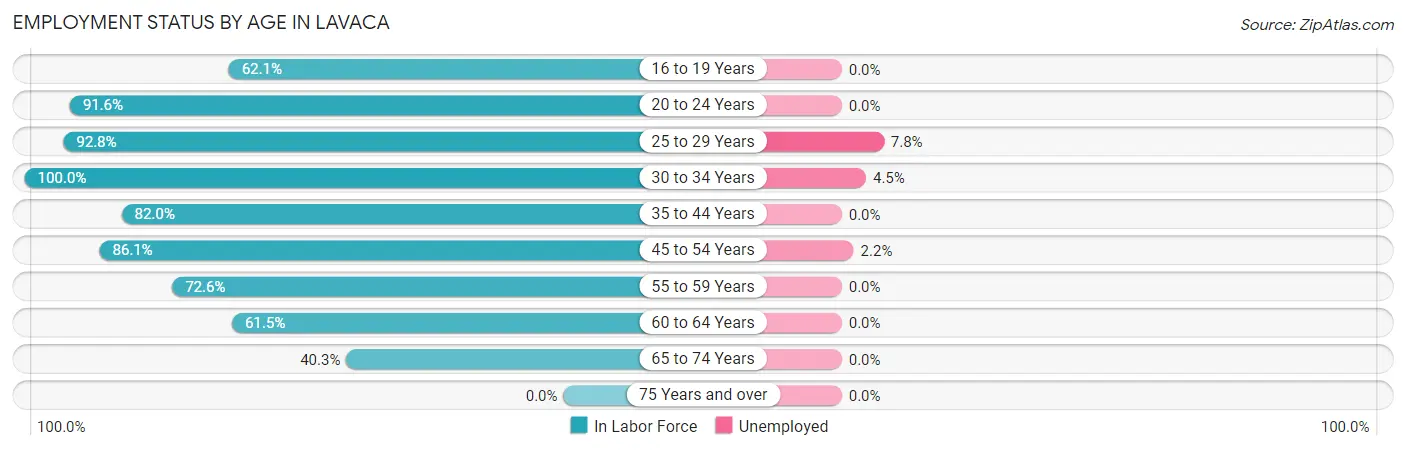
| Age Bracket | In Labor Force | Unemployed |
| 16 to 19 Years | 131 (62.1%) | 0 (0.0%) |
| 20 to 24 Years | 163 (91.6%) | 0 (0.0%) |
| 25 to 29 Years | 193 (92.8%) | 15 (7.8%) |
| 30 to 34 Years | 132 (100.0%) | 6 (4.5%) |
| 35 to 44 Years | 292 (82.0%) | 0 (0.0%) |
| 45 to 54 Years | 278 (86.1%) | 6 (2.2%) |
| 55 to 59 Years | 85 (72.6%) | 0 (0.0%) |
| 60 to 64 Years | 75 (61.5%) | 0 (0.0%) |
| 65 to 74 Years | 58 (40.3%) | 0 (0.0%) |
| 75 Years and over | 0 (0.0%) | 0 (0.0%) |
| Total | 1,407 (75.6%) | 27 (1.9%) |
Employment Status by Educational Attainment in Lavaca
According to labor force statistics for Lavaca, 83.9% of individuals (1,055) out of the total population between 25 and 64 years of age (1,258) are in the labor force, with 2.6% or 27 of them being unemployed. The group with the highest labor force participation rate are those with the educational attainment of bachelor's degree or higher, with 93.2% or 371 individuals in the labor force. Within the labor force, individuals with high school diploma education have the highest percentage of unemployment, with 8.2% or 15 of them being unemployed.
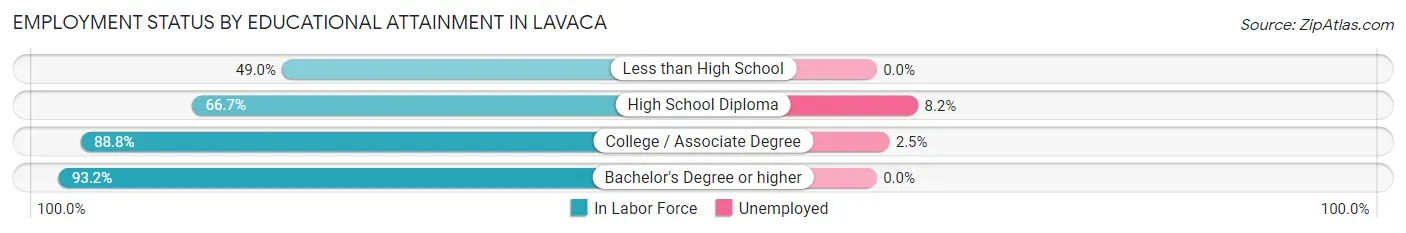
| Educational Attainment | In Labor Force | Unemployed |
| Less than High School | 24 (49.0%) | 0 (0.0%) |
| High School Diploma | 182 (66.7%) | 22 (8.2%) |
| College / Associate Degree | 478 (88.8%) | 13 (2.5%) |
| Bachelor's Degree or higher | 371 (93.2%) | 0 (0.0%) |
| Total | 1,055 (83.9%) | 33 (2.6%) |
Employment Occupations by Sex in Lavaca
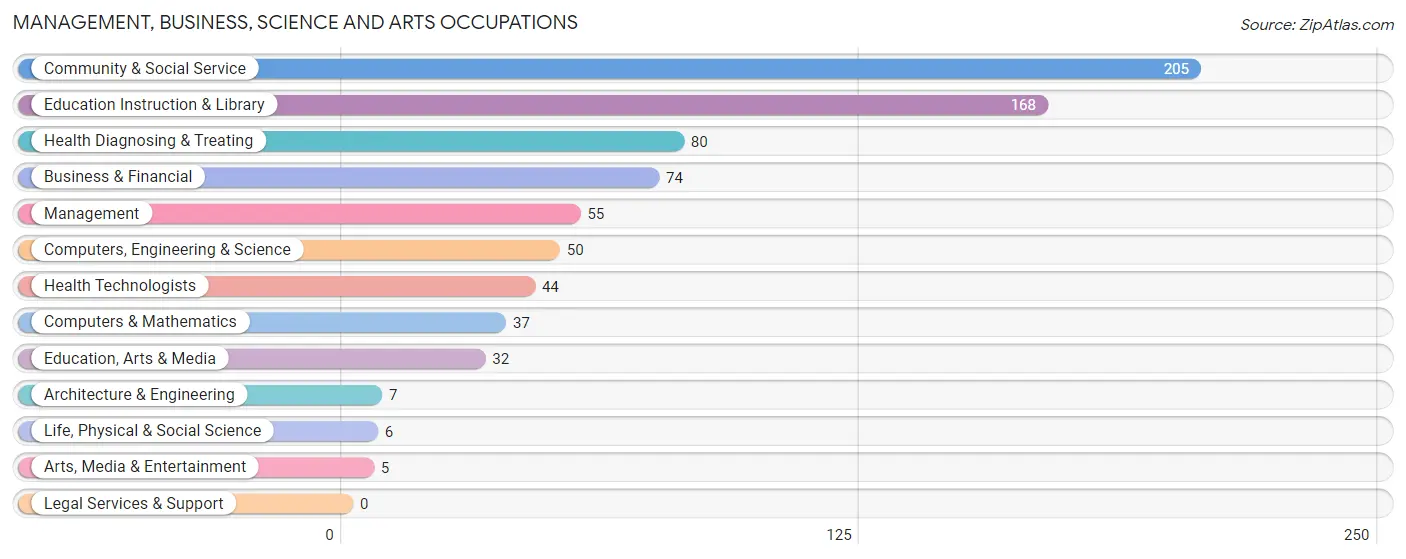
Management, Business, Science and Arts Occupations
The most common Management, Business, Science and Arts occupations in Lavaca are Community & Social Service (205 | 14.9%), Education Instruction & Library (168 | 12.2%), Health Diagnosing & Treating (80 | 5.8%), Business & Financial (74 | 5.4%), and Management (55 | 4.0%).
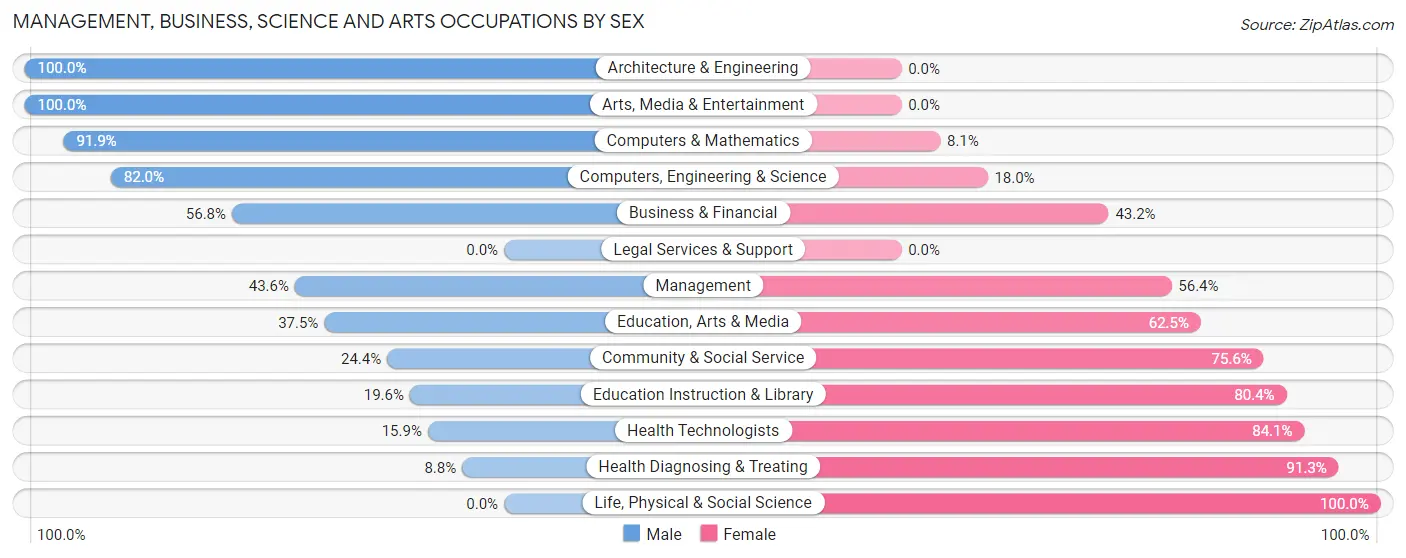
Management, Business, Science and Arts Occupations by Sex
Within the Management, Business, Science and Arts occupations in Lavaca, the most male-oriented occupations are Architecture & Engineering (100.0%), Arts, Media & Entertainment (100.0%), and Computers & Mathematics (91.9%), while the most female-oriented occupations are Life, Physical & Social Science (100.0%), Health Diagnosing & Treating (91.2%), and Health Technologists (84.1%).
| Occupation | Male | Female |
| Management | 24 (43.6%) | 31 (56.4%) |
| Business & Financial | 42 (56.8%) | 32 (43.2%) |
| Computers, Engineering & Science | 41 (82.0%) | 9 (18.0%) |
| Computers & Mathematics | 34 (91.9%) | 3 (8.1%) |
| Architecture & Engineering | 7 (100.0%) | 0 (0.0%) |
| Life, Physical & Social Science | 0 (0.0%) | 6 (100.0%) |
| Community & Social Service | 50 (24.4%) | 155 (75.6%) |
| Education, Arts & Media | 12 (37.5%) | 20 (62.5%) |
| Legal Services & Support | 0 (0.0%) | 0 (0.0%) |
| Education Instruction & Library | 33 (19.6%) | 135 (80.4%) |
| Arts, Media & Entertainment | 5 (100.0%) | 0 (0.0%) |
| Health Diagnosing & Treating | 7 (8.7%) | 73 (91.2%) |
| Health Technologists | 7 (15.9%) | 37 (84.1%) |
| Total (Category) | 164 (35.3%) | 300 (64.7%) |
| Total (Overall) | 634 (46.1%) | 741 (53.9%) |
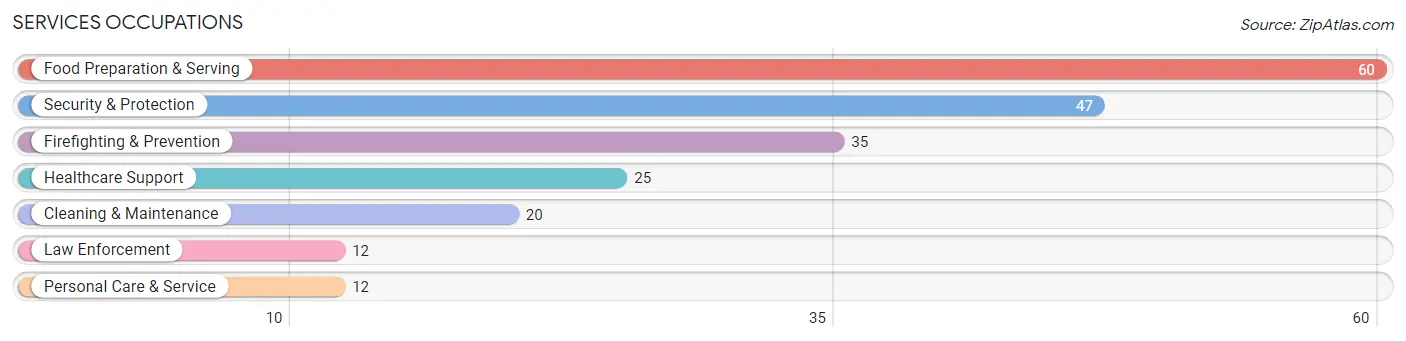
Services Occupations
The most common Services occupations in Lavaca are Food Preparation & Serving (60 | 4.4%), Security & Protection (47 | 3.4%), Firefighting & Prevention (35 | 2.5%), Healthcare Support (25 | 1.8%), and Cleaning & Maintenance (20 | 1.5%).
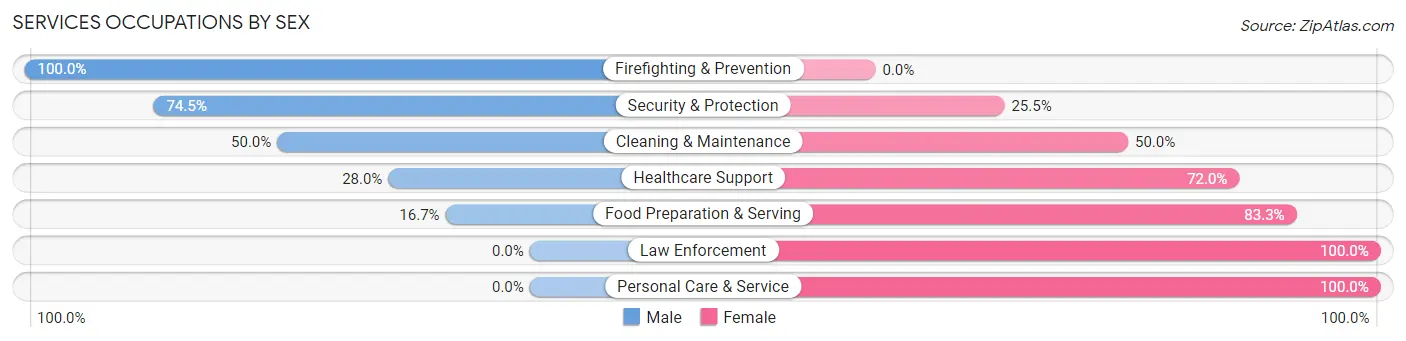
Services Occupations by Sex
Within the Services occupations in Lavaca, the most male-oriented occupations are Firefighting & Prevention (100.0%), Security & Protection (74.5%), and Cleaning & Maintenance (50.0%), while the most female-oriented occupations are Law Enforcement (100.0%), Personal Care & Service (100.0%), and Food Preparation & Serving (83.3%).
| Occupation | Male | Female |
| Healthcare Support | 7 (28.0%) | 18 (72.0%) |
| Security & Protection | 35 (74.5%) | 12 (25.5%) |
| Firefighting & Prevention | 35 (100.0%) | 0 (0.0%) |
| Law Enforcement | 0 (0.0%) | 12 (100.0%) |
| Food Preparation & Serving | 10 (16.7%) | 50 (83.3%) |
| Cleaning & Maintenance | 10 (50.0%) | 10 (50.0%) |
| Personal Care & Service | 0 (0.0%) | 12 (100.0%) |
| Total (Category) | 62 (37.8%) | 102 (62.2%) |
| Total (Overall) | 634 (46.1%) | 741 (53.9%) |
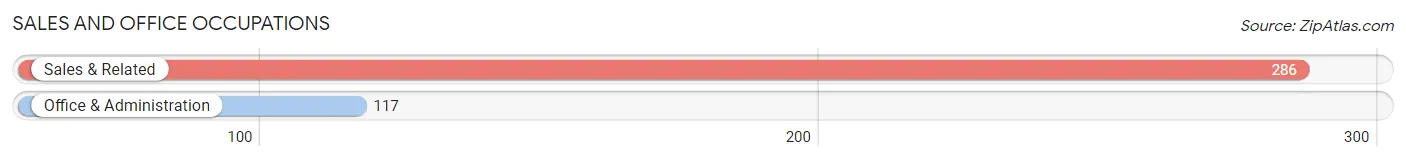
Sales and Office Occupations
The most common Sales and Office occupations in Lavaca are Sales & Related (286 | 20.8%), and Office & Administration (117 | 8.5%).
Sales and Office Occupations by Sex
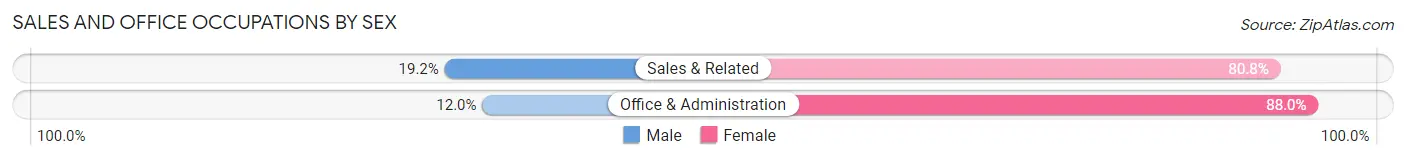
| Occupation | Male | Female |
| Sales & Related | 55 (19.2%) | 231 (80.8%) |
| Office & Administration | 14 (12.0%) | 103 (88.0%) |
| Total (Category) | 69 (17.1%) | 334 (82.9%) |
| Total (Overall) | 634 (46.1%) | 741 (53.9%) |
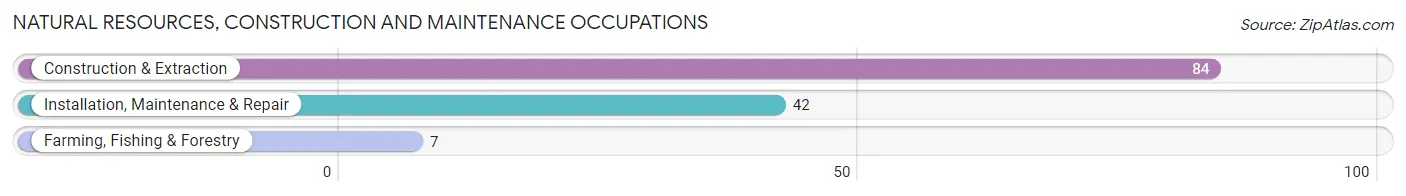
Natural Resources, Construction and Maintenance Occupations
The most common Natural Resources, Construction and Maintenance occupations in Lavaca are Construction & Extraction (84 | 6.1%), Installation, Maintenance & Repair (42 | 3.0%), and Farming, Fishing & Forestry (7 | 0.5%).
Natural Resources, Construction and Maintenance Occupations by Sex
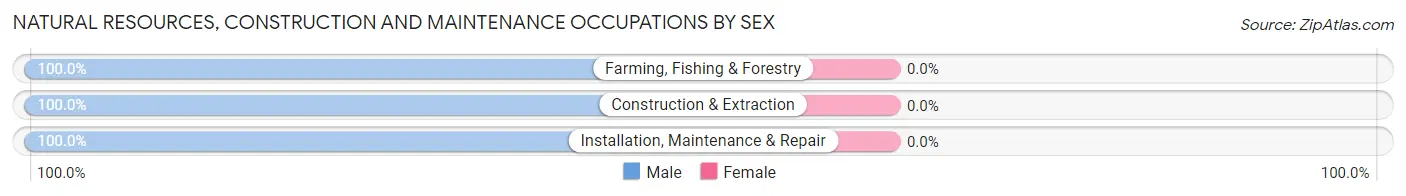
| Occupation | Male | Female |
| Farming, Fishing & Forestry | 7 (100.0%) | 0 (0.0%) |
| Construction & Extraction | 84 (100.0%) | 0 (0.0%) |
| Installation, Maintenance & Repair | 42 (100.0%) | 0 (0.0%) |
| Total (Category) | 133 (100.0%) | 0 (0.0%) |
| Total (Overall) | 634 (46.1%) | 741 (53.9%) |
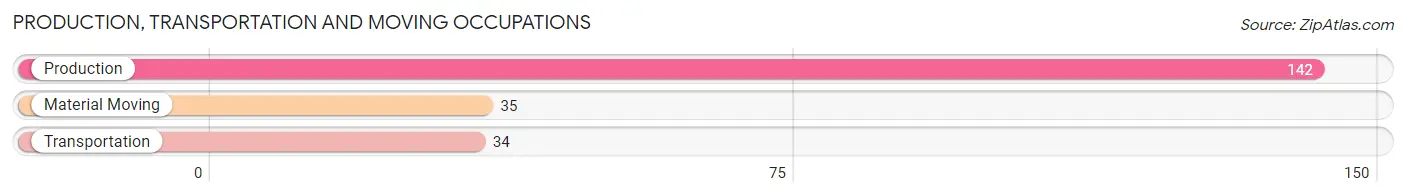
Production, Transportation and Moving Occupations
The most common Production, Transportation and Moving occupations in Lavaca are Production (142 | 10.3%), Material Moving (35 | 2.5%), and Transportation (34 | 2.5%).
Production, Transportation and Moving Occupations by Sex
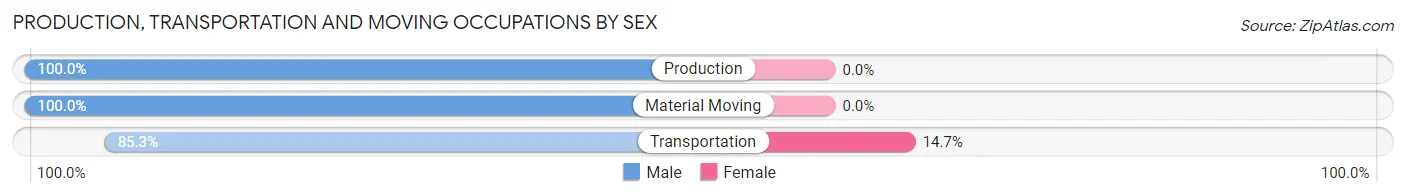
| Occupation | Male | Female |
| Production | 142 (100.0%) | 0 (0.0%) |
| Transportation | 29 (85.3%) | 5 (14.7%) |
| Material Moving | 35 (100.0%) | 0 (0.0%) |
| Total (Category) | 206 (97.6%) | 5 (2.4%) |
| Total (Overall) | 634 (46.1%) | 741 (53.9%) |
Employment Industries by Sex in Lavaca
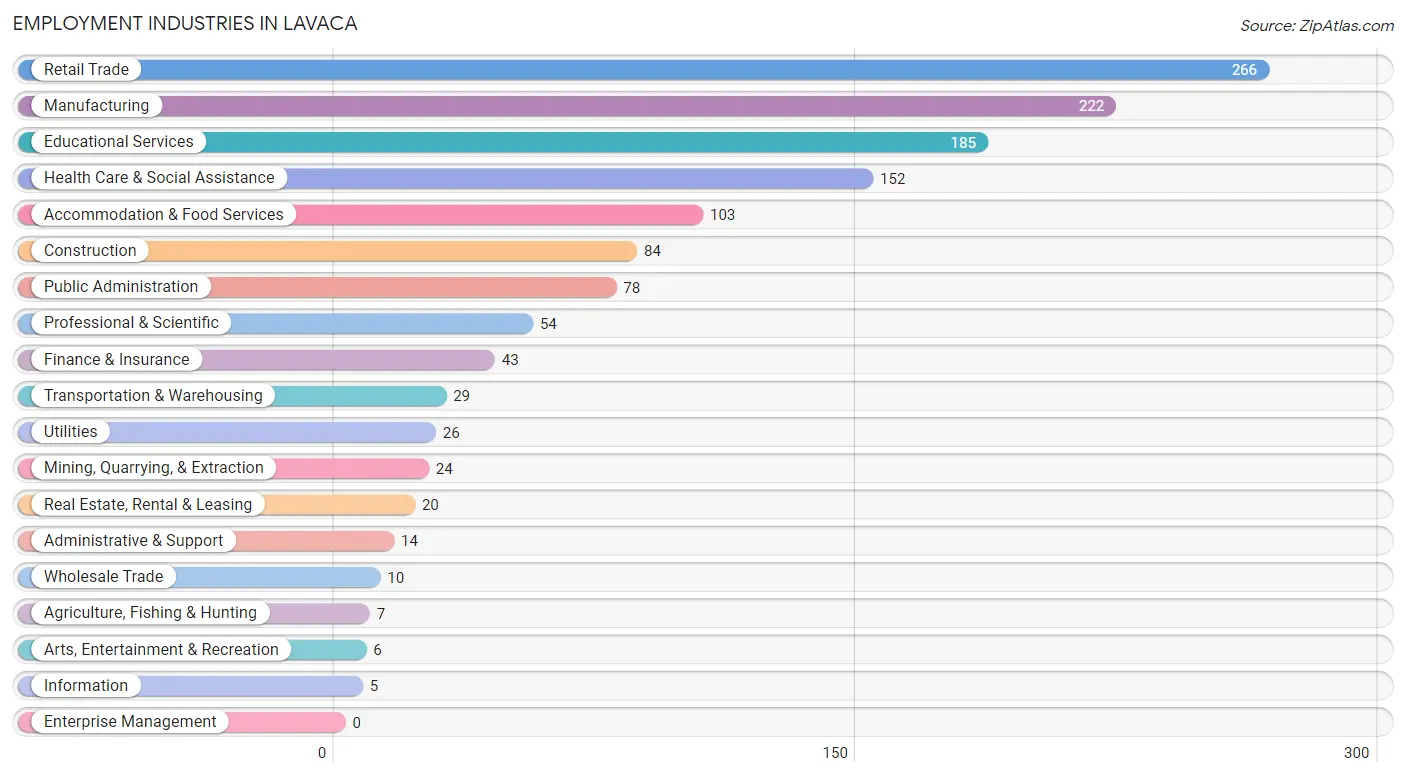
Employment Industries in Lavaca
The major employment industries in Lavaca include Retail Trade (266 | 19.4%), Manufacturing (222 | 16.2%), Educational Services (185 | 13.5%), Health Care & Social Assistance (152 | 11.1%), and Accommodation & Food Services (103 | 7.5%).
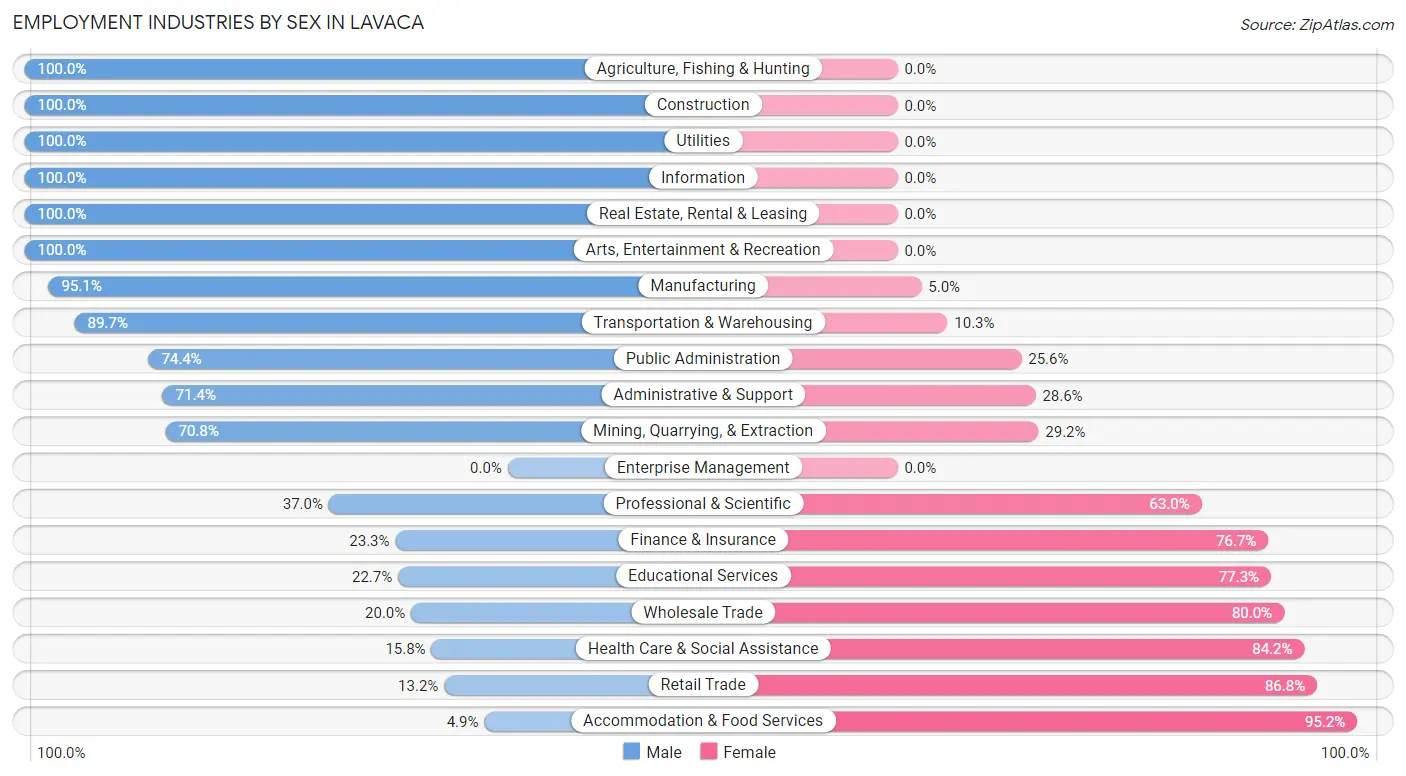
Employment Industries by Sex in Lavaca
The Lavaca industries that see more men than women are Agriculture, Fishing & Hunting (100.0%), Construction (100.0%), and Utilities (100.0%), whereas the industries that tend to have a higher number of women are Accommodation & Food Services (95.2%), Retail Trade (86.8%), and Health Care & Social Assistance (84.2%).
| Industry | Male | Female |
| Agriculture, Fishing & Hunting | 7 (100.0%) | 0 (0.0%) |
| Mining, Quarrying, & Extraction | 17 (70.8%) | 7 (29.2%) |
| Construction | 84 (100.0%) | 0 (0.0%) |
| Manufacturing | 211 (95.1%) | 11 (5.0%) |
| Wholesale Trade | 2 (20.0%) | 8 (80.0%) |
| Retail Trade | 35 (13.2%) | 231 (86.8%) |
| Transportation & Warehousing | 26 (89.7%) | 3 (10.3%) |
| Utilities | 26 (100.0%) | 0 (0.0%) |
| Information | 5 (100.0%) | 0 (0.0%) |
| Finance & Insurance | 10 (23.3%) | 33 (76.7%) |
| Real Estate, Rental & Leasing | 20 (100.0%) | 0 (0.0%) |
| Professional & Scientific | 20 (37.0%) | 34 (63.0%) |
| Enterprise Management | 0 (0.0%) | 0 (0.0%) |
| Administrative & Support | 10 (71.4%) | 4 (28.6%) |
| Educational Services | 42 (22.7%) | 143 (77.3%) |
| Health Care & Social Assistance | 24 (15.8%) | 128 (84.2%) |
| Arts, Entertainment & Recreation | 6 (100.0%) | 0 (0.0%) |
| Accommodation & Food Services | 5 (4.9%) | 98 (95.2%) |
| Public Administration | 58 (74.4%) | 20 (25.6%) |
| Total | 634 (46.1%) | 741 (53.9%) |
Education in Lavaca
School Enrollment in Lavaca
The most common levels of schooling among the 777 students in Lavaca are college / undergraduate (183 | 23.5%), high school (169 | 21.7%), and elementary school (158 | 20.3%).
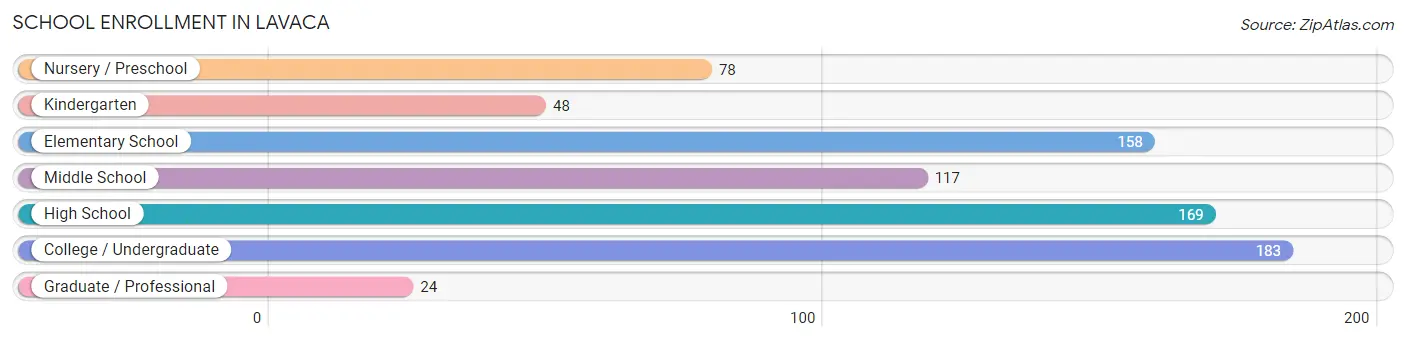
| School Level | # Students | % Students |
| Nursery / Preschool | 78 | 10.0% |
| Kindergarten | 48 | 6.2% |
| Elementary School | 158 | 20.3% |
| Middle School | 117 | 15.1% |
| High School | 169 | 21.7% |
| College / Undergraduate | 183 | 23.5% |
| Graduate / Professional | 24 | 3.1% |
| Total | 777 | 100.0% |
School Enrollment by Age by Funding Source in Lavaca
Out of a total of 777 students who are enrolled in schools in Lavaca, 48 (6.2%) attend a private institution, while the remaining 729 (93.8%) are enrolled in public schools. The age group of 35 years and over has the highest likelihood of being enrolled in private schools, with 16 (25.8% in the age bracket) enrolled. Conversely, the age group of 10 to 14 year olds has the lowest likelihood of being enrolled in a private school, with 125 (100.0% in the age bracket) attending a public institution.
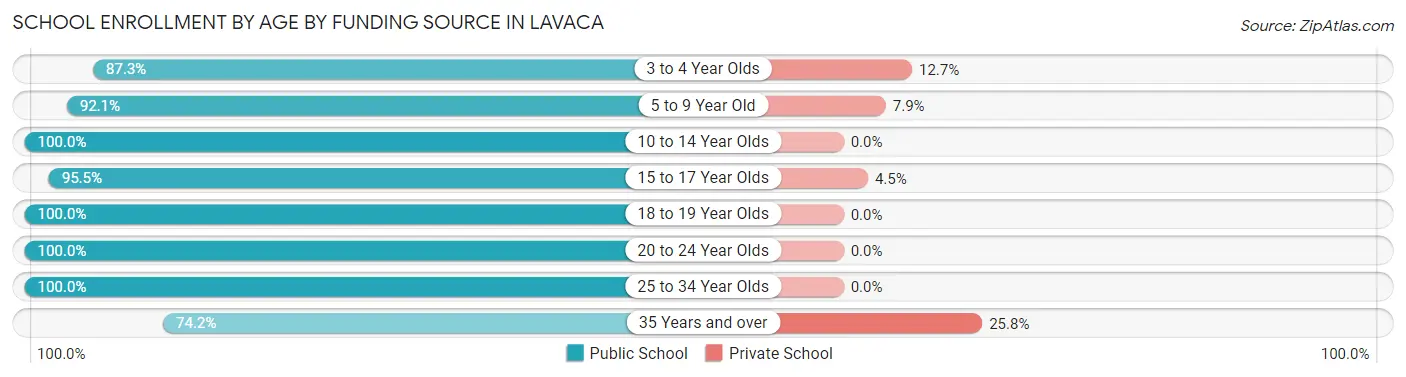
| Age Bracket | Public School | Private School |
| 3 to 4 Year Olds | 48 (87.3%) | 7 (12.7%) |
| 5 to 9 Year Old | 211 (92.1%) | 18 (7.9%) |
| 10 to 14 Year Olds | 125 (100.0%) | 0 (0.0%) |
| 15 to 17 Year Olds | 148 (95.5%) | 7 (4.5%) |
| 18 to 19 Year Olds | 58 (100.0%) | 0 (0.0%) |
| 20 to 24 Year Olds | 46 (100.0%) | 0 (0.0%) |
| 25 to 34 Year Olds | 47 (100.0%) | 0 (0.0%) |
| 35 Years and over | 46 (74.2%) | 16 (25.8%) |
| Total | 729 (93.8%) | 48 (6.2%) |
Educational Attainment by Field of Study in Lavaca
Business (107 | 23.9%), education (101 | 22.6%), science & technology (59 | 13.2%), psychology (33 | 7.4%), and arts & humanities (31 | 6.9%) are the most common fields of study among 447 individuals in Lavaca who have obtained a bachelor's degree or higher.
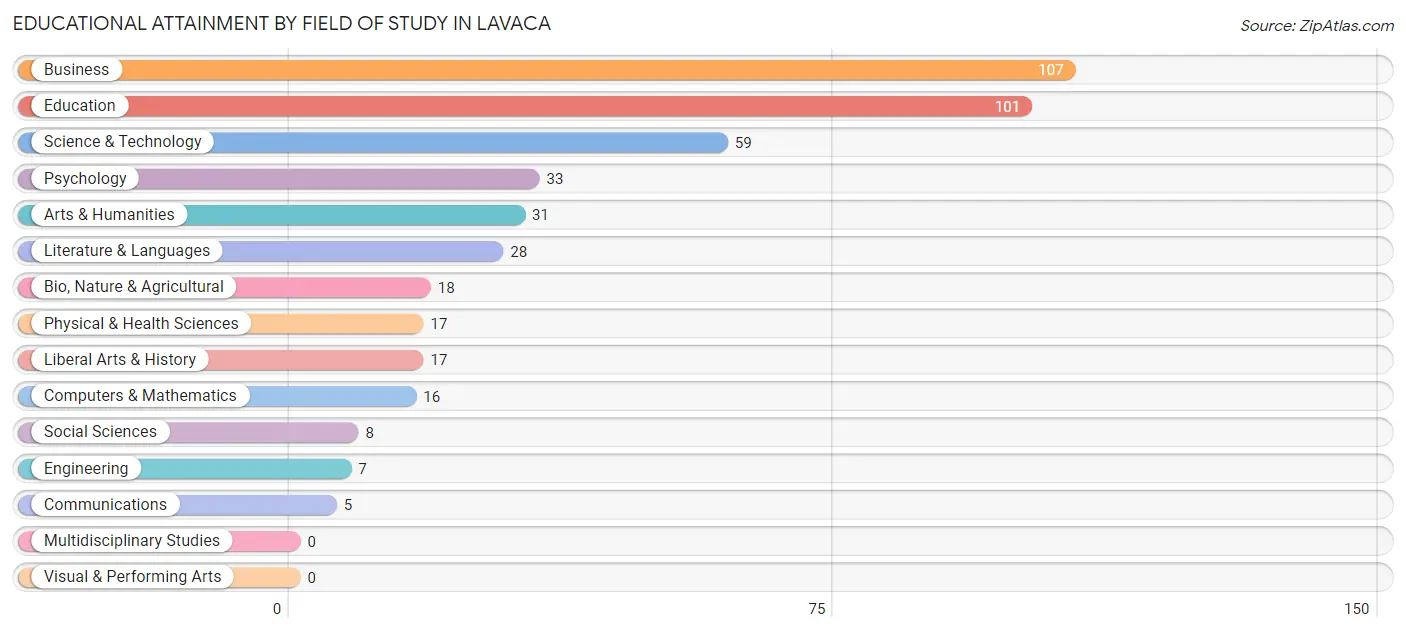
| Field of Study | # Graduates | % Graduates |
| Computers & Mathematics | 16 | 3.6% |
| Bio, Nature & Agricultural | 18 | 4.0% |
| Physical & Health Sciences | 17 | 3.8% |
| Psychology | 33 | 7.4% |
| Social Sciences | 8 | 1.8% |
| Engineering | 7 | 1.6% |
| Multidisciplinary Studies | 0 | 0.0% |
| Science & Technology | 59 | 13.2% |
| Business | 107 | 23.9% |
| Education | 101 | 22.6% |
| Literature & Languages | 28 | 6.3% |
| Liberal Arts & History | 17 | 3.8% |
| Visual & Performing Arts | 0 | 0.0% |
| Communications | 5 | 1.1% |
| Arts & Humanities | 31 | 6.9% |
| Total | 447 | 100.0% |
Transportation & Commute in Lavaca
Vehicle Availability by Sex in Lavaca
The most prevalent vehicle ownership categories in Lavaca are males with 2 vehicles (424, accounting for 66.3%) and females with 2 vehicles (434, making up 58.4%).
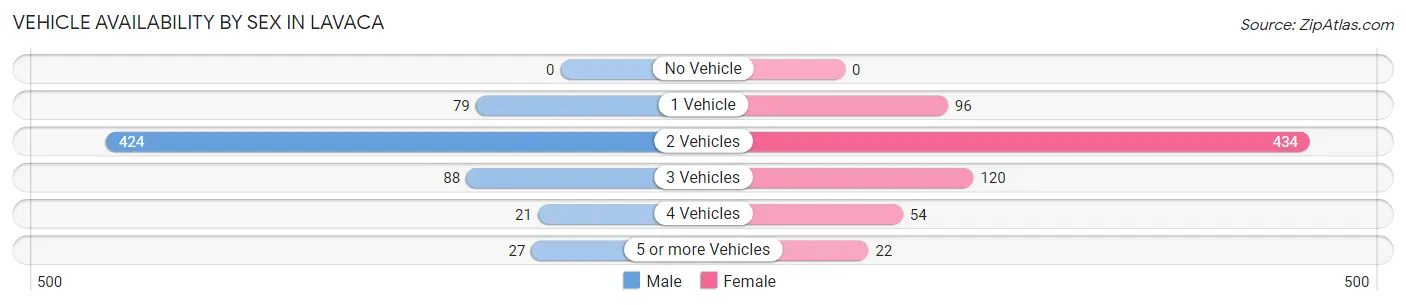
| Vehicles Available | Male | Female |
| No Vehicle | 0 (0.0%) | 0 (0.0%) |
| 1 Vehicle | 79 (12.4%) | 96 (13.2%) |
| 2 Vehicles | 424 (66.3%) | 434 (59.8%) |
| 3 Vehicles | 88 (13.8%) | 120 (16.5%) |
| 4 Vehicles | 21 (3.3%) | 54 (7.4%) |
| 5 or more Vehicles | 27 (4.2%) | 22 (3.0%) |
| Total | 639 (100.0%) | 726 (100.0%) |
Commute Time in Lavaca
The most frequently occuring commute durations in Lavaca are 20 to 24 minutes (338 commuters, 25.9%), 15 to 19 minutes (197 commuters, 15.1%), and 30 to 34 minutes (188 commuters, 14.4%).
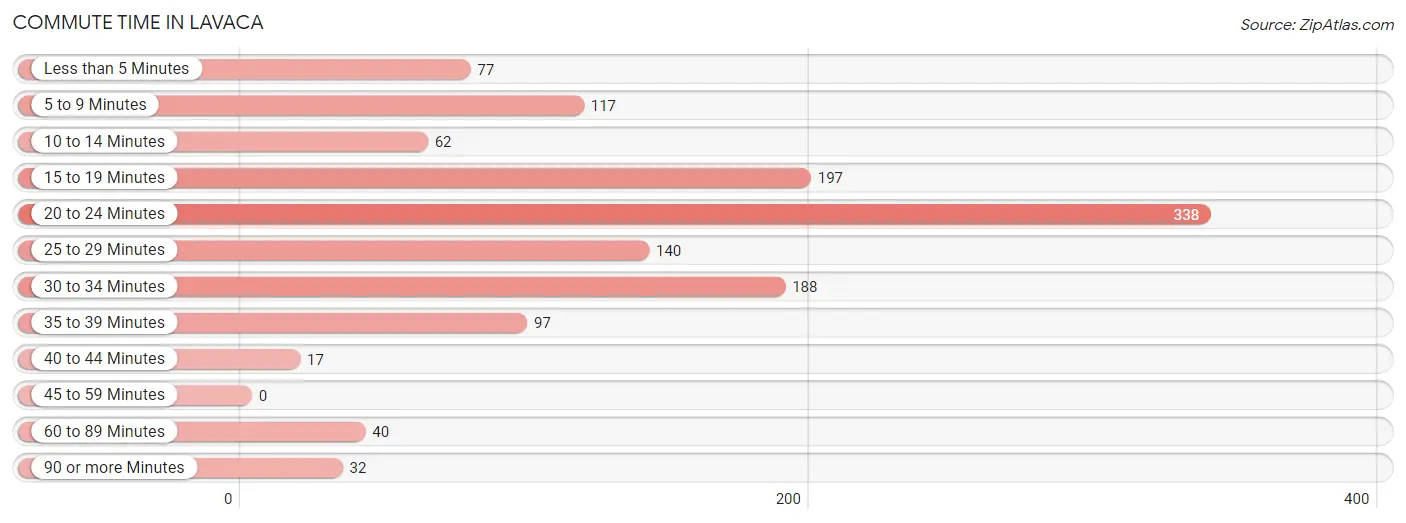
| Commute Time | # Commuters | % Commuters |
| Less than 5 Minutes | 77 | 5.9% |
| 5 to 9 Minutes | 117 | 9.0% |
| 10 to 14 Minutes | 62 | 4.8% |
| 15 to 19 Minutes | 197 | 15.1% |
| 20 to 24 Minutes | 338 | 25.9% |
| 25 to 29 Minutes | 140 | 10.7% |
| 30 to 34 Minutes | 188 | 14.4% |
| 35 to 39 Minutes | 97 | 7.4% |
| 40 to 44 Minutes | 17 | 1.3% |
| 45 to 59 Minutes | 0 | 0.0% |
| 60 to 89 Minutes | 40 | 3.1% |
| 90 or more Minutes | 32 | 2.5% |
Commute Time by Sex in Lavaca
The most common commute times in Lavaca are 20 to 24 minutes (215 commuters, 34.5%) for males and 20 to 24 minutes (123 commuters, 18.1%) for females.
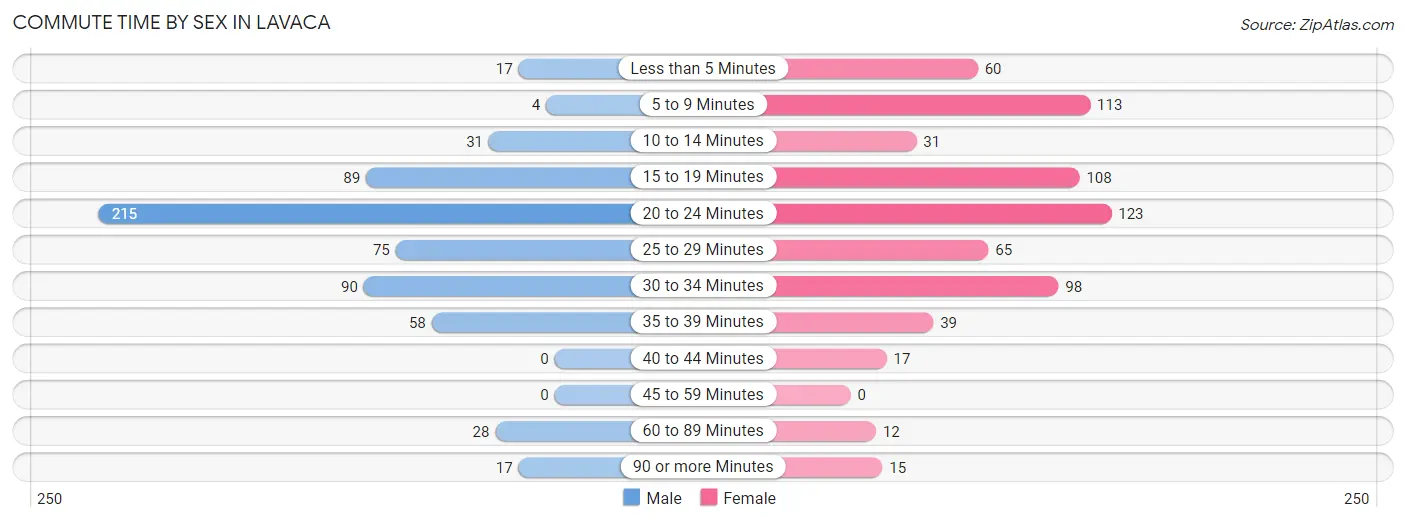
| Commute Time | Male | Female |
| Less than 5 Minutes | 17 (2.7%) | 60 (8.8%) |
| 5 to 9 Minutes | 4 (0.6%) | 113 (16.6%) |
| 10 to 14 Minutes | 31 (5.0%) | 31 (4.5%) |
| 15 to 19 Minutes | 89 (14.3%) | 108 (15.9%) |
| 20 to 24 Minutes | 215 (34.5%) | 123 (18.1%) |
| 25 to 29 Minutes | 75 (12.0%) | 65 (9.5%) |
| 30 to 34 Minutes | 90 (14.4%) | 98 (14.4%) |
| 35 to 39 Minutes | 58 (9.3%) | 39 (5.7%) |
| 40 to 44 Minutes | 0 (0.0%) | 17 (2.5%) |
| 45 to 59 Minutes | 0 (0.0%) | 0 (0.0%) |
| 60 to 89 Minutes | 28 (4.5%) | 12 (1.8%) |
| 90 or more Minutes | 17 (2.7%) | 15 (2.2%) |
Time of Departure to Work by Sex in Lavaca
The most frequent times of departure to work in Lavaca are 7:30 AM to 7:59 AM (132, 21.1%) for males and 7:30 AM to 7:59 AM (171, 25.1%) for females.
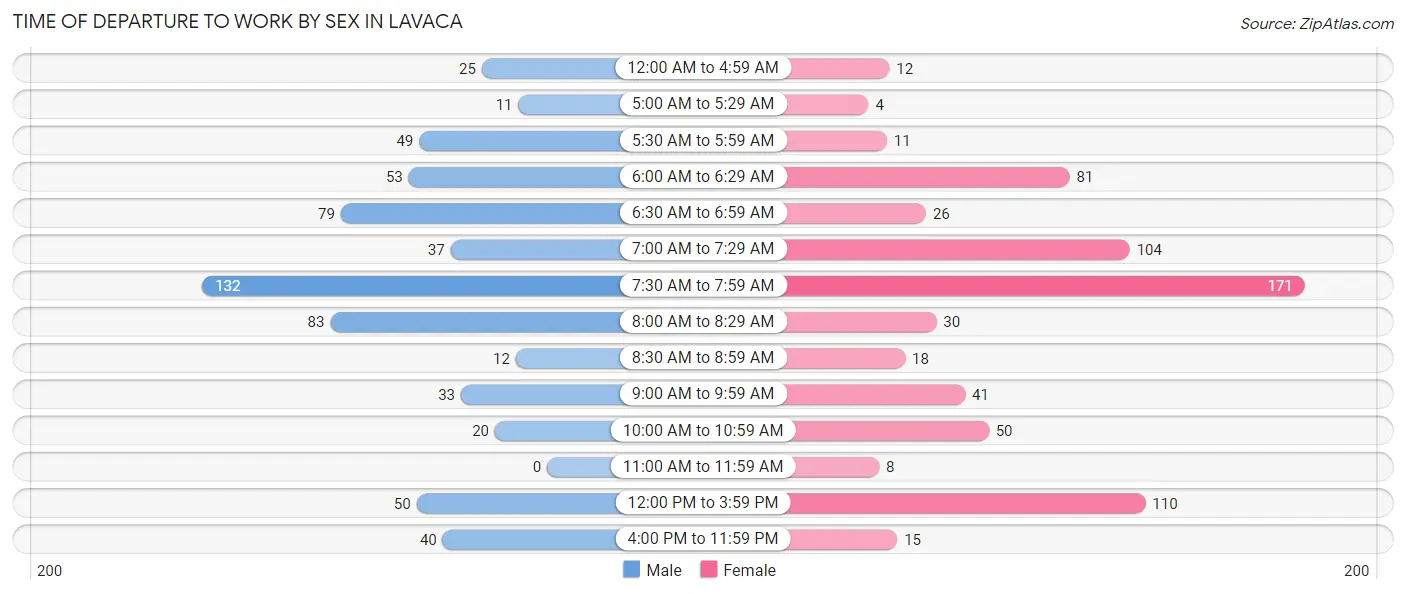
| Time of Departure | Male | Female |
| 12:00 AM to 4:59 AM | 25 (4.0%) | 12 (1.8%) |
| 5:00 AM to 5:29 AM | 11 (1.8%) | 4 (0.6%) |
| 5:30 AM to 5:59 AM | 49 (7.9%) | 11 (1.6%) |
| 6:00 AM to 6:29 AM | 53 (8.5%) | 81 (11.9%) |
| 6:30 AM to 6:59 AM | 79 (12.7%) | 26 (3.8%) |
| 7:00 AM to 7:29 AM | 37 (5.9%) | 104 (15.3%) |
| 7:30 AM to 7:59 AM | 132 (21.1%) | 171 (25.1%) |
| 8:00 AM to 8:29 AM | 83 (13.3%) | 30 (4.4%) |
| 8:30 AM to 8:59 AM | 12 (1.9%) | 18 (2.6%) |
| 9:00 AM to 9:59 AM | 33 (5.3%) | 41 (6.0%) |
| 10:00 AM to 10:59 AM | 20 (3.2%) | 50 (7.3%) |
| 11:00 AM to 11:59 AM | 0 (0.0%) | 8 (1.2%) |
| 12:00 PM to 3:59 PM | 50 (8.0%) | 110 (16.2%) |
| 4:00 PM to 11:59 PM | 40 (6.4%) | 15 (2.2%) |
| Total | 624 (100.0%) | 681 (100.0%) |
Housing Occupancy in Lavaca
Occupancy by Ownership in Lavaca
Of the total 842 dwellings in Lavaca, owner-occupied units account for 700 (83.1%), while renter-occupied units make up 142 (16.9%).
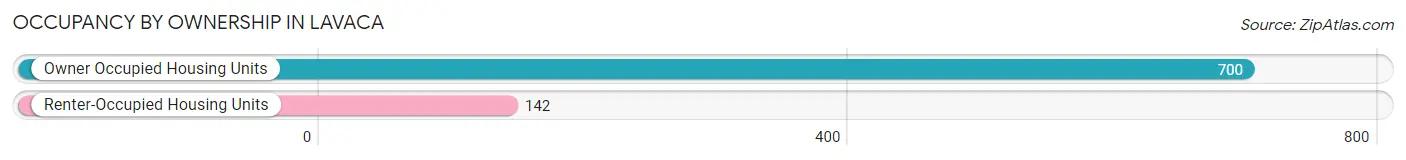
| Occupancy | # Housing Units | % Housing Units |
| Owner Occupied Housing Units | 700 | 83.1% |
| Renter-Occupied Housing Units | 142 | 16.9% |
| Total Occupied Housing Units | 842 | 100.0% |
Occupancy by Household Size in Lavaca
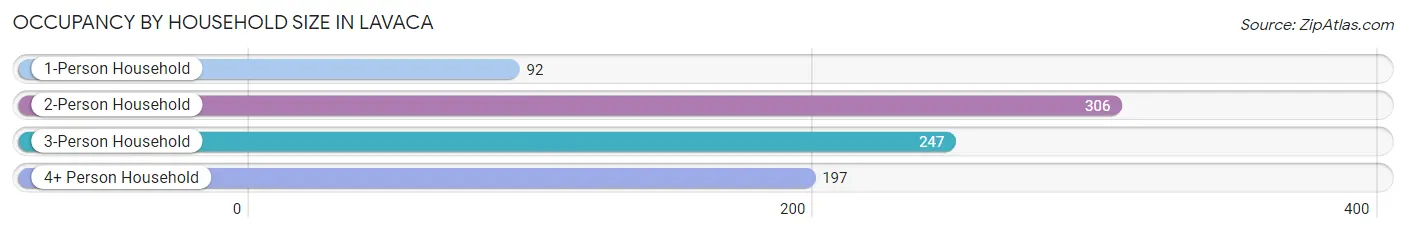
| Household Size | # Housing Units | % Housing Units |
| 1-Person Household | 92 | 10.9% |
| 2-Person Household | 306 | 36.3% |
| 3-Person Household | 247 | 29.3% |
| 4+ Person Household | 197 | 23.4% |
| Total Housing Units | 842 | 100.0% |
Occupancy by Ownership by Household Size in Lavaca
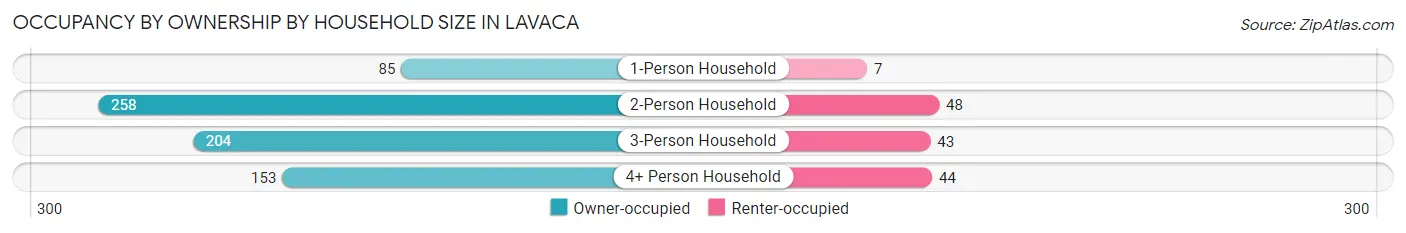
| Household Size | Owner-occupied | Renter-occupied |
| 1-Person Household | 85 (92.4%) | 7 (7.6%) |
| 2-Person Household | 258 (84.3%) | 48 (15.7%) |
| 3-Person Household | 204 (82.6%) | 43 (17.4%) |
| 4+ Person Household | 153 (77.7%) | 44 (22.3%) |
| Total Housing Units | 700 (83.1%) | 142 (16.9%) |
Occupancy by Educational Attainment in Lavaca
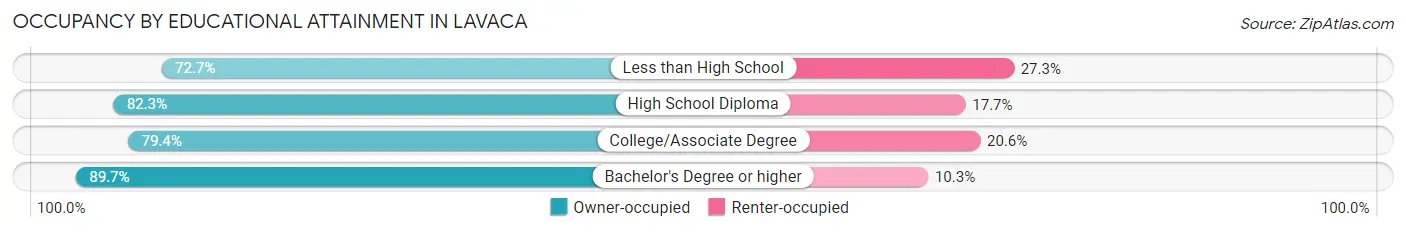
| Household Size | Owner-occupied | Renter-occupied |
| Less than High School | 16 (72.7%) | 6 (27.3%) |
| High School Diploma | 163 (82.3%) | 35 (17.7%) |
| College/Associate Degree | 285 (79.4%) | 74 (20.6%) |
| Bachelor's Degree or higher | 236 (89.7%) | 27 (10.3%) |
Occupancy by Age of Householder in Lavaca
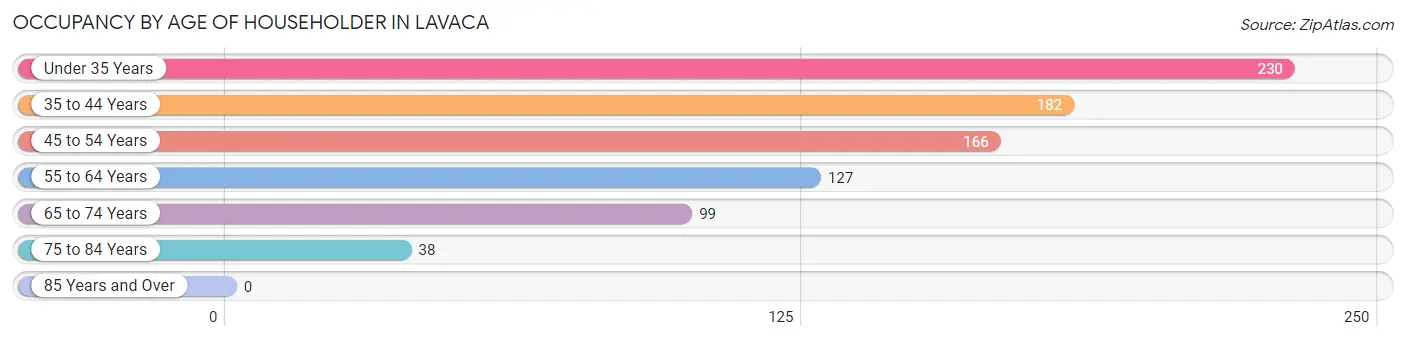
| Age Bracket | # Households | % Households |
| Under 35 Years | 230 | 27.3% |
| 35 to 44 Years | 182 | 21.6% |
| 45 to 54 Years | 166 | 19.7% |
| 55 to 64 Years | 127 | 15.1% |
| 65 to 74 Years | 99 | 11.8% |
| 75 to 84 Years | 38 | 4.5% |
| 85 Years and Over | 0 | 0.0% |
| Total | 842 | 100.0% |
Housing Finances in Lavaca
Median Income by Occupancy in Lavaca
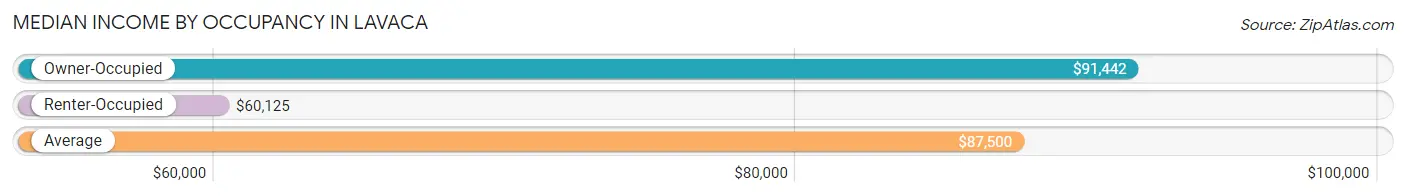
| Occupancy Type | # Households | Median Income |
| Owner-Occupied | 700 (83.1%) | $91,442 |
| Renter-Occupied | 142 (16.9%) | $60,125 |
| Average | 842 (100.0%) | $87,500 |
Occupancy by Householder Income Bracket in Lavaca
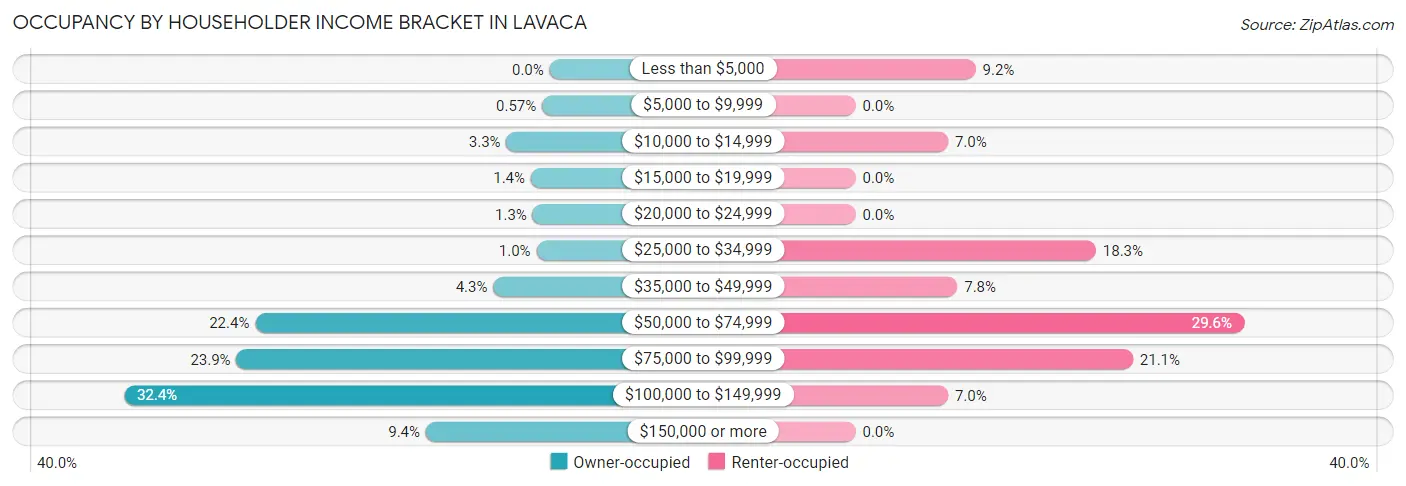
| Income Bracket | Owner-occupied | Renter-occupied |
| Less than $5,000 | 0 (0.0%) | 13 (9.1%) |
| $5,000 to $9,999 | 4 (0.6%) | 0 (0.0%) |
| $10,000 to $14,999 | 23 (3.3%) | 10 (7.0%) |
| $15,000 to $19,999 | 10 (1.4%) | 0 (0.0%) |
| $20,000 to $24,999 | 9 (1.3%) | 0 (0.0%) |
| $25,000 to $34,999 | 7 (1.0%) | 26 (18.3%) |
| $35,000 to $49,999 | 30 (4.3%) | 11 (7.7%) |
| $50,000 to $74,999 | 157 (22.4%) | 42 (29.6%) |
| $75,000 to $99,999 | 167 (23.9%) | 30 (21.1%) |
| $100,000 to $149,999 | 227 (32.4%) | 10 (7.0%) |
| $150,000 or more | 66 (9.4%) | 0 (0.0%) |
| Total | 700 (100.0%) | 142 (100.0%) |
Monthly Housing Cost Tiers in Lavaca
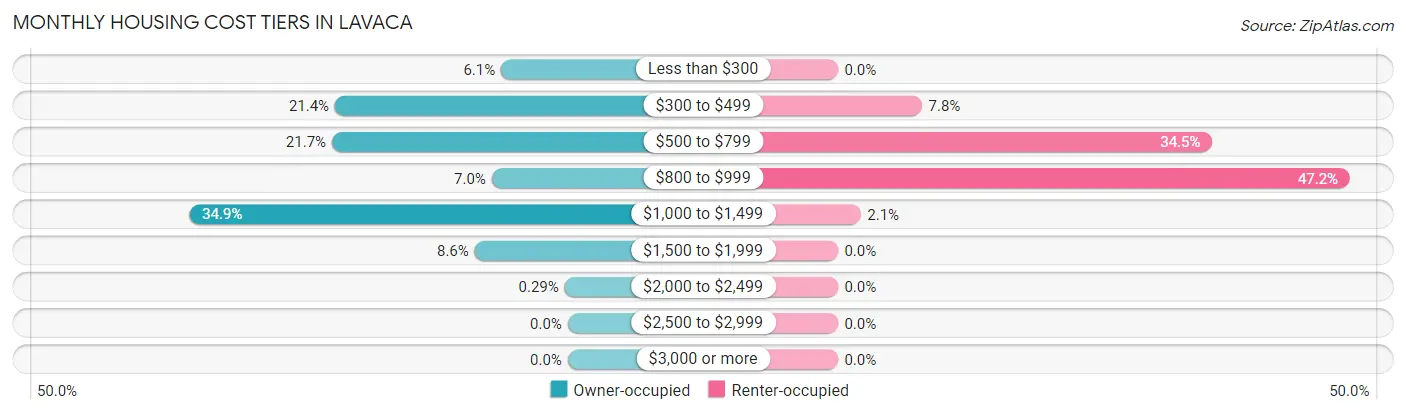
| Monthly Cost | Owner-occupied | Renter-occupied |
| Less than $300 | 43 (6.1%) | 0 (0.0%) |
| $300 to $499 | 150 (21.4%) | 11 (7.7%) |
| $500 to $799 | 152 (21.7%) | 49 (34.5%) |
| $800 to $999 | 49 (7.0%) | 67 (47.2%) |
| $1,000 to $1,499 | 244 (34.9%) | 3 (2.1%) |
| $1,500 to $1,999 | 60 (8.6%) | 0 (0.0%) |
| $2,000 to $2,499 | 2 (0.3%) | 0 (0.0%) |
| $2,500 to $2,999 | 0 (0.0%) | 0 (0.0%) |
| $3,000 or more | 0 (0.0%) | 0 (0.0%) |
| Total | 700 (100.0%) | 142 (100.0%) |
Physical Housing Characteristics in Lavaca
Housing Structures in Lavaca
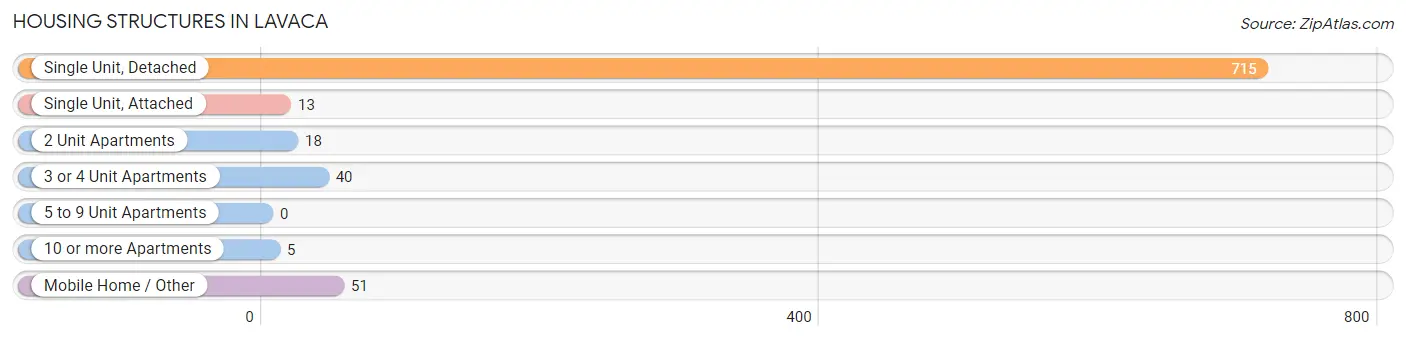
| Structure Type | # Housing Units | % Housing Units |
| Single Unit, Detached | 715 | 84.9% |
| Single Unit, Attached | 13 | 1.5% |
| 2 Unit Apartments | 18 | 2.1% |
| 3 or 4 Unit Apartments | 40 | 4.8% |
| 5 to 9 Unit Apartments | 0 | 0.0% |
| 10 or more Apartments | 5 | 0.6% |
| Mobile Home / Other | 51 | 6.1% |
| Total | 842 | 100.0% |
Housing Structures by Occupancy in Lavaca
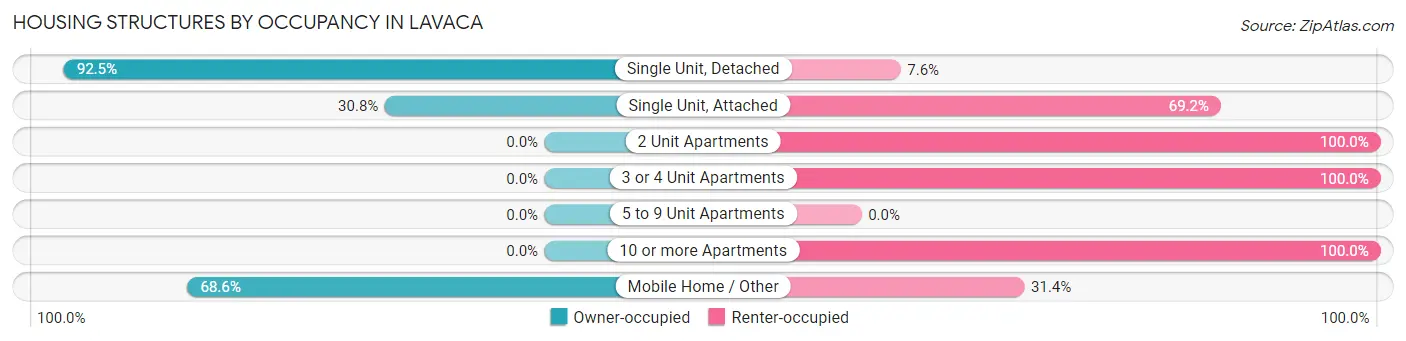
| Structure Type | Owner-occupied | Renter-occupied |
| Single Unit, Detached | 661 (92.4%) | 54 (7.5%) |
| Single Unit, Attached | 4 (30.8%) | 9 (69.2%) |
| 2 Unit Apartments | 0 (0.0%) | 18 (100.0%) |
| 3 or 4 Unit Apartments | 0 (0.0%) | 40 (100.0%) |
| 5 to 9 Unit Apartments | 0 (0.0%) | 0 (0.0%) |
| 10 or more Apartments | 0 (0.0%) | 5 (100.0%) |
| Mobile Home / Other | 35 (68.6%) | 16 (31.4%) |
| Total | 700 (83.1%) | 142 (16.9%) |
Housing Structures by Number of Rooms in Lavaca
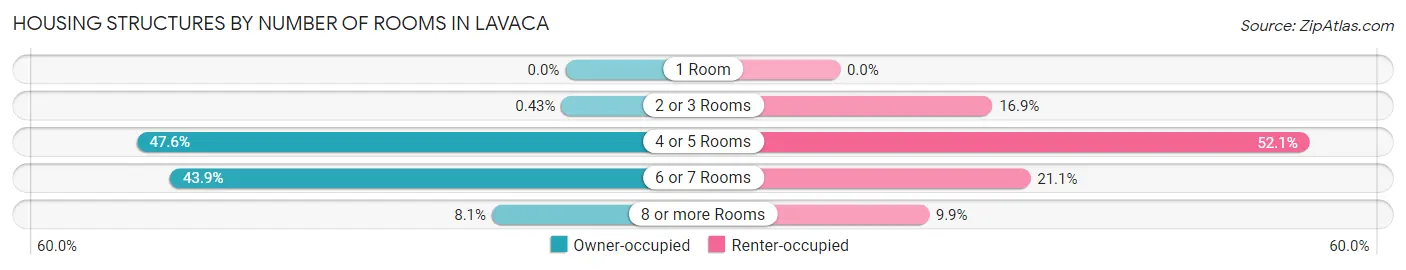
| Number of Rooms | Owner-occupied | Renter-occupied |
| 1 Room | 0 (0.0%) | 0 (0.0%) |
| 2 or 3 Rooms | 3 (0.4%) | 24 (16.9%) |
| 4 or 5 Rooms | 333 (47.6%) | 74 (52.1%) |
| 6 or 7 Rooms | 307 (43.9%) | 30 (21.1%) |
| 8 or more Rooms | 57 (8.1%) | 14 (9.9%) |
| Total | 700 (100.0%) | 142 (100.0%) |
Housing Structure by Heating Type in Lavaca
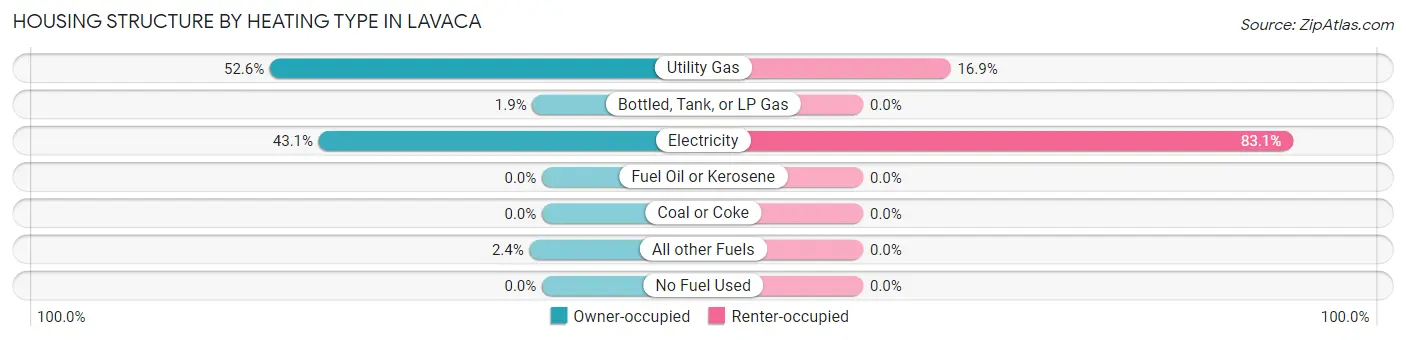
| Heating Type | Owner-occupied | Renter-occupied |
| Utility Gas | 368 (52.6%) | 24 (16.9%) |
| Bottled, Tank, or LP Gas | 13 (1.9%) | 0 (0.0%) |
| Electricity | 302 (43.1%) | 118 (83.1%) |
| Fuel Oil or Kerosene | 0 (0.0%) | 0 (0.0%) |
| Coal or Coke | 0 (0.0%) | 0 (0.0%) |
| All other Fuels | 17 (2.4%) | 0 (0.0%) |
| No Fuel Used | 0 (0.0%) | 0 (0.0%) |
| Total | 700 (100.0%) | 142 (100.0%) |
Household Vehicle Usage in Lavaca
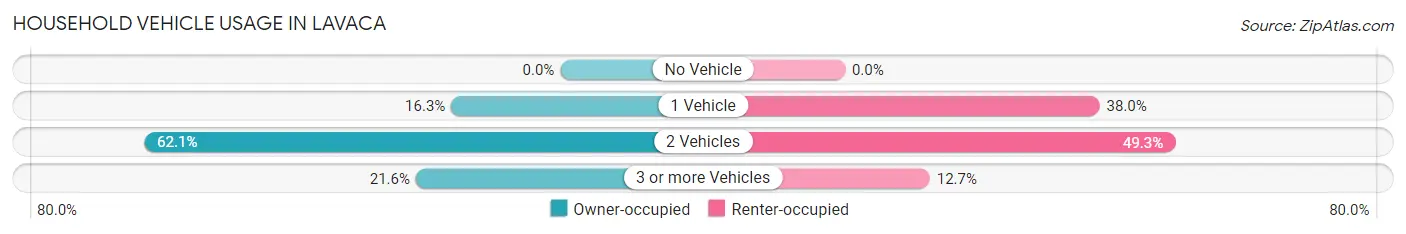
| Vehicles per Household | Owner-occupied | Renter-occupied |
| No Vehicle | 0 (0.0%) | 0 (0.0%) |
| 1 Vehicle | 114 (16.3%) | 54 (38.0%) |
| 2 Vehicles | 435 (62.1%) | 70 (49.3%) |
| 3 or more Vehicles | 151 (21.6%) | 18 (12.7%) |
| Total | 700 (100.0%) | 142 (100.0%) |
Real Estate & Mortgages in Lavaca
Real Estate and Mortgage Overview in Lavaca
| Characteristic | Without Mortgage | With Mortgage |
| Housing Units | 248 | 452 |
| Median Property Value | $134,000 | $145,900 |
| Median Household Income | $71,875 | $46 |
| Monthly Housing Costs | $378 | $0 |
| Real Estate Taxes | $912 | $0 |
Property Value by Mortgage Status in Lavaca
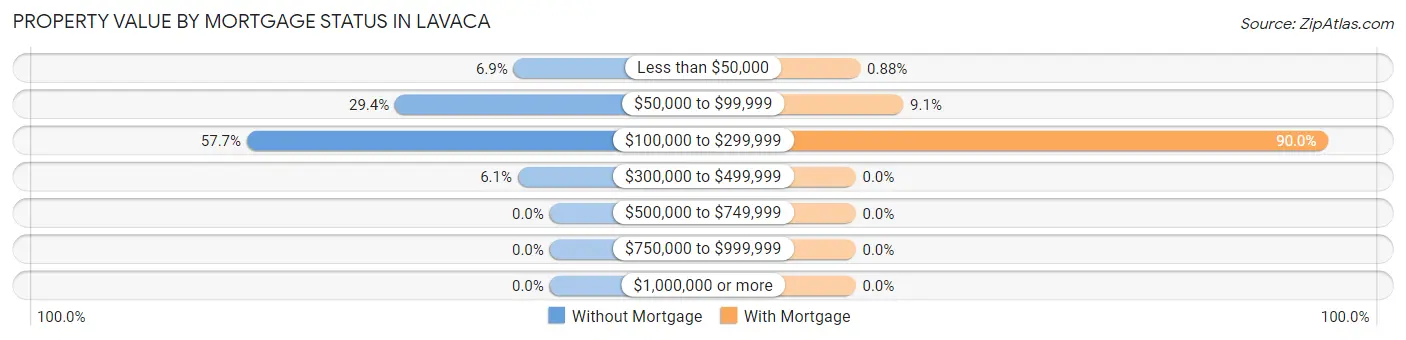
| Property Value | Without Mortgage | With Mortgage |
| Less than $50,000 | 17 (6.9%) | 4 (0.9%) |
| $50,000 to $99,999 | 73 (29.4%) | 41 (9.1%) |
| $100,000 to $299,999 | 143 (57.7%) | 407 (90.0%) |
| $300,000 to $499,999 | 15 (6.0%) | 0 (0.0%) |
| $500,000 to $749,999 | 0 (0.0%) | 0 (0.0%) |
| $750,000 to $999,999 | 0 (0.0%) | 0 (0.0%) |
| $1,000,000 or more | 0 (0.0%) | 0 (0.0%) |
| Total | 248 (100.0%) | 452 (100.0%) |
Household Income by Mortgage Status in Lavaca
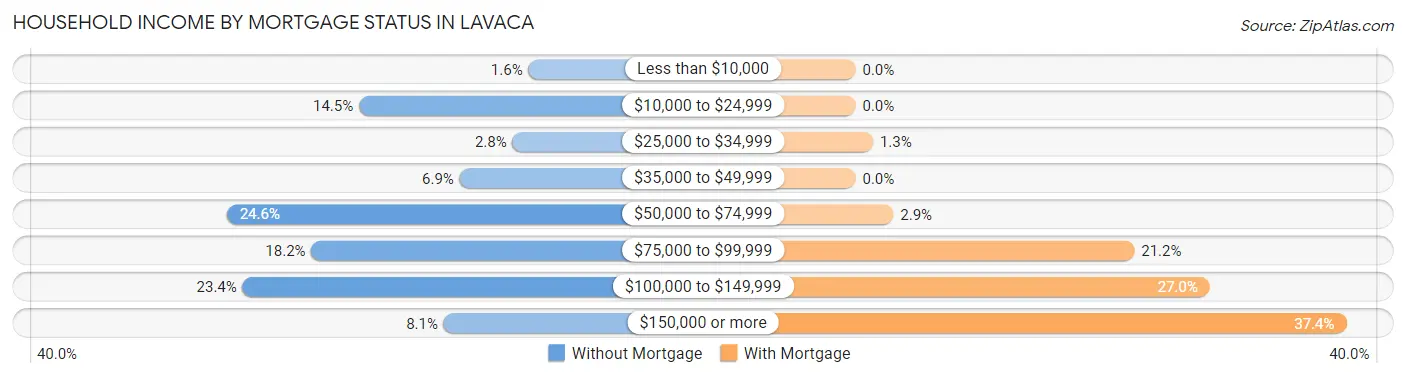
| Household Income | Without Mortgage | With Mortgage |
| Less than $10,000 | 4 (1.6%) | 0 (0.0%) |
| $10,000 to $24,999 | 36 (14.5%) | 0 (0.0%) |
| $25,000 to $34,999 | 7 (2.8%) | 6 (1.3%) |
| $35,000 to $49,999 | 17 (6.9%) | 0 (0.0%) |
| $50,000 to $74,999 | 61 (24.6%) | 13 (2.9%) |
| $75,000 to $99,999 | 45 (18.1%) | 96 (21.2%) |
| $100,000 to $149,999 | 58 (23.4%) | 122 (27.0%) |
| $150,000 or more | 20 (8.1%) | 169 (37.4%) |
| Total | 248 (100.0%) | 452 (100.0%) |
Property Value to Household Income Ratio in Lavaca
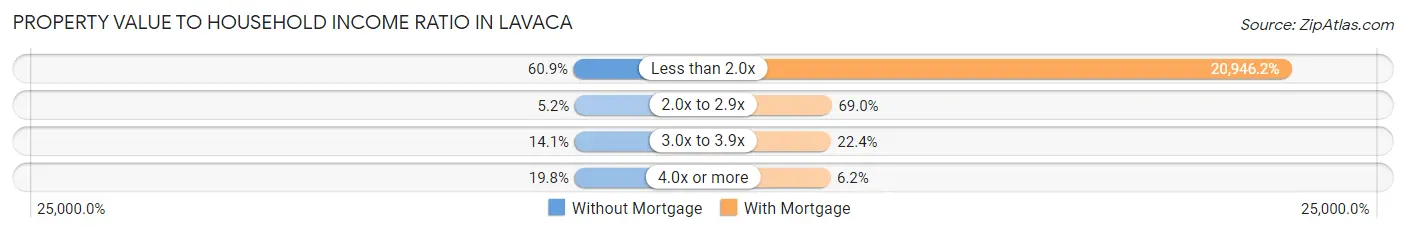
| Value-to-Income Ratio | Without Mortgage | With Mortgage |
| Less than 2.0x | 151 (60.9%) | 94,677 (20,946.2%) |
| 2.0x to 2.9x | 13 (5.2%) | 312 (69.0%) |
| 3.0x to 3.9x | 35 (14.1%) | 101 (22.4%) |
| 4.0x or more | 49 (19.8%) | 28 (6.2%) |
| Total | 248 (100.0%) | 452 (100.0%) |
Real Estate Taxes by Mortgage Status in Lavaca
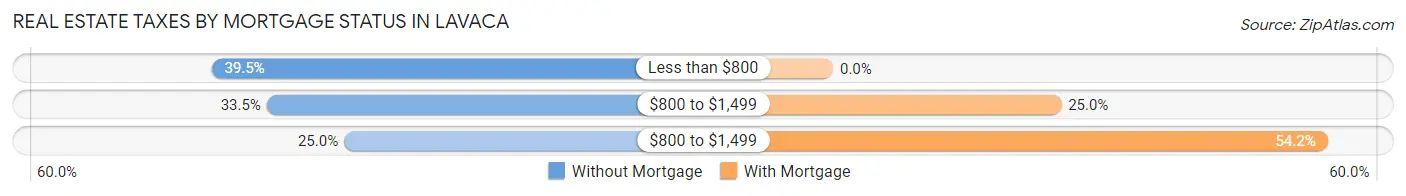
| Property Taxes | Without Mortgage | With Mortgage |
| Less than $800 | 98 (39.5%) | 0 (0.0%) |
| $800 to $1,499 | 83 (33.5%) | 113 (25.0%) |
| $800 to $1,499 | 62 (25.0%) | 245 (54.2%) |
| Total | 248 (100.0%) | 452 (100.0%) |
Health & Disability in Lavaca
Health Insurance Coverage by Age in Lavaca
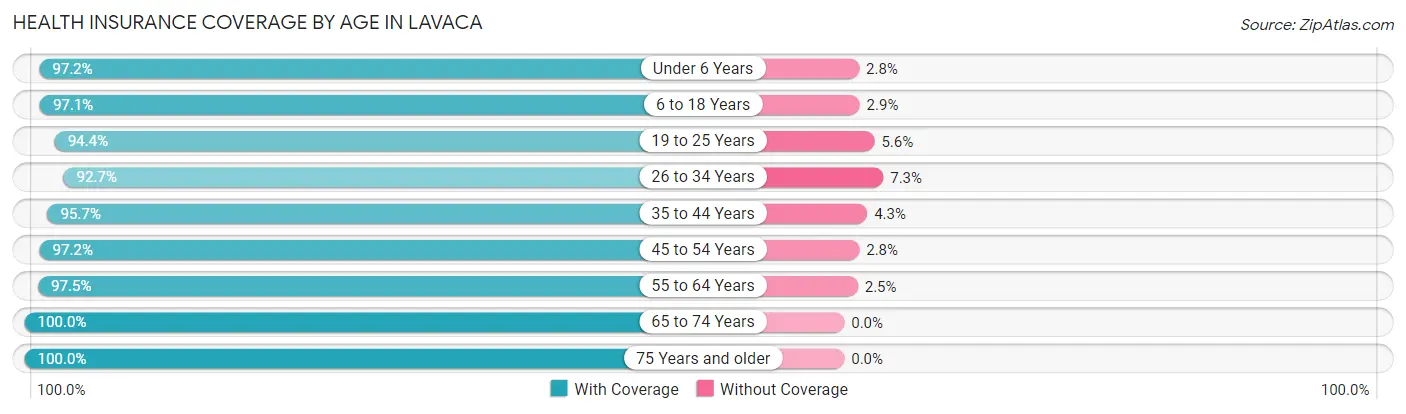
| Age Bracket | With Coverage | Without Coverage |
| Under 6 Years | 211 (97.2%) | 6 (2.8%) |
| 6 to 18 Years | 541 (97.1%) | 16 (2.9%) |
| 19 to 25 Years | 218 (94.4%) | 13 (5.6%) |
| 26 to 34 Years | 306 (92.7%) | 24 (7.3%) |
| 35 to 44 Years | 336 (95.7%) | 15 (4.3%) |
| 45 to 54 Years | 314 (97.2%) | 9 (2.8%) |
| 55 to 64 Years | 233 (97.5%) | 6 (2.5%) |
| 65 to 74 Years | 144 (100.0%) | 0 (0.0%) |
| 75 Years and older | 70 (100.0%) | 0 (0.0%) |
| Total | 2,373 (96.4%) | 89 (3.6%) |
Health Insurance Coverage by Citizenship Status in Lavaca
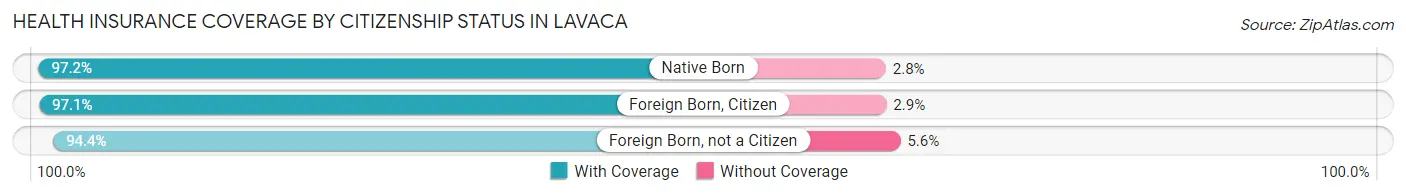
| Citizenship Status | With Coverage | Without Coverage |
| Native Born | 211 (97.2%) | 6 (2.8%) |
| Foreign Born, Citizen | 541 (97.1%) | 16 (2.9%) |
| Foreign Born, not a Citizen | 218 (94.4%) | 13 (5.6%) |
Health Insurance Coverage by Household Income in Lavaca
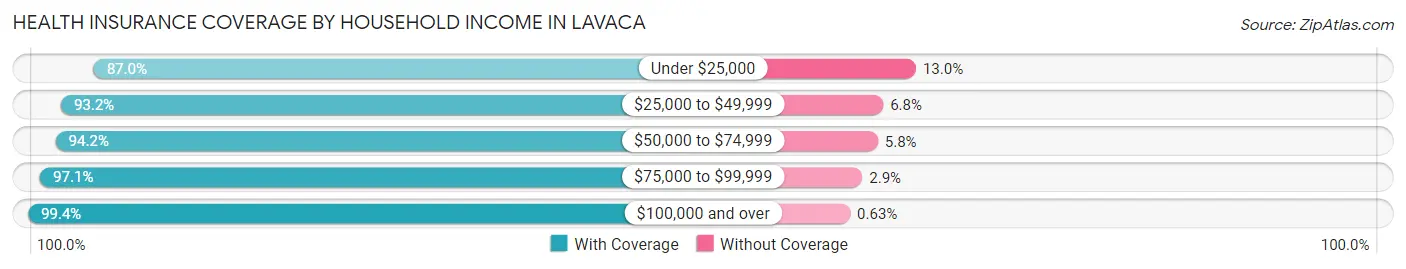
| Household Income | With Coverage | Without Coverage |
| Under $25,000 | 141 (87.0%) | 21 (13.0%) |
| $25,000 to $49,999 | 164 (93.2%) | 12 (6.8%) |
| $50,000 to $74,999 | 518 (94.2%) | 32 (5.8%) |
| $75,000 to $99,999 | 598 (97.1%) | 18 (2.9%) |
| $100,000 and over | 952 (99.4%) | 6 (0.6%) |
Public vs Private Health Insurance Coverage by Age in Lavaca
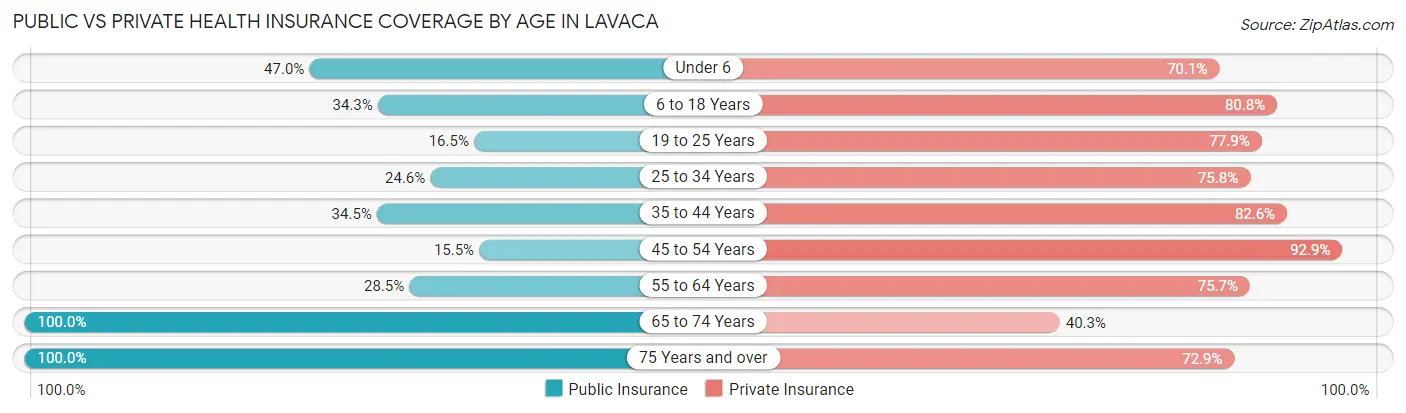
| Age Bracket | Public Insurance | Private Insurance |
| Under 6 | 102 (47.0%) | 152 (70.1%) |
| 6 to 18 Years | 191 (34.3%) | 450 (80.8%) |
| 19 to 25 Years | 38 (16.5%) | 180 (77.9%) |
| 25 to 34 Years | 81 (24.5%) | 250 (75.8%) |
| 35 to 44 Years | 121 (34.5%) | 290 (82.6%) |
| 45 to 54 Years | 50 (15.5%) | 300 (92.9%) |
| 55 to 64 Years | 68 (28.4%) | 181 (75.7%) |
| 65 to 74 Years | 144 (100.0%) | 58 (40.3%) |
| 75 Years and over | 70 (100.0%) | 51 (72.9%) |
| Total | 865 (35.1%) | 1,912 (77.7%) |
Disability Status by Sex by Age in Lavaca
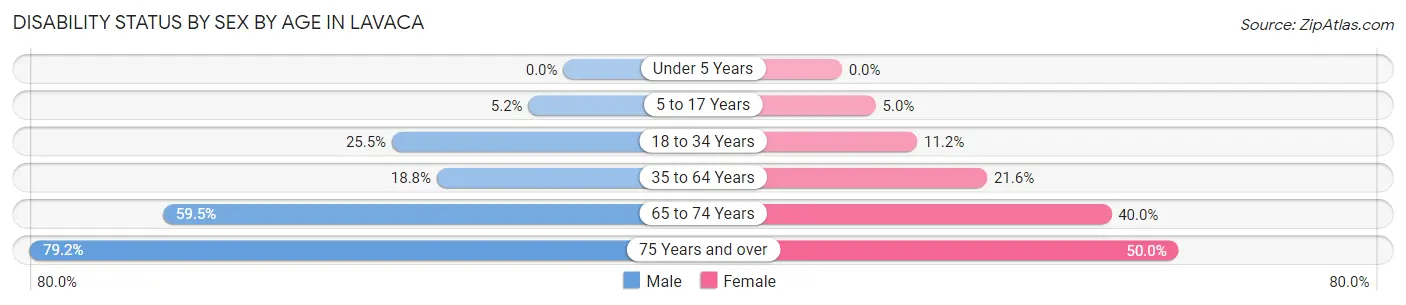
| Age Bracket | Male | Female |
| Under 5 Years | 0 (0.0%) | 0 (0.0%) |
| 5 to 17 Years | 11 (5.2%) | 16 (5.0%) |
| 18 to 34 Years | 71 (25.5%) | 38 (11.2%) |
| 35 to 64 Years | 80 (18.8%) | 105 (21.6%) |
| 65 to 74 Years | 44 (59.5%) | 28 (40.0%) |
| 75 Years and over | 19 (79.2%) | 23 (50.0%) |
Disability Class by Sex by Age in Lavaca
Disability Class: Hearing Difficulty
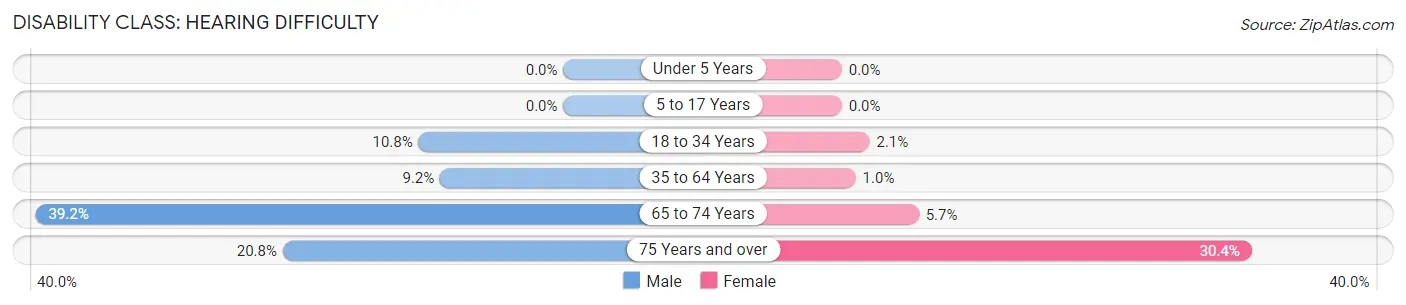
| Age Bracket | Male | Female |
| Under 5 Years | 0 (0.0%) | 0 (0.0%) |
| 5 to 17 Years | 0 (0.0%) | 0 (0.0%) |
| 18 to 34 Years | 30 (10.7%) | 7 (2.1%) |
| 35 to 64 Years | 39 (9.1%) | 5 (1.0%) |
| 65 to 74 Years | 29 (39.2%) | 4 (5.7%) |
| 75 Years and over | 5 (20.8%) | 14 (30.4%) |
Disability Class: Vision Difficulty
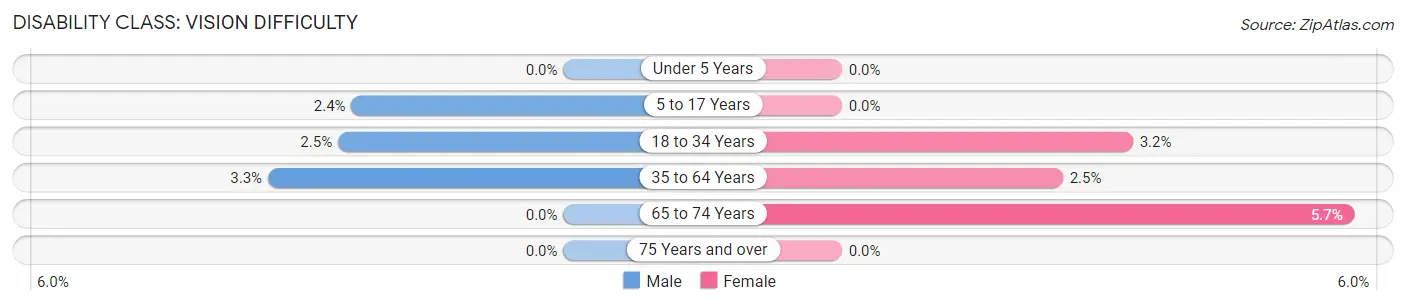
| Age Bracket | Male | Female |
| Under 5 Years | 0 (0.0%) | 0 (0.0%) |
| 5 to 17 Years | 5 (2.4%) | 0 (0.0%) |
| 18 to 34 Years | 7 (2.5%) | 11 (3.2%) |
| 35 to 64 Years | 14 (3.3%) | 12 (2.5%) |
| 65 to 74 Years | 0 (0.0%) | 4 (5.7%) |
| 75 Years and over | 0 (0.0%) | 0 (0.0%) |
Disability Class: Cognitive Difficulty
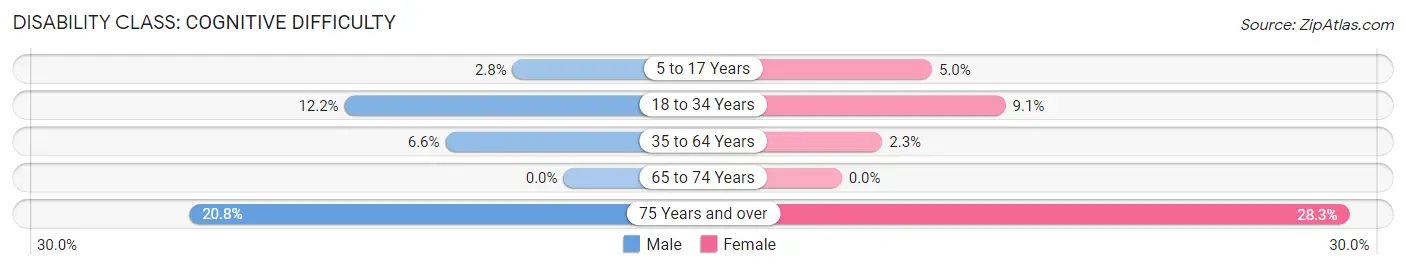
| Age Bracket | Male | Female |
| 5 to 17 Years | 6 (2.8%) | 16 (5.0%) |
| 18 to 34 Years | 34 (12.2%) | 31 (9.1%) |
| 35 to 64 Years | 28 (6.6%) | 11 (2.3%) |
| 65 to 74 Years | 0 (0.0%) | 0 (0.0%) |
| 75 Years and over | 5 (20.8%) | 13 (28.3%) |
Disability Class: Ambulatory Difficulty
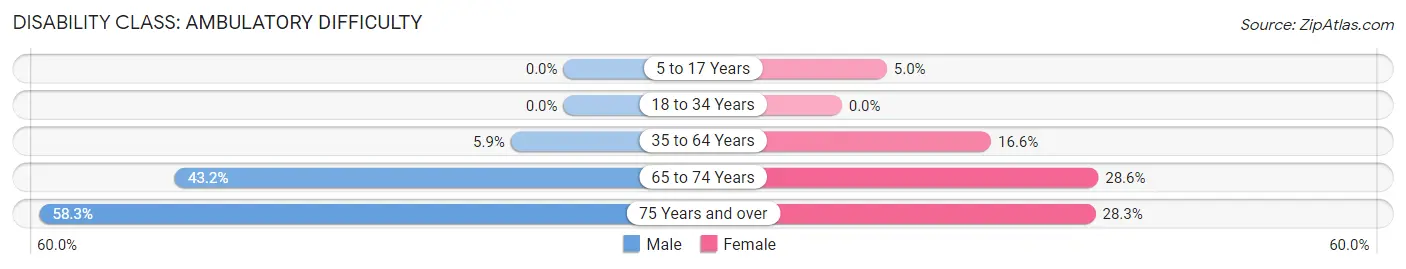
| Age Bracket | Male | Female |
| 5 to 17 Years | 0 (0.0%) | 16 (5.0%) |
| 18 to 34 Years | 0 (0.0%) | 0 (0.0%) |
| 35 to 64 Years | 25 (5.9%) | 81 (16.6%) |
| 65 to 74 Years | 32 (43.2%) | 20 (28.6%) |
| 75 Years and over | 14 (58.3%) | 13 (28.3%) |
Disability Class: Self-Care Difficulty
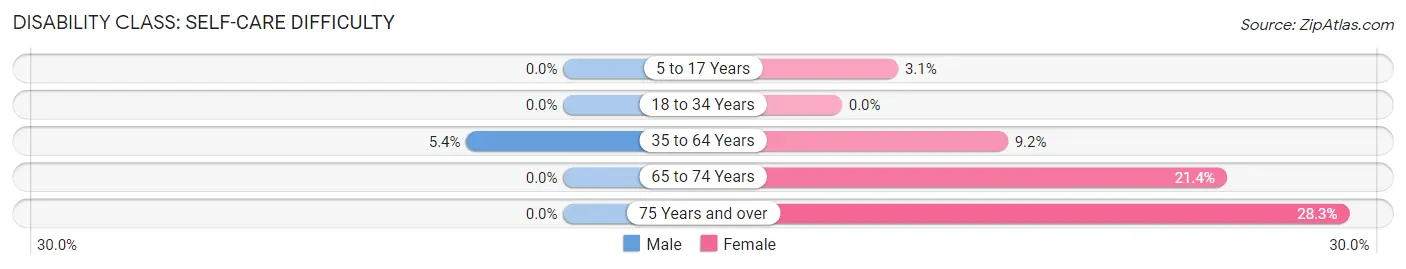
| Age Bracket | Male | Female |
| 5 to 17 Years | 0 (0.0%) | 10 (3.1%) |
| 18 to 34 Years | 0 (0.0%) | 0 (0.0%) |
| 35 to 64 Years | 23 (5.4%) | 45 (9.2%) |
| 65 to 74 Years | 0 (0.0%) | 15 (21.4%) |
| 75 Years and over | 0 (0.0%) | 13 (28.3%) |
Technology Access in Lavaca
Computing Device Access in Lavaca
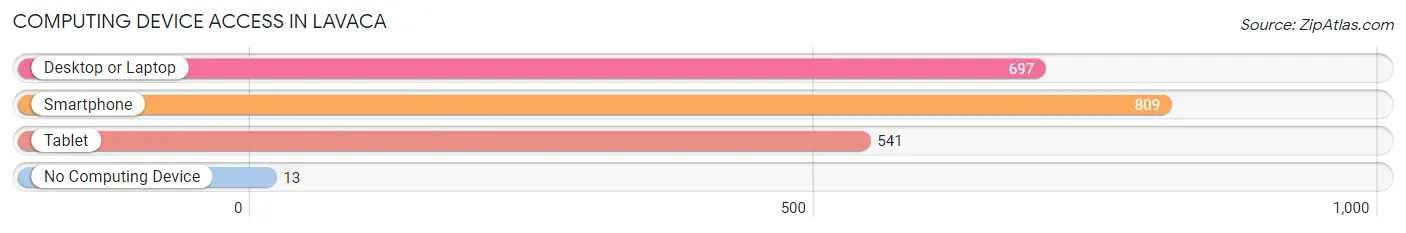
| Device Type | # Households | % Households |
| Desktop or Laptop | 697 | 82.8% |
| Smartphone | 809 | 96.1% |
| Tablet | 541 | 64.2% |
| No Computing Device | 13 | 1.5% |
| Total | 842 | 100.0% |
Internet Access in Lavaca
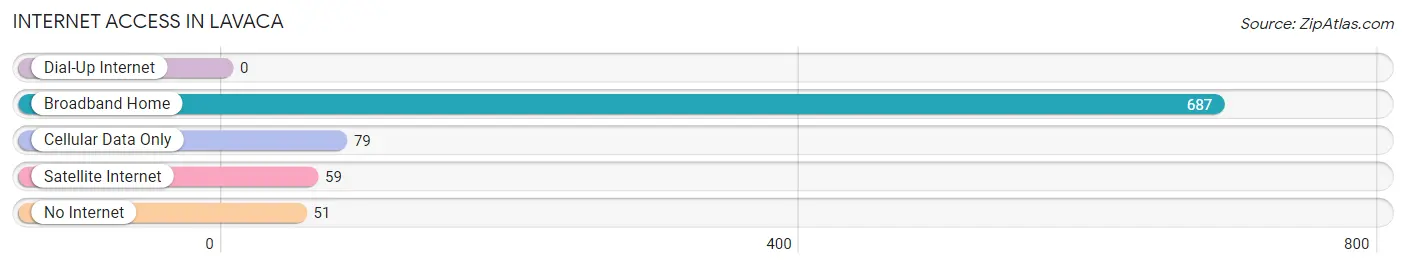
| Internet Type | # Households | % Households |
| Dial-Up Internet | 0 | 0.0% |
| Broadband Home | 687 | 81.6% |
| Cellular Data Only | 79 | 9.4% |
| Satellite Internet | 59 | 7.0% |
| No Internet | 51 | 6.1% |
| Total | 842 | 100.0% |
Lavaca Summary
Lavaca is a city located in Sebastian County, Arkansas, United States. It is part of the Fort Smith, Arkansas-Oklahoma Metropolitan Statistical Area. The population was 2,845 at the 2010 census, an increase of 8.3 percent from 2,622 at the 2000 census.
History
Lavaca was founded in 1836 by a group of settlers from Georgia and Alabama. The town was named after the La Vaca River, which flows through the area. The first post office was established in 1837.
In 1845, the town was incorporated and a mayor and aldermen were elected. The first school was built in 1848.
In 1851, the first newspaper, the Lavaca Gazette, was established. The first bank was established in 1853.
In 1871, the first railroad line was built, connecting Lavaca to Fort Smith. This allowed the town to become a major shipping center for the surrounding area.
In 1883 the first telephone line was established in Lavaca
In the early 1900s, the town experienced a period of growth and prosperity. Several new businesses were established, including a cotton gin, a lumber mill, and a brick factory.
In the 1920s, the town experienced a period of decline. The Great Depression of the 1930s further exacerbated the situation.
In the 1940s, the town began to experience a period of recovery. Several new businesses were established, including a canning factory and a furniture factory.
In the 1950s, the town experienced a period of growth and prosperity. Several new businesses were established, including a clothing factory and a shoe factory.
In the 1960s, the town experienced a period of decline. Several businesses closed and the population decreased.
In the 1970s, the town experienced a period of recovery. Several new businesses were established, including a furniture factory and a printing company.
In the 1980s, the town experienced a period of growth and prosperity. Several new businesses were established, including a plastics factory and a printing company.
In the 1990s, the town experienced a period of decline. Several businesses closed and the population decreased.
Geography
Lavaca is located at 35 17 25 North 94 20 45 West 35 290278 94 345833
According to the United States Census Bureau, the city has a total area of 2.2 square miles (5.7 km2), all land.
Economy
The economy of Lavaca is largely based on agriculture and manufacturing. The city is home to several factories, including a plastics factory, a furniture factory, and a printing company.
The city is also home to several retail stores, including a grocery store, a hardware store, and a clothing store.
Demographics
As of the census of 2000, there were 2,622 people, 1,039 households, and 717 families residing in the city. The population density was 1,179.2 people per square mile (455.7/km2). There were 1,097 housing units at an average density of 492.2 per square mile (190.2/km2). The racial makeup of the city was 92.45% White, 0.19% Black or African American, 0.76% Native American, 0.08% Asian, 0.04% Pacific Islander, 5.17% from other races, and 1.31% from two or more races. 8.45% of the population were Hispanic or Latino of any race.
There were 1,039 households, out of which 33.2% had children under the age of 18 living with them, 54.2% were married couples living together, 12.2% had a female householder with no husband present, and 29.2% were non-families. 25.3% of all households were made up of individuals, and 12.7% had someone living alone who was 65 years of age or older. The average household size was 2.52 and the average family size was 3.02.
In the city, the population was spread out, with 26.2% under the age of 18, 8.7% from 18 to 24, 27.2% from 25 to 44, 22.2% from 45 to 64, and 15.7% who were 65 years of age or older. The median age was 36 years. For every 100 females, there were 92.2 males. For every 100 females age 18 and over, there were 87.7 males.
The median income for a household in the city was $27,917, and the median income for a family was $32,917. Males had a median income of $27,917 versus $20,000 for females. The per capita income for the city was $14,917. About 13.2% of families and 16.2% of the population were below the poverty line, including 22.2% of those under age 18 and 14.2% of those age 65 or over.
Common Questions
What is Per Capita Income in Lavaca?
Per Capita income in Lavaca is $31,598.
What is the Median Family Income in Lavaca?
Median Family Income in Lavaca is $93,427.
What is the Median Household income in Lavaca?
Median Household Income in Lavaca is $87,500.
What is Income or Wage Gap in Lavaca?
Income or Wage Gap in Lavaca is 47.3%.
Women in Lavaca earn 52.7 cents for every dollar earned by a man.
What is Inequality or Gini Index in Lavaca?
Inequality or Gini Index in Lavaca is 0.31.
What is the Total Population of Lavaca?
Total Population of Lavaca is 2,467.
What is the Total Male Population of Lavaca?
Total Male Population of Lavaca is 1,105.
What is the Total Female Population of Lavaca?
Total Female Population of Lavaca is 1,362.
What is the Ratio of Males per 100 Females in Lavaca?
There are 81.13 Males per 100 Females in Lavaca.
What is the Ratio of Females per 100 Males in Lavaca?
There are 123.26 Females per 100 Males in Lavaca.
What is the Median Population Age in Lavaca?
Median Population Age in Lavaca is 31.4 Years.
What is the Average Family Size in Lavaca
Average Family Size in Lavaca is 3.2 People.
What is the Average Household Size in Lavaca
Average Household Size in Lavaca is 2.9 People.
How Large is the Labor Force in Lavaca?
There are 1,407 People in the Labor Forcein in Lavaca.
What is the Percentage of People in the Labor Force in Lavaca?
75.6% of People are in the Labor Force in Lavaca.
What is the Unemployment Rate in Lavaca?
Unemployment Rate in Lavaca is 1.9%.