Lamar, AR
Lamar Map
Lamar Overview
1,731
TOTAL POPULATION
805
MALE POPULATION
926
FEMALE POPULATION
86.93
MALES / 100 FEMALES
115.03
FEMALES / 100 MALES
31.0
MEDIAN AGE
3.2
AVG FAMILY SIZE
2.7
AVG HOUSEHOLD SIZE
$22,196
PER CAPITA INCOME
$51,875
AVG FAMILY INCOME
$41,188
AVG HOUSEHOLD INCOME
41.2%
WAGE / INCOME GAP [ % ]
58.8¢/ $1
WAGE / INCOME GAP [ $ ]
0.51
INEQUALITY / GINI INDEX
667
LABOR FORCE [ PEOPLE ]
53.2%
PERCENT IN LABOR FORCE
2.9%
UNEMPLOYMENT RATE
Lamar Zip Codes
Lamar Area Codes
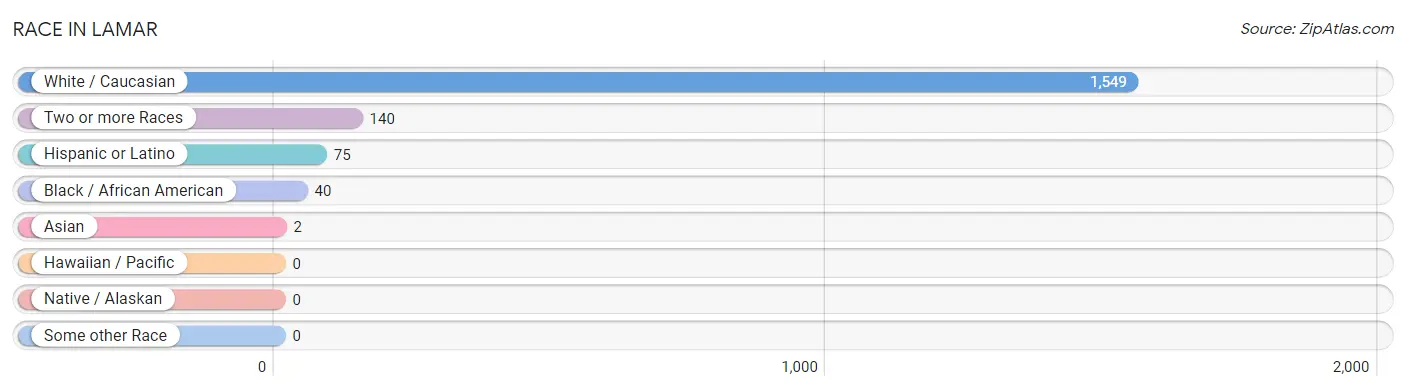
Race in Lamar
The most populous races in Lamar are White / Caucasian (1,549 | 89.5%), Two or more Races (140 | 8.1%), and Hispanic or Latino (75 | 4.3%).
| Race | # Population | % Population |
| Asian | 2 | 0.1% |
| Black / African American | 40 | 2.3% |
| Hawaiian / Pacific | 0 | 0.0% |
| Hispanic or Latino | 75 | 4.3% |
| Native / Alaskan | 0 | 0.0% |
| White / Caucasian | 1,549 | 89.5% |
| Two or more Races | 140 | 8.1% |
| Some other Race | 0 | 0.0% |
| Total | 1,731 | 100.0% |
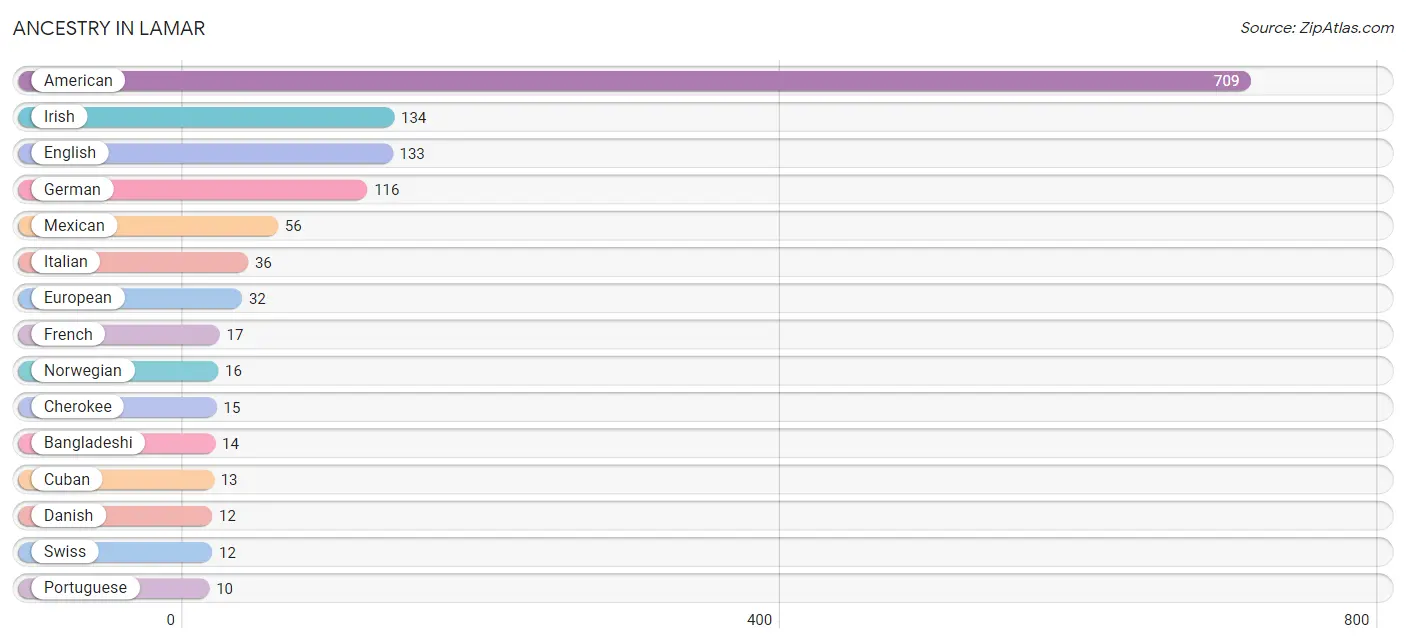
Ancestry in Lamar
The most populous ancestries reported in Lamar are American (709 | 41.0%), Irish (134 | 7.7%), English (133 | 7.7%), German (116 | 6.7%), and Mexican (56 | 3.2%), together accounting for 66.3% of all Lamar residents.
| Ancestry | # Population | % Population |
| American | 709 | 41.0% |
| Bangladeshi | 14 | 0.8% |
| Blackfeet | 6 | 0.4% |
| Central American | 6 | 0.4% |
| Cherokee | 15 | 0.9% |
| Choctaw | 3 | 0.2% |
| Cuban | 13 | 0.7% |
| Danish | 12 | 0.7% |
| English | 133 | 7.7% |
| European | 32 | 1.8% |
| French | 17 | 1.0% |
| German | 116 | 6.7% |
| Indian (Asian) | 2 | 0.1% |
| Irish | 134 | 7.7% |
| Italian | 36 | 2.1% |
| Mexican | 56 | 3.2% |
| Norwegian | 16 | 0.9% |
| Portuguese | 10 | 0.6% |
| Salvadoran | 6 | 0.4% |
| Scotch-Irish | 3 | 0.2% |
| Scottish | 6 | 0.4% |
| Swiss | 12 | 0.7% |
| Ukrainian | 4 | 0.2% |
| Welsh | 4 | 0.2% | View All 24 Rows |
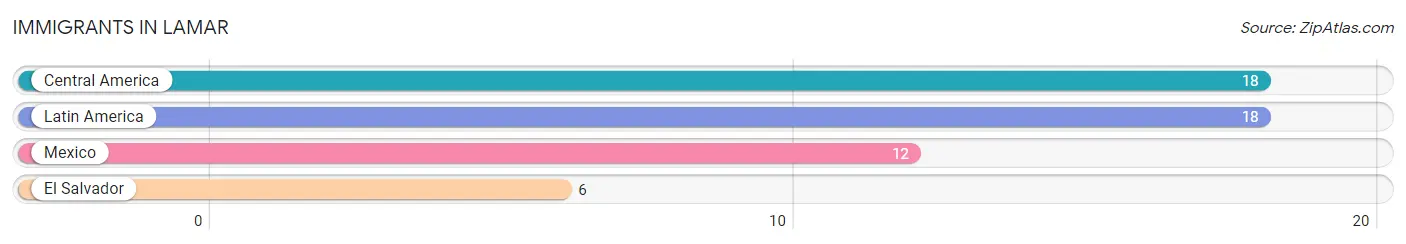
Immigrants in Lamar
The most numerous immigrant groups reported in Lamar came from Central America (18 | 1.0%), Latin America (18 | 1.0%), Mexico (12 | 0.7%), and El Salvador (6 | 0.4%), together accounting for 3.1% of all Lamar residents.
| Immigration Origin | # Population | % Population |
| Central America | 18 | 1.0% |
| El Salvador | 6 | 0.4% |
| Latin America | 18 | 1.0% |
| Mexico | 12 | 0.7% | View All 4 Rows |
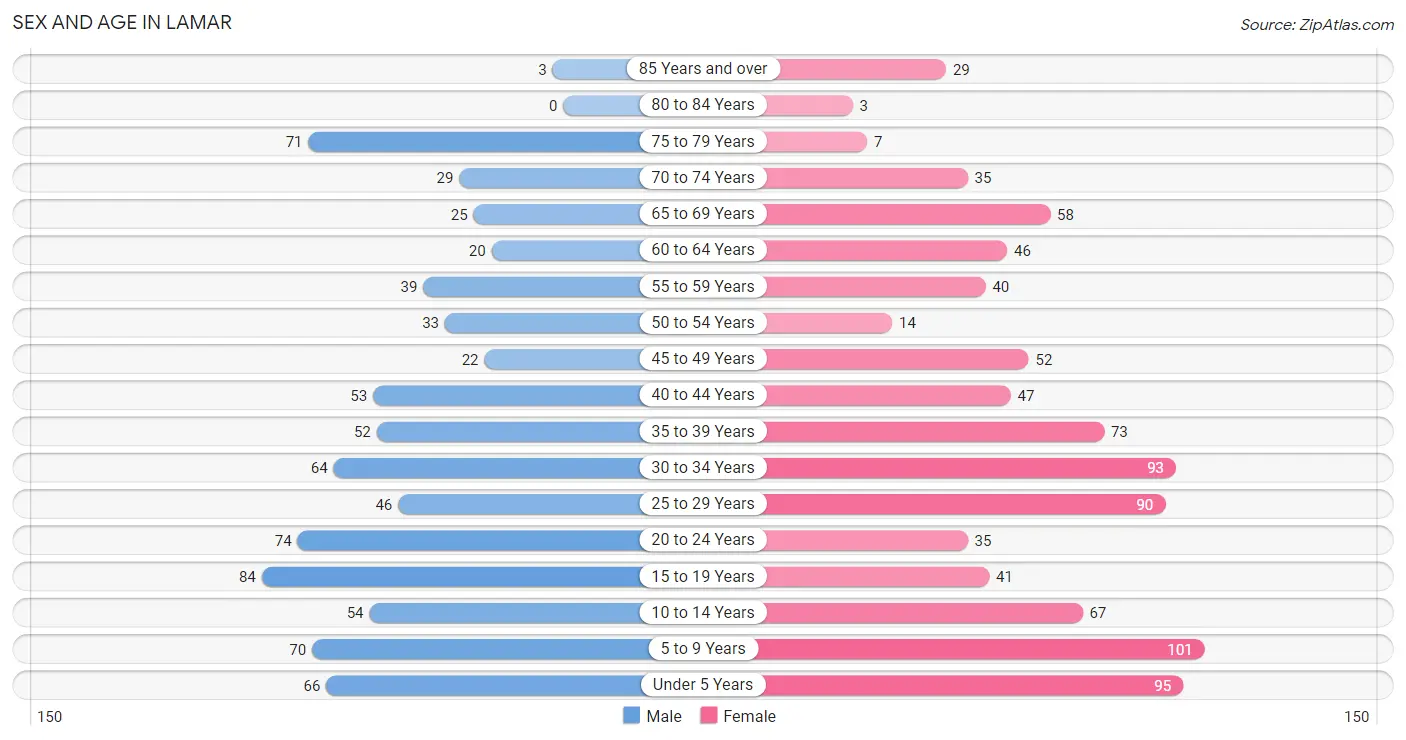
Sex and Age in Lamar
Sex and Age in Lamar
The most populous age groups in Lamar are 15 to 19 Years (84 | 10.4%) for men and 5 to 9 Years (101 | 10.9%) for women.
| Age Bracket | Male | Female |
| Under 5 Years | 66 (8.2%) | 95 (10.3%) |
| 5 to 9 Years | 70 (8.7%) | 101 (10.9%) |
| 10 to 14 Years | 54 (6.7%) | 67 (7.2%) |
| 15 to 19 Years | 84 (10.4%) | 41 (4.4%) |
| 20 to 24 Years | 74 (9.2%) | 35 (3.8%) |
| 25 to 29 Years | 46 (5.7%) | 90 (9.7%) |
| 30 to 34 Years | 64 (8.0%) | 93 (10.0%) |
| 35 to 39 Years | 52 (6.5%) | 73 (7.9%) |
| 40 to 44 Years | 53 (6.6%) | 47 (5.1%) |
| 45 to 49 Years | 22 (2.7%) | 52 (5.6%) |
| 50 to 54 Years | 33 (4.1%) | 14 (1.5%) |
| 55 to 59 Years | 39 (4.8%) | 40 (4.3%) |
| 60 to 64 Years | 20 (2.5%) | 46 (5.0%) |
| 65 to 69 Years | 25 (3.1%) | 58 (6.3%) |
| 70 to 74 Years | 29 (3.6%) | 35 (3.8%) |
| 75 to 79 Years | 71 (8.8%) | 7 (0.8%) |
| 80 to 84 Years | 0 (0.0%) | 3 (0.3%) |
| 85 Years and over | 3 (0.4%) | 29 (3.1%) |
| Total | 805 (100.0%) | 926 (100.0%) |
Families and Households in Lamar
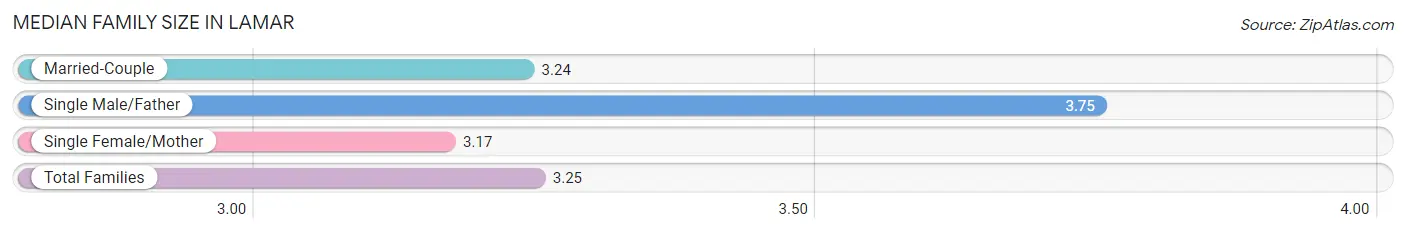
Median Family Size in Lamar
The median family size in Lamar is 3.25 persons per family, with single male/father families (20 | 4.6%) accounting for the largest median family size of 3.75 persons per family. On the other hand, single female/mother families (87 | 20.0%) represent the smallest median family size with 3.17 persons per family.
| Family Type | # Families | Family Size |
| Married-Couple | 328 (75.4%) | 3.24 |
| Single Male/Father | 20 (4.6%) | 3.75 |
| Single Female/Mother | 87 (20.0%) | 3.17 |
| Total Families | 435 (100.0%) | 3.25 |
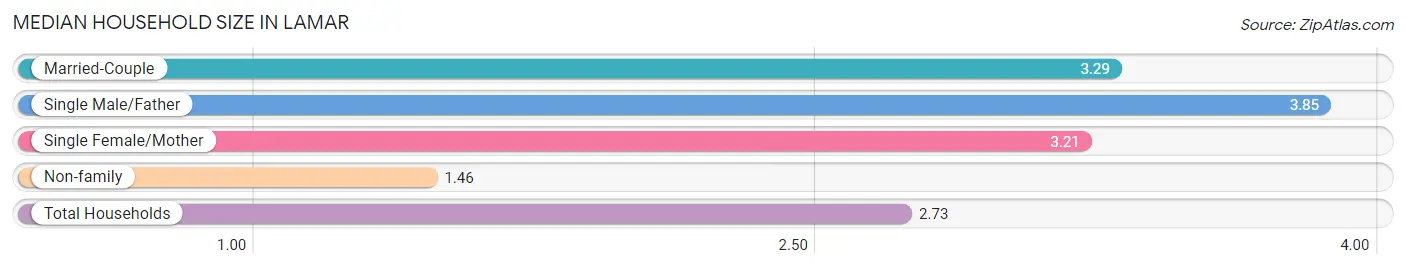
Median Household Size in Lamar
The median household size in Lamar is 2.73 persons per household, with single male/father households (20 | 3.2%) accounting for the largest median household size of 3.85 persons per household. non-family households (194 | 30.8%) represent the smallest median household size with 1.46 persons per household.
| Household Type | # Households | Household Size |
| Married-Couple | 328 (52.1%) | 3.29 |
| Single Male/Father | 20 (3.2%) | 3.85 |
| Single Female/Mother | 87 (13.8%) | 3.21 |
| Non-family | 194 (30.8%) | 1.46 |
| Total Households | 629 (100.0%) | 2.73 |
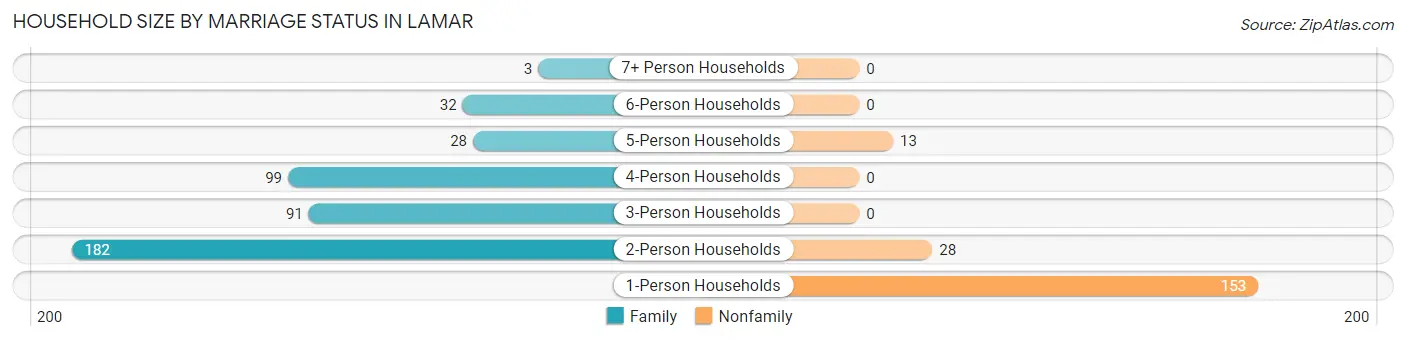
Household Size by Marriage Status in Lamar
Out of a total of 629 households in Lamar, 435 (69.2%) are family households, while 194 (30.8%) are nonfamily households. The most numerous type of family households are 2-person households, comprising 182, and the most common type of nonfamily households are 1-person households, comprising 153.
| Household Size | Family Households | Nonfamily Households |
| 1-Person Households | - | 153 (24.3%) |
| 2-Person Households | 182 (28.9%) | 28 (4.4%) |
| 3-Person Households | 91 (14.5%) | 0 (0.0%) |
| 4-Person Households | 99 (15.7%) | 0 (0.0%) |
| 5-Person Households | 28 (4.4%) | 13 (2.1%) |
| 6-Person Households | 32 (5.1%) | 0 (0.0%) |
| 7+ Person Households | 3 (0.5%) | 0 (0.0%) |
| Total | 435 (69.2%) | 194 (30.8%) |
Female Fertility in Lamar
Fertility by Age in Lamar
Average fertility rate in Lamar is 123.0 births per 1,000 women. Women in the age bracket of 20 to 34 years have the highest fertility rate with 197.0 births per 1,000 women. Women in the age bracket of 20 to 34 years acount for 81.1% of all women with births.
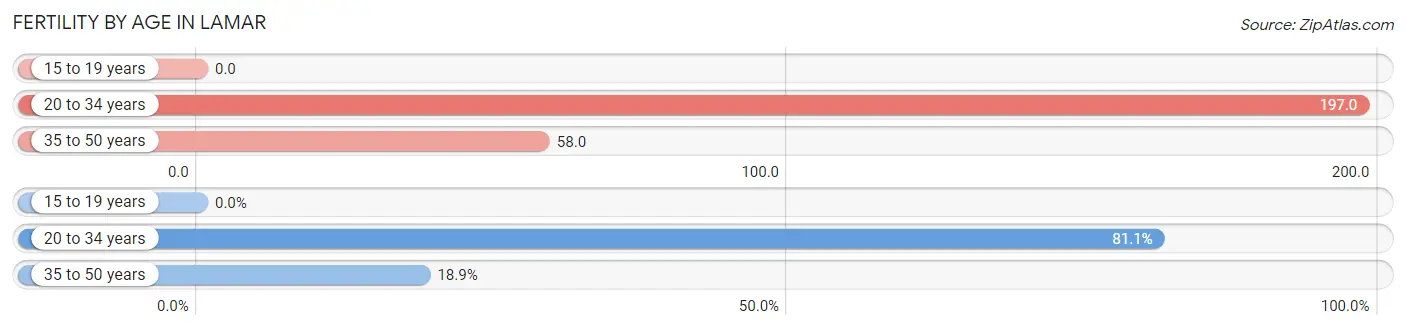
| Age Bracket | Women with Births | Births / 1,000 Women |
| 15 to 19 years | 0 (0.0%) | 0.0 |
| 20 to 34 years | 43 (81.1%) | 197.0 |
| 35 to 50 years | 10 (18.9%) | 58.0 |
| Total | 53 (100.0%) | 123.0 |
Fertility by Age by Marriage Status in Lamar
71.7% of women with births (53) in Lamar are married. The highest percentage of unmarried women with births falls into 20 to 34 years age bracket with 34.9% of them unmarried at the time of birth, while the lowest percentage of unmarried women with births belong to 35 to 50 years age bracket with 0.0% of them unmarried.
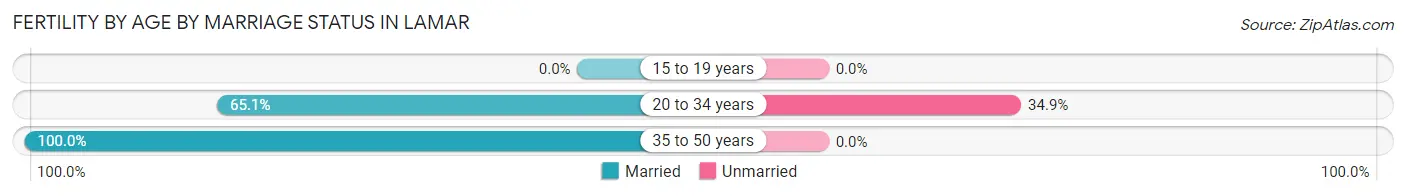
| Age Bracket | Married | Unmarried |
| 15 to 19 years | 0 (0.0%) | 0 (0.0%) |
| 20 to 34 years | 28 (65.1%) | 15 (34.9%) |
| 35 to 50 years | 10 (100.0%) | 0 (0.0%) |
| Total | 38 (71.7%) | 15 (28.3%) |
Fertility by Education in Lamar
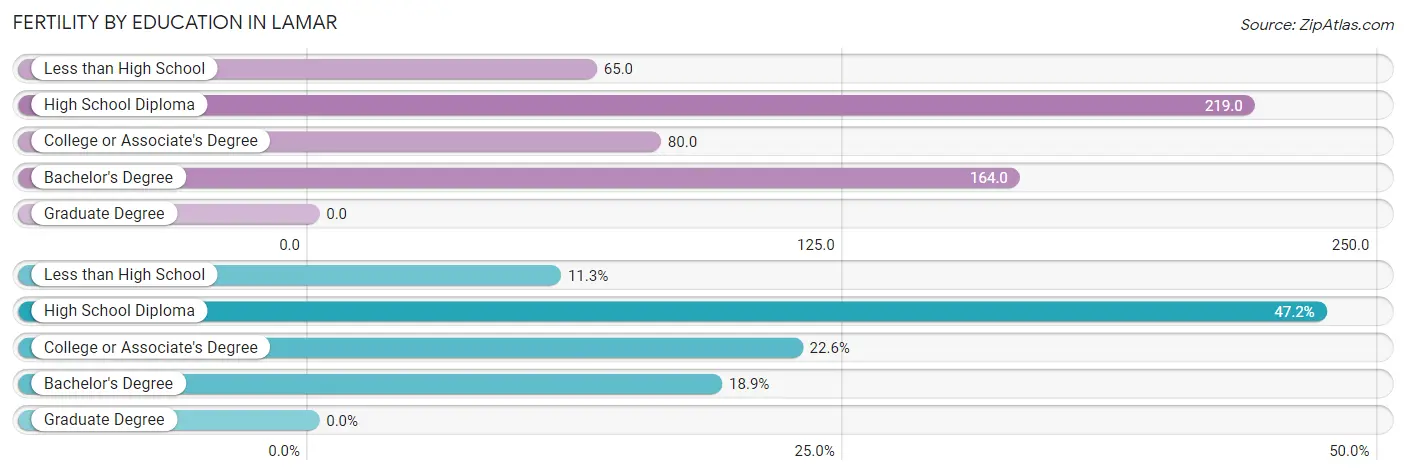
| Educational Attainment | Women with Births | Births / 1,000 Women |
| Less than High School | 6 (11.3%) | 65.0 |
| High School Diploma | 25 (47.2%) | 219.0 |
| College or Associate's Degree | 12 (22.6%) | 80.0 |
| Bachelor's Degree | 10 (18.9%) | 164.0 |
| Graduate Degree | 0 (0.0%) | 0.0 |
| Total | 53 (100.0%) | 123.0 |
Fertility by Education by Marriage Status in Lamar
28.3% of women with births in Lamar are unmarried. Women with the educational attainment of bachelor's degree are most likely to be married with 100.0% of them married at childbirth, while women with the educational attainment of high school diploma are least likely to be married with 40.0% of them unmarried at childbirth.
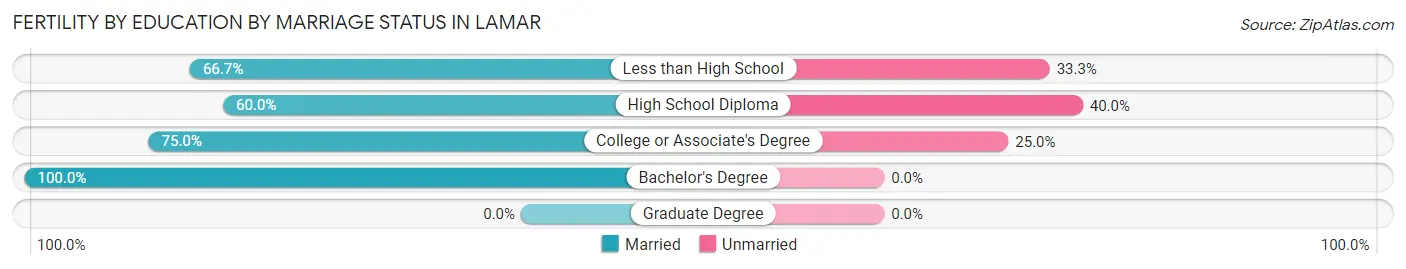
| Educational Attainment | Married | Unmarried |
| Less than High School | 4 (66.7%) | 2 (33.3%) |
| High School Diploma | 15 (60.0%) | 10 (40.0%) |
| College or Associate's Degree | 9 (75.0%) | 3 (25.0%) |
| Bachelor's Degree | 10 (100.0%) | 0 (0.0%) |
| Graduate Degree | 0 (0.0%) | 0 (0.0%) |
| Total | 38 (71.7%) | 15 (28.3%) |
Income in Lamar
Income Overview in Lamar
Per Capita Income in Lamar is $22,196, while median incomes of families and households are $51,875 and $41,188 respectively.
| Characteristic | Number | Measure |
| Per Capita Income | 1,731 | $22,196 |
| Median Family Income | 435 | $51,875 |
| Mean Family Income | 435 | $71,359 |
| Median Household Income | 629 | $41,188 |
| Mean Household Income | 629 | $61,434 |
| Income Deficit | 435 | $0 |
| Wage / Income Gap (%) | 1,731 | 41.17% |
| Wage / Income Gap ($) | 1,731 | 58.83¢ per $1 |
| Gini / Inequality Index | 1,731 | 0.51 |
Earnings by Sex in Lamar
Average Earnings in Lamar are $33,646, $42,391 for men and $24,938 for women, a difference of 41.2%.
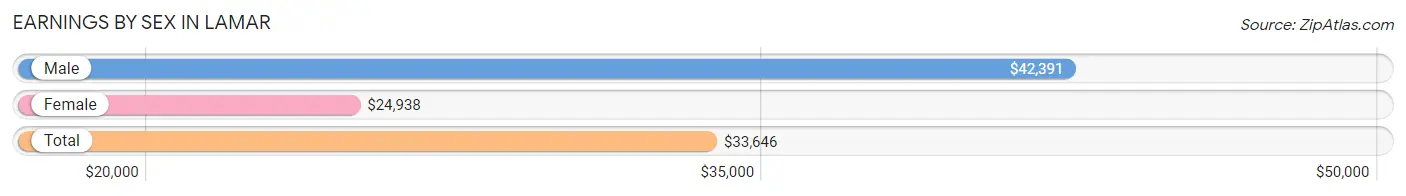
| Sex | Number | Average Earnings |
| Male | 368 (51.8%) | $42,391 |
| Female | 343 (48.2%) | $24,938 |
| Total | 711 (100.0%) | $33,646 |
Earnings by Sex by Income Bracket in Lamar
The most common earnings brackets in Lamar are $100,000+ for men (57 | 15.5%) and $55,000 to $64,999 for women (36 | 10.5%).
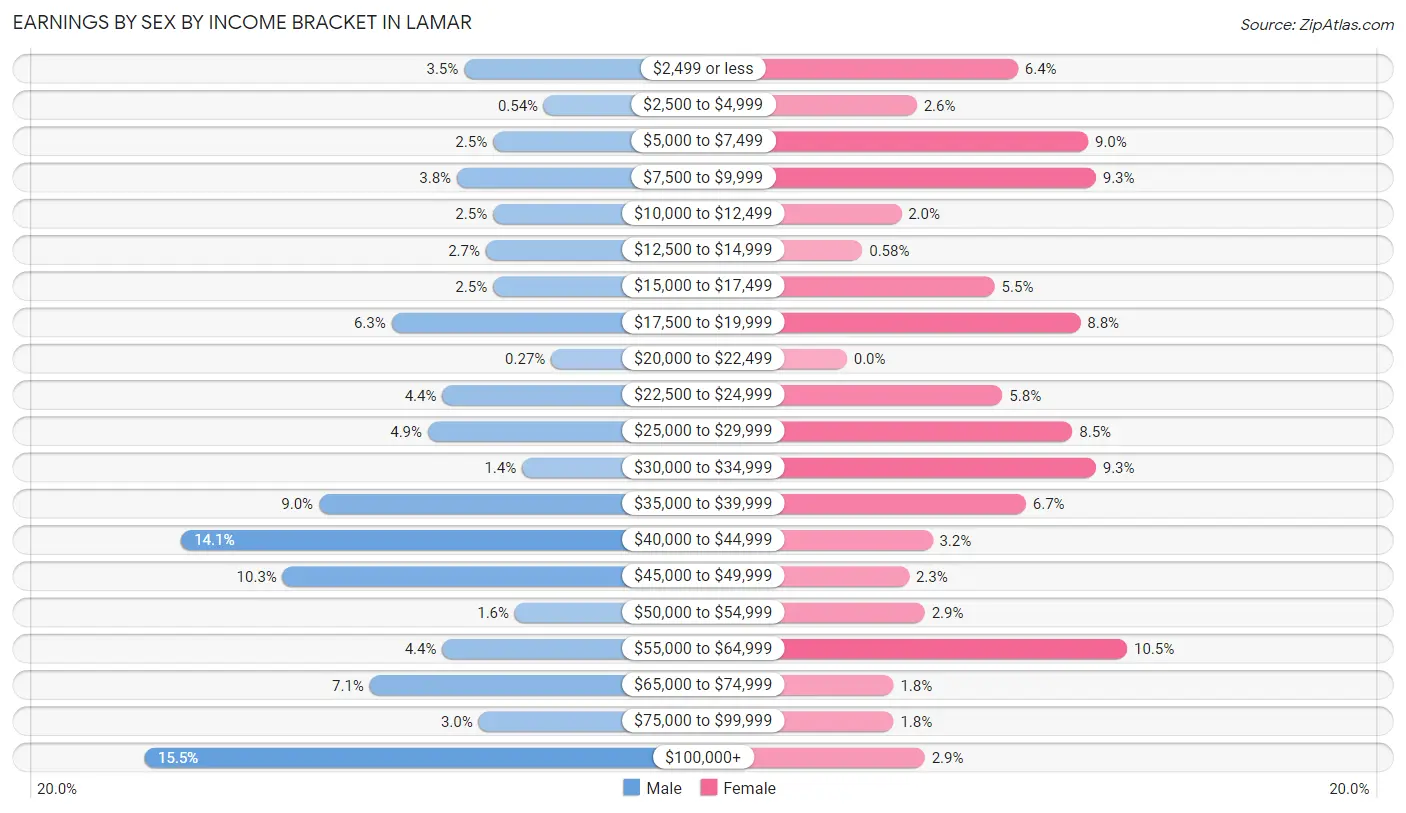
| Income | Male | Female |
| $2,499 or less | 13 (3.5%) | 22 (6.4%) |
| $2,500 to $4,999 | 2 (0.5%) | 9 (2.6%) |
| $5,000 to $7,499 | 9 (2.5%) | 31 (9.0%) |
| $7,500 to $9,999 | 14 (3.8%) | 32 (9.3%) |
| $10,000 to $12,499 | 9 (2.5%) | 7 (2.0%) |
| $12,500 to $14,999 | 10 (2.7%) | 2 (0.6%) |
| $15,000 to $17,499 | 9 (2.5%) | 19 (5.5%) |
| $17,500 to $19,999 | 23 (6.2%) | 30 (8.7%) |
| $20,000 to $22,499 | 1 (0.3%) | 0 (0.0%) |
| $22,500 to $24,999 | 16 (4.3%) | 20 (5.8%) |
| $25,000 to $29,999 | 18 (4.9%) | 29 (8.5%) |
| $30,000 to $34,999 | 5 (1.4%) | 32 (9.3%) |
| $35,000 to $39,999 | 33 (9.0%) | 23 (6.7%) |
| $40,000 to $44,999 | 52 (14.1%) | 11 (3.2%) |
| $45,000 to $49,999 | 38 (10.3%) | 8 (2.3%) |
| $50,000 to $54,999 | 6 (1.6%) | 10 (2.9%) |
| $55,000 to $64,999 | 16 (4.3%) | 36 (10.5%) |
| $65,000 to $74,999 | 26 (7.1%) | 6 (1.8%) |
| $75,000 to $99,999 | 11 (3.0%) | 6 (1.8%) |
| $100,000+ | 57 (15.5%) | 10 (2.9%) |
| Total | 368 (100.0%) | 343 (100.0%) |
Earnings by Sex by Educational Attainment in Lamar
Average earnings in Lamar are $44,440 for men and $25,556 for women, a difference of 42.5%. Men with an educational attainment of graduate degree enjoy the highest average annual earnings of $74,250, while those with bachelor's degree education earn the least with $42,143. Women with an educational attainment of graduate degree earn the most with the average annual earnings of $63,523, while those with less than high school education have the smallest earnings of $8,355.
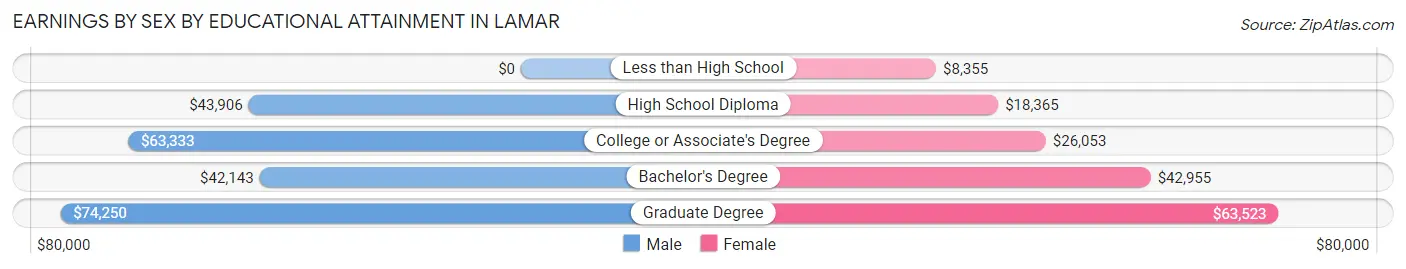
| Educational Attainment | Male Income | Female Income |
| Less than High School | - | - |
| High School Diploma | $43,906 | $18,365 |
| College or Associate's Degree | $63,333 | $26,053 |
| Bachelor's Degree | $42,143 | $42,955 |
| Graduate Degree | $74,250 | $63,523 |
| Total | $44,440 | $25,556 |
Family Income in Lamar
Family Income Brackets in Lamar
According to the Lamar family income data, there are 58 families falling into the $50,000 to $74,999 income range, which is the most common income bracket and makes up 13.3% of all families. Conversely, the $200,000+ income bracket is the least frequent group with only 28 families (6.4%) belonging to this category.
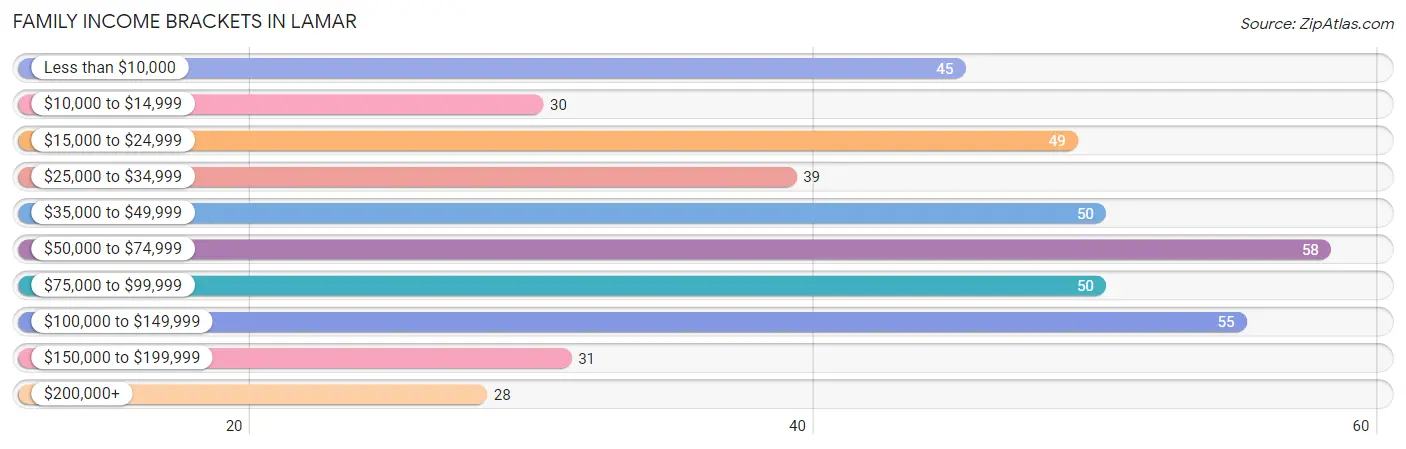
| Income Bracket | # Families | % Families |
| Less than $10,000 | 45 | 10.3% |
| $10,000 to $14,999 | 30 | 6.9% |
| $15,000 to $24,999 | 49 | 11.3% |
| $25,000 to $34,999 | 39 | 9.0% |
| $35,000 to $49,999 | 50 | 11.5% |
| $50,000 to $74,999 | 58 | 13.3% |
| $75,000 to $99,999 | 50 | 11.5% |
| $100,000 to $149,999 | 55 | 12.6% |
| $150,000 to $199,999 | 31 | 7.1% |
| $200,000+ | 28 | 6.4% |
Family Income by Famaliy Size in Lamar
3-person families (92 | 21.1%) account for the highest median family income in Lamar with $84,375 per family, while 3-person families (92 | 21.1%) have the highest median income of $28,125 per family member.
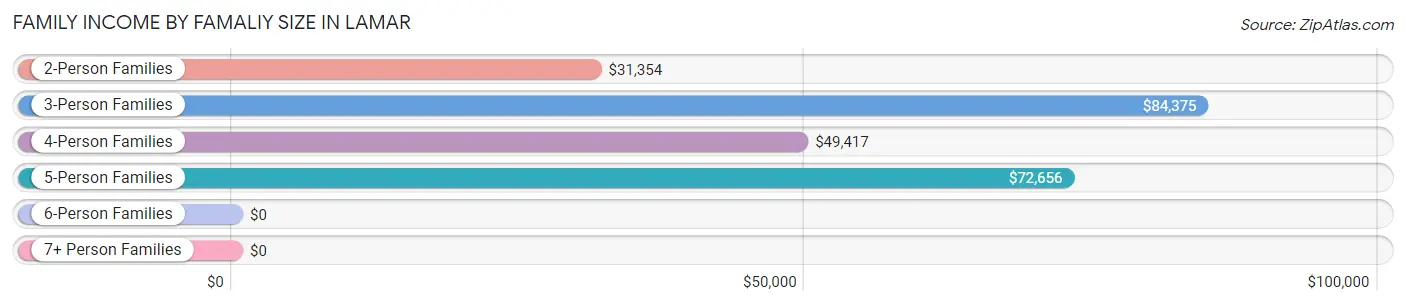
| Income Bracket | # Families | Median Income |
| 2-Person Families | 189 (43.4%) | $31,354 |
| 3-Person Families | 92 (21.1%) | $84,375 |
| 4-Person Families | 91 (20.9%) | $49,417 |
| 5-Person Families | 31 (7.1%) | $72,656 |
| 6-Person Families | 29 (6.7%) | $0 |
| 7+ Person Families | 3 (0.7%) | $0 |
| Total | 435 (100.0%) | $51,875 |
Family Income by Number of Earners in Lamar
The median family income in Lamar is $51,875, with families comprising 3+ earners (40) having the highest median family income of $117,500, while families with no earners (100) have the lowest median family income of $17,361, accounting for 9.2% and 23.0% of families, respectively.
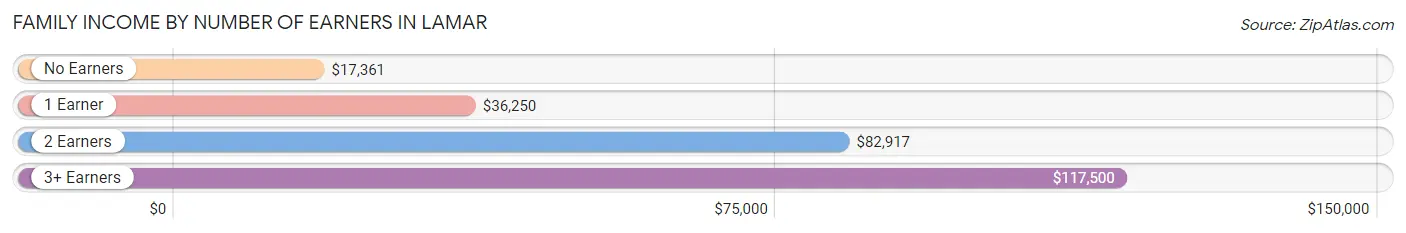
| Number of Earners | # Families | Median Income |
| No Earners | 100 (23.0%) | $17,361 |
| 1 Earner | 131 (30.1%) | $36,250 |
| 2 Earners | 164 (37.7%) | $82,917 |
| 3+ Earners | 40 (9.2%) | $117,500 |
| Total | 435 (100.0%) | $51,875 |
Household Income in Lamar
Household Income Brackets in Lamar
With 115 households falling in the category, the $15,000 to $24,999 income range is the most frequent in Lamar, accounting for 18.3% of all households. In contrast, only 28 households (4.4%) fall into the $200,000+ income bracket, making it the least populous group.
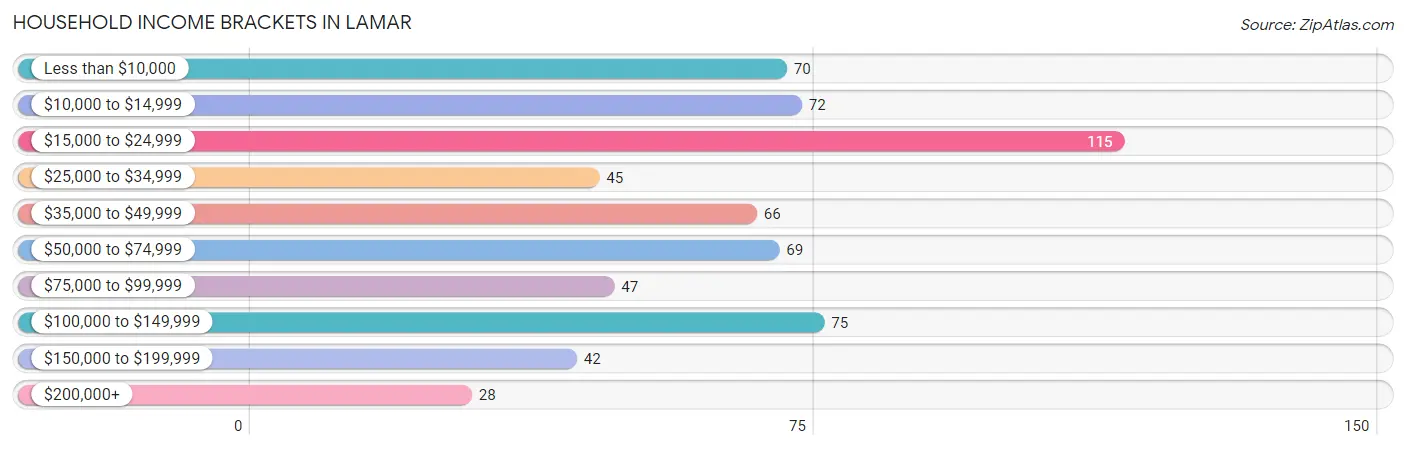
| Income Bracket | # Households | % Households |
| Less than $10,000 | 70 | 11.1% |
| $10,000 to $14,999 | 72 | 11.4% |
| $15,000 to $24,999 | 115 | 18.3% |
| $25,000 to $34,999 | 45 | 7.2% |
| $35,000 to $49,999 | 66 | 10.5% |
| $50,000 to $74,999 | 69 | 11.0% |
| $75,000 to $99,999 | 47 | 7.5% |
| $100,000 to $149,999 | 75 | 11.9% |
| $150,000 to $199,999 | 42 | 6.7% |
| $200,000+ | 28 | 4.5% |
Household Income by Householder Age in Lamar
The median household income in Lamar is $41,188, with the highest median household income of $79,375 found in the 25 to 44 years age bracket for the primary householder. A total of 243 households (38.6%) fall into this category. Meanwhile, the 45 to 64 years age bracket for the primary householder has the lowest median household income of $0, with 160 households (25.4%) in this group.
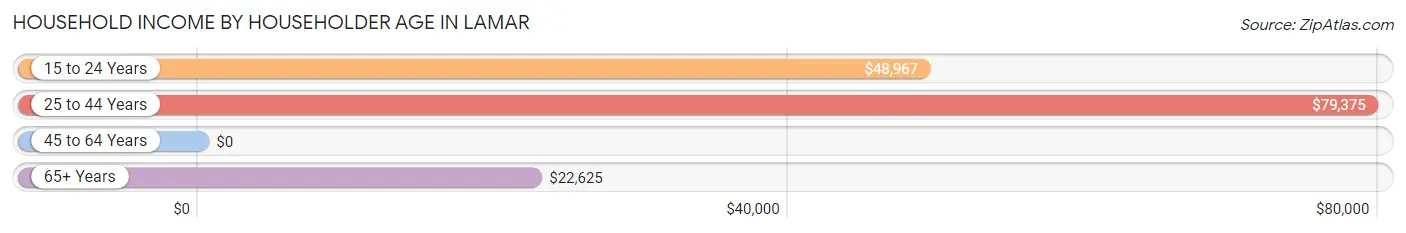
| Income Bracket | # Households | Median Income |
| 15 to 24 Years | 41 (6.5%) | $48,967 |
| 25 to 44 Years | 243 (38.6%) | $79,375 |
| 45 to 64 Years | 160 (25.4%) | $0 |
| 65+ Years | 185 (29.4%) | $22,625 |
| Total | 629 (100.0%) | $41,188 |
Poverty in Lamar
Income Below Poverty by Sex and Age in Lamar
With 21.4% poverty level for males and 36.3% for females among the residents of Lamar, 6 to 11 year old males and 12 to 14 year old females are the most vulnerable to poverty, with 43 males (55.1%) and 17 females (85.0%) in their respective age groups living below the poverty level.
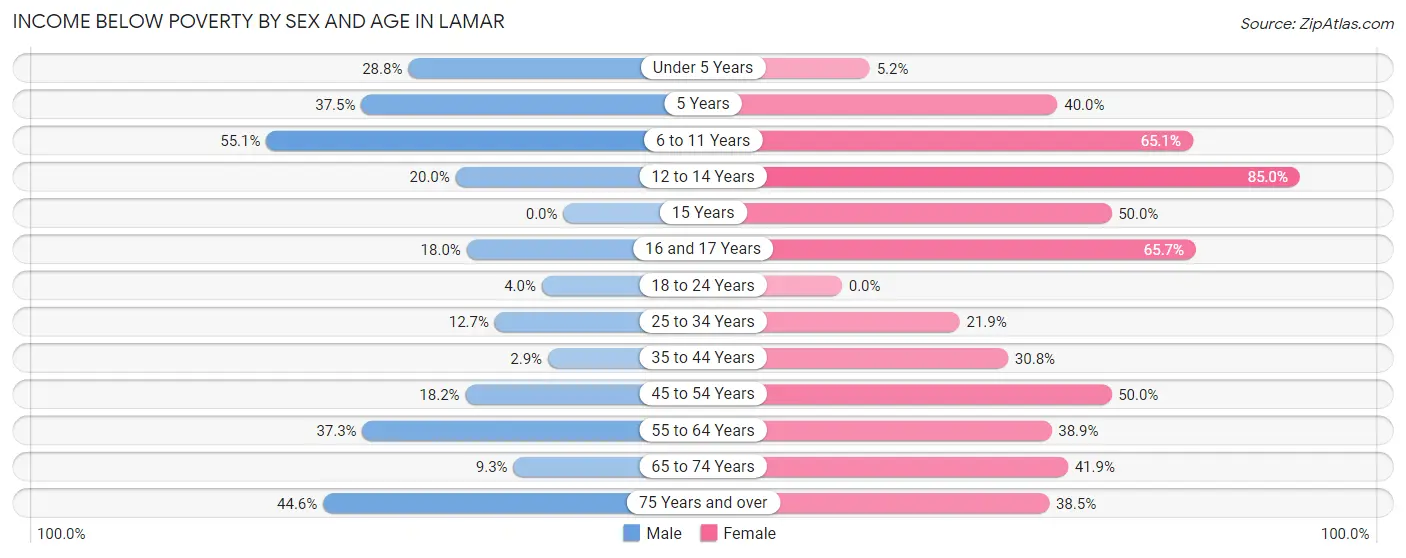
| Age Bracket | Male | Female |
| Under 5 Years | 19 (28.8%) | 4 (5.2%) |
| 5 Years | 6 (37.5%) | 8 (40.0%) |
| 6 to 11 Years | 43 (55.1%) | 71 (65.1%) |
| 12 to 14 Years | 6 (20.0%) | 17 (85.0%) |
| 15 Years | 0 (0.0%) | 3 (50.0%) |
| 16 and 17 Years | 7 (17.9%) | 23 (65.7%) |
| 18 to 24 Years | 4 (4.0%) | 0 (0.0%) |
| 25 to 34 Years | 14 (12.7%) | 40 (21.9%) |
| 35 to 44 Years | 3 (2.9%) | 37 (30.8%) |
| 45 to 54 Years | 10 (18.2%) | 33 (50.0%) |
| 55 to 64 Years | 22 (37.3%) | 28 (38.9%) |
| 65 to 74 Years | 5 (9.3%) | 39 (41.9%) |
| 75 Years and over | 33 (44.6%) | 15 (38.5%) |
| Total | 172 (21.4%) | 318 (36.3%) |
Income Above Poverty by Sex and Age in Lamar
According to the poverty statistics in Lamar, males aged 15 years and females aged 18 to 24 years are the age groups that are most secure financially, with 100.0% of males and 100.0% of females in these age groups living above the poverty line.
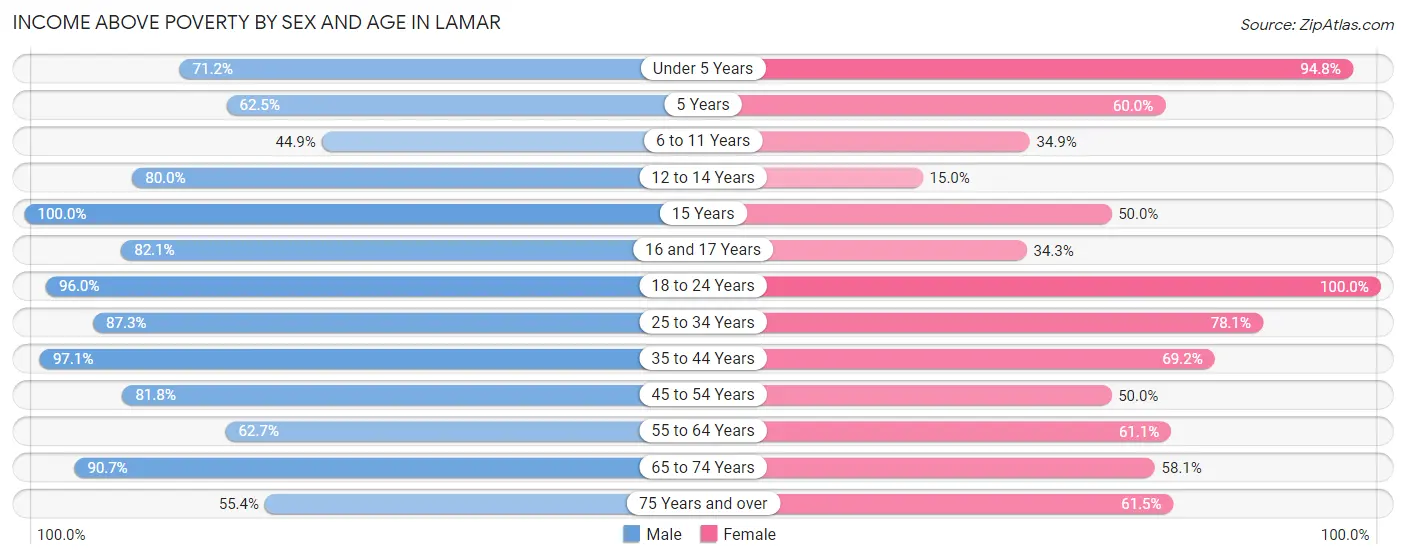
| Age Bracket | Male | Female |
| Under 5 Years | 47 (71.2%) | 73 (94.8%) |
| 5 Years | 10 (62.5%) | 12 (60.0%) |
| 6 to 11 Years | 35 (44.9%) | 38 (34.9%) |
| 12 to 14 Years | 24 (80.0%) | 3 (15.0%) |
| 15 Years | 19 (100.0%) | 3 (50.0%) |
| 16 and 17 Years | 32 (82.1%) | 12 (34.3%) |
| 18 to 24 Years | 96 (96.0%) | 35 (100.0%) |
| 25 to 34 Years | 96 (87.3%) | 143 (78.1%) |
| 35 to 44 Years | 102 (97.1%) | 83 (69.2%) |
| 45 to 54 Years | 45 (81.8%) | 33 (50.0%) |
| 55 to 64 Years | 37 (62.7%) | 44 (61.1%) |
| 65 to 74 Years | 49 (90.7%) | 54 (58.1%) |
| 75 Years and over | 41 (55.4%) | 24 (61.5%) |
| Total | 633 (78.6%) | 557 (63.7%) |
Income Below Poverty Among Married-Couple Families in Lamar
The poverty statistics for married-couple families in Lamar show that 15.2% or 50 of the total 328 families live below the poverty line. Families with 3 or 4 children have the highest poverty rate of 42.1%, comprising of 16 families. On the other hand, families with 1 or 2 children have the lowest poverty rate of 7.0%, which includes 10 families.
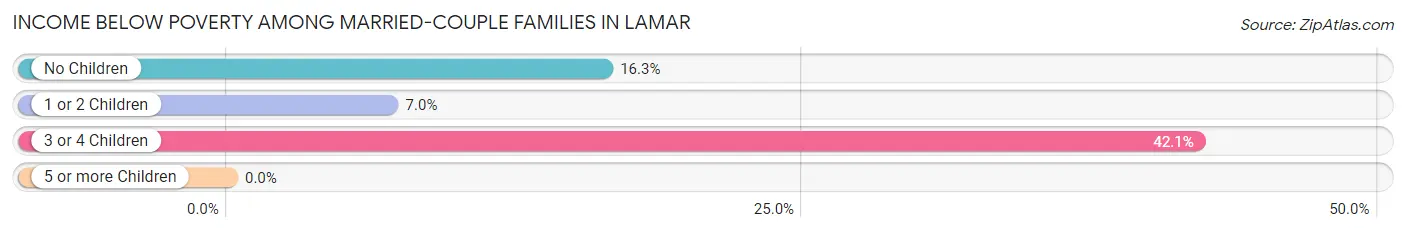
| Children | Above Poverty | Below Poverty |
| No Children | 123 (83.7%) | 24 (16.3%) |
| 1 or 2 Children | 133 (93.0%) | 10 (7.0%) |
| 3 or 4 Children | 22 (57.9%) | 16 (42.1%) |
| 5 or more Children | 0 (0.0%) | 0 (0.0%) |
| Total | 278 (84.8%) | 50 (15.2%) |
Income Below Poverty Among Single-Parent Households in Lamar
According to the poverty data in Lamar, 35.0% or 7 single-father households and 79.3% or 69 single-mother households are living below the poverty line. Among single-father households, those with 1 or 2 children have the highest poverty rate, with 7 households (38.9%) experiencing poverty. Likewise, among single-mother households, those with 3 or 4 children have the highest poverty rate, with 25 households (100.0%) falling below the poverty line.
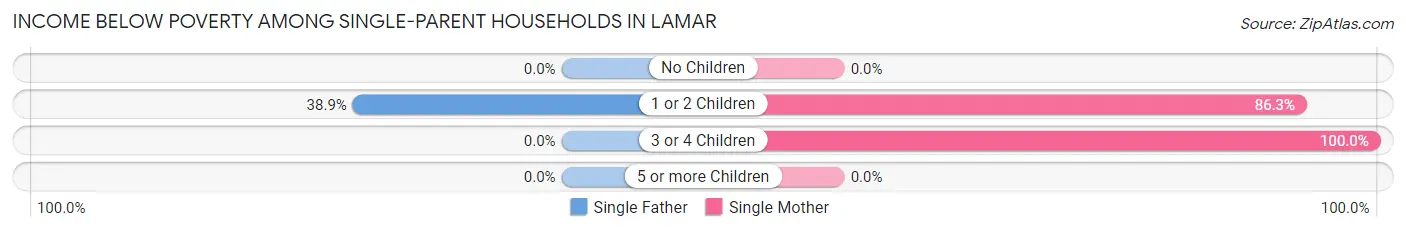
| Children | Single Father | Single Mother |
| No Children | 0 (0.0%) | 0 (0.0%) |
| 1 or 2 Children | 7 (38.9%) | 44 (86.3%) |
| 3 or 4 Children | 0 (0.0%) | 25 (100.0%) |
| 5 or more Children | 0 (0.0%) | 0 (0.0%) |
| Total | 7 (35.0%) | 69 (79.3%) |
Income Below Poverty Among Married-Couple vs Single-Parent Households in Lamar
The poverty data for Lamar shows that 50 of the married-couple family households (15.2%) and 76 of the single-parent households (71.0%) are living below the poverty level. Within the married-couple family households, those with 3 or 4 children have the highest poverty rate, with 16 households (42.1%) falling below the poverty line. Among the single-parent households, those with 3 or 4 children have the highest poverty rate, with 25 household (100.0%) living below poverty.
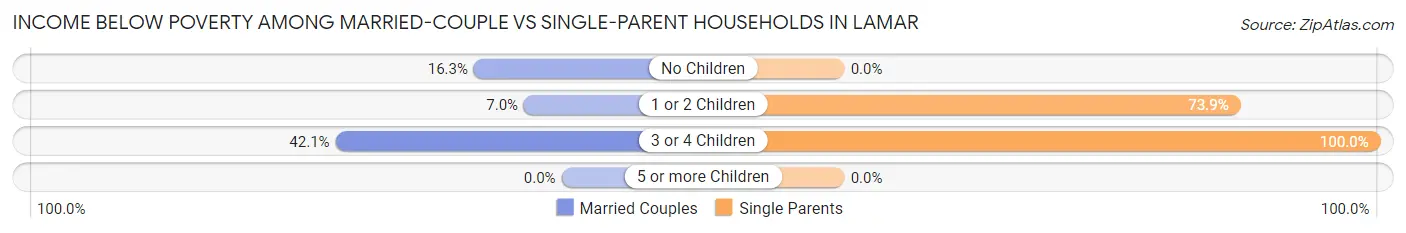
| Children | Married-Couple Families | Single-Parent Households |
| No Children | 24 (16.3%) | 0 (0.0%) |
| 1 or 2 Children | 10 (7.0%) | 51 (73.9%) |
| 3 or 4 Children | 16 (42.1%) | 25 (100.0%) |
| 5 or more Children | 0 (0.0%) | 0 (0.0%) |
| Total | 50 (15.2%) | 76 (71.0%) |
Employment Characteristics in Lamar
Employment by Class of Employer in Lamar
Among the 636 employed individuals in Lamar, private company employees (445 | 70.0%), local government employees (67 | 10.5%), and self-employed (not incorporated) (47 | 7.4%) make up the most common classes of employment.
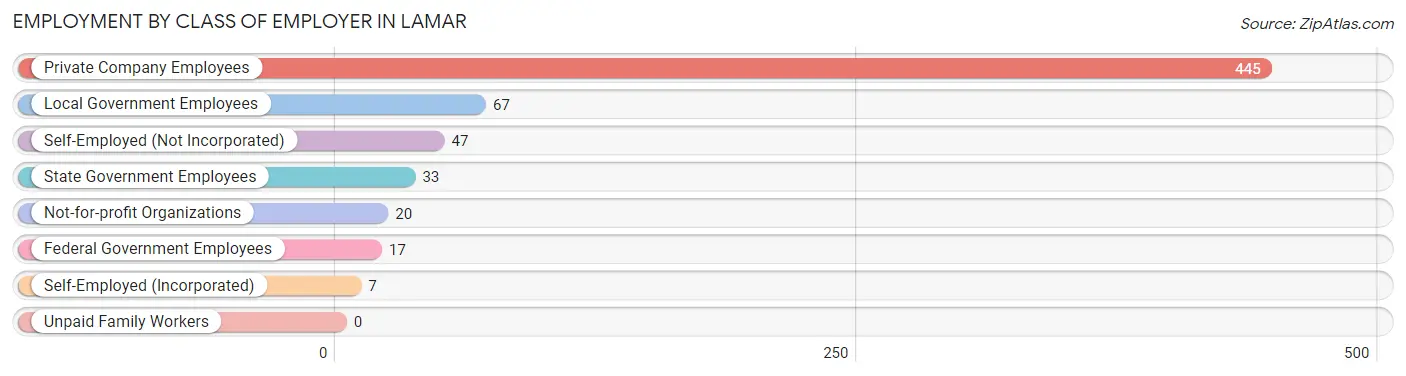
| Employer Class | # Employees | % Employees |
| Private Company Employees | 445 | 70.0% |
| Self-Employed (Incorporated) | 7 | 1.1% |
| Self-Employed (Not Incorporated) | 47 | 7.4% |
| Not-for-profit Organizations | 20 | 3.1% |
| Local Government Employees | 67 | 10.5% |
| State Government Employees | 33 | 5.2% |
| Federal Government Employees | 17 | 2.7% |
| Unpaid Family Workers | 0 | 0.0% |
| Total | 636 | 100.0% |
Employment Status by Age in Lamar
According to the labor force statistics for Lamar, out of the total population over 16 years of age (1,253), 53.2% or 667 individuals are in the labor force, with 2.9% or 19 of them unemployed. The age group with the highest labor force participation rate is 35 to 44 years, with 94.7% or 213 individuals in the labor force. Within the labor force, the 20 to 24 years age range has the highest percentage of unemployed individuals, with 9.1% or 6 of them being unemployed.
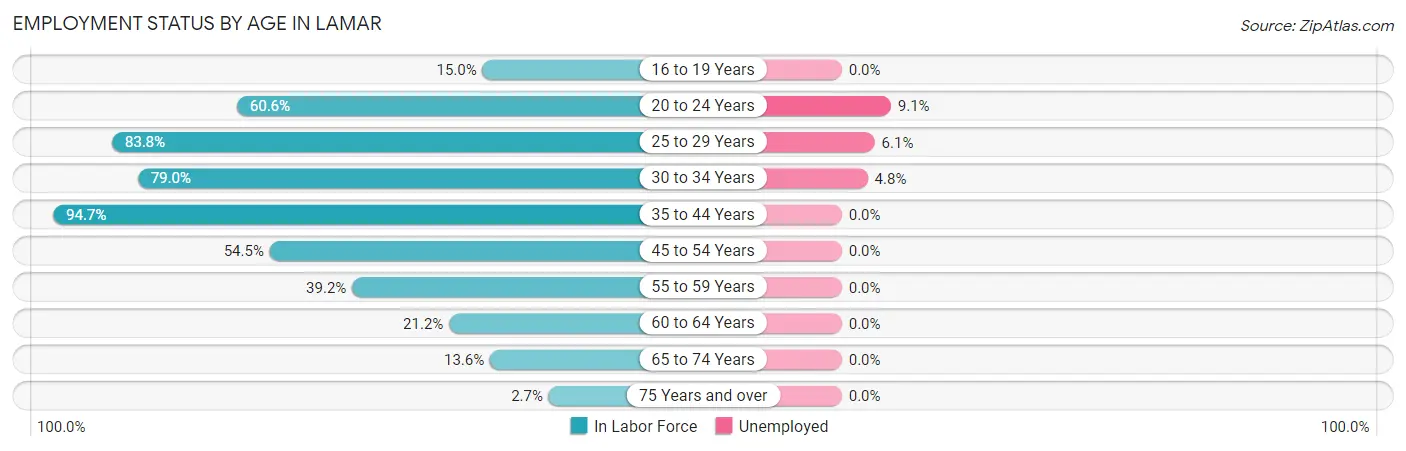
| Age Bracket | In Labor Force | Unemployed |
| 16 to 19 Years | 15 (15.0%) | 0 (0.0%) |
| 20 to 24 Years | 66 (60.6%) | 6 (9.1%) |
| 25 to 29 Years | 114 (83.8%) | 7 (6.1%) |
| 30 to 34 Years | 124 (79.0%) | 6 (4.8%) |
| 35 to 44 Years | 213 (94.7%) | 0 (0.0%) |
| 45 to 54 Years | 66 (54.5%) | 0 (0.0%) |
| 55 to 59 Years | 31 (39.2%) | 0 (0.0%) |
| 60 to 64 Years | 14 (21.2%) | 0 (0.0%) |
| 65 to 74 Years | 20 (13.6%) | 0 (0.0%) |
| 75 Years and over | 3 (2.7%) | 0 (0.0%) |
| Total | 667 (53.2%) | 19 (2.9%) |
Employment Status by Educational Attainment in Lamar
According to labor force statistics for Lamar, 71.7% of individuals (562) out of the total population between 25 and 64 years of age (784) are in the labor force, with 2.3% or 13 of them being unemployed. The group with the highest labor force participation rate are those with the educational attainment of bachelor's degree or higher, with 86.4% or 172 individuals in the labor force. Within the labor force, individuals with bachelor's degree or higher education have the highest percentage of unemployment, with 5.2% or 9 of them being unemployed.
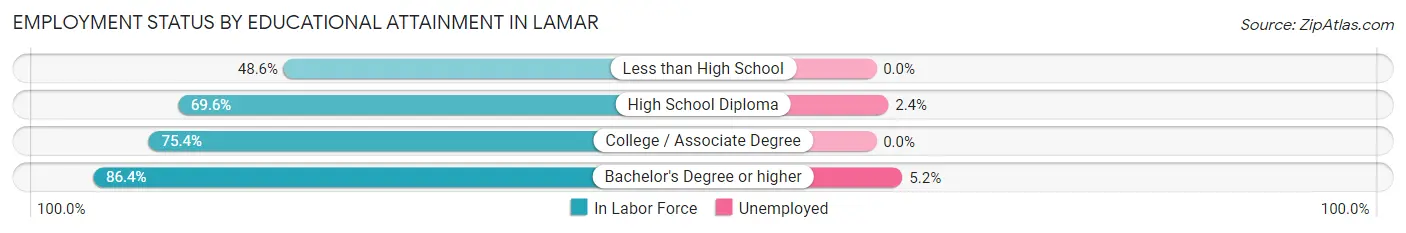
| Educational Attainment | In Labor Force | Unemployed |
| Less than High School | 67 (48.6%) | 0 (0.0%) |
| High School Diploma | 167 (69.6%) | 6 (2.4%) |
| College / Associate Degree | 156 (75.4%) | 0 (0.0%) |
| Bachelor's Degree or higher | 172 (86.4%) | 10 (5.2%) |
| Total | 562 (71.7%) | 18 (2.3%) |
Employment Occupations by Sex in Lamar
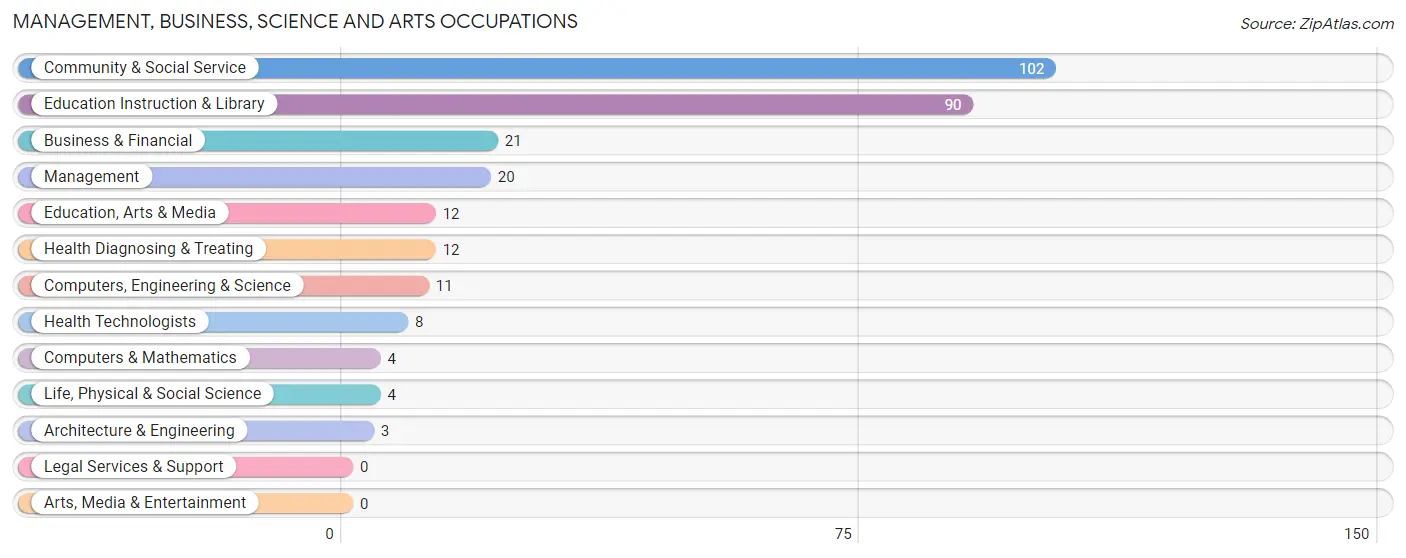
Management, Business, Science and Arts Occupations
The most common Management, Business, Science and Arts occupations in Lamar are Community & Social Service (102 | 15.8%), Education Instruction & Library (90 | 13.9%), Business & Financial (21 | 3.3%), Management (20 | 3.1%), and Education, Arts & Media (12 | 1.8%).
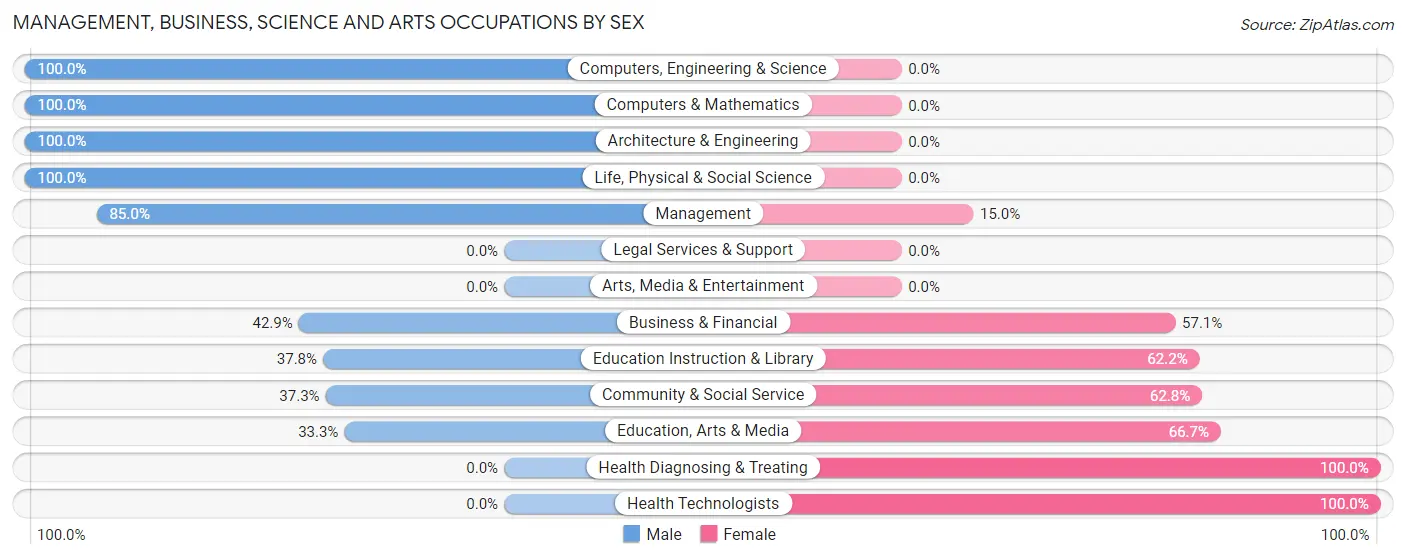
Management, Business, Science and Arts Occupations by Sex
Within the Management, Business, Science and Arts occupations in Lamar, the most male-oriented occupations are Computers, Engineering & Science (100.0%), Computers & Mathematics (100.0%), and Architecture & Engineering (100.0%), while the most female-oriented occupations are Health Diagnosing & Treating (100.0%), Health Technologists (100.0%), and Education, Arts & Media (66.7%).
| Occupation | Male | Female |
| Management | 17 (85.0%) | 3 (15.0%) |
| Business & Financial | 9 (42.9%) | 12 (57.1%) |
| Computers, Engineering & Science | 11 (100.0%) | 0 (0.0%) |
| Computers & Mathematics | 4 (100.0%) | 0 (0.0%) |
| Architecture & Engineering | 3 (100.0%) | 0 (0.0%) |
| Life, Physical & Social Science | 4 (100.0%) | 0 (0.0%) |
| Community & Social Service | 38 (37.2%) | 64 (62.7%) |
| Education, Arts & Media | 4 (33.3%) | 8 (66.7%) |
| Legal Services & Support | 0 (0.0%) | 0 (0.0%) |
| Education Instruction & Library | 34 (37.8%) | 56 (62.2%) |
| Arts, Media & Entertainment | 0 (0.0%) | 0 (0.0%) |
| Health Diagnosing & Treating | 0 (0.0%) | 12 (100.0%) |
| Health Technologists | 0 (0.0%) | 8 (100.0%) |
| Total (Category) | 75 (45.2%) | 91 (54.8%) |
| Total (Overall) | 333 (51.5%) | 314 (48.5%) |
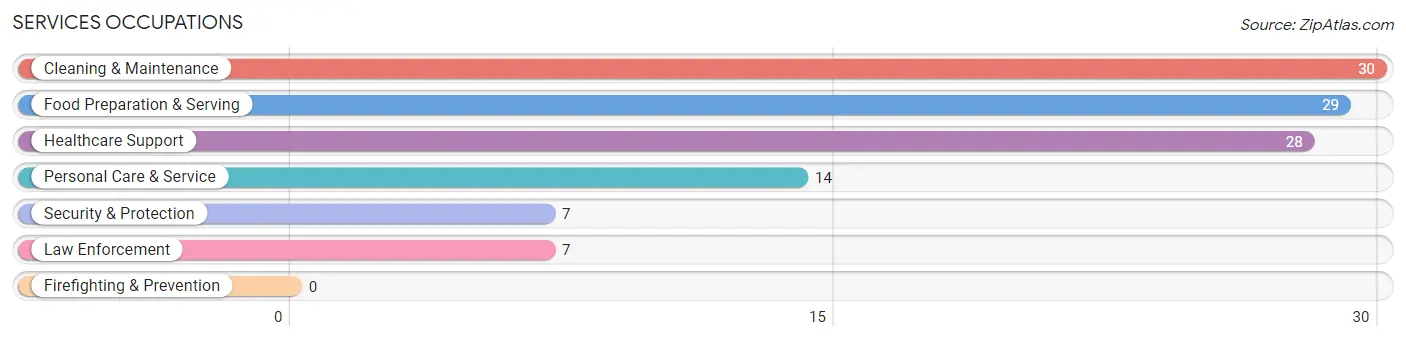
Services Occupations
The most common Services occupations in Lamar are Cleaning & Maintenance (30 | 4.6%), Food Preparation & Serving (29 | 4.5%), Healthcare Support (28 | 4.3%), Personal Care & Service (14 | 2.2%), and Security & Protection (7 | 1.1%).
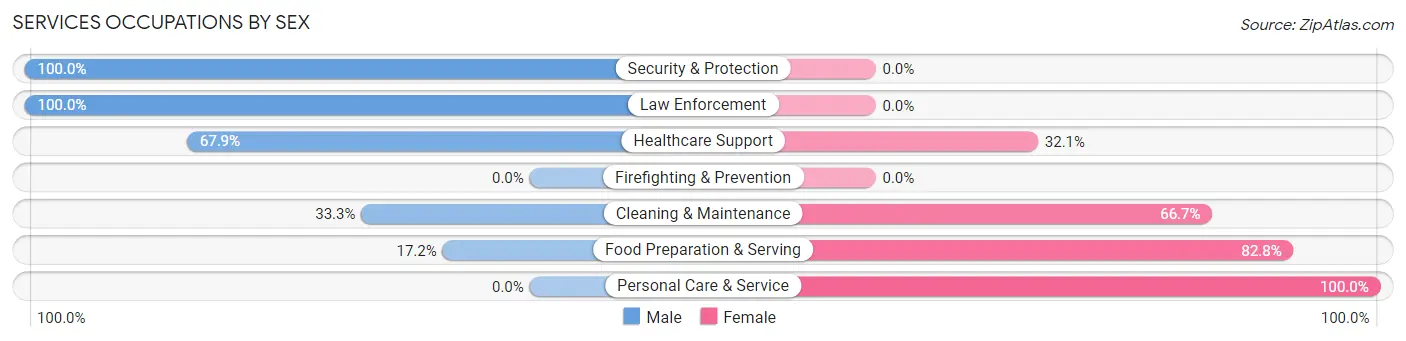
Services Occupations by Sex
Within the Services occupations in Lamar, the most male-oriented occupations are Security & Protection (100.0%), Law Enforcement (100.0%), and Healthcare Support (67.9%), while the most female-oriented occupations are Personal Care & Service (100.0%), Food Preparation & Serving (82.8%), and Cleaning & Maintenance (66.7%).
| Occupation | Male | Female |
| Healthcare Support | 19 (67.9%) | 9 (32.1%) |
| Security & Protection | 7 (100.0%) | 0 (0.0%) |
| Firefighting & Prevention | 0 (0.0%) | 0 (0.0%) |
| Law Enforcement | 7 (100.0%) | 0 (0.0%) |
| Food Preparation & Serving | 5 (17.2%) | 24 (82.8%) |
| Cleaning & Maintenance | 10 (33.3%) | 20 (66.7%) |
| Personal Care & Service | 0 (0.0%) | 14 (100.0%) |
| Total (Category) | 41 (38.0%) | 67 (62.0%) |
| Total (Overall) | 333 (51.5%) | 314 (48.5%) |
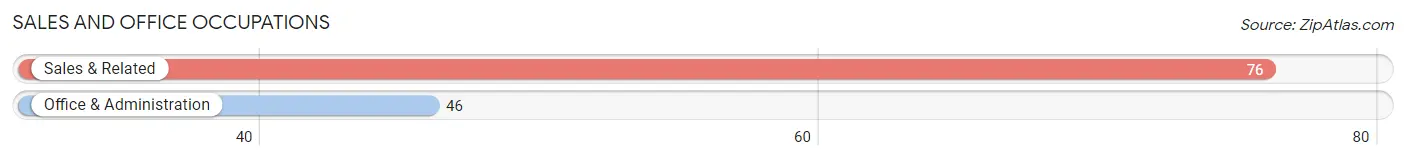
Sales and Office Occupations
The most common Sales and Office occupations in Lamar are Sales & Related (76 | 11.7%), and Office & Administration (46 | 7.1%).
Sales and Office Occupations by Sex

| Occupation | Male | Female |
| Sales & Related | 35 (46.1%) | 41 (53.9%) |
| Office & Administration | 0 (0.0%) | 46 (100.0%) |
| Total (Category) | 35 (28.7%) | 87 (71.3%) |
| Total (Overall) | 333 (51.5%) | 314 (48.5%) |
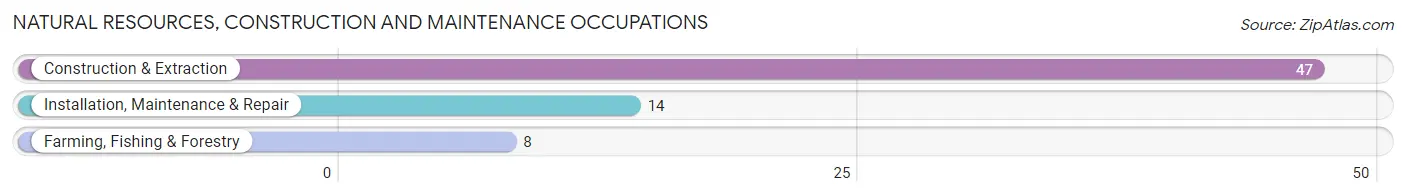
Natural Resources, Construction and Maintenance Occupations
The most common Natural Resources, Construction and Maintenance occupations in Lamar are Construction & Extraction (47 | 7.3%), Installation, Maintenance & Repair (14 | 2.2%), and Farming, Fishing & Forestry (8 | 1.2%).
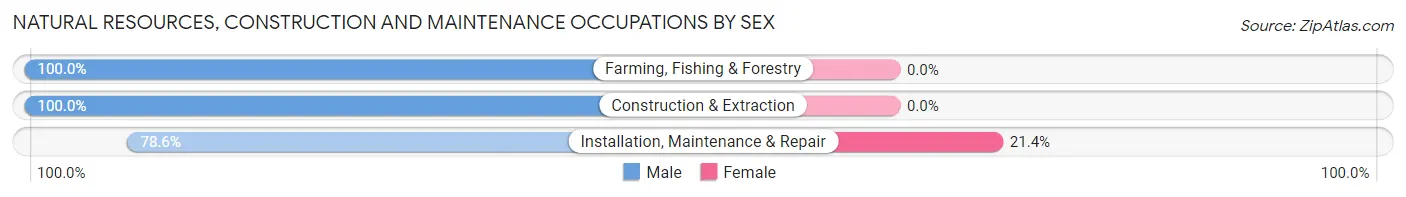
Natural Resources, Construction and Maintenance Occupations by Sex
| Occupation | Male | Female |
| Farming, Fishing & Forestry | 8 (100.0%) | 0 (0.0%) |
| Construction & Extraction | 47 (100.0%) | 0 (0.0%) |
| Installation, Maintenance & Repair | 11 (78.6%) | 3 (21.4%) |
| Total (Category) | 66 (95.7%) | 3 (4.3%) |
| Total (Overall) | 333 (51.5%) | 314 (48.5%) |
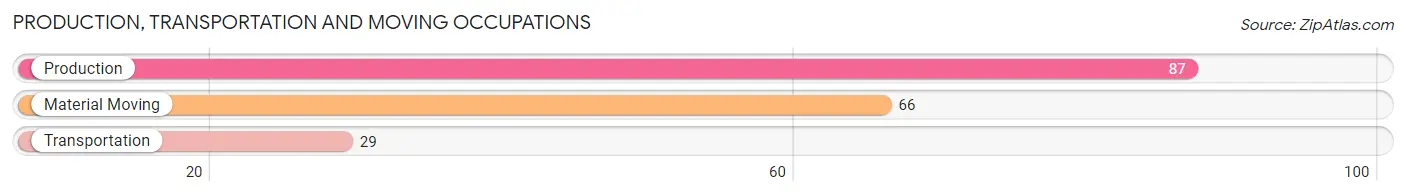
Production, Transportation and Moving Occupations
The most common Production, Transportation and Moving occupations in Lamar are Production (87 | 13.5%), Material Moving (66 | 10.2%), and Transportation (29 | 4.5%).
Production, Transportation and Moving Occupations by Sex
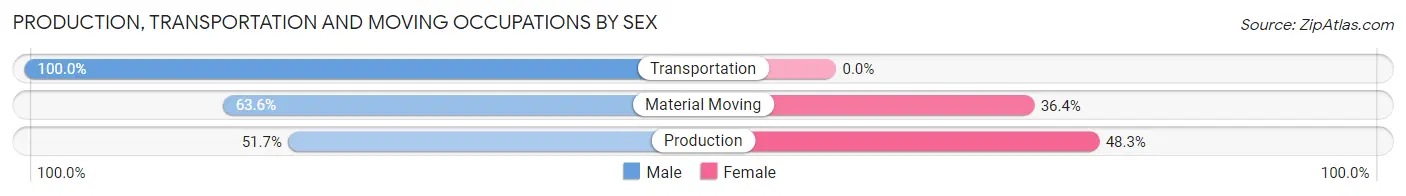
| Occupation | Male | Female |
| Production | 45 (51.7%) | 42 (48.3%) |
| Transportation | 29 (100.0%) | 0 (0.0%) |
| Material Moving | 42 (63.6%) | 24 (36.4%) |
| Total (Category) | 116 (63.7%) | 66 (36.3%) |
| Total (Overall) | 333 (51.5%) | 314 (48.5%) |
Employment Industries by Sex in Lamar
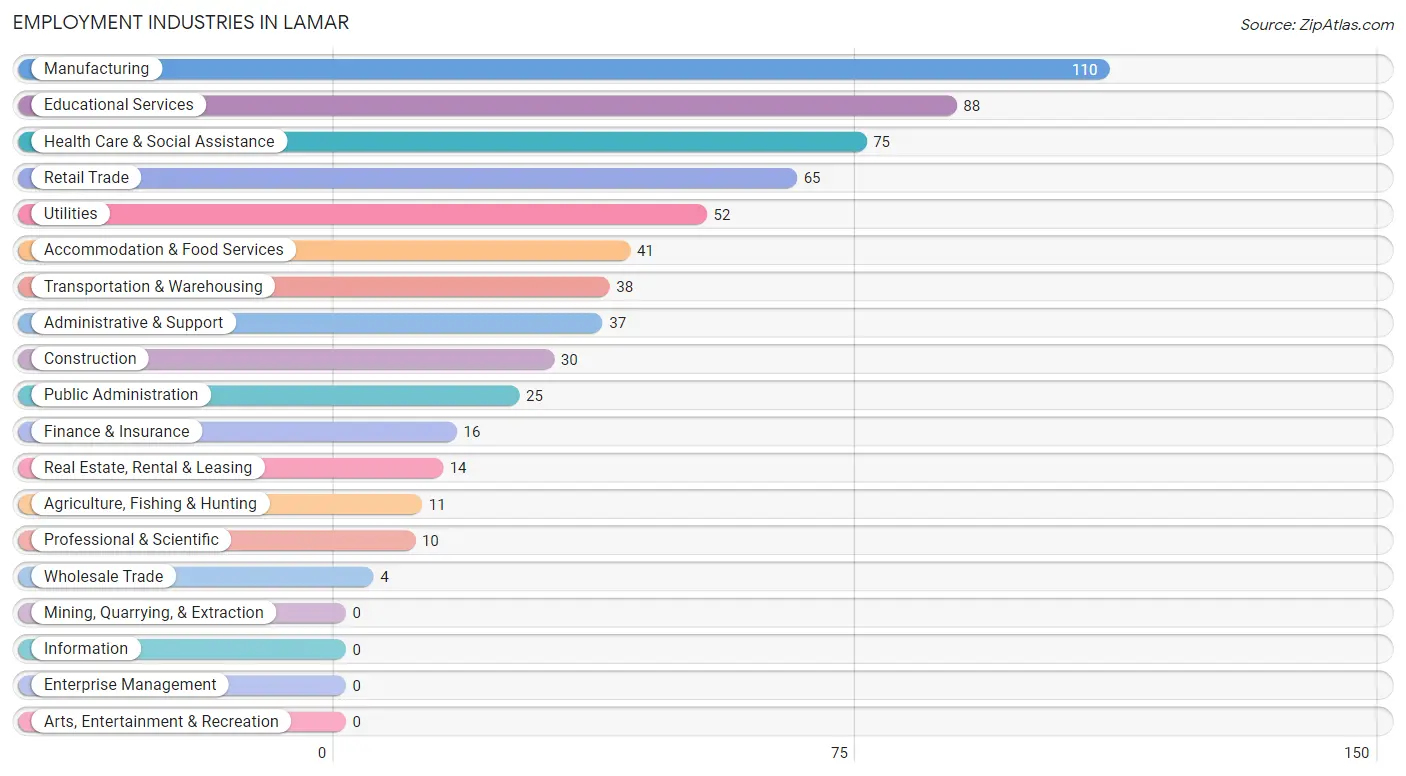
Employment Industries in Lamar
The major employment industries in Lamar include Manufacturing (110 | 17.0%), Educational Services (88 | 13.6%), Health Care & Social Assistance (75 | 11.6%), Retail Trade (65 | 10.1%), and Utilities (52 | 8.0%).
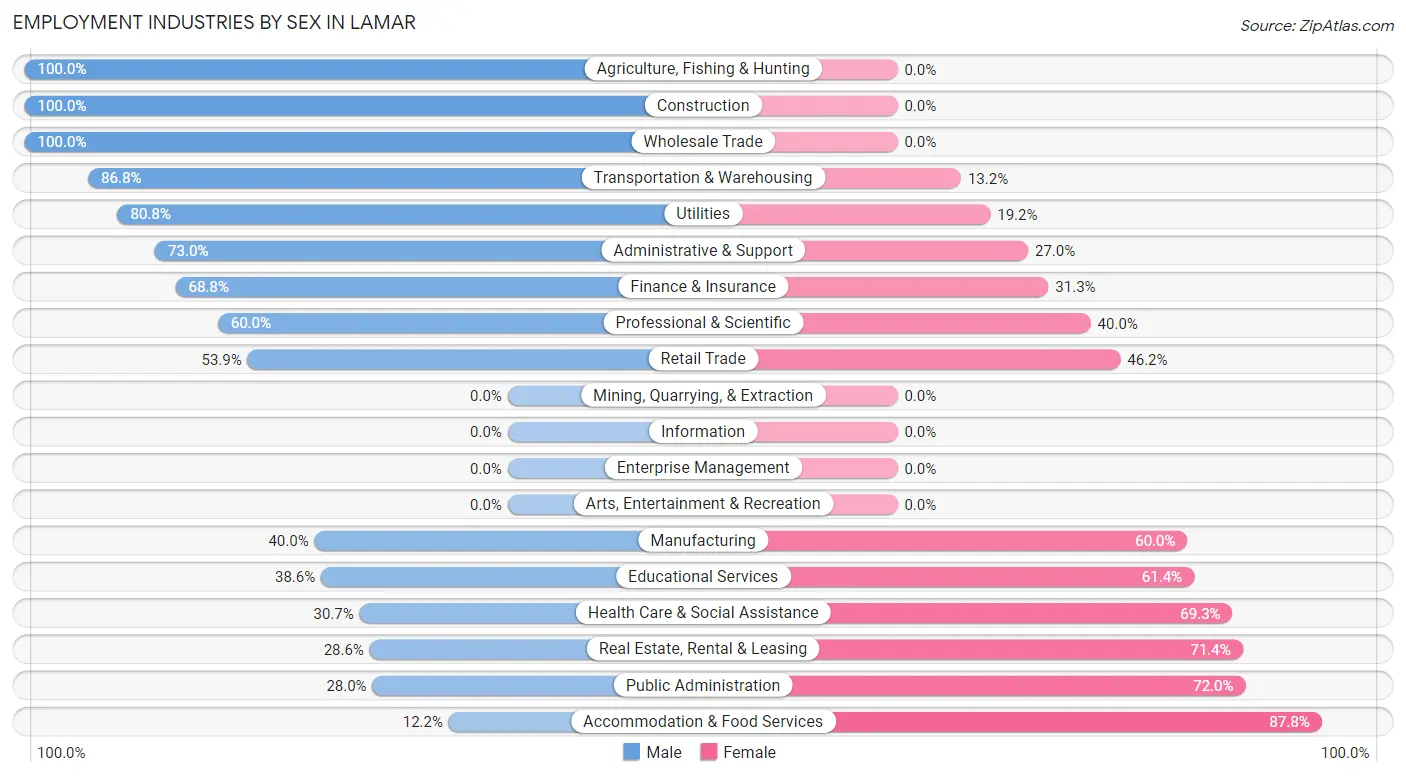
Employment Industries by Sex in Lamar
The Lamar industries that see more men than women are Agriculture, Fishing & Hunting (100.0%), Construction (100.0%), and Wholesale Trade (100.0%), whereas the industries that tend to have a higher number of women are Accommodation & Food Services (87.8%), Public Administration (72.0%), and Real Estate, Rental & Leasing (71.4%).
| Industry | Male | Female |
| Agriculture, Fishing & Hunting | 11 (100.0%) | 0 (0.0%) |
| Mining, Quarrying, & Extraction | 0 (0.0%) | 0 (0.0%) |
| Construction | 30 (100.0%) | 0 (0.0%) |
| Manufacturing | 44 (40.0%) | 66 (60.0%) |
| Wholesale Trade | 4 (100.0%) | 0 (0.0%) |
| Retail Trade | 35 (53.8%) | 30 (46.2%) |
| Transportation & Warehousing | 33 (86.8%) | 5 (13.2%) |
| Utilities | 42 (80.8%) | 10 (19.2%) |
| Information | 0 (0.0%) | 0 (0.0%) |
| Finance & Insurance | 11 (68.8%) | 5 (31.2%) |
| Real Estate, Rental & Leasing | 4 (28.6%) | 10 (71.4%) |
| Professional & Scientific | 6 (60.0%) | 4 (40.0%) |
| Enterprise Management | 0 (0.0%) | 0 (0.0%) |
| Administrative & Support | 27 (73.0%) | 10 (27.0%) |
| Educational Services | 34 (38.6%) | 54 (61.4%) |
| Health Care & Social Assistance | 23 (30.7%) | 52 (69.3%) |
| Arts, Entertainment & Recreation | 0 (0.0%) | 0 (0.0%) |
| Accommodation & Food Services | 5 (12.2%) | 36 (87.8%) |
| Public Administration | 7 (28.0%) | 18 (72.0%) |
| Total | 333 (51.5%) | 314 (48.5%) |
Education in Lamar
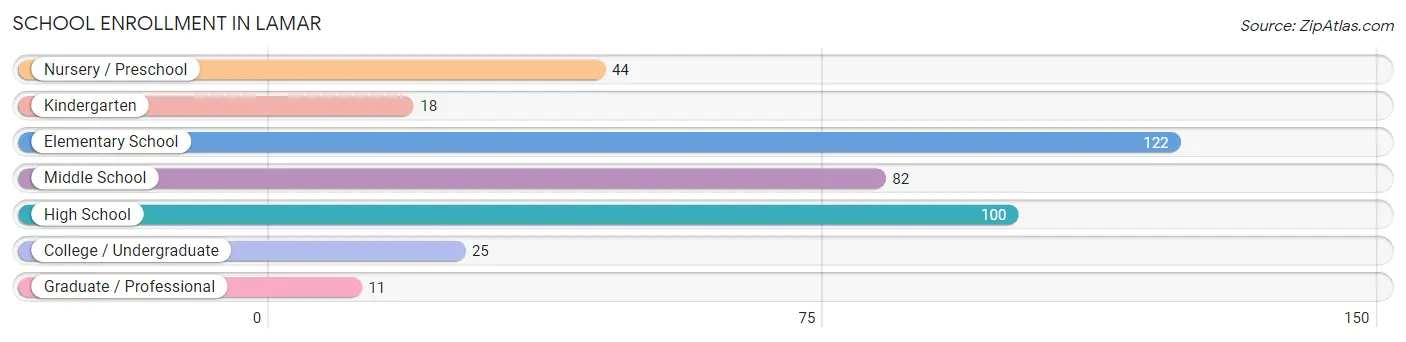
School Enrollment in Lamar
The most common levels of schooling among the 402 students in Lamar are elementary school (122 | 30.3%), high school (100 | 24.9%), and middle school (82 | 20.4%).
| School Level | # Students | % Students |
| Nursery / Preschool | 44 | 11.0% |
| Kindergarten | 18 | 4.5% |
| Elementary School | 122 | 30.3% |
| Middle School | 82 | 20.4% |
| High School | 100 | 24.9% |
| College / Undergraduate | 25 | 6.2% |
| Graduate / Professional | 11 | 2.7% |
| Total | 402 | 100.0% |
School Enrollment by Age by Funding Source in Lamar
Out of a total of 402 students who are enrolled in schools in Lamar, 18 (4.5%) attend a private institution, while the remaining 384 (95.5%) are enrolled in public schools. The age group of 10 to 14 year olds has the highest likelihood of being enrolled in private schools, with 14 (11.6% in the age bracket) enrolled. Conversely, the age group of 3 to 4 year olds has the lowest likelihood of being enrolled in a private school, with 14 (100.0% in the age bracket) attending a public institution.
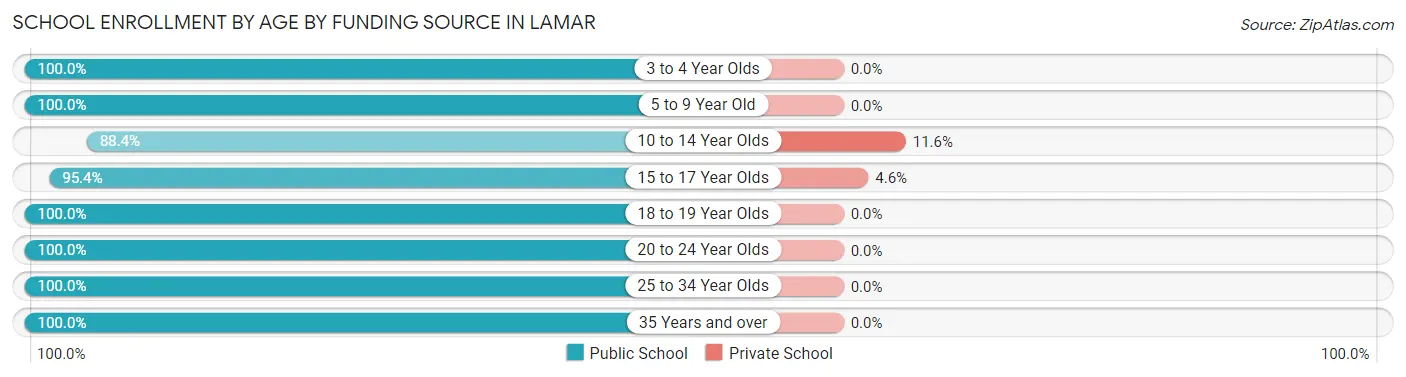
| Age Bracket | Public School | Private School |
| 3 to 4 Year Olds | 14 (100.0%) | 0 (0.0%) |
| 5 to 9 Year Old | 137 (100.0%) | 0 (0.0%) |
| 10 to 14 Year Olds | 107 (88.4%) | 14 (11.6%) |
| 15 to 17 Year Olds | 83 (95.4%) | 4 (4.6%) |
| 18 to 19 Year Olds | 7 (100.0%) | 0 (0.0%) |
| 20 to 24 Year Olds | 7 (100.0%) | 0 (0.0%) |
| 25 to 34 Year Olds | 10 (100.0%) | 0 (0.0%) |
| 35 Years and over | 19 (100.0%) | 0 (0.0%) |
| Total | 384 (95.5%) | 18 (4.5%) |
Educational Attainment by Field of Study in Lamar
Education (61 | 25.0%), engineering (42 | 17.2%), business (32 | 13.1%), psychology (30 | 12.3%), and bio, nature & agricultural (22 | 9.0%) are the most common fields of study among 244 individuals in Lamar who have obtained a bachelor's degree or higher.
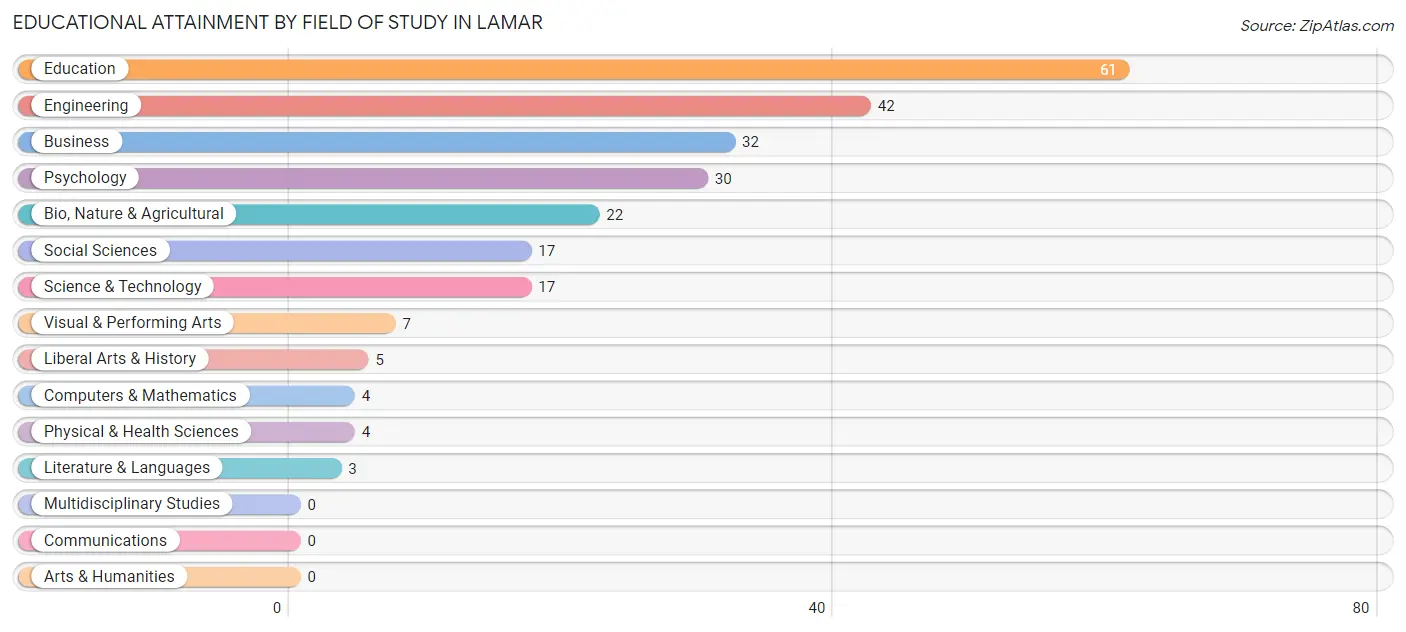
| Field of Study | # Graduates | % Graduates |
| Computers & Mathematics | 4 | 1.6% |
| Bio, Nature & Agricultural | 22 | 9.0% |
| Physical & Health Sciences | 4 | 1.6% |
| Psychology | 30 | 12.3% |
| Social Sciences | 17 | 7.0% |
| Engineering | 42 | 17.2% |
| Multidisciplinary Studies | 0 | 0.0% |
| Science & Technology | 17 | 7.0% |
| Business | 32 | 13.1% |
| Education | 61 | 25.0% |
| Literature & Languages | 3 | 1.2% |
| Liberal Arts & History | 5 | 2.1% |
| Visual & Performing Arts | 7 | 2.9% |
| Communications | 0 | 0.0% |
| Arts & Humanities | 0 | 0.0% |
| Total | 244 | 100.0% |
Transportation & Commute in Lamar
Vehicle Availability by Sex in Lamar
The most prevalent vehicle ownership categories in Lamar are males with 3 vehicles (117, accounting for 36.3%) and females with 3 vehicles (91, making up 37.3%).
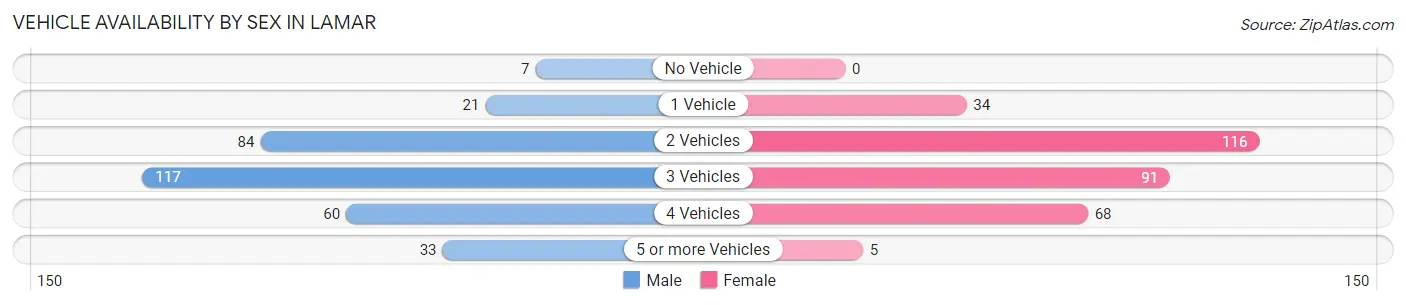
| Vehicles Available | Male | Female |
| No Vehicle | 7 (2.2%) | 0 (0.0%) |
| 1 Vehicle | 21 (6.5%) | 34 (10.8%) |
| 2 Vehicles | 84 (26.1%) | 116 (36.9%) |
| 3 Vehicles | 117 (36.3%) | 91 (29.0%) |
| 4 Vehicles | 60 (18.6%) | 68 (21.7%) |
| 5 or more Vehicles | 33 (10.2%) | 5 (1.6%) |
| Total | 322 (100.0%) | 314 (100.0%) |
Commute Time in Lamar
The most frequently occuring commute durations in Lamar are 10 to 14 minutes (147 commuters, 24.2%), 15 to 19 minutes (85 commuters, 14.0%), and 5 to 9 minutes (81 commuters, 13.3%).
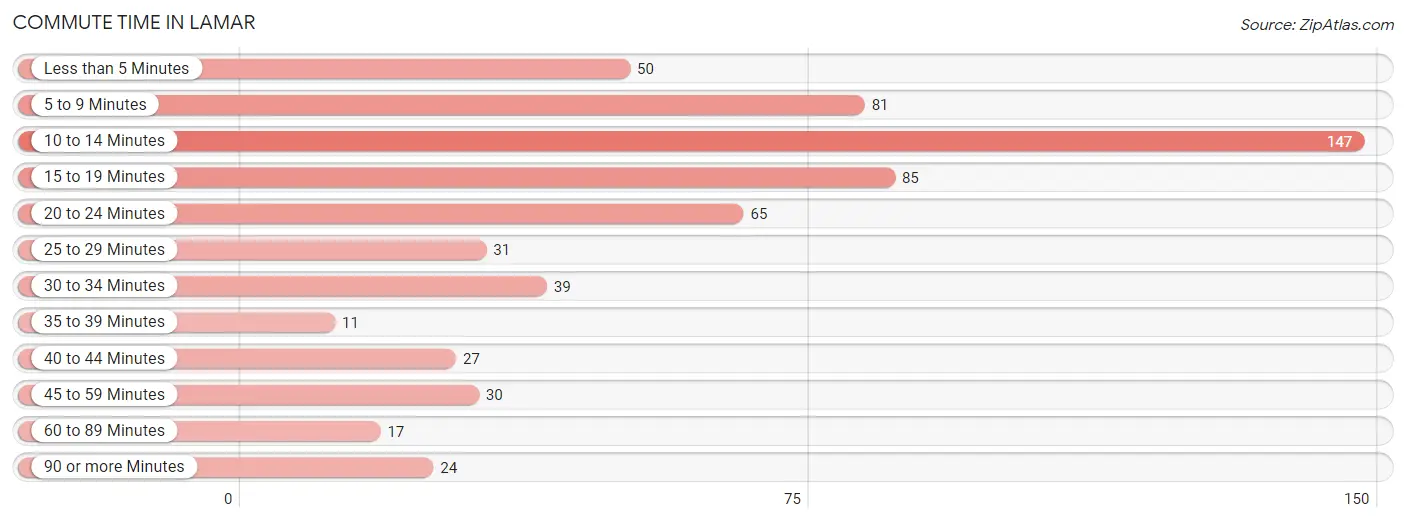
| Commute Time | # Commuters | % Commuters |
| Less than 5 Minutes | 50 | 8.2% |
| 5 to 9 Minutes | 81 | 13.3% |
| 10 to 14 Minutes | 147 | 24.2% |
| 15 to 19 Minutes | 85 | 14.0% |
| 20 to 24 Minutes | 65 | 10.7% |
| 25 to 29 Minutes | 31 | 5.1% |
| 30 to 34 Minutes | 39 | 6.4% |
| 35 to 39 Minutes | 11 | 1.8% |
| 40 to 44 Minutes | 27 | 4.4% |
| 45 to 59 Minutes | 30 | 4.9% |
| 60 to 89 Minutes | 17 | 2.8% |
| 90 or more Minutes | 24 | 4.0% |
Commute Time by Sex in Lamar
The most common commute times in Lamar are 15 to 19 minutes (57 commuters, 18.1%) for males and 10 to 14 minutes (106 commuters, 36.3%) for females.
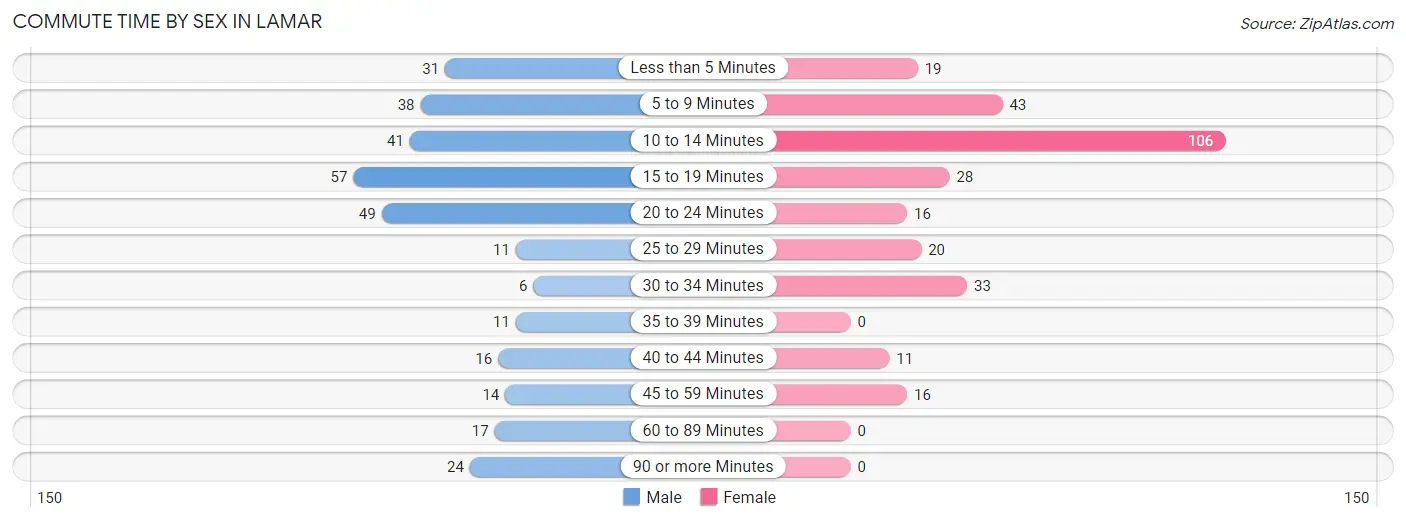
| Commute Time | Male | Female |
| Less than 5 Minutes | 31 (9.8%) | 19 (6.5%) |
| 5 to 9 Minutes | 38 (12.1%) | 43 (14.7%) |
| 10 to 14 Minutes | 41 (13.0%) | 106 (36.3%) |
| 15 to 19 Minutes | 57 (18.1%) | 28 (9.6%) |
| 20 to 24 Minutes | 49 (15.6%) | 16 (5.5%) |
| 25 to 29 Minutes | 11 (3.5%) | 20 (6.9%) |
| 30 to 34 Minutes | 6 (1.9%) | 33 (11.3%) |
| 35 to 39 Minutes | 11 (3.5%) | 0 (0.0%) |
| 40 to 44 Minutes | 16 (5.1%) | 11 (3.8%) |
| 45 to 59 Minutes | 14 (4.4%) | 16 (5.5%) |
| 60 to 89 Minutes | 17 (5.4%) | 0 (0.0%) |
| 90 or more Minutes | 24 (7.6%) | 0 (0.0%) |
Time of Departure to Work by Sex in Lamar
The most frequent times of departure to work in Lamar are 5:00 AM to 5:29 AM (60, 19.1%) for males and 6:30 AM to 6:59 AM (58, 19.9%) for females.
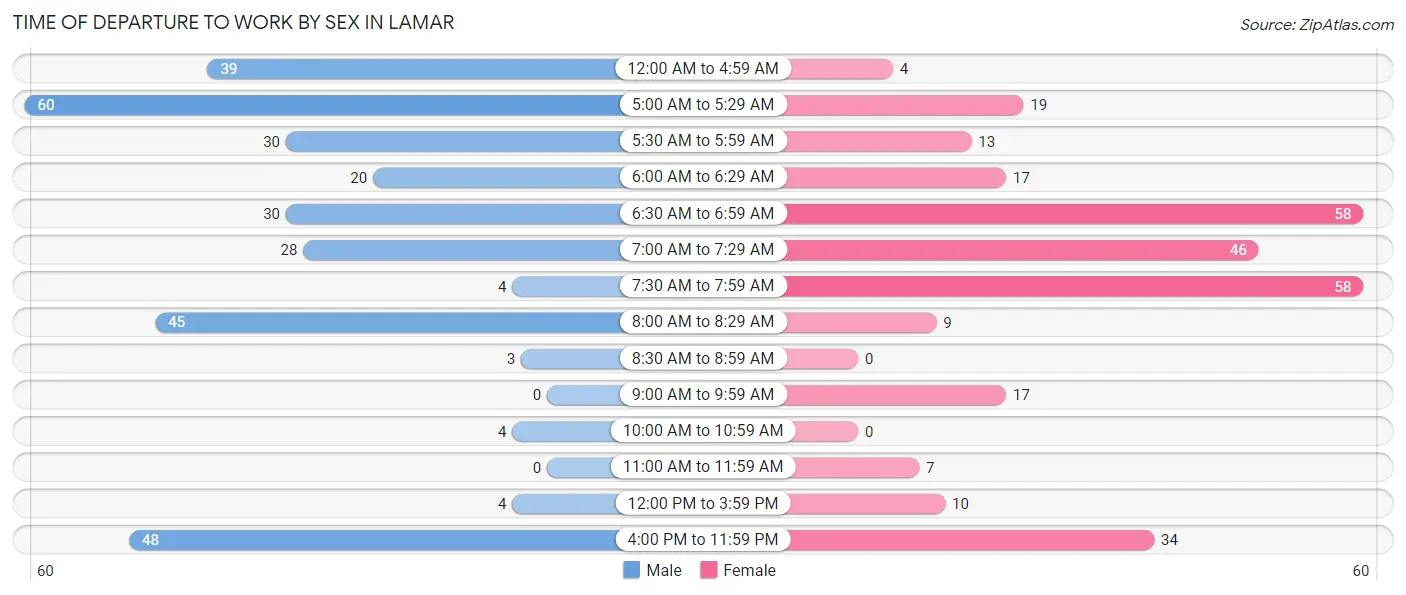
| Time of Departure | Male | Female |
| 12:00 AM to 4:59 AM | 39 (12.4%) | 4 (1.4%) |
| 5:00 AM to 5:29 AM | 60 (19.1%) | 19 (6.5%) |
| 5:30 AM to 5:59 AM | 30 (9.5%) | 13 (4.4%) |
| 6:00 AM to 6:29 AM | 20 (6.4%) | 17 (5.8%) |
| 6:30 AM to 6:59 AM | 30 (9.5%) | 58 (19.9%) |
| 7:00 AM to 7:29 AM | 28 (8.9%) | 46 (15.8%) |
| 7:30 AM to 7:59 AM | 4 (1.3%) | 58 (19.9%) |
| 8:00 AM to 8:29 AM | 45 (14.3%) | 9 (3.1%) |
| 8:30 AM to 8:59 AM | 3 (0.9%) | 0 (0.0%) |
| 9:00 AM to 9:59 AM | 0 (0.0%) | 17 (5.8%) |
| 10:00 AM to 10:59 AM | 4 (1.3%) | 0 (0.0%) |
| 11:00 AM to 11:59 AM | 0 (0.0%) | 7 (2.4%) |
| 12:00 PM to 3:59 PM | 4 (1.3%) | 10 (3.4%) |
| 4:00 PM to 11:59 PM | 48 (15.2%) | 34 (11.6%) |
| Total | 315 (100.0%) | 292 (100.0%) |
Housing Occupancy in Lamar
Occupancy by Ownership in Lamar
Of the total 629 dwellings in Lamar, owner-occupied units account for 459 (73.0%), while renter-occupied units make up 170 (27.0%).
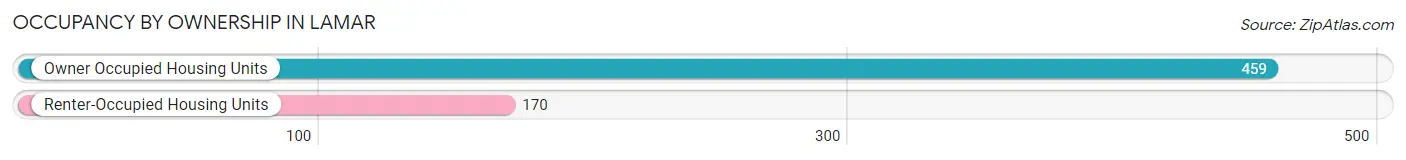
| Occupancy | # Housing Units | % Housing Units |
| Owner Occupied Housing Units | 459 | 73.0% |
| Renter-Occupied Housing Units | 170 | 27.0% |
| Total Occupied Housing Units | 629 | 100.0% |
Occupancy by Household Size in Lamar
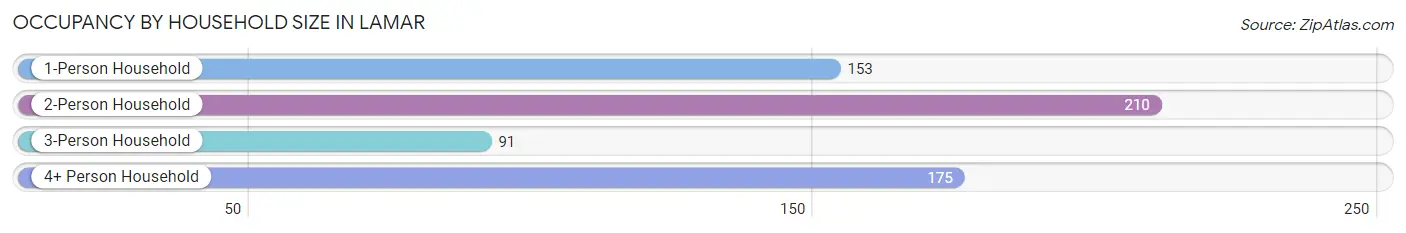
| Household Size | # Housing Units | % Housing Units |
| 1-Person Household | 153 | 24.3% |
| 2-Person Household | 210 | 33.4% |
| 3-Person Household | 91 | 14.5% |
| 4+ Person Household | 175 | 27.8% |
| Total Housing Units | 629 | 100.0% |
Occupancy by Ownership by Household Size in Lamar
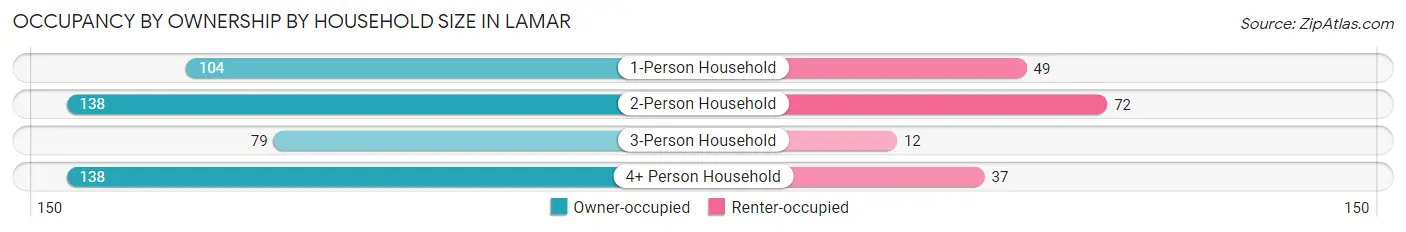
| Household Size | Owner-occupied | Renter-occupied |
| 1-Person Household | 104 (68.0%) | 49 (32.0%) |
| 2-Person Household | 138 (65.7%) | 72 (34.3%) |
| 3-Person Household | 79 (86.8%) | 12 (13.2%) |
| 4+ Person Household | 138 (78.9%) | 37 (21.1%) |
| Total Housing Units | 459 (73.0%) | 170 (27.0%) |
Occupancy by Educational Attainment in Lamar
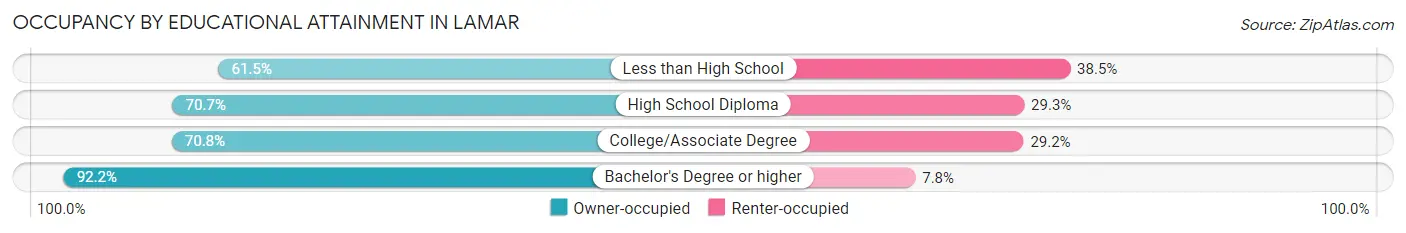
| Household Size | Owner-occupied | Renter-occupied |
| Less than High School | 72 (61.5%) | 45 (38.5%) |
| High School Diploma | 183 (70.7%) | 76 (29.3%) |
| College/Associate Degree | 97 (70.8%) | 40 (29.2%) |
| Bachelor's Degree or higher | 107 (92.2%) | 9 (7.8%) |
Occupancy by Age of Householder in Lamar
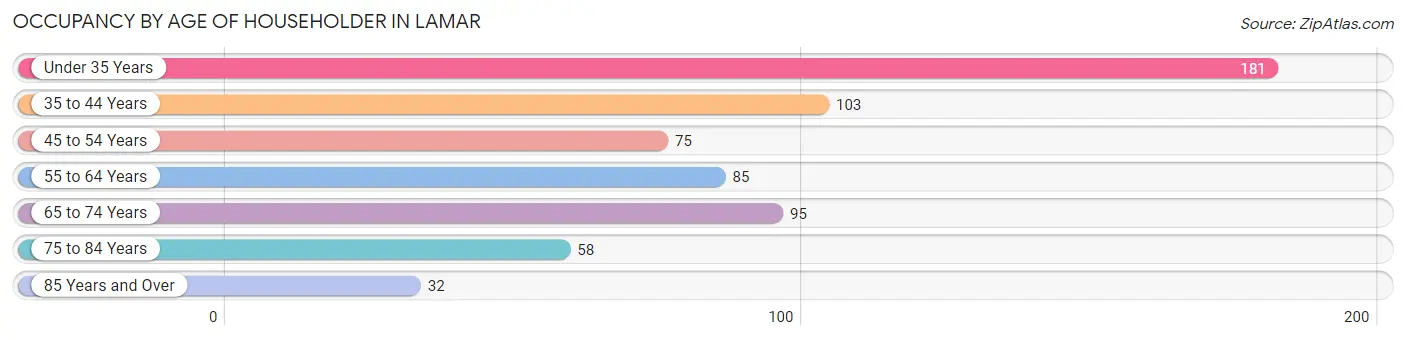
| Age Bracket | # Households | % Households |
| Under 35 Years | 181 | 28.8% |
| 35 to 44 Years | 103 | 16.4% |
| 45 to 54 Years | 75 | 11.9% |
| 55 to 64 Years | 85 | 13.5% |
| 65 to 74 Years | 95 | 15.1% |
| 75 to 84 Years | 58 | 9.2% |
| 85 Years and Over | 32 | 5.1% |
| Total | 629 | 100.0% |
Housing Finances in Lamar
Median Income by Occupancy in Lamar
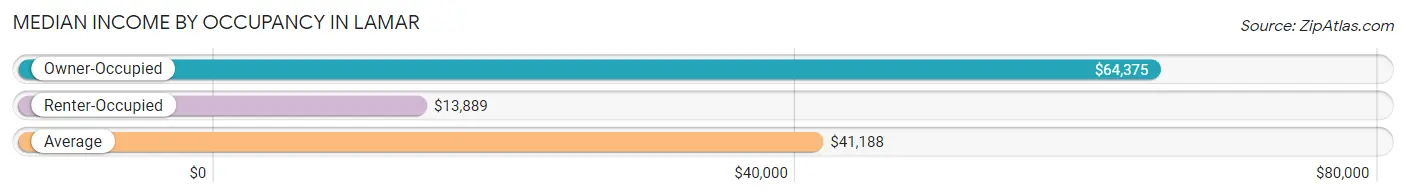
| Occupancy Type | # Households | Median Income |
| Owner-Occupied | 459 (73.0%) | $64,375 |
| Renter-Occupied | 170 (27.0%) | $13,889 |
| Average | 629 (100.0%) | $41,188 |
Occupancy by Householder Income Bracket in Lamar
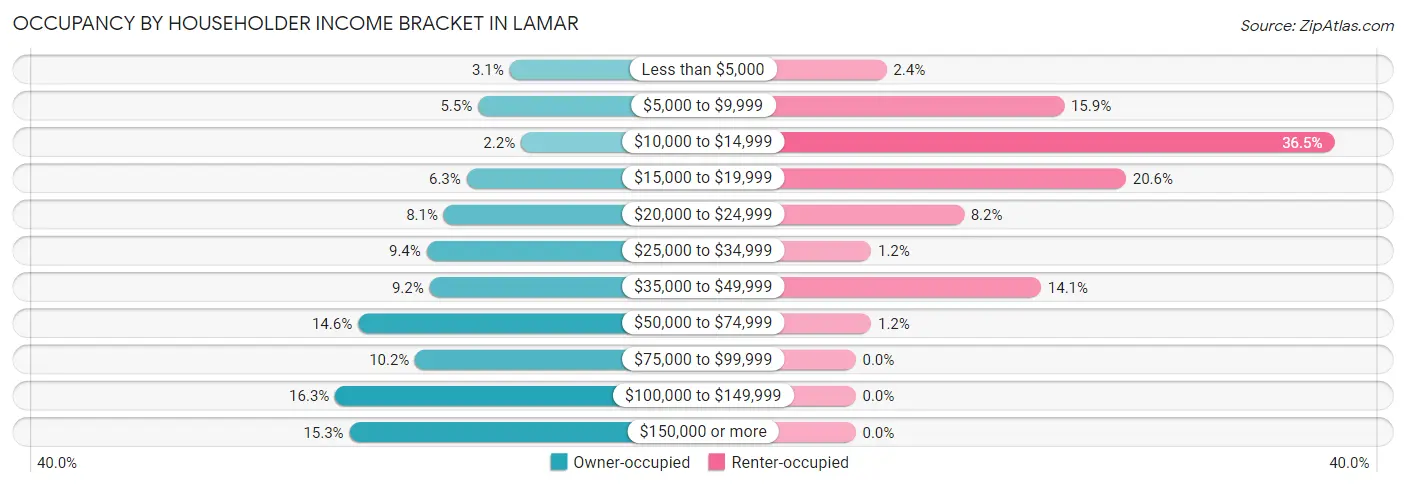
| Income Bracket | Owner-occupied | Renter-occupied |
| Less than $5,000 | 14 (3.0%) | 4 (2.4%) |
| $5,000 to $9,999 | 25 (5.4%) | 27 (15.9%) |
| $10,000 to $14,999 | 10 (2.2%) | 62 (36.5%) |
| $15,000 to $19,999 | 29 (6.3%) | 35 (20.6%) |
| $20,000 to $24,999 | 37 (8.1%) | 14 (8.2%) |
| $25,000 to $34,999 | 43 (9.4%) | 2 (1.2%) |
| $35,000 to $49,999 | 42 (9.1%) | 24 (14.1%) |
| $50,000 to $74,999 | 67 (14.6%) | 2 (1.2%) |
| $75,000 to $99,999 | 47 (10.2%) | 0 (0.0%) |
| $100,000 to $149,999 | 75 (16.3%) | 0 (0.0%) |
| $150,000 or more | 70 (15.2%) | 0 (0.0%) |
| Total | 459 (100.0%) | 170 (100.0%) |
Monthly Housing Cost Tiers in Lamar
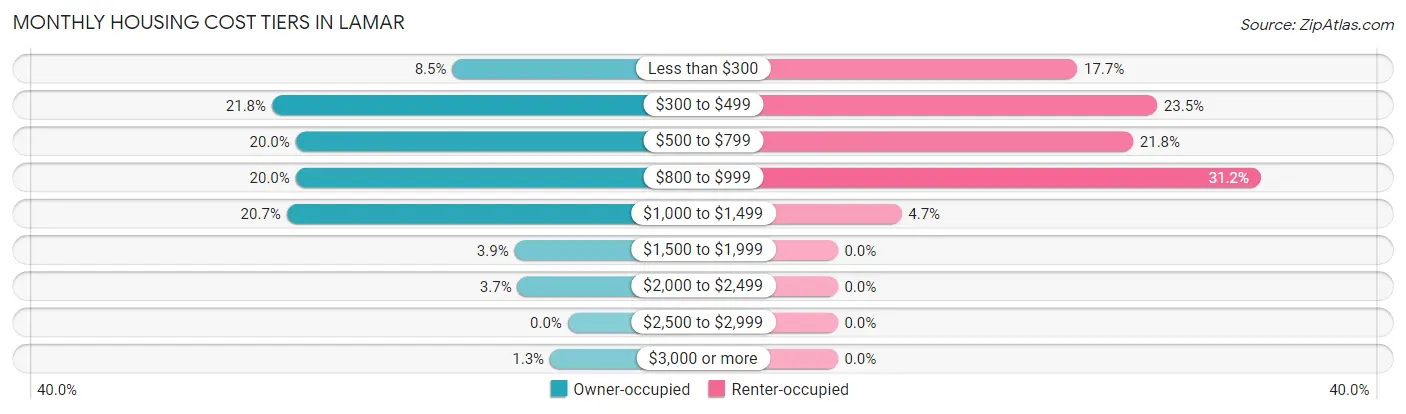
| Monthly Cost | Owner-occupied | Renter-occupied |
| Less than $300 | 39 (8.5%) | 30 (17.6%) |
| $300 to $499 | 100 (21.8%) | 40 (23.5%) |
| $500 to $799 | 92 (20.0%) | 37 (21.8%) |
| $800 to $999 | 92 (20.0%) | 53 (31.2%) |
| $1,000 to $1,499 | 95 (20.7%) | 8 (4.7%) |
| $1,500 to $1,999 | 18 (3.9%) | 0 (0.0%) |
| $2,000 to $2,499 | 17 (3.7%) | 0 (0.0%) |
| $2,500 to $2,999 | 0 (0.0%) | 0 (0.0%) |
| $3,000 or more | 6 (1.3%) | 0 (0.0%) |
| Total | 459 (100.0%) | 170 (100.0%) |
Physical Housing Characteristics in Lamar
Housing Structures in Lamar
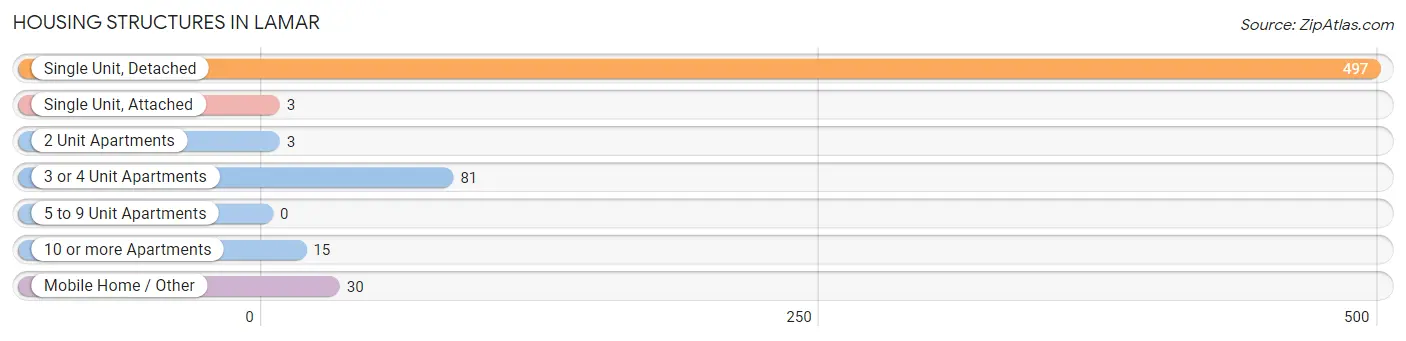
| Structure Type | # Housing Units | % Housing Units |
| Single Unit, Detached | 497 | 79.0% |
| Single Unit, Attached | 3 | 0.5% |
| 2 Unit Apartments | 3 | 0.5% |
| 3 or 4 Unit Apartments | 81 | 12.9% |
| 5 to 9 Unit Apartments | 0 | 0.0% |
| 10 or more Apartments | 15 | 2.4% |
| Mobile Home / Other | 30 | 4.8% |
| Total | 629 | 100.0% |
Housing Structures by Occupancy in Lamar
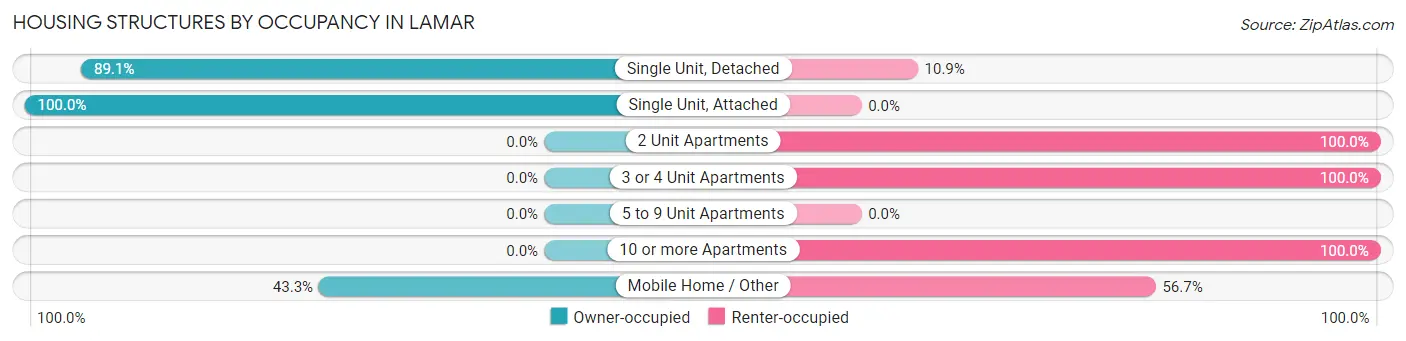
| Structure Type | Owner-occupied | Renter-occupied |
| Single Unit, Detached | 443 (89.1%) | 54 (10.9%) |
| Single Unit, Attached | 3 (100.0%) | 0 (0.0%) |
| 2 Unit Apartments | 0 (0.0%) | 3 (100.0%) |
| 3 or 4 Unit Apartments | 0 (0.0%) | 81 (100.0%) |
| 5 to 9 Unit Apartments | 0 (0.0%) | 0 (0.0%) |
| 10 or more Apartments | 0 (0.0%) | 15 (100.0%) |
| Mobile Home / Other | 13 (43.3%) | 17 (56.7%) |
| Total | 459 (73.0%) | 170 (27.0%) |
Housing Structures by Number of Rooms in Lamar
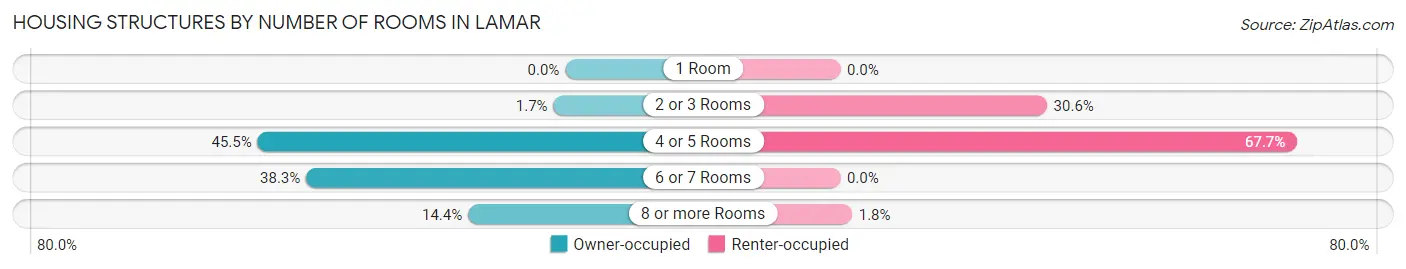
| Number of Rooms | Owner-occupied | Renter-occupied |
| 1 Room | 0 (0.0%) | 0 (0.0%) |
| 2 or 3 Rooms | 8 (1.7%) | 52 (30.6%) |
| 4 or 5 Rooms | 209 (45.5%) | 115 (67.6%) |
| 6 or 7 Rooms | 176 (38.3%) | 0 (0.0%) |
| 8 or more Rooms | 66 (14.4%) | 3 (1.8%) |
| Total | 459 (100.0%) | 170 (100.0%) |
Housing Structure by Heating Type in Lamar
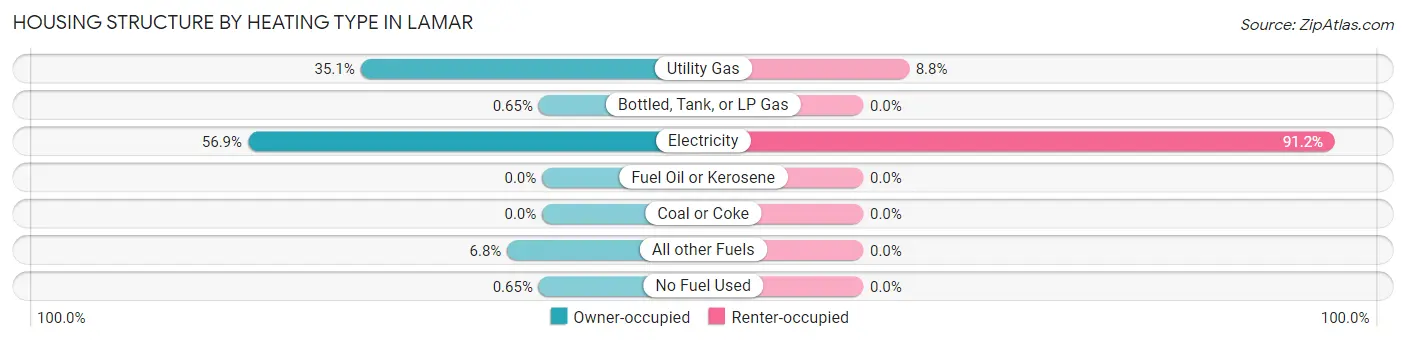
| Heating Type | Owner-occupied | Renter-occupied |
| Utility Gas | 161 (35.1%) | 15 (8.8%) |
| Bottled, Tank, or LP Gas | 3 (0.6%) | 0 (0.0%) |
| Electricity | 261 (56.9%) | 155 (91.2%) |
| Fuel Oil or Kerosene | 0 (0.0%) | 0 (0.0%) |
| Coal or Coke | 0 (0.0%) | 0 (0.0%) |
| All other Fuels | 31 (6.8%) | 0 (0.0%) |
| No Fuel Used | 3 (0.6%) | 0 (0.0%) |
| Total | 459 (100.0%) | 170 (100.0%) |
Household Vehicle Usage in Lamar
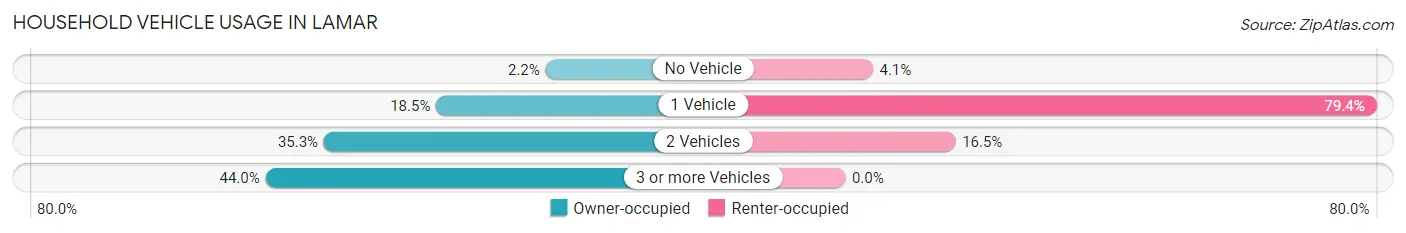
| Vehicles per Household | Owner-occupied | Renter-occupied |
| No Vehicle | 10 (2.2%) | 7 (4.1%) |
| 1 Vehicle | 85 (18.5%) | 135 (79.4%) |
| 2 Vehicles | 162 (35.3%) | 28 (16.5%) |
| 3 or more Vehicles | 202 (44.0%) | 0 (0.0%) |
| Total | 459 (100.0%) | 170 (100.0%) |
Real Estate & Mortgages in Lamar
Real Estate and Mortgage Overview in Lamar
| Characteristic | Without Mortgage | With Mortgage |
| Housing Units | 162 | 297 |
| Median Property Value | $127,300 | $130,000 |
| Median Household Income | $30,625 | $51 |
| Monthly Housing Costs | $348 | $6 |
| Real Estate Taxes | $523 | $16 |
Property Value by Mortgage Status in Lamar
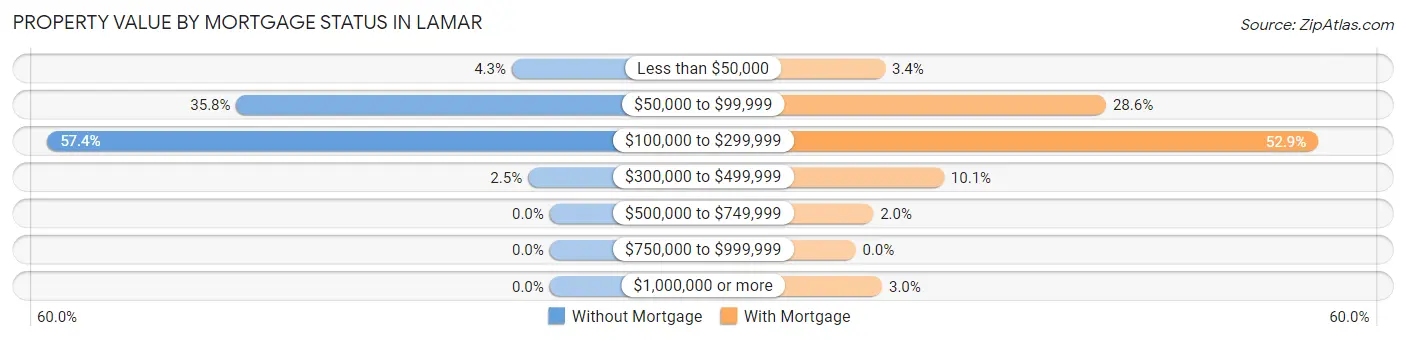
| Property Value | Without Mortgage | With Mortgage |
| Less than $50,000 | 7 (4.3%) | 10 (3.4%) |
| $50,000 to $99,999 | 58 (35.8%) | 85 (28.6%) |
| $100,000 to $299,999 | 93 (57.4%) | 157 (52.9%) |
| $300,000 to $499,999 | 4 (2.5%) | 30 (10.1%) |
| $500,000 to $749,999 | 0 (0.0%) | 6 (2.0%) |
| $750,000 to $999,999 | 0 (0.0%) | 0 (0.0%) |
| $1,000,000 or more | 0 (0.0%) | 9 (3.0%) |
| Total | 162 (100.0%) | 297 (100.0%) |
Household Income by Mortgage Status in Lamar
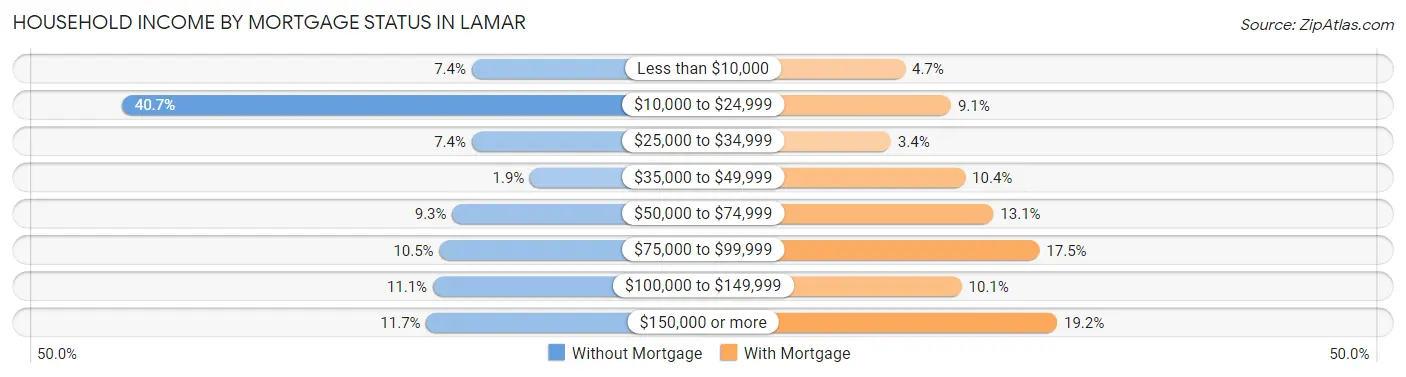
| Household Income | Without Mortgage | With Mortgage |
| Less than $10,000 | 12 (7.4%) | 14 (4.7%) |
| $10,000 to $24,999 | 66 (40.7%) | 27 (9.1%) |
| $25,000 to $34,999 | 12 (7.4%) | 10 (3.4%) |
| $35,000 to $49,999 | 3 (1.8%) | 31 (10.4%) |
| $50,000 to $74,999 | 15 (9.3%) | 39 (13.1%) |
| $75,000 to $99,999 | 17 (10.5%) | 52 (17.5%) |
| $100,000 to $149,999 | 18 (11.1%) | 30 (10.1%) |
| $150,000 or more | 19 (11.7%) | 57 (19.2%) |
| Total | 162 (100.0%) | 297 (100.0%) |
Property Value to Household Income Ratio in Lamar
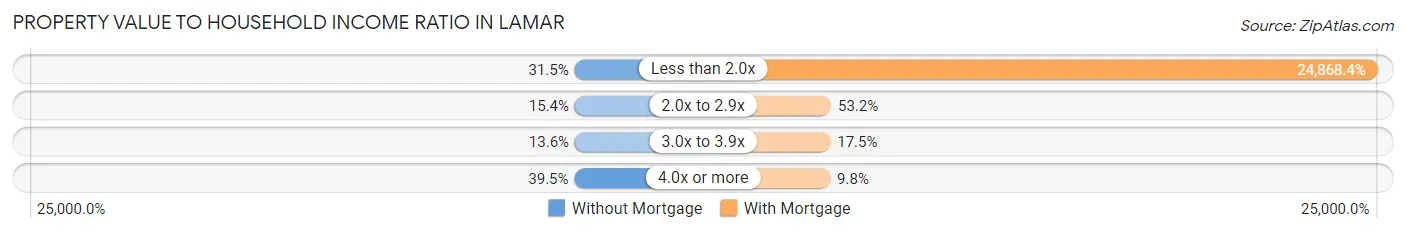
| Value-to-Income Ratio | Without Mortgage | With Mortgage |
| Less than 2.0x | 51 (31.5%) | 73,859 (24,868.4%) |
| 2.0x to 2.9x | 25 (15.4%) | 158 (53.2%) |
| 3.0x to 3.9x | 22 (13.6%) | 52 (17.5%) |
| 4.0x or more | 64 (39.5%) | 29 (9.8%) |
| Total | 162 (100.0%) | 297 (100.0%) |
Real Estate Taxes by Mortgage Status in Lamar
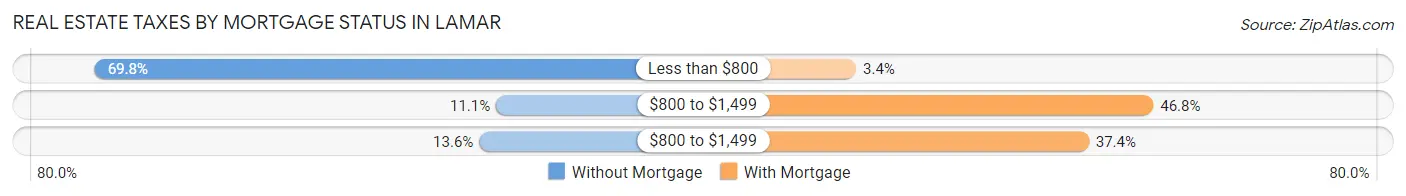
| Property Taxes | Without Mortgage | With Mortgage |
| Less than $800 | 113 (69.8%) | 10 (3.4%) |
| $800 to $1,499 | 18 (11.1%) | 139 (46.8%) |
| $800 to $1,499 | 22 (13.6%) | 111 (37.4%) |
| Total | 162 (100.0%) | 297 (100.0%) |
Health & Disability in Lamar
Health Insurance Coverage by Age in Lamar
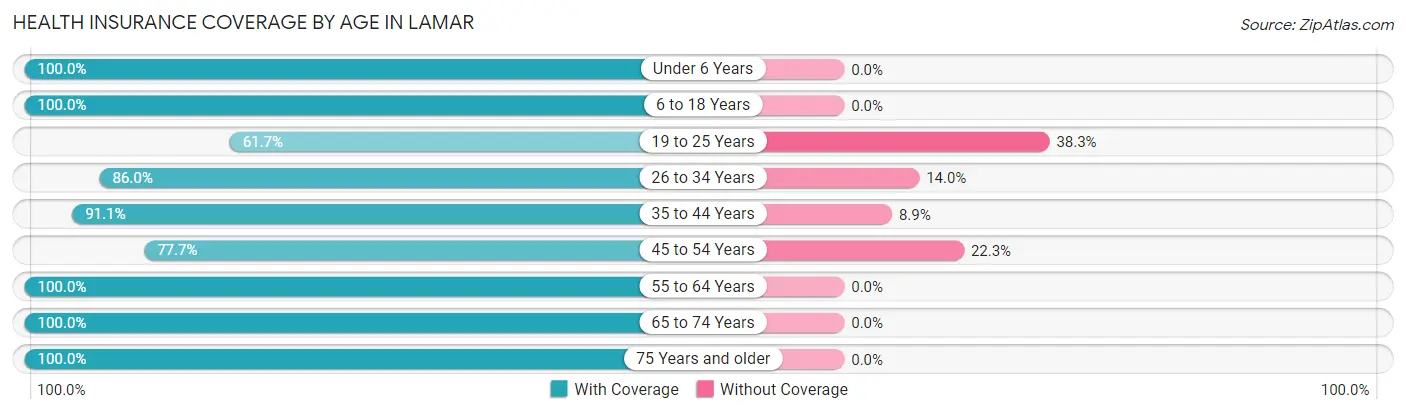
| Age Bracket | With Coverage | Without Coverage |
| Under 6 Years | 197 (100.0%) | 0 (0.0%) |
| 6 to 18 Years | 362 (100.0%) | 0 (0.0%) |
| 19 to 25 Years | 92 (61.7%) | 57 (38.3%) |
| 26 to 34 Years | 234 (86.0%) | 38 (14.0%) |
| 35 to 44 Years | 205 (91.1%) | 20 (8.9%) |
| 45 to 54 Years | 94 (77.7%) | 27 (22.3%) |
| 55 to 64 Years | 131 (100.0%) | 0 (0.0%) |
| 65 to 74 Years | 147 (100.0%) | 0 (0.0%) |
| 75 Years and older | 113 (100.0%) | 0 (0.0%) |
| Total | 1,575 (91.7%) | 142 (8.3%) |
Health Insurance Coverage by Citizenship Status in Lamar
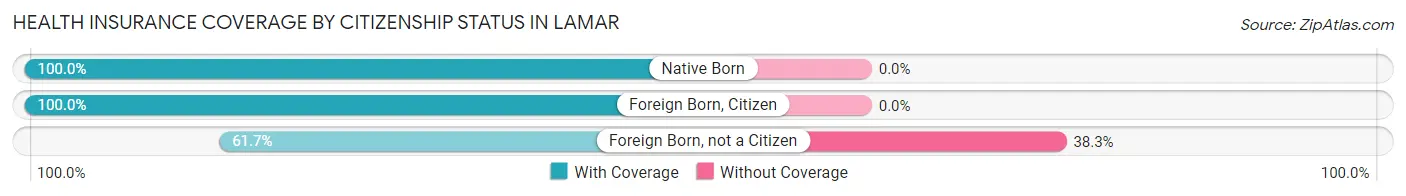
| Citizenship Status | With Coverage | Without Coverage |
| Native Born | 197 (100.0%) | 0 (0.0%) |
| Foreign Born, Citizen | 362 (100.0%) | 0 (0.0%) |
| Foreign Born, not a Citizen | 92 (61.7%) | 57 (38.3%) |
Health Insurance Coverage by Household Income in Lamar
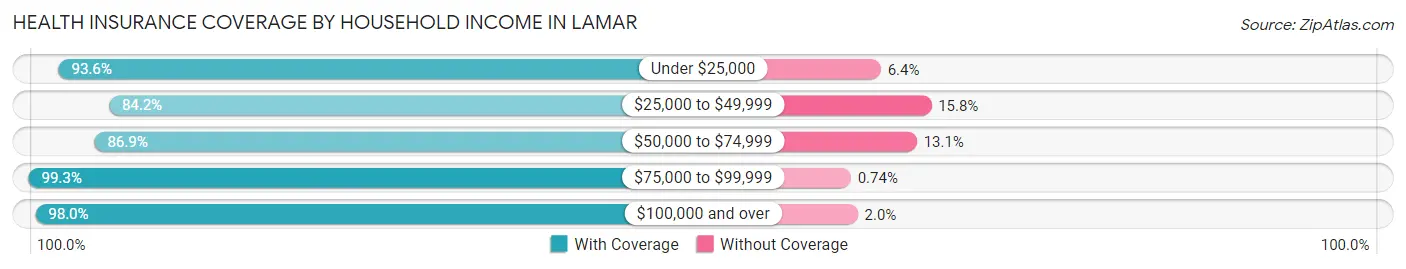
| Household Income | With Coverage | Without Coverage |
| Under $25,000 | 412 (93.6%) | 28 (6.4%) |
| $25,000 to $49,999 | 394 (84.2%) | 74 (15.8%) |
| $50,000 to $74,999 | 199 (86.9%) | 30 (13.1%) |
| $75,000 to $99,999 | 134 (99.3%) | 1 (0.7%) |
| $100,000 and over | 436 (98.0%) | 9 (2.0%) |
Public vs Private Health Insurance Coverage by Age in Lamar
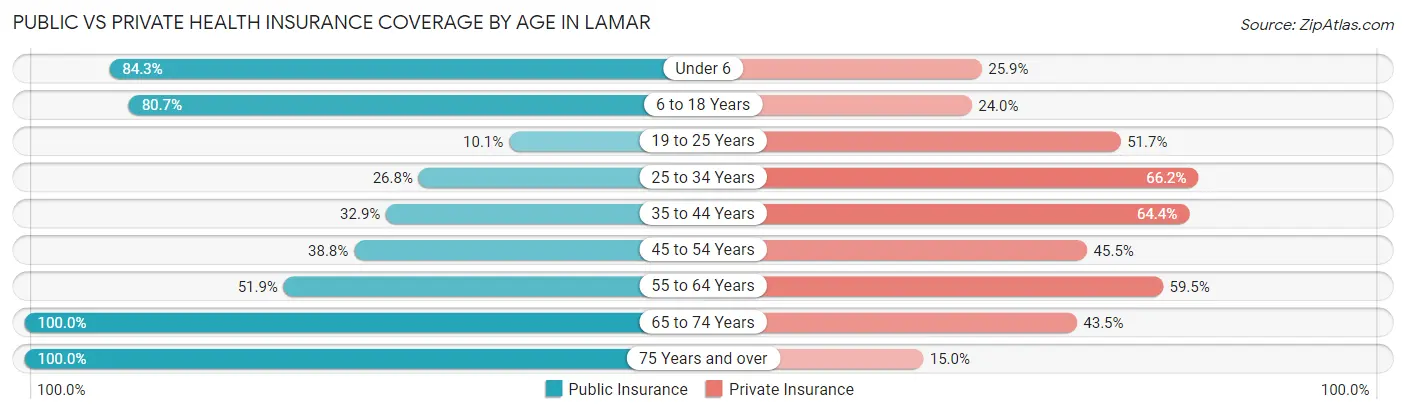
| Age Bracket | Public Insurance | Private Insurance |
| Under 6 | 166 (84.3%) | 51 (25.9%) |
| 6 to 18 Years | 292 (80.7%) | 87 (24.0%) |
| 19 to 25 Years | 15 (10.1%) | 77 (51.7%) |
| 25 to 34 Years | 73 (26.8%) | 180 (66.2%) |
| 35 to 44 Years | 74 (32.9%) | 145 (64.4%) |
| 45 to 54 Years | 47 (38.8%) | 55 (45.5%) |
| 55 to 64 Years | 68 (51.9%) | 78 (59.5%) |
| 65 to 74 Years | 147 (100.0%) | 64 (43.5%) |
| 75 Years and over | 113 (100.0%) | 17 (15.0%) |
| Total | 995 (58.0%) | 754 (43.9%) |
Disability Status by Sex by Age in Lamar
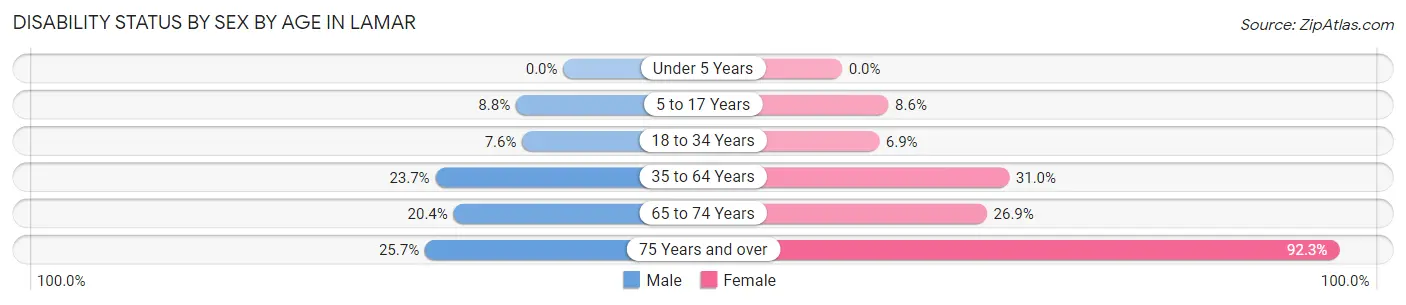
| Age Bracket | Male | Female |
| Under 5 Years | 0 (0.0%) | 0 (0.0%) |
| 5 to 17 Years | 16 (8.8%) | 18 (8.6%) |
| 18 to 34 Years | 16 (7.6%) | 15 (6.9%) |
| 35 to 64 Years | 52 (23.7%) | 80 (31.0%) |
| 65 to 74 Years | 11 (20.4%) | 25 (26.9%) |
| 75 Years and over | 19 (25.7%) | 36 (92.3%) |
Disability Class by Sex by Age in Lamar
Disability Class: Hearing Difficulty
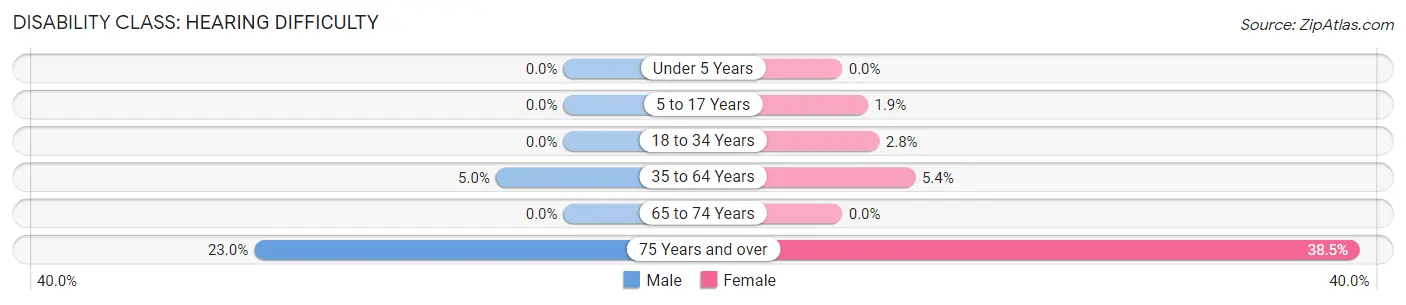
| Age Bracket | Male | Female |
| Under 5 Years | 0 (0.0%) | 0 (0.0%) |
| 5 to 17 Years | 0 (0.0%) | 4 (1.9%) |
| 18 to 34 Years | 0 (0.0%) | 6 (2.8%) |
| 35 to 64 Years | 11 (5.0%) | 14 (5.4%) |
| 65 to 74 Years | 0 (0.0%) | 0 (0.0%) |
| 75 Years and over | 17 (23.0%) | 15 (38.5%) |
Disability Class: Vision Difficulty
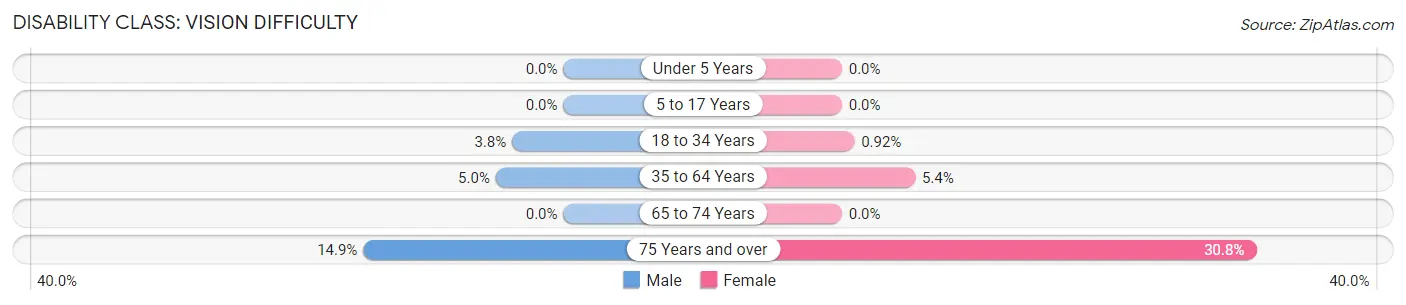
| Age Bracket | Male | Female |
| Under 5 Years | 0 (0.0%) | 0 (0.0%) |
| 5 to 17 Years | 0 (0.0%) | 0 (0.0%) |
| 18 to 34 Years | 8 (3.8%) | 2 (0.9%) |
| 35 to 64 Years | 11 (5.0%) | 14 (5.4%) |
| 65 to 74 Years | 0 (0.0%) | 0 (0.0%) |
| 75 Years and over | 11 (14.9%) | 12 (30.8%) |
Disability Class: Cognitive Difficulty
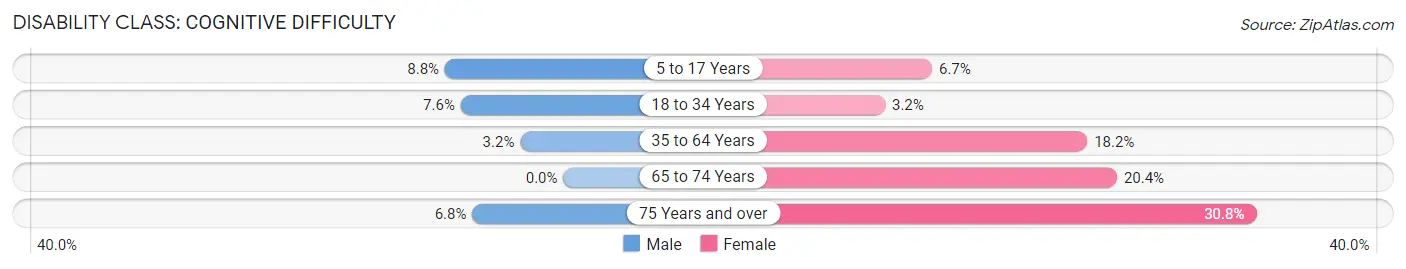
| Age Bracket | Male | Female |
| 5 to 17 Years | 16 (8.8%) | 14 (6.7%) |
| 18 to 34 Years | 16 (7.6%) | 7 (3.2%) |
| 35 to 64 Years | 7 (3.2%) | 47 (18.2%) |
| 65 to 74 Years | 0 (0.0%) | 19 (20.4%) |
| 75 Years and over | 5 (6.8%) | 12 (30.8%) |
Disability Class: Ambulatory Difficulty
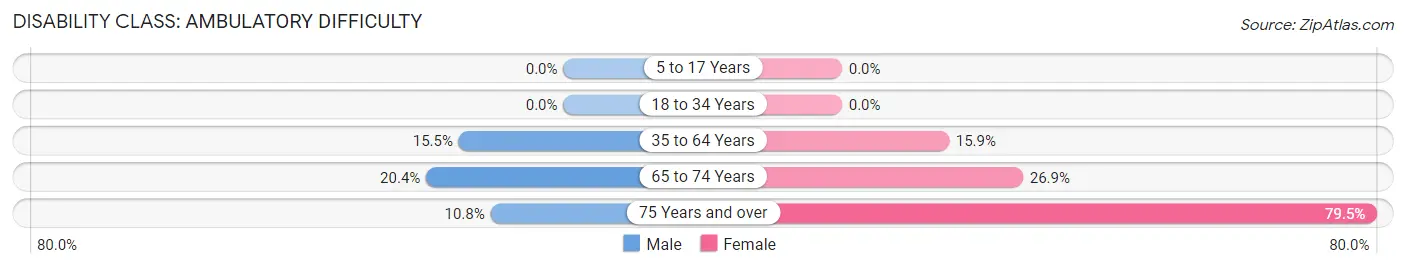
| Age Bracket | Male | Female |
| 5 to 17 Years | 0 (0.0%) | 0 (0.0%) |
| 18 to 34 Years | 0 (0.0%) | 0 (0.0%) |
| 35 to 64 Years | 34 (15.5%) | 41 (15.9%) |
| 65 to 74 Years | 11 (20.4%) | 25 (26.9%) |
| 75 Years and over | 8 (10.8%) | 31 (79.5%) |
Disability Class: Self-Care Difficulty
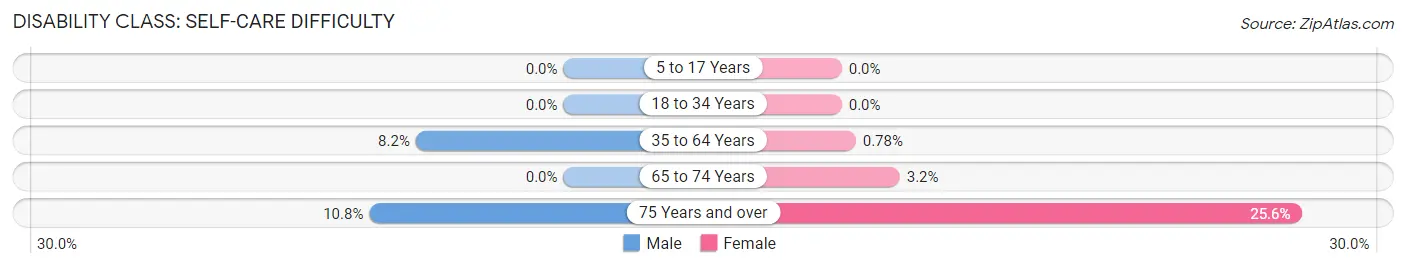
| Age Bracket | Male | Female |
| 5 to 17 Years | 0 (0.0%) | 0 (0.0%) |
| 18 to 34 Years | 0 (0.0%) | 0 (0.0%) |
| 35 to 64 Years | 18 (8.2%) | 2 (0.8%) |
| 65 to 74 Years | 0 (0.0%) | 3 (3.2%) |
| 75 Years and over | 8 (10.8%) | 10 (25.6%) |
Technology Access in Lamar
Computing Device Access in Lamar
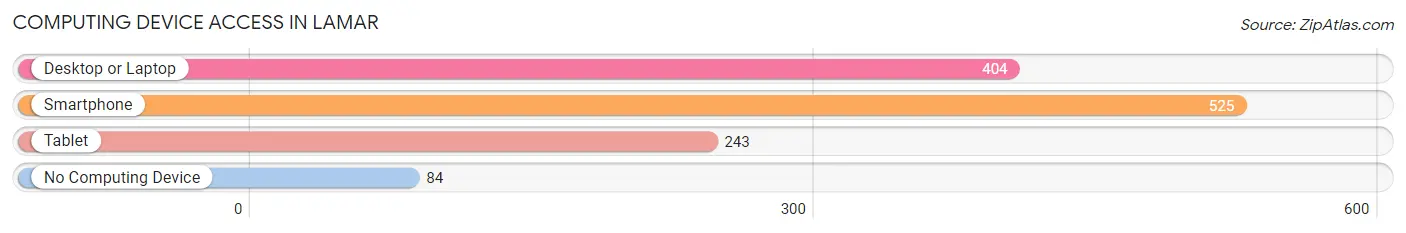
| Device Type | # Households | % Households |
| Desktop or Laptop | 404 | 64.2% |
| Smartphone | 525 | 83.5% |
| Tablet | 243 | 38.6% |
| No Computing Device | 84 | 13.4% |
| Total | 629 | 100.0% |
Internet Access in Lamar
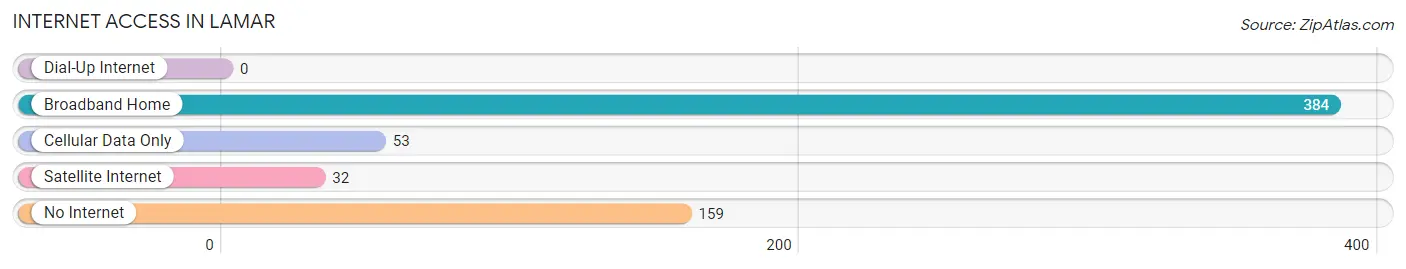
| Internet Type | # Households | % Households |
| Dial-Up Internet | 0 | 0.0% |
| Broadband Home | 384 | 61.1% |
| Cellular Data Only | 53 | 8.4% |
| Satellite Internet | 32 | 5.1% |
| No Internet | 159 | 25.3% |
| Total | 629 | 100.0% |
Lamar Summary
Lamar, Arkansas is a small town located in Johnson County in the northwest corner of the state. It is situated on the banks of the Arkansas River and is surrounded by the Ozark Mountains. The town was founded in 1883 and has a population of approximately 1,000 people.
Geography
Lamar is located in the northwest corner of Arkansas, in Johnson County. It is situated on the banks of the Arkansas River and is surrounded by the Ozark Mountains. The town is located at an elevation of 845 feet above sea level. The climate in Lamar is humid subtropical, with hot summers and mild winters. The average annual temperature is around 64 degrees Fahrenheit.
Economy
Lamar’s economy is largely based on agriculture and tourism. The town is home to several farms, which produce a variety of crops, including corn, soybeans, wheat, and hay. The town also has a number of small businesses, including restaurants, stores, and a few manufacturing plants. Tourism is also an important part of the local economy, as the town is located near several popular attractions, such as the Ozark National Forest and the Buffalo National River.
Demographics
As of the 2010 census, Lamar had a population of 1,000 people. The racial makeup of the town was 97.2% White, 0.7% African American, 0.3% Native American, 0.2% Asian, 0.1% Pacific Islander, and 1.5% from other races. The median household income was $30,000, and the median family income was $35,000. The per capita income was $14,000.
History
Lamar was founded in 1883 by a group of settlers from Missouri. The town was named after Lucius Quintus Cincinnatus Lamar, a former United States Senator from Mississippi. The town was incorporated in 1887 and quickly grew to become an important trading center in the region. In the early 1900s, the town was home to several sawmills, gristmills, and cotton gins.
In the late 20th century, Lamar began to experience a decline in population as many of its residents moved away in search of better economic opportunities. However, the town has seen a resurgence in recent years, as more people have moved to the area in search of a quieter, more rural lifestyle.
Conclusion
Lamar, Arkansas is a small town located in Johnson County in the northwest corner of the state. It is situated on the banks of the Arkansas River and is surrounded by the Ozark Mountains. The town was founded in 1883 and has a population of approximately 1,000 people. The economy of Lamar is largely based on agriculture and tourism, and the town is home to several small businesses. The racial makeup of the town is predominantly White, with a small percentage of African American, Native American, Asian, and Pacific Islander residents. Lamar has experienced a resurgence in recent years, as more people have moved to the area in search of a quieter, more rural lifestyle.
Common Questions
What is the Total Population of Lamar?
Total Population of Lamar is 1,731.
What is the Total Male Population of Lamar?
Total Male Population of Lamar is 805.
What is the Total Female Population of Lamar?
Total Female Population of Lamar is 926.
What is the Ratio of Males per 100 Females in Lamar?
There are 86.93 Males per 100 Females in Lamar.
What is the Ratio of Females per 100 Males in Lamar?
There are 115.03 Females per 100 Males in Lamar.
What is the Median Population Age in Lamar?
Median Population Age in Lamar is 31.0 Years.
What is the Average Family Size in Lamar
Average Family Size in Lamar is 3.2 People.
What is the Average Household Size in Lamar
Average Household Size in Lamar is 2.7 People.
What is Per Capita Income in Lamar?
Per Capita income in Lamar is $22,196.
What is the Median Family Income in Lamar?
Median Family Income in Lamar is $51,875.
What is the Median Household income in Lamar?
Median Household Income in Lamar is $41,188.
What is Income or Wage Gap in Lamar?
Income or Wage Gap in Lamar is 41.2%.
Women in Lamar earn 58.8 cents for every dollar earned by a man.
What is Inequality or Gini Index in Lamar?
Inequality or Gini Index in Lamar is 0.51.
How Large is the Labor Force in Lamar?
There are 667 People in the Labor Forcein in Lamar.
What is the Percentage of People in the Labor Force in Lamar?
53.2% of People are in the Labor Force in Lamar.
What is the Unemployment Rate in Lamar?
Unemployment Rate in Lamar is 2.9%.