Lake City, AR Map & Demographics
Lake City Map
Lake City Overview
$30,198
PER CAPITA INCOME
$64,773
AVG FAMILY INCOME
$56,414
AVG HOUSEHOLD INCOME
35.8%
WAGE / INCOME GAP [ % ]
64.2¢/ $1
WAGE / INCOME GAP [ $ ]
0.39
INEQUALITY / GINI INDEX
2,389
TOTAL POPULATION
1,160
MALE POPULATION
1,229
FEMALE POPULATION
94.39
MALES / 100 FEMALES
105.95
FEMALES / 100 MALES
32.5
MEDIAN AGE
2.8
AVG FAMILY SIZE
2.4
AVG HOUSEHOLD SIZE
1,288
LABOR FORCE [ PEOPLE ]
66.0%
PERCENT IN LABOR FORCE
8.3%
UNEMPLOYMENT RATE
Lake City Zip Codes
Lake City Area Codes
Income in Lake City
Income Overview in Lake City
Per Capita Income in Lake City is $30,198, while median incomes of families and households are $64,773 and $56,414 respectively.
| Characteristic | Number | Measure |
| Per Capita Income | 2,389 | $30,198 |
| Median Family Income | 662 | $64,773 |
| Mean Family Income | 662 | $85,011 |
| Median Household Income | 986 | $56,414 |
| Mean Household Income | 986 | $70,747 |
| Income Deficit | 662 | $0 |
| Wage / Income Gap (%) | 2,389 | 35.79% |
| Wage / Income Gap ($) | 2,389 | 64.21¢ per $1 |
| Gini / Inequality Index | 2,389 | 0.39 |
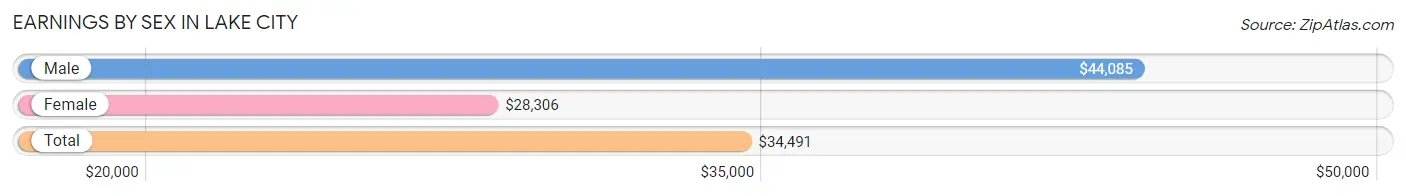
Earnings by Sex in Lake City
Average Earnings in Lake City are $34,491, $44,085 for men and $28,306 for women, a difference of 35.8%.
| Sex | Number | Average Earnings |
| Male | 698 (52.5%) | $44,085 |
| Female | 631 (47.5%) | $28,306 |
| Total | 1,329 (100.0%) | $34,491 |
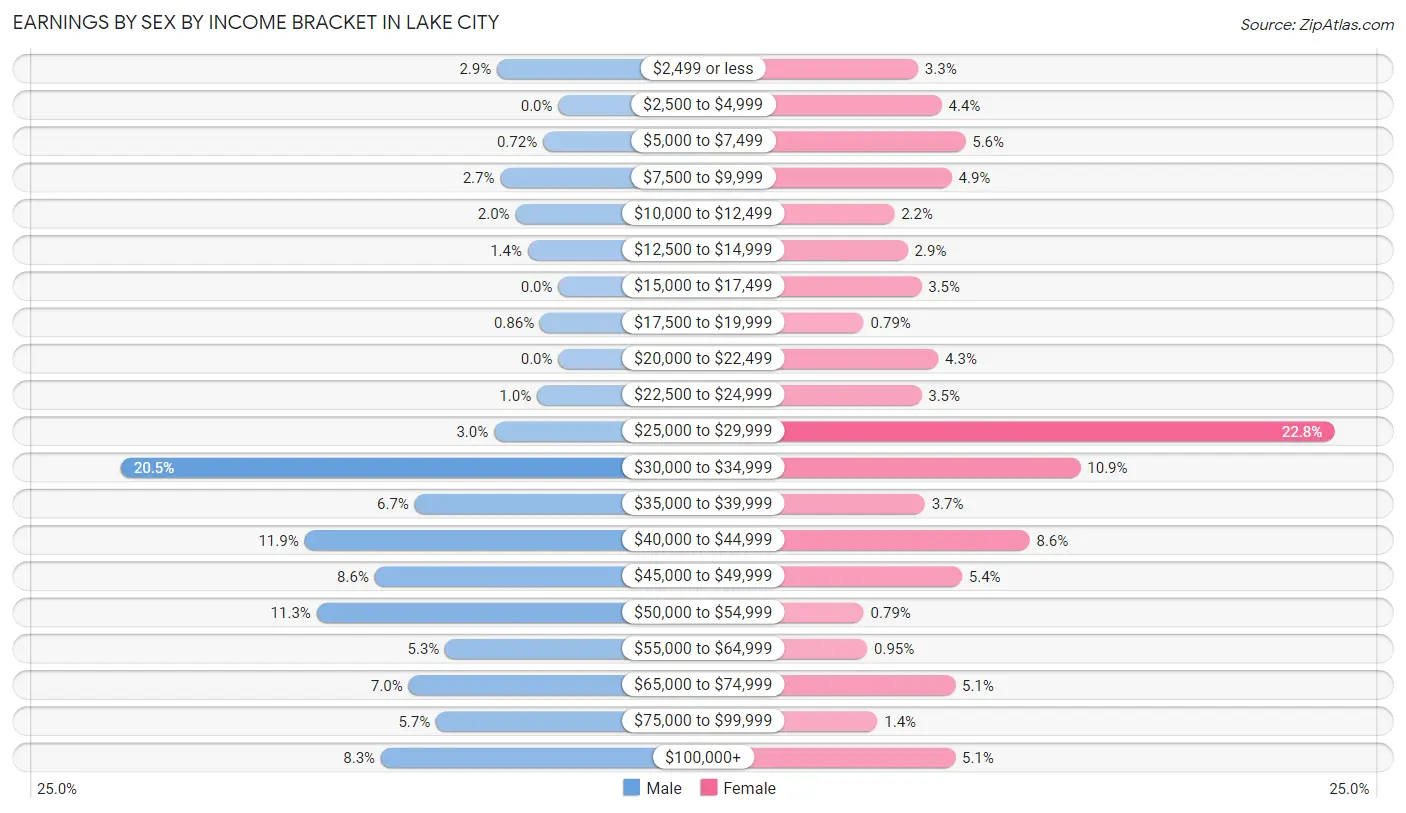
Earnings by Sex by Income Bracket in Lake City
The most common earnings brackets in Lake City are $30,000 to $34,999 for men (143 | 20.5%) and $25,000 to $29,999 for women (144 | 22.8%).
| Income | Male | Female |
| $2,499 or less | 20 (2.9%) | 21 (3.3%) |
| $2,500 to $4,999 | 0 (0.0%) | 28 (4.4%) |
| $5,000 to $7,499 | 5 (0.7%) | 35 (5.6%) |
| $7,500 to $9,999 | 19 (2.7%) | 31 (4.9%) |
| $10,000 to $12,499 | 14 (2.0%) | 14 (2.2%) |
| $12,500 to $14,999 | 10 (1.4%) | 18 (2.9%) |
| $15,000 to $17,499 | 0 (0.0%) | 22 (3.5%) |
| $17,500 to $19,999 | 6 (0.9%) | 5 (0.8%) |
| $20,000 to $22,499 | 0 (0.0%) | 27 (4.3%) |
| $22,500 to $24,999 | 7 (1.0%) | 22 (3.5%) |
| $25,000 to $29,999 | 21 (3.0%) | 144 (22.8%) |
| $30,000 to $34,999 | 143 (20.5%) | 69 (10.9%) |
| $35,000 to $39,999 | 47 (6.7%) | 23 (3.6%) |
| $40,000 to $44,999 | 83 (11.9%) | 54 (8.6%) |
| $45,000 to $49,999 | 60 (8.6%) | 34 (5.4%) |
| $50,000 to $54,999 | 79 (11.3%) | 5 (0.8%) |
| $55,000 to $64,999 | 37 (5.3%) | 6 (0.9%) |
| $65,000 to $74,999 | 49 (7.0%) | 32 (5.1%) |
| $75,000 to $99,999 | 40 (5.7%) | 9 (1.4%) |
| $100,000+ | 58 (8.3%) | 32 (5.1%) |
| Total | 698 (100.0%) | 631 (100.0%) |
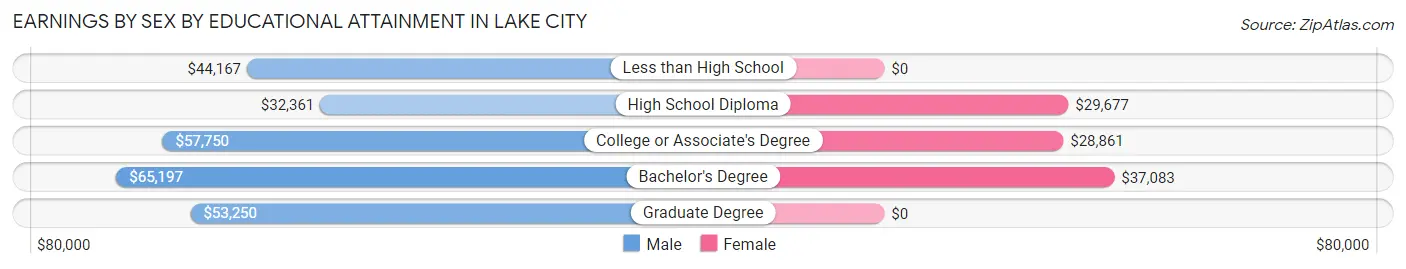
Earnings by Sex by Educational Attainment in Lake City
Average earnings in Lake City are $45,402 for men and $30,352 for women, a difference of 33.2%. Men with an educational attainment of bachelor's degree enjoy the highest average annual earnings of $65,197, while those with high school diploma education earn the least with $32,361. Women with an educational attainment of bachelor's degree earn the most with the average annual earnings of $37,083, while those with college or associate's degree education have the smallest earnings of $28,861.
| Educational Attainment | Male Income | Female Income |
| Less than High School | $44,167 | $0 |
| High School Diploma | $32,361 | $29,677 |
| College or Associate's Degree | $57,750 | $28,861 |
| Bachelor's Degree | $65,197 | $37,083 |
| Graduate Degree | $53,250 | $0 |
| Total | $45,402 | $30,352 |
Family Income in Lake City
Family Income Brackets in Lake City
According to the Lake City family income data, there are 229 families falling into the $50,000 to $74,999 income range, which is the most common income bracket and makes up 34.6% of all families.
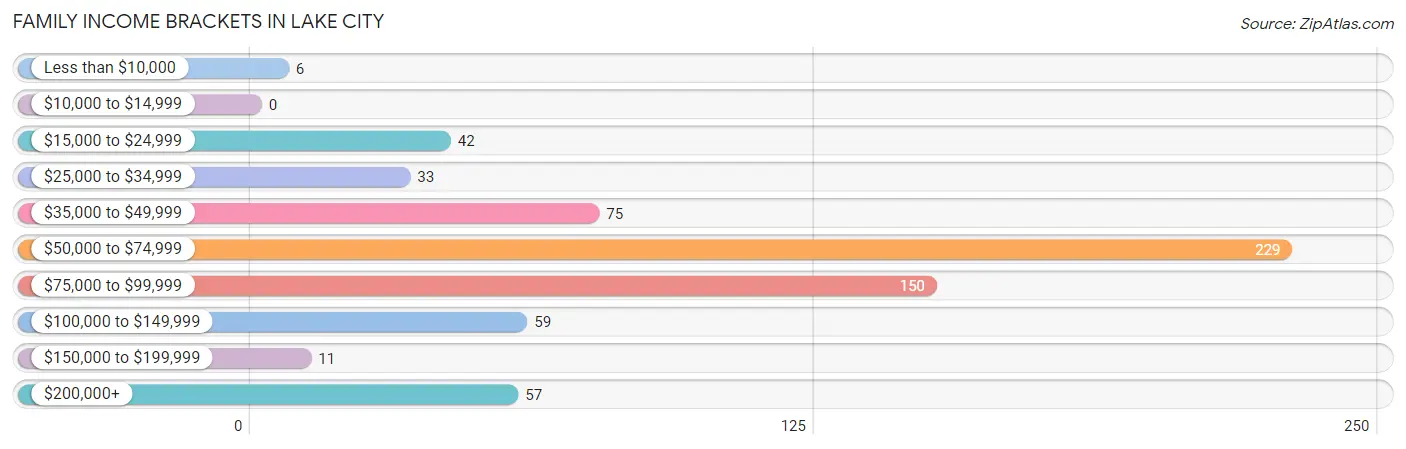
| Income Bracket | # Families | % Families |
| Less than $10,000 | 6 | 0.9% |
| $10,000 to $14,999 | 0 | 0.0% |
| $15,000 to $24,999 | 42 | 6.3% |
| $25,000 to $34,999 | 33 | 5.0% |
| $35,000 to $49,999 | 75 | 11.3% |
| $50,000 to $74,999 | 229 | 34.6% |
| $75,000 to $99,999 | 150 | 22.7% |
| $100,000 to $149,999 | 59 | 8.9% |
| $150,000 to $199,999 | 11 | 1.7% |
| $200,000+ | 57 | 8.6% |
Family Income by Famaliy Size in Lake City
4-person families (104 | 15.7%) account for the highest median family income in Lake City with $128,125 per family, while 4-person families (104 | 15.7%) have the highest median income of $32,031 per family member.
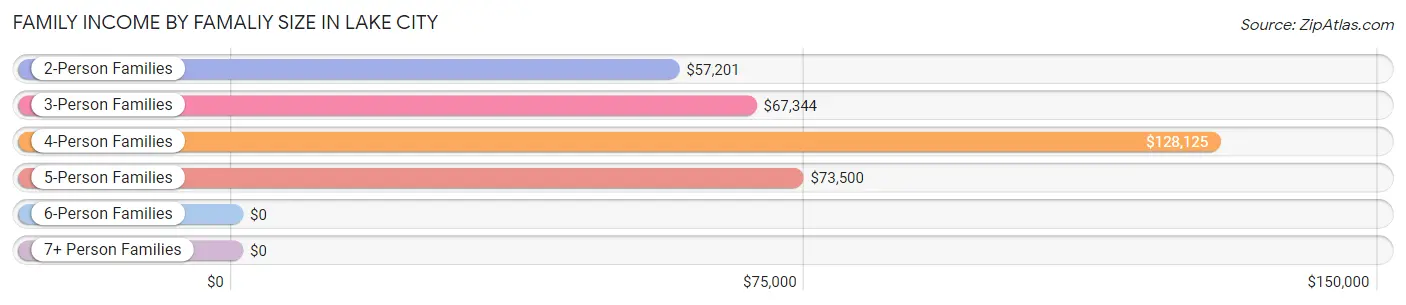
| Income Bracket | # Families | Median Income |
| 2-Person Families | 390 (58.9%) | $57,201 |
| 3-Person Families | 111 (16.8%) | $67,344 |
| 4-Person Families | 104 (15.7%) | $128,125 |
| 5-Person Families | 30 (4.5%) | $73,500 |
| 6-Person Families | 27 (4.1%) | $0 |
| 7+ Person Families | 0 (0.0%) | $0 |
| Total | 662 (100.0%) | $64,773 |
Family Income by Number of Earners in Lake City
The median family income in Lake City is $64,773, with families comprising 3+ earners (92) having the highest median family income of $130,357, while families with 1 earner (178) have the lowest median family income of $39,844, accounting for 13.9% and 26.9% of families, respectively.
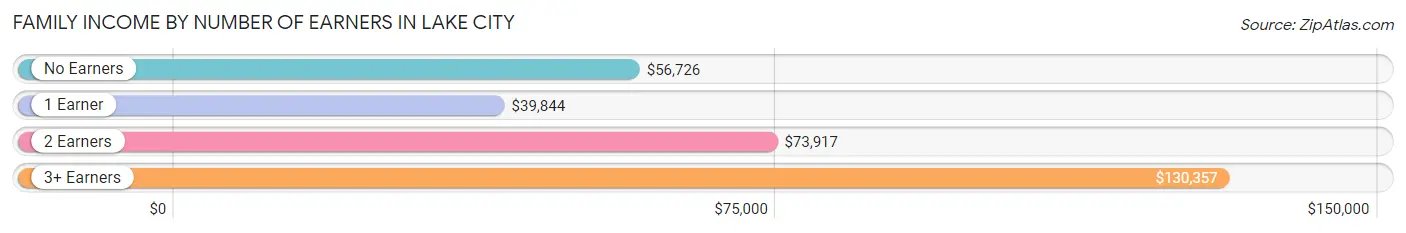
| Number of Earners | # Families | Median Income |
| No Earners | 81 (12.2%) | $56,726 |
| 1 Earner | 178 (26.9%) | $39,844 |
| 2 Earners | 311 (47.0%) | $73,917 |
| 3+ Earners | 92 (13.9%) | $130,357 |
| Total | 662 (100.0%) | $64,773 |
Household Income in Lake City
Household Income Brackets in Lake City
With 337 households falling in the category, the $50,000 to $74,999 income range is the most frequent in Lake City, accounting for 34.2% of all households. In contrast, only 11 households (1.1%) fall into the $150,000 to $199,999 income bracket, making it the least populous group.
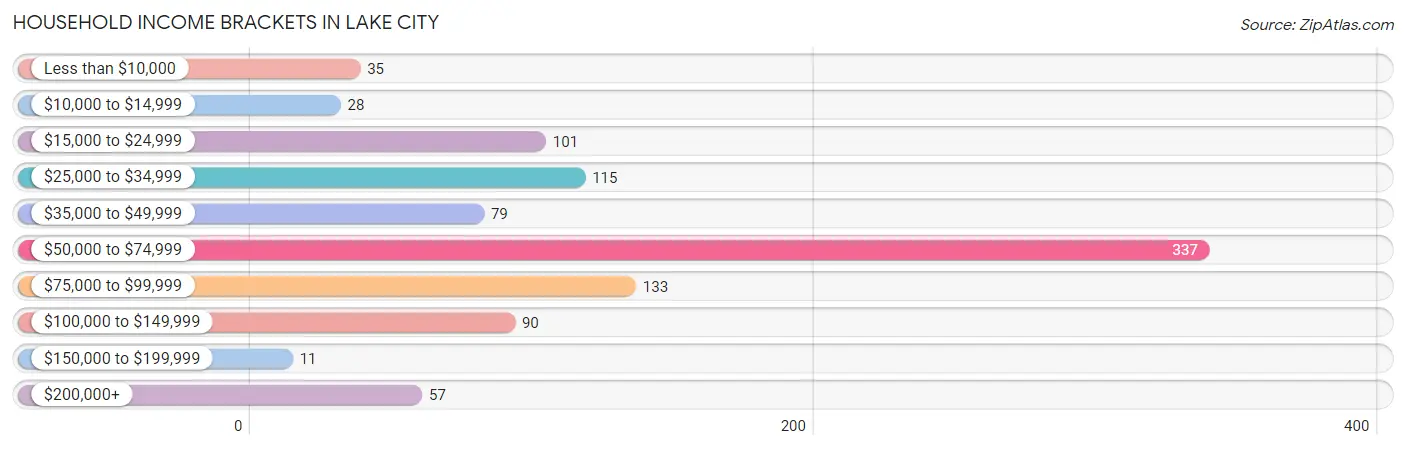
| Income Bracket | # Households | % Households |
| Less than $10,000 | 35 | 3.5% |
| $10,000 to $14,999 | 28 | 2.8% |
| $15,000 to $24,999 | 101 | 10.2% |
| $25,000 to $34,999 | 115 | 11.7% |
| $35,000 to $49,999 | 79 | 8.0% |
| $50,000 to $74,999 | 337 | 34.2% |
| $75,000 to $99,999 | 133 | 13.5% |
| $100,000 to $149,999 | 90 | 9.1% |
| $150,000 to $199,999 | 11 | 1.1% |
| $200,000+ | 57 | 5.8% |
Household Income by Householder Age in Lake City
The median household income in Lake City is $56,414, with the highest median household income of $70,833 found in the 15 to 24 years age bracket for the primary householder. A total of 58 households (5.9%) fall into this category. Meanwhile, the 65+ years age bracket for the primary householder has the lowest median household income of $37,763, with 288 households (29.2%) in this group.
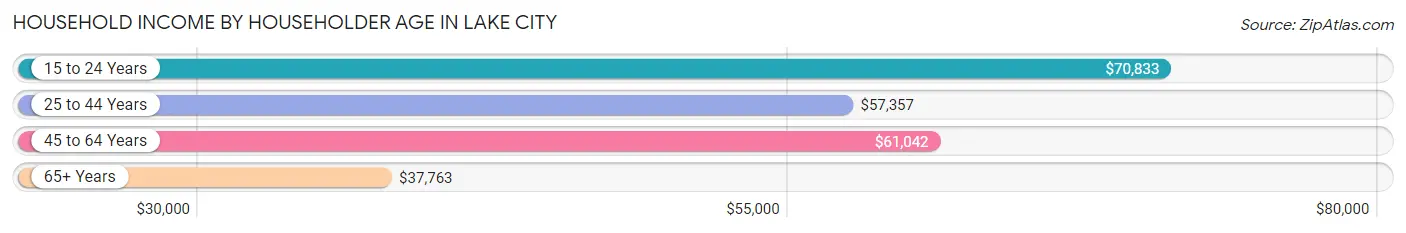
| Income Bracket | # Households | Median Income |
| 15 to 24 Years | 58 (5.9%) | $70,833 |
| 25 to 44 Years | 345 (35.0%) | $57,357 |
| 45 to 64 Years | 295 (29.9%) | $61,042 |
| 65+ Years | 288 (29.2%) | $37,763 |
| Total | 986 (100.0%) | $56,414 |
Poverty in Lake City
Income Below Poverty by Sex and Age in Lake City
With 8.3% poverty level for males and 14.3% for females among the residents of Lake City, 55 to 64 year old males and under 5 year old females are the most vulnerable to poverty, with 23 males (31.9%) and 24 females (31.2%) in their respective age groups living below the poverty level.
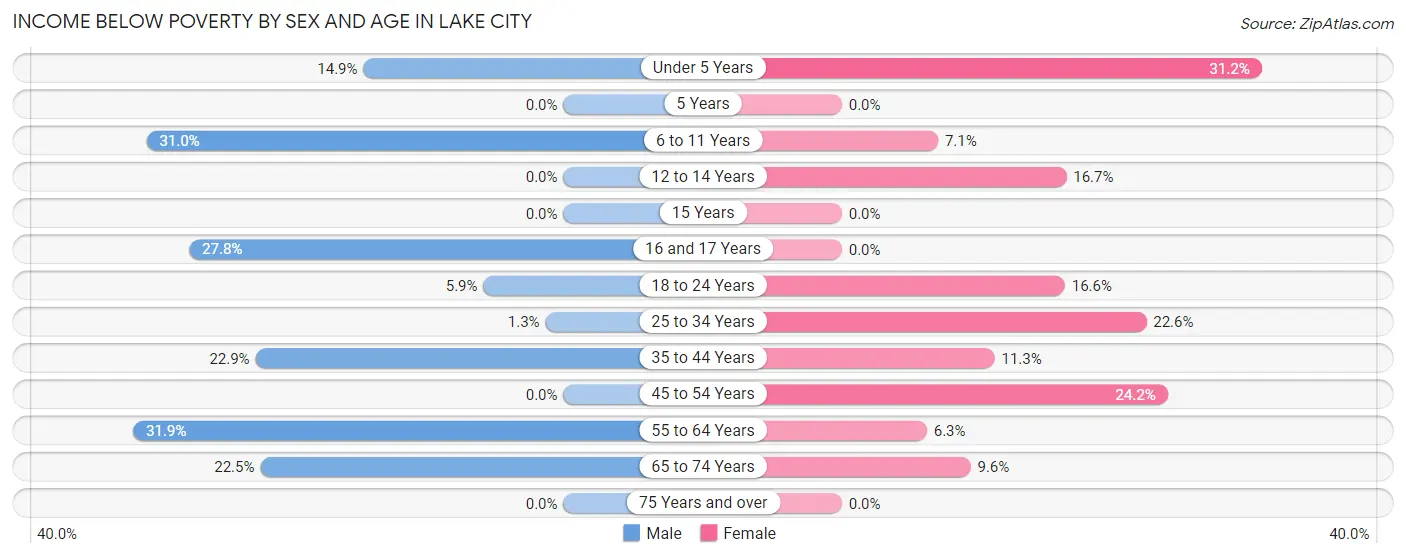
| Age Bracket | Male | Female |
| Under 5 Years | 15 (14.8%) | 24 (31.2%) |
| 5 Years | 0 (0.0%) | 0 (0.0%) |
| 6 to 11 Years | 13 (30.9%) | 5 (7.1%) |
| 12 to 14 Years | 0 (0.0%) | 6 (16.7%) |
| 15 Years | 0 (0.0%) | 0 (0.0%) |
| 16 and 17 Years | 5 (27.8%) | 0 (0.0%) |
| 18 to 24 Years | 6 (5.9%) | 27 (16.6%) |
| 25 to 34 Years | 5 (1.3%) | 45 (22.6%) |
| 35 to 44 Years | 8 (22.9%) | 11 (11.3%) |
| 45 to 54 Years | 0 (0.0%) | 30 (24.2%) |
| 55 to 64 Years | 23 (31.9%) | 7 (6.3%) |
| 65 to 74 Years | 18 (22.5%) | 13 (9.6%) |
| 75 Years and over | 0 (0.0%) | 0 (0.0%) |
| Total | 93 (8.3%) | 168 (14.3%) |
Income Above Poverty by Sex and Age in Lake City
According to the poverty statistics in Lake City, males aged 5 years and females aged 15 years are the age groups that are most secure financially, with 100.0% of males and 100.0% of females in these age groups living above the poverty line.
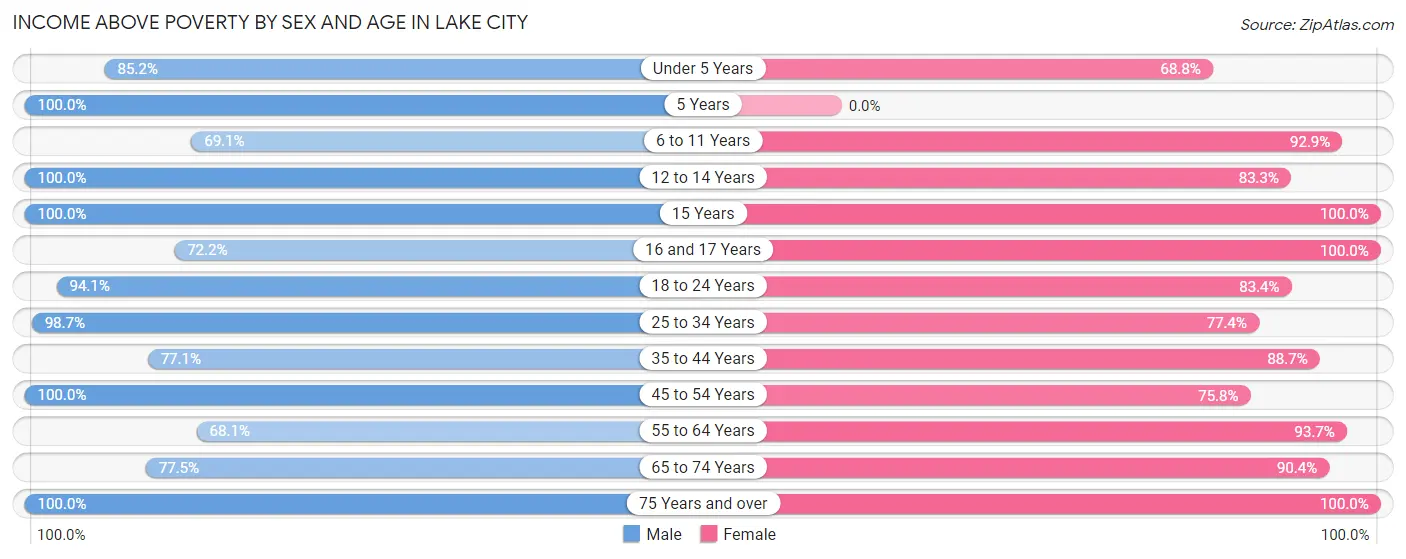
| Age Bracket | Male | Female |
| Under 5 Years | 86 (85.2%) | 53 (68.8%) |
| 5 Years | 17 (100.0%) | 0 (0.0%) |
| 6 to 11 Years | 29 (69.1%) | 65 (92.9%) |
| 12 to 14 Years | 21 (100.0%) | 30 (83.3%) |
| 15 Years | 32 (100.0%) | 8 (100.0%) |
| 16 and 17 Years | 13 (72.2%) | 41 (100.0%) |
| 18 to 24 Years | 95 (94.1%) | 136 (83.4%) |
| 25 to 34 Years | 372 (98.7%) | 154 (77.4%) |
| 35 to 44 Years | 27 (77.1%) | 86 (88.7%) |
| 45 to 54 Years | 143 (100.0%) | 94 (75.8%) |
| 55 to 64 Years | 49 (68.1%) | 104 (93.7%) |
| 65 to 74 Years | 62 (77.5%) | 123 (90.4%) |
| 75 Years and over | 77 (100.0%) | 116 (100.0%) |
| Total | 1,023 (91.7%) | 1,010 (85.7%) |
Income Below Poverty Among Married-Couple Families in Lake City
The poverty statistics for married-couple families in Lake City show that 1.4% or 7 of the total 498 families live below the poverty line. Families with 1 or 2 children have the highest poverty rate of 5.5%, comprising of 7 families. On the other hand, families with no children have the lowest poverty rate of 0.0%, which includes 0 families.
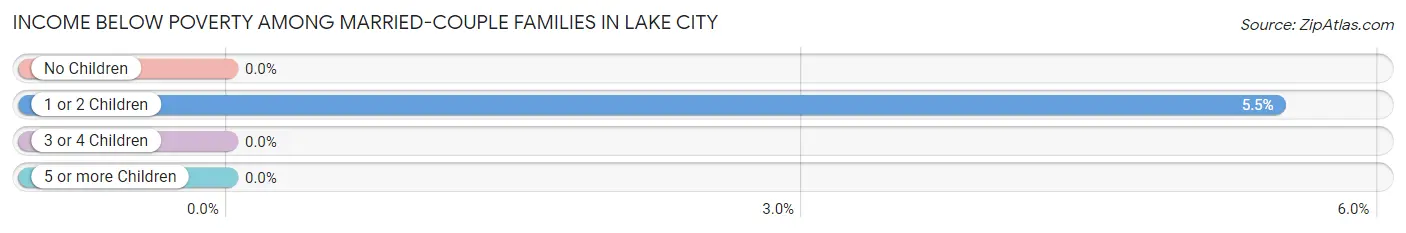
| Children | Above Poverty | Below Poverty |
| No Children | 331 (100.0%) | 0 (0.0%) |
| 1 or 2 Children | 121 (94.5%) | 7 (5.5%) |
| 3 or 4 Children | 39 (100.0%) | 0 (0.0%) |
| 5 or more Children | 0 (0.0%) | 0 (0.0%) |
| Total | 491 (98.6%) | 7 (1.4%) |
Income Below Poverty Among Single-Parent Households in Lake City
According to the poverty data in Lake City, 9.5% or 6 single-father households and 26.7% or 27 single-mother households are living below the poverty line. Among single-father households, those with no children have the highest poverty rate, with 6 households (28.6%) experiencing poverty. Likewise, among single-mother households, those with 3 or 4 children have the highest poverty rate, with 5 households (100.0%) falling below the poverty line.
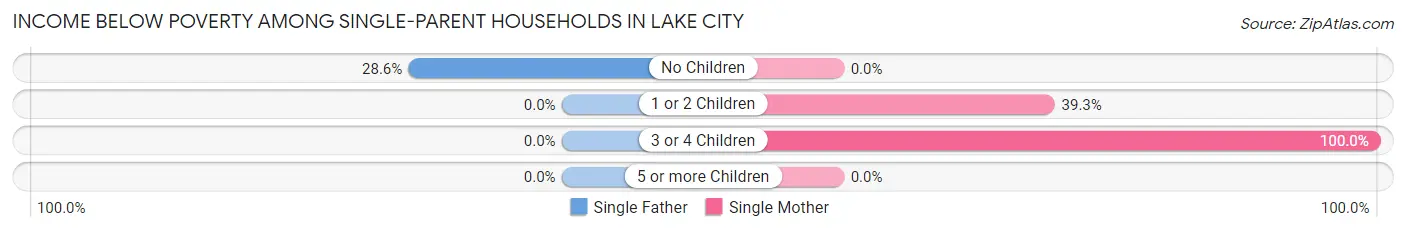
| Children | Single Father | Single Mother |
| No Children | 6 (28.6%) | 0 (0.0%) |
| 1 or 2 Children | 0 (0.0%) | 22 (39.3%) |
| 3 or 4 Children | 0 (0.0%) | 5 (100.0%) |
| 5 or more Children | 0 (0.0%) | 0 (0.0%) |
| Total | 6 (9.5%) | 27 (26.7%) |
Income Below Poverty Among Married-Couple vs Single-Parent Households in Lake City
The poverty data for Lake City shows that 7 of the married-couple family households (1.4%) and 33 of the single-parent households (20.1%) are living below the poverty level. Within the married-couple family households, those with 1 or 2 children have the highest poverty rate, with 7 households (5.5%) falling below the poverty line. Among the single-parent households, those with 3 or 4 children have the highest poverty rate, with 5 household (100.0%) living below poverty.
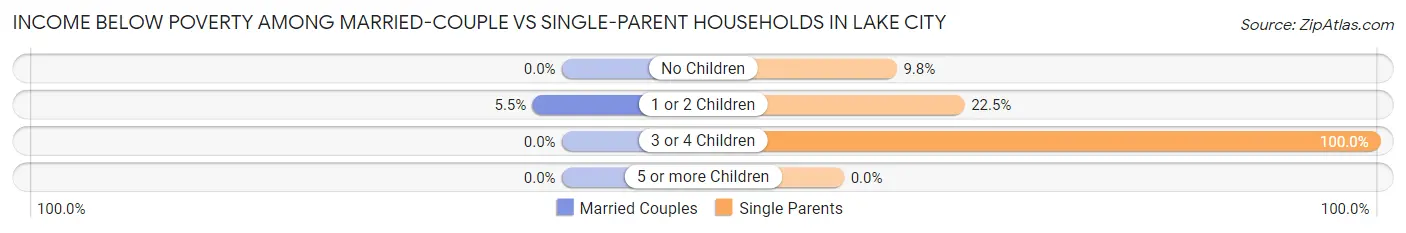
| Children | Married-Couple Families | Single-Parent Households |
| No Children | 0 (0.0%) | 6 (9.8%) |
| 1 or 2 Children | 7 (5.5%) | 22 (22.5%) |
| 3 or 4 Children | 0 (0.0%) | 5 (100.0%) |
| 5 or more Children | 0 (0.0%) | 0 (0.0%) |
| Total | 7 (1.4%) | 33 (20.1%) |
Race in Lake City
The most populous races in Lake City are White / Caucasian (2,209 | 92.5%), Two or more Races (123 | 5.1%), and Hispanic or Latino (37 | 1.5%).
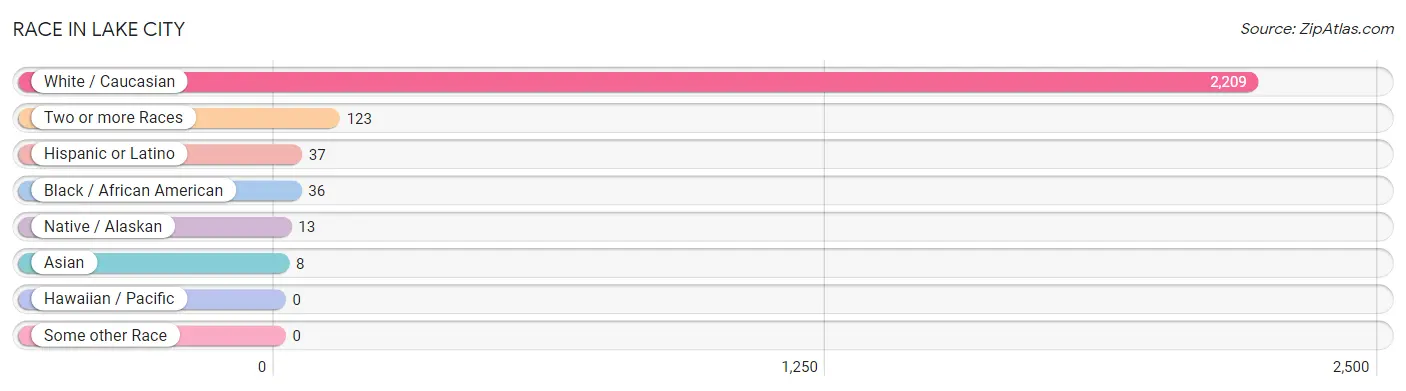
| Race | # Population | % Population |
| Asian | 8 | 0.3% |
| Black / African American | 36 | 1.5% |
| Hawaiian / Pacific | 0 | 0.0% |
| Hispanic or Latino | 37 | 1.5% |
| Native / Alaskan | 13 | 0.5% |
| White / Caucasian | 2,209 | 92.5% |
| Two or more Races | 123 | 5.1% |
| Some other Race | 0 | 0.0% |
| Total | 2,389 | 100.0% |
Ancestry in Lake City
The most populous ancestries reported in Lake City are American (425 | 17.8%), English (393 | 16.5%), Irish (272 | 11.4%), German (217 | 9.1%), and Scottish (45 | 1.9%), together accounting for 56.6% of all Lake City residents.
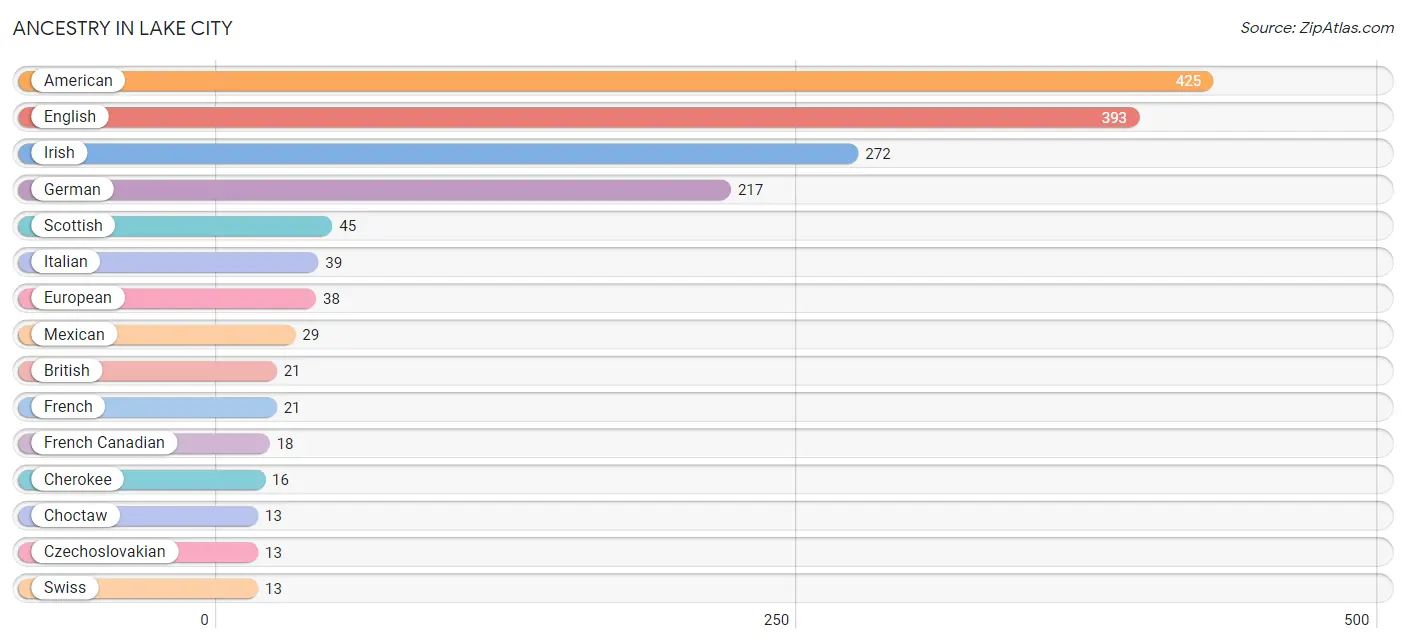
| Ancestry | # Population | % Population |
| American | 425 | 17.8% |
| Blackfeet | 6 | 0.3% |
| British | 21 | 0.9% |
| Cherokee | 16 | 0.7% |
| Choctaw | 13 | 0.5% |
| Czechoslovakian | 13 | 0.5% |
| Eastern European | 6 | 0.3% |
| English | 393 | 16.5% |
| European | 38 | 1.6% |
| French | 21 | 0.9% |
| French Canadian | 18 | 0.7% |
| German | 217 | 9.1% |
| Indian (Asian) | 8 | 0.3% |
| Irish | 272 | 11.4% |
| Italian | 39 | 1.6% |
| Mexican | 29 | 1.2% |
| Polish | 6 | 0.3% |
| Scotch-Irish | 6 | 0.3% |
| Scottish | 45 | 1.9% |
| Sri Lankan | 11 | 0.5% |
| Swiss | 13 | 0.5% | View All 21 Rows |
Immigrants in Lake City
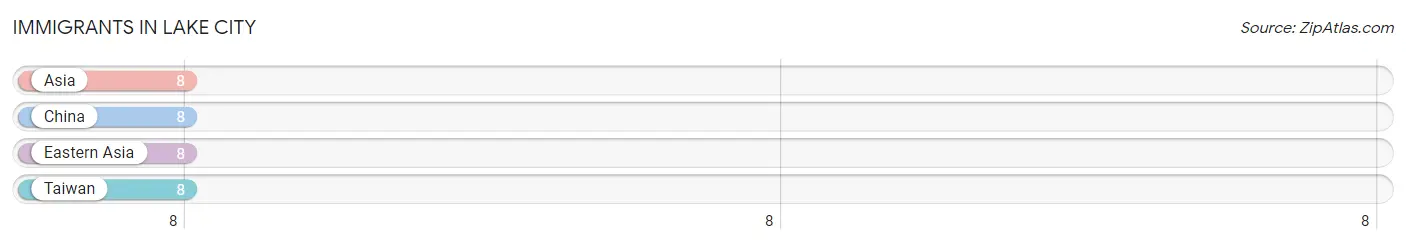
The most numerous immigrant groups reported in Lake City came from Asia (8 | 0.3%), China (8 | 0.3%), Eastern Asia (8 | 0.3%), and Taiwan (8 | 0.3%), together accounting for 1.3% of all Lake City residents.
| Immigration Origin | # Population | % Population |
| Asia | 8 | 0.3% |
| China | 8 | 0.3% |
| Eastern Asia | 8 | 0.3% |
| Taiwan | 8 | 0.3% | View All 4 Rows |
Sex and Age in Lake City
Sex and Age in Lake City
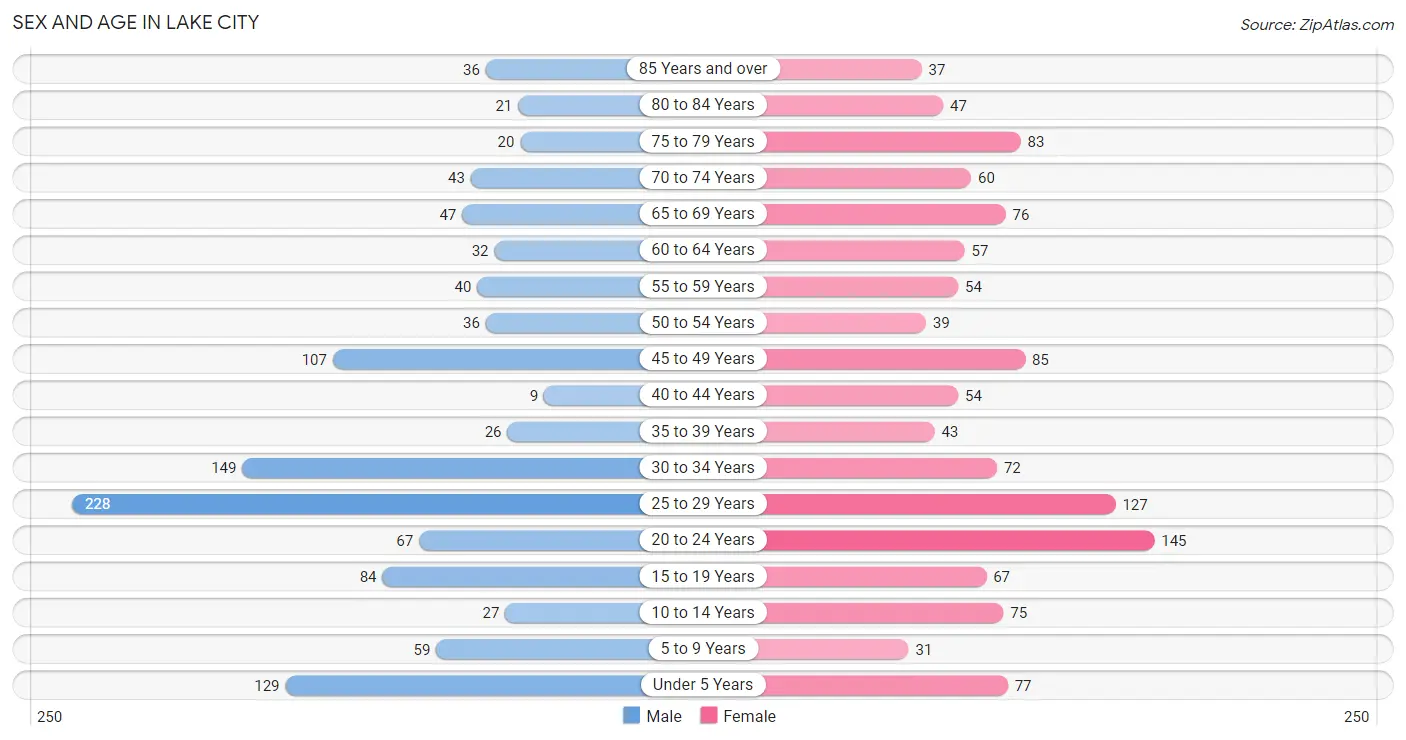
The most populous age groups in Lake City are 25 to 29 Years (228 | 19.7%) for men and 20 to 24 Years (145 | 11.8%) for women.
| Age Bracket | Male | Female |
| Under 5 Years | 129 (11.1%) | 77 (6.3%) |
| 5 to 9 Years | 59 (5.1%) | 31 (2.5%) |
| 10 to 14 Years | 27 (2.3%) | 75 (6.1%) |
| 15 to 19 Years | 84 (7.2%) | 67 (5.4%) |
| 20 to 24 Years | 67 (5.8%) | 145 (11.8%) |
| 25 to 29 Years | 228 (19.7%) | 127 (10.3%) |
| 30 to 34 Years | 149 (12.8%) | 72 (5.9%) |
| 35 to 39 Years | 26 (2.2%) | 43 (3.5%) |
| 40 to 44 Years | 9 (0.8%) | 54 (4.4%) |
| 45 to 49 Years | 107 (9.2%) | 85 (6.9%) |
| 50 to 54 Years | 36 (3.1%) | 39 (3.2%) |
| 55 to 59 Years | 40 (3.5%) | 54 (4.4%) |
| 60 to 64 Years | 32 (2.8%) | 57 (4.6%) |
| 65 to 69 Years | 47 (4.1%) | 76 (6.2%) |
| 70 to 74 Years | 43 (3.7%) | 60 (4.9%) |
| 75 to 79 Years | 20 (1.7%) | 83 (6.8%) |
| 80 to 84 Years | 21 (1.8%) | 47 (3.8%) |
| 85 Years and over | 36 (3.1%) | 37 (3.0%) |
| Total | 1,160 (100.0%) | 1,229 (100.0%) |
Families and Households in Lake City
Median Family Size in Lake City
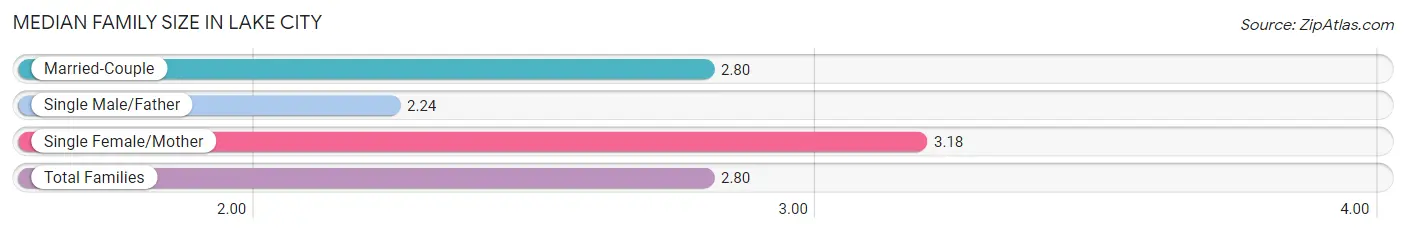
The median family size in Lake City is 2.80 persons per family, with single female/mother families (101 | 15.3%) accounting for the largest median family size of 3.18 persons per family. On the other hand, single male/father families (63 | 9.5%) represent the smallest median family size with 2.24 persons per family.
| Family Type | # Families | Family Size |
| Married-Couple | 498 (75.2%) | 2.80 |
| Single Male/Father | 63 (9.5%) | 2.24 |
| Single Female/Mother | 101 (15.3%) | 3.18 |
| Total Families | 662 (100.0%) | 2.80 |
Median Household Size in Lake City
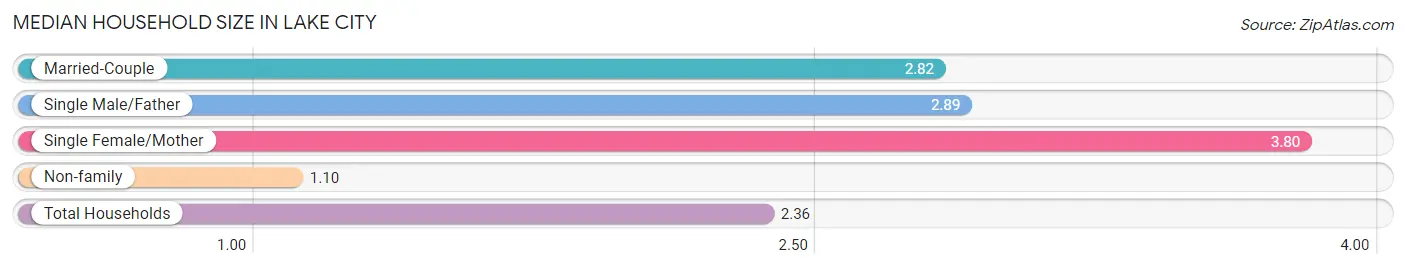
The median household size in Lake City is 2.36 persons per household, with single female/mother households (101 | 10.2%) accounting for the largest median household size of 3.8 persons per household. non-family households (324 | 32.9%) represent the smallest median household size with 1.10 persons per household.
| Household Type | # Households | Household Size |
| Married-Couple | 498 (50.5%) | 2.82 |
| Single Male/Father | 63 (6.4%) | 2.89 |
| Single Female/Mother | 101 (10.2%) | 3.80 |
| Non-family | 324 (32.9%) | 1.10 |
| Total Households | 986 (100.0%) | 2.36 |
Household Size by Marriage Status in Lake City
Out of a total of 986 households in Lake City, 662 (67.1%) are family households, while 324 (32.9%) are nonfamily households. The most numerous type of family households are 2-person households, comprising 341, and the most common type of nonfamily households are 1-person households, comprising 307.
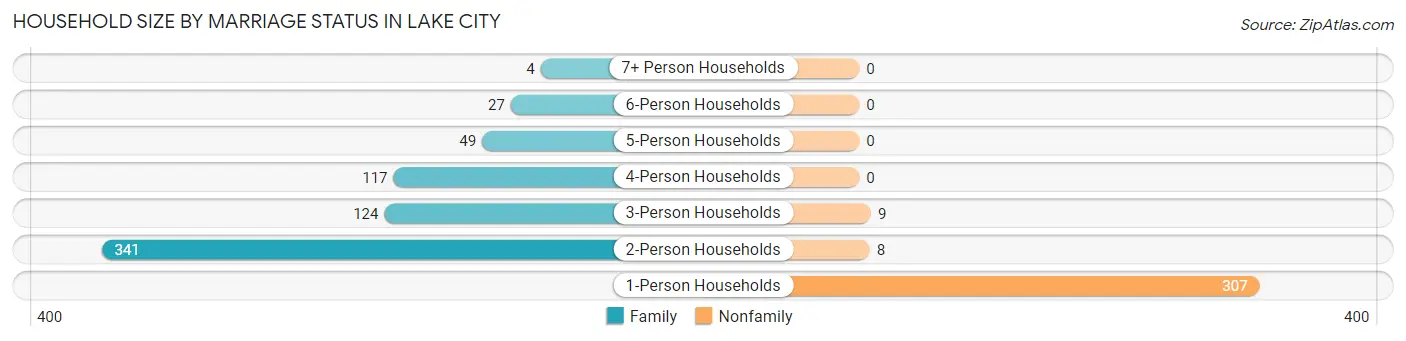
| Household Size | Family Households | Nonfamily Households |
| 1-Person Households | - | 307 (31.1%) |
| 2-Person Households | 341 (34.6%) | 8 (0.8%) |
| 3-Person Households | 124 (12.6%) | 9 (0.9%) |
| 4-Person Households | 117 (11.9%) | 0 (0.0%) |
| 5-Person Households | 49 (5.0%) | 0 (0.0%) |
| 6-Person Households | 27 (2.7%) | 0 (0.0%) |
| 7+ Person Households | 4 (0.4%) | 0 (0.0%) |
| Total | 662 (67.1%) | 324 (32.9%) |
Female Fertility in Lake City
Fertility by Age in Lake City
Average fertility rate in Lake City is 116.0 births per 1,000 women. Women in the age bracket of 20 to 34 years have the highest fertility rate with 137.0 births per 1,000 women. Women in the age bracket of 20 to 34 years acount for 68.1% of all women with births.

| Age Bracket | Women with Births | Births / 1,000 Women |
| 15 to 19 years | 0 (0.0%) | 0.0 |
| 20 to 34 years | 47 (68.1%) | 137.0 |
| 35 to 50 years | 22 (31.9%) | 121.0 |
| Total | 69 (100.0%) | 116.0 |
Fertility by Age by Marriage Status in Lake City
65.2% of women with births (69) in Lake City are married. The highest percentage of unmarried women with births falls into 20 to 34 years age bracket with 51.1% of them unmarried at the time of birth, while the lowest percentage of unmarried women with births belong to 35 to 50 years age bracket with 0.0% of them unmarried.
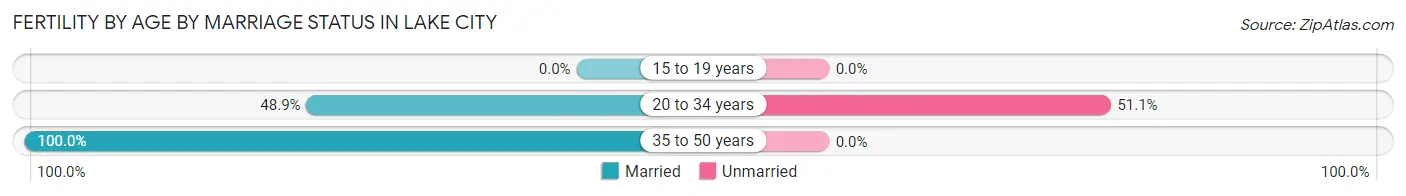
| Age Bracket | Married | Unmarried |
| 15 to 19 years | 0 (0.0%) | 0 (0.0%) |
| 20 to 34 years | 23 (48.9%) | 24 (51.1%) |
| 35 to 50 years | 22 (100.0%) | 0 (0.0%) |
| Total | 45 (65.2%) | 24 (34.8%) |
Fertility by Education in Lake City
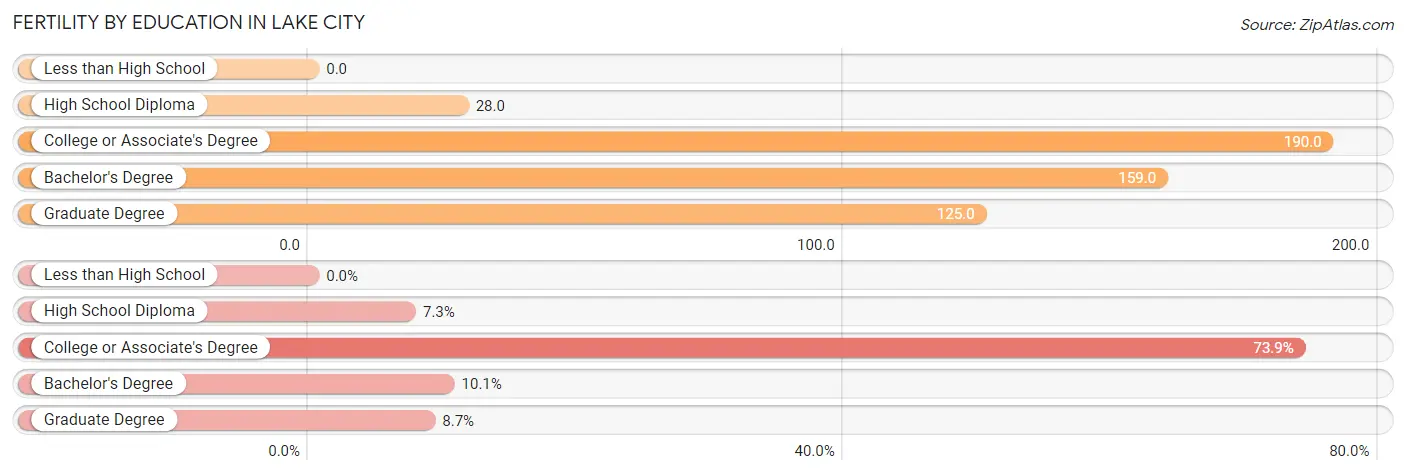
| Educational Attainment | Women with Births | Births / 1,000 Women |
| Less than High School | 0 (0.0%) | 0.0 |
| High School Diploma | 5 (7.2%) | 28.0 |
| College or Associate's Degree | 51 (73.9%) | 190.0 |
| Bachelor's Degree | 7 (10.1%) | 159.0 |
| Graduate Degree | 6 (8.7%) | 125.0 |
| Total | 69 (100.0%) | 116.0 |
Fertility by Education by Marriage Status in Lake City
34.8% of women with births in Lake City are unmarried. Women with the educational attainment of high school diploma are most likely to be married with 100.0% of them married at childbirth, while women with the educational attainment of college or associate's degree are least likely to be married with 47.1% of them unmarried at childbirth.
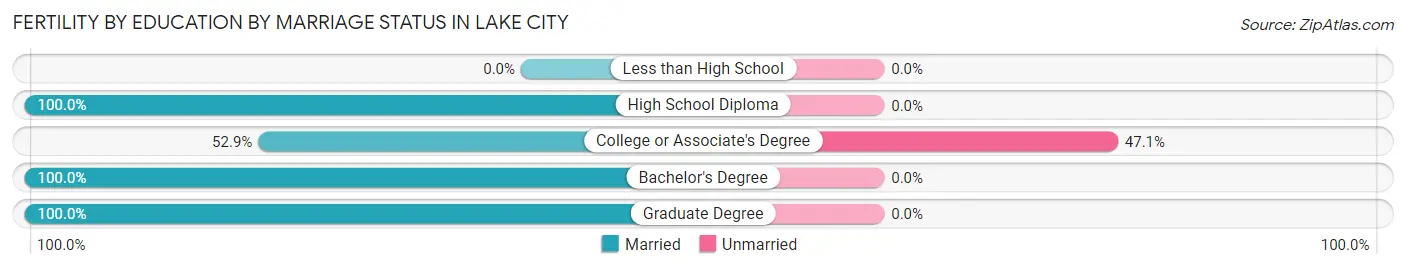
| Educational Attainment | Married | Unmarried |
| Less than High School | 0 (0.0%) | 0 (0.0%) |
| High School Diploma | 5 (100.0%) | 0 (0.0%) |
| College or Associate's Degree | 27 (52.9%) | 24 (47.1%) |
| Bachelor's Degree | 7 (100.0%) | 0 (0.0%) |
| Graduate Degree | 6 (100.0%) | 0 (0.0%) |
| Total | 45 (65.2%) | 24 (34.8%) |
Employment Characteristics in Lake City
Employment by Class of Employer in Lake City
Among the 1,144 employed individuals in Lake City, private company employees (866 | 75.7%), not-for-profit organizations (96 | 8.4%), and local government employees (76 | 6.6%) make up the most common classes of employment.
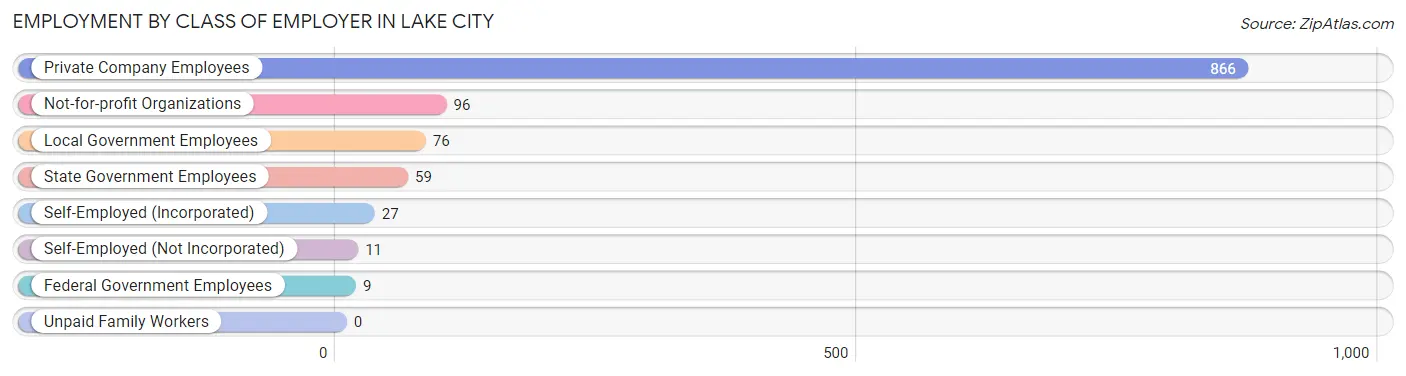
| Employer Class | # Employees | % Employees |
| Private Company Employees | 866 | 75.7% |
| Self-Employed (Incorporated) | 27 | 2.4% |
| Self-Employed (Not Incorporated) | 11 | 1.0% |
| Not-for-profit Organizations | 96 | 8.4% |
| Local Government Employees | 76 | 6.6% |
| State Government Employees | 59 | 5.2% |
| Federal Government Employees | 9 | 0.8% |
| Unpaid Family Workers | 0 | 0.0% |
| Total | 1,144 | 100.0% |
Employment Status by Age in Lake City
According to the labor force statistics for Lake City, out of the total population over 16 years of age (1,951), 66.0% or 1,288 individuals are in the labor force, with 8.3% or 107 of them unemployed. The age group with the highest labor force participation rate is 30 to 34 years, with 92.3% or 204 individuals in the labor force. Within the labor force, the 16 to 19 years age range has the highest percentage of unemployed individuals, with 46.6% or 27 of them being unemployed.
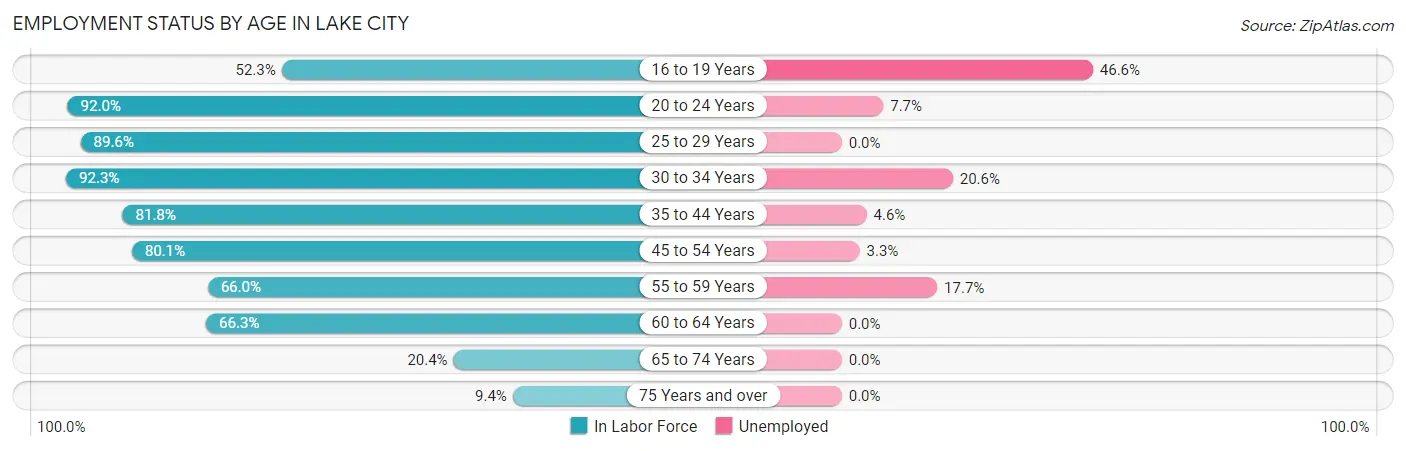
| Age Bracket | In Labor Force | Unemployed |
| 16 to 19 Years | 58 (52.3%) | 27 (46.6%) |
| 20 to 24 Years | 195 (92.0%) | 15 (7.7%) |
| 25 to 29 Years | 318 (89.6%) | 0 (0.0%) |
| 30 to 34 Years | 204 (92.3%) | 42 (20.6%) |
| 35 to 44 Years | 108 (81.8%) | 5 (4.6%) |
| 45 to 54 Years | 214 (80.1%) | 7 (3.3%) |
| 55 to 59 Years | 62 (66.0%) | 11 (17.7%) |
| 60 to 64 Years | 59 (66.3%) | 0 (0.0%) |
| 65 to 74 Years | 46 (20.4%) | 0 (0.0%) |
| 75 Years and over | 23 (9.4%) | 0 (0.0%) |
| Total | 1,288 (66.0%) | 107 (8.3%) |
Employment Status by Educational Attainment in Lake City
According to labor force statistics for Lake City, 83.3% of individuals (965) out of the total population between 25 and 64 years of age (1,158) are in the labor force, with 6.7% or 65 of them being unemployed. The group with the highest labor force participation rate are those with the educational attainment of bachelor's degree or higher, with 95.2% or 237 individuals in the labor force. Within the labor force, individuals with college / associate degree education have the highest percentage of unemployment, with 9.7% or 26 of them being unemployed.
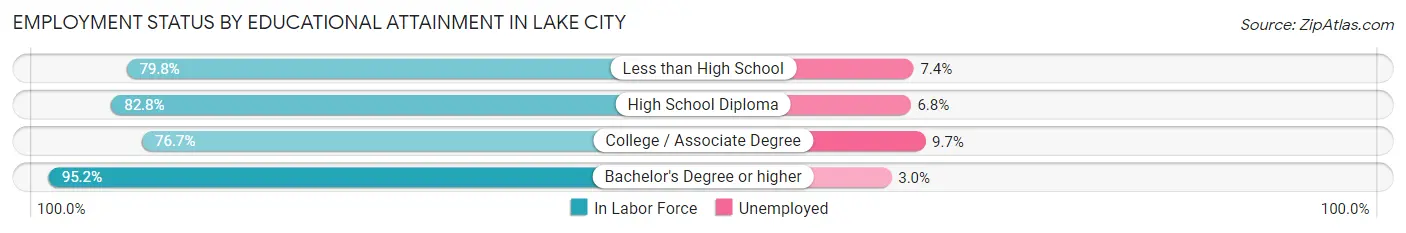
| Educational Attainment | In Labor Force | Unemployed |
| Less than High School | 95 (79.8%) | 9 (7.4%) |
| High School Diploma | 366 (82.8%) | 30 (6.8%) |
| College / Associate Degree | 267 (76.7%) | 34 (9.7%) |
| Bachelor's Degree or higher | 237 (95.2%) | 7 (3.0%) |
| Total | 965 (83.3%) | 78 (6.7%) |
Employment Occupations by Sex in Lake City
Management, Business, Science and Arts Occupations
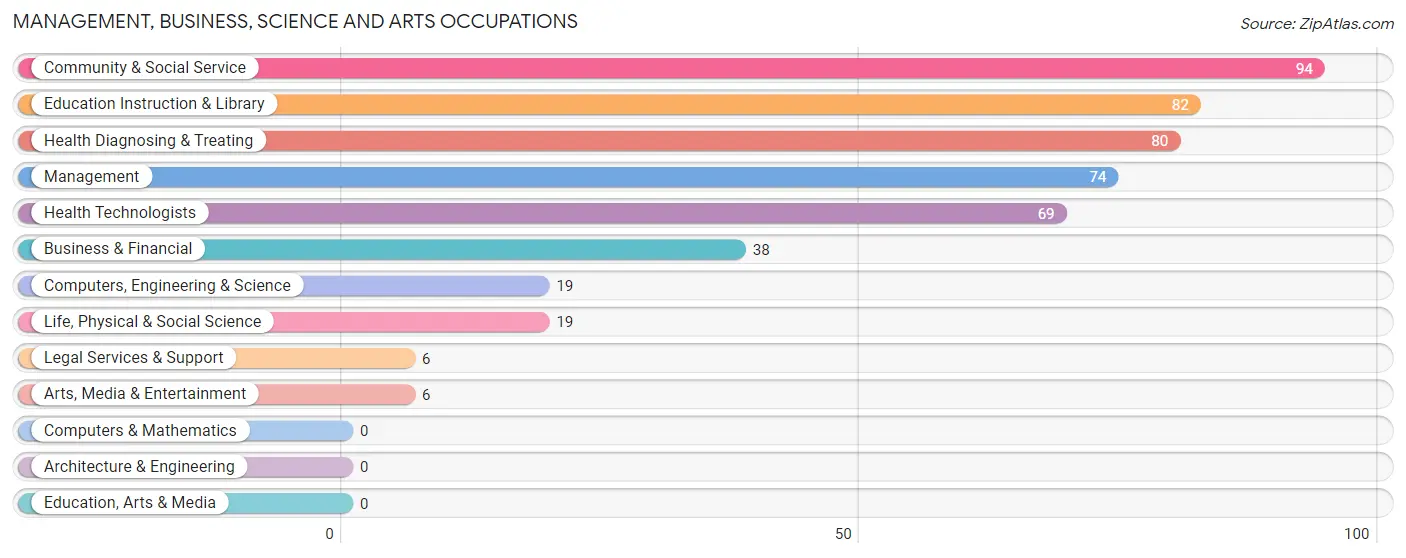
The most common Management, Business, Science and Arts occupations in Lake City are Community & Social Service (94 | 8.0%), Education Instruction & Library (82 | 7.0%), Health Diagnosing & Treating (80 | 6.8%), Management (74 | 6.3%), and Health Technologists (69 | 5.9%).
Management, Business, Science and Arts Occupations by Sex
Within the Management, Business, Science and Arts occupations in Lake City, the most male-oriented occupations are Computers, Engineering & Science (100.0%), Life, Physical & Social Science (100.0%), and Legal Services & Support (100.0%), while the most female-oriented occupations are Arts, Media & Entertainment (100.0%), Health Technologists (89.9%), and Health Diagnosing & Treating (83.8%).
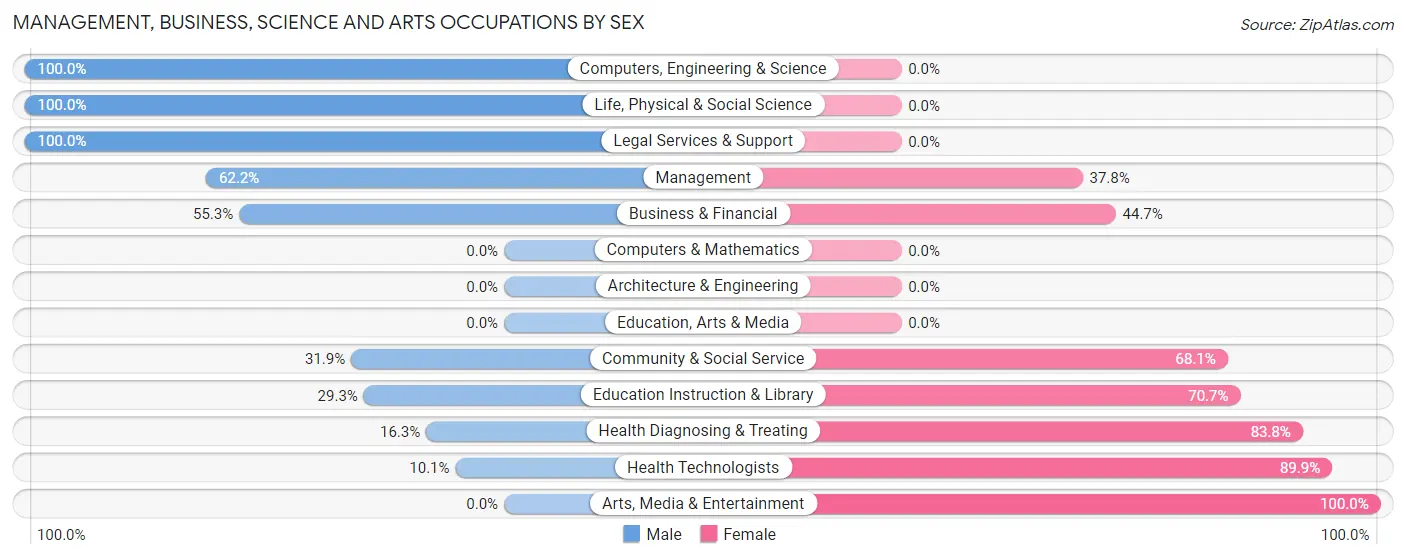
| Occupation | Male | Female |
| Management | 46 (62.2%) | 28 (37.8%) |
| Business & Financial | 21 (55.3%) | 17 (44.7%) |
| Computers, Engineering & Science | 19 (100.0%) | 0 (0.0%) |
| Computers & Mathematics | 0 (0.0%) | 0 (0.0%) |
| Architecture & Engineering | 0 (0.0%) | 0 (0.0%) |
| Life, Physical & Social Science | 19 (100.0%) | 0 (0.0%) |
| Community & Social Service | 30 (31.9%) | 64 (68.1%) |
| Education, Arts & Media | 0 (0.0%) | 0 (0.0%) |
| Legal Services & Support | 6 (100.0%) | 0 (0.0%) |
| Education Instruction & Library | 24 (29.3%) | 58 (70.7%) |
| Arts, Media & Entertainment | 0 (0.0%) | 6 (100.0%) |
| Health Diagnosing & Treating | 13 (16.3%) | 67 (83.8%) |
| Health Technologists | 7 (10.1%) | 62 (89.9%) |
| Total (Category) | 129 (42.3%) | 176 (57.7%) |
| Total (Overall) | 658 (55.8%) | 522 (44.2%) |
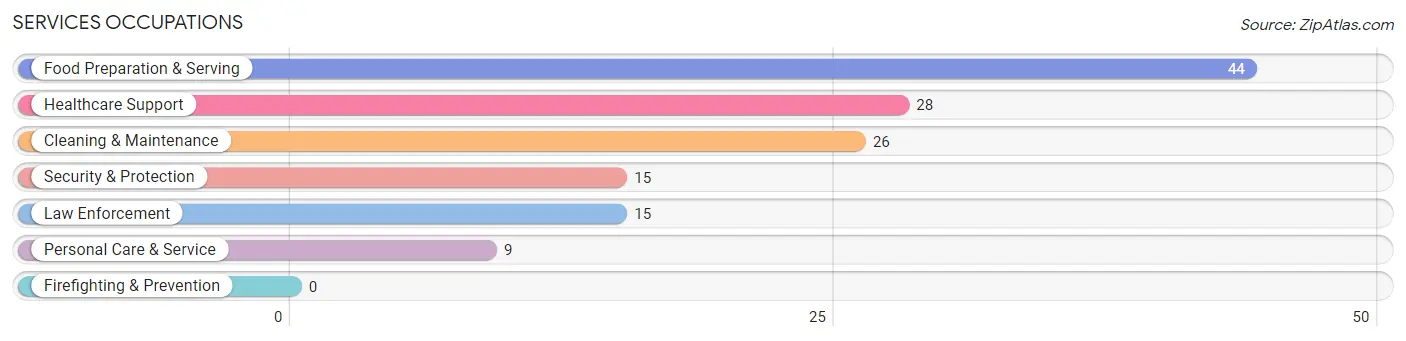
Services Occupations
The most common Services occupations in Lake City are Food Preparation & Serving (44 | 3.7%), Healthcare Support (28 | 2.4%), Cleaning & Maintenance (26 | 2.2%), Security & Protection (15 | 1.3%), and Law Enforcement (15 | 1.3%).
Services Occupations by Sex
Within the Services occupations in Lake City, the most male-oriented occupations are Security & Protection (100.0%), Law Enforcement (100.0%), and Healthcare Support (32.1%), while the most female-oriented occupations are Personal Care & Service (100.0%), Food Preparation & Serving (81.8%), and Cleaning & Maintenance (76.9%).
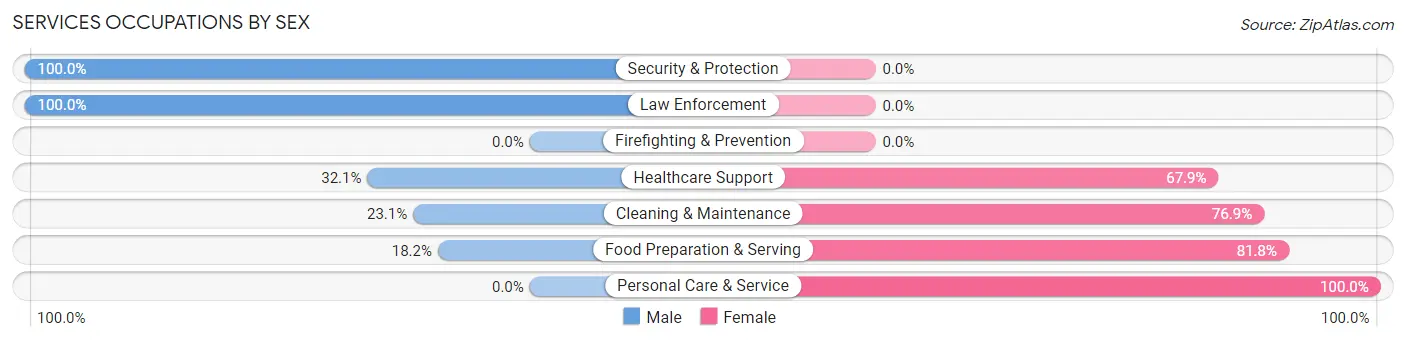
| Occupation | Male | Female |
| Healthcare Support | 9 (32.1%) | 19 (67.9%) |
| Security & Protection | 15 (100.0%) | 0 (0.0%) |
| Firefighting & Prevention | 0 (0.0%) | 0 (0.0%) |
| Law Enforcement | 15 (100.0%) | 0 (0.0%) |
| Food Preparation & Serving | 8 (18.2%) | 36 (81.8%) |
| Cleaning & Maintenance | 6 (23.1%) | 20 (76.9%) |
| Personal Care & Service | 0 (0.0%) | 9 (100.0%) |
| Total (Category) | 38 (31.1%) | 84 (68.9%) |
| Total (Overall) | 658 (55.8%) | 522 (44.2%) |
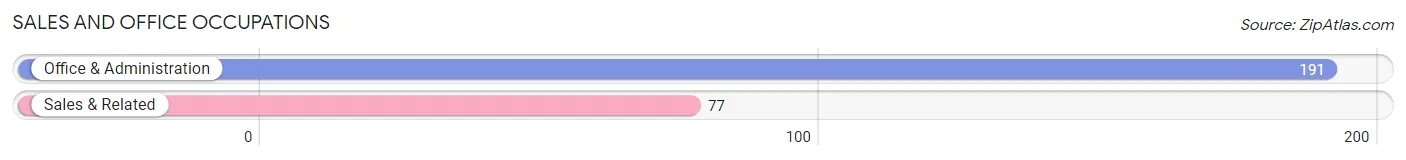
Sales and Office Occupations
The most common Sales and Office occupations in Lake City are Office & Administration (191 | 16.2%), and Sales & Related (77 | 6.5%).
Sales and Office Occupations by Sex
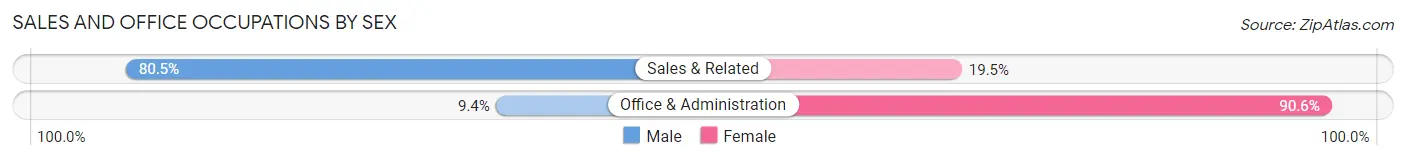
| Occupation | Male | Female |
| Sales & Related | 62 (80.5%) | 15 (19.5%) |
| Office & Administration | 18 (9.4%) | 173 (90.6%) |
| Total (Category) | 80 (29.8%) | 188 (70.2%) |
| Total (Overall) | 658 (55.8%) | 522 (44.2%) |
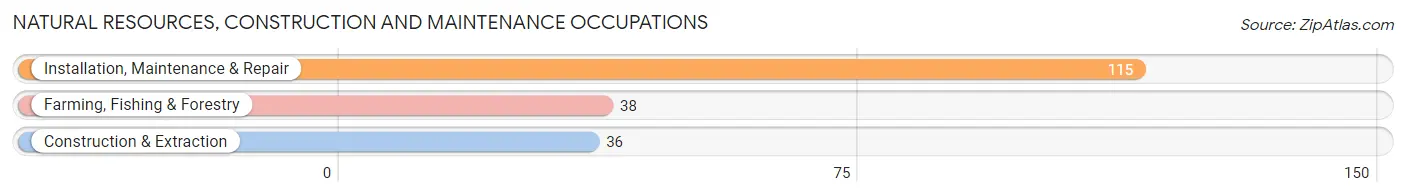
Natural Resources, Construction and Maintenance Occupations
The most common Natural Resources, Construction and Maintenance occupations in Lake City are Installation, Maintenance & Repair (115 | 9.8%), Farming, Fishing & Forestry (38 | 3.2%), and Construction & Extraction (36 | 3.0%).
Natural Resources, Construction and Maintenance Occupations by Sex
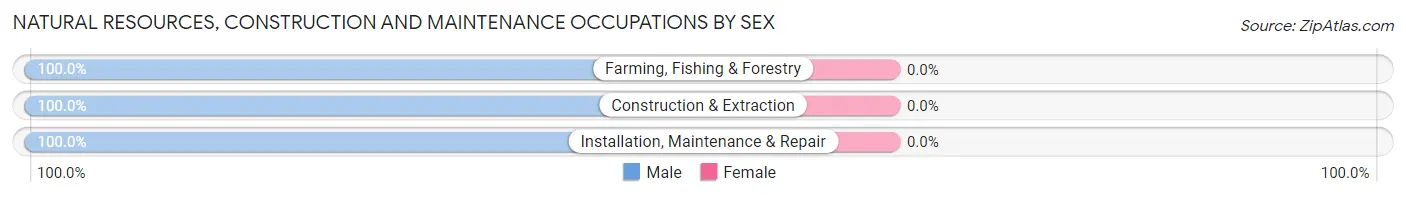
| Occupation | Male | Female |
| Farming, Fishing & Forestry | 38 (100.0%) | 0 (0.0%) |
| Construction & Extraction | 36 (100.0%) | 0 (0.0%) |
| Installation, Maintenance & Repair | 115 (100.0%) | 0 (0.0%) |
| Total (Category) | 189 (100.0%) | 0 (0.0%) |
| Total (Overall) | 658 (55.8%) | 522 (44.2%) |
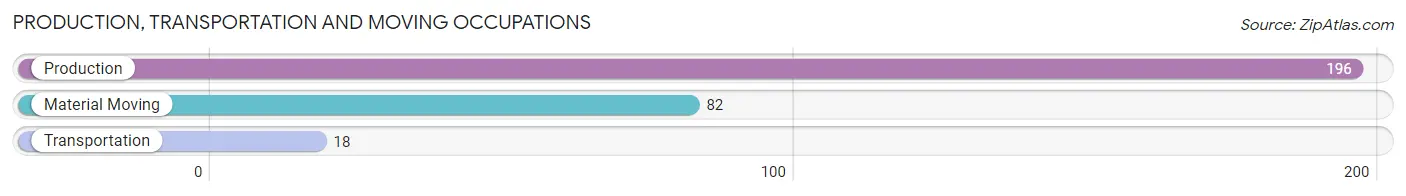
Production, Transportation and Moving Occupations
The most common Production, Transportation and Moving occupations in Lake City are Production (196 | 16.6%), Material Moving (82 | 7.0%), and Transportation (18 | 1.5%).
Production, Transportation and Moving Occupations by Sex
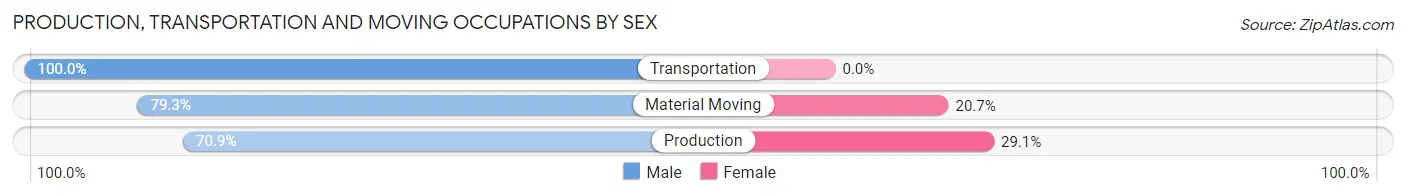
| Occupation | Male | Female |
| Production | 139 (70.9%) | 57 (29.1%) |
| Transportation | 18 (100.0%) | 0 (0.0%) |
| Material Moving | 65 (79.3%) | 17 (20.7%) |
| Total (Category) | 222 (75.0%) | 74 (25.0%) |
| Total (Overall) | 658 (55.8%) | 522 (44.2%) |
Employment Industries by Sex in Lake City
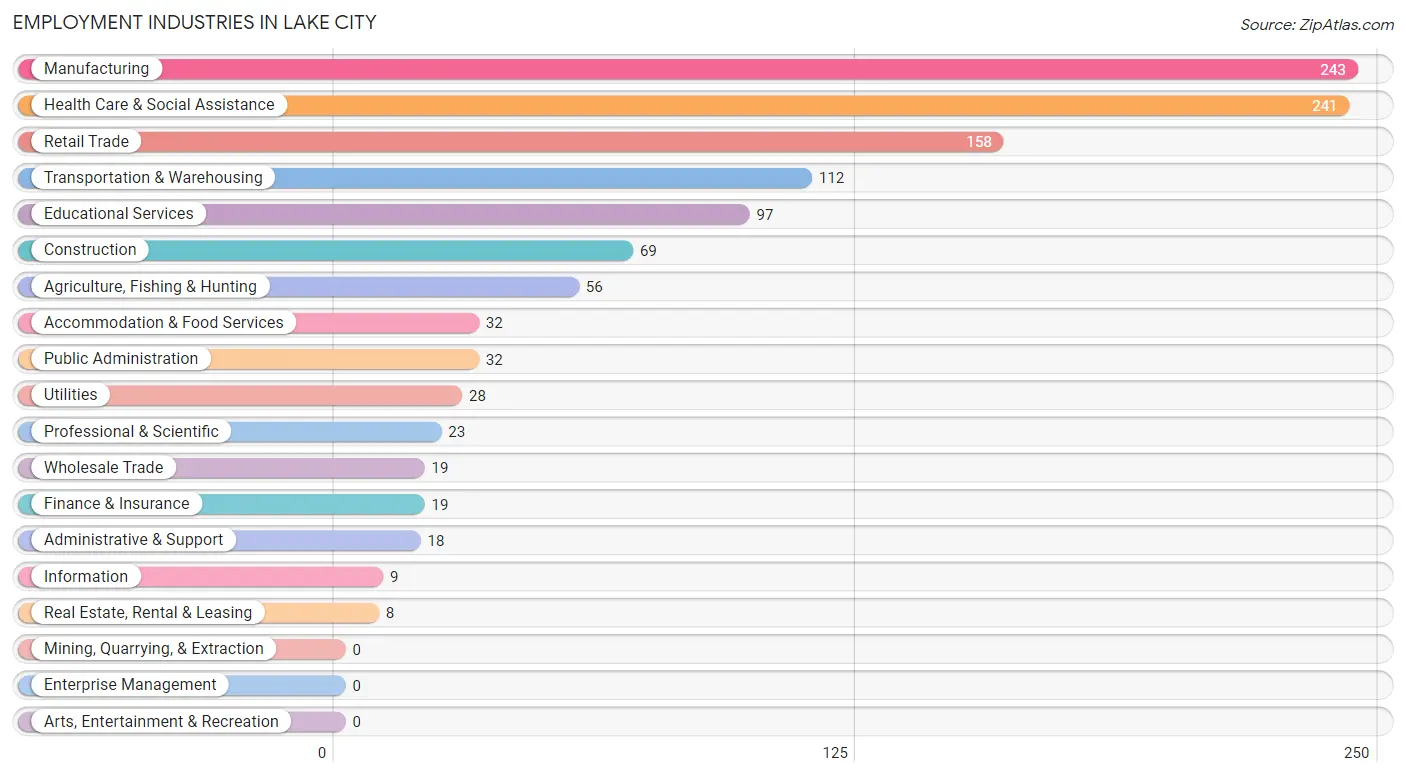
Employment Industries in Lake City
The major employment industries in Lake City include Manufacturing (243 | 20.6%), Health Care & Social Assistance (241 | 20.4%), Retail Trade (158 | 13.4%), Transportation & Warehousing (112 | 9.5%), and Educational Services (97 | 8.2%).
Employment Industries by Sex in Lake City
The Lake City industries that see more men than women are Agriculture, Fishing & Hunting (100.0%), Wholesale Trade (100.0%), and Utilities (100.0%), whereas the industries that tend to have a higher number of women are Real Estate, Rental & Leasing (100.0%), Administrative & Support (100.0%), and Health Care & Social Assistance (90.9%).
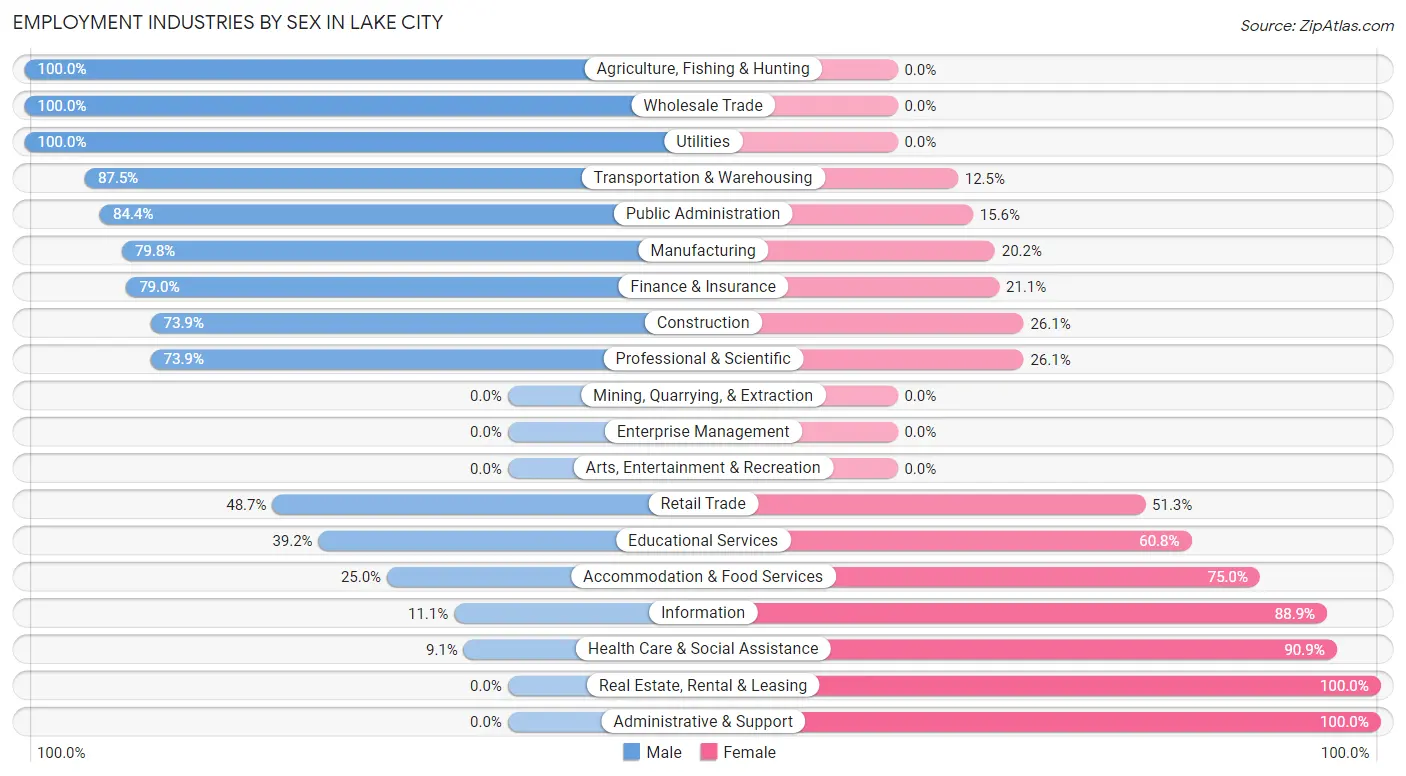
| Industry | Male | Female |
| Agriculture, Fishing & Hunting | 56 (100.0%) | 0 (0.0%) |
| Mining, Quarrying, & Extraction | 0 (0.0%) | 0 (0.0%) |
| Construction | 51 (73.9%) | 18 (26.1%) |
| Manufacturing | 194 (79.8%) | 49 (20.2%) |
| Wholesale Trade | 19 (100.0%) | 0 (0.0%) |
| Retail Trade | 77 (48.7%) | 81 (51.3%) |
| Transportation & Warehousing | 98 (87.5%) | 14 (12.5%) |
| Utilities | 28 (100.0%) | 0 (0.0%) |
| Information | 1 (11.1%) | 8 (88.9%) |
| Finance & Insurance | 15 (78.9%) | 4 (21.0%) |
| Real Estate, Rental & Leasing | 0 (0.0%) | 8 (100.0%) |
| Professional & Scientific | 17 (73.9%) | 6 (26.1%) |
| Enterprise Management | 0 (0.0%) | 0 (0.0%) |
| Administrative & Support | 0 (0.0%) | 18 (100.0%) |
| Educational Services | 38 (39.2%) | 59 (60.8%) |
| Health Care & Social Assistance | 22 (9.1%) | 219 (90.9%) |
| Arts, Entertainment & Recreation | 0 (0.0%) | 0 (0.0%) |
| Accommodation & Food Services | 8 (25.0%) | 24 (75.0%) |
| Public Administration | 27 (84.4%) | 5 (15.6%) |
| Total | 658 (55.8%) | 522 (44.2%) |
Education in Lake City
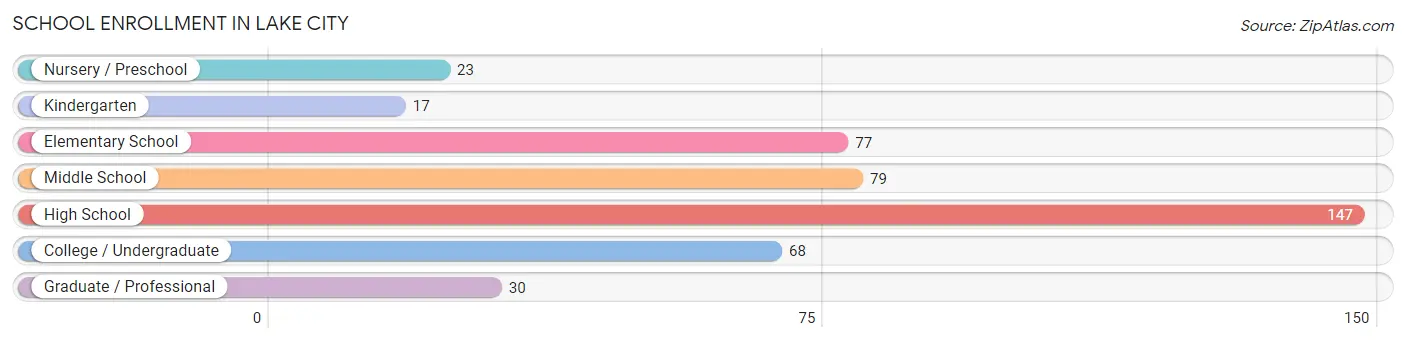
School Enrollment in Lake City
The most common levels of schooling among the 441 students in Lake City are high school (147 | 33.3%), middle school (79 | 17.9%), and elementary school (77 | 17.5%).
| School Level | # Students | % Students |
| Nursery / Preschool | 23 | 5.2% |
| Kindergarten | 17 | 3.8% |
| Elementary School | 77 | 17.5% |
| Middle School | 79 | 17.9% |
| High School | 147 | 33.3% |
| College / Undergraduate | 68 | 15.4% |
| Graduate / Professional | 30 | 6.8% |
| Total | 441 | 100.0% |
School Enrollment by Age by Funding Source in Lake City
Out of a total of 441 students who are enrolled in schools in Lake City, 29 (6.6%) attend a private institution, while the remaining 412 (93.4%) are enrolled in public schools. The age group of 35 years and over has the highest likelihood of being enrolled in private schools, with 13 (43.3% in the age bracket) enrolled. Conversely, the age group of 3 to 4 year olds has the lowest likelihood of being enrolled in a private school, with 23 (100.0% in the age bracket) attending a public institution.
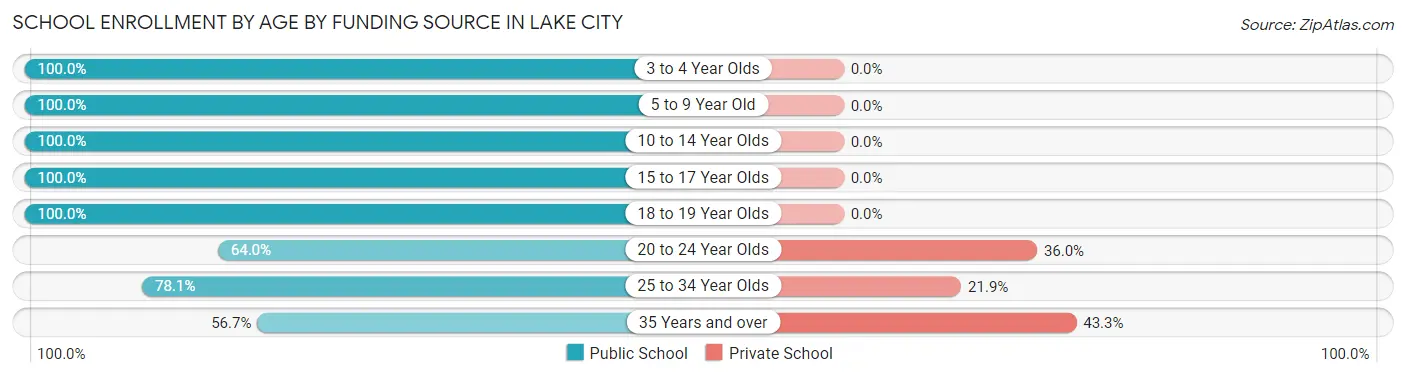
| Age Bracket | Public School | Private School |
| 3 to 4 Year Olds | 23 (100.0%) | 0 (0.0%) |
| 5 to 9 Year Old | 90 (100.0%) | 0 (0.0%) |
| 10 to 14 Year Olds | 102 (100.0%) | 0 (0.0%) |
| 15 to 17 Year Olds | 99 (100.0%) | 0 (0.0%) |
| 18 to 19 Year Olds | 40 (100.0%) | 0 (0.0%) |
| 20 to 24 Year Olds | 16 (64.0%) | 9 (36.0%) |
| 25 to 34 Year Olds | 25 (78.1%) | 7 (21.9%) |
| 35 Years and over | 17 (56.7%) | 13 (43.3%) |
| Total | 412 (93.4%) | 29 (6.6%) |
Educational Attainment by Field of Study in Lake City
Bio, nature & agricultural (59 | 20.1%), arts & humanities (55 | 18.8%), education (51 | 17.4%), science & technology (35 | 11.9%), and physical & health sciences (19 | 6.5%) are the most common fields of study among 293 individuals in Lake City who have obtained a bachelor's degree or higher.
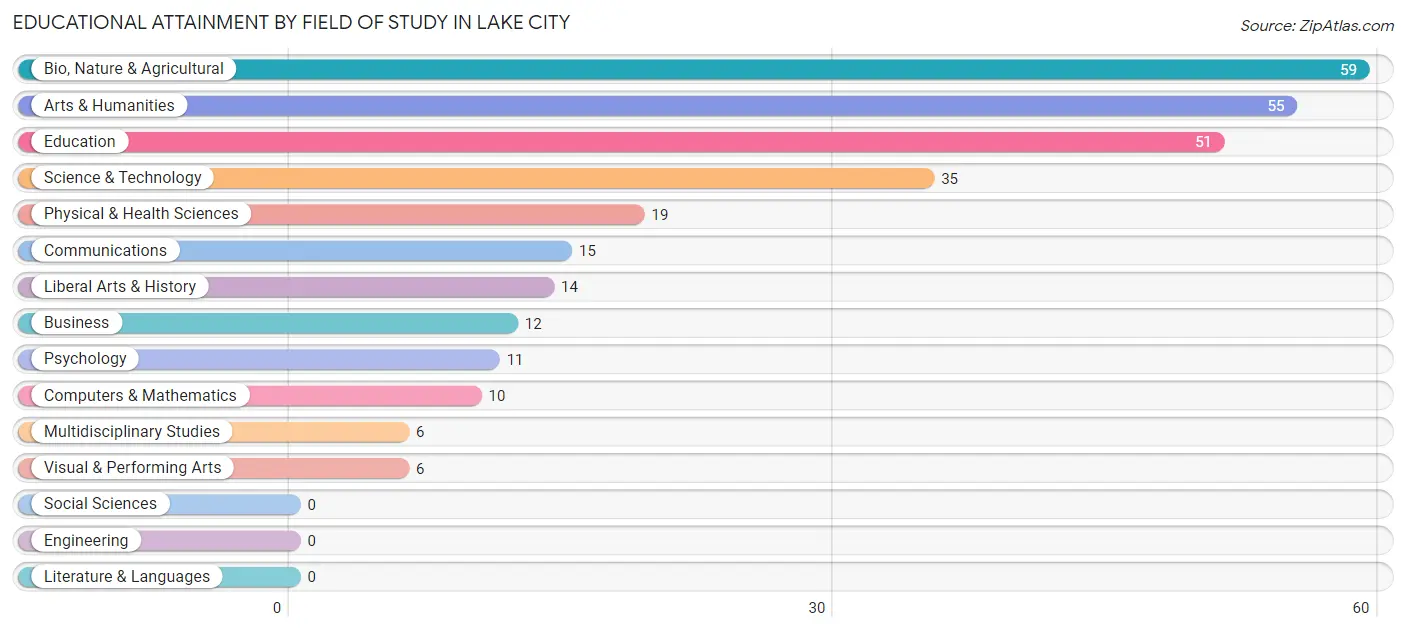
| Field of Study | # Graduates | % Graduates |
| Computers & Mathematics | 10 | 3.4% |
| Bio, Nature & Agricultural | 59 | 20.1% |
| Physical & Health Sciences | 19 | 6.5% |
| Psychology | 11 | 3.7% |
| Social Sciences | 0 | 0.0% |
| Engineering | 0 | 0.0% |
| Multidisciplinary Studies | 6 | 2.1% |
| Science & Technology | 35 | 11.9% |
| Business | 12 | 4.1% |
| Education | 51 | 17.4% |
| Literature & Languages | 0 | 0.0% |
| Liberal Arts & History | 14 | 4.8% |
| Visual & Performing Arts | 6 | 2.1% |
| Communications | 15 | 5.1% |
| Arts & Humanities | 55 | 18.8% |
| Total | 293 | 100.0% |
Transportation & Commute in Lake City
Vehicle Availability by Sex in Lake City
The most prevalent vehicle ownership categories in Lake City are males with 2 vehicles (323, accounting for 50.7%) and females with 2 vehicles (197, making up 63.7%).
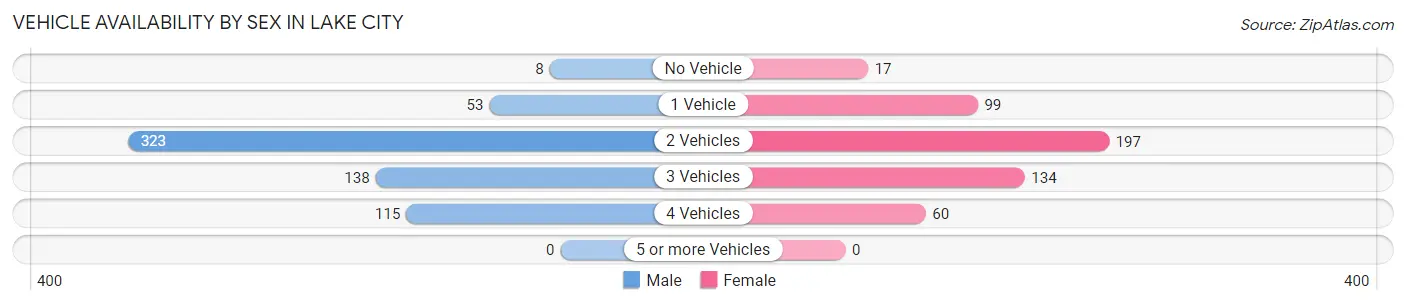
| Vehicles Available | Male | Female |
| No Vehicle | 8 (1.3%) | 17 (3.4%) |
| 1 Vehicle | 53 (8.3%) | 99 (19.5%) |
| 2 Vehicles | 323 (50.7%) | 197 (38.9%) |
| 3 Vehicles | 138 (21.7%) | 134 (26.4%) |
| 4 Vehicles | 115 (18.0%) | 60 (11.8%) |
| 5 or more Vehicles | 0 (0.0%) | 0 (0.0%) |
| Total | 637 (100.0%) | 507 (100.0%) |
Commute Time in Lake City
The most frequently occuring commute durations in Lake City are 20 to 24 minutes (269 commuters, 24.0%), 5 to 9 minutes (232 commuters, 20.7%), and 25 to 29 minutes (132 commuters, 11.8%).
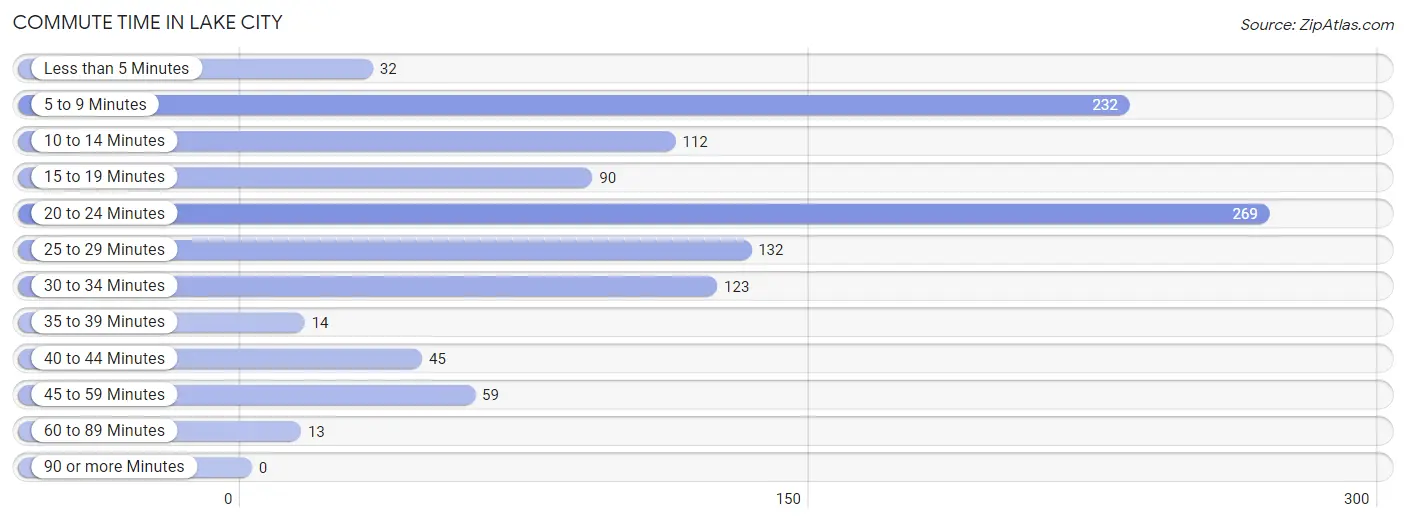
| Commute Time | # Commuters | % Commuters |
| Less than 5 Minutes | 32 | 2.9% |
| 5 to 9 Minutes | 232 | 20.7% |
| 10 to 14 Minutes | 112 | 10.0% |
| 15 to 19 Minutes | 90 | 8.0% |
| 20 to 24 Minutes | 269 | 24.0% |
| 25 to 29 Minutes | 132 | 11.8% |
| 30 to 34 Minutes | 123 | 11.0% |
| 35 to 39 Minutes | 14 | 1.3% |
| 40 to 44 Minutes | 45 | 4.0% |
| 45 to 59 Minutes | 59 | 5.3% |
| 60 to 89 Minutes | 13 | 1.2% |
| 90 or more Minutes | 0 | 0.0% |
Commute Time by Sex in Lake City
The most common commute times in Lake City are 5 to 9 minutes (179 commuters, 28.8%) for males and 20 to 24 minutes (126 commuters, 25.3%) for females.
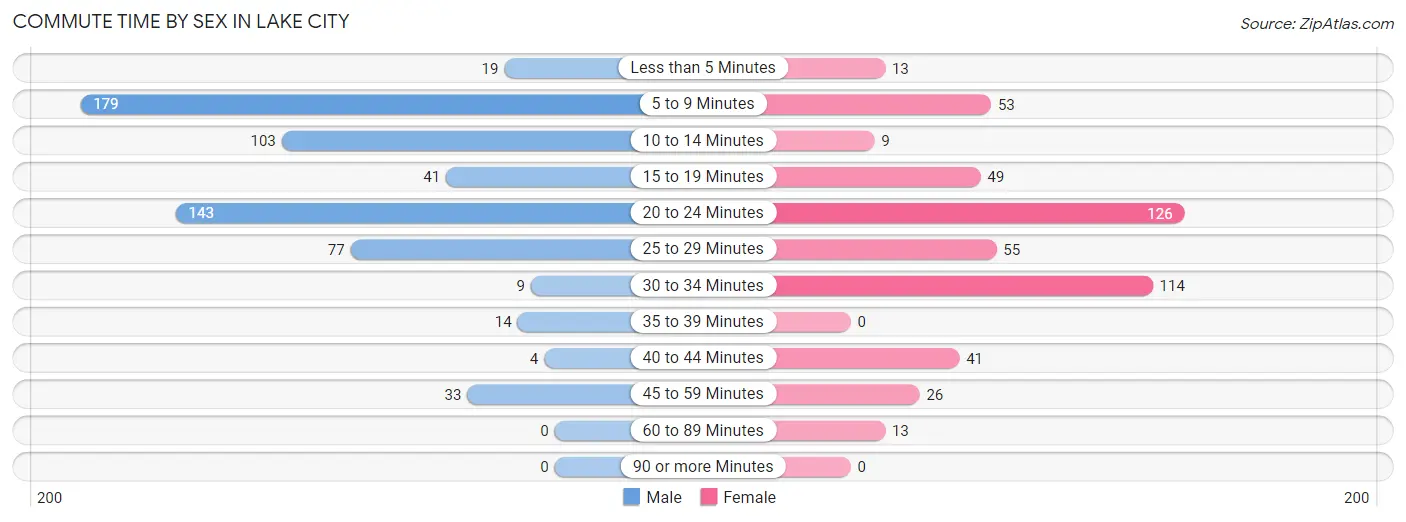
| Commute Time | Male | Female |
| Less than 5 Minutes | 19 (3.0%) | 13 (2.6%) |
| 5 to 9 Minutes | 179 (28.8%) | 53 (10.6%) |
| 10 to 14 Minutes | 103 (16.6%) | 9 (1.8%) |
| 15 to 19 Minutes | 41 (6.6%) | 49 (9.8%) |
| 20 to 24 Minutes | 143 (23.0%) | 126 (25.3%) |
| 25 to 29 Minutes | 77 (12.4%) | 55 (11.0%) |
| 30 to 34 Minutes | 9 (1.5%) | 114 (22.9%) |
| 35 to 39 Minutes | 14 (2.2%) | 0 (0.0%) |
| 40 to 44 Minutes | 4 (0.6%) | 41 (8.2%) |
| 45 to 59 Minutes | 33 (5.3%) | 26 (5.2%) |
| 60 to 89 Minutes | 0 (0.0%) | 13 (2.6%) |
| 90 or more Minutes | 0 (0.0%) | 0 (0.0%) |
Time of Departure to Work by Sex in Lake City
The most frequent times of departure to work in Lake City are 7:30 AM to 7:59 AM (136, 21.9%) for males and 7:30 AM to 7:59 AM (127, 25.5%) for females.
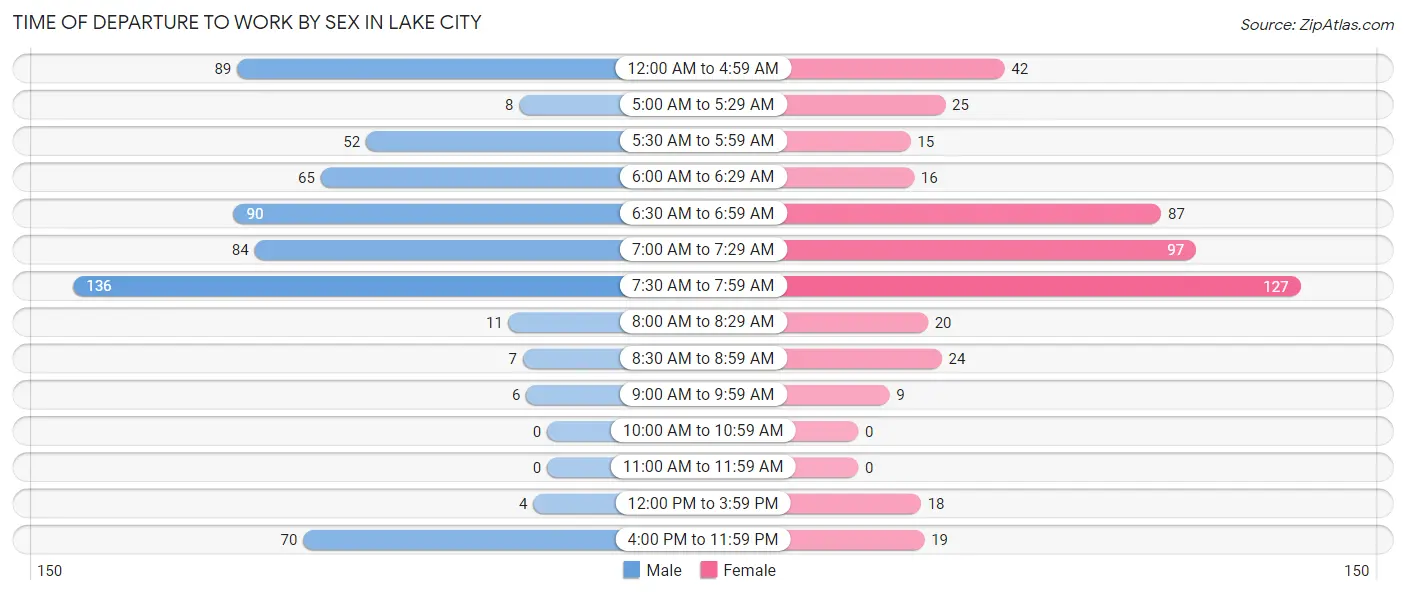
| Time of Departure | Male | Female |
| 12:00 AM to 4:59 AM | 89 (14.3%) | 42 (8.4%) |
| 5:00 AM to 5:29 AM | 8 (1.3%) | 25 (5.0%) |
| 5:30 AM to 5:59 AM | 52 (8.4%) | 15 (3.0%) |
| 6:00 AM to 6:29 AM | 65 (10.4%) | 16 (3.2%) |
| 6:30 AM to 6:59 AM | 90 (14.5%) | 87 (17.4%) |
| 7:00 AM to 7:29 AM | 84 (13.5%) | 97 (19.4%) |
| 7:30 AM to 7:59 AM | 136 (21.9%) | 127 (25.5%) |
| 8:00 AM to 8:29 AM | 11 (1.8%) | 20 (4.0%) |
| 8:30 AM to 8:59 AM | 7 (1.1%) | 24 (4.8%) |
| 9:00 AM to 9:59 AM | 6 (1.0%) | 9 (1.8%) |
| 10:00 AM to 10:59 AM | 0 (0.0%) | 0 (0.0%) |
| 11:00 AM to 11:59 AM | 0 (0.0%) | 0 (0.0%) |
| 12:00 PM to 3:59 PM | 4 (0.6%) | 18 (3.6%) |
| 4:00 PM to 11:59 PM | 70 (11.3%) | 19 (3.8%) |
| Total | 622 (100.0%) | 499 (100.0%) |
Housing Occupancy in Lake City
Occupancy by Ownership in Lake City
Of the total 986 dwellings in Lake City, owner-occupied units account for 614 (62.3%), while renter-occupied units make up 372 (37.7%).
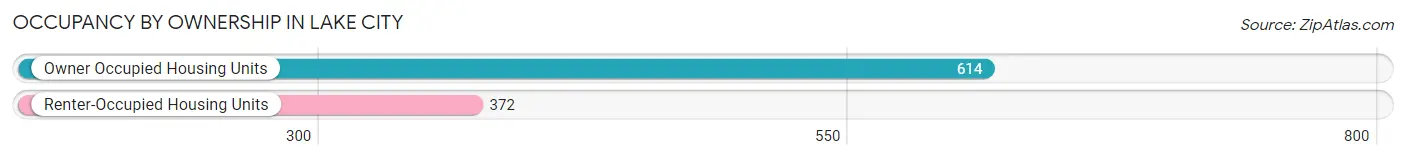
| Occupancy | # Housing Units | % Housing Units |
| Owner Occupied Housing Units | 614 | 62.3% |
| Renter-Occupied Housing Units | 372 | 37.7% |
| Total Occupied Housing Units | 986 | 100.0% |
Occupancy by Household Size in Lake City
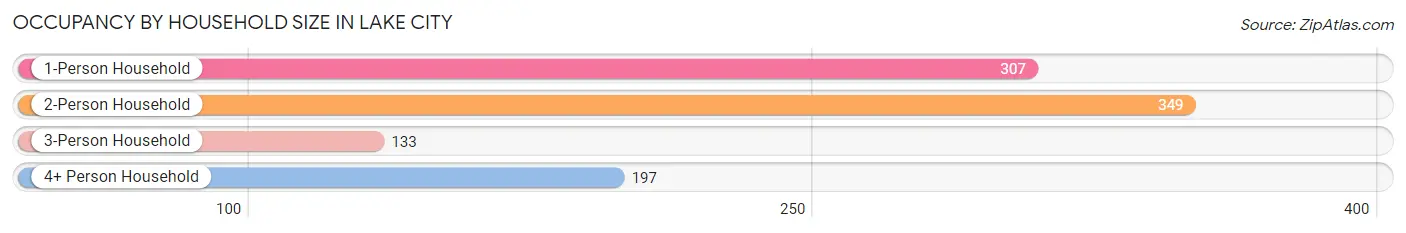
| Household Size | # Housing Units | % Housing Units |
| 1-Person Household | 307 | 31.1% |
| 2-Person Household | 349 | 35.4% |
| 3-Person Household | 133 | 13.5% |
| 4+ Person Household | 197 | 20.0% |
| Total Housing Units | 986 | 100.0% |
Occupancy by Ownership by Household Size in Lake City
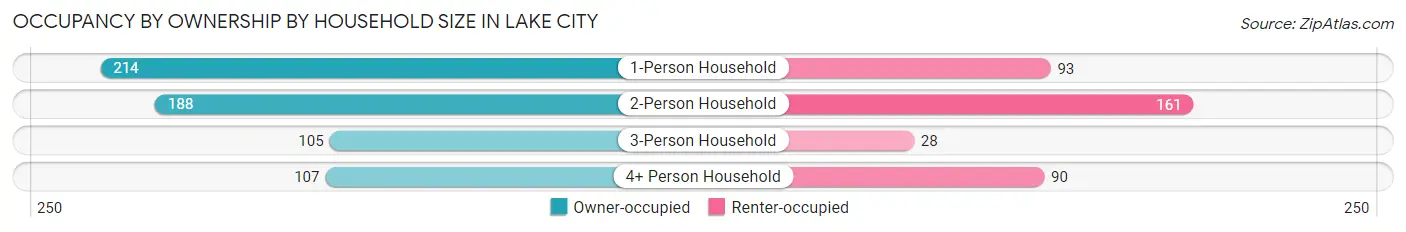
| Household Size | Owner-occupied | Renter-occupied |
| 1-Person Household | 214 (69.7%) | 93 (30.3%) |
| 2-Person Household | 188 (53.9%) | 161 (46.1%) |
| 3-Person Household | 105 (78.9%) | 28 (21.0%) |
| 4+ Person Household | 107 (54.3%) | 90 (45.7%) |
| Total Housing Units | 614 (62.3%) | 372 (37.7%) |
Occupancy by Educational Attainment in Lake City
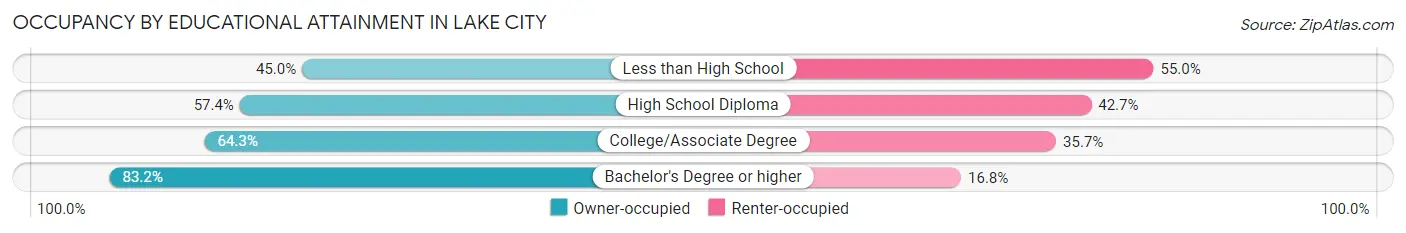
| Household Size | Owner-occupied | Renter-occupied |
| Less than High School | 63 (45.0%) | 77 (55.0%) |
| High School Diploma | 238 (57.4%) | 177 (42.6%) |
| College/Associate Degree | 155 (64.3%) | 86 (35.7%) |
| Bachelor's Degree or higher | 158 (83.2%) | 32 (16.8%) |
Occupancy by Age of Householder in Lake City
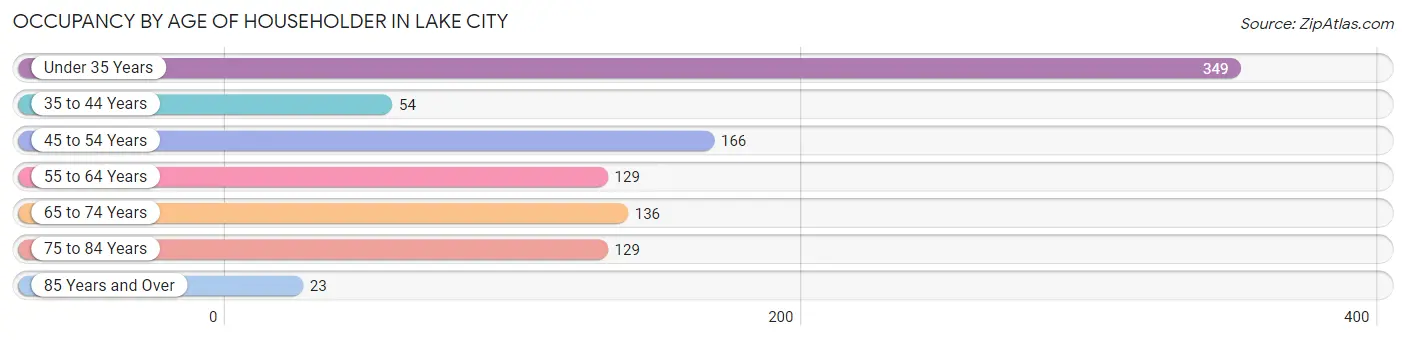
| Age Bracket | # Households | % Households |
| Under 35 Years | 349 | 35.4% |
| 35 to 44 Years | 54 | 5.5% |
| 45 to 54 Years | 166 | 16.8% |
| 55 to 64 Years | 129 | 13.1% |
| 65 to 74 Years | 136 | 13.8% |
| 75 to 84 Years | 129 | 13.1% |
| 85 Years and Over | 23 | 2.3% |
| Total | 986 | 100.0% |
Housing Finances in Lake City
Median Income by Occupancy in Lake City
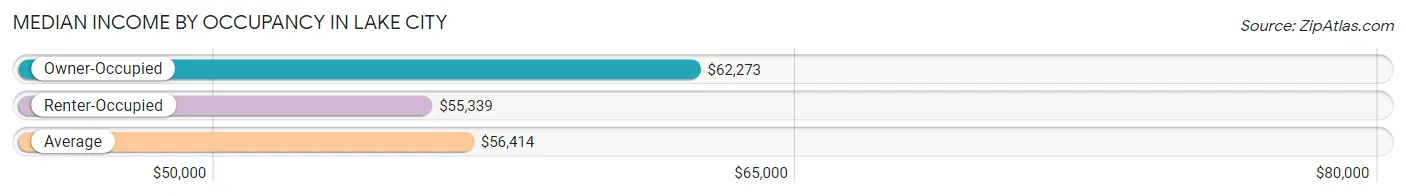
| Occupancy Type | # Households | Median Income |
| Owner-Occupied | 614 (62.3%) | $62,273 |
| Renter-Occupied | 372 (37.7%) | $55,339 |
| Average | 986 (100.0%) | $56,414 |
Occupancy by Householder Income Bracket in Lake City
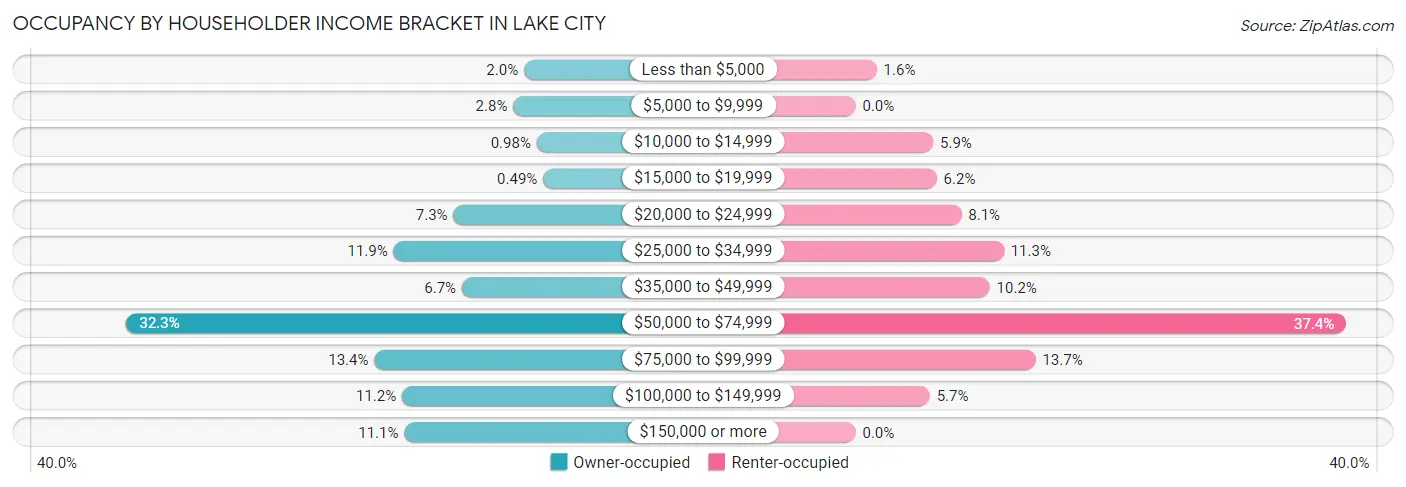
| Income Bracket | Owner-occupied | Renter-occupied |
| Less than $5,000 | 12 (1.9%) | 6 (1.6%) |
| $5,000 to $9,999 | 17 (2.8%) | 0 (0.0%) |
| $10,000 to $14,999 | 6 (1.0%) | 22 (5.9%) |
| $15,000 to $19,999 | 3 (0.5%) | 23 (6.2%) |
| $20,000 to $24,999 | 45 (7.3%) | 30 (8.1%) |
| $25,000 to $34,999 | 73 (11.9%) | 42 (11.3%) |
| $35,000 to $49,999 | 41 (6.7%) | 38 (10.2%) |
| $50,000 to $74,999 | 198 (32.3%) | 139 (37.4%) |
| $75,000 to $99,999 | 82 (13.4%) | 51 (13.7%) |
| $100,000 to $149,999 | 69 (11.2%) | 21 (5.7%) |
| $150,000 or more | 68 (11.1%) | 0 (0.0%) |
| Total | 614 (100.0%) | 372 (100.0%) |
Monthly Housing Cost Tiers in Lake City
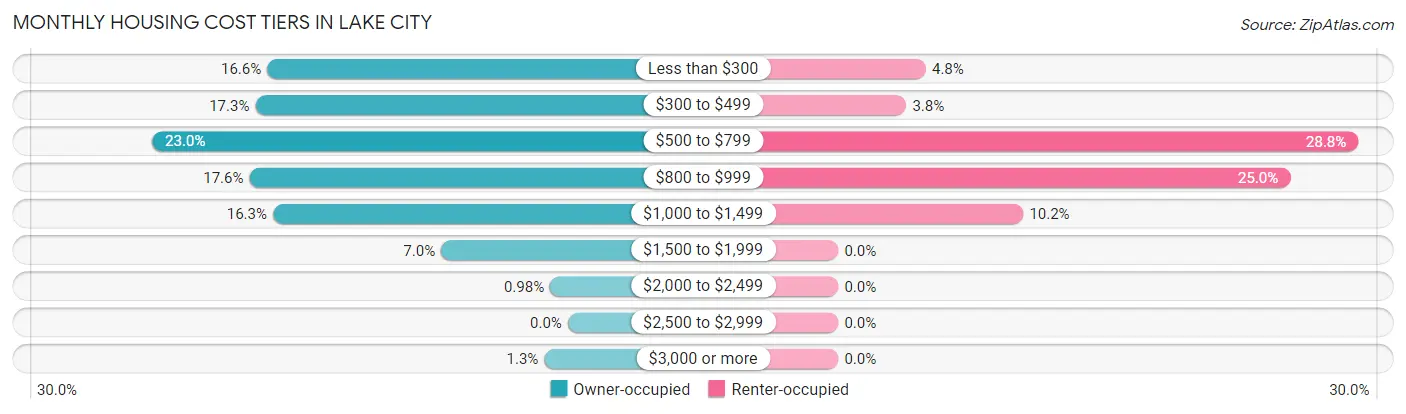
| Monthly Cost | Owner-occupied | Renter-occupied |
| Less than $300 | 102 (16.6%) | 18 (4.8%) |
| $300 to $499 | 106 (17.3%) | 14 (3.8%) |
| $500 to $799 | 141 (23.0%) | 107 (28.8%) |
| $800 to $999 | 108 (17.6%) | 93 (25.0%) |
| $1,000 to $1,499 | 100 (16.3%) | 38 (10.2%) |
| $1,500 to $1,999 | 43 (7.0%) | 0 (0.0%) |
| $2,000 to $2,499 | 6 (1.0%) | 0 (0.0%) |
| $2,500 to $2,999 | 0 (0.0%) | 0 (0.0%) |
| $3,000 or more | 8 (1.3%) | 0 (0.0%) |
| Total | 614 (100.0%) | 372 (100.0%) |
Physical Housing Characteristics in Lake City
Housing Structures in Lake City
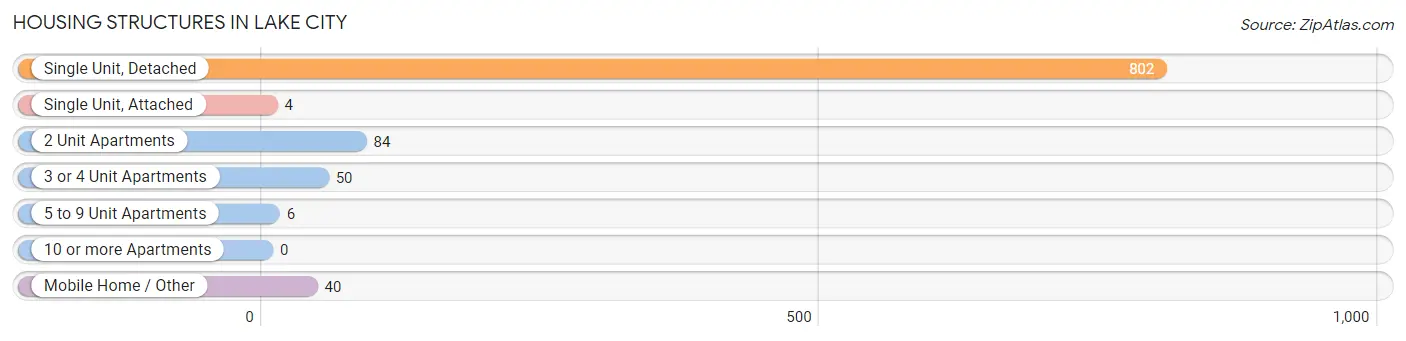
| Structure Type | # Housing Units | % Housing Units |
| Single Unit, Detached | 802 | 81.3% |
| Single Unit, Attached | 4 | 0.4% |
| 2 Unit Apartments | 84 | 8.5% |
| 3 or 4 Unit Apartments | 50 | 5.1% |
| 5 to 9 Unit Apartments | 6 | 0.6% |
| 10 or more Apartments | 0 | 0.0% |
| Mobile Home / Other | 40 | 4.1% |
| Total | 986 | 100.0% |
Housing Structures by Occupancy in Lake City
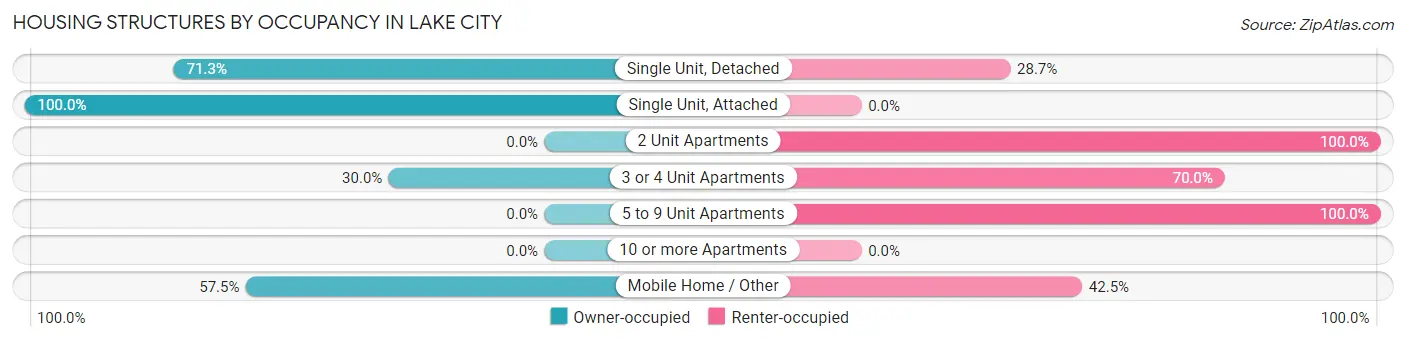
| Structure Type | Owner-occupied | Renter-occupied |
| Single Unit, Detached | 572 (71.3%) | 230 (28.7%) |
| Single Unit, Attached | 4 (100.0%) | 0 (0.0%) |
| 2 Unit Apartments | 0 (0.0%) | 84 (100.0%) |
| 3 or 4 Unit Apartments | 15 (30.0%) | 35 (70.0%) |
| 5 to 9 Unit Apartments | 0 (0.0%) | 6 (100.0%) |
| 10 or more Apartments | 0 (0.0%) | 0 (0.0%) |
| Mobile Home / Other | 23 (57.5%) | 17 (42.5%) |
| Total | 614 (62.3%) | 372 (37.7%) |
Housing Structures by Number of Rooms in Lake City
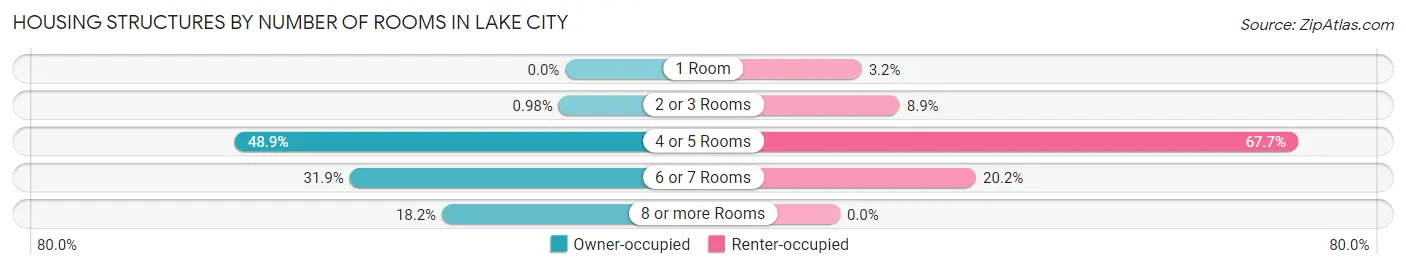
| Number of Rooms | Owner-occupied | Renter-occupied |
| 1 Room | 0 (0.0%) | 12 (3.2%) |
| 2 or 3 Rooms | 6 (1.0%) | 33 (8.9%) |
| 4 or 5 Rooms | 300 (48.9%) | 252 (67.7%) |
| 6 or 7 Rooms | 196 (31.9%) | 75 (20.2%) |
| 8 or more Rooms | 112 (18.2%) | 0 (0.0%) |
| Total | 614 (100.0%) | 372 (100.0%) |
Housing Structure by Heating Type in Lake City
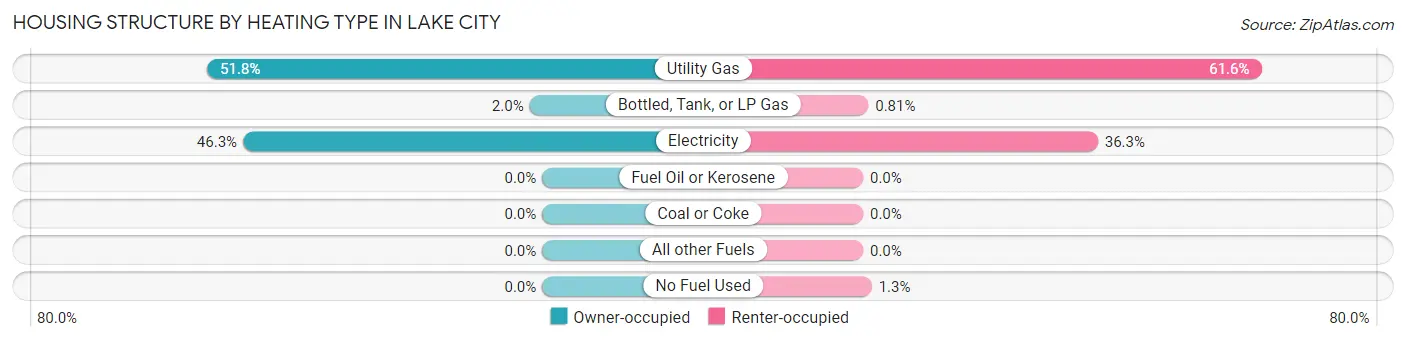
| Heating Type | Owner-occupied | Renter-occupied |
| Utility Gas | 318 (51.8%) | 229 (61.6%) |
| Bottled, Tank, or LP Gas | 12 (1.9%) | 3 (0.8%) |
| Electricity | 284 (46.3%) | 135 (36.3%) |
| Fuel Oil or Kerosene | 0 (0.0%) | 0 (0.0%) |
| Coal or Coke | 0 (0.0%) | 0 (0.0%) |
| All other Fuels | 0 (0.0%) | 0 (0.0%) |
| No Fuel Used | 0 (0.0%) | 5 (1.3%) |
| Total | 614 (100.0%) | 372 (100.0%) |
Household Vehicle Usage in Lake City
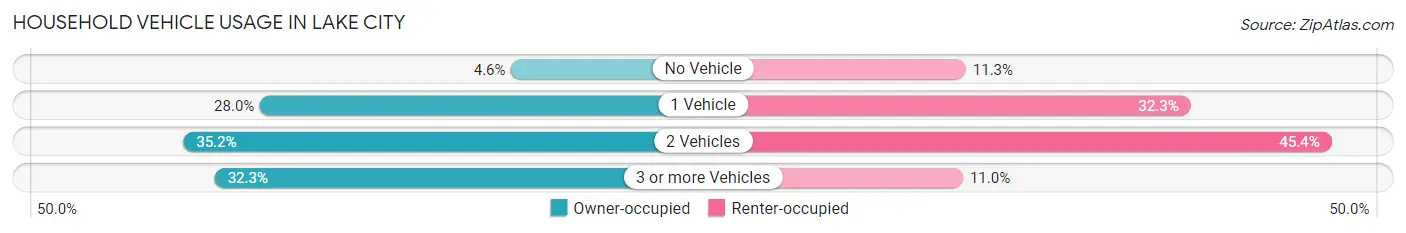
| Vehicles per Household | Owner-occupied | Renter-occupied |
| No Vehicle | 28 (4.6%) | 42 (11.3%) |
| 1 Vehicle | 172 (28.0%) | 120 (32.3%) |
| 2 Vehicles | 216 (35.2%) | 169 (45.4%) |
| 3 or more Vehicles | 198 (32.3%) | 41 (11.0%) |
| Total | 614 (100.0%) | 372 (100.0%) |
Real Estate & Mortgages in Lake City
Real Estate and Mortgage Overview in Lake City
| Characteristic | Without Mortgage | With Mortgage |
| Housing Units | 278 | 336 |
| Median Property Value | $105,600 | $132,700 |
| Median Household Income | $53,636 | $55 |
| Monthly Housing Costs | $351 | $8 |
| Real Estate Taxes | $679 | $6 |
Property Value by Mortgage Status in Lake City
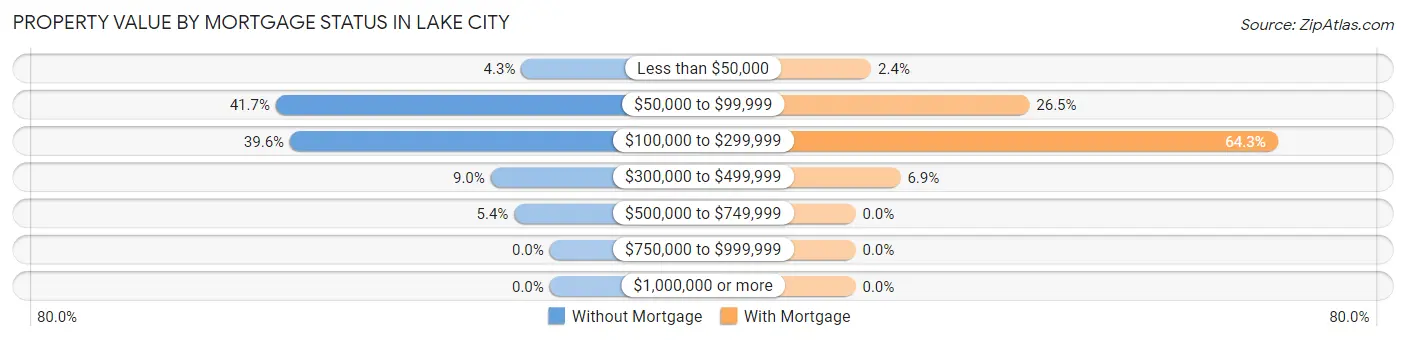
| Property Value | Without Mortgage | With Mortgage |
| Less than $50,000 | 12 (4.3%) | 8 (2.4%) |
| $50,000 to $99,999 | 116 (41.7%) | 89 (26.5%) |
| $100,000 to $299,999 | 110 (39.6%) | 216 (64.3%) |
| $300,000 to $499,999 | 25 (9.0%) | 23 (6.9%) |
| $500,000 to $749,999 | 15 (5.4%) | 0 (0.0%) |
| $750,000 to $999,999 | 0 (0.0%) | 0 (0.0%) |
| $1,000,000 or more | 0 (0.0%) | 0 (0.0%) |
| Total | 278 (100.0%) | 336 (100.0%) |
Household Income by Mortgage Status in Lake City
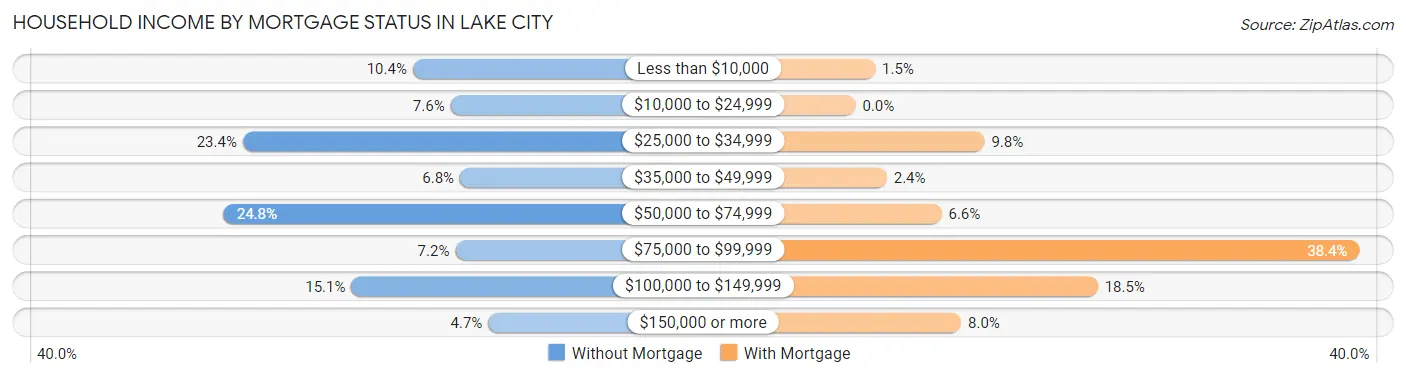
| Household Income | Without Mortgage | With Mortgage |
| Less than $10,000 | 29 (10.4%) | 5 (1.5%) |
| $10,000 to $24,999 | 21 (7.5%) | 0 (0.0%) |
| $25,000 to $34,999 | 65 (23.4%) | 33 (9.8%) |
| $35,000 to $49,999 | 19 (6.8%) | 8 (2.4%) |
| $50,000 to $74,999 | 69 (24.8%) | 22 (6.6%) |
| $75,000 to $99,999 | 20 (7.2%) | 129 (38.4%) |
| $100,000 to $149,999 | 42 (15.1%) | 62 (18.4%) |
| $150,000 or more | 13 (4.7%) | 27 (8.0%) |
| Total | 278 (100.0%) | 336 (100.0%) |
Property Value to Household Income Ratio in Lake City
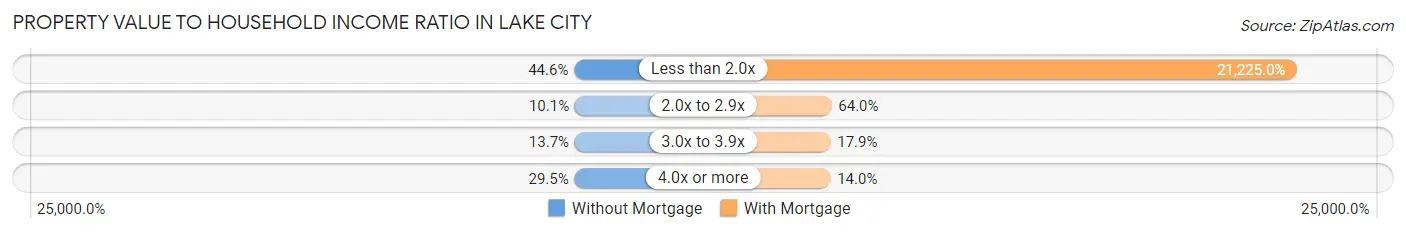
| Value-to-Income Ratio | Without Mortgage | With Mortgage |
| Less than 2.0x | 124 (44.6%) | 71,316 (21,225.0%) |
| 2.0x to 2.9x | 28 (10.1%) | 215 (64.0%) |
| 3.0x to 3.9x | 38 (13.7%) | 60 (17.9%) |
| 4.0x or more | 82 (29.5%) | 47 (14.0%) |
| Total | 278 (100.0%) | 336 (100.0%) |
Real Estate Taxes by Mortgage Status in Lake City
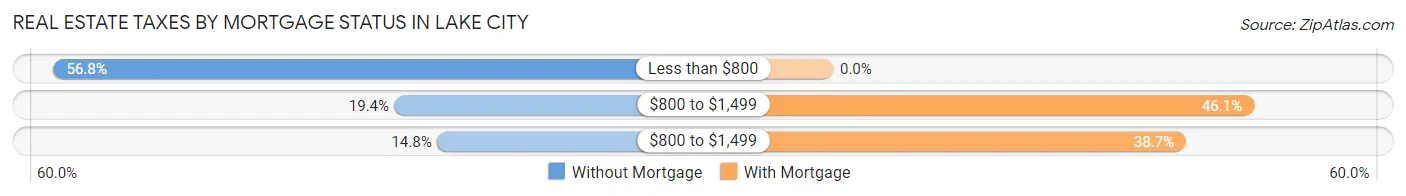
| Property Taxes | Without Mortgage | With Mortgage |
| Less than $800 | 158 (56.8%) | 0 (0.0%) |
| $800 to $1,499 | 54 (19.4%) | 155 (46.1%) |
| $800 to $1,499 | 41 (14.7%) | 130 (38.7%) |
| Total | 278 (100.0%) | 336 (100.0%) |
Health & Disability in Lake City
Health Insurance Coverage by Age in Lake City
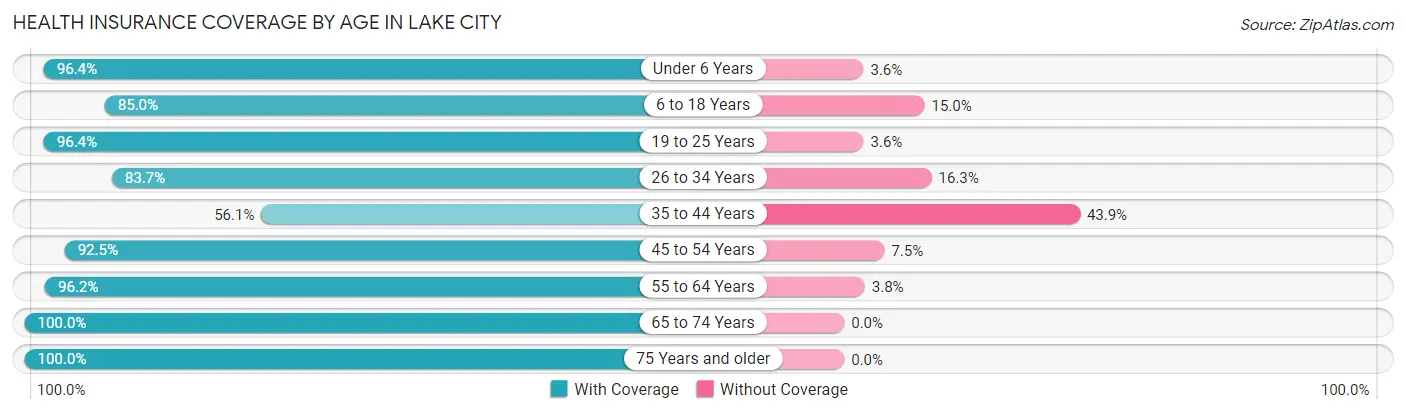
| Age Bracket | With Coverage | Without Coverage |
| Under 6 Years | 215 (96.4%) | 8 (3.6%) |
| 6 to 18 Years | 267 (85.0%) | 47 (15.0%) |
| 19 to 25 Years | 268 (96.4%) | 10 (3.6%) |
| 26 to 34 Years | 437 (83.7%) | 85 (16.3%) |
| 35 to 44 Years | 74 (56.1%) | 58 (43.9%) |
| 45 to 54 Years | 247 (92.5%) | 20 (7.5%) |
| 55 to 64 Years | 176 (96.2%) | 7 (3.8%) |
| 65 to 74 Years | 216 (100.0%) | 0 (0.0%) |
| 75 Years and older | 193 (100.0%) | 0 (0.0%) |
| Total | 2,093 (89.9%) | 235 (10.1%) |
Health Insurance Coverage by Citizenship Status in Lake City
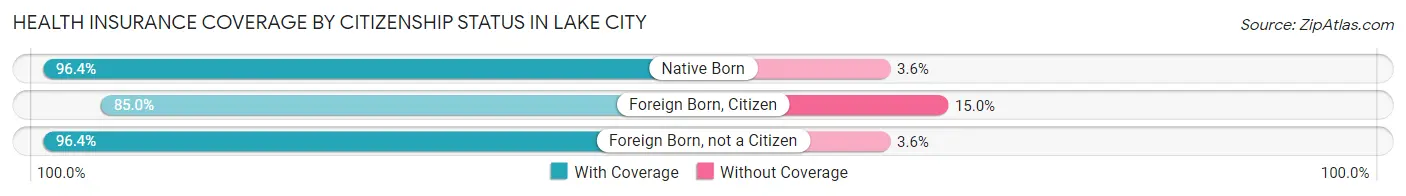
| Citizenship Status | With Coverage | Without Coverage |
| Native Born | 215 (96.4%) | 8 (3.6%) |
| Foreign Born, Citizen | 267 (85.0%) | 47 (15.0%) |
| Foreign Born, not a Citizen | 268 (96.4%) | 10 (3.6%) |
Health Insurance Coverage by Household Income in Lake City
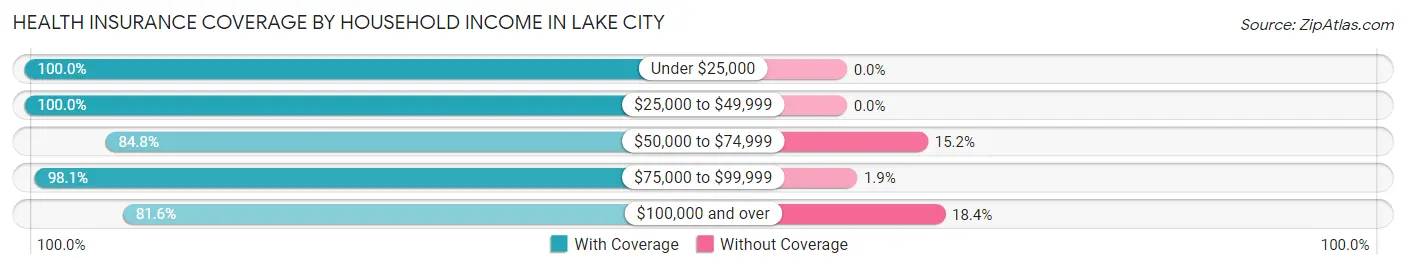
| Household Income | With Coverage | Without Coverage |
| Under $25,000 | 220 (100.0%) | 0 (0.0%) |
| $25,000 to $49,999 | 353 (100.0%) | 0 (0.0%) |
| $50,000 to $74,999 | 710 (84.8%) | 127 (15.2%) |
| $75,000 to $99,999 | 362 (98.1%) | 7 (1.9%) |
| $100,000 and over | 448 (81.6%) | 101 (18.4%) |
Public vs Private Health Insurance Coverage by Age in Lake City
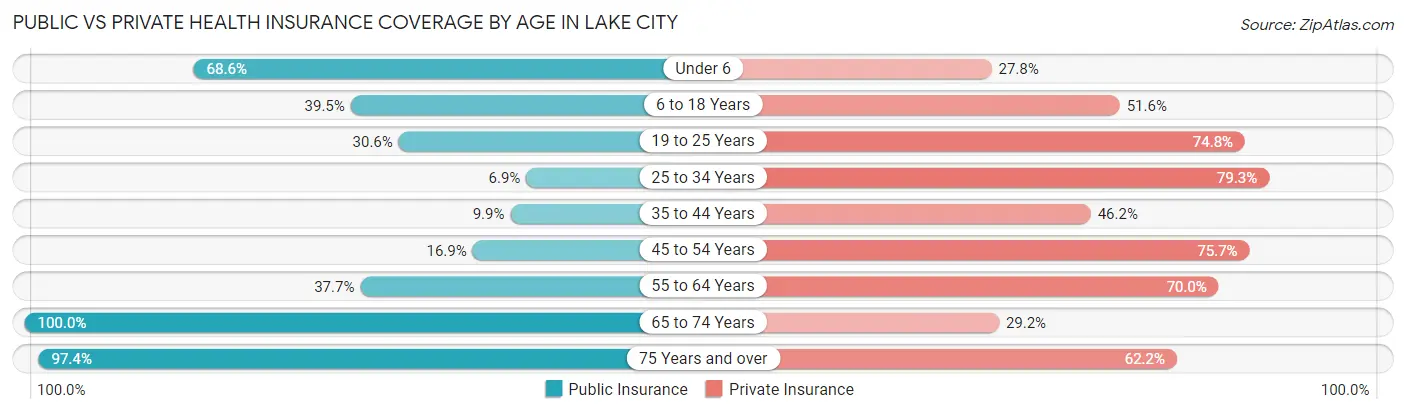
| Age Bracket | Public Insurance | Private Insurance |
| Under 6 | 153 (68.6%) | 62 (27.8%) |
| 6 to 18 Years | 124 (39.5%) | 162 (51.6%) |
| 19 to 25 Years | 85 (30.6%) | 208 (74.8%) |
| 25 to 34 Years | 36 (6.9%) | 414 (79.3%) |
| 35 to 44 Years | 13 (9.9%) | 61 (46.2%) |
| 45 to 54 Years | 45 (16.9%) | 202 (75.7%) |
| 55 to 64 Years | 69 (37.7%) | 128 (70.0%) |
| 65 to 74 Years | 216 (100.0%) | 63 (29.2%) |
| 75 Years and over | 188 (97.4%) | 120 (62.2%) |
| Total | 929 (39.9%) | 1,420 (61.0%) |
Disability Status by Sex by Age in Lake City
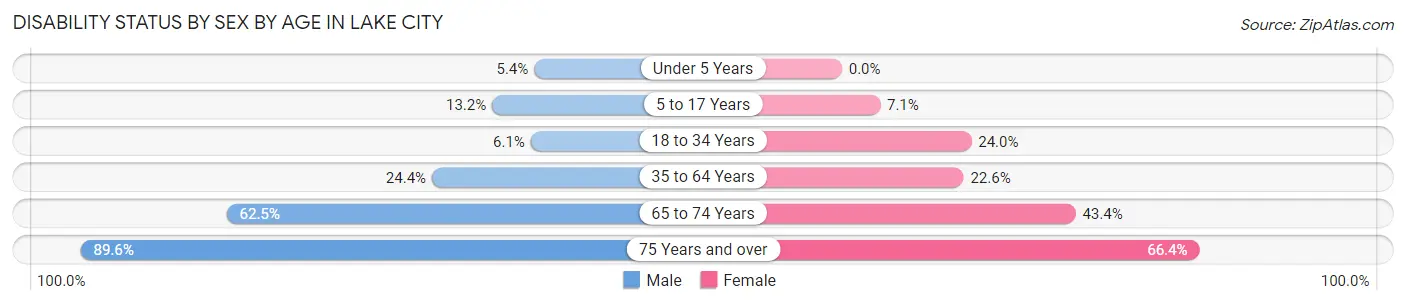
| Age Bracket | Male | Female |
| Under 5 Years | 7 (5.4%) | 0 (0.0%) |
| 5 to 17 Years | 18 (13.2%) | 11 (7.1%) |
| 18 to 34 Years | 29 (6.1%) | 87 (24.0%) |
| 35 to 64 Years | 61 (24.4%) | 75 (22.6%) |
| 65 to 74 Years | 50 (62.5%) | 59 (43.4%) |
| 75 Years and over | 69 (89.6%) | 77 (66.4%) |
Disability Class by Sex by Age in Lake City
Disability Class: Hearing Difficulty
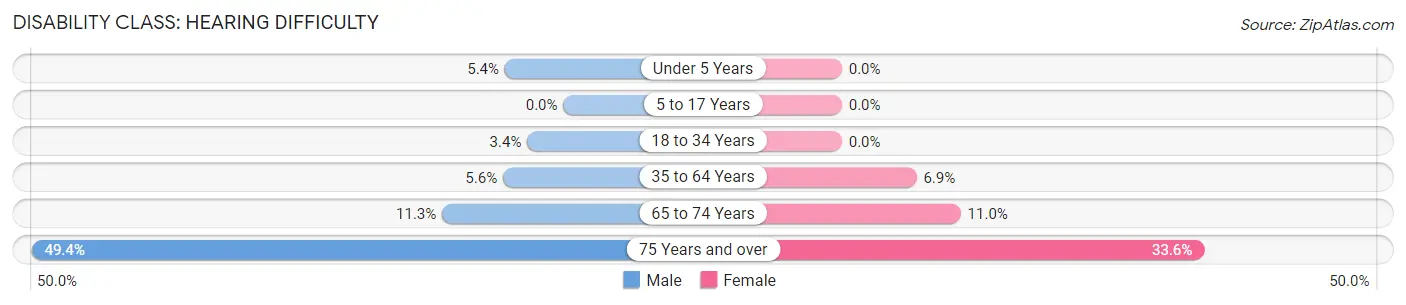
| Age Bracket | Male | Female |
| Under 5 Years | 7 (5.4%) | 0 (0.0%) |
| 5 to 17 Years | 0 (0.0%) | 0 (0.0%) |
| 18 to 34 Years | 16 (3.4%) | 0 (0.0%) |
| 35 to 64 Years | 14 (5.6%) | 23 (6.9%) |
| 65 to 74 Years | 9 (11.3%) | 15 (11.0%) |
| 75 Years and over | 38 (49.3%) | 39 (33.6%) |
Disability Class: Vision Difficulty
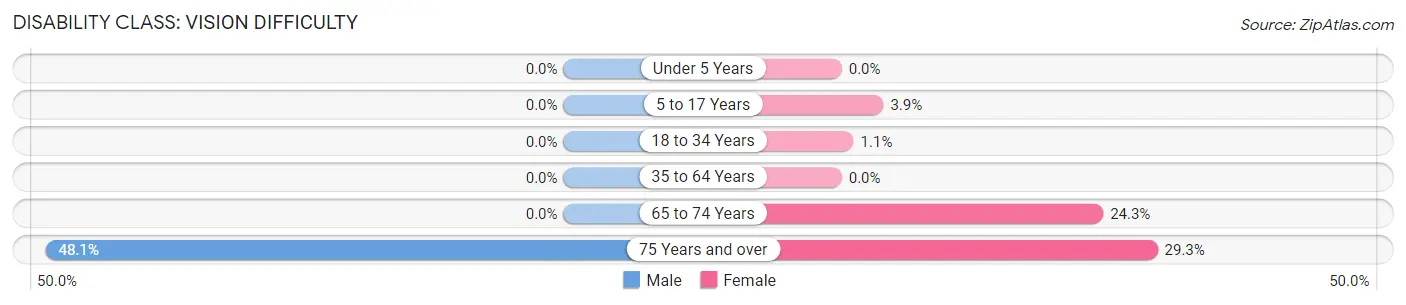
| Age Bracket | Male | Female |
| Under 5 Years | 0 (0.0%) | 0 (0.0%) |
| 5 to 17 Years | 0 (0.0%) | 6 (3.9%) |
| 18 to 34 Years | 0 (0.0%) | 4 (1.1%) |
| 35 to 64 Years | 0 (0.0%) | 0 (0.0%) |
| 65 to 74 Years | 0 (0.0%) | 33 (24.3%) |
| 75 Years and over | 37 (48.0%) | 34 (29.3%) |
Disability Class: Cognitive Difficulty
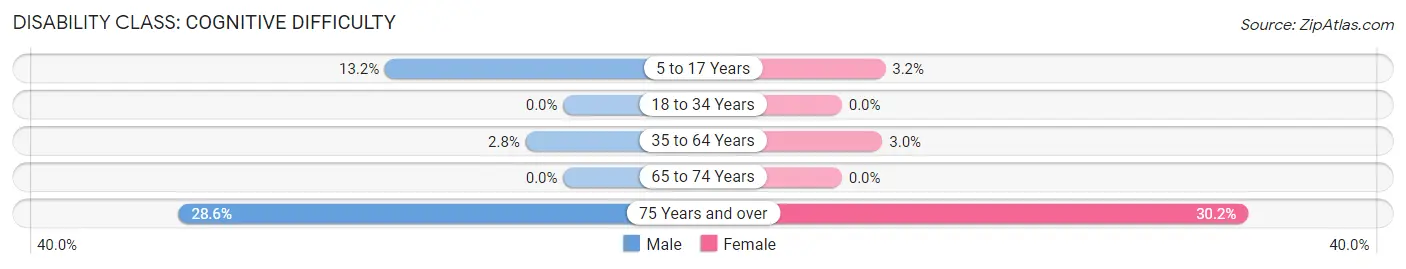
| Age Bracket | Male | Female |
| 5 to 17 Years | 18 (13.2%) | 5 (3.2%) |
| 18 to 34 Years | 0 (0.0%) | 0 (0.0%) |
| 35 to 64 Years | 7 (2.8%) | 10 (3.0%) |
| 65 to 74 Years | 0 (0.0%) | 0 (0.0%) |
| 75 Years and over | 22 (28.6%) | 35 (30.2%) |
Disability Class: Ambulatory Difficulty
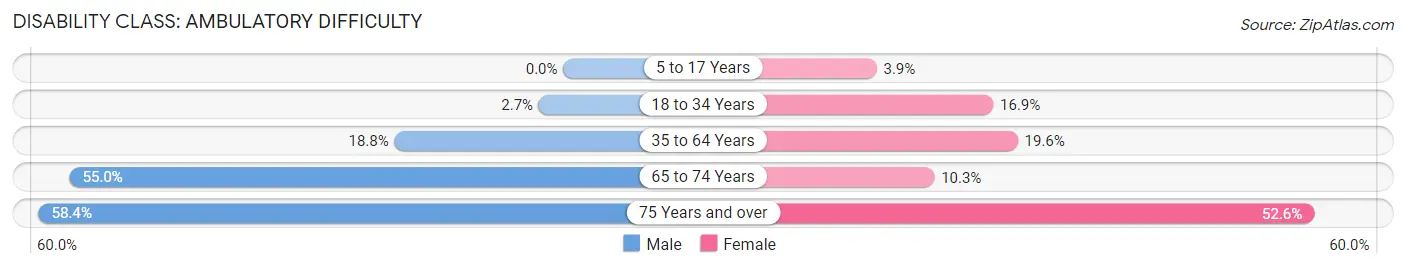
| Age Bracket | Male | Female |
| 5 to 17 Years | 0 (0.0%) | 6 (3.9%) |
| 18 to 34 Years | 13 (2.7%) | 61 (16.9%) |
| 35 to 64 Years | 47 (18.8%) | 65 (19.6%) |
| 65 to 74 Years | 44 (55.0%) | 14 (10.3%) |
| 75 Years and over | 45 (58.4%) | 61 (52.6%) |
Disability Class: Self-Care Difficulty
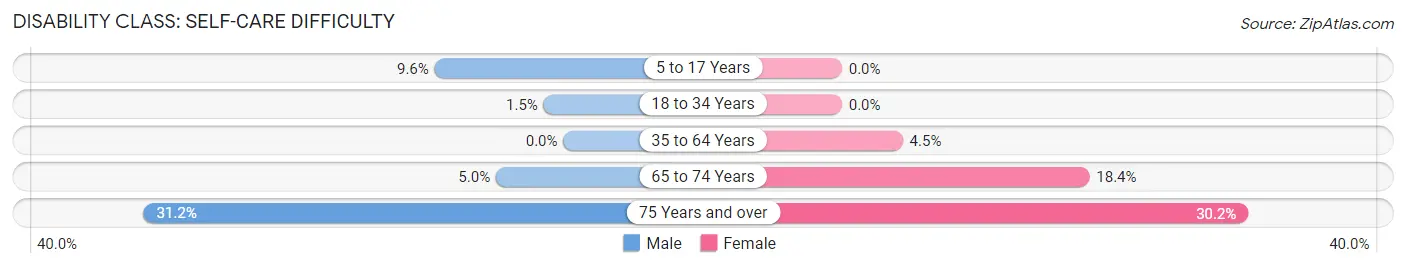
| Age Bracket | Male | Female |
| 5 to 17 Years | 13 (9.6%) | 0 (0.0%) |
| 18 to 34 Years | 7 (1.5%) | 0 (0.0%) |
| 35 to 64 Years | 0 (0.0%) | 15 (4.5%) |
| 65 to 74 Years | 4 (5.0%) | 25 (18.4%) |
| 75 Years and over | 24 (31.2%) | 35 (30.2%) |
Technology Access in Lake City
Computing Device Access in Lake City
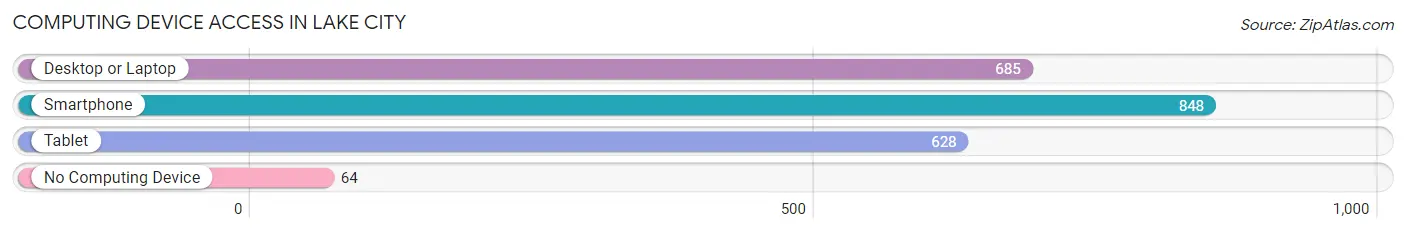
| Device Type | # Households | % Households |
| Desktop or Laptop | 685 | 69.5% |
| Smartphone | 848 | 86.0% |
| Tablet | 628 | 63.7% |
| No Computing Device | 64 | 6.5% |
| Total | 986 | 100.0% |
Internet Access in Lake City
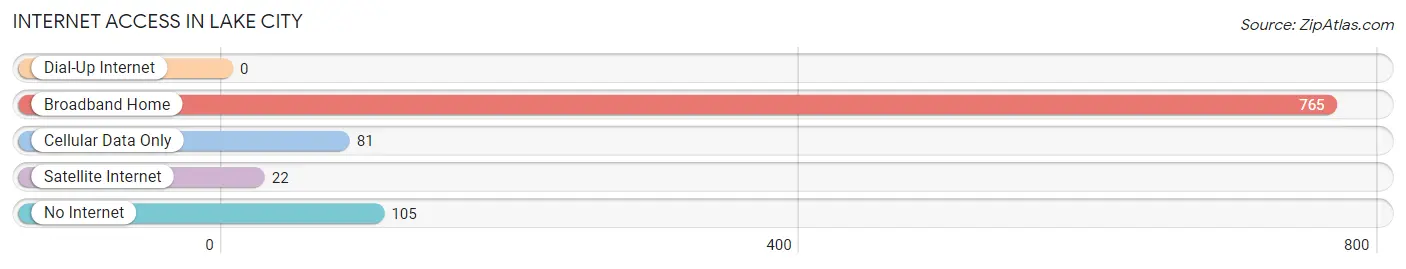
| Internet Type | # Households | % Households |
| Dial-Up Internet | 0 | 0.0% |
| Broadband Home | 765 | 77.6% |
| Cellular Data Only | 81 | 8.2% |
| Satellite Internet | 22 | 2.2% |
| No Internet | 105 | 10.6% |
| Total | 986 | 100.0% |
Lake City Summary
City of Lake City Arkansas
Lake City, Arkansas is a small city located in Craighead County in the northeastern part of the state. It is situated on the banks of the St. Francis River, and is part of the Jonesboro metropolitan area. The city has a population of approximately 2,000 people, and is the county seat of Craighead County.
History
The area that is now Lake City was first settled in the early 1800s by settlers from the nearby town of Jonesboro. The town was originally known as “St. Francis”, and was named after the nearby river. In 1872, the town was renamed “Lake City”, after the nearby lake.
The city was incorporated in 1883, and the first mayor was elected in 1884. The city was a major center for cotton production, and the economy was largely based on agriculture. The city was also home to several sawmills and gristmills, which provided lumber and grain for the local population.
In the early 1900s, the city began to experience a period of growth and development. The city was connected to the railroad in 1906, and the first bank was established in 1907. The city also had a number of stores, hotels, and other businesses.
In the 1950s, the city began to experience a decline in population and economic activity. The city was hit hard by the Great Depression, and many of the businesses closed. The city also experienced a decline in the cotton industry, as the mechanization of farming made it less profitable.
In the late 1970s, the city began to experience a period of revitalization. The city was connected to the interstate highway system in 1979, and the city began to attract new businesses and residents. The city also began to experience a resurgence in the cotton industry, as the mechanization of farming made it more profitable.
Geography
Lake City is located in the northeastern part of Arkansas, in Craighead County. The city is situated on the banks of the St. Francis River, and is part of the Jonesboro metropolitan area. The city has a total area of 4.2 square miles, and is located at an elevation of 246 feet.
The city is located in a humid subtropical climate zone, and has hot, humid summers and mild winters. The average annual temperature is 64 degrees Fahrenheit, and the average annual precipitation is 48 inches.
Economy
The economy of Lake City is largely based on agriculture and manufacturing. The city is home to several cotton gins, and the cotton industry is still an important part of the local economy. The city is also home to several manufacturing plants, including a paper mill and a furniture factory.
The city is also home to several retail stores, restaurants, and other businesses. The city is also home to a number of medical facilities, including a hospital and several clinics.
Demographics
As of the 2010 census, the population of Lake City was 2,000 people. The racial makeup of the city was 95.2% White, 1.7% African American, 0.3% Native American, 0.3% Asian, 0.1% Pacific Islander, 0.7% from other races, and 1.9% from two or more races. Hispanic or Latino of any race were 2.2% of the population.
The median income for a household in the city was $30,000, and the median income for a family was $35,000. The per capita income for the city was $15,000. About 17.5% of the population was below the poverty line.
Common Questions
What is Per Capita Income in Lake City?
Per Capita income in Lake City is $30,198.
What is the Median Family Income in Lake City?
Median Family Income in Lake City is $64,773.
What is the Median Household income in Lake City?
Median Household Income in Lake City is $56,414.
What is Income or Wage Gap in Lake City?
Income or Wage Gap in Lake City is 35.8%.
Women in Lake City earn 64.2 cents for every dollar earned by a man.
What is Inequality or Gini Index in Lake City?
Inequality or Gini Index in Lake City is 0.39.
What is the Total Population of Lake City?
Total Population of Lake City is 2,389.
What is the Total Male Population of Lake City?
Total Male Population of Lake City is 1,160.
What is the Total Female Population of Lake City?
Total Female Population of Lake City is 1,229.
What is the Ratio of Males per 100 Females in Lake City?
There are 94.39 Males per 100 Females in Lake City.
What is the Ratio of Females per 100 Males in Lake City?
There are 105.95 Females per 100 Males in Lake City.
What is the Median Population Age in Lake City?
Median Population Age in Lake City is 32.5 Years.
What is the Average Family Size in Lake City
Average Family Size in Lake City is 2.8 People.
What is the Average Household Size in Lake City
Average Household Size in Lake City is 2.4 People.
How Large is the Labor Force in Lake City?
There are 1,288 People in the Labor Forcein in Lake City.
What is the Percentage of People in the Labor Force in Lake City?
66.0% of People are in the Labor Force in Lake City.
What is the Unemployment Rate in Lake City?
Unemployment Rate in Lake City is 8.3%.