Kingsland, AR Map & Demographics
Kingsland Map
Kingsland Overview
$20,005
PER CAPITA INCOME
$29,318
AVG FAMILY INCOME
$27,583
AVG HOUSEHOLD INCOME
70.7%
WAGE / INCOME GAP [ % ]
29.3¢/ $1
WAGE / INCOME GAP [ $ ]
$7,033
FAMILY INCOME DEFICIT
0.46
INEQUALITY / GINI INDEX
529
TOTAL POPULATION
176
MALE POPULATION
353
FEMALE POPULATION
49.86
MALES / 100 FEMALES
200.57
FEMALES / 100 MALES
37.6
MEDIAN AGE
4.4
AVG FAMILY SIZE
3.0
AVG HOUSEHOLD SIZE
306
LABOR FORCE [ PEOPLE ]
71.3%
PERCENT IN LABOR FORCE
Kingsland Zip Codes
Kingsland Area Codes
Income in Kingsland
Income Overview in Kingsland
Per Capita Income in Kingsland is $20,005, while median incomes of families and households are $29,318 and $27,583 respectively.
| Characteristic | Number | Measure |
| Per Capita Income | 529 | $20,005 |
| Median Family Income | 98 | $29,318 |
| Mean Family Income | 98 | $55,443 |
| Median Household Income | 179 | $27,583 |
| Mean Household Income | 179 | $44,646 |
| Income Deficit | 98 | $7,033 |
| Wage / Income Gap (%) | 529 | 70.75% |
| Wage / Income Gap ($) | 529 | 29.25¢ per $1 |
| Gini / Inequality Index | 529 | 0.46 |
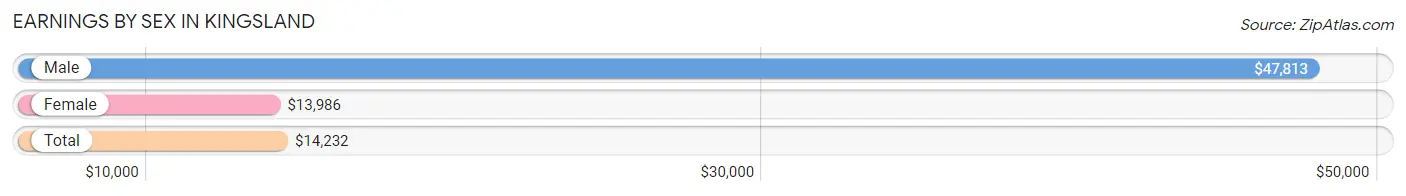
Earnings by Sex in Kingsland
Average Earnings in Kingsland are $14,232, $47,813 for men and $13,986 for women, a difference of 70.8%.
| Sex | Number | Average Earnings |
| Male | 59 (18.7%) | $47,813 |
| Female | 257 (81.3%) | $13,986 |
| Total | 316 (100.0%) | $14,232 |
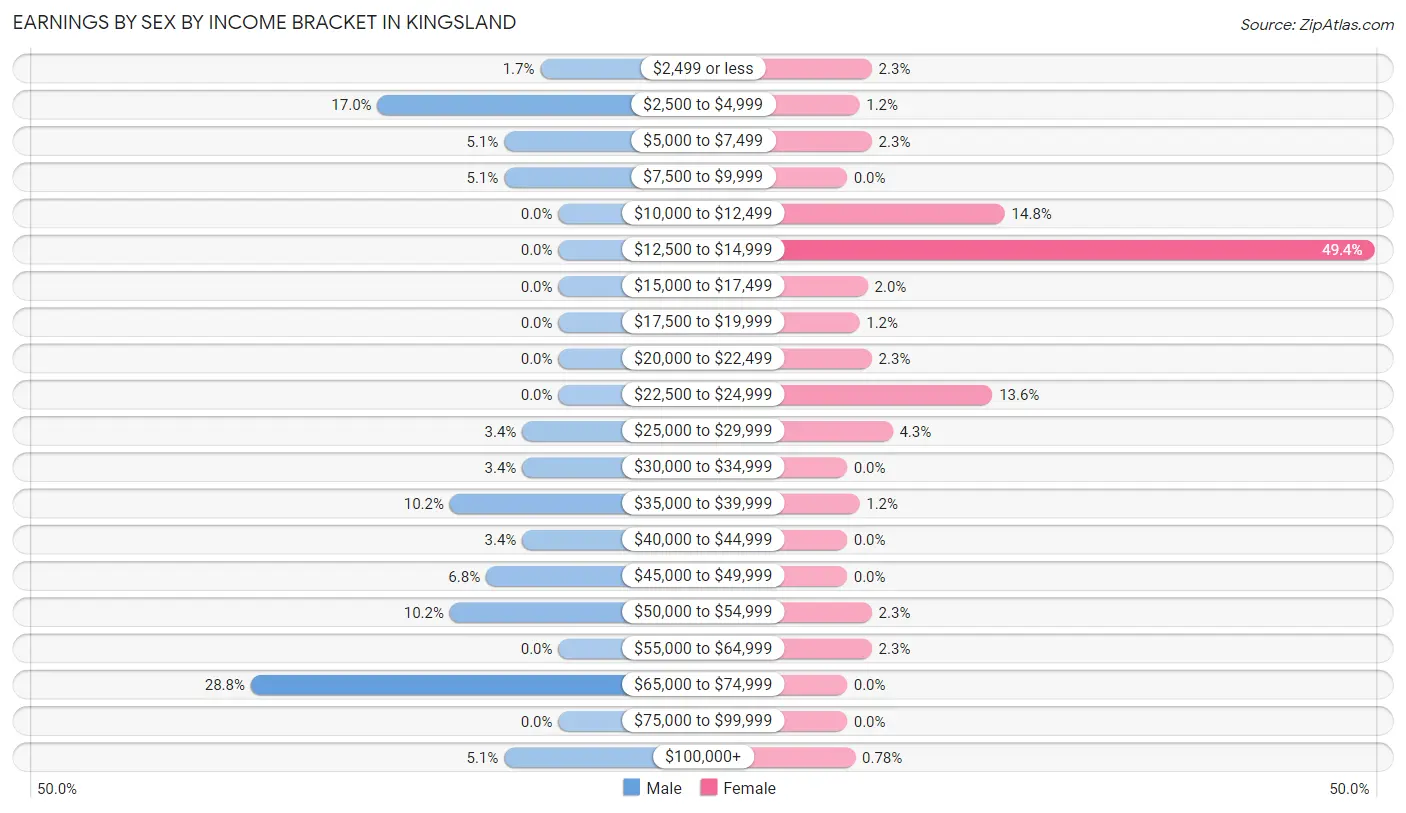
Earnings by Sex by Income Bracket in Kingsland
The most common earnings brackets in Kingsland are $65,000 to $74,999 for men (17 | 28.8%) and $12,500 to $14,999 for women (127 | 49.4%).
| Income | Male | Female |
| $2,499 or less | 1 (1.7%) | 6 (2.3%) |
| $2,500 to $4,999 | 10 (17.0%) | 3 (1.2%) |
| $5,000 to $7,499 | 3 (5.1%) | 6 (2.3%) |
| $7,500 to $9,999 | 3 (5.1%) | 0 (0.0%) |
| $10,000 to $12,499 | 0 (0.0%) | 38 (14.8%) |
| $12,500 to $14,999 | 0 (0.0%) | 127 (49.4%) |
| $15,000 to $17,499 | 0 (0.0%) | 5 (1.9%) |
| $17,500 to $19,999 | 0 (0.0%) | 3 (1.2%) |
| $20,000 to $22,499 | 0 (0.0%) | 6 (2.3%) |
| $22,500 to $24,999 | 0 (0.0%) | 35 (13.6%) |
| $25,000 to $29,999 | 2 (3.4%) | 11 (4.3%) |
| $30,000 to $34,999 | 2 (3.4%) | 0 (0.0%) |
| $35,000 to $39,999 | 6 (10.2%) | 3 (1.2%) |
| $40,000 to $44,999 | 2 (3.4%) | 0 (0.0%) |
| $45,000 to $49,999 | 4 (6.8%) | 0 (0.0%) |
| $50,000 to $54,999 | 6 (10.2%) | 6 (2.3%) |
| $55,000 to $64,999 | 0 (0.0%) | 6 (2.3%) |
| $65,000 to $74,999 | 17 (28.8%) | 0 (0.0%) |
| $75,000 to $99,999 | 0 (0.0%) | 0 (0.0%) |
| $100,000+ | 3 (5.1%) | 2 (0.8%) |
| Total | 59 (100.0%) | 257 (100.0%) |
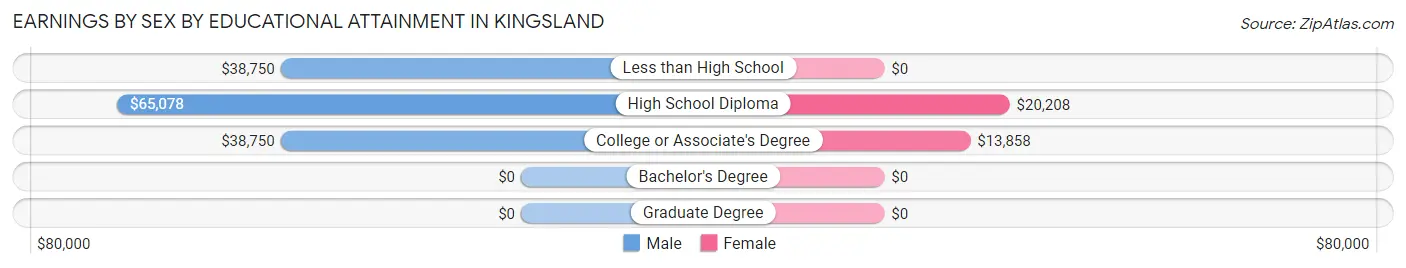
Earnings by Sex by Educational Attainment in Kingsland
Average earnings in Kingsland are $53,542 for men and $13,937 for women, a difference of 74.0%. Men with an educational attainment of high school diploma enjoy the highest average annual earnings of $65,078, while those with less than high school education earn the least with $38,750. Women with an educational attainment of high school diploma earn the most with the average annual earnings of $20,208, while those with college or associate's degree education have the smallest earnings of $13,858.
| Educational Attainment | Male Income | Female Income |
| Less than High School | $38,750 | $0 |
| High School Diploma | $65,078 | $20,208 |
| College or Associate's Degree | $38,750 | $13,858 |
| Bachelor's Degree | - | - |
| Graduate Degree | - | - |
| Total | $53,542 | $13,937 |
Family Income in Kingsland
Family Income Brackets in Kingsland
According to the Kingsland family income data, there are 46 families falling into the $25,000 to $34,999 income range, which is the most common income bracket and makes up 46.9% of all families.
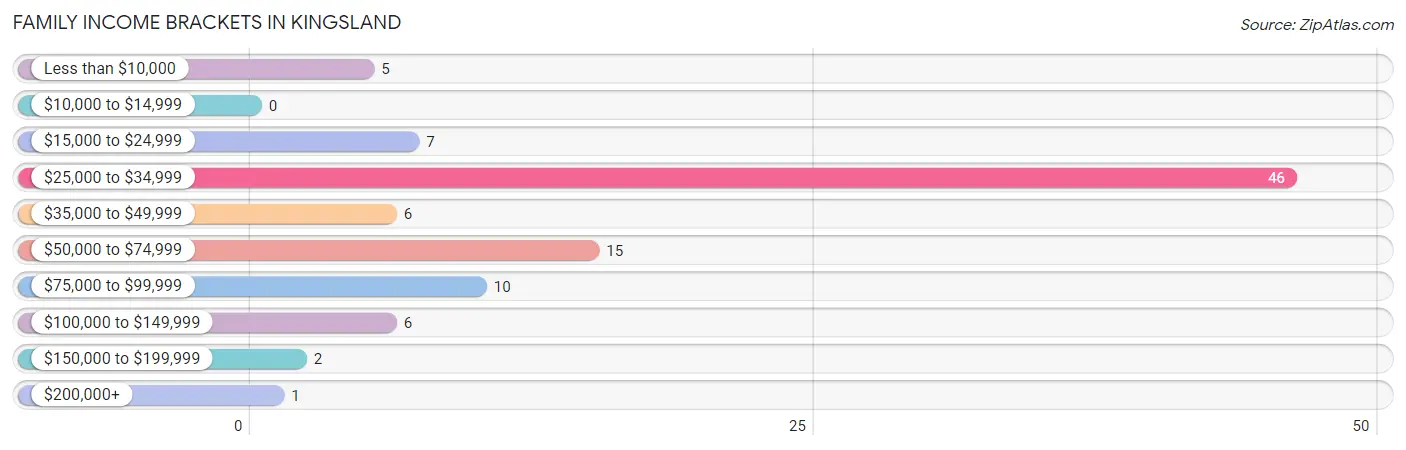
| Income Bracket | # Families | % Families |
| Less than $10,000 | 5 | 5.1% |
| $10,000 to $14,999 | 0 | 0.0% |
| $15,000 to $24,999 | 7 | 7.1% |
| $25,000 to $34,999 | 46 | 46.9% |
| $35,000 to $49,999 | 6 | 6.1% |
| $50,000 to $74,999 | 15 | 15.3% |
| $75,000 to $99,999 | 10 | 10.2% |
| $100,000 to $149,999 | 6 | 6.1% |
| $150,000 to $199,999 | 2 | 2.0% |
| $200,000+ | 1 | 1.0% |
Family Income by Famaliy Size in Kingsland
2-person families (57 | 58.2%) account for the highest median family income in Kingsland with $33,438 per family, while 2-person families (57 | 58.2%) have the highest median income of $16,719 per family member.
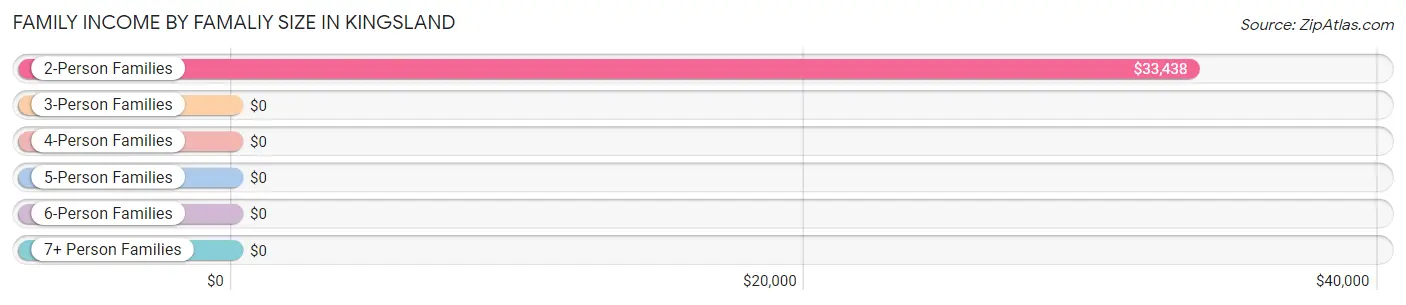
| Income Bracket | # Families | Median Income |
| 2-Person Families | 57 (58.2%) | $33,438 |
| 3-Person Families | 21 (21.4%) | $0 |
| 4-Person Families | 8 (8.2%) | $0 |
| 5-Person Families | 12 (12.2%) | $0 |
| 6-Person Families | 0 (0.0%) | $0 |
| 7+ Person Families | 0 (0.0%) | $0 |
| Total | 98 (100.0%) | $29,318 |
Family Income by Number of Earners in Kingsland
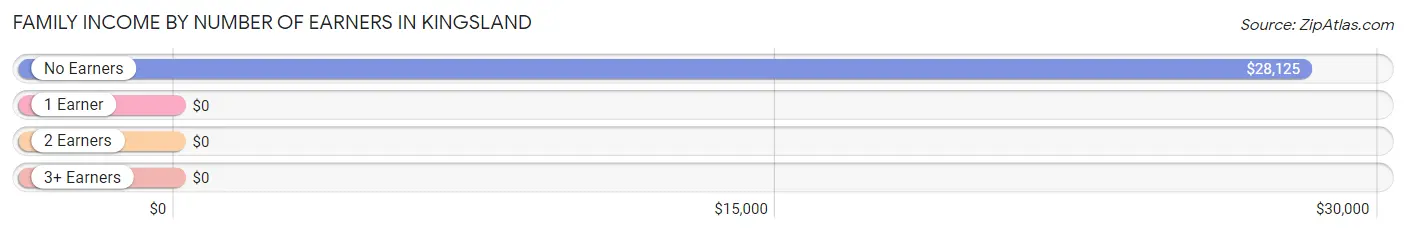
| Number of Earners | # Families | Median Income |
| No Earners | 19 (19.4%) | $28,125 |
| 1 Earner | 40 (40.8%) | $0 |
| 2 Earners | 39 (39.8%) | $0 |
| 3+ Earners | 0 (0.0%) | $0 |
| Total | 98 (100.0%) | $29,318 |
Household Income in Kingsland
Household Income Brackets in Kingsland
With 54 households falling in the category, the $25,000 to $34,999 income range is the most frequent in Kingsland, accounting for 30.2% of all households. In contrast, only 1 households (0.6%) fall into the $200,000+ income bracket, making it the least populous group.
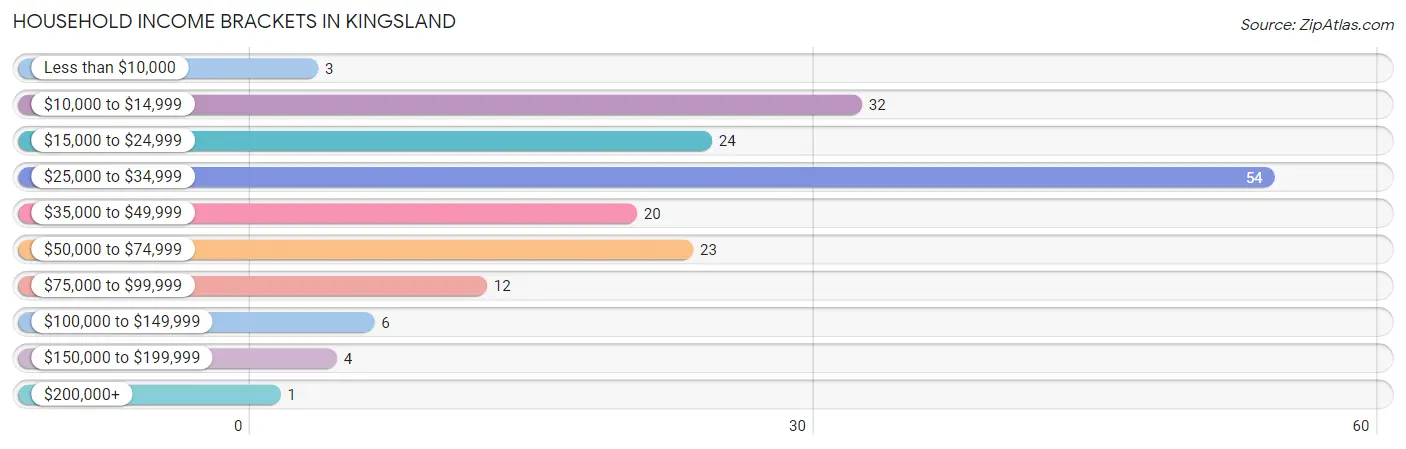
| Income Bracket | # Households | % Households |
| Less than $10,000 | 3 | 1.7% |
| $10,000 to $14,999 | 32 | 17.9% |
| $15,000 to $24,999 | 24 | 13.4% |
| $25,000 to $34,999 | 54 | 30.2% |
| $35,000 to $49,999 | 20 | 11.2% |
| $50,000 to $74,999 | 23 | 12.8% |
| $75,000 to $99,999 | 12 | 6.7% |
| $100,000 to $149,999 | 6 | 3.4% |
| $150,000 to $199,999 | 4 | 2.2% |
| $200,000+ | 1 | 0.6% |
Household Income by Householder Age in Kingsland
The median household income in Kingsland is $27,583, with the highest median household income of $50,625 found in the 15 to 24 years age bracket for the primary householder. A total of 9 households (5.0%) fall into this category. Meanwhile, the 45 to 64 years age bracket for the primary householder has the lowest median household income of $0, with 79 households (44.1%) in this group.
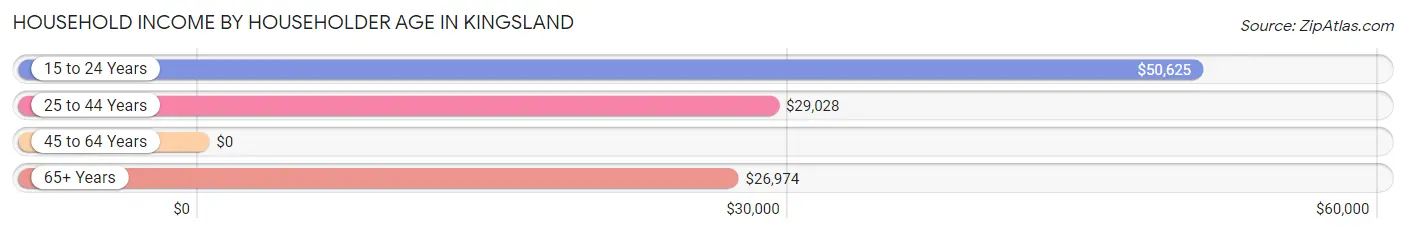
| Income Bracket | # Households | Median Income |
| 15 to 24 Years | 9 (5.0%) | $50,625 |
| 25 to 44 Years | 43 (24.0%) | $29,028 |
| 45 to 64 Years | 79 (44.1%) | $0 |
| 65+ Years | 48 (26.8%) | $26,974 |
| Total | 179 (100.0%) | $27,583 |
Poverty in Kingsland
Income Below Poverty by Sex and Age in Kingsland
With 23.3% poverty level for males and 25.1% for females among the residents of Kingsland, 15 year old males and under 5 year old females are the most vulnerable to poverty, with 10 males (100.0%) and 1 females (100.0%) in their respective age groups living below the poverty level.
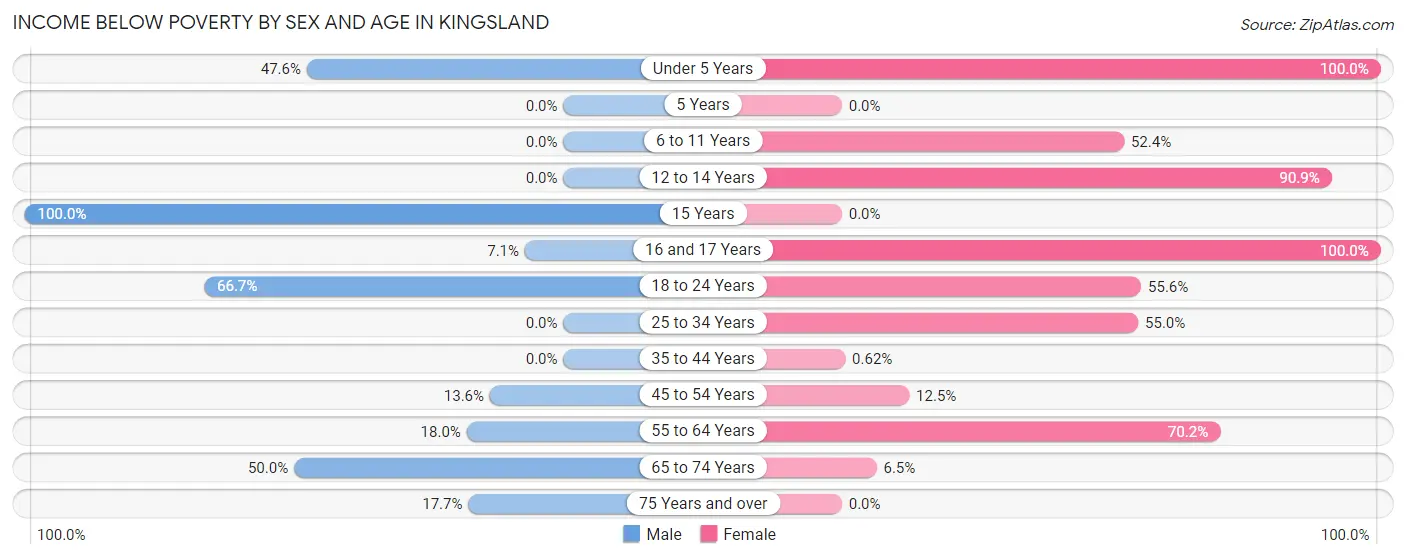
| Age Bracket | Male | Female |
| Under 5 Years | 10 (47.6%) | 1 (100.0%) |
| 5 Years | 0 (0.0%) | 0 (0.0%) |
| 6 to 11 Years | 0 (0.0%) | 22 (52.4%) |
| 12 to 14 Years | 0 (0.0%) | 10 (90.9%) |
| 15 Years | 10 (100.0%) | 0 (0.0%) |
| 16 and 17 Years | 1 (7.1%) | 1 (100.0%) |
| 18 to 24 Years | 2 (66.7%) | 5 (55.6%) |
| 25 to 34 Years | 0 (0.0%) | 11 (55.0%) |
| 35 to 44 Years | 0 (0.0%) | 1 (0.6%) |
| 45 to 54 Years | 3 (13.6%) | 2 (12.5%) |
| 55 to 64 Years | 7 (17.9%) | 33 (70.2%) |
| 65 to 74 Years | 5 (50.0%) | 2 (6.5%) |
| 75 Years and over | 3 (17.6%) | 0 (0.0%) |
| Total | 41 (23.3%) | 88 (25.1%) |
Income Above Poverty by Sex and Age in Kingsland
According to the poverty statistics in Kingsland, males aged 6 to 11 years and females aged 15 years are the age groups that are most secure financially, with 100.0% of males and 100.0% of females in these age groups living above the poverty line.
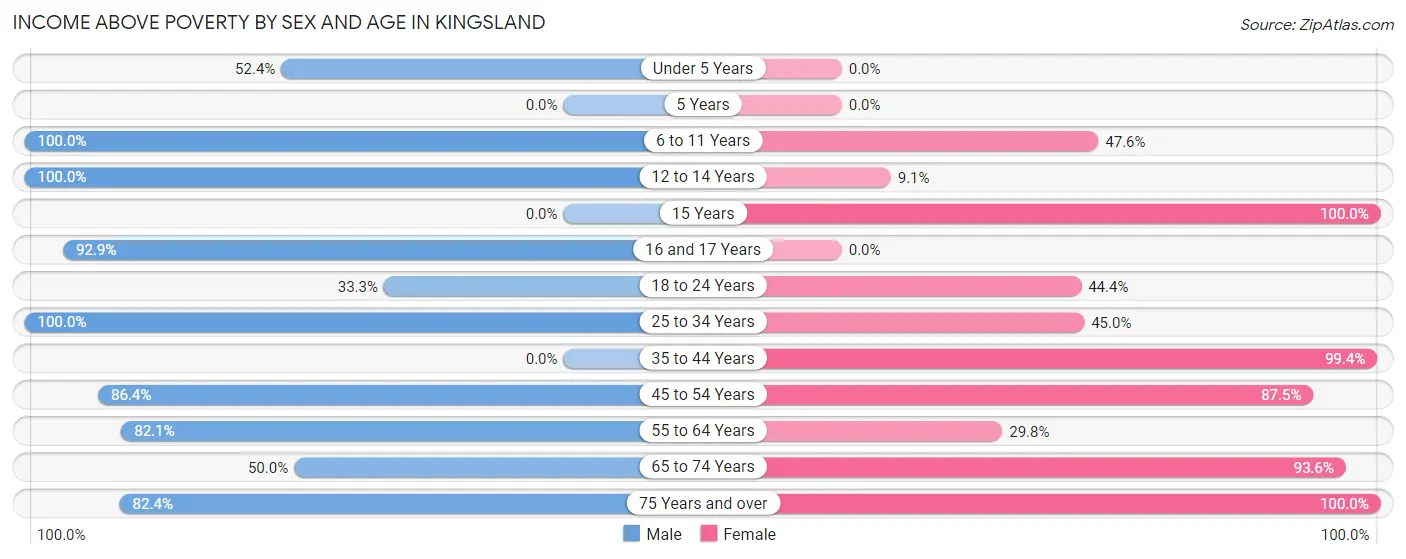
| Age Bracket | Male | Female |
| Under 5 Years | 11 (52.4%) | 0 (0.0%) |
| 5 Years | 0 (0.0%) | 0 (0.0%) |
| 6 to 11 Years | 6 (100.0%) | 20 (47.6%) |
| 12 to 14 Years | 4 (100.0%) | 1 (9.1%) |
| 15 Years | 0 (0.0%) | 3 (100.0%) |
| 16 and 17 Years | 13 (92.9%) | 0 (0.0%) |
| 18 to 24 Years | 1 (33.3%) | 4 (44.4%) |
| 25 to 34 Years | 30 (100.0%) | 9 (45.0%) |
| 35 to 44 Years | 0 (0.0%) | 160 (99.4%) |
| 45 to 54 Years | 19 (86.4%) | 14 (87.5%) |
| 55 to 64 Years | 32 (82.1%) | 14 (29.8%) |
| 65 to 74 Years | 5 (50.0%) | 29 (93.5%) |
| 75 Years and over | 14 (82.4%) | 9 (100.0%) |
| Total | 135 (76.7%) | 263 (74.9%) |
Income Below Poverty Among Married-Couple Families in Kingsland
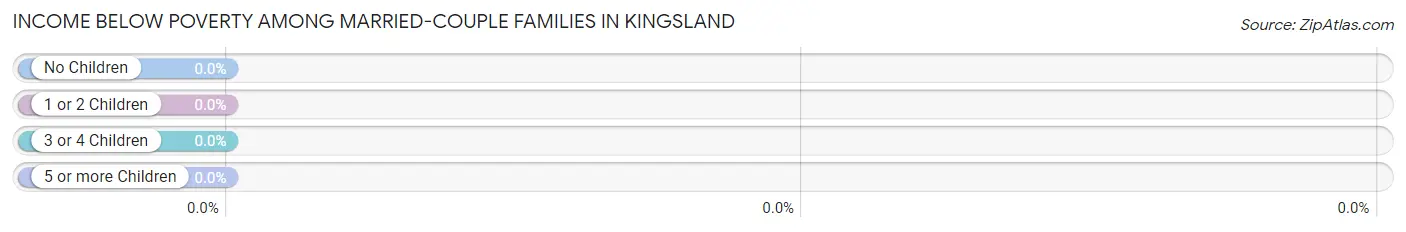
| Children | Above Poverty | Below Poverty |
| No Children | 34 (100.0%) | 0 (0.0%) |
| 1 or 2 Children | 8 (100.0%) | 0 (0.0%) |
| 3 or 4 Children | 2 (100.0%) | 0 (0.0%) |
| 5 or more Children | 0 (0.0%) | 0 (0.0%) |
| Total | 44 (100.0%) | 0 (0.0%) |
Income Below Poverty Among Single-Parent Households in Kingsland
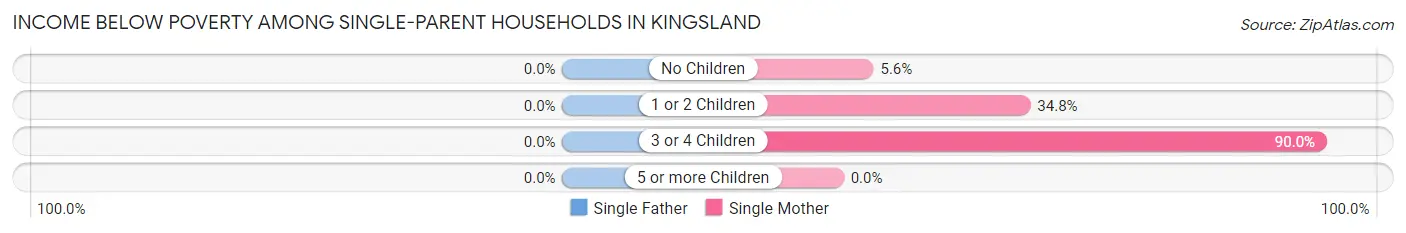
| Children | Single Father | Single Mother |
| No Children | 0 (0.0%) | 1 (5.6%) |
| 1 or 2 Children | 0 (0.0%) | 8 (34.8%) |
| 3 or 4 Children | 0 (0.0%) | 9 (90.0%) |
| 5 or more Children | 0 (0.0%) | 0 (0.0%) |
| Total | 0 (0.0%) | 18 (35.3%) |
Income Below Poverty Among Married-Couple vs Single-Parent Households in Kingsland
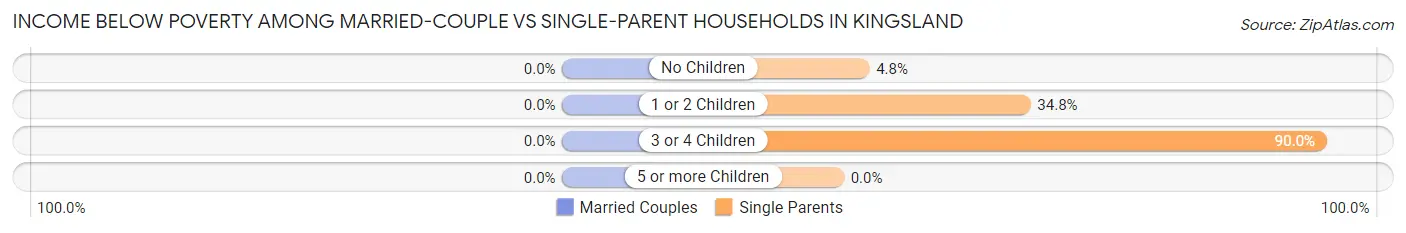
| Children | Married-Couple Families | Single-Parent Households |
| No Children | 0 (0.0%) | 1 (4.8%) |
| 1 or 2 Children | 0 (0.0%) | 8 (34.8%) |
| 3 or 4 Children | 0 (0.0%) | 9 (90.0%) |
| 5 or more Children | 0 (0.0%) | 0 (0.0%) |
| Total | 0 (0.0%) | 18 (33.3%) |
Race in Kingsland
The most populous races in Kingsland are Black / African American (302 | 57.1%), White / Caucasian (223 | 42.2%), and Native / Alaskan (2 | 0.4%).
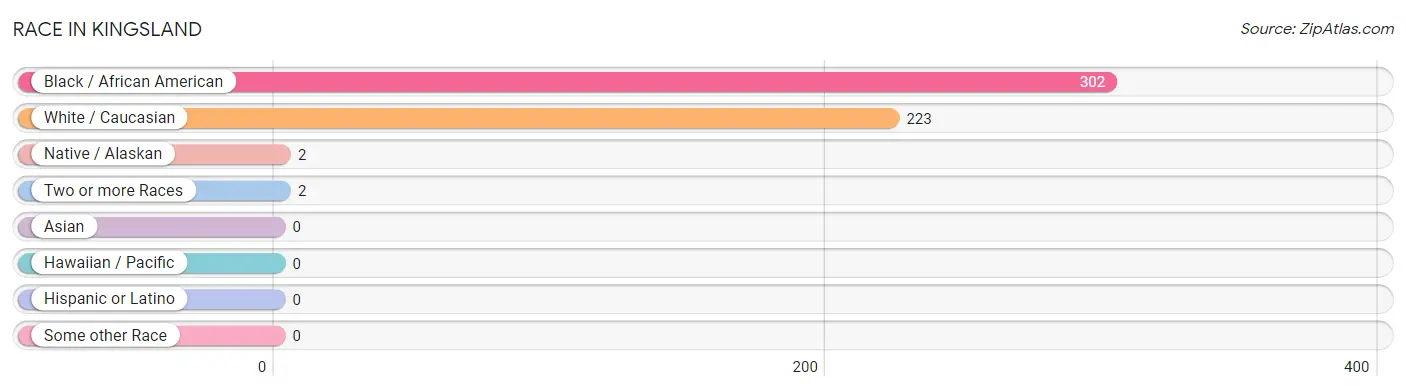
| Race | # Population | % Population |
| Asian | 0 | 0.0% |
| Black / African American | 302 | 57.1% |
| Hawaiian / Pacific | 0 | 0.0% |
| Hispanic or Latino | 0 | 0.0% |
| Native / Alaskan | 2 | 0.4% |
| White / Caucasian | 223 | 42.2% |
| Two or more Races | 2 | 0.4% |
| Some other Race | 0 | 0.0% |
| Total | 529 | 100.0% |
Ancestry in Kingsland
The most populous ancestries reported in Kingsland are Irish (60 | 11.3%), American (39 | 7.4%), English (20 | 3.8%), German (16 | 3.0%), and Italian (14 | 2.6%), together accounting for 28.2% of all Kingsland residents.
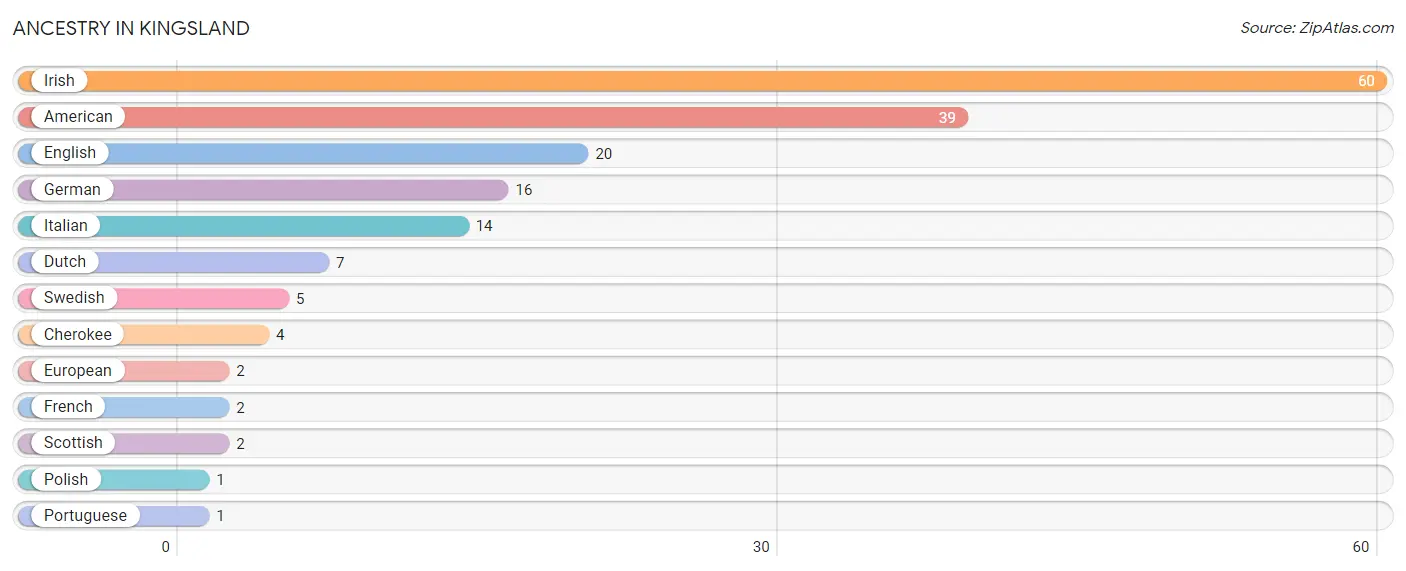
| Ancestry | # Population | % Population |
| American | 39 | 7.4% |
| Cherokee | 4 | 0.8% |
| Dutch | 7 | 1.3% |
| English | 20 | 3.8% |
| European | 2 | 0.4% |
| French | 2 | 0.4% |
| German | 16 | 3.0% |
| Irish | 60 | 11.3% |
| Italian | 14 | 2.6% |
| Polish | 1 | 0.2% |
| Portuguese | 1 | 0.2% |
| Scottish | 2 | 0.4% |
| Swedish | 5 | 0.9% | View All 13 Rows |
Immigrants in Kingsland

| Immigration Origin | # Population | % Population | View All 0 Rows |
Sex and Age in Kingsland
Sex and Age in Kingsland
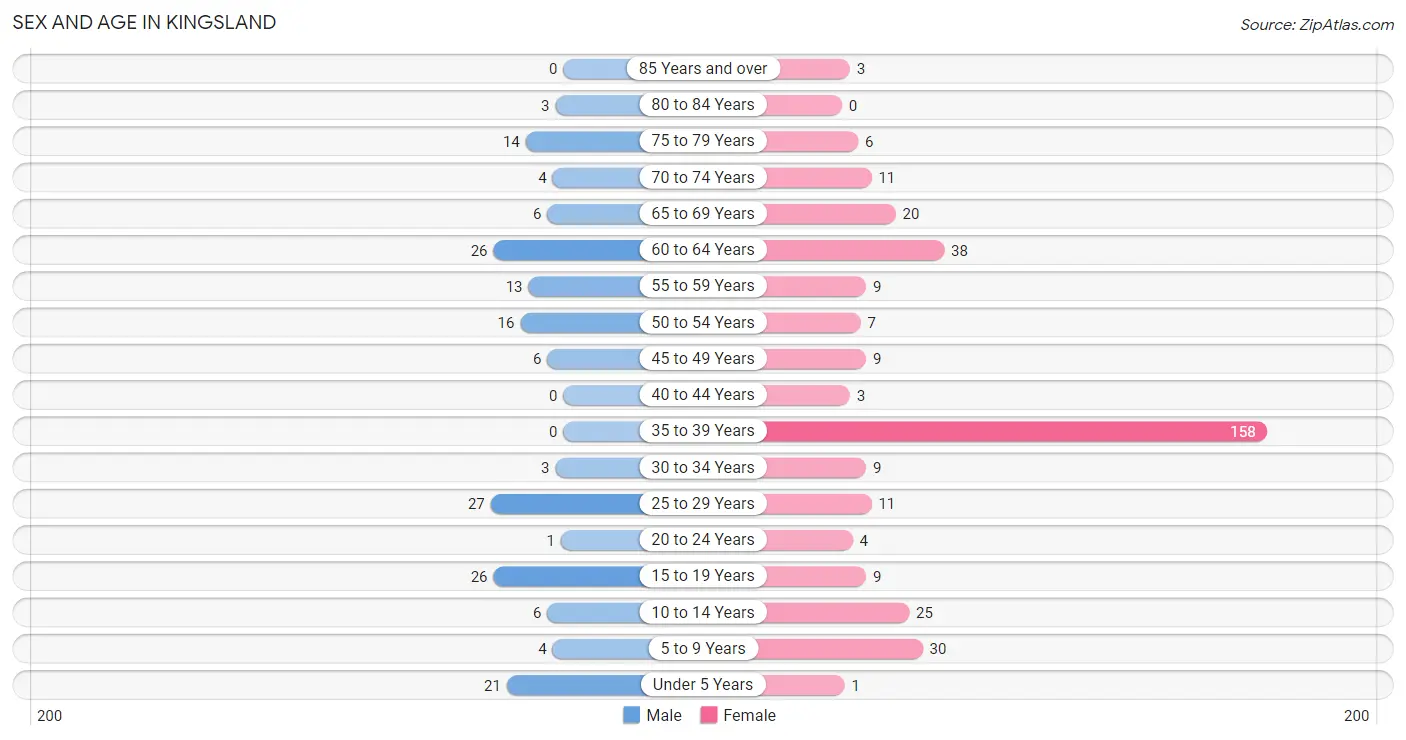
The most populous age groups in Kingsland are 25 to 29 Years (27 | 15.3%) for men and 35 to 39 Years (158 | 44.8%) for women.
| Age Bracket | Male | Female |
| Under 5 Years | 21 (11.9%) | 1 (0.3%) |
| 5 to 9 Years | 4 (2.3%) | 30 (8.5%) |
| 10 to 14 Years | 6 (3.4%) | 25 (7.1%) |
| 15 to 19 Years | 26 (14.8%) | 9 (2.5%) |
| 20 to 24 Years | 1 (0.6%) | 4 (1.1%) |
| 25 to 29 Years | 27 (15.3%) | 11 (3.1%) |
| 30 to 34 Years | 3 (1.7%) | 9 (2.5%) |
| 35 to 39 Years | 0 (0.0%) | 158 (44.8%) |
| 40 to 44 Years | 0 (0.0%) | 3 (0.9%) |
| 45 to 49 Years | 6 (3.4%) | 9 (2.5%) |
| 50 to 54 Years | 16 (9.1%) | 7 (2.0%) |
| 55 to 59 Years | 13 (7.4%) | 9 (2.5%) |
| 60 to 64 Years | 26 (14.8%) | 38 (10.8%) |
| 65 to 69 Years | 6 (3.4%) | 20 (5.7%) |
| 70 to 74 Years | 4 (2.3%) | 11 (3.1%) |
| 75 to 79 Years | 14 (8.0%) | 6 (1.7%) |
| 80 to 84 Years | 3 (1.7%) | 0 (0.0%) |
| 85 Years and over | 0 (0.0%) | 3 (0.9%) |
| Total | 176 (100.0%) | 353 (100.0%) |
Families and Households in Kingsland
Median Family Size in Kingsland
The median family size in Kingsland is 4.37 persons per family, with single female/mother families (51 | 52.0%) accounting for the largest median family size of 5.69 persons per family. On the other hand, single male/father families (3 | 3.1%) represent the smallest median family size with 1.33 persons per family.
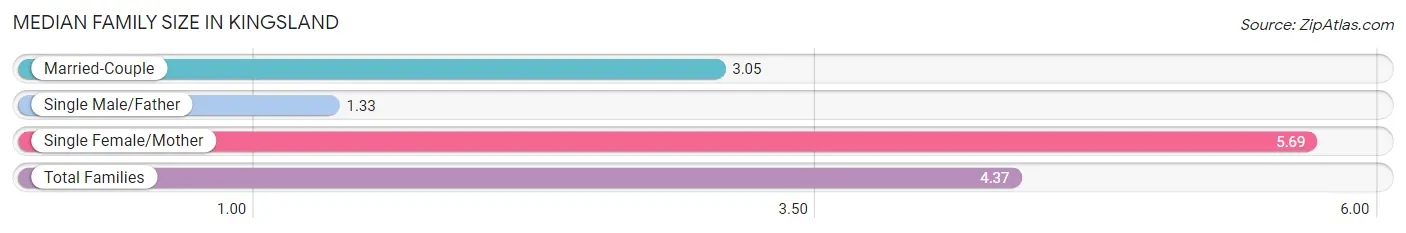
| Family Type | # Families | Family Size |
| Married-Couple | 44 (44.9%) | 3.05 |
| Single Male/Father | 3 (3.1%) | 1.33 |
| Single Female/Mother | 51 (52.0%) | 5.69 |
| Total Families | 98 (100.0%) | 4.37 |
Median Household Size in Kingsland
The median household size in Kingsland is 2.96 persons per household, with single female/mother households (51 | 28.5%) accounting for the largest median household size of 5.92 persons per household. non-family households (81 | 45.3%) represent the smallest median household size with 1.10 persons per household.
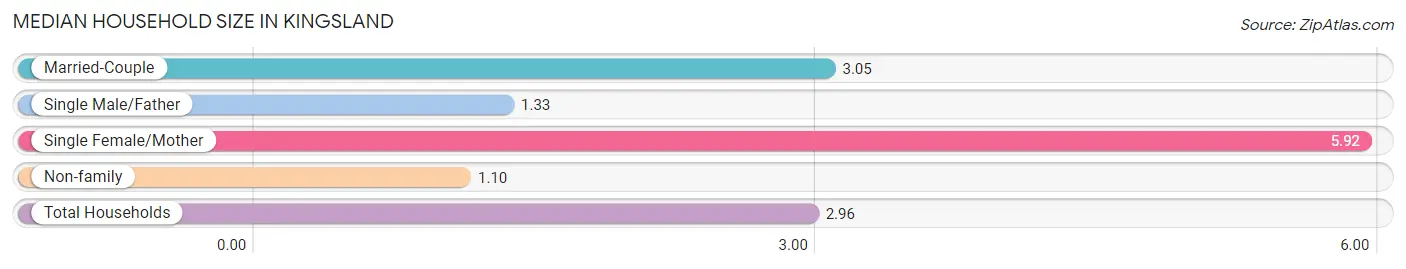
| Household Type | # Households | Household Size |
| Married-Couple | 44 (24.6%) | 3.05 |
| Single Male/Father | 3 (1.7%) | 1.33 |
| Single Female/Mother | 51 (28.5%) | 5.92 |
| Non-family | 81 (45.3%) | 1.10 |
| Total Households | 179 (100.0%) | 2.96 |
Household Size by Marriage Status in Kingsland
Out of a total of 179 households in Kingsland, 98 (54.7%) are family households, while 81 (45.3%) are nonfamily households. The most numerous type of family households are 2-person households, comprising 55, and the most common type of nonfamily households are 1-person households, comprising 74.
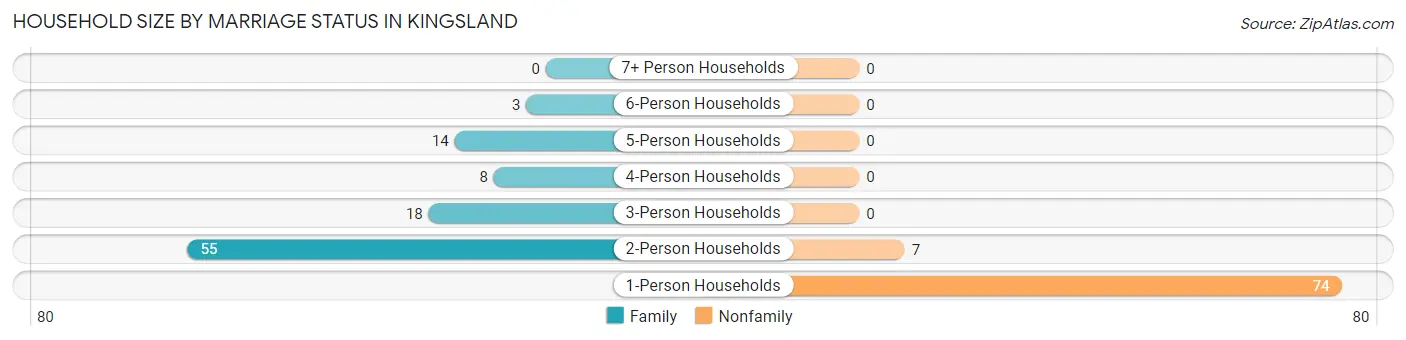
| Household Size | Family Households | Nonfamily Households |
| 1-Person Households | - | 74 (41.3%) |
| 2-Person Households | 55 (30.7%) | 7 (3.9%) |
| 3-Person Households | 18 (10.1%) | 0 (0.0%) |
| 4-Person Households | 8 (4.5%) | 0 (0.0%) |
| 5-Person Households | 14 (7.8%) | 0 (0.0%) |
| 6-Person Households | 3 (1.7%) | 0 (0.0%) |
| 7+ Person Households | 0 (0.0%) | 0 (0.0%) |
| Total | 98 (54.7%) | 81 (45.3%) |
Female Fertility in Kingsland
Fertility by Age in Kingsland
Average fertility rate in Kingsland is 49.0 births per 1,000 women. Women in the age bracket of 15 to 19 years have the highest fertility rate with 556.0 births per 1,000 women. Women in the age bracket of 15 to 19 years acount for 50.0% of all women with births.
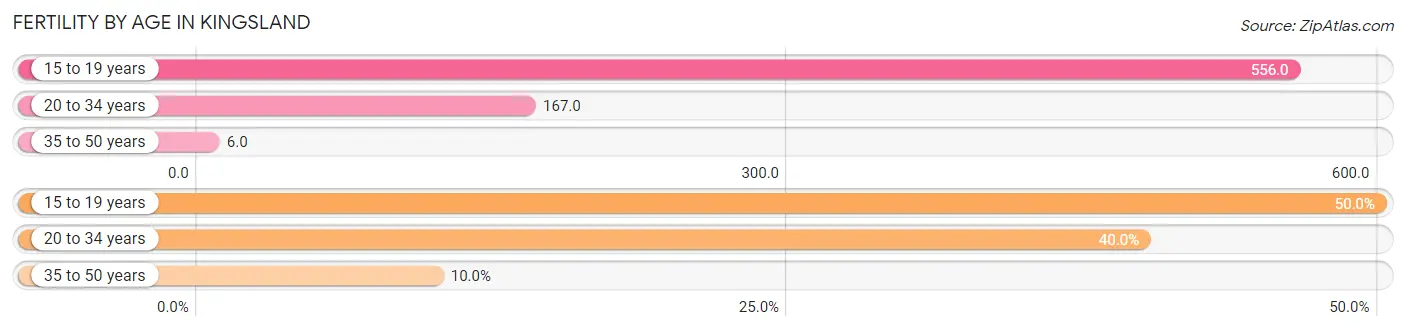
| Age Bracket | Women with Births | Births / 1,000 Women |
| 15 to 19 years | 5 (50.0%) | 556.0 |
| 20 to 34 years | 4 (40.0%) | 167.0 |
| 35 to 50 years | 1 (10.0%) | 6.0 |
| Total | 10 (100.0%) | 49.0 |
Fertility by Age by Marriage Status in Kingsland
20.0% of women with births (10) in Kingsland are married. The highest percentage of unmarried women with births falls into 15 to 19 years age bracket with 100.0% of them unmarried at the time of birth, while the lowest percentage of unmarried women with births belong to 20 to 34 years age bracket with 50.0% of them unmarried.
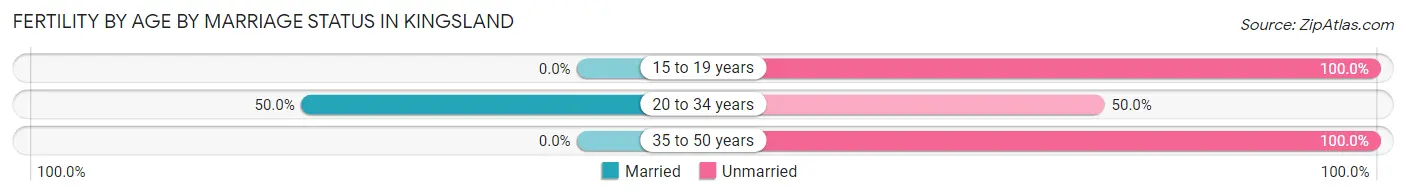
| Age Bracket | Married | Unmarried |
| 15 to 19 years | 0 (0.0%) | 5 (100.0%) |
| 20 to 34 years | 2 (50.0%) | 2 (50.0%) |
| 35 to 50 years | 0 (0.0%) | 1 (100.0%) |
| Total | 2 (20.0%) | 8 (80.0%) |
Fertility by Education in Kingsland
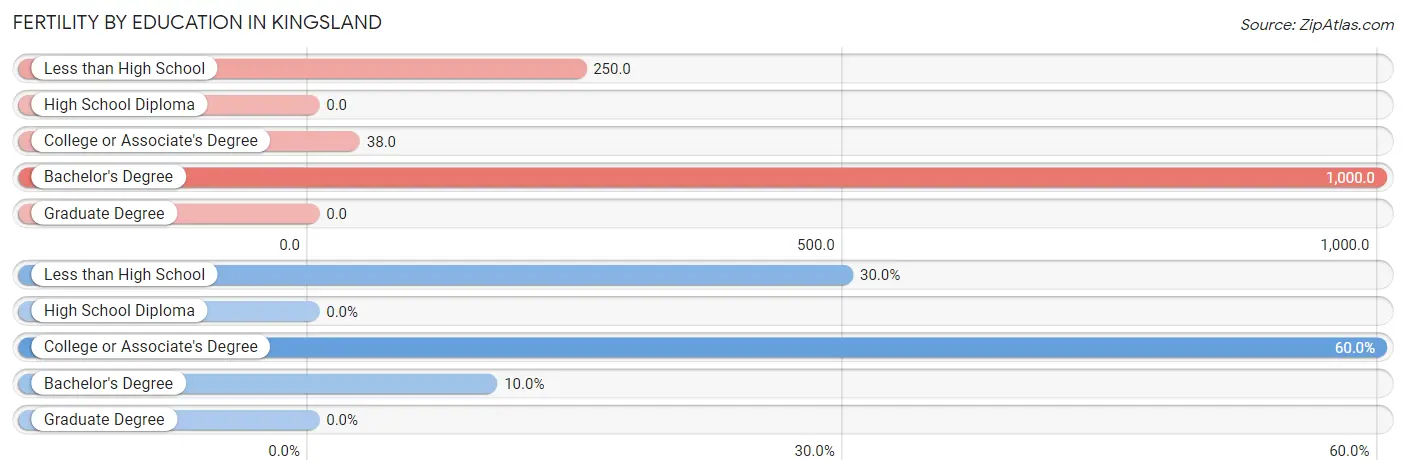
| Educational Attainment | Women with Births | Births / 1,000 Women |
| Less than High School | 3 (30.0%) | 250.0 |
| High School Diploma | 0 (0.0%) | 0.0 |
| College or Associate's Degree | 6 (60.0%) | 38.0 |
| Bachelor's Degree | 1 (10.0%) | 1,000.0 |
| Graduate Degree | 0 (0.0%) | 0.0 |
| Total | 10 (100.0%) | 49.0 |
Fertility by Education by Marriage Status in Kingsland
80.0% of women with births in Kingsland are unmarried. Women with the educational attainment of college or associate's degree are most likely to be married with 33.3% of them married at childbirth, while women with the educational attainment of less than high school are least likely to be married with 100.0% of them unmarried at childbirth.
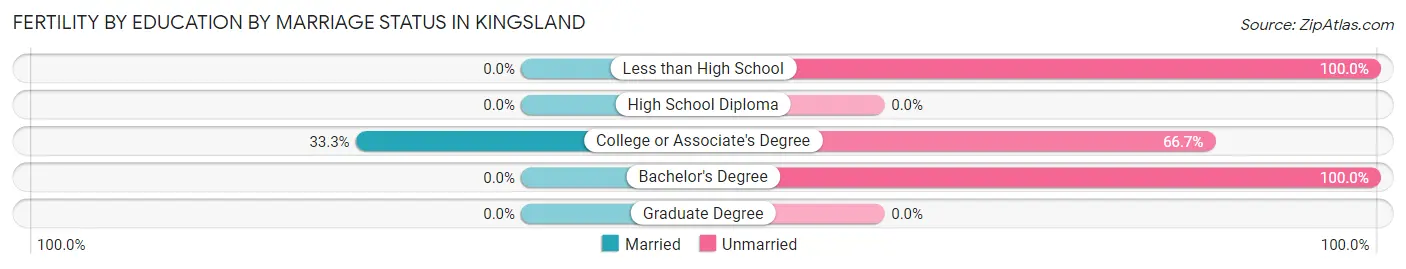
| Educational Attainment | Married | Unmarried |
| Less than High School | 0 (0.0%) | 3 (100.0%) |
| High School Diploma | 0 (0.0%) | 0 (0.0%) |
| College or Associate's Degree | 2 (33.3%) | 4 (66.7%) |
| Bachelor's Degree | 0 (0.0%) | 1 (100.0%) |
| Graduate Degree | 0 (0.0%) | 0 (0.0%) |
| Total | 2 (20.0%) | 8 (80.0%) |
Employment Characteristics in Kingsland
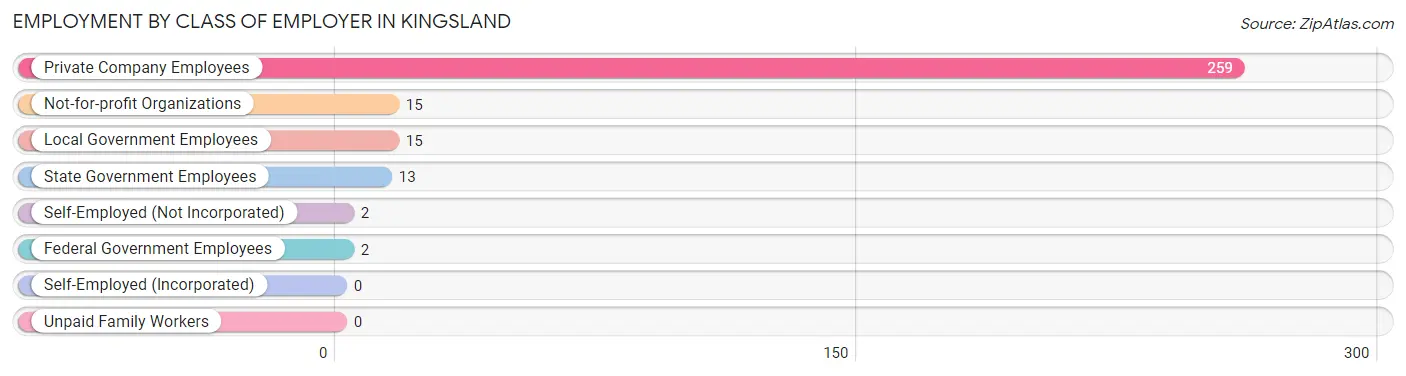
Employment by Class of Employer in Kingsland
Among the 306 employed individuals in Kingsland, private company employees (259 | 84.6%), not-for-profit organizations (15 | 4.9%), and local government employees (15 | 4.9%) make up the most common classes of employment.
| Employer Class | # Employees | % Employees |
| Private Company Employees | 259 | 84.6% |
| Self-Employed (Incorporated) | 0 | 0.0% |
| Self-Employed (Not Incorporated) | 2 | 0.6% |
| Not-for-profit Organizations | 15 | 4.9% |
| Local Government Employees | 15 | 4.9% |
| State Government Employees | 13 | 4.3% |
| Federal Government Employees | 2 | 0.6% |
| Unpaid Family Workers | 0 | 0.0% |
| Total | 306 | 100.0% |
Employment Status by Age in Kingsland

| Age Bracket | In Labor Force | Unemployed |
| 16 to 19 Years | 12 (54.5%) | 0 (0.0%) |
| 20 to 24 Years | 5 (100.0%) | 0 (0.0%) |
| 25 to 29 Years | 36 (94.7%) | 0 (0.0%) |
| 30 to 34 Years | 12 (100.0%) | 0 (0.0%) |
| 35 to 44 Years | 156 (96.9%) | 0 (0.0%) |
| 45 to 54 Years | 24 (63.2%) | 0 (0.0%) |
| 55 to 59 Years | 5 (22.7%) | 0 (0.0%) |
| 60 to 64 Years | 37 (57.8%) | 0 (0.0%) |
| 65 to 74 Years | 14 (34.1%) | 0 (0.0%) |
| 75 Years and over | 5 (19.2%) | 0 (0.0%) |
| Total | 306 (71.3%) | 0 (0.0%) |
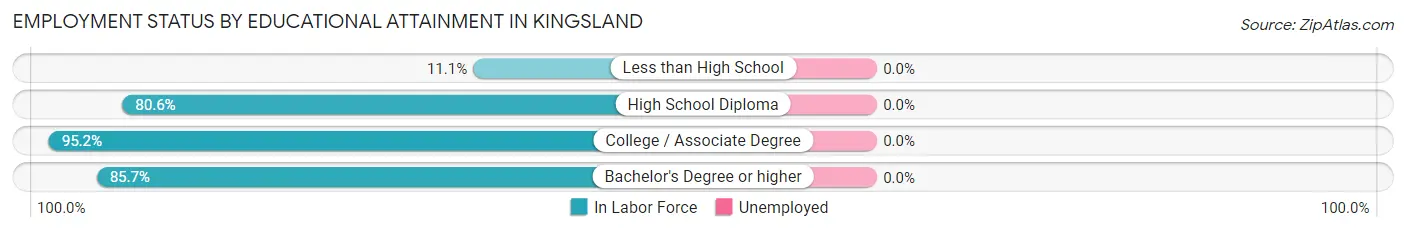
Employment Status by Educational Attainment in Kingsland
| Educational Attainment | In Labor Force | Unemployed |
| Less than High School | 4 (11.1%) | 0 (0.0%) |
| High School Diploma | 100 (80.6%) | 0 (0.0%) |
| College / Associate Degree | 160 (95.2%) | 0 (0.0%) |
| Bachelor's Degree or higher | 6 (85.7%) | 0 (0.0%) |
| Total | 270 (80.6%) | 0 (0.0%) |
Employment Occupations by Sex in Kingsland
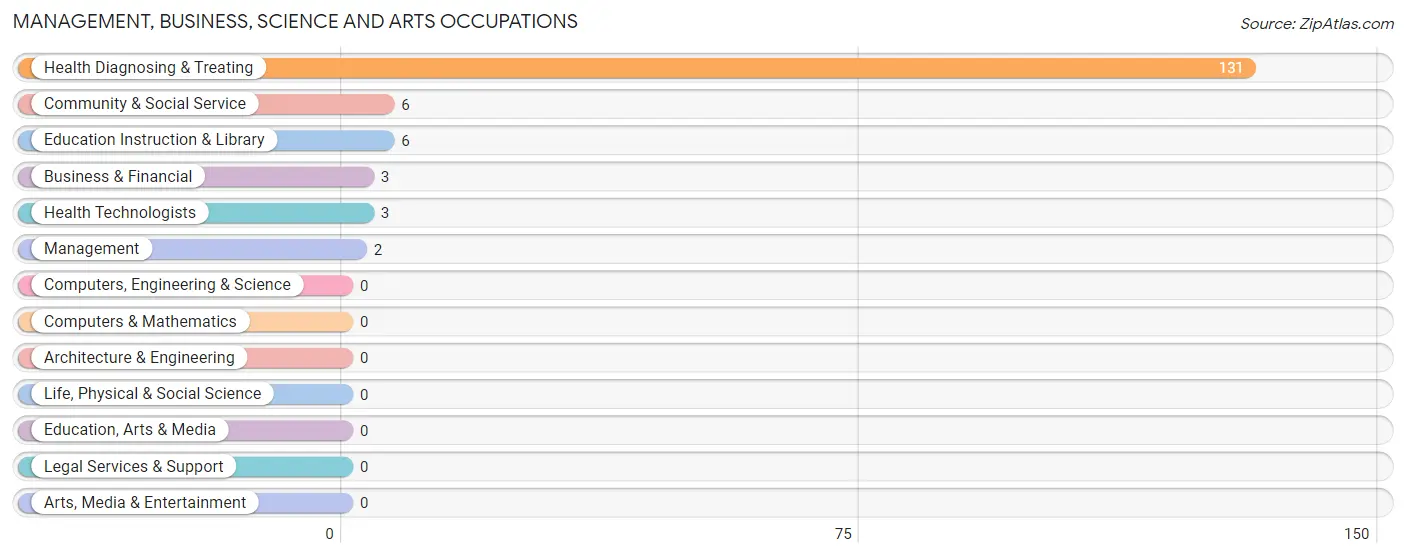
Management, Business, Science and Arts Occupations
The most common Management, Business, Science and Arts occupations in Kingsland are Health Diagnosing & Treating (131 | 42.8%), Community & Social Service (6 | 2.0%), Education Instruction & Library (6 | 2.0%), Business & Financial (3 | 1.0%), and Health Technologists (3 | 1.0%).
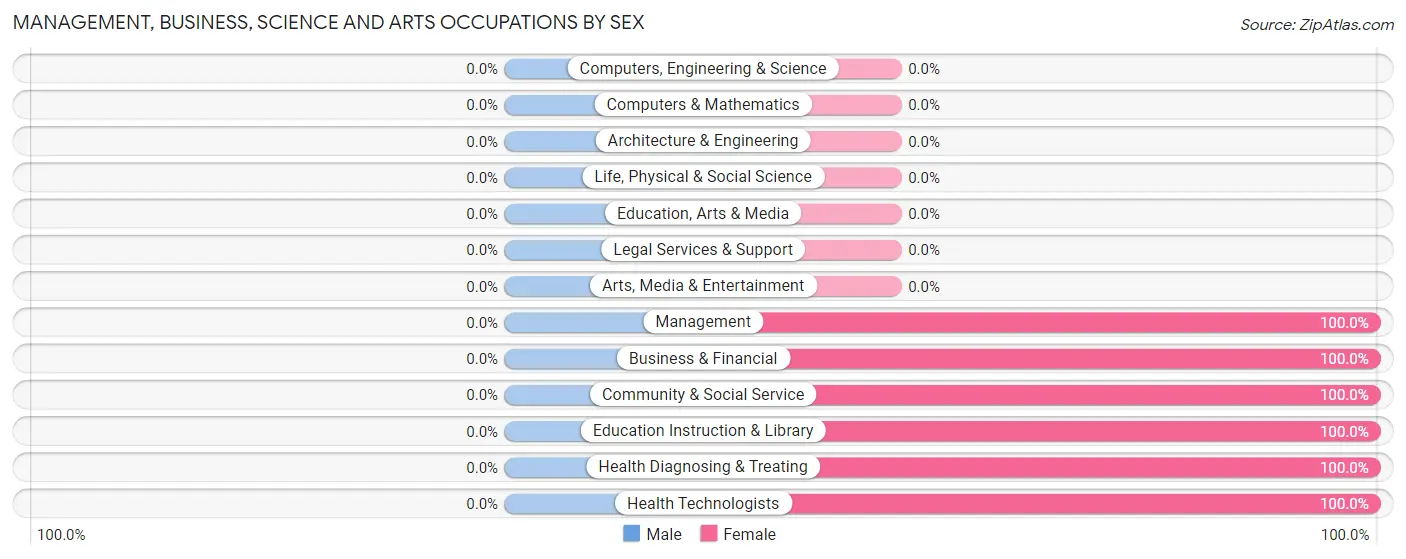
Management, Business, Science and Arts Occupations by Sex
| Occupation | Male | Female |
| Management | 0 (0.0%) | 2 (100.0%) |
| Business & Financial | 0 (0.0%) | 3 (100.0%) |
| Computers, Engineering & Science | 0 (0.0%) | 0 (0.0%) |
| Computers & Mathematics | 0 (0.0%) | 0 (0.0%) |
| Architecture & Engineering | 0 (0.0%) | 0 (0.0%) |
| Life, Physical & Social Science | 0 (0.0%) | 0 (0.0%) |
| Community & Social Service | 0 (0.0%) | 6 (100.0%) |
| Education, Arts & Media | 0 (0.0%) | 0 (0.0%) |
| Legal Services & Support | 0 (0.0%) | 0 (0.0%) |
| Education Instruction & Library | 0 (0.0%) | 6 (100.0%) |
| Arts, Media & Entertainment | 0 (0.0%) | 0 (0.0%) |
| Health Diagnosing & Treating | 0 (0.0%) | 131 (100.0%) |
| Health Technologists | 0 (0.0%) | 3 (100.0%) |
| Total (Category) | 0 (0.0%) | 142 (100.0%) |
| Total (Overall) | 57 (18.6%) | 249 (81.4%) |
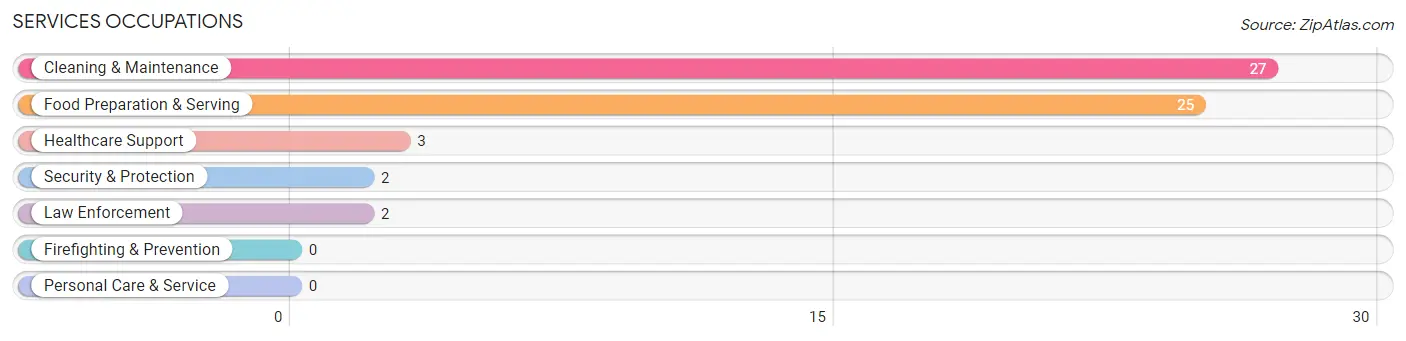
Services Occupations
The most common Services occupations in Kingsland are Cleaning & Maintenance (27 | 8.8%), Food Preparation & Serving (25 | 8.2%), Healthcare Support (3 | 1.0%), Security & Protection (2 | 0.6%), and Law Enforcement (2 | 0.6%).
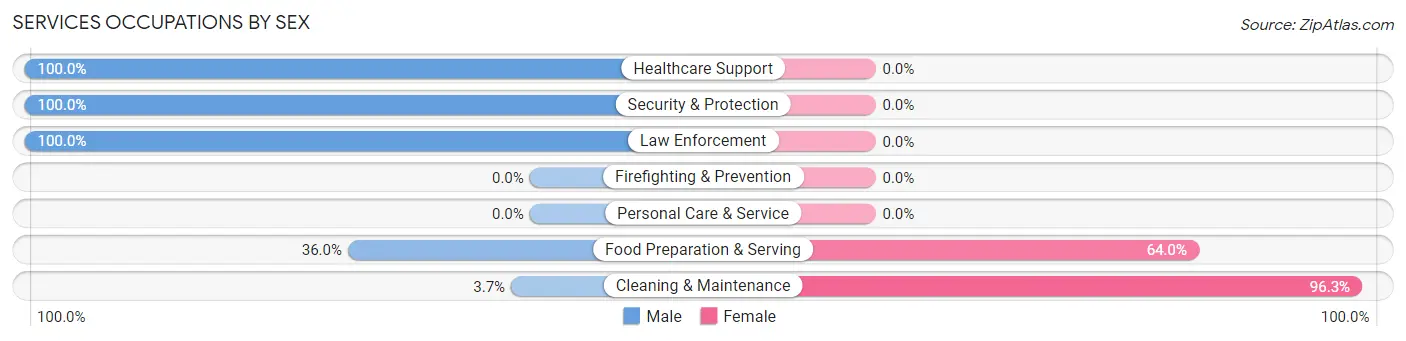
Services Occupations by Sex
Within the Services occupations in Kingsland, the most male-oriented occupations are Healthcare Support (100.0%), Security & Protection (100.0%), and Law Enforcement (100.0%), while the most female-oriented occupations are Cleaning & Maintenance (96.3%), and Food Preparation & Serving (64.0%).
| Occupation | Male | Female |
| Healthcare Support | 3 (100.0%) | 0 (0.0%) |
| Security & Protection | 2 (100.0%) | 0 (0.0%) |
| Firefighting & Prevention | 0 (0.0%) | 0 (0.0%) |
| Law Enforcement | 2 (100.0%) | 0 (0.0%) |
| Food Preparation & Serving | 9 (36.0%) | 16 (64.0%) |
| Cleaning & Maintenance | 1 (3.7%) | 26 (96.3%) |
| Personal Care & Service | 0 (0.0%) | 0 (0.0%) |
| Total (Category) | 15 (26.3%) | 42 (73.7%) |
| Total (Overall) | 57 (18.6%) | 249 (81.4%) |
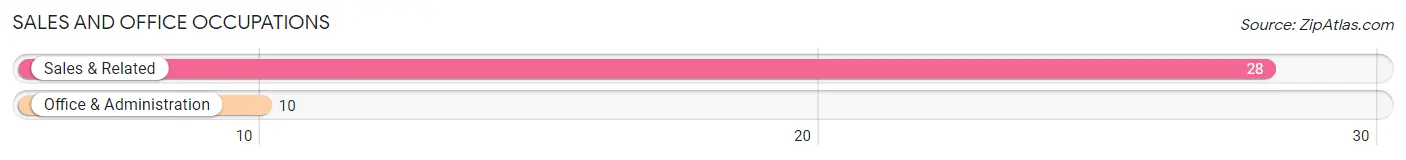
Sales and Office Occupations
The most common Sales and Office occupations in Kingsland are Sales & Related (28 | 9.1%), and Office & Administration (10 | 3.3%).
Sales and Office Occupations by Sex
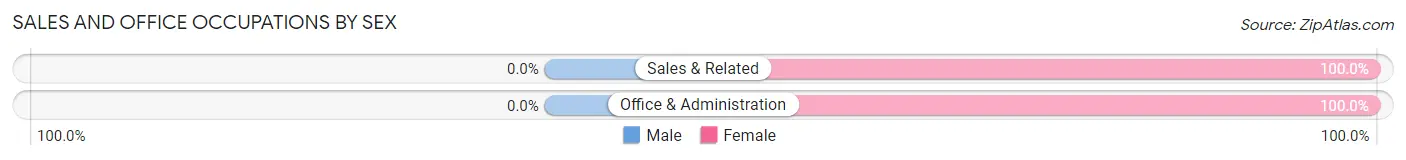
| Occupation | Male | Female |
| Sales & Related | 0 (0.0%) | 28 (100.0%) |
| Office & Administration | 0 (0.0%) | 10 (100.0%) |
| Total (Category) | 0 (0.0%) | 38 (100.0%) |
| Total (Overall) | 57 (18.6%) | 249 (81.4%) |
Natural Resources, Construction and Maintenance Occupations
The most common Natural Resources, Construction and Maintenance occupations in Kingsland are , and Installation, Maintenance & Repair (7 | 2.3%).

Natural Resources, Construction and Maintenance Occupations by Sex
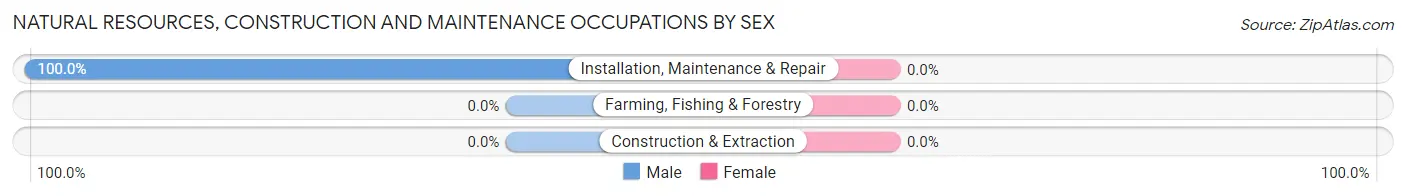
| Occupation | Male | Female |
| Farming, Fishing & Forestry | 0 (0.0%) | 0 (0.0%) |
| Construction & Extraction | 0 (0.0%) | 0 (0.0%) |
| Installation, Maintenance & Repair | 7 (100.0%) | 0 (0.0%) |
| Total (Category) | 7 (100.0%) | 0 (0.0%) |
| Total (Overall) | 57 (18.6%) | 249 (81.4%) |
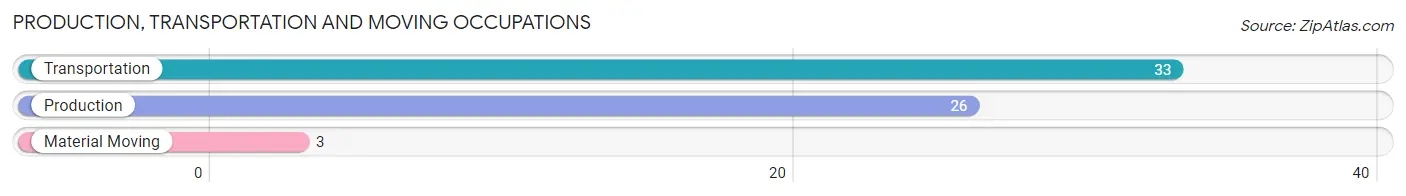
Production, Transportation and Moving Occupations
The most common Production, Transportation and Moving occupations in Kingsland are Transportation (33 | 10.8%), Production (26 | 8.5%), and Material Moving (3 | 1.0%).
Production, Transportation and Moving Occupations by Sex
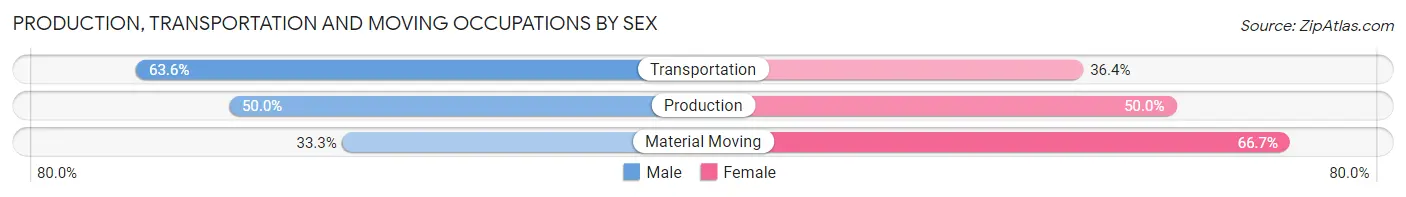
| Occupation | Male | Female |
| Production | 13 (50.0%) | 13 (50.0%) |
| Transportation | 21 (63.6%) | 12 (36.4%) |
| Material Moving | 1 (33.3%) | 2 (66.7%) |
| Total (Category) | 35 (56.5%) | 27 (43.5%) |
| Total (Overall) | 57 (18.6%) | 249 (81.4%) |
Employment Industries by Sex in Kingsland
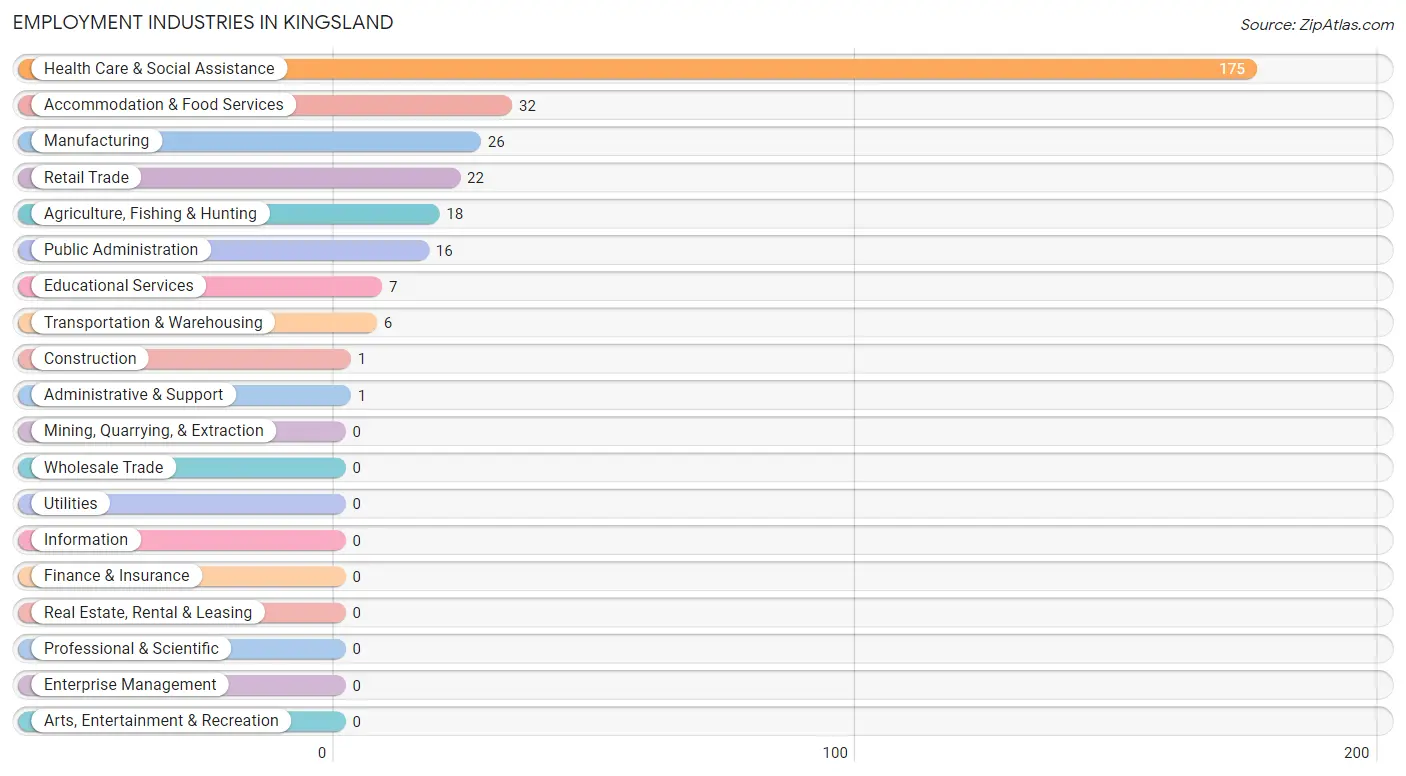
Employment Industries in Kingsland
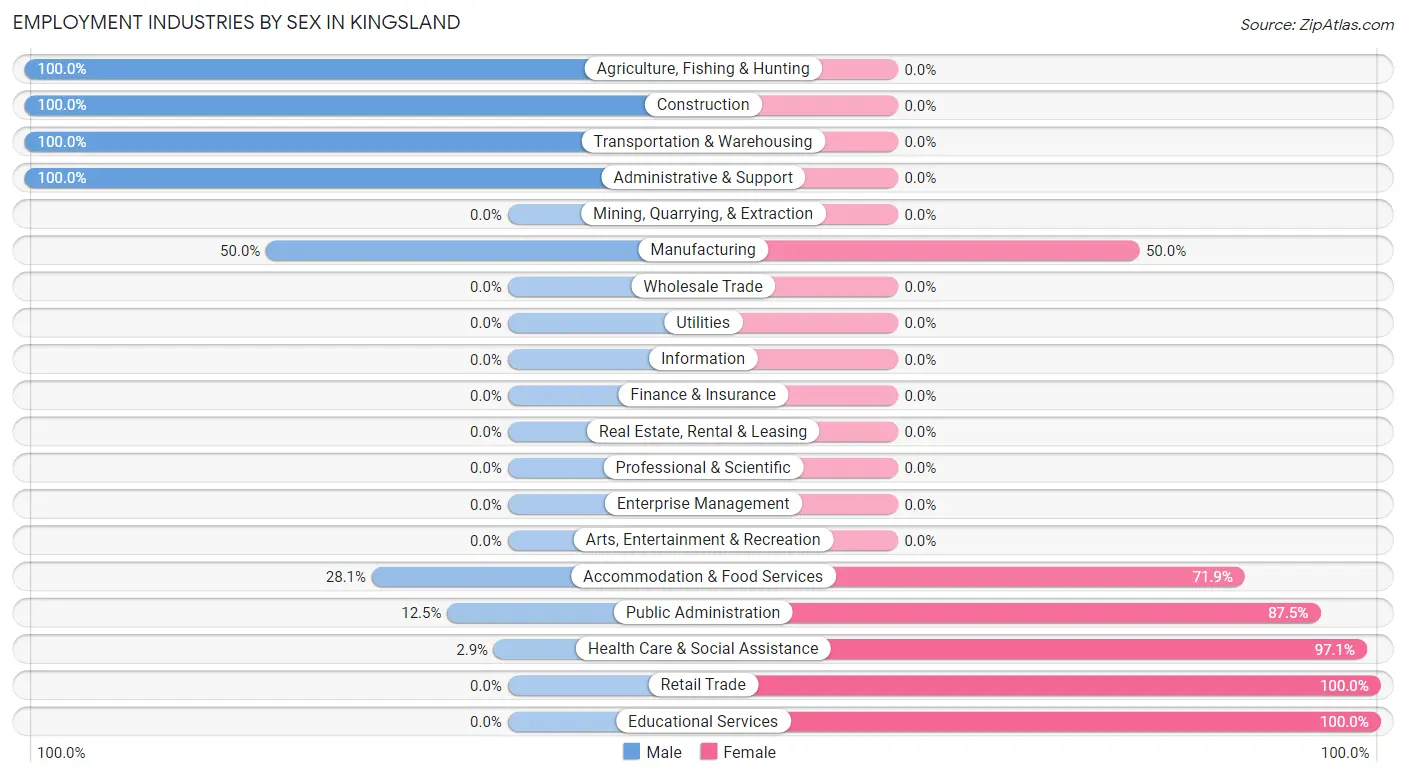
The major employment industries in Kingsland include Health Care & Social Assistance (175 | 57.2%), Accommodation & Food Services (32 | 10.5%), Manufacturing (26 | 8.5%), Retail Trade (22 | 7.2%), and Agriculture, Fishing & Hunting (18 | 5.9%).
Employment Industries by Sex in Kingsland
The Kingsland industries that see more men than women are Agriculture, Fishing & Hunting (100.0%), Construction (100.0%), and Transportation & Warehousing (100.0%), whereas the industries that tend to have a higher number of women are Retail Trade (100.0%), Educational Services (100.0%), and Health Care & Social Assistance (97.1%).
| Industry | Male | Female |
| Agriculture, Fishing & Hunting | 18 (100.0%) | 0 (0.0%) |
| Mining, Quarrying, & Extraction | 0 (0.0%) | 0 (0.0%) |
| Construction | 1 (100.0%) | 0 (0.0%) |
| Manufacturing | 13 (50.0%) | 13 (50.0%) |
| Wholesale Trade | 0 (0.0%) | 0 (0.0%) |
| Retail Trade | 0 (0.0%) | 22 (100.0%) |
| Transportation & Warehousing | 6 (100.0%) | 0 (0.0%) |
| Utilities | 0 (0.0%) | 0 (0.0%) |
| Information | 0 (0.0%) | 0 (0.0%) |
| Finance & Insurance | 0 (0.0%) | 0 (0.0%) |
| Real Estate, Rental & Leasing | 0 (0.0%) | 0 (0.0%) |
| Professional & Scientific | 0 (0.0%) | 0 (0.0%) |
| Enterprise Management | 0 (0.0%) | 0 (0.0%) |
| Administrative & Support | 1 (100.0%) | 0 (0.0%) |
| Educational Services | 0 (0.0%) | 7 (100.0%) |
| Health Care & Social Assistance | 5 (2.9%) | 170 (97.1%) |
| Arts, Entertainment & Recreation | 0 (0.0%) | 0 (0.0%) |
| Accommodation & Food Services | 9 (28.1%) | 23 (71.9%) |
| Public Administration | 2 (12.5%) | 14 (87.5%) |
| Total | 57 (18.6%) | 249 (81.4%) |
Education in Kingsland
School Enrollment in Kingsland
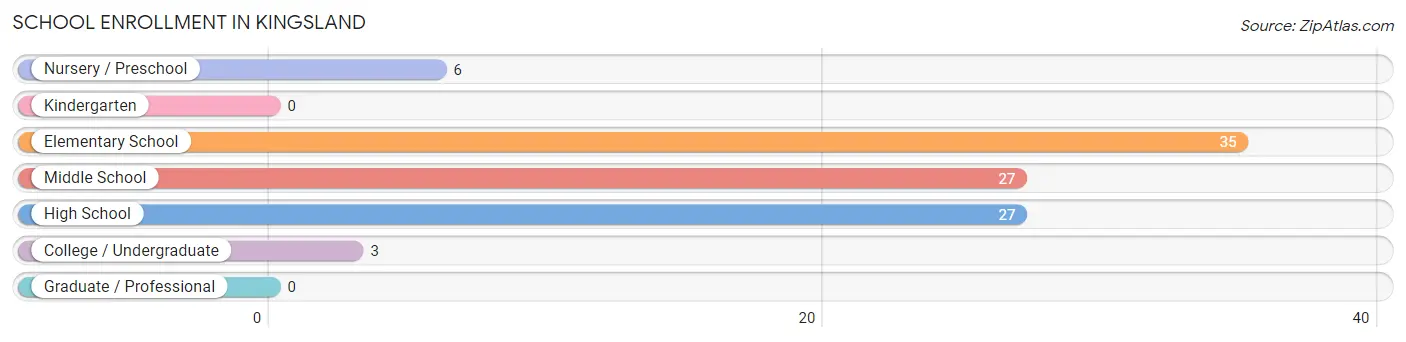
The most common levels of schooling among the 98 students in Kingsland are elementary school (35 | 35.7%), middle school (27 | 27.6%), and high school (27 | 27.6%).
| School Level | # Students | % Students |
| Nursery / Preschool | 6 | 6.1% |
| Kindergarten | 0 | 0.0% |
| Elementary School | 35 | 35.7% |
| Middle School | 27 | 27.6% |
| High School | 27 | 27.6% |
| College / Undergraduate | 3 | 3.1% |
| Graduate / Professional | 0 | 0.0% |
| Total | 98 | 100.0% |
School Enrollment by Age by Funding Source in Kingsland
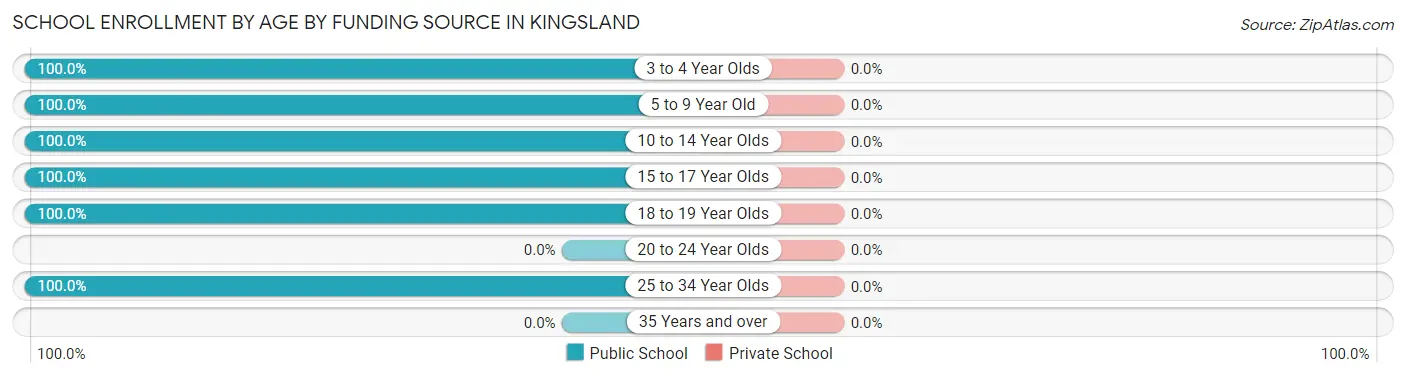
| Age Bracket | Public School | Private School |
| 3 to 4 Year Olds | 6 (100.0%) | 0 (0.0%) |
| 5 to 9 Year Old | 34 (100.0%) | 0 (0.0%) |
| 10 to 14 Year Olds | 28 (100.0%) | 0 (0.0%) |
| 15 to 17 Year Olds | 27 (100.0%) | 0 (0.0%) |
| 18 to 19 Year Olds | 2 (100.0%) | 0 (0.0%) |
| 20 to 24 Year Olds | 0 (0.0%) | 0 (0.0%) |
| 25 to 34 Year Olds | 1 (100.0%) | 0 (0.0%) |
| 35 Years and over | 0 (0.0%) | 0 (0.0%) |
| Total | 98 (100.0%) | 0 (0.0%) |
Educational Attainment by Field of Study in Kingsland
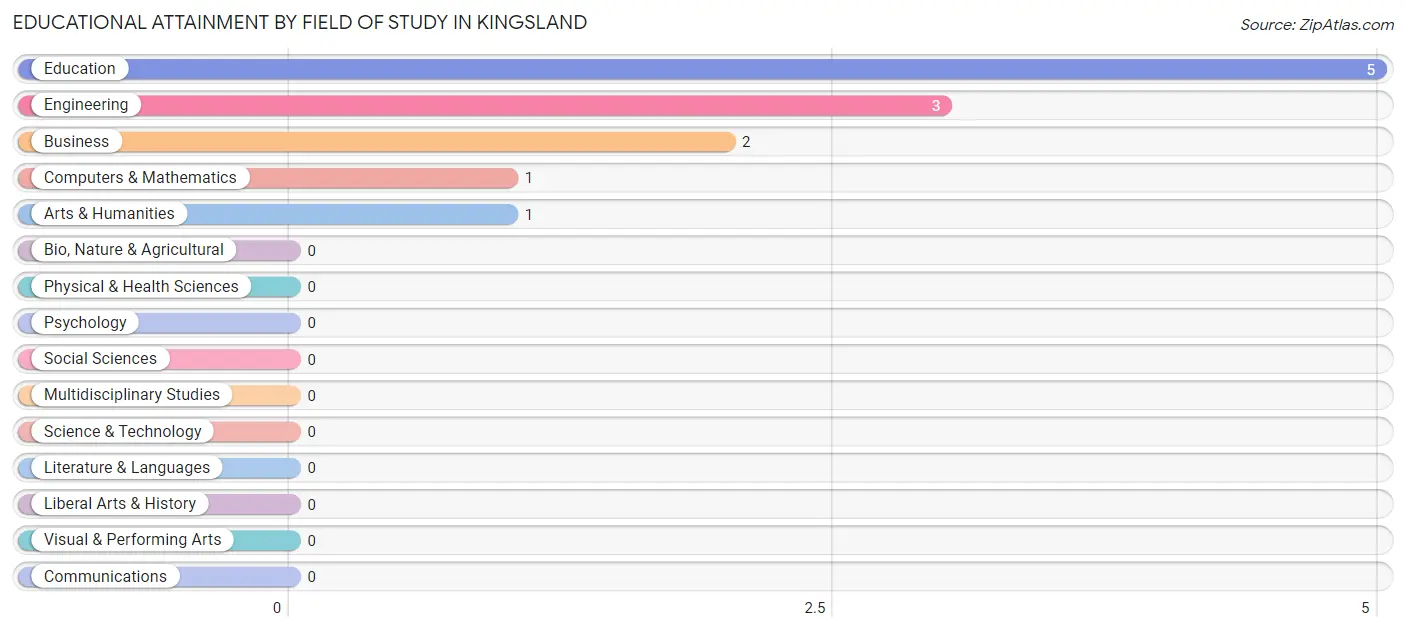
Education (5 | 41.7%), engineering (3 | 25.0%), business (2 | 16.7%), computers & mathematics (1 | 8.3%), and arts & humanities (1 | 8.3%) are the most common fields of study among 12 individuals in Kingsland who have obtained a bachelor's degree or higher.
| Field of Study | # Graduates | % Graduates |
| Computers & Mathematics | 1 | 8.3% |
| Bio, Nature & Agricultural | 0 | 0.0% |
| Physical & Health Sciences | 0 | 0.0% |
| Psychology | 0 | 0.0% |
| Social Sciences | 0 | 0.0% |
| Engineering | 3 | 25.0% |
| Multidisciplinary Studies | 0 | 0.0% |
| Science & Technology | 0 | 0.0% |
| Business | 2 | 16.7% |
| Education | 5 | 41.7% |
| Literature & Languages | 0 | 0.0% |
| Liberal Arts & History | 0 | 0.0% |
| Visual & Performing Arts | 0 | 0.0% |
| Communications | 0 | 0.0% |
| Arts & Humanities | 1 | 8.3% |
| Total | 12 | 100.0% |
Transportation & Commute in Kingsland
Vehicle Availability by Sex in Kingsland
The most prevalent vehicle ownership categories in Kingsland are males with 2 vehicles (30, accounting for 52.6%) and females with 2 vehicles (201, making up 12.0%).
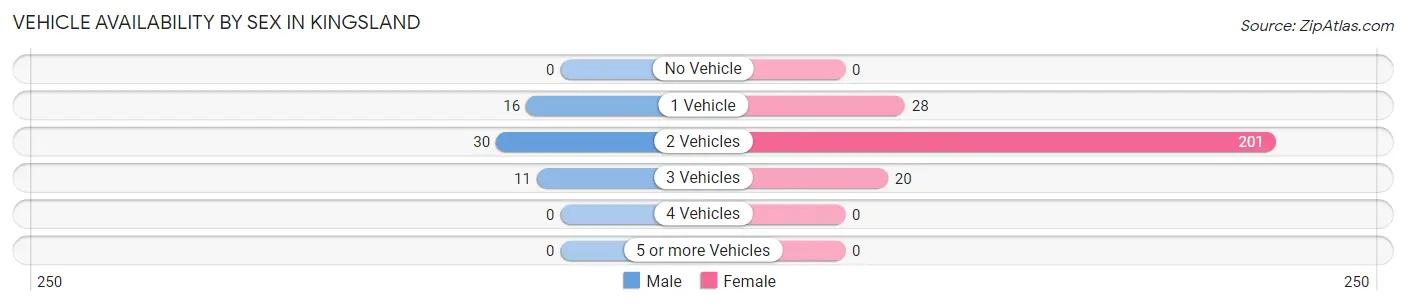
| Vehicles Available | Male | Female |
| No Vehicle | 0 (0.0%) | 0 (0.0%) |
| 1 Vehicle | 16 (28.1%) | 28 (11.2%) |
| 2 Vehicles | 30 (52.6%) | 201 (80.7%) |
| 3 Vehicles | 11 (19.3%) | 20 (8.0%) |
| 4 Vehicles | 0 (0.0%) | 0 (0.0%) |
| 5 or more Vehicles | 0 (0.0%) | 0 (0.0%) |
| Total | 57 (100.0%) | 249 (100.0%) |
Commute Time in Kingsland
The most frequently occuring commute durations in Kingsland are 15 to 19 minutes (215 commuters, 70.3%), 20 to 24 minutes (30 commuters, 9.8%), and 10 to 14 minutes (16 commuters, 5.2%).
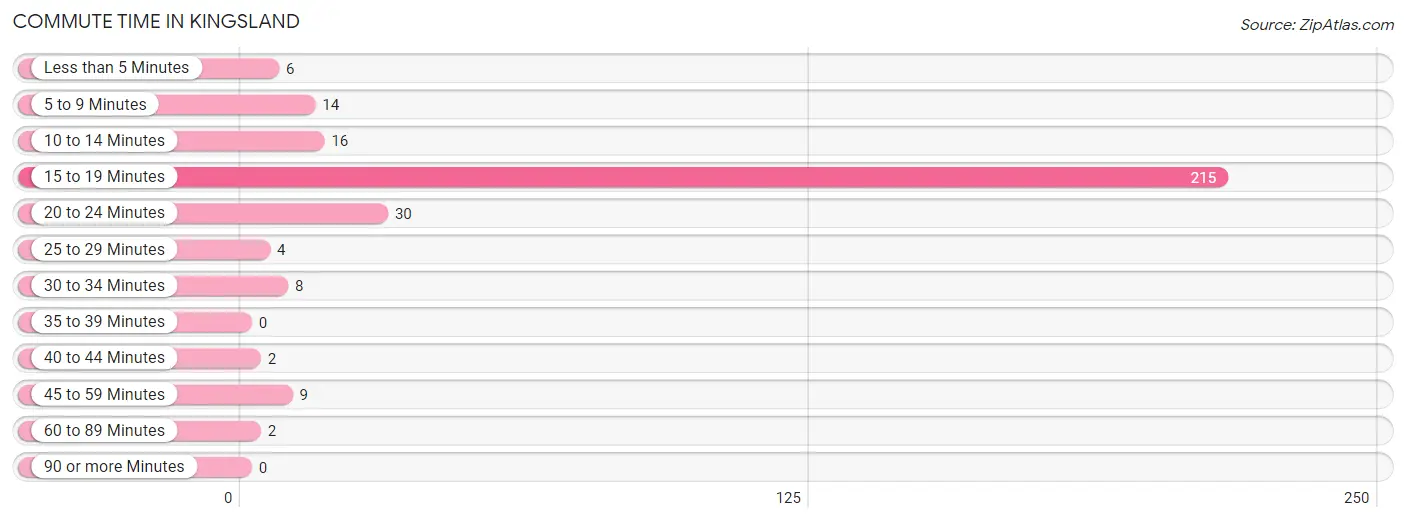
| Commute Time | # Commuters | % Commuters |
| Less than 5 Minutes | 6 | 2.0% |
| 5 to 9 Minutes | 14 | 4.6% |
| 10 to 14 Minutes | 16 | 5.2% |
| 15 to 19 Minutes | 215 | 70.3% |
| 20 to 24 Minutes | 30 | 9.8% |
| 25 to 29 Minutes | 4 | 1.3% |
| 30 to 34 Minutes | 8 | 2.6% |
| 35 to 39 Minutes | 0 | 0.0% |
| 40 to 44 Minutes | 2 | 0.6% |
| 45 to 59 Minutes | 9 | 2.9% |
| 60 to 89 Minutes | 2 | 0.6% |
| 90 or more Minutes | 0 | 0.0% |
Commute Time by Sex in Kingsland
The most common commute times in Kingsland are 20 to 24 minutes (20 commuters, 35.1%) for males and 15 to 19 minutes (199 commuters, 79.9%) for females.
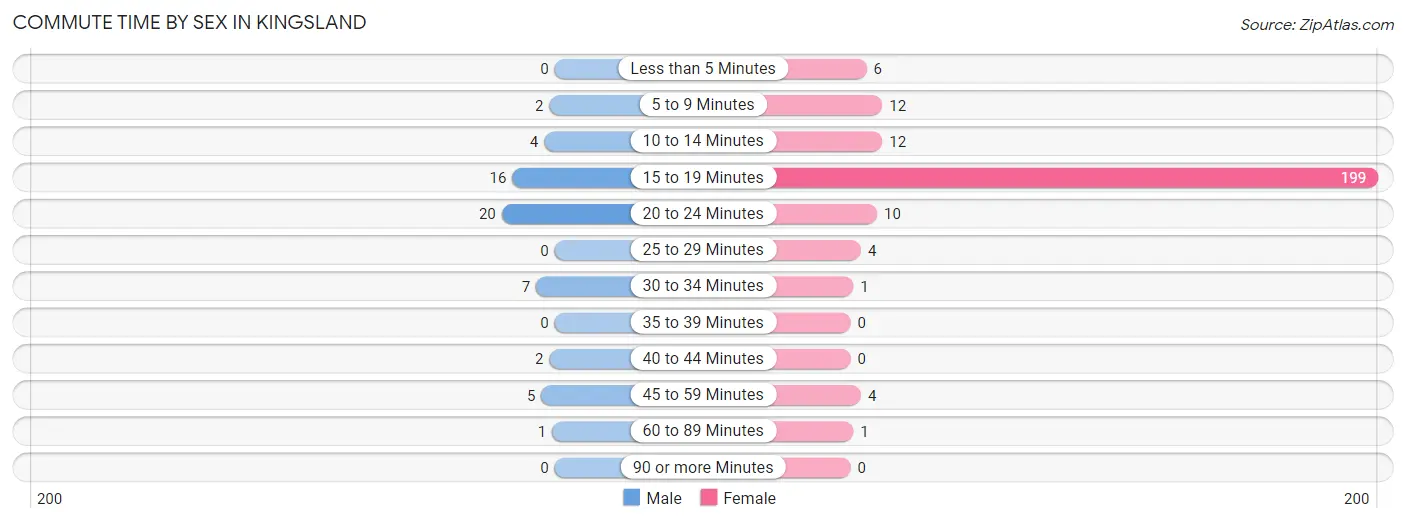
| Commute Time | Male | Female |
| Less than 5 Minutes | 0 (0.0%) | 6 (2.4%) |
| 5 to 9 Minutes | 2 (3.5%) | 12 (4.8%) |
| 10 to 14 Minutes | 4 (7.0%) | 12 (4.8%) |
| 15 to 19 Minutes | 16 (28.1%) | 199 (79.9%) |
| 20 to 24 Minutes | 20 (35.1%) | 10 (4.0%) |
| 25 to 29 Minutes | 0 (0.0%) | 4 (1.6%) |
| 30 to 34 Minutes | 7 (12.3%) | 1 (0.4%) |
| 35 to 39 Minutes | 0 (0.0%) | 0 (0.0%) |
| 40 to 44 Minutes | 2 (3.5%) | 0 (0.0%) |
| 45 to 59 Minutes | 5 (8.8%) | 4 (1.6%) |
| 60 to 89 Minutes | 1 (1.8%) | 1 (0.4%) |
| 90 or more Minutes | 0 (0.0%) | 0 (0.0%) |
Time of Departure to Work by Sex in Kingsland
The most frequent times of departure to work in Kingsland are 5:00 AM to 5:29 AM (24, 42.1%) for males and 4:00 PM to 11:59 PM (139, 55.8%) for females.
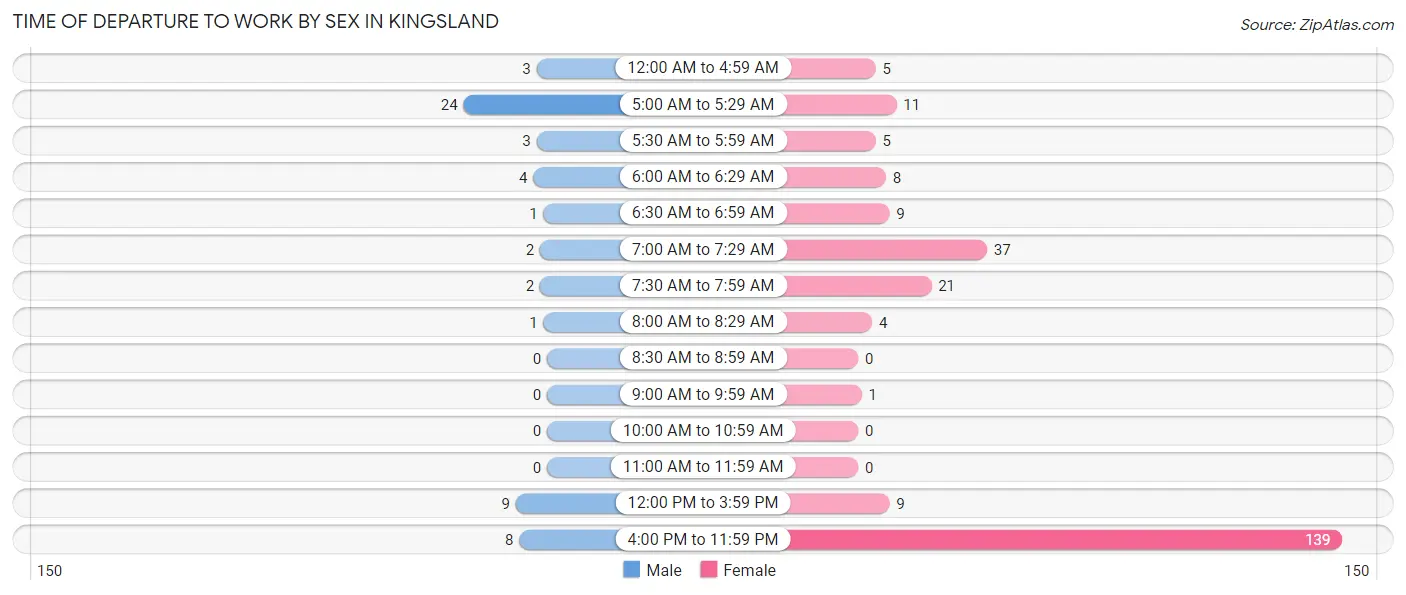
| Time of Departure | Male | Female |
| 12:00 AM to 4:59 AM | 3 (5.3%) | 5 (2.0%) |
| 5:00 AM to 5:29 AM | 24 (42.1%) | 11 (4.4%) |
| 5:30 AM to 5:59 AM | 3 (5.3%) | 5 (2.0%) |
| 6:00 AM to 6:29 AM | 4 (7.0%) | 8 (3.2%) |
| 6:30 AM to 6:59 AM | 1 (1.8%) | 9 (3.6%) |
| 7:00 AM to 7:29 AM | 2 (3.5%) | 37 (14.9%) |
| 7:30 AM to 7:59 AM | 2 (3.5%) | 21 (8.4%) |
| 8:00 AM to 8:29 AM | 1 (1.8%) | 4 (1.6%) |
| 8:30 AM to 8:59 AM | 0 (0.0%) | 0 (0.0%) |
| 9:00 AM to 9:59 AM | 0 (0.0%) | 1 (0.4%) |
| 10:00 AM to 10:59 AM | 0 (0.0%) | 0 (0.0%) |
| 11:00 AM to 11:59 AM | 0 (0.0%) | 0 (0.0%) |
| 12:00 PM to 3:59 PM | 9 (15.8%) | 9 (3.6%) |
| 4:00 PM to 11:59 PM | 8 (14.0%) | 139 (55.8%) |
| Total | 57 (100.0%) | 249 (100.0%) |
Housing Occupancy in Kingsland
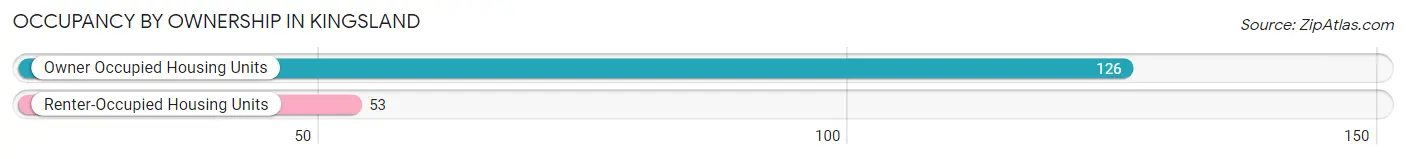
Occupancy by Ownership in Kingsland
Of the total 179 dwellings in Kingsland, owner-occupied units account for 126 (70.4%), while renter-occupied units make up 53 (29.6%).
| Occupancy | # Housing Units | % Housing Units |
| Owner Occupied Housing Units | 126 | 70.4% |
| Renter-Occupied Housing Units | 53 | 29.6% |
| Total Occupied Housing Units | 179 | 100.0% |
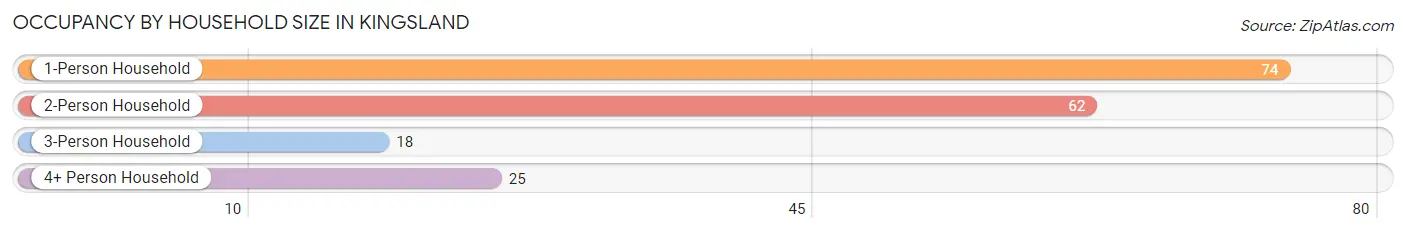
Occupancy by Household Size in Kingsland
| Household Size | # Housing Units | % Housing Units |
| 1-Person Household | 74 | 41.3% |
| 2-Person Household | 62 | 34.6% |
| 3-Person Household | 18 | 10.1% |
| 4+ Person Household | 25 | 14.0% |
| Total Housing Units | 179 | 100.0% |
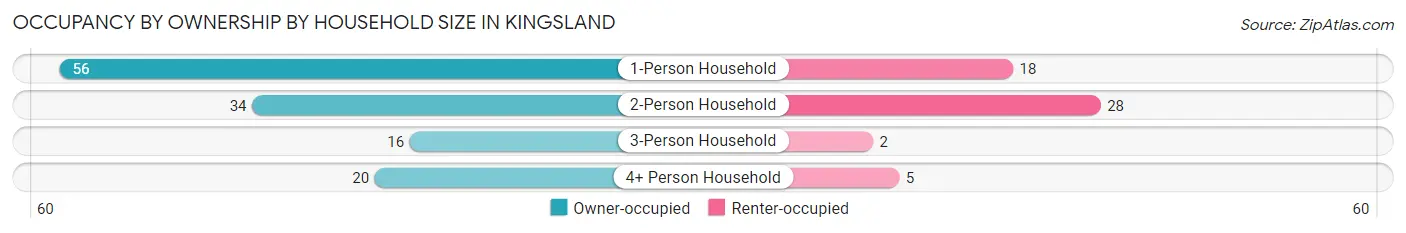
Occupancy by Ownership by Household Size in Kingsland
| Household Size | Owner-occupied | Renter-occupied |
| 1-Person Household | 56 (75.7%) | 18 (24.3%) |
| 2-Person Household | 34 (54.8%) | 28 (45.2%) |
| 3-Person Household | 16 (88.9%) | 2 (11.1%) |
| 4+ Person Household | 20 (80.0%) | 5 (20.0%) |
| Total Housing Units | 126 (70.4%) | 53 (29.6%) |
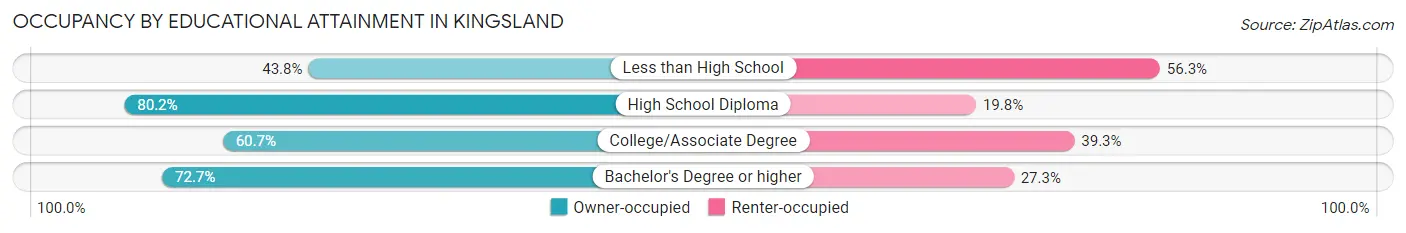
Occupancy by Educational Attainment in Kingsland
| Household Size | Owner-occupied | Renter-occupied |
| Less than High School | 7 (43.8%) | 9 (56.2%) |
| High School Diploma | 77 (80.2%) | 19 (19.8%) |
| College/Associate Degree | 34 (60.7%) | 22 (39.3%) |
| Bachelor's Degree or higher | 8 (72.7%) | 3 (27.3%) |
Occupancy by Age of Householder in Kingsland
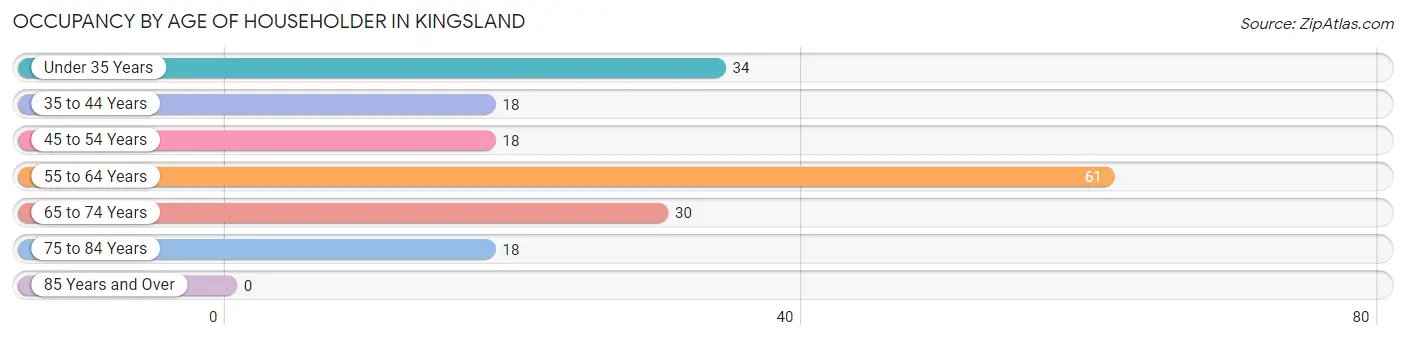
| Age Bracket | # Households | % Households |
| Under 35 Years | 34 | 19.0% |
| 35 to 44 Years | 18 | 10.1% |
| 45 to 54 Years | 18 | 10.1% |
| 55 to 64 Years | 61 | 34.1% |
| 65 to 74 Years | 30 | 16.8% |
| 75 to 84 Years | 18 | 10.1% |
| 85 Years and Over | 0 | 0.0% |
| Total | 179 | 100.0% |
Housing Finances in Kingsland
Median Income by Occupancy in Kingsland
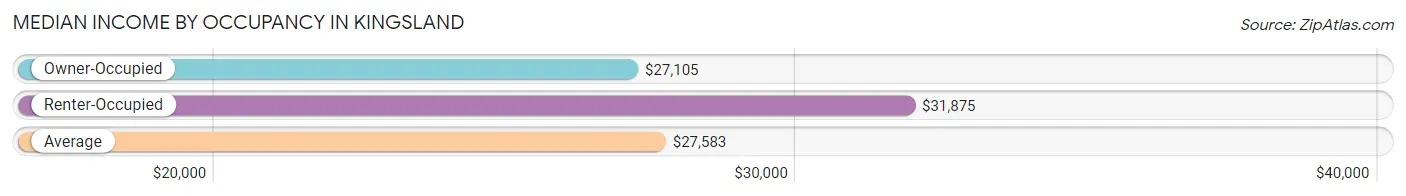
| Occupancy Type | # Households | Median Income |
| Owner-Occupied | 126 (70.4%) | $27,105 |
| Renter-Occupied | 53 (29.6%) | $31,875 |
| Average | 179 (100.0%) | $27,583 |
Occupancy by Householder Income Bracket in Kingsland
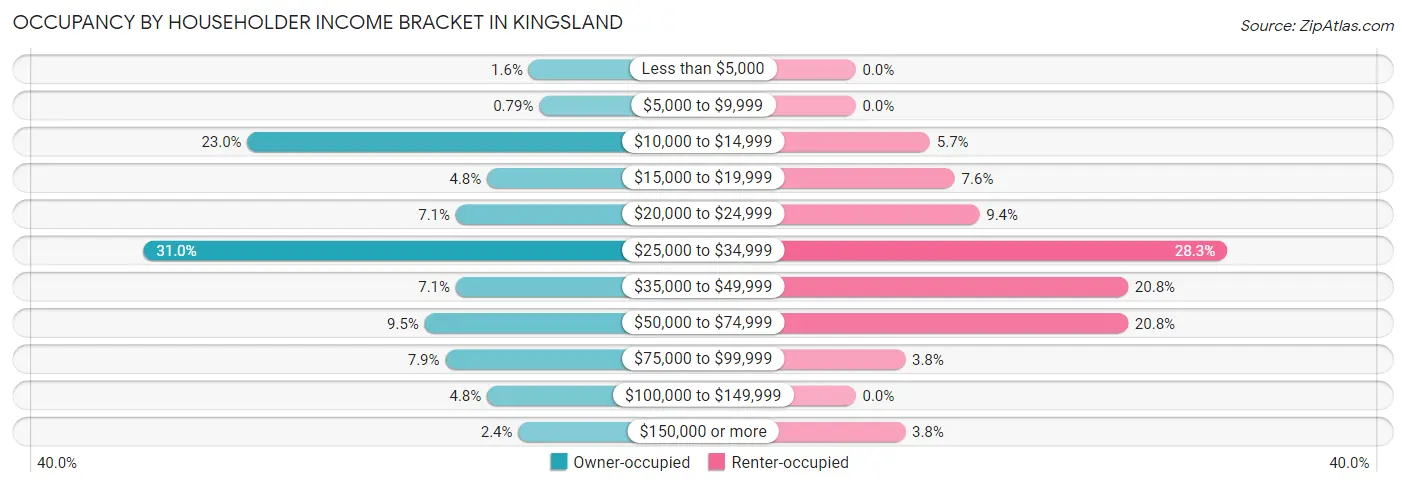
| Income Bracket | Owner-occupied | Renter-occupied |
| Less than $5,000 | 2 (1.6%) | 0 (0.0%) |
| $5,000 to $9,999 | 1 (0.8%) | 0 (0.0%) |
| $10,000 to $14,999 | 29 (23.0%) | 3 (5.7%) |
| $15,000 to $19,999 | 6 (4.8%) | 4 (7.5%) |
| $20,000 to $24,999 | 9 (7.1%) | 5 (9.4%) |
| $25,000 to $34,999 | 39 (30.9%) | 15 (28.3%) |
| $35,000 to $49,999 | 9 (7.1%) | 11 (20.7%) |
| $50,000 to $74,999 | 12 (9.5%) | 11 (20.7%) |
| $75,000 to $99,999 | 10 (7.9%) | 2 (3.8%) |
| $100,000 to $149,999 | 6 (4.8%) | 0 (0.0%) |
| $150,000 or more | 3 (2.4%) | 2 (3.8%) |
| Total | 126 (100.0%) | 53 (100.0%) |
Monthly Housing Cost Tiers in Kingsland
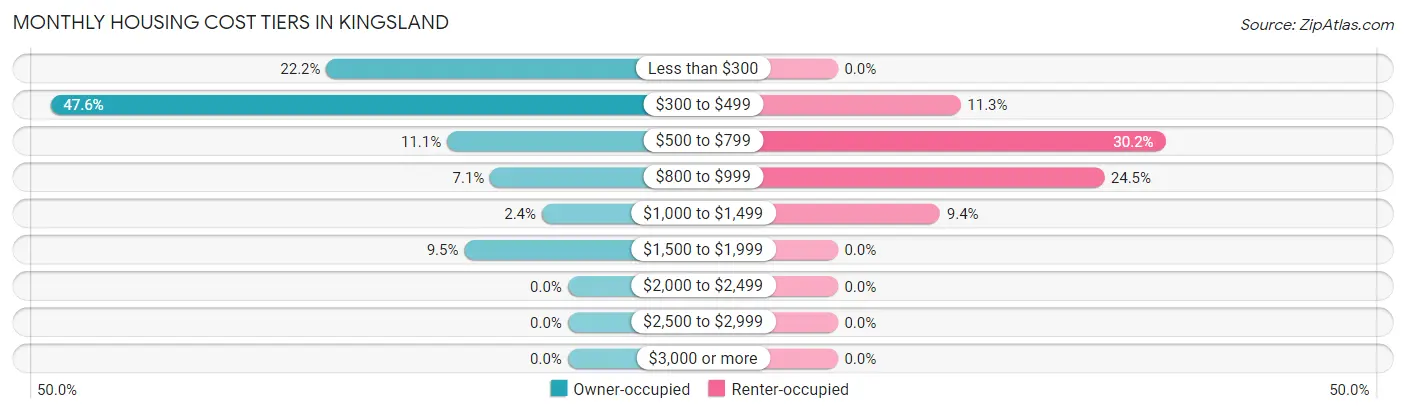
| Monthly Cost | Owner-occupied | Renter-occupied |
| Less than $300 | 28 (22.2%) | 0 (0.0%) |
| $300 to $499 | 60 (47.6%) | 6 (11.3%) |
| $500 to $799 | 14 (11.1%) | 16 (30.2%) |
| $800 to $999 | 9 (7.1%) | 13 (24.5%) |
| $1,000 to $1,499 | 3 (2.4%) | 5 (9.4%) |
| $1,500 to $1,999 | 12 (9.5%) | 0 (0.0%) |
| $2,000 to $2,499 | 0 (0.0%) | 0 (0.0%) |
| $2,500 to $2,999 | 0 (0.0%) | 0 (0.0%) |
| $3,000 or more | 0 (0.0%) | 0 (0.0%) |
| Total | 126 (100.0%) | 53 (100.0%) |
Physical Housing Characteristics in Kingsland
Housing Structures in Kingsland
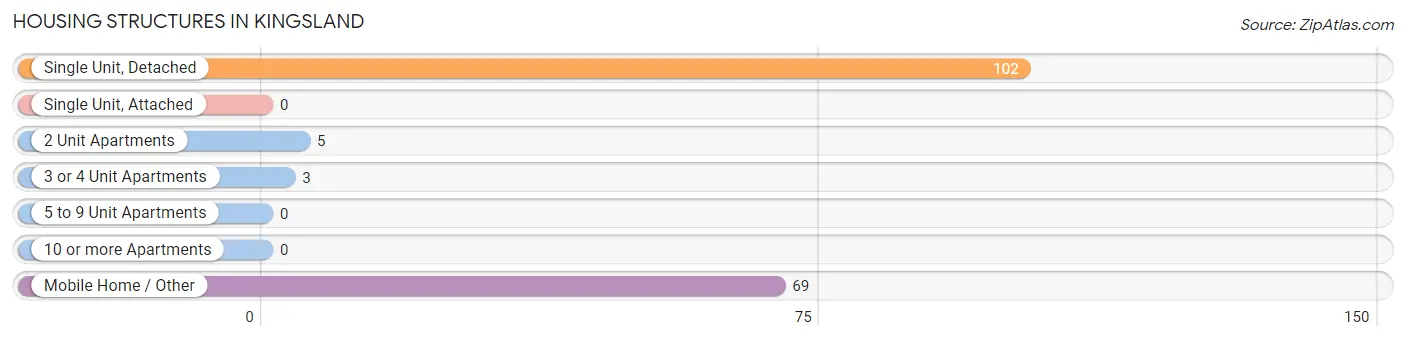
| Structure Type | # Housing Units | % Housing Units |
| Single Unit, Detached | 102 | 57.0% |
| Single Unit, Attached | 0 | 0.0% |
| 2 Unit Apartments | 5 | 2.8% |
| 3 or 4 Unit Apartments | 3 | 1.7% |
| 5 to 9 Unit Apartments | 0 | 0.0% |
| 10 or more Apartments | 0 | 0.0% |
| Mobile Home / Other | 69 | 38.6% |
| Total | 179 | 100.0% |
Housing Structures by Occupancy in Kingsland
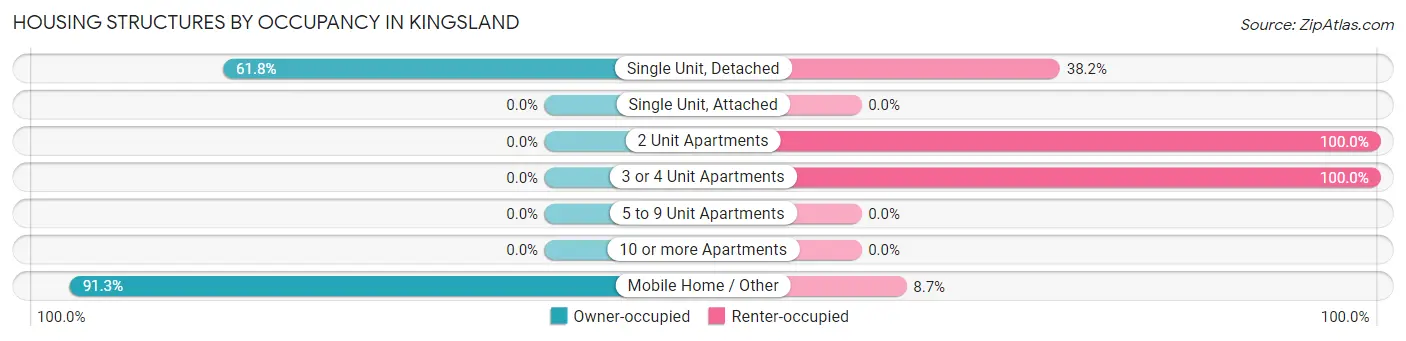
| Structure Type | Owner-occupied | Renter-occupied |
| Single Unit, Detached | 63 (61.8%) | 39 (38.2%) |
| Single Unit, Attached | 0 (0.0%) | 0 (0.0%) |
| 2 Unit Apartments | 0 (0.0%) | 5 (100.0%) |
| 3 or 4 Unit Apartments | 0 (0.0%) | 3 (100.0%) |
| 5 to 9 Unit Apartments | 0 (0.0%) | 0 (0.0%) |
| 10 or more Apartments | 0 (0.0%) | 0 (0.0%) |
| Mobile Home / Other | 63 (91.3%) | 6 (8.7%) |
| Total | 126 (70.4%) | 53 (29.6%) |
Housing Structures by Number of Rooms in Kingsland
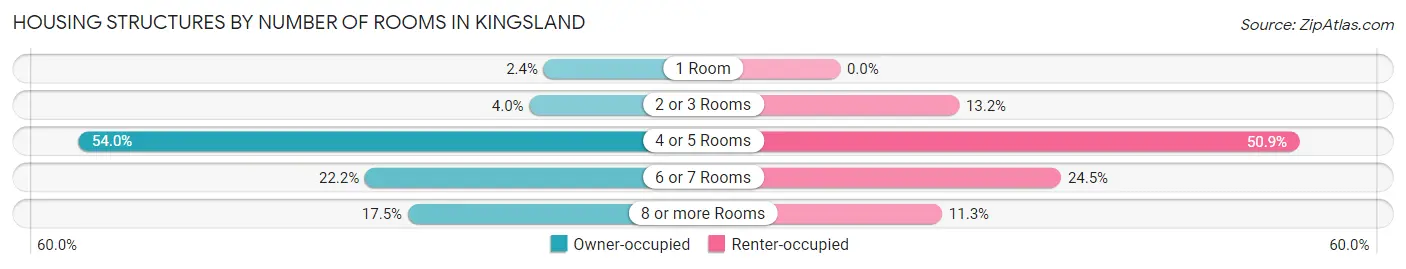
| Number of Rooms | Owner-occupied | Renter-occupied |
| 1 Room | 3 (2.4%) | 0 (0.0%) |
| 2 or 3 Rooms | 5 (4.0%) | 7 (13.2%) |
| 4 or 5 Rooms | 68 (54.0%) | 27 (50.9%) |
| 6 or 7 Rooms | 28 (22.2%) | 13 (24.5%) |
| 8 or more Rooms | 22 (17.5%) | 6 (11.3%) |
| Total | 126 (100.0%) | 53 (100.0%) |
Housing Structure by Heating Type in Kingsland
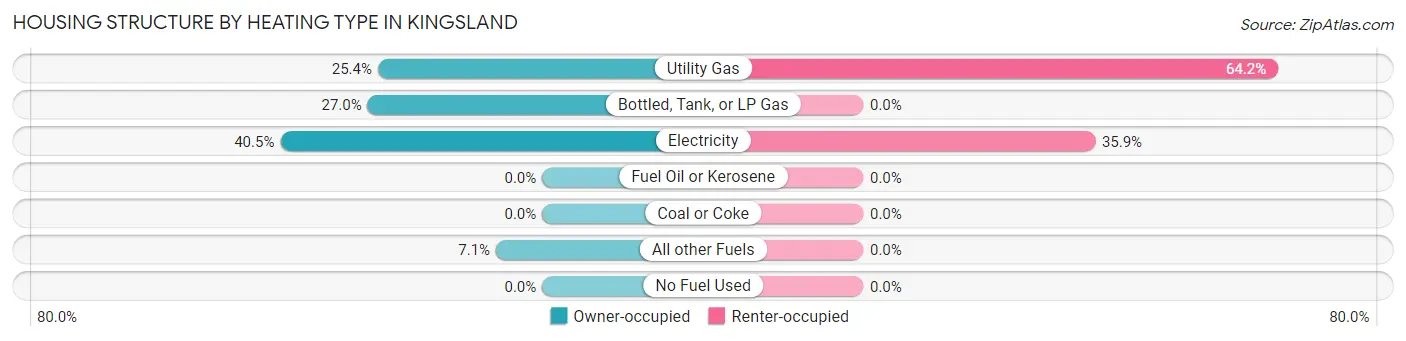
| Heating Type | Owner-occupied | Renter-occupied |
| Utility Gas | 32 (25.4%) | 34 (64.1%) |
| Bottled, Tank, or LP Gas | 34 (27.0%) | 0 (0.0%) |
| Electricity | 51 (40.5%) | 19 (35.8%) |
| Fuel Oil or Kerosene | 0 (0.0%) | 0 (0.0%) |
| Coal or Coke | 0 (0.0%) | 0 (0.0%) |
| All other Fuels | 9 (7.1%) | 0 (0.0%) |
| No Fuel Used | 0 (0.0%) | 0 (0.0%) |
| Total | 126 (100.0%) | 53 (100.0%) |
Household Vehicle Usage in Kingsland
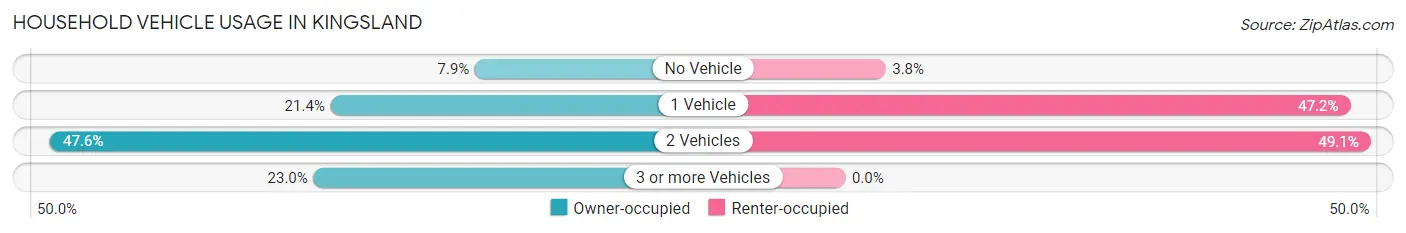
| Vehicles per Household | Owner-occupied | Renter-occupied |
| No Vehicle | 10 (7.9%) | 2 (3.8%) |
| 1 Vehicle | 27 (21.4%) | 25 (47.2%) |
| 2 Vehicles | 60 (47.6%) | 26 (49.1%) |
| 3 or more Vehicles | 29 (23.0%) | 0 (0.0%) |
| Total | 126 (100.0%) | 53 (100.0%) |
Real Estate & Mortgages in Kingsland
Real Estate and Mortgage Overview in Kingsland
| Characteristic | Without Mortgage | With Mortgage |
| Housing Units | 94 | 32 |
| Median Property Value | - | - |
| Median Household Income | $26,111 | $3 |
| Monthly Housing Costs | $390 | $0 |
| Real Estate Taxes | $199 | $7 |
Property Value by Mortgage Status in Kingsland
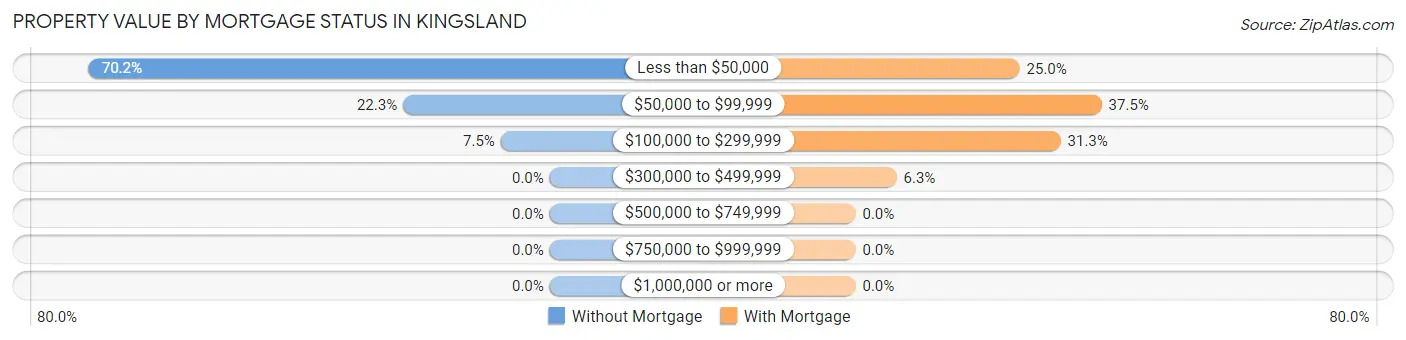
| Property Value | Without Mortgage | With Mortgage |
| Less than $50,000 | 66 (70.2%) | 8 (25.0%) |
| $50,000 to $99,999 | 21 (22.3%) | 12 (37.5%) |
| $100,000 to $299,999 | 7 (7.4%) | 10 (31.2%) |
| $300,000 to $499,999 | 0 (0.0%) | 2 (6.2%) |
| $500,000 to $749,999 | 0 (0.0%) | 0 (0.0%) |
| $750,000 to $999,999 | 0 (0.0%) | 0 (0.0%) |
| $1,000,000 or more | 0 (0.0%) | 0 (0.0%) |
| Total | 94 (100.0%) | 32 (100.0%) |
Household Income by Mortgage Status in Kingsland
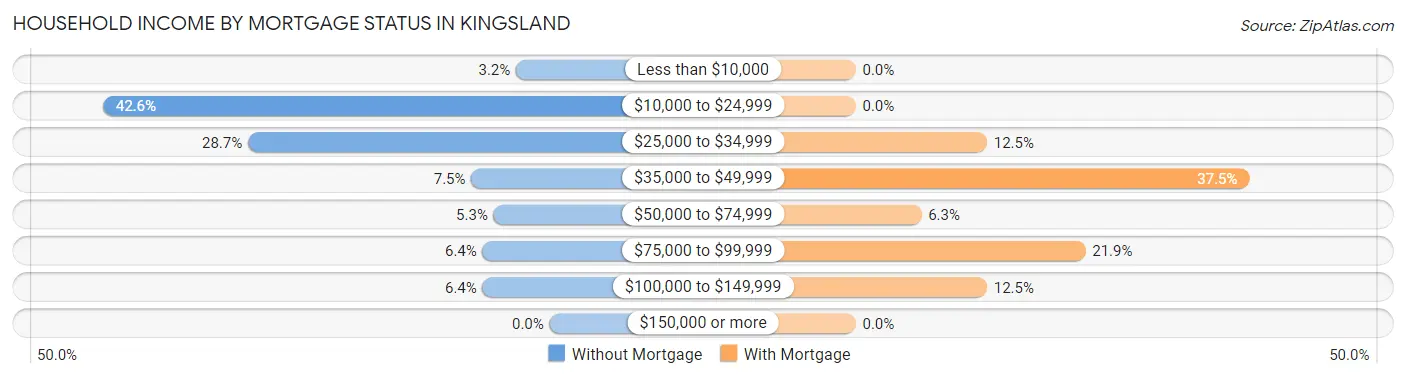
| Household Income | Without Mortgage | With Mortgage |
| Less than $10,000 | 3 (3.2%) | 0 (0.0%) |
| $10,000 to $24,999 | 40 (42.5%) | 0 (0.0%) |
| $25,000 to $34,999 | 27 (28.7%) | 4 (12.5%) |
| $35,000 to $49,999 | 7 (7.4%) | 12 (37.5%) |
| $50,000 to $74,999 | 5 (5.3%) | 2 (6.2%) |
| $75,000 to $99,999 | 6 (6.4%) | 7 (21.9%) |
| $100,000 to $149,999 | 6 (6.4%) | 4 (12.5%) |
| $150,000 or more | 0 (0.0%) | 0 (0.0%) |
| Total | 94 (100.0%) | 32 (100.0%) |
Property Value to Household Income Ratio in Kingsland
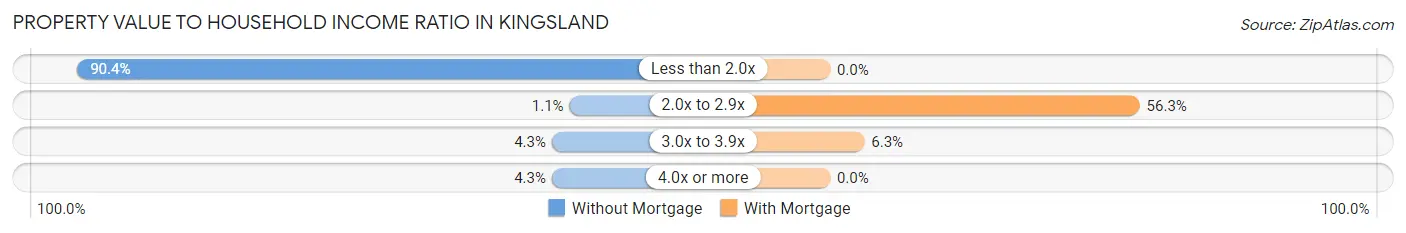
| Value-to-Income Ratio | Without Mortgage | With Mortgage |
| Less than 2.0x | 85 (90.4%) | 0 (0.0%) |
| 2.0x to 2.9x | 1 (1.1%) | 18 (56.2%) |
| 3.0x to 3.9x | 4 (4.3%) | 2 (6.2%) |
| 4.0x or more | 4 (4.3%) | 0 (0.0%) |
| Total | 94 (100.0%) | 32 (100.0%) |
Real Estate Taxes by Mortgage Status in Kingsland
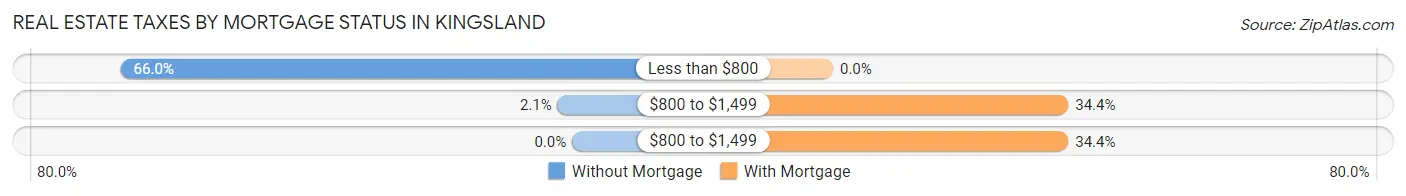
| Property Taxes | Without Mortgage | With Mortgage |
| Less than $800 | 62 (66.0%) | 0 (0.0%) |
| $800 to $1,499 | 2 (2.1%) | 11 (34.4%) |
| $800 to $1,499 | 0 (0.0%) | 11 (34.4%) |
| Total | 94 (100.0%) | 32 (100.0%) |
Health & Disability in Kingsland
Health Insurance Coverage by Age in Kingsland
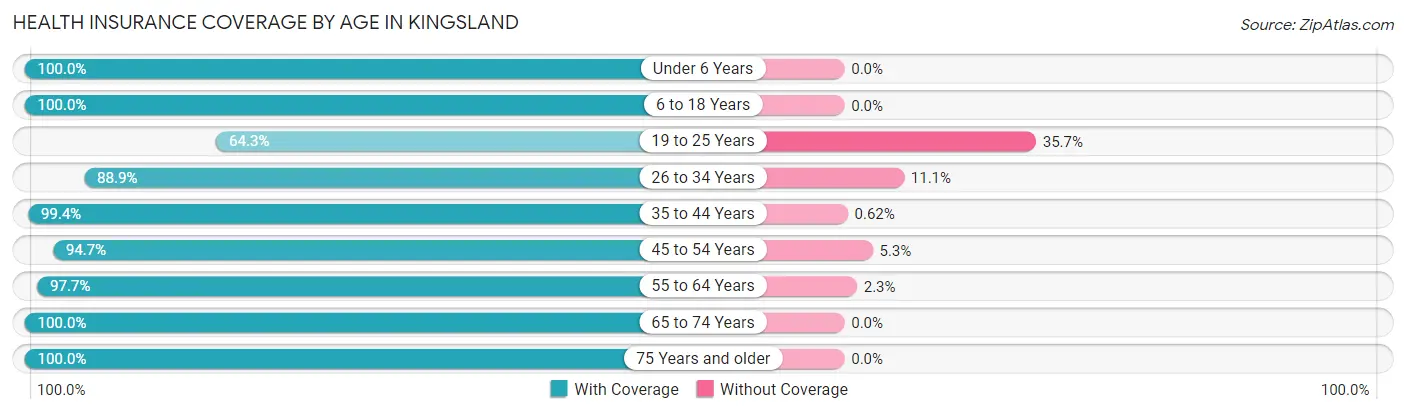
| Age Bracket | With Coverage | Without Coverage |
| Under 6 Years | 22 (100.0%) | 0 (0.0%) |
| 6 to 18 Years | 96 (100.0%) | 0 (0.0%) |
| 19 to 25 Years | 9 (64.3%) | 5 (35.7%) |
| 26 to 34 Years | 40 (88.9%) | 5 (11.1%) |
| 35 to 44 Years | 160 (99.4%) | 1 (0.6%) |
| 45 to 54 Years | 36 (94.7%) | 2 (5.3%) |
| 55 to 64 Years | 84 (97.7%) | 2 (2.3%) |
| 65 to 74 Years | 41 (100.0%) | 0 (0.0%) |
| 75 Years and older | 26 (100.0%) | 0 (0.0%) |
| Total | 514 (97.2%) | 15 (2.8%) |
Health Insurance Coverage by Citizenship Status in Kingsland
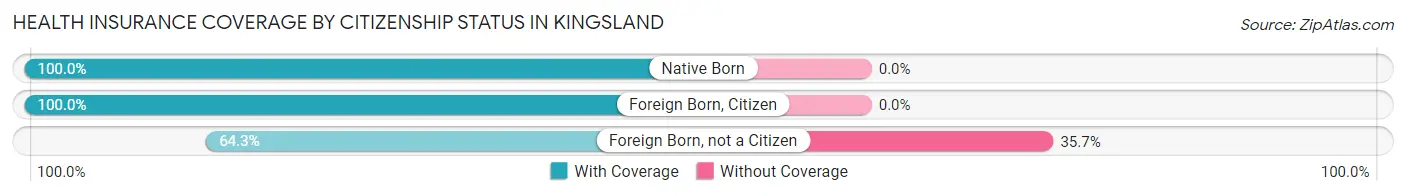
| Citizenship Status | With Coverage | Without Coverage |
| Native Born | 22 (100.0%) | 0 (0.0%) |
| Foreign Born, Citizen | 96 (100.0%) | 0 (0.0%) |
| Foreign Born, not a Citizen | 9 (64.3%) | 5 (35.7%) |
Health Insurance Coverage by Household Income in Kingsland
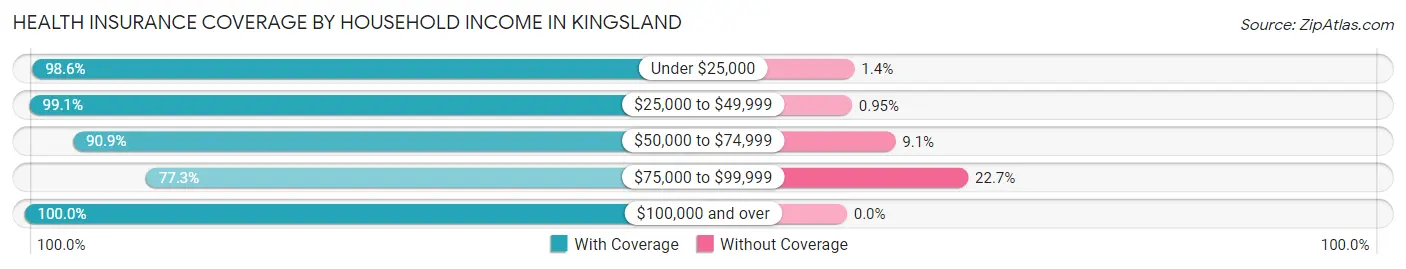
| Household Income | With Coverage | Without Coverage |
| Under $25,000 | 69 (98.6%) | 1 (1.4%) |
| $25,000 to $49,999 | 313 (99.1%) | 3 (0.9%) |
| $50,000 to $74,999 | 60 (90.9%) | 6 (9.1%) |
| $75,000 to $99,999 | 17 (77.3%) | 5 (22.7%) |
| $100,000 and over | 55 (100.0%) | 0 (0.0%) |
Public vs Private Health Insurance Coverage by Age in Kingsland
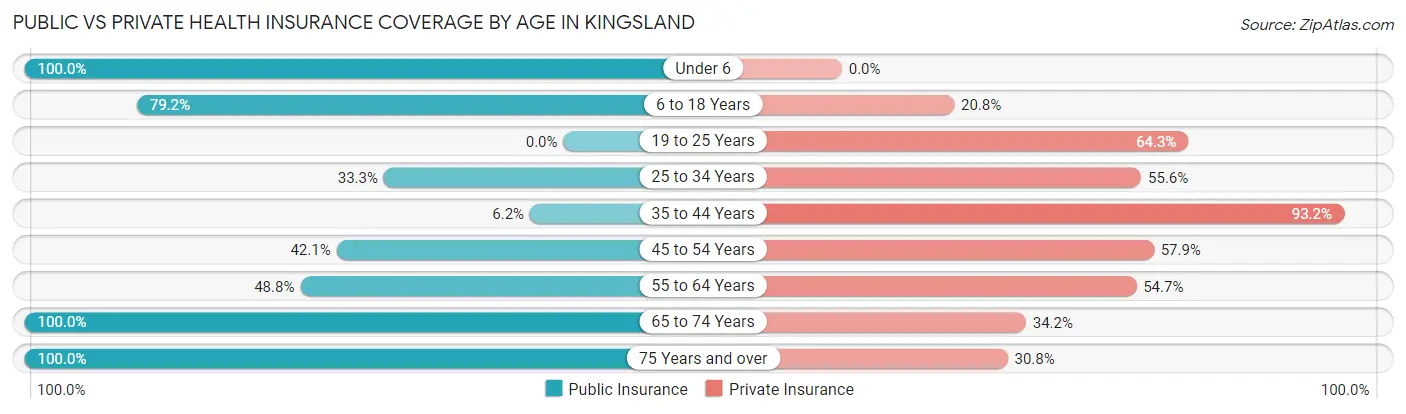
| Age Bracket | Public Insurance | Private Insurance |
| Under 6 | 22 (100.0%) | 0 (0.0%) |
| 6 to 18 Years | 76 (79.2%) | 20 (20.8%) |
| 19 to 25 Years | 0 (0.0%) | 9 (64.3%) |
| 25 to 34 Years | 15 (33.3%) | 25 (55.6%) |
| 35 to 44 Years | 10 (6.2%) | 150 (93.2%) |
| 45 to 54 Years | 16 (42.1%) | 22 (57.9%) |
| 55 to 64 Years | 42 (48.8%) | 47 (54.6%) |
| 65 to 74 Years | 41 (100.0%) | 14 (34.2%) |
| 75 Years and over | 26 (100.0%) | 8 (30.8%) |
| Total | 248 (46.9%) | 295 (55.8%) |
Disability Status by Sex by Age in Kingsland
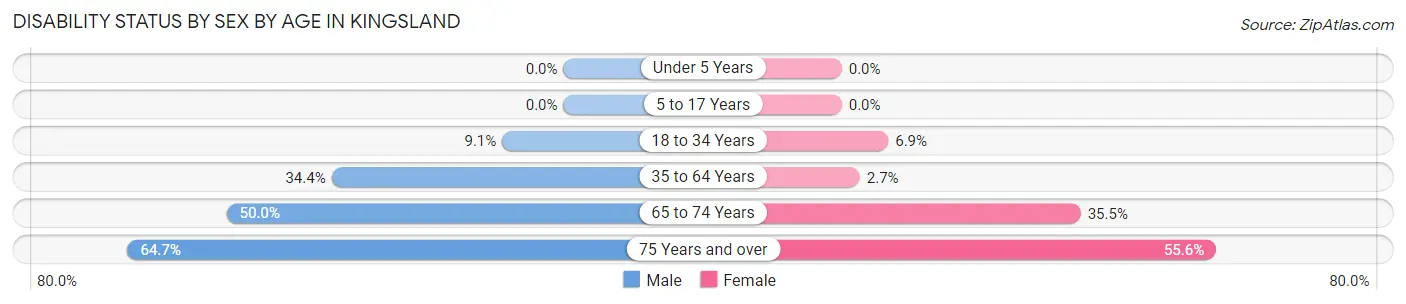
| Age Bracket | Male | Female |
| Under 5 Years | 0 (0.0%) | 0 (0.0%) |
| 5 to 17 Years | 0 (0.0%) | 0 (0.0%) |
| 18 to 34 Years | 3 (9.1%) | 2 (6.9%) |
| 35 to 64 Years | 21 (34.4%) | 6 (2.7%) |
| 65 to 74 Years | 5 (50.0%) | 11 (35.5%) |
| 75 Years and over | 11 (64.7%) | 5 (55.6%) |
Disability Class by Sex by Age in Kingsland
Disability Class: Hearing Difficulty
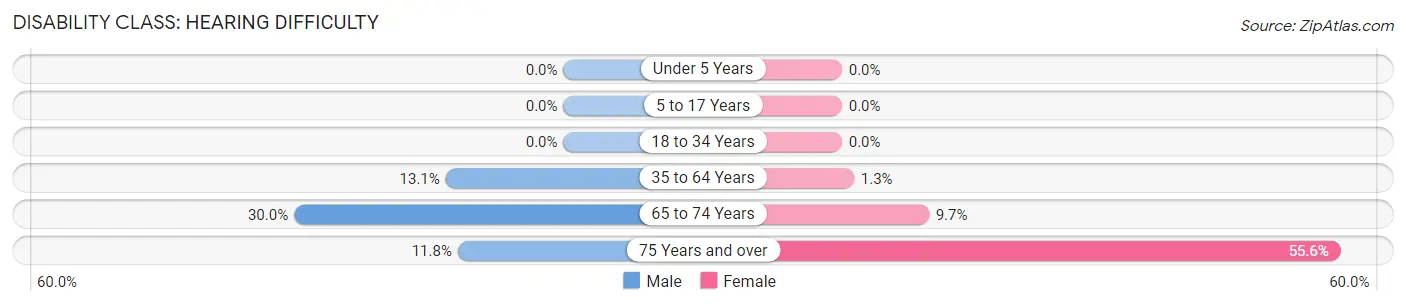
| Age Bracket | Male | Female |
| Under 5 Years | 0 (0.0%) | 0 (0.0%) |
| 5 to 17 Years | 0 (0.0%) | 0 (0.0%) |
| 18 to 34 Years | 0 (0.0%) | 0 (0.0%) |
| 35 to 64 Years | 8 (13.1%) | 3 (1.3%) |
| 65 to 74 Years | 3 (30.0%) | 3 (9.7%) |
| 75 Years and over | 2 (11.8%) | 5 (55.6%) |
Disability Class: Vision Difficulty
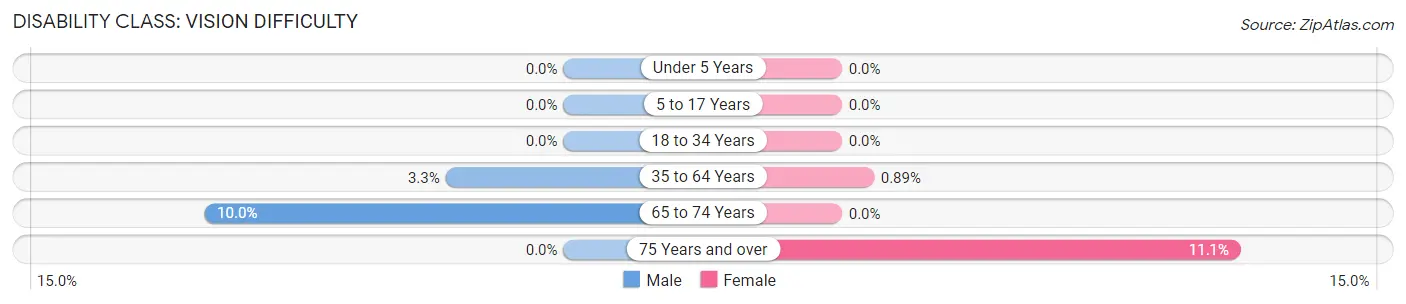
| Age Bracket | Male | Female |
| Under 5 Years | 0 (0.0%) | 0 (0.0%) |
| 5 to 17 Years | 0 (0.0%) | 0 (0.0%) |
| 18 to 34 Years | 0 (0.0%) | 0 (0.0%) |
| 35 to 64 Years | 2 (3.3%) | 2 (0.9%) |
| 65 to 74 Years | 1 (10.0%) | 0 (0.0%) |
| 75 Years and over | 0 (0.0%) | 1 (11.1%) |
Disability Class: Cognitive Difficulty
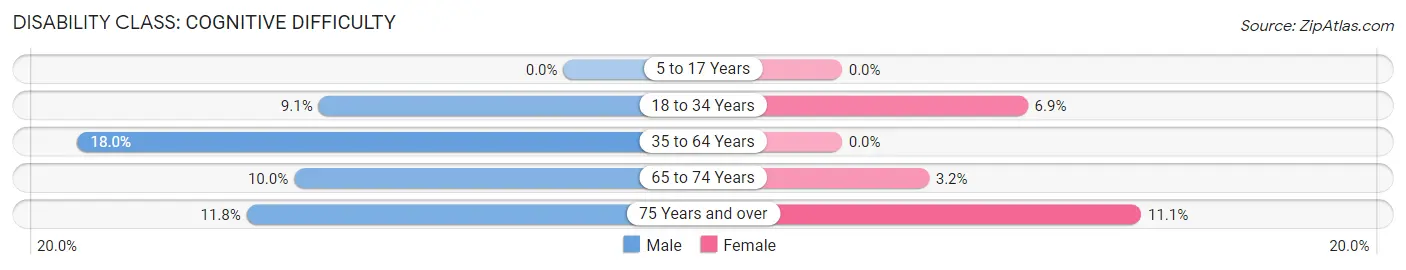
| Age Bracket | Male | Female |
| 5 to 17 Years | 0 (0.0%) | 0 (0.0%) |
| 18 to 34 Years | 3 (9.1%) | 2 (6.9%) |
| 35 to 64 Years | 11 (18.0%) | 0 (0.0%) |
| 65 to 74 Years | 1 (10.0%) | 1 (3.2%) |
| 75 Years and over | 2 (11.8%) | 1 (11.1%) |
Disability Class: Ambulatory Difficulty
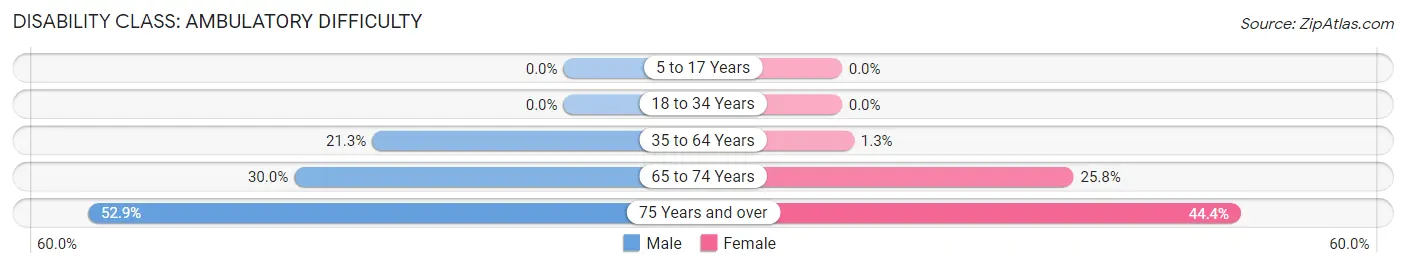
| Age Bracket | Male | Female |
| 5 to 17 Years | 0 (0.0%) | 0 (0.0%) |
| 18 to 34 Years | 0 (0.0%) | 0 (0.0%) |
| 35 to 64 Years | 13 (21.3%) | 3 (1.3%) |
| 65 to 74 Years | 3 (30.0%) | 8 (25.8%) |
| 75 Years and over | 9 (52.9%) | 4 (44.4%) |
Disability Class: Self-Care Difficulty
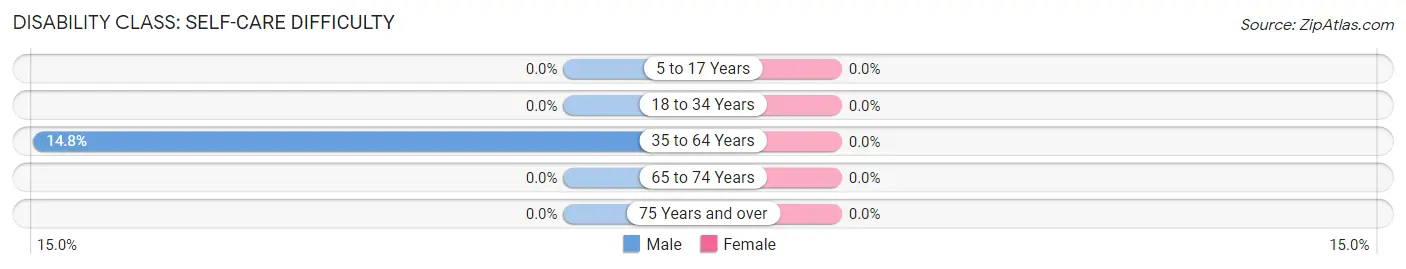
| Age Bracket | Male | Female |
| 5 to 17 Years | 0 (0.0%) | 0 (0.0%) |
| 18 to 34 Years | 0 (0.0%) | 0 (0.0%) |
| 35 to 64 Years | 9 (14.7%) | 0 (0.0%) |
| 65 to 74 Years | 0 (0.0%) | 0 (0.0%) |
| 75 Years and over | 0 (0.0%) | 0 (0.0%) |
Technology Access in Kingsland
Computing Device Access in Kingsland
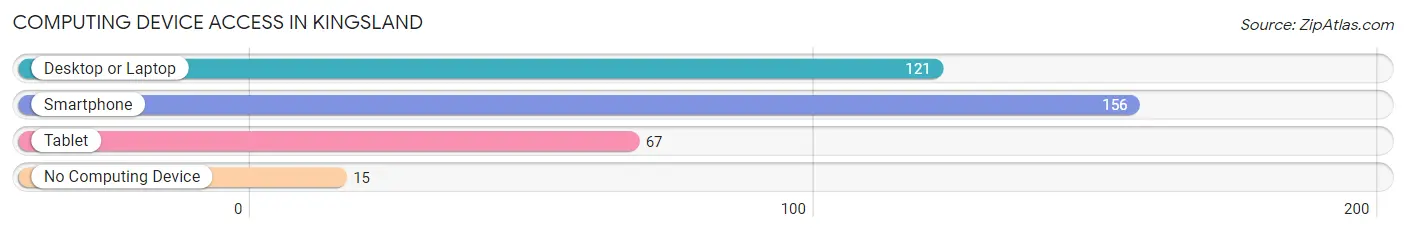
| Device Type | # Households | % Households |
| Desktop or Laptop | 121 | 67.6% |
| Smartphone | 156 | 87.2% |
| Tablet | 67 | 37.4% |
| No Computing Device | 15 | 8.4% |
| Total | 179 | 100.0% |
Internet Access in Kingsland
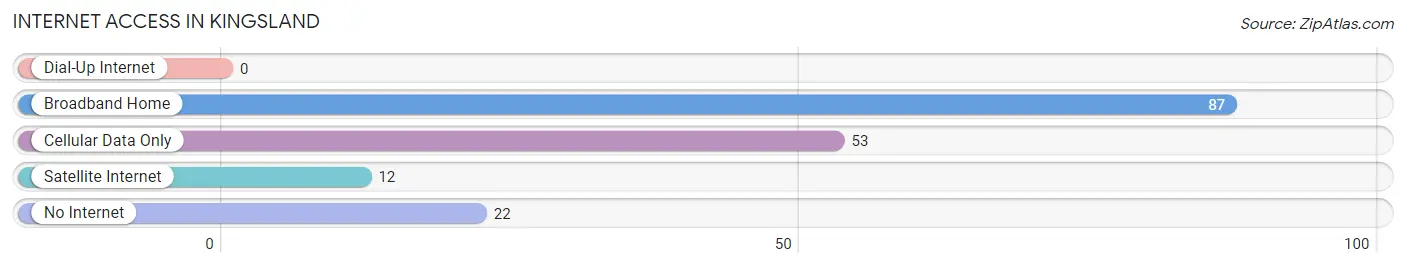
| Internet Type | # Households | % Households |
| Dial-Up Internet | 0 | 0.0% |
| Broadband Home | 87 | 48.6% |
| Cellular Data Only | 53 | 29.6% |
| Satellite Internet | 12 | 6.7% |
| No Internet | 22 | 12.3% |
| Total | 179 | 100.0% |
Kingsland Summary
History
Kingsland, Arkansas is a small town located in Cleveland County, Arkansas. It was founded in 1883 by the Kingsland Land Company, which was owned by the Kingsland family. The town was named after the family, and the first post office was established in 1884. The town was originally a farming community, and the main crops were cotton, corn, and soybeans.
In the early 1900s, the town began to grow and develop. The first school was built in 1906, and the first bank opened in 1908. The town also had a cotton gin, a sawmill, and a gristmill. In the 1920s, the town began to expand and the population grew. The first paved road was built in 1925, and the first telephone service was established in 1927.
In the 1930s, the Great Depression hit the town hard. Many of the businesses closed and the population decreased. However, the town was able to survive and the population began to grow again in the 1940s. The town was incorporated in 1947, and the first mayor was elected in 1948.
In the 1950s, the town continued to grow and develop. The first hospital was built in 1952, and the first library was established in 1954. The town also had a movie theater, a bowling alley, and a golf course.
In the 1960s, the town continued to grow and develop. The first shopping center was built in 1962, and the first fire station was established in 1965. The town also had a water park, a swimming pool, and a skating rink.
In the 1970s, the town continued to grow and develop. The first newspaper was established in 1971, and the first radio station was established in 1975. The town also had a museum, a library, and a community center.
In the 1980s, the town continued to grow and develop. The first high school was built in 1981, and the first public library was established in 1983. The town also had a community college, a hospital, and a senior center.
In the 1990s, the town continued to grow and develop. The first airport was built in 1991, and the first public park was established in 1995. The town also had a golf course, a tennis court, and a skate park.
Geography
Kingsland is located in the southeastern corner of Arkansas, in Cleveland County. It is situated on the banks of the White River, and is surrounded by the Ouachita National Forest. The town is located about 30 miles south of Little Rock, and about 50 miles north of Pine Bluff.
The town has a total area of 2.2 square miles, all of which is land. The terrain is mostly flat, with some rolling hills. The climate is humid subtropical, with hot summers and mild winters.
Economy
The economy of Kingsland is largely based on agriculture. The main crops are cotton, corn, soybeans, and wheat. The town also has a few small businesses, including a grocery store, a hardware store, and a few restaurants.
The town is also home to a few manufacturing companies, including a furniture factory and a plastics factory. The town also has a few small service businesses, such as a car repair shop and a beauty salon.
Demographics
As of the 2010 census, the population of Kingsland was 1,845. The racial makeup of the town was 79.3% White, 17.2% African American, 0.7% Native American, 0.3% Asian, 0.1% Pacific Islander, and 2.4% from other races. Hispanic or Latino of any race were 2.7% of the population.
The median household income in Kingsland was $30,938, and the median family income was $37,813. The per capita income was $15,945. About 17.2% of the population was below the poverty line.
Common Questions
What is Per Capita Income in Kingsland?
Per Capita income in Kingsland is $20,005.
What is the Median Family Income in Kingsland?
Median Family Income in Kingsland is $29,318.
What is the Median Household income in Kingsland?
Median Household Income in Kingsland is $27,583.
What is Income or Wage Gap in Kingsland?
Income or Wage Gap in Kingsland is 70.7%.
Women in Kingsland earn 29.3 cents for every dollar earned by a man.
What is Family Income Deficit in Kingsland?
Family Income Deficit in Kingsland is $7,033.
Families that are below poverty line in Kingsland earn $7,033 less on average than the poverty threshold level.
What is Inequality or Gini Index in Kingsland?
Inequality or Gini Index in Kingsland is 0.46.
What is the Total Population of Kingsland?
Total Population of Kingsland is 529.
What is the Total Male Population of Kingsland?
Total Male Population of Kingsland is 176.
What is the Total Female Population of Kingsland?
Total Female Population of Kingsland is 353.
What is the Ratio of Males per 100 Females in Kingsland?
There are 49.86 Males per 100 Females in Kingsland.
What is the Ratio of Females per 100 Males in Kingsland?
There are 200.57 Females per 100 Males in Kingsland.
What is the Median Population Age in Kingsland?
Median Population Age in Kingsland is 37.6 Years.
What is the Average Family Size in Kingsland
Average Family Size in Kingsland is 4.4 People.
What is the Average Household Size in Kingsland
Average Household Size in Kingsland is 3.0 People.
How Large is the Labor Force in Kingsland?
There are 306 People in the Labor Forcein in Kingsland.
What is the Percentage of People in the Labor Force in Kingsland?
71.3% of People are in the Labor Force in Kingsland.