Judsonia, AR Map & Demographics
Judsonia Map
Judsonia Overview
$30,625
PER CAPITA INCOME
$40,652
AVG FAMILY INCOME
$41,232
AVG HOUSEHOLD INCOME
51.6%
WAGE / INCOME GAP [ % ]
48.4¢/ $1
WAGE / INCOME GAP [ $ ]
0.58
INEQUALITY / GINI INDEX
2,204
TOTAL POPULATION
860
MALE POPULATION
1,344
FEMALE POPULATION
63.99
MALES / 100 FEMALES
156.28
FEMALES / 100 MALES
40.9
MEDIAN AGE
2.7
AVG FAMILY SIZE
2.5
AVG HOUSEHOLD SIZE
848
LABOR FORCE [ PEOPLE ]
47.4%
PERCENT IN LABOR FORCE
1.7%
UNEMPLOYMENT RATE
Judsonia Zip Codes
Judsonia Area Codes
Income in Judsonia
Income Overview in Judsonia
Per Capita Income in Judsonia is $30,625, while median incomes of families and households are $40,652 and $41,232 respectively.
| Characteristic | Number | Measure |
| Per Capita Income | 2,204 | $30,625 |
| Median Family Income | 636 | $40,652 |
| Mean Family Income | 636 | $83,772 |
| Median Household Income | 840 | $41,232 |
| Mean Household Income | 840 | $78,267 |
| Income Deficit | 636 | $0 |
| Wage / Income Gap (%) | 2,204 | 51.64% |
| Wage / Income Gap ($) | 2,204 | 48.36¢ per $1 |
| Gini / Inequality Index | 2,204 | 0.58 |
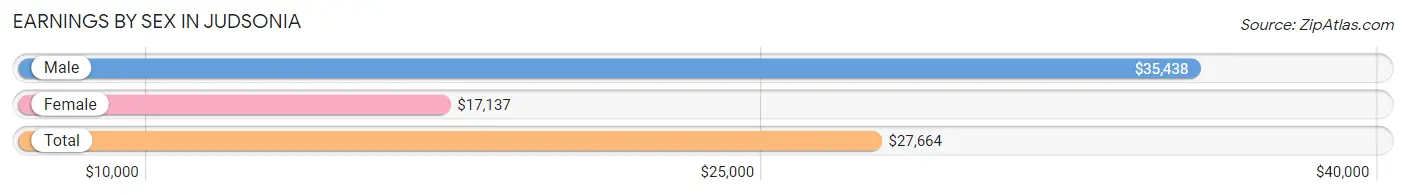
Earnings by Sex in Judsonia
Average Earnings in Judsonia are $27,664, $35,438 for men and $17,137 for women, a difference of 51.6%.
| Sex | Number | Average Earnings |
| Male | 381 (43.2%) | $35,438 |
| Female | 501 (56.8%) | $17,137 |
| Total | 882 (100.0%) | $27,664 |
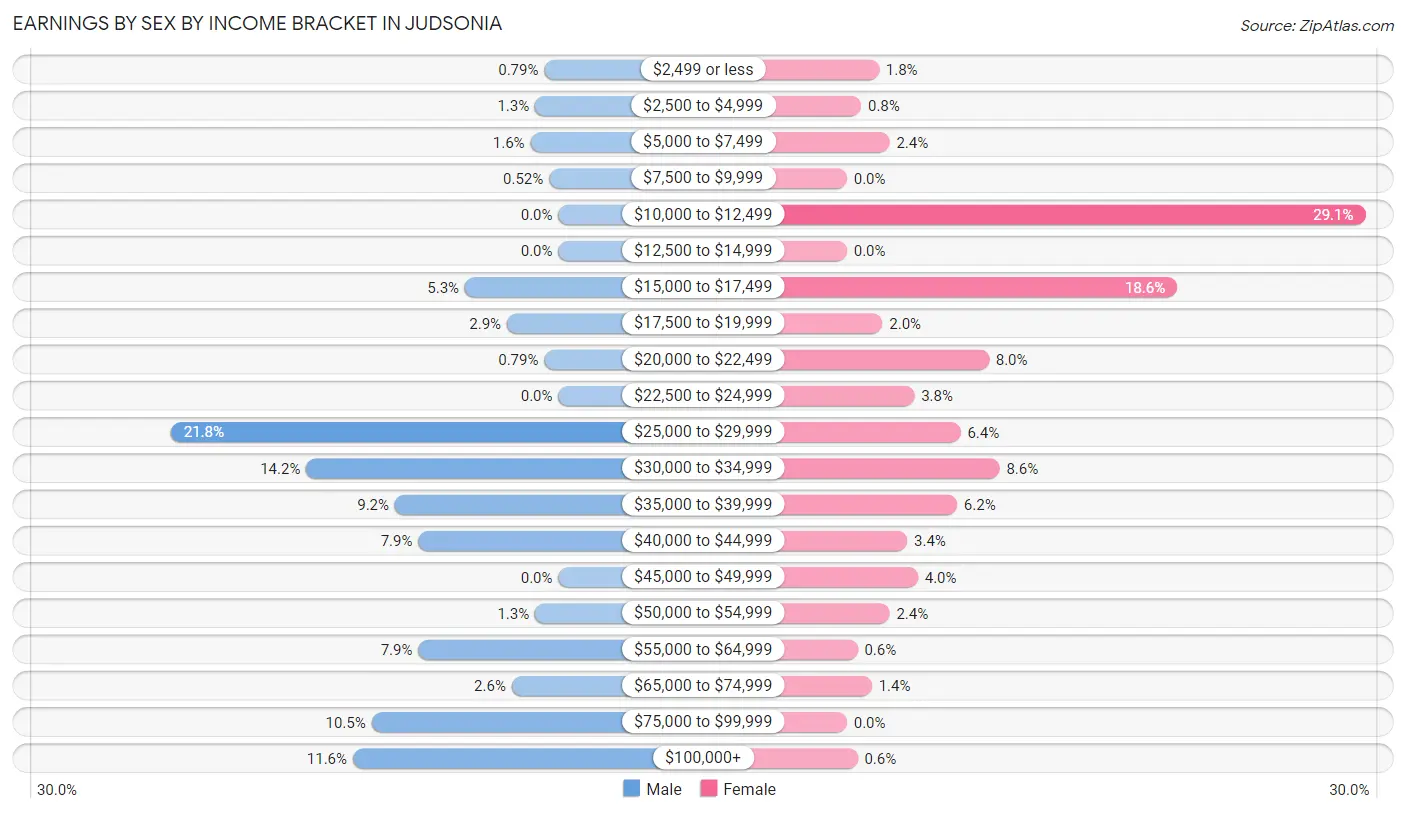
Earnings by Sex by Income Bracket in Judsonia
The most common earnings brackets in Judsonia are $25,000 to $29,999 for men (83 | 21.8%) and $10,000 to $12,499 for women (146 | 29.1%).
| Income | Male | Female |
| $2,499 or less | 3 (0.8%) | 9 (1.8%) |
| $2,500 to $4,999 | 5 (1.3%) | 4 (0.8%) |
| $5,000 to $7,499 | 6 (1.6%) | 12 (2.4%) |
| $7,500 to $9,999 | 2 (0.5%) | 0 (0.0%) |
| $10,000 to $12,499 | 0 (0.0%) | 146 (29.1%) |
| $12,500 to $14,999 | 0 (0.0%) | 0 (0.0%) |
| $15,000 to $17,499 | 20 (5.2%) | 93 (18.6%) |
| $17,500 to $19,999 | 11 (2.9%) | 10 (2.0%) |
| $20,000 to $22,499 | 3 (0.8%) | 40 (8.0%) |
| $22,500 to $24,999 | 0 (0.0%) | 19 (3.8%) |
| $25,000 to $29,999 | 83 (21.8%) | 32 (6.4%) |
| $30,000 to $34,999 | 54 (14.2%) | 43 (8.6%) |
| $35,000 to $39,999 | 35 (9.2%) | 31 (6.2%) |
| $40,000 to $44,999 | 30 (7.9%) | 17 (3.4%) |
| $45,000 to $49,999 | 0 (0.0%) | 20 (4.0%) |
| $50,000 to $54,999 | 5 (1.3%) | 12 (2.4%) |
| $55,000 to $64,999 | 30 (7.9%) | 3 (0.6%) |
| $65,000 to $74,999 | 10 (2.6%) | 7 (1.4%) |
| $75,000 to $99,999 | 40 (10.5%) | 0 (0.0%) |
| $100,000+ | 44 (11.6%) | 3 (0.6%) |
| Total | 381 (100.0%) | 501 (100.0%) |
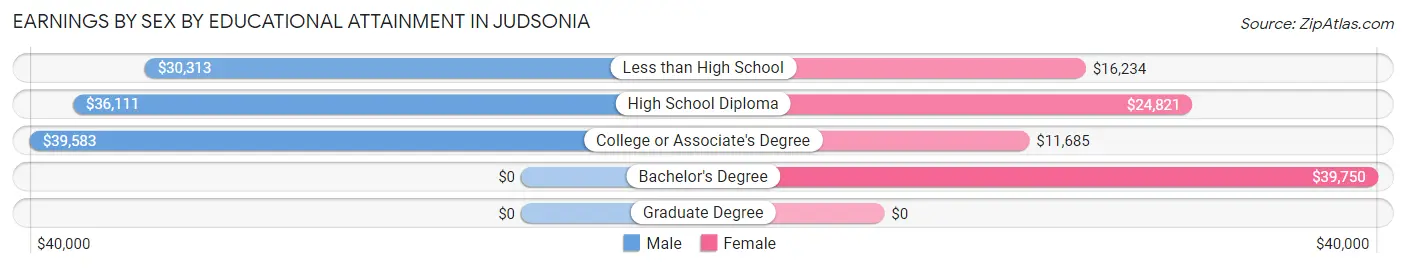
Earnings by Sex by Educational Attainment in Judsonia
Average earnings in Judsonia are $37,313 for men and $17,258 for women, a difference of 53.7%. Men with an educational attainment of college or associate's degree enjoy the highest average annual earnings of $39,583, while those with less than high school education earn the least with $30,313. Women with an educational attainment of bachelor's degree earn the most with the average annual earnings of $39,750, while those with college or associate's degree education have the smallest earnings of $11,685.
| Educational Attainment | Male Income | Female Income |
| Less than High School | $30,313 | $16,234 |
| High School Diploma | $36,111 | $24,821 |
| College or Associate's Degree | $39,583 | $11,685 |
| Bachelor's Degree | - | - |
| Graduate Degree | - | - |
| Total | $37,313 | $17,258 |
Family Income in Judsonia
Family Income Brackets in Judsonia
According to the Judsonia family income data, there are 159 families falling into the $10,000 to $14,999 income range, which is the most common income bracket and makes up 25.0% of all families.
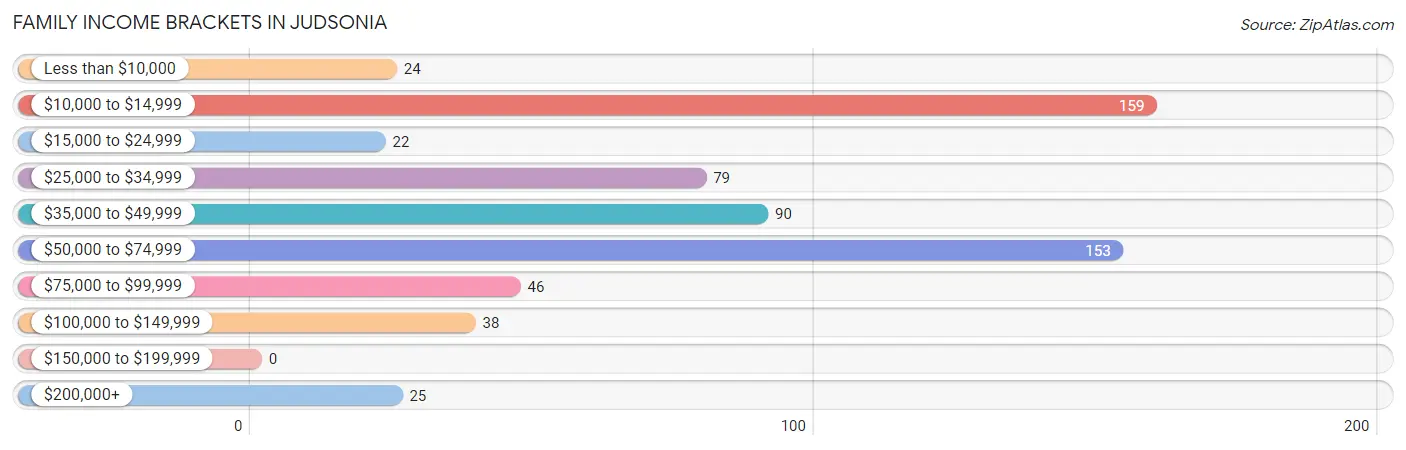
| Income Bracket | # Families | % Families |
| Less than $10,000 | 24 | 3.8% |
| $10,000 to $14,999 | 159 | 25.0% |
| $15,000 to $24,999 | 22 | 3.5% |
| $25,000 to $34,999 | 79 | 12.4% |
| $35,000 to $49,999 | 90 | 14.2% |
| $50,000 to $74,999 | 153 | 24.1% |
| $75,000 to $99,999 | 46 | 7.2% |
| $100,000 to $149,999 | 38 | 6.0% |
| $150,000 to $199,999 | 0 | 0.0% |
| $200,000+ | 25 | 3.9% |
Family Income by Famaliy Size in Judsonia
4-person families (58 | 9.1%) account for the highest median family income in Judsonia with $75,000 per family, while 4-person families (58 | 9.1%) have the highest median income of $18,750 per family member.
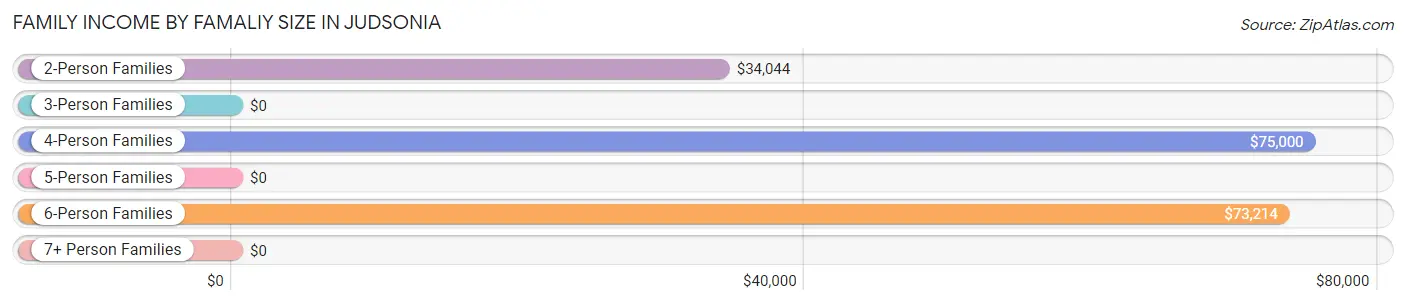
| Income Bracket | # Families | Median Income |
| 2-Person Families | 381 (59.9%) | $34,044 |
| 3-Person Families | 163 (25.6%) | $0 |
| 4-Person Families | 58 (9.1%) | $75,000 |
| 5-Person Families | 4 (0.6%) | $0 |
| 6-Person Families | 30 (4.7%) | $73,214 |
| 7+ Person Families | 0 (0.0%) | $0 |
| Total | 636 (100.0%) | $40,652 |
Family Income by Number of Earners in Judsonia
The median family income in Judsonia is $40,652, with families comprising 3+ earners (31) having the highest median family income of $73,884, while families with 1 earner (276) have the lowest median family income of $30,119, accounting for 4.9% and 43.4% of families, respectively.
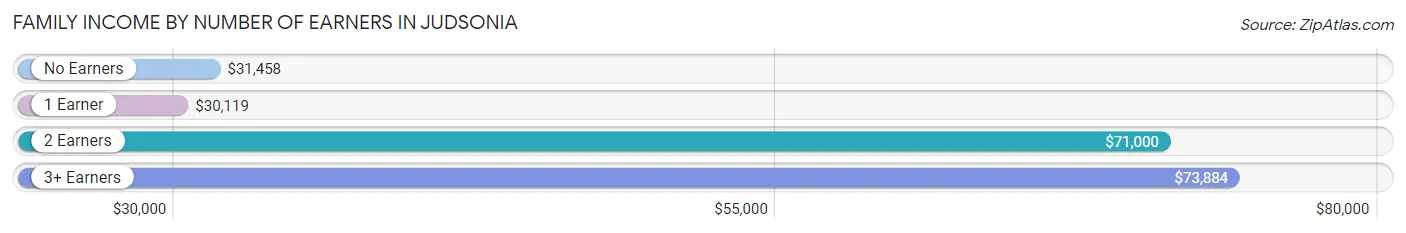
| Number of Earners | # Families | Median Income |
| No Earners | 209 (32.9%) | $31,458 |
| 1 Earner | 276 (43.4%) | $30,119 |
| 2 Earners | 120 (18.9%) | $71,000 |
| 3+ Earners | 31 (4.9%) | $73,884 |
| Total | 636 (100.0%) | $40,652 |
Household Income in Judsonia
Household Income Brackets in Judsonia
With 230 households falling in the category, the $25,000 to $34,999 income range is the most frequent in Judsonia, accounting for 27.4% of all households.
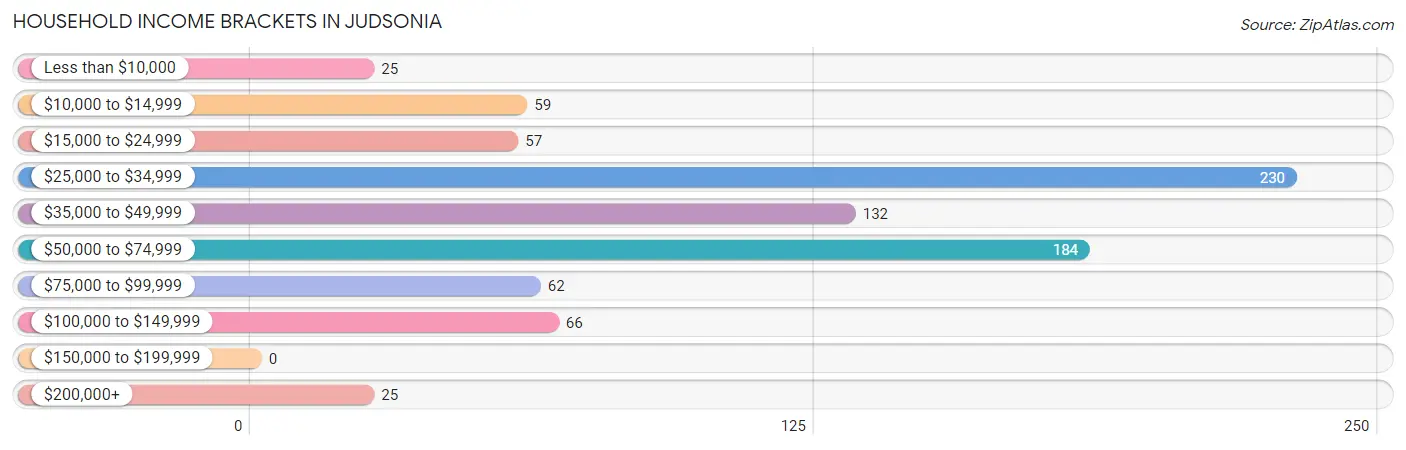
| Income Bracket | # Households | % Households |
| Less than $10,000 | 25 | 3.0% |
| $10,000 to $14,999 | 59 | 7.0% |
| $15,000 to $24,999 | 57 | 6.8% |
| $25,000 to $34,999 | 230 | 27.4% |
| $35,000 to $49,999 | 132 | 15.7% |
| $50,000 to $74,999 | 184 | 21.9% |
| $75,000 to $99,999 | 62 | 7.4% |
| $100,000 to $149,999 | 66 | 7.9% |
| $150,000 to $199,999 | 0 | 0.0% |
| $200,000+ | 25 | 3.0% |
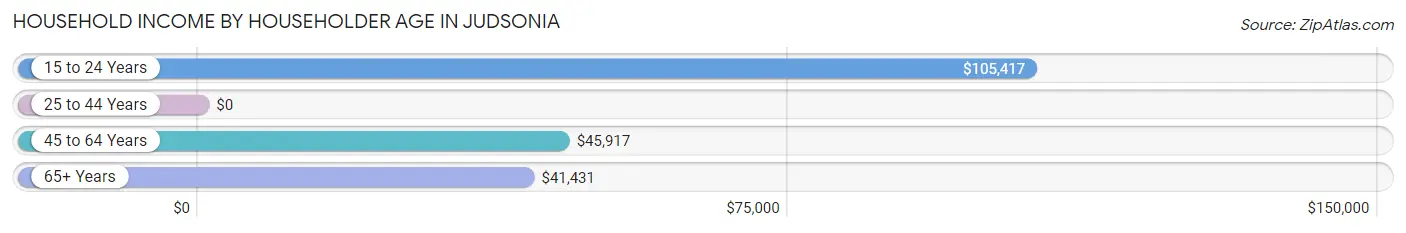
Household Income by Householder Age in Judsonia
The median household income in Judsonia is $41,232, with the highest median household income of $105,417 found in the 15 to 24 years age bracket for the primary householder. A total of 40 households (4.8%) fall into this category. Meanwhile, the 25 to 44 years age bracket for the primary householder has the lowest median household income of $0, with 276 households (32.9%) in this group.
| Income Bracket | # Households | Median Income |
| 15 to 24 Years | 40 (4.8%) | $105,417 |
| 25 to 44 Years | 276 (32.9%) | $0 |
| 45 to 64 Years | 257 (30.6%) | $45,917 |
| 65+ Years | 267 (31.8%) | $41,431 |
| Total | 840 (100.0%) | $41,232 |
Poverty in Judsonia
Income Below Poverty by Sex and Age in Judsonia
With 6.9% poverty level for males and 33.8% for females among the residents of Judsonia, 45 to 54 year old males and under 5 year old females are the most vulnerable to poverty, with 34 males (39.1%) and 85 females (78.7%) in their respective age groups living below the poverty level.
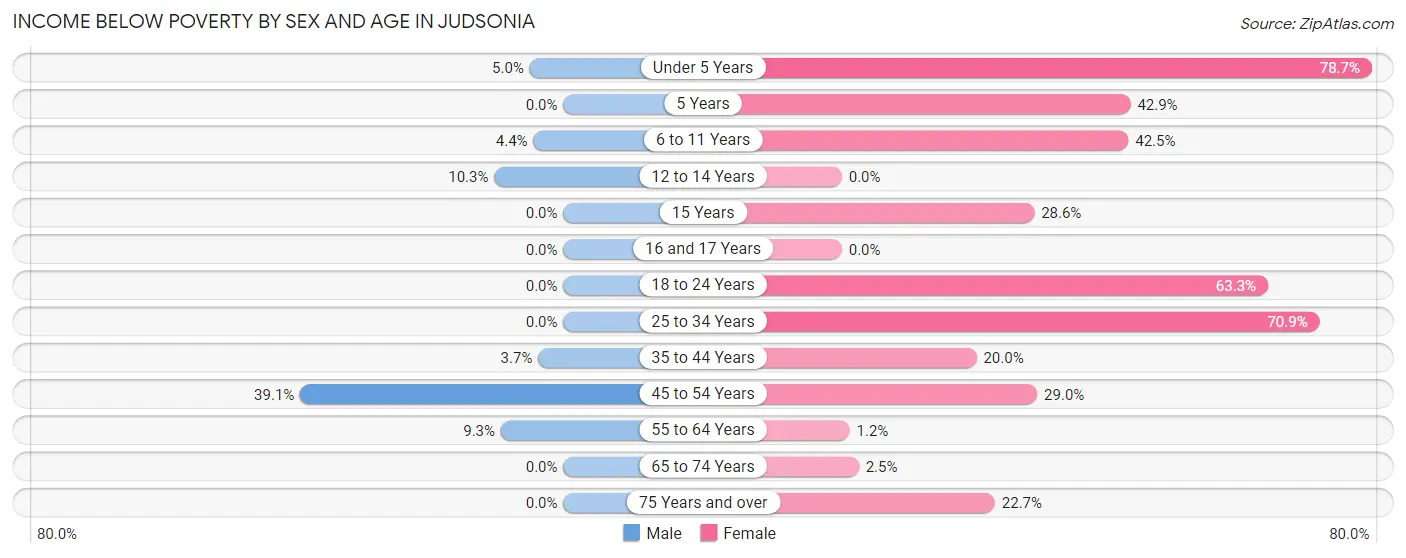
| Age Bracket | Male | Female |
| Under 5 Years | 2 (5.0%) | 85 (78.7%) |
| 5 Years | 0 (0.0%) | 3 (42.9%) |
| 6 to 11 Years | 2 (4.4%) | 57 (42.5%) |
| 12 to 14 Years | 4 (10.3%) | 0 (0.0%) |
| 15 Years | 0 (0.0%) | 2 (28.6%) |
| 16 and 17 Years | 0 (0.0%) | 0 (0.0%) |
| 18 to 24 Years | 0 (0.0%) | 31 (63.3%) |
| 25 to 34 Years | 0 (0.0%) | 161 (70.9%) |
| 35 to 44 Years | 5 (3.7%) | 37 (20.0%) |
| 45 to 54 Years | 34 (39.1%) | 38 (29.0%) |
| 55 to 64 Years | 9 (9.3%) | 2 (1.2%) |
| 65 to 74 Years | 0 (0.0%) | 5 (2.5%) |
| 75 Years and over | 0 (0.0%) | 5 (22.7%) |
| Total | 56 (6.9%) | 426 (33.8%) |
Income Above Poverty by Sex and Age in Judsonia
According to the poverty statistics in Judsonia, males aged 15 years and females aged 12 to 14 years are the age groups that are most secure financially, with 100.0% of males and 100.0% of females in these age groups living above the poverty line.
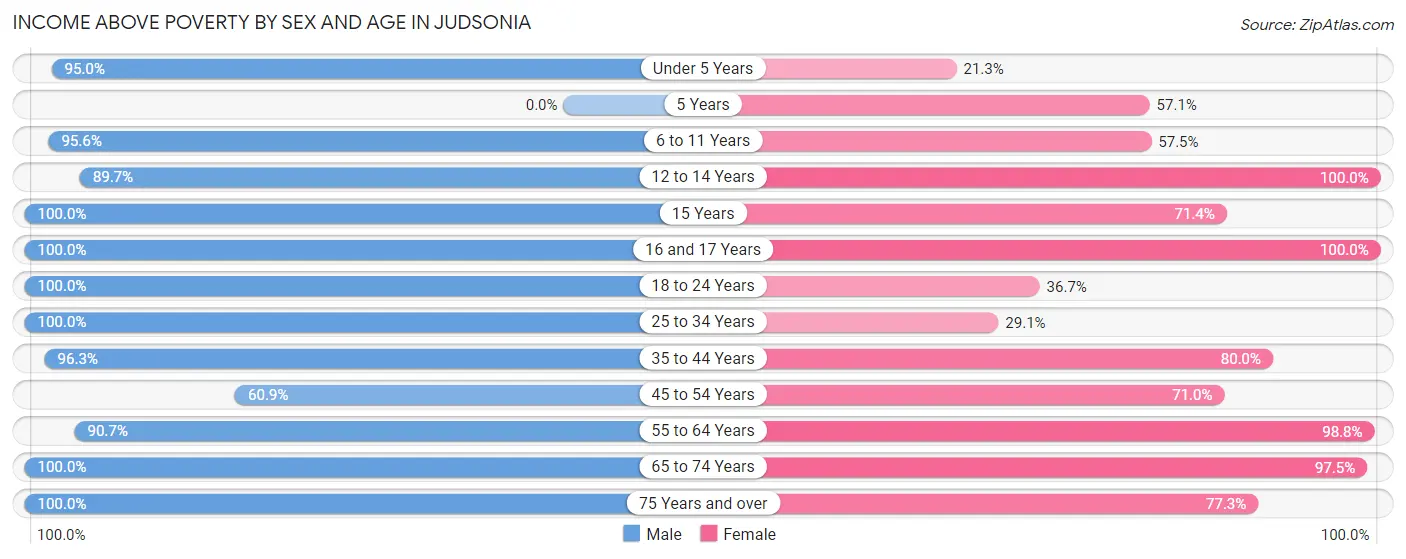
| Age Bracket | Male | Female |
| Under 5 Years | 38 (95.0%) | 23 (21.3%) |
| 5 Years | 0 (0.0%) | 4 (57.1%) |
| 6 to 11 Years | 43 (95.6%) | 77 (57.5%) |
| 12 to 14 Years | 35 (89.7%) | 16 (100.0%) |
| 15 Years | 8 (100.0%) | 5 (71.4%) |
| 16 and 17 Years | 4 (100.0%) | 4 (100.0%) |
| 18 to 24 Years | 91 (100.0%) | 18 (36.7%) |
| 25 to 34 Years | 73 (100.0%) | 66 (29.1%) |
| 35 to 44 Years | 129 (96.3%) | 148 (80.0%) |
| 45 to 54 Years | 53 (60.9%) | 93 (71.0%) |
| 55 to 64 Years | 88 (90.7%) | 170 (98.8%) |
| 65 to 74 Years | 135 (100.0%) | 194 (97.5%) |
| 75 Years and over | 63 (100.0%) | 17 (77.3%) |
| Total | 760 (93.1%) | 835 (66.2%) |
Income Below Poverty Among Married-Couple Families in Judsonia
The poverty statistics for married-couple families in Judsonia show that 3.4% or 12 of the total 353 families live below the poverty line. Families with 3 or 4 children have the highest poverty rate of 6.9%, comprising of 2 families. On the other hand, families with 1 or 2 children have the lowest poverty rate of 0.0%, which includes 0 families.
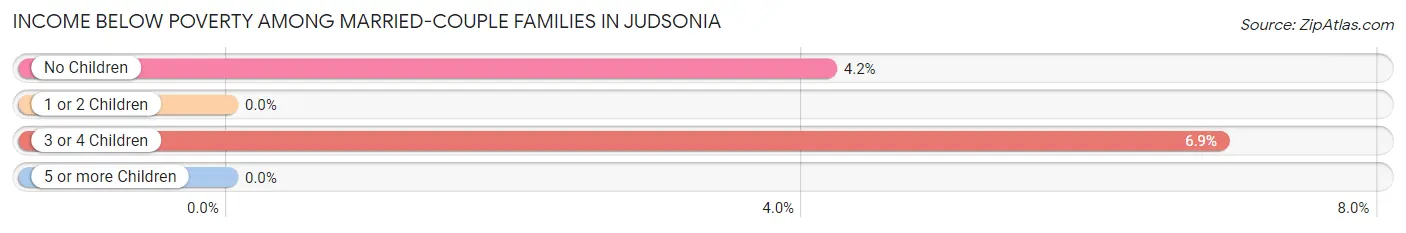
| Children | Above Poverty | Below Poverty |
| No Children | 230 (95.8%) | 10 (4.2%) |
| 1 or 2 Children | 84 (100.0%) | 0 (0.0%) |
| 3 or 4 Children | 27 (93.1%) | 2 (6.9%) |
| 5 or more Children | 0 (0.0%) | 0 (0.0%) |
| Total | 341 (96.6%) | 12 (3.4%) |
Income Below Poverty Among Single-Parent Households in Judsonia
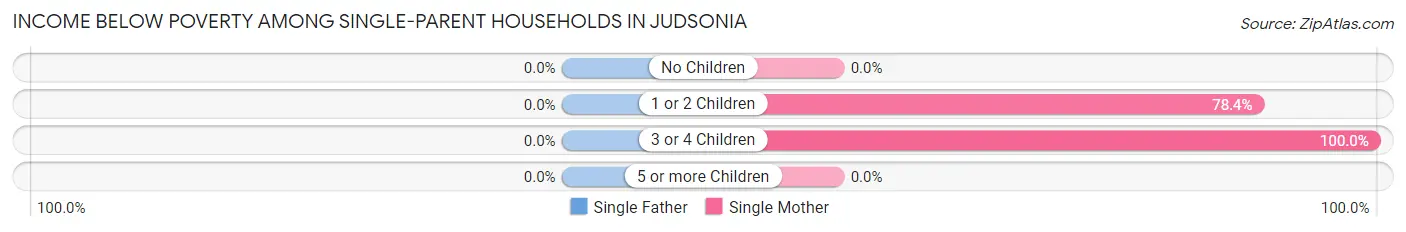
| Children | Single Father | Single Mother |
| No Children | 0 (0.0%) | 0 (0.0%) |
| 1 or 2 Children | 0 (0.0%) | 181 (78.3%) |
| 3 or 4 Children | 0 (0.0%) | 1 (100.0%) |
| 5 or more Children | 0 (0.0%) | 0 (0.0%) |
| Total | 0 (0.0%) | 182 (65.9%) |
Income Below Poverty Among Married-Couple vs Single-Parent Households in Judsonia
The poverty data for Judsonia shows that 12 of the married-couple family households (3.4%) and 182 of the single-parent households (64.3%) are living below the poverty level. Within the married-couple family households, those with 3 or 4 children have the highest poverty rate, with 2 households (6.9%) falling below the poverty line. Among the single-parent households, those with 3 or 4 children have the highest poverty rate, with 1 household (100.0%) living below poverty.
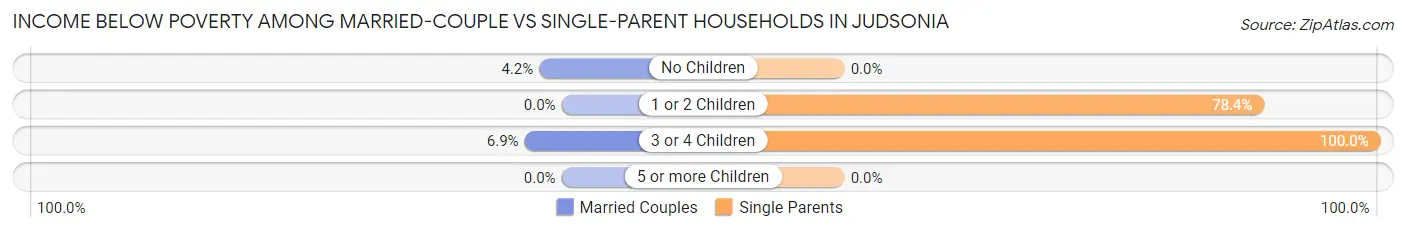
| Children | Married-Couple Families | Single-Parent Households |
| No Children | 10 (4.2%) | 0 (0.0%) |
| 1 or 2 Children | 0 (0.0%) | 181 (78.3%) |
| 3 or 4 Children | 2 (6.9%) | 1 (100.0%) |
| 5 or more Children | 0 (0.0%) | 0 (0.0%) |
| Total | 12 (3.4%) | 182 (64.3%) |
Race in Judsonia
The most populous races in Judsonia are White / Caucasian (1,957 | 88.8%), Two or more Races (224 | 10.2%), and Hispanic or Latino (152 | 6.9%).
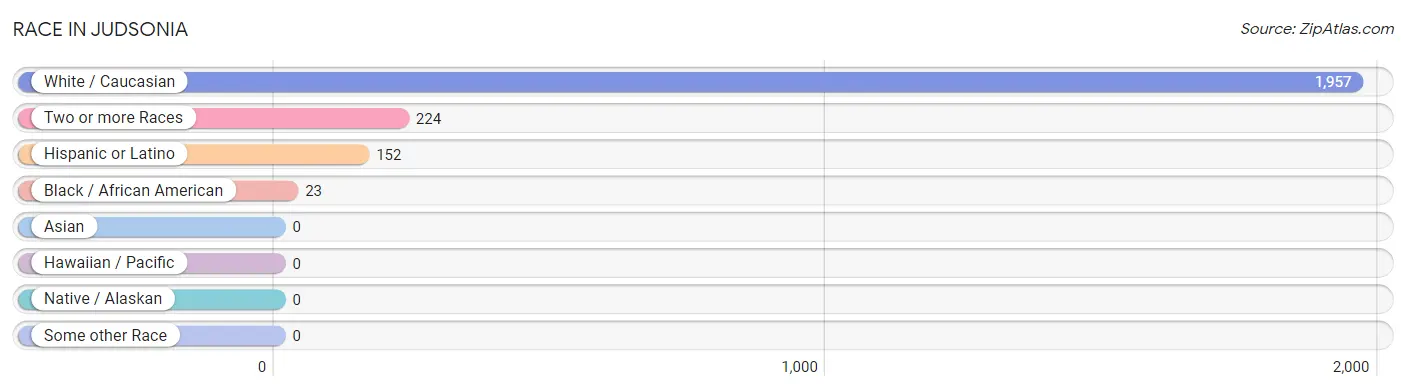
| Race | # Population | % Population |
| Asian | 0 | 0.0% |
| Black / African American | 23 | 1.0% |
| Hawaiian / Pacific | 0 | 0.0% |
| Hispanic or Latino | 152 | 6.9% |
| Native / Alaskan | 0 | 0.0% |
| White / Caucasian | 1,957 | 88.8% |
| Two or more Races | 224 | 10.2% |
| Some other Race | 0 | 0.0% |
| Total | 2,204 | 100.0% |
Ancestry in Judsonia
The most populous ancestries reported in Judsonia are English (270 | 12.2%), American (228 | 10.3%), Mexican (149 | 6.8%), Irish (134 | 6.1%), and German (114 | 5.2%), together accounting for 40.6% of all Judsonia residents.
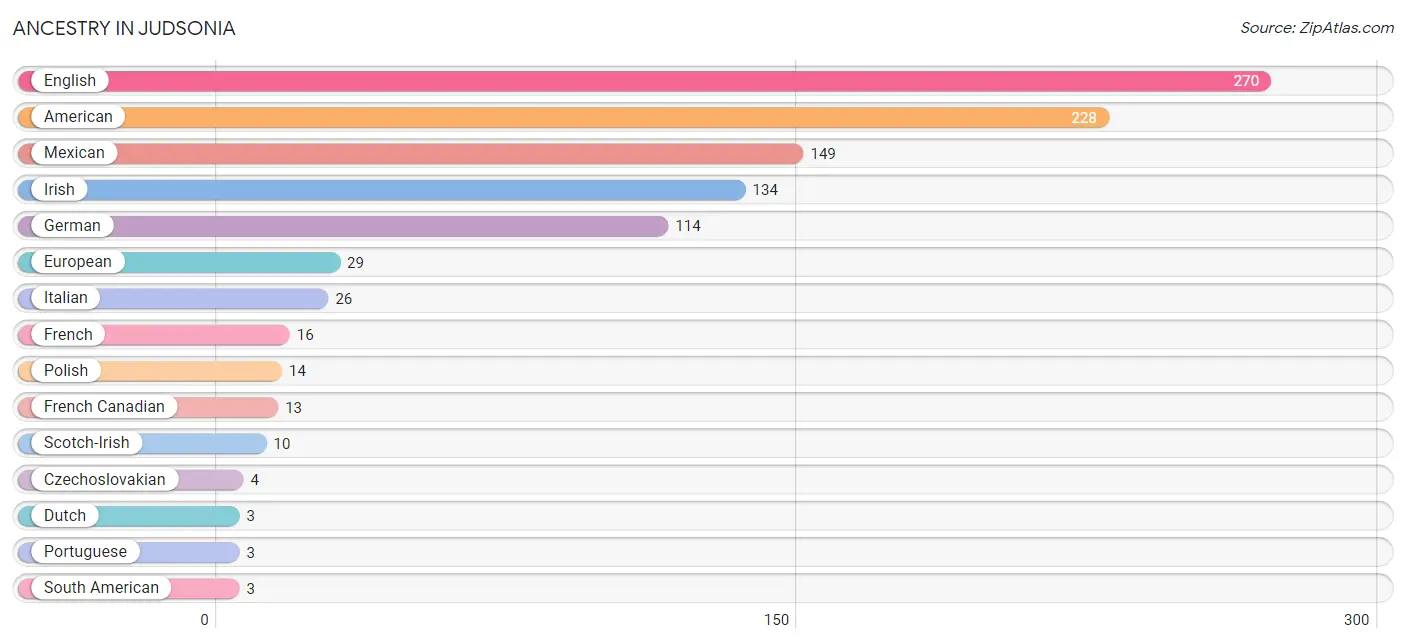
| Ancestry | # Population | % Population |
| American | 228 | 10.3% |
| Blackfeet | 1 | 0.1% |
| Czechoslovakian | 4 | 0.2% |
| Dutch | 3 | 0.1% |
| English | 270 | 12.2% |
| European | 29 | 1.3% |
| French | 16 | 0.7% |
| French Canadian | 13 | 0.6% |
| German | 114 | 5.2% |
| Irish | 134 | 6.1% |
| Italian | 26 | 1.2% |
| Mexican | 149 | 6.8% |
| Polish | 14 | 0.6% |
| Portuguese | 3 | 0.1% |
| Scotch-Irish | 10 | 0.4% |
| South American | 3 | 0.1% |
| Venezuelan | 3 | 0.1% | View All 17 Rows |
Immigrants in Judsonia
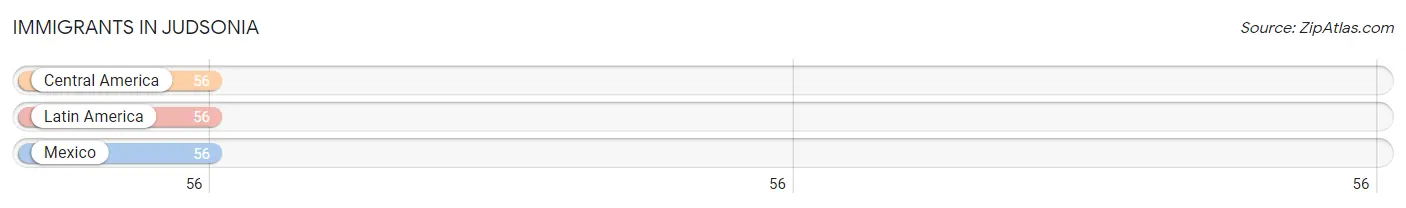
The most numerous immigrant groups reported in Judsonia came from Central America (56 | 2.5%), Latin America (56 | 2.5%), and Mexico (56 | 2.5%), together accounting for 7.6% of all Judsonia residents.
| Immigration Origin | # Population | % Population |
| Central America | 56 | 2.5% |
| Latin America | 56 | 2.5% |
| Mexico | 56 | 2.5% | View All 3 Rows |
Sex and Age in Judsonia
Sex and Age in Judsonia
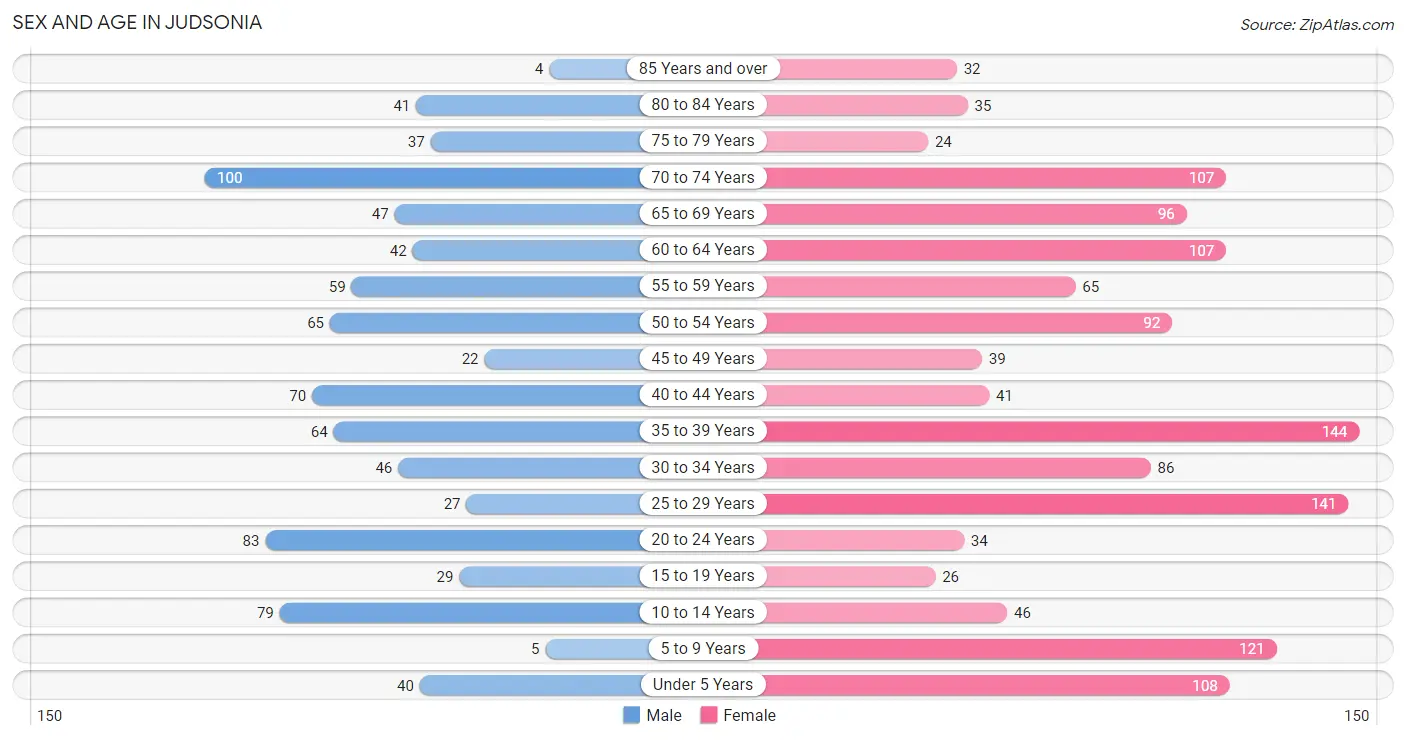
The most populous age groups in Judsonia are 70 to 74 Years (100 | 11.6%) for men and 35 to 39 Years (144 | 10.7%) for women.
| Age Bracket | Male | Female |
| Under 5 Years | 40 (4.6%) | 108 (8.0%) |
| 5 to 9 Years | 5 (0.6%) | 121 (9.0%) |
| 10 to 14 Years | 79 (9.2%) | 46 (3.4%) |
| 15 to 19 Years | 29 (3.4%) | 26 (1.9%) |
| 20 to 24 Years | 83 (9.7%) | 34 (2.5%) |
| 25 to 29 Years | 27 (3.1%) | 141 (10.5%) |
| 30 to 34 Years | 46 (5.3%) | 86 (6.4%) |
| 35 to 39 Years | 64 (7.4%) | 144 (10.7%) |
| 40 to 44 Years | 70 (8.1%) | 41 (3.0%) |
| 45 to 49 Years | 22 (2.6%) | 39 (2.9%) |
| 50 to 54 Years | 65 (7.6%) | 92 (6.9%) |
| 55 to 59 Years | 59 (6.9%) | 65 (4.8%) |
| 60 to 64 Years | 42 (4.9%) | 107 (8.0%) |
| 65 to 69 Years | 47 (5.5%) | 96 (7.1%) |
| 70 to 74 Years | 100 (11.6%) | 107 (8.0%) |
| 75 to 79 Years | 37 (4.3%) | 24 (1.8%) |
| 80 to 84 Years | 41 (4.8%) | 35 (2.6%) |
| 85 Years and over | 4 (0.5%) | 32 (2.4%) |
| Total | 860 (100.0%) | 1,344 (100.0%) |
Families and Households in Judsonia
Median Family Size in Judsonia
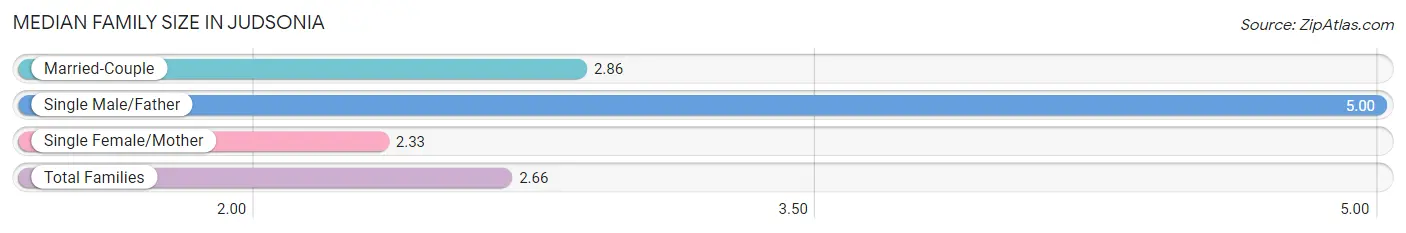
The median family size in Judsonia is 2.66 persons per family, with single male/father families (7 | 1.1%) accounting for the largest median family size of 5 persons per family. On the other hand, single female/mother families (276 | 43.4%) represent the smallest median family size with 2.33 persons per family.
| Family Type | # Families | Family Size |
| Married-Couple | 353 (55.5%) | 2.86 |
| Single Male/Father | 7 (1.1%) | 5.00 |
| Single Female/Mother | 276 (43.4%) | 2.33 |
| Total Families | 636 (100.0%) | 2.66 |
Median Household Size in Judsonia
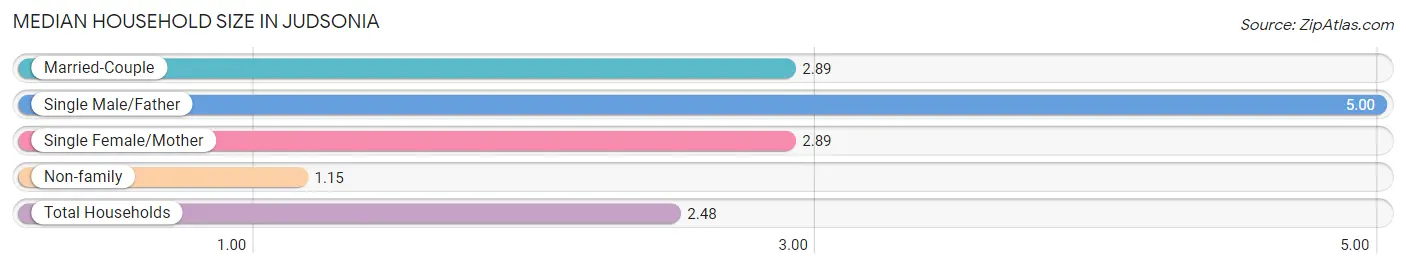
The median household size in Judsonia is 2.48 persons per household, with single male/father households (7 | 0.8%) accounting for the largest median household size of 5 persons per household. non-family households (204 | 24.3%) represent the smallest median household size with 1.15 persons per household.
| Household Type | # Households | Household Size |
| Married-Couple | 353 (42.0%) | 2.89 |
| Single Male/Father | 7 (0.8%) | 5.00 |
| Single Female/Mother | 276 (32.9%) | 2.89 |
| Non-family | 204 (24.3%) | 1.15 |
| Total Households | 840 (100.0%) | 2.48 |
Household Size by Marriage Status in Judsonia
Out of a total of 840 households in Judsonia, 636 (75.7%) are family households, while 204 (24.3%) are nonfamily households. The most numerous type of family households are 3-person households, comprising 275, and the most common type of nonfamily households are 1-person households, comprising 185.
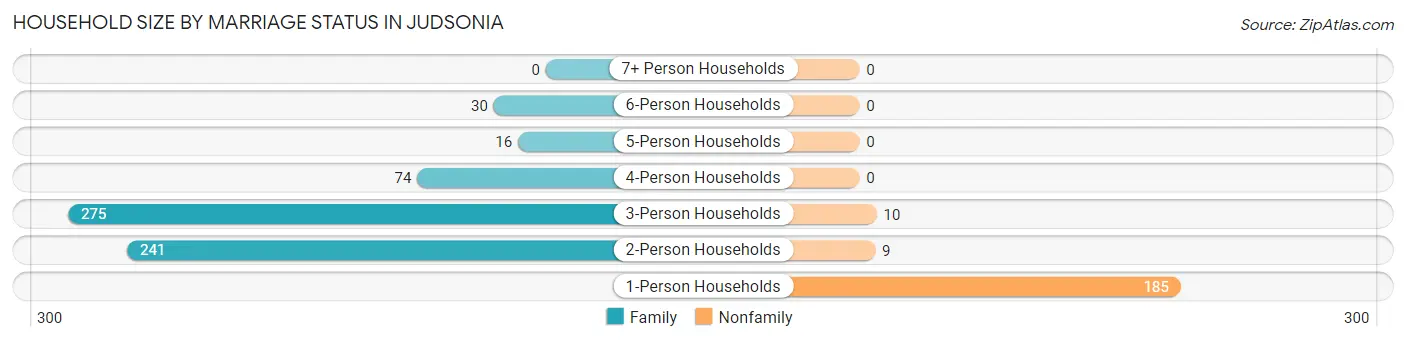
| Household Size | Family Households | Nonfamily Households |
| 1-Person Households | - | 185 (22.0%) |
| 2-Person Households | 241 (28.7%) | 9 (1.1%) |
| 3-Person Households | 275 (32.7%) | 10 (1.2%) |
| 4-Person Households | 74 (8.8%) | 0 (0.0%) |
| 5-Person Households | 16 (1.9%) | 0 (0.0%) |
| 6-Person Households | 30 (3.6%) | 0 (0.0%) |
| 7+ Person Households | 0 (0.0%) | 0 (0.0%) |
| Total | 636 (75.7%) | 204 (24.3%) |
Female Fertility in Judsonia
Fertility by Age in Judsonia
Average fertility rate in Judsonia is 19.0 births per 1,000 women. Women in the age bracket of 35 to 50 years have the highest fertility rate with 31.0 births per 1,000 women. Women in the age bracket of 35 to 50 years acount for 70.0% of all women with births.
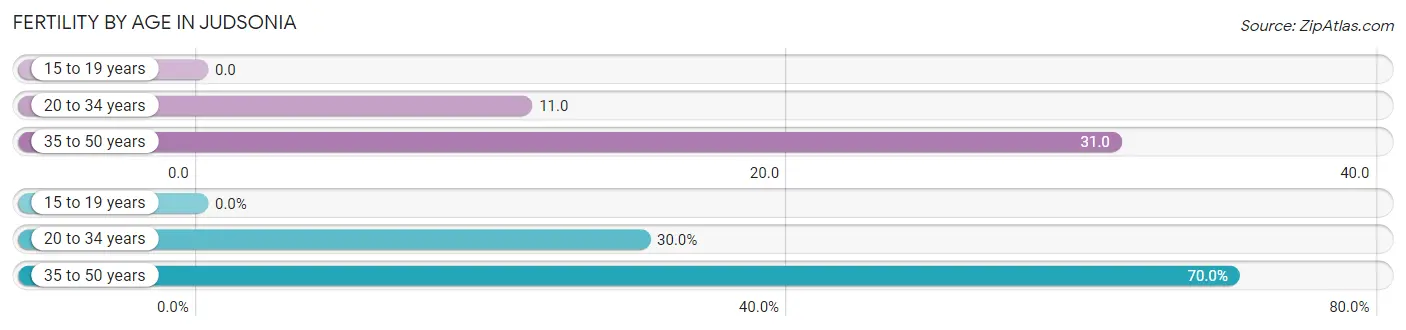
| Age Bracket | Women with Births | Births / 1,000 Women |
| 15 to 19 years | 0 (0.0%) | 0.0 |
| 20 to 34 years | 3 (30.0%) | 11.0 |
| 35 to 50 years | 7 (70.0%) | 31.0 |
| Total | 10 (100.0%) | 19.0 |
Fertility by Age by Marriage Status in Judsonia
70.0% of women with births (10) in Judsonia are married. The highest percentage of unmarried women with births falls into 20 to 34 years age bracket with 100.0% of them unmarried at the time of birth, while the lowest percentage of unmarried women with births belong to 35 to 50 years age bracket with 0.0% of them unmarried.
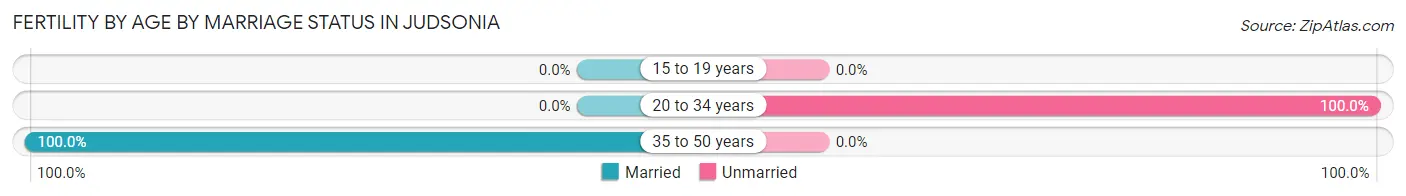
| Age Bracket | Married | Unmarried |
| 15 to 19 years | 0 (0.0%) | 0 (0.0%) |
| 20 to 34 years | 0 (0.0%) | 3 (100.0%) |
| 35 to 50 years | 7 (100.0%) | 0 (0.0%) |
| Total | 7 (70.0%) | 3 (30.0%) |
Fertility by Education in Judsonia
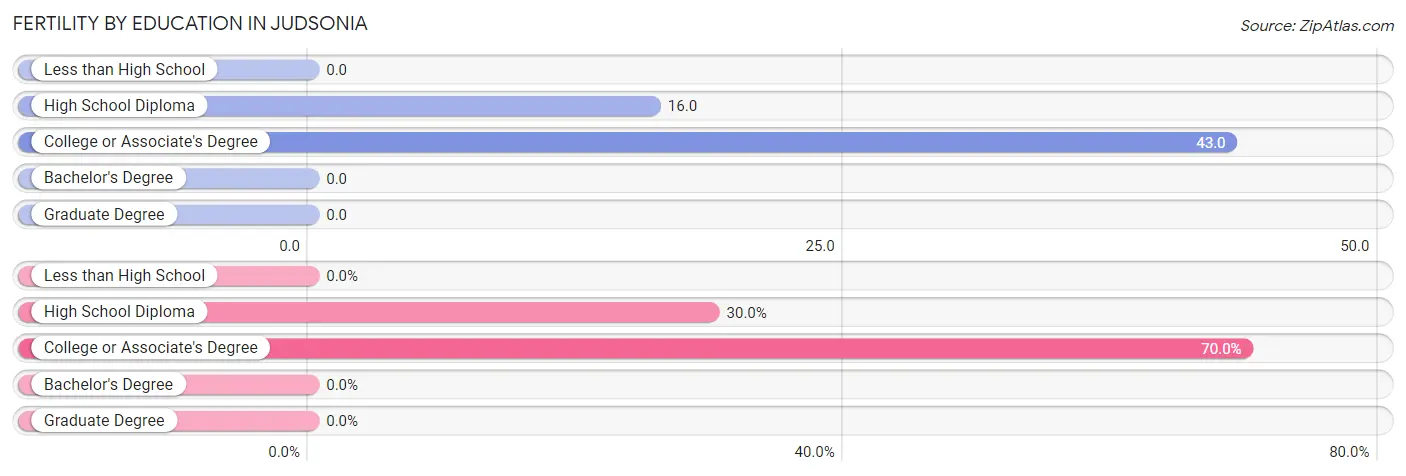
| Educational Attainment | Women with Births | Births / 1,000 Women |
| Less than High School | 0 (0.0%) | 0.0 |
| High School Diploma | 3 (30.0%) | 16.0 |
| College or Associate's Degree | 7 (70.0%) | 43.0 |
| Bachelor's Degree | 0 (0.0%) | 0.0 |
| Graduate Degree | 0 (0.0%) | 0.0 |
| Total | 10 (100.0%) | 19.0 |
Fertility by Education by Marriage Status in Judsonia
30.0% of women with births in Judsonia are unmarried. Women with the educational attainment of college or associate's degree are most likely to be married with 100.0% of them married at childbirth, while women with the educational attainment of high school diploma are least likely to be married with 100.0% of them unmarried at childbirth.
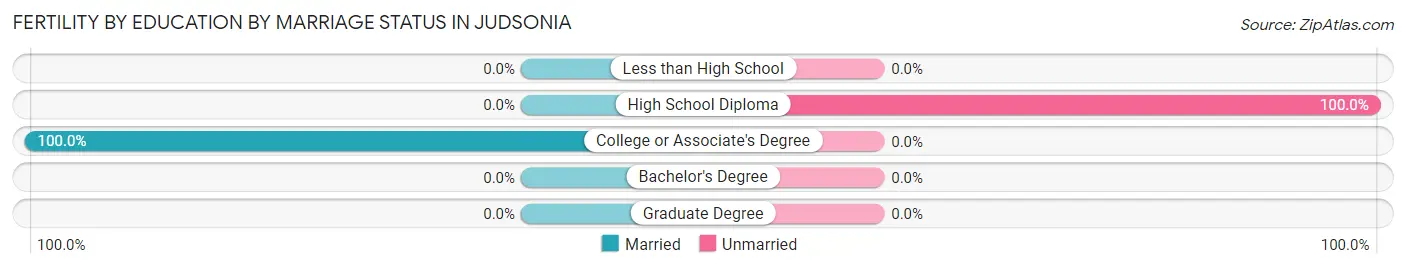
| Educational Attainment | Married | Unmarried |
| Less than High School | 0 (0.0%) | 0 (0.0%) |
| High School Diploma | 0 (0.0%) | 3 (100.0%) |
| College or Associate's Degree | 7 (100.0%) | 0 (0.0%) |
| Bachelor's Degree | 0 (0.0%) | 0 (0.0%) |
| Graduate Degree | 0 (0.0%) | 0 (0.0%) |
| Total | 7 (70.0%) | 3 (30.0%) |
Employment Characteristics in Judsonia
Employment by Class of Employer in Judsonia
Among the 814 employed individuals in Judsonia, private company employees (654 | 80.3%), not-for-profit organizations (57 | 7.0%), and local government employees (47 | 5.8%) make up the most common classes of employment.
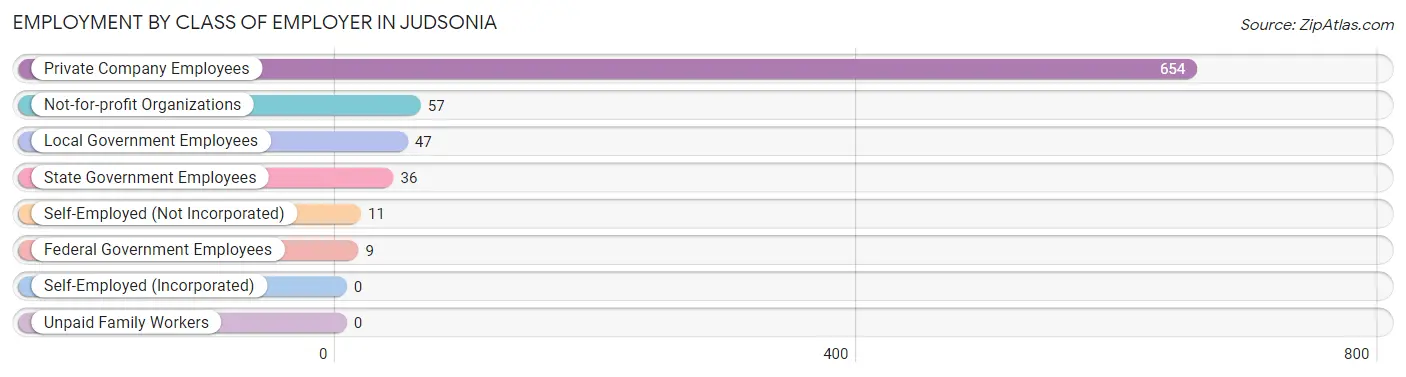
| Employer Class | # Employees | % Employees |
| Private Company Employees | 654 | 80.3% |
| Self-Employed (Incorporated) | 0 | 0.0% |
| Self-Employed (Not Incorporated) | 11 | 1.3% |
| Not-for-profit Organizations | 57 | 7.0% |
| Local Government Employees | 47 | 5.8% |
| State Government Employees | 36 | 4.4% |
| Federal Government Employees | 9 | 1.1% |
| Unpaid Family Workers | 0 | 0.0% |
| Total | 814 | 100.0% |
Employment Status by Age in Judsonia
According to the labor force statistics for Judsonia, out of the total population over 16 years of age (1,790), 47.4% or 848 individuals are in the labor force, with 1.7% or 14 of them unemployed. The age group with the highest labor force participation rate is 25 to 29 years, with 82.7% or 139 individuals in the labor force. Within the labor force, the 20 to 24 years age range has the highest percentage of unemployed individuals, with 5.6% or 4 of them being unemployed.
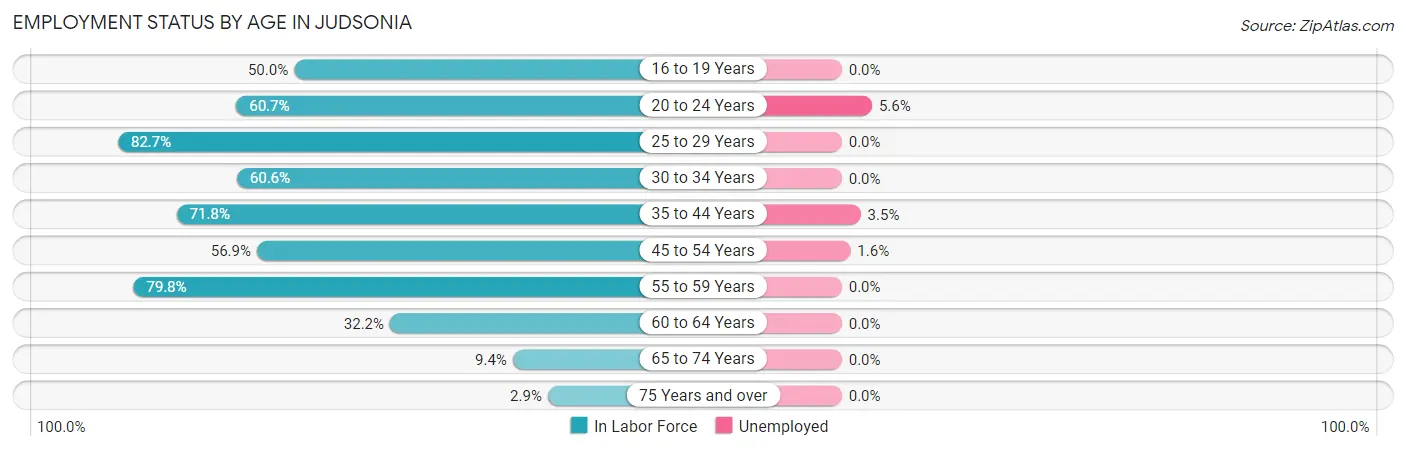
| Age Bracket | In Labor Force | Unemployed |
| 16 to 19 Years | 20 (50.0%) | 0 (0.0%) |
| 20 to 24 Years | 71 (60.7%) | 4 (5.6%) |
| 25 to 29 Years | 139 (82.7%) | 0 (0.0%) |
| 30 to 34 Years | 80 (60.6%) | 0 (0.0%) |
| 35 to 44 Years | 229 (71.8%) | 8 (3.5%) |
| 45 to 54 Years | 124 (56.9%) | 2 (1.6%) |
| 55 to 59 Years | 99 (79.8%) | 0 (0.0%) |
| 60 to 64 Years | 48 (32.2%) | 0 (0.0%) |
| 65 to 74 Years | 33 (9.4%) | 0 (0.0%) |
| 75 Years and over | 5 (2.9%) | 0 (0.0%) |
| Total | 848 (47.4%) | 14 (1.7%) |
Employment Status by Educational Attainment in Judsonia
According to labor force statistics for Judsonia, 64.8% of individuals (719) out of the total population between 25 and 64 years of age (1,110) are in the labor force, with 1.4% or 10 of them being unemployed. The group with the highest labor force participation rate are those with the educational attainment of college / associate degree, with 73.8% or 228 individuals in the labor force. Within the labor force, individuals with high school diploma education have the highest percentage of unemployment, with 2.6% or 8 of them being unemployed.
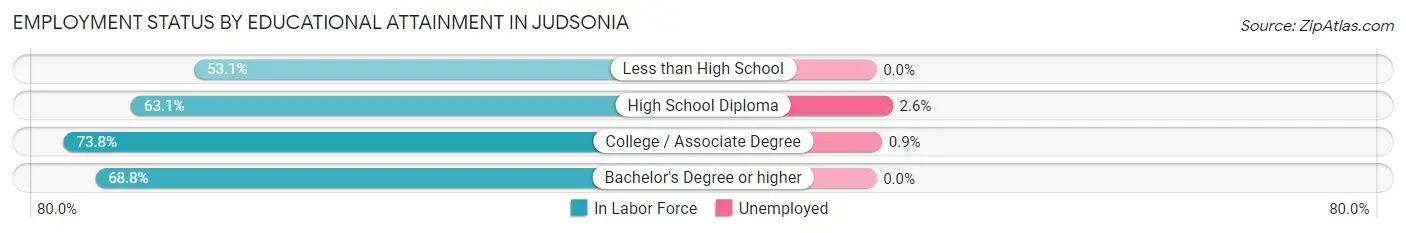
| Educational Attainment | In Labor Force | Unemployed |
| Less than High School | 111 (53.1%) | 0 (0.0%) |
| High School Diploma | 303 (63.1%) | 12 (2.6%) |
| College / Associate Degree | 228 (73.8%) | 3 (0.9%) |
| Bachelor's Degree or higher | 77 (68.8%) | 0 (0.0%) |
| Total | 719 (64.8%) | 16 (1.4%) |
Employment Occupations by Sex in Judsonia
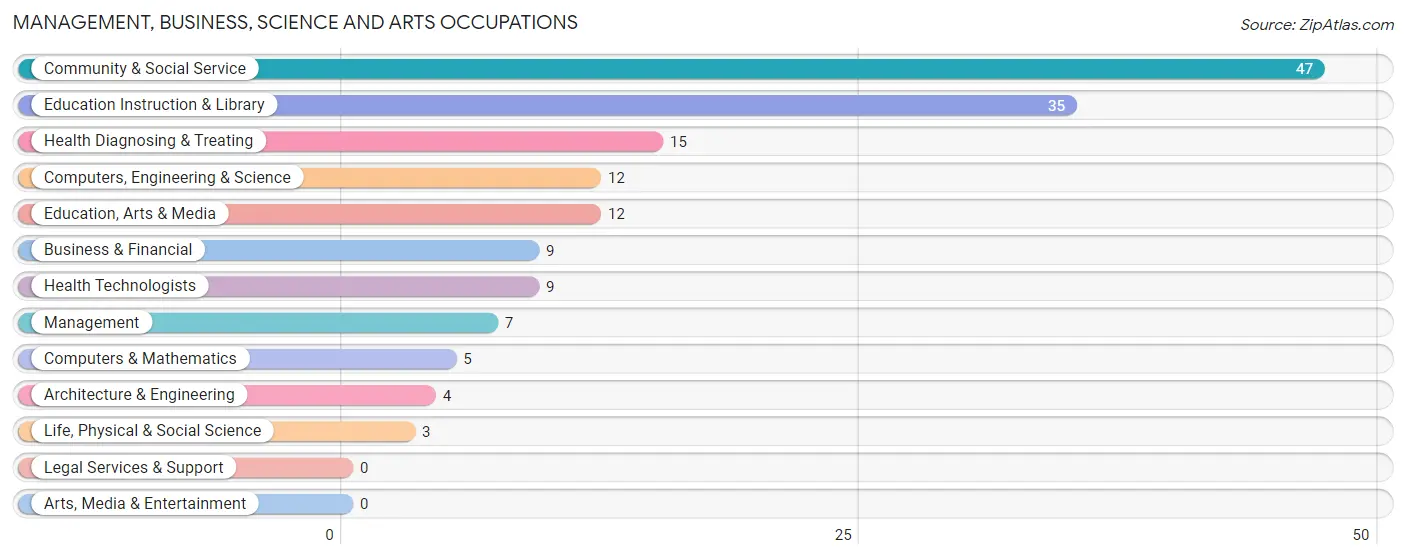
Management, Business, Science and Arts Occupations
The most common Management, Business, Science and Arts occupations in Judsonia are Community & Social Service (47 | 5.6%), Education Instruction & Library (35 | 4.2%), Health Diagnosing & Treating (15 | 1.8%), Computers, Engineering & Science (12 | 1.4%), and Education, Arts & Media (12 | 1.4%).
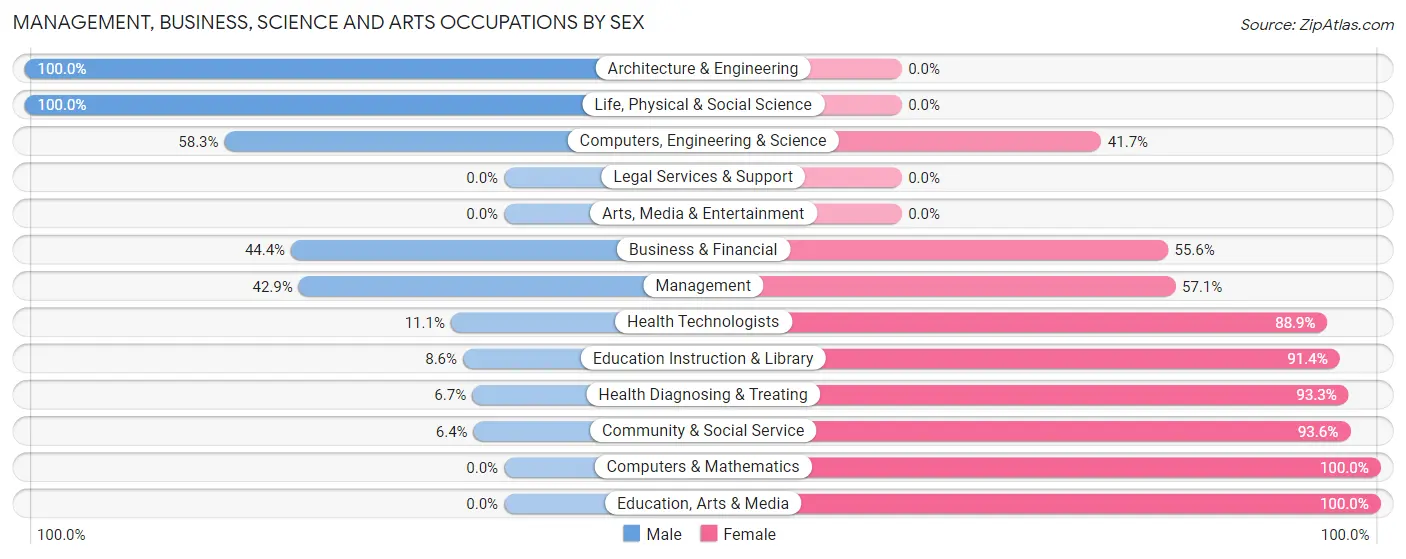
Management, Business, Science and Arts Occupations by Sex
Within the Management, Business, Science and Arts occupations in Judsonia, the most male-oriented occupations are Architecture & Engineering (100.0%), Life, Physical & Social Science (100.0%), and Computers, Engineering & Science (58.3%), while the most female-oriented occupations are Computers & Mathematics (100.0%), Education, Arts & Media (100.0%), and Community & Social Service (93.6%).
| Occupation | Male | Female |
| Management | 3 (42.9%) | 4 (57.1%) |
| Business & Financial | 4 (44.4%) | 5 (55.6%) |
| Computers, Engineering & Science | 7 (58.3%) | 5 (41.7%) |
| Computers & Mathematics | 0 (0.0%) | 5 (100.0%) |
| Architecture & Engineering | 4 (100.0%) | 0 (0.0%) |
| Life, Physical & Social Science | 3 (100.0%) | 0 (0.0%) |
| Community & Social Service | 3 (6.4%) | 44 (93.6%) |
| Education, Arts & Media | 0 (0.0%) | 12 (100.0%) |
| Legal Services & Support | 0 (0.0%) | 0 (0.0%) |
| Education Instruction & Library | 3 (8.6%) | 32 (91.4%) |
| Arts, Media & Entertainment | 0 (0.0%) | 0 (0.0%) |
| Health Diagnosing & Treating | 1 (6.7%) | 14 (93.3%) |
| Health Technologists | 1 (11.1%) | 8 (88.9%) |
| Total (Category) | 18 (20.0%) | 72 (80.0%) |
| Total (Overall) | 340 (40.8%) | 494 (59.2%) |
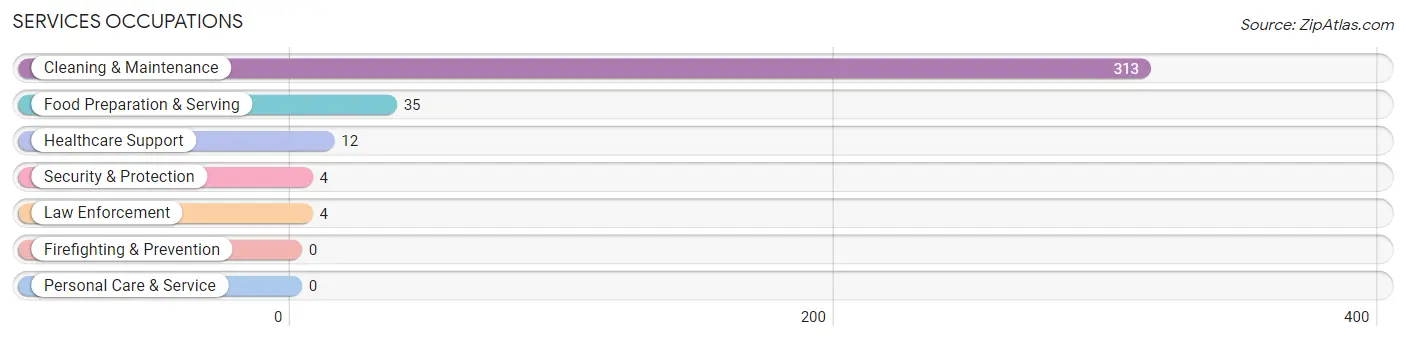
Services Occupations
The most common Services occupations in Judsonia are Cleaning & Maintenance (313 | 37.5%), Food Preparation & Serving (35 | 4.2%), Healthcare Support (12 | 1.4%), Security & Protection (4 | 0.5%), and Law Enforcement (4 | 0.5%).
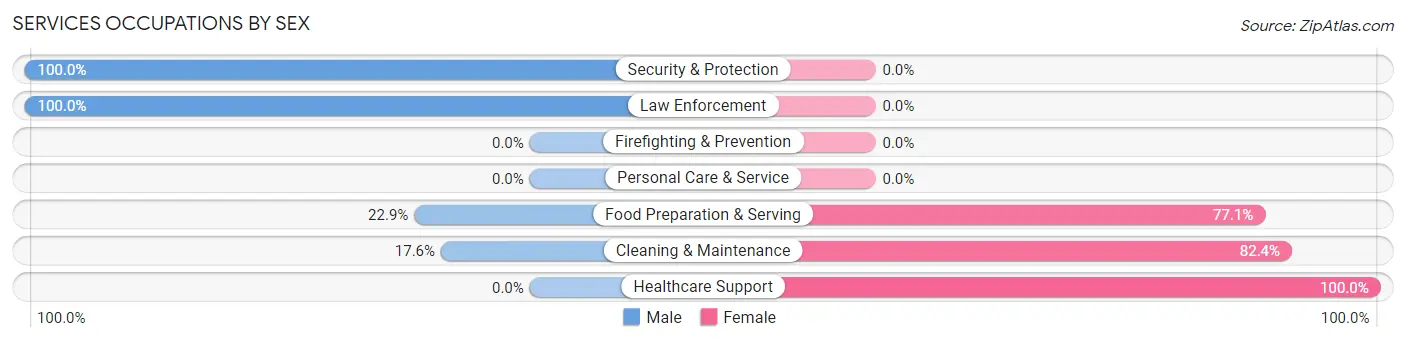
Services Occupations by Sex
Within the Services occupations in Judsonia, the most male-oriented occupations are Security & Protection (100.0%), Law Enforcement (100.0%), and Food Preparation & Serving (22.9%), while the most female-oriented occupations are Healthcare Support (100.0%), Cleaning & Maintenance (82.4%), and Food Preparation & Serving (77.1%).
| Occupation | Male | Female |
| Healthcare Support | 0 (0.0%) | 12 (100.0%) |
| Security & Protection | 4 (100.0%) | 0 (0.0%) |
| Firefighting & Prevention | 0 (0.0%) | 0 (0.0%) |
| Law Enforcement | 4 (100.0%) | 0 (0.0%) |
| Food Preparation & Serving | 8 (22.9%) | 27 (77.1%) |
| Cleaning & Maintenance | 55 (17.6%) | 258 (82.4%) |
| Personal Care & Service | 0 (0.0%) | 0 (0.0%) |
| Total (Category) | 67 (18.4%) | 297 (81.6%) |
| Total (Overall) | 340 (40.8%) | 494 (59.2%) |
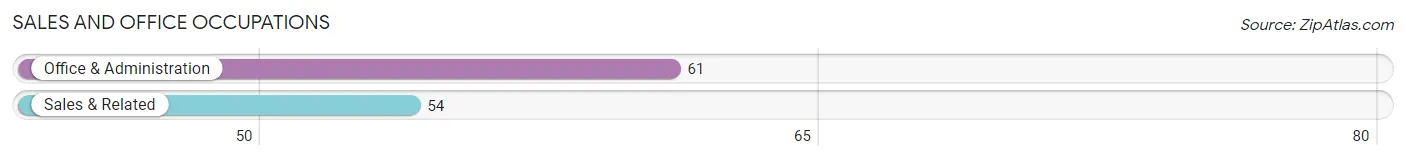
Sales and Office Occupations
The most common Sales and Office occupations in Judsonia are Office & Administration (61 | 7.3%), and Sales & Related (54 | 6.5%).
Sales and Office Occupations by Sex
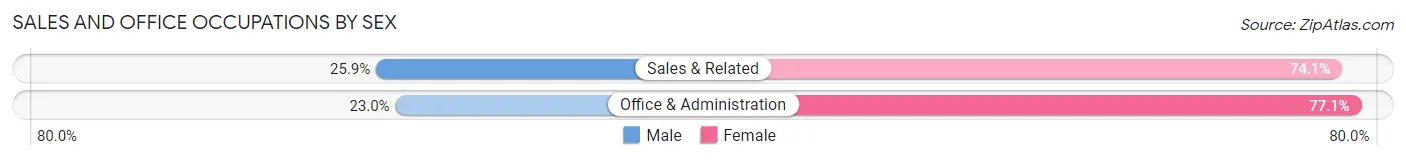
| Occupation | Male | Female |
| Sales & Related | 14 (25.9%) | 40 (74.1%) |
| Office & Administration | 14 (23.0%) | 47 (77.0%) |
| Total (Category) | 28 (24.3%) | 87 (75.6%) |
| Total (Overall) | 340 (40.8%) | 494 (59.2%) |
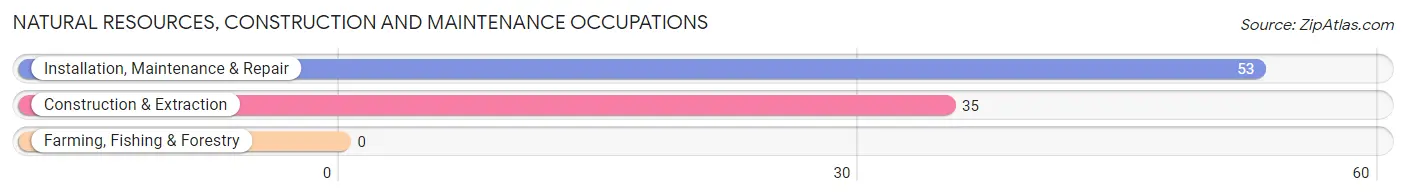
Natural Resources, Construction and Maintenance Occupations
The most common Natural Resources, Construction and Maintenance occupations in Judsonia are Installation, Maintenance & Repair (53 | 6.4%), and Construction & Extraction (35 | 4.2%).
Natural Resources, Construction and Maintenance Occupations by Sex
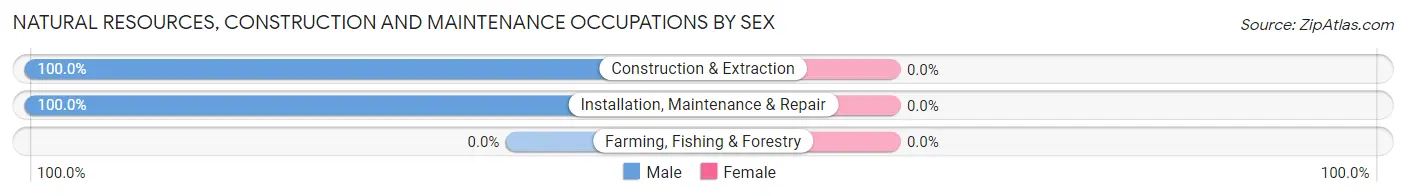
| Occupation | Male | Female |
| Farming, Fishing & Forestry | 0 (0.0%) | 0 (0.0%) |
| Construction & Extraction | 35 (100.0%) | 0 (0.0%) |
| Installation, Maintenance & Repair | 53 (100.0%) | 0 (0.0%) |
| Total (Category) | 88 (100.0%) | 0 (0.0%) |
| Total (Overall) | 340 (40.8%) | 494 (59.2%) |
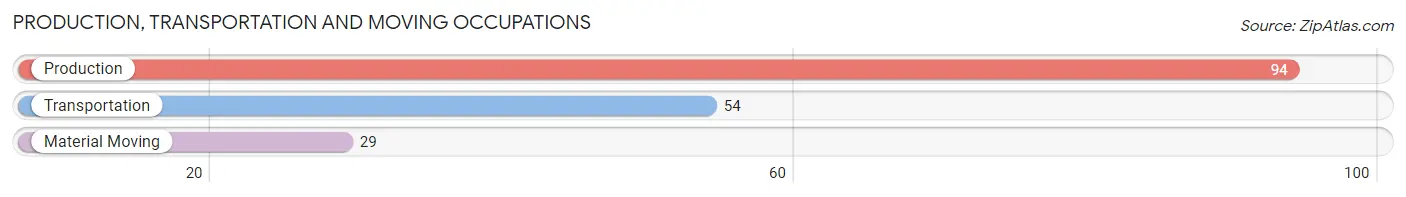
Production, Transportation and Moving Occupations
The most common Production, Transportation and Moving occupations in Judsonia are Production (94 | 11.3%), Transportation (54 | 6.5%), and Material Moving (29 | 3.5%).
Production, Transportation and Moving Occupations by Sex
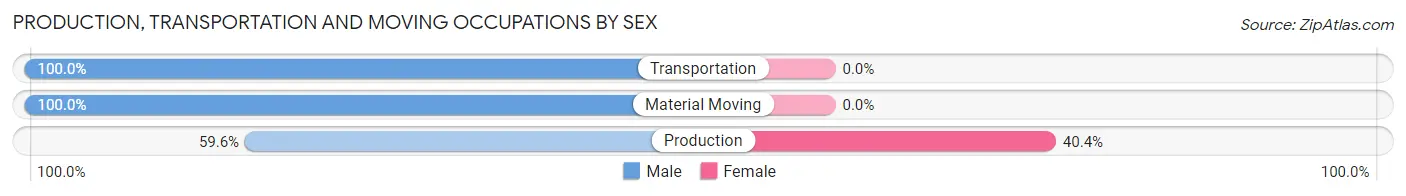
| Occupation | Male | Female |
| Production | 56 (59.6%) | 38 (40.4%) |
| Transportation | 54 (100.0%) | 0 (0.0%) |
| Material Moving | 29 (100.0%) | 0 (0.0%) |
| Total (Category) | 139 (78.5%) | 38 (21.5%) |
| Total (Overall) | 340 (40.8%) | 494 (59.2%) |
Employment Industries by Sex in Judsonia
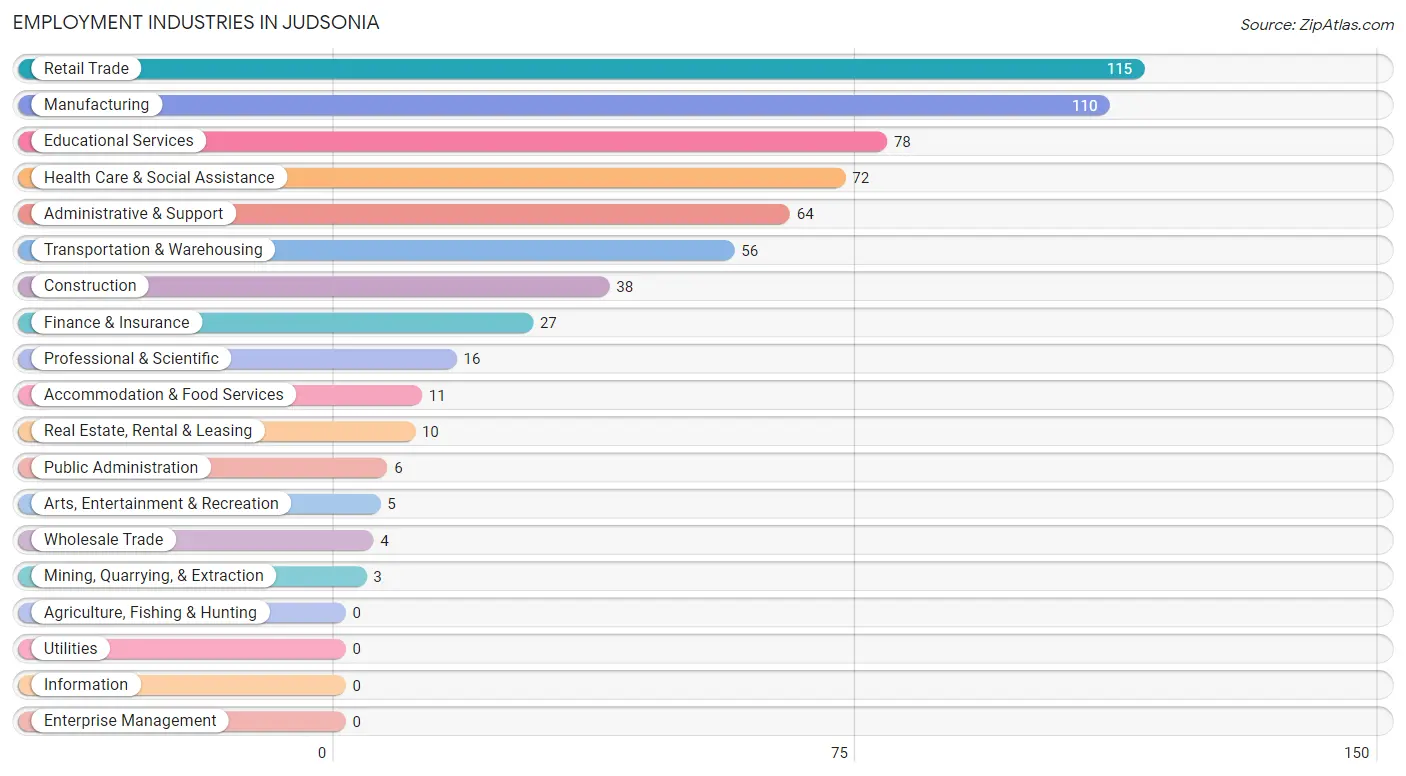
Employment Industries in Judsonia
The major employment industries in Judsonia include Retail Trade (115 | 13.8%), Manufacturing (110 | 13.2%), Educational Services (78 | 9.3%), Health Care & Social Assistance (72 | 8.6%), and Administrative & Support (64 | 7.7%).
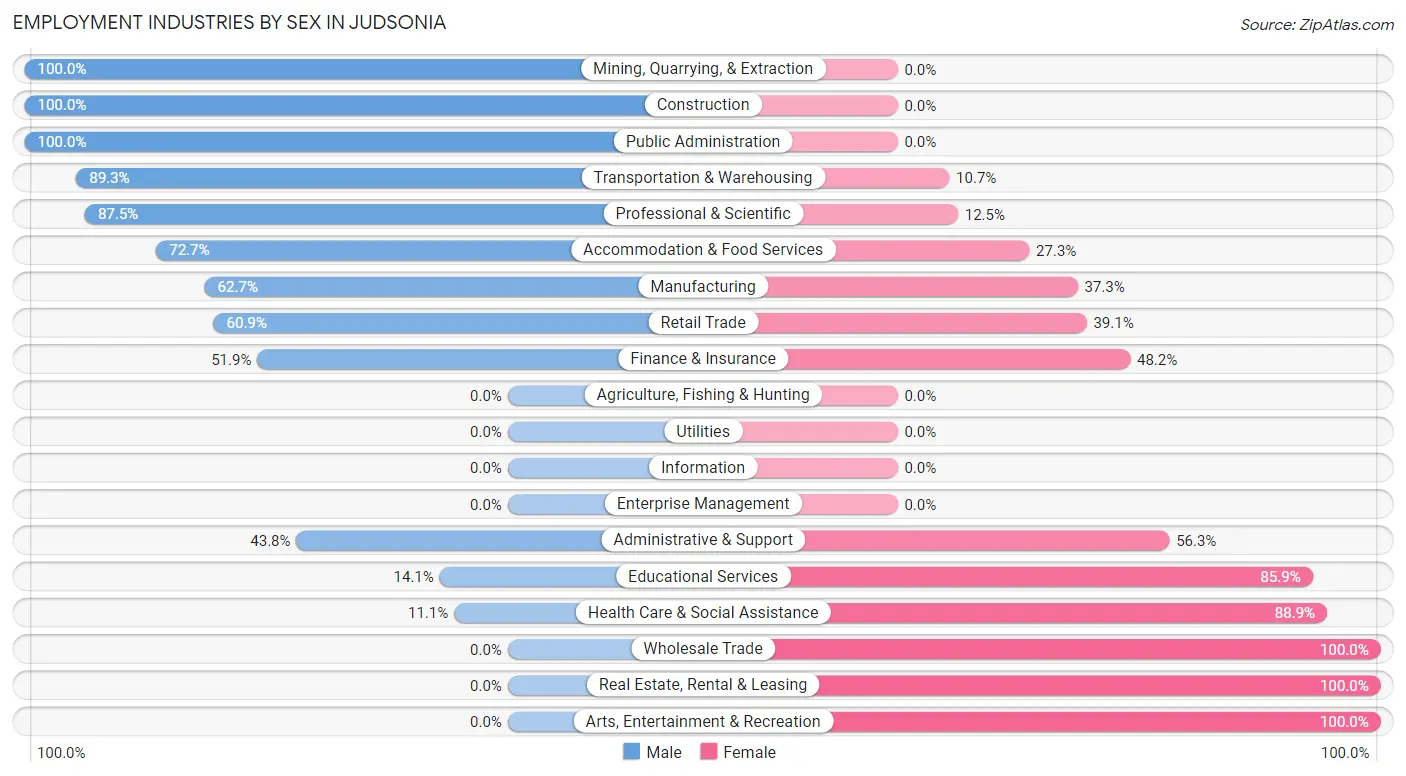
Employment Industries by Sex in Judsonia
The Judsonia industries that see more men than women are Mining, Quarrying, & Extraction (100.0%), Construction (100.0%), and Public Administration (100.0%), whereas the industries that tend to have a higher number of women are Wholesale Trade (100.0%), Real Estate, Rental & Leasing (100.0%), and Arts, Entertainment & Recreation (100.0%).
| Industry | Male | Female |
| Agriculture, Fishing & Hunting | 0 (0.0%) | 0 (0.0%) |
| Mining, Quarrying, & Extraction | 3 (100.0%) | 0 (0.0%) |
| Construction | 38 (100.0%) | 0 (0.0%) |
| Manufacturing | 69 (62.7%) | 41 (37.3%) |
| Wholesale Trade | 0 (0.0%) | 4 (100.0%) |
| Retail Trade | 70 (60.9%) | 45 (39.1%) |
| Transportation & Warehousing | 50 (89.3%) | 6 (10.7%) |
| Utilities | 0 (0.0%) | 0 (0.0%) |
| Information | 0 (0.0%) | 0 (0.0%) |
| Finance & Insurance | 14 (51.8%) | 13 (48.1%) |
| Real Estate, Rental & Leasing | 0 (0.0%) | 10 (100.0%) |
| Professional & Scientific | 14 (87.5%) | 2 (12.5%) |
| Enterprise Management | 0 (0.0%) | 0 (0.0%) |
| Administrative & Support | 28 (43.8%) | 36 (56.2%) |
| Educational Services | 11 (14.1%) | 67 (85.9%) |
| Health Care & Social Assistance | 8 (11.1%) | 64 (88.9%) |
| Arts, Entertainment & Recreation | 0 (0.0%) | 5 (100.0%) |
| Accommodation & Food Services | 8 (72.7%) | 3 (27.3%) |
| Public Administration | 6 (100.0%) | 0 (0.0%) |
| Total | 340 (40.8%) | 494 (59.2%) |
Education in Judsonia
School Enrollment in Judsonia
The most common levels of schooling among the 437 students in Judsonia are college / undergraduate (115 | 26.3%), middle school (92 | 21.0%), and elementary school (85 | 19.5%).
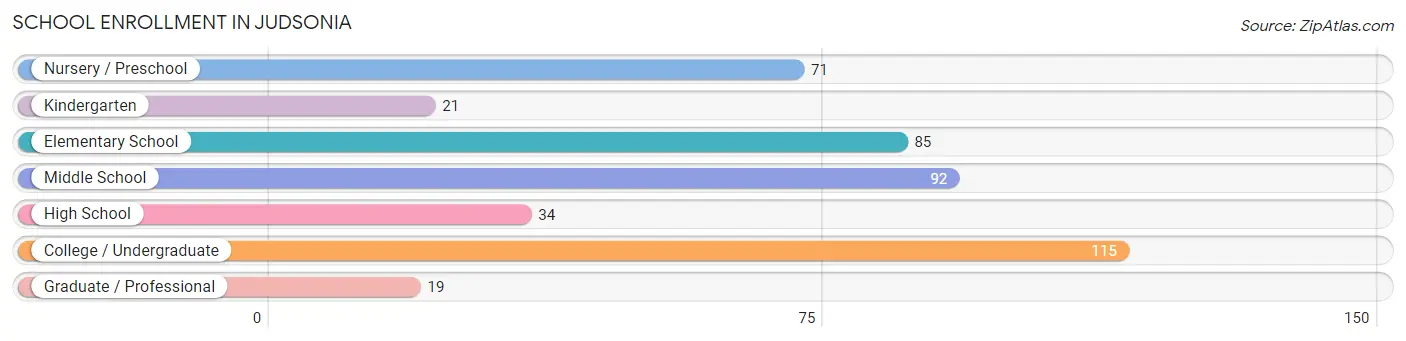
| School Level | # Students | % Students |
| Nursery / Preschool | 71 | 16.3% |
| Kindergarten | 21 | 4.8% |
| Elementary School | 85 | 19.5% |
| Middle School | 92 | 21.0% |
| High School | 34 | 7.8% |
| College / Undergraduate | 115 | 26.3% |
| Graduate / Professional | 19 | 4.3% |
| Total | 437 | 100.0% |
School Enrollment by Age by Funding Source in Judsonia
Out of a total of 437 students who are enrolled in schools in Judsonia, 22 (5.0%) attend a private institution, while the remaining 415 (95.0%) are enrolled in public schools. The age group of 20 to 24 year olds has the highest likelihood of being enrolled in private schools, with 4 (57.1% in the age bracket) enrolled. Conversely, the age group of 3 to 4 year olds has the lowest likelihood of being enrolled in a private school, with 71 (100.0% in the age bracket) attending a public institution.
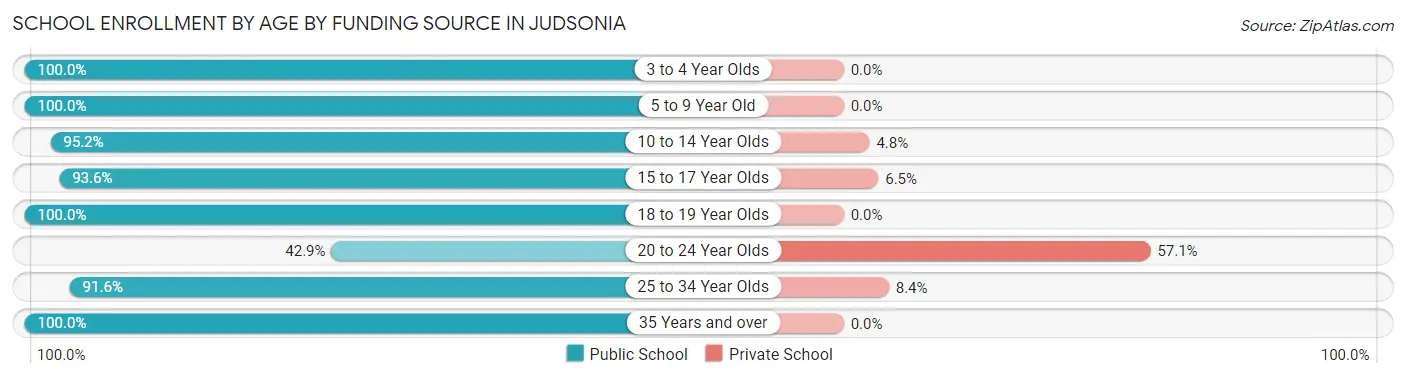
| Age Bracket | Public School | Private School |
| 3 to 4 Year Olds | 71 (100.0%) | 0 (0.0%) |
| 5 to 9 Year Old | 73 (100.0%) | 0 (0.0%) |
| 10 to 14 Year Olds | 119 (95.2%) | 6 (4.8%) |
| 15 to 17 Year Olds | 29 (93.5%) | 2 (6.5%) |
| 18 to 19 Year Olds | 6 (100.0%) | 0 (0.0%) |
| 20 to 24 Year Olds | 3 (42.9%) | 4 (57.1%) |
| 25 to 34 Year Olds | 109 (91.6%) | 10 (8.4%) |
| 35 Years and over | 5 (100.0%) | 0 (0.0%) |
| Total | 415 (95.0%) | 22 (5.0%) |
Educational Attainment by Field of Study in Judsonia
Science & technology (147 | 48.2%), education (68 | 22.3%), arts & humanities (26 | 8.5%), business (25 | 8.2%), and bio, nature & agricultural (14 | 4.6%) are the most common fields of study among 305 individuals in Judsonia who have obtained a bachelor's degree or higher.
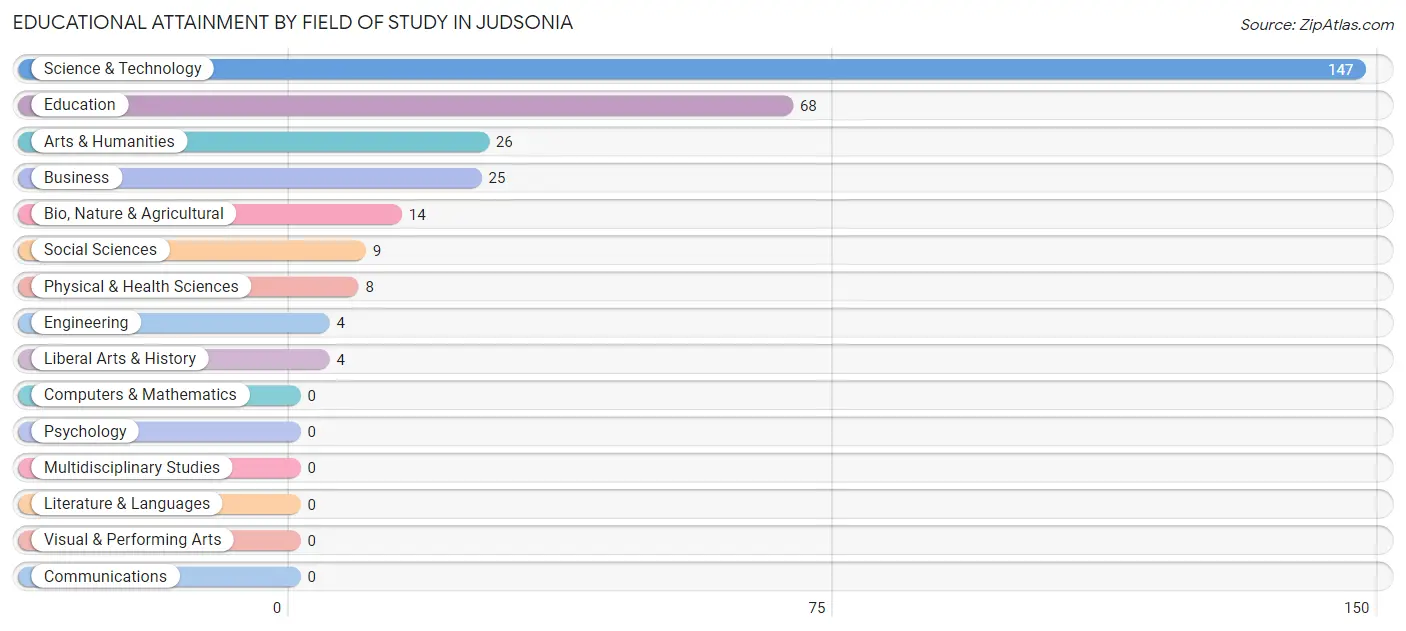
| Field of Study | # Graduates | % Graduates |
| Computers & Mathematics | 0 | 0.0% |
| Bio, Nature & Agricultural | 14 | 4.6% |
| Physical & Health Sciences | 8 | 2.6% |
| Psychology | 0 | 0.0% |
| Social Sciences | 9 | 2.9% |
| Engineering | 4 | 1.3% |
| Multidisciplinary Studies | 0 | 0.0% |
| Science & Technology | 147 | 48.2% |
| Business | 25 | 8.2% |
| Education | 68 | 22.3% |
| Literature & Languages | 0 | 0.0% |
| Liberal Arts & History | 4 | 1.3% |
| Visual & Performing Arts | 0 | 0.0% |
| Communications | 0 | 0.0% |
| Arts & Humanities | 26 | 8.5% |
| Total | 305 | 100.0% |
Transportation & Commute in Judsonia
Vehicle Availability by Sex in Judsonia
The most prevalent vehicle ownership categories in Judsonia are males with 2 vehicles (118, accounting for 36.9%) and females with 2 vehicles (271, making up 23.9%).
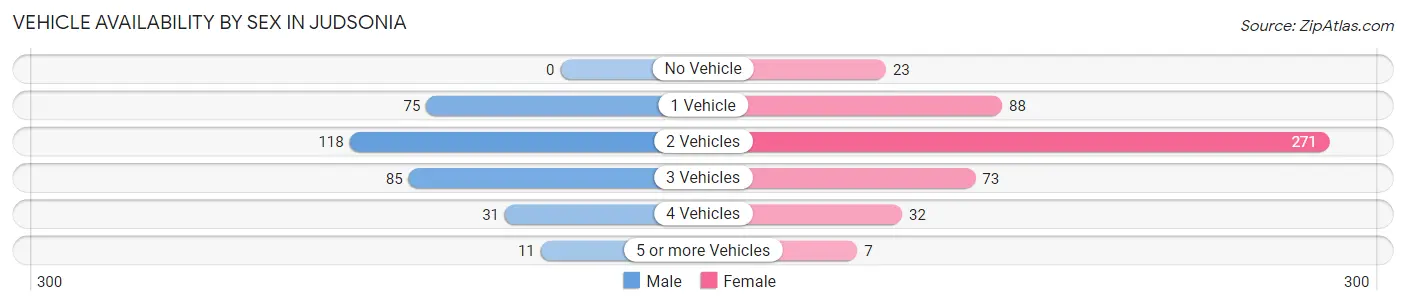
| Vehicles Available | Male | Female |
| No Vehicle | 0 (0.0%) | 23 (4.7%) |
| 1 Vehicle | 75 (23.4%) | 88 (17.8%) |
| 2 Vehicles | 118 (36.9%) | 271 (54.9%) |
| 3 Vehicles | 85 (26.6%) | 73 (14.8%) |
| 4 Vehicles | 31 (9.7%) | 32 (6.5%) |
| 5 or more Vehicles | 11 (3.4%) | 7 (1.4%) |
| Total | 320 (100.0%) | 494 (100.0%) |
Commute Time in Judsonia
The most frequently occuring commute durations in Judsonia are 15 to 19 minutes (349 commuters, 44.4%), 10 to 14 minutes (242 commuters, 30.8%), and 30 to 34 minutes (60 commuters, 7.6%).
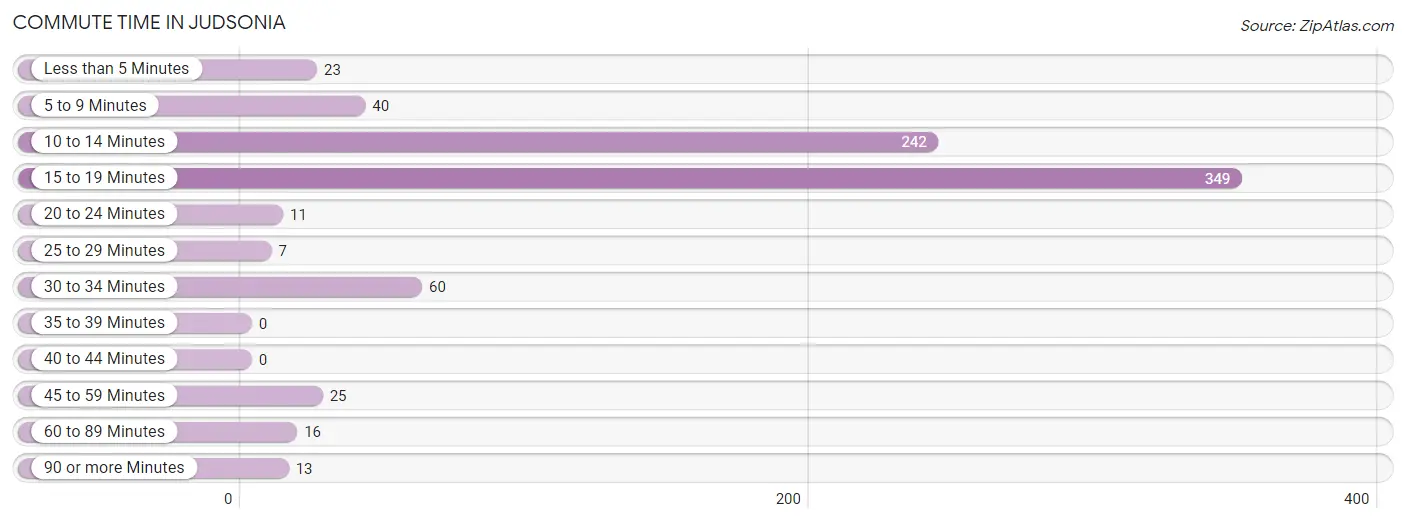
| Commute Time | # Commuters | % Commuters |
| Less than 5 Minutes | 23 | 2.9% |
| 5 to 9 Minutes | 40 | 5.1% |
| 10 to 14 Minutes | 242 | 30.8% |
| 15 to 19 Minutes | 349 | 44.4% |
| 20 to 24 Minutes | 11 | 1.4% |
| 25 to 29 Minutes | 7 | 0.9% |
| 30 to 34 Minutes | 60 | 7.6% |
| 35 to 39 Minutes | 0 | 0.0% |
| 40 to 44 Minutes | 0 | 0.0% |
| 45 to 59 Minutes | 25 | 3.2% |
| 60 to 89 Minutes | 16 | 2.0% |
| 90 or more Minutes | 13 | 1.7% |
Commute Time by Sex in Judsonia
The most common commute times in Judsonia are 10 to 14 minutes (133 commuters, 45.6%) for males and 15 to 19 minutes (282 commuters, 57.1%) for females.
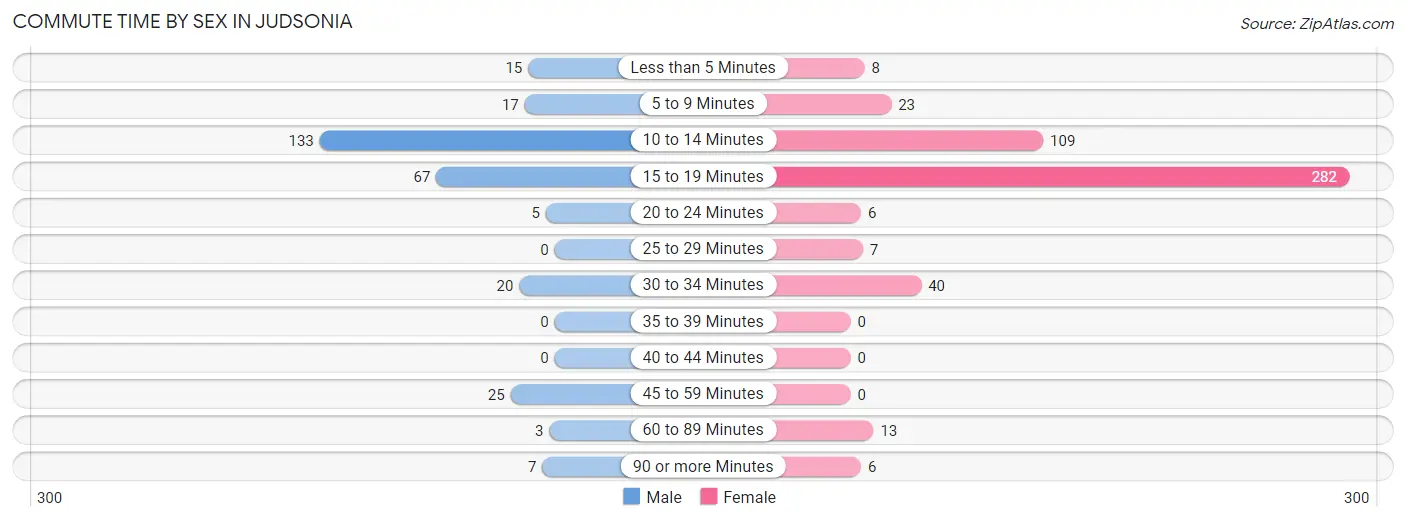
| Commute Time | Male | Female |
| Less than 5 Minutes | 15 (5.1%) | 8 (1.6%) |
| 5 to 9 Minutes | 17 (5.8%) | 23 (4.7%) |
| 10 to 14 Minutes | 133 (45.6%) | 109 (22.1%) |
| 15 to 19 Minutes | 67 (23.0%) | 282 (57.1%) |
| 20 to 24 Minutes | 5 (1.7%) | 6 (1.2%) |
| 25 to 29 Minutes | 0 (0.0%) | 7 (1.4%) |
| 30 to 34 Minutes | 20 (6.9%) | 40 (8.1%) |
| 35 to 39 Minutes | 0 (0.0%) | 0 (0.0%) |
| 40 to 44 Minutes | 0 (0.0%) | 0 (0.0%) |
| 45 to 59 Minutes | 25 (8.6%) | 0 (0.0%) |
| 60 to 89 Minutes | 3 (1.0%) | 13 (2.6%) |
| 90 or more Minutes | 7 (2.4%) | 6 (1.2%) |
Time of Departure to Work by Sex in Judsonia
The most frequent times of departure to work in Judsonia are 6:30 AM to 6:59 AM (67, 23.0%) for males and 7:00 AM to 7:29 AM (245, 49.6%) for females.
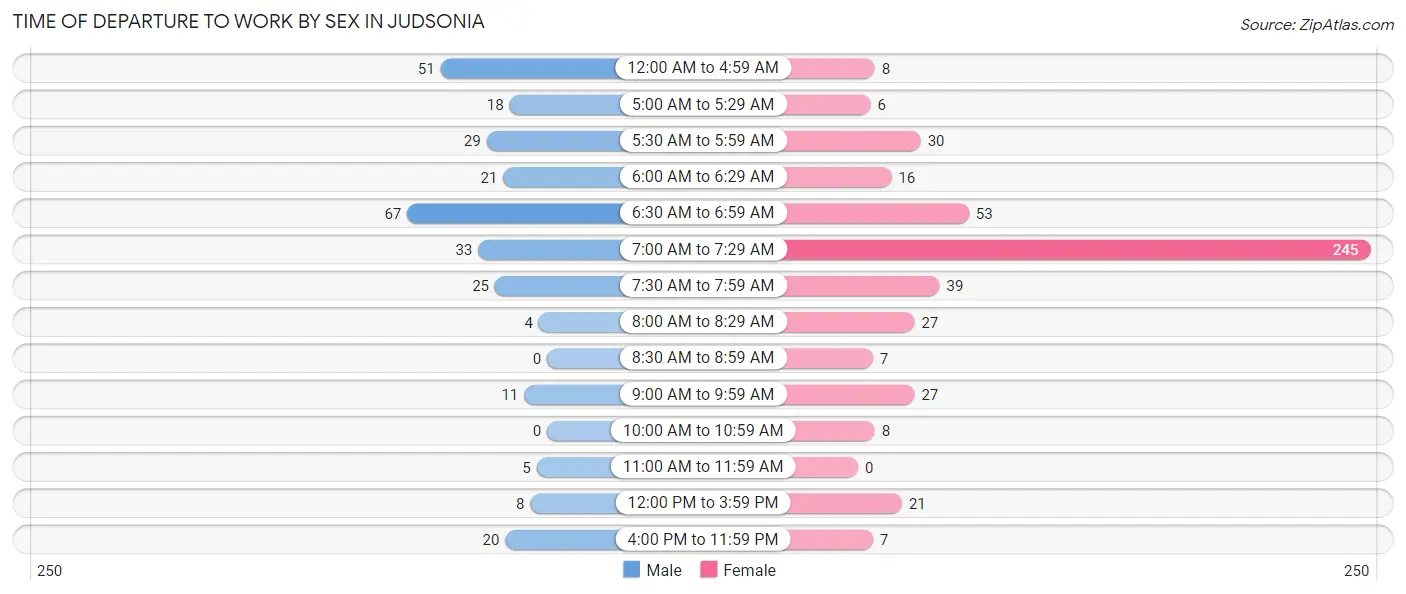
| Time of Departure | Male | Female |
| 12:00 AM to 4:59 AM | 51 (17.5%) | 8 (1.6%) |
| 5:00 AM to 5:29 AM | 18 (6.2%) | 6 (1.2%) |
| 5:30 AM to 5:59 AM | 29 (9.9%) | 30 (6.1%) |
| 6:00 AM to 6:29 AM | 21 (7.2%) | 16 (3.2%) |
| 6:30 AM to 6:59 AM | 67 (23.0%) | 53 (10.7%) |
| 7:00 AM to 7:29 AM | 33 (11.3%) | 245 (49.6%) |
| 7:30 AM to 7:59 AM | 25 (8.6%) | 39 (7.9%) |
| 8:00 AM to 8:29 AM | 4 (1.4%) | 27 (5.5%) |
| 8:30 AM to 8:59 AM | 0 (0.0%) | 7 (1.4%) |
| 9:00 AM to 9:59 AM | 11 (3.8%) | 27 (5.5%) |
| 10:00 AM to 10:59 AM | 0 (0.0%) | 8 (1.6%) |
| 11:00 AM to 11:59 AM | 5 (1.7%) | 0 (0.0%) |
| 12:00 PM to 3:59 PM | 8 (2.7%) | 21 (4.3%) |
| 4:00 PM to 11:59 PM | 20 (6.9%) | 7 (1.4%) |
| Total | 292 (100.0%) | 494 (100.0%) |
Housing Occupancy in Judsonia
Occupancy by Ownership in Judsonia
Of the total 840 dwellings in Judsonia, owner-occupied units account for 538 (64.0%), while renter-occupied units make up 302 (35.9%).
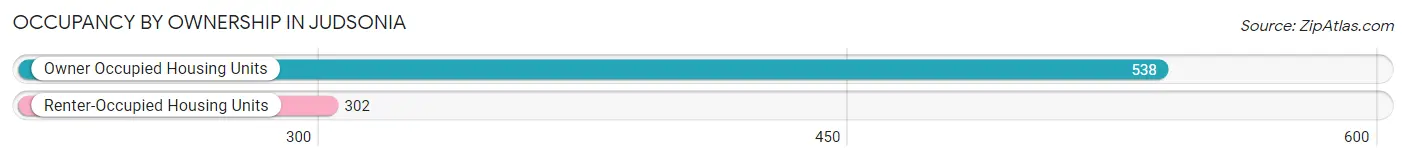
| Occupancy | # Housing Units | % Housing Units |
| Owner Occupied Housing Units | 538 | 64.0% |
| Renter-Occupied Housing Units | 302 | 35.9% |
| Total Occupied Housing Units | 840 | 100.0% |
Occupancy by Household Size in Judsonia
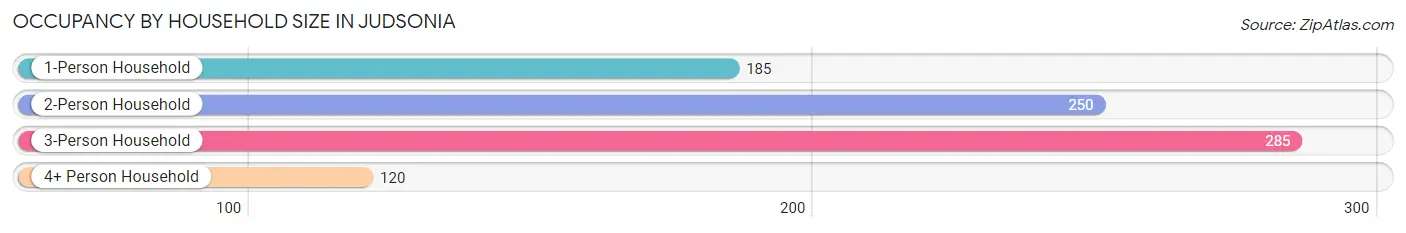
| Household Size | # Housing Units | % Housing Units |
| 1-Person Household | 185 | 22.0% |
| 2-Person Household | 250 | 29.8% |
| 3-Person Household | 285 | 33.9% |
| 4+ Person Household | 120 | 14.3% |
| Total Housing Units | 840 | 100.0% |
Occupancy by Ownership by Household Size in Judsonia
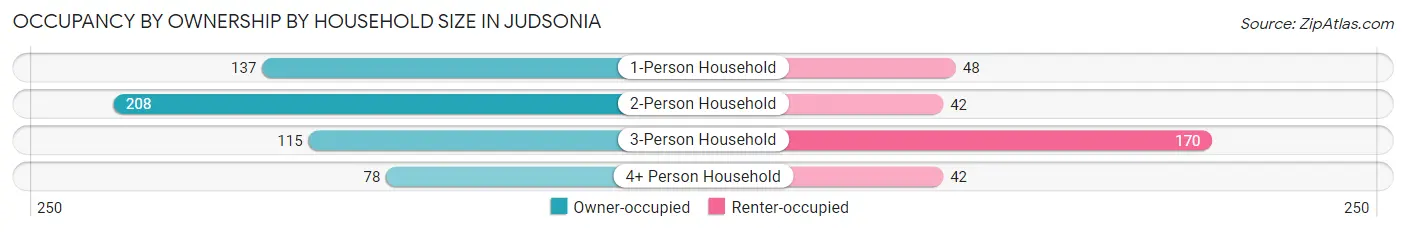
| Household Size | Owner-occupied | Renter-occupied |
| 1-Person Household | 137 (74.1%) | 48 (26.0%) |
| 2-Person Household | 208 (83.2%) | 42 (16.8%) |
| 3-Person Household | 115 (40.4%) | 170 (59.7%) |
| 4+ Person Household | 78 (65.0%) | 42 (35.0%) |
| Total Housing Units | 538 (64.0%) | 302 (35.9%) |
Occupancy by Educational Attainment in Judsonia
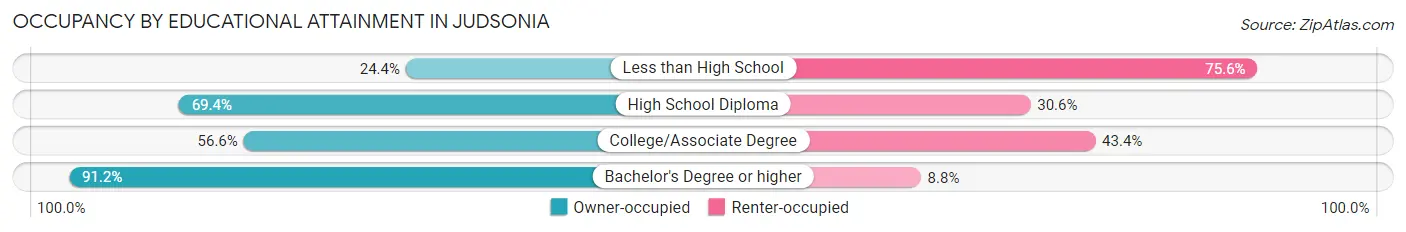
| Household Size | Owner-occupied | Renter-occupied |
| Less than High School | 21 (24.4%) | 65 (75.6%) |
| High School Diploma | 234 (69.4%) | 103 (30.6%) |
| College/Associate Degree | 159 (56.6%) | 122 (43.4%) |
| Bachelor's Degree or higher | 124 (91.2%) | 12 (8.8%) |
Occupancy by Age of Householder in Judsonia
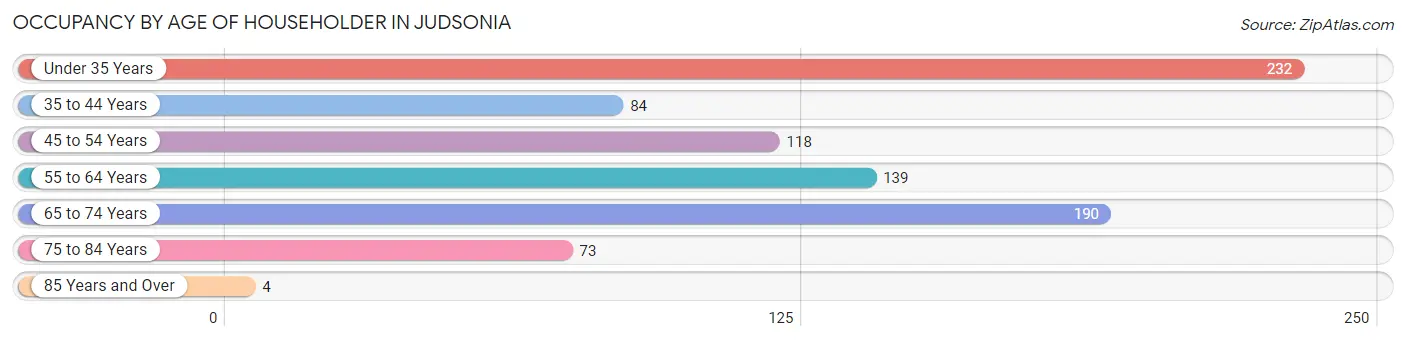
| Age Bracket | # Households | % Households |
| Under 35 Years | 232 | 27.6% |
| 35 to 44 Years | 84 | 10.0% |
| 45 to 54 Years | 118 | 14.1% |
| 55 to 64 Years | 139 | 16.6% |
| 65 to 74 Years | 190 | 22.6% |
| 75 to 84 Years | 73 | 8.7% |
| 85 Years and Over | 4 | 0.5% |
| Total | 840 | 100.0% |
Housing Finances in Judsonia
Median Income by Occupancy in Judsonia
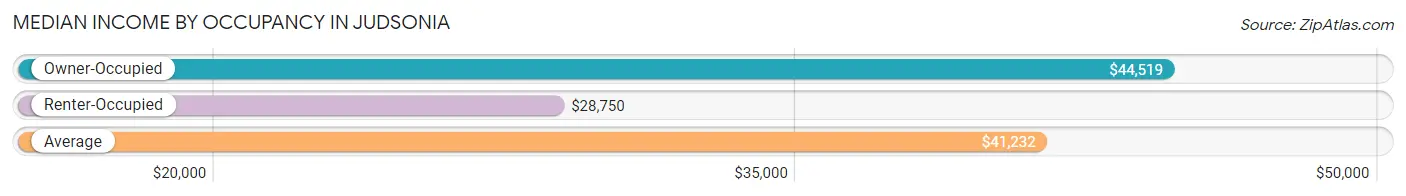
| Occupancy Type | # Households | Median Income |
| Owner-Occupied | 538 (64.0%) | $44,519 |
| Renter-Occupied | 302 (35.9%) | $28,750 |
| Average | 840 (100.0%) | $41,232 |
Occupancy by Householder Income Bracket in Judsonia
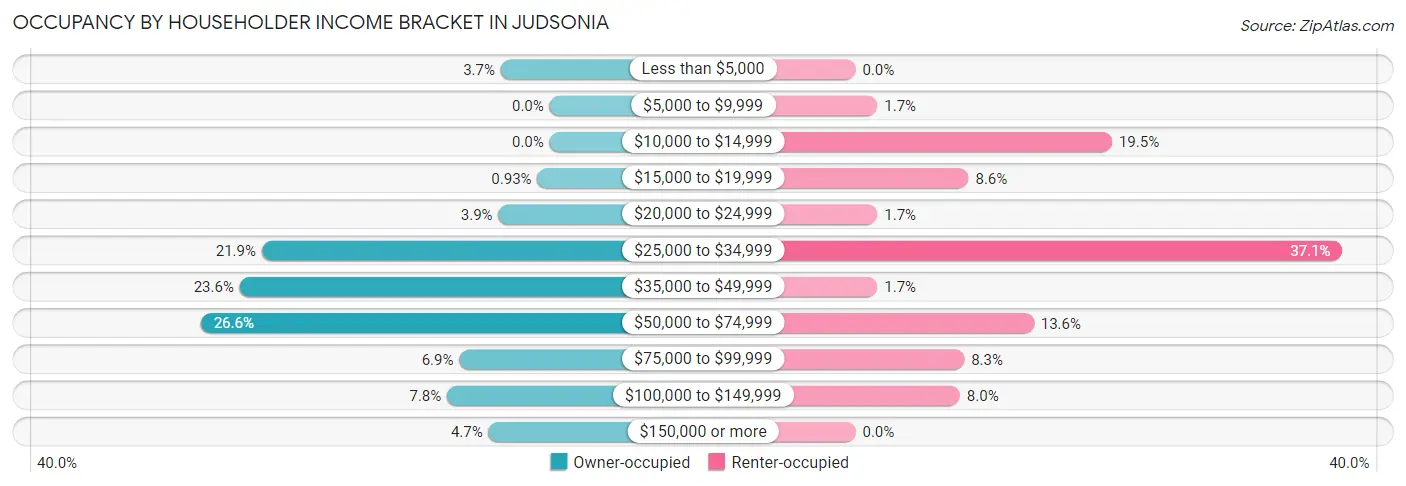
| Income Bracket | Owner-occupied | Renter-occupied |
| Less than $5,000 | 20 (3.7%) | 0 (0.0%) |
| $5,000 to $9,999 | 0 (0.0%) | 5 (1.7%) |
| $10,000 to $14,999 | 0 (0.0%) | 59 (19.5%) |
| $15,000 to $19,999 | 5 (0.9%) | 26 (8.6%) |
| $20,000 to $24,999 | 21 (3.9%) | 5 (1.7%) |
| $25,000 to $34,999 | 118 (21.9%) | 112 (37.1%) |
| $35,000 to $49,999 | 127 (23.6%) | 5 (1.7%) |
| $50,000 to $74,999 | 143 (26.6%) | 41 (13.6%) |
| $75,000 to $99,999 | 37 (6.9%) | 25 (8.3%) |
| $100,000 to $149,999 | 42 (7.8%) | 24 (8.0%) |
| $150,000 or more | 25 (4.6%) | 0 (0.0%) |
| Total | 538 (100.0%) | 302 (100.0%) |
Monthly Housing Cost Tiers in Judsonia
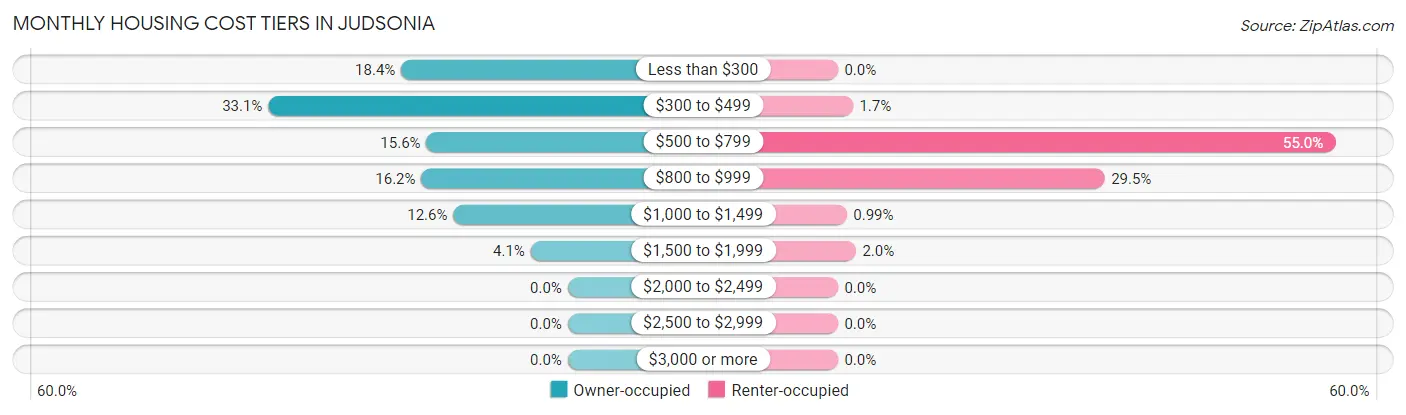
| Monthly Cost | Owner-occupied | Renter-occupied |
| Less than $300 | 99 (18.4%) | 0 (0.0%) |
| $300 to $499 | 178 (33.1%) | 5 (1.7%) |
| $500 to $799 | 84 (15.6%) | 166 (55.0%) |
| $800 to $999 | 87 (16.2%) | 89 (29.5%) |
| $1,000 to $1,499 | 68 (12.6%) | 3 (1.0%) |
| $1,500 to $1,999 | 22 (4.1%) | 6 (2.0%) |
| $2,000 to $2,499 | 0 (0.0%) | 0 (0.0%) |
| $2,500 to $2,999 | 0 (0.0%) | 0 (0.0%) |
| $3,000 or more | 0 (0.0%) | 0 (0.0%) |
| Total | 538 (100.0%) | 302 (100.0%) |
Physical Housing Characteristics in Judsonia
Housing Structures in Judsonia
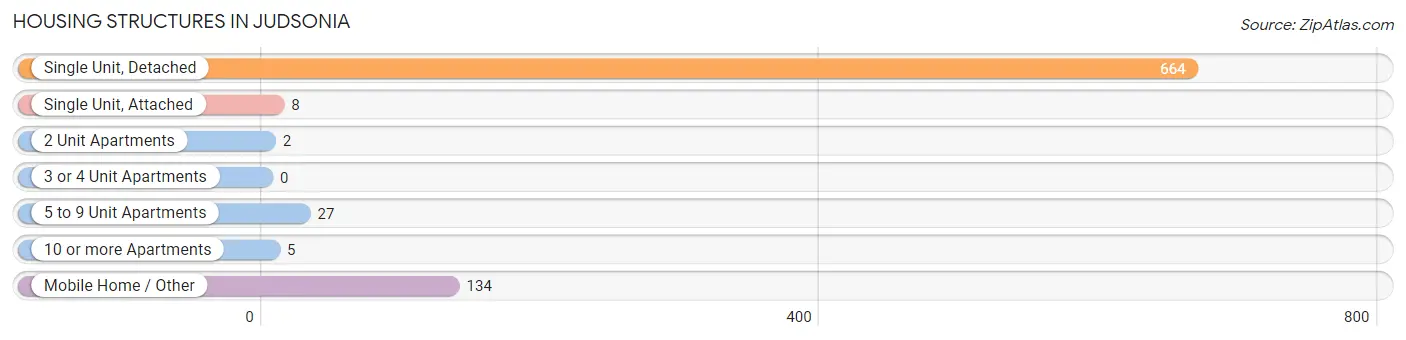
| Structure Type | # Housing Units | % Housing Units |
| Single Unit, Detached | 664 | 79.0% |
| Single Unit, Attached | 8 | 0.9% |
| 2 Unit Apartments | 2 | 0.2% |
| 3 or 4 Unit Apartments | 0 | 0.0% |
| 5 to 9 Unit Apartments | 27 | 3.2% |
| 10 or more Apartments | 5 | 0.6% |
| Mobile Home / Other | 134 | 16.0% |
| Total | 840 | 100.0% |
Housing Structures by Occupancy in Judsonia
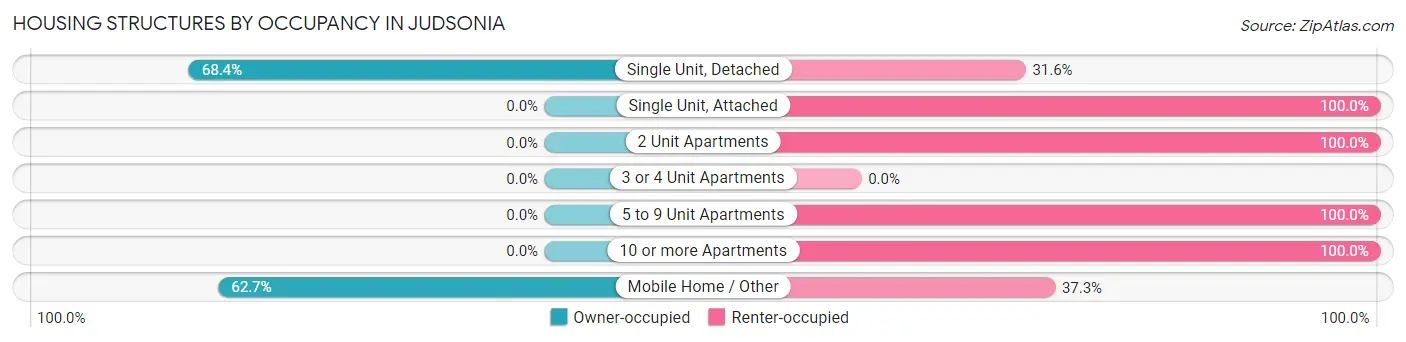
| Structure Type | Owner-occupied | Renter-occupied |
| Single Unit, Detached | 454 (68.4%) | 210 (31.6%) |
| Single Unit, Attached | 0 (0.0%) | 8 (100.0%) |
| 2 Unit Apartments | 0 (0.0%) | 2 (100.0%) |
| 3 or 4 Unit Apartments | 0 (0.0%) | 0 (0.0%) |
| 5 to 9 Unit Apartments | 0 (0.0%) | 27 (100.0%) |
| 10 or more Apartments | 0 (0.0%) | 5 (100.0%) |
| Mobile Home / Other | 84 (62.7%) | 50 (37.3%) |
| Total | 538 (64.0%) | 302 (35.9%) |
Housing Structures by Number of Rooms in Judsonia
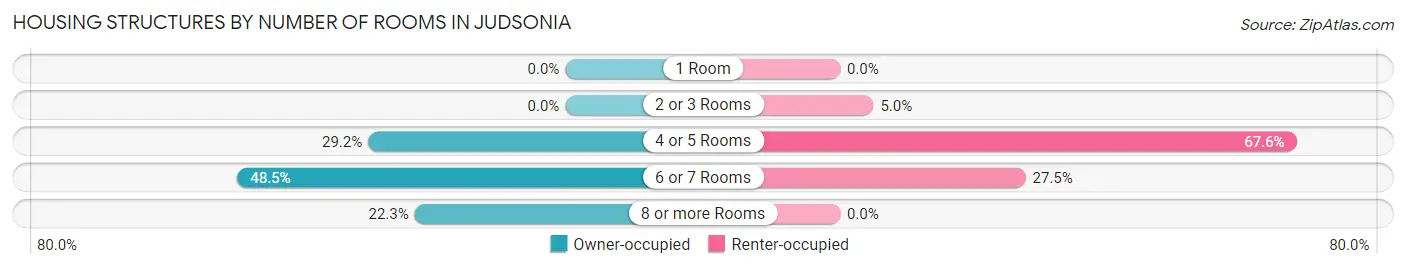
| Number of Rooms | Owner-occupied | Renter-occupied |
| 1 Room | 0 (0.0%) | 0 (0.0%) |
| 2 or 3 Rooms | 0 (0.0%) | 15 (5.0%) |
| 4 or 5 Rooms | 157 (29.2%) | 204 (67.5%) |
| 6 or 7 Rooms | 261 (48.5%) | 83 (27.5%) |
| 8 or more Rooms | 120 (22.3%) | 0 (0.0%) |
| Total | 538 (100.0%) | 302 (100.0%) |
Housing Structure by Heating Type in Judsonia
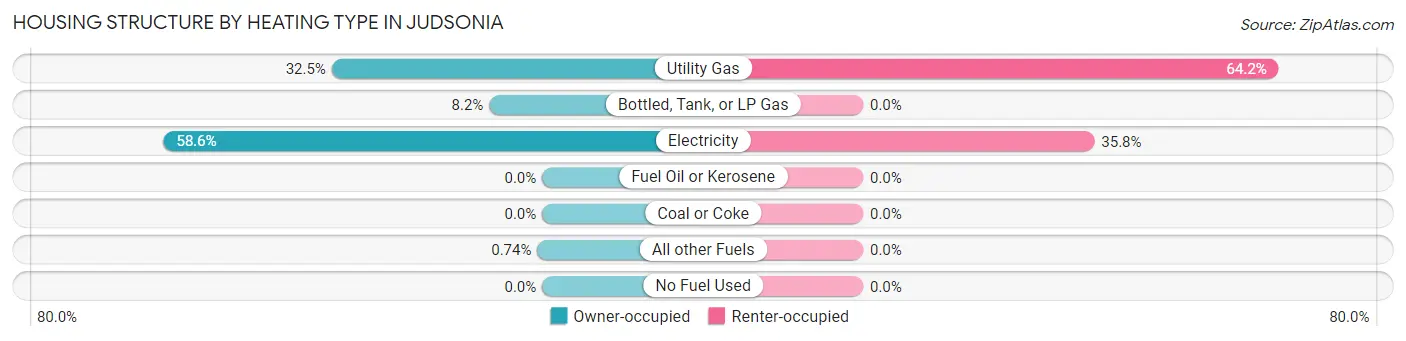
| Heating Type | Owner-occupied | Renter-occupied |
| Utility Gas | 175 (32.5%) | 194 (64.2%) |
| Bottled, Tank, or LP Gas | 44 (8.2%) | 0 (0.0%) |
| Electricity | 315 (58.6%) | 108 (35.8%) |
| Fuel Oil or Kerosene | 0 (0.0%) | 0 (0.0%) |
| Coal or Coke | 0 (0.0%) | 0 (0.0%) |
| All other Fuels | 4 (0.7%) | 0 (0.0%) |
| No Fuel Used | 0 (0.0%) | 0 (0.0%) |
| Total | 538 (100.0%) | 302 (100.0%) |
Household Vehicle Usage in Judsonia
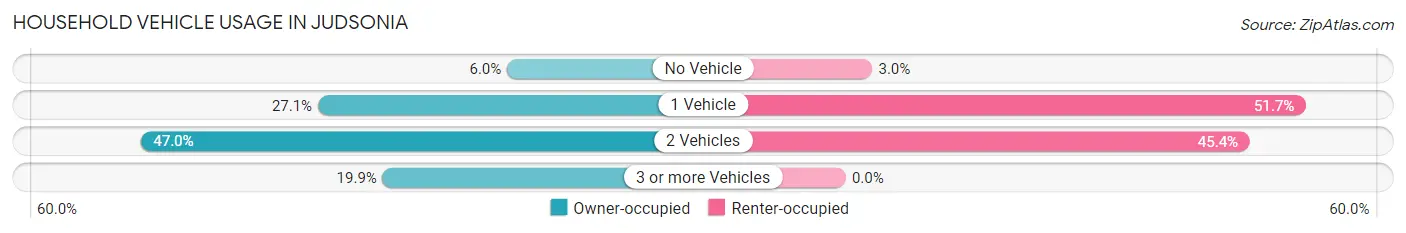
| Vehicles per Household | Owner-occupied | Renter-occupied |
| No Vehicle | 32 (5.9%) | 9 (3.0%) |
| 1 Vehicle | 146 (27.1%) | 156 (51.7%) |
| 2 Vehicles | 253 (47.0%) | 137 (45.4%) |
| 3 or more Vehicles | 107 (19.9%) | 0 (0.0%) |
| Total | 538 (100.0%) | 302 (100.0%) |
Real Estate & Mortgages in Judsonia
Real Estate and Mortgage Overview in Judsonia
| Characteristic | Without Mortgage | With Mortgage |
| Housing Units | 307 | 231 |
| Median Property Value | $95,800 | $98,400 |
| Median Household Income | $41,307 | $25 |
| Monthly Housing Costs | $359 | $0 |
| Real Estate Taxes | $498 | $7 |
Property Value by Mortgage Status in Judsonia
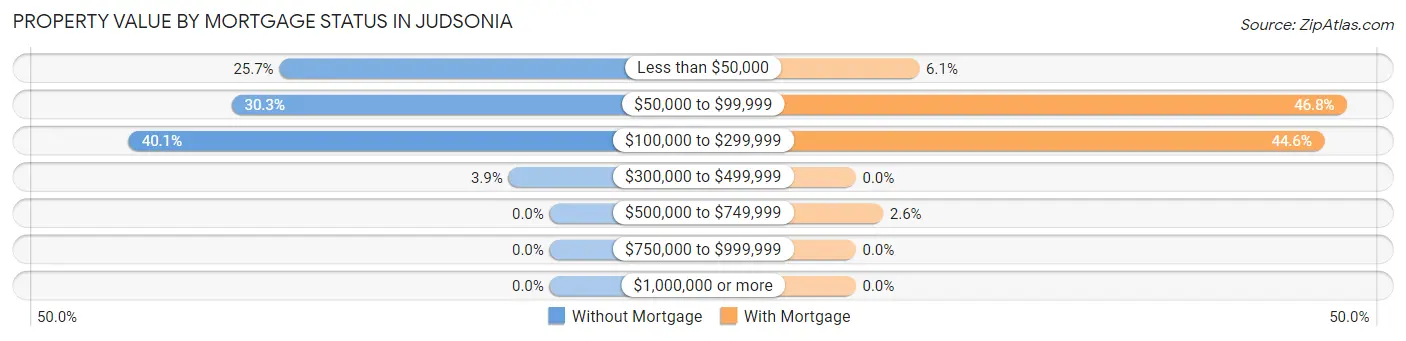
| Property Value | Without Mortgage | With Mortgage |
| Less than $50,000 | 79 (25.7%) | 14 (6.1%) |
| $50,000 to $99,999 | 93 (30.3%) | 108 (46.8%) |
| $100,000 to $299,999 | 123 (40.1%) | 103 (44.6%) |
| $300,000 to $499,999 | 12 (3.9%) | 0 (0.0%) |
| $500,000 to $749,999 | 0 (0.0%) | 6 (2.6%) |
| $750,000 to $999,999 | 0 (0.0%) | 0 (0.0%) |
| $1,000,000 or more | 0 (0.0%) | 0 (0.0%) |
| Total | 307 (100.0%) | 231 (100.0%) |
Household Income by Mortgage Status in Judsonia
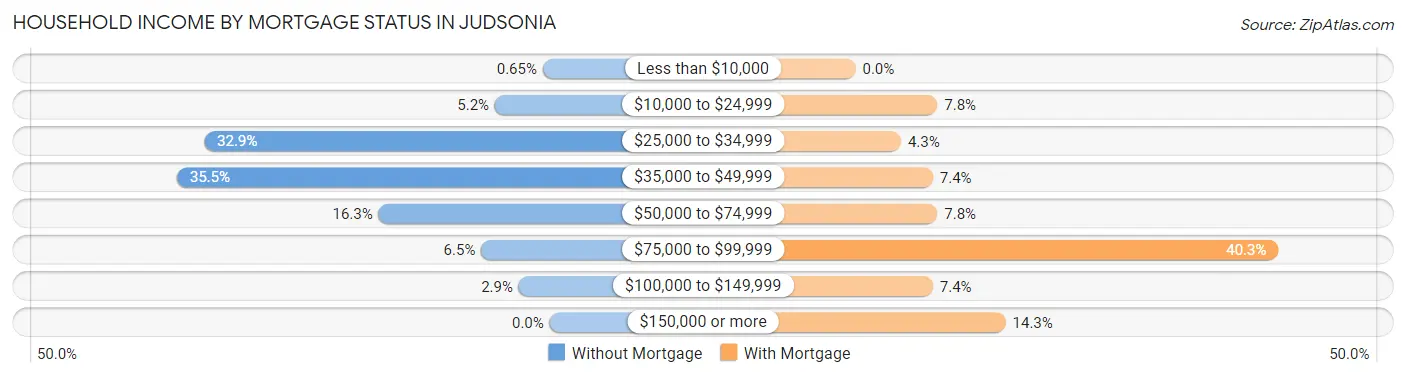
| Household Income | Without Mortgage | With Mortgage |
| Less than $10,000 | 2 (0.6%) | 0 (0.0%) |
| $10,000 to $24,999 | 16 (5.2%) | 18 (7.8%) |
| $25,000 to $34,999 | 101 (32.9%) | 10 (4.3%) |
| $35,000 to $49,999 | 109 (35.5%) | 17 (7.4%) |
| $50,000 to $74,999 | 50 (16.3%) | 18 (7.8%) |
| $75,000 to $99,999 | 20 (6.5%) | 93 (40.3%) |
| $100,000 to $149,999 | 9 (2.9%) | 17 (7.4%) |
| $150,000 or more | 0 (0.0%) | 33 (14.3%) |
| Total | 307 (100.0%) | 231 (100.0%) |
Property Value to Household Income Ratio in Judsonia
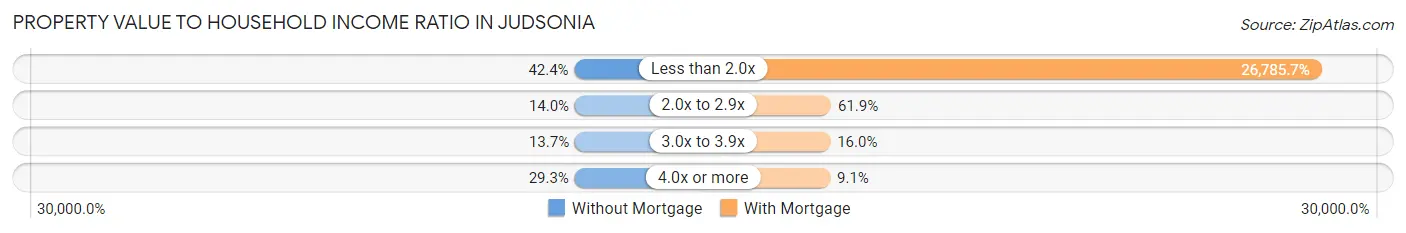
| Value-to-Income Ratio | Without Mortgage | With Mortgage |
| Less than 2.0x | 130 (42.3%) | 61,875 (26,785.7%) |
| 2.0x to 2.9x | 43 (14.0%) | 143 (61.9%) |
| 3.0x to 3.9x | 42 (13.7%) | 37 (16.0%) |
| 4.0x or more | 90 (29.3%) | 21 (9.1%) |
| Total | 307 (100.0%) | 231 (100.0%) |
Real Estate Taxes by Mortgage Status in Judsonia
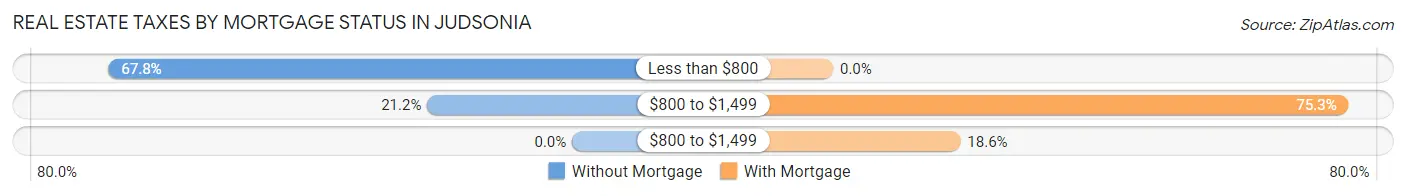
| Property Taxes | Without Mortgage | With Mortgage |
| Less than $800 | 208 (67.7%) | 0 (0.0%) |
| $800 to $1,499 | 65 (21.2%) | 174 (75.3%) |
| $800 to $1,499 | 0 (0.0%) | 43 (18.6%) |
| Total | 307 (100.0%) | 231 (100.0%) |
Health & Disability in Judsonia
Health Insurance Coverage by Age in Judsonia
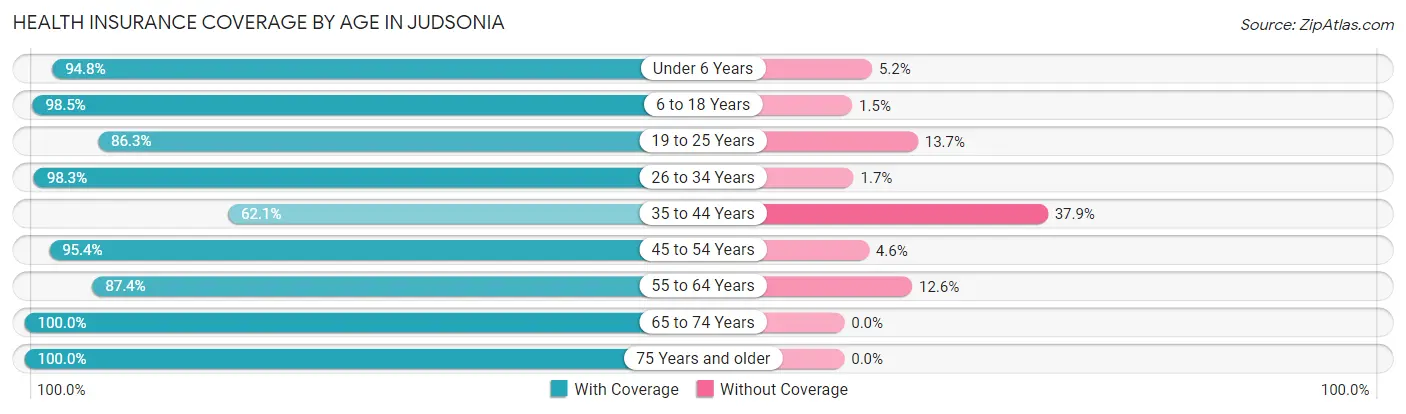
| Age Bracket | With Coverage | Without Coverage |
| Under 6 Years | 147 (94.8%) | 8 (5.2%) |
| 6 to 18 Years | 268 (98.5%) | 4 (1.5%) |
| 19 to 25 Years | 126 (86.3%) | 20 (13.7%) |
| 26 to 34 Years | 284 (98.3%) | 5 (1.7%) |
| 35 to 44 Years | 198 (62.1%) | 121 (37.9%) |
| 45 to 54 Years | 208 (95.4%) | 10 (4.6%) |
| 55 to 64 Years | 235 (87.4%) | 34 (12.6%) |
| 65 to 74 Years | 334 (100.0%) | 0 (0.0%) |
| 75 Years and older | 85 (100.0%) | 0 (0.0%) |
| Total | 1,885 (90.3%) | 202 (9.7%) |
Health Insurance Coverage by Citizenship Status in Judsonia
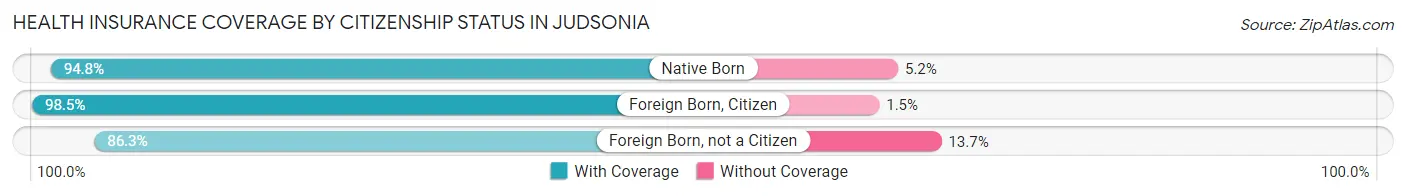
| Citizenship Status | With Coverage | Without Coverage |
| Native Born | 147 (94.8%) | 8 (5.2%) |
| Foreign Born, Citizen | 268 (98.5%) | 4 (1.5%) |
| Foreign Born, not a Citizen | 126 (86.3%) | 20 (13.7%) |
Health Insurance Coverage by Household Income in Judsonia
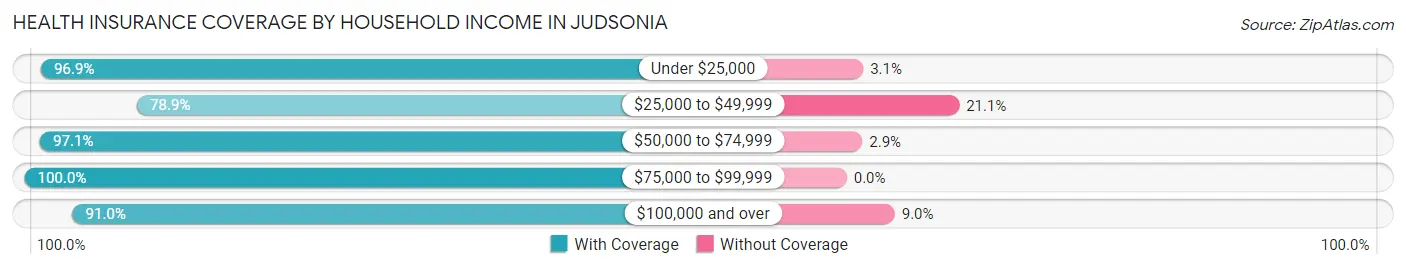
| Household Income | With Coverage | Without Coverage |
| Under $25,000 | 315 (96.9%) | 10 (3.1%) |
| $25,000 to $49,999 | 566 (78.9%) | 151 (21.1%) |
| $50,000 to $74,999 | 566 (97.1%) | 17 (2.9%) |
| $75,000 to $99,999 | 195 (100.0%) | 0 (0.0%) |
| $100,000 and over | 243 (91.0%) | 24 (9.0%) |
Public vs Private Health Insurance Coverage by Age in Judsonia
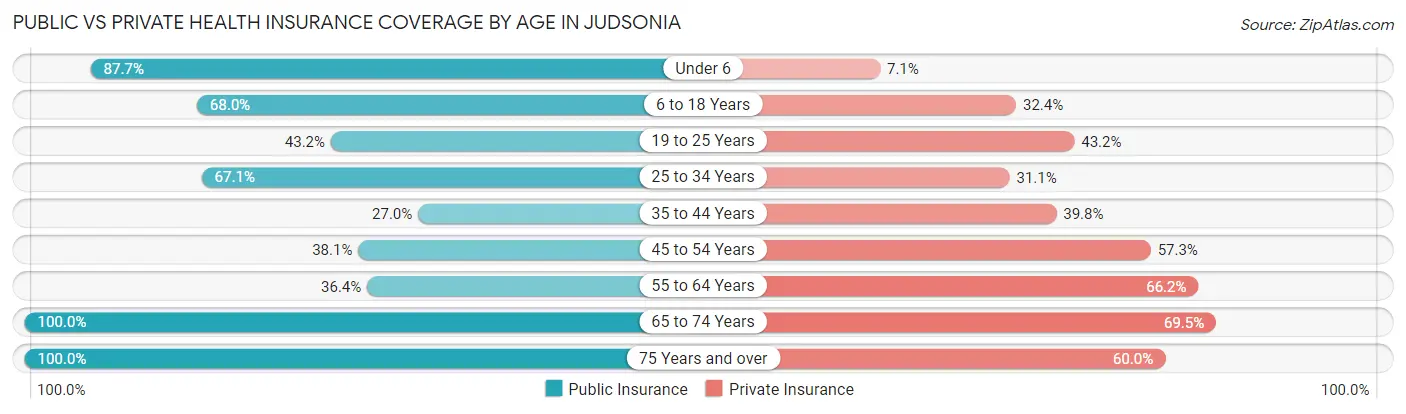
| Age Bracket | Public Insurance | Private Insurance |
| Under 6 | 136 (87.7%) | 11 (7.1%) |
| 6 to 18 Years | 185 (68.0%) | 88 (32.4%) |
| 19 to 25 Years | 63 (43.1%) | 63 (43.1%) |
| 25 to 34 Years | 194 (67.1%) | 90 (31.1%) |
| 35 to 44 Years | 86 (27.0%) | 127 (39.8%) |
| 45 to 54 Years | 83 (38.1%) | 125 (57.3%) |
| 55 to 64 Years | 98 (36.4%) | 178 (66.2%) |
| 65 to 74 Years | 334 (100.0%) | 232 (69.5%) |
| 75 Years and over | 85 (100.0%) | 51 (60.0%) |
| Total | 1,264 (60.6%) | 965 (46.2%) |
Disability Status by Sex by Age in Judsonia
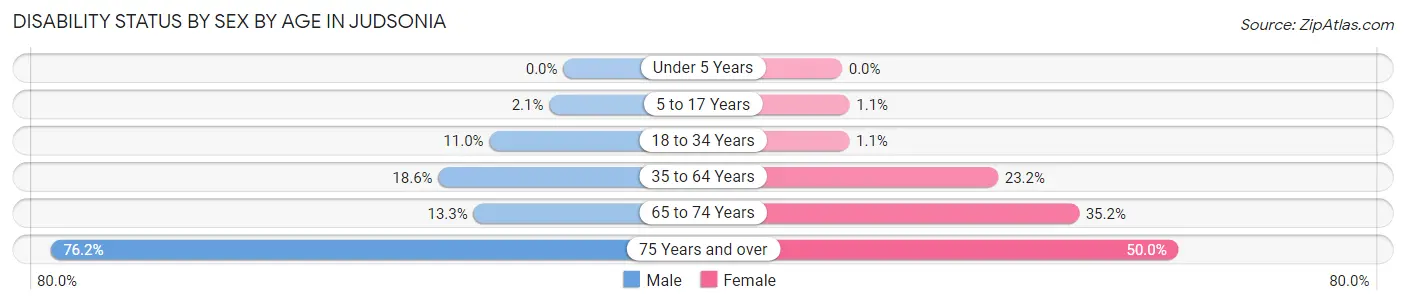
| Age Bracket | Male | Female |
| Under 5 Years | 0 (0.0%) | 0 (0.0%) |
| 5 to 17 Years | 2 (2.1%) | 2 (1.1%) |
| 18 to 34 Years | 18 (11.0%) | 3 (1.1%) |
| 35 to 64 Years | 59 (18.5%) | 113 (23.2%) |
| 65 to 74 Years | 18 (13.3%) | 70 (35.2%) |
| 75 Years and over | 48 (76.2%) | 11 (50.0%) |
Disability Class by Sex by Age in Judsonia
Disability Class: Hearing Difficulty
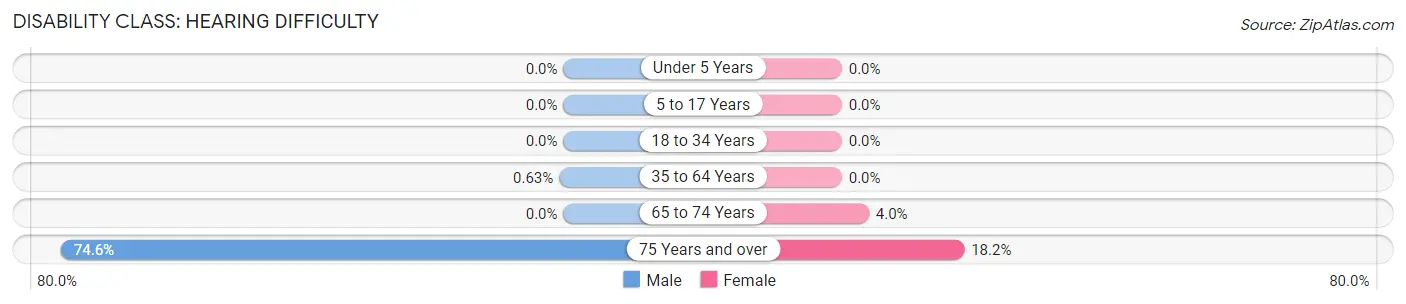
| Age Bracket | Male | Female |
| Under 5 Years | 0 (0.0%) | 0 (0.0%) |
| 5 to 17 Years | 0 (0.0%) | 0 (0.0%) |
| 18 to 34 Years | 0 (0.0%) | 0 (0.0%) |
| 35 to 64 Years | 2 (0.6%) | 0 (0.0%) |
| 65 to 74 Years | 0 (0.0%) | 8 (4.0%) |
| 75 Years and over | 47 (74.6%) | 4 (18.2%) |
Disability Class: Vision Difficulty
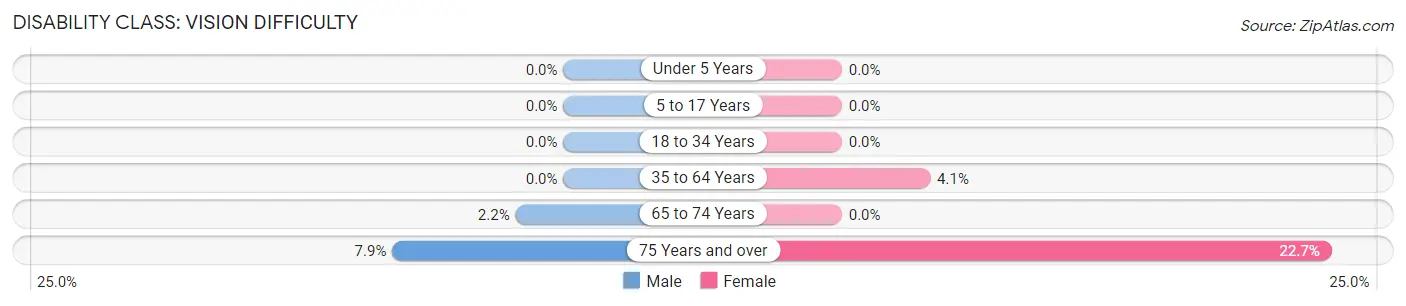
| Age Bracket | Male | Female |
| Under 5 Years | 0 (0.0%) | 0 (0.0%) |
| 5 to 17 Years | 0 (0.0%) | 0 (0.0%) |
| 18 to 34 Years | 0 (0.0%) | 0 (0.0%) |
| 35 to 64 Years | 0 (0.0%) | 20 (4.1%) |
| 65 to 74 Years | 3 (2.2%) | 0 (0.0%) |
| 75 Years and over | 5 (7.9%) | 5 (22.7%) |
Disability Class: Cognitive Difficulty
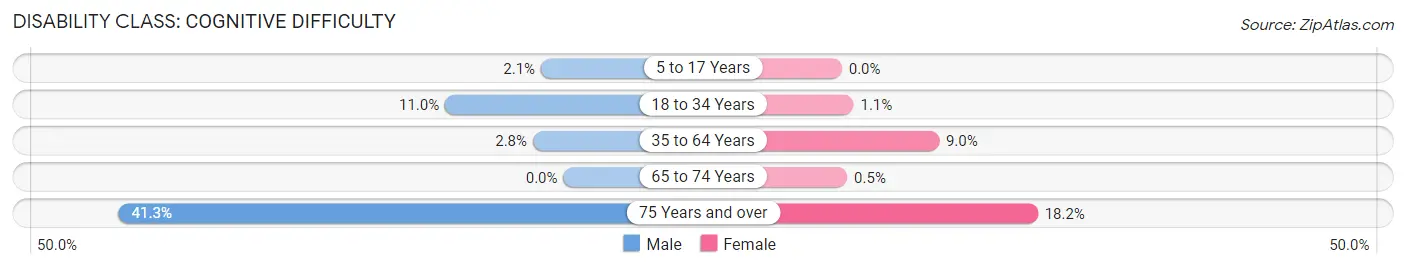
| Age Bracket | Male | Female |
| 5 to 17 Years | 2 (2.1%) | 0 (0.0%) |
| 18 to 34 Years | 18 (11.0%) | 3 (1.1%) |
| 35 to 64 Years | 9 (2.8%) | 44 (9.0%) |
| 65 to 74 Years | 0 (0.0%) | 1 (0.5%) |
| 75 Years and over | 26 (41.3%) | 4 (18.2%) |
Disability Class: Ambulatory Difficulty
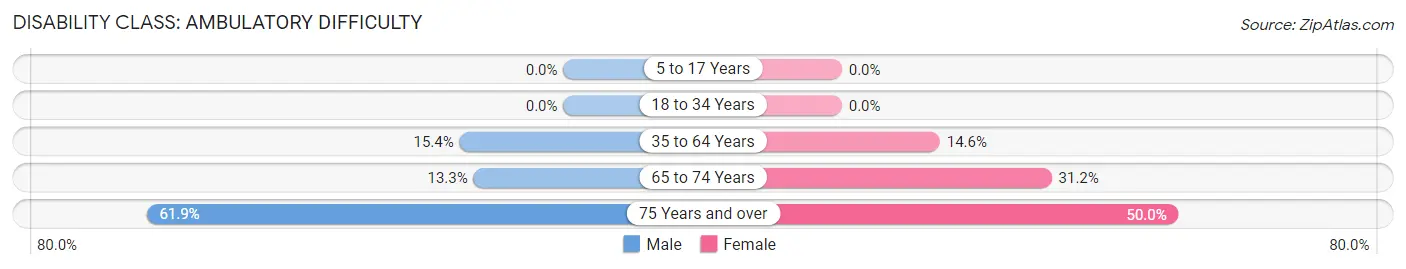
| Age Bracket | Male | Female |
| 5 to 17 Years | 0 (0.0%) | 0 (0.0%) |
| 18 to 34 Years | 0 (0.0%) | 0 (0.0%) |
| 35 to 64 Years | 49 (15.4%) | 71 (14.5%) |
| 65 to 74 Years | 18 (13.3%) | 62 (31.2%) |
| 75 Years and over | 39 (61.9%) | 11 (50.0%) |
Disability Class: Self-Care Difficulty
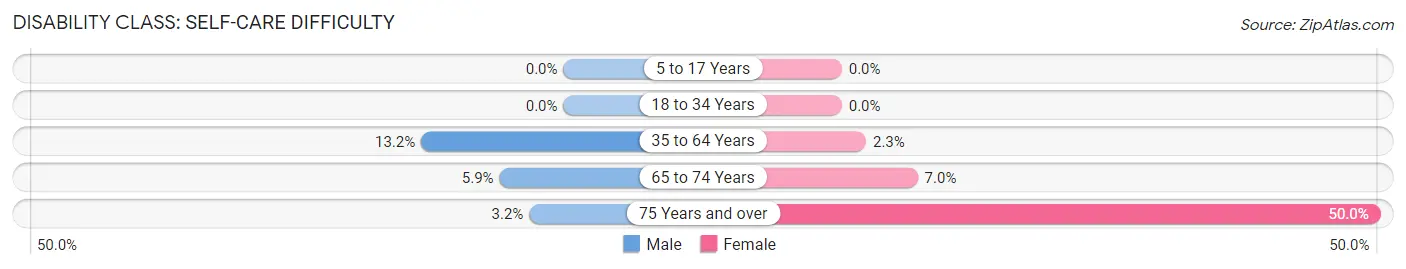
| Age Bracket | Male | Female |
| 5 to 17 Years | 0 (0.0%) | 0 (0.0%) |
| 18 to 34 Years | 0 (0.0%) | 0 (0.0%) |
| 35 to 64 Years | 42 (13.2%) | 11 (2.2%) |
| 65 to 74 Years | 8 (5.9%) | 14 (7.0%) |
| 75 Years and over | 2 (3.2%) | 11 (50.0%) |
Technology Access in Judsonia
Computing Device Access in Judsonia
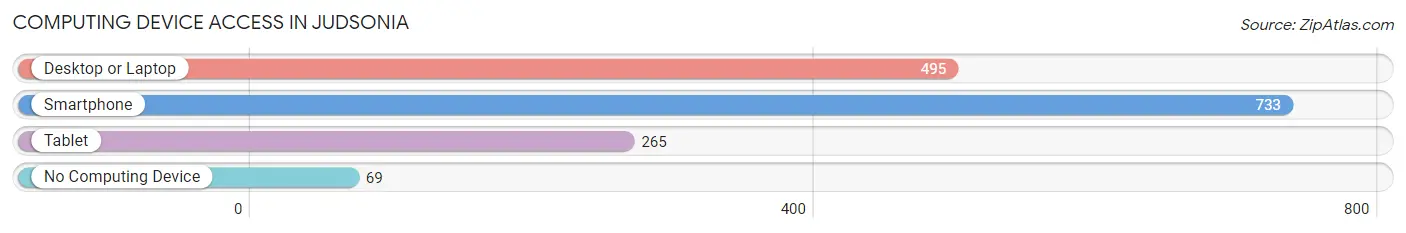
| Device Type | # Households | % Households |
| Desktop or Laptop | 495 | 58.9% |
| Smartphone | 733 | 87.3% |
| Tablet | 265 | 31.6% |
| No Computing Device | 69 | 8.2% |
| Total | 840 | 100.0% |
Internet Access in Judsonia
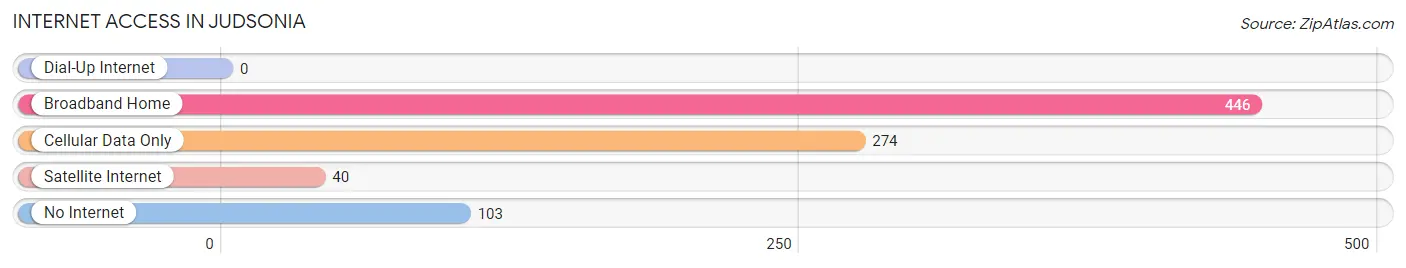
| Internet Type | # Households | % Households |
| Dial-Up Internet | 0 | 0.0% |
| Broadband Home | 446 | 53.1% |
| Cellular Data Only | 274 | 32.6% |
| Satellite Internet | 40 | 4.8% |
| No Internet | 103 | 12.3% |
| Total | 840 | 100.0% |
Judsonia Summary
Judsonia, Arkansas is a small town located in White County, Arkansas. It is situated on the banks of the Little Red River, and is home to a population of approximately 1,500 people. The town was founded in 1873 by William Judson, a former Confederate soldier, and was named in his honor.
Geography
Judsonia is located in the foothills of the Ozark Mountains, and is surrounded by rolling hills and lush forests. The town is situated on the banks of the Little Red River, which provides a source of recreation for the locals. The town is located approximately 30 miles north of Little Rock, and is accessible by US Highway 67.
Economy
Judsonia’s economy is largely based on agriculture, with the majority of the population employed in farming and related industries. The town is also home to several small businesses, including a grocery store, a hardware store, and a few restaurants.
Demographics
As of the 2010 census, the population of Judsonia was 1,521. The racial makeup of the town was 95.3% White, 0.7% African American, 0.3% Native American, 0.2% Asian, 0.1% Pacific Islander, and 3.4% from other races. The median household income was $30,938, and the median family income was $37,813.
History
Judsonia was founded in 1873 by William Judson, a former Confederate soldier. The town was named in his honor, and was incorporated in 1881. The town was originally a farming community, and the economy was largely based on cotton and other agricultural products.
In the early 1900s, Judsonia experienced a period of growth and prosperity. The town was home to several businesses, including a bank, a hotel, and a movie theater. The town also had a thriving music scene, and was home to several popular bands.
In the late 20th century, Judsonia experienced a period of decline. The town’s economy shifted away from agriculture, and many of the businesses closed. The population also declined, and the town’s population is now less than half of what it was in the early 1900s.
Despite the decline, Judsonia remains a vibrant and welcoming community. The town is home to several churches, and the locals are proud of their small-town heritage. The town is also home to several festivals and events, including the annual Judsonia Watermelon Festival.
Judsonia is a small town with a big heart. The locals are friendly and welcoming, and the town is a great place to live and raise a family. The town is also home to a rich history and culture, and is a great place to visit and explore.
Common Questions
What is Per Capita Income in Judsonia?
Per Capita income in Judsonia is $30,625.
What is the Median Family Income in Judsonia?
Median Family Income in Judsonia is $40,652.
What is the Median Household income in Judsonia?
Median Household Income in Judsonia is $41,232.
What is Income or Wage Gap in Judsonia?
Income or Wage Gap in Judsonia is 51.6%.
Women in Judsonia earn 48.4 cents for every dollar earned by a man.
What is Inequality or Gini Index in Judsonia?
Inequality or Gini Index in Judsonia is 0.58.
What is the Total Population of Judsonia?
Total Population of Judsonia is 2,204.
What is the Total Male Population of Judsonia?
Total Male Population of Judsonia is 860.
What is the Total Female Population of Judsonia?
Total Female Population of Judsonia is 1,344.
What is the Ratio of Males per 100 Females in Judsonia?
There are 63.99 Males per 100 Females in Judsonia.
What is the Ratio of Females per 100 Males in Judsonia?
There are 156.28 Females per 100 Males in Judsonia.
What is the Median Population Age in Judsonia?
Median Population Age in Judsonia is 40.9 Years.
What is the Average Family Size in Judsonia
Average Family Size in Judsonia is 2.7 People.
What is the Average Household Size in Judsonia
Average Household Size in Judsonia is 2.5 People.
How Large is the Labor Force in Judsonia?
There are 848 People in the Labor Forcein in Judsonia.
What is the Percentage of People in the Labor Force in Judsonia?
47.4% of People are in the Labor Force in Judsonia.
What is the Unemployment Rate in Judsonia?
Unemployment Rate in Judsonia is 1.7%.