Joiner, AR Map & Demographics
Joiner Map
Joiner Overview
$16,212
PER CAPITA INCOME
$26,691
AVG FAMILY INCOME
$27,321
AVG HOUSEHOLD INCOME
29.6%
WAGE / INCOME GAP [ % ]
70.4¢/ $1
WAGE / INCOME GAP [ $ ]
0.46
INEQUALITY / GINI INDEX
477
TOTAL POPULATION
296
MALE POPULATION
181
FEMALE POPULATION
163.54
MALES / 100 FEMALES
61.15
FEMALES / 100 MALES
26.2
MEDIAN AGE
3.6
AVG FAMILY SIZE
2.6
AVG HOUSEHOLD SIZE
225
LABOR FORCE [ PEOPLE ]
60.0%
PERCENT IN LABOR FORCE
27.6%
UNEMPLOYMENT RATE
Joiner Zip Codes
Joiner Area Codes
Income in Joiner
Income Overview in Joiner
Per Capita Income in Joiner is $16,212, while median incomes of families and households are $26,691 and $27,321 respectively.
| Characteristic | Number | Measure |
| Per Capita Income | 477 | $16,212 |
| Median Family Income | 107 | $26,691 |
| Mean Family Income | 107 | $38,162 |
| Median Household Income | 183 | $27,321 |
| Mean Household Income | 183 | $37,446 |
| Income Deficit | 107 | $0 |
| Wage / Income Gap (%) | 477 | 29.61% |
| Wage / Income Gap ($) | 477 | 70.39¢ per $1 |
| Gini / Inequality Index | 477 | 0.46 |
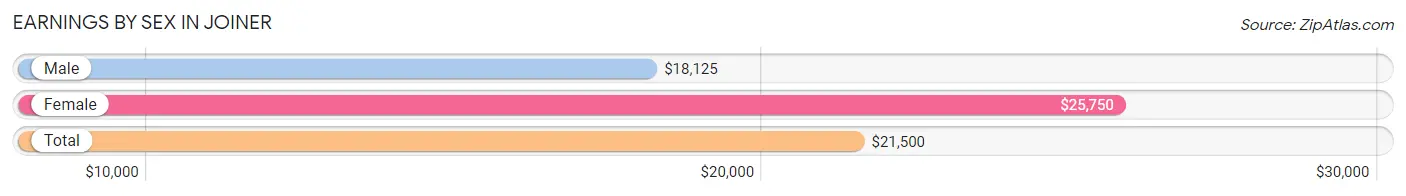
Earnings by Sex in Joiner
Average Earnings in Joiner are $21,500, $18,125 for men and $25,750 for women, a difference of 29.6%.
| Sex | Number | Average Earnings |
| Male | 127 (62.9%) | $18,125 |
| Female | 75 (37.1%) | $25,750 |
| Total | 202 (100.0%) | $21,500 |
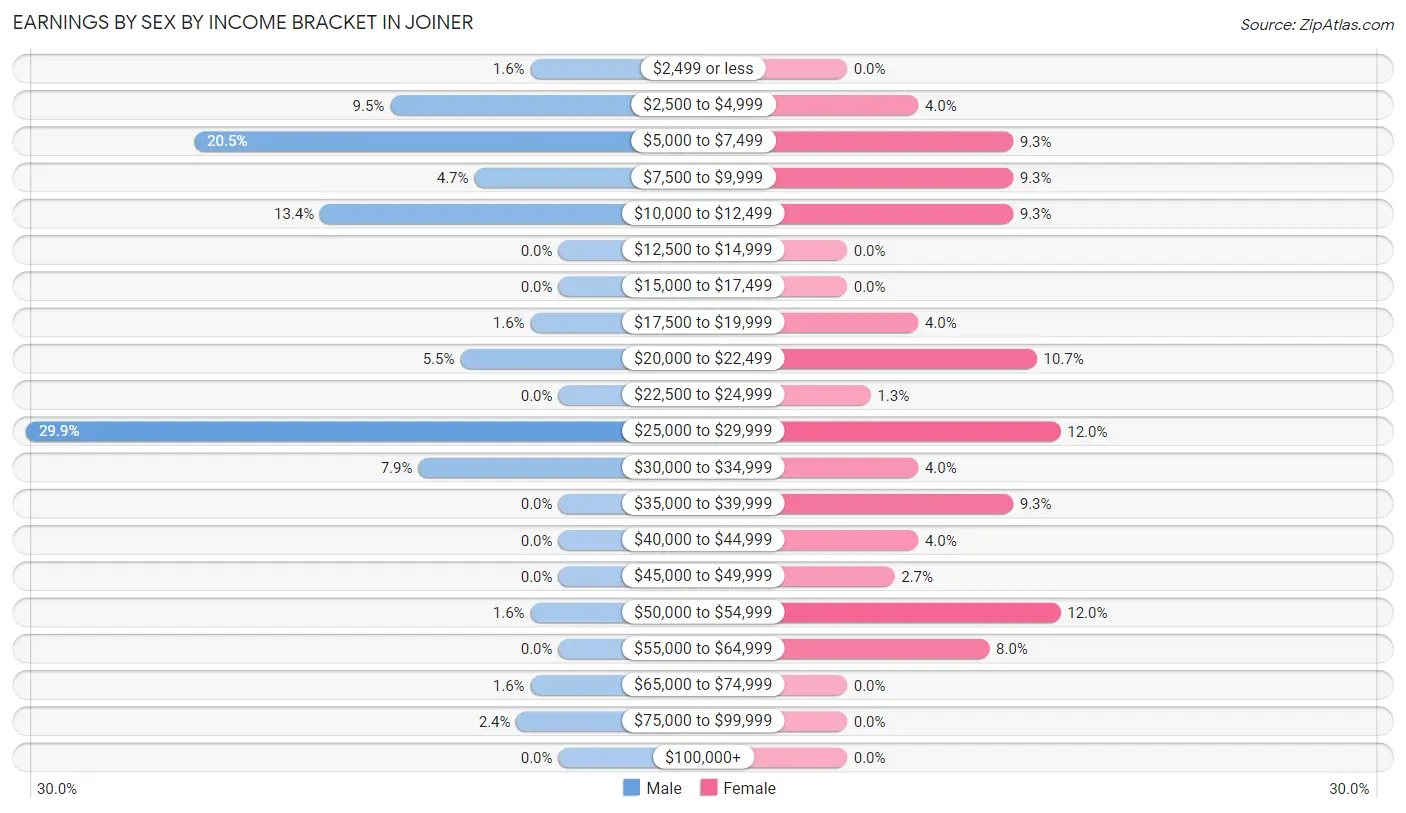
Earnings by Sex by Income Bracket in Joiner
The most common earnings brackets in Joiner are $25,000 to $29,999 for men (38 | 29.9%) and $25,000 to $29,999 for women (9 | 12.0%).
| Income | Male | Female |
| $2,499 or less | 2 (1.6%) | 0 (0.0%) |
| $2,500 to $4,999 | 12 (9.5%) | 3 (4.0%) |
| $5,000 to $7,499 | 26 (20.5%) | 7 (9.3%) |
| $7,500 to $9,999 | 6 (4.7%) | 7 (9.3%) |
| $10,000 to $12,499 | 17 (13.4%) | 7 (9.3%) |
| $12,500 to $14,999 | 0 (0.0%) | 0 (0.0%) |
| $15,000 to $17,499 | 0 (0.0%) | 0 (0.0%) |
| $17,500 to $19,999 | 2 (1.6%) | 3 (4.0%) |
| $20,000 to $22,499 | 7 (5.5%) | 8 (10.7%) |
| $22,500 to $24,999 | 0 (0.0%) | 1 (1.3%) |
| $25,000 to $29,999 | 38 (29.9%) | 9 (12.0%) |
| $30,000 to $34,999 | 10 (7.9%) | 3 (4.0%) |
| $35,000 to $39,999 | 0 (0.0%) | 7 (9.3%) |
| $40,000 to $44,999 | 0 (0.0%) | 3 (4.0%) |
| $45,000 to $49,999 | 0 (0.0%) | 2 (2.7%) |
| $50,000 to $54,999 | 2 (1.6%) | 9 (12.0%) |
| $55,000 to $64,999 | 0 (0.0%) | 6 (8.0%) |
| $65,000 to $74,999 | 2 (1.6%) | 0 (0.0%) |
| $75,000 to $99,999 | 3 (2.4%) | 0 (0.0%) |
| $100,000+ | 0 (0.0%) | 0 (0.0%) |
| Total | 127 (100.0%) | 75 (100.0%) |
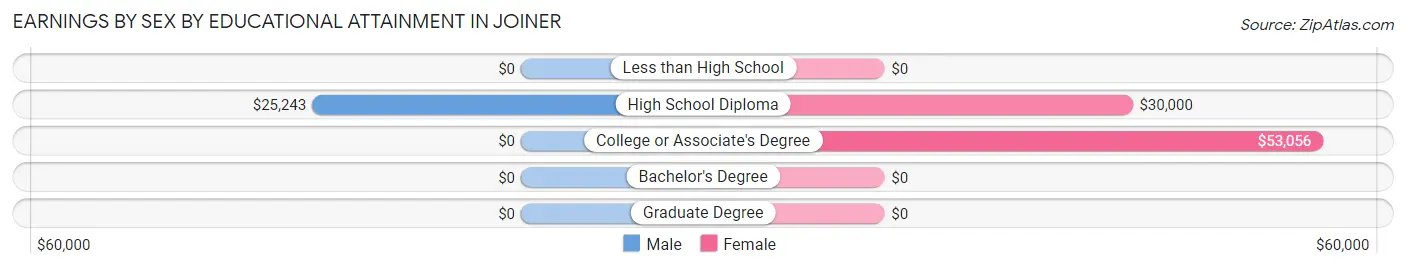
Earnings by Sex by Educational Attainment in Joiner
Average earnings in Joiner are $21,071 for men and $28,438 for women, a difference of 25.9%. Men with an educational attainment of high school diploma enjoy the highest average annual earnings of $25,243, while those with high school diploma education earn the least with $25,243. Women with an educational attainment of college or associate's degree earn the most with the average annual earnings of $53,056, while those with high school diploma education have the smallest earnings of $30,000.
| Educational Attainment | Male Income | Female Income |
| Less than High School | - | - |
| High School Diploma | $25,243 | $30,000 |
| College or Associate's Degree | - | - |
| Bachelor's Degree | - | - |
| Graduate Degree | - | - |
| Total | $21,071 | $28,438 |
Family Income in Joiner
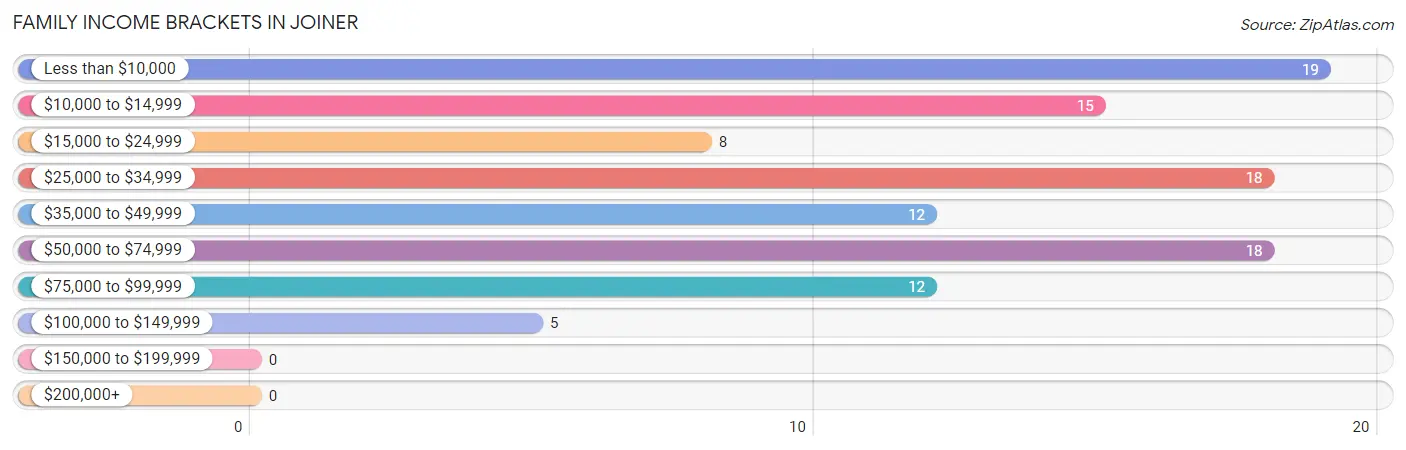
Family Income Brackets in Joiner
According to the Joiner family income data, there are 19 families falling into the less than $10,000 income range, which is the most common income bracket and makes up 17.8% of all families.
| Income Bracket | # Families | % Families |
| Less than $10,000 | 19 | 17.8% |
| $10,000 to $14,999 | 15 | 14.0% |
| $15,000 to $24,999 | 8 | 7.5% |
| $25,000 to $34,999 | 18 | 16.8% |
| $35,000 to $49,999 | 12 | 11.2% |
| $50,000 to $74,999 | 18 | 16.8% |
| $75,000 to $99,999 | 12 | 11.2% |
| $100,000 to $149,999 | 5 | 4.7% |
| $150,000 to $199,999 | 0 | 0.0% |
| $200,000+ | 0 | 0.0% |
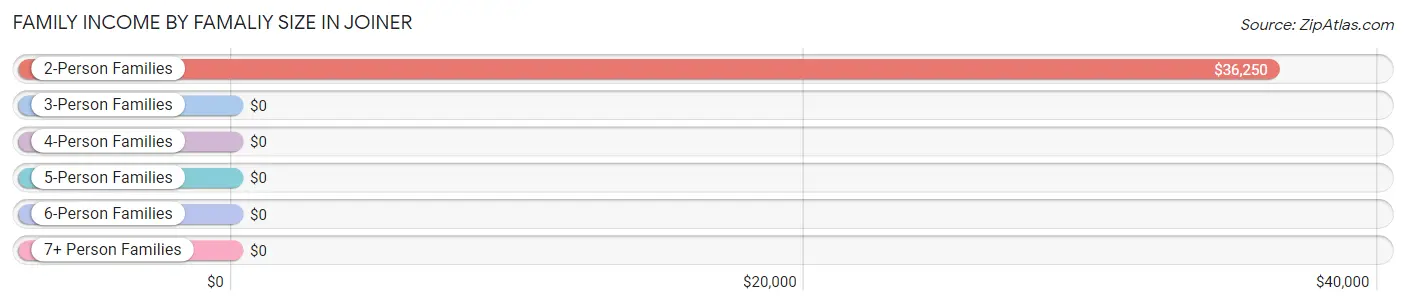
Family Income by Famaliy Size in Joiner
2-person families (53 | 49.5%) account for the highest median family income in Joiner with $36,250 per family, while 2-person families (53 | 49.5%) have the highest median income of $18,125 per family member.
| Income Bracket | # Families | Median Income |
| 2-Person Families | 53 (49.5%) | $36,250 |
| 3-Person Families | 30 (28.0%) | $0 |
| 4-Person Families | 12 (11.2%) | $0 |
| 5-Person Families | 12 (11.2%) | $0 |
| 6-Person Families | 0 (0.0%) | $0 |
| 7+ Person Families | 0 (0.0%) | $0 |
| Total | 107 (100.0%) | $26,691 |
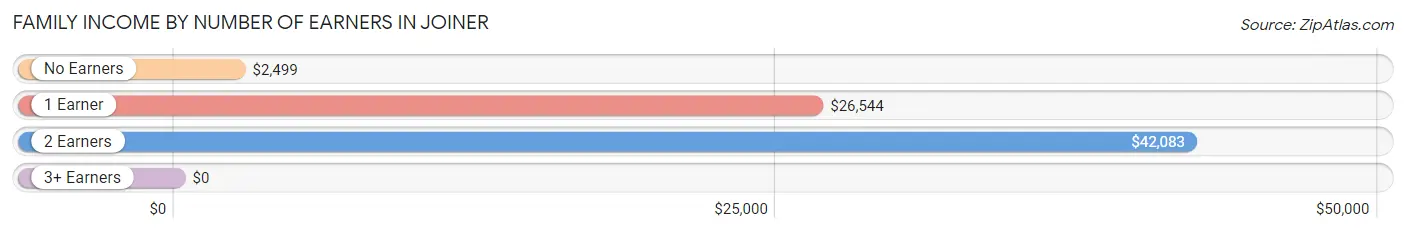
Family Income by Number of Earners in Joiner
| Number of Earners | # Families | Median Income |
| No Earners | 28 (26.2%) | $2,499 |
| 1 Earner | 53 (49.5%) | $26,544 |
| 2 Earners | 24 (22.4%) | $42,083 |
| 3+ Earners | 2 (1.9%) | $0 |
| Total | 107 (100.0%) | $26,691 |
Household Income in Joiner
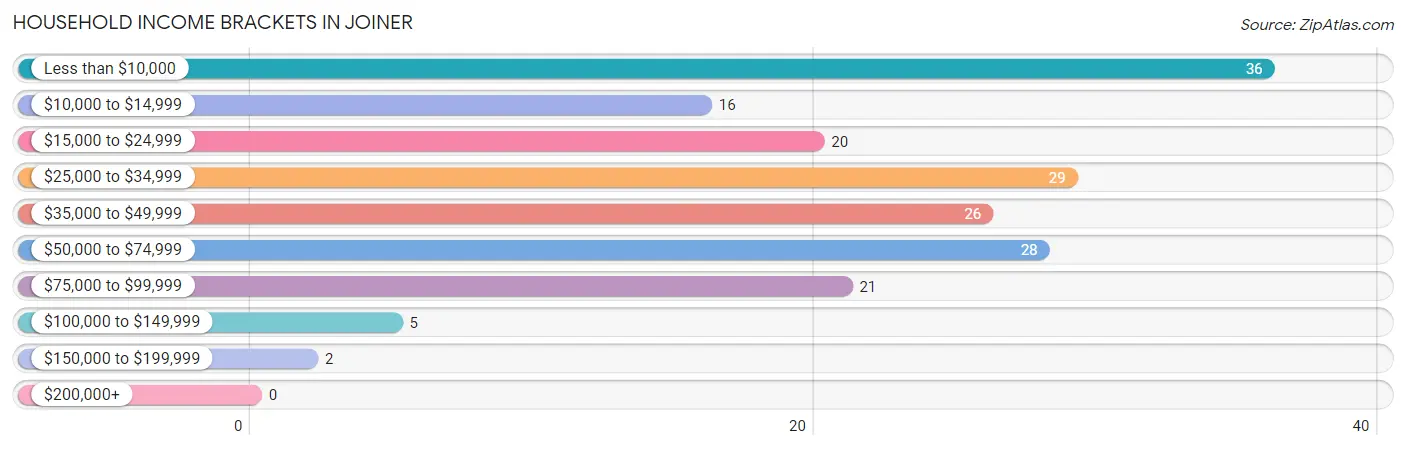
Household Income Brackets in Joiner
With 36 households falling in the category, the less than $10,000 income range is the most frequent in Joiner, accounting for 19.7% of all households.
| Income Bracket | # Households | % Households |
| Less than $10,000 | 36 | 19.7% |
| $10,000 to $14,999 | 16 | 8.7% |
| $15,000 to $24,999 | 20 | 10.9% |
| $25,000 to $34,999 | 29 | 15.8% |
| $35,000 to $49,999 | 26 | 14.2% |
| $50,000 to $74,999 | 28 | 15.3% |
| $75,000 to $99,999 | 21 | 11.5% |
| $100,000 to $149,999 | 5 | 2.7% |
| $150,000 to $199,999 | 2 | 1.1% |
| $200,000+ | 0 | 0.0% |
Household Income by Householder Age in Joiner
The median household income in Joiner is $27,321, with the highest median household income of $36,250 found in the 45 to 64 years age bracket for the primary householder. A total of 73 households (39.9%) fall into this category. Meanwhile, the 15 to 24 years age bracket for the primary householder has the lowest median household income of $0, with 7 households (3.8%) in this group.
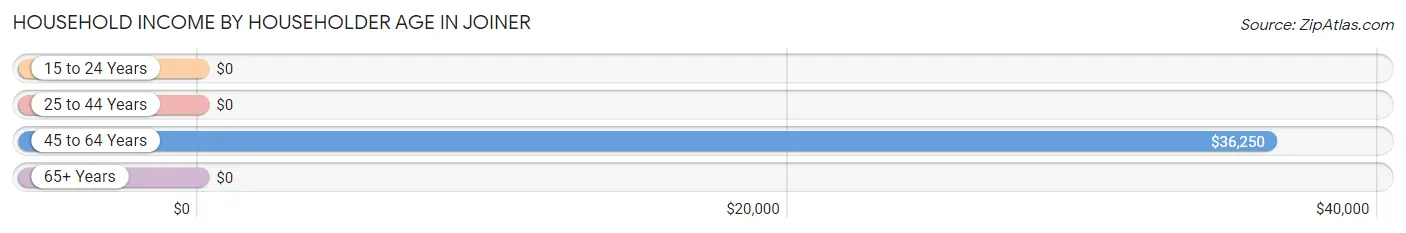
| Income Bracket | # Households | Median Income |
| 15 to 24 Years | 7 (3.8%) | $0 |
| 25 to 44 Years | 46 (25.1%) | $0 |
| 45 to 64 Years | 73 (39.9%) | $36,250 |
| 65+ Years | 57 (31.1%) | $0 |
| Total | 183 (100.0%) | $27,321 |
Poverty in Joiner
Income Below Poverty by Sex and Age in Joiner
With 65.6% poverty level for males and 38.7% for females among the residents of Joiner, 6 to 11 year old males and under 5 year old females are the most vulnerable to poverty, with 23 males (100.0%) and 4 females (100.0%) in their respective age groups living below the poverty level.
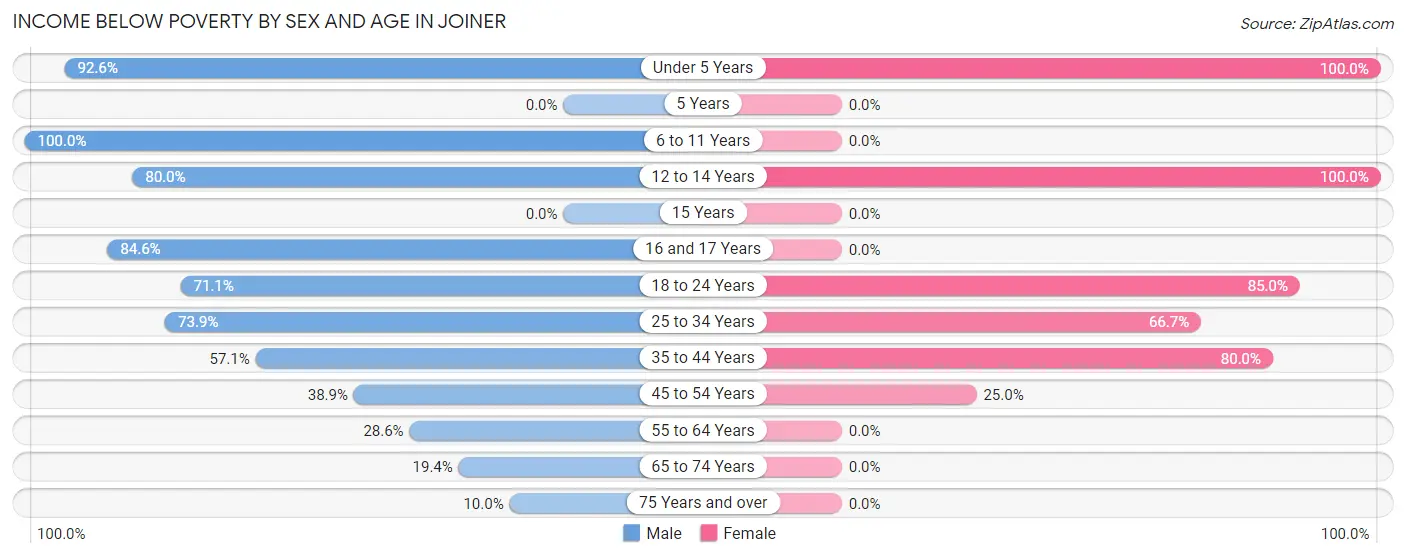
| Age Bracket | Male | Female |
| Under 5 Years | 25 (92.6%) | 4 (100.0%) |
| 5 Years | 0 (0.0%) | 0 (0.0%) |
| 6 to 11 Years | 23 (100.0%) | 0 (0.0%) |
| 12 to 14 Years | 16 (80.0%) | 12 (100.0%) |
| 15 Years | 0 (0.0%) | 0 (0.0%) |
| 16 and 17 Years | 22 (84.6%) | 0 (0.0%) |
| 18 to 24 Years | 27 (71.1%) | 17 (85.0%) |
| 25 to 34 Years | 51 (73.9%) | 16 (66.7%) |
| 35 to 44 Years | 8 (57.1%) | 12 (80.0%) |
| 45 to 54 Years | 7 (38.9%) | 6 (25.0%) |
| 55 to 64 Years | 2 (28.6%) | 0 (0.0%) |
| 65 to 74 Years | 7 (19.4%) | 0 (0.0%) |
| 75 Years and over | 1 (10.0%) | 0 (0.0%) |
| Total | 189 (65.6%) | 67 (38.7%) |
Income Above Poverty by Sex and Age in Joiner
According to the poverty statistics in Joiner, males aged 75 years and over and females aged 55 to 64 years are the age groups that are most secure financially, with 90.0% of males and 100.0% of females in these age groups living above the poverty line.
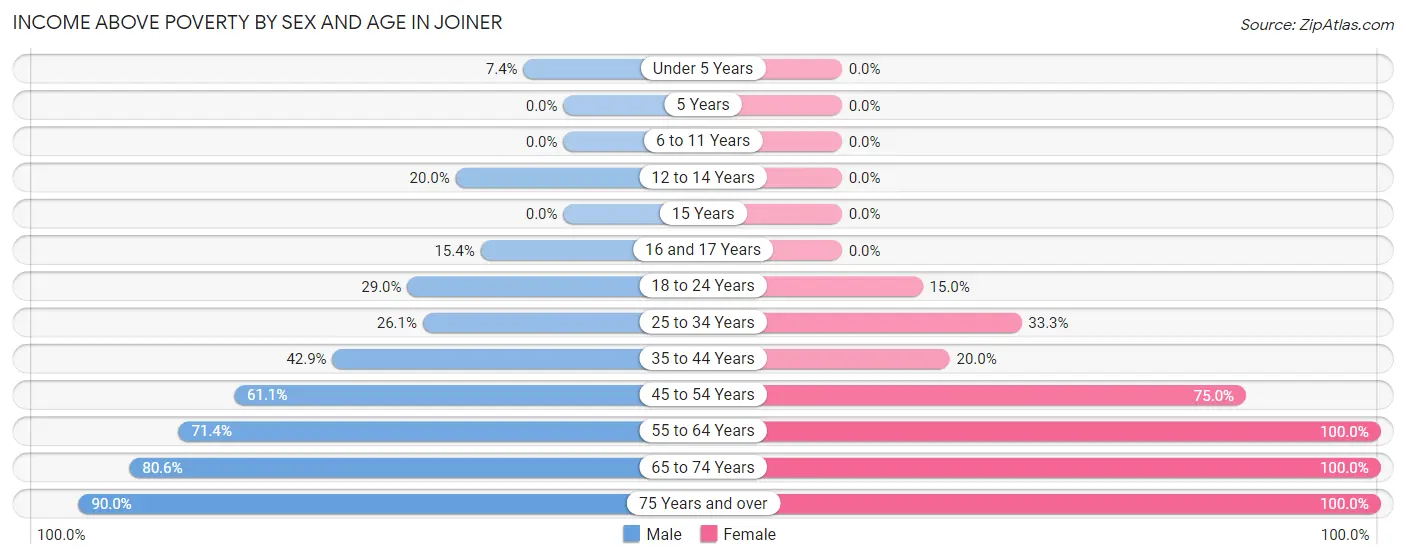
| Age Bracket | Male | Female |
| Under 5 Years | 2 (7.4%) | 0 (0.0%) |
| 5 Years | 0 (0.0%) | 0 (0.0%) |
| 6 to 11 Years | 0 (0.0%) | 0 (0.0%) |
| 12 to 14 Years | 4 (20.0%) | 0 (0.0%) |
| 15 Years | 0 (0.0%) | 0 (0.0%) |
| 16 and 17 Years | 4 (15.4%) | 0 (0.0%) |
| 18 to 24 Years | 11 (28.9%) | 3 (15.0%) |
| 25 to 34 Years | 18 (26.1%) | 8 (33.3%) |
| 35 to 44 Years | 6 (42.9%) | 3 (20.0%) |
| 45 to 54 Years | 11 (61.1%) | 18 (75.0%) |
| 55 to 64 Years | 5 (71.4%) | 30 (100.0%) |
| 65 to 74 Years | 29 (80.6%) | 39 (100.0%) |
| 75 Years and over | 9 (90.0%) | 5 (100.0%) |
| Total | 99 (34.4%) | 106 (61.3%) |
Income Below Poverty Among Married-Couple Families in Joiner
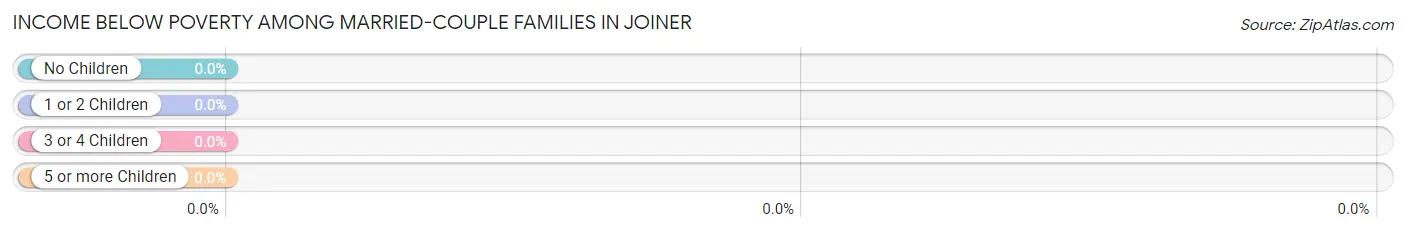
| Children | Above Poverty | Below Poverty |
| No Children | 36 (100.0%) | 0 (0.0%) |
| 1 or 2 Children | 0 (0.0%) | 0 (0.0%) |
| 3 or 4 Children | 0 (0.0%) | 0 (0.0%) |
| 5 or more Children | 0 (0.0%) | 0 (0.0%) |
| Total | 36 (100.0%) | 0 (0.0%) |
Income Below Poverty Among Single-Parent Households in Joiner
According to the poverty data in Joiner, 60.0% or 9 single-father households and 73.2% or 41 single-mother households are living below the poverty line. Among single-father households, those with 1 or 2 children have the highest poverty rate, with 2 households (100.0%) experiencing poverty. Likewise, among single-mother households, those with 3 or 4 children have the highest poverty rate, with 4 households (100.0%) falling below the poverty line.
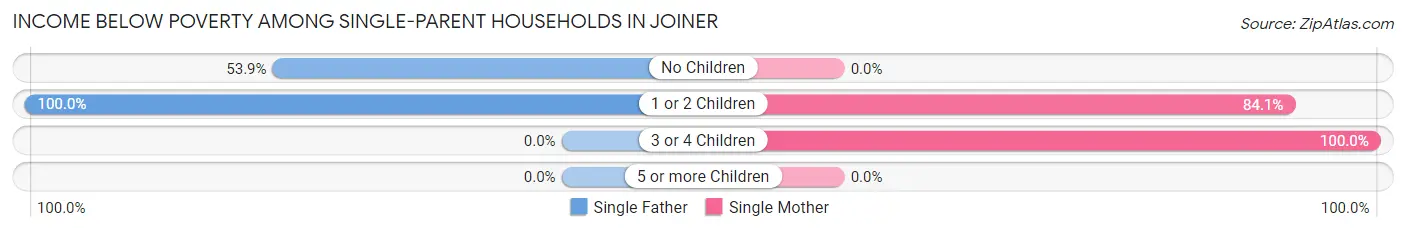
| Children | Single Father | Single Mother |
| No Children | 7 (53.8%) | 0 (0.0%) |
| 1 or 2 Children | 2 (100.0%) | 37 (84.1%) |
| 3 or 4 Children | 0 (0.0%) | 4 (100.0%) |
| 5 or more Children | 0 (0.0%) | 0 (0.0%) |
| Total | 9 (60.0%) | 41 (73.2%) |
Income Below Poverty Among Married-Couple vs Single-Parent Households in Joiner
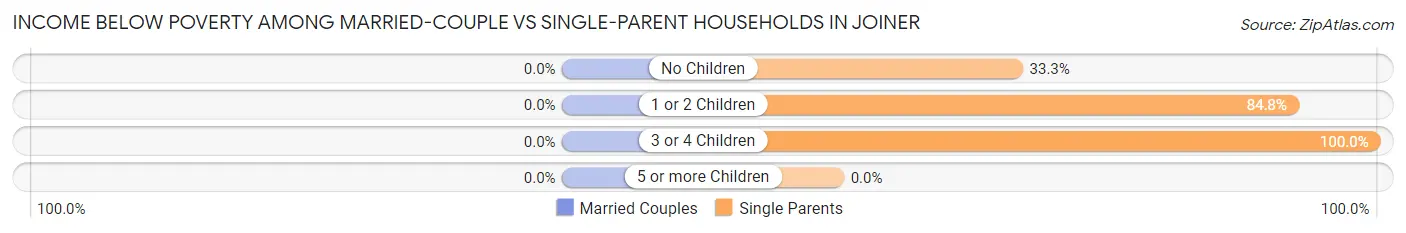
| Children | Married-Couple Families | Single-Parent Households |
| No Children | 0 (0.0%) | 7 (33.3%) |
| 1 or 2 Children | 0 (0.0%) | 39 (84.8%) |
| 3 or 4 Children | 0 (0.0%) | 4 (100.0%) |
| 5 or more Children | 0 (0.0%) | 0 (0.0%) |
| Total | 0 (0.0%) | 50 (70.4%) |
Race in Joiner
The most populous races in Joiner are Black / African American (360 | 75.5%), White / Caucasian (102 | 21.4%), and Two or more Races (15 | 3.1%).
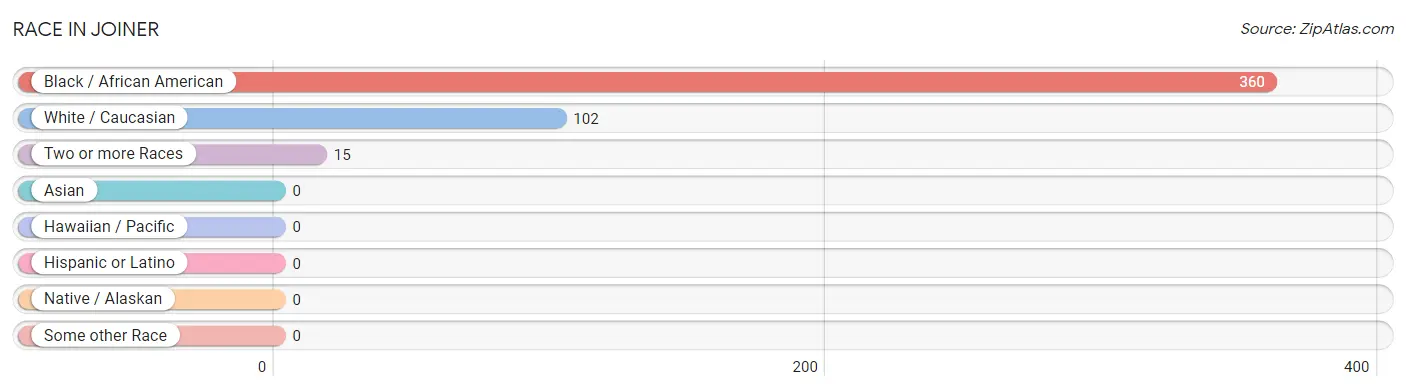
| Race | # Population | % Population |
| Asian | 0 | 0.0% |
| Black / African American | 360 | 75.5% |
| Hawaiian / Pacific | 0 | 0.0% |
| Hispanic or Latino | 0 | 0.0% |
| Native / Alaskan | 0 | 0.0% |
| White / Caucasian | 102 | 21.4% |
| Two or more Races | 15 | 3.1% |
| Some other Race | 0 | 0.0% |
| Total | 477 | 100.0% |
Ancestry in Joiner
The most populous ancestries reported in Joiner are English (28 | 5.9%), African (9 | 1.9%), Subsaharan African (9 | 1.9%), Scotch-Irish (2 | 0.4%), and Cherokee (1 | 0.2%), together accounting for 10.3% of all Joiner residents.
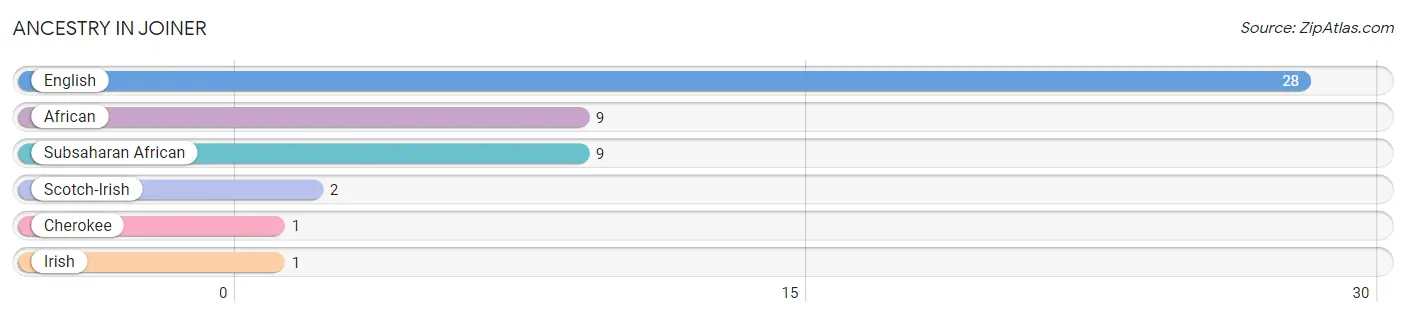
| Ancestry | # Population | % Population |
| African | 9 | 1.9% |
| Cherokee | 1 | 0.2% |
| English | 28 | 5.9% |
| Irish | 1 | 0.2% |
| Scotch-Irish | 2 | 0.4% |
| Subsaharan African | 9 | 1.9% | View All 6 Rows |
Immigrants in Joiner

| Immigration Origin | # Population | % Population | View All 0 Rows |
Sex and Age in Joiner
Sex and Age in Joiner
The most populous age groups in Joiner are 25 to 29 Years (65 | 22.0%) for men and 65 to 69 Years (26 | 14.4%) for women.
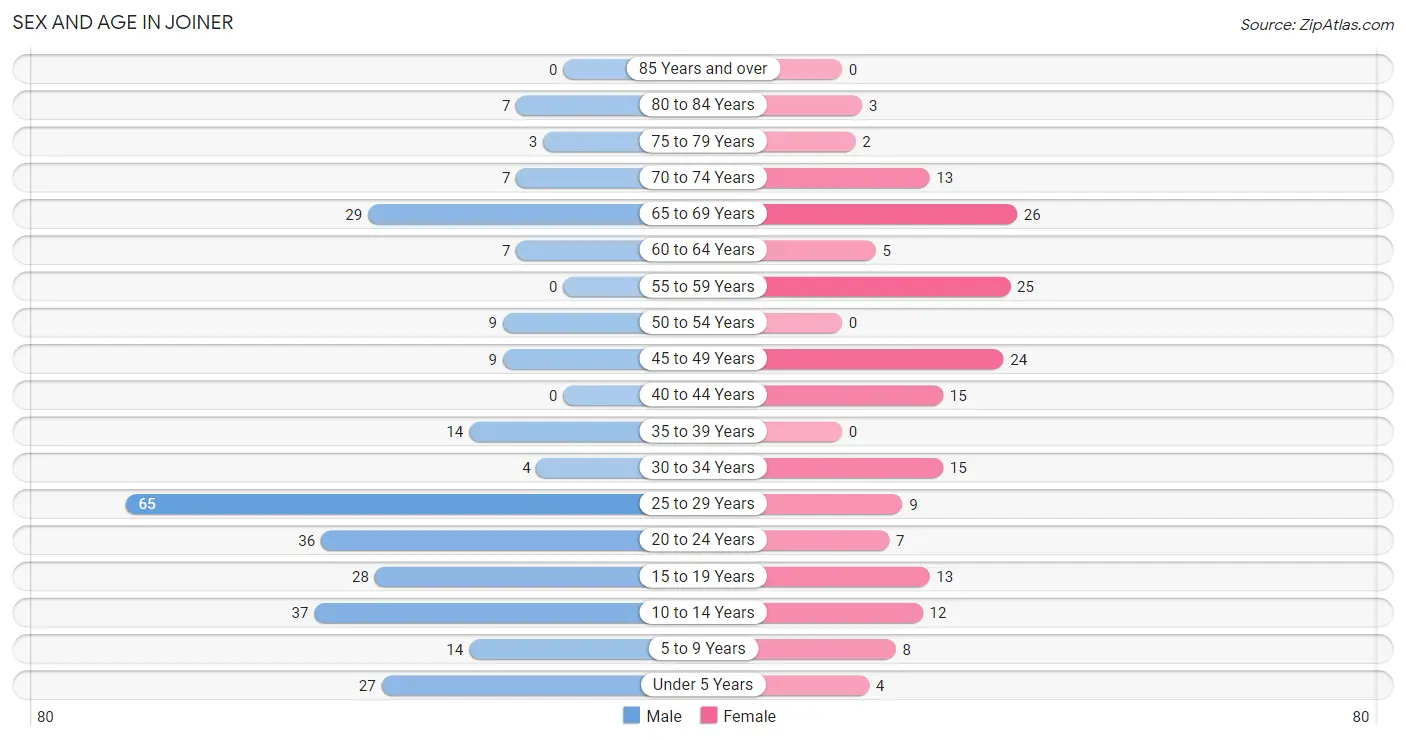
| Age Bracket | Male | Female |
| Under 5 Years | 27 (9.1%) | 4 (2.2%) |
| 5 to 9 Years | 14 (4.7%) | 8 (4.4%) |
| 10 to 14 Years | 37 (12.5%) | 12 (6.6%) |
| 15 to 19 Years | 28 (9.5%) | 13 (7.2%) |
| 20 to 24 Years | 36 (12.2%) | 7 (3.9%) |
| 25 to 29 Years | 65 (22.0%) | 9 (5.0%) |
| 30 to 34 Years | 4 (1.3%) | 15 (8.3%) |
| 35 to 39 Years | 14 (4.7%) | 0 (0.0%) |
| 40 to 44 Years | 0 (0.0%) | 15 (8.3%) |
| 45 to 49 Years | 9 (3.0%) | 24 (13.3%) |
| 50 to 54 Years | 9 (3.0%) | 0 (0.0%) |
| 55 to 59 Years | 0 (0.0%) | 25 (13.8%) |
| 60 to 64 Years | 7 (2.4%) | 5 (2.8%) |
| 65 to 69 Years | 29 (9.8%) | 26 (14.4%) |
| 70 to 74 Years | 7 (2.4%) | 13 (7.2%) |
| 75 to 79 Years | 3 (1.0%) | 2 (1.1%) |
| 80 to 84 Years | 7 (2.4%) | 3 (1.7%) |
| 85 Years and over | 0 (0.0%) | 0 (0.0%) |
| Total | 296 (100.0%) | 181 (100.0%) |
Families and Households in Joiner
Median Family Size in Joiner
The median family size in Joiner is 3.57 persons per family, with single female/mother families (56 | 52.3%) accounting for the largest median family size of 4.68 persons per family. On the other hand, single male/father families (15 | 14.0%) represent the smallest median family size with 2.13 persons per family.
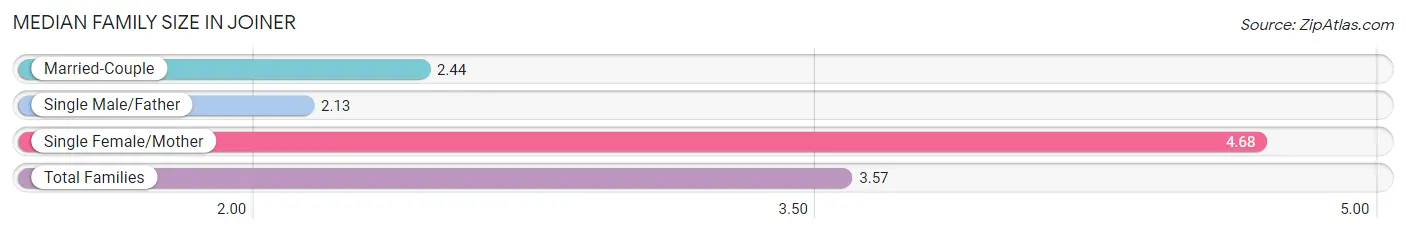
| Family Type | # Families | Family Size |
| Married-Couple | 36 (33.6%) | 2.44 |
| Single Male/Father | 15 (14.0%) | 2.13 |
| Single Female/Mother | 56 (52.3%) | 4.68 |
| Total Families | 107 (100.0%) | 3.57 |
Median Household Size in Joiner
The median household size in Joiner is 2.61 persons per household, with single female/mother households (56 | 30.6%) accounting for the largest median household size of 4.68 persons per household. non-family households (76 | 41.5%) represent the smallest median household size with 1.21 persons per household.
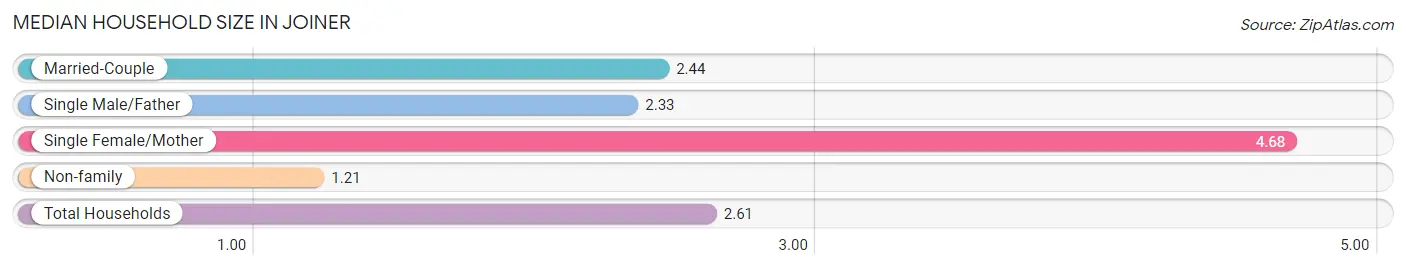
| Household Type | # Households | Household Size |
| Married-Couple | 36 (19.7%) | 2.44 |
| Single Male/Father | 15 (8.2%) | 2.33 |
| Single Female/Mother | 56 (30.6%) | 4.68 |
| Non-family | 76 (41.5%) | 1.21 |
| Total Households | 183 (100.0%) | 2.61 |
Household Size by Marriage Status in Joiner
Out of a total of 183 households in Joiner, 107 (58.5%) are family households, while 76 (41.5%) are nonfamily households. The most numerous type of family households are 2-person households, comprising 51, and the most common type of nonfamily households are 1-person households, comprising 72.
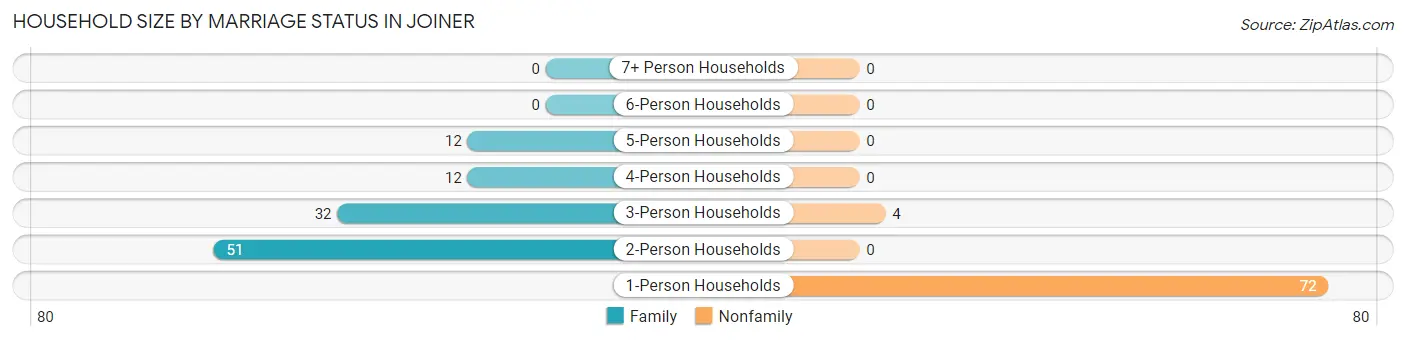
| Household Size | Family Households | Nonfamily Households |
| 1-Person Households | - | 72 (39.3%) |
| 2-Person Households | 51 (27.9%) | 0 (0.0%) |
| 3-Person Households | 32 (17.5%) | 4 (2.2%) |
| 4-Person Households | 12 (6.6%) | 0 (0.0%) |
| 5-Person Households | 12 (6.6%) | 0 (0.0%) |
| 6-Person Households | 0 (0.0%) | 0 (0.0%) |
| 7+ Person Households | 0 (0.0%) | 0 (0.0%) |
| Total | 107 (58.5%) | 76 (41.5%) |
Female Fertility in Joiner
Fertility by Age in Joiner
Average fertility rate in Joiner is 48.0 births per 1,000 women. Women in the age bracket of 20 to 34 years have the highest fertility rate with 129.0 births per 1,000 women. Women in the age bracket of 20 to 34 years acount for 100.0% of all women with births.
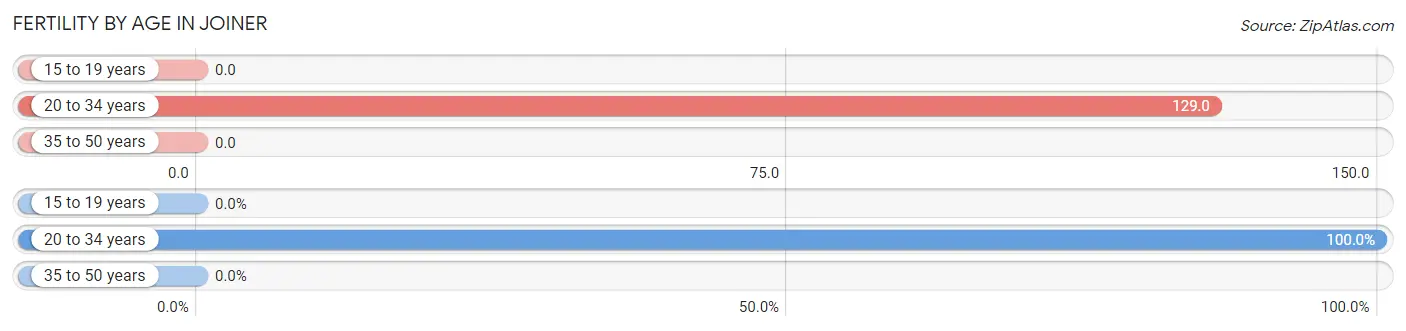
| Age Bracket | Women with Births | Births / 1,000 Women |
| 15 to 19 years | 0 (0.0%) | 0.0 |
| 20 to 34 years | 4 (100.0%) | 129.0 |
| 35 to 50 years | 0 (0.0%) | 0.0 |
| Total | 4 (100.0%) | 48.0 |
Fertility by Age by Marriage Status in Joiner
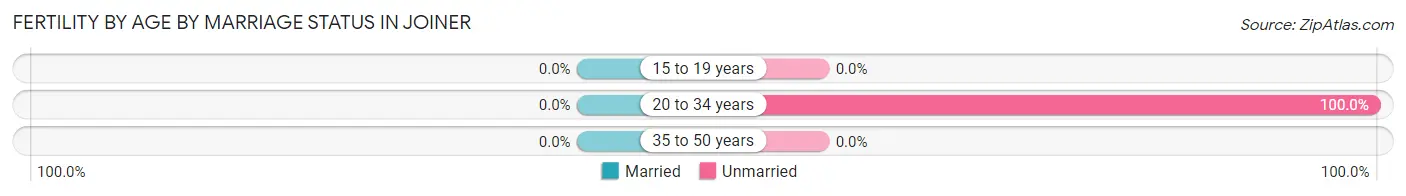
| Age Bracket | Married | Unmarried |
| 15 to 19 years | 0 (0.0%) | 0 (0.0%) |
| 20 to 34 years | 0 (0.0%) | 4 (100.0%) |
| 35 to 50 years | 0 (0.0%) | 0 (0.0%) |
| Total | 0 (0.0%) | 4 (100.0%) |
Fertility by Education in Joiner
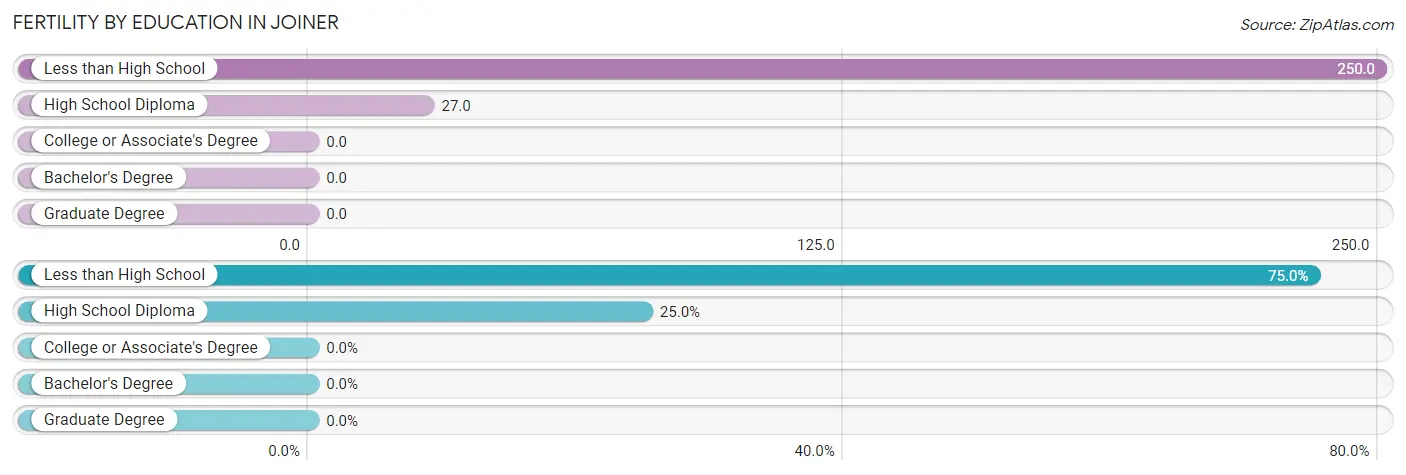
| Educational Attainment | Women with Births | Births / 1,000 Women |
| Less than High School | 3 (75.0%) | 250.0 |
| High School Diploma | 1 (25.0%) | 27.0 |
| College or Associate's Degree | 0 (0.0%) | 0.0 |
| Bachelor's Degree | 0 (0.0%) | 0.0 |
| Graduate Degree | 0 (0.0%) | 0.0 |
| Total | 4 (100.0%) | 48.0 |
Fertility by Education by Marriage Status in Joiner
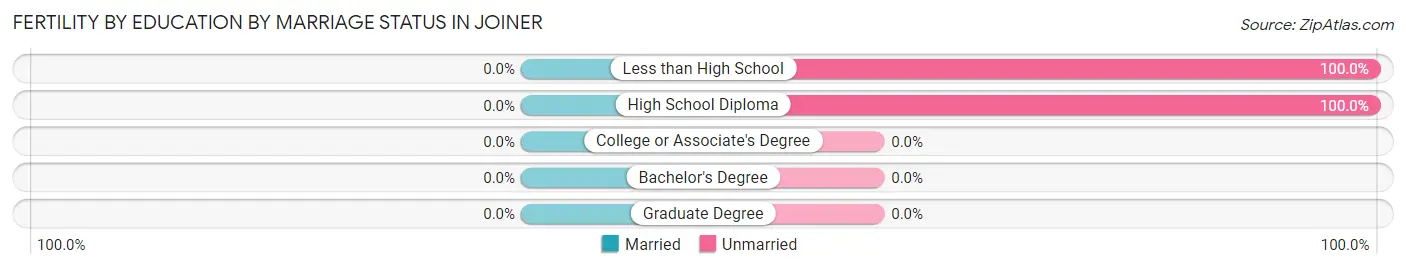
| Educational Attainment | Married | Unmarried |
| Less than High School | 0 (0.0%) | 3 (100.0%) |
| High School Diploma | 0 (0.0%) | 1 (100.0%) |
| College or Associate's Degree | 0 (0.0%) | 0 (0.0%) |
| Bachelor's Degree | 0 (0.0%) | 0 (0.0%) |
| Graduate Degree | 0 (0.0%) | 0 (0.0%) |
| Total | 0 (0.0%) | 4 (100.0%) |
Employment Characteristics in Joiner
Employment by Class of Employer in Joiner
Among the 125 employed individuals in Joiner, private company employees (57 | 45.6%), state government employees (18 | 14.4%), and self-employed (incorporated) (13 | 10.4%) make up the most common classes of employment.
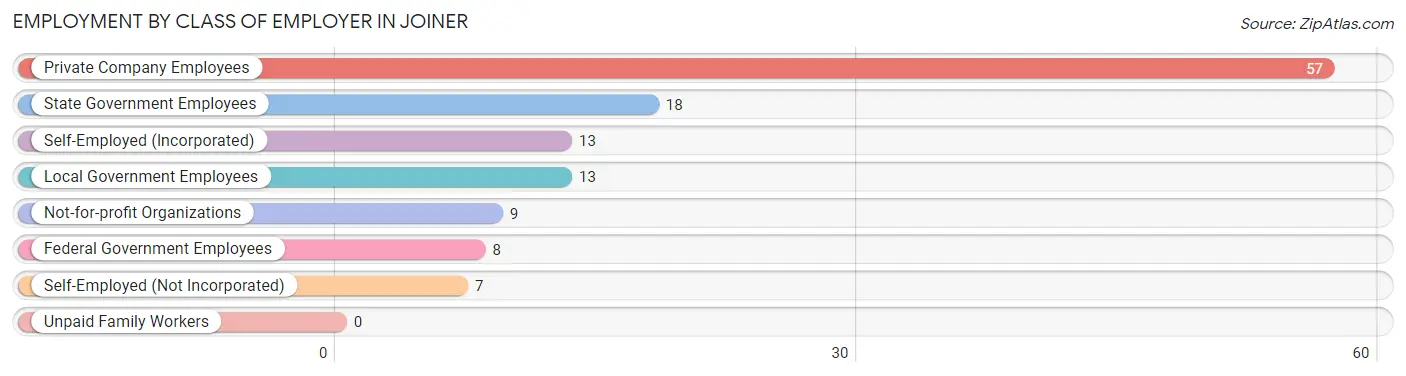
| Employer Class | # Employees | % Employees |
| Private Company Employees | 57 | 45.6% |
| Self-Employed (Incorporated) | 13 | 10.4% |
| Self-Employed (Not Incorporated) | 7 | 5.6% |
| Not-for-profit Organizations | 9 | 7.2% |
| Local Government Employees | 13 | 10.4% |
| State Government Employees | 18 | 14.4% |
| Federal Government Employees | 8 | 6.4% |
| Unpaid Family Workers | 0 | 0.0% |
| Total | 125 | 100.0% |
Employment Status by Age in Joiner
According to the labor force statistics for Joiner, out of the total population over 16 years of age (375), 60.0% or 225 individuals are in the labor force, with 27.6% or 62 of them unemployed. The age group with the highest labor force participation rate is 25 to 29 years, with 100.0% or 74 individuals in the labor force. Within the labor force, the 20 to 24 years age range has the highest percentage of unemployed individuals, with 100.0% or 12 of them being unemployed.
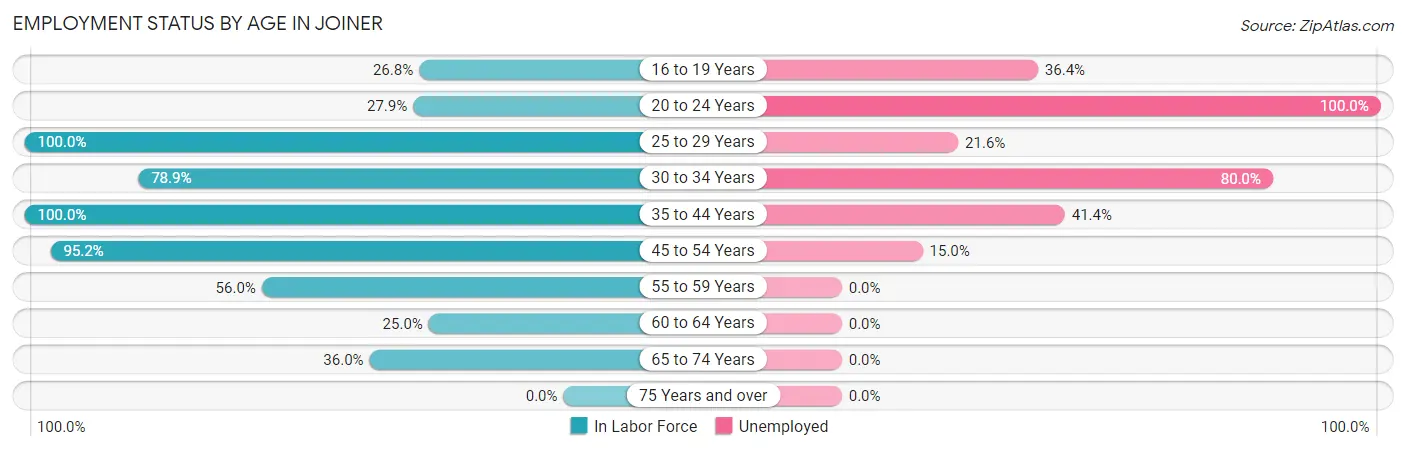
| Age Bracket | In Labor Force | Unemployed |
| 16 to 19 Years | 11 (26.8%) | 4 (36.4%) |
| 20 to 24 Years | 12 (27.9%) | 12 (100.0%) |
| 25 to 29 Years | 74 (100.0%) | 16 (21.6%) |
| 30 to 34 Years | 15 (78.9%) | 12 (80.0%) |
| 35 to 44 Years | 29 (100.0%) | 12 (41.4%) |
| 45 to 54 Years | 40 (95.2%) | 6 (15.0%) |
| 55 to 59 Years | 14 (56.0%) | 0 (0.0%) |
| 60 to 64 Years | 3 (25.0%) | 0 (0.0%) |
| 65 to 74 Years | 27 (36.0%) | 0 (0.0%) |
| 75 Years and over | 0 (0.0%) | 0 (0.0%) |
| Total | 225 (60.0%) | 62 (27.6%) |
Employment Status by Educational Attainment in Joiner
According to labor force statistics for Joiner, 87.1% of individuals (175) out of the total population between 25 and 64 years of age (201) are in the labor force, with 26.3% or 46 of them being unemployed. The group with the highest labor force participation rate are those with the educational attainment of bachelor's degree or higher, with 90.5% or 19 individuals in the labor force. Within the labor force, individuals with bachelor's degree or higher education have the highest percentage of unemployment, with 63.2% or 12 of them being unemployed.
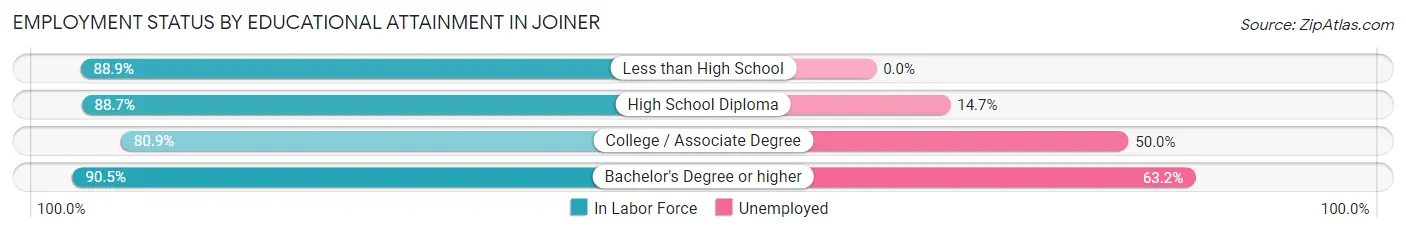
| Educational Attainment | In Labor Force | Unemployed |
| Less than High School | 16 (88.9%) | 0 (0.0%) |
| High School Diploma | 102 (88.7%) | 17 (14.7%) |
| College / Associate Degree | 38 (80.9%) | 24 (50.0%) |
| Bachelor's Degree or higher | 19 (90.5%) | 13 (63.2%) |
| Total | 175 (87.1%) | 53 (26.3%) |
Employment Occupations by Sex in Joiner
Management, Business, Science and Arts Occupations
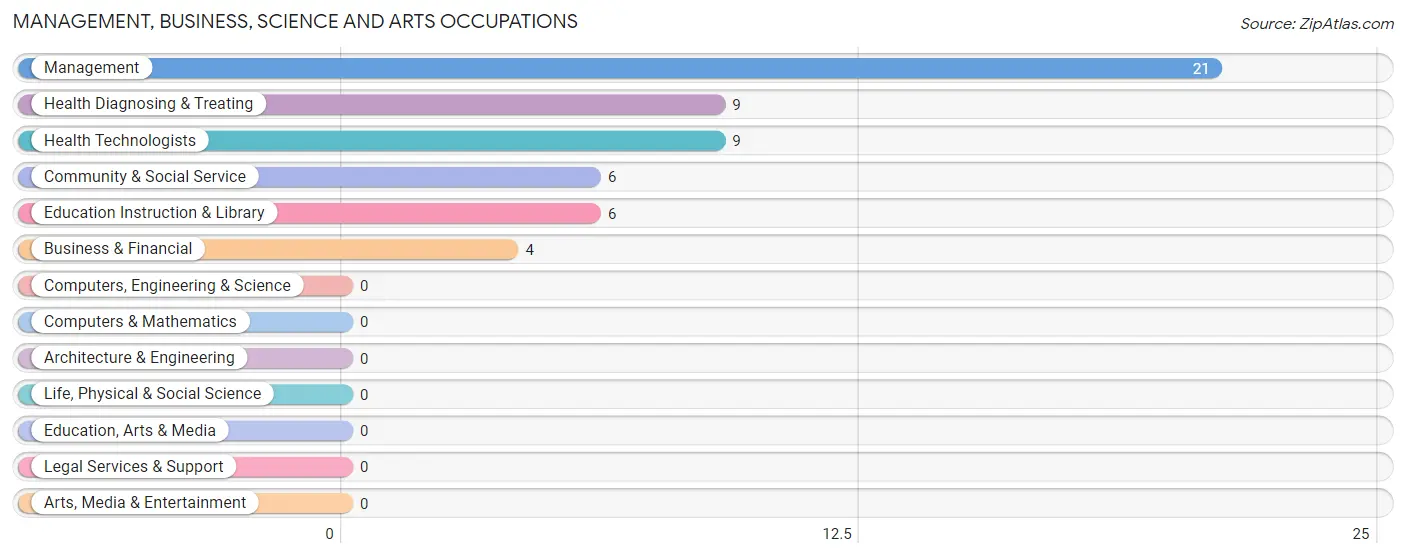
The most common Management, Business, Science and Arts occupations in Joiner are Management (21 | 12.9%), Health Diagnosing & Treating (9 | 5.5%), Health Technologists (9 | 5.5%), Community & Social Service (6 | 3.7%), and Education Instruction & Library (6 | 3.7%).
Management, Business, Science and Arts Occupations by Sex
Within the Management, Business, Science and Arts occupations in Joiner, the most male-oriented occupations are Business & Financial (100.0%), and Management (33.3%), while the most female-oriented occupations are Community & Social Service (100.0%), Education Instruction & Library (100.0%), and Health Diagnosing & Treating (100.0%).
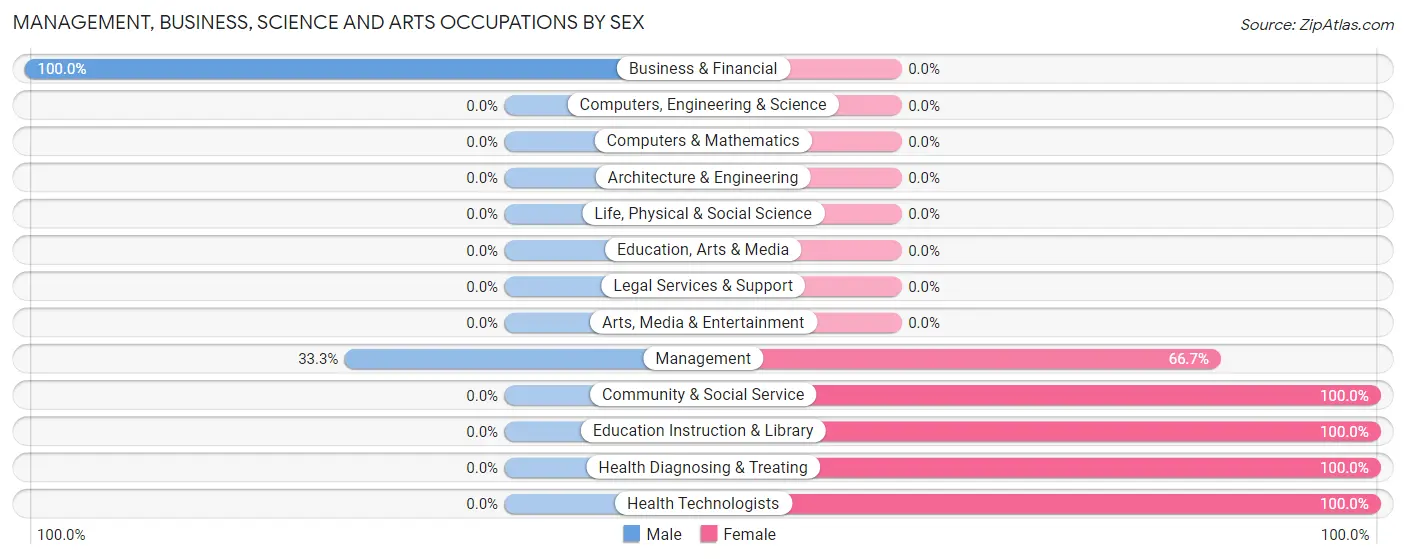
| Occupation | Male | Female |
| Management | 7 (33.3%) | 14 (66.7%) |
| Business & Financial | 4 (100.0%) | 0 (0.0%) |
| Computers, Engineering & Science | 0 (0.0%) | 0 (0.0%) |
| Computers & Mathematics | 0 (0.0%) | 0 (0.0%) |
| Architecture & Engineering | 0 (0.0%) | 0 (0.0%) |
| Life, Physical & Social Science | 0 (0.0%) | 0 (0.0%) |
| Community & Social Service | 0 (0.0%) | 6 (100.0%) |
| Education, Arts & Media | 0 (0.0%) | 0 (0.0%) |
| Legal Services & Support | 0 (0.0%) | 0 (0.0%) |
| Education Instruction & Library | 0 (0.0%) | 6 (100.0%) |
| Arts, Media & Entertainment | 0 (0.0%) | 0 (0.0%) |
| Health Diagnosing & Treating | 0 (0.0%) | 9 (100.0%) |
| Health Technologists | 0 (0.0%) | 9 (100.0%) |
| Total (Category) | 11 (27.5%) | 29 (72.5%) |
| Total (Overall) | 99 (60.7%) | 64 (39.3%) |
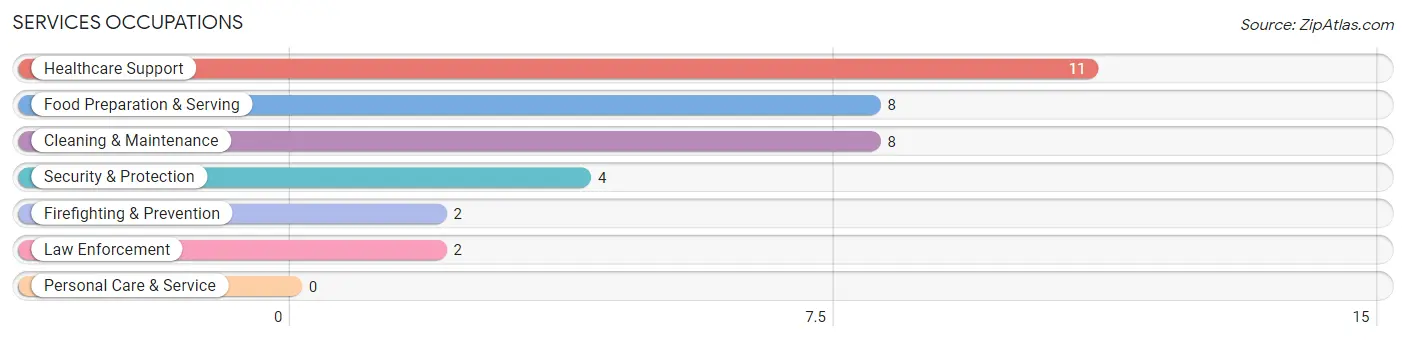
Services Occupations
The most common Services occupations in Joiner are Healthcare Support (11 | 6.8%), Food Preparation & Serving (8 | 4.9%), Cleaning & Maintenance (8 | 4.9%), Security & Protection (4 | 2.5%), and Firefighting & Prevention (2 | 1.2%).
Services Occupations by Sex
Within the Services occupations in Joiner, the most male-oriented occupations are Firefighting & Prevention (100.0%), Cleaning & Maintenance (100.0%), and Security & Protection (50.0%), while the most female-oriented occupations are Healthcare Support (100.0%), Law Enforcement (100.0%), and Food Preparation & Serving (100.0%).
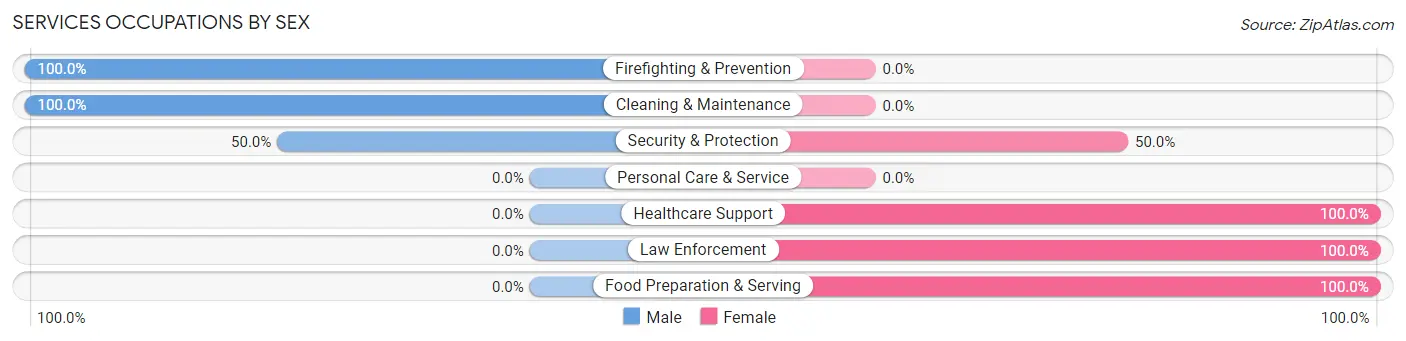
| Occupation | Male | Female |
| Healthcare Support | 0 (0.0%) | 11 (100.0%) |
| Security & Protection | 2 (50.0%) | 2 (50.0%) |
| Firefighting & Prevention | 2 (100.0%) | 0 (0.0%) |
| Law Enforcement | 0 (0.0%) | 2 (100.0%) |
| Food Preparation & Serving | 0 (0.0%) | 8 (100.0%) |
| Cleaning & Maintenance | 8 (100.0%) | 0 (0.0%) |
| Personal Care & Service | 0 (0.0%) | 0 (0.0%) |
| Total (Category) | 10 (32.3%) | 21 (67.7%) |
| Total (Overall) | 99 (60.7%) | 64 (39.3%) |
Sales and Office Occupations
The most common Sales and Office occupations in Joiner are , and Office & Administration (6 | 3.7%).
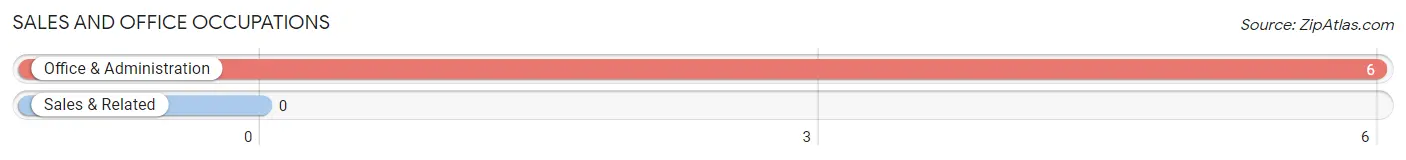
Sales and Office Occupations by Sex
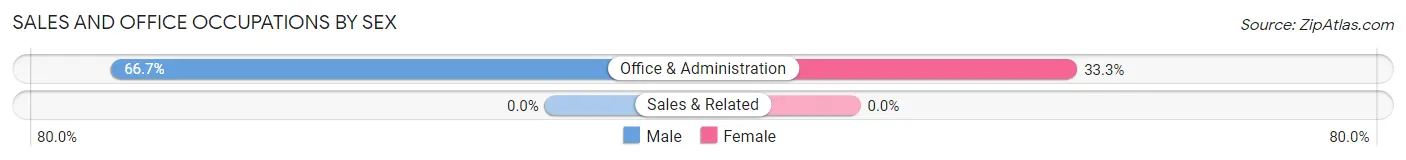
| Occupation | Male | Female |
| Sales & Related | 0 (0.0%) | 0 (0.0%) |
| Office & Administration | 4 (66.7%) | 2 (33.3%) |
| Total (Category) | 4 (66.7%) | 2 (33.3%) |
| Total (Overall) | 99 (60.7%) | 64 (39.3%) |
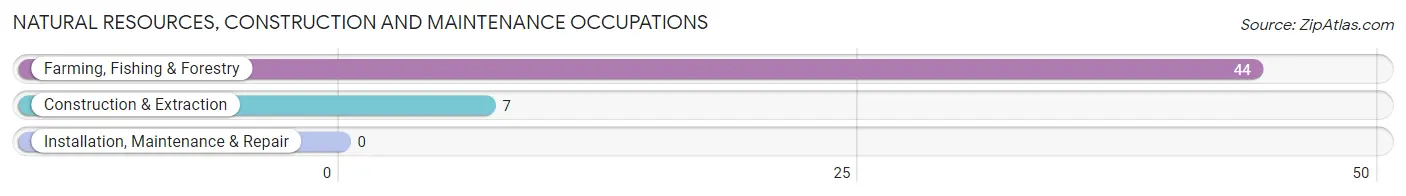
Natural Resources, Construction and Maintenance Occupations
The most common Natural Resources, Construction and Maintenance occupations in Joiner are Farming, Fishing & Forestry (44 | 27.0%), and Construction & Extraction (7 | 4.3%).
Natural Resources, Construction and Maintenance Occupations by Sex
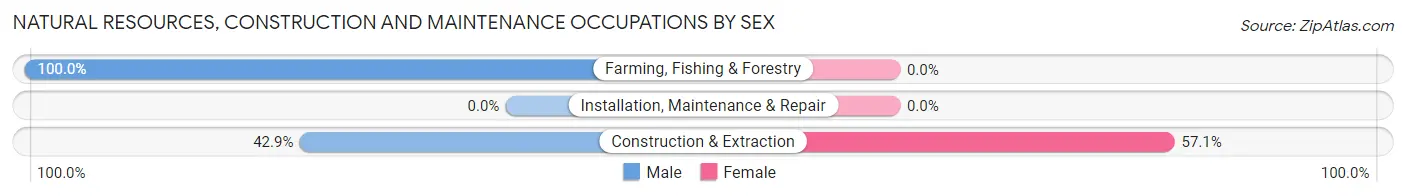
| Occupation | Male | Female |
| Farming, Fishing & Forestry | 44 (100.0%) | 0 (0.0%) |
| Construction & Extraction | 3 (42.9%) | 4 (57.1%) |
| Installation, Maintenance & Repair | 0 (0.0%) | 0 (0.0%) |
| Total (Category) | 47 (92.2%) | 4 (7.8%) |
| Total (Overall) | 99 (60.7%) | 64 (39.3%) |
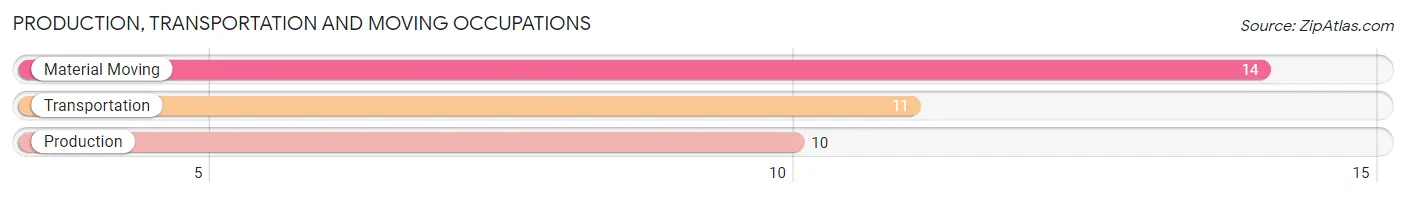
Production, Transportation and Moving Occupations
The most common Production, Transportation and Moving occupations in Joiner are Material Moving (14 | 8.6%), Transportation (11 | 6.8%), and Production (10 | 6.1%).
Production, Transportation and Moving Occupations by Sex
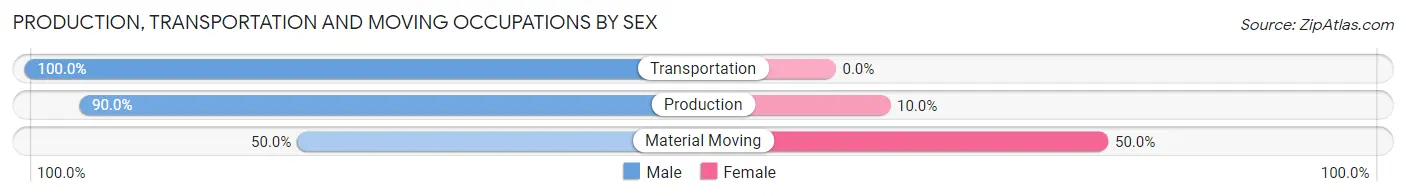
| Occupation | Male | Female |
| Production | 9 (90.0%) | 1 (10.0%) |
| Transportation | 11 (100.0%) | 0 (0.0%) |
| Material Moving | 7 (50.0%) | 7 (50.0%) |
| Total (Category) | 27 (77.1%) | 8 (22.9%) |
| Total (Overall) | 99 (60.7%) | 64 (39.3%) |
Employment Industries by Sex in Joiner
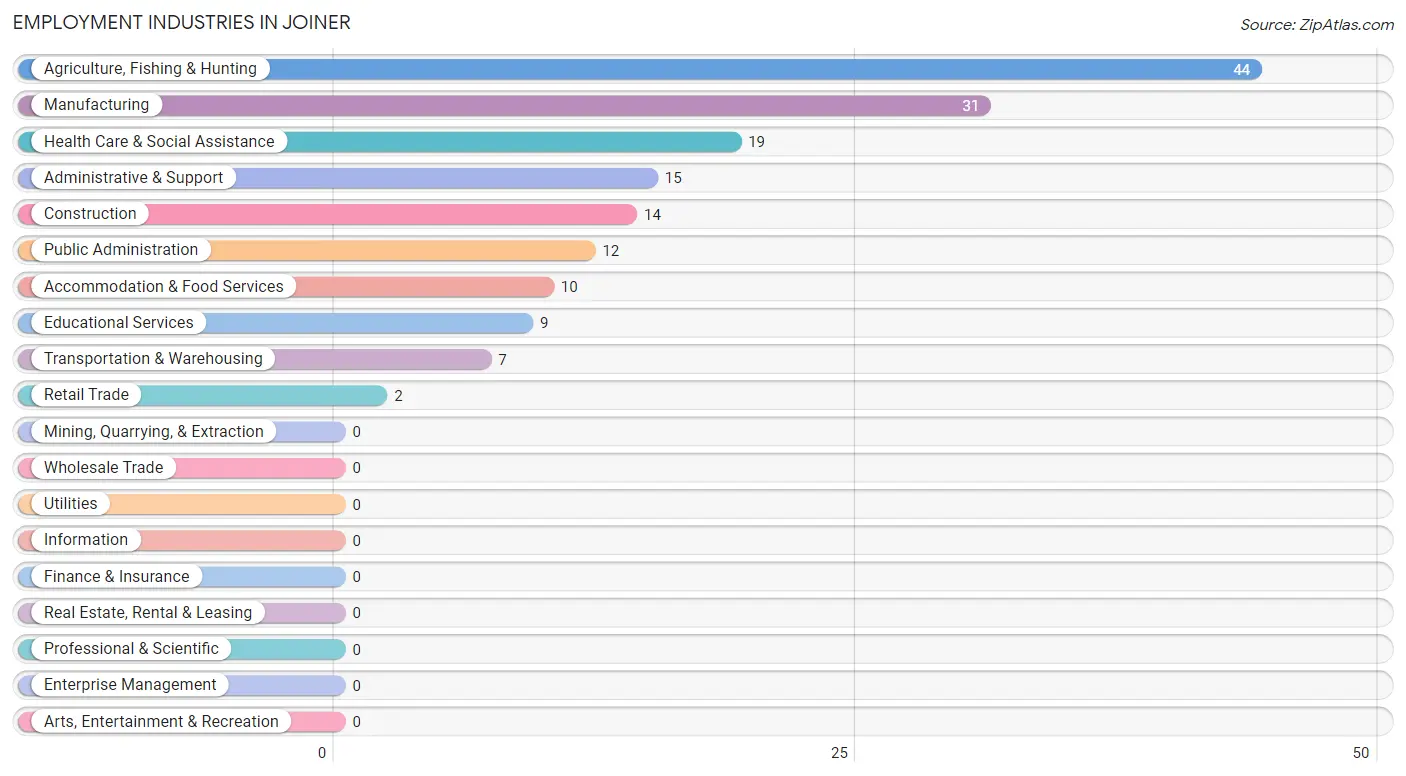
Employment Industries in Joiner
The major employment industries in Joiner include Agriculture, Fishing & Hunting (44 | 27.0%), Manufacturing (31 | 19.0%), Health Care & Social Assistance (19 | 11.7%), Administrative & Support (15 | 9.2%), and Construction (14 | 8.6%).
Employment Industries by Sex in Joiner
The Joiner industries that see more men than women are Agriculture, Fishing & Hunting (100.0%), Retail Trade (100.0%), and Administrative & Support (100.0%), whereas the industries that tend to have a higher number of women are Educational Services (100.0%), Public Administration (100.0%), and Accommodation & Food Services (80.0%).
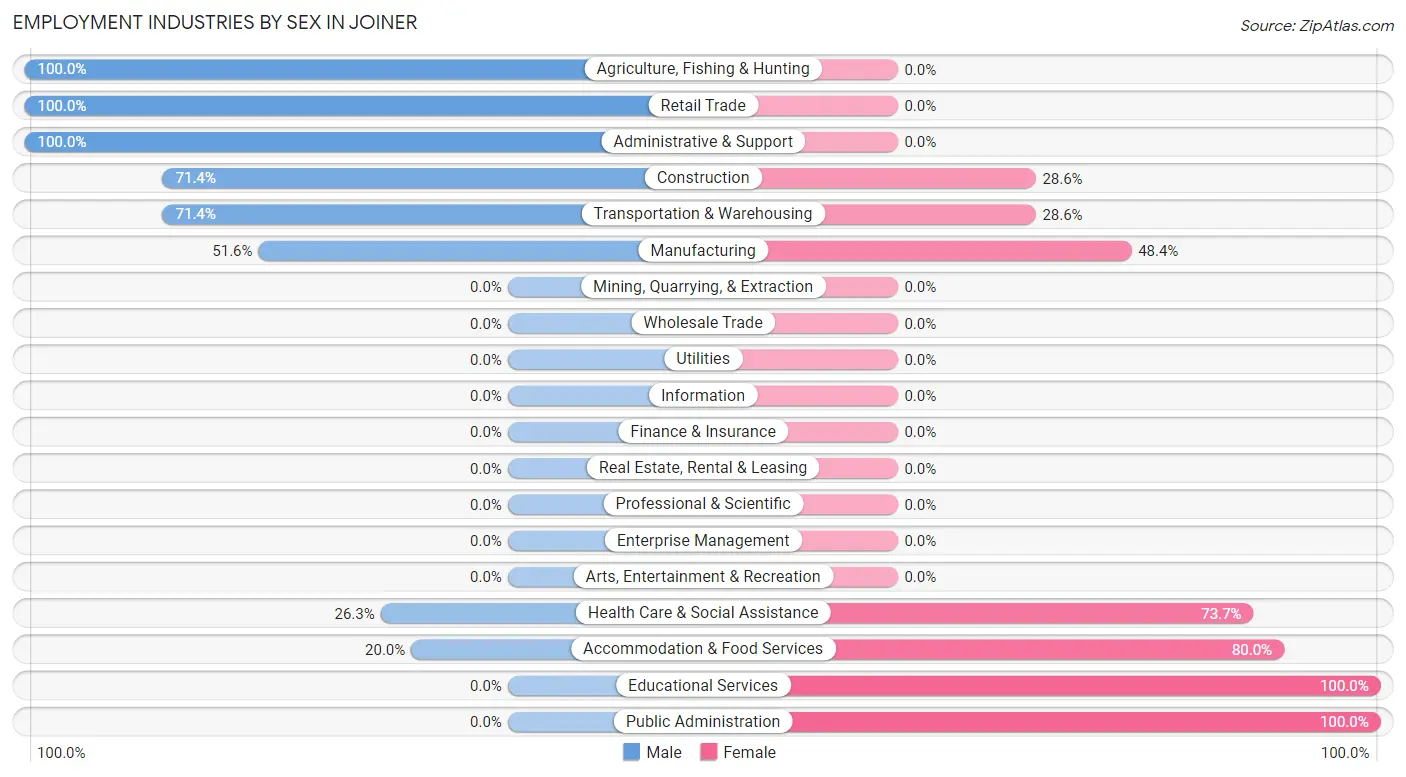
| Industry | Male | Female |
| Agriculture, Fishing & Hunting | 44 (100.0%) | 0 (0.0%) |
| Mining, Quarrying, & Extraction | 0 (0.0%) | 0 (0.0%) |
| Construction | 10 (71.4%) | 4 (28.6%) |
| Manufacturing | 16 (51.6%) | 15 (48.4%) |
| Wholesale Trade | 0 (0.0%) | 0 (0.0%) |
| Retail Trade | 2 (100.0%) | 0 (0.0%) |
| Transportation & Warehousing | 5 (71.4%) | 2 (28.6%) |
| Utilities | 0 (0.0%) | 0 (0.0%) |
| Information | 0 (0.0%) | 0 (0.0%) |
| Finance & Insurance | 0 (0.0%) | 0 (0.0%) |
| Real Estate, Rental & Leasing | 0 (0.0%) | 0 (0.0%) |
| Professional & Scientific | 0 (0.0%) | 0 (0.0%) |
| Enterprise Management | 0 (0.0%) | 0 (0.0%) |
| Administrative & Support | 15 (100.0%) | 0 (0.0%) |
| Educational Services | 0 (0.0%) | 9 (100.0%) |
| Health Care & Social Assistance | 5 (26.3%) | 14 (73.7%) |
| Arts, Entertainment & Recreation | 0 (0.0%) | 0 (0.0%) |
| Accommodation & Food Services | 2 (20.0%) | 8 (80.0%) |
| Public Administration | 0 (0.0%) | 12 (100.0%) |
| Total | 99 (60.7%) | 64 (39.3%) |
Education in Joiner
School Enrollment in Joiner
The most common levels of schooling among the 114 students in Joiner are high school (46 | 40.4%), middle school (24 | 21.0%), and elementary school (23 | 20.2%).
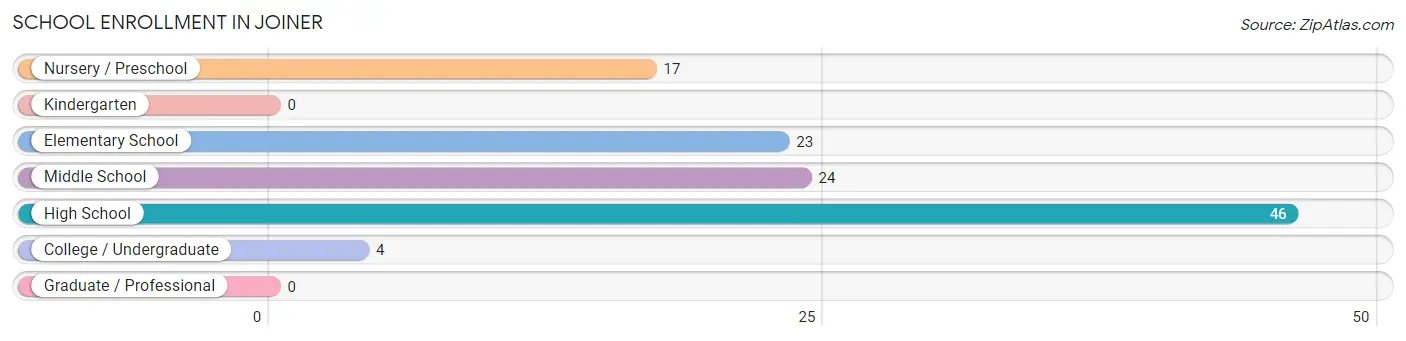
| School Level | # Students | % Students |
| Nursery / Preschool | 17 | 14.9% |
| Kindergarten | 0 | 0.0% |
| Elementary School | 23 | 20.2% |
| Middle School | 24 | 21.0% |
| High School | 46 | 40.4% |
| College / Undergraduate | 4 | 3.5% |
| Graduate / Professional | 0 | 0.0% |
| Total | 114 | 100.0% |
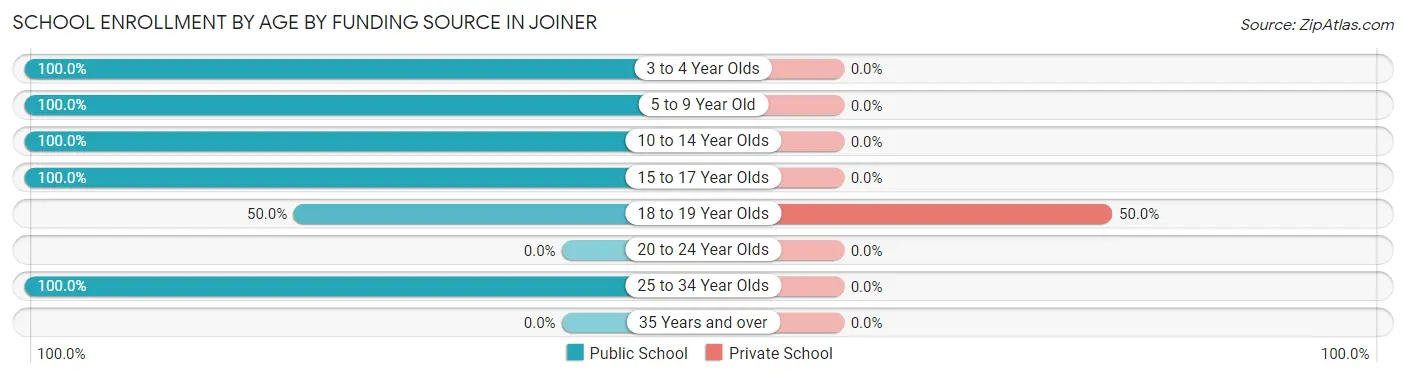
School Enrollment by Age by Funding Source in Joiner
Out of a total of 114 students who are enrolled in schools in Joiner, 2 (1.8%) attend a private institution, while the remaining 112 (98.2%) are enrolled in public schools. The age group of 18 to 19 year olds has the highest likelihood of being enrolled in private schools, with 2 (50.0% in the age bracket) enrolled. Conversely, the age group of 3 to 4 year olds has the lowest likelihood of being enrolled in a private school, with 9 (100.0% in the age bracket) attending a public institution.
| Age Bracket | Public School | Private School |
| 3 to 4 Year Olds | 9 (100.0%) | 0 (0.0%) |
| 5 to 9 Year Old | 22 (100.0%) | 0 (0.0%) |
| 10 to 14 Year Olds | 49 (100.0%) | 0 (0.0%) |
| 15 to 17 Year Olds | 26 (100.0%) | 0 (0.0%) |
| 18 to 19 Year Olds | 2 (50.0%) | 2 (50.0%) |
| 20 to 24 Year Olds | 0 (0.0%) | 0 (0.0%) |
| 25 to 34 Year Olds | 4 (100.0%) | 0 (0.0%) |
| 35 Years and over | 0 (0.0%) | 0 (0.0%) |
| Total | 112 (98.2%) | 2 (1.8%) |
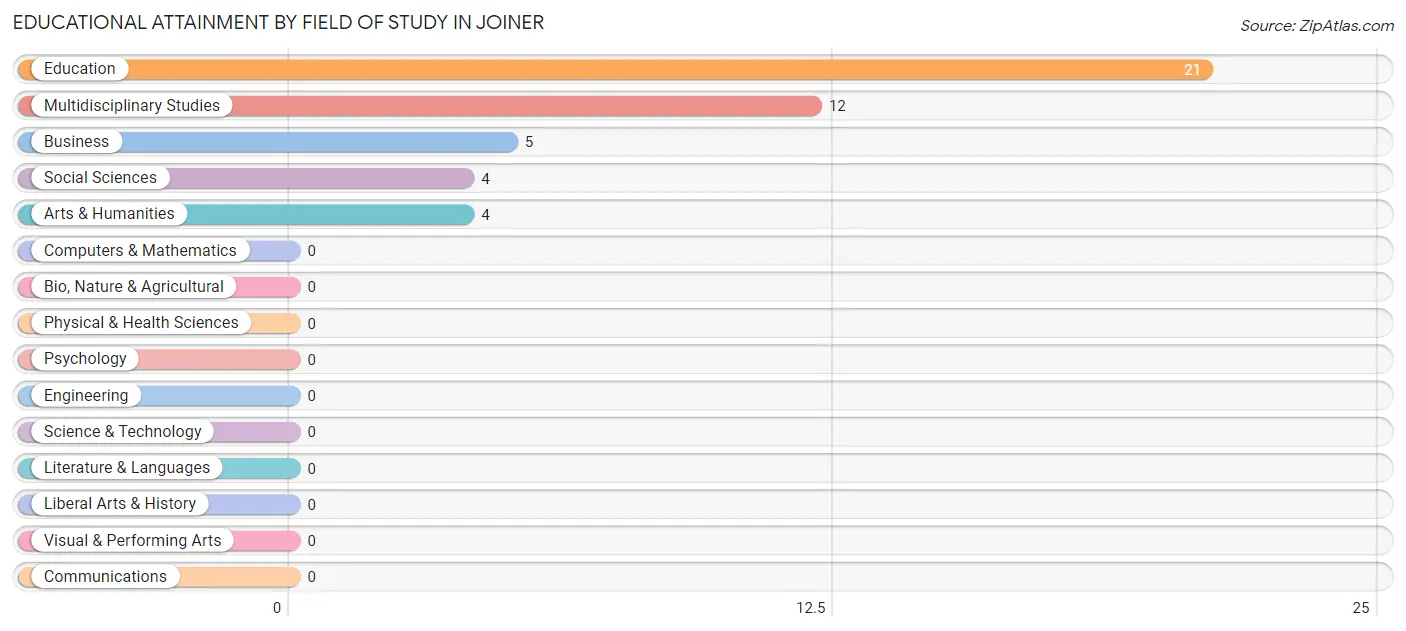
Educational Attainment by Field of Study in Joiner
Education (21 | 45.7%), multidisciplinary studies (12 | 26.1%), business (5 | 10.9%), social sciences (4 | 8.7%), and arts & humanities (4 | 8.7%) are the most common fields of study among 46 individuals in Joiner who have obtained a bachelor's degree or higher.
| Field of Study | # Graduates | % Graduates |
| Computers & Mathematics | 0 | 0.0% |
| Bio, Nature & Agricultural | 0 | 0.0% |
| Physical & Health Sciences | 0 | 0.0% |
| Psychology | 0 | 0.0% |
| Social Sciences | 4 | 8.7% |
| Engineering | 0 | 0.0% |
| Multidisciplinary Studies | 12 | 26.1% |
| Science & Technology | 0 | 0.0% |
| Business | 5 | 10.9% |
| Education | 21 | 45.7% |
| Literature & Languages | 0 | 0.0% |
| Liberal Arts & History | 0 | 0.0% |
| Visual & Performing Arts | 0 | 0.0% |
| Communications | 0 | 0.0% |
| Arts & Humanities | 4 | 8.7% |
| Total | 46 | 100.0% |
Transportation & Commute in Joiner
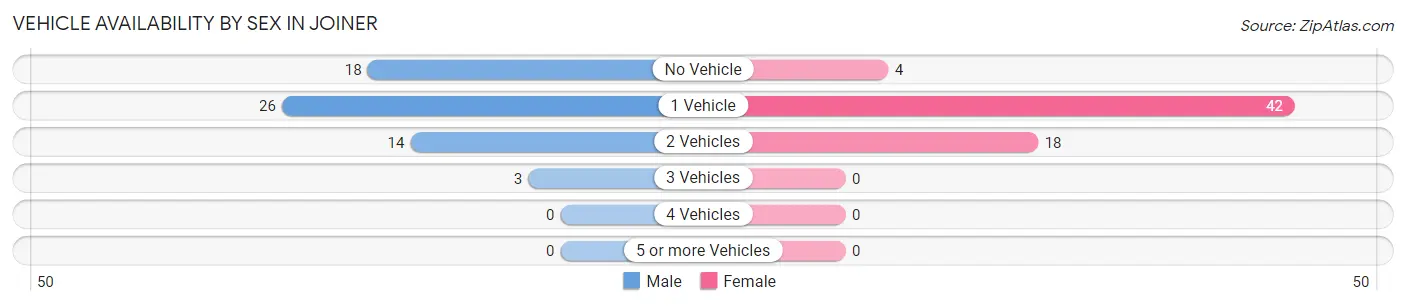
Vehicle Availability by Sex in Joiner
The most prevalent vehicle ownership categories in Joiner are males with 1 vehicle (26, accounting for 42.6%) and females with 1 vehicle (42, making up 40.6%).
| Vehicles Available | Male | Female |
| No Vehicle | 18 (29.5%) | 4 (6.2%) |
| 1 Vehicle | 26 (42.6%) | 42 (65.6%) |
| 2 Vehicles | 14 (23.0%) | 18 (28.1%) |
| 3 Vehicles | 3 (4.9%) | 0 (0.0%) |
| 4 Vehicles | 0 (0.0%) | 0 (0.0%) |
| 5 or more Vehicles | 0 (0.0%) | 0 (0.0%) |
| Total | 61 (100.0%) | 64 (100.0%) |
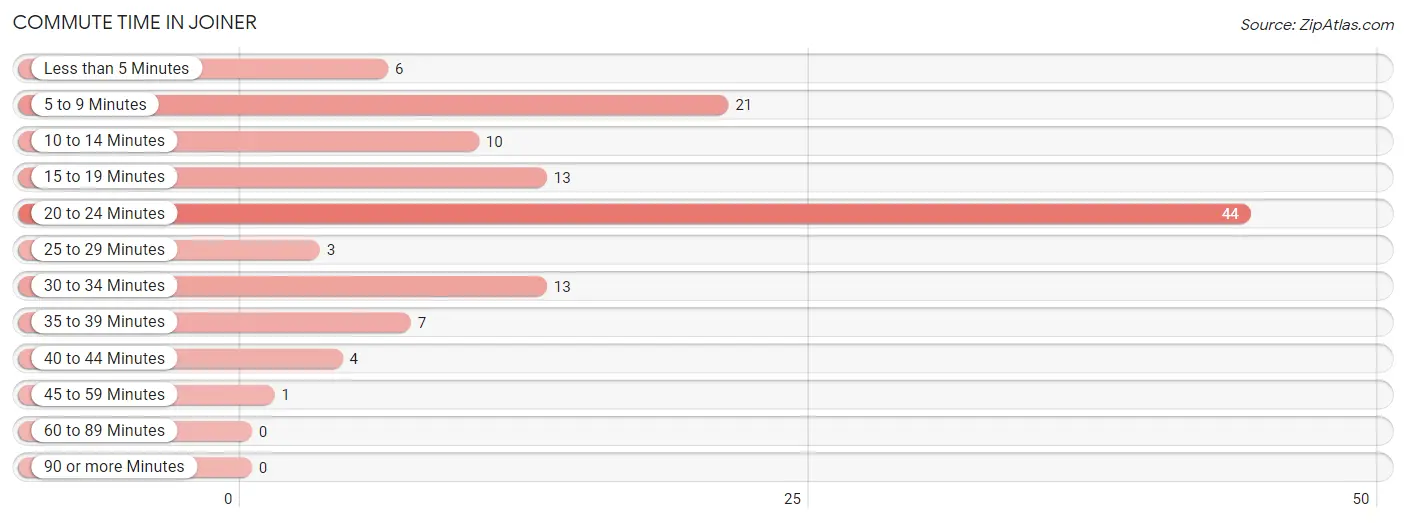
Commute Time in Joiner
The most frequently occuring commute durations in Joiner are 20 to 24 minutes (44 commuters, 36.1%), 5 to 9 minutes (21 commuters, 17.2%), and 15 to 19 minutes (13 commuters, 10.7%).
| Commute Time | # Commuters | % Commuters |
| Less than 5 Minutes | 6 | 4.9% |
| 5 to 9 Minutes | 21 | 17.2% |
| 10 to 14 Minutes | 10 | 8.2% |
| 15 to 19 Minutes | 13 | 10.7% |
| 20 to 24 Minutes | 44 | 36.1% |
| 25 to 29 Minutes | 3 | 2.5% |
| 30 to 34 Minutes | 13 | 10.7% |
| 35 to 39 Minutes | 7 | 5.7% |
| 40 to 44 Minutes | 4 | 3.3% |
| 45 to 59 Minutes | 1 | 0.8% |
| 60 to 89 Minutes | 0 | 0.0% |
| 90 or more Minutes | 0 | 0.0% |
Commute Time by Sex in Joiner
The most common commute times in Joiner are 5 to 9 minutes (14 commuters, 24.1%) for males and 20 to 24 minutes (34 commuters, 53.1%) for females.
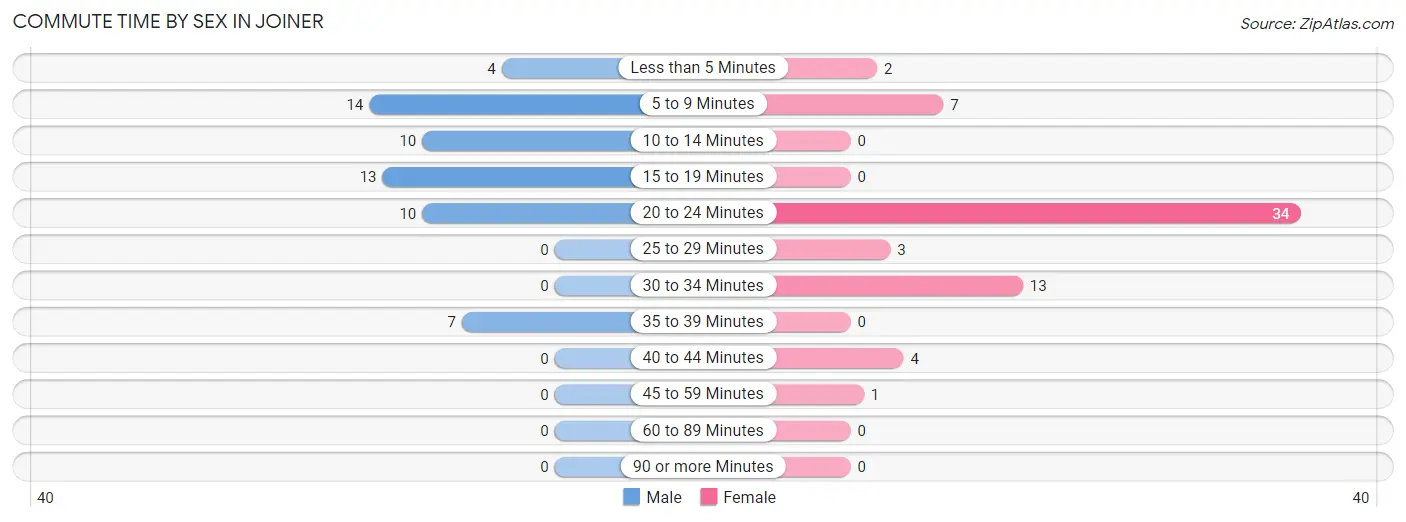
| Commute Time | Male | Female |
| Less than 5 Minutes | 4 (6.9%) | 2 (3.1%) |
| 5 to 9 Minutes | 14 (24.1%) | 7 (10.9%) |
| 10 to 14 Minutes | 10 (17.2%) | 0 (0.0%) |
| 15 to 19 Minutes | 13 (22.4%) | 0 (0.0%) |
| 20 to 24 Minutes | 10 (17.2%) | 34 (53.1%) |
| 25 to 29 Minutes | 0 (0.0%) | 3 (4.7%) |
| 30 to 34 Minutes | 0 (0.0%) | 13 (20.3%) |
| 35 to 39 Minutes | 7 (12.1%) | 0 (0.0%) |
| 40 to 44 Minutes | 0 (0.0%) | 4 (6.2%) |
| 45 to 59 Minutes | 0 (0.0%) | 1 (1.6%) |
| 60 to 89 Minutes | 0 (0.0%) | 0 (0.0%) |
| 90 or more Minutes | 0 (0.0%) | 0 (0.0%) |
Time of Departure to Work by Sex in Joiner
The most frequent times of departure to work in Joiner are 6:00 AM to 6:29 AM (16, 27.6%) for males and 6:00 AM to 6:29 AM (20, 31.2%) for females.
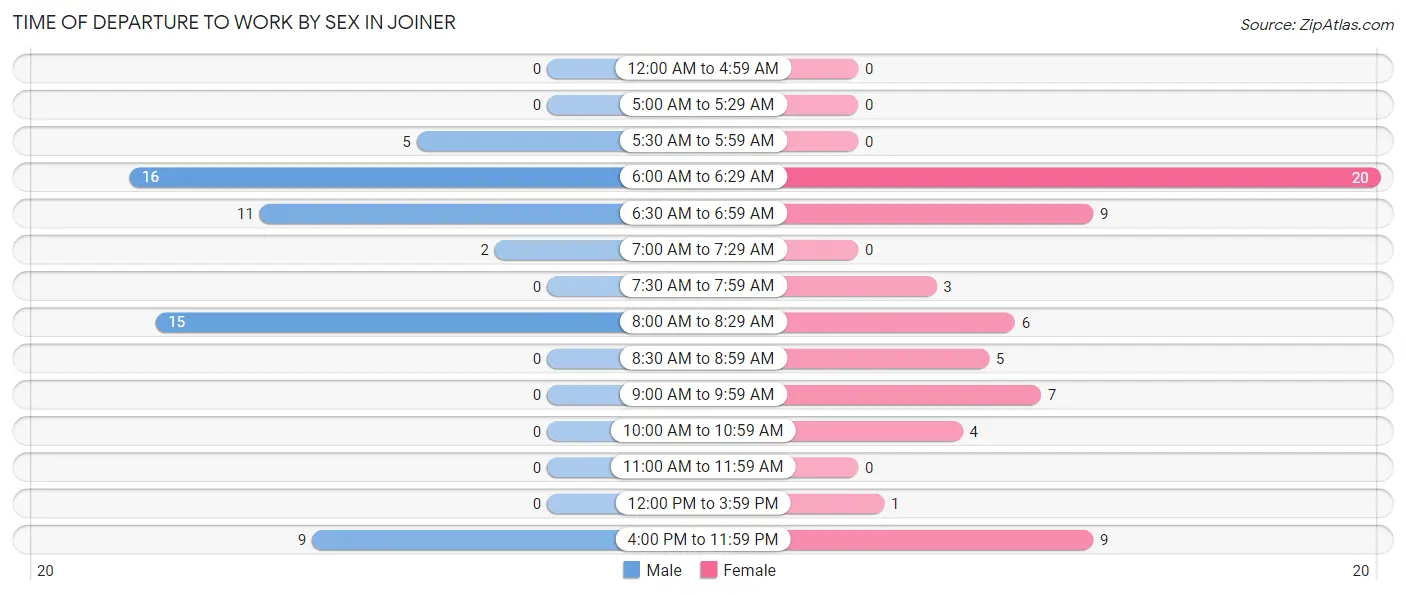
| Time of Departure | Male | Female |
| 12:00 AM to 4:59 AM | 0 (0.0%) | 0 (0.0%) |
| 5:00 AM to 5:29 AM | 0 (0.0%) | 0 (0.0%) |
| 5:30 AM to 5:59 AM | 5 (8.6%) | 0 (0.0%) |
| 6:00 AM to 6:29 AM | 16 (27.6%) | 20 (31.2%) |
| 6:30 AM to 6:59 AM | 11 (19.0%) | 9 (14.1%) |
| 7:00 AM to 7:29 AM | 2 (3.5%) | 0 (0.0%) |
| 7:30 AM to 7:59 AM | 0 (0.0%) | 3 (4.7%) |
| 8:00 AM to 8:29 AM | 15 (25.9%) | 6 (9.4%) |
| 8:30 AM to 8:59 AM | 0 (0.0%) | 5 (7.8%) |
| 9:00 AM to 9:59 AM | 0 (0.0%) | 7 (10.9%) |
| 10:00 AM to 10:59 AM | 0 (0.0%) | 4 (6.2%) |
| 11:00 AM to 11:59 AM | 0 (0.0%) | 0 (0.0%) |
| 12:00 PM to 3:59 PM | 0 (0.0%) | 1 (1.6%) |
| 4:00 PM to 11:59 PM | 9 (15.5%) | 9 (14.1%) |
| Total | 58 (100.0%) | 64 (100.0%) |
Housing Occupancy in Joiner
Occupancy by Ownership in Joiner
Of the total 183 dwellings in Joiner, owner-occupied units account for 97 (53.0%), while renter-occupied units make up 86 (47.0%).
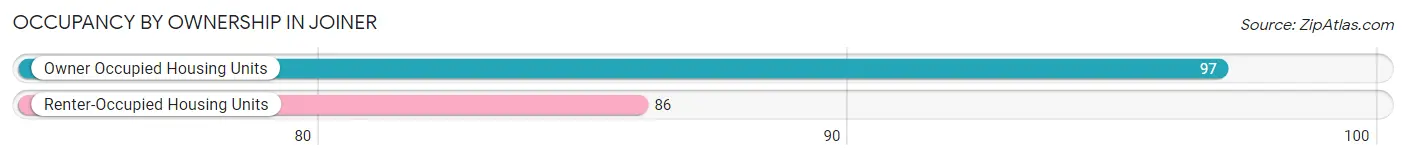
| Occupancy | # Housing Units | % Housing Units |
| Owner Occupied Housing Units | 97 | 53.0% |
| Renter-Occupied Housing Units | 86 | 47.0% |
| Total Occupied Housing Units | 183 | 100.0% |
Occupancy by Household Size in Joiner
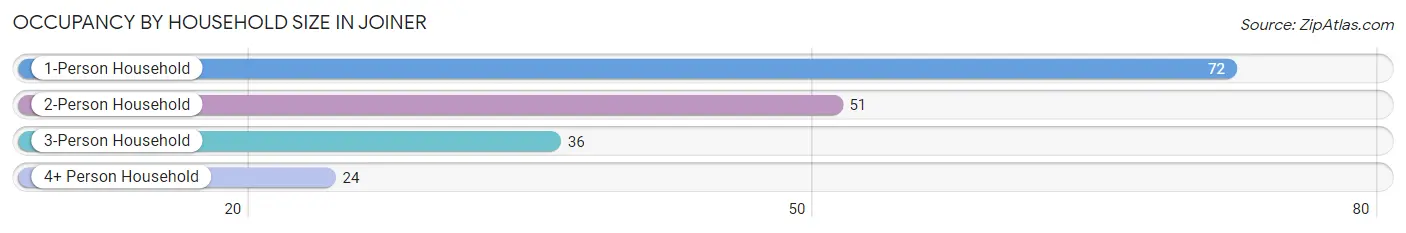
| Household Size | # Housing Units | % Housing Units |
| 1-Person Household | 72 | 39.3% |
| 2-Person Household | 51 | 27.9% |
| 3-Person Household | 36 | 19.7% |
| 4+ Person Household | 24 | 13.1% |
| Total Housing Units | 183 | 100.0% |
Occupancy by Ownership by Household Size in Joiner
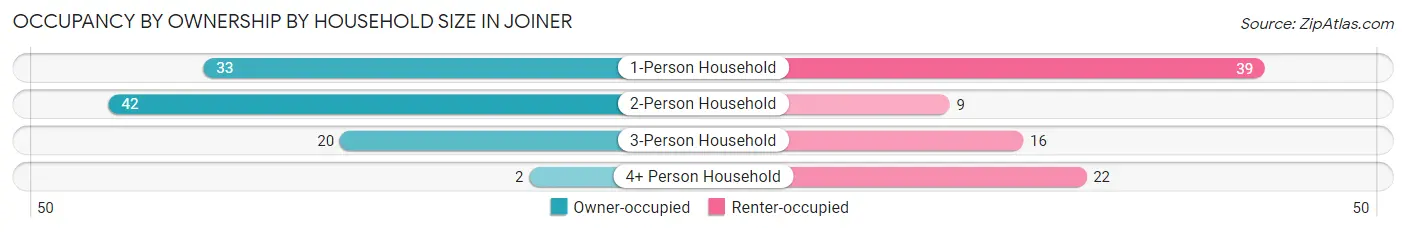
| Household Size | Owner-occupied | Renter-occupied |
| 1-Person Household | 33 (45.8%) | 39 (54.2%) |
| 2-Person Household | 42 (82.4%) | 9 (17.6%) |
| 3-Person Household | 20 (55.6%) | 16 (44.4%) |
| 4+ Person Household | 2 (8.3%) | 22 (91.7%) |
| Total Housing Units | 97 (53.0%) | 86 (47.0%) |
Occupancy by Educational Attainment in Joiner
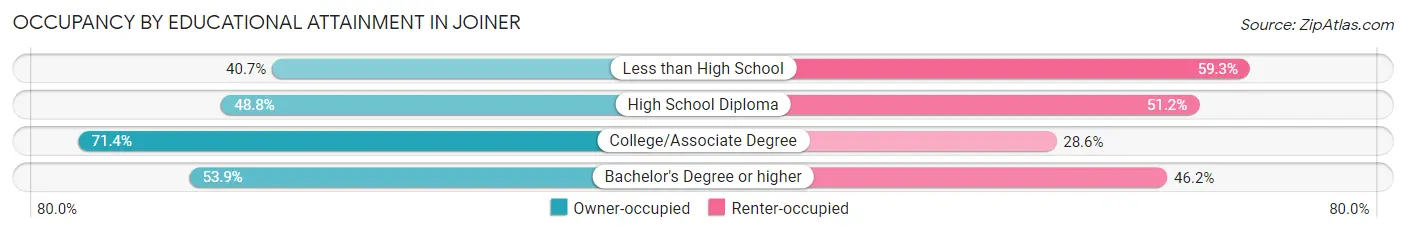
| Household Size | Owner-occupied | Renter-occupied |
| Less than High School | 11 (40.7%) | 16 (59.3%) |
| High School Diploma | 40 (48.8%) | 42 (51.2%) |
| College/Associate Degree | 25 (71.4%) | 10 (28.6%) |
| Bachelor's Degree or higher | 21 (53.8%) | 18 (46.2%) |
Occupancy by Age of Householder in Joiner
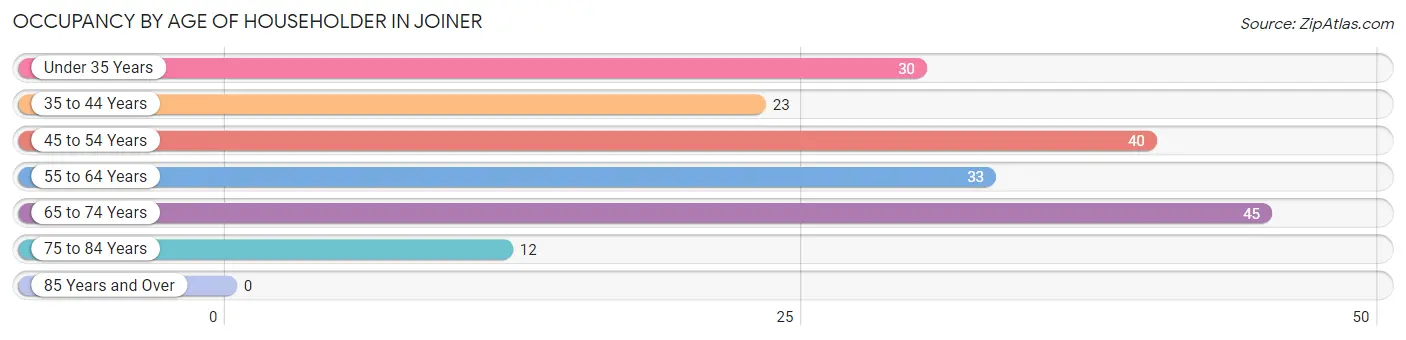
| Age Bracket | # Households | % Households |
| Under 35 Years | 30 | 16.4% |
| 35 to 44 Years | 23 | 12.6% |
| 45 to 54 Years | 40 | 21.9% |
| 55 to 64 Years | 33 | 18.0% |
| 65 to 74 Years | 45 | 24.6% |
| 75 to 84 Years | 12 | 6.6% |
| 85 Years and Over | 0 | 0.0% |
| Total | 183 | 100.0% |
Housing Finances in Joiner
Median Income by Occupancy in Joiner
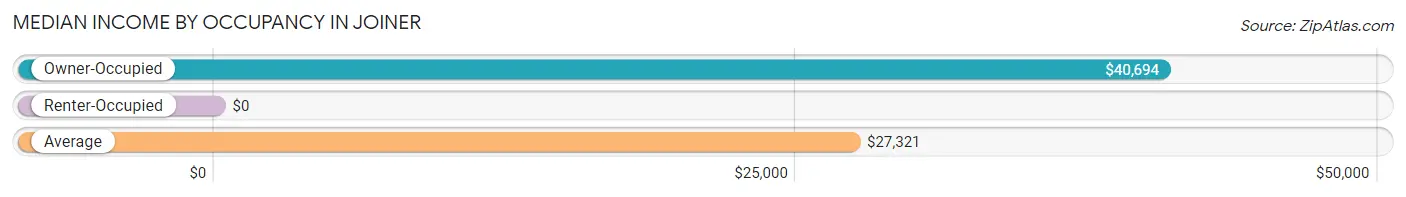
| Occupancy Type | # Households | Median Income |
| Owner-Occupied | 97 (53.0%) | $40,694 |
| Renter-Occupied | 86 (47.0%) | $0 |
| Average | 183 (100.0%) | $27,321 |
Occupancy by Householder Income Bracket in Joiner
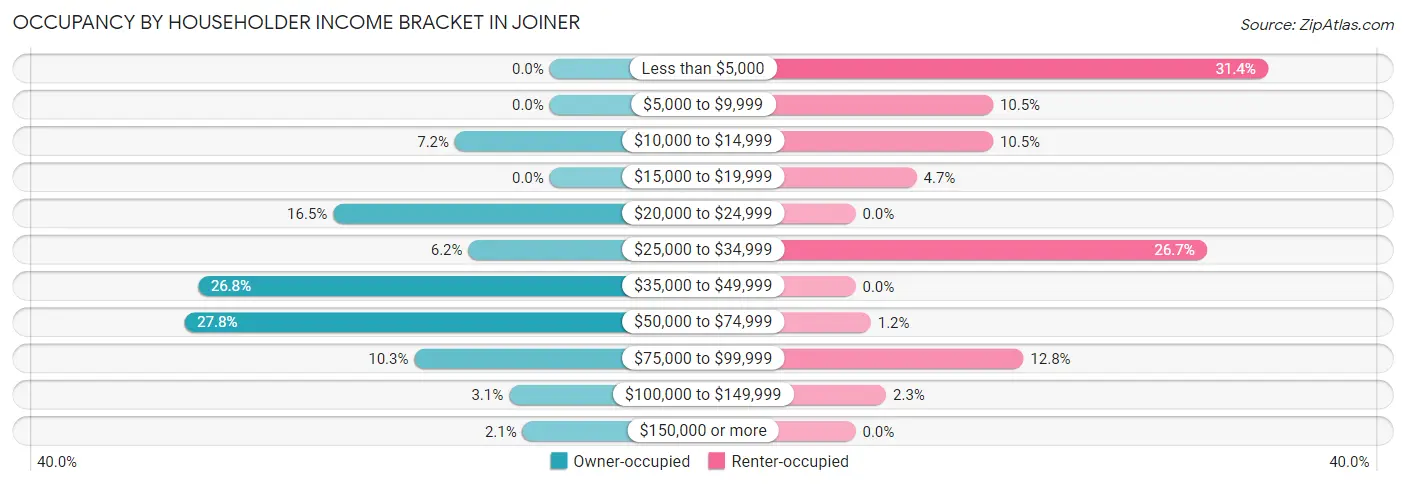
| Income Bracket | Owner-occupied | Renter-occupied |
| Less than $5,000 | 0 (0.0%) | 27 (31.4%) |
| $5,000 to $9,999 | 0 (0.0%) | 9 (10.5%) |
| $10,000 to $14,999 | 7 (7.2%) | 9 (10.5%) |
| $15,000 to $19,999 | 0 (0.0%) | 4 (4.6%) |
| $20,000 to $24,999 | 16 (16.5%) | 0 (0.0%) |
| $25,000 to $34,999 | 6 (6.2%) | 23 (26.7%) |
| $35,000 to $49,999 | 26 (26.8%) | 0 (0.0%) |
| $50,000 to $74,999 | 27 (27.8%) | 1 (1.2%) |
| $75,000 to $99,999 | 10 (10.3%) | 11 (12.8%) |
| $100,000 to $149,999 | 3 (3.1%) | 2 (2.3%) |
| $150,000 or more | 2 (2.1%) | 0 (0.0%) |
| Total | 97 (100.0%) | 86 (100.0%) |
Monthly Housing Cost Tiers in Joiner
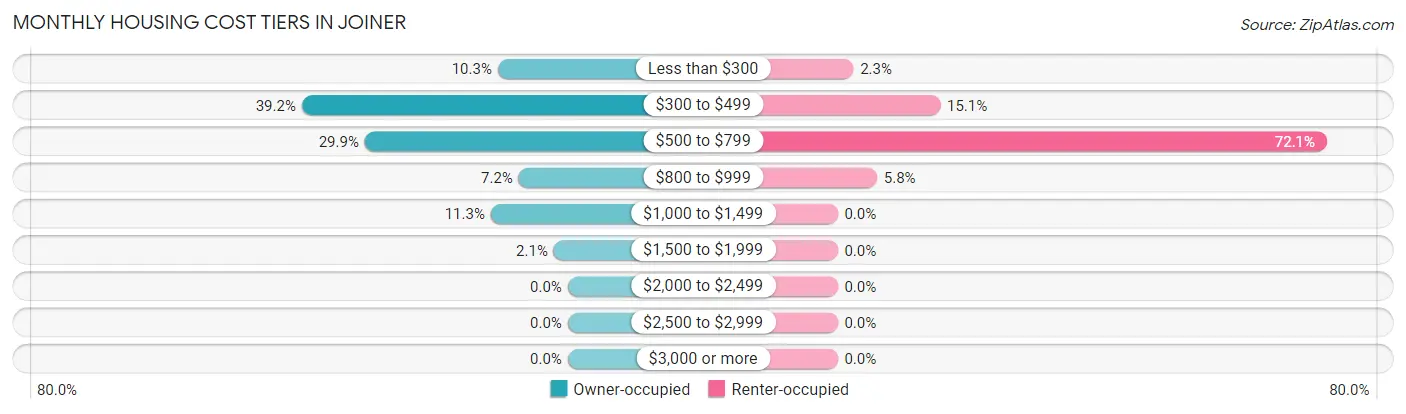
| Monthly Cost | Owner-occupied | Renter-occupied |
| Less than $300 | 10 (10.3%) | 2 (2.3%) |
| $300 to $499 | 38 (39.2%) | 13 (15.1%) |
| $500 to $799 | 29 (29.9%) | 62 (72.1%) |
| $800 to $999 | 7 (7.2%) | 5 (5.8%) |
| $1,000 to $1,499 | 11 (11.3%) | 0 (0.0%) |
| $1,500 to $1,999 | 2 (2.1%) | 0 (0.0%) |
| $2,000 to $2,499 | 0 (0.0%) | 0 (0.0%) |
| $2,500 to $2,999 | 0 (0.0%) | 0 (0.0%) |
| $3,000 or more | 0 (0.0%) | 0 (0.0%) |
| Total | 97 (100.0%) | 86 (100.0%) |
Physical Housing Characteristics in Joiner
Housing Structures in Joiner
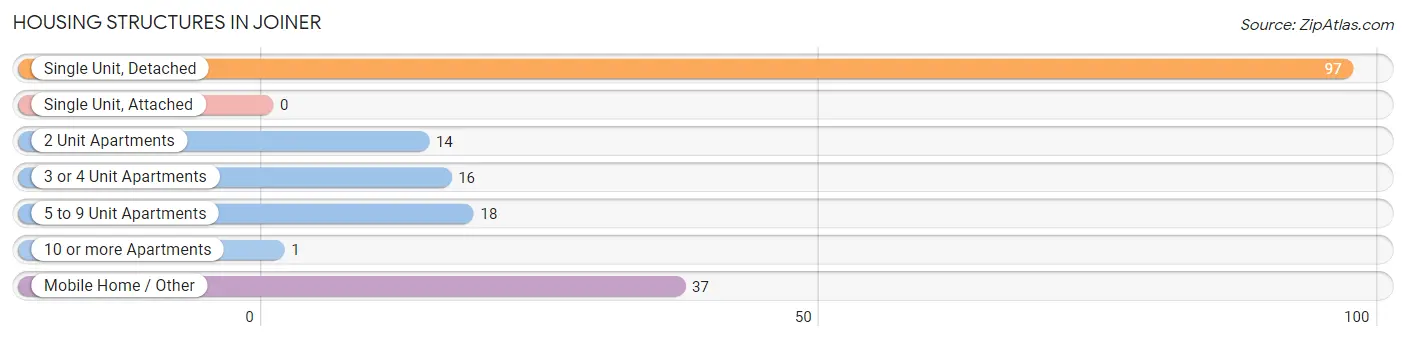
| Structure Type | # Housing Units | % Housing Units |
| Single Unit, Detached | 97 | 53.0% |
| Single Unit, Attached | 0 | 0.0% |
| 2 Unit Apartments | 14 | 7.6% |
| 3 or 4 Unit Apartments | 16 | 8.7% |
| 5 to 9 Unit Apartments | 18 | 9.8% |
| 10 or more Apartments | 1 | 0.5% |
| Mobile Home / Other | 37 | 20.2% |
| Total | 183 | 100.0% |
Housing Structures by Occupancy in Joiner
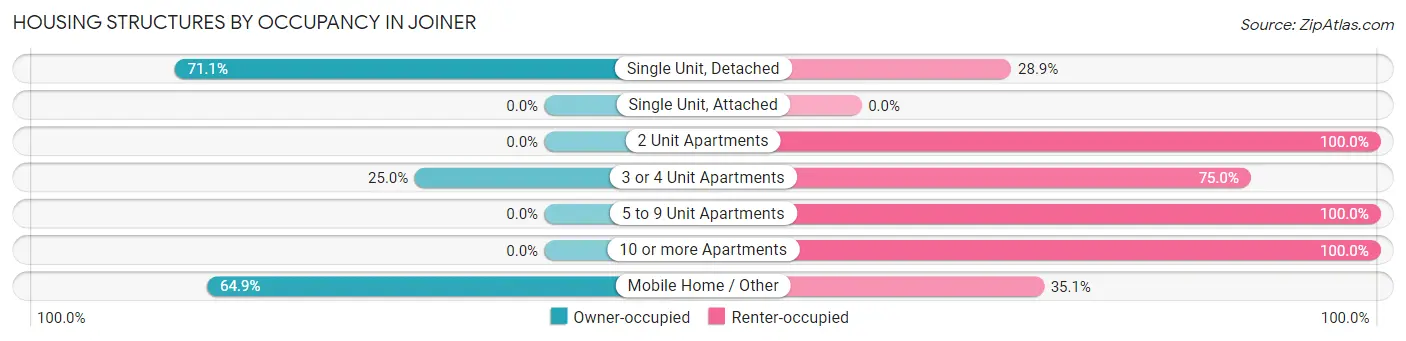
| Structure Type | Owner-occupied | Renter-occupied |
| Single Unit, Detached | 69 (71.1%) | 28 (28.9%) |
| Single Unit, Attached | 0 (0.0%) | 0 (0.0%) |
| 2 Unit Apartments | 0 (0.0%) | 14 (100.0%) |
| 3 or 4 Unit Apartments | 4 (25.0%) | 12 (75.0%) |
| 5 to 9 Unit Apartments | 0 (0.0%) | 18 (100.0%) |
| 10 or more Apartments | 0 (0.0%) | 1 (100.0%) |
| Mobile Home / Other | 24 (64.9%) | 13 (35.1%) |
| Total | 97 (53.0%) | 86 (47.0%) |
Housing Structures by Number of Rooms in Joiner
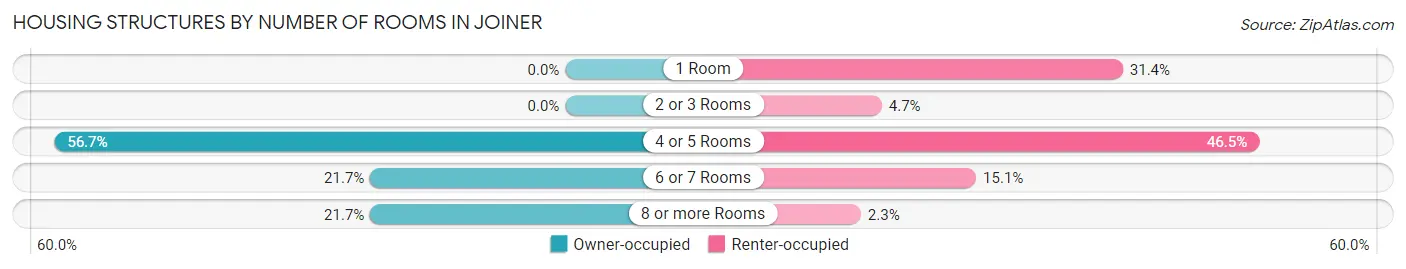
| Number of Rooms | Owner-occupied | Renter-occupied |
| 1 Room | 0 (0.0%) | 27 (31.4%) |
| 2 or 3 Rooms | 0 (0.0%) | 4 (4.6%) |
| 4 or 5 Rooms | 55 (56.7%) | 40 (46.5%) |
| 6 or 7 Rooms | 21 (21.6%) | 13 (15.1%) |
| 8 or more Rooms | 21 (21.6%) | 2 (2.3%) |
| Total | 97 (100.0%) | 86 (100.0%) |
Housing Structure by Heating Type in Joiner
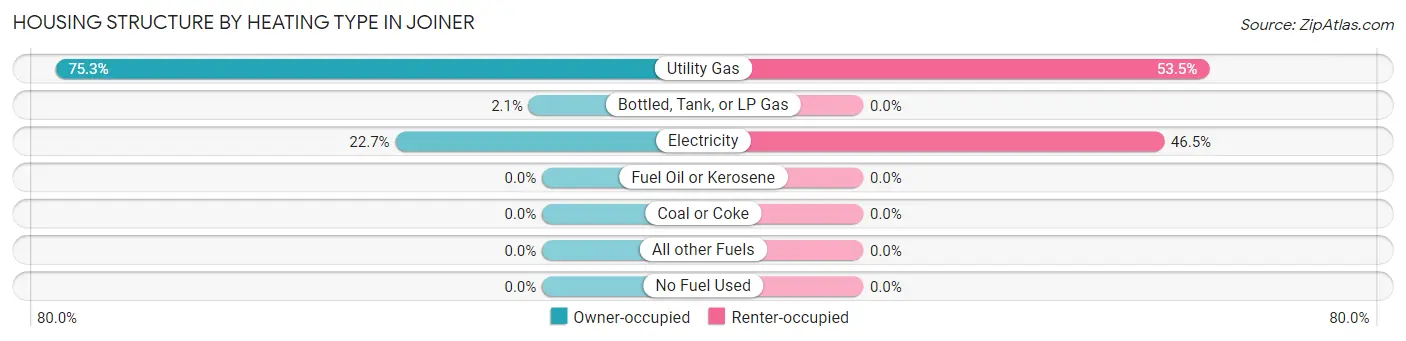
| Heating Type | Owner-occupied | Renter-occupied |
| Utility Gas | 73 (75.3%) | 46 (53.5%) |
| Bottled, Tank, or LP Gas | 2 (2.1%) | 0 (0.0%) |
| Electricity | 22 (22.7%) | 40 (46.5%) |
| Fuel Oil or Kerosene | 0 (0.0%) | 0 (0.0%) |
| Coal or Coke | 0 (0.0%) | 0 (0.0%) |
| All other Fuels | 0 (0.0%) | 0 (0.0%) |
| No Fuel Used | 0 (0.0%) | 0 (0.0%) |
| Total | 97 (100.0%) | 86 (100.0%) |
Household Vehicle Usage in Joiner
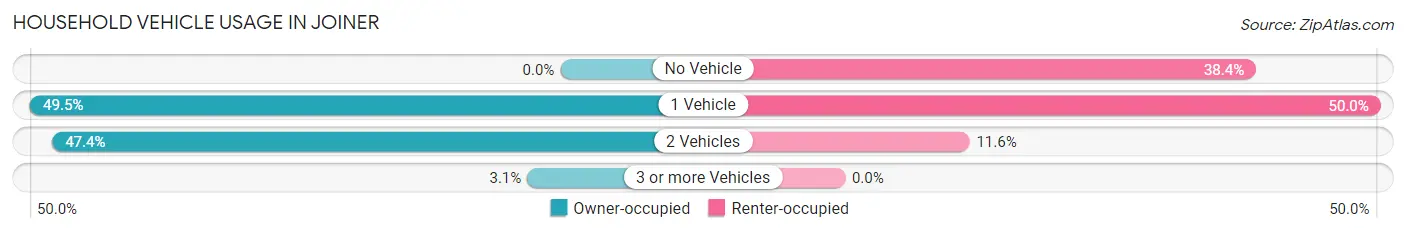
| Vehicles per Household | Owner-occupied | Renter-occupied |
| No Vehicle | 0 (0.0%) | 33 (38.4%) |
| 1 Vehicle | 48 (49.5%) | 43 (50.0%) |
| 2 Vehicles | 46 (47.4%) | 10 (11.6%) |
| 3 or more Vehicles | 3 (3.1%) | 0 (0.0%) |
| Total | 97 (100.0%) | 86 (100.0%) |
Real Estate & Mortgages in Joiner
Real Estate and Mortgage Overview in Joiner
| Characteristic | Without Mortgage | With Mortgage |
| Housing Units | 45 | 52 |
| Median Property Value | $50,400 | $45,000 |
| Median Household Income | $35,179 | $0 |
| Monthly Housing Costs | $375 | $0 |
| Real Estate Taxes | $199 | $0 |
Property Value by Mortgage Status in Joiner
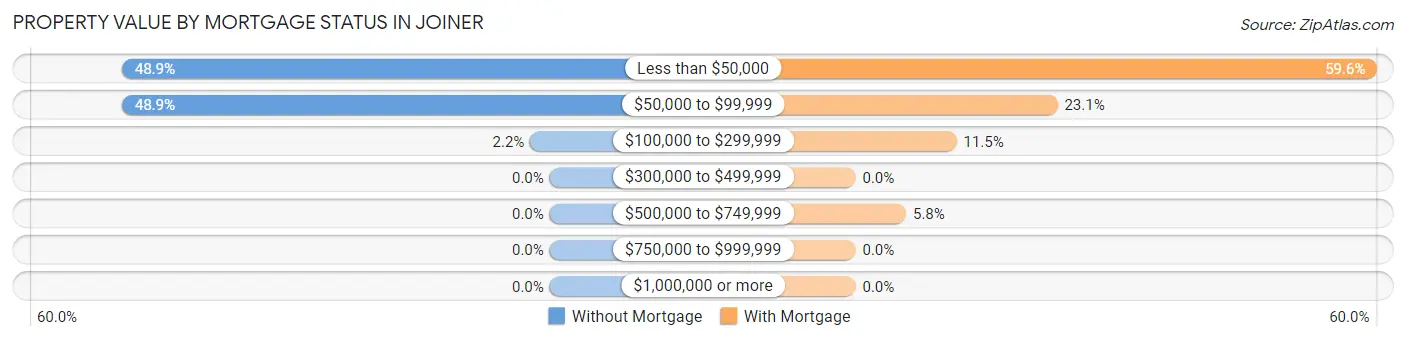
| Property Value | Without Mortgage | With Mortgage |
| Less than $50,000 | 22 (48.9%) | 31 (59.6%) |
| $50,000 to $99,999 | 22 (48.9%) | 12 (23.1%) |
| $100,000 to $299,999 | 1 (2.2%) | 6 (11.5%) |
| $300,000 to $499,999 | 0 (0.0%) | 0 (0.0%) |
| $500,000 to $749,999 | 0 (0.0%) | 3 (5.8%) |
| $750,000 to $999,999 | 0 (0.0%) | 0 (0.0%) |
| $1,000,000 or more | 0 (0.0%) | 0 (0.0%) |
| Total | 45 (100.0%) | 52 (100.0%) |
Household Income by Mortgage Status in Joiner
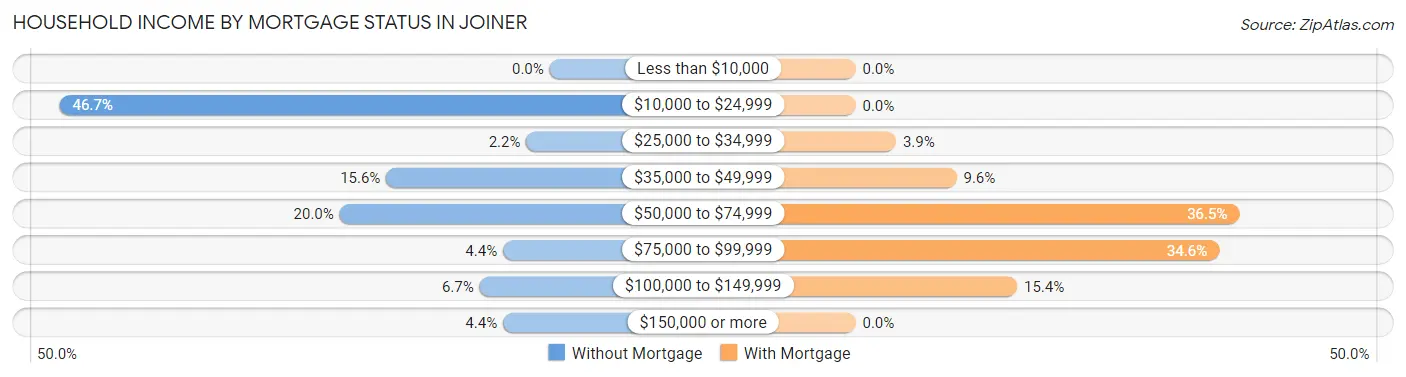
| Household Income | Without Mortgage | With Mortgage |
| Less than $10,000 | 0 (0.0%) | 0 (0.0%) |
| $10,000 to $24,999 | 21 (46.7%) | 0 (0.0%) |
| $25,000 to $34,999 | 1 (2.2%) | 2 (3.8%) |
| $35,000 to $49,999 | 7 (15.6%) | 5 (9.6%) |
| $50,000 to $74,999 | 9 (20.0%) | 19 (36.5%) |
| $75,000 to $99,999 | 2 (4.4%) | 18 (34.6%) |
| $100,000 to $149,999 | 3 (6.7%) | 8 (15.4%) |
| $150,000 or more | 2 (4.4%) | 0 (0.0%) |
| Total | 45 (100.0%) | 52 (100.0%) |
Property Value to Household Income Ratio in Joiner
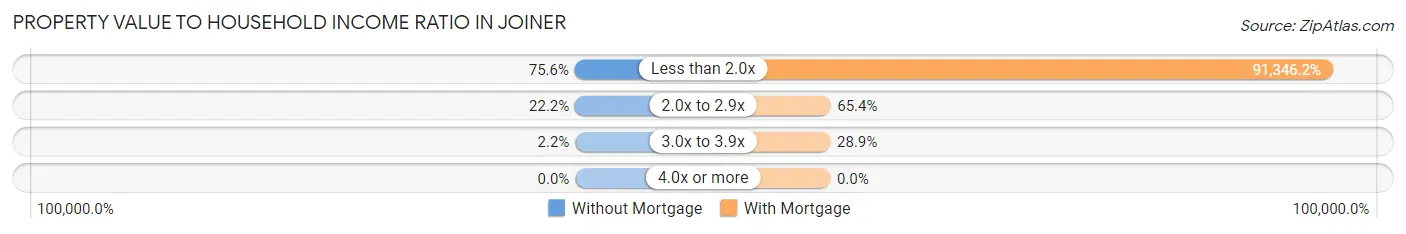
| Value-to-Income Ratio | Without Mortgage | With Mortgage |
| Less than 2.0x | 34 (75.6%) | 47,500 (91,346.2%) |
| 2.0x to 2.9x | 10 (22.2%) | 34 (65.4%) |
| 3.0x to 3.9x | 1 (2.2%) | 15 (28.8%) |
| 4.0x or more | 0 (0.0%) | 0 (0.0%) |
| Total | 45 (100.0%) | 52 (100.0%) |
Real Estate Taxes by Mortgage Status in Joiner
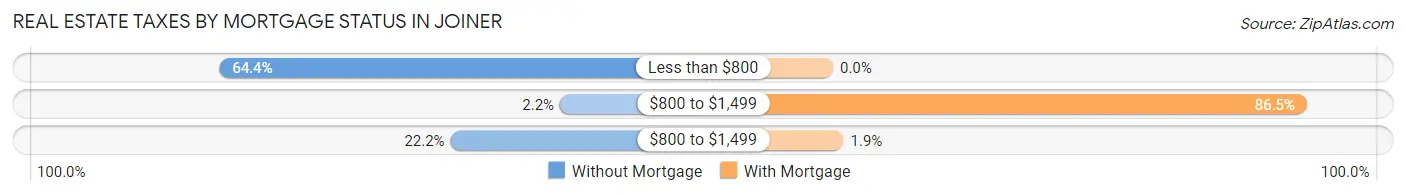
| Property Taxes | Without Mortgage | With Mortgage |
| Less than $800 | 29 (64.4%) | 0 (0.0%) |
| $800 to $1,499 | 1 (2.2%) | 45 (86.5%) |
| $800 to $1,499 | 10 (22.2%) | 1 (1.9%) |
| Total | 45 (100.0%) | 52 (100.0%) |
Health & Disability in Joiner
Health Insurance Coverage by Age in Joiner
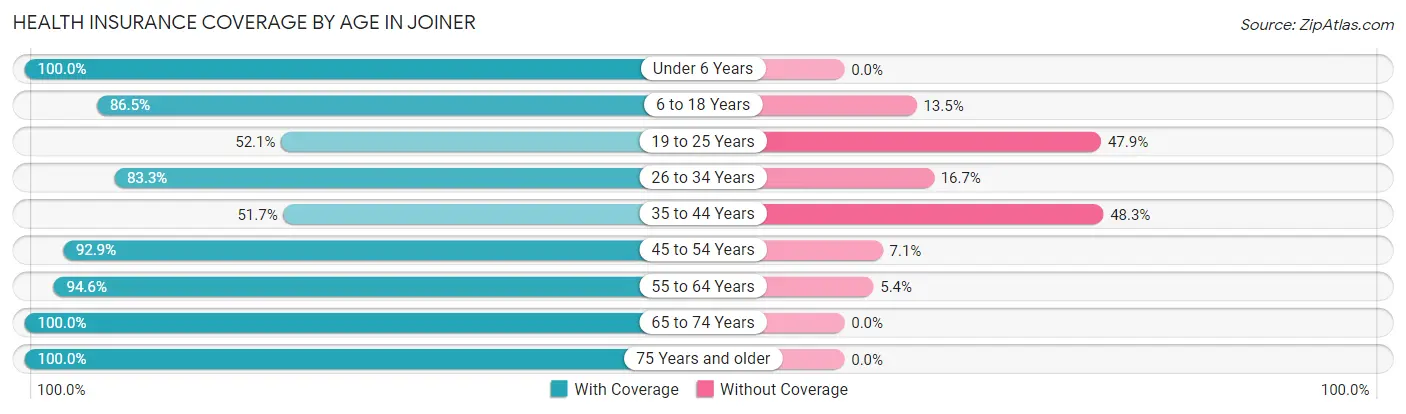
| Age Bracket | With Coverage | Without Coverage |
| Under 6 Years | 39 (100.0%) | 0 (0.0%) |
| 6 to 18 Years | 90 (86.5%) | 14 (13.5%) |
| 19 to 25 Years | 49 (52.1%) | 45 (47.9%) |
| 26 to 34 Years | 35 (83.3%) | 7 (16.7%) |
| 35 to 44 Years | 15 (51.7%) | 14 (48.3%) |
| 45 to 54 Years | 39 (92.9%) | 3 (7.1%) |
| 55 to 64 Years | 35 (94.6%) | 2 (5.4%) |
| 65 to 74 Years | 75 (100.0%) | 0 (0.0%) |
| 75 Years and older | 15 (100.0%) | 0 (0.0%) |
| Total | 392 (82.2%) | 85 (17.8%) |
Health Insurance Coverage by Citizenship Status in Joiner
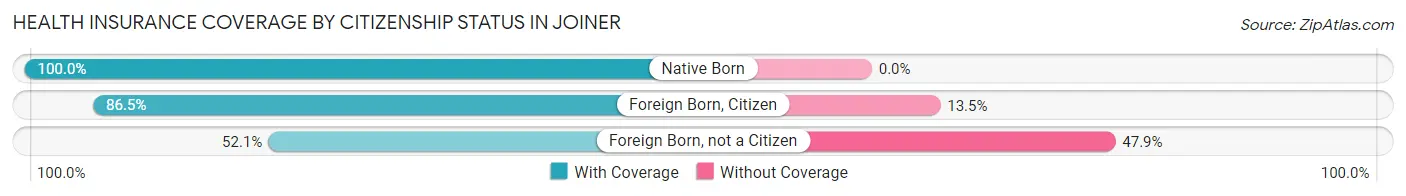
| Citizenship Status | With Coverage | Without Coverage |
| Native Born | 39 (100.0%) | 0 (0.0%) |
| Foreign Born, Citizen | 90 (86.5%) | 14 (13.5%) |
| Foreign Born, not a Citizen | 49 (52.1%) | 45 (47.9%) |
Health Insurance Coverage by Household Income in Joiner
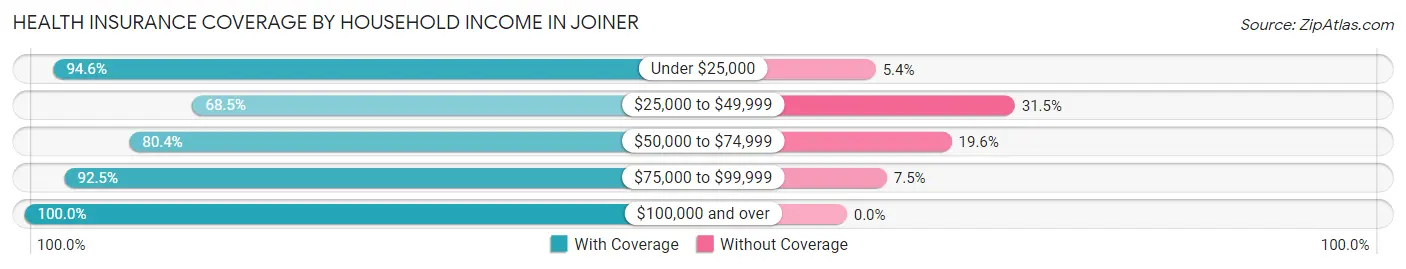
| Household Income | With Coverage | Without Coverage |
| Under $25,000 | 157 (94.6%) | 9 (5.4%) |
| $25,000 to $49,999 | 135 (68.5%) | 62 (31.5%) |
| $50,000 to $74,999 | 45 (80.4%) | 11 (19.6%) |
| $75,000 to $99,999 | 37 (92.5%) | 3 (7.5%) |
| $100,000 and over | 18 (100.0%) | 0 (0.0%) |
Public vs Private Health Insurance Coverage by Age in Joiner
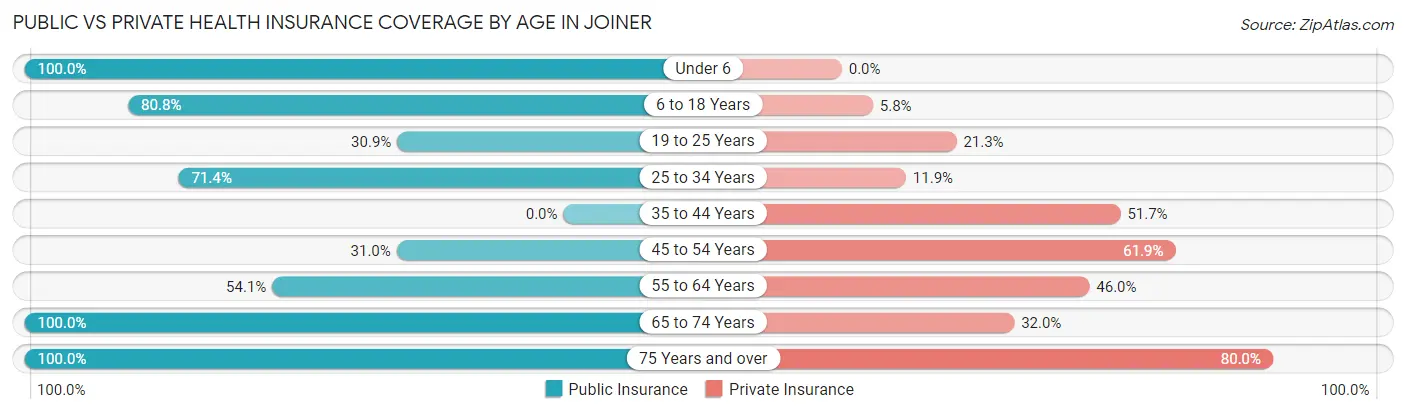
| Age Bracket | Public Insurance | Private Insurance |
| Under 6 | 39 (100.0%) | 0 (0.0%) |
| 6 to 18 Years | 84 (80.8%) | 6 (5.8%) |
| 19 to 25 Years | 29 (30.8%) | 20 (21.3%) |
| 25 to 34 Years | 30 (71.4%) | 5 (11.9%) |
| 35 to 44 Years | 0 (0.0%) | 15 (51.7%) |
| 45 to 54 Years | 13 (30.9%) | 26 (61.9%) |
| 55 to 64 Years | 20 (54.0%) | 17 (46.0%) |
| 65 to 74 Years | 75 (100.0%) | 24 (32.0%) |
| 75 Years and over | 15 (100.0%) | 12 (80.0%) |
| Total | 305 (63.9%) | 125 (26.2%) |
Disability Status by Sex by Age in Joiner
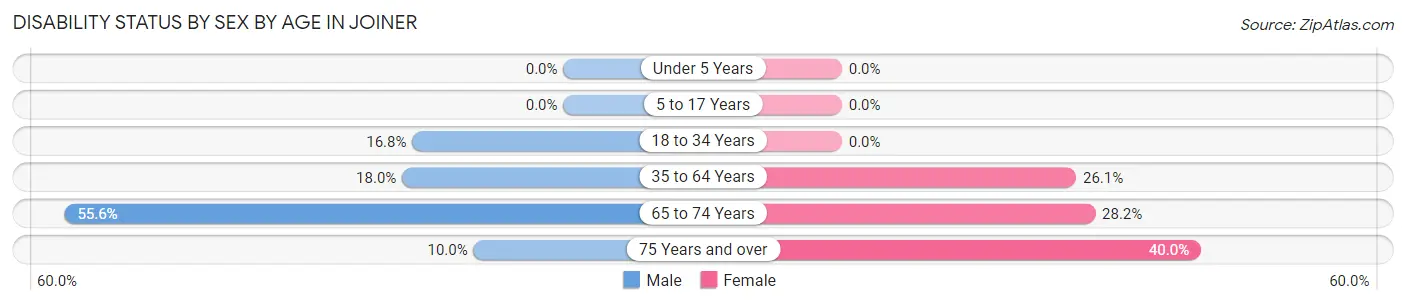
| Age Bracket | Male | Female |
| Under 5 Years | 0 (0.0%) | 0 (0.0%) |
| 5 to 17 Years | 0 (0.0%) | 0 (0.0%) |
| 18 to 34 Years | 18 (16.8%) | 0 (0.0%) |
| 35 to 64 Years | 7 (17.9%) | 18 (26.1%) |
| 65 to 74 Years | 20 (55.6%) | 11 (28.2%) |
| 75 Years and over | 1 (10.0%) | 2 (40.0%) |
Disability Class by Sex by Age in Joiner
Disability Class: Hearing Difficulty
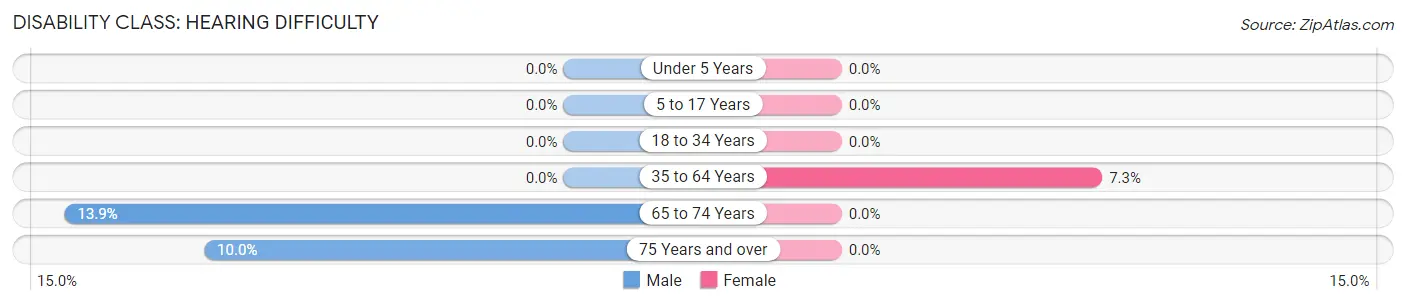
| Age Bracket | Male | Female |
| Under 5 Years | 0 (0.0%) | 0 (0.0%) |
| 5 to 17 Years | 0 (0.0%) | 0 (0.0%) |
| 18 to 34 Years | 0 (0.0%) | 0 (0.0%) |
| 35 to 64 Years | 0 (0.0%) | 5 (7.2%) |
| 65 to 74 Years | 5 (13.9%) | 0 (0.0%) |
| 75 Years and over | 1 (10.0%) | 0 (0.0%) |
Disability Class: Vision Difficulty
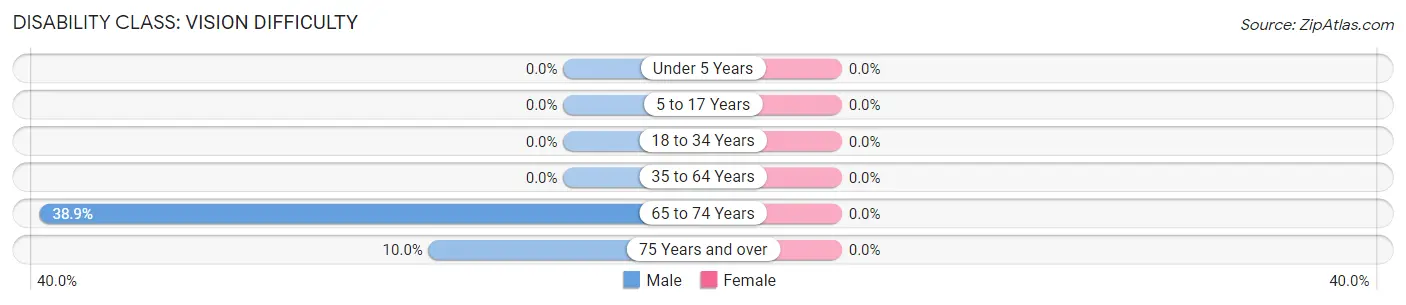
| Age Bracket | Male | Female |
| Under 5 Years | 0 (0.0%) | 0 (0.0%) |
| 5 to 17 Years | 0 (0.0%) | 0 (0.0%) |
| 18 to 34 Years | 0 (0.0%) | 0 (0.0%) |
| 35 to 64 Years | 0 (0.0%) | 0 (0.0%) |
| 65 to 74 Years | 14 (38.9%) | 0 (0.0%) |
| 75 Years and over | 1 (10.0%) | 0 (0.0%) |
Disability Class: Cognitive Difficulty

| Age Bracket | Male | Female |
| 5 to 17 Years | 0 (0.0%) | 0 (0.0%) |
| 18 to 34 Years | 18 (16.8%) | 0 (0.0%) |
| 35 to 64 Years | 0 (0.0%) | 7 (10.1%) |
| 65 to 74 Years | 3 (8.3%) | 0 (0.0%) |
| 75 Years and over | 1 (10.0%) | 0 (0.0%) |
Disability Class: Ambulatory Difficulty
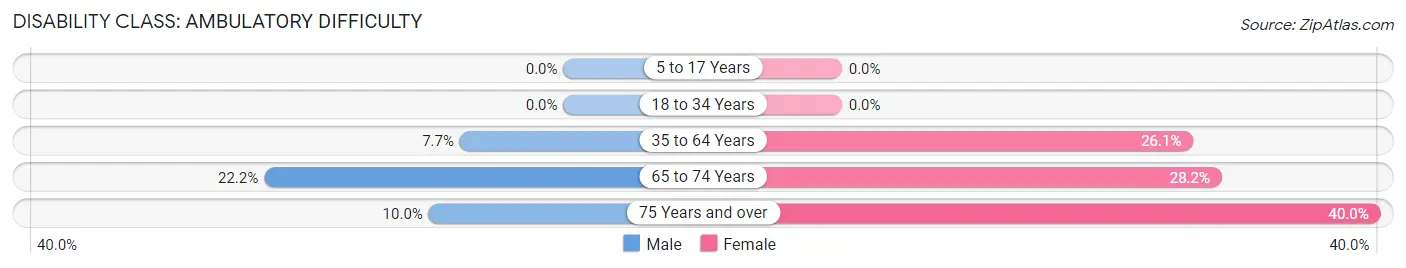
| Age Bracket | Male | Female |
| 5 to 17 Years | 0 (0.0%) | 0 (0.0%) |
| 18 to 34 Years | 0 (0.0%) | 0 (0.0%) |
| 35 to 64 Years | 3 (7.7%) | 18 (26.1%) |
| 65 to 74 Years | 8 (22.2%) | 11 (28.2%) |
| 75 Years and over | 1 (10.0%) | 2 (40.0%) |
Disability Class: Self-Care Difficulty
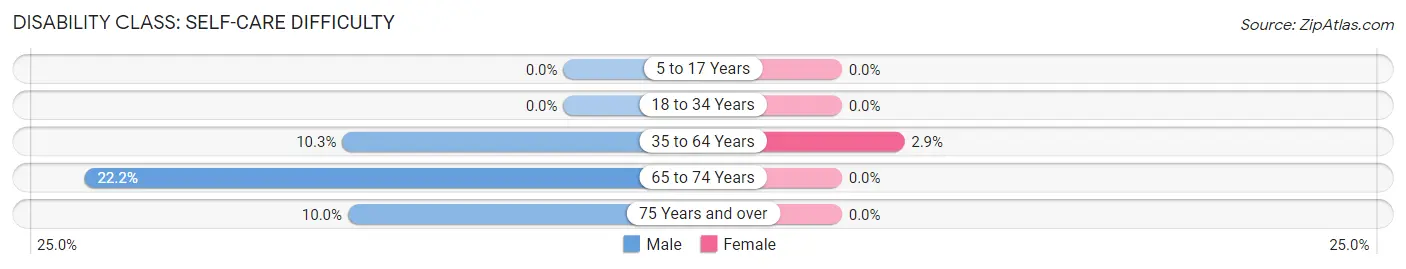
| Age Bracket | Male | Female |
| 5 to 17 Years | 0 (0.0%) | 0 (0.0%) |
| 18 to 34 Years | 0 (0.0%) | 0 (0.0%) |
| 35 to 64 Years | 4 (10.3%) | 2 (2.9%) |
| 65 to 74 Years | 8 (22.2%) | 0 (0.0%) |
| 75 Years and over | 1 (10.0%) | 0 (0.0%) |
Technology Access in Joiner
Computing Device Access in Joiner
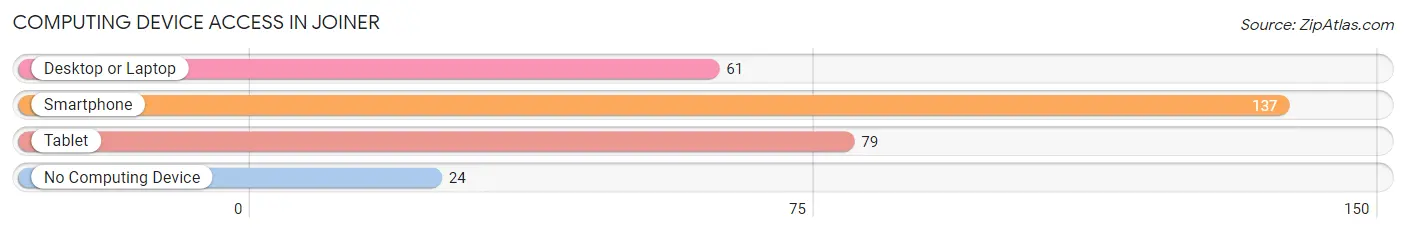
| Device Type | # Households | % Households |
| Desktop or Laptop | 61 | 33.3% |
| Smartphone | 137 | 74.9% |
| Tablet | 79 | 43.2% |
| No Computing Device | 24 | 13.1% |
| Total | 183 | 100.0% |
Internet Access in Joiner
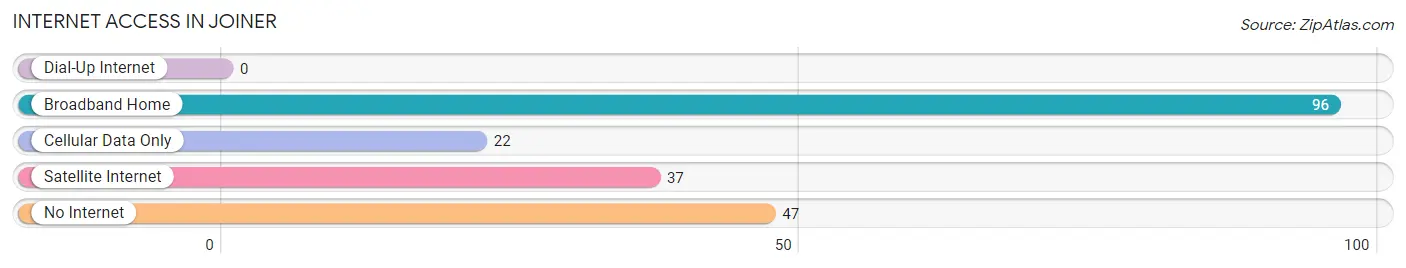
| Internet Type | # Households | % Households |
| Dial-Up Internet | 0 | 0.0% |
| Broadband Home | 96 | 52.5% |
| Cellular Data Only | 22 | 12.0% |
| Satellite Internet | 37 | 20.2% |
| No Internet | 47 | 25.7% |
| Total | 183 | 100.0% |
Joiner Summary
AR History
The history of Arkansas is a long and varied one, stretching back to the earliest days of the United States. The state was first explored by Spanish explorers in the 16th century, and was later claimed by France in the 18th century. The area was ceded to the United States in 1803 as part of the Louisiana Purchase. Arkansas was admitted to the Union in 1836 as the 25th state.
The state has a rich Native American history, with many tribes inhabiting the area prior to European settlement. The Quapaw, Caddo, Osage, and Cherokee were among the most prominent tribes in the region. The state was also home to the Trail of Tears, a forced relocation of Native Americans from the southeastern United States to Oklahoma in the 1830s.
Arkansas was a slave state prior to the Civil War, and was the site of several battles during the conflict. After the war, the state was readmitted to the Union in 1868. During the Reconstruction era, the state was the site of several racial tensions, including the Elaine Massacre of 1919.
The state experienced a period of economic growth in the late 19th and early 20th centuries, with the development of the timber and cotton industries. The Great Depression of the 1930s hit the state hard, and the state was slow to recover. The state experienced a period of economic growth in the 1950s and 1960s, with the development of the poultry and tourism industries.
Geography
Arkansas is located in the south-central United States, bordered by Missouri to the north, Tennessee and Mississippi to the east, Louisiana to the south, and Texas and Oklahoma to the west. The state is divided into 75 counties, and its capital is Little Rock.
The state is home to a variety of landscapes, from the Ozark Mountains in the northwest to the flat Delta region in the east. The state is also home to several rivers, including the Arkansas, White, and Mississippi.
Economy
Arkansas’s economy is largely based on agriculture, with the state’s main crops being cotton, soybeans, rice, and wheat. The state is also home to a large poultry industry, and is a major producer of timber.
The state’s manufacturing sector is also important, with the production of chemicals, paper products, and food products being the most important industries. The state is also home to several large companies, including Walmart, Tyson Foods, and J.B. Hunt.
Demographics
As of the 2010 census, Arkansas had a population of 2,915,918. The state is predominantly white, with 78.7% of the population identifying as such. African Americans make up 15.4% of the population, while Hispanics and Latinos make up 6.2%.
The state is also home to a large Native American population, with the Cherokee, Choctaw, and Quapaw tribes being the most prominent. The state also has a large Asian population, with Chinese, Vietnamese, and Filipino Americans making up the largest groups.
The state’s median household income is $41,371, and the poverty rate is 17.2%. The state’s largest cities are Little Rock, Fort Smith, Fayetteville, and Springdale.
Common Questions
What is Per Capita Income in Joiner?
Per Capita income in Joiner is $16,212.
What is the Median Family Income in Joiner?
Median Family Income in Joiner is $26,691.
What is the Median Household income in Joiner?
Median Household Income in Joiner is $27,321.
What is Income or Wage Gap in Joiner?
Income or Wage Gap in Joiner is 29.6%.
Women in Joiner earn 70.4 cents for every dollar earned by a man.
What is Inequality or Gini Index in Joiner?
Inequality or Gini Index in Joiner is 0.46.
What is the Total Population of Joiner?
Total Population of Joiner is 477.
What is the Total Male Population of Joiner?
Total Male Population of Joiner is 296.
What is the Total Female Population of Joiner?
Total Female Population of Joiner is 181.
What is the Ratio of Males per 100 Females in Joiner?
There are 163.54 Males per 100 Females in Joiner.
What is the Ratio of Females per 100 Males in Joiner?
There are 61.15 Females per 100 Males in Joiner.
What is the Median Population Age in Joiner?
Median Population Age in Joiner is 26.2 Years.
What is the Average Family Size in Joiner
Average Family Size in Joiner is 3.6 People.
What is the Average Household Size in Joiner
Average Household Size in Joiner is 2.6 People.
How Large is the Labor Force in Joiner?
There are 225 People in the Labor Forcein in Joiner.
What is the Percentage of People in the Labor Force in Joiner?
60.0% of People are in the Labor Force in Joiner.
What is the Unemployment Rate in Joiner?
Unemployment Rate in Joiner is 27.6%.