Hunter, AR Map & Demographics
Hunter Map
Hunter Overview
$31,454
PER CAPITA INCOME
$118,438
AVG FAMILY INCOME
$86,389
AVG HOUSEHOLD INCOME
0.28
INEQUALITY / GINI INDEX
142
TOTAL POPULATION
69
MALE POPULATION
73
FEMALE POPULATION
94.52
MALES / 100 FEMALES
105.80
FEMALES / 100 MALES
39.3
MEDIAN AGE
4.1
AVG FAMILY SIZE
3.2
AVG HOUSEHOLD SIZE
87
LABOR FORCE [ PEOPLE ]
75.7%
PERCENT IN LABOR FORCE
Hunter Zip Codes
Hunter Area Codes
Income in Hunter
Income Overview in Hunter
Per Capita Income in Hunter is $31,454, while median incomes of families and households are $118,438 and $86,389 respectively.
| Characteristic | Number | Measure |
| Per Capita Income | 142 | $31,454 |
| Median Family Income | 30 | $118,438 |
| Mean Family Income | 30 | $108,347 |
| Median Household Income | 44 | $86,389 |
| Mean Household Income | 44 | $87,468 |
| Income Deficit | 30 | $0 |
| Wage / Income Gap (%) | 142 | 0.00% |
| Wage / Income Gap ($) | 142 | 100.00¢ per $1 |
| Gini / Inequality Index | 142 | 0.28 |
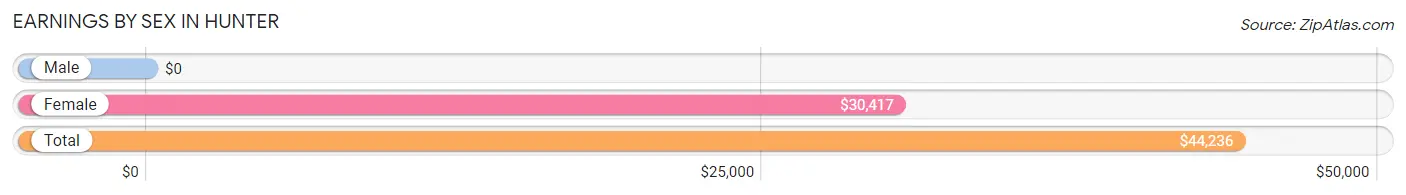
Earnings by Sex in Hunter
| Sex | Number | Average Earnings |
| Male | 45 (51.7%) | $0 |
| Female | 42 (48.3%) | $30,417 |
| Total | 87 (100.0%) | $44,236 |
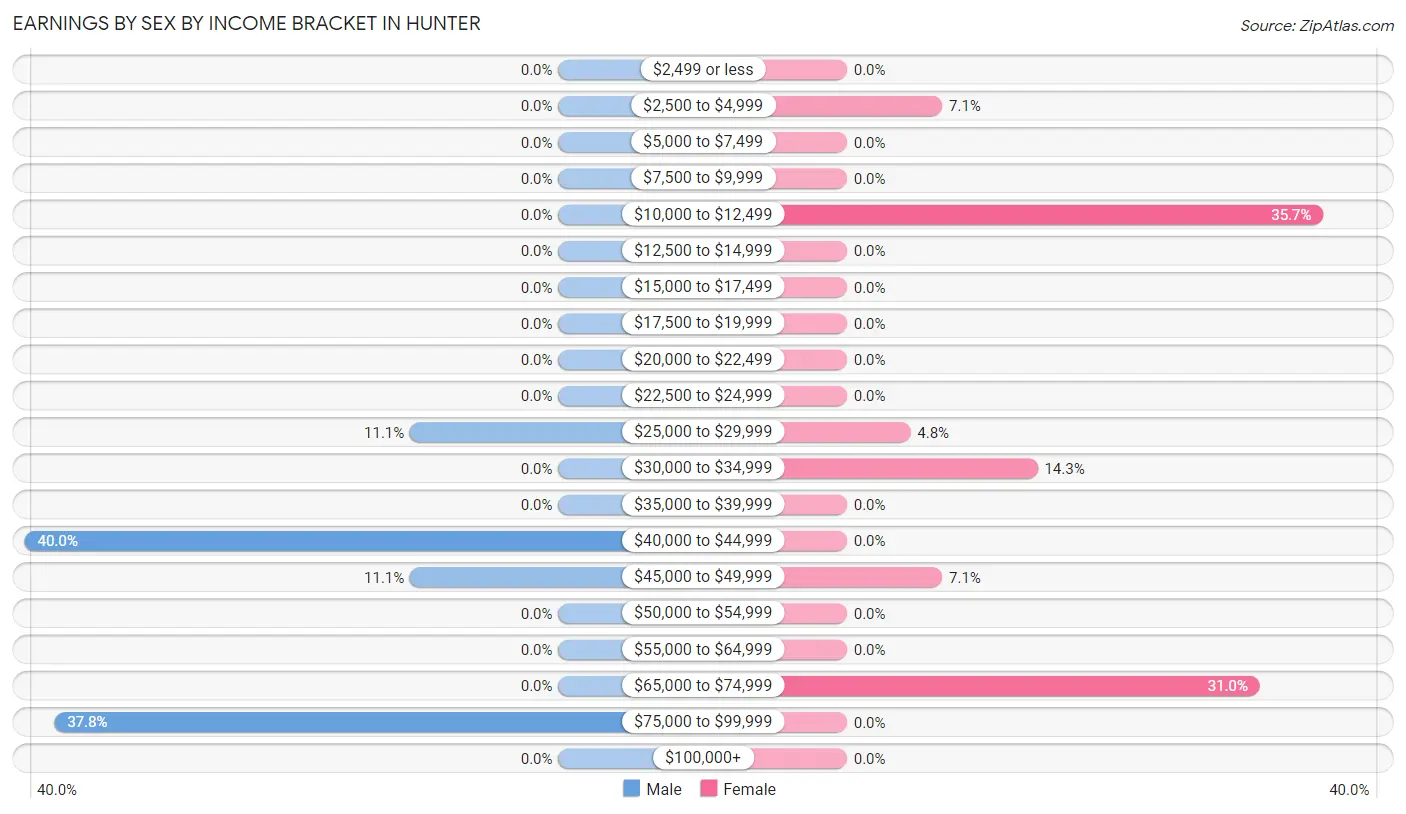
Earnings by Sex by Income Bracket in Hunter
The most common earnings brackets in Hunter are $40,000 to $44,999 for men (18 | 40.0%) and $10,000 to $12,499 for women (15 | 35.7%).
| Income | Male | Female |
| $2,499 or less | 0 (0.0%) | 0 (0.0%) |
| $2,500 to $4,999 | 0 (0.0%) | 3 (7.1%) |
| $5,000 to $7,499 | 0 (0.0%) | 0 (0.0%) |
| $7,500 to $9,999 | 0 (0.0%) | 0 (0.0%) |
| $10,000 to $12,499 | 0 (0.0%) | 15 (35.7%) |
| $12,500 to $14,999 | 0 (0.0%) | 0 (0.0%) |
| $15,000 to $17,499 | 0 (0.0%) | 0 (0.0%) |
| $17,500 to $19,999 | 0 (0.0%) | 0 (0.0%) |
| $20,000 to $22,499 | 0 (0.0%) | 0 (0.0%) |
| $22,500 to $24,999 | 0 (0.0%) | 0 (0.0%) |
| $25,000 to $29,999 | 5 (11.1%) | 2 (4.8%) |
| $30,000 to $34,999 | 0 (0.0%) | 6 (14.3%) |
| $35,000 to $39,999 | 0 (0.0%) | 0 (0.0%) |
| $40,000 to $44,999 | 18 (40.0%) | 0 (0.0%) |
| $45,000 to $49,999 | 5 (11.1%) | 3 (7.1%) |
| $50,000 to $54,999 | 0 (0.0%) | 0 (0.0%) |
| $55,000 to $64,999 | 0 (0.0%) | 0 (0.0%) |
| $65,000 to $74,999 | 0 (0.0%) | 13 (30.9%) |
| $75,000 to $99,999 | 17 (37.8%) | 0 (0.0%) |
| $100,000+ | 0 (0.0%) | 0 (0.0%) |
| Total | 45 (100.0%) | 42 (100.0%) |
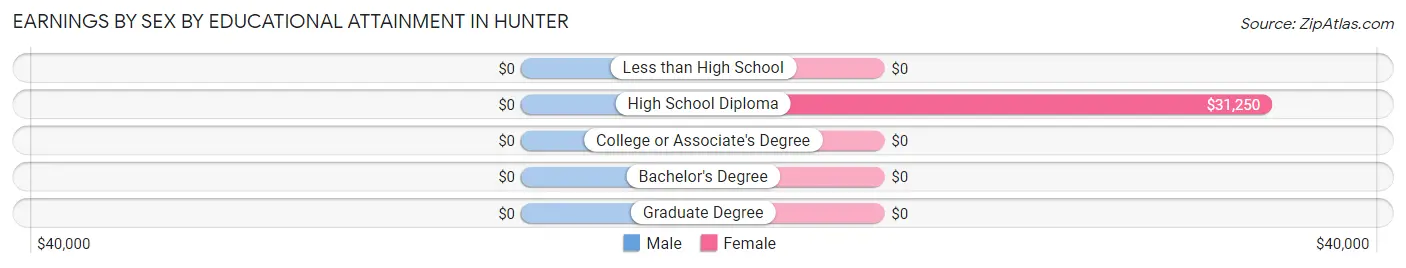
Earnings by Sex by Educational Attainment in Hunter
| Educational Attainment | Male Income | Female Income |
| Less than High School | - | - |
| High School Diploma | - | - |
| College or Associate's Degree | - | - |
| Bachelor's Degree | - | - |
| Graduate Degree | - | - |
| Total | - | - |
Family Income in Hunter
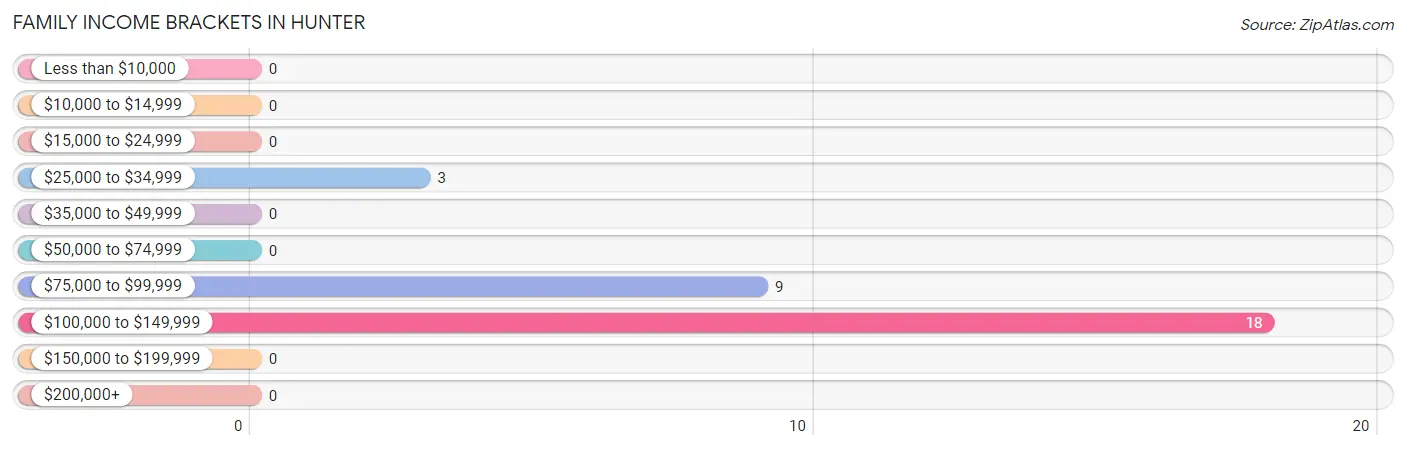
Family Income Brackets in Hunter
According to the Hunter family income data, there are 18 families falling into the $100,000 to $149,999 income range, which is the most common income bracket and makes up 60.0% of all families.
| Income Bracket | # Families | % Families |
| Less than $10,000 | 0 | 0.0% |
| $10,000 to $14,999 | 0 | 0.0% |
| $15,000 to $24,999 | 0 | 0.0% |
| $25,000 to $34,999 | 3 | 10.0% |
| $35,000 to $49,999 | 0 | 0.0% |
| $50,000 to $74,999 | 0 | 0.0% |
| $75,000 to $99,999 | 9 | 30.0% |
| $100,000 to $149,999 | 18 | 60.0% |
| $150,000 to $199,999 | 0 | 0.0% |
| $200,000+ | 0 | 0.0% |
Family Income by Famaliy Size in Hunter
| Income Bracket | # Families | Median Income |
| 2-Person Families | 3 (10.0%) | $0 |
| 3-Person Families | 17 (56.7%) | $0 |
| 4-Person Families | 0 (0.0%) | $0 |
| 5-Person Families | 10 (33.3%) | $0 |
| 6-Person Families | 0 (0.0%) | $0 |
| 7+ Person Families | 0 (0.0%) | $0 |
| Total | 30 (100.0%) | $118,438 |
Family Income by Number of Earners in Hunter
| Number of Earners | # Families | Median Income |
| No Earners | 0 (0.0%) | $0 |
| 1 Earner | 9 (30.0%) | $0 |
| 2 Earners | 11 (36.7%) | $0 |
| 3+ Earners | 10 (33.3%) | $0 |
| Total | 30 (100.0%) | $118,438 |
Household Income in Hunter
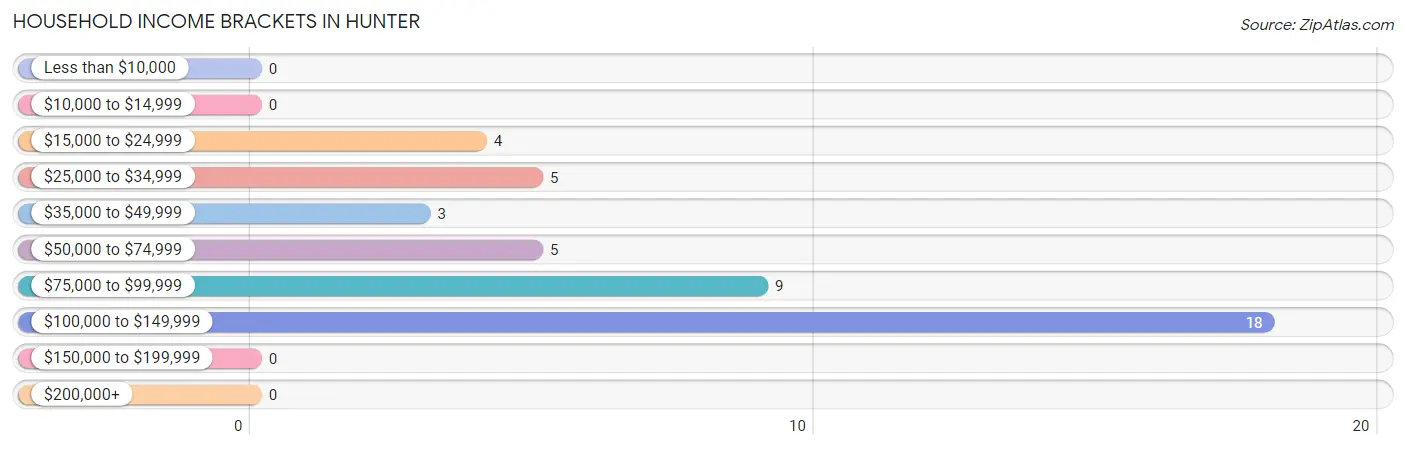
Household Income Brackets in Hunter
With 18 households falling in the category, the $100,000 to $149,999 income range is the most frequent in Hunter, accounting for 40.9% of all households.
| Income Bracket | # Households | % Households |
| Less than $10,000 | 0 | 0.0% |
| $10,000 to $14,999 | 0 | 0.0% |
| $15,000 to $24,999 | 4 | 9.1% |
| $25,000 to $34,999 | 5 | 11.4% |
| $35,000 to $49,999 | 3 | 6.8% |
| $50,000 to $74,999 | 5 | 11.4% |
| $75,000 to $99,999 | 9 | 20.5% |
| $100,000 to $149,999 | 18 | 40.9% |
| $150,000 to $199,999 | 0 | 0.0% |
| $200,000+ | 0 | 0.0% |
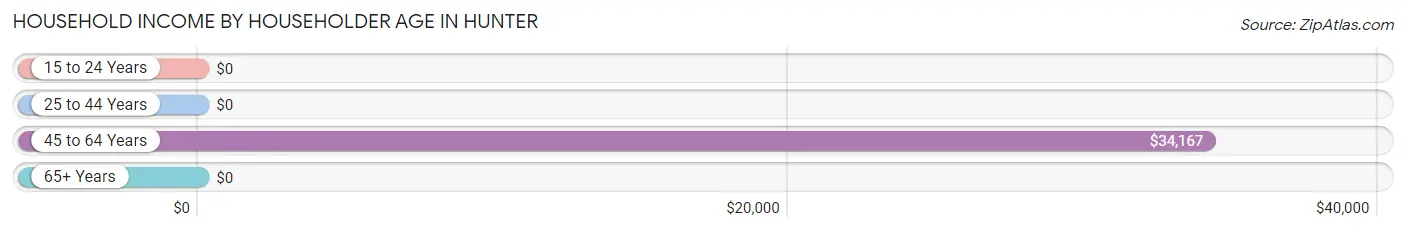
Household Income by Householder Age in Hunter
The median household income in Hunter is $86,389, with the highest median household income of $34,167 found in the 45 to 64 years age bracket for the primary householder. A total of 8 households (18.2%) fall into this category.
| Income Bracket | # Households | Median Income |
| 15 to 24 Years | 0 (0.0%) | $0 |
| 25 to 44 Years | 17 (38.6%) | $0 |
| 45 to 64 Years | 8 (18.2%) | $34,167 |
| 65+ Years | 19 (43.2%) | $0 |
| Total | 44 (100.0%) | $86,389 |
Poverty in Hunter
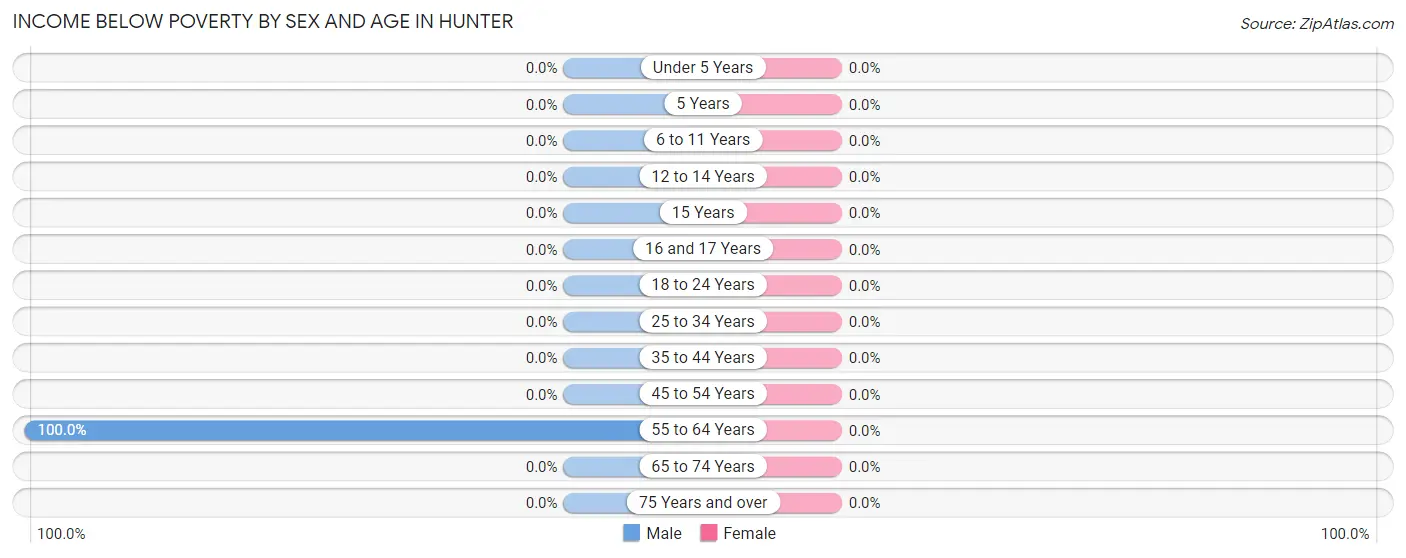
Income Below Poverty by Sex and Age in Hunter
| Age Bracket | Male | Female |
| Under 5 Years | 0 (0.0%) | 0 (0.0%) |
| 5 Years | 0 (0.0%) | 0 (0.0%) |
| 6 to 11 Years | 0 (0.0%) | 0 (0.0%) |
| 12 to 14 Years | 0 (0.0%) | 0 (0.0%) |
| 15 Years | 0 (0.0%) | 0 (0.0%) |
| 16 and 17 Years | 0 (0.0%) | 0 (0.0%) |
| 18 to 24 Years | 0 (0.0%) | 0 (0.0%) |
| 25 to 34 Years | 0 (0.0%) | 0 (0.0%) |
| 35 to 44 Years | 0 (0.0%) | 0 (0.0%) |
| 45 to 54 Years | 0 (0.0%) | 0 (0.0%) |
| 55 to 64 Years | 5 (100.0%) | 0 (0.0%) |
| 65 to 74 Years | 0 (0.0%) | 0 (0.0%) |
| 75 Years and over | 0 (0.0%) | 0 (0.0%) |
| Total | 5 (7.2%) | 0 (0.0%) |
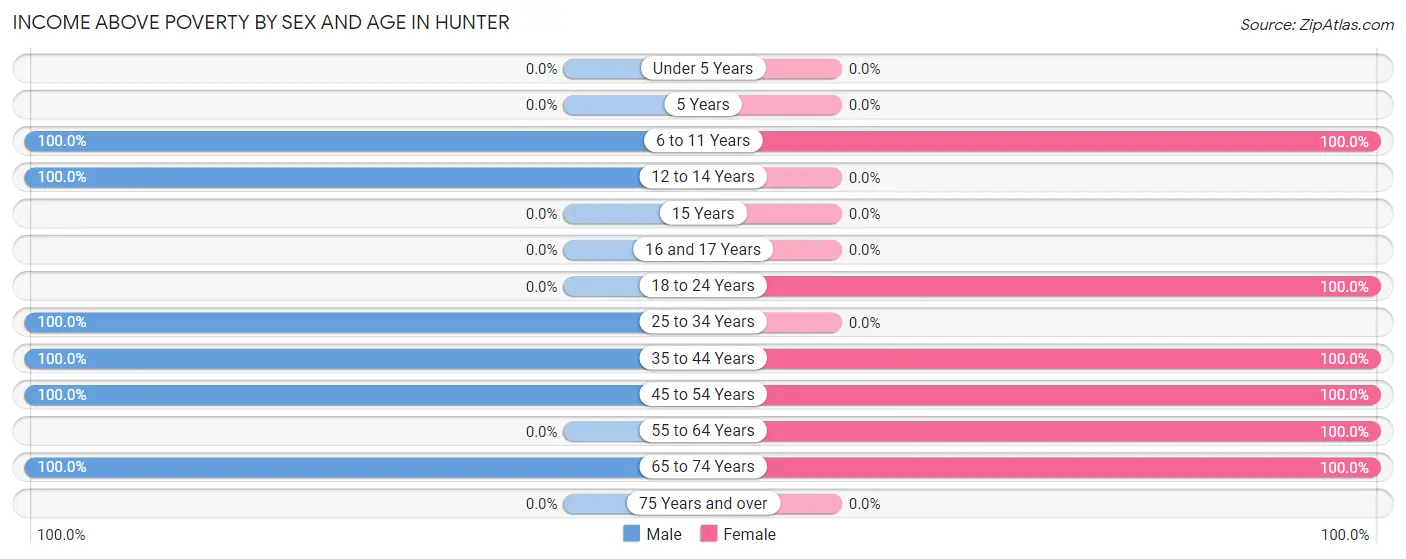
Income Above Poverty by Sex and Age in Hunter
According to the poverty statistics in Hunter, males aged 6 to 11 years and females aged 6 to 11 years are the age groups that are most secure financially, with 100.0% of males and 100.0% of females in these age groups living above the poverty line.
| Age Bracket | Male | Female |
| Under 5 Years | 0 (0.0%) | 0 (0.0%) |
| 5 Years | 0 (0.0%) | 0 (0.0%) |
| 6 to 11 Years | 13 (100.0%) | 8 (100.0%) |
| 12 to 14 Years | 6 (100.0%) | 0 (0.0%) |
| 15 Years | 0 (0.0%) | 0 (0.0%) |
| 16 and 17 Years | 0 (0.0%) | 0 (0.0%) |
| 18 to 24 Years | 0 (0.0%) | 24 (100.0%) |
| 25 to 34 Years | 18 (100.0%) | 0 (0.0%) |
| 35 to 44 Years | 17 (100.0%) | 6 (100.0%) |
| 45 to 54 Years | 5 (100.0%) | 15 (100.0%) |
| 55 to 64 Years | 0 (0.0%) | 6 (100.0%) |
| 65 to 74 Years | 5 (100.0%) | 14 (100.0%) |
| 75 Years and over | 0 (0.0%) | 0 (0.0%) |
| Total | 64 (92.7%) | 73 (100.0%) |
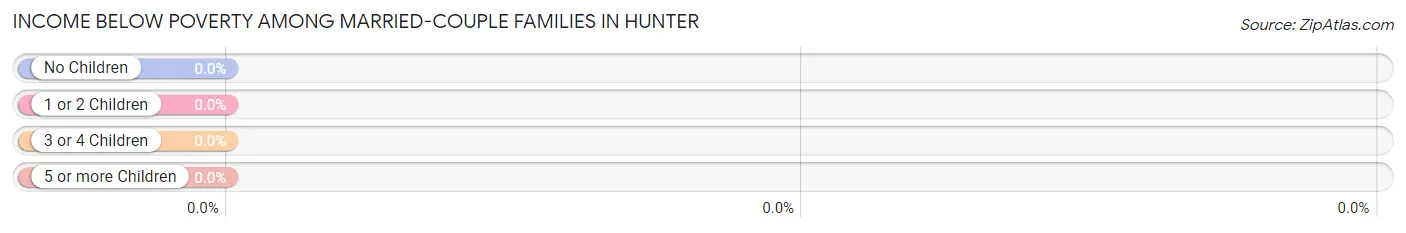
Income Below Poverty Among Married-Couple Families in Hunter
| Children | Above Poverty | Below Poverty |
| No Children | 3 (100.0%) | 0 (0.0%) |
| 1 or 2 Children | 8 (100.0%) | 0 (0.0%) |
| 3 or 4 Children | 0 (0.0%) | 0 (0.0%) |
| 5 or more Children | 0 (0.0%) | 0 (0.0%) |
| Total | 11 (100.0%) | 0 (0.0%) |
Income Below Poverty Among Single-Parent Households in Hunter
| Children | Single Father | Single Mother |
| No Children | 0 (0.0%) | 0 (0.0%) |
| 1 or 2 Children | 0 (0.0%) | 0 (0.0%) |
| 3 or 4 Children | 0 (0.0%) | 0 (0.0%) |
| 5 or more Children | 0 (0.0%) | 0 (0.0%) |
| Total | 0 (0.0%) | 0 (0.0%) |
Income Below Poverty Among Married-Couple vs Single-Parent Households in Hunter
| Children | Married-Couple Families | Single-Parent Households |
| No Children | 0 (0.0%) | 0 (0.0%) |
| 1 or 2 Children | 0 (0.0%) | 0 (0.0%) |
| 3 or 4 Children | 0 (0.0%) | 0 (0.0%) |
| 5 or more Children | 0 (0.0%) | 0 (0.0%) |
| Total | 0 (0.0%) | 0 (0.0%) |
Race in Hunter
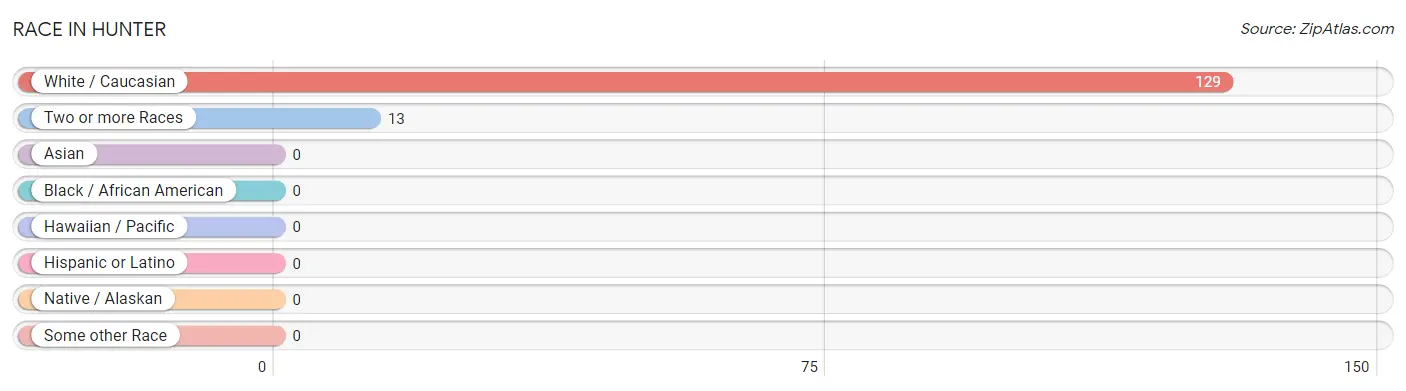
The most populous races in Hunter are White / Caucasian (129 | 90.8%), and Two or more Races (13 | 9.1%).
| Race | # Population | % Population |
| Asian | 0 | 0.0% |
| Black / African American | 0 | 0.0% |
| Hawaiian / Pacific | 0 | 0.0% |
| Hispanic or Latino | 0 | 0.0% |
| Native / Alaskan | 0 | 0.0% |
| White / Caucasian | 129 | 90.8% |
| Two or more Races | 13 | 9.1% |
| Some other Race | 0 | 0.0% |
| Total | 142 | 100.0% |
Ancestry in Hunter

| Ancestry | # Population | % Population | View All 0 Rows |
Immigrants in Hunter

| Immigration Origin | # Population | % Population | View All 0 Rows |
Sex and Age in Hunter
Sex and Age in Hunter
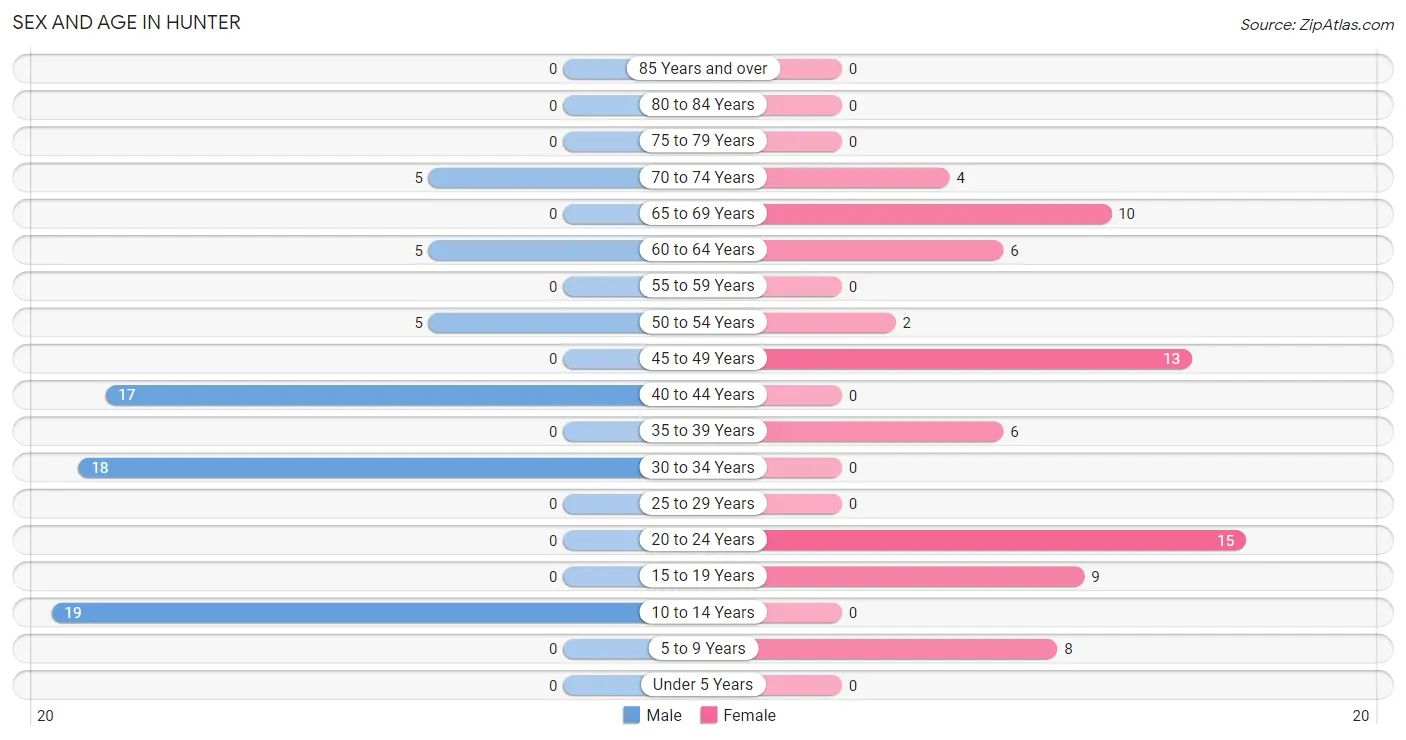
The most populous age groups in Hunter are 10 to 14 Years (19 | 27.5%) for men and 20 to 24 Years (15 | 20.5%) for women.
| Age Bracket | Male | Female |
| Under 5 Years | 0 (0.0%) | 0 (0.0%) |
| 5 to 9 Years | 0 (0.0%) | 8 (11.0%) |
| 10 to 14 Years | 19 (27.5%) | 0 (0.0%) |
| 15 to 19 Years | 0 (0.0%) | 9 (12.3%) |
| 20 to 24 Years | 0 (0.0%) | 15 (20.5%) |
| 25 to 29 Years | 0 (0.0%) | 0 (0.0%) |
| 30 to 34 Years | 18 (26.1%) | 0 (0.0%) |
| 35 to 39 Years | 0 (0.0%) | 6 (8.2%) |
| 40 to 44 Years | 17 (24.6%) | 0 (0.0%) |
| 45 to 49 Years | 0 (0.0%) | 13 (17.8%) |
| 50 to 54 Years | 5 (7.2%) | 2 (2.7%) |
| 55 to 59 Years | 0 (0.0%) | 0 (0.0%) |
| 60 to 64 Years | 5 (7.2%) | 6 (8.2%) |
| 65 to 69 Years | 0 (0.0%) | 10 (13.7%) |
| 70 to 74 Years | 5 (7.2%) | 4 (5.5%) |
| 75 to 79 Years | 0 (0.0%) | 0 (0.0%) |
| 80 to 84 Years | 0 (0.0%) | 0 (0.0%) |
| 85 Years and over | 0 (0.0%) | 0 (0.0%) |
| Total | 69 (100.0%) | 73 (100.0%) |
Families and Households in Hunter
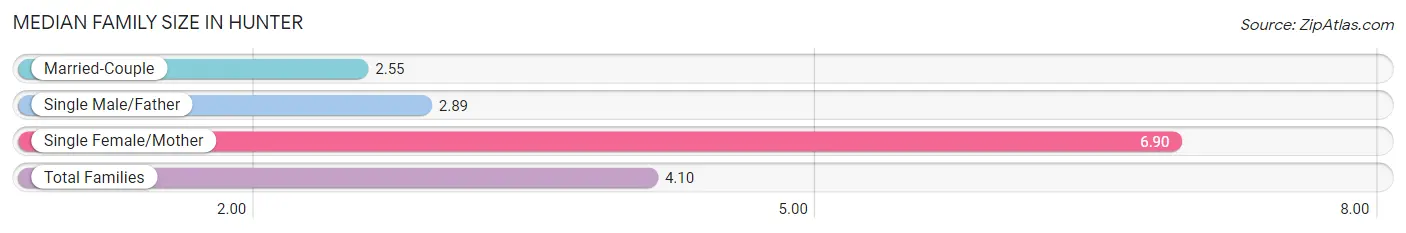
Median Family Size in Hunter
The median family size in Hunter is 4.10 persons per family, with single female/mother families (10 | 33.3%) accounting for the largest median family size of 6.9 persons per family. On the other hand, married-couple families (11 | 36.7%) represent the smallest median family size with 2.55 persons per family.
| Family Type | # Families | Family Size |
| Married-Couple | 11 (36.7%) | 2.55 |
| Single Male/Father | 9 (30.0%) | 2.89 |
| Single Female/Mother | 10 (33.3%) | 6.90 |
| Total Families | 30 (100.0%) | 4.10 |
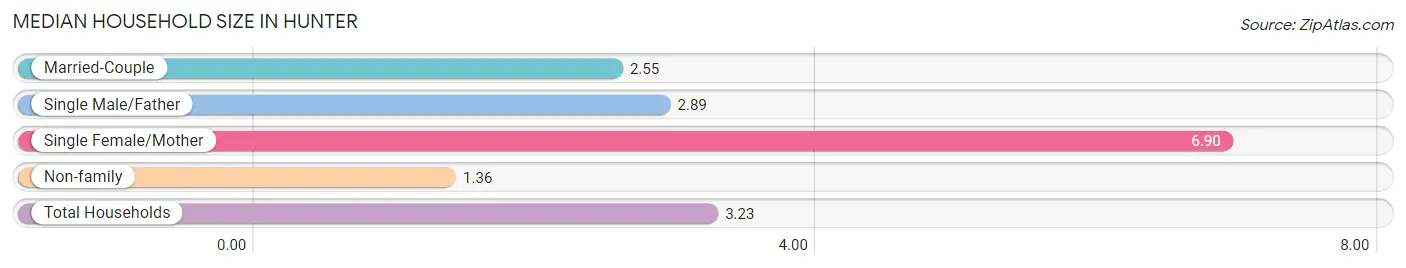
Median Household Size in Hunter
The median household size in Hunter is 3.23 persons per household, with single female/mother households (10 | 22.7%) accounting for the largest median household size of 6.9 persons per household. non-family households (14 | 31.8%) represent the smallest median household size with 1.36 persons per household.
| Household Type | # Households | Household Size |
| Married-Couple | 11 (25.0%) | 2.55 |
| Single Male/Father | 9 (20.4%) | 2.89 |
| Single Female/Mother | 10 (22.7%) | 6.90 |
| Non-family | 14 (31.8%) | 1.36 |
| Total Households | 44 (100.0%) | 3.23 |
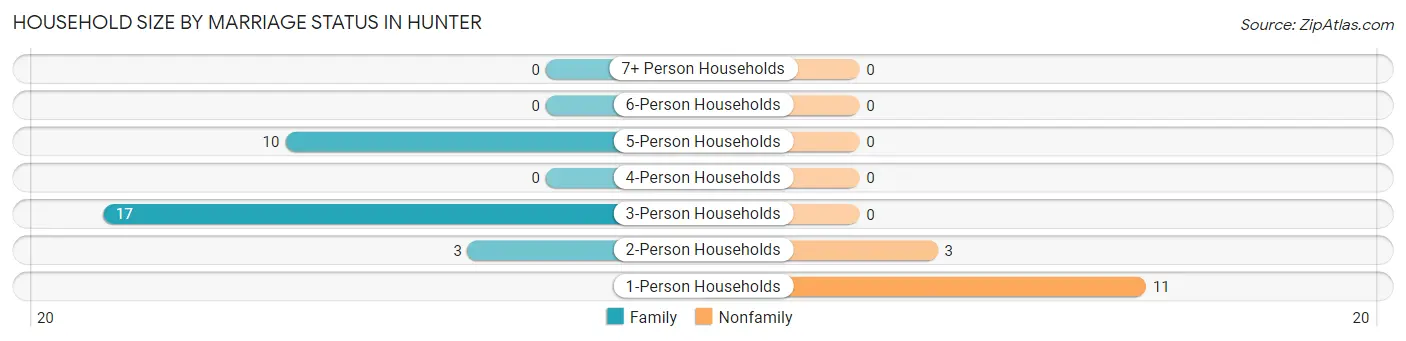
Household Size by Marriage Status in Hunter
Out of a total of 44 households in Hunter, 30 (68.2%) are family households, while 14 (31.8%) are nonfamily households. The most numerous type of family households are 3-person households, comprising 17, and the most common type of nonfamily households are 1-person households, comprising 11.
| Household Size | Family Households | Nonfamily Households |
| 1-Person Households | - | 11 (25.0%) |
| 2-Person Households | 3 (6.8%) | 3 (6.8%) |
| 3-Person Households | 17 (38.6%) | 0 (0.0%) |
| 4-Person Households | 0 (0.0%) | 0 (0.0%) |
| 5-Person Households | 10 (22.7%) | 0 (0.0%) |
| 6-Person Households | 0 (0.0%) | 0 (0.0%) |
| 7+ Person Households | 0 (0.0%) | 0 (0.0%) |
| Total | 30 (68.2%) | 14 (31.8%) |
Female Fertility in Hunter
Fertility by Age in Hunter
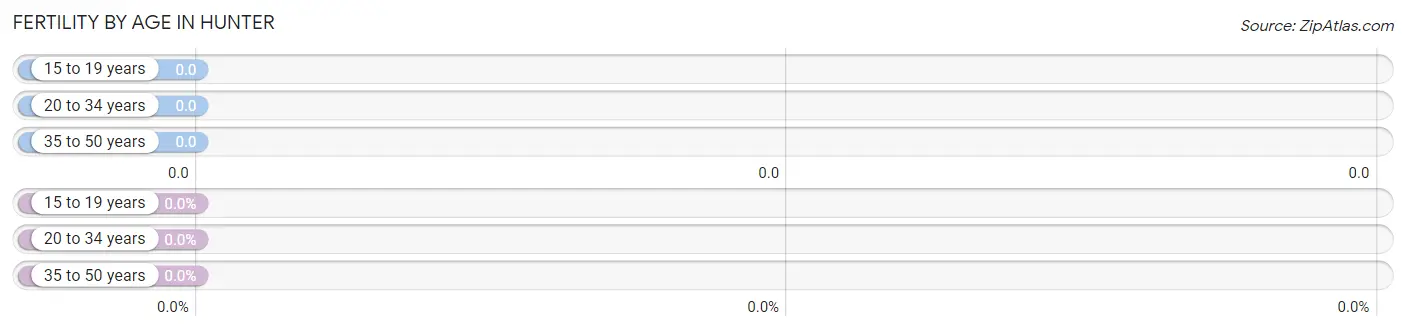
| Age Bracket | Women with Births | Births / 1,000 Women |
| 15 to 19 years | 0 (0.0%) | 0.0 |
| 20 to 34 years | 0 (0.0%) | 0.0 |
| 35 to 50 years | 0 (0.0%) | 0.0 |
| Total | 0 (0.0%) | 0.0 |
Fertility by Age by Marriage Status in Hunter
| Age Bracket | Married | Unmarried |
| 15 to 19 years | 0 (0.0%) | 0 (0.0%) |
| 20 to 34 years | 0 (0.0%) | 0 (0.0%) |
| 35 to 50 years | 0 (0.0%) | 0 (0.0%) |
| Total | 0 (0.0%) | 0 (0.0%) |
Fertility by Education in Hunter
| Educational Attainment | Women with Births | Births / 1,000 Women |
| Less than High School | 0 (0.0%) | 0.0 |
| High School Diploma | 0 (0.0%) | 0.0 |
| College or Associate's Degree | 0 (0.0%) | 0.0 |
| Bachelor's Degree | 0 (0.0%) | 0.0 |
| Graduate Degree | 0 (0.0%) | 0.0 |
| Total | 0 (0.0%) | 0.0 |
Fertility by Education by Marriage Status in Hunter
| Educational Attainment | Married | Unmarried |
| Less than High School | 0 (0.0%) | 0 (0.0%) |
| High School Diploma | 0 (0.0%) | 0 (0.0%) |
| College or Associate's Degree | 0 (0.0%) | 0 (0.0%) |
| Bachelor's Degree | 0 (0.0%) | 0 (0.0%) |
| Graduate Degree | 0 (0.0%) | 0 (0.0%) |
| Total | 0 (0.0%) | 0 (0.0%) |
Employment Characteristics in Hunter
Employment by Class of Employer in Hunter
Among the 87 employed individuals in Hunter, private company employees (60 | 69.0%), self-employed (not incorporated) (25 | 28.7%), and local government employees (2 | 2.3%) make up the most common classes of employment.
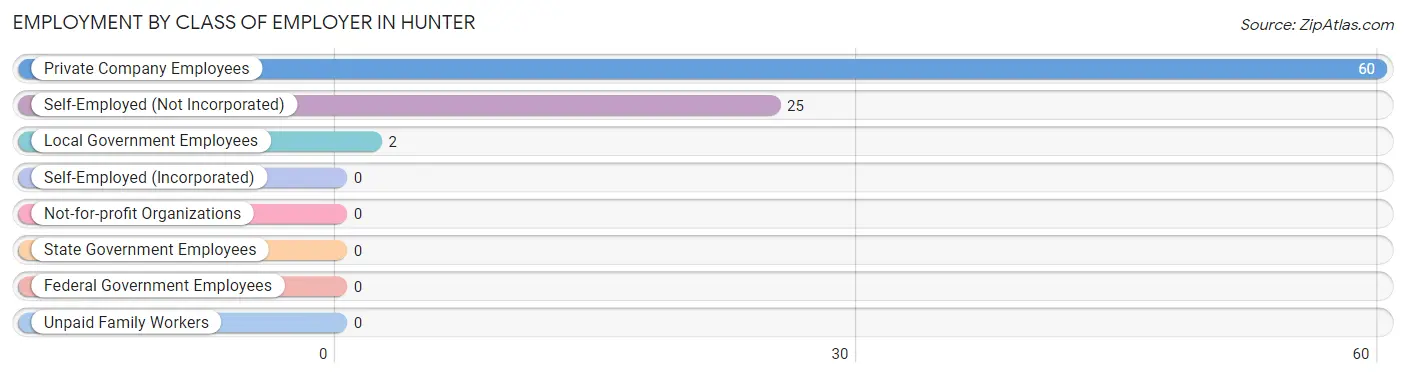
| Employer Class | # Employees | % Employees |
| Private Company Employees | 60 | 69.0% |
| Self-Employed (Incorporated) | 0 | 0.0% |
| Self-Employed (Not Incorporated) | 25 | 28.7% |
| Not-for-profit Organizations | 0 | 0.0% |
| Local Government Employees | 2 | 2.3% |
| State Government Employees | 0 | 0.0% |
| Federal Government Employees | 0 | 0.0% |
| Unpaid Family Workers | 0 | 0.0% |
| Total | 87 | 100.0% |
Employment Status by Age in Hunter
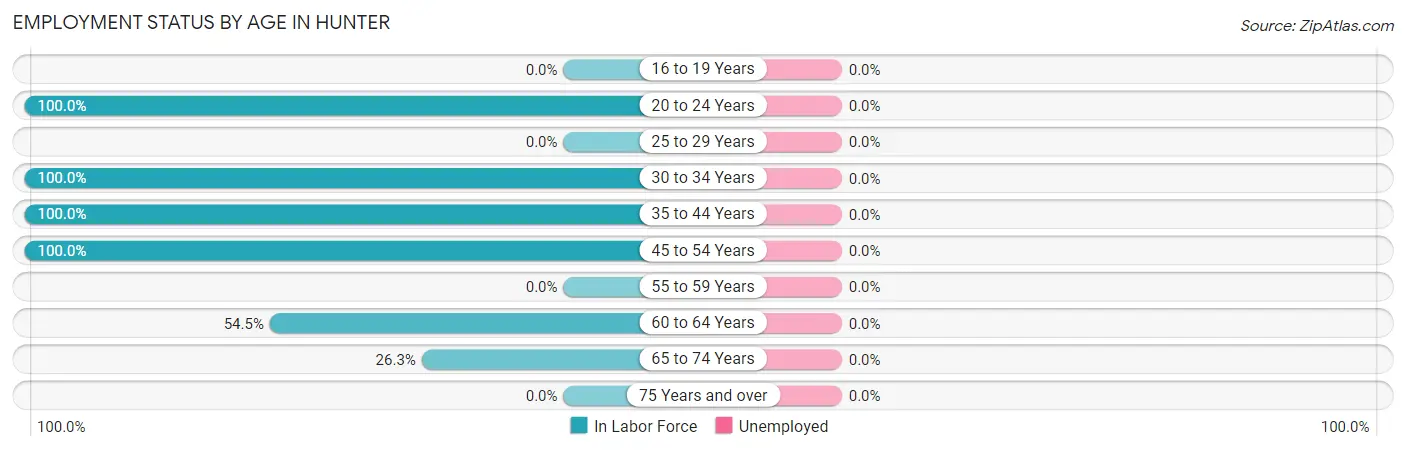
| Age Bracket | In Labor Force | Unemployed |
| 16 to 19 Years | 0 (0.0%) | 0 (0.0%) |
| 20 to 24 Years | 15 (100.0%) | 0 (0.0%) |
| 25 to 29 Years | 0 (0.0%) | 0 (0.0%) |
| 30 to 34 Years | 18 (100.0%) | 0 (0.0%) |
| 35 to 44 Years | 23 (100.0%) | 0 (0.0%) |
| 45 to 54 Years | 20 (100.0%) | 0 (0.0%) |
| 55 to 59 Years | 0 (0.0%) | 0 (0.0%) |
| 60 to 64 Years | 6 (54.5%) | 0 (0.0%) |
| 65 to 74 Years | 5 (26.3%) | 0 (0.0%) |
| 75 Years and over | 0 (0.0%) | 0 (0.0%) |
| Total | 87 (75.7%) | 0 (0.0%) |
Employment Status by Educational Attainment in Hunter
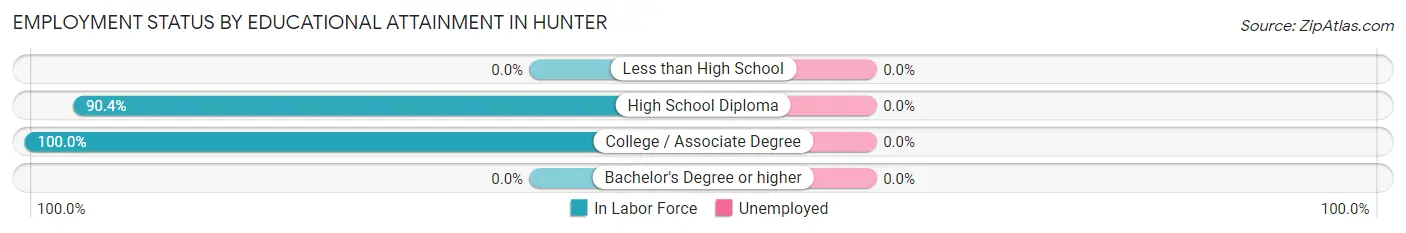
| Educational Attainment | In Labor Force | Unemployed |
| Less than High School | 0 (0.0%) | 0 (0.0%) |
| High School Diploma | 47 (90.4%) | 0 (0.0%) |
| College / Associate Degree | 20 (100.0%) | 0 (0.0%) |
| Bachelor's Degree or higher | 0 (0.0%) | 0 (0.0%) |
| Total | 67 (93.1%) | 0 (0.0%) |
Employment Occupations by Sex in Hunter
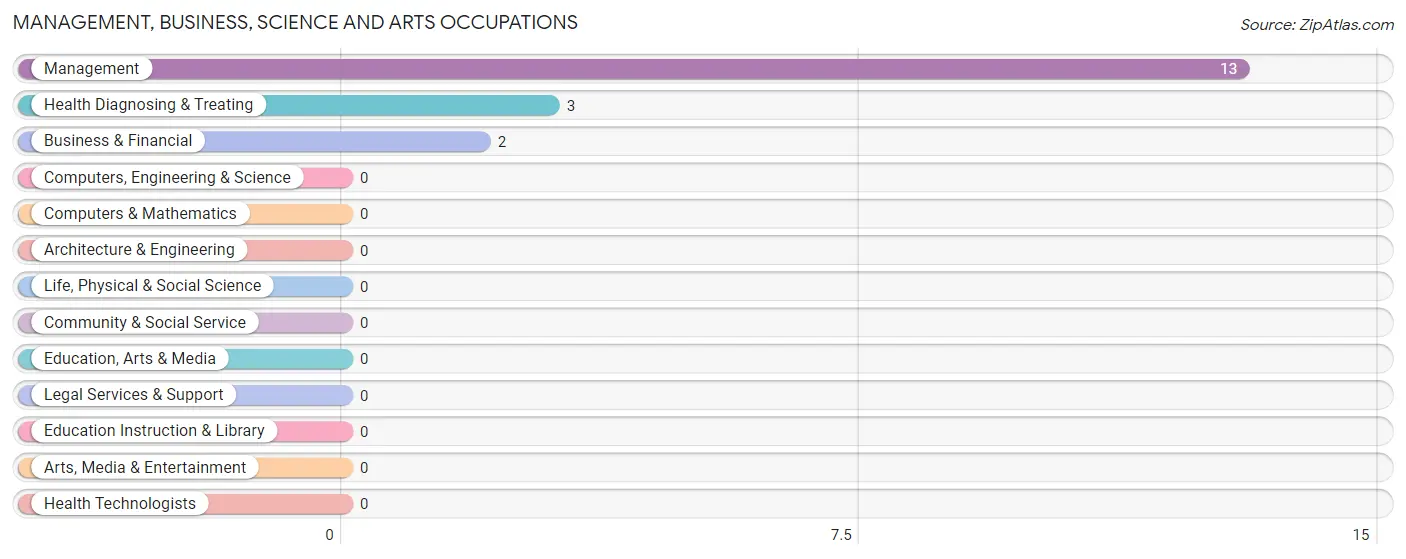
Management, Business, Science and Arts Occupations
The most common Management, Business, Science and Arts occupations in Hunter are Management (13 | 14.9%), Health Diagnosing & Treating (3 | 3.5%), and Business & Financial (2 | 2.3%).
Management, Business, Science and Arts Occupations by Sex
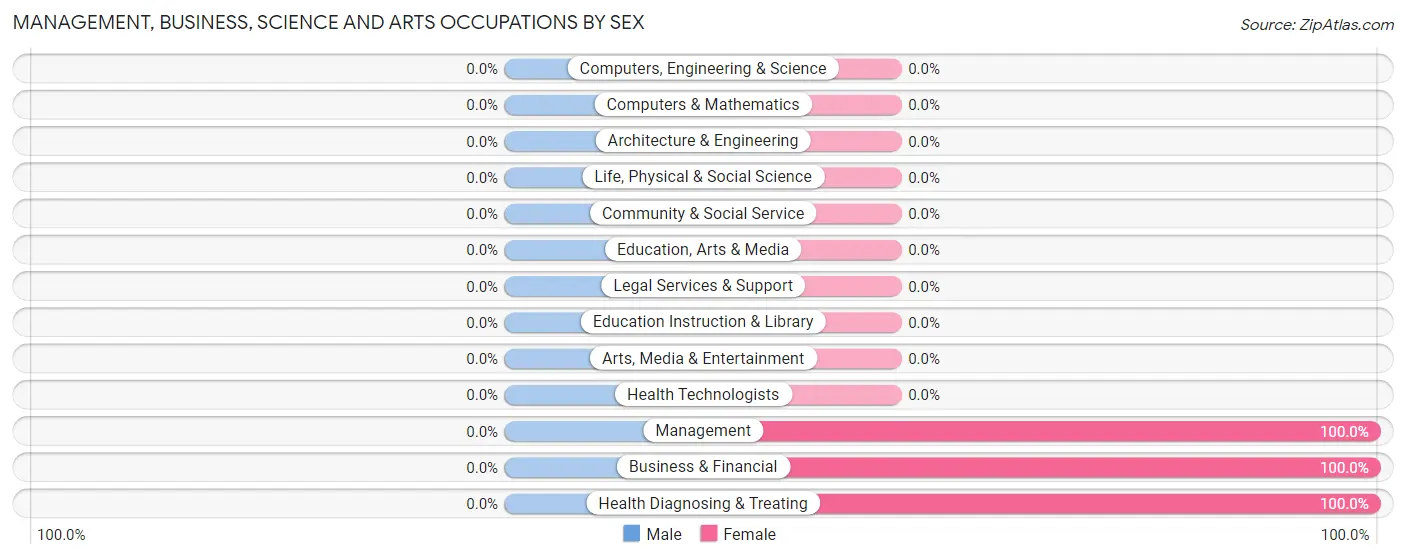
| Occupation | Male | Female |
| Management | 0 (0.0%) | 13 (100.0%) |
| Business & Financial | 0 (0.0%) | 2 (100.0%) |
| Computers, Engineering & Science | 0 (0.0%) | 0 (0.0%) |
| Computers & Mathematics | 0 (0.0%) | 0 (0.0%) |
| Architecture & Engineering | 0 (0.0%) | 0 (0.0%) |
| Life, Physical & Social Science | 0 (0.0%) | 0 (0.0%) |
| Community & Social Service | 0 (0.0%) | 0 (0.0%) |
| Education, Arts & Media | 0 (0.0%) | 0 (0.0%) |
| Legal Services & Support | 0 (0.0%) | 0 (0.0%) |
| Education Instruction & Library | 0 (0.0%) | 0 (0.0%) |
| Arts, Media & Entertainment | 0 (0.0%) | 0 (0.0%) |
| Health Diagnosing & Treating | 0 (0.0%) | 3 (100.0%) |
| Health Technologists | 0 (0.0%) | 0 (0.0%) |
| Total (Category) | 0 (0.0%) | 18 (100.0%) |
| Total (Overall) | 45 (51.7%) | 42 (48.3%) |
Services Occupations
The most common Services occupations in Hunter are , and Cleaning & Maintenance (8 | 9.2%).
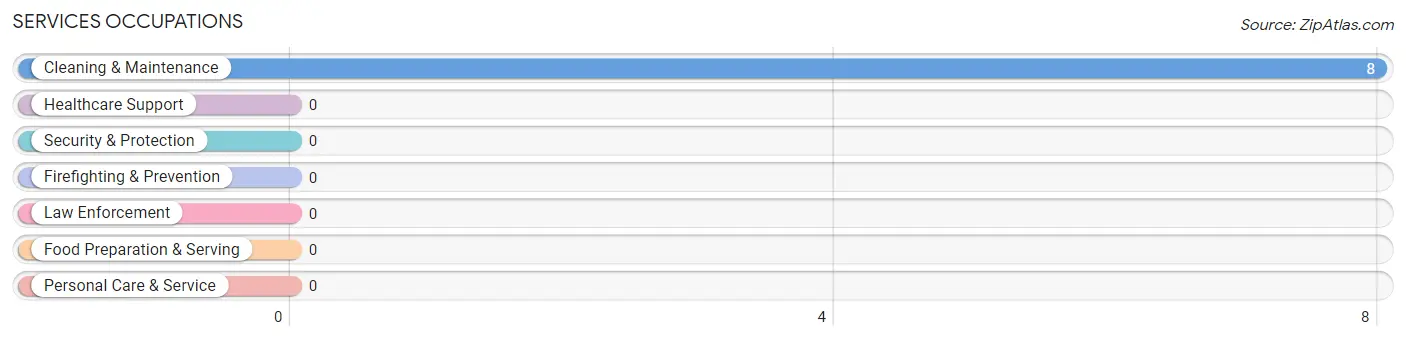
Services Occupations by Sex
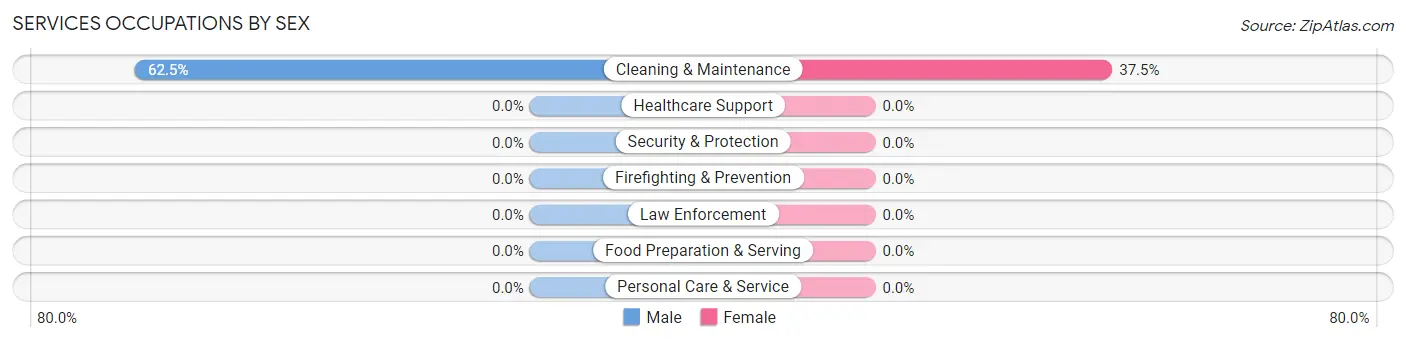
| Occupation | Male | Female |
| Healthcare Support | 0 (0.0%) | 0 (0.0%) |
| Security & Protection | 0 (0.0%) | 0 (0.0%) |
| Firefighting & Prevention | 0 (0.0%) | 0 (0.0%) |
| Law Enforcement | 0 (0.0%) | 0 (0.0%) |
| Food Preparation & Serving | 0 (0.0%) | 0 (0.0%) |
| Cleaning & Maintenance | 5 (62.5%) | 3 (37.5%) |
| Personal Care & Service | 0 (0.0%) | 0 (0.0%) |
| Total (Category) | 5 (62.5%) | 3 (37.5%) |
| Total (Overall) | 45 (51.7%) | 42 (48.3%) |
Sales and Office Occupations
The most common Sales and Office occupations in Hunter are Office & Administration (21 | 24.1%), and Sales & Related (18 | 20.7%).
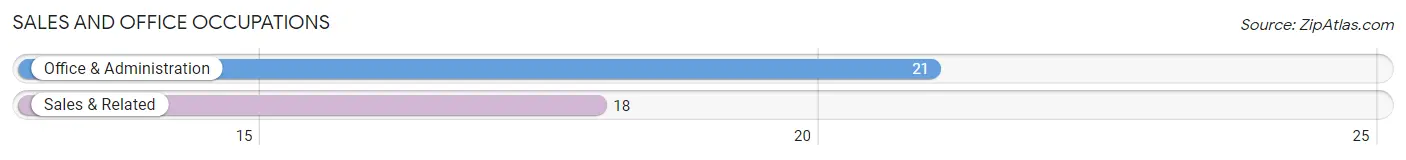
Sales and Office Occupations by Sex
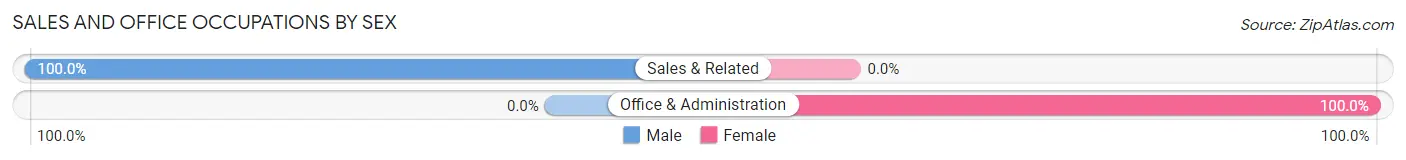
| Occupation | Male | Female |
| Sales & Related | 18 (100.0%) | 0 (0.0%) |
| Office & Administration | 0 (0.0%) | 21 (100.0%) |
| Total (Category) | 18 (46.2%) | 21 (53.8%) |
| Total (Overall) | 45 (51.7%) | 42 (48.3%) |
Natural Resources, Construction and Maintenance Occupations
The most common Natural Resources, Construction and Maintenance occupations in Hunter are , and Farming, Fishing & Forestry (5 | 5.8%).
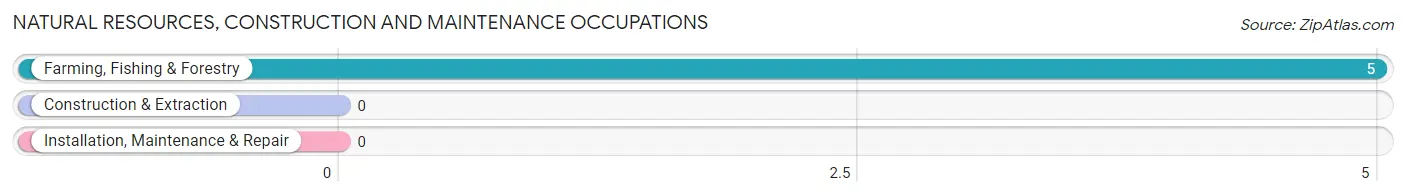
Natural Resources, Construction and Maintenance Occupations by Sex
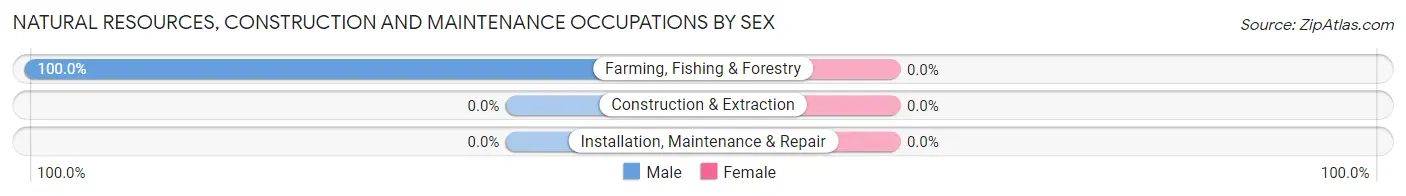
| Occupation | Male | Female |
| Farming, Fishing & Forestry | 5 (100.0%) | 0 (0.0%) |
| Construction & Extraction | 0 (0.0%) | 0 (0.0%) |
| Installation, Maintenance & Repair | 0 (0.0%) | 0 (0.0%) |
| Total (Category) | 5 (100.0%) | 0 (0.0%) |
| Total (Overall) | 45 (51.7%) | 42 (48.3%) |
Production, Transportation and Moving Occupations
The most common Production, Transportation and Moving occupations in Hunter are , and Transportation (17 | 19.5%).
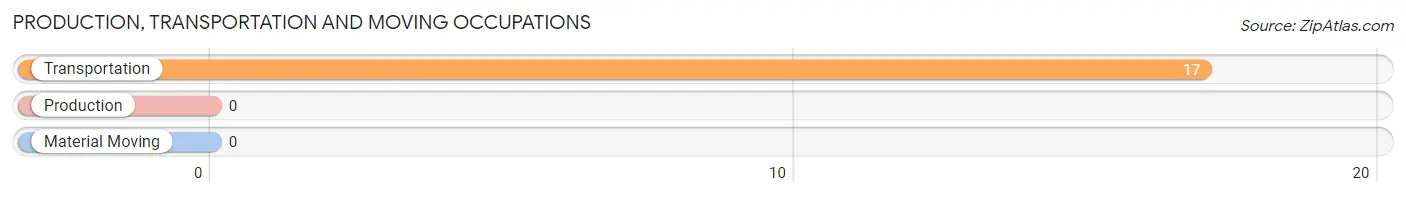
Production, Transportation and Moving Occupations by Sex
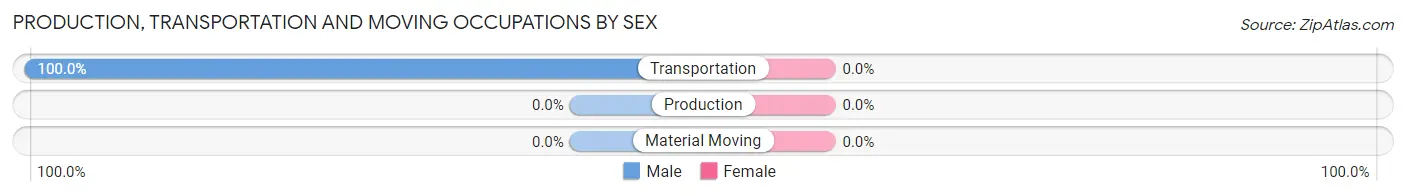
| Occupation | Male | Female |
| Production | 0 (0.0%) | 0 (0.0%) |
| Transportation | 17 (100.0%) | 0 (0.0%) |
| Material Moving | 0 (0.0%) | 0 (0.0%) |
| Total (Category) | 17 (100.0%) | 0 (0.0%) |
| Total (Overall) | 45 (51.7%) | 42 (48.3%) |
Employment Industries by Sex in Hunter
Employment Industries in Hunter
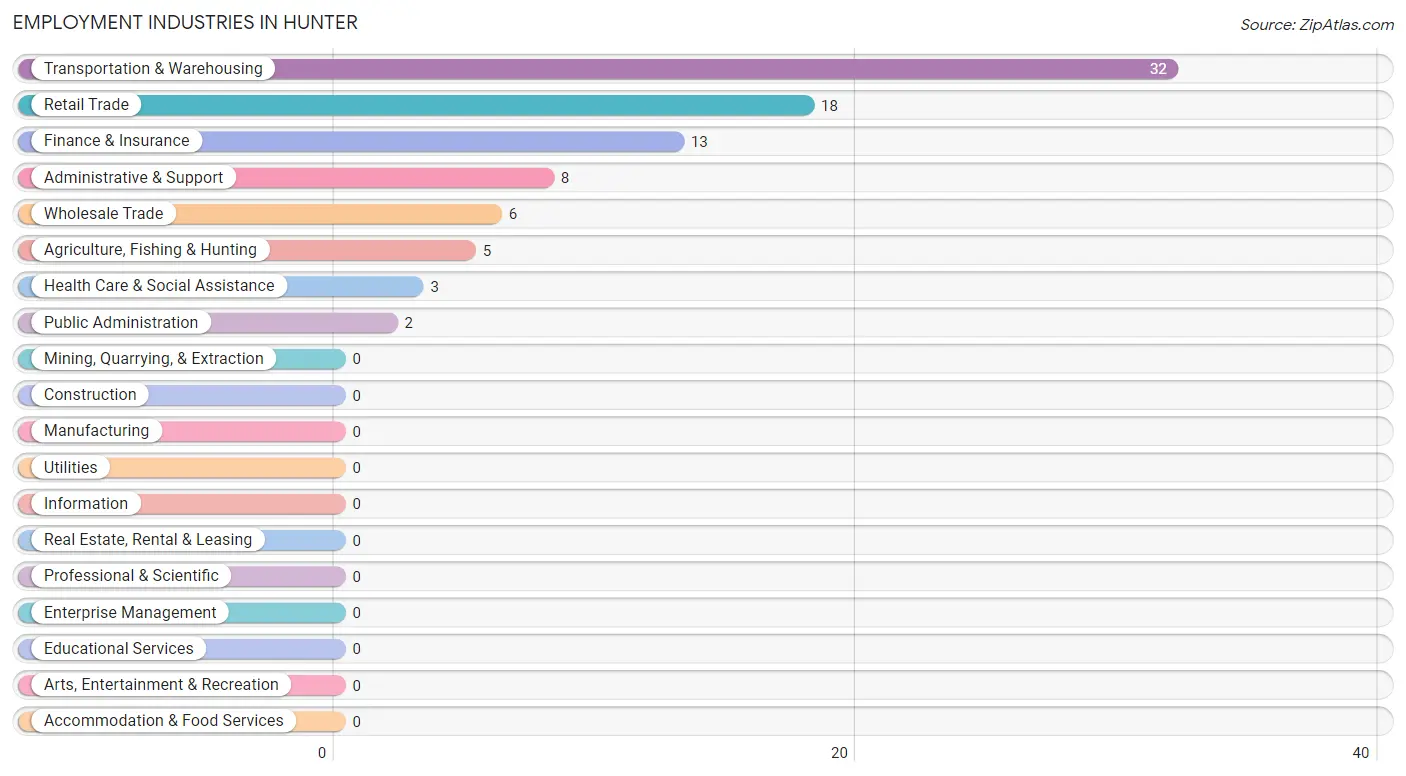
The major employment industries in Hunter include Transportation & Warehousing (32 | 36.8%), Retail Trade (18 | 20.7%), Finance & Insurance (13 | 14.9%), Administrative & Support (8 | 9.2%), and Wholesale Trade (6 | 6.9%).
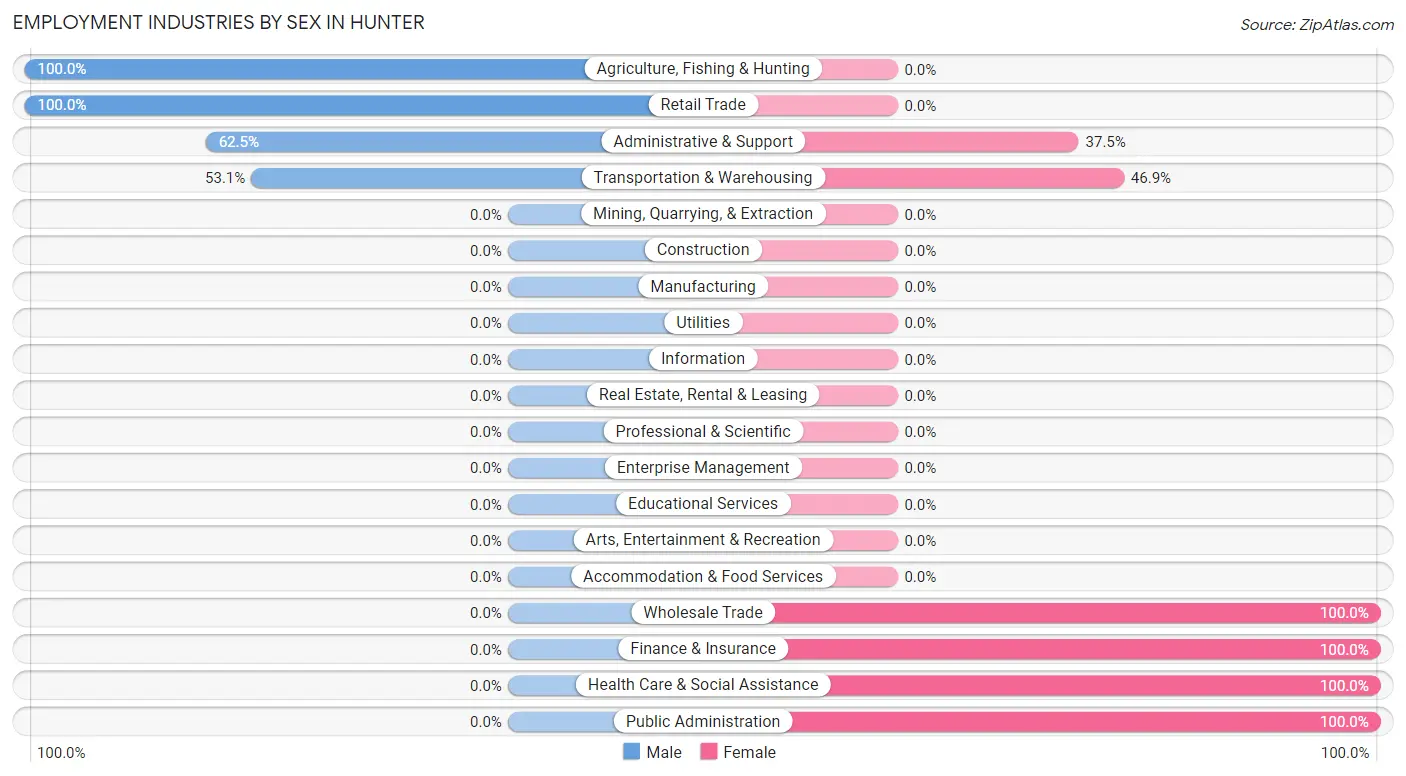
Employment Industries by Sex in Hunter
The Hunter industries that see more men than women are Agriculture, Fishing & Hunting (100.0%), Retail Trade (100.0%), and Administrative & Support (62.5%), whereas the industries that tend to have a higher number of women are Wholesale Trade (100.0%), Finance & Insurance (100.0%), and Health Care & Social Assistance (100.0%).
| Industry | Male | Female |
| Agriculture, Fishing & Hunting | 5 (100.0%) | 0 (0.0%) |
| Mining, Quarrying, & Extraction | 0 (0.0%) | 0 (0.0%) |
| Construction | 0 (0.0%) | 0 (0.0%) |
| Manufacturing | 0 (0.0%) | 0 (0.0%) |
| Wholesale Trade | 0 (0.0%) | 6 (100.0%) |
| Retail Trade | 18 (100.0%) | 0 (0.0%) |
| Transportation & Warehousing | 17 (53.1%) | 15 (46.9%) |
| Utilities | 0 (0.0%) | 0 (0.0%) |
| Information | 0 (0.0%) | 0 (0.0%) |
| Finance & Insurance | 0 (0.0%) | 13 (100.0%) |
| Real Estate, Rental & Leasing | 0 (0.0%) | 0 (0.0%) |
| Professional & Scientific | 0 (0.0%) | 0 (0.0%) |
| Enterprise Management | 0 (0.0%) | 0 (0.0%) |
| Administrative & Support | 5 (62.5%) | 3 (37.5%) |
| Educational Services | 0 (0.0%) | 0 (0.0%) |
| Health Care & Social Assistance | 0 (0.0%) | 3 (100.0%) |
| Arts, Entertainment & Recreation | 0 (0.0%) | 0 (0.0%) |
| Accommodation & Food Services | 0 (0.0%) | 0 (0.0%) |
| Public Administration | 0 (0.0%) | 2 (100.0%) |
| Total | 45 (51.7%) | 42 (48.3%) |
Education in Hunter
School Enrollment in Hunter
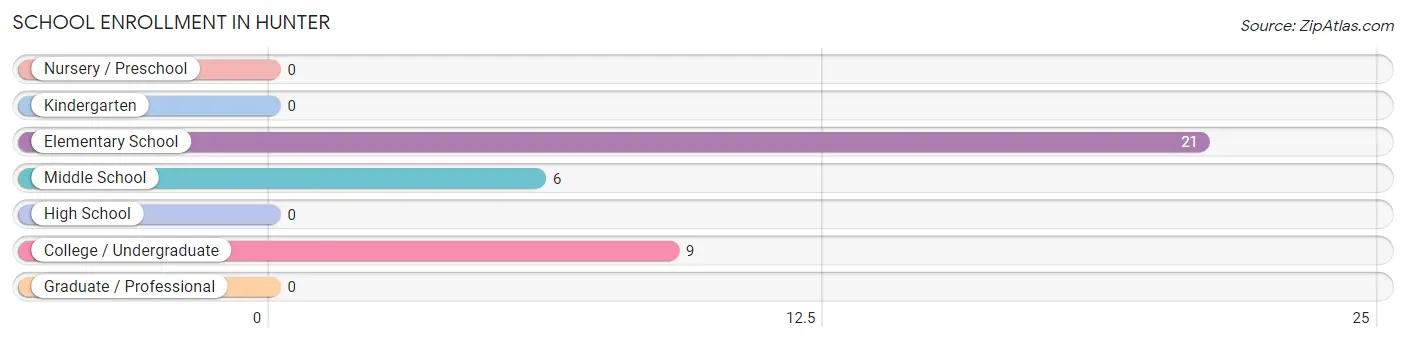
The most common levels of schooling among the 36 students in Hunter are elementary school (21 | 58.3%), college / undergraduate (9 | 25.0%), and middle school (6 | 16.7%).
| School Level | # Students | % Students |
| Nursery / Preschool | 0 | 0.0% |
| Kindergarten | 0 | 0.0% |
| Elementary School | 21 | 58.3% |
| Middle School | 6 | 16.7% |
| High School | 0 | 0.0% |
| College / Undergraduate | 9 | 25.0% |
| Graduate / Professional | 0 | 0.0% |
| Total | 36 | 100.0% |
School Enrollment by Age by Funding Source in Hunter
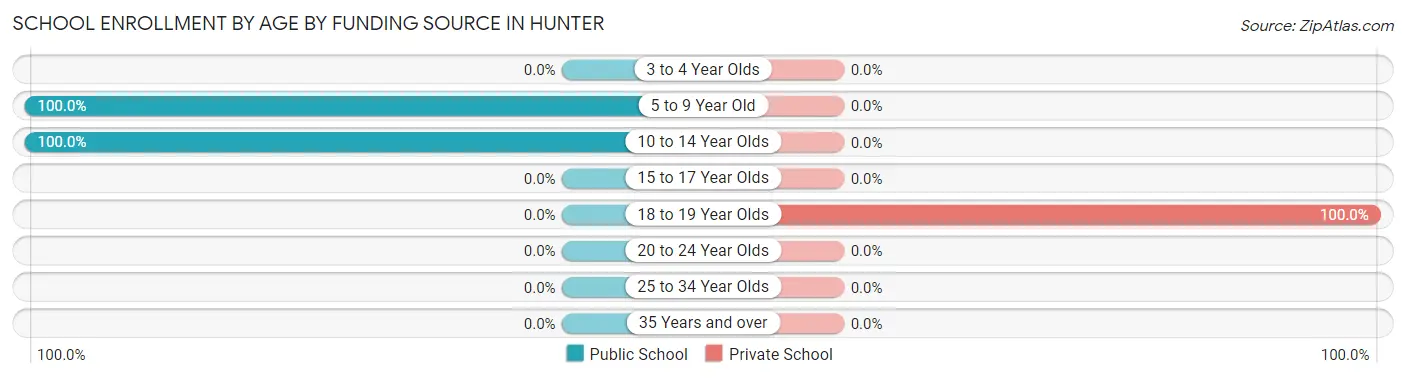
Out of a total of 36 students who are enrolled in schools in Hunter, 9 (25.0%) attend a private institution, while the remaining 27 (75.0%) are enrolled in public schools. The age group of 18 to 19 year olds has the highest likelihood of being enrolled in private schools, with 9 (100.0% in the age bracket) enrolled. Conversely, the age group of 5 to 9 year old has the lowest likelihood of being enrolled in a private school, with 8 (100.0% in the age bracket) attending a public institution.
| Age Bracket | Public School | Private School |
| 3 to 4 Year Olds | 0 (0.0%) | 0 (0.0%) |
| 5 to 9 Year Old | 8 (100.0%) | 0 (0.0%) |
| 10 to 14 Year Olds | 19 (100.0%) | 0 (0.0%) |
| 15 to 17 Year Olds | 0 (0.0%) | 0 (0.0%) |
| 18 to 19 Year Olds | 0 (0.0%) | 9 (100.0%) |
| 20 to 24 Year Olds | 0 (0.0%) | 0 (0.0%) |
| 25 to 34 Year Olds | 0 (0.0%) | 0 (0.0%) |
| 35 Years and over | 0 (0.0%) | 0 (0.0%) |
| Total | 27 (75.0%) | 9 (25.0%) |
Educational Attainment by Field of Study in Hunter
| Field of Study | # Graduates | % Graduates |
| Computers & Mathematics | 0 | 0.0% |
| Bio, Nature & Agricultural | 0 | 0.0% |
| Physical & Health Sciences | 0 | 0.0% |
| Psychology | 0 | 0.0% |
| Social Sciences | 0 | 0.0% |
| Engineering | 0 | 0.0% |
| Multidisciplinary Studies | 0 | 0.0% |
| Science & Technology | 0 | 0.0% |
| Business | 0 | 0.0% |
| Education | 0 | 0.0% |
| Literature & Languages | 0 | 0.0% |
| Liberal Arts & History | 0 | 0.0% |
| Visual & Performing Arts | 0 | 0.0% |
| Communications | 0 | 0.0% |
| Arts & Humanities | 0 | 0.0% |
| Total | 0 | 0.0% |
Transportation & Commute in Hunter
Vehicle Availability by Sex in Hunter
The most prevalent vehicle ownership categories in Hunter are males with 4 vehicles (18, accounting for 40.0%) and females with 4 vehicles (28, making up 42.9%).
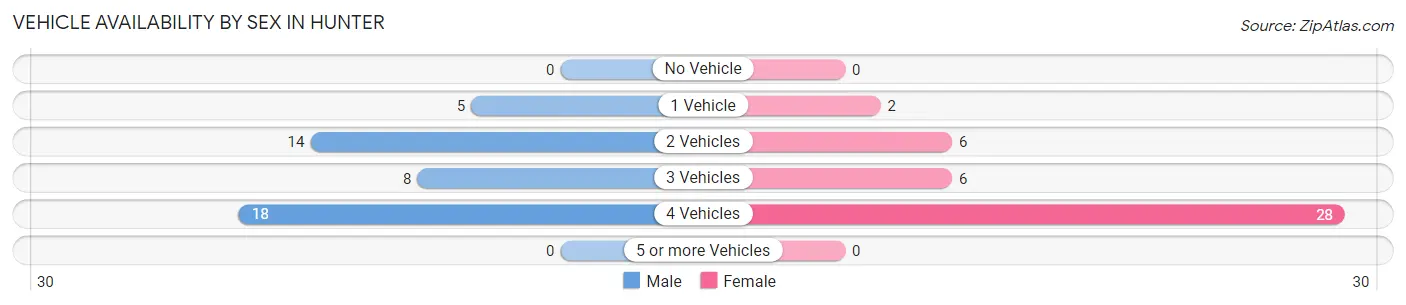
| Vehicles Available | Male | Female |
| No Vehicle | 0 (0.0%) | 0 (0.0%) |
| 1 Vehicle | 5 (11.1%) | 2 (4.8%) |
| 2 Vehicles | 14 (31.1%) | 6 (14.3%) |
| 3 Vehicles | 8 (17.8%) | 6 (14.3%) |
| 4 Vehicles | 18 (40.0%) | 28 (66.7%) |
| 5 or more Vehicles | 0 (0.0%) | 0 (0.0%) |
| Total | 45 (100.0%) | 42 (100.0%) |
Commute Time in Hunter
The most frequently occuring commute durations in Hunter are 30 to 34 minutes (31 commuters, 39.7%), 10 to 14 minutes (24 commuters, 30.8%), and 15 to 19 minutes (13 commuters, 16.7%).
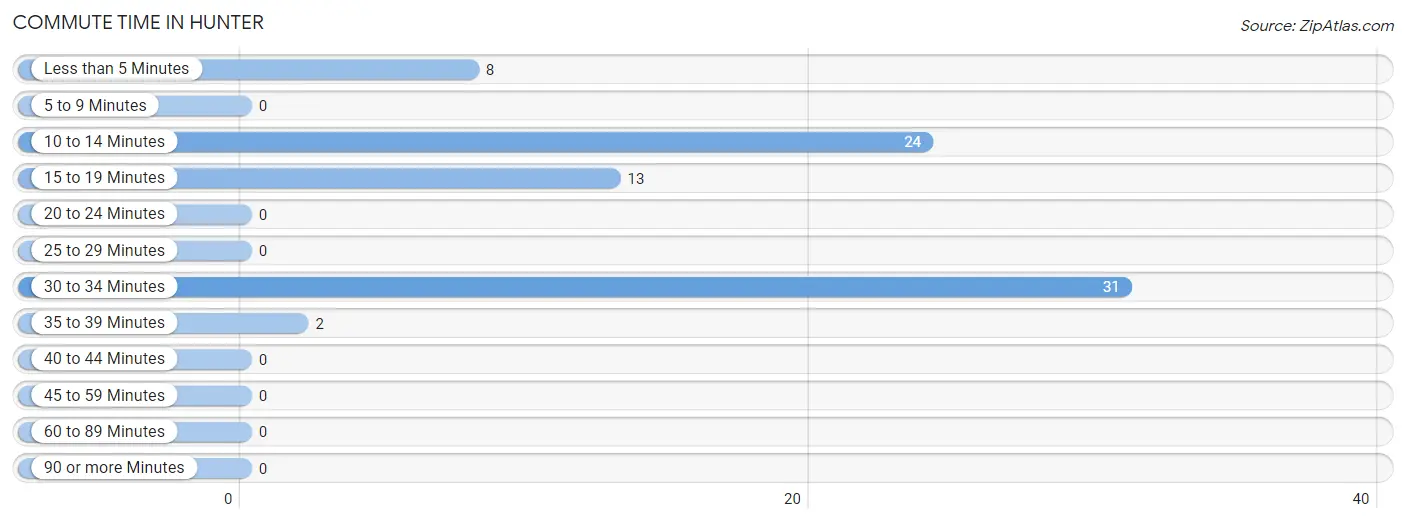
| Commute Time | # Commuters | % Commuters |
| Less than 5 Minutes | 8 | 10.3% |
| 5 to 9 Minutes | 0 | 0.0% |
| 10 to 14 Minutes | 24 | 30.8% |
| 15 to 19 Minutes | 13 | 16.7% |
| 20 to 24 Minutes | 0 | 0.0% |
| 25 to 29 Minutes | 0 | 0.0% |
| 30 to 34 Minutes | 31 | 39.7% |
| 35 to 39 Minutes | 2 | 2.6% |
| 40 to 44 Minutes | 0 | 0.0% |
| 45 to 59 Minutes | 0 | 0.0% |
| 60 to 89 Minutes | 0 | 0.0% |
| 90 or more Minutes | 0 | 0.0% |
Commute Time by Sex in Hunter
The most common commute times in Hunter are 30 to 34 minutes (18 commuters, 50.0%) for males and 10 to 14 minutes (24 commuters, 57.1%) for females.
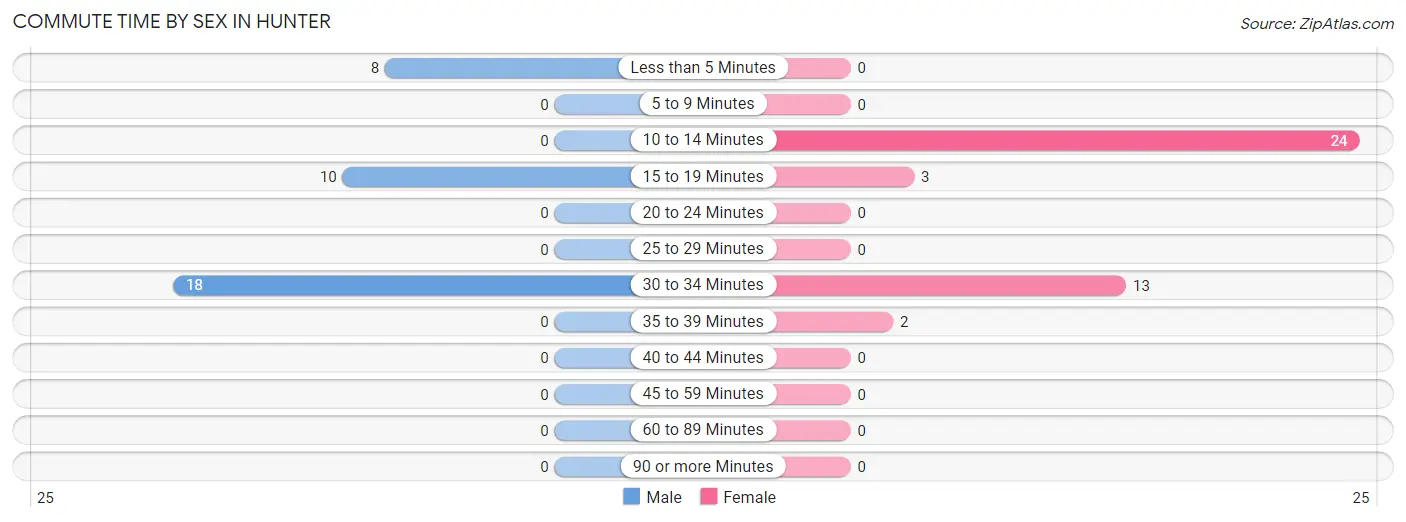
| Commute Time | Male | Female |
| Less than 5 Minutes | 8 (22.2%) | 0 (0.0%) |
| 5 to 9 Minutes | 0 (0.0%) | 0 (0.0%) |
| 10 to 14 Minutes | 0 (0.0%) | 24 (57.1%) |
| 15 to 19 Minutes | 10 (27.8%) | 3 (7.1%) |
| 20 to 24 Minutes | 0 (0.0%) | 0 (0.0%) |
| 25 to 29 Minutes | 0 (0.0%) | 0 (0.0%) |
| 30 to 34 Minutes | 18 (50.0%) | 13 (30.9%) |
| 35 to 39 Minutes | 0 (0.0%) | 2 (4.8%) |
| 40 to 44 Minutes | 0 (0.0%) | 0 (0.0%) |
| 45 to 59 Minutes | 0 (0.0%) | 0 (0.0%) |
| 60 to 89 Minutes | 0 (0.0%) | 0 (0.0%) |
| 90 or more Minutes | 0 (0.0%) | 0 (0.0%) |
Time of Departure to Work by Sex in Hunter
The most frequent times of departure to work in Hunter are 6:00 AM to 6:29 AM (26, 72.2%) for males and 7:00 AM to 7:29 AM (15, 35.7%) for females.
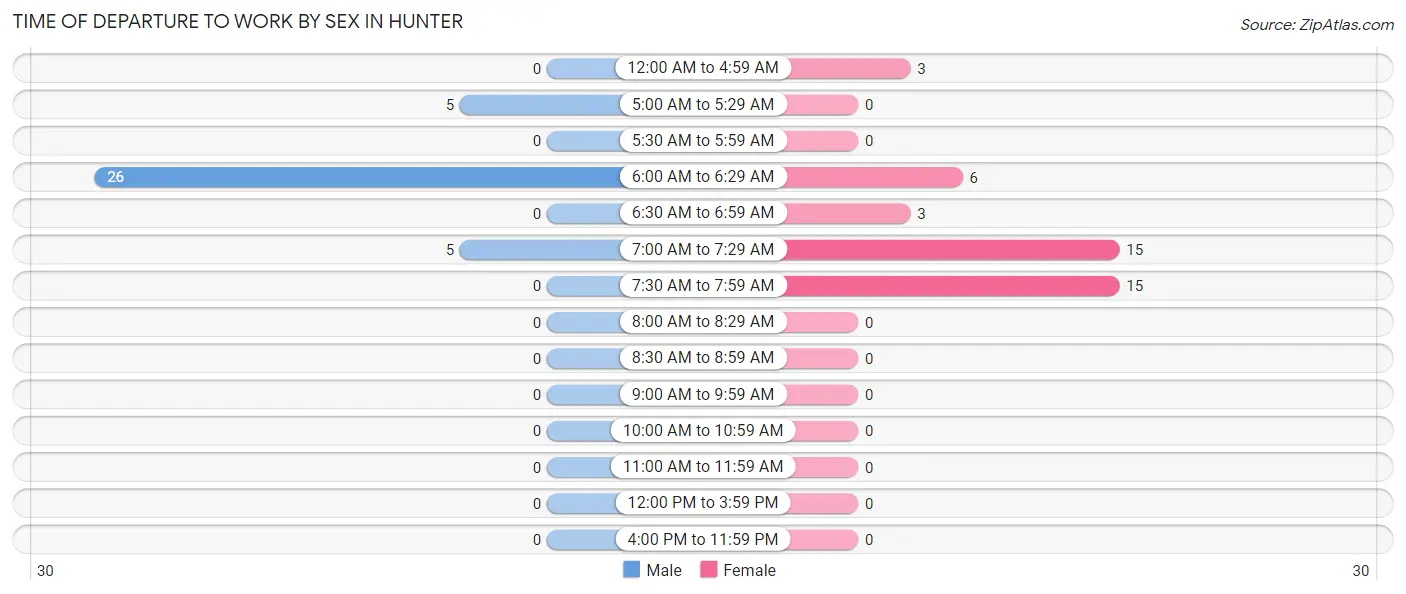
| Time of Departure | Male | Female |
| 12:00 AM to 4:59 AM | 0 (0.0%) | 3 (7.1%) |
| 5:00 AM to 5:29 AM | 5 (13.9%) | 0 (0.0%) |
| 5:30 AM to 5:59 AM | 0 (0.0%) | 0 (0.0%) |
| 6:00 AM to 6:29 AM | 26 (72.2%) | 6 (14.3%) |
| 6:30 AM to 6:59 AM | 0 (0.0%) | 3 (7.1%) |
| 7:00 AM to 7:29 AM | 5 (13.9%) | 15 (35.7%) |
| 7:30 AM to 7:59 AM | 0 (0.0%) | 15 (35.7%) |
| 8:00 AM to 8:29 AM | 0 (0.0%) | 0 (0.0%) |
| 8:30 AM to 8:59 AM | 0 (0.0%) | 0 (0.0%) |
| 9:00 AM to 9:59 AM | 0 (0.0%) | 0 (0.0%) |
| 10:00 AM to 10:59 AM | 0 (0.0%) | 0 (0.0%) |
| 11:00 AM to 11:59 AM | 0 (0.0%) | 0 (0.0%) |
| 12:00 PM to 3:59 PM | 0 (0.0%) | 0 (0.0%) |
| 4:00 PM to 11:59 PM | 0 (0.0%) | 0 (0.0%) |
| Total | 36 (100.0%) | 42 (100.0%) |
Housing Occupancy in Hunter
Occupancy by Ownership in Hunter
Of the total 44 dwellings in Hunter, owner-occupied units account for 40 (90.9%), while renter-occupied units make up 4 (9.1%).
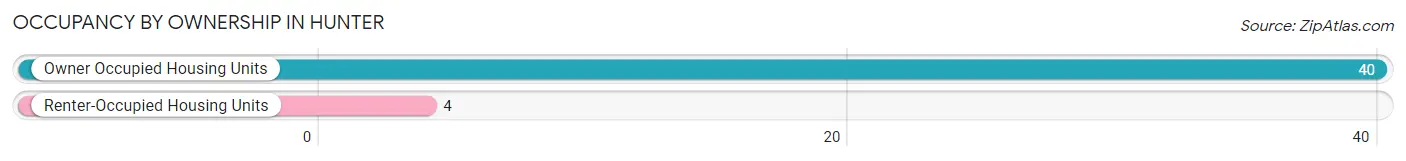
| Occupancy | # Housing Units | % Housing Units |
| Owner Occupied Housing Units | 40 | 90.9% |
| Renter-Occupied Housing Units | 4 | 9.1% |
| Total Occupied Housing Units | 44 | 100.0% |
Occupancy by Household Size in Hunter
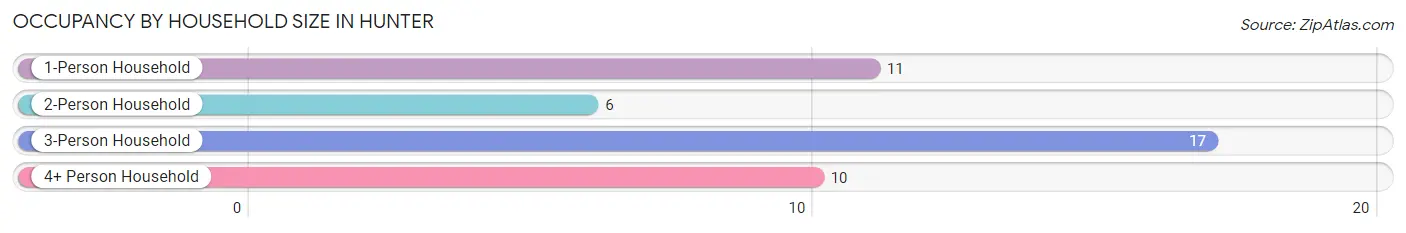
| Household Size | # Housing Units | % Housing Units |
| 1-Person Household | 11 | 25.0% |
| 2-Person Household | 6 | 13.6% |
| 3-Person Household | 17 | 38.6% |
| 4+ Person Household | 10 | 22.7% |
| Total Housing Units | 44 | 100.0% |
Occupancy by Ownership by Household Size in Hunter
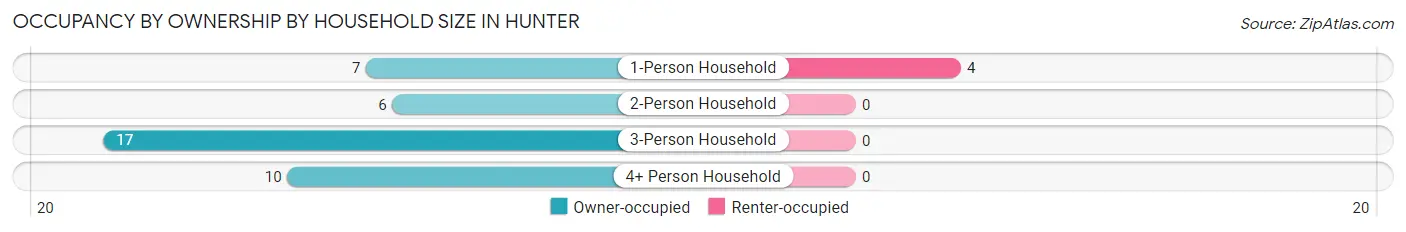
| Household Size | Owner-occupied | Renter-occupied |
| 1-Person Household | 7 (63.6%) | 4 (36.4%) |
| 2-Person Household | 6 (100.0%) | 0 (0.0%) |
| 3-Person Household | 17 (100.0%) | 0 (0.0%) |
| 4+ Person Household | 10 (100.0%) | 0 (0.0%) |
| Total Housing Units | 40 (90.9%) | 4 (9.1%) |
Occupancy by Educational Attainment in Hunter
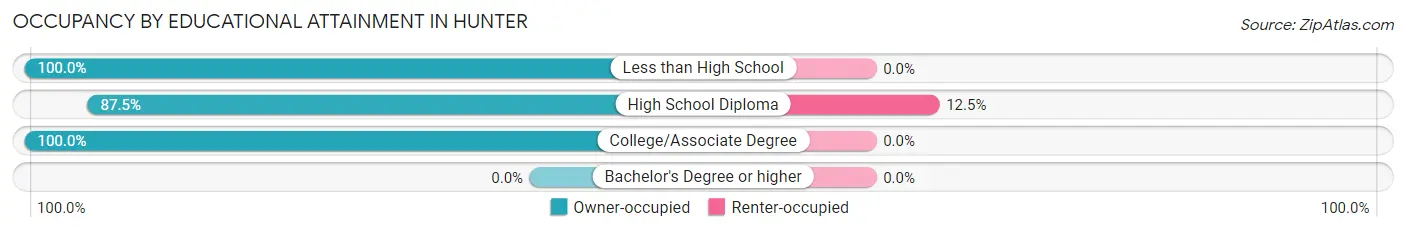
| Household Size | Owner-occupied | Renter-occupied |
| Less than High School | 10 (100.0%) | 0 (0.0%) |
| High School Diploma | 28 (87.5%) | 4 (12.5%) |
| College/Associate Degree | 2 (100.0%) | 0 (0.0%) |
| Bachelor's Degree or higher | 0 (0.0%) | 0 (0.0%) |
Occupancy by Age of Householder in Hunter
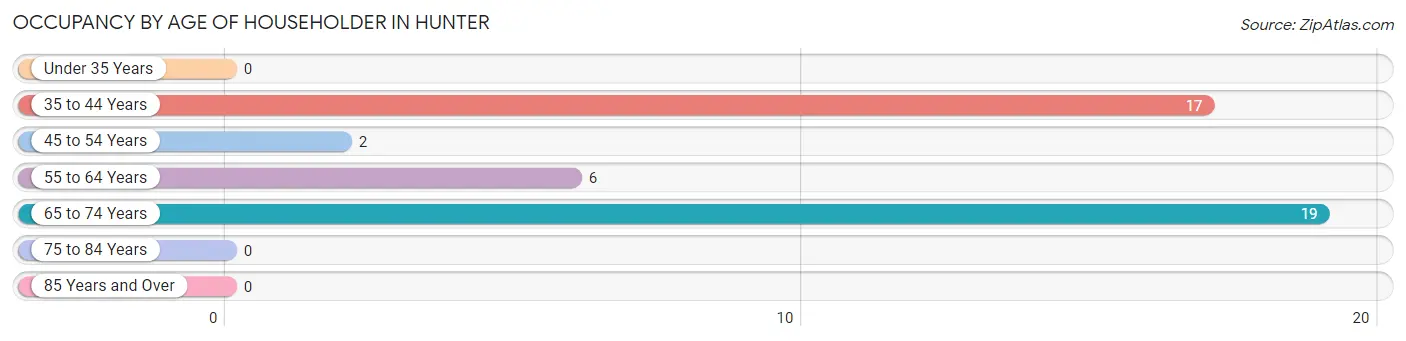
| Age Bracket | # Households | % Households |
| Under 35 Years | 0 | 0.0% |
| 35 to 44 Years | 17 | 38.6% |
| 45 to 54 Years | 2 | 4.5% |
| 55 to 64 Years | 6 | 13.6% |
| 65 to 74 Years | 19 | 43.2% |
| 75 to 84 Years | 0 | 0.0% |
| 85 Years and Over | 0 | 0.0% |
| Total | 44 | 100.0% |
Housing Finances in Hunter
Median Income by Occupancy in Hunter
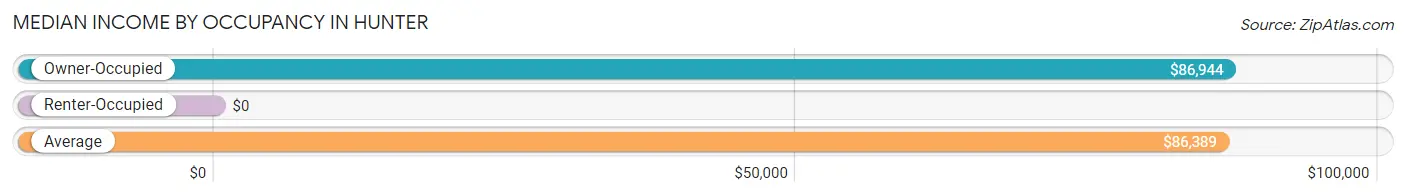
| Occupancy Type | # Households | Median Income |
| Owner-Occupied | 40 (90.9%) | $86,944 |
| Renter-Occupied | 4 (9.1%) | $0 |
| Average | 44 (100.0%) | $86,389 |
Occupancy by Householder Income Bracket in Hunter
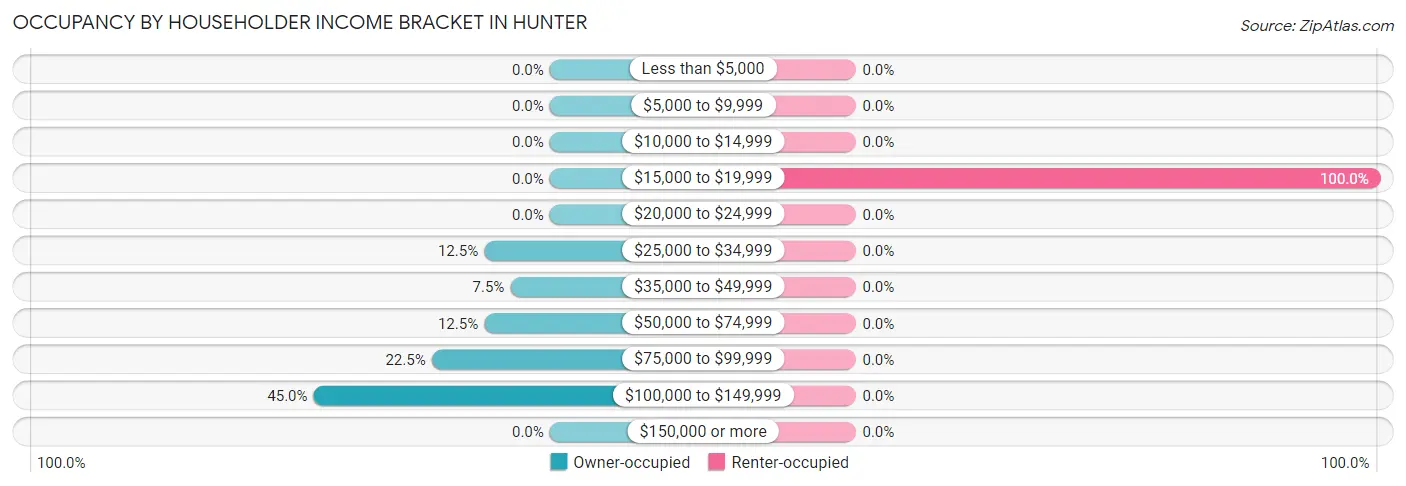
| Income Bracket | Owner-occupied | Renter-occupied |
| Less than $5,000 | 0 (0.0%) | 0 (0.0%) |
| $5,000 to $9,999 | 0 (0.0%) | 0 (0.0%) |
| $10,000 to $14,999 | 0 (0.0%) | 0 (0.0%) |
| $15,000 to $19,999 | 0 (0.0%) | 4 (100.0%) |
| $20,000 to $24,999 | 0 (0.0%) | 0 (0.0%) |
| $25,000 to $34,999 | 5 (12.5%) | 0 (0.0%) |
| $35,000 to $49,999 | 3 (7.5%) | 0 (0.0%) |
| $50,000 to $74,999 | 5 (12.5%) | 0 (0.0%) |
| $75,000 to $99,999 | 9 (22.5%) | 0 (0.0%) |
| $100,000 to $149,999 | 18 (45.0%) | 0 (0.0%) |
| $150,000 or more | 0 (0.0%) | 0 (0.0%) |
| Total | 40 (100.0%) | 4 (100.0%) |
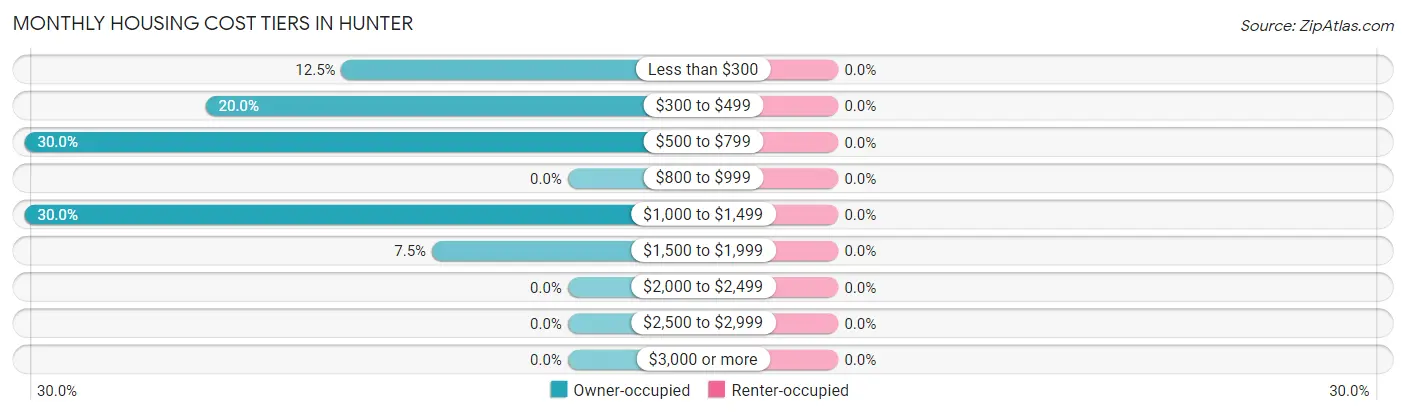
Monthly Housing Cost Tiers in Hunter
| Monthly Cost | Owner-occupied | Renter-occupied |
| Less than $300 | 5 (12.5%) | 0 (0.0%) |
| $300 to $499 | 8 (20.0%) | 0 (0.0%) |
| $500 to $799 | 12 (30.0%) | 0 (0.0%) |
| $800 to $999 | 0 (0.0%) | 0 (0.0%) |
| $1,000 to $1,499 | 12 (30.0%) | 0 (0.0%) |
| $1,500 to $1,999 | 3 (7.5%) | 0 (0.0%) |
| $2,000 to $2,499 | 0 (0.0%) | 0 (0.0%) |
| $2,500 to $2,999 | 0 (0.0%) | 0 (0.0%) |
| $3,000 or more | 0 (0.0%) | 0 (0.0%) |
| Total | 40 (100.0%) | 4 (100.0%) |
Physical Housing Characteristics in Hunter
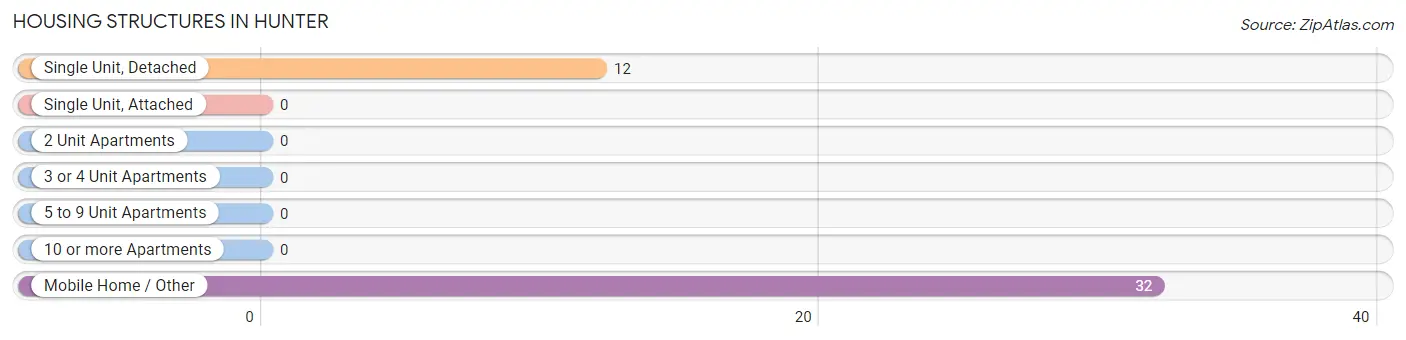
Housing Structures in Hunter
| Structure Type | # Housing Units | % Housing Units |
| Single Unit, Detached | 12 | 27.3% |
| Single Unit, Attached | 0 | 0.0% |
| 2 Unit Apartments | 0 | 0.0% |
| 3 or 4 Unit Apartments | 0 | 0.0% |
| 5 to 9 Unit Apartments | 0 | 0.0% |
| 10 or more Apartments | 0 | 0.0% |
| Mobile Home / Other | 32 | 72.7% |
| Total | 44 | 100.0% |
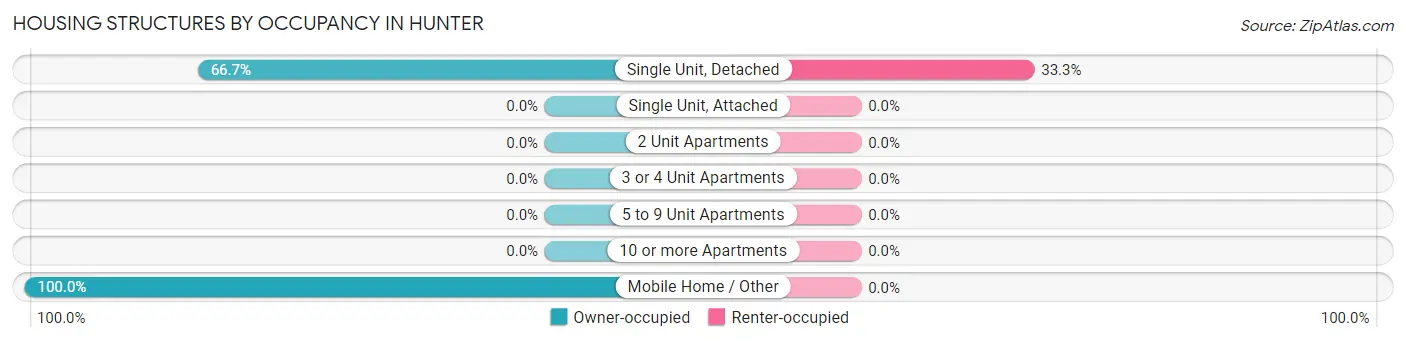
Housing Structures by Occupancy in Hunter
| Structure Type | Owner-occupied | Renter-occupied |
| Single Unit, Detached | 8 (66.7%) | 4 (33.3%) |
| Single Unit, Attached | 0 (0.0%) | 0 (0.0%) |
| 2 Unit Apartments | 0 (0.0%) | 0 (0.0%) |
| 3 or 4 Unit Apartments | 0 (0.0%) | 0 (0.0%) |
| 5 to 9 Unit Apartments | 0 (0.0%) | 0 (0.0%) |
| 10 or more Apartments | 0 (0.0%) | 0 (0.0%) |
| Mobile Home / Other | 32 (100.0%) | 0 (0.0%) |
| Total | 40 (90.9%) | 4 (9.1%) |
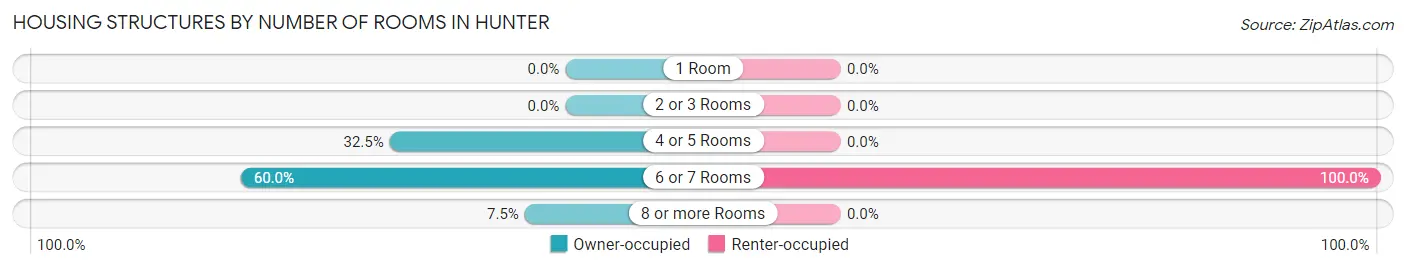
Housing Structures by Number of Rooms in Hunter
| Number of Rooms | Owner-occupied | Renter-occupied |
| 1 Room | 0 (0.0%) | 0 (0.0%) |
| 2 or 3 Rooms | 0 (0.0%) | 0 (0.0%) |
| 4 or 5 Rooms | 13 (32.5%) | 0 (0.0%) |
| 6 or 7 Rooms | 24 (60.0%) | 4 (100.0%) |
| 8 or more Rooms | 3 (7.5%) | 0 (0.0%) |
| Total | 40 (100.0%) | 4 (100.0%) |
Housing Structure by Heating Type in Hunter
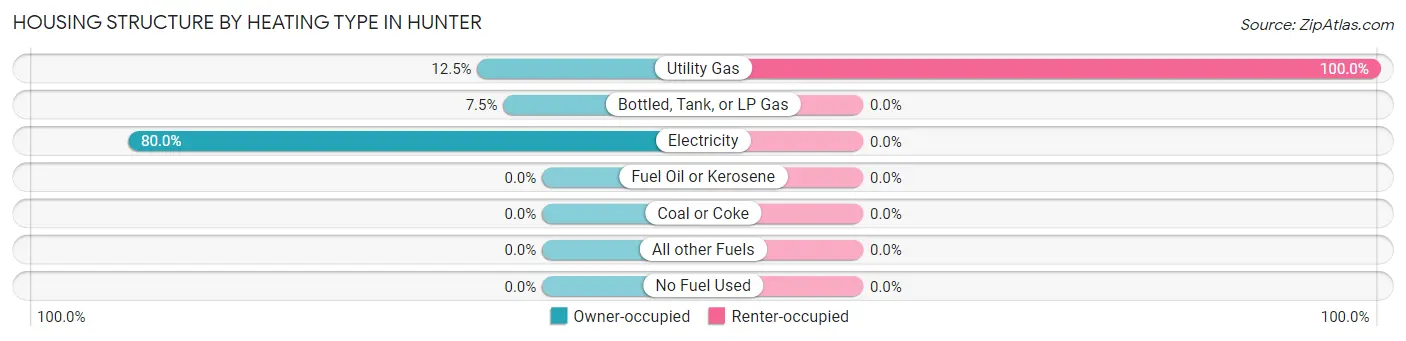
| Heating Type | Owner-occupied | Renter-occupied |
| Utility Gas | 5 (12.5%) | 4 (100.0%) |
| Bottled, Tank, or LP Gas | 3 (7.5%) | 0 (0.0%) |
| Electricity | 32 (80.0%) | 0 (0.0%) |
| Fuel Oil or Kerosene | 0 (0.0%) | 0 (0.0%) |
| Coal or Coke | 0 (0.0%) | 0 (0.0%) |
| All other Fuels | 0 (0.0%) | 0 (0.0%) |
| No Fuel Used | 0 (0.0%) | 0 (0.0%) |
| Total | 40 (100.0%) | 4 (100.0%) |
Household Vehicle Usage in Hunter
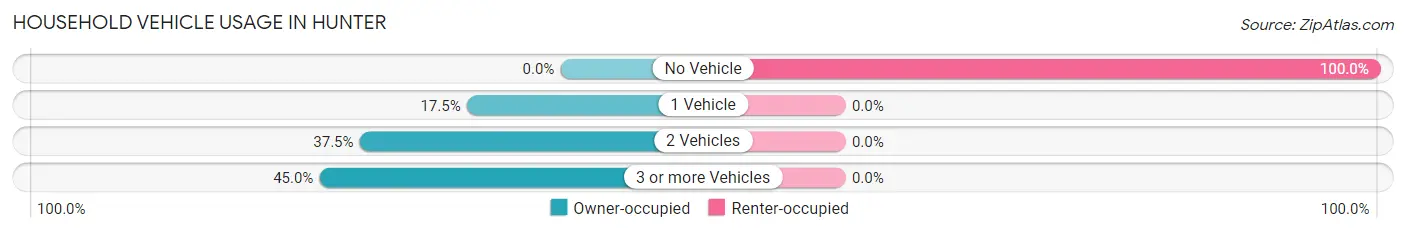
| Vehicles per Household | Owner-occupied | Renter-occupied |
| No Vehicle | 0 (0.0%) | 4 (100.0%) |
| 1 Vehicle | 7 (17.5%) | 0 (0.0%) |
| 2 Vehicles | 15 (37.5%) | 0 (0.0%) |
| 3 or more Vehicles | 18 (45.0%) | 0 (0.0%) |
| Total | 40 (100.0%) | 4 (100.0%) |
Real Estate & Mortgages in Hunter
Real Estate and Mortgage Overview in Hunter
| Characteristic | Without Mortgage | With Mortgage |
| Housing Units | 13 | 27 |
| Median Property Value | - | - |
| Median Household Income | - | - |
| Monthly Housing Costs | - | - |
| Real Estate Taxes | - | - |
Property Value by Mortgage Status in Hunter
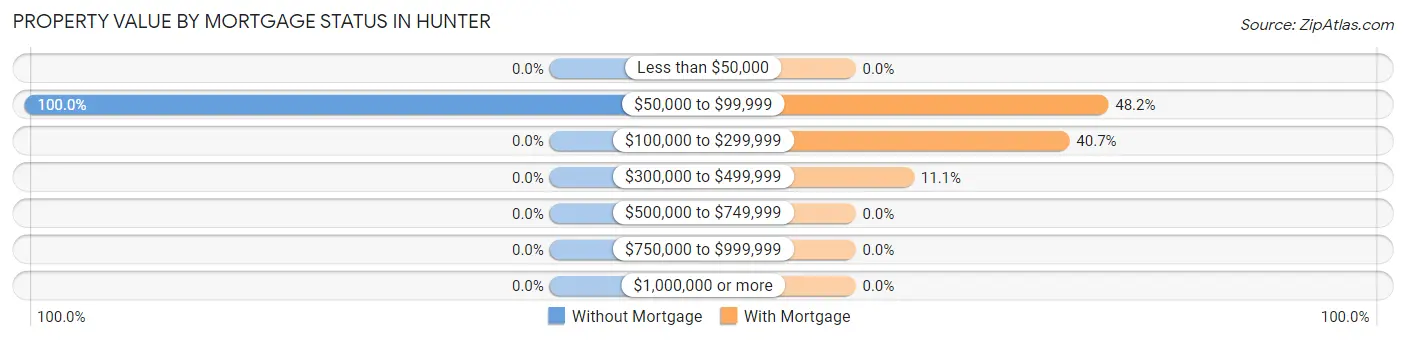
| Property Value | Without Mortgage | With Mortgage |
| Less than $50,000 | 0 (0.0%) | 0 (0.0%) |
| $50,000 to $99,999 | 13 (100.0%) | 13 (48.1%) |
| $100,000 to $299,999 | 0 (0.0%) | 11 (40.7%) |
| $300,000 to $499,999 | 0 (0.0%) | 3 (11.1%) |
| $500,000 to $749,999 | 0 (0.0%) | 0 (0.0%) |
| $750,000 to $999,999 | 0 (0.0%) | 0 (0.0%) |
| $1,000,000 or more | 0 (0.0%) | 0 (0.0%) |
| Total | 13 (100.0%) | 27 (100.0%) |
Household Income by Mortgage Status in Hunter
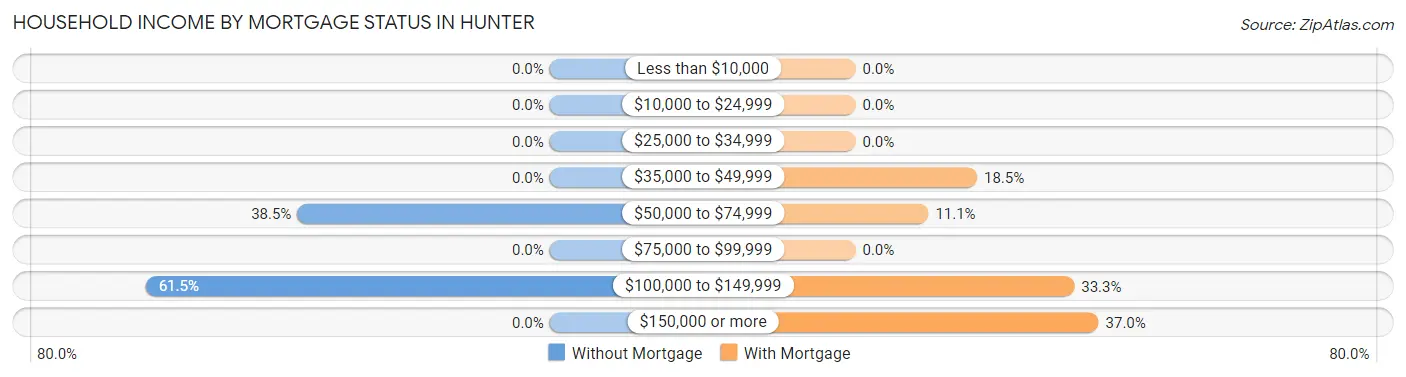
| Household Income | Without Mortgage | With Mortgage |
| Less than $10,000 | 0 (0.0%) | 0 (0.0%) |
| $10,000 to $24,999 | 0 (0.0%) | 0 (0.0%) |
| $25,000 to $34,999 | 0 (0.0%) | 0 (0.0%) |
| $35,000 to $49,999 | 0 (0.0%) | 5 (18.5%) |
| $50,000 to $74,999 | 5 (38.5%) | 3 (11.1%) |
| $75,000 to $99,999 | 0 (0.0%) | 0 (0.0%) |
| $100,000 to $149,999 | 8 (61.5%) | 9 (33.3%) |
| $150,000 or more | 0 (0.0%) | 10 (37.0%) |
| Total | 13 (100.0%) | 27 (100.0%) |
Property Value to Household Income Ratio in Hunter
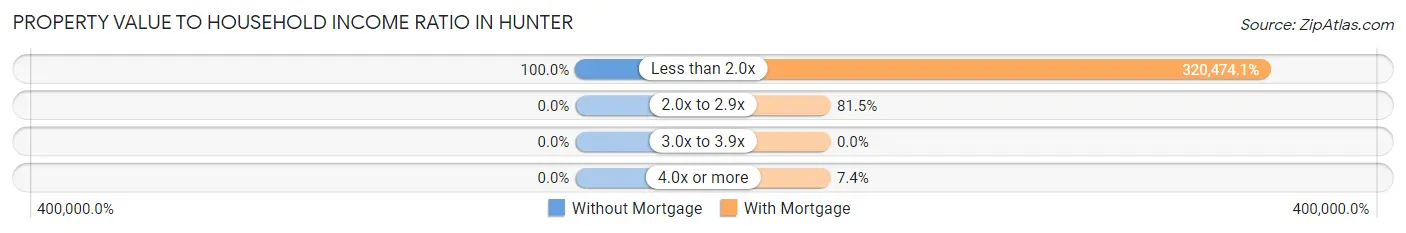
| Value-to-Income Ratio | Without Mortgage | With Mortgage |
| Less than 2.0x | 13 (100.0%) | 86,528 (320,474.1%) |
| 2.0x to 2.9x | 0 (0.0%) | 22 (81.5%) |
| 3.0x to 3.9x | 0 (0.0%) | 0 (0.0%) |
| 4.0x or more | 0 (0.0%) | 2 (7.4%) |
| Total | 13 (100.0%) | 27 (100.0%) |
Real Estate Taxes by Mortgage Status in Hunter
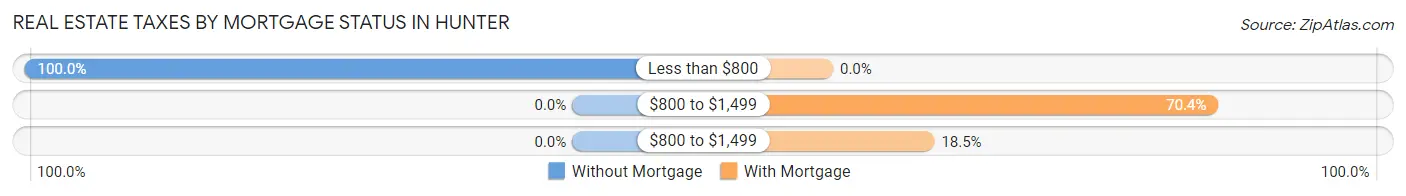
| Property Taxes | Without Mortgage | With Mortgage |
| Less than $800 | 13 (100.0%) | 0 (0.0%) |
| $800 to $1,499 | 0 (0.0%) | 19 (70.4%) |
| $800 to $1,499 | 0 (0.0%) | 5 (18.5%) |
| Total | 13 (100.0%) | 27 (100.0%) |
Health & Disability in Hunter
Health Insurance Coverage by Age in Hunter
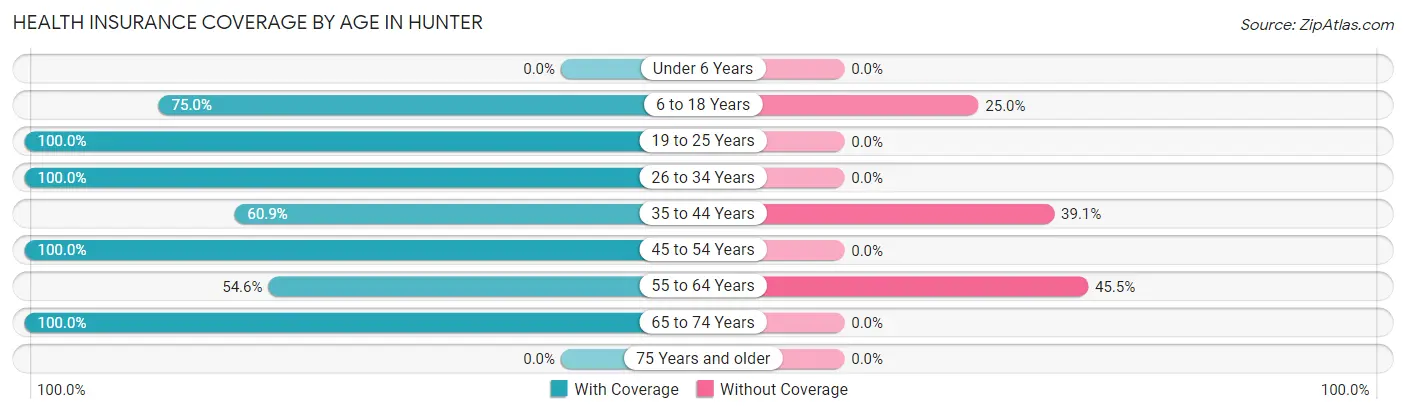
| Age Bracket | With Coverage | Without Coverage |
| Under 6 Years | 0 (0.0%) | 0 (0.0%) |
| 6 to 18 Years | 27 (75.0%) | 9 (25.0%) |
| 19 to 25 Years | 15 (100.0%) | 0 (0.0%) |
| 26 to 34 Years | 18 (100.0%) | 0 (0.0%) |
| 35 to 44 Years | 14 (60.9%) | 9 (39.1%) |
| 45 to 54 Years | 20 (100.0%) | 0 (0.0%) |
| 55 to 64 Years | 6 (54.5%) | 5 (45.5%) |
| 65 to 74 Years | 19 (100.0%) | 0 (0.0%) |
| 75 Years and older | 0 (0.0%) | 0 (0.0%) |
| Total | 119 (83.8%) | 23 (16.2%) |
Health Insurance Coverage by Citizenship Status in Hunter
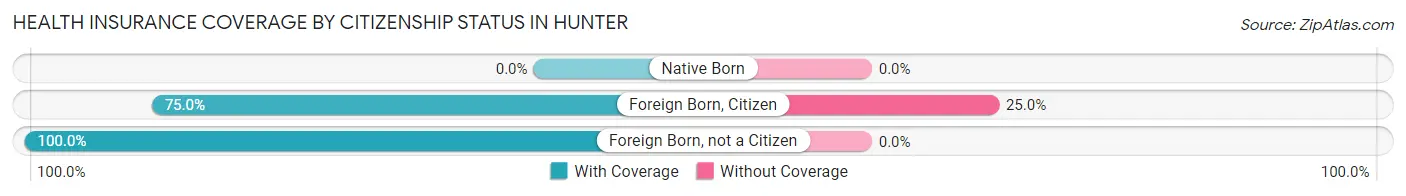
| Citizenship Status | With Coverage | Without Coverage |
| Native Born | 0 (0.0%) | 0 (0.0%) |
| Foreign Born, Citizen | 27 (75.0%) | 9 (25.0%) |
| Foreign Born, not a Citizen | 15 (100.0%) | 0 (0.0%) |
Health Insurance Coverage by Household Income in Hunter
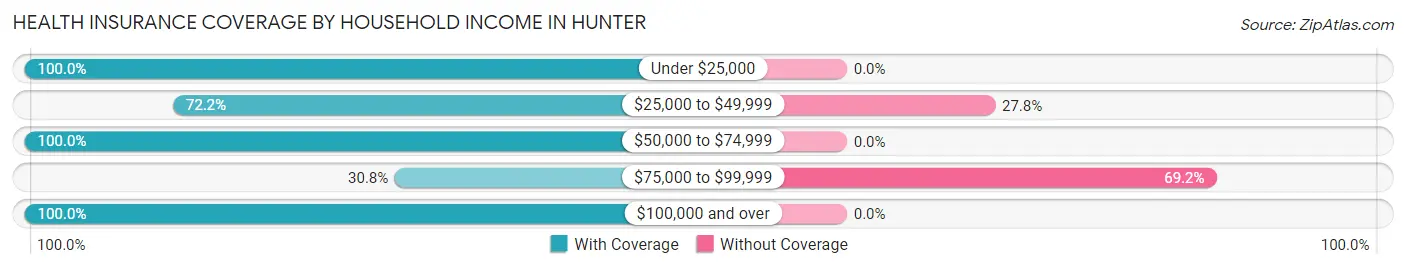
| Household Income | With Coverage | Without Coverage |
| Under $25,000 | 4 (100.0%) | 0 (0.0%) |
| $25,000 to $49,999 | 13 (72.2%) | 5 (27.8%) |
| $50,000 to $74,999 | 5 (100.0%) | 0 (0.0%) |
| $75,000 to $99,999 | 8 (30.8%) | 18 (69.2%) |
| $100,000 and over | 89 (100.0%) | 0 (0.0%) |
Public vs Private Health Insurance Coverage by Age in Hunter
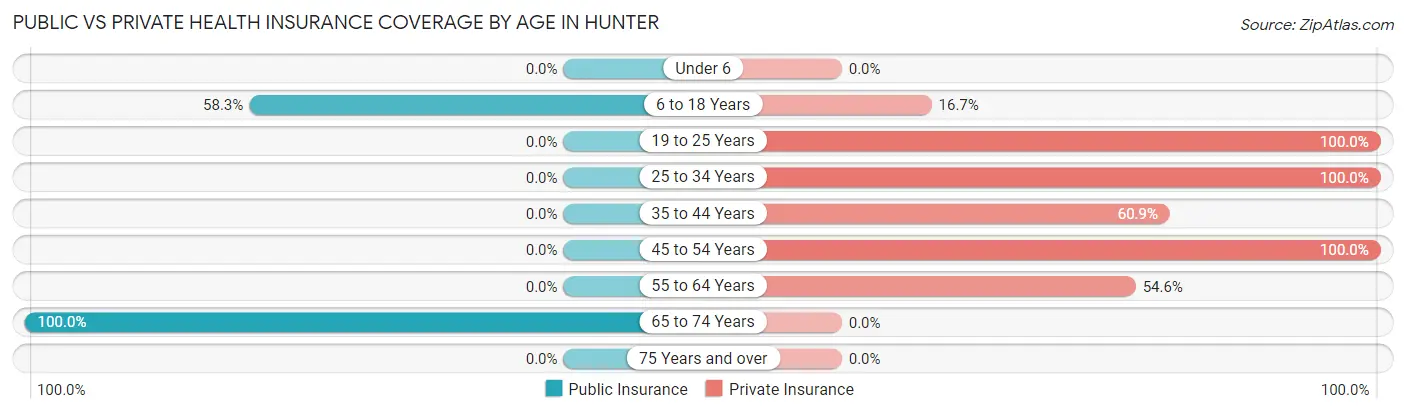
| Age Bracket | Public Insurance | Private Insurance |
| Under 6 | 0 (0.0%) | 0 (0.0%) |
| 6 to 18 Years | 21 (58.3%) | 6 (16.7%) |
| 19 to 25 Years | 0 (0.0%) | 15 (100.0%) |
| 25 to 34 Years | 0 (0.0%) | 18 (100.0%) |
| 35 to 44 Years | 0 (0.0%) | 14 (60.9%) |
| 45 to 54 Years | 0 (0.0%) | 20 (100.0%) |
| 55 to 64 Years | 0 (0.0%) | 6 (54.5%) |
| 65 to 74 Years | 19 (100.0%) | 0 (0.0%) |
| 75 Years and over | 0 (0.0%) | 0 (0.0%) |
| Total | 40 (28.2%) | 79 (55.6%) |
Disability Status by Sex by Age in Hunter
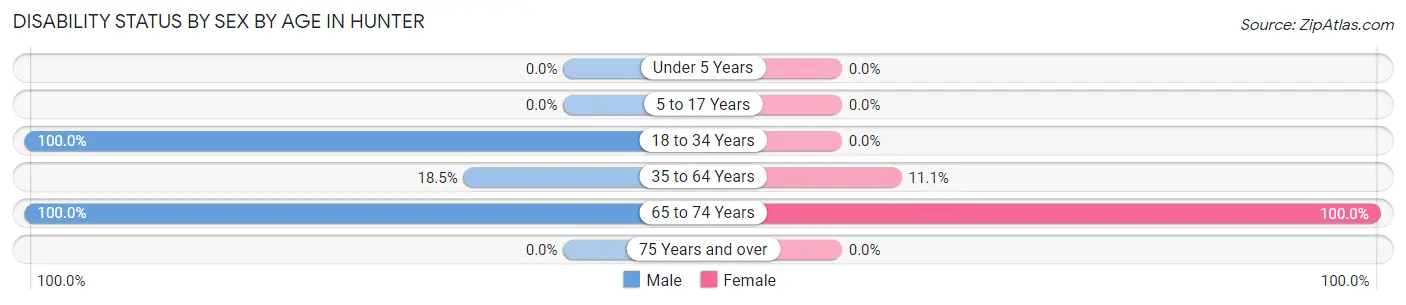
| Age Bracket | Male | Female |
| Under 5 Years | 0 (0.0%) | 0 (0.0%) |
| 5 to 17 Years | 0 (0.0%) | 0 (0.0%) |
| 18 to 34 Years | 18 (100.0%) | 0 (0.0%) |
| 35 to 64 Years | 5 (18.5%) | 3 (11.1%) |
| 65 to 74 Years | 5 (100.0%) | 14 (100.0%) |
| 75 Years and over | 0 (0.0%) | 0 (0.0%) |
Disability Class by Sex by Age in Hunter
Disability Class: Hearing Difficulty
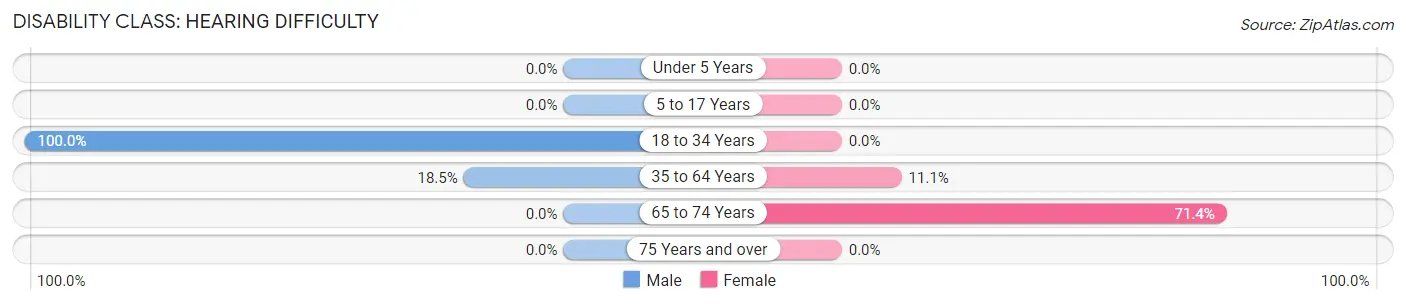
| Age Bracket | Male | Female |
| Under 5 Years | 0 (0.0%) | 0 (0.0%) |
| 5 to 17 Years | 0 (0.0%) | 0 (0.0%) |
| 18 to 34 Years | 18 (100.0%) | 0 (0.0%) |
| 35 to 64 Years | 5 (18.5%) | 3 (11.1%) |
| 65 to 74 Years | 0 (0.0%) | 10 (71.4%) |
| 75 Years and over | 0 (0.0%) | 0 (0.0%) |
Disability Class: Vision Difficulty
| Age Bracket | Male | Female |
| Under 5 Years | 0 (0.0%) | 0 (0.0%) |
| 5 to 17 Years | 0 (0.0%) | 0 (0.0%) |
| 18 to 34 Years | 0 (0.0%) | 0 (0.0%) |
| 35 to 64 Years | 0 (0.0%) | 0 (0.0%) |
| 65 to 74 Years | 0 (0.0%) | 0 (0.0%) |
| 75 Years and over | 0 (0.0%) | 0 (0.0%) |
Disability Class: Cognitive Difficulty
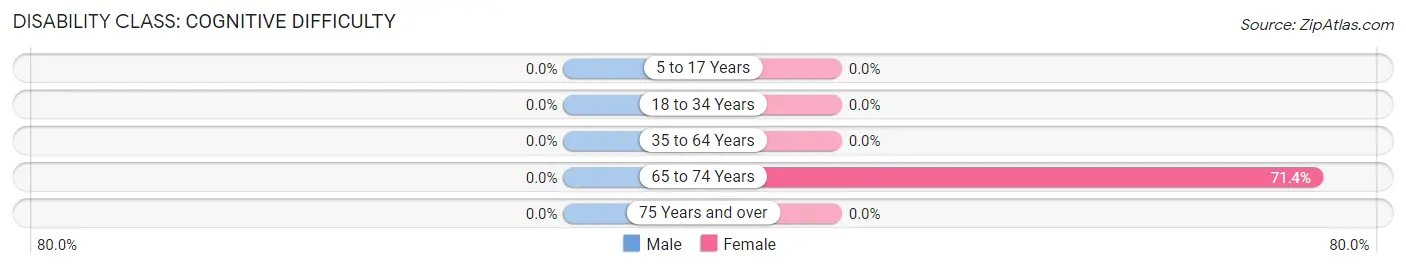
| Age Bracket | Male | Female |
| 5 to 17 Years | 0 (0.0%) | 0 (0.0%) |
| 18 to 34 Years | 0 (0.0%) | 0 (0.0%) |
| 35 to 64 Years | 0 (0.0%) | 0 (0.0%) |
| 65 to 74 Years | 0 (0.0%) | 10 (71.4%) |
| 75 Years and over | 0 (0.0%) | 0 (0.0%) |
Disability Class: Ambulatory Difficulty
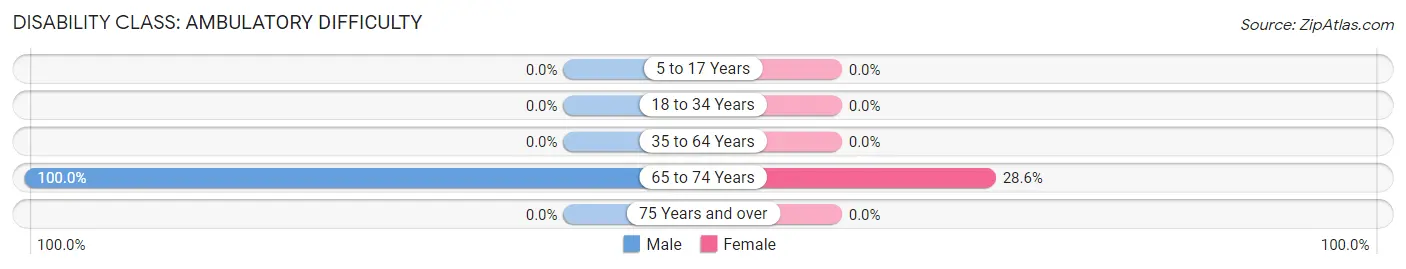
| Age Bracket | Male | Female |
| 5 to 17 Years | 0 (0.0%) | 0 (0.0%) |
| 18 to 34 Years | 0 (0.0%) | 0 (0.0%) |
| 35 to 64 Years | 0 (0.0%) | 0 (0.0%) |
| 65 to 74 Years | 5 (100.0%) | 4 (28.6%) |
| 75 Years and over | 0 (0.0%) | 0 (0.0%) |
Disability Class: Self-Care Difficulty
| Age Bracket | Male | Female |
| 5 to 17 Years | 0 (0.0%) | 0 (0.0%) |
| 18 to 34 Years | 0 (0.0%) | 0 (0.0%) |
| 35 to 64 Years | 0 (0.0%) | 0 (0.0%) |
| 65 to 74 Years | 0 (0.0%) | 0 (0.0%) |
| 75 Years and over | 0 (0.0%) | 0 (0.0%) |
Technology Access in Hunter
Computing Device Access in Hunter
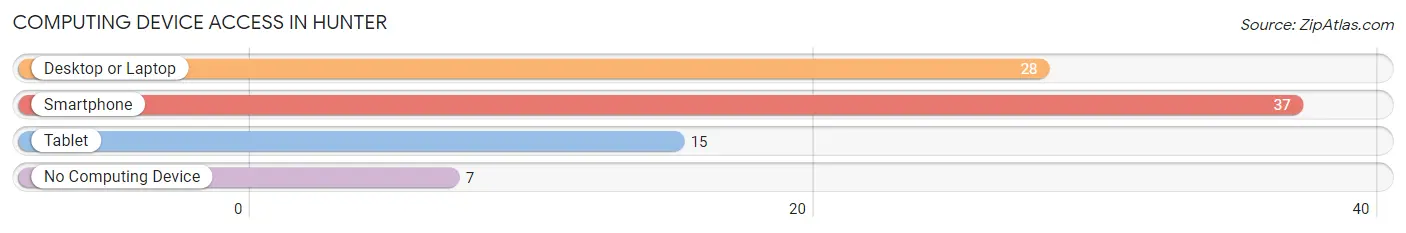
| Device Type | # Households | % Households |
| Desktop or Laptop | 28 | 63.6% |
| Smartphone | 37 | 84.1% |
| Tablet | 15 | 34.1% |
| No Computing Device | 7 | 15.9% |
| Total | 44 | 100.0% |
Internet Access in Hunter
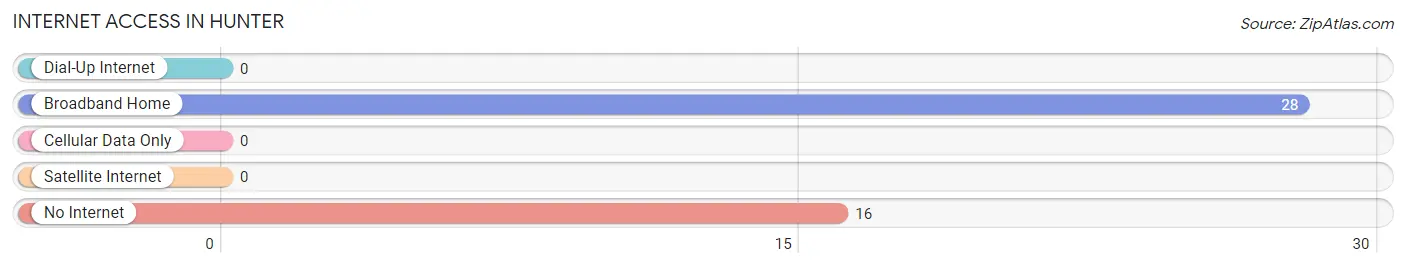
| Internet Type | # Households | % Households |
| Dial-Up Internet | 0 | 0.0% |
| Broadband Home | 28 | 63.6% |
| Cellular Data Only | 0 | 0.0% |
| Satellite Internet | 0 | 0.0% |
| No Internet | 16 | 36.4% |
| Total | 44 | 100.0% |
Hunter Summary
Hunter is a small town located in the Ozark Mountains of Arkansas. It is situated in the northwest corner of the state, near the Oklahoma border. The town was founded in 1883 and has a population of just over 500 people.
Geography
Hunter is located in the Ozark Mountains of Arkansas, in the northwest corner of the state. The town is situated in the foothills of the Ozarks, and is surrounded by rolling hills and forests. The town is located on the banks of the Arkansas River, and is just a few miles from the Oklahoma border. The climate in Hunter is mild, with hot summers and cold winters.
Economy
The economy of Hunter is largely based on agriculture and tourism. The town is home to several small farms, which produce a variety of crops, including corn, soybeans, and wheat. The town also has a few small businesses, including a grocery store, a hardware store, and a few restaurants. Tourism is also an important part of the local economy, as the town is a popular destination for outdoor activities such as fishing, hunting, and camping.
Demographics
As of the 2010 census, the population of Hunter was 514 people. The racial makeup of the town was 97.3% White, 0.6% African American, 0.2% Native American, 0.2% Asian, 0.2% from other races, and 1.5% from two or more races. The median household income in Hunter was $30,000, and the median family income was $35,000.
History
Hunter was founded in 1883 by a group of settlers from Missouri. The town was named after a local settler, William Hunter, who was one of the first settlers in the area. The town quickly grew, and by the early 1900s, it had become a thriving agricultural community. The town was also home to several small businesses, including a general store, a blacksmith shop, and a sawmill.
In the late 1950s, the town began to decline as many of the local businesses closed. However, in the late 1970s, the town began to experience a resurgence as tourism began to increase. Today, Hunter is a popular destination for outdoor activities, and the town is home to several small businesses and farms.
Common Questions
What is Per Capita Income in Hunter?
Per Capita income in Hunter is $31,454.
What is the Median Family Income in Hunter?
Median Family Income in Hunter is $118,438.
What is the Median Household income in Hunter?
Median Household Income in Hunter is $86,389.
What is Inequality or Gini Index in Hunter?
Inequality or Gini Index in Hunter is 0.28.
What is the Total Population of Hunter?
Total Population of Hunter is 142.
What is the Total Male Population of Hunter?
Total Male Population of Hunter is 69.
What is the Total Female Population of Hunter?
Total Female Population of Hunter is 73.
What is the Ratio of Males per 100 Females in Hunter?
There are 94.52 Males per 100 Females in Hunter.
What is the Ratio of Females per 100 Males in Hunter?
There are 105.80 Females per 100 Males in Hunter.
What is the Median Population Age in Hunter?
Median Population Age in Hunter is 39.3 Years.
What is the Average Family Size in Hunter
Average Family Size in Hunter is 4.1 People.
What is the Average Household Size in Hunter
Average Household Size in Hunter is 3.2 People.
How Large is the Labor Force in Hunter?
There are 87 People in the Labor Forcein in Hunter.
What is the Percentage of People in the Labor Force in Hunter?
75.7% of People are in the Labor Force in Hunter.