Houston, AR Map & Demographics
Houston Map
Houston Overview
$14,557
PER CAPITA INCOME
$44,375
AVG FAMILY INCOME
$42,813
AVG HOUSEHOLD INCOME
35.9%
WAGE / INCOME GAP [ % ]
64.1¢/ $1
WAGE / INCOME GAP [ $ ]
0.46
INEQUALITY / GINI INDEX
233
TOTAL POPULATION
103
MALE POPULATION
130
FEMALE POPULATION
79.23
MALES / 100 FEMALES
126.21
FEMALES / 100 MALES
18.1
MEDIAN AGE
4.1
AVG FAMILY SIZE
3.8
AVG HOUSEHOLD SIZE
75
LABOR FORCE [ PEOPLE ]
62.0%
PERCENT IN LABOR FORCE
Houston Zip Codes
Houston Area Codes
Income in Houston
Income Overview in Houston
Per Capita Income in Houston is $14,557, while median incomes of families and households are $44,375 and $42,813 respectively.
| Characteristic | Number | Measure |
| Per Capita Income | 233 | $14,557 |
| Median Family Income | 54 | $44,375 |
| Mean Family Income | 54 | $50,431 |
| Median Household Income | 61 | $42,813 |
| Mean Household Income | 61 | $51,477 |
| Income Deficit | 54 | $0 |
| Wage / Income Gap (%) | 233 | 35.86% |
| Wage / Income Gap ($) | 233 | 64.14¢ per $1 |
| Gini / Inequality Index | 233 | 0.46 |
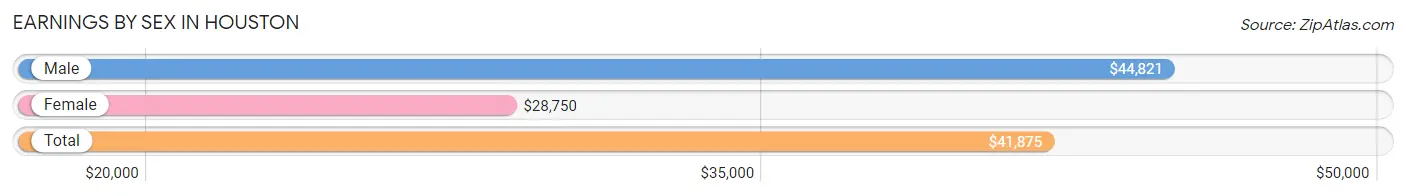
Earnings by Sex in Houston
Average Earnings in Houston are $41,875, $44,821 for men and $28,750 for women, a difference of 35.9%.
| Sex | Number | Average Earnings |
| Male | 39 (52.0%) | $44,821 |
| Female | 36 (48.0%) | $28,750 |
| Total | 75 (100.0%) | $41,875 |
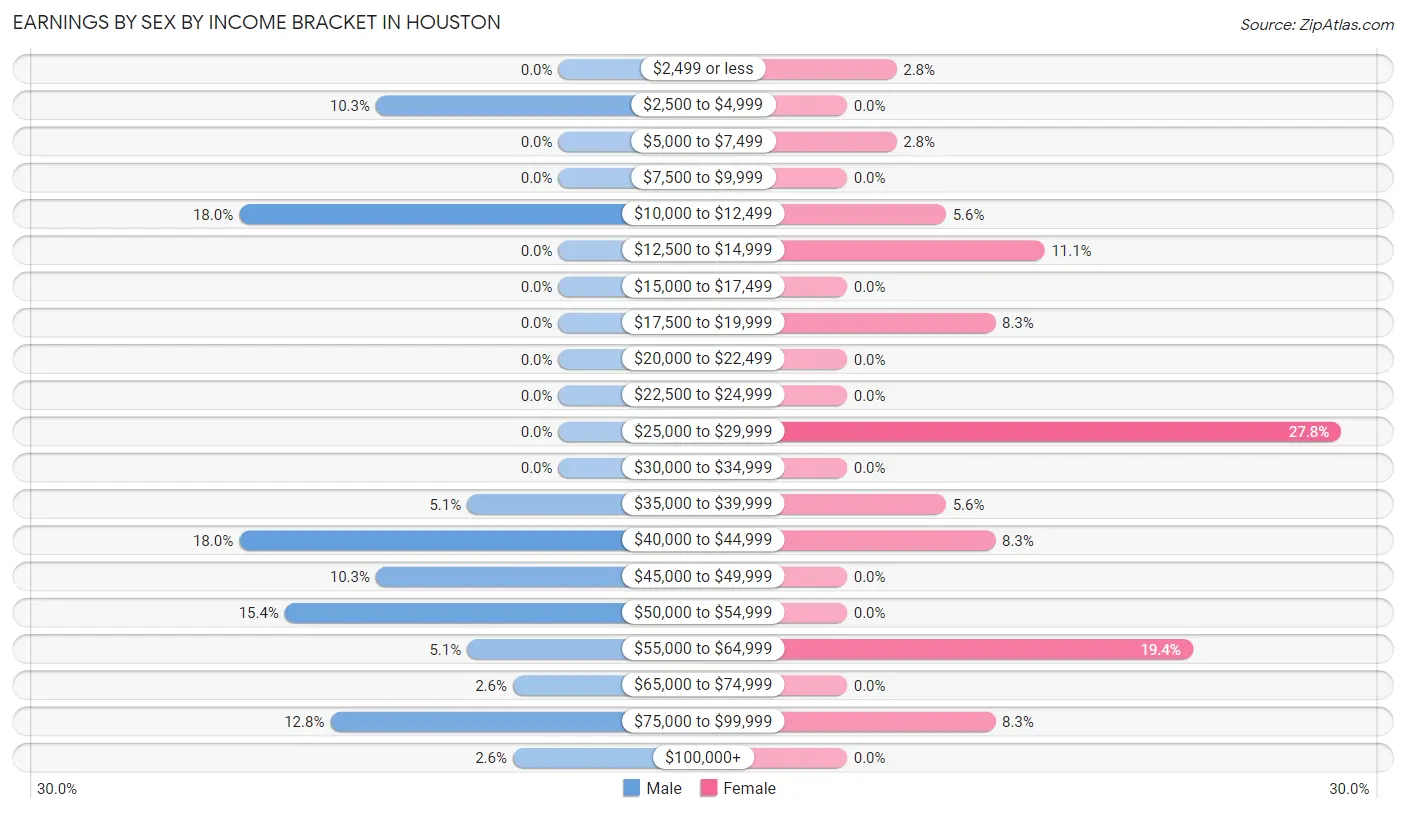
Earnings by Sex by Income Bracket in Houston
The most common earnings brackets in Houston are $10,000 to $12,499 for men (7 | 17.9%) and $25,000 to $29,999 for women (10 | 27.8%).
| Income | Male | Female |
| $2,499 or less | 0 (0.0%) | 1 (2.8%) |
| $2,500 to $4,999 | 4 (10.3%) | 0 (0.0%) |
| $5,000 to $7,499 | 0 (0.0%) | 1 (2.8%) |
| $7,500 to $9,999 | 0 (0.0%) | 0 (0.0%) |
| $10,000 to $12,499 | 7 (17.9%) | 2 (5.6%) |
| $12,500 to $14,999 | 0 (0.0%) | 4 (11.1%) |
| $15,000 to $17,499 | 0 (0.0%) | 0 (0.0%) |
| $17,500 to $19,999 | 0 (0.0%) | 3 (8.3%) |
| $20,000 to $22,499 | 0 (0.0%) | 0 (0.0%) |
| $22,500 to $24,999 | 0 (0.0%) | 0 (0.0%) |
| $25,000 to $29,999 | 0 (0.0%) | 10 (27.8%) |
| $30,000 to $34,999 | 0 (0.0%) | 0 (0.0%) |
| $35,000 to $39,999 | 2 (5.1%) | 2 (5.6%) |
| $40,000 to $44,999 | 7 (17.9%) | 3 (8.3%) |
| $45,000 to $49,999 | 4 (10.3%) | 0 (0.0%) |
| $50,000 to $54,999 | 6 (15.4%) | 0 (0.0%) |
| $55,000 to $64,999 | 2 (5.1%) | 7 (19.4%) |
| $65,000 to $74,999 | 1 (2.6%) | 0 (0.0%) |
| $75,000 to $99,999 | 5 (12.8%) | 3 (8.3%) |
| $100,000+ | 1 (2.6%) | 0 (0.0%) |
| Total | 39 (100.0%) | 36 (100.0%) |
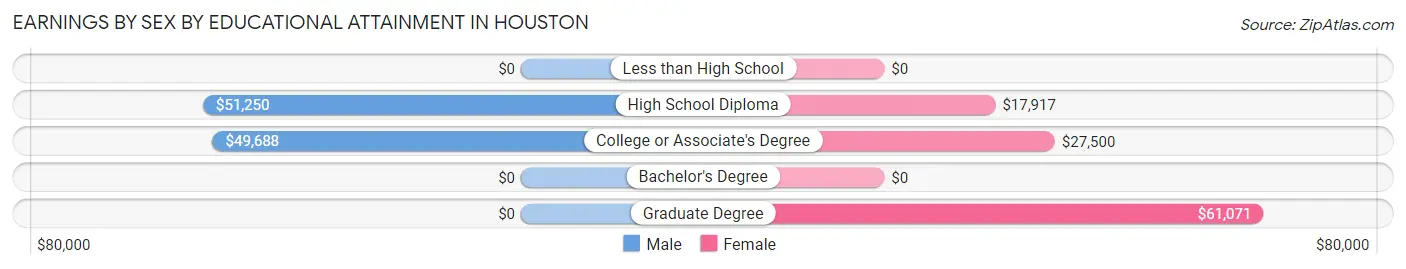
Earnings by Sex by Educational Attainment in Houston
Average earnings in Houston are $50,000 for men and $29,583 for women, a difference of 40.8%. Men with an educational attainment of high school diploma enjoy the highest average annual earnings of $51,250, while those with college or associate's degree education earn the least with $49,688. Women with an educational attainment of graduate degree earn the most with the average annual earnings of $61,071, while those with high school diploma education have the smallest earnings of $17,917.
| Educational Attainment | Male Income | Female Income |
| Less than High School | - | - |
| High School Diploma | $51,250 | $17,917 |
| College or Associate's Degree | $49,688 | $27,500 |
| Bachelor's Degree | - | - |
| Graduate Degree | - | - |
| Total | $50,000 | $29,583 |
Family Income in Houston
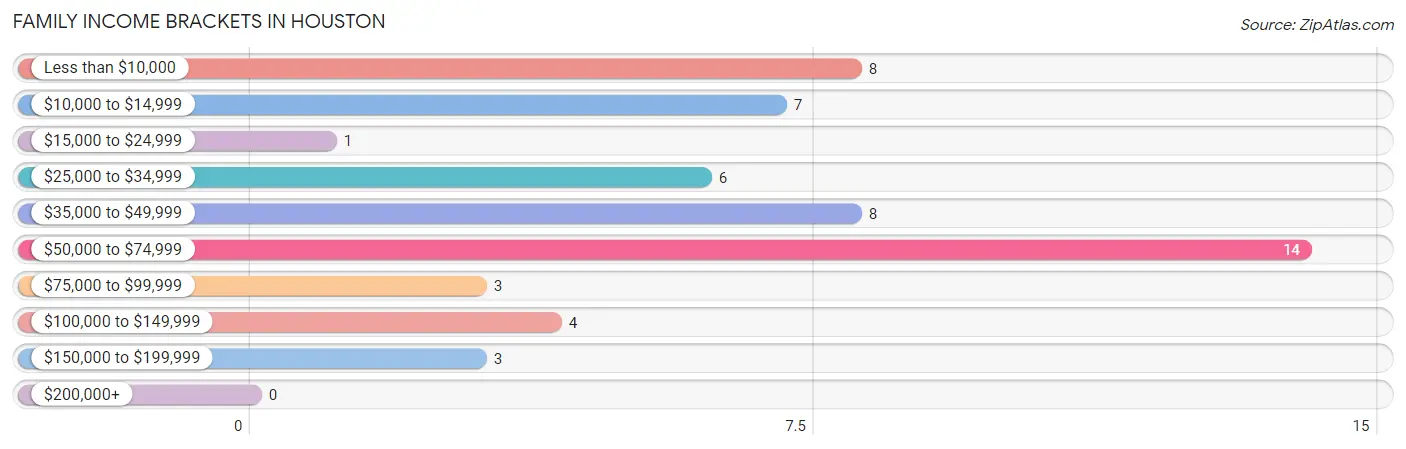
Family Income Brackets in Houston
According to the Houston family income data, there are 14 families falling into the $50,000 to $74,999 income range, which is the most common income bracket and makes up 25.9% of all families.
| Income Bracket | # Families | % Families |
| Less than $10,000 | 8 | 14.8% |
| $10,000 to $14,999 | 7 | 13.0% |
| $15,000 to $24,999 | 1 | 1.9% |
| $25,000 to $34,999 | 6 | 11.1% |
| $35,000 to $49,999 | 8 | 14.8% |
| $50,000 to $74,999 | 14 | 25.9% |
| $75,000 to $99,999 | 3 | 5.6% |
| $100,000 to $149,999 | 4 | 7.4% |
| $150,000 to $199,999 | 3 | 5.6% |
| $200,000+ | 0 | 0.0% |
Family Income by Famaliy Size in Houston
| Income Bracket | # Families | Median Income |
| 2-Person Families | 30 (55.6%) | $0 |
| 3-Person Families | 8 (14.8%) | $0 |
| 4-Person Families | 4 (7.4%) | $0 |
| 5-Person Families | 4 (7.4%) | $0 |
| 6-Person Families | 2 (3.7%) | $0 |
| 7+ Person Families | 6 (11.1%) | $0 |
| Total | 54 (100.0%) | $44,375 |
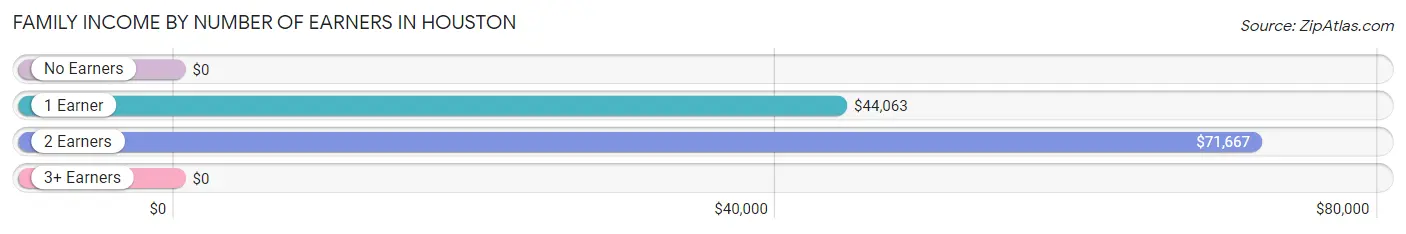
Family Income by Number of Earners in Houston
| Number of Earners | # Families | Median Income |
| No Earners | 18 (33.3%) | $0 |
| 1 Earner | 13 (24.1%) | $44,063 |
| 2 Earners | 22 (40.7%) | $71,667 |
| 3+ Earners | 1 (1.8%) | $0 |
| Total | 54 (100.0%) | $44,375 |
Household Income in Houston
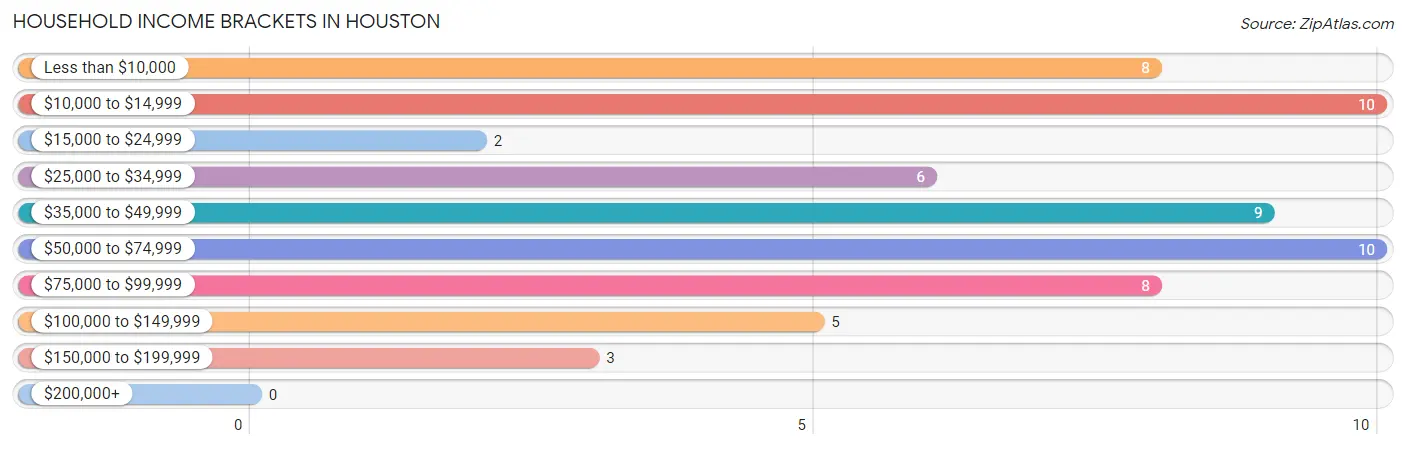
Household Income Brackets in Houston
With 10 households falling in the category, the $10,000 to $14,999 income range is the most frequent in Houston, accounting for 16.4% of all households.
| Income Bracket | # Households | % Households |
| Less than $10,000 | 8 | 13.1% |
| $10,000 to $14,999 | 10 | 16.4% |
| $15,000 to $24,999 | 2 | 3.3% |
| $25,000 to $34,999 | 6 | 9.8% |
| $35,000 to $49,999 | 9 | 14.8% |
| $50,000 to $74,999 | 10 | 16.4% |
| $75,000 to $99,999 | 8 | 13.1% |
| $100,000 to $149,999 | 5 | 8.2% |
| $150,000 to $199,999 | 3 | 4.9% |
| $200,000+ | 0 | 0.0% |
Household Income by Householder Age in Houston
The median household income in Houston is $42,813, with the highest median household income of $44,063 found in the 25 to 44 years age bracket for the primary householder. A total of 27 households (44.3%) fall into this category.
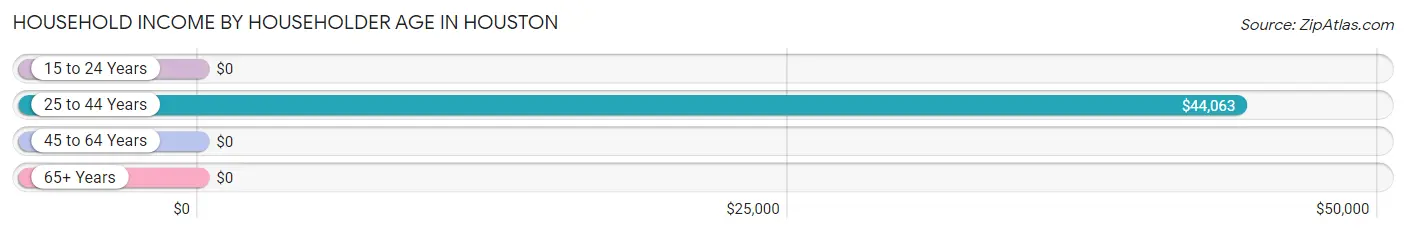
| Income Bracket | # Households | Median Income |
| 15 to 24 Years | 0 (0.0%) | $0 |
| 25 to 44 Years | 27 (44.3%) | $44,063 |
| 45 to 64 Years | 27 (44.3%) | $0 |
| 65+ Years | 7 (11.5%) | $0 |
| Total | 61 (100.0%) | $42,813 |
Poverty in Houston
Income Below Poverty by Sex and Age in Houston
With 36.9% poverty level for males and 23.8% for females among the residents of Houston, 5 year old males and 65 to 74 year old females are the most vulnerable to poverty, with 4 males (100.0%) and 3 females (100.0%) in their respective age groups living below the poverty level.
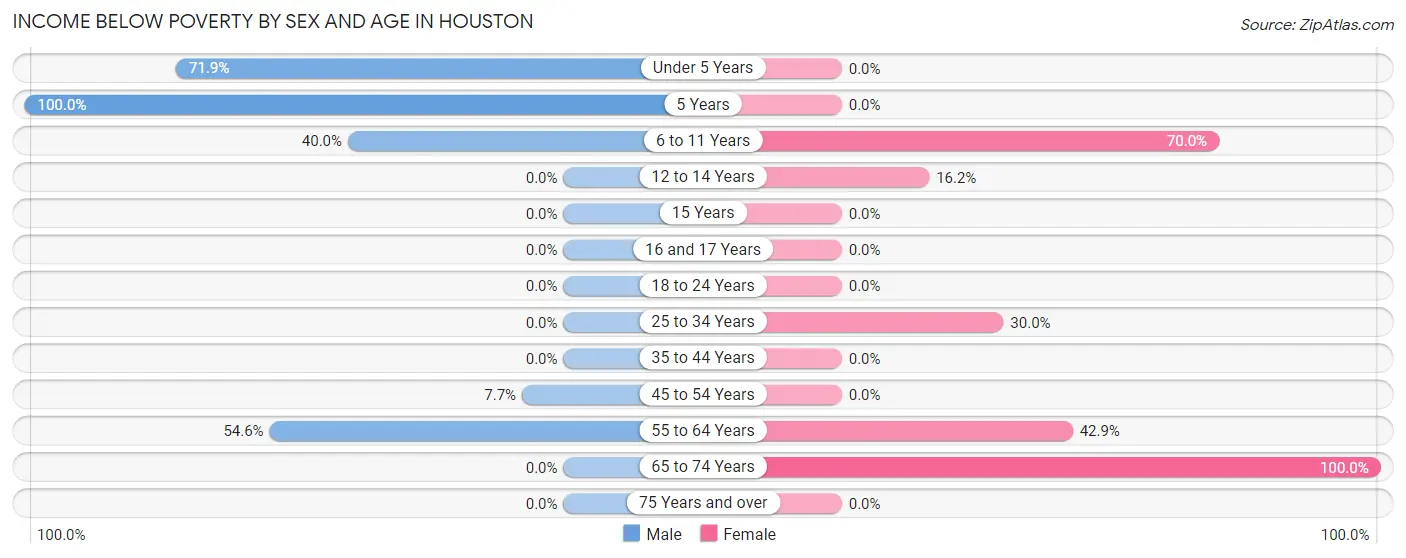
| Age Bracket | Male | Female |
| Under 5 Years | 23 (71.9%) | 0 (0.0%) |
| 5 Years | 4 (100.0%) | 0 (0.0%) |
| 6 to 11 Years | 4 (40.0%) | 7 (70.0%) |
| 12 to 14 Years | 0 (0.0%) | 6 (16.2%) |
| 15 Years | 0 (0.0%) | 0 (0.0%) |
| 16 and 17 Years | 0 (0.0%) | 0 (0.0%) |
| 18 to 24 Years | 0 (0.0%) | 0 (0.0%) |
| 25 to 34 Years | 0 (0.0%) | 6 (30.0%) |
| 35 to 44 Years | 0 (0.0%) | 0 (0.0%) |
| 45 to 54 Years | 1 (7.7%) | 0 (0.0%) |
| 55 to 64 Years | 6 (54.5%) | 9 (42.9%) |
| 65 to 74 Years | 0 (0.0%) | 3 (100.0%) |
| 75 Years and over | 0 (0.0%) | 0 (0.0%) |
| Total | 38 (36.9%) | 31 (23.8%) |
Income Above Poverty by Sex and Age in Houston
According to the poverty statistics in Houston, males aged 12 to 14 years and females aged under 5 years are the age groups that are most secure financially, with 100.0% of males and 100.0% of females in these age groups living above the poverty line.
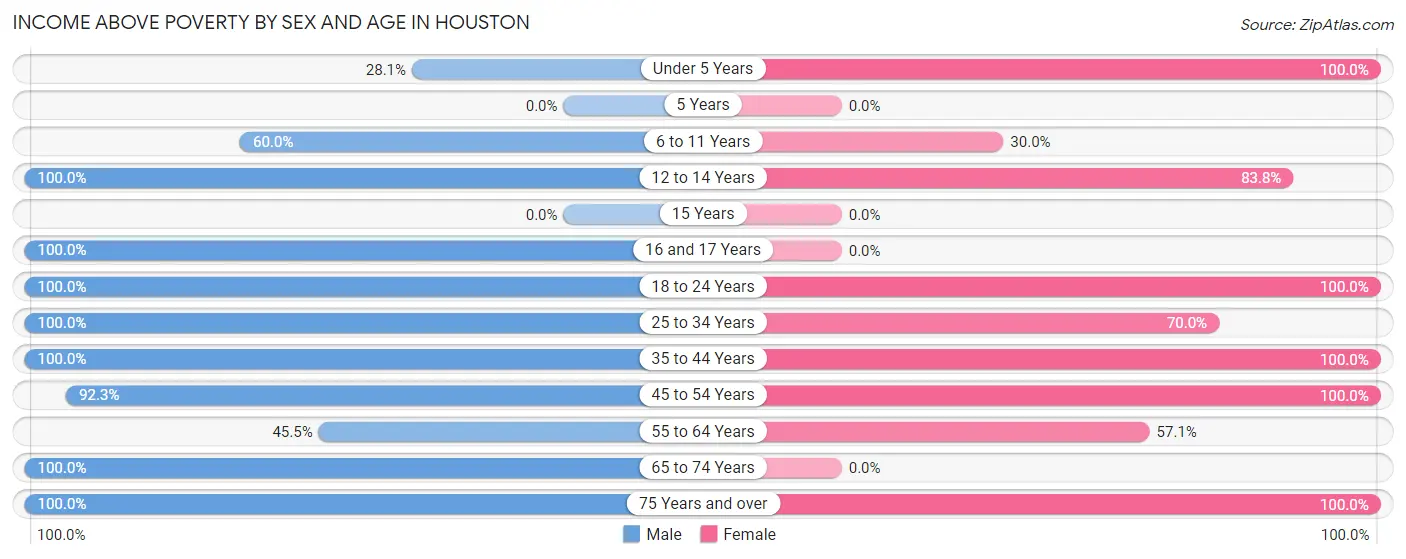
| Age Bracket | Male | Female |
| Under 5 Years | 9 (28.1%) | 18 (100.0%) |
| 5 Years | 0 (0.0%) | 0 (0.0%) |
| 6 to 11 Years | 6 (60.0%) | 3 (30.0%) |
| 12 to 14 Years | 1 (100.0%) | 31 (83.8%) |
| 15 Years | 0 (0.0%) | 0 (0.0%) |
| 16 and 17 Years | 4 (100.0%) | 0 (0.0%) |
| 18 to 24 Years | 9 (100.0%) | 5 (100.0%) |
| 25 to 34 Years | 9 (100.0%) | 14 (70.0%) |
| 35 to 44 Years | 7 (100.0%) | 7 (100.0%) |
| 45 to 54 Years | 12 (92.3%) | 8 (100.0%) |
| 55 to 64 Years | 5 (45.5%) | 12 (57.1%) |
| 65 to 74 Years | 2 (100.0%) | 0 (0.0%) |
| 75 Years and over | 1 (100.0%) | 1 (100.0%) |
| Total | 65 (63.1%) | 99 (76.1%) |
Income Below Poverty Among Married-Couple Families in Houston
The poverty statistics for married-couple families in Houston show that 24.3% or 9 of the total 37 families live below the poverty line. Families with no children have the highest poverty rate of 45.0%, comprising of 9 families. On the other hand, families with 1 or 2 children have the lowest poverty rate of 0.0%, which includes 0 families.
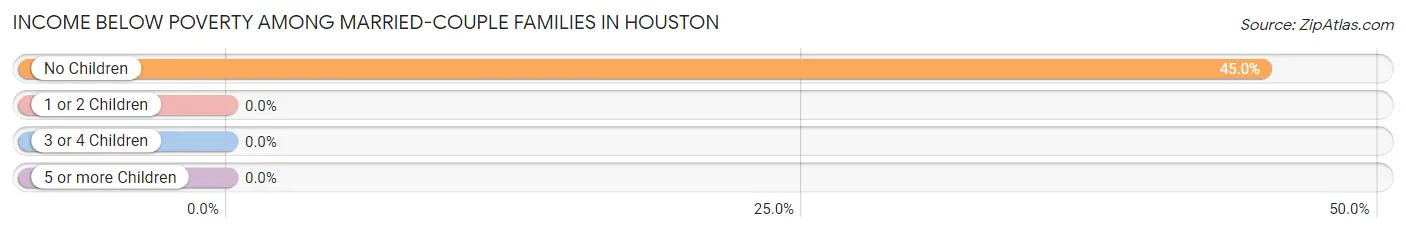
| Children | Above Poverty | Below Poverty |
| No Children | 11 (55.0%) | 9 (45.0%) |
| 1 or 2 Children | 11 (100.0%) | 0 (0.0%) |
| 3 or 4 Children | 6 (100.0%) | 0 (0.0%) |
| 5 or more Children | 0 (0.0%) | 0 (0.0%) |
| Total | 28 (75.7%) | 9 (24.3%) |
Income Below Poverty Among Single-Parent Households in Houston
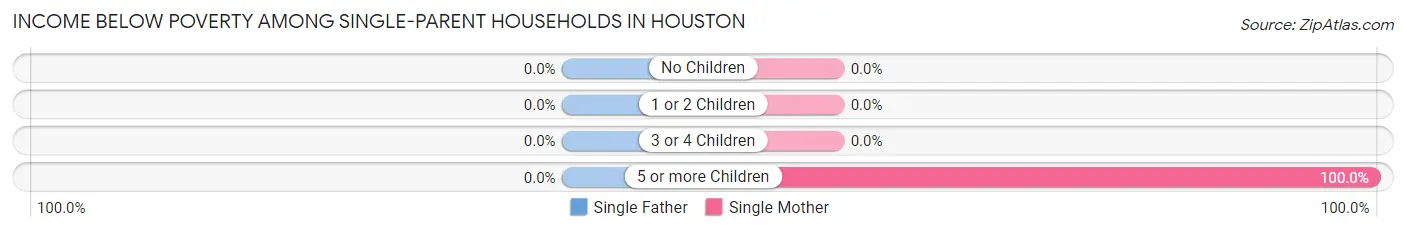
| Children | Single Father | Single Mother |
| No Children | 0 (0.0%) | 0 (0.0%) |
| 1 or 2 Children | 0 (0.0%) | 0 (0.0%) |
| 3 or 4 Children | 0 (0.0%) | 0 (0.0%) |
| 5 or more Children | 0 (0.0%) | 6 (100.0%) |
| Total | 0 (0.0%) | 6 (54.5%) |
Income Below Poverty Among Married-Couple vs Single-Parent Households in Houston
The poverty data for Houston shows that 9 of the married-couple family households (24.3%) and 6 of the single-parent households (35.3%) are living below the poverty level. Within the married-couple family households, those with no children have the highest poverty rate, with 9 households (45.0%) falling below the poverty line. Among the single-parent households, those with 5 or more children have the highest poverty rate, with 6 household (100.0%) living below poverty.
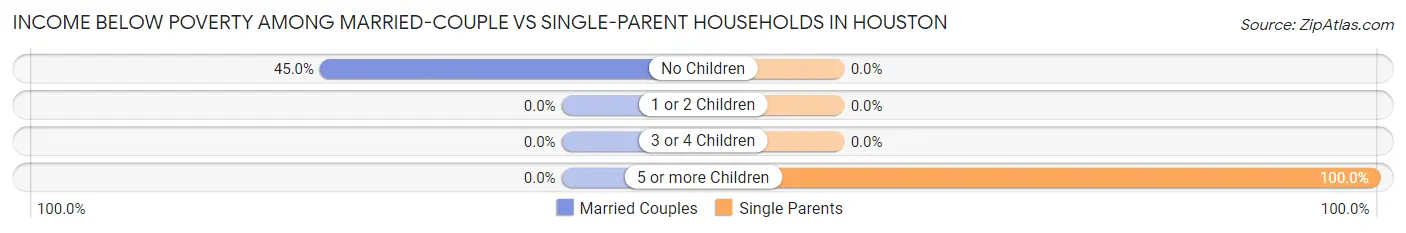
| Children | Married-Couple Families | Single-Parent Households |
| No Children | 9 (45.0%) | 0 (0.0%) |
| 1 or 2 Children | 0 (0.0%) | 0 (0.0%) |
| 3 or 4 Children | 0 (0.0%) | 0 (0.0%) |
| 5 or more Children | 0 (0.0%) | 6 (100.0%) |
| Total | 9 (24.3%) | 6 (35.3%) |
Race in Houston
The most populous races in Houston are White / Caucasian (199 | 85.4%), Black / African American (31 | 13.3%), and Native / Alaskan (3 | 1.3%).
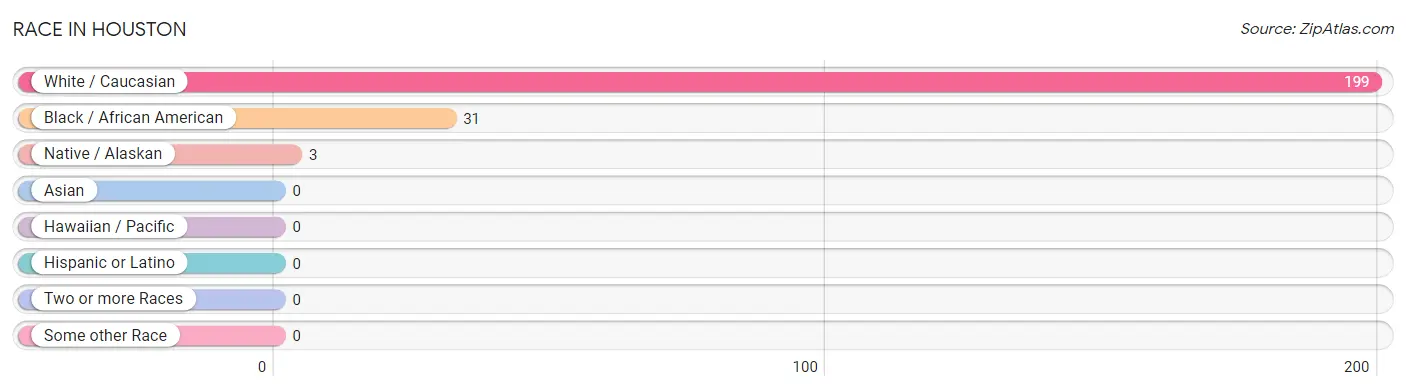
| Race | # Population | % Population |
| Asian | 0 | 0.0% |
| Black / African American | 31 | 13.3% |
| Hawaiian / Pacific | 0 | 0.0% |
| Hispanic or Latino | 0 | 0.0% |
| Native / Alaskan | 3 | 1.3% |
| White / Caucasian | 199 | 85.4% |
| Two or more Races | 0 | 0.0% |
| Some other Race | 0 | 0.0% |
| Total | 233 | 100.0% |
Ancestry in Houston
The most populous ancestries reported in Houston are German (46 | 19.7%), American (41 | 17.6%), Irish (15 | 6.4%), Italian (10 | 4.3%), and Scottish (5 | 2.1%), together accounting for 50.2% of all Houston residents.
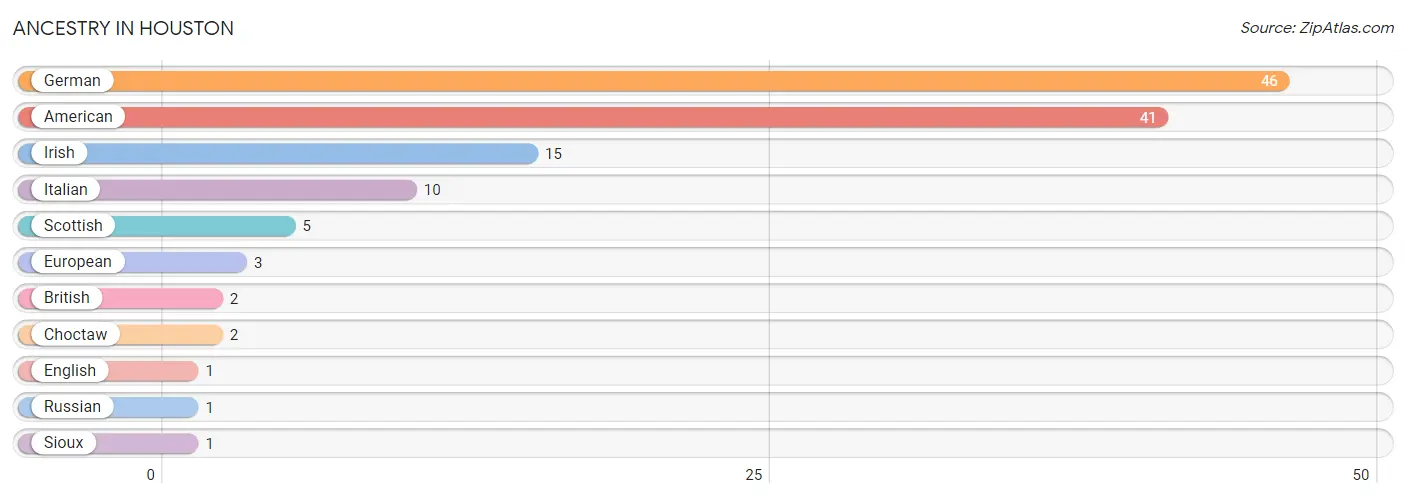
| Ancestry | # Population | % Population |
| American | 41 | 17.6% |
| British | 2 | 0.9% |
| Choctaw | 2 | 0.9% |
| English | 1 | 0.4% |
| European | 3 | 1.3% |
| German | 46 | 19.7% |
| Irish | 15 | 6.4% |
| Italian | 10 | 4.3% |
| Russian | 1 | 0.4% |
| Scottish | 5 | 2.1% |
| Sioux | 1 | 0.4% | View All 11 Rows |
Immigrants in Houston

| Immigration Origin | # Population | % Population | View All 0 Rows |
Sex and Age in Houston
Sex and Age in Houston
The most populous age groups in Houston are Under 5 Years (32 | 31.1%) for men and 10 to 14 Years (40 | 30.8%) for women.
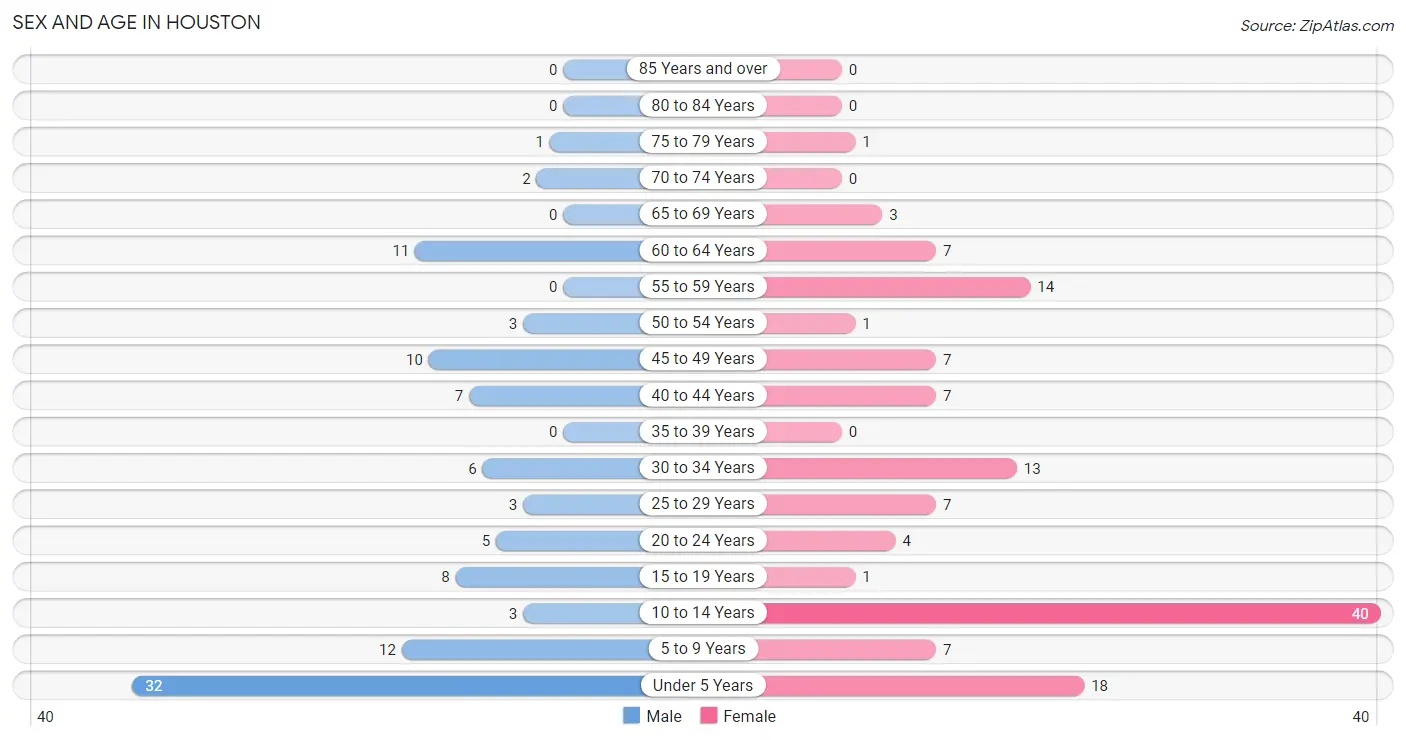
| Age Bracket | Male | Female |
| Under 5 Years | 32 (31.1%) | 18 (13.9%) |
| 5 to 9 Years | 12 (11.7%) | 7 (5.4%) |
| 10 to 14 Years | 3 (2.9%) | 40 (30.8%) |
| 15 to 19 Years | 8 (7.8%) | 1 (0.8%) |
| 20 to 24 Years | 5 (4.9%) | 4 (3.1%) |
| 25 to 29 Years | 3 (2.9%) | 7 (5.4%) |
| 30 to 34 Years | 6 (5.8%) | 13 (10.0%) |
| 35 to 39 Years | 0 (0.0%) | 0 (0.0%) |
| 40 to 44 Years | 7 (6.8%) | 7 (5.4%) |
| 45 to 49 Years | 10 (9.7%) | 7 (5.4%) |
| 50 to 54 Years | 3 (2.9%) | 1 (0.8%) |
| 55 to 59 Years | 0 (0.0%) | 14 (10.8%) |
| 60 to 64 Years | 11 (10.7%) | 7 (5.4%) |
| 65 to 69 Years | 0 (0.0%) | 3 (2.3%) |
| 70 to 74 Years | 2 (1.9%) | 0 (0.0%) |
| 75 to 79 Years | 1 (1.0%) | 1 (0.8%) |
| 80 to 84 Years | 0 (0.0%) | 0 (0.0%) |
| 85 Years and over | 0 (0.0%) | 0 (0.0%) |
| Total | 103 (100.0%) | 130 (100.0%) |
Families and Households in Houston
Median Family Size in Houston
The median family size in Houston is 4.09 persons per family, with single female/mother families (11 | 20.4%) accounting for the largest median family size of 8.09 persons per family. On the other hand, single male/father families (6 | 11.1%) represent the smallest median family size with 2.17 persons per family.
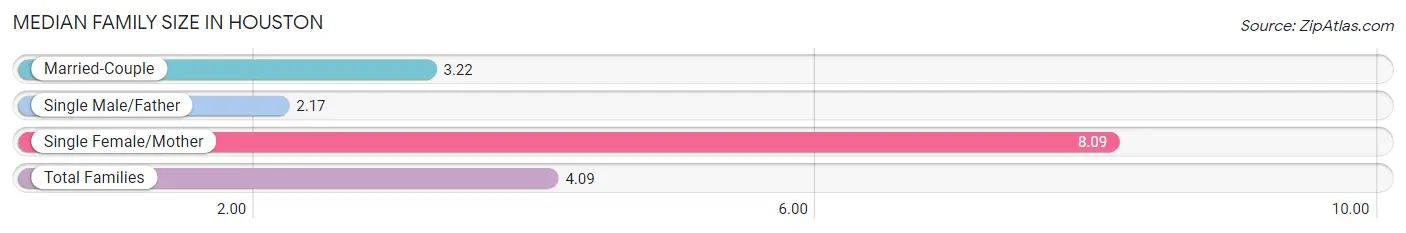
| Family Type | # Families | Family Size |
| Married-Couple | 37 (68.5%) | 3.22 |
| Single Male/Father | 6 (11.1%) | 2.17 |
| Single Female/Mother | 11 (20.4%) | 8.09 |
| Total Families | 54 (100.0%) | 4.09 |
Median Household Size in Houston
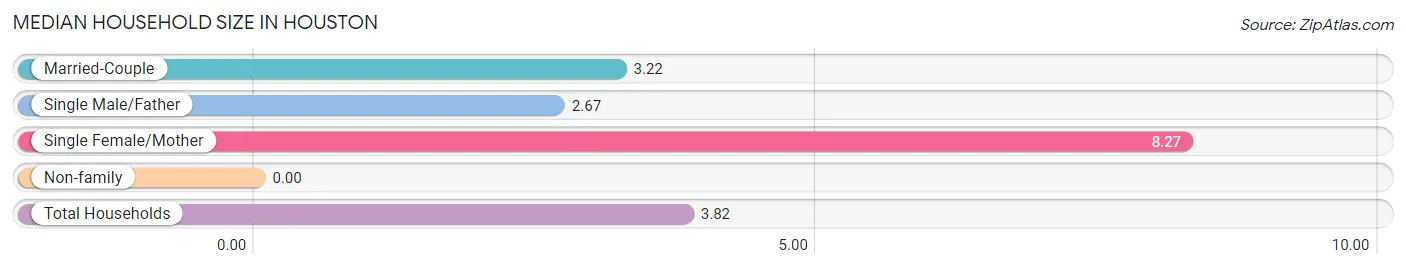
| Household Type | # Households | Household Size |
| Married-Couple | 37 (60.7%) | 3.22 |
| Single Male/Father | 6 (9.8%) | 2.67 |
| Single Female/Mother | 11 (18.0%) | 8.27 |
| Non-family | 7 (11.5%) | - |
| Total Households | 61 (100.0%) | 3.82 |
Household Size by Marriage Status in Houston
Out of a total of 61 households in Houston, 54 (88.5%) are family households, while 7 (11.5%) are nonfamily households. The most numerous type of family households are 2-person households, comprising 24, and the most common type of nonfamily households are 1-person households, comprising 7.
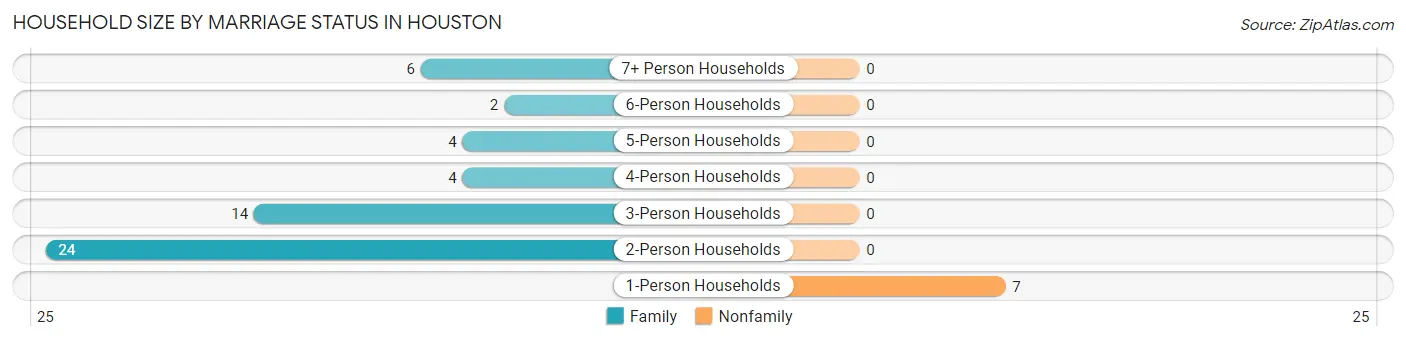
| Household Size | Family Households | Nonfamily Households |
| 1-Person Households | - | 7 (11.5%) |
| 2-Person Households | 24 (39.3%) | 0 (0.0%) |
| 3-Person Households | 14 (23.0%) | 0 (0.0%) |
| 4-Person Households | 4 (6.6%) | 0 (0.0%) |
| 5-Person Households | 4 (6.6%) | 0 (0.0%) |
| 6-Person Households | 2 (3.3%) | 0 (0.0%) |
| 7+ Person Households | 6 (9.8%) | 0 (0.0%) |
| Total | 54 (88.5%) | 7 (11.5%) |
Female Fertility in Houston
Fertility by Age in Houston
Average fertility rate in Houston is 250.0 births per 1,000 women. Women in the age bracket of 20 to 34 years have the highest fertility rate with 417.0 births per 1,000 women. Women in the age bracket of 20 to 34 years acount for 100.0% of all women with births.
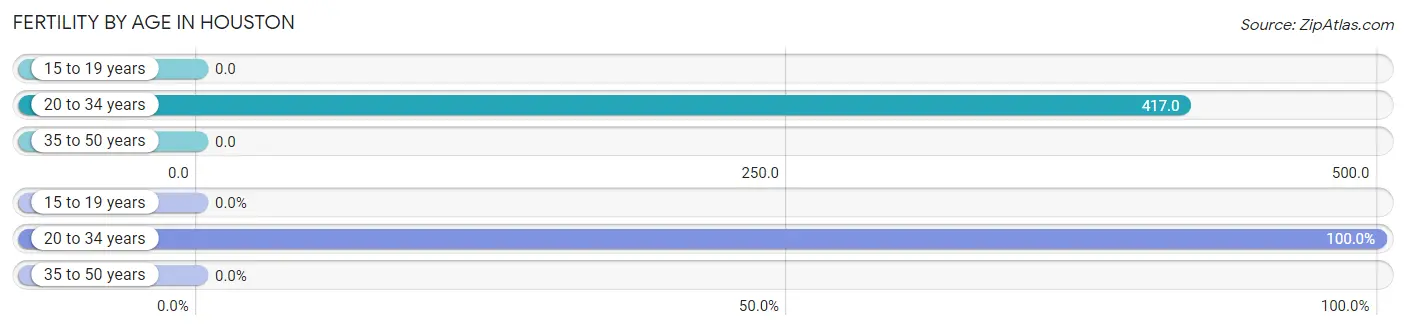
| Age Bracket | Women with Births | Births / 1,000 Women |
| 15 to 19 years | 0 (0.0%) | 0.0 |
| 20 to 34 years | 10 (100.0%) | 417.0 |
| 35 to 50 years | 0 (0.0%) | 0.0 |
| Total | 10 (100.0%) | 250.0 |
Fertility by Age by Marriage Status in Houston
40.0% of women with births (10) in Houston are married. The highest percentage of unmarried women with births falls into 20 to 34 years age bracket with 60.0% of them unmarried at the time of birth, while the lowest percentage of unmarried women with births belong to 20 to 34 years age bracket with 60.0% of them unmarried.
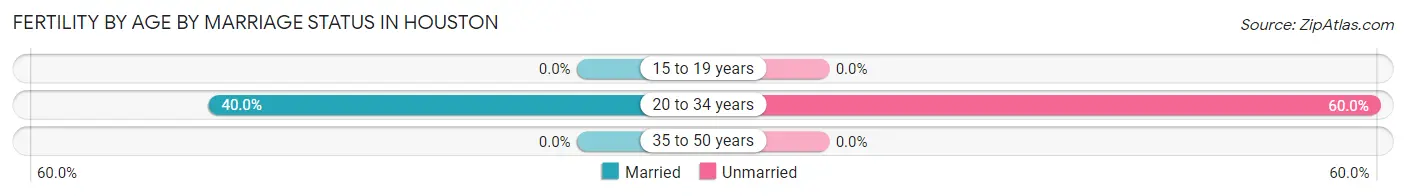
| Age Bracket | Married | Unmarried |
| 15 to 19 years | 0 (0.0%) | 0 (0.0%) |
| 20 to 34 years | 4 (40.0%) | 6 (60.0%) |
| 35 to 50 years | 0 (0.0%) | 0 (0.0%) |
| Total | 4 (40.0%) | 6 (60.0%) |
Fertility by Education in Houston
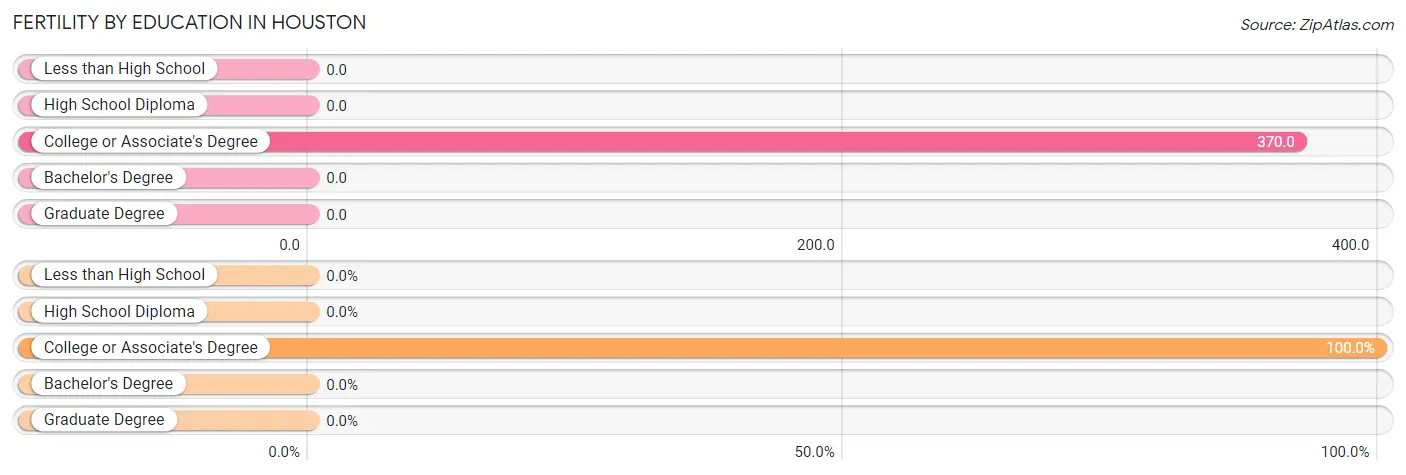
| Educational Attainment | Women with Births | Births / 1,000 Women |
| Less than High School | 0 (0.0%) | 0.0 |
| High School Diploma | 0 (0.0%) | 0.0 |
| College or Associate's Degree | 10 (100.0%) | 370.0 |
| Bachelor's Degree | 0 (0.0%) | 0.0 |
| Graduate Degree | 0 (0.0%) | 0.0 |
| Total | 10 (100.0%) | 250.0 |
Fertility by Education by Marriage Status in Houston
60.0% of women with births in Houston are unmarried. Women with the educational attainment of college or associate's degree are most likely to be married with 40.0% of them married at childbirth, while women with the educational attainment of college or associate's degree are least likely to be married with 60.0% of them unmarried at childbirth.
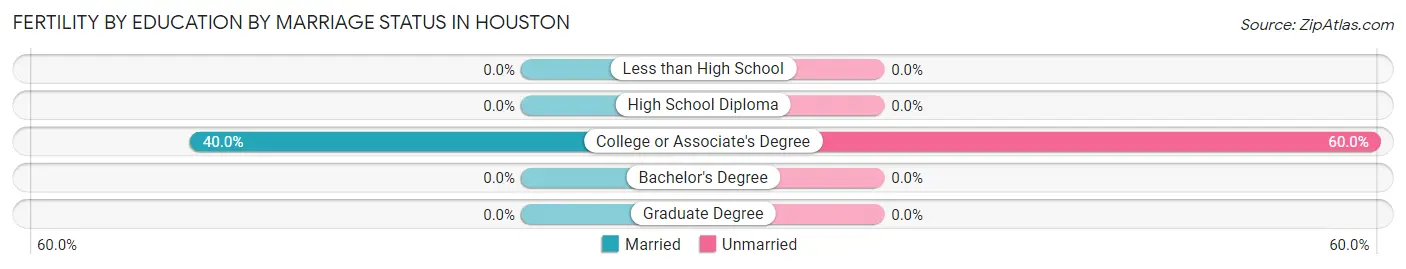
| Educational Attainment | Married | Unmarried |
| Less than High School | 0 (0.0%) | 0 (0.0%) |
| High School Diploma | 0 (0.0%) | 0 (0.0%) |
| College or Associate's Degree | 4 (40.0%) | 6 (60.0%) |
| Bachelor's Degree | 0 (0.0%) | 0 (0.0%) |
| Graduate Degree | 0 (0.0%) | 0 (0.0%) |
| Total | 4 (40.0%) | 6 (60.0%) |
Employment Characteristics in Houston
Employment by Class of Employer in Houston
Among the 75 employed individuals in Houston, private company employees (31 | 41.3%), local government employees (19 | 25.3%), and not-for-profit organizations (11 | 14.7%) make up the most common classes of employment.
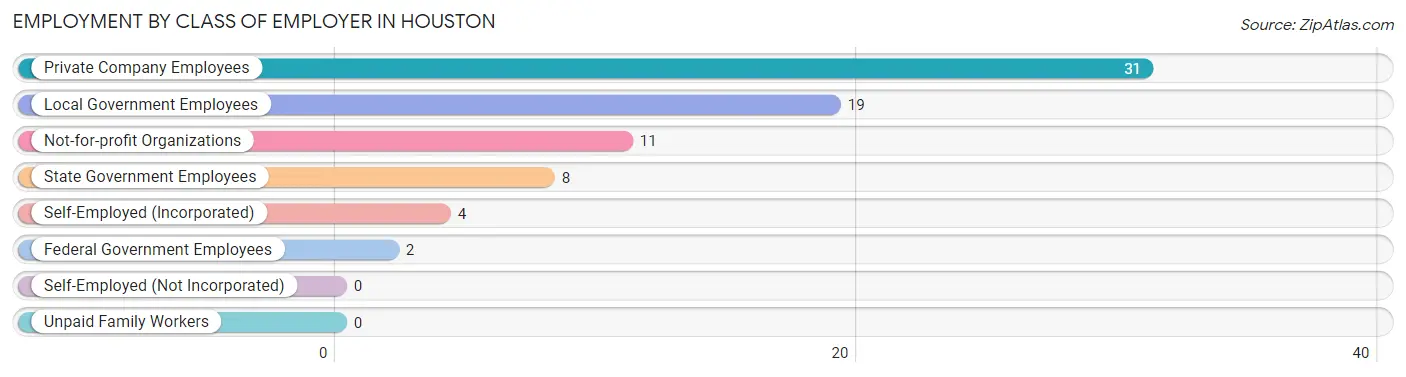
| Employer Class | # Employees | % Employees |
| Private Company Employees | 31 | 41.3% |
| Self-Employed (Incorporated) | 4 | 5.3% |
| Self-Employed (Not Incorporated) | 0 | 0.0% |
| Not-for-profit Organizations | 11 | 14.7% |
| Local Government Employees | 19 | 25.3% |
| State Government Employees | 8 | 10.7% |
| Federal Government Employees | 2 | 2.7% |
| Unpaid Family Workers | 0 | 0.0% |
| Total | 75 | 100.0% |
Employment Status by Age in Houston
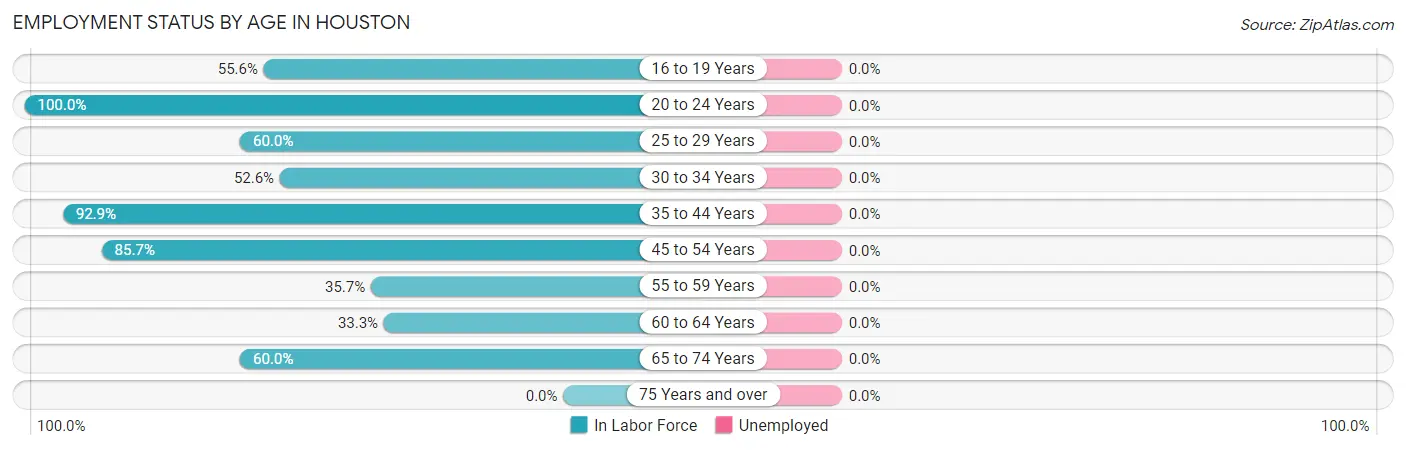
| Age Bracket | In Labor Force | Unemployed |
| 16 to 19 Years | 5 (55.6%) | 0 (0.0%) |
| 20 to 24 Years | 9 (100.0%) | 0 (0.0%) |
| 25 to 29 Years | 6 (60.0%) | 0 (0.0%) |
| 30 to 34 Years | 10 (52.6%) | 0 (0.0%) |
| 35 to 44 Years | 13 (92.9%) | 0 (0.0%) |
| 45 to 54 Years | 18 (85.7%) | 0 (0.0%) |
| 55 to 59 Years | 5 (35.7%) | 0 (0.0%) |
| 60 to 64 Years | 6 (33.3%) | 0 (0.0%) |
| 65 to 74 Years | 3 (60.0%) | 0 (0.0%) |
| 75 Years and over | 0 (0.0%) | 0 (0.0%) |
| Total | 75 (62.0%) | 0 (0.0%) |
Employment Status by Educational Attainment in Houston
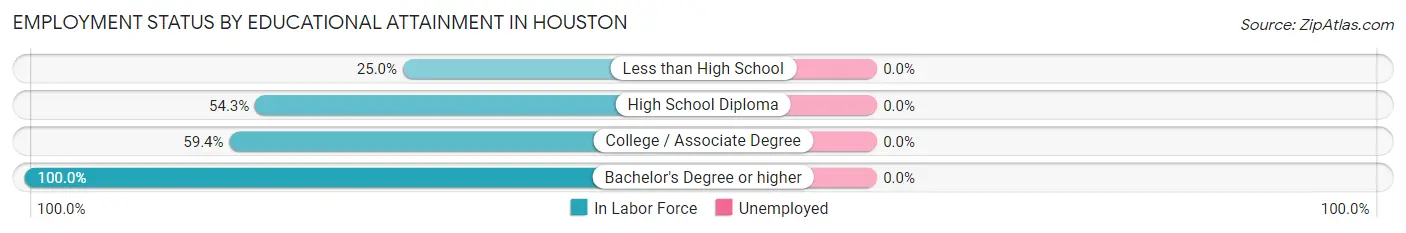
| Educational Attainment | In Labor Force | Unemployed |
| Less than High School | 3 (25.0%) | 0 (0.0%) |
| High School Diploma | 19 (54.3%) | 0 (0.0%) |
| College / Associate Degree | 19 (59.4%) | 0 (0.0%) |
| Bachelor's Degree or higher | 17 (100.0%) | 0 (0.0%) |
| Total | 58 (60.4%) | 0 (0.0%) |
Employment Occupations by Sex in Houston
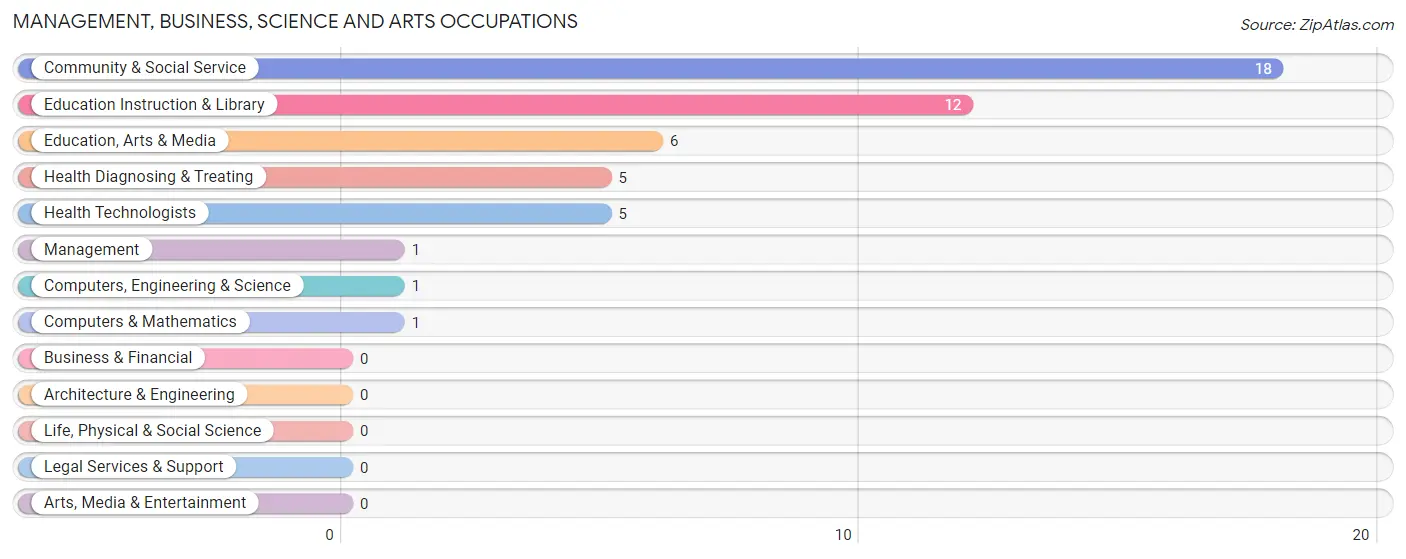
Management, Business, Science and Arts Occupations
The most common Management, Business, Science and Arts occupations in Houston are Community & Social Service (18 | 24.0%), Education Instruction & Library (12 | 16.0%), Education, Arts & Media (6 | 8.0%), Health Diagnosing & Treating (5 | 6.7%), and Health Technologists (5 | 6.7%).
Management, Business, Science and Arts Occupations by Sex
Within the Management, Business, Science and Arts occupations in Houston, the most male-oriented occupations are Computers, Engineering & Science (100.0%), Computers & Mathematics (100.0%), and Education, Arts & Media (100.0%), while the most female-oriented occupations are Management (100.0%), Health Diagnosing & Treating (100.0%), and Health Technologists (100.0%).
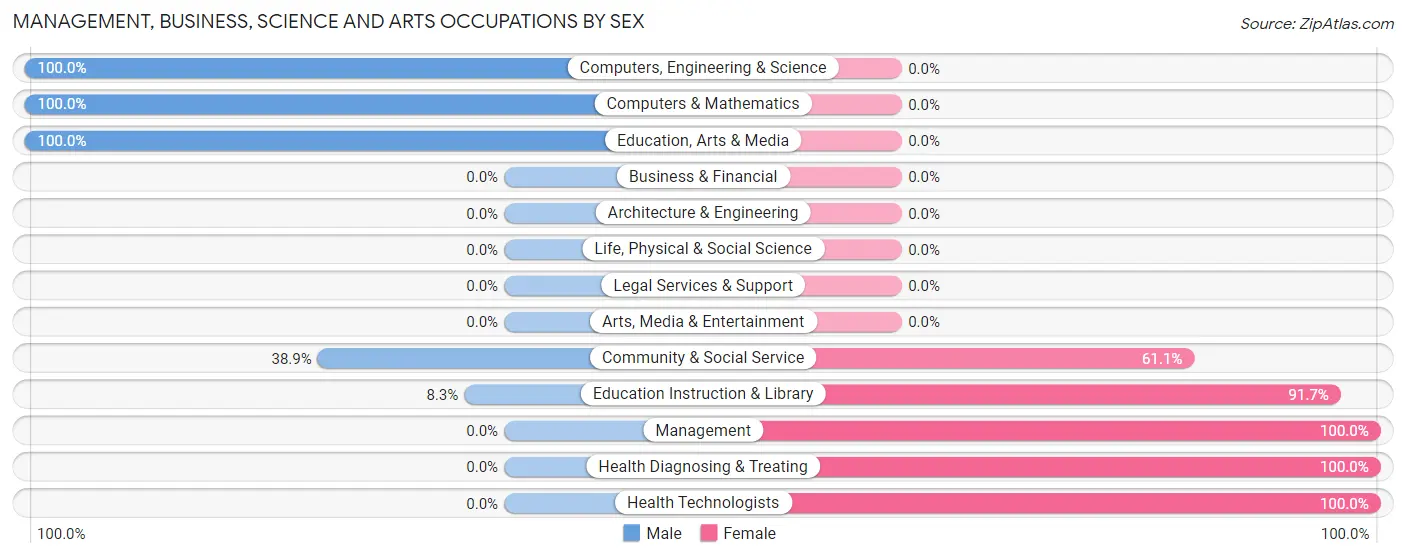
| Occupation | Male | Female |
| Management | 0 (0.0%) | 1 (100.0%) |
| Business & Financial | 0 (0.0%) | 0 (0.0%) |
| Computers, Engineering & Science | 1 (100.0%) | 0 (0.0%) |
| Computers & Mathematics | 1 (100.0%) | 0 (0.0%) |
| Architecture & Engineering | 0 (0.0%) | 0 (0.0%) |
| Life, Physical & Social Science | 0 (0.0%) | 0 (0.0%) |
| Community & Social Service | 7 (38.9%) | 11 (61.1%) |
| Education, Arts & Media | 6 (100.0%) | 0 (0.0%) |
| Legal Services & Support | 0 (0.0%) | 0 (0.0%) |
| Education Instruction & Library | 1 (8.3%) | 11 (91.7%) |
| Arts, Media & Entertainment | 0 (0.0%) | 0 (0.0%) |
| Health Diagnosing & Treating | 0 (0.0%) | 5 (100.0%) |
| Health Technologists | 0 (0.0%) | 5 (100.0%) |
| Total (Category) | 8 (32.0%) | 17 (68.0%) |
| Total (Overall) | 39 (52.0%) | 36 (48.0%) |
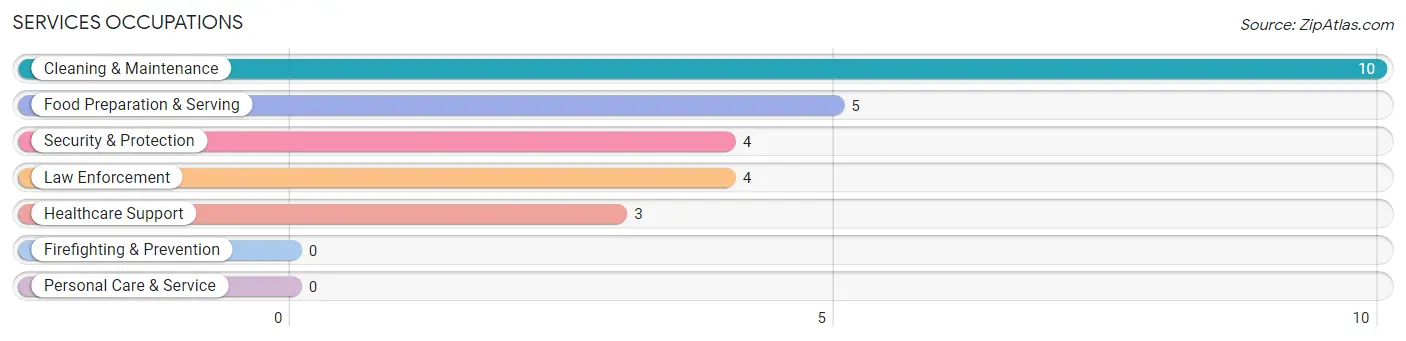
Services Occupations
The most common Services occupations in Houston are Cleaning & Maintenance (10 | 13.3%), Food Preparation & Serving (5 | 6.7%), Security & Protection (4 | 5.3%), Law Enforcement (4 | 5.3%), and Healthcare Support (3 | 4.0%).
Services Occupations by Sex
Within the Services occupations in Houston, the most male-oriented occupations are Security & Protection (100.0%), Law Enforcement (100.0%), and Food Preparation & Serving (80.0%), while the most female-oriented occupations are Healthcare Support (100.0%), Cleaning & Maintenance (60.0%), and Food Preparation & Serving (20.0%).
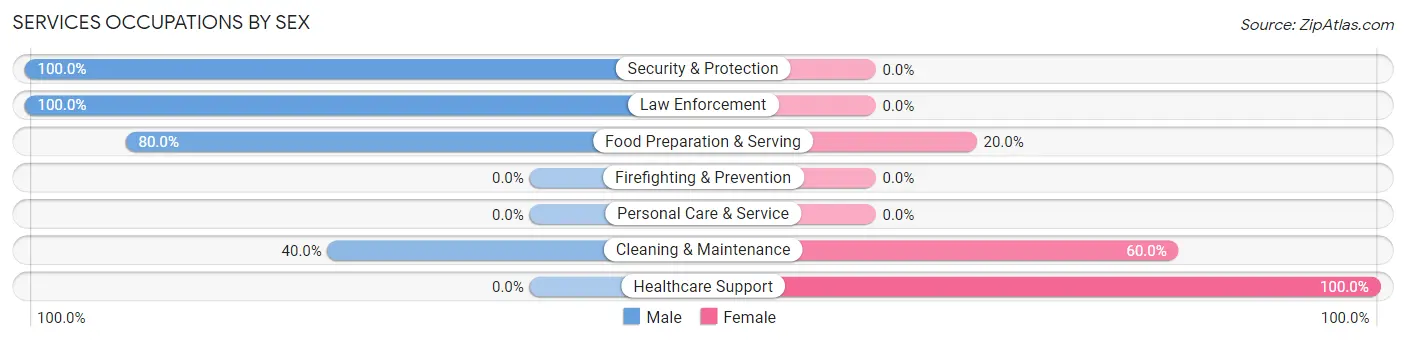
| Occupation | Male | Female |
| Healthcare Support | 0 (0.0%) | 3 (100.0%) |
| Security & Protection | 4 (100.0%) | 0 (0.0%) |
| Firefighting & Prevention | 0 (0.0%) | 0 (0.0%) |
| Law Enforcement | 4 (100.0%) | 0 (0.0%) |
| Food Preparation & Serving | 4 (80.0%) | 1 (20.0%) |
| Cleaning & Maintenance | 4 (40.0%) | 6 (60.0%) |
| Personal Care & Service | 0 (0.0%) | 0 (0.0%) |
| Total (Category) | 12 (54.5%) | 10 (45.5%) |
| Total (Overall) | 39 (52.0%) | 36 (48.0%) |
Sales and Office Occupations
The most common Sales and Office occupations in Houston are Sales & Related (7 | 9.3%), and Office & Administration (6 | 8.0%).

Sales and Office Occupations by Sex

| Occupation | Male | Female |
| Sales & Related | 6 (85.7%) | 1 (14.3%) |
| Office & Administration | 2 (33.3%) | 4 (66.7%) |
| Total (Category) | 8 (61.5%) | 5 (38.5%) |
| Total (Overall) | 39 (52.0%) | 36 (48.0%) |
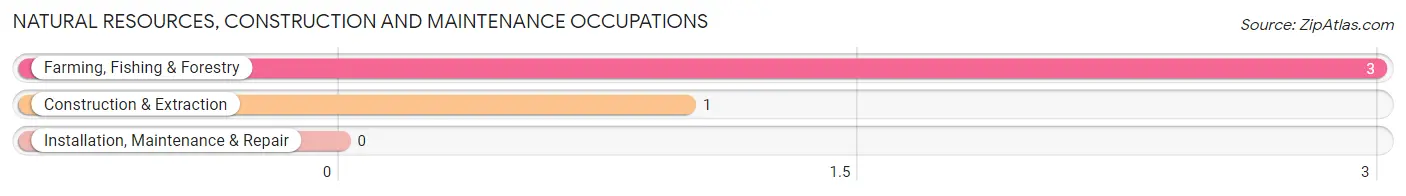
Natural Resources, Construction and Maintenance Occupations
The most common Natural Resources, Construction and Maintenance occupations in Houston are Farming, Fishing & Forestry (3 | 4.0%), and Construction & Extraction (1 | 1.3%).
Natural Resources, Construction and Maintenance Occupations by Sex
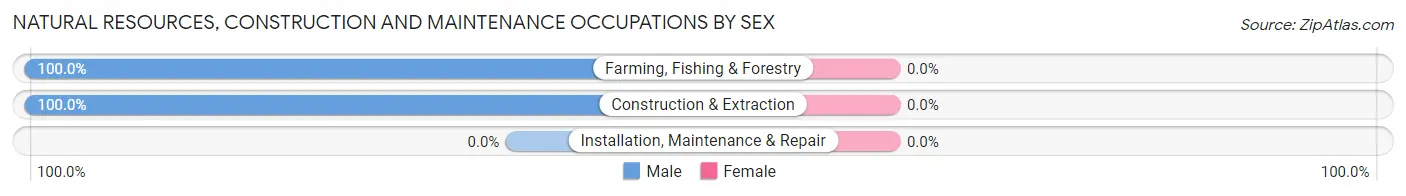
| Occupation | Male | Female |
| Farming, Fishing & Forestry | 3 (100.0%) | 0 (0.0%) |
| Construction & Extraction | 1 (100.0%) | 0 (0.0%) |
| Installation, Maintenance & Repair | 0 (0.0%) | 0 (0.0%) |
| Total (Category) | 4 (100.0%) | 0 (0.0%) |
| Total (Overall) | 39 (52.0%) | 36 (48.0%) |
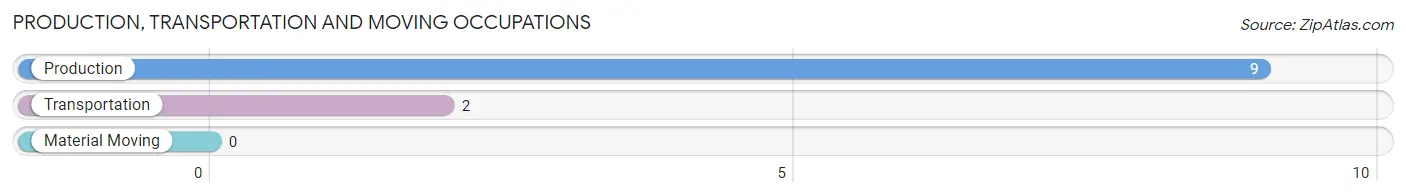
Production, Transportation and Moving Occupations
The most common Production, Transportation and Moving occupations in Houston are Production (9 | 12.0%), and Transportation (2 | 2.7%).
Production, Transportation and Moving Occupations by Sex
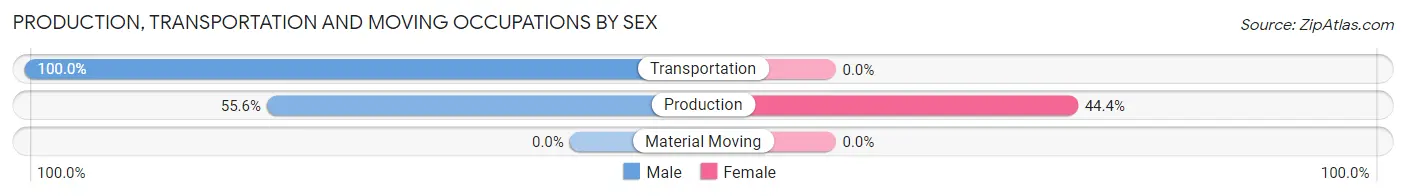
| Occupation | Male | Female |
| Production | 5 (55.6%) | 4 (44.4%) |
| Transportation | 2 (100.0%) | 0 (0.0%) |
| Material Moving | 0 (0.0%) | 0 (0.0%) |
| Total (Category) | 7 (63.6%) | 4 (36.4%) |
| Total (Overall) | 39 (52.0%) | 36 (48.0%) |
Employment Industries by Sex in Houston
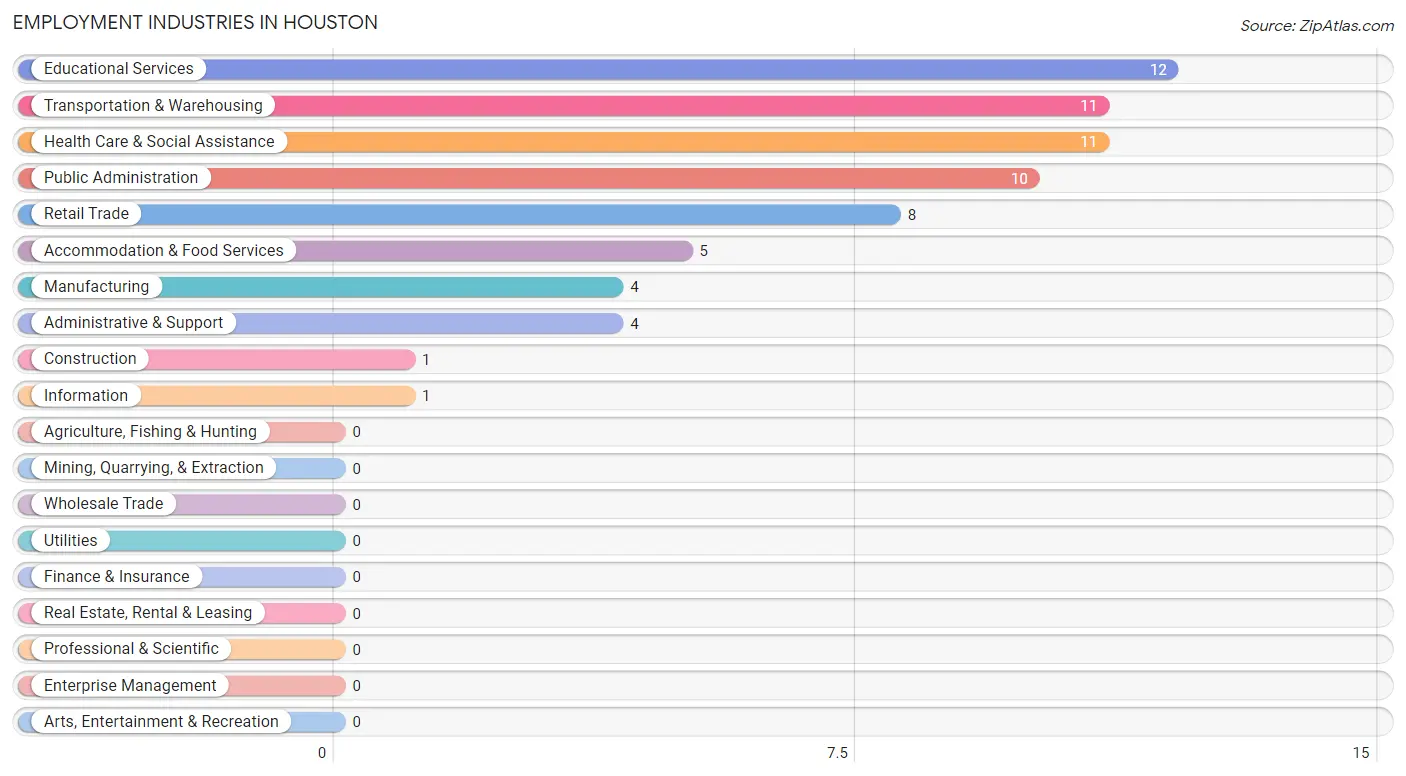
Employment Industries in Houston
The major employment industries in Houston include Educational Services (12 | 16.0%), Transportation & Warehousing (11 | 14.7%), Health Care & Social Assistance (11 | 14.7%), Public Administration (10 | 13.3%), and Retail Trade (8 | 10.7%).
Employment Industries by Sex in Houston
The Houston industries that see more men than women are Construction (100.0%), Retail Trade (100.0%), and Administrative & Support (100.0%), whereas the industries that tend to have a higher number of women are Information (100.0%), Educational Services (91.7%), and Health Care & Social Assistance (72.7%).
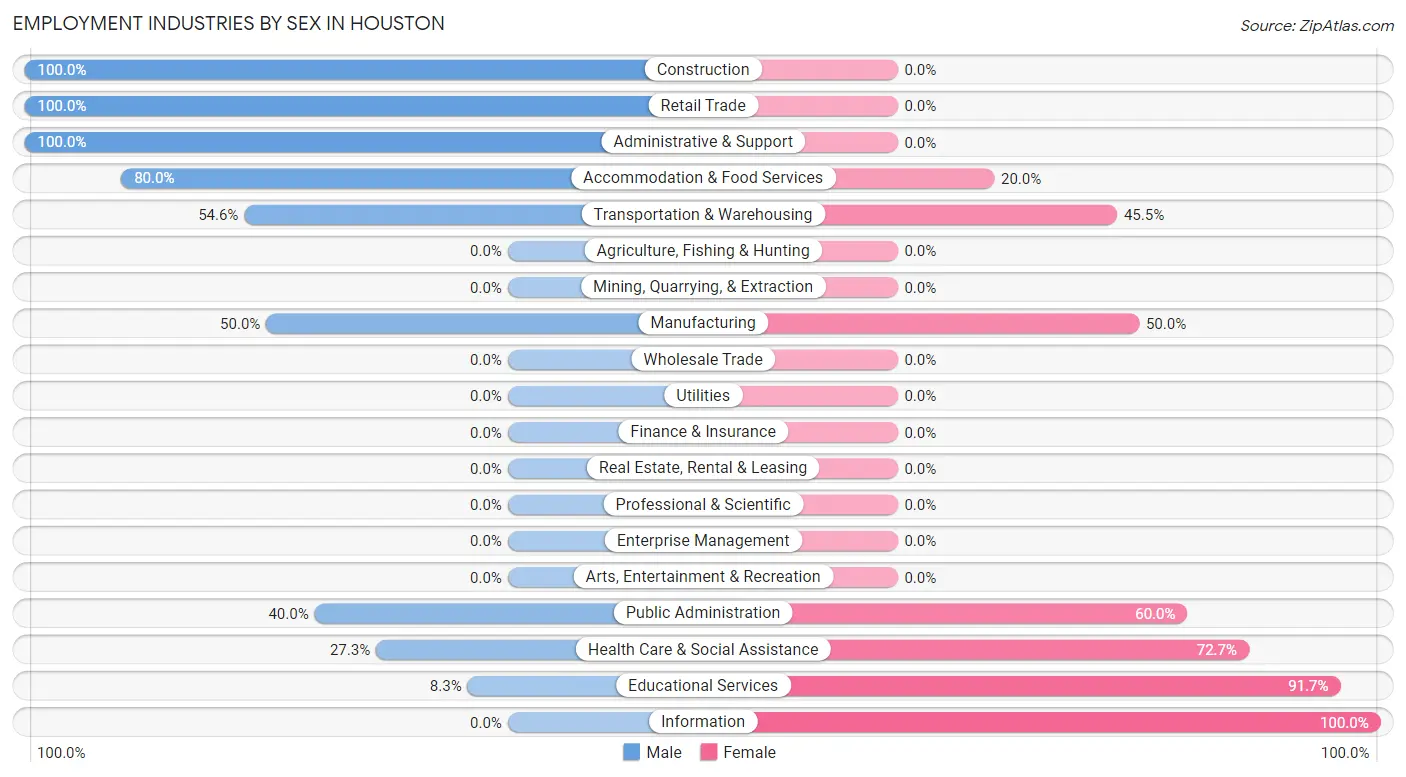
| Industry | Male | Female |
| Agriculture, Fishing & Hunting | 0 (0.0%) | 0 (0.0%) |
| Mining, Quarrying, & Extraction | 0 (0.0%) | 0 (0.0%) |
| Construction | 1 (100.0%) | 0 (0.0%) |
| Manufacturing | 2 (50.0%) | 2 (50.0%) |
| Wholesale Trade | 0 (0.0%) | 0 (0.0%) |
| Retail Trade | 8 (100.0%) | 0 (0.0%) |
| Transportation & Warehousing | 6 (54.5%) | 5 (45.5%) |
| Utilities | 0 (0.0%) | 0 (0.0%) |
| Information | 0 (0.0%) | 1 (100.0%) |
| Finance & Insurance | 0 (0.0%) | 0 (0.0%) |
| Real Estate, Rental & Leasing | 0 (0.0%) | 0 (0.0%) |
| Professional & Scientific | 0 (0.0%) | 0 (0.0%) |
| Enterprise Management | 0 (0.0%) | 0 (0.0%) |
| Administrative & Support | 4 (100.0%) | 0 (0.0%) |
| Educational Services | 1 (8.3%) | 11 (91.7%) |
| Health Care & Social Assistance | 3 (27.3%) | 8 (72.7%) |
| Arts, Entertainment & Recreation | 0 (0.0%) | 0 (0.0%) |
| Accommodation & Food Services | 4 (80.0%) | 1 (20.0%) |
| Public Administration | 4 (40.0%) | 6 (60.0%) |
| Total | 39 (52.0%) | 36 (48.0%) |
Education in Houston
School Enrollment in Houston
The most common levels of schooling among the 106 students in Houston are middle school (43 | 40.6%), nursery / preschool (23 | 21.7%), and elementary school (15 | 14.1%).
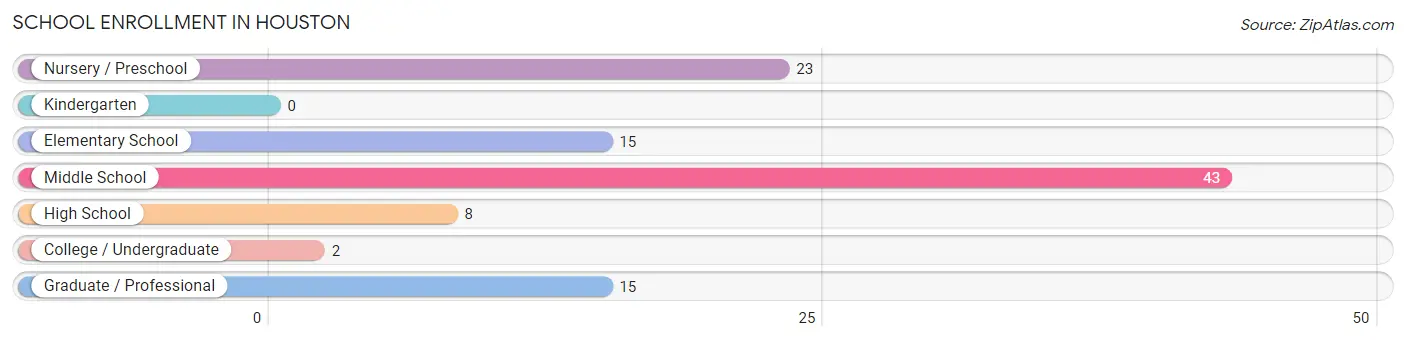
| School Level | # Students | % Students |
| Nursery / Preschool | 23 | 21.7% |
| Kindergarten | 0 | 0.0% |
| Elementary School | 15 | 14.1% |
| Middle School | 43 | 40.6% |
| High School | 8 | 7.5% |
| College / Undergraduate | 2 | 1.9% |
| Graduate / Professional | 15 | 14.1% |
| Total | 106 | 100.0% |
School Enrollment by Age by Funding Source in Houston
Out of a total of 106 students who are enrolled in schools in Houston, 6 (5.7%) attend a private institution, while the remaining 100 (94.3%) are enrolled in public schools. The age group of 35 years and over has the highest likelihood of being enrolled in private schools, with 6 (42.9% in the age bracket) enrolled. Conversely, the age group of 3 to 4 year olds has the lowest likelihood of being enrolled in a private school, with 19 (100.0% in the age bracket) attending a public institution.
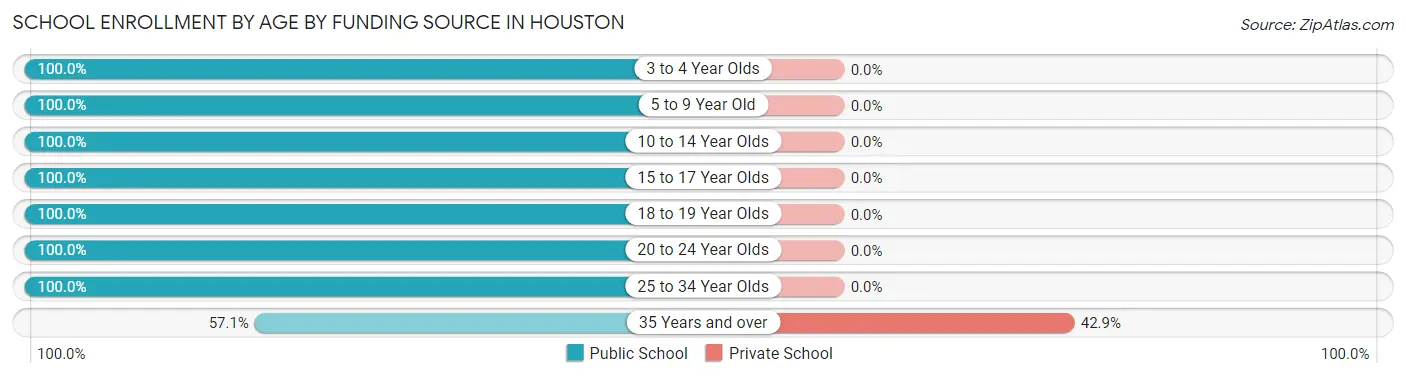
| Age Bracket | Public School | Private School |
| 3 to 4 Year Olds | 19 (100.0%) | 0 (0.0%) |
| 5 to 9 Year Old | 19 (100.0%) | 0 (0.0%) |
| 10 to 14 Year Olds | 43 (100.0%) | 0 (0.0%) |
| 15 to 17 Year Olds | 4 (100.0%) | 0 (0.0%) |
| 18 to 19 Year Olds | 4 (100.0%) | 0 (0.0%) |
| 20 to 24 Year Olds | 1 (100.0%) | 0 (0.0%) |
| 25 to 34 Year Olds | 2 (100.0%) | 0 (0.0%) |
| 35 Years and over | 8 (57.1%) | 6 (42.9%) |
| Total | 100 (94.3%) | 6 (5.7%) |
Educational Attainment by Field of Study in Houston
Business (13 | 76.5%), education (2 | 11.8%), bio, nature & agricultural (1 | 5.9%), and psychology (1 | 5.9%) are the most common fields of study among 17 individuals in Houston who have obtained a bachelor's degree or higher.
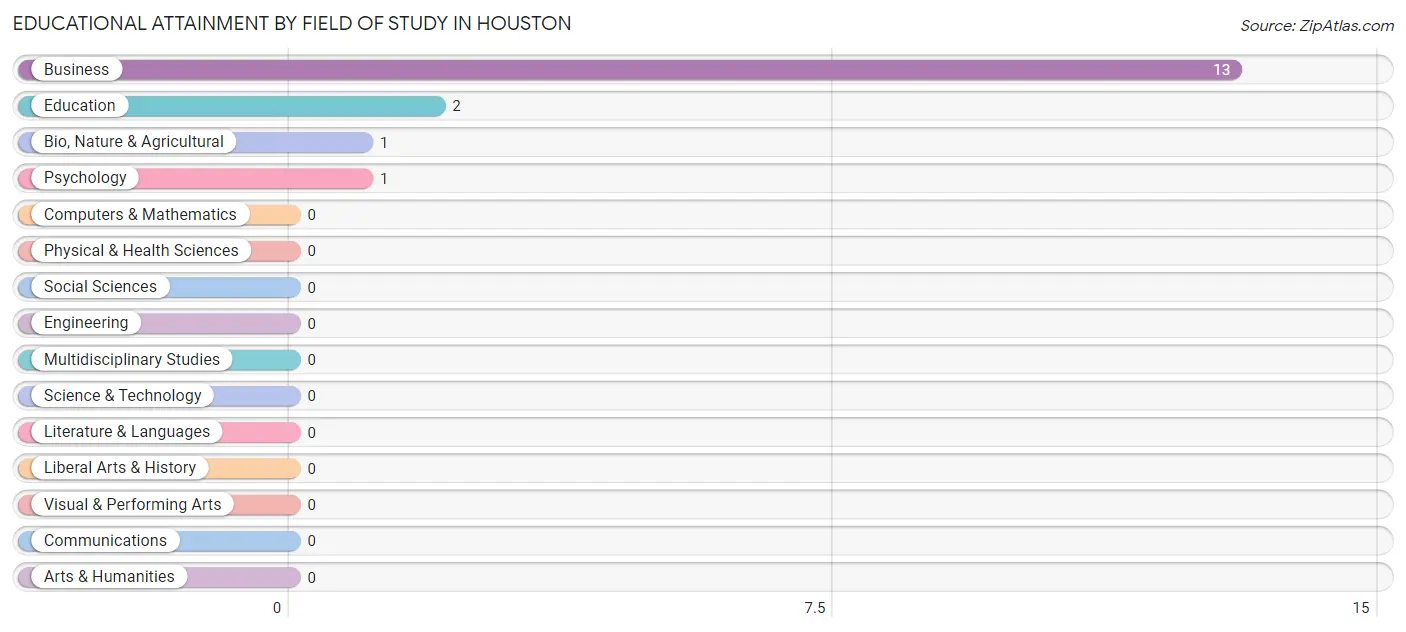
| Field of Study | # Graduates | % Graduates |
| Computers & Mathematics | 0 | 0.0% |
| Bio, Nature & Agricultural | 1 | 5.9% |
| Physical & Health Sciences | 0 | 0.0% |
| Psychology | 1 | 5.9% |
| Social Sciences | 0 | 0.0% |
| Engineering | 0 | 0.0% |
| Multidisciplinary Studies | 0 | 0.0% |
| Science & Technology | 0 | 0.0% |
| Business | 13 | 76.5% |
| Education | 2 | 11.8% |
| Literature & Languages | 0 | 0.0% |
| Liberal Arts & History | 0 | 0.0% |
| Visual & Performing Arts | 0 | 0.0% |
| Communications | 0 | 0.0% |
| Arts & Humanities | 0 | 0.0% |
| Total | 17 | 100.0% |
Transportation & Commute in Houston
Vehicle Availability by Sex in Houston
The most prevalent vehicle ownership categories in Houston are males with 3 vehicles (18, accounting for 46.2%) and females with 3 vehicles (17, making up 50.0%).
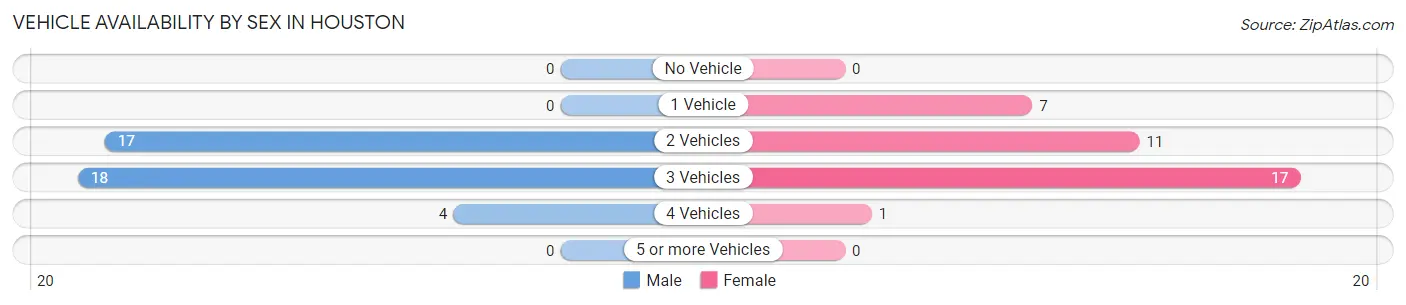
| Vehicles Available | Male | Female |
| No Vehicle | 0 (0.0%) | 0 (0.0%) |
| 1 Vehicle | 0 (0.0%) | 7 (19.4%) |
| 2 Vehicles | 17 (43.6%) | 11 (30.6%) |
| 3 Vehicles | 18 (46.2%) | 17 (47.2%) |
| 4 Vehicles | 4 (10.3%) | 1 (2.8%) |
| 5 or more Vehicles | 0 (0.0%) | 0 (0.0%) |
| Total | 39 (100.0%) | 36 (100.0%) |
Commute Time in Houston
The most frequently occuring commute durations in Houston are 30 to 34 minutes (24 commuters, 32.4%), 15 to 19 minutes (12 commuters, 16.2%), and 60 to 89 minutes (10 commuters, 13.5%).
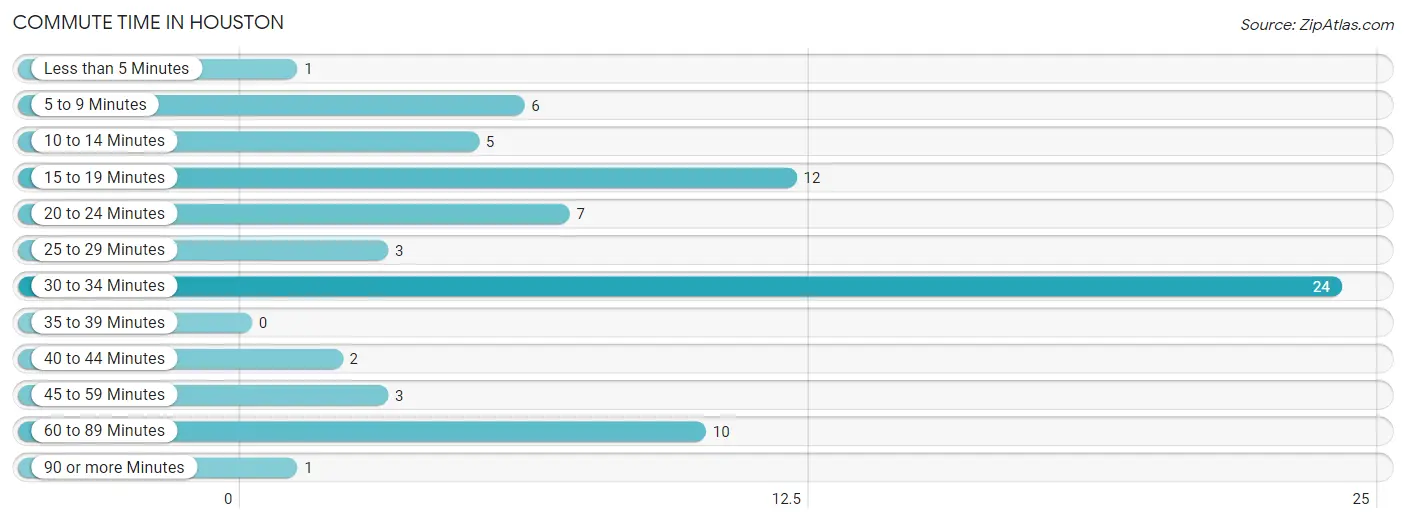
| Commute Time | # Commuters | % Commuters |
| Less than 5 Minutes | 1 | 1.3% |
| 5 to 9 Minutes | 6 | 8.1% |
| 10 to 14 Minutes | 5 | 6.8% |
| 15 to 19 Minutes | 12 | 16.2% |
| 20 to 24 Minutes | 7 | 9.5% |
| 25 to 29 Minutes | 3 | 4.1% |
| 30 to 34 Minutes | 24 | 32.4% |
| 35 to 39 Minutes | 0 | 0.0% |
| 40 to 44 Minutes | 2 | 2.7% |
| 45 to 59 Minutes | 3 | 4.1% |
| 60 to 89 Minutes | 10 | 13.5% |
| 90 or more Minutes | 1 | 1.3% |
Commute Time by Sex in Houston
The most common commute times in Houston are 30 to 34 minutes (10 commuters, 26.3%) for males and 30 to 34 minutes (14 commuters, 38.9%) for females.
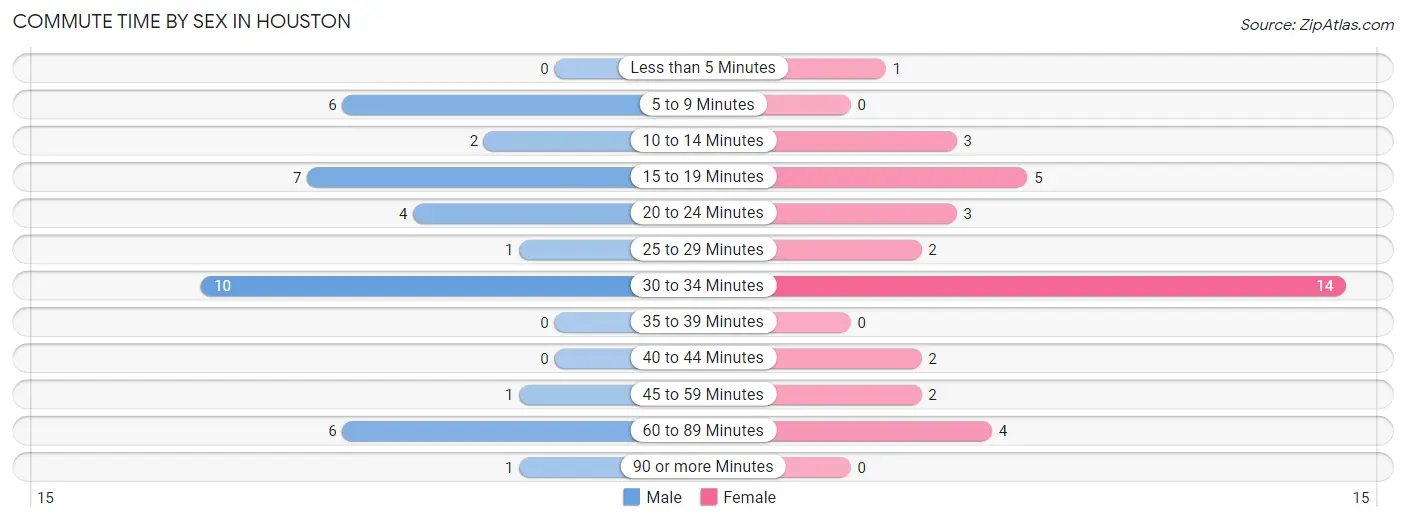
| Commute Time | Male | Female |
| Less than 5 Minutes | 0 (0.0%) | 1 (2.8%) |
| 5 to 9 Minutes | 6 (15.8%) | 0 (0.0%) |
| 10 to 14 Minutes | 2 (5.3%) | 3 (8.3%) |
| 15 to 19 Minutes | 7 (18.4%) | 5 (13.9%) |
| 20 to 24 Minutes | 4 (10.5%) | 3 (8.3%) |
| 25 to 29 Minutes | 1 (2.6%) | 2 (5.6%) |
| 30 to 34 Minutes | 10 (26.3%) | 14 (38.9%) |
| 35 to 39 Minutes | 0 (0.0%) | 0 (0.0%) |
| 40 to 44 Minutes | 0 (0.0%) | 2 (5.6%) |
| 45 to 59 Minutes | 1 (2.6%) | 2 (5.6%) |
| 60 to 89 Minutes | 6 (15.8%) | 4 (11.1%) |
| 90 or more Minutes | 1 (2.6%) | 0 (0.0%) |
Time of Departure to Work by Sex in Houston
The most frequent times of departure to work in Houston are 8:00 AM to 8:29 AM (8, 21.0%) for males and 7:00 AM to 7:29 AM (13, 36.1%) for females.
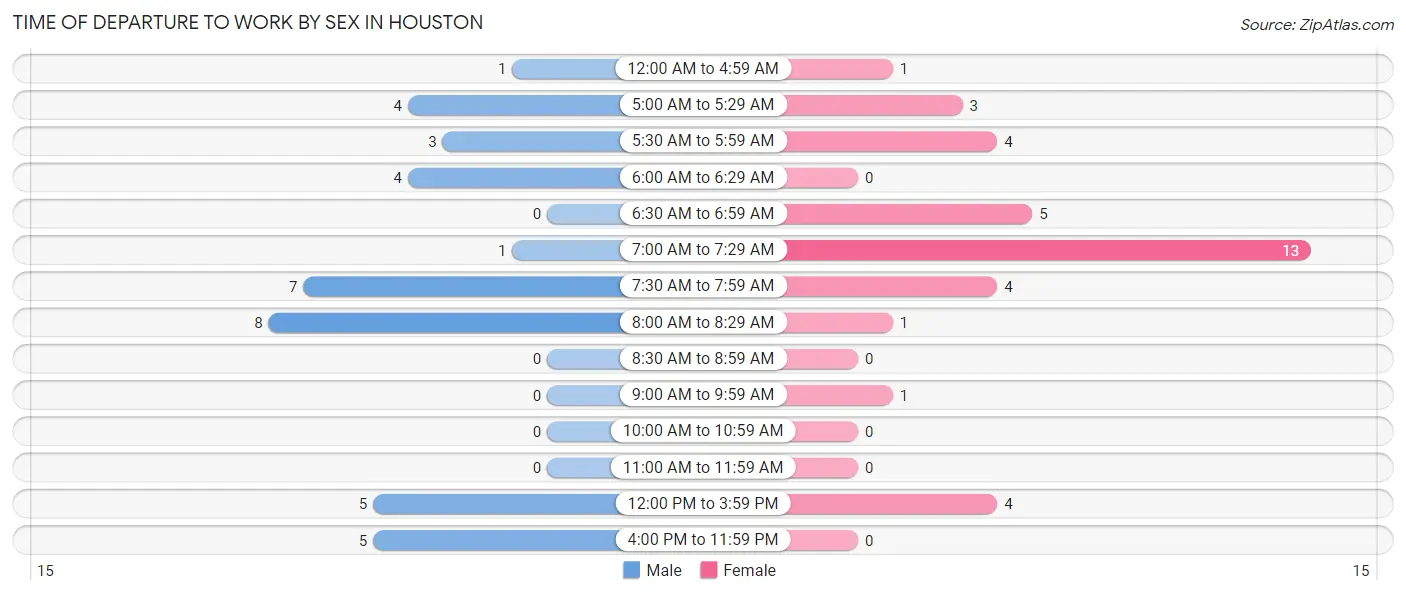
| Time of Departure | Male | Female |
| 12:00 AM to 4:59 AM | 1 (2.6%) | 1 (2.8%) |
| 5:00 AM to 5:29 AM | 4 (10.5%) | 3 (8.3%) |
| 5:30 AM to 5:59 AM | 3 (7.9%) | 4 (11.1%) |
| 6:00 AM to 6:29 AM | 4 (10.5%) | 0 (0.0%) |
| 6:30 AM to 6:59 AM | 0 (0.0%) | 5 (13.9%) |
| 7:00 AM to 7:29 AM | 1 (2.6%) | 13 (36.1%) |
| 7:30 AM to 7:59 AM | 7 (18.4%) | 4 (11.1%) |
| 8:00 AM to 8:29 AM | 8 (21.0%) | 1 (2.8%) |
| 8:30 AM to 8:59 AM | 0 (0.0%) | 0 (0.0%) |
| 9:00 AM to 9:59 AM | 0 (0.0%) | 1 (2.8%) |
| 10:00 AM to 10:59 AM | 0 (0.0%) | 0 (0.0%) |
| 11:00 AM to 11:59 AM | 0 (0.0%) | 0 (0.0%) |
| 12:00 PM to 3:59 PM | 5 (13.2%) | 4 (11.1%) |
| 4:00 PM to 11:59 PM | 5 (13.2%) | 0 (0.0%) |
| Total | 38 (100.0%) | 36 (100.0%) |
Housing Occupancy in Houston
Occupancy by Ownership in Houston
Of the total 61 dwellings in Houston, owner-occupied units account for 36 (59.0%), while renter-occupied units make up 25 (41.0%).
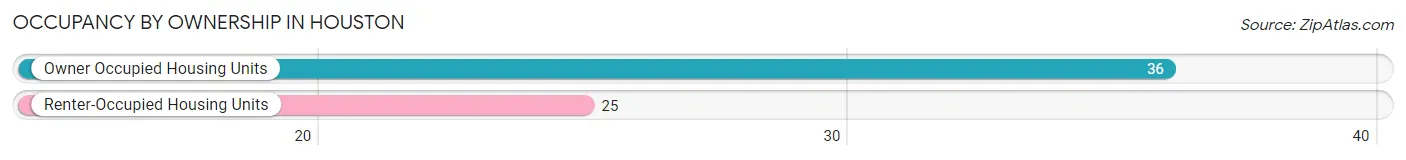
| Occupancy | # Housing Units | % Housing Units |
| Owner Occupied Housing Units | 36 | 59.0% |
| Renter-Occupied Housing Units | 25 | 41.0% |
| Total Occupied Housing Units | 61 | 100.0% |
Occupancy by Household Size in Houston
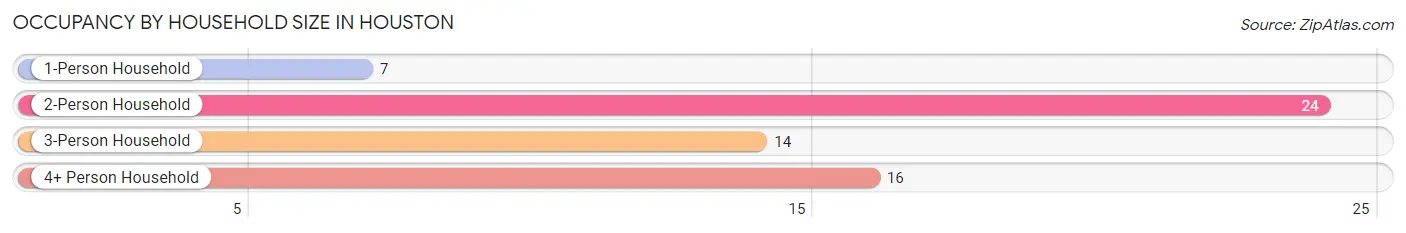
| Household Size | # Housing Units | % Housing Units |
| 1-Person Household | 7 | 11.5% |
| 2-Person Household | 24 | 39.3% |
| 3-Person Household | 14 | 23.0% |
| 4+ Person Household | 16 | 26.2% |
| Total Housing Units | 61 | 100.0% |
Occupancy by Ownership by Household Size in Houston
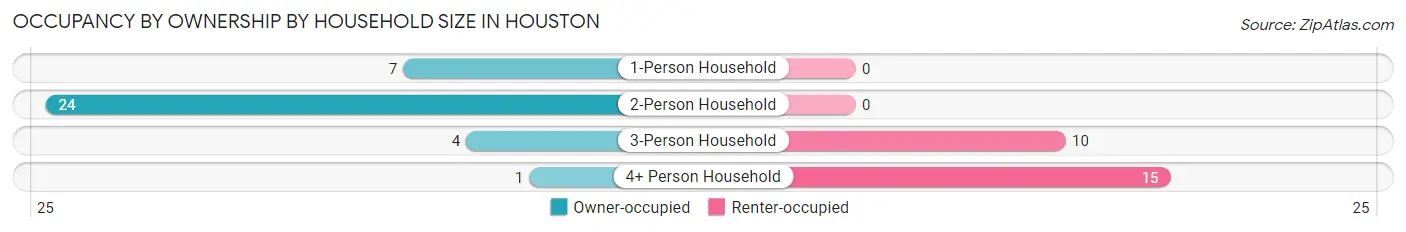
| Household Size | Owner-occupied | Renter-occupied |
| 1-Person Household | 7 (100.0%) | 0 (0.0%) |
| 2-Person Household | 24 (100.0%) | 0 (0.0%) |
| 3-Person Household | 4 (28.6%) | 10 (71.4%) |
| 4+ Person Household | 1 (6.2%) | 15 (93.8%) |
| Total Housing Units | 36 (59.0%) | 25 (41.0%) |
Occupancy by Educational Attainment in Houston
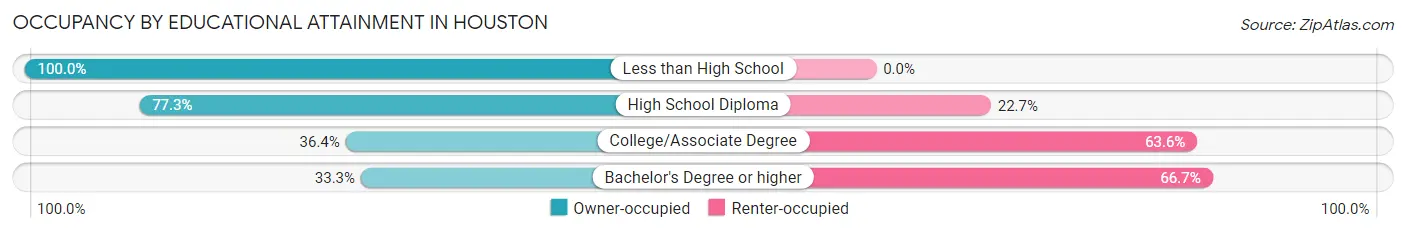
| Household Size | Owner-occupied | Renter-occupied |
| Less than High School | 8 (100.0%) | 0 (0.0%) |
| High School Diploma | 17 (77.3%) | 5 (22.7%) |
| College/Associate Degree | 8 (36.4%) | 14 (63.6%) |
| Bachelor's Degree or higher | 3 (33.3%) | 6 (66.7%) |
Occupancy by Age of Householder in Houston
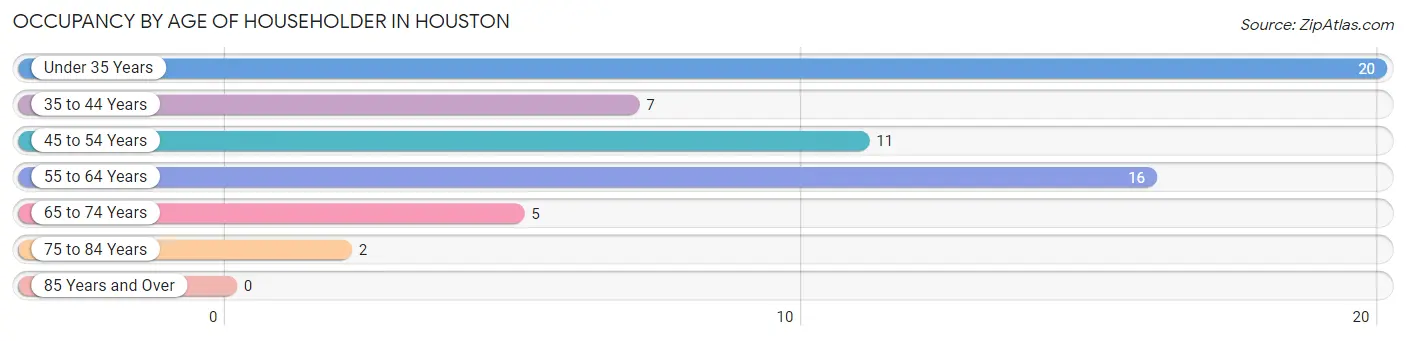
| Age Bracket | # Households | % Households |
| Under 35 Years | 20 | 32.8% |
| 35 to 44 Years | 7 | 11.5% |
| 45 to 54 Years | 11 | 18.0% |
| 55 to 64 Years | 16 | 26.2% |
| 65 to 74 Years | 5 | 8.2% |
| 75 to 84 Years | 2 | 3.3% |
| 85 Years and Over | 0 | 0.0% |
| Total | 61 | 100.0% |
Housing Finances in Houston
Median Income by Occupancy in Houston
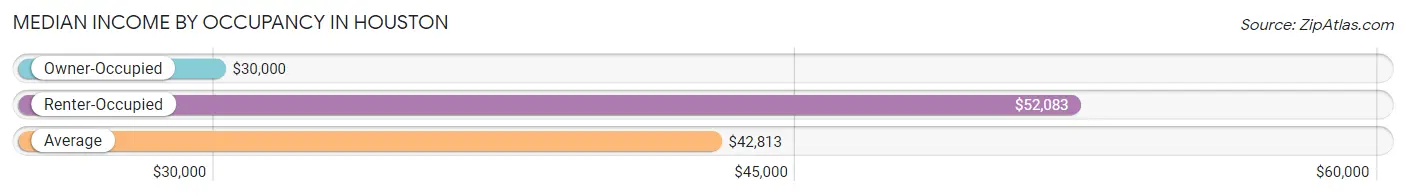
| Occupancy Type | # Households | Median Income |
| Owner-Occupied | 36 (59.0%) | $30,000 |
| Renter-Occupied | 25 (41.0%) | $52,083 |
| Average | 61 (100.0%) | $42,813 |
Occupancy by Householder Income Bracket in Houston
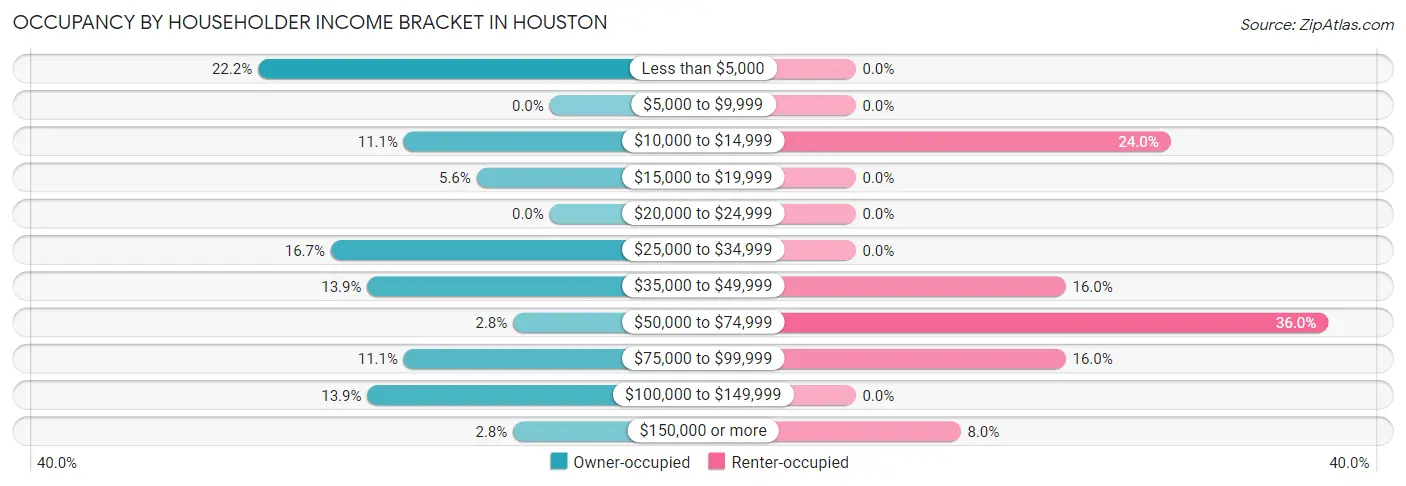
| Income Bracket | Owner-occupied | Renter-occupied |
| Less than $5,000 | 8 (22.2%) | 0 (0.0%) |
| $5,000 to $9,999 | 0 (0.0%) | 0 (0.0%) |
| $10,000 to $14,999 | 4 (11.1%) | 6 (24.0%) |
| $15,000 to $19,999 | 2 (5.6%) | 0 (0.0%) |
| $20,000 to $24,999 | 0 (0.0%) | 0 (0.0%) |
| $25,000 to $34,999 | 6 (16.7%) | 0 (0.0%) |
| $35,000 to $49,999 | 5 (13.9%) | 4 (16.0%) |
| $50,000 to $74,999 | 1 (2.8%) | 9 (36.0%) |
| $75,000 to $99,999 | 4 (11.1%) | 4 (16.0%) |
| $100,000 to $149,999 | 5 (13.9%) | 0 (0.0%) |
| $150,000 or more | 1 (2.8%) | 2 (8.0%) |
| Total | 36 (100.0%) | 25 (100.0%) |
Monthly Housing Cost Tiers in Houston
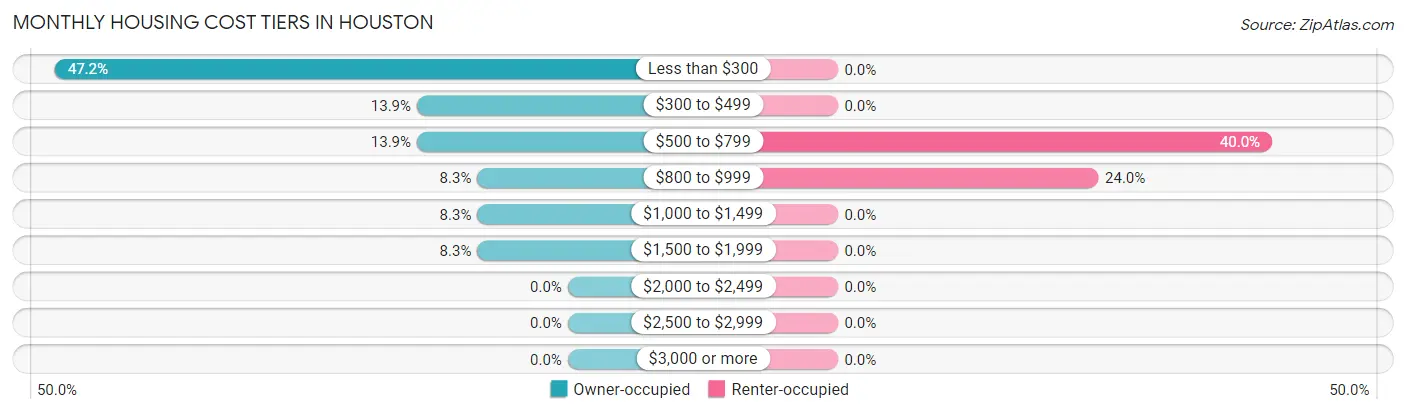
| Monthly Cost | Owner-occupied | Renter-occupied |
| Less than $300 | 17 (47.2%) | 0 (0.0%) |
| $300 to $499 | 5 (13.9%) | 0 (0.0%) |
| $500 to $799 | 5 (13.9%) | 10 (40.0%) |
| $800 to $999 | 3 (8.3%) | 6 (24.0%) |
| $1,000 to $1,499 | 3 (8.3%) | 0 (0.0%) |
| $1,500 to $1,999 | 3 (8.3%) | 0 (0.0%) |
| $2,000 to $2,499 | 0 (0.0%) | 0 (0.0%) |
| $2,500 to $2,999 | 0 (0.0%) | 0 (0.0%) |
| $3,000 or more | 0 (0.0%) | 0 (0.0%) |
| Total | 36 (100.0%) | 25 (100.0%) |
Physical Housing Characteristics in Houston
Housing Structures in Houston
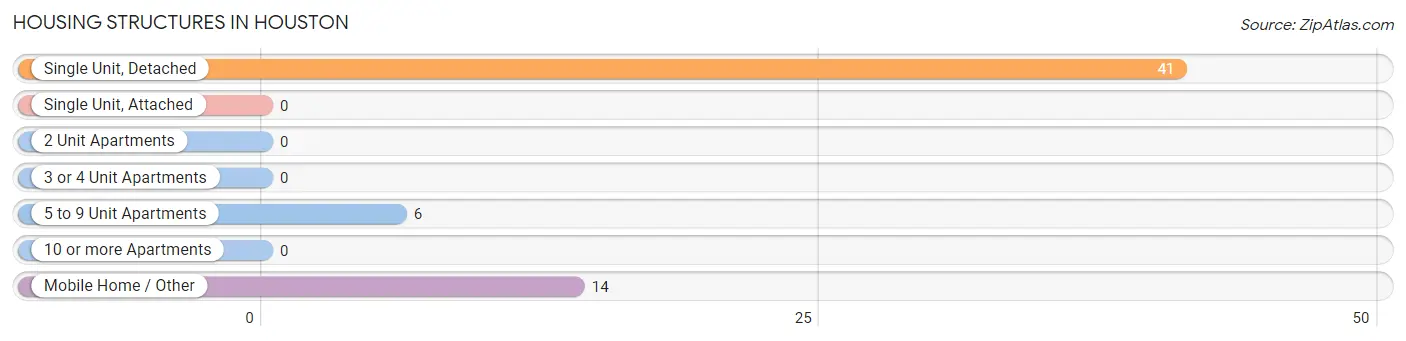
| Structure Type | # Housing Units | % Housing Units |
| Single Unit, Detached | 41 | 67.2% |
| Single Unit, Attached | 0 | 0.0% |
| 2 Unit Apartments | 0 | 0.0% |
| 3 or 4 Unit Apartments | 0 | 0.0% |
| 5 to 9 Unit Apartments | 6 | 9.8% |
| 10 or more Apartments | 0 | 0.0% |
| Mobile Home / Other | 14 | 23.0% |
| Total | 61 | 100.0% |
Housing Structures by Occupancy in Houston
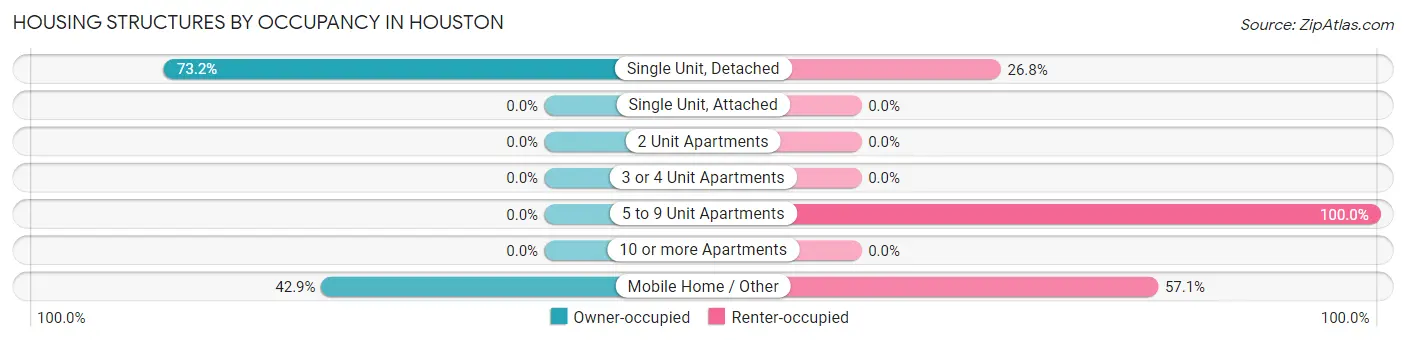
| Structure Type | Owner-occupied | Renter-occupied |
| Single Unit, Detached | 30 (73.2%) | 11 (26.8%) |
| Single Unit, Attached | 0 (0.0%) | 0 (0.0%) |
| 2 Unit Apartments | 0 (0.0%) | 0 (0.0%) |
| 3 or 4 Unit Apartments | 0 (0.0%) | 0 (0.0%) |
| 5 to 9 Unit Apartments | 0 (0.0%) | 6 (100.0%) |
| 10 or more Apartments | 0 (0.0%) | 0 (0.0%) |
| Mobile Home / Other | 6 (42.9%) | 8 (57.1%) |
| Total | 36 (59.0%) | 25 (41.0%) |
Housing Structures by Number of Rooms in Houston
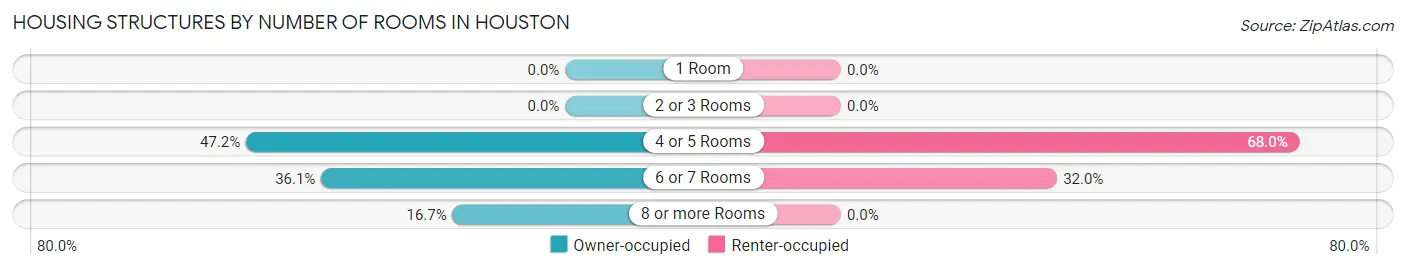
| Number of Rooms | Owner-occupied | Renter-occupied |
| 1 Room | 0 (0.0%) | 0 (0.0%) |
| 2 or 3 Rooms | 0 (0.0%) | 0 (0.0%) |
| 4 or 5 Rooms | 17 (47.2%) | 17 (68.0%) |
| 6 or 7 Rooms | 13 (36.1%) | 8 (32.0%) |
| 8 or more Rooms | 6 (16.7%) | 0 (0.0%) |
| Total | 36 (100.0%) | 25 (100.0%) |
Housing Structure by Heating Type in Houston
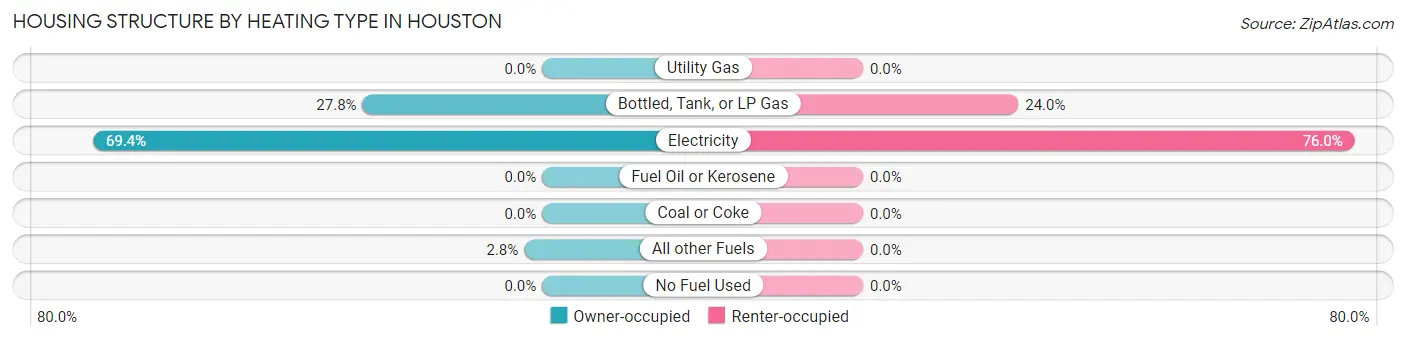
| Heating Type | Owner-occupied | Renter-occupied |
| Utility Gas | 0 (0.0%) | 0 (0.0%) |
| Bottled, Tank, or LP Gas | 10 (27.8%) | 6 (24.0%) |
| Electricity | 25 (69.4%) | 19 (76.0%) |
| Fuel Oil or Kerosene | 0 (0.0%) | 0 (0.0%) |
| Coal or Coke | 0 (0.0%) | 0 (0.0%) |
| All other Fuels | 1 (2.8%) | 0 (0.0%) |
| No Fuel Used | 0 (0.0%) | 0 (0.0%) |
| Total | 36 (100.0%) | 25 (100.0%) |
Household Vehicle Usage in Houston
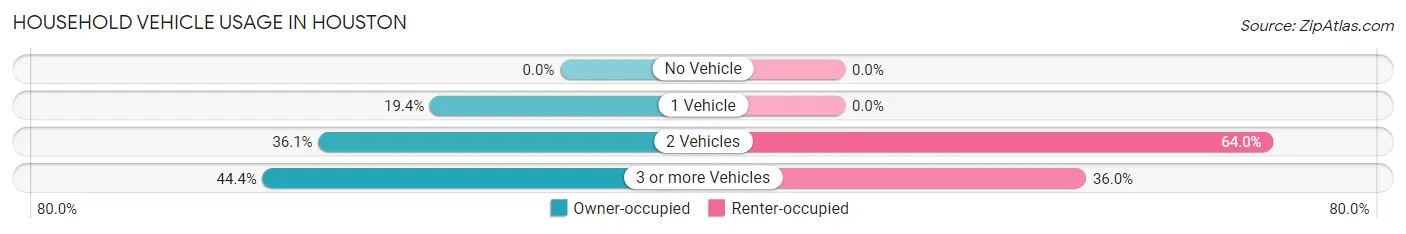
| Vehicles per Household | Owner-occupied | Renter-occupied |
| No Vehicle | 0 (0.0%) | 0 (0.0%) |
| 1 Vehicle | 7 (19.4%) | 0 (0.0%) |
| 2 Vehicles | 13 (36.1%) | 16 (64.0%) |
| 3 or more Vehicles | 16 (44.4%) | 9 (36.0%) |
| Total | 36 (100.0%) | 25 (100.0%) |
Real Estate & Mortgages in Houston
Real Estate and Mortgage Overview in Houston
| Characteristic | Without Mortgage | With Mortgage |
| Housing Units | 21 | 15 |
| Median Property Value | $91,400 | $120,800 |
| Median Household Income | - | - |
| Monthly Housing Costs | $216 | $0 |
| Real Estate Taxes | $258 | $3 |
Property Value by Mortgage Status in Houston
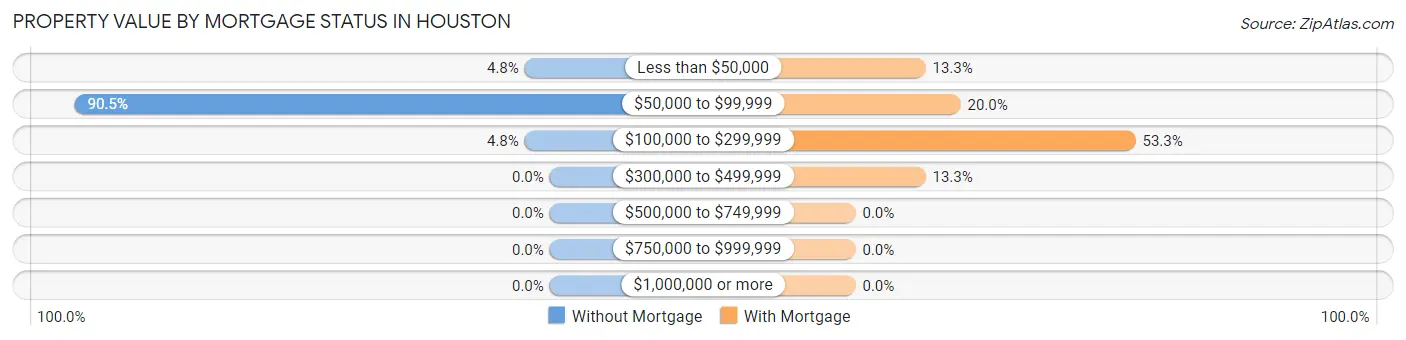
| Property Value | Without Mortgage | With Mortgage |
| Less than $50,000 | 1 (4.8%) | 2 (13.3%) |
| $50,000 to $99,999 | 19 (90.5%) | 3 (20.0%) |
| $100,000 to $299,999 | 1 (4.8%) | 8 (53.3%) |
| $300,000 to $499,999 | 0 (0.0%) | 2 (13.3%) |
| $500,000 to $749,999 | 0 (0.0%) | 0 (0.0%) |
| $750,000 to $999,999 | 0 (0.0%) | 0 (0.0%) |
| $1,000,000 or more | 0 (0.0%) | 0 (0.0%) |
| Total | 21 (100.0%) | 15 (100.0%) |
Household Income by Mortgage Status in Houston
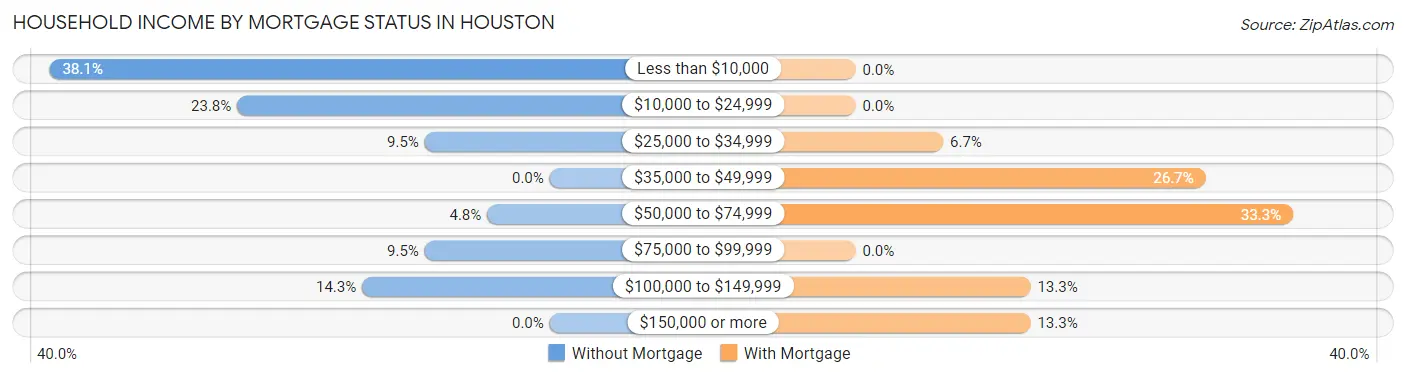
| Household Income | Without Mortgage | With Mortgage |
| Less than $10,000 | 8 (38.1%) | 0 (0.0%) |
| $10,000 to $24,999 | 5 (23.8%) | 0 (0.0%) |
| $25,000 to $34,999 | 2 (9.5%) | 1 (6.7%) |
| $35,000 to $49,999 | 0 (0.0%) | 4 (26.7%) |
| $50,000 to $74,999 | 1 (4.8%) | 5 (33.3%) |
| $75,000 to $99,999 | 2 (9.5%) | 0 (0.0%) |
| $100,000 to $149,999 | 3 (14.3%) | 2 (13.3%) |
| $150,000 or more | 0 (0.0%) | 2 (13.3%) |
| Total | 21 (100.0%) | 15 (100.0%) |
Property Value to Household Income Ratio in Houston
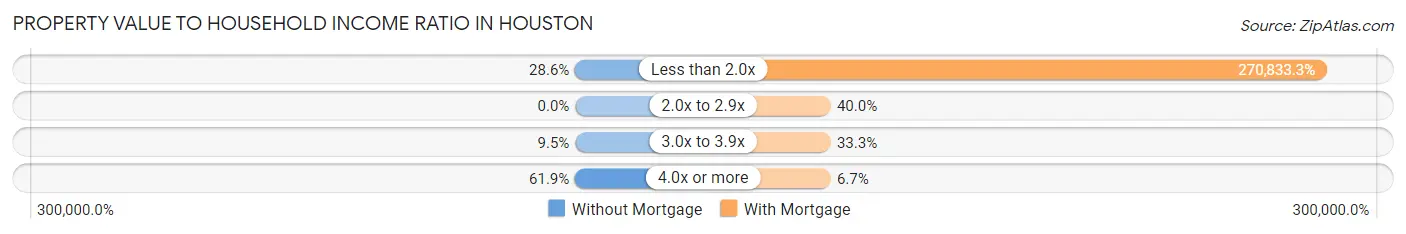
| Value-to-Income Ratio | Without Mortgage | With Mortgage |
| Less than 2.0x | 6 (28.6%) | 40,625 (270,833.3%) |
| 2.0x to 2.9x | 0 (0.0%) | 6 (40.0%) |
| 3.0x to 3.9x | 2 (9.5%) | 5 (33.3%) |
| 4.0x or more | 13 (61.9%) | 1 (6.7%) |
| Total | 21 (100.0%) | 15 (100.0%) |
Real Estate Taxes by Mortgage Status in Houston
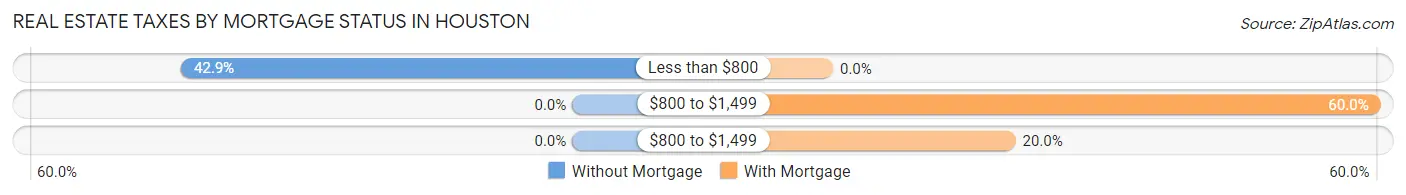
| Property Taxes | Without Mortgage | With Mortgage |
| Less than $800 | 9 (42.9%) | 0 (0.0%) |
| $800 to $1,499 | 0 (0.0%) | 9 (60.0%) |
| $800 to $1,499 | 0 (0.0%) | 3 (20.0%) |
| Total | 21 (100.0%) | 15 (100.0%) |
Health & Disability in Houston
Health Insurance Coverage by Age in Houston
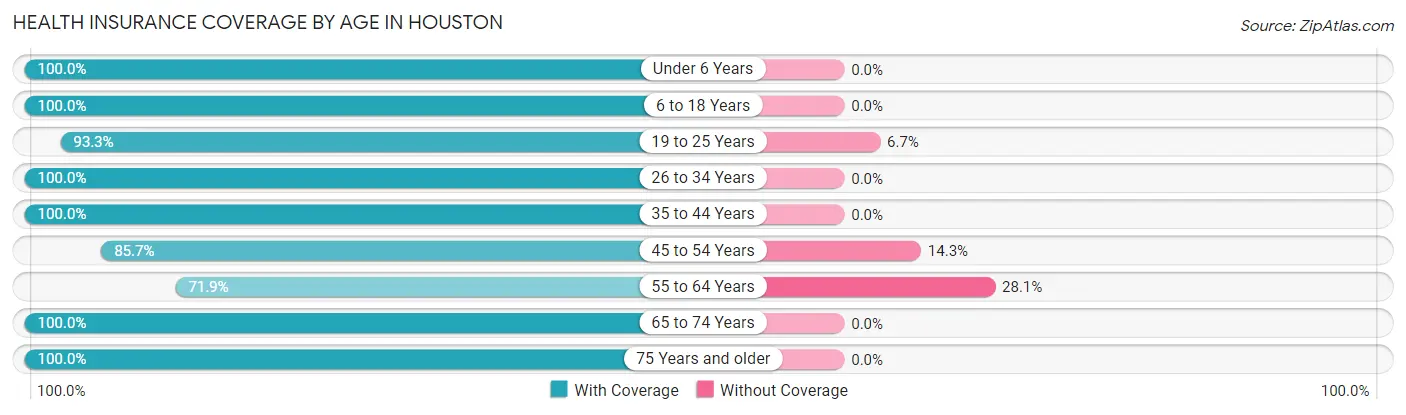
| Age Bracket | With Coverage | Without Coverage |
| Under 6 Years | 54 (100.0%) | 0 (0.0%) |
| 6 to 18 Years | 67 (100.0%) | 0 (0.0%) |
| 19 to 25 Years | 14 (93.3%) | 1 (6.7%) |
| 26 to 34 Years | 23 (100.0%) | 0 (0.0%) |
| 35 to 44 Years | 14 (100.0%) | 0 (0.0%) |
| 45 to 54 Years | 18 (85.7%) | 3 (14.3%) |
| 55 to 64 Years | 23 (71.9%) | 9 (28.1%) |
| 65 to 74 Years | 5 (100.0%) | 0 (0.0%) |
| 75 Years and older | 2 (100.0%) | 0 (0.0%) |
| Total | 220 (94.4%) | 13 (5.6%) |
Health Insurance Coverage by Citizenship Status in Houston
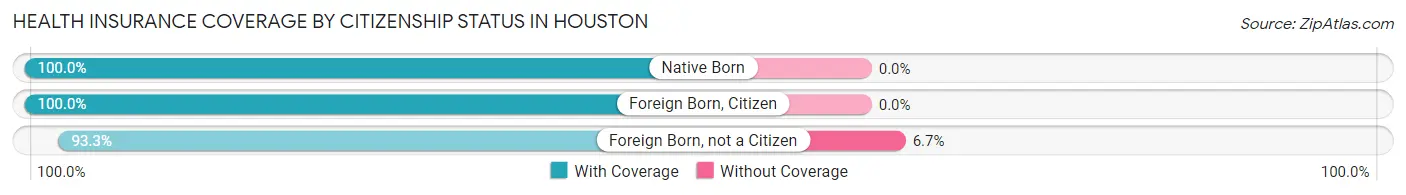
| Citizenship Status | With Coverage | Without Coverage |
| Native Born | 54 (100.0%) | 0 (0.0%) |
| Foreign Born, Citizen | 67 (100.0%) | 0 (0.0%) |
| Foreign Born, not a Citizen | 14 (93.3%) | 1 (6.7%) |
Health Insurance Coverage by Household Income in Houston
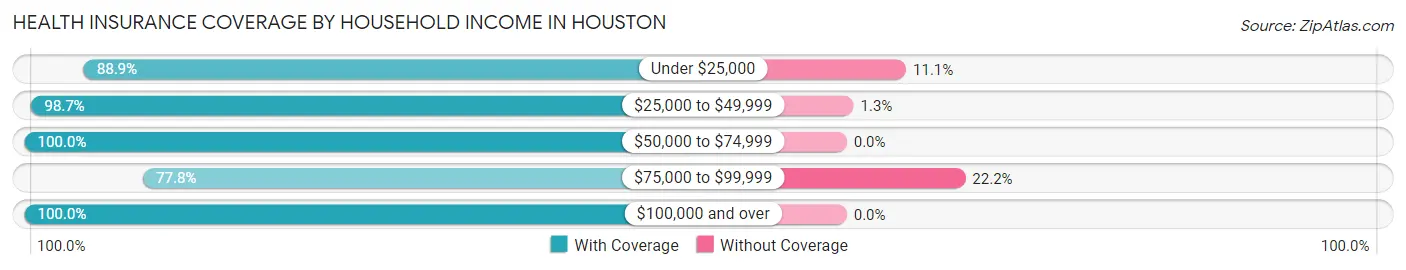
| Household Income | With Coverage | Without Coverage |
| Under $25,000 | 64 (88.9%) | 8 (11.1%) |
| $25,000 to $49,999 | 77 (98.7%) | 1 (1.3%) |
| $50,000 to $74,999 | 32 (100.0%) | 0 (0.0%) |
| $75,000 to $99,999 | 14 (77.8%) | 4 (22.2%) |
| $100,000 and over | 33 (100.0%) | 0 (0.0%) |
Public vs Private Health Insurance Coverage by Age in Houston
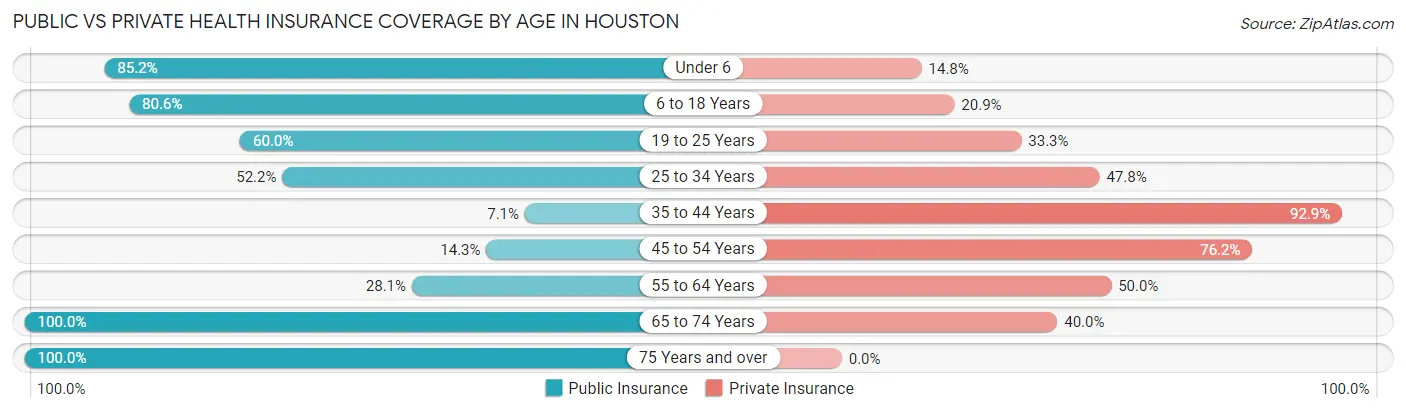
| Age Bracket | Public Insurance | Private Insurance |
| Under 6 | 46 (85.2%) | 8 (14.8%) |
| 6 to 18 Years | 54 (80.6%) | 14 (20.9%) |
| 19 to 25 Years | 9 (60.0%) | 5 (33.3%) |
| 25 to 34 Years | 12 (52.2%) | 11 (47.8%) |
| 35 to 44 Years | 1 (7.1%) | 13 (92.9%) |
| 45 to 54 Years | 3 (14.3%) | 16 (76.2%) |
| 55 to 64 Years | 9 (28.1%) | 16 (50.0%) |
| 65 to 74 Years | 5 (100.0%) | 2 (40.0%) |
| 75 Years and over | 2 (100.0%) | 0 (0.0%) |
| Total | 141 (60.5%) | 85 (36.5%) |
Disability Status by Sex by Age in Houston
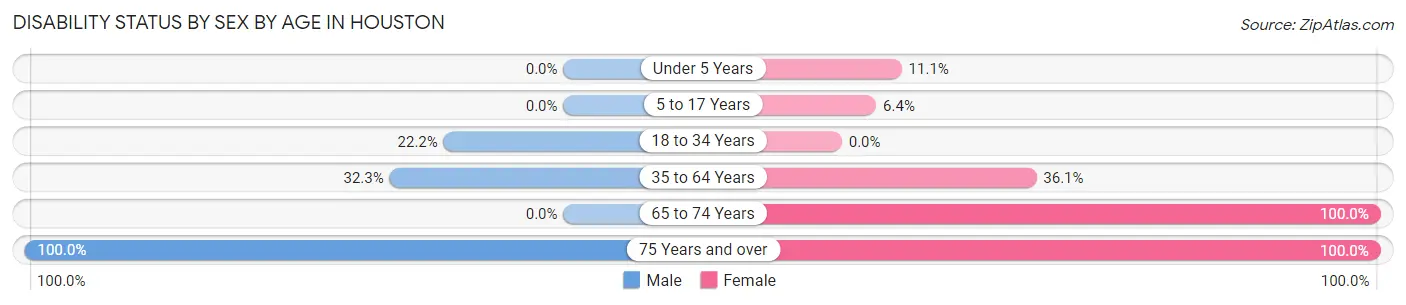
| Age Bracket | Male | Female |
| Under 5 Years | 0 (0.0%) | 2 (11.1%) |
| 5 to 17 Years | 0 (0.0%) | 3 (6.4%) |
| 18 to 34 Years | 4 (22.2%) | 0 (0.0%) |
| 35 to 64 Years | 10 (32.3%) | 13 (36.1%) |
| 65 to 74 Years | 0 (0.0%) | 3 (100.0%) |
| 75 Years and over | 1 (100.0%) | 1 (100.0%) |
Disability Class by Sex by Age in Houston
Disability Class: Hearing Difficulty
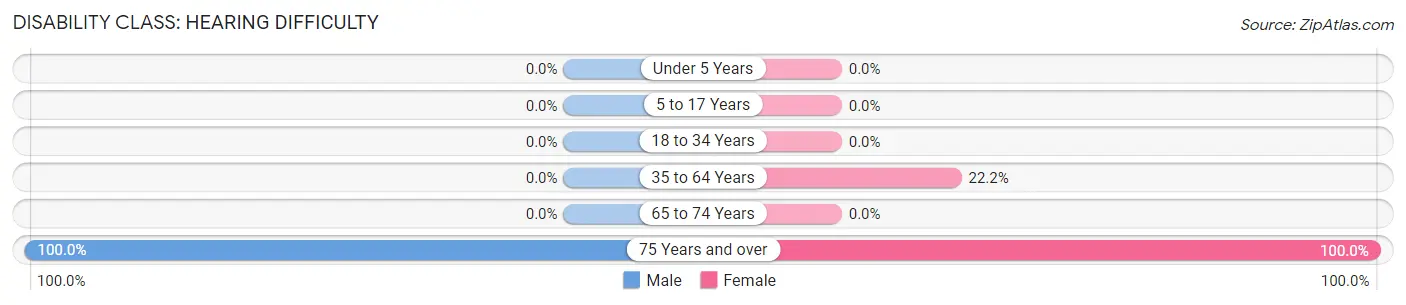
| Age Bracket | Male | Female |
| Under 5 Years | 0 (0.0%) | 0 (0.0%) |
| 5 to 17 Years | 0 (0.0%) | 0 (0.0%) |
| 18 to 34 Years | 0 (0.0%) | 0 (0.0%) |
| 35 to 64 Years | 0 (0.0%) | 8 (22.2%) |
| 65 to 74 Years | 0 (0.0%) | 0 (0.0%) |
| 75 Years and over | 1 (100.0%) | 1 (100.0%) |
Disability Class: Vision Difficulty
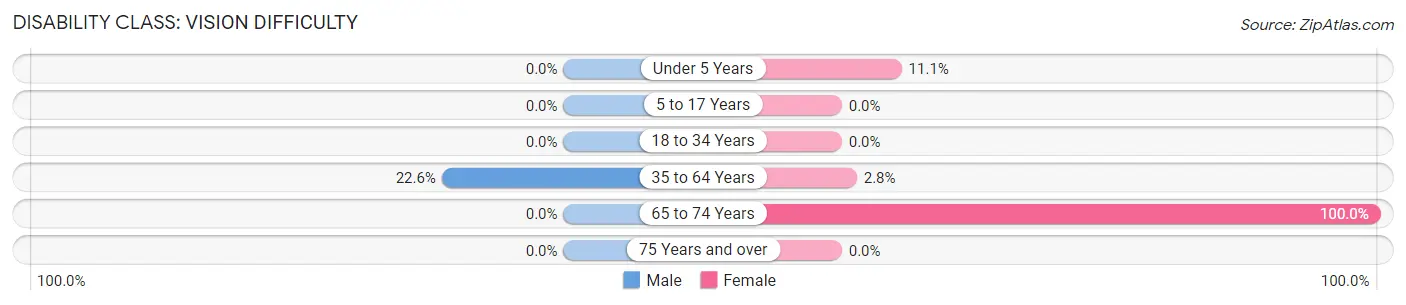
| Age Bracket | Male | Female |
| Under 5 Years | 0 (0.0%) | 2 (11.1%) |
| 5 to 17 Years | 0 (0.0%) | 0 (0.0%) |
| 18 to 34 Years | 0 (0.0%) | 0 (0.0%) |
| 35 to 64 Years | 7 (22.6%) | 1 (2.8%) |
| 65 to 74 Years | 0 (0.0%) | 3 (100.0%) |
| 75 Years and over | 0 (0.0%) | 0 (0.0%) |
Disability Class: Cognitive Difficulty
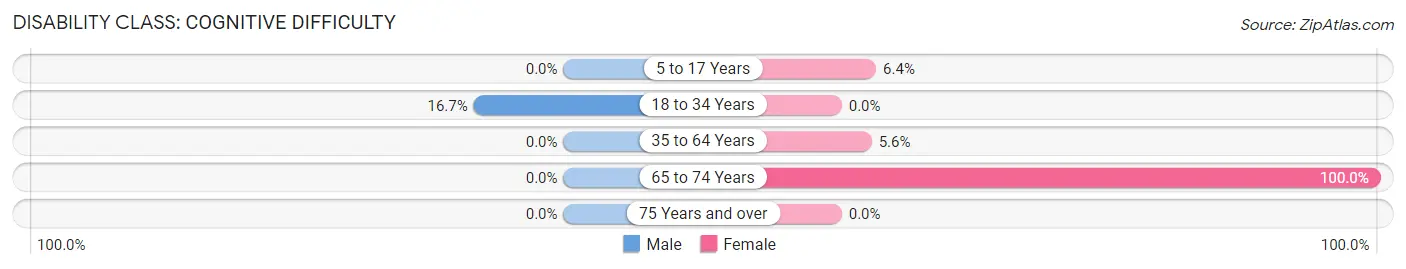
| Age Bracket | Male | Female |
| 5 to 17 Years | 0 (0.0%) | 3 (6.4%) |
| 18 to 34 Years | 3 (16.7%) | 0 (0.0%) |
| 35 to 64 Years | 0 (0.0%) | 2 (5.6%) |
| 65 to 74 Years | 0 (0.0%) | 3 (100.0%) |
| 75 Years and over | 0 (0.0%) | 0 (0.0%) |
Disability Class: Ambulatory Difficulty

| Age Bracket | Male | Female |
| 5 to 17 Years | 0 (0.0%) | 0 (0.0%) |
| 18 to 34 Years | 0 (0.0%) | 0 (0.0%) |
| 35 to 64 Years | 8 (25.8%) | 4 (11.1%) |
| 65 to 74 Years | 0 (0.0%) | 0 (0.0%) |
| 75 Years and over | 0 (0.0%) | 0 (0.0%) |
Disability Class: Self-Care Difficulty
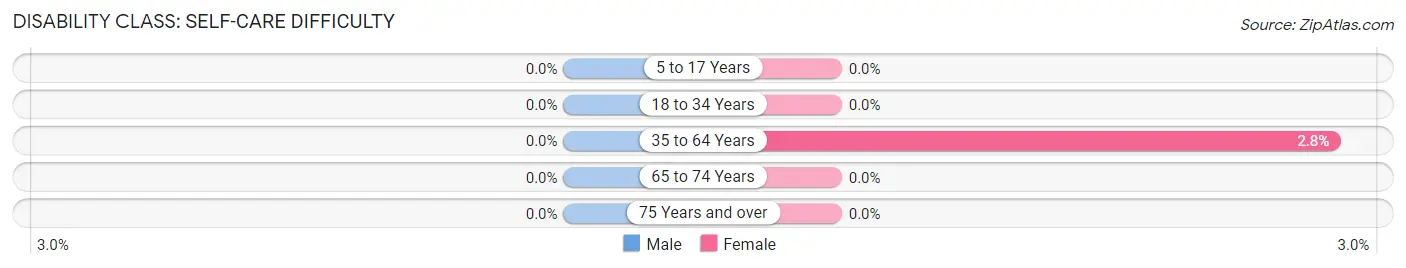
| Age Bracket | Male | Female |
| 5 to 17 Years | 0 (0.0%) | 0 (0.0%) |
| 18 to 34 Years | 0 (0.0%) | 0 (0.0%) |
| 35 to 64 Years | 0 (0.0%) | 1 (2.8%) |
| 65 to 74 Years | 0 (0.0%) | 0 (0.0%) |
| 75 Years and over | 0 (0.0%) | 0 (0.0%) |
Technology Access in Houston
Computing Device Access in Houston
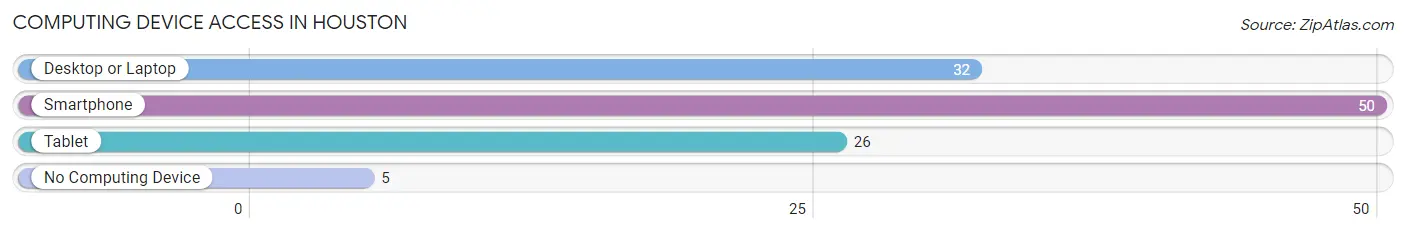
| Device Type | # Households | % Households |
| Desktop or Laptop | 32 | 52.5% |
| Smartphone | 50 | 82.0% |
| Tablet | 26 | 42.6% |
| No Computing Device | 5 | 8.2% |
| Total | 61 | 100.0% |
Internet Access in Houston
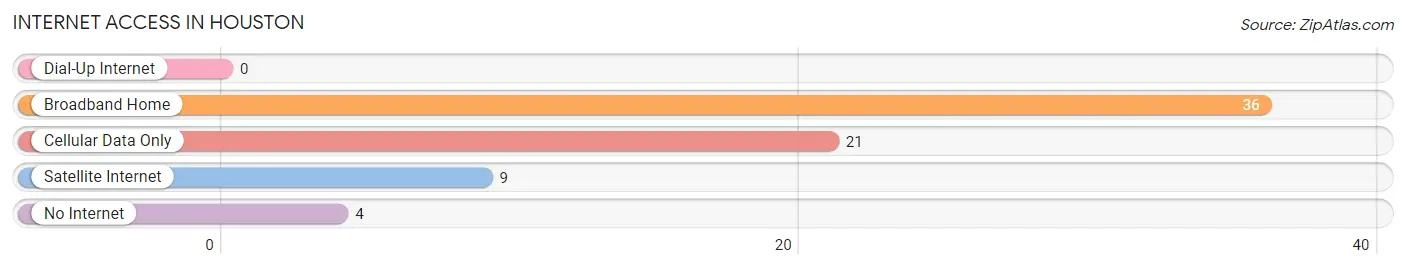
| Internet Type | # Households | % Households |
| Dial-Up Internet | 0 | 0.0% |
| Broadband Home | 36 | 59.0% |
| Cellular Data Only | 21 | 34.4% |
| Satellite Internet | 9 | 14.7% |
| No Internet | 4 | 6.6% |
| Total | 61 | 100.0% |
Houston Summary
Houston, Arkansas is a city located in the southeastern corner of the state, in the foothills of the Ozark Mountains. It is the county seat of Perry County and is the largest city in the county. The city is located on the banks of the Petit Jean River and is home to a population of approximately 2,000 people.
History
Houston was founded in 1876 by a group of settlers from the nearby town of Perryville. The town was named after Sam Houston, the former president of the Republic of Texas. The town was incorporated in 1883 and quickly grew to become the largest city in Perry County.
In the early 1900s, Houston was a thriving agricultural center, with cotton, corn, and other crops being grown in the area. The town also had a thriving timber industry, with several sawmills located in the area.
In the 1950s, Houston began to experience a decline in population as people moved away from the rural areas to larger cities. However, in the late 1970s, the city began to experience a resurgence in population as people began to move back to the area.
Geography
Houston is located in the southeastern corner of Arkansas, in the foothills of the Ozark Mountains. The city is situated on the banks of the Petit Jean River and is surrounded by rolling hills and forests. The city is located approximately 50 miles from Little Rock, the state capital.
The climate in Houston is humid subtropical, with hot summers and mild winters. The average annual temperature is around 65 degrees Fahrenheit.
Economy
Houston’s economy is largely based on agriculture and timber. The city is home to several large farms that produce cotton, corn, soybeans, and other crops. The timber industry is also an important part of the local economy, with several sawmills located in the area.
The city is also home to several small businesses, including restaurants, retail stores, and service providers. The city is also home to a small manufacturing sector, with several factories located in the area.
Demographics
As of the 2010 census, the population of Houston was 2,000 people. The racial makeup of the city was 95.2% White, 0.7% African American, 0.3% Native American, 0.2% Asian, 0.1% Pacific Islander, and 3.5% from other races. The median household income was $30,000, and the median family income was $35,000.
Houston is a small, rural city with a close-knit community. The city is home to several churches, schools, and other community organizations. The city is also home to a small arts and culture scene, with several galleries and performance venues located in the area.
Common Questions
What is Per Capita Income in Houston?
Per Capita income in Houston is $14,557.
What is the Median Family Income in Houston?
Median Family Income in Houston is $44,375.
What is the Median Household income in Houston?
Median Household Income in Houston is $42,813.
What is Income or Wage Gap in Houston?
Income or Wage Gap in Houston is 35.9%.
Women in Houston earn 64.1 cents for every dollar earned by a man.
What is Inequality or Gini Index in Houston?
Inequality or Gini Index in Houston is 0.46.
What is the Total Population of Houston?
Total Population of Houston is 233.
What is the Total Male Population of Houston?
Total Male Population of Houston is 103.
What is the Total Female Population of Houston?
Total Female Population of Houston is 130.
What is the Ratio of Males per 100 Females in Houston?
There are 79.23 Males per 100 Females in Houston.
What is the Ratio of Females per 100 Males in Houston?
There are 126.21 Females per 100 Males in Houston.
What is the Median Population Age in Houston?
Median Population Age in Houston is 18.1 Years.
What is the Average Family Size in Houston
Average Family Size in Houston is 4.1 People.
What is the Average Household Size in Houston
Average Household Size in Houston is 3.8 People.
How Large is the Labor Force in Houston?
There are 75 People in the Labor Forcein in Houston.
What is the Percentage of People in the Labor Force in Houston?
62.0% of People are in the Labor Force in Houston.