Horseshoe Bend, AR Map & Demographics
Horseshoe Bend Map
Horseshoe Bend Overview
$24,125
PER CAPITA INCOME
$49,563
AVG FAMILY INCOME
$38,750
AVG HOUSEHOLD INCOME
20.9%
WAGE / INCOME GAP [ % ]
79.1¢/ $1
WAGE / INCOME GAP [ $ ]
$7,378
FAMILY INCOME DEFICIT
0.44
INEQUALITY / GINI INDEX
2,423
TOTAL POPULATION
1,164
MALE POPULATION
1,259
FEMALE POPULATION
92.45
MALES / 100 FEMALES
108.16
FEMALES / 100 MALES
53.1
MEDIAN AGE
3.4
AVG FAMILY SIZE
2.6
AVG HOUSEHOLD SIZE
719
LABOR FORCE [ PEOPLE ]
34.7%
PERCENT IN LABOR FORCE
16.3%
UNEMPLOYMENT RATE
Horseshoe Bend Zip Codes
Horseshoe Bend Area Codes
Income in Horseshoe Bend
Income Overview in Horseshoe Bend
Per Capita Income in Horseshoe Bend is $24,125, while median incomes of families and households are $49,563 and $38,750 respectively.
| Characteristic | Number | Measure |
| Per Capita Income | 2,423 | $24,125 |
| Median Family Income | 571 | $49,563 |
| Mean Family Income | 571 | $67,622 |
| Median Household Income | 905 | $38,750 |
| Mean Household Income | 905 | $55,320 |
| Income Deficit | 571 | $7,378 |
| Wage / Income Gap (%) | 2,423 | 20.91% |
| Wage / Income Gap ($) | 2,423 | 79.09¢ per $1 |
| Gini / Inequality Index | 2,423 | 0.44 |
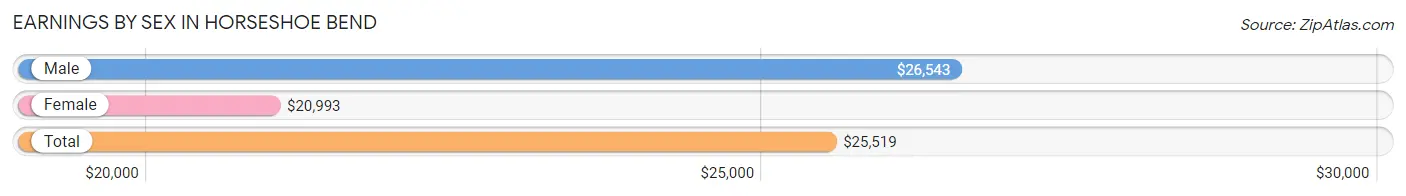
Earnings by Sex in Horseshoe Bend
Average Earnings in Horseshoe Bend are $25,519, $26,543 for men and $20,993 for women, a difference of 20.9%.
| Sex | Number | Average Earnings |
| Male | 482 (55.6%) | $26,543 |
| Female | 385 (44.4%) | $20,993 |
| Total | 867 (100.0%) | $25,519 |
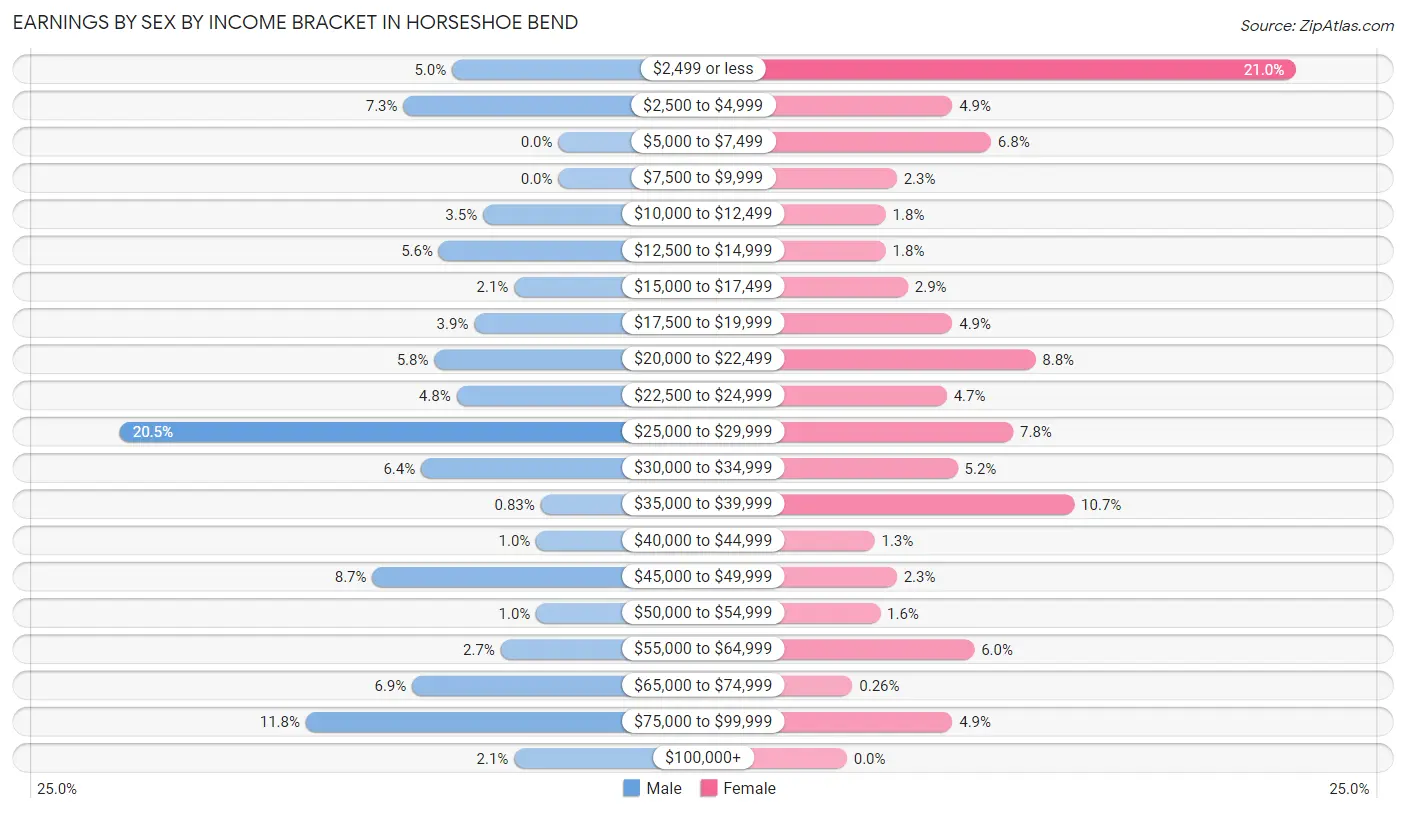
Earnings by Sex by Income Bracket in Horseshoe Bend
The most common earnings brackets in Horseshoe Bend are $25,000 to $29,999 for men (99 | 20.5%) and $2,499 or less for women (81 | 21.0%).
| Income | Male | Female |
| $2,499 or less | 24 (5.0%) | 81 (21.0%) |
| $2,500 to $4,999 | 35 (7.3%) | 19 (4.9%) |
| $5,000 to $7,499 | 0 (0.0%) | 26 (6.8%) |
| $7,500 to $9,999 | 0 (0.0%) | 9 (2.3%) |
| $10,000 to $12,499 | 17 (3.5%) | 7 (1.8%) |
| $12,500 to $14,999 | 27 (5.6%) | 7 (1.8%) |
| $15,000 to $17,499 | 10 (2.1%) | 11 (2.9%) |
| $17,500 to $19,999 | 19 (3.9%) | 19 (4.9%) |
| $20,000 to $22,499 | 28 (5.8%) | 34 (8.8%) |
| $22,500 to $24,999 | 23 (4.8%) | 18 (4.7%) |
| $25,000 to $29,999 | 99 (20.5%) | 30 (7.8%) |
| $30,000 to $34,999 | 31 (6.4%) | 20 (5.2%) |
| $35,000 to $39,999 | 4 (0.8%) | 41 (10.6%) |
| $40,000 to $44,999 | 5 (1.0%) | 5 (1.3%) |
| $45,000 to $49,999 | 42 (8.7%) | 9 (2.3%) |
| $50,000 to $54,999 | 5 (1.0%) | 6 (1.6%) |
| $55,000 to $64,999 | 13 (2.7%) | 23 (6.0%) |
| $65,000 to $74,999 | 33 (6.9%) | 1 (0.3%) |
| $75,000 to $99,999 | 57 (11.8%) | 19 (4.9%) |
| $100,000+ | 10 (2.1%) | 0 (0.0%) |
| Total | 482 (100.0%) | 385 (100.0%) |
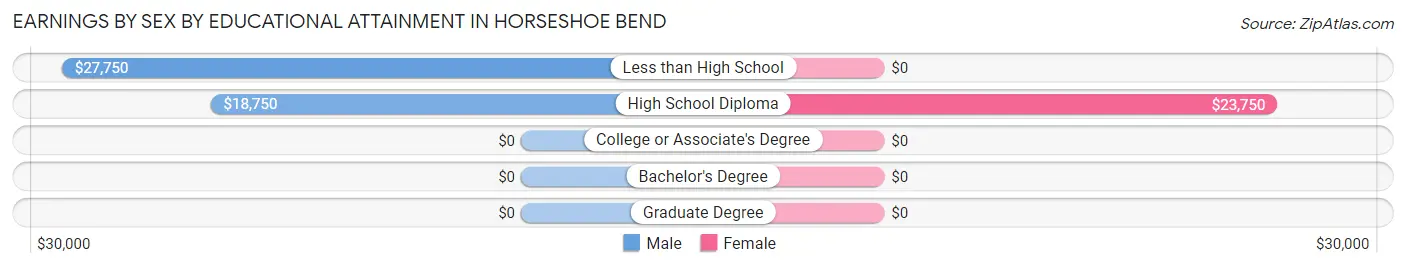
Earnings by Sex by Educational Attainment in Horseshoe Bend
Average earnings in Horseshoe Bend are $27,101 for men and $21,985 for women, a difference of 18.9%. Men with an educational attainment of less than high school enjoy the highest average annual earnings of $27,750, while those with high school diploma education earn the least with $18,750. Women with an educational attainment of high school diploma earn the most with the average annual earnings of $23,750, while those with high school diploma education have the smallest earnings of $23,750.
| Educational Attainment | Male Income | Female Income |
| Less than High School | $27,750 | $0 |
| High School Diploma | $18,750 | $23,750 |
| College or Associate's Degree | - | - |
| Bachelor's Degree | - | - |
| Graduate Degree | - | - |
| Total | $27,101 | $21,985 |
Family Income in Horseshoe Bend
Family Income Brackets in Horseshoe Bend
According to the Horseshoe Bend family income data, there are 111 families falling into the $35,000 to $49,999 income range, which is the most common income bracket and makes up 19.4% of all families. Conversely, the $10,000 to $14,999 income bracket is the least frequent group with only 6 families (1.1%) belonging to this category.
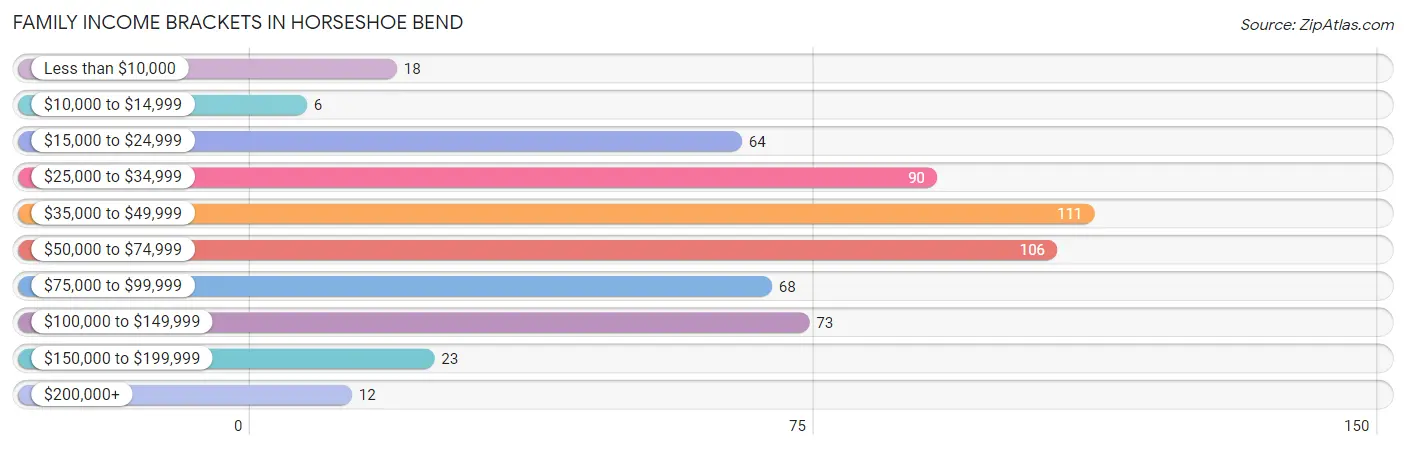
| Income Bracket | # Families | % Families |
| Less than $10,000 | 18 | 3.2% |
| $10,000 to $14,999 | 6 | 1.1% |
| $15,000 to $24,999 | 64 | 11.2% |
| $25,000 to $34,999 | 90 | 15.8% |
| $35,000 to $49,999 | 111 | 19.4% |
| $50,000 to $74,999 | 106 | 18.6% |
| $75,000 to $99,999 | 68 | 11.9% |
| $100,000 to $149,999 | 73 | 12.8% |
| $150,000 to $199,999 | 23 | 4.0% |
| $200,000+ | 12 | 2.1% |
Family Income by Famaliy Size in Horseshoe Bend
3-person families (97 | 17.0%) account for the highest median family income in Horseshoe Bend with $61,083 per family, while 2-person families (351 | 61.5%) have the highest median income of $27,578 per family member.
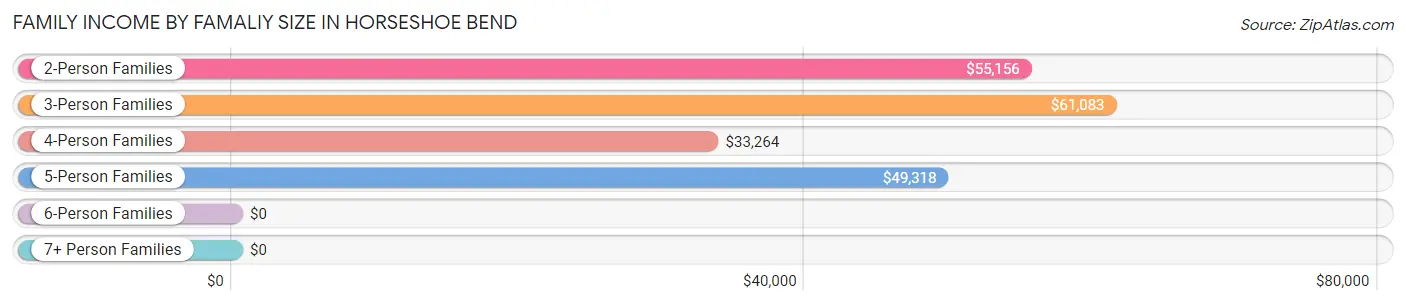
| Income Bracket | # Families | Median Income |
| 2-Person Families | 351 (61.5%) | $55,156 |
| 3-Person Families | 97 (17.0%) | $61,083 |
| 4-Person Families | 93 (16.3%) | $33,264 |
| 5-Person Families | 30 (5.2%) | $49,318 |
| 6-Person Families | 0 (0.0%) | $0 |
| 7+ Person Families | 0 (0.0%) | $0 |
| Total | 571 (100.0%) | $49,563 |
Family Income by Number of Earners in Horseshoe Bend
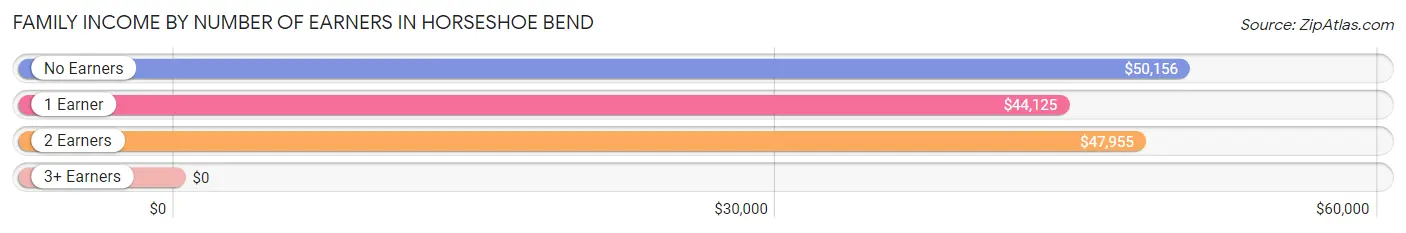
| Number of Earners | # Families | Median Income |
| No Earners | 189 (33.1%) | $50,156 |
| 1 Earner | 227 (39.8%) | $44,125 |
| 2 Earners | 138 (24.2%) | $47,955 |
| 3+ Earners | 17 (3.0%) | $0 |
| Total | 571 (100.0%) | $49,563 |
Household Income in Horseshoe Bend
Household Income Brackets in Horseshoe Bend
With 174 households falling in the category, the $25,000 to $34,999 income range is the most frequent in Horseshoe Bend, accounting for 19.2% of all households. In contrast, only 12 households (1.3%) fall into the $200,000+ income bracket, making it the least populous group.
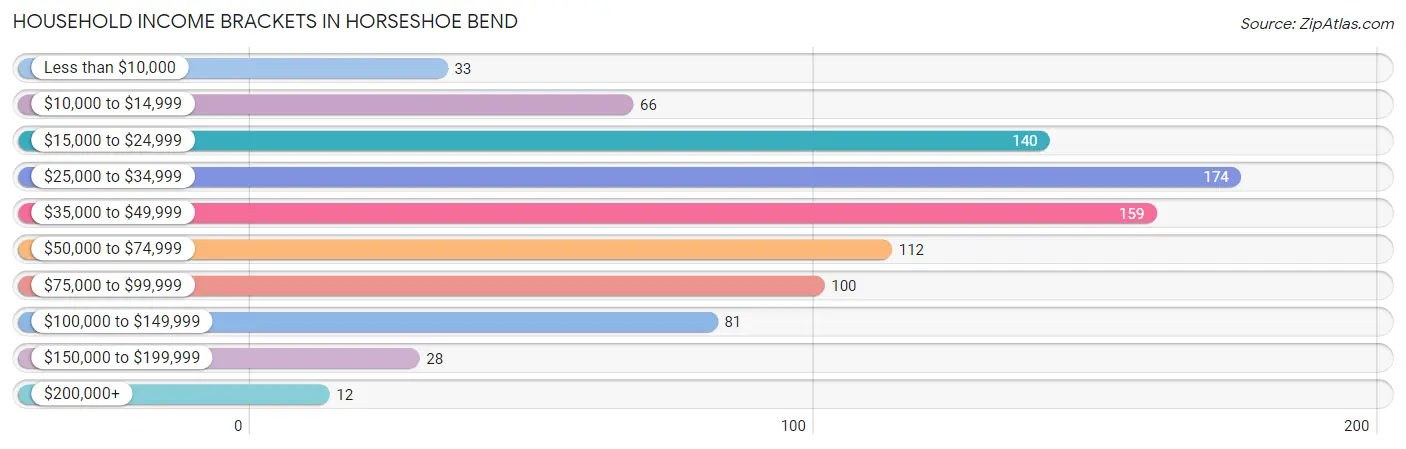
| Income Bracket | # Households | % Households |
| Less than $10,000 | 33 | 3.6% |
| $10,000 to $14,999 | 66 | 7.3% |
| $15,000 to $24,999 | 140 | 15.5% |
| $25,000 to $34,999 | 174 | 19.2% |
| $35,000 to $49,999 | 159 | 17.6% |
| $50,000 to $74,999 | 112 | 12.4% |
| $75,000 to $99,999 | 100 | 11.0% |
| $100,000 to $149,999 | 81 | 9.0% |
| $150,000 to $199,999 | 28 | 3.1% |
| $200,000+ | 12 | 1.3% |
Household Income by Householder Age in Horseshoe Bend
The median household income in Horseshoe Bend is $38,750, with the highest median household income of $43,086 found in the 65+ years age bracket for the primary householder. A total of 423 households (46.7%) fall into this category. Meanwhile, the 15 to 24 years age bracket for the primary householder has the lowest median household income of $25,536, with 38 households (4.2%) in this group.
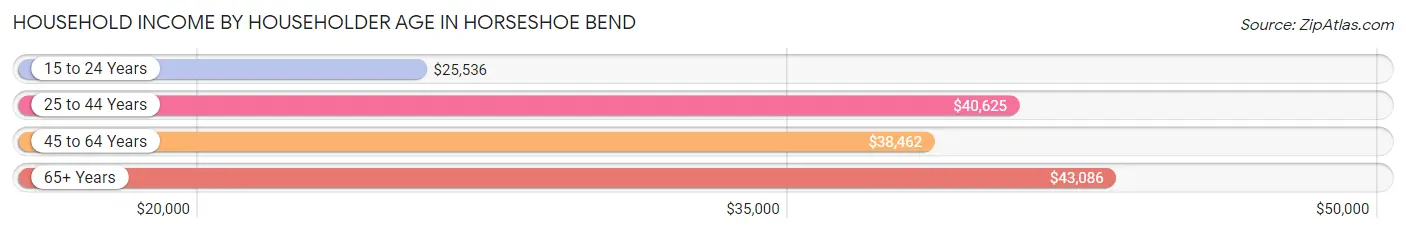
| Income Bracket | # Households | Median Income |
| 15 to 24 Years | 38 (4.2%) | $25,536 |
| 25 to 44 Years | 148 (16.4%) | $40,625 |
| 45 to 64 Years | 296 (32.7%) | $38,462 |
| 65+ Years | 423 (46.7%) | $43,086 |
| Total | 905 (100.0%) | $38,750 |
Poverty in Horseshoe Bend
Income Below Poverty by Sex and Age in Horseshoe Bend
With 20.7% poverty level for males and 28.7% for females among the residents of Horseshoe Bend, 25 to 34 year old males and 12 to 14 year old females are the most vulnerable to poverty, with 88 males (43.6%) and 30 females (90.9%) in their respective age groups living below the poverty level.
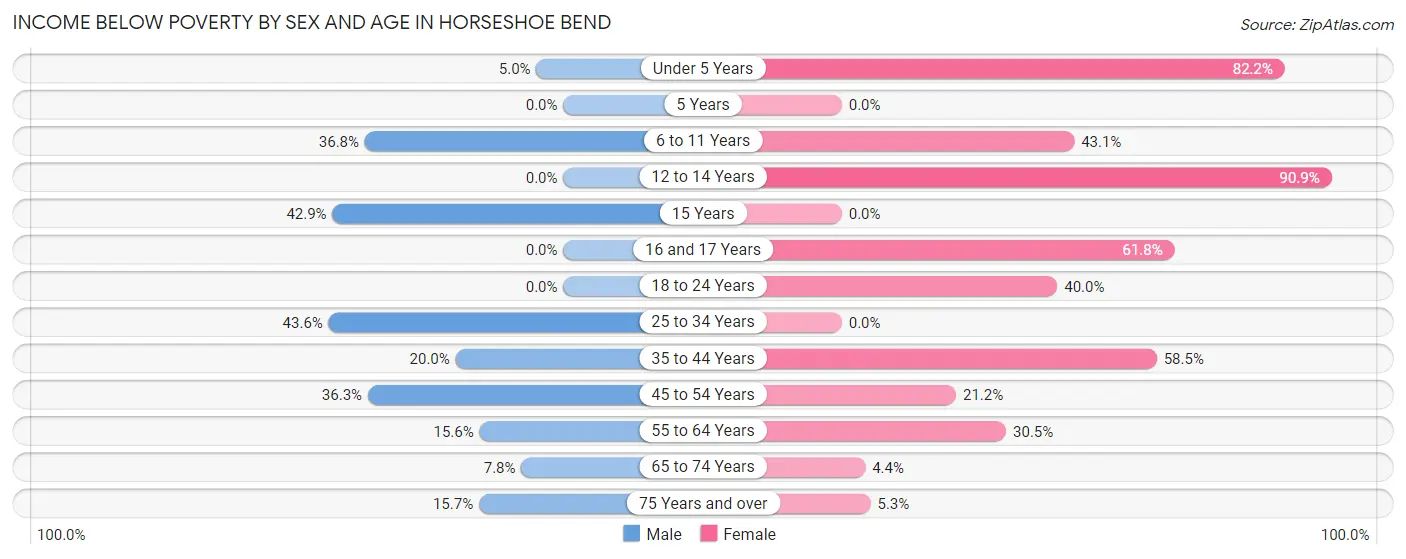
| Age Bracket | Male | Female |
| Under 5 Years | 2 (5.0%) | 74 (82.2%) |
| 5 Years | 0 (0.0%) | 0 (0.0%) |
| 6 to 11 Years | 21 (36.8%) | 22 (43.1%) |
| 12 to 14 Years | 0 (0.0%) | 30 (90.9%) |
| 15 Years | 3 (42.9%) | 0 (0.0%) |
| 16 and 17 Years | 0 (0.0%) | 21 (61.8%) |
| 18 to 24 Years | 0 (0.0%) | 36 (40.0%) |
| 25 to 34 Years | 88 (43.6%) | 0 (0.0%) |
| 35 to 44 Years | 19 (20.0%) | 76 (58.5%) |
| 45 to 54 Years | 41 (36.3%) | 14 (21.2%) |
| 55 to 64 Years | 28 (15.6%) | 61 (30.5%) |
| 65 to 74 Years | 12 (7.8%) | 10 (4.3%) |
| 75 Years and over | 26 (15.7%) | 9 (5.3%) |
| Total | 240 (20.7%) | 353 (28.7%) |
Income Above Poverty by Sex and Age in Horseshoe Bend
According to the poverty statistics in Horseshoe Bend, males aged 5 years and females aged 15 years are the age groups that are most secure financially, with 100.0% of males and 100.0% of females in these age groups living above the poverty line.
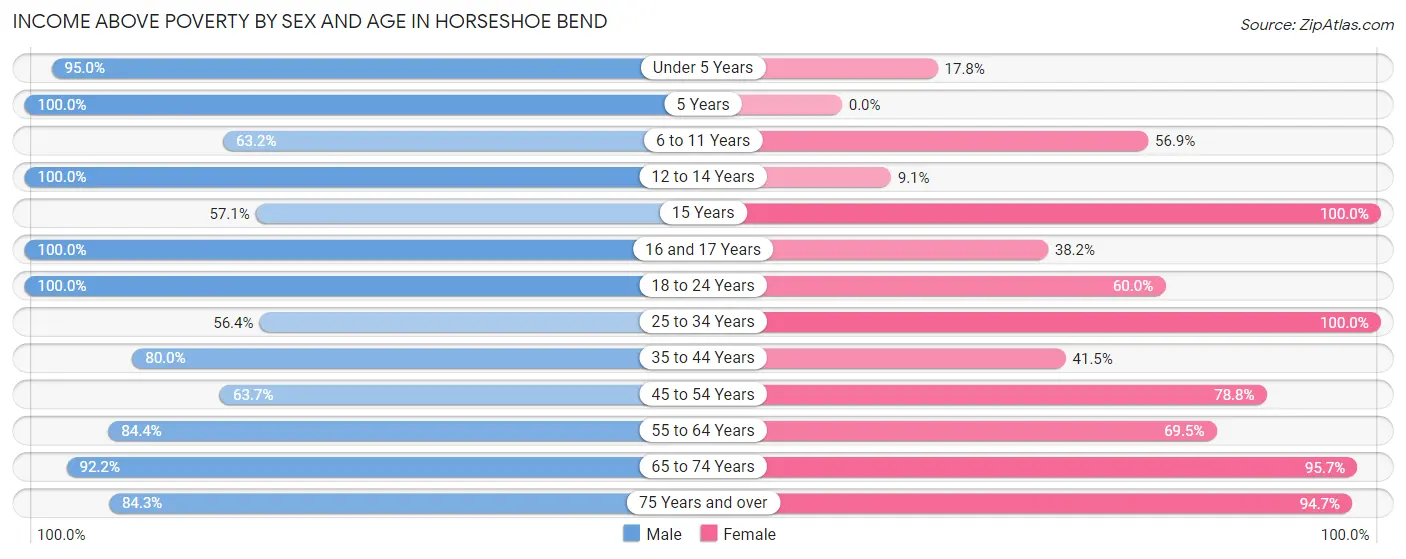
| Age Bracket | Male | Female |
| Under 5 Years | 38 (95.0%) | 16 (17.8%) |
| 5 Years | 10 (100.0%) | 0 (0.0%) |
| 6 to 11 Years | 36 (63.2%) | 29 (56.9%) |
| 12 to 14 Years | 54 (100.0%) | 3 (9.1%) |
| 15 Years | 4 (57.1%) | 9 (100.0%) |
| 16 and 17 Years | 13 (100.0%) | 13 (38.2%) |
| 18 to 24 Years | 66 (100.0%) | 54 (60.0%) |
| 25 to 34 Years | 114 (56.4%) | 126 (100.0%) |
| 35 to 44 Years | 76 (80.0%) | 54 (41.5%) |
| 45 to 54 Years | 72 (63.7%) | 52 (78.8%) |
| 55 to 64 Years | 152 (84.4%) | 139 (69.5%) |
| 65 to 74 Years | 142 (92.2%) | 220 (95.7%) |
| 75 Years and over | 140 (84.3%) | 160 (94.7%) |
| Total | 917 (79.3%) | 875 (71.3%) |
Income Below Poverty Among Married-Couple Families in Horseshoe Bend
The poverty statistics for married-couple families in Horseshoe Bend show that 14.0% or 68 of the total 486 families live below the poverty line. Families with 1 or 2 children have the highest poverty rate of 31.3%, comprising of 36 families. On the other hand, families with no children have the lowest poverty rate of 8.0%, which includes 28 families.
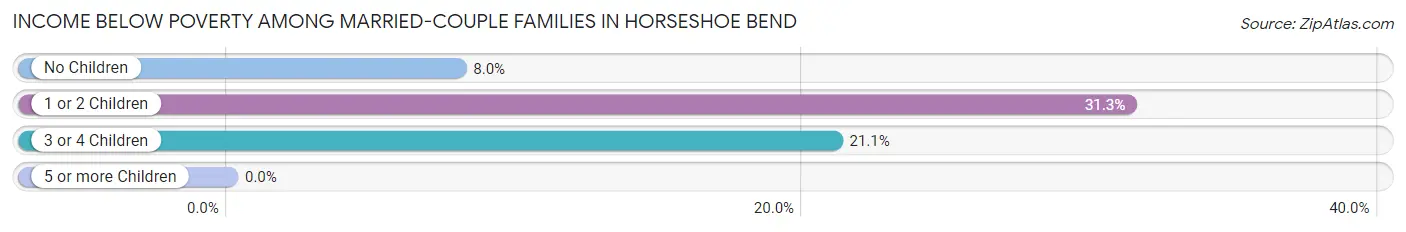
| Children | Above Poverty | Below Poverty |
| No Children | 324 (92.0%) | 28 (8.0%) |
| 1 or 2 Children | 79 (68.7%) | 36 (31.3%) |
| 3 or 4 Children | 15 (78.9%) | 4 (21.0%) |
| 5 or more Children | 0 (0.0%) | 0 (0.0%) |
| Total | 418 (86.0%) | 68 (14.0%) |
Income Below Poverty Among Single-Parent Households in Horseshoe Bend
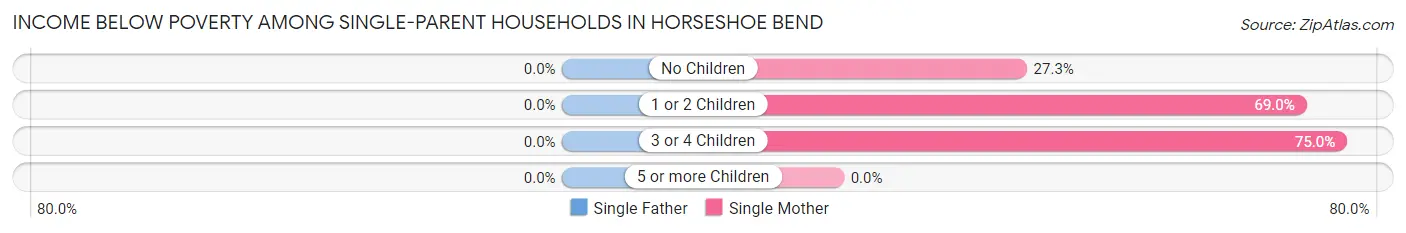
| Children | Single Father | Single Mother |
| No Children | 0 (0.0%) | 6 (27.3%) |
| 1 or 2 Children | 0 (0.0%) | 20 (69.0%) |
| 3 or 4 Children | 0 (0.0%) | 3 (75.0%) |
| 5 or more Children | 0 (0.0%) | 0 (0.0%) |
| Total | 0 (0.0%) | 29 (52.7%) |
Income Below Poverty Among Married-Couple vs Single-Parent Households in Horseshoe Bend
The poverty data for Horseshoe Bend shows that 68 of the married-couple family households (14.0%) and 29 of the single-parent households (34.1%) are living below the poverty level. Within the married-couple family households, those with 1 or 2 children have the highest poverty rate, with 36 households (31.3%) falling below the poverty line. Among the single-parent households, those with 3 or 4 children have the highest poverty rate, with 3 household (75.0%) living below poverty.
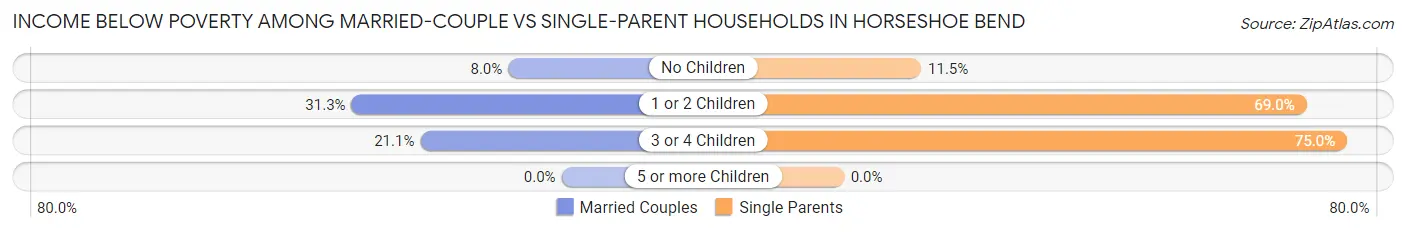
| Children | Married-Couple Families | Single-Parent Households |
| No Children | 28 (8.0%) | 6 (11.5%) |
| 1 or 2 Children | 36 (31.3%) | 20 (69.0%) |
| 3 or 4 Children | 4 (21.0%) | 3 (75.0%) |
| 5 or more Children | 0 (0.0%) | 0 (0.0%) |
| Total | 68 (14.0%) | 29 (34.1%) |
Race in Horseshoe Bend
The most populous races in Horseshoe Bend are White / Caucasian (2,120 | 87.5%), Two or more Races (248 | 10.2%), and Hispanic or Latino (62 | 2.6%).
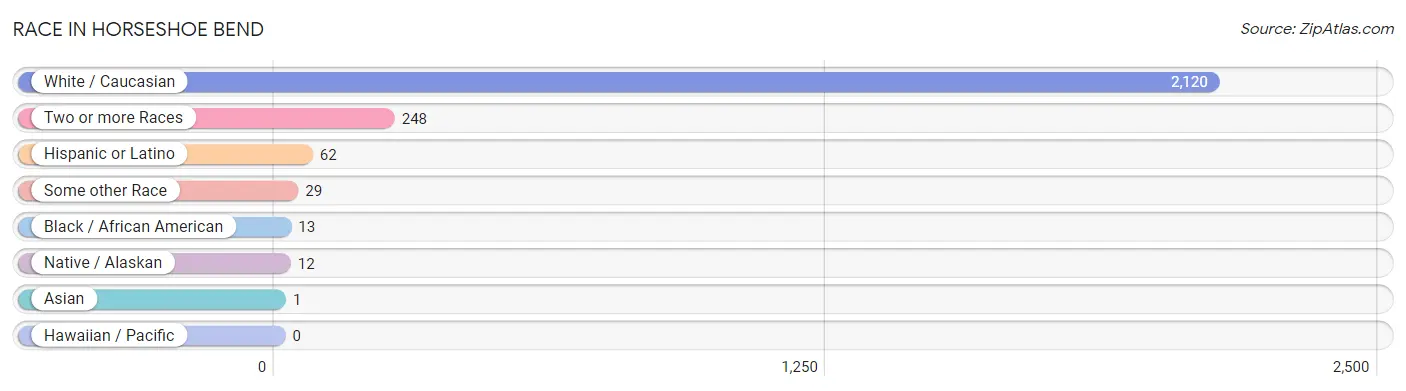
| Race | # Population | % Population |
| Asian | 1 | 0.0% |
| Black / African American | 13 | 0.5% |
| Hawaiian / Pacific | 0 | 0.0% |
| Hispanic or Latino | 62 | 2.6% |
| Native / Alaskan | 12 | 0.5% |
| White / Caucasian | 2,120 | 87.5% |
| Two or more Races | 248 | 10.2% |
| Some other Race | 29 | 1.2% |
| Total | 2,423 | 100.0% |
Ancestry in Horseshoe Bend
The most populous ancestries reported in Horseshoe Bend are German (543 | 22.4%), Irish (517 | 21.3%), English (309 | 12.8%), French (97 | 4.0%), and American (96 | 4.0%), together accounting for 64.5% of all Horseshoe Bend residents.
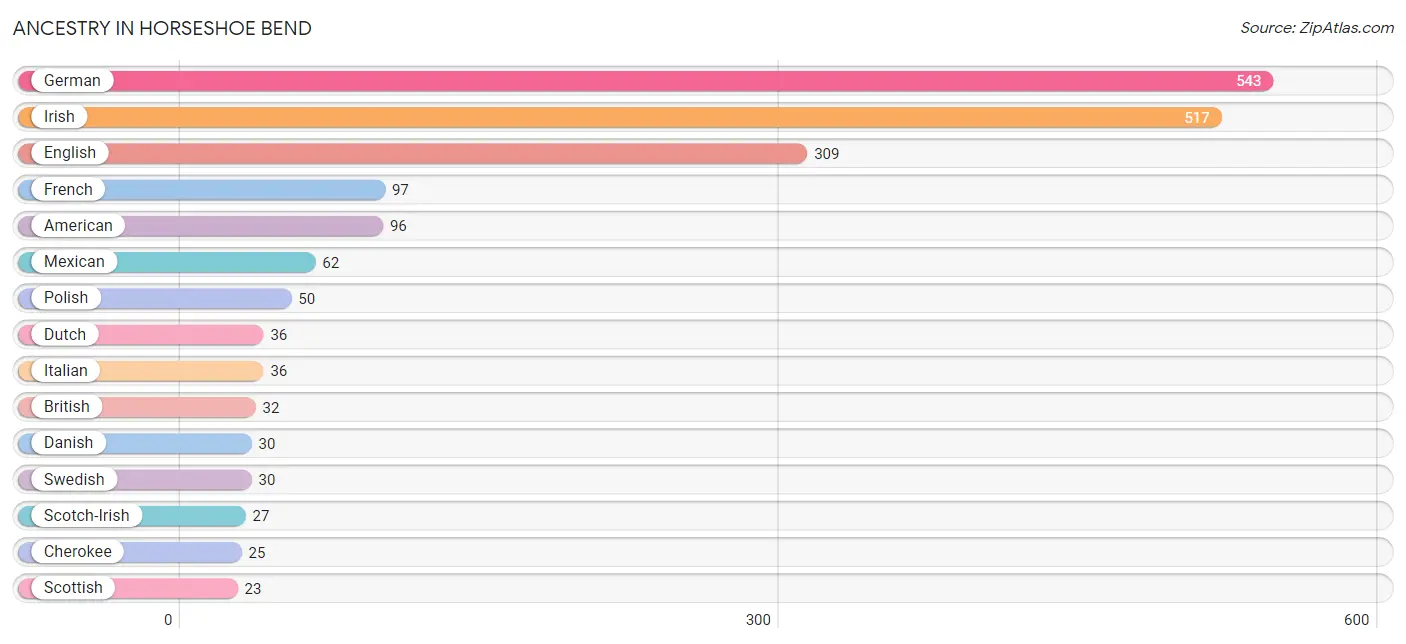
| Ancestry | # Population | % Population |
| American | 96 | 4.0% |
| Austrian | 5 | 0.2% |
| British | 32 | 1.3% |
| Cherokee | 25 | 1.0% |
| Choctaw | 6 | 0.3% |
| Czech | 4 | 0.2% |
| Danish | 30 | 1.2% |
| Dutch | 36 | 1.5% |
| English | 309 | 12.8% |
| European | 4 | 0.2% |
| Finnish | 16 | 0.7% |
| French | 97 | 4.0% |
| German | 543 | 22.4% |
| Greek | 4 | 0.2% |
| Hungarian | 6 | 0.3% |
| Irish | 517 | 21.3% |
| Italian | 36 | 1.5% |
| Korean | 1 | 0.0% |
| Lithuanian | 5 | 0.2% |
| Mexican | 62 | 2.6% |
| Norwegian | 13 | 0.5% |
| Polish | 50 | 2.1% |
| Scotch-Irish | 27 | 1.1% |
| Scottish | 23 | 0.9% |
| Swedish | 30 | 1.2% |
| Welsh | 4 | 0.2% | View All 26 Rows |
Immigrants in Horseshoe Bend
The most numerous immigrant groups reported in Horseshoe Bend came from Central America (6 | 0.3%), Latin America (6 | 0.3%), Mexico (6 | 0.3%), Asia (1 | 0.0%), and Philippines (1 | 0.0%), together accounting for 0.8% of all Horseshoe Bend residents.
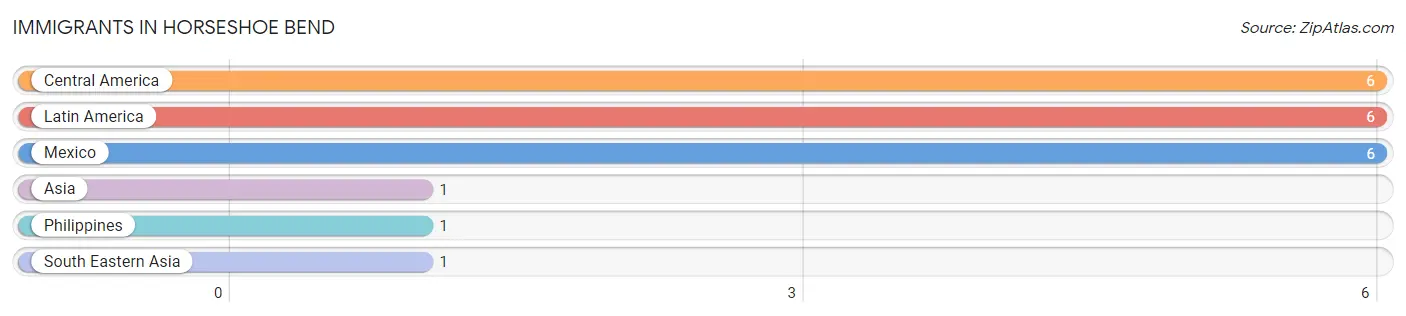
| Immigration Origin | # Population | % Population |
| Asia | 1 | 0.0% |
| Central America | 6 | 0.3% |
| Latin America | 6 | 0.3% |
| Mexico | 6 | 0.3% |
| Philippines | 1 | 0.0% |
| South Eastern Asia | 1 | 0.0% | View All 6 Rows |
Sex and Age in Horseshoe Bend
Sex and Age in Horseshoe Bend
The most populous age groups in Horseshoe Bend are 25 to 29 Years (131 | 11.3%) for men and 70 to 74 Years (146 | 11.6%) for women.
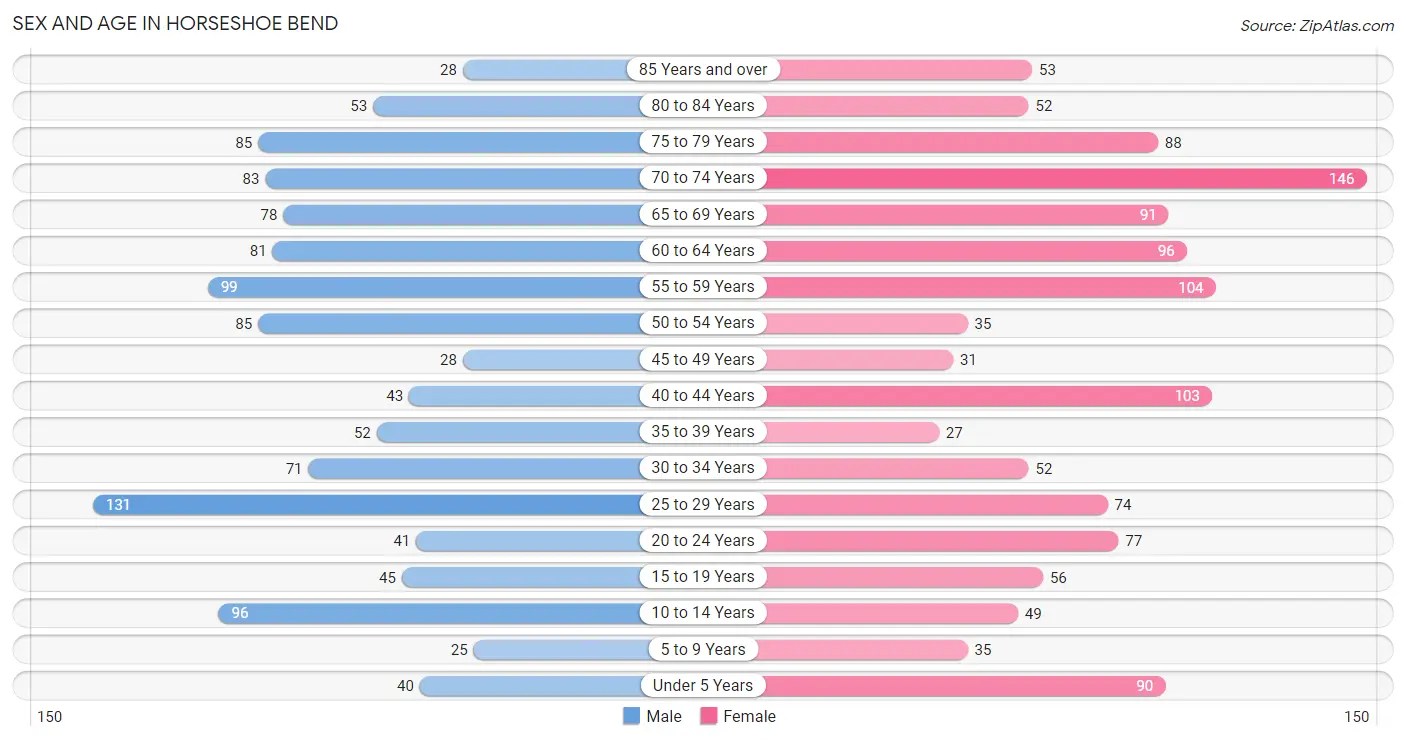
| Age Bracket | Male | Female |
| Under 5 Years | 40 (3.4%) | 90 (7.1%) |
| 5 to 9 Years | 25 (2.1%) | 35 (2.8%) |
| 10 to 14 Years | 96 (8.3%) | 49 (3.9%) |
| 15 to 19 Years | 45 (3.9%) | 56 (4.4%) |
| 20 to 24 Years | 41 (3.5%) | 77 (6.1%) |
| 25 to 29 Years | 131 (11.3%) | 74 (5.9%) |
| 30 to 34 Years | 71 (6.1%) | 52 (4.1%) |
| 35 to 39 Years | 52 (4.5%) | 27 (2.1%) |
| 40 to 44 Years | 43 (3.7%) | 103 (8.2%) |
| 45 to 49 Years | 28 (2.4%) | 31 (2.5%) |
| 50 to 54 Years | 85 (7.3%) | 35 (2.8%) |
| 55 to 59 Years | 99 (8.5%) | 104 (8.3%) |
| 60 to 64 Years | 81 (7.0%) | 96 (7.6%) |
| 65 to 69 Years | 78 (6.7%) | 91 (7.2%) |
| 70 to 74 Years | 83 (7.1%) | 146 (11.6%) |
| 75 to 79 Years | 85 (7.3%) | 88 (7.0%) |
| 80 to 84 Years | 53 (4.5%) | 52 (4.1%) |
| 85 Years and over | 28 (2.4%) | 53 (4.2%) |
| Total | 1,164 (100.0%) | 1,259 (100.0%) |
Families and Households in Horseshoe Bend
Median Family Size in Horseshoe Bend
The median family size in Horseshoe Bend is 3.42 persons per family, with single female/mother families (55 | 9.6%) accounting for the largest median family size of 4.13 persons per family. On the other hand, single male/father families (30 | 5.2%) represent the smallest median family size with 1.83 persons per family.
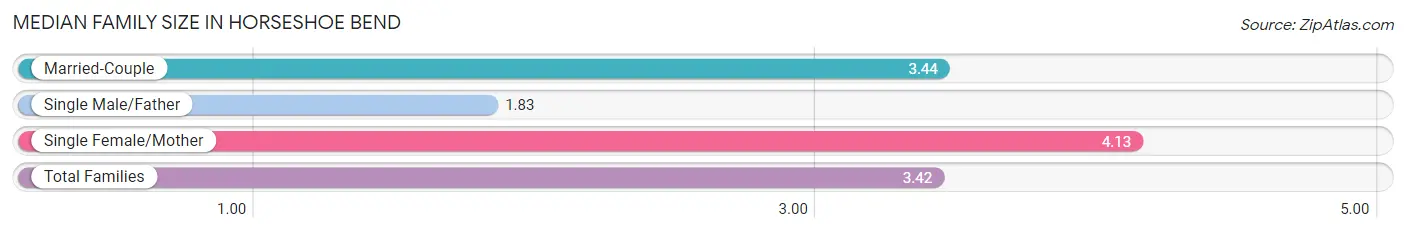
| Family Type | # Families | Family Size |
| Married-Couple | 486 (85.1%) | 3.44 |
| Single Male/Father | 30 (5.2%) | 1.83 |
| Single Female/Mother | 55 (9.6%) | 4.13 |
| Total Families | 571 (100.0%) | 3.42 |
Median Household Size in Horseshoe Bend
The median household size in Horseshoe Bend is 2.64 persons per household, with single female/mother households (55 | 6.1%) accounting for the largest median household size of 4.13 persons per household. non-family households (334 | 36.9%) represent the smallest median household size with 1.30 persons per household.
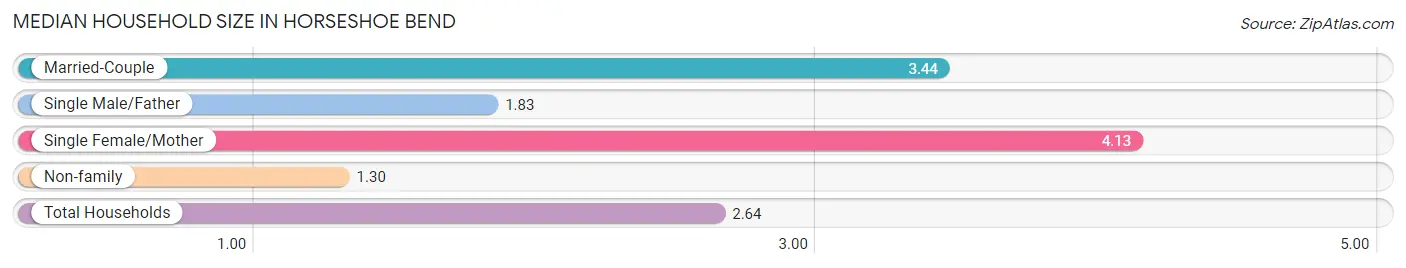
| Household Type | # Households | Household Size |
| Married-Couple | 486 (53.7%) | 3.44 |
| Single Male/Father | 30 (3.3%) | 1.83 |
| Single Female/Mother | 55 (6.1%) | 4.13 |
| Non-family | 334 (36.9%) | 1.30 |
| Total Households | 905 (100.0%) | 2.64 |
Household Size by Marriage Status in Horseshoe Bend
Out of a total of 905 households in Horseshoe Bend, 571 (63.1%) are family households, while 334 (36.9%) are nonfamily households. The most numerous type of family households are 2-person households, comprising 351, and the most common type of nonfamily households are 1-person households, comprising 293.
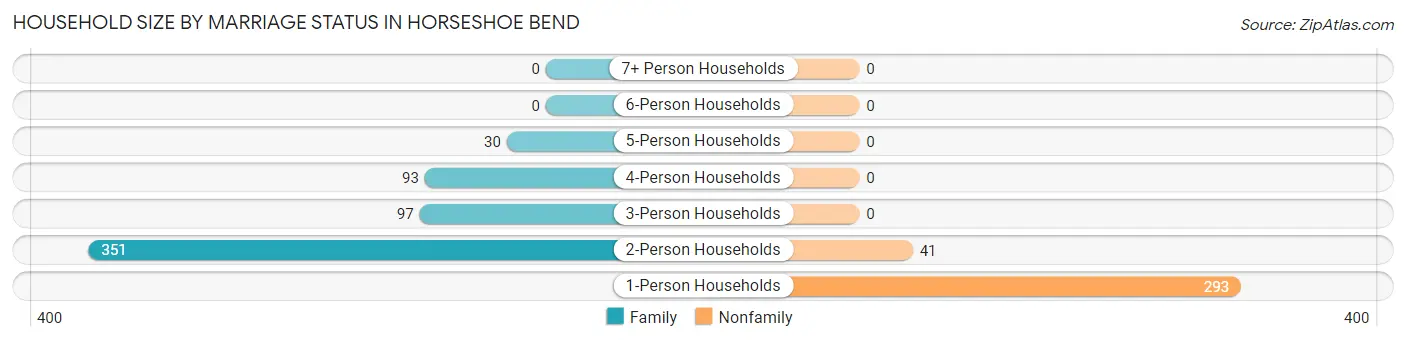
| Household Size | Family Households | Nonfamily Households |
| 1-Person Households | - | 293 (32.4%) |
| 2-Person Households | 351 (38.8%) | 41 (4.5%) |
| 3-Person Households | 97 (10.7%) | 0 (0.0%) |
| 4-Person Households | 93 (10.3%) | 0 (0.0%) |
| 5-Person Households | 30 (3.3%) | 0 (0.0%) |
| 6-Person Households | 0 (0.0%) | 0 (0.0%) |
| 7+ Person Households | 0 (0.0%) | 0 (0.0%) |
| Total | 571 (63.1%) | 334 (36.9%) |
Female Fertility in Horseshoe Bend
Fertility by Age in Horseshoe Bend
Average fertility rate in Horseshoe Bend is 61.0 births per 1,000 women. Women in the age bracket of 20 to 34 years have the highest fertility rate with 128.0 births per 1,000 women. Women in the age bracket of 20 to 34 years acount for 100.0% of all women with births.
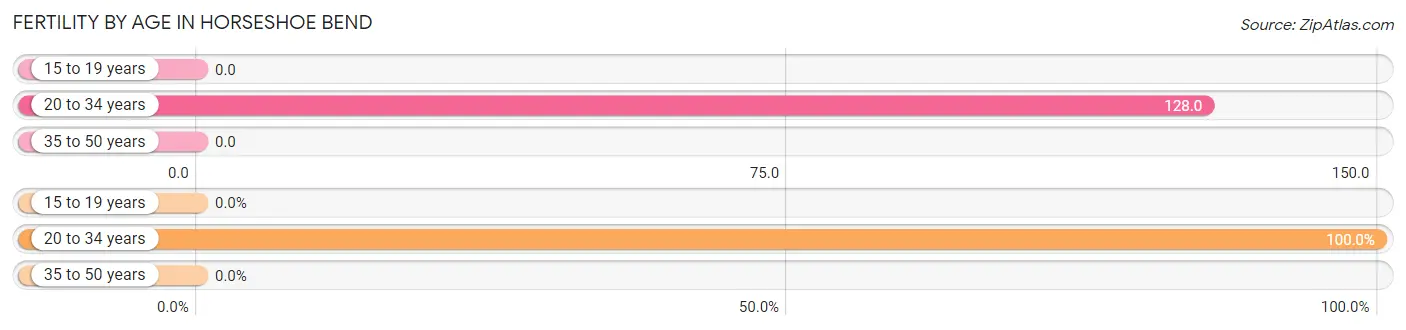
| Age Bracket | Women with Births | Births / 1,000 Women |
| 15 to 19 years | 0 (0.0%) | 0.0 |
| 20 to 34 years | 26 (100.0%) | 128.0 |
| 35 to 50 years | 0 (0.0%) | 0.0 |
| Total | 26 (100.0%) | 61.0 |
Fertility by Age by Marriage Status in Horseshoe Bend
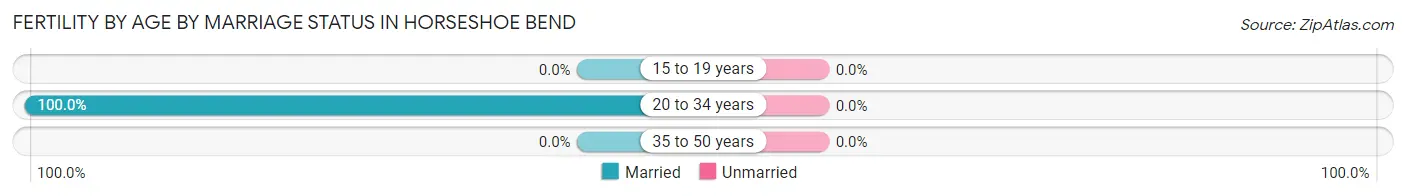
| Age Bracket | Married | Unmarried |
| 15 to 19 years | 0 (0.0%) | 0 (0.0%) |
| 20 to 34 years | 26 (100.0%) | 0 (0.0%) |
| 35 to 50 years | 0 (0.0%) | 0 (0.0%) |
| Total | 26 (100.0%) | 0 (0.0%) |
Fertility by Education in Horseshoe Bend
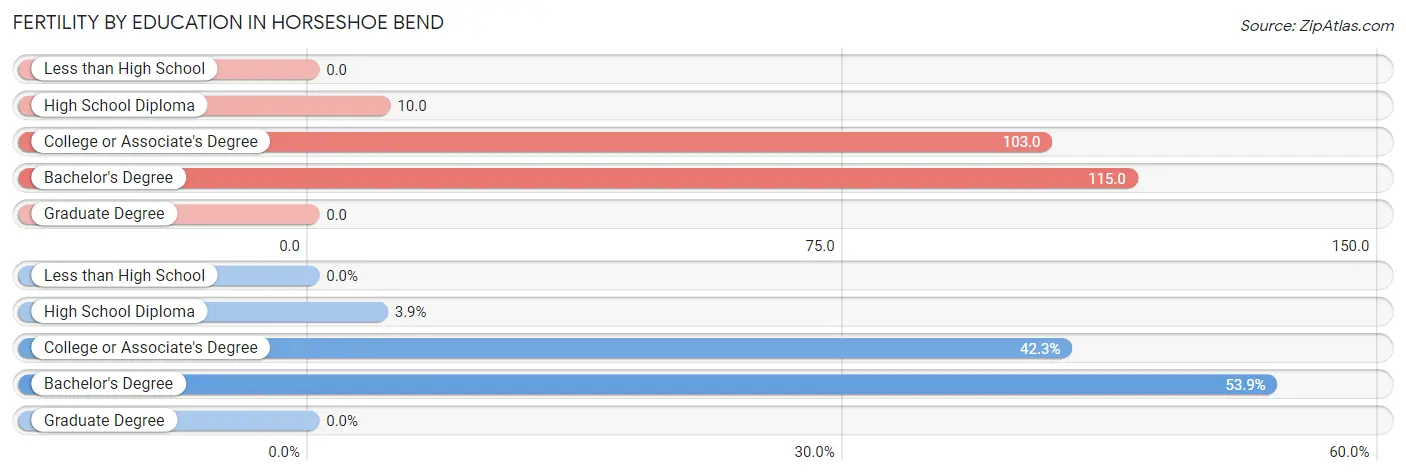
| Educational Attainment | Women with Births | Births / 1,000 Women |
| Less than High School | 0 (0.0%) | 0.0 |
| High School Diploma | 1 (3.8%) | 10.0 |
| College or Associate's Degree | 11 (42.3%) | 103.0 |
| Bachelor's Degree | 14 (53.8%) | 115.0 |
| Graduate Degree | 0 (0.0%) | 0.0 |
| Total | 26 (100.0%) | 61.0 |
Fertility by Education by Marriage Status in Horseshoe Bend
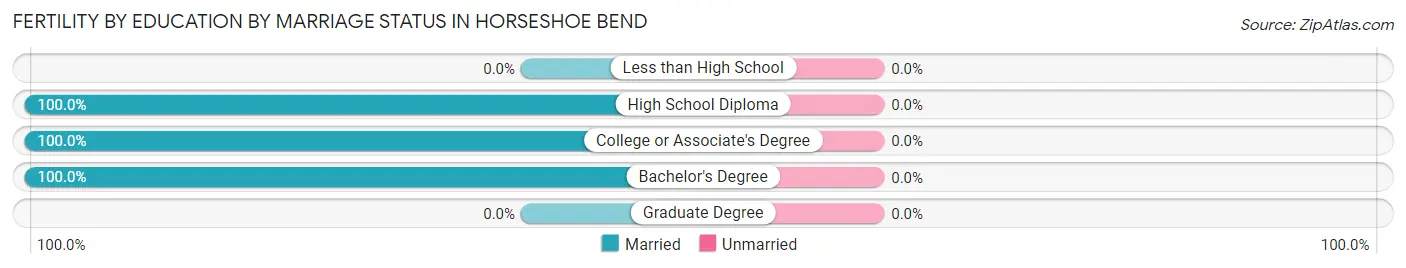
| Educational Attainment | Married | Unmarried |
| Less than High School | 0 (0.0%) | 0 (0.0%) |
| High School Diploma | 1 (100.0%) | 0 (0.0%) |
| College or Associate's Degree | 11 (100.0%) | 0 (0.0%) |
| Bachelor's Degree | 14 (100.0%) | 0 (0.0%) |
| Graduate Degree | 0 (0.0%) | 0 (0.0%) |
| Total | 26 (100.0%) | 0 (0.0%) |
Employment Characteristics in Horseshoe Bend
Employment by Class of Employer in Horseshoe Bend
Among the 592 employed individuals in Horseshoe Bend, private company employees (441 | 74.5%), local government employees (53 | 8.9%), and self-employed (not incorporated) (41 | 6.9%) make up the most common classes of employment.
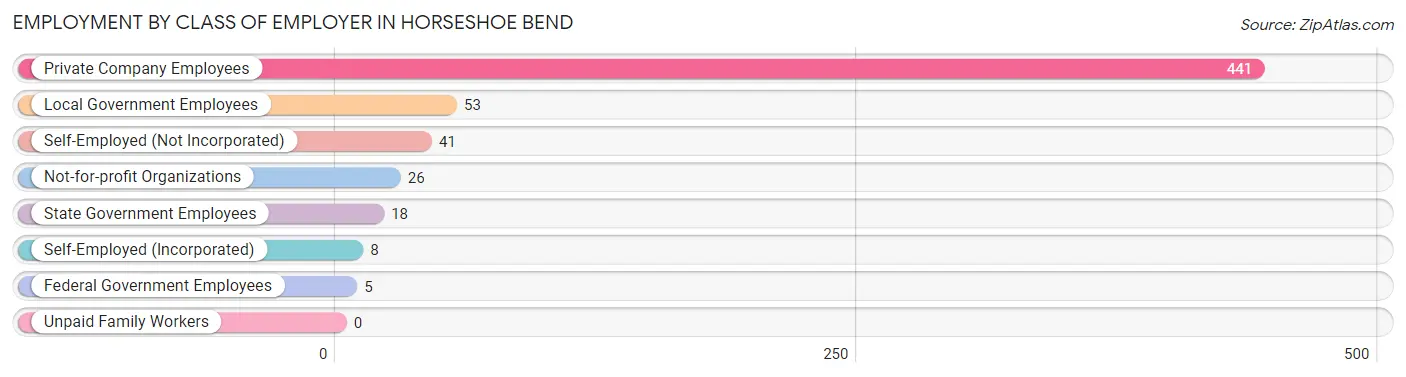
| Employer Class | # Employees | % Employees |
| Private Company Employees | 441 | 74.5% |
| Self-Employed (Incorporated) | 8 | 1.3% |
| Self-Employed (Not Incorporated) | 41 | 6.9% |
| Not-for-profit Organizations | 26 | 4.4% |
| Local Government Employees | 53 | 8.9% |
| State Government Employees | 18 | 3.0% |
| Federal Government Employees | 5 | 0.8% |
| Unpaid Family Workers | 0 | 0.0% |
| Total | 592 | 100.0% |
Employment Status by Age in Horseshoe Bend
According to the labor force statistics for Horseshoe Bend, out of the total population over 16 years of age (2,072), 34.7% or 719 individuals are in the labor force, with 16.3% or 117 of them unemployed. The age group with the highest labor force participation rate is 30 to 34 years, with 91.9% or 113 individuals in the labor force. Within the labor force, the 45 to 54 years age range has the highest percentage of unemployed individuals, with 39.4% or 28 of them being unemployed.
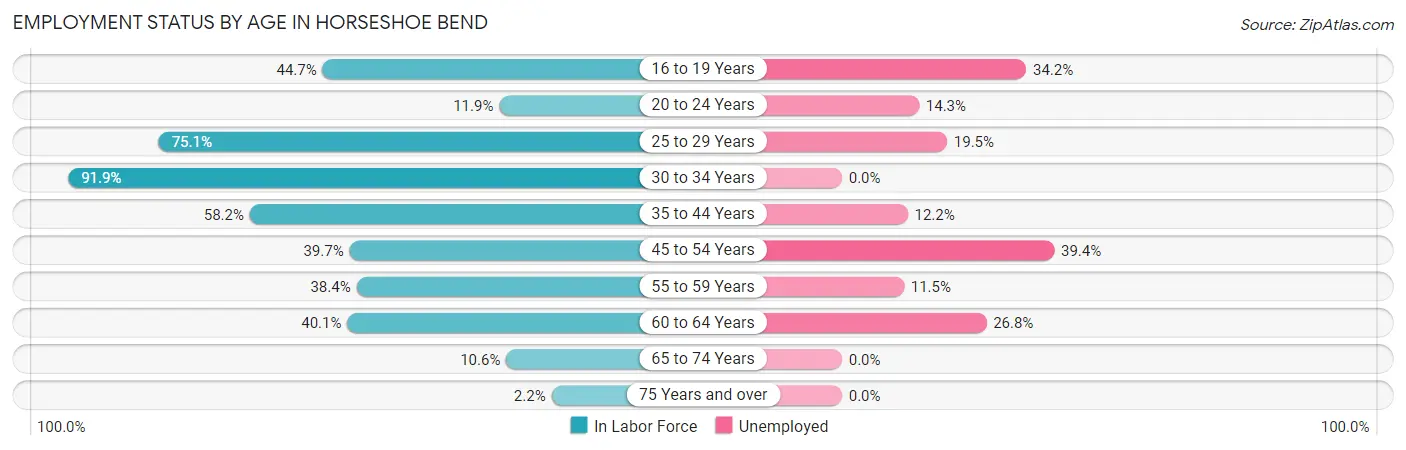
| Age Bracket | In Labor Force | Unemployed |
| 16 to 19 Years | 38 (44.7%) | 13 (34.2%) |
| 20 to 24 Years | 14 (11.9%) | 2 (14.3%) |
| 25 to 29 Years | 154 (75.1%) | 30 (19.5%) |
| 30 to 34 Years | 113 (91.9%) | 0 (0.0%) |
| 35 to 44 Years | 131 (58.2%) | 16 (12.2%) |
| 45 to 54 Years | 71 (39.7%) | 28 (39.4%) |
| 55 to 59 Years | 78 (38.4%) | 9 (11.5%) |
| 60 to 64 Years | 71 (40.1%) | 19 (26.8%) |
| 65 to 74 Years | 42 (10.6%) | 0 (0.0%) |
| 75 Years and over | 8 (2.2%) | 0 (0.0%) |
| Total | 719 (34.7%) | 117 (16.3%) |
Employment Status by Educational Attainment in Horseshoe Bend
According to labor force statistics for Horseshoe Bend, 55.6% of individuals (618) out of the total population between 25 and 64 years of age (1,112) are in the labor force, with 16.5% or 102 of them being unemployed. The group with the highest labor force participation rate are those with the educational attainment of high school diploma, with 65.8% or 219 individuals in the labor force. Within the labor force, individuals with less than high school education have the highest percentage of unemployment, with 72.0% or 18 of them being unemployed.
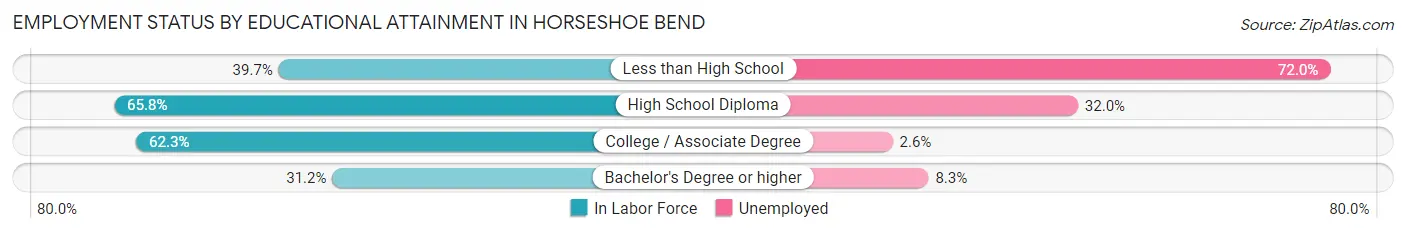
| Educational Attainment | In Labor Force | Unemployed |
| Less than High School | 25 (39.7%) | 45 (72.0%) |
| High School Diploma | 219 (65.8%) | 107 (32.0%) |
| College / Associate Degree | 302 (62.3%) | 13 (2.6%) |
| Bachelor's Degree or higher | 72 (31.2%) | 19 (8.3%) |
| Total | 618 (55.6%) | 183 (16.5%) |
Employment Occupations by Sex in Horseshoe Bend
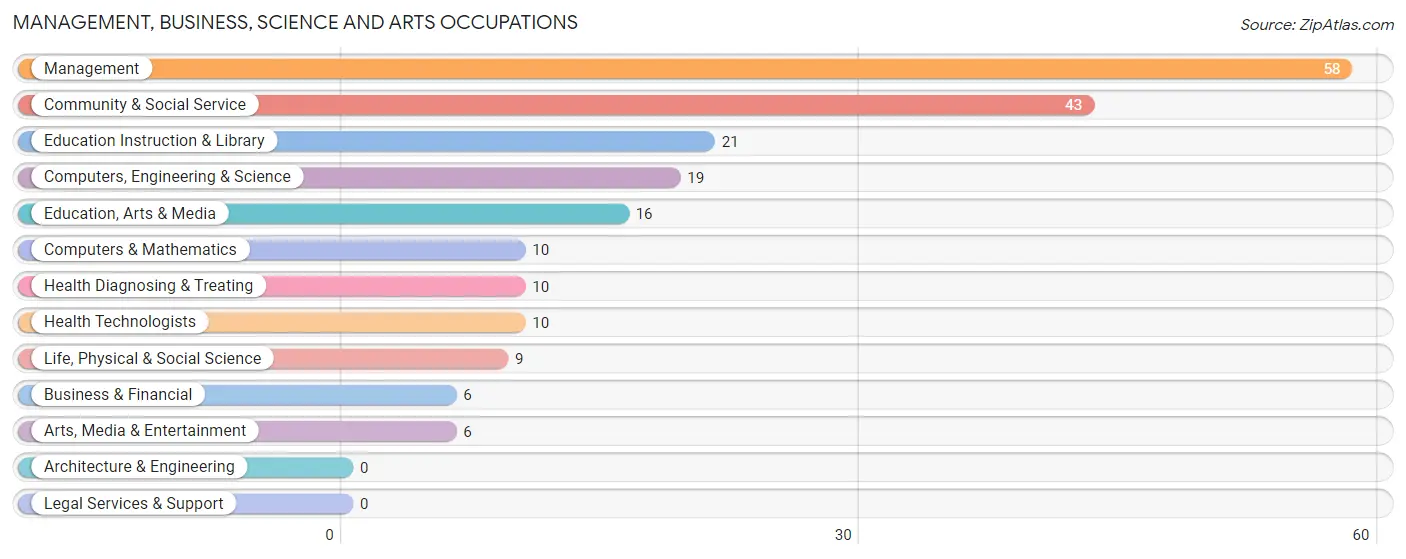
Management, Business, Science and Arts Occupations
The most common Management, Business, Science and Arts occupations in Horseshoe Bend are Management (58 | 9.6%), Community & Social Service (43 | 7.1%), Education Instruction & Library (21 | 3.5%), Computers, Engineering & Science (19 | 3.2%), and Education, Arts & Media (16 | 2.6%).
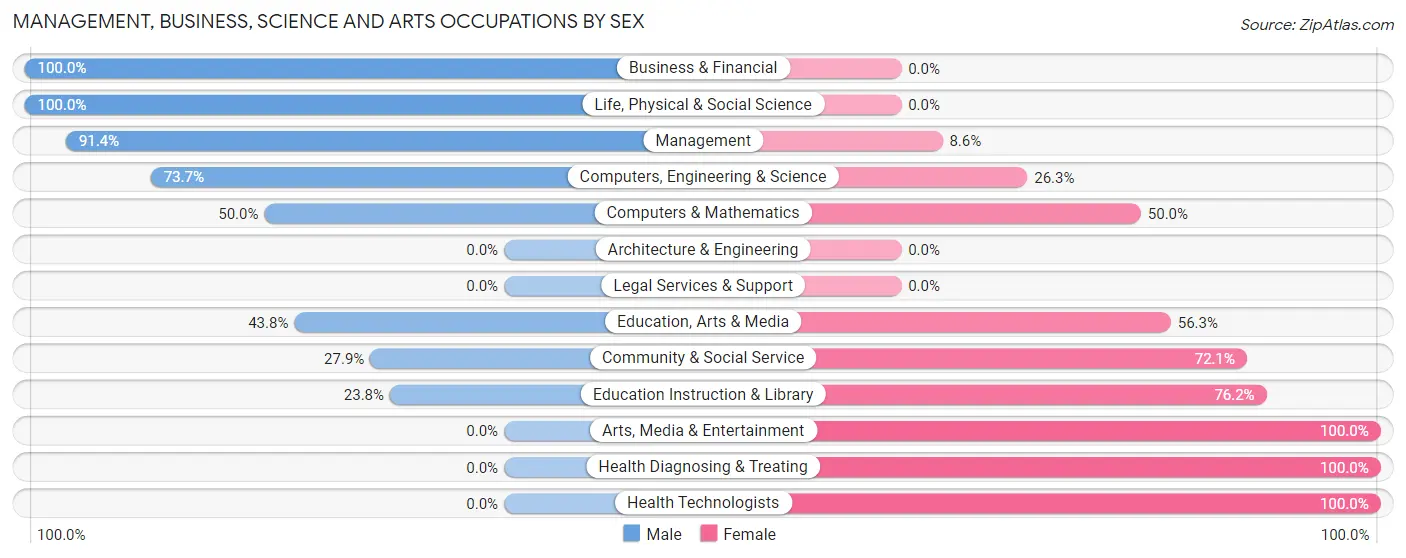
Management, Business, Science and Arts Occupations by Sex
Within the Management, Business, Science and Arts occupations in Horseshoe Bend, the most male-oriented occupations are Business & Financial (100.0%), Life, Physical & Social Science (100.0%), and Management (91.4%), while the most female-oriented occupations are Arts, Media & Entertainment (100.0%), Health Diagnosing & Treating (100.0%), and Health Technologists (100.0%).
| Occupation | Male | Female |
| Management | 53 (91.4%) | 5 (8.6%) |
| Business & Financial | 6 (100.0%) | 0 (0.0%) |
| Computers, Engineering & Science | 14 (73.7%) | 5 (26.3%) |
| Computers & Mathematics | 5 (50.0%) | 5 (50.0%) |
| Architecture & Engineering | 0 (0.0%) | 0 (0.0%) |
| Life, Physical & Social Science | 9 (100.0%) | 0 (0.0%) |
| Community & Social Service | 12 (27.9%) | 31 (72.1%) |
| Education, Arts & Media | 7 (43.8%) | 9 (56.2%) |
| Legal Services & Support | 0 (0.0%) | 0 (0.0%) |
| Education Instruction & Library | 5 (23.8%) | 16 (76.2%) |
| Arts, Media & Entertainment | 0 (0.0%) | 6 (100.0%) |
| Health Diagnosing & Treating | 0 (0.0%) | 10 (100.0%) |
| Health Technologists | 0 (0.0%) | 10 (100.0%) |
| Total (Category) | 85 (62.5%) | 51 (37.5%) |
| Total (Overall) | 382 (63.3%) | 221 (36.6%) |
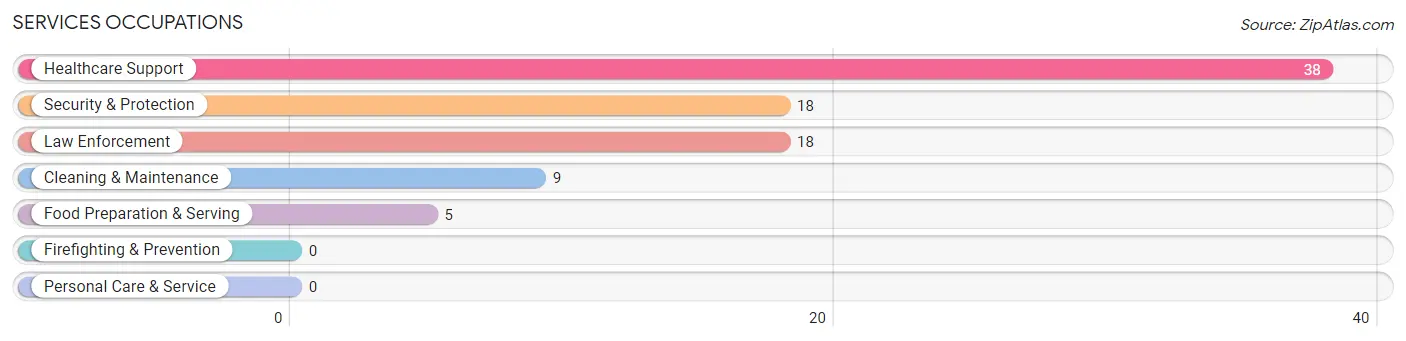
Services Occupations
The most common Services occupations in Horseshoe Bend are Healthcare Support (38 | 6.3%), Security & Protection (18 | 3.0%), Law Enforcement (18 | 3.0%), Cleaning & Maintenance (9 | 1.5%), and Food Preparation & Serving (5 | 0.8%).
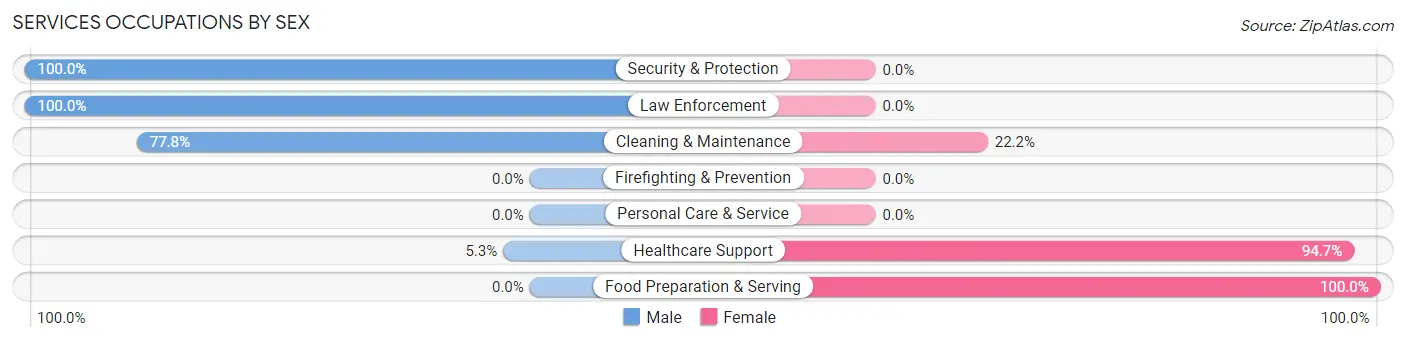
Services Occupations by Sex
Within the Services occupations in Horseshoe Bend, the most male-oriented occupations are Security & Protection (100.0%), Law Enforcement (100.0%), and Cleaning & Maintenance (77.8%), while the most female-oriented occupations are Food Preparation & Serving (100.0%), Healthcare Support (94.7%), and Cleaning & Maintenance (22.2%).
| Occupation | Male | Female |
| Healthcare Support | 2 (5.3%) | 36 (94.7%) |
| Security & Protection | 18 (100.0%) | 0 (0.0%) |
| Firefighting & Prevention | 0 (0.0%) | 0 (0.0%) |
| Law Enforcement | 18 (100.0%) | 0 (0.0%) |
| Food Preparation & Serving | 0 (0.0%) | 5 (100.0%) |
| Cleaning & Maintenance | 7 (77.8%) | 2 (22.2%) |
| Personal Care & Service | 0 (0.0%) | 0 (0.0%) |
| Total (Category) | 27 (38.6%) | 43 (61.4%) |
| Total (Overall) | 382 (63.3%) | 221 (36.6%) |
Sales and Office Occupations
The most common Sales and Office occupations in Horseshoe Bend are Office & Administration (52 | 8.6%), and Sales & Related (27 | 4.5%).
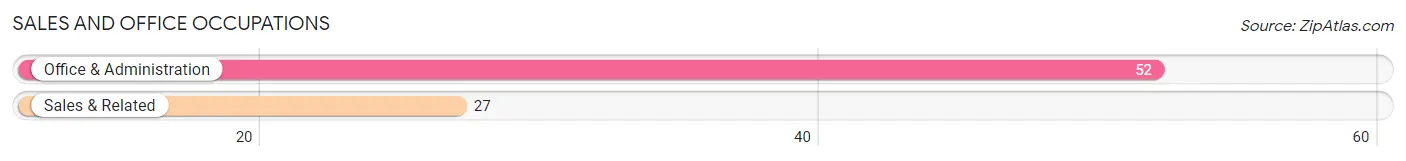
Sales and Office Occupations by Sex
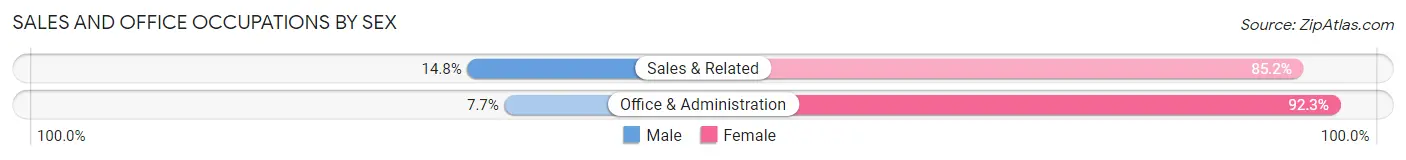
| Occupation | Male | Female |
| Sales & Related | 4 (14.8%) | 23 (85.2%) |
| Office & Administration | 4 (7.7%) | 48 (92.3%) |
| Total (Category) | 8 (10.1%) | 71 (89.9%) |
| Total (Overall) | 382 (63.3%) | 221 (36.6%) |
Natural Resources, Construction and Maintenance Occupations
The most common Natural Resources, Construction and Maintenance occupations in Horseshoe Bend are Construction & Extraction (41 | 6.8%), and Installation, Maintenance & Repair (9 | 1.5%).
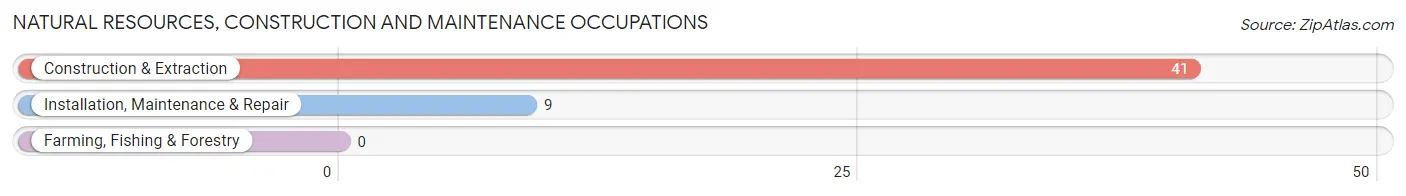
Natural Resources, Construction and Maintenance Occupations by Sex
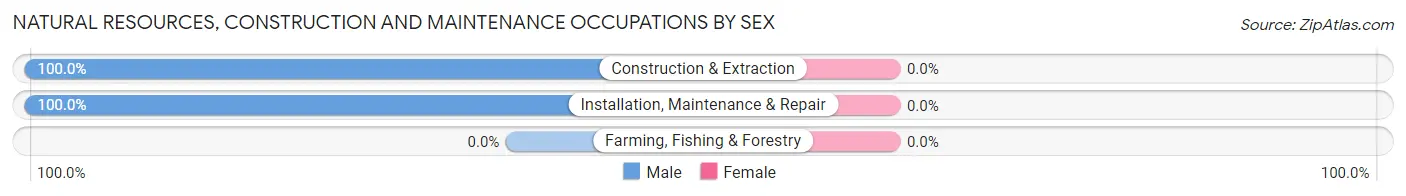
| Occupation | Male | Female |
| Farming, Fishing & Forestry | 0 (0.0%) | 0 (0.0%) |
| Construction & Extraction | 41 (100.0%) | 0 (0.0%) |
| Installation, Maintenance & Repair | 9 (100.0%) | 0 (0.0%) |
| Total (Category) | 50 (100.0%) | 0 (0.0%) |
| Total (Overall) | 382 (63.3%) | 221 (36.6%) |
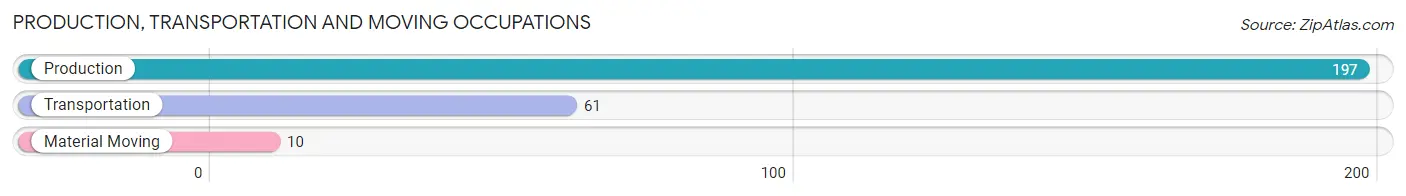
Production, Transportation and Moving Occupations
The most common Production, Transportation and Moving occupations in Horseshoe Bend are Production (197 | 32.7%), Transportation (61 | 10.1%), and Material Moving (10 | 1.7%).
Production, Transportation and Moving Occupations by Sex
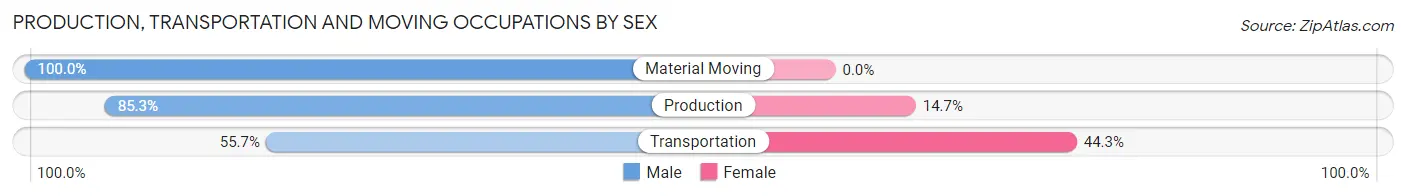
| Occupation | Male | Female |
| Production | 168 (85.3%) | 29 (14.7%) |
| Transportation | 34 (55.7%) | 27 (44.3%) |
| Material Moving | 10 (100.0%) | 0 (0.0%) |
| Total (Category) | 212 (79.1%) | 56 (20.9%) |
| Total (Overall) | 382 (63.3%) | 221 (36.6%) |
Employment Industries by Sex in Horseshoe Bend
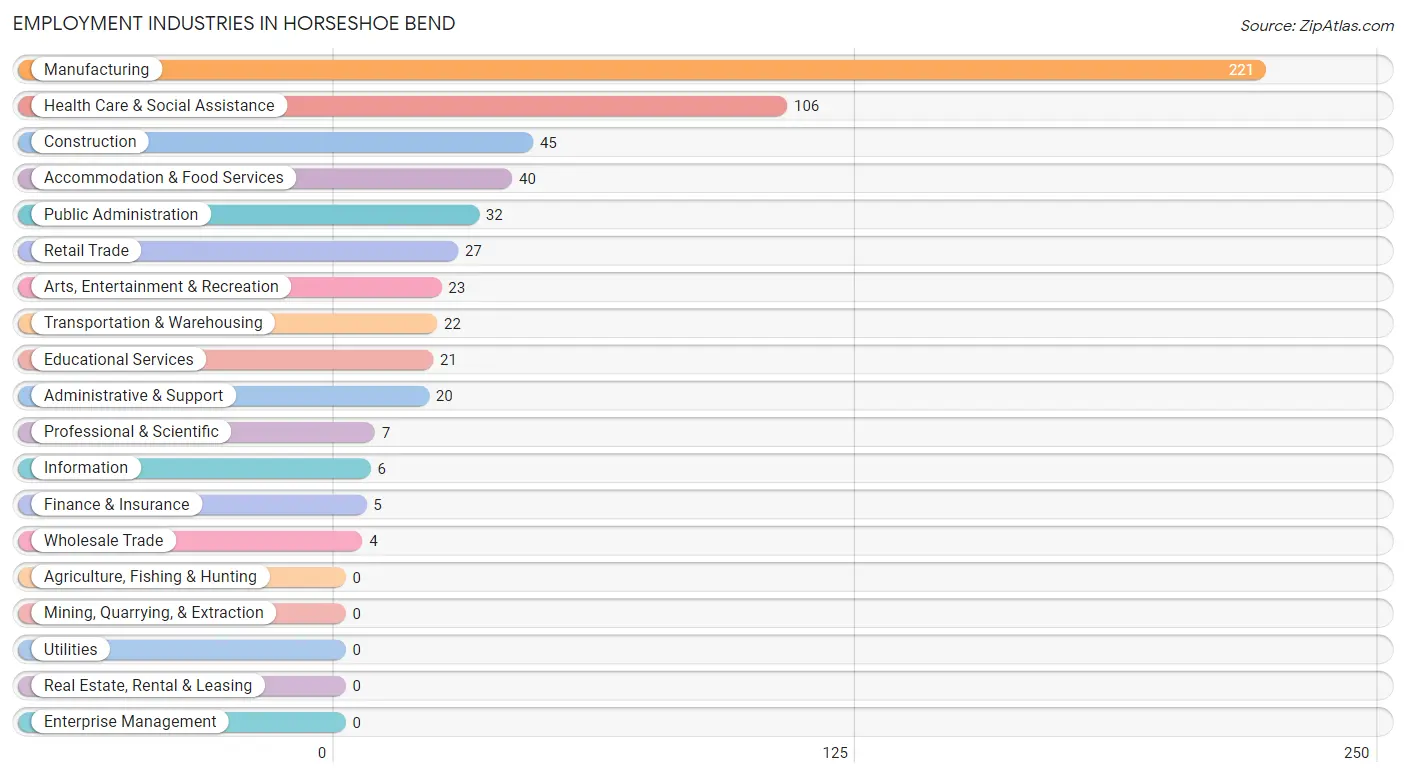
Employment Industries in Horseshoe Bend
The major employment industries in Horseshoe Bend include Manufacturing (221 | 36.6%), Health Care & Social Assistance (106 | 17.6%), Construction (45 | 7.5%), Accommodation & Food Services (40 | 6.6%), and Public Administration (32 | 5.3%).
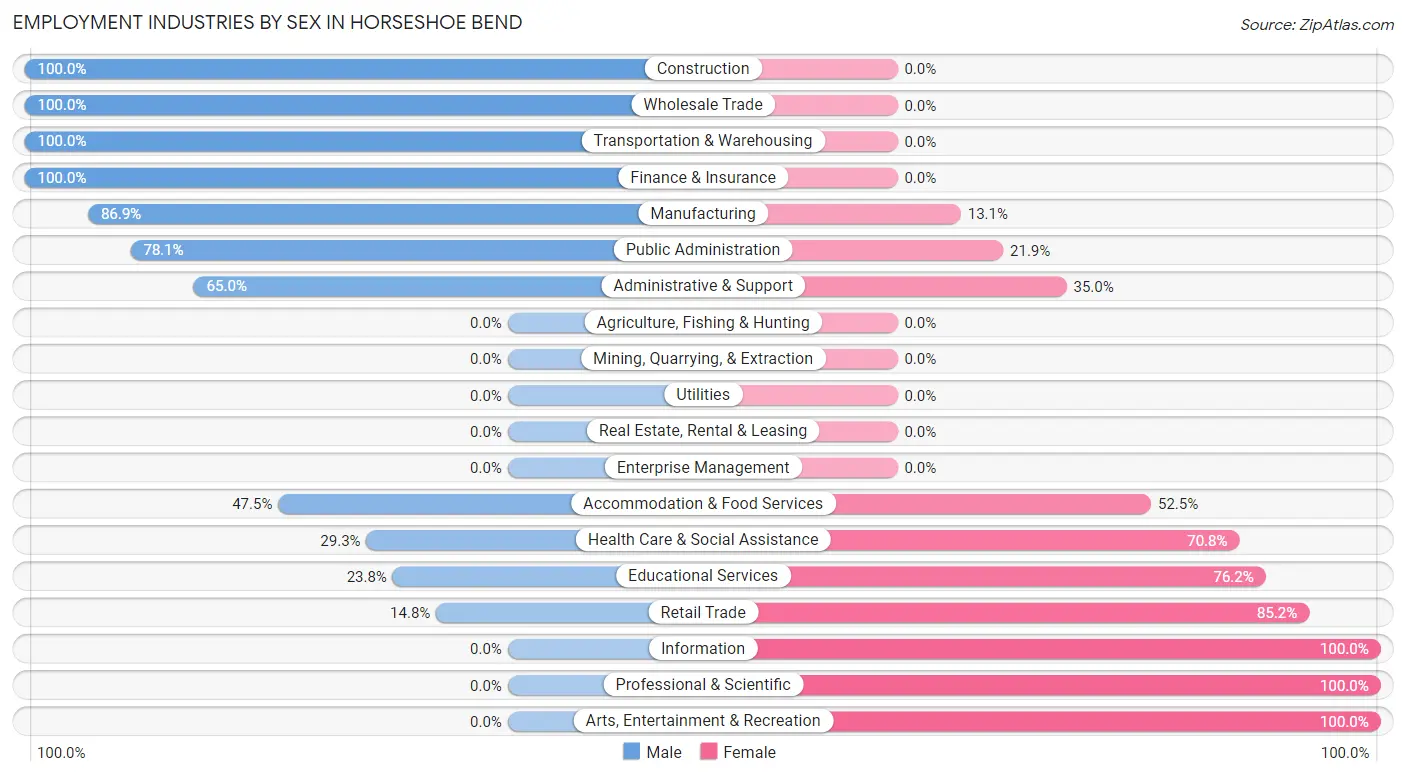
Employment Industries by Sex in Horseshoe Bend
The Horseshoe Bend industries that see more men than women are Construction (100.0%), Wholesale Trade (100.0%), and Transportation & Warehousing (100.0%), whereas the industries that tend to have a higher number of women are Information (100.0%), Professional & Scientific (100.0%), and Arts, Entertainment & Recreation (100.0%).
| Industry | Male | Female |
| Agriculture, Fishing & Hunting | 0 (0.0%) | 0 (0.0%) |
| Mining, Quarrying, & Extraction | 0 (0.0%) | 0 (0.0%) |
| Construction | 45 (100.0%) | 0 (0.0%) |
| Manufacturing | 192 (86.9%) | 29 (13.1%) |
| Wholesale Trade | 4 (100.0%) | 0 (0.0%) |
| Retail Trade | 4 (14.8%) | 23 (85.2%) |
| Transportation & Warehousing | 22 (100.0%) | 0 (0.0%) |
| Utilities | 0 (0.0%) | 0 (0.0%) |
| Information | 0 (0.0%) | 6 (100.0%) |
| Finance & Insurance | 5 (100.0%) | 0 (0.0%) |
| Real Estate, Rental & Leasing | 0 (0.0%) | 0 (0.0%) |
| Professional & Scientific | 0 (0.0%) | 7 (100.0%) |
| Enterprise Management | 0 (0.0%) | 0 (0.0%) |
| Administrative & Support | 13 (65.0%) | 7 (35.0%) |
| Educational Services | 5 (23.8%) | 16 (76.2%) |
| Health Care & Social Assistance | 31 (29.2%) | 75 (70.8%) |
| Arts, Entertainment & Recreation | 0 (0.0%) | 23 (100.0%) |
| Accommodation & Food Services | 19 (47.5%) | 21 (52.5%) |
| Public Administration | 25 (78.1%) | 7 (21.9%) |
| Total | 382 (63.3%) | 221 (36.6%) |
Education in Horseshoe Bend
School Enrollment in Horseshoe Bend
The most common levels of schooling among the 313 students in Horseshoe Bend are middle school (133 | 42.5%), high school (68 | 21.7%), and elementary school (38 | 12.1%).
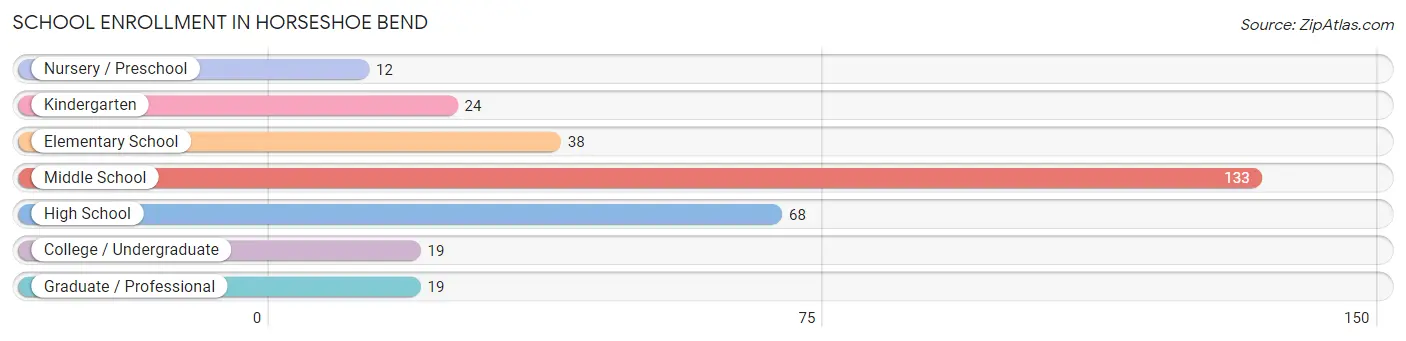
| School Level | # Students | % Students |
| Nursery / Preschool | 12 | 3.8% |
| Kindergarten | 24 | 7.7% |
| Elementary School | 38 | 12.1% |
| Middle School | 133 | 42.5% |
| High School | 68 | 21.7% |
| College / Undergraduate | 19 | 6.1% |
| Graduate / Professional | 19 | 6.1% |
| Total | 313 | 100.0% |
School Enrollment by Age by Funding Source in Horseshoe Bend
Out of a total of 313 students who are enrolled in schools in Horseshoe Bend, 53 (16.9%) attend a private institution, while the remaining 260 (83.1%) are enrolled in public schools. The age group of 10 to 14 year olds has the highest likelihood of being enrolled in private schools, with 43 (29.7% in the age bracket) enrolled. Conversely, the age group of 3 to 4 year olds has the lowest likelihood of being enrolled in a private school, with 2 (100.0% in the age bracket) attending a public institution.
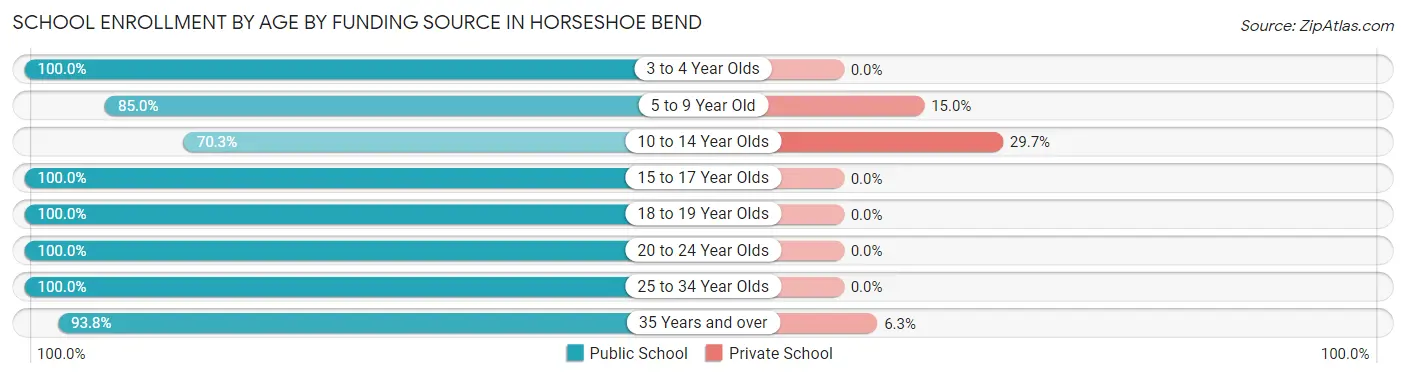
| Age Bracket | Public School | Private School |
| 3 to 4 Year Olds | 2 (100.0%) | 0 (0.0%) |
| 5 to 9 Year Old | 51 (85.0%) | 9 (15.0%) |
| 10 to 14 Year Olds | 102 (70.3%) | 43 (29.7%) |
| 15 to 17 Year Olds | 50 (100.0%) | 0 (0.0%) |
| 18 to 19 Year Olds | 18 (100.0%) | 0 (0.0%) |
| 20 to 24 Year Olds | 18 (100.0%) | 0 (0.0%) |
| 25 to 34 Year Olds | 4 (100.0%) | 0 (0.0%) |
| 35 Years and over | 15 (93.8%) | 1 (6.2%) |
| Total | 260 (83.1%) | 53 (16.9%) |
Educational Attainment by Field of Study in Horseshoe Bend
Business (117 | 26.3%), arts & humanities (98 | 22.0%), education (67 | 15.1%), science & technology (42 | 9.4%), and literature & languages (40 | 9.0%) are the most common fields of study among 445 individuals in Horseshoe Bend who have obtained a bachelor's degree or higher.
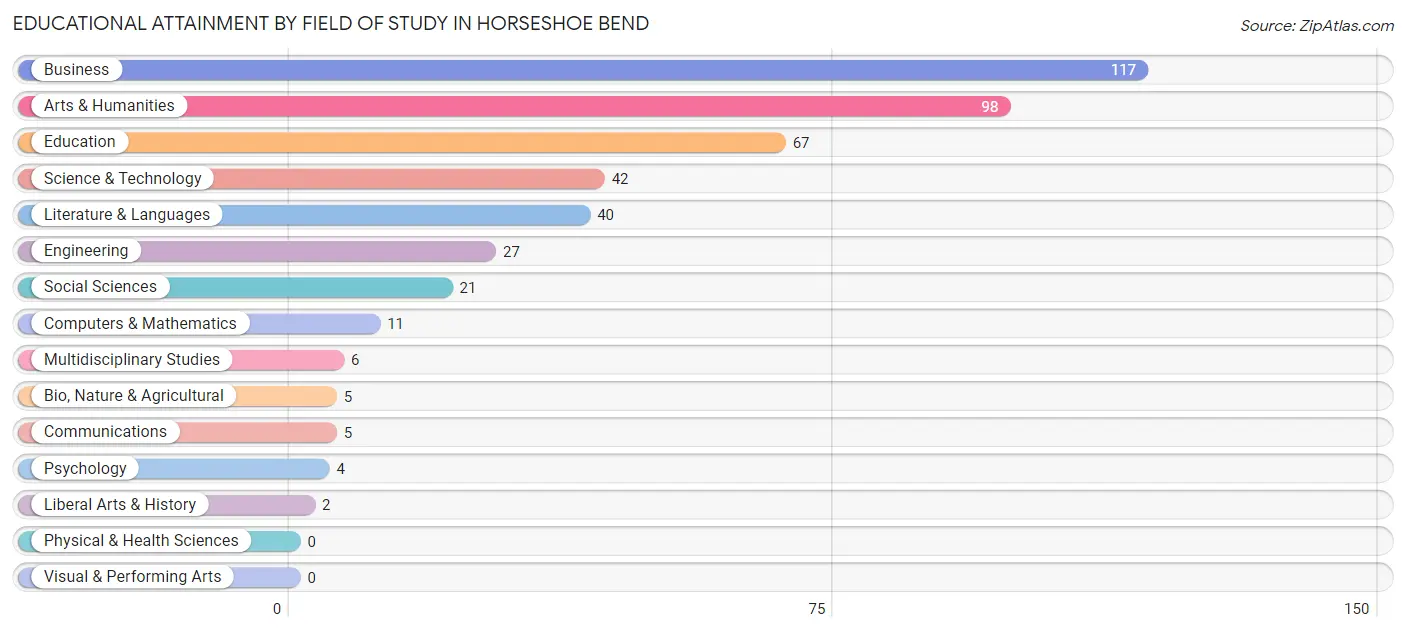
| Field of Study | # Graduates | % Graduates |
| Computers & Mathematics | 11 | 2.5% |
| Bio, Nature & Agricultural | 5 | 1.1% |
| Physical & Health Sciences | 0 | 0.0% |
| Psychology | 4 | 0.9% |
| Social Sciences | 21 | 4.7% |
| Engineering | 27 | 6.1% |
| Multidisciplinary Studies | 6 | 1.3% |
| Science & Technology | 42 | 9.4% |
| Business | 117 | 26.3% |
| Education | 67 | 15.1% |
| Literature & Languages | 40 | 9.0% |
| Liberal Arts & History | 2 | 0.4% |
| Visual & Performing Arts | 0 | 0.0% |
| Communications | 5 | 1.1% |
| Arts & Humanities | 98 | 22.0% |
| Total | 445 | 100.0% |
Transportation & Commute in Horseshoe Bend
Vehicle Availability by Sex in Horseshoe Bend
The most prevalent vehicle ownership categories in Horseshoe Bend are males with 2 vehicles (267, accounting for 69.9%) and females with 2 vehicles (88, making up 127.1%).
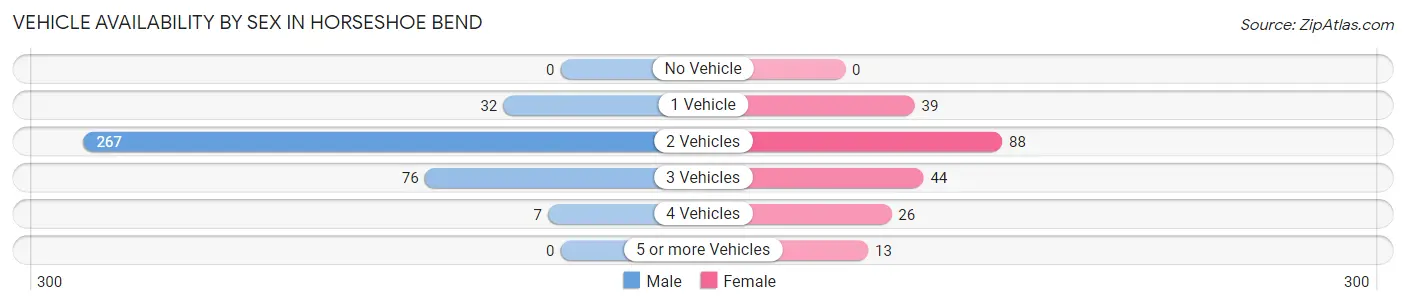
| Vehicles Available | Male | Female |
| No Vehicle | 0 (0.0%) | 0 (0.0%) |
| 1 Vehicle | 32 (8.4%) | 39 (18.6%) |
| 2 Vehicles | 267 (69.9%) | 88 (41.9%) |
| 3 Vehicles | 76 (19.9%) | 44 (20.9%) |
| 4 Vehicles | 7 (1.8%) | 26 (12.4%) |
| 5 or more Vehicles | 0 (0.0%) | 13 (6.2%) |
| Total | 382 (100.0%) | 210 (100.0%) |
Commute Time in Horseshoe Bend
The most frequently occuring commute durations in Horseshoe Bend are 20 to 24 minutes (133 commuters, 23.8%), 5 to 9 minutes (114 commuters, 20.4%), and 45 to 59 minutes (76 commuters, 13.6%).
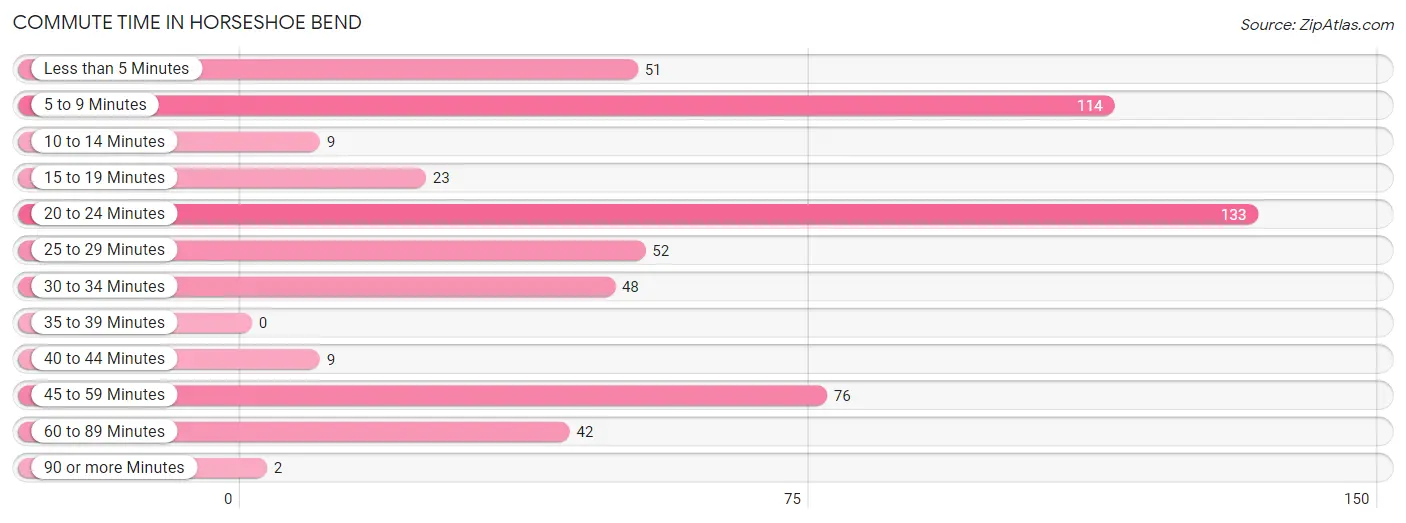
| Commute Time | # Commuters | % Commuters |
| Less than 5 Minutes | 51 | 9.1% |
| 5 to 9 Minutes | 114 | 20.4% |
| 10 to 14 Minutes | 9 | 1.6% |
| 15 to 19 Minutes | 23 | 4.1% |
| 20 to 24 Minutes | 133 | 23.8% |
| 25 to 29 Minutes | 52 | 9.3% |
| 30 to 34 Minutes | 48 | 8.6% |
| 35 to 39 Minutes | 0 | 0.0% |
| 40 to 44 Minutes | 9 | 1.6% |
| 45 to 59 Minutes | 76 | 13.6% |
| 60 to 89 Minutes | 42 | 7.5% |
| 90 or more Minutes | 2 | 0.4% |
Commute Time by Sex in Horseshoe Bend
The most common commute times in Horseshoe Bend are 20 to 24 minutes (101 commuters, 26.8%) for males and 30 to 34 minutes (39 commuters, 21.4%) for females.
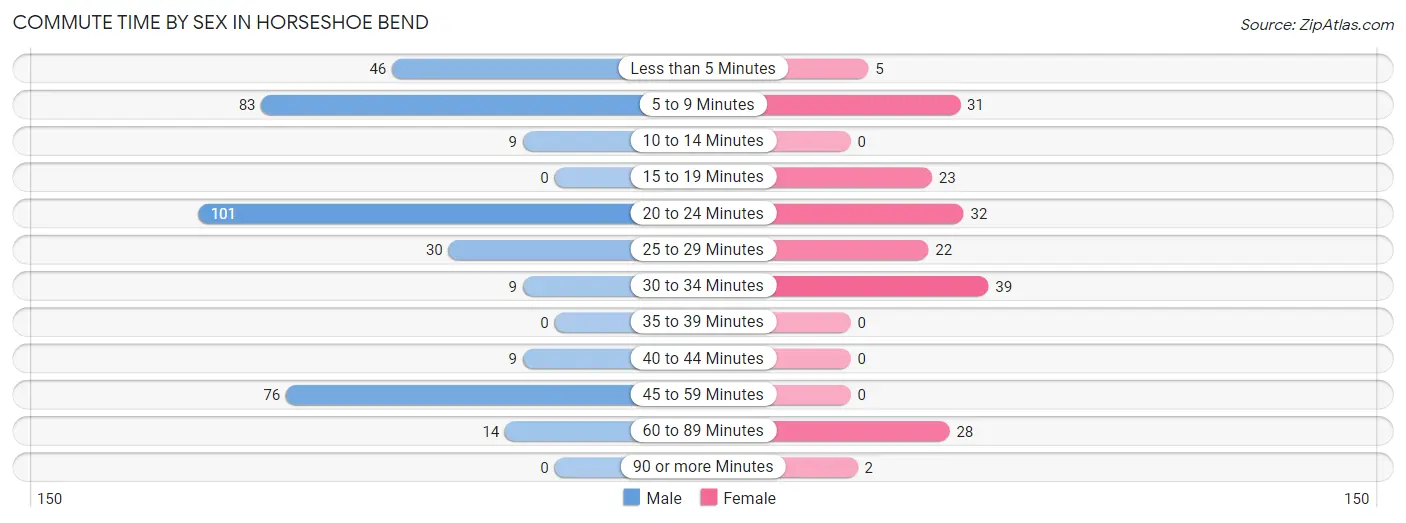
| Commute Time | Male | Female |
| Less than 5 Minutes | 46 (12.2%) | 5 (2.8%) |
| 5 to 9 Minutes | 83 (22.0%) | 31 (17.0%) |
| 10 to 14 Minutes | 9 (2.4%) | 0 (0.0%) |
| 15 to 19 Minutes | 0 (0.0%) | 23 (12.6%) |
| 20 to 24 Minutes | 101 (26.8%) | 32 (17.6%) |
| 25 to 29 Minutes | 30 (8.0%) | 22 (12.1%) |
| 30 to 34 Minutes | 9 (2.4%) | 39 (21.4%) |
| 35 to 39 Minutes | 0 (0.0%) | 0 (0.0%) |
| 40 to 44 Minutes | 9 (2.4%) | 0 (0.0%) |
| 45 to 59 Minutes | 76 (20.2%) | 0 (0.0%) |
| 60 to 89 Minutes | 14 (3.7%) | 28 (15.4%) |
| 90 or more Minutes | 0 (0.0%) | 2 (1.1%) |
Time of Departure to Work by Sex in Horseshoe Bend
The most frequent times of departure to work in Horseshoe Bend are 7:30 AM to 7:59 AM (100, 26.5%) for males and 6:30 AM to 6:59 AM (46, 25.3%) for females.
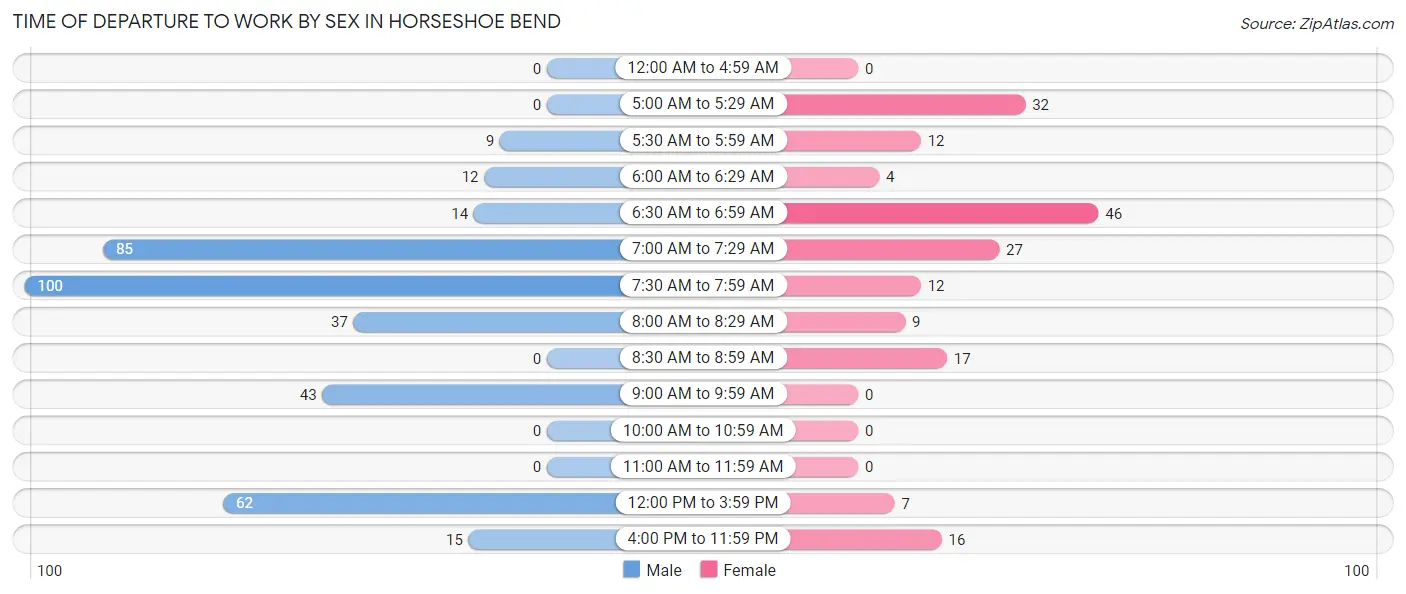
| Time of Departure | Male | Female |
| 12:00 AM to 4:59 AM | 0 (0.0%) | 0 (0.0%) |
| 5:00 AM to 5:29 AM | 0 (0.0%) | 32 (17.6%) |
| 5:30 AM to 5:59 AM | 9 (2.4%) | 12 (6.6%) |
| 6:00 AM to 6:29 AM | 12 (3.2%) | 4 (2.2%) |
| 6:30 AM to 6:59 AM | 14 (3.7%) | 46 (25.3%) |
| 7:00 AM to 7:29 AM | 85 (22.6%) | 27 (14.8%) |
| 7:30 AM to 7:59 AM | 100 (26.5%) | 12 (6.6%) |
| 8:00 AM to 8:29 AM | 37 (9.8%) | 9 (5.0%) |
| 8:30 AM to 8:59 AM | 0 (0.0%) | 17 (9.3%) |
| 9:00 AM to 9:59 AM | 43 (11.4%) | 0 (0.0%) |
| 10:00 AM to 10:59 AM | 0 (0.0%) | 0 (0.0%) |
| 11:00 AM to 11:59 AM | 0 (0.0%) | 0 (0.0%) |
| 12:00 PM to 3:59 PM | 62 (16.5%) | 7 (3.8%) |
| 4:00 PM to 11:59 PM | 15 (4.0%) | 16 (8.8%) |
| Total | 377 (100.0%) | 182 (100.0%) |
Housing Occupancy in Horseshoe Bend
Occupancy by Ownership in Horseshoe Bend
Of the total 905 dwellings in Horseshoe Bend, owner-occupied units account for 721 (79.7%), while renter-occupied units make up 184 (20.3%).
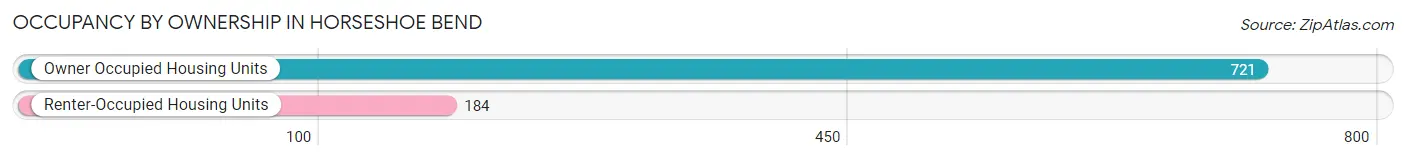
| Occupancy | # Housing Units | % Housing Units |
| Owner Occupied Housing Units | 721 | 79.7% |
| Renter-Occupied Housing Units | 184 | 20.3% |
| Total Occupied Housing Units | 905 | 100.0% |
Occupancy by Household Size in Horseshoe Bend
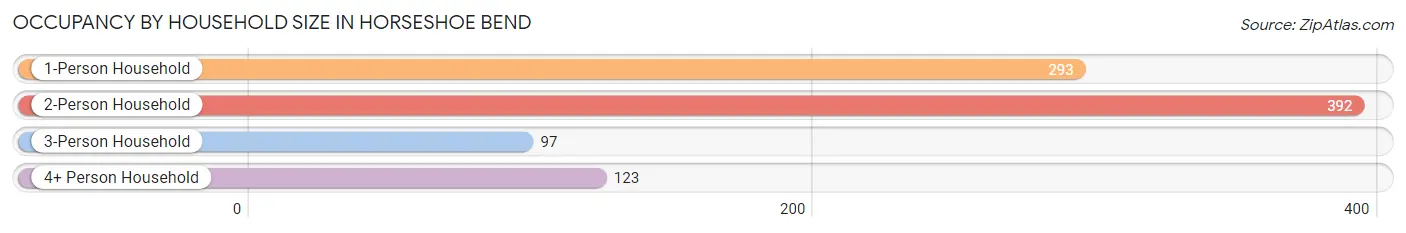
| Household Size | # Housing Units | % Housing Units |
| 1-Person Household | 293 | 32.4% |
| 2-Person Household | 392 | 43.3% |
| 3-Person Household | 97 | 10.7% |
| 4+ Person Household | 123 | 13.6% |
| Total Housing Units | 905 | 100.0% |
Occupancy by Ownership by Household Size in Horseshoe Bend
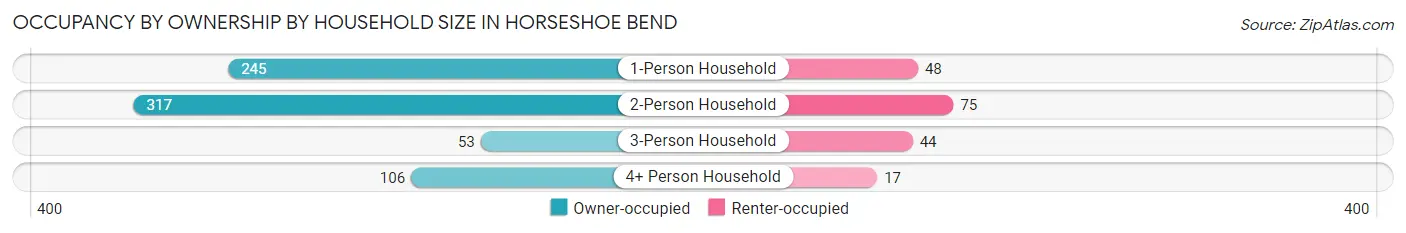
| Household Size | Owner-occupied | Renter-occupied |
| 1-Person Household | 245 (83.6%) | 48 (16.4%) |
| 2-Person Household | 317 (80.9%) | 75 (19.1%) |
| 3-Person Household | 53 (54.6%) | 44 (45.4%) |
| 4+ Person Household | 106 (86.2%) | 17 (13.8%) |
| Total Housing Units | 721 (79.7%) | 184 (20.3%) |
Occupancy by Educational Attainment in Horseshoe Bend
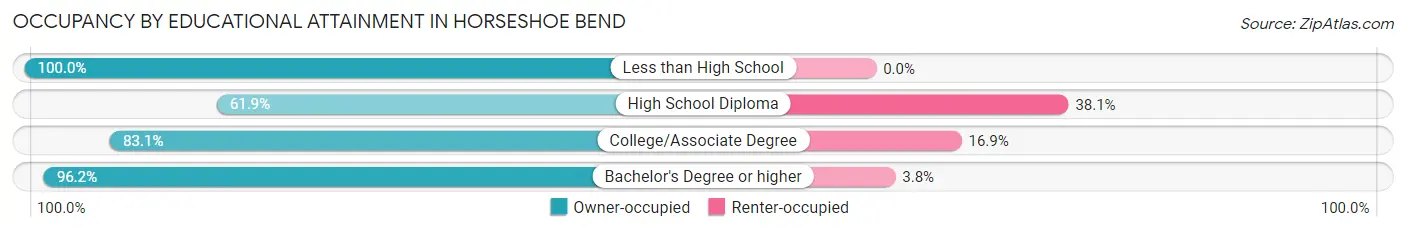
| Household Size | Owner-occupied | Renter-occupied |
| Less than High School | 56 (100.0%) | 0 (0.0%) |
| High School Diploma | 198 (61.9%) | 122 (38.1%) |
| College/Associate Degree | 265 (83.1%) | 54 (16.9%) |
| Bachelor's Degree or higher | 202 (96.2%) | 8 (3.8%) |
Occupancy by Age of Householder in Horseshoe Bend
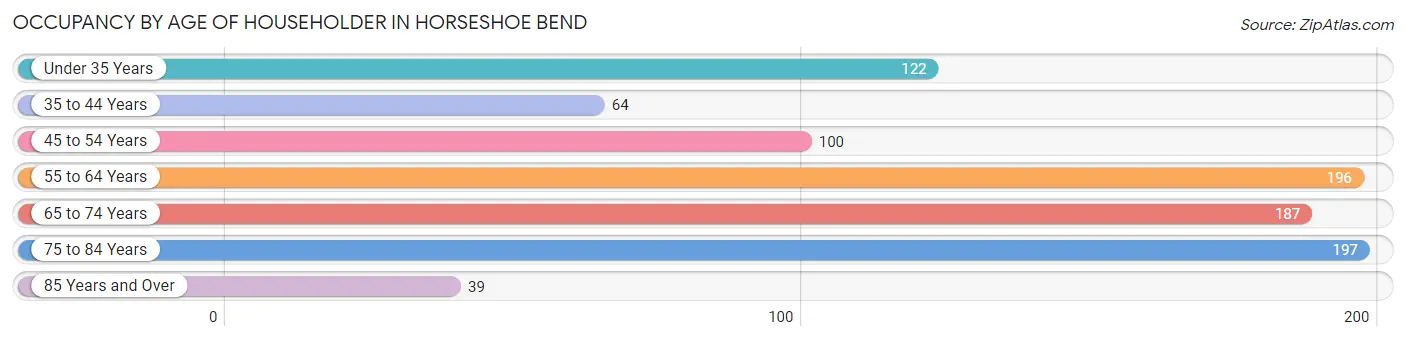
| Age Bracket | # Households | % Households |
| Under 35 Years | 122 | 13.5% |
| 35 to 44 Years | 64 | 7.1% |
| 45 to 54 Years | 100 | 11.1% |
| 55 to 64 Years | 196 | 21.7% |
| 65 to 74 Years | 187 | 20.7% |
| 75 to 84 Years | 197 | 21.8% |
| 85 Years and Over | 39 | 4.3% |
| Total | 905 | 100.0% |
Housing Finances in Horseshoe Bend
Median Income by Occupancy in Horseshoe Bend
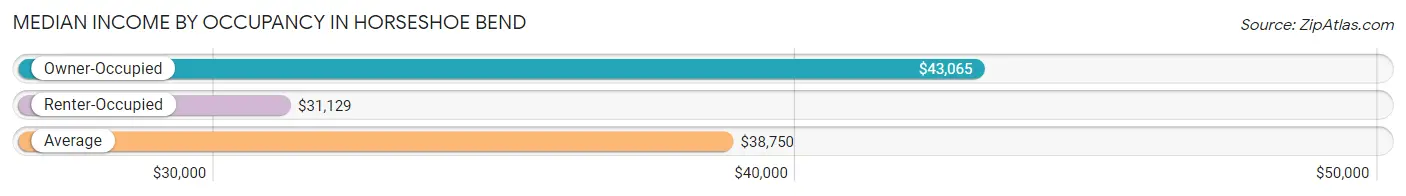
| Occupancy Type | # Households | Median Income |
| Owner-Occupied | 721 (79.7%) | $43,065 |
| Renter-Occupied | 184 (20.3%) | $31,129 |
| Average | 905 (100.0%) | $38,750 |
Occupancy by Householder Income Bracket in Horseshoe Bend
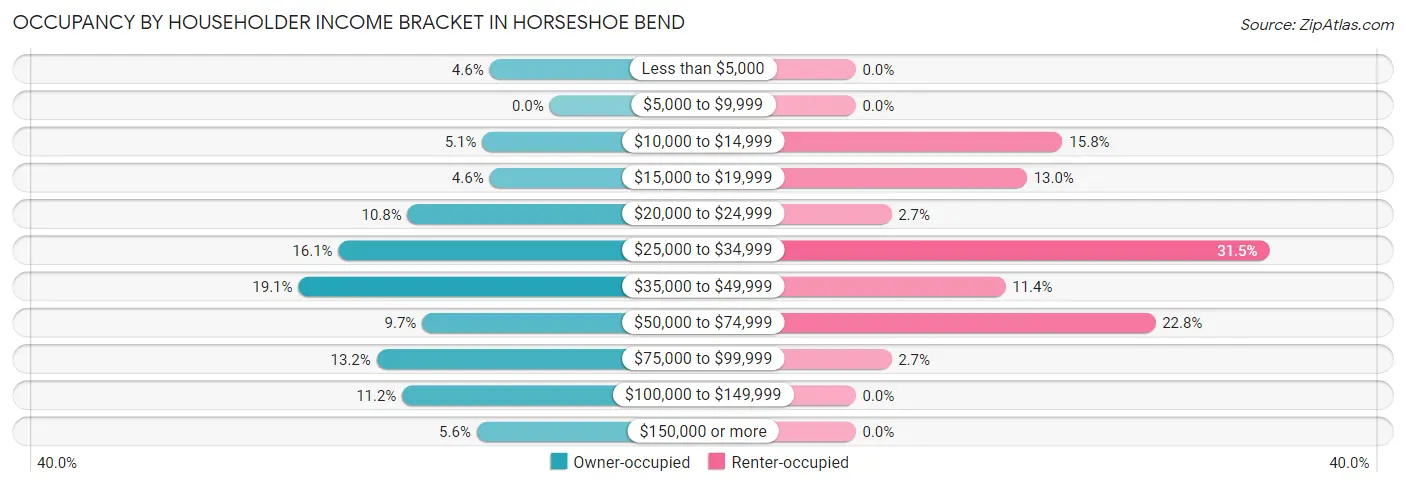
| Income Bracket | Owner-occupied | Renter-occupied |
| Less than $5,000 | 33 (4.6%) | 0 (0.0%) |
| $5,000 to $9,999 | 0 (0.0%) | 0 (0.0%) |
| $10,000 to $14,999 | 37 (5.1%) | 29 (15.8%) |
| $15,000 to $19,999 | 33 (4.6%) | 24 (13.0%) |
| $20,000 to $24,999 | 78 (10.8%) | 5 (2.7%) |
| $25,000 to $34,999 | 116 (16.1%) | 58 (31.5%) |
| $35,000 to $49,999 | 138 (19.1%) | 21 (11.4%) |
| $50,000 to $74,999 | 70 (9.7%) | 42 (22.8%) |
| $75,000 to $99,999 | 95 (13.2%) | 5 (2.7%) |
| $100,000 to $149,999 | 81 (11.2%) | 0 (0.0%) |
| $150,000 or more | 40 (5.6%) | 0 (0.0%) |
| Total | 721 (100.0%) | 184 (100.0%) |
Monthly Housing Cost Tiers in Horseshoe Bend
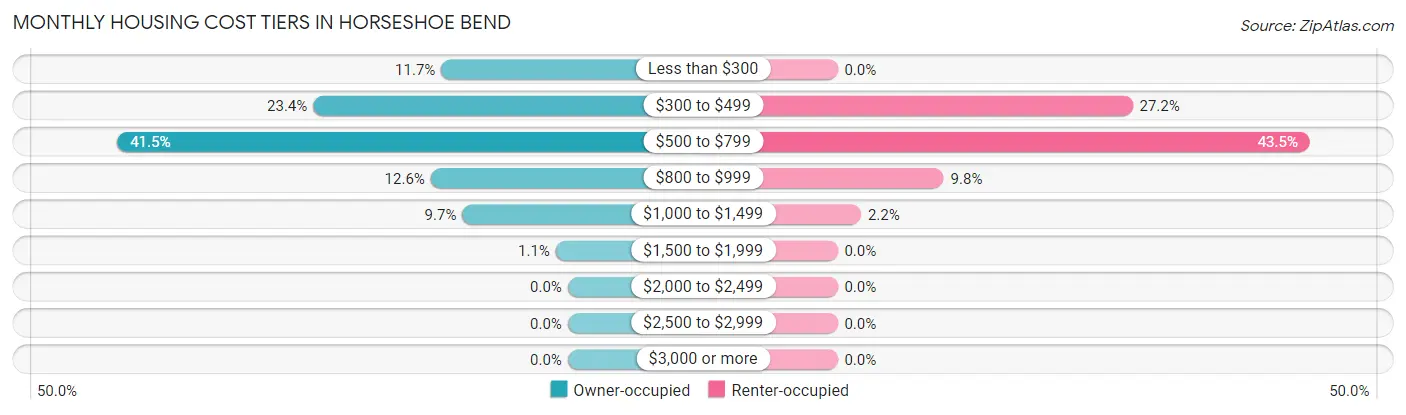
| Monthly Cost | Owner-occupied | Renter-occupied |
| Less than $300 | 84 (11.7%) | 0 (0.0%) |
| $300 to $499 | 169 (23.4%) | 50 (27.2%) |
| $500 to $799 | 299 (41.5%) | 80 (43.5%) |
| $800 to $999 | 91 (12.6%) | 18 (9.8%) |
| $1,000 to $1,499 | 70 (9.7%) | 4 (2.2%) |
| $1,500 to $1,999 | 8 (1.1%) | 0 (0.0%) |
| $2,000 to $2,499 | 0 (0.0%) | 0 (0.0%) |
| $2,500 to $2,999 | 0 (0.0%) | 0 (0.0%) |
| $3,000 or more | 0 (0.0%) | 0 (0.0%) |
| Total | 721 (100.0%) | 184 (100.0%) |
Physical Housing Characteristics in Horseshoe Bend
Housing Structures in Horseshoe Bend
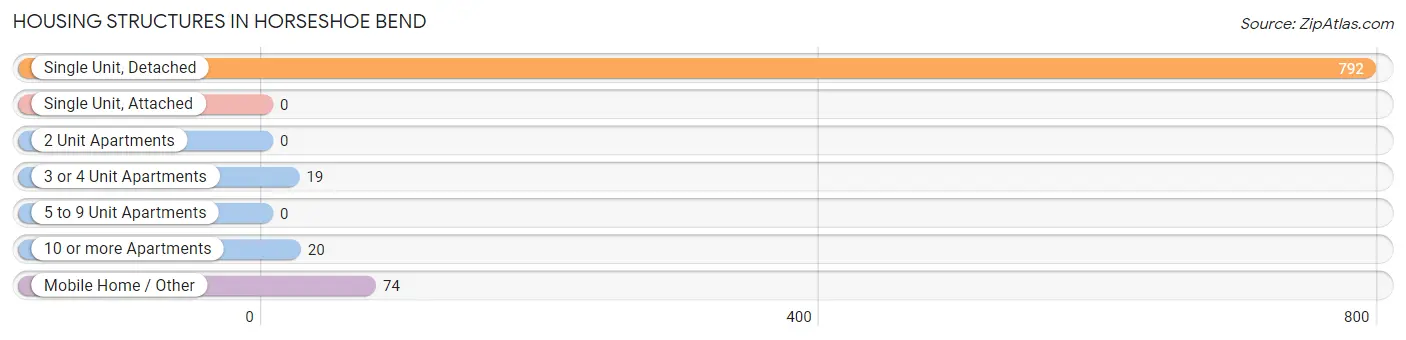
| Structure Type | # Housing Units | % Housing Units |
| Single Unit, Detached | 792 | 87.5% |
| Single Unit, Attached | 0 | 0.0% |
| 2 Unit Apartments | 0 | 0.0% |
| 3 or 4 Unit Apartments | 19 | 2.1% |
| 5 to 9 Unit Apartments | 0 | 0.0% |
| 10 or more Apartments | 20 | 2.2% |
| Mobile Home / Other | 74 | 8.2% |
| Total | 905 | 100.0% |
Housing Structures by Occupancy in Horseshoe Bend
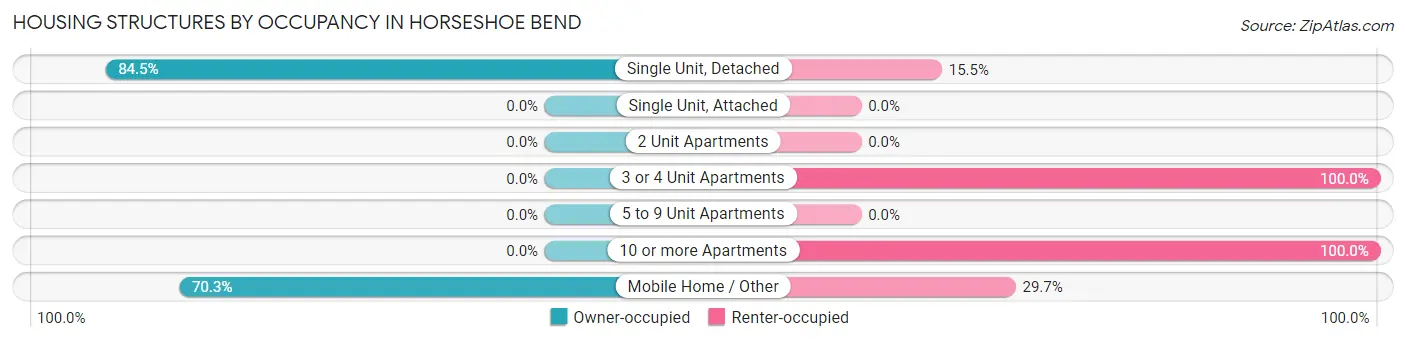
| Structure Type | Owner-occupied | Renter-occupied |
| Single Unit, Detached | 669 (84.5%) | 123 (15.5%) |
| Single Unit, Attached | 0 (0.0%) | 0 (0.0%) |
| 2 Unit Apartments | 0 (0.0%) | 0 (0.0%) |
| 3 or 4 Unit Apartments | 0 (0.0%) | 19 (100.0%) |
| 5 to 9 Unit Apartments | 0 (0.0%) | 0 (0.0%) |
| 10 or more Apartments | 0 (0.0%) | 20 (100.0%) |
| Mobile Home / Other | 52 (70.3%) | 22 (29.7%) |
| Total | 721 (79.7%) | 184 (20.3%) |
Housing Structures by Number of Rooms in Horseshoe Bend
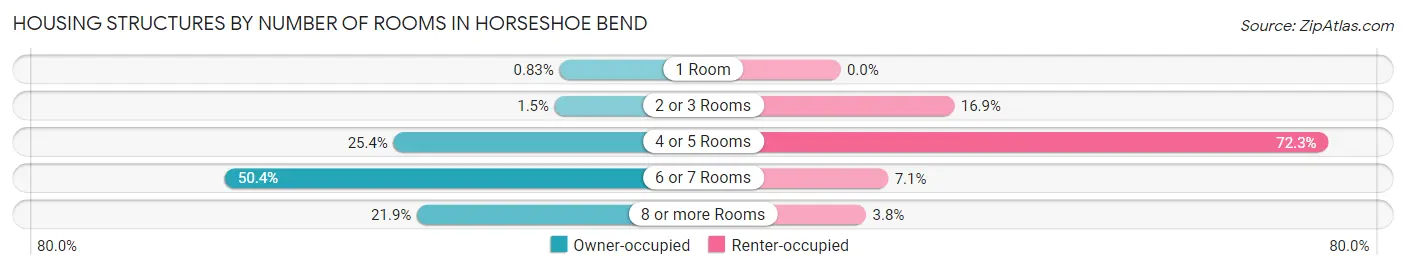
| Number of Rooms | Owner-occupied | Renter-occupied |
| 1 Room | 6 (0.8%) | 0 (0.0%) |
| 2 or 3 Rooms | 11 (1.5%) | 31 (16.9%) |
| 4 or 5 Rooms | 183 (25.4%) | 133 (72.3%) |
| 6 or 7 Rooms | 363 (50.3%) | 13 (7.1%) |
| 8 or more Rooms | 158 (21.9%) | 7 (3.8%) |
| Total | 721 (100.0%) | 184 (100.0%) |
Housing Structure by Heating Type in Horseshoe Bend
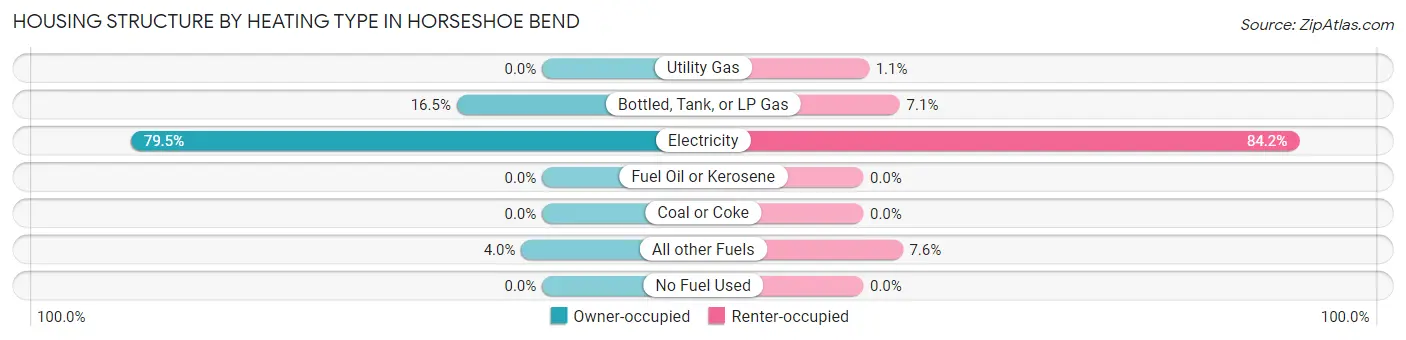
| Heating Type | Owner-occupied | Renter-occupied |
| Utility Gas | 0 (0.0%) | 2 (1.1%) |
| Bottled, Tank, or LP Gas | 119 (16.5%) | 13 (7.1%) |
| Electricity | 573 (79.5%) | 155 (84.2%) |
| Fuel Oil or Kerosene | 0 (0.0%) | 0 (0.0%) |
| Coal or Coke | 0 (0.0%) | 0 (0.0%) |
| All other Fuels | 29 (4.0%) | 14 (7.6%) |
| No Fuel Used | 0 (0.0%) | 0 (0.0%) |
| Total | 721 (100.0%) | 184 (100.0%) |
Household Vehicle Usage in Horseshoe Bend
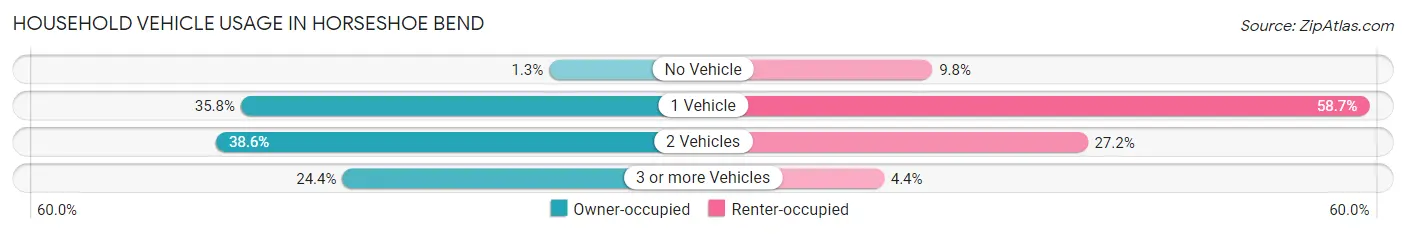
| Vehicles per Household | Owner-occupied | Renter-occupied |
| No Vehicle | 9 (1.3%) | 18 (9.8%) |
| 1 Vehicle | 258 (35.8%) | 108 (58.7%) |
| 2 Vehicles | 278 (38.6%) | 50 (27.2%) |
| 3 or more Vehicles | 176 (24.4%) | 8 (4.3%) |
| Total | 721 (100.0%) | 184 (100.0%) |
Real Estate & Mortgages in Horseshoe Bend
Real Estate and Mortgage Overview in Horseshoe Bend
| Characteristic | Without Mortgage | With Mortgage |
| Housing Units | 384 | 337 |
| Median Property Value | $105,900 | $101,100 |
| Median Household Income | $38,043 | $30 |
| Monthly Housing Costs | $447 | $0 |
| Real Estate Taxes | $610 | $27 |
Property Value by Mortgage Status in Horseshoe Bend
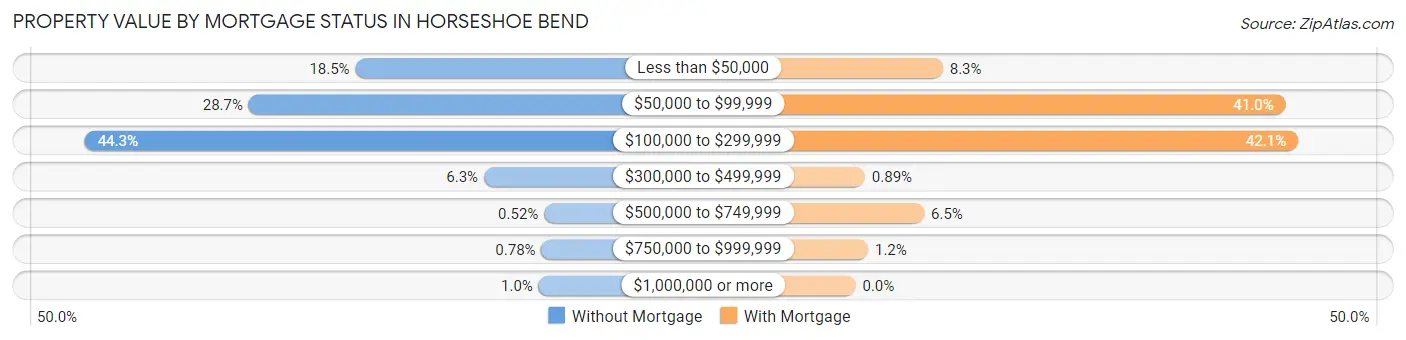
| Property Value | Without Mortgage | With Mortgage |
| Less than $50,000 | 71 (18.5%) | 28 (8.3%) |
| $50,000 to $99,999 | 110 (28.6%) | 138 (40.9%) |
| $100,000 to $299,999 | 170 (44.3%) | 142 (42.1%) |
| $300,000 to $499,999 | 24 (6.2%) | 3 (0.9%) |
| $500,000 to $749,999 | 2 (0.5%) | 22 (6.5%) |
| $750,000 to $999,999 | 3 (0.8%) | 4 (1.2%) |
| $1,000,000 or more | 4 (1.0%) | 0 (0.0%) |
| Total | 384 (100.0%) | 337 (100.0%) |
Household Income by Mortgage Status in Horseshoe Bend
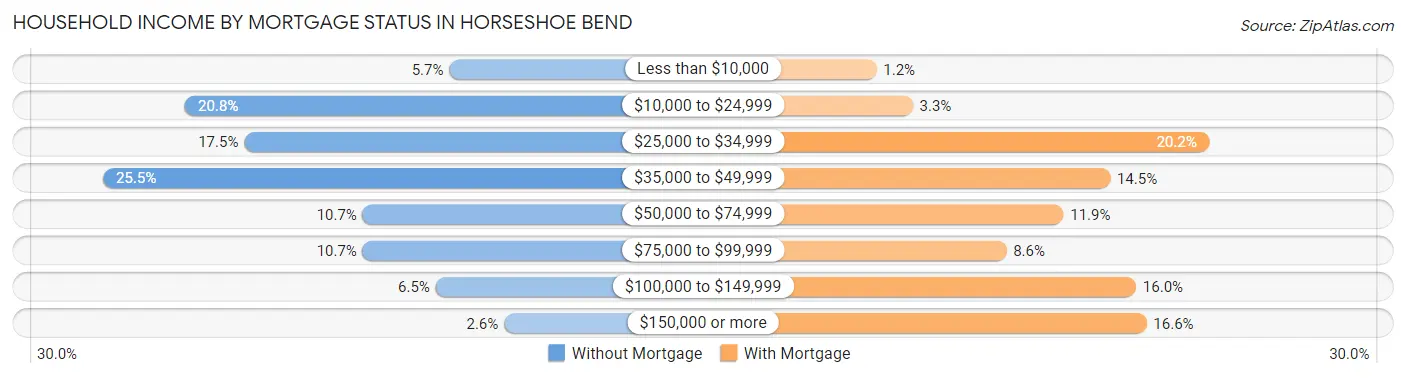
| Household Income | Without Mortgage | With Mortgage |
| Less than $10,000 | 22 (5.7%) | 4 (1.2%) |
| $10,000 to $24,999 | 80 (20.8%) | 11 (3.3%) |
| $25,000 to $34,999 | 67 (17.4%) | 68 (20.2%) |
| $35,000 to $49,999 | 98 (25.5%) | 49 (14.5%) |
| $50,000 to $74,999 | 41 (10.7%) | 40 (11.9%) |
| $75,000 to $99,999 | 41 (10.7%) | 29 (8.6%) |
| $100,000 to $149,999 | 25 (6.5%) | 54 (16.0%) |
| $150,000 or more | 10 (2.6%) | 56 (16.6%) |
| Total | 384 (100.0%) | 337 (100.0%) |
Property Value to Household Income Ratio in Horseshoe Bend
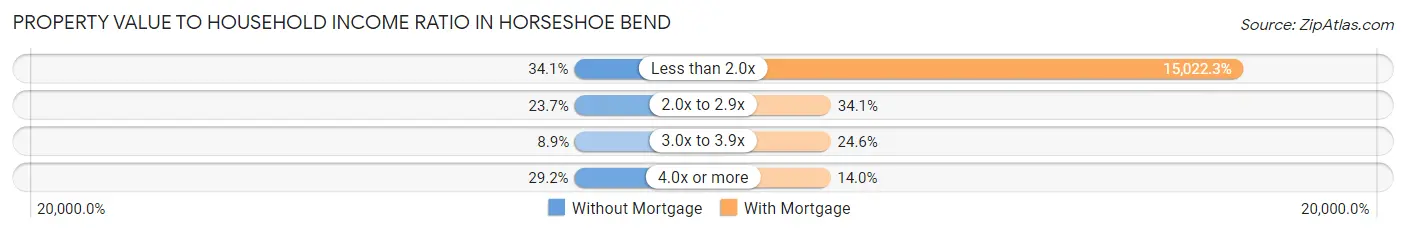
| Value-to-Income Ratio | Without Mortgage | With Mortgage |
| Less than 2.0x | 131 (34.1%) | 50,625 (15,022.3%) |
| 2.0x to 2.9x | 91 (23.7%) | 115 (34.1%) |
| 3.0x to 3.9x | 34 (8.8%) | 83 (24.6%) |
| 4.0x or more | 112 (29.2%) | 47 (14.0%) |
| Total | 384 (100.0%) | 337 (100.0%) |
Real Estate Taxes by Mortgage Status in Horseshoe Bend
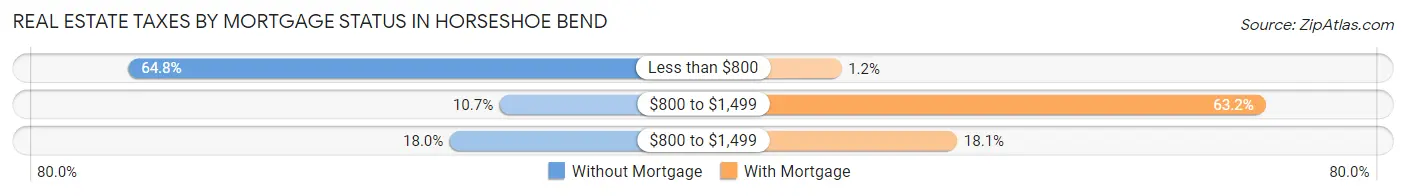
| Property Taxes | Without Mortgage | With Mortgage |
| Less than $800 | 249 (64.8%) | 4 (1.2%) |
| $800 to $1,499 | 41 (10.7%) | 213 (63.2%) |
| $800 to $1,499 | 69 (18.0%) | 61 (18.1%) |
| Total | 384 (100.0%) | 337 (100.0%) |
Health & Disability in Horseshoe Bend
Health Insurance Coverage by Age in Horseshoe Bend
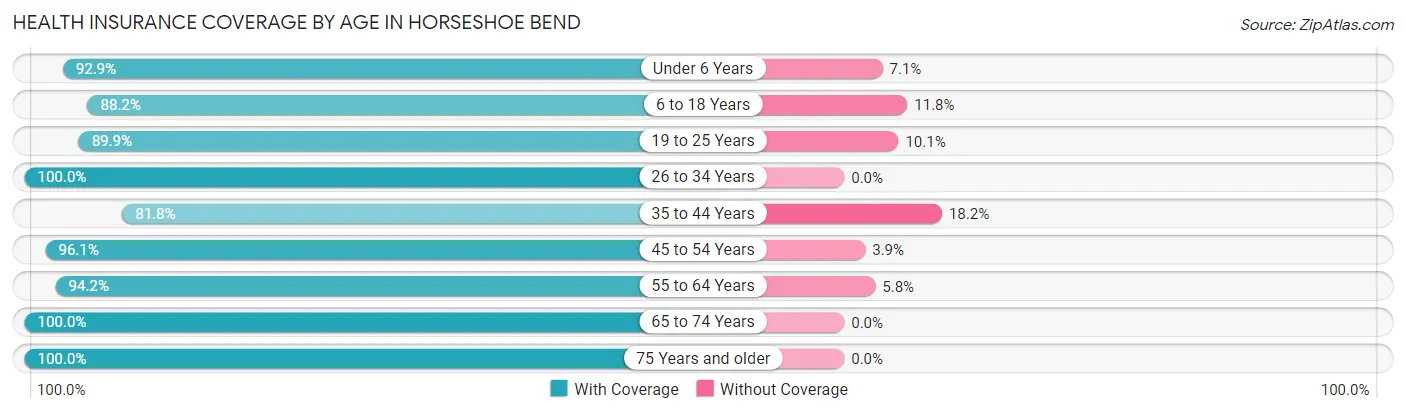
| Age Bracket | With Coverage | Without Coverage |
| Under 6 Years | 130 (92.9%) | 10 (7.1%) |
| 6 to 18 Years | 255 (88.2%) | 34 (11.8%) |
| 19 to 25 Years | 276 (89.9%) | 31 (10.1%) |
| 26 to 34 Years | 146 (100.0%) | 0 (0.0%) |
| 35 to 44 Years | 184 (81.8%) | 41 (18.2%) |
| 45 to 54 Years | 172 (96.1%) | 7 (3.9%) |
| 55 to 64 Years | 358 (94.2%) | 22 (5.8%) |
| 65 to 74 Years | 384 (100.0%) | 0 (0.0%) |
| 75 Years and older | 335 (100.0%) | 0 (0.0%) |
| Total | 2,240 (93.9%) | 145 (6.1%) |
Health Insurance Coverage by Citizenship Status in Horseshoe Bend
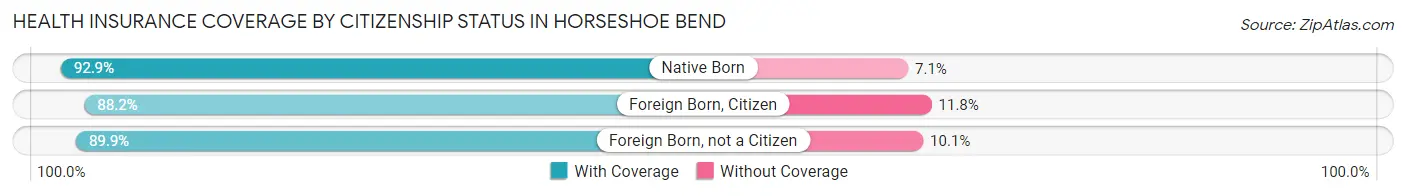
| Citizenship Status | With Coverage | Without Coverage |
| Native Born | 130 (92.9%) | 10 (7.1%) |
| Foreign Born, Citizen | 255 (88.2%) | 34 (11.8%) |
| Foreign Born, not a Citizen | 276 (89.9%) | 31 (10.1%) |
Health Insurance Coverage by Household Income in Horseshoe Bend
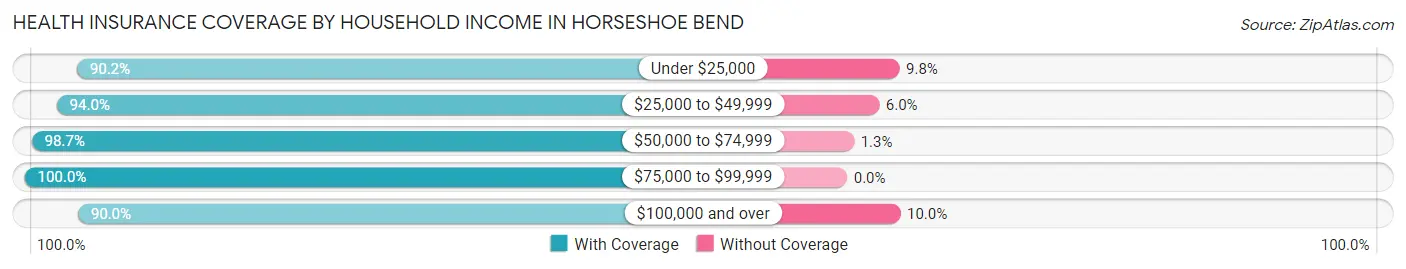
| Household Income | With Coverage | Without Coverage |
| Under $25,000 | 442 (90.2%) | 48 (9.8%) |
| $25,000 to $49,999 | 829 (94.0%) | 53 (6.0%) |
| $50,000 to $74,999 | 380 (98.7%) | 5 (1.3%) |
| $75,000 to $99,999 | 237 (100.0%) | 0 (0.0%) |
| $100,000 and over | 352 (90.0%) | 39 (10.0%) |
Public vs Private Health Insurance Coverage by Age in Horseshoe Bend
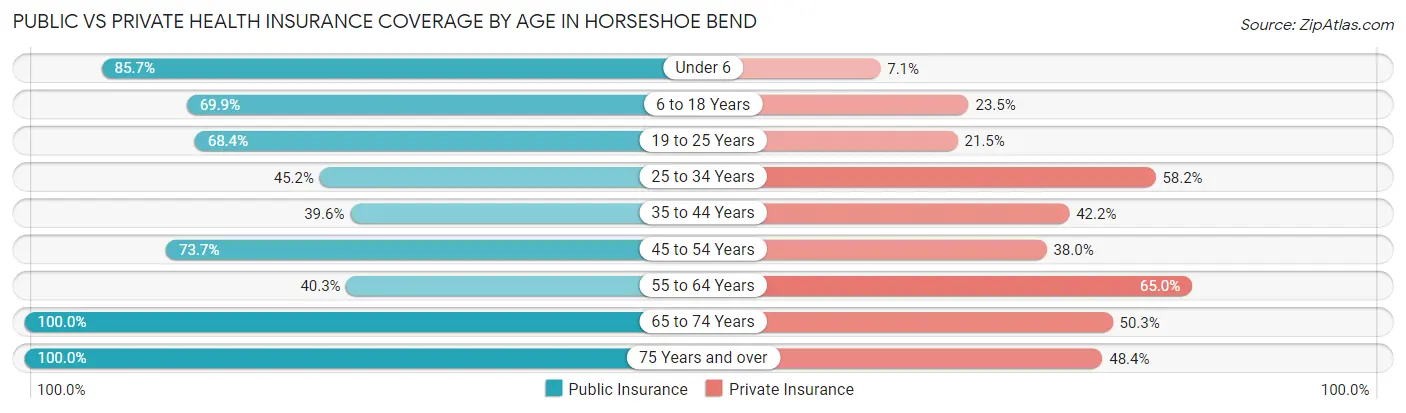
| Age Bracket | Public Insurance | Private Insurance |
| Under 6 | 120 (85.7%) | 10 (7.1%) |
| 6 to 18 Years | 202 (69.9%) | 68 (23.5%) |
| 19 to 25 Years | 210 (68.4%) | 66 (21.5%) |
| 25 to 34 Years | 66 (45.2%) | 85 (58.2%) |
| 35 to 44 Years | 89 (39.6%) | 95 (42.2%) |
| 45 to 54 Years | 132 (73.7%) | 68 (38.0%) |
| 55 to 64 Years | 153 (40.3%) | 247 (65.0%) |
| 65 to 74 Years | 384 (100.0%) | 193 (50.3%) |
| 75 Years and over | 335 (100.0%) | 162 (48.4%) |
| Total | 1,691 (70.9%) | 994 (41.7%) |
Disability Status by Sex by Age in Horseshoe Bend
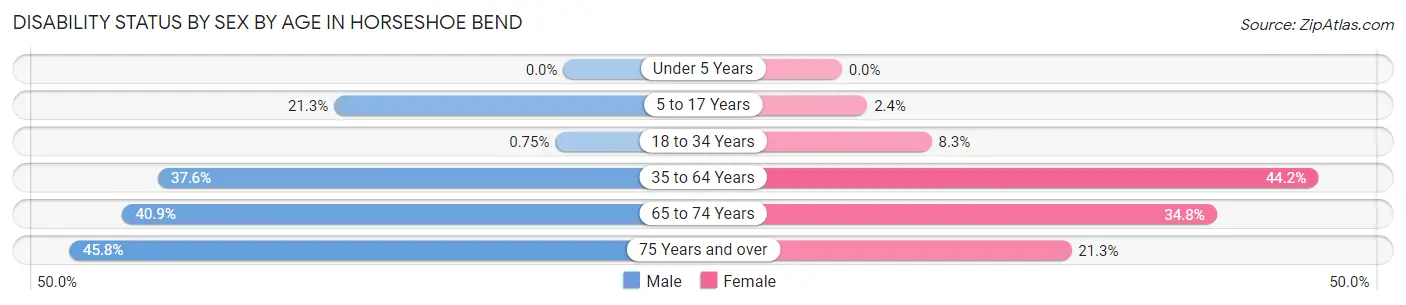
| Age Bracket | Male | Female |
| Under 5 Years | 0 (0.0%) | 0 (0.0%) |
| 5 to 17 Years | 30 (21.3%) | 3 (2.4%) |
| 18 to 34 Years | 2 (0.7%) | 18 (8.3%) |
| 35 to 64 Years | 146 (37.6%) | 175 (44.2%) |
| 65 to 74 Years | 63 (40.9%) | 80 (34.8%) |
| 75 Years and over | 76 (45.8%) | 36 (21.3%) |
Disability Class by Sex by Age in Horseshoe Bend
Disability Class: Hearing Difficulty
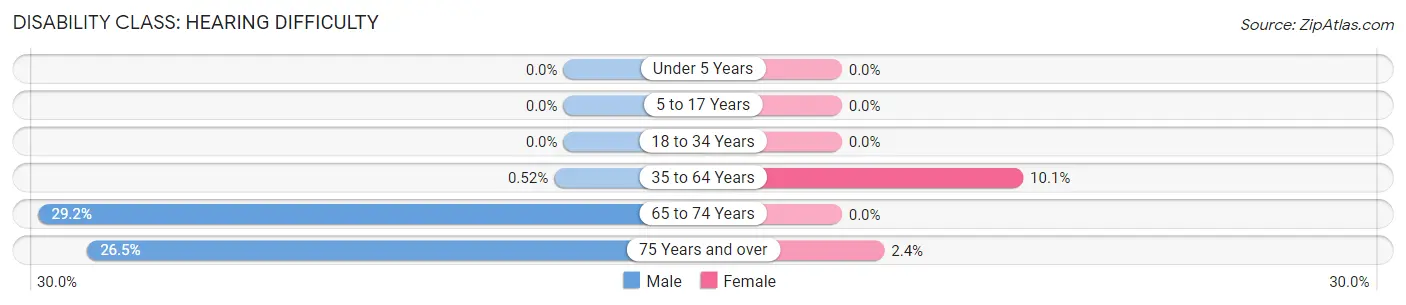
| Age Bracket | Male | Female |
| Under 5 Years | 0 (0.0%) | 0 (0.0%) |
| 5 to 17 Years | 0 (0.0%) | 0 (0.0%) |
| 18 to 34 Years | 0 (0.0%) | 0 (0.0%) |
| 35 to 64 Years | 2 (0.5%) | 40 (10.1%) |
| 65 to 74 Years | 45 (29.2%) | 0 (0.0%) |
| 75 Years and over | 44 (26.5%) | 4 (2.4%) |
Disability Class: Vision Difficulty
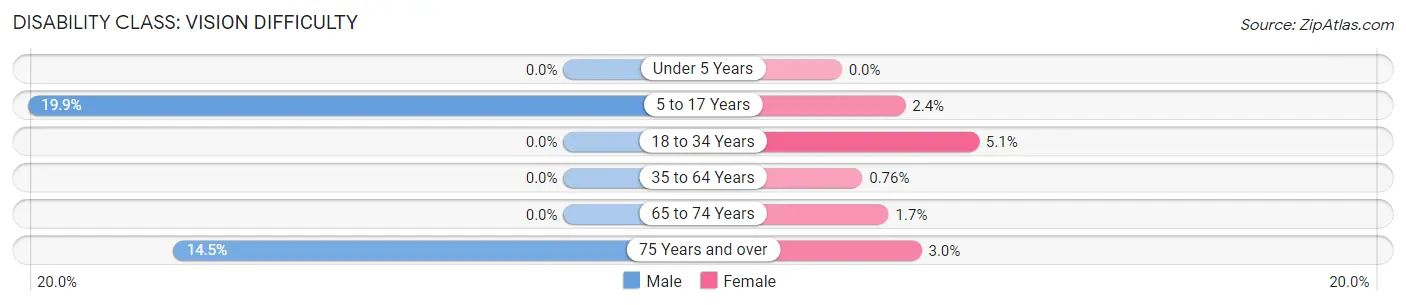
| Age Bracket | Male | Female |
| Under 5 Years | 0 (0.0%) | 0 (0.0%) |
| 5 to 17 Years | 28 (19.9%) | 3 (2.4%) |
| 18 to 34 Years | 0 (0.0%) | 11 (5.1%) |
| 35 to 64 Years | 0 (0.0%) | 3 (0.8%) |
| 65 to 74 Years | 0 (0.0%) | 4 (1.7%) |
| 75 Years and over | 24 (14.5%) | 5 (3.0%) |
Disability Class: Cognitive Difficulty
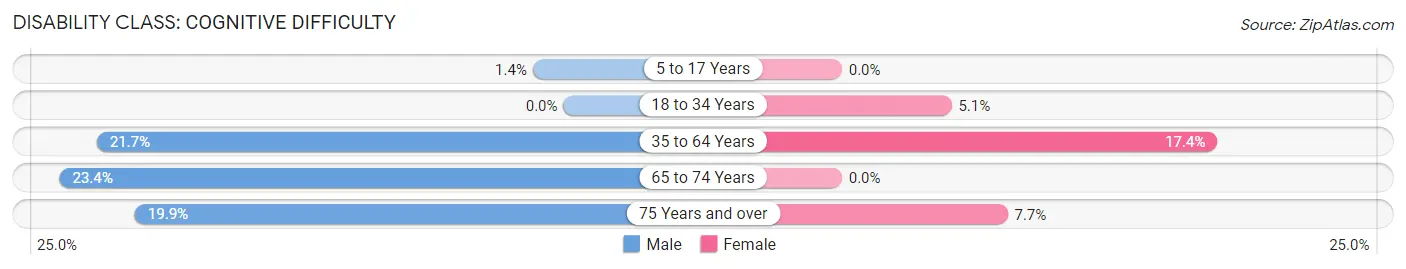
| Age Bracket | Male | Female |
| 5 to 17 Years | 2 (1.4%) | 0 (0.0%) |
| 18 to 34 Years | 0 (0.0%) | 11 (5.1%) |
| 35 to 64 Years | 84 (21.6%) | 69 (17.4%) |
| 65 to 74 Years | 36 (23.4%) | 0 (0.0%) |
| 75 Years and over | 33 (19.9%) | 13 (7.7%) |
Disability Class: Ambulatory Difficulty
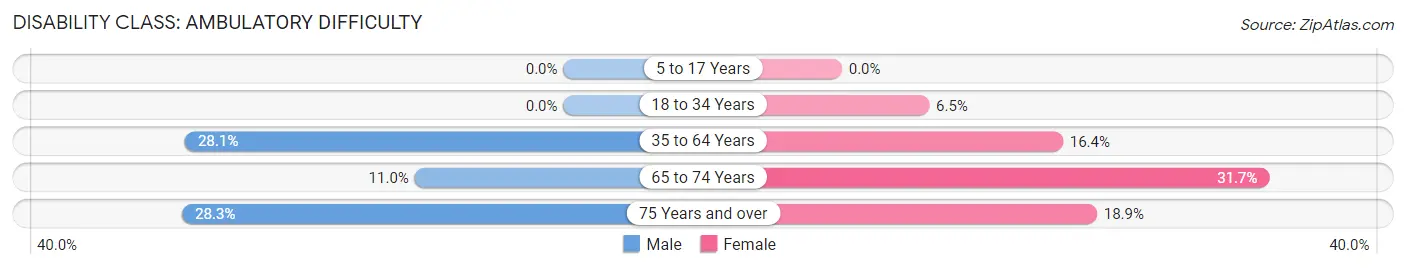
| Age Bracket | Male | Female |
| 5 to 17 Years | 0 (0.0%) | 0 (0.0%) |
| 18 to 34 Years | 0 (0.0%) | 14 (6.5%) |
| 35 to 64 Years | 109 (28.1%) | 65 (16.4%) |
| 65 to 74 Years | 17 (11.0%) | 73 (31.7%) |
| 75 Years and over | 47 (28.3%) | 32 (18.9%) |
Disability Class: Self-Care Difficulty
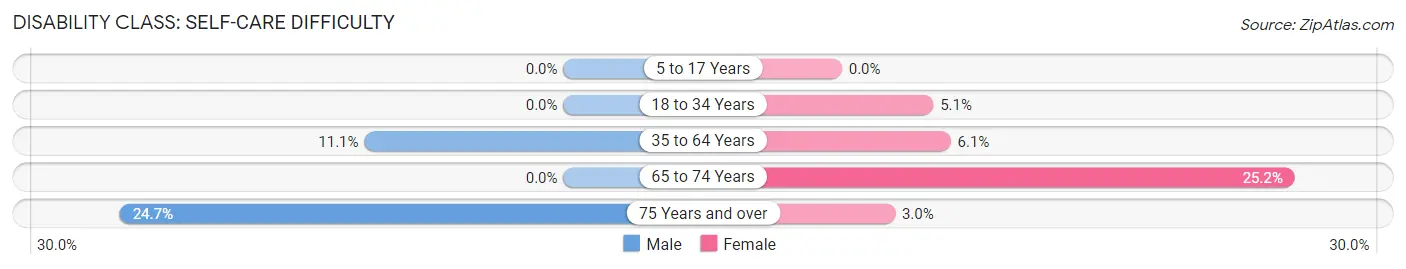
| Age Bracket | Male | Female |
| 5 to 17 Years | 0 (0.0%) | 0 (0.0%) |
| 18 to 34 Years | 0 (0.0%) | 11 (5.1%) |
| 35 to 64 Years | 43 (11.1%) | 24 (6.1%) |
| 65 to 74 Years | 0 (0.0%) | 58 (25.2%) |
| 75 Years and over | 41 (24.7%) | 5 (3.0%) |
Technology Access in Horseshoe Bend
Computing Device Access in Horseshoe Bend
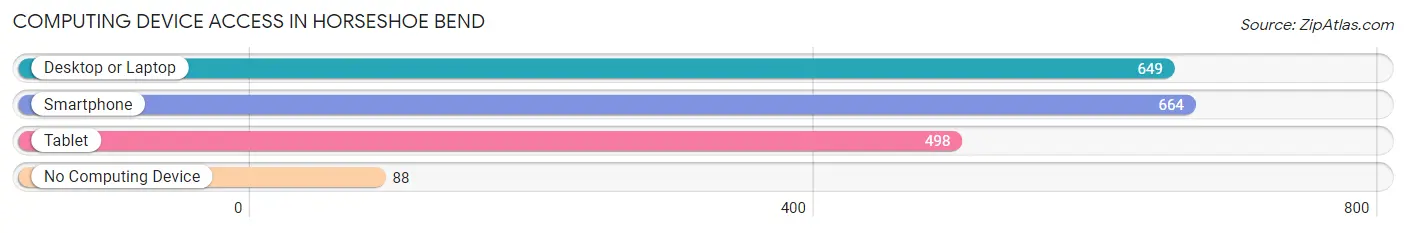
| Device Type | # Households | % Households |
| Desktop or Laptop | 649 | 71.7% |
| Smartphone | 664 | 73.4% |
| Tablet | 498 | 55.0% |
| No Computing Device | 88 | 9.7% |
| Total | 905 | 100.0% |
Internet Access in Horseshoe Bend
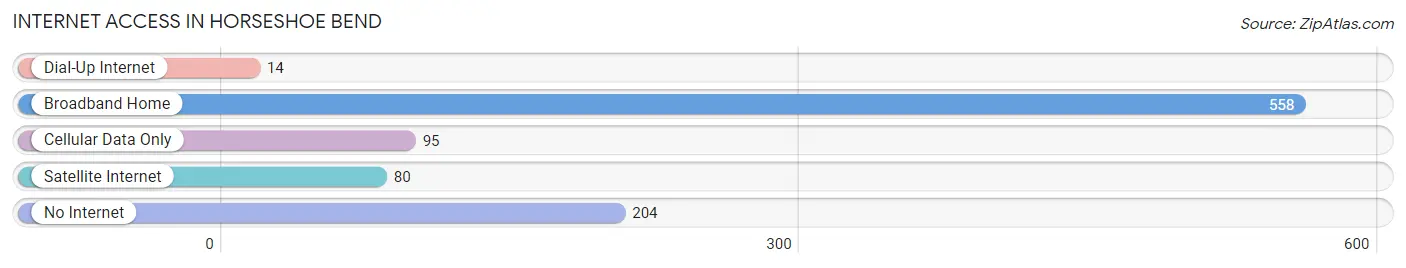
| Internet Type | # Households | % Households |
| Dial-Up Internet | 14 | 1.5% |
| Broadband Home | 558 | 61.7% |
| Cellular Data Only | 95 | 10.5% |
| Satellite Internet | 80 | 8.8% |
| No Internet | 204 | 22.5% |
| Total | 905 | 100.0% |
Horseshoe Bend Summary
Horseshoe Bend, Arkansas is a small town located in the Ozark Mountains of northern Arkansas. It is situated in the foothills of the Ozarks, approximately 30 miles south of the Arkansas-Missouri border. The town is named after a nearby horseshoe-shaped bend in the White River. The population of Horseshoe Bend was 1,717 at the 2010 census.
History
Horseshoe Bend was first settled in the early 1800s by settlers from the nearby town of Batesville. The town was originally known as “Horseshoe Bend Settlement” and was located on the banks of the White River. The town was officially incorporated in 1883 and was named after the nearby horseshoe-shaped bend in the river.
In the late 1800s, the town was a popular destination for tourists and fishermen. The town was also home to a number of businesses, including a hotel, a general store, a blacksmith shop, and a sawmill.
In the early 1900s, the town began to decline as the railroad bypassed it and the nearby town of Batesville grew in size and importance. The town was nearly abandoned by the mid-1900s, but was revitalized in the late 1970s when the White River was dammed to create Bull Shoals Lake. The lake brought new life to the town, as it became a popular destination for fishing, boating, and other recreational activities.
Geography
Horseshoe Bend is located in the Ozark Mountains of northern Arkansas. It is situated in the foothills of the Ozarks, approximately 30 miles south of the Arkansas-Missouri border. The town is named after a nearby horseshoe-shaped bend in the White River.
The town is located in the Ozark National Forest and is surrounded by the Ozark Mountains. The town is located at an elevation of 890 feet above sea level.
Economy
The economy of Horseshoe Bend is largely based on tourism and recreation. The town is a popular destination for fishing, boating, and other recreational activities. The town is also home to a number of businesses, including restaurants, hotels, and retail stores.
The town is also home to a number of manufacturing and industrial businesses, including a sawmill, a furniture factory, and a metal fabrication plant.
Demographics
The population of Horseshoe Bend was 1,717 at the 2010 census. The racial makeup of the town was 97.2% White, 0.7% African American, 0.3% Native American, 0.2% Asian, 0.1% Pacific Islander, 0.3% from other races, and 1.3% from two or more races. Hispanic or Latino of any race were 1.3% of the population.
The median income for a household in the town was $30,938, and the median income for a family was $37,500. The per capita income for the town was $17,845. About 15.2% of families and 18.2% of the population were below the poverty line, including 25.2% of those under age 18 and 11.3% of those age 65 or over.
Common Questions
What is Per Capita Income in Horseshoe Bend?
Per Capita income in Horseshoe Bend is $24,125.
What is the Median Family Income in Horseshoe Bend?
Median Family Income in Horseshoe Bend is $49,563.
What is the Median Household income in Horseshoe Bend?
Median Household Income in Horseshoe Bend is $38,750.
What is Income or Wage Gap in Horseshoe Bend?
Income or Wage Gap in Horseshoe Bend is 20.9%.
Women in Horseshoe Bend earn 79.1 cents for every dollar earned by a man.
What is Family Income Deficit in Horseshoe Bend?
Family Income Deficit in Horseshoe Bend is $7,378.
Families that are below poverty line in Horseshoe Bend earn $7,378 less on average than the poverty threshold level.
What is Inequality or Gini Index in Horseshoe Bend?
Inequality or Gini Index in Horseshoe Bend is 0.44.
What is the Total Population of Horseshoe Bend?
Total Population of Horseshoe Bend is 2,423.
What is the Total Male Population of Horseshoe Bend?
Total Male Population of Horseshoe Bend is 1,164.
What is the Total Female Population of Horseshoe Bend?
Total Female Population of Horseshoe Bend is 1,259.
What is the Ratio of Males per 100 Females in Horseshoe Bend?
There are 92.45 Males per 100 Females in Horseshoe Bend.
What is the Ratio of Females per 100 Males in Horseshoe Bend?
There are 108.16 Females per 100 Males in Horseshoe Bend.
What is the Median Population Age in Horseshoe Bend?
Median Population Age in Horseshoe Bend is 53.1 Years.
What is the Average Family Size in Horseshoe Bend
Average Family Size in Horseshoe Bend is 3.4 People.
What is the Average Household Size in Horseshoe Bend
Average Household Size in Horseshoe Bend is 2.6 People.
How Large is the Labor Force in Horseshoe Bend?
There are 719 People in the Labor Forcein in Horseshoe Bend.
What is the Percentage of People in the Labor Force in Horseshoe Bend?
34.7% of People are in the Labor Force in Horseshoe Bend.
What is the Unemployment Rate in Horseshoe Bend?
Unemployment Rate in Horseshoe Bend is 16.3%.