Hope, AR Map & Demographics
Hope Map
Hope Overview
$26,157
PER CAPITA INCOME
$56,506
AVG FAMILY INCOME
$43,018
AVG HOUSEHOLD INCOME
19.9%
WAGE / INCOME GAP [ % ]
80.1¢/ $1
WAGE / INCOME GAP [ $ ]
0.52
INEQUALITY / GINI INDEX
8,921
TOTAL POPULATION
4,484
MALE POPULATION
4,437
FEMALE POPULATION
101.06
MALES / 100 FEMALES
98.95
FEMALES / 100 MALES
36.2
MEDIAN AGE
3.6
AVG FAMILY SIZE
2.7
AVG HOUSEHOLD SIZE
3,710
LABOR FORCE [ PEOPLE ]
56.2%
PERCENT IN LABOR FORCE
3.9%
UNEMPLOYMENT RATE
Hope Zip Codes
Hope Area Codes
Income in Hope
Income Overview in Hope
Per Capita Income in Hope is $26,157, while median incomes of families and households are $56,506 and $43,018 respectively.
| Characteristic | Number | Measure |
| Per Capita Income | 8,921 | $26,157 |
| Median Family Income | 1,941 | $56,506 |
| Mean Family Income | 1,941 | $83,167 |
| Median Household Income | 3,171 | $43,018 |
| Mean Household Income | 3,171 | $64,036 |
| Income Deficit | 1,941 | $0 |
| Wage / Income Gap (%) | 8,921 | 19.91% |
| Wage / Income Gap ($) | 8,921 | 80.09¢ per $1 |
| Gini / Inequality Index | 8,921 | 0.52 |
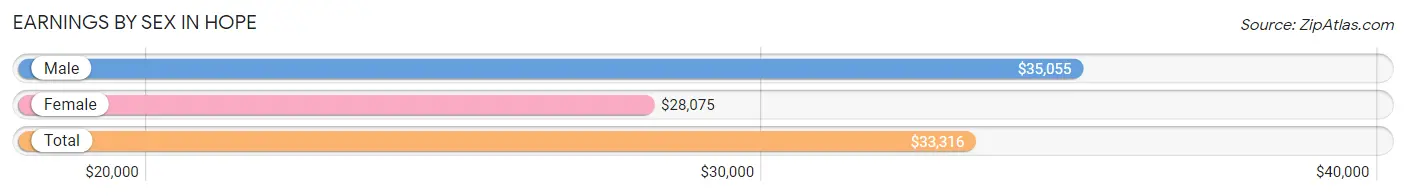
Earnings by Sex in Hope
Average Earnings in Hope are $33,316, $35,055 for men and $28,075 for women, a difference of 19.9%.
| Sex | Number | Average Earnings |
| Male | 2,041 (54.1%) | $35,055 |
| Female | 1,734 (45.9%) | $28,075 |
| Total | 3,775 (100.0%) | $33,316 |
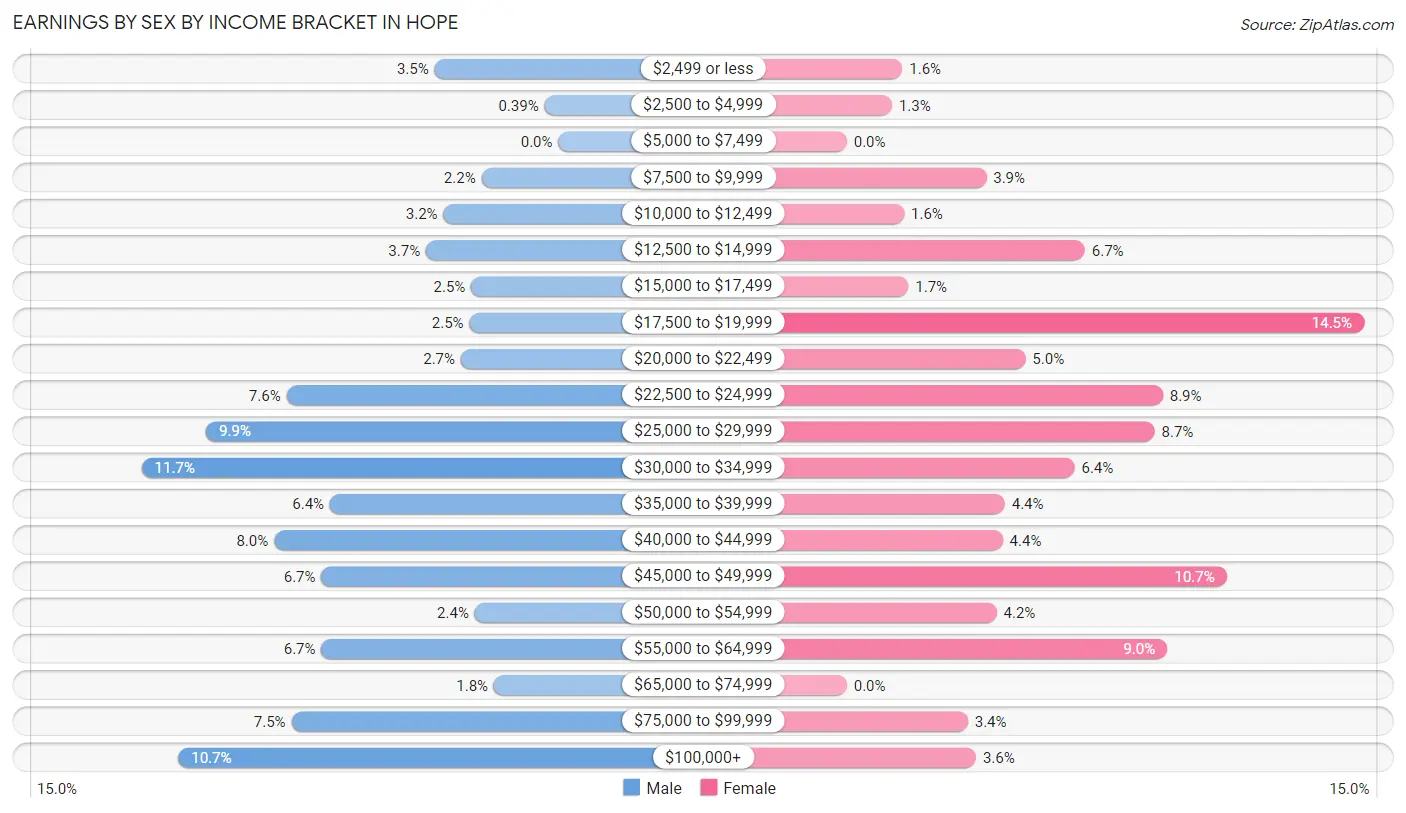
Earnings by Sex by Income Bracket in Hope
The most common earnings brackets in Hope are $30,000 to $34,999 for men (239 | 11.7%) and $17,500 to $19,999 for women (252 | 14.5%).
| Income | Male | Female |
| $2,499 or less | 71 (3.5%) | 27 (1.6%) |
| $2,500 to $4,999 | 8 (0.4%) | 22 (1.3%) |
| $5,000 to $7,499 | 0 (0.0%) | 0 (0.0%) |
| $7,500 to $9,999 | 44 (2.2%) | 68 (3.9%) |
| $10,000 to $12,499 | 66 (3.2%) | 28 (1.6%) |
| $12,500 to $14,999 | 76 (3.7%) | 116 (6.7%) |
| $15,000 to $17,499 | 50 (2.5%) | 30 (1.7%) |
| $17,500 to $19,999 | 51 (2.5%) | 252 (14.5%) |
| $20,000 to $22,499 | 56 (2.7%) | 87 (5.0%) |
| $22,500 to $24,999 | 156 (7.6%) | 154 (8.9%) |
| $25,000 to $29,999 | 202 (9.9%) | 150 (8.6%) |
| $30,000 to $34,999 | 239 (11.7%) | 111 (6.4%) |
| $35,000 to $39,999 | 131 (6.4%) | 77 (4.4%) |
| $40,000 to $44,999 | 163 (8.0%) | 76 (4.4%) |
| $45,000 to $49,999 | 136 (6.7%) | 185 (10.7%) |
| $50,000 to $54,999 | 48 (2.4%) | 73 (4.2%) |
| $55,000 to $64,999 | 136 (6.7%) | 156 (9.0%) |
| $65,000 to $74,999 | 37 (1.8%) | 0 (0.0%) |
| $75,000 to $99,999 | 153 (7.5%) | 59 (3.4%) |
| $100,000+ | 218 (10.7%) | 63 (3.6%) |
| Total | 2,041 (100.0%) | 1,734 (100.0%) |
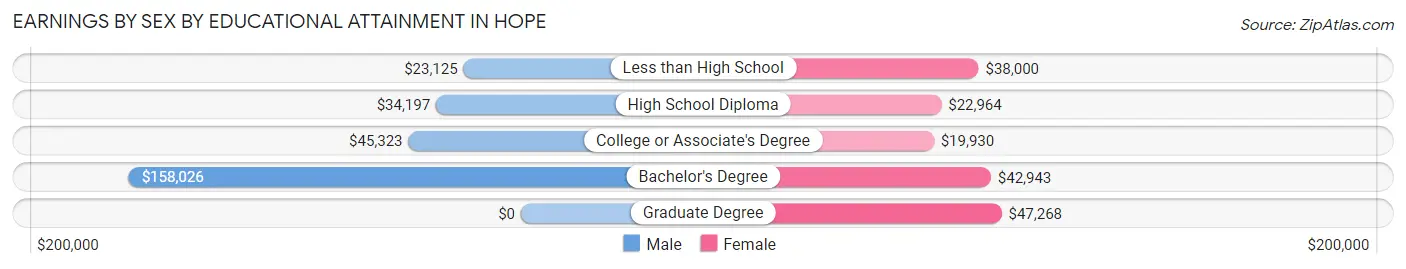
Earnings by Sex by Educational Attainment in Hope
Average earnings in Hope are $39,663 for men and $32,841 for women, a difference of 17.2%. Men with an educational attainment of bachelor's degree enjoy the highest average annual earnings of $158,026, while those with less than high school education earn the least with $23,125. Women with an educational attainment of graduate degree earn the most with the average annual earnings of $47,268, while those with college or associate's degree education have the smallest earnings of $19,930.
| Educational Attainment | Male Income | Female Income |
| Less than High School | $23,125 | $38,000 |
| High School Diploma | $34,197 | $22,964 |
| College or Associate's Degree | $45,323 | $19,930 |
| Bachelor's Degree | $158,026 | $42,943 |
| Graduate Degree | - | - |
| Total | $39,663 | $32,841 |
Family Income in Hope
Family Income Brackets in Hope
According to the Hope family income data, there are 388 families falling into the $50,000 to $74,999 income range, which is the most common income bracket and makes up 20.0% of all families. Conversely, the less than $10,000 income bracket is the least frequent group with only 103 families (5.3%) belonging to this category.
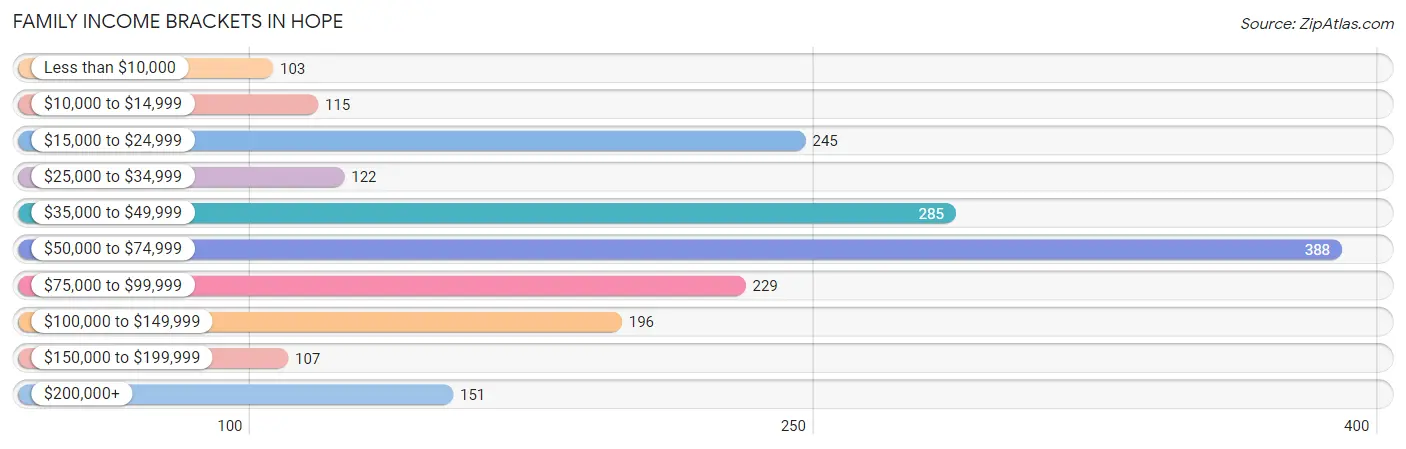
| Income Bracket | # Families | % Families |
| Less than $10,000 | 103 | 5.3% |
| $10,000 to $14,999 | 115 | 5.9% |
| $15,000 to $24,999 | 245 | 12.6% |
| $25,000 to $34,999 | 122 | 6.3% |
| $35,000 to $49,999 | 285 | 14.7% |
| $50,000 to $74,999 | 388 | 20.0% |
| $75,000 to $99,999 | 229 | 11.8% |
| $100,000 to $149,999 | 196 | 10.1% |
| $150,000 to $199,999 | 107 | 5.5% |
| $200,000+ | 151 | 7.8% |
Family Income by Famaliy Size in Hope
5-person families (136 | 7.0%) account for the highest median family income in Hope with $96,579 per family, while 3-person families (418 | 21.5%) have the highest median income of $28,618 per family member.
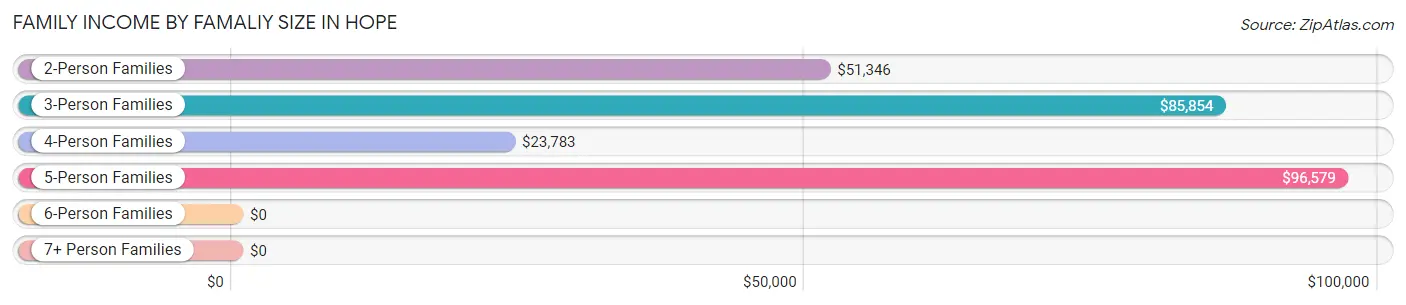
| Income Bracket | # Families | Median Income |
| 2-Person Families | 1,012 (52.1%) | $51,346 |
| 3-Person Families | 418 (21.5%) | $85,854 |
| 4-Person Families | 317 (16.3%) | $23,783 |
| 5-Person Families | 136 (7.0%) | $96,579 |
| 6-Person Families | 44 (2.3%) | $0 |
| 7+ Person Families | 14 (0.7%) | $0 |
| Total | 1,941 (100.0%) | $56,506 |
Family Income by Number of Earners in Hope
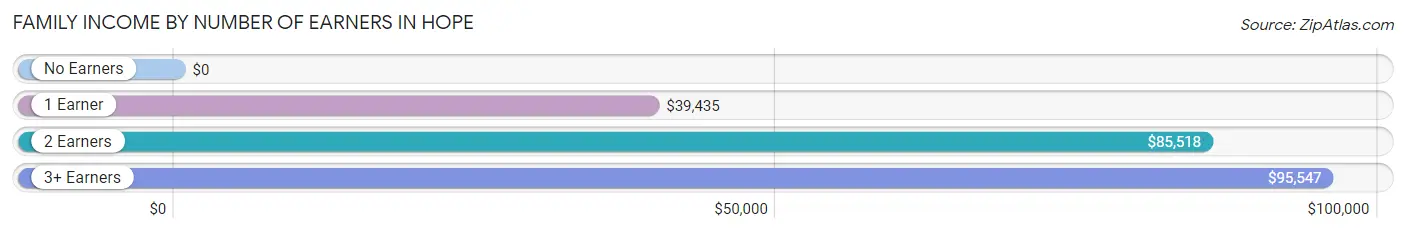
| Number of Earners | # Families | Median Income |
| No Earners | 270 (13.9%) | $0 |
| 1 Earner | 917 (47.2%) | $39,435 |
| 2 Earners | 661 (34.1%) | $85,518 |
| 3+ Earners | 93 (4.8%) | $95,547 |
| Total | 1,941 (100.0%) | $56,506 |
Household Income in Hope
Household Income Brackets in Hope
With 564 households falling in the category, the $50,000 to $74,999 income range is the most frequent in Hope, accounting for 17.8% of all households. In contrast, only 105 households (3.3%) fall into the $150,000 to $199,999 income bracket, making it the least populous group.
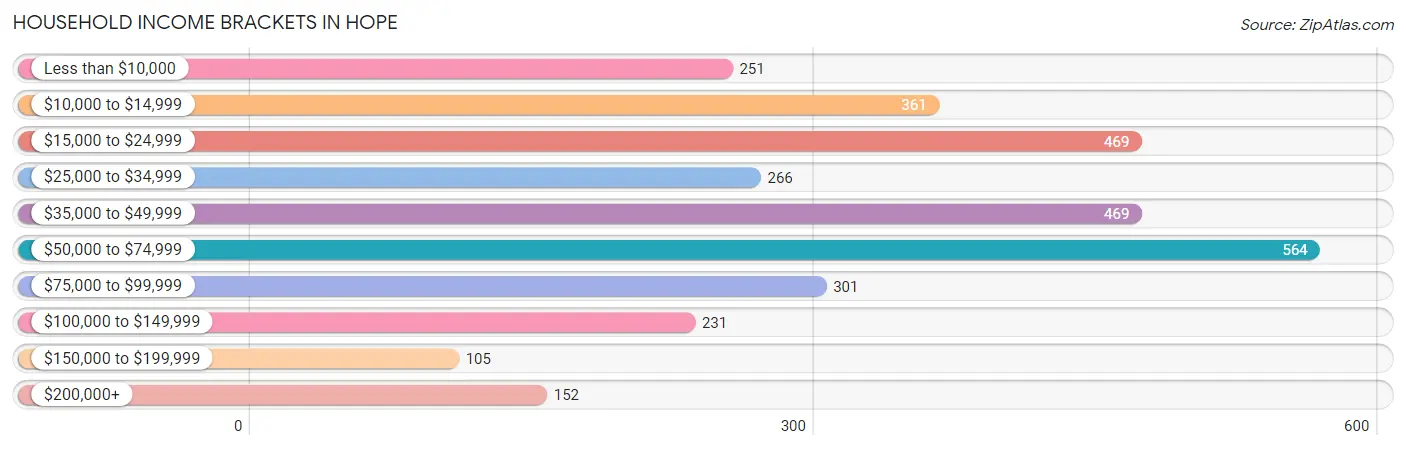
| Income Bracket | # Households | % Households |
| Less than $10,000 | 251 | 7.9% |
| $10,000 to $14,999 | 361 | 11.4% |
| $15,000 to $24,999 | 469 | 14.8% |
| $25,000 to $34,999 | 266 | 8.4% |
| $35,000 to $49,999 | 469 | 14.8% |
| $50,000 to $74,999 | 564 | 17.8% |
| $75,000 to $99,999 | 301 | 9.5% |
| $100,000 to $149,999 | 231 | 7.3% |
| $150,000 to $199,999 | 105 | 3.3% |
| $200,000+ | 152 | 4.8% |
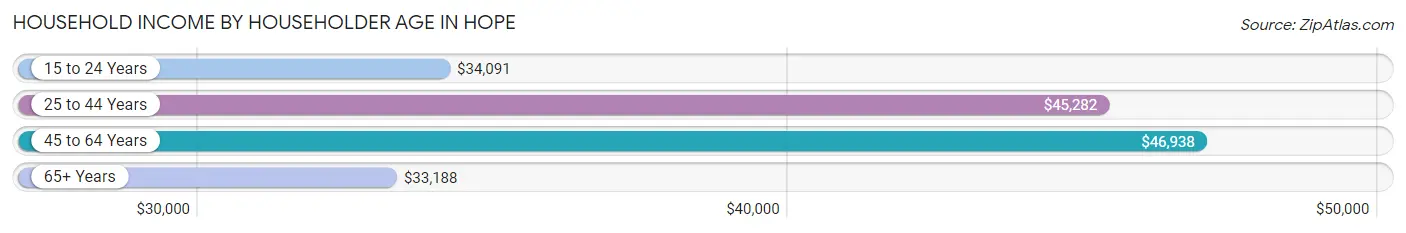
Household Income by Householder Age in Hope
The median household income in Hope is $43,018, with the highest median household income of $46,938 found in the 45 to 64 years age bracket for the primary householder. A total of 1,073 households (33.8%) fall into this category. Meanwhile, the 65+ years age bracket for the primary householder has the lowest median household income of $33,188, with 876 households (27.6%) in this group.
| Income Bracket | # Households | Median Income |
| 15 to 24 Years | 182 (5.7%) | $34,091 |
| 25 to 44 Years | 1,040 (32.8%) | $45,282 |
| 45 to 64 Years | 1,073 (33.8%) | $46,938 |
| 65+ Years | 876 (27.6%) | $33,188 |
| Total | 3,171 (100.0%) | $43,018 |
Poverty in Hope
Income Below Poverty by Sex and Age in Hope
With 24.4% poverty level for males and 32.8% for females among the residents of Hope, under 5 year old males and 5 year old females are the most vulnerable to poverty, with 257 males (69.3%) and 18 females (100.0%) in their respective age groups living below the poverty level.
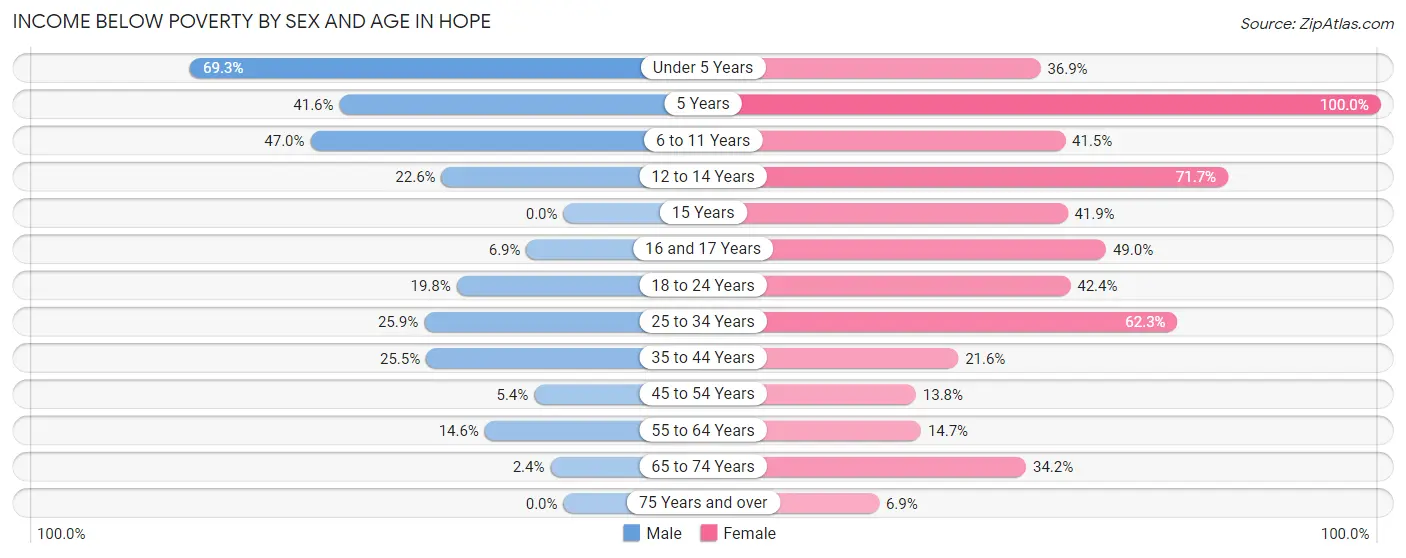
| Age Bracket | Male | Female |
| Under 5 Years | 257 (69.3%) | 73 (36.9%) |
| 5 Years | 42 (41.6%) | 18 (100.0%) |
| 6 to 11 Years | 216 (47.0%) | 172 (41.4%) |
| 12 to 14 Years | 86 (22.6%) | 167 (71.7%) |
| 15 Years | 0 (0.0%) | 49 (41.9%) |
| 16 and 17 Years | 7 (6.9%) | 77 (49.0%) |
| 18 to 24 Years | 117 (19.8%) | 162 (42.4%) |
| 25 to 34 Years | 127 (25.9%) | 223 (62.3%) |
| 35 to 44 Years | 106 (25.5%) | 126 (21.6%) |
| 45 to 54 Years | 23 (5.4%) | 70 (13.8%) |
| 55 to 64 Years | 67 (14.6%) | 84 (14.7%) |
| 65 to 74 Years | 5 (2.4%) | 185 (34.2%) |
| 75 Years and over | 0 (0.0%) | 18 (6.9%) |
| Total | 1,053 (24.4%) | 1,424 (32.8%) |
Income Above Poverty by Sex and Age in Hope
According to the poverty statistics in Hope, males aged 15 years and females aged 75 years and over are the age groups that are most secure financially, with 100.0% of males and 93.1% of females in these age groups living above the poverty line.
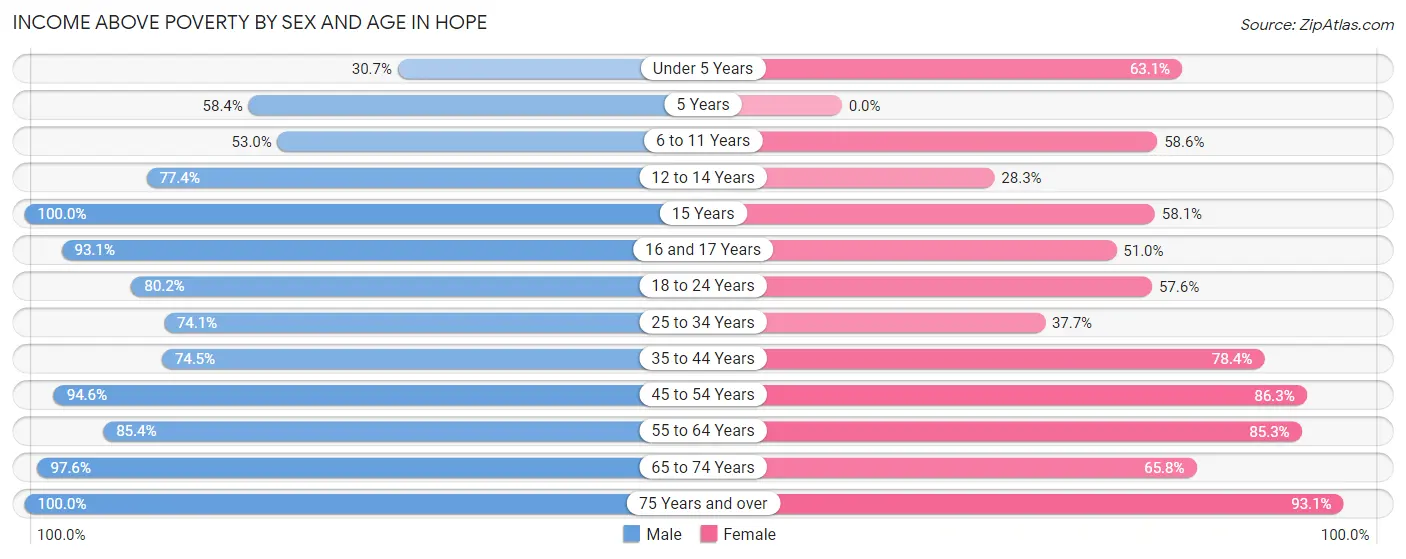
| Age Bracket | Male | Female |
| Under 5 Years | 114 (30.7%) | 125 (63.1%) |
| 5 Years | 59 (58.4%) | 0 (0.0%) |
| 6 to 11 Years | 244 (53.0%) | 243 (58.6%) |
| 12 to 14 Years | 294 (77.4%) | 66 (28.3%) |
| 15 Years | 14 (100.0%) | 68 (58.1%) |
| 16 and 17 Years | 95 (93.1%) | 80 (51.0%) |
| 18 to 24 Years | 473 (80.2%) | 220 (57.6%) |
| 25 to 34 Years | 364 (74.1%) | 135 (37.7%) |
| 35 to 44 Years | 310 (74.5%) | 457 (78.4%) |
| 45 to 54 Years | 401 (94.6%) | 439 (86.3%) |
| 55 to 64 Years | 392 (85.4%) | 488 (85.3%) |
| 65 to 74 Years | 202 (97.6%) | 356 (65.8%) |
| 75 Years and over | 298 (100.0%) | 243 (93.1%) |
| Total | 3,260 (75.6%) | 2,920 (67.2%) |
Income Below Poverty Among Married-Couple Families in Hope
The poverty statistics for married-couple families in Hope show that 5.1% or 54 of the total 1,048 families live below the poverty line. Families with 3 or 4 children have the highest poverty rate of 42.6%, comprising of 29 families. On the other hand, families with no children have the lowest poverty rate of 0.0%, which includes 0 families.
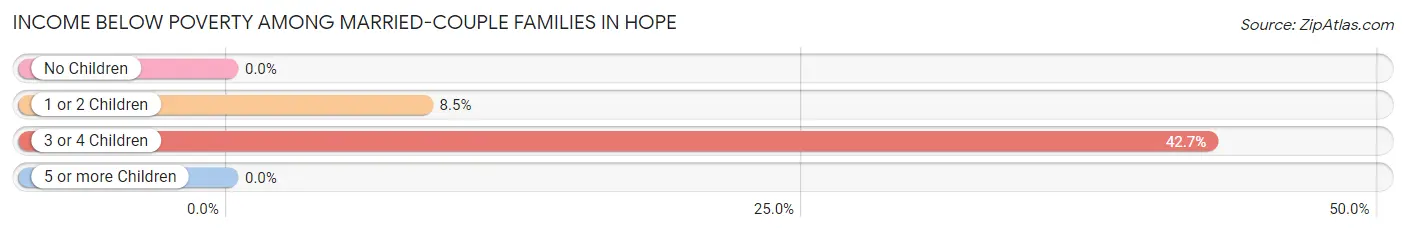
| Children | Above Poverty | Below Poverty |
| No Children | 685 (100.0%) | 0 (0.0%) |
| 1 or 2 Children | 270 (91.5%) | 25 (8.5%) |
| 3 or 4 Children | 39 (57.4%) | 29 (42.6%) |
| 5 or more Children | 0 (0.0%) | 0 (0.0%) |
| Total | 994 (94.9%) | 54 (5.1%) |
Income Below Poverty Among Single-Parent Households in Hope
According to the poverty data in Hope, 7.7% or 16 single-father households and 49.2% or 337 single-mother households are living below the poverty line. Among single-father households, those with 1 or 2 children have the highest poverty rate, with 16 households (13.0%) experiencing poverty. Likewise, among single-mother households, those with 3 or 4 children have the highest poverty rate, with 127 households (90.1%) falling below the poverty line.
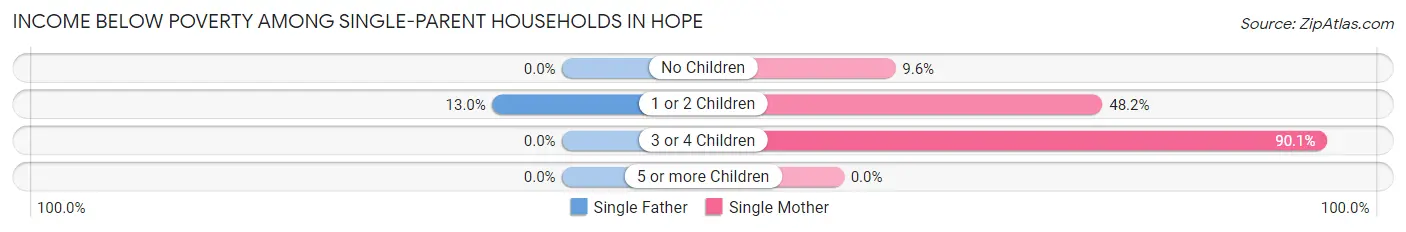
| Children | Single Father | Single Mother |
| No Children | 0 (0.0%) | 13 (9.6%) |
| 1 or 2 Children | 16 (13.0%) | 197 (48.2%) |
| 3 or 4 Children | 0 (0.0%) | 127 (90.1%) |
| 5 or more Children | 0 (0.0%) | 0 (0.0%) |
| Total | 16 (7.7%) | 337 (49.2%) |
Income Below Poverty Among Married-Couple vs Single-Parent Households in Hope
The poverty data for Hope shows that 54 of the married-couple family households (5.1%) and 353 of the single-parent households (39.5%) are living below the poverty level. Within the married-couple family households, those with 3 or 4 children have the highest poverty rate, with 29 households (42.6%) falling below the poverty line. Among the single-parent households, those with 3 or 4 children have the highest poverty rate, with 127 household (84.7%) living below poverty.
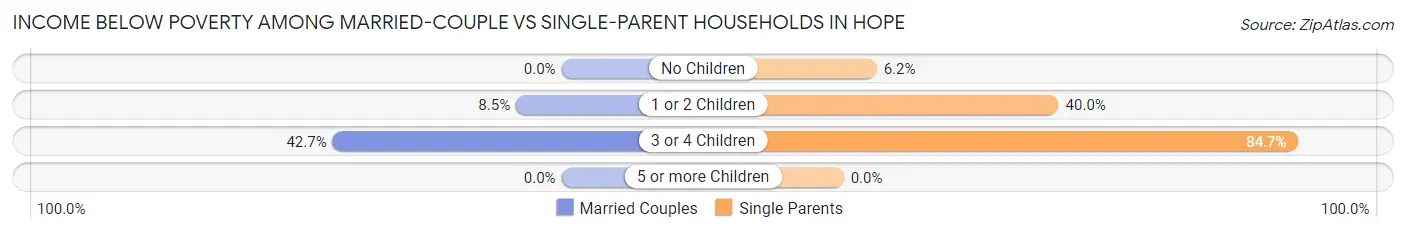
| Children | Married-Couple Families | Single-Parent Households |
| No Children | 0 (0.0%) | 13 (6.2%) |
| 1 or 2 Children | 25 (8.5%) | 213 (40.0%) |
| 3 or 4 Children | 29 (42.6%) | 127 (84.7%) |
| 5 or more Children | 0 (0.0%) | 0 (0.0%) |
| Total | 54 (5.1%) | 353 (39.5%) |
Race in Hope
The most populous races in Hope are Black / African American (4,169 | 46.7%), White / Caucasian (3,384 | 37.9%), and Hispanic or Latino (1,640 | 18.4%).
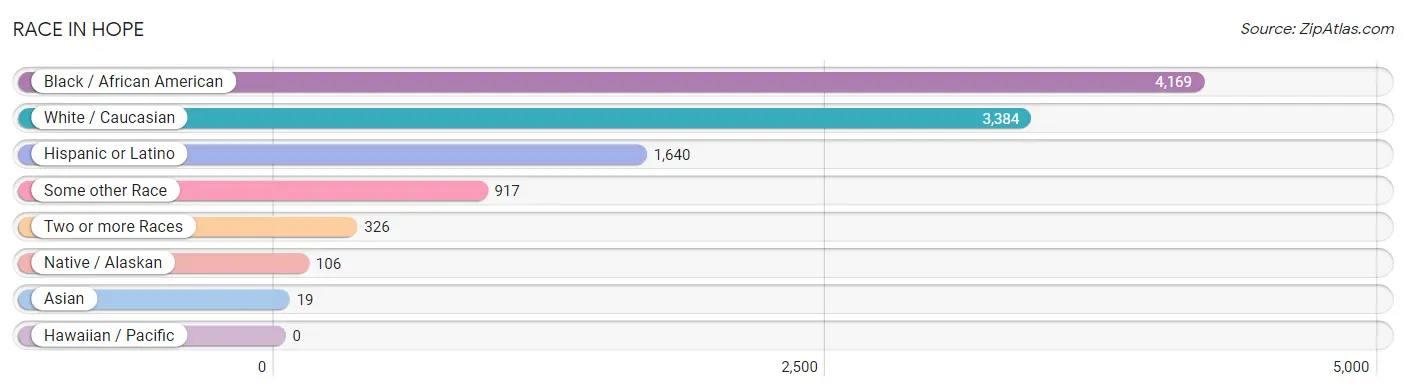
| Race | # Population | % Population |
| Asian | 19 | 0.2% |
| Black / African American | 4,169 | 46.7% |
| Hawaiian / Pacific | 0 | 0.0% |
| Hispanic or Latino | 1,640 | 18.4% |
| Native / Alaskan | 106 | 1.2% |
| White / Caucasian | 3,384 | 37.9% |
| Two or more Races | 326 | 3.6% |
| Some other Race | 917 | 10.3% |
| Total | 8,921 | 100.0% |
Ancestry in Hope
The most populous ancestries reported in Hope are Mexican (1,530 | 17.2%), Irish (622 | 7.0%), English (571 | 6.4%), American (333 | 3.7%), and German (317 | 3.5%), together accounting for 37.8% of all Hope residents.
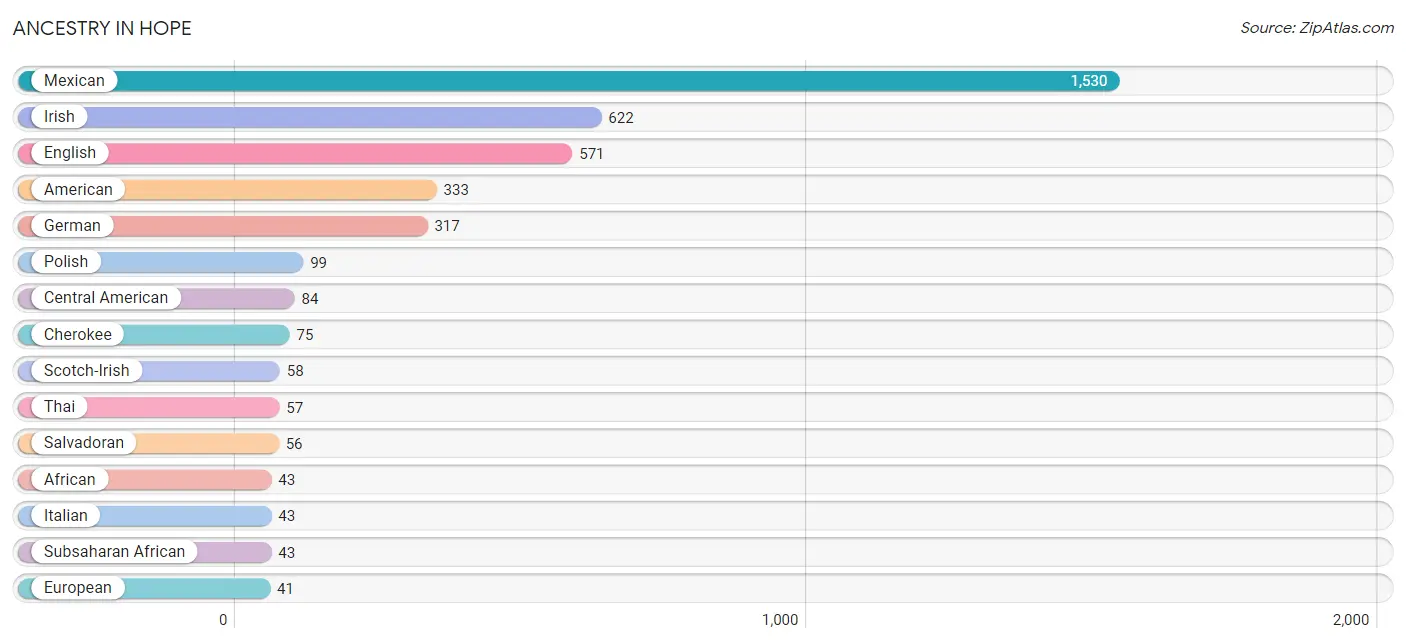
| Ancestry | # Population | % Population |
| African | 43 | 0.5% |
| American | 333 | 3.7% |
| Argentinean | 10 | 0.1% |
| Central American | 84 | 0.9% |
| Cherokee | 75 | 0.8% |
| Cuban | 16 | 0.2% |
| Dutch | 10 | 0.1% |
| English | 571 | 6.4% |
| European | 41 | 0.5% |
| French | 18 | 0.2% |
| German | 317 | 3.5% |
| Honduran | 28 | 0.3% |
| Irish | 622 | 7.0% |
| Italian | 43 | 0.5% |
| Mexican | 1,530 | 17.2% |
| Polish | 99 | 1.1% |
| Portuguese | 20 | 0.2% |
| Salvadoran | 56 | 0.6% |
| Scotch-Irish | 58 | 0.6% |
| Scottish | 37 | 0.4% |
| South American | 10 | 0.1% |
| Spanish American Indian | 13 | 0.2% |
| Subsaharan African | 43 | 0.5% |
| Swedish | 24 | 0.3% |
| Thai | 57 | 0.6% | View All 25 Rows |
Immigrants in Hope
The most numerous immigrant groups reported in Hope came from Central America (657 | 7.4%), Latin America (657 | 7.4%), Mexico (616 | 6.9%), Canada (68 | 0.8%), and Honduras (28 | 0.3%), together accounting for 22.7% of all Hope residents.
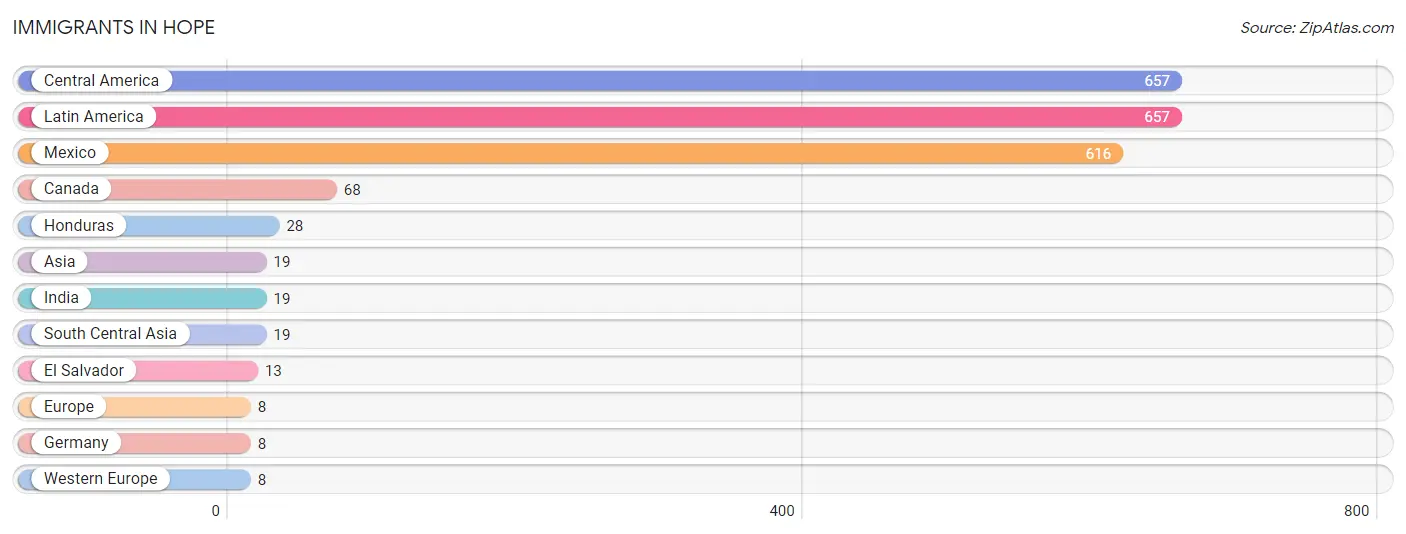
| Immigration Origin | # Population | % Population |
| Asia | 19 | 0.2% |
| Canada | 68 | 0.8% |
| Central America | 657 | 7.4% |
| El Salvador | 13 | 0.2% |
| Europe | 8 | 0.1% |
| Germany | 8 | 0.1% |
| Honduras | 28 | 0.3% |
| India | 19 | 0.2% |
| Latin America | 657 | 7.4% |
| Mexico | 616 | 6.9% |
| South Central Asia | 19 | 0.2% |
| Western Europe | 8 | 0.1% | View All 12 Rows |
Sex and Age in Hope
Sex and Age in Hope
The most populous age groups in Hope are 20 to 24 Years (531 | 11.8%) for men and 40 to 44 Years (388 | 8.7%) for women.
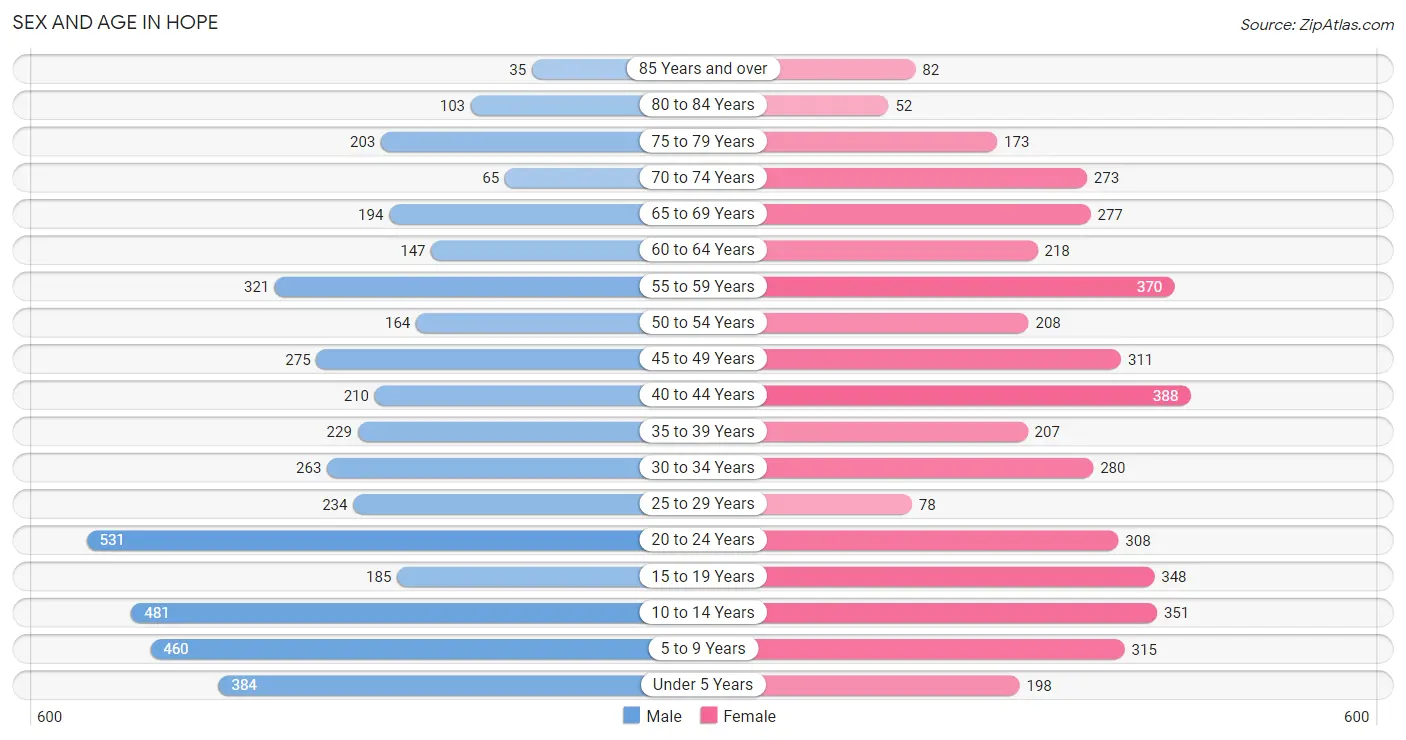
| Age Bracket | Male | Female |
| Under 5 Years | 384 (8.6%) | 198 (4.5%) |
| 5 to 9 Years | 460 (10.3%) | 315 (7.1%) |
| 10 to 14 Years | 481 (10.7%) | 351 (7.9%) |
| 15 to 19 Years | 185 (4.1%) | 348 (7.8%) |
| 20 to 24 Years | 531 (11.8%) | 308 (6.9%) |
| 25 to 29 Years | 234 (5.2%) | 78 (1.8%) |
| 30 to 34 Years | 263 (5.9%) | 280 (6.3%) |
| 35 to 39 Years | 229 (5.1%) | 207 (4.7%) |
| 40 to 44 Years | 210 (4.7%) | 388 (8.7%) |
| 45 to 49 Years | 275 (6.1%) | 311 (7.0%) |
| 50 to 54 Years | 164 (3.7%) | 208 (4.7%) |
| 55 to 59 Years | 321 (7.2%) | 370 (8.3%) |
| 60 to 64 Years | 147 (3.3%) | 218 (4.9%) |
| 65 to 69 Years | 194 (4.3%) | 277 (6.2%) |
| 70 to 74 Years | 65 (1.5%) | 273 (6.1%) |
| 75 to 79 Years | 203 (4.5%) | 173 (3.9%) |
| 80 to 84 Years | 103 (2.3%) | 52 (1.2%) |
| 85 Years and over | 35 (0.8%) | 82 (1.8%) |
| Total | 4,484 (100.0%) | 4,437 (100.0%) |
Families and Households in Hope
Median Family Size in Hope
The median family size in Hope is 3.63 persons per family, with single female/mother families (685 | 35.3%) accounting for the largest median family size of 4.14 persons per family. On the other hand, married-couple families (1,048 | 54.0%) represent the smallest median family size with 3.34 persons per family.
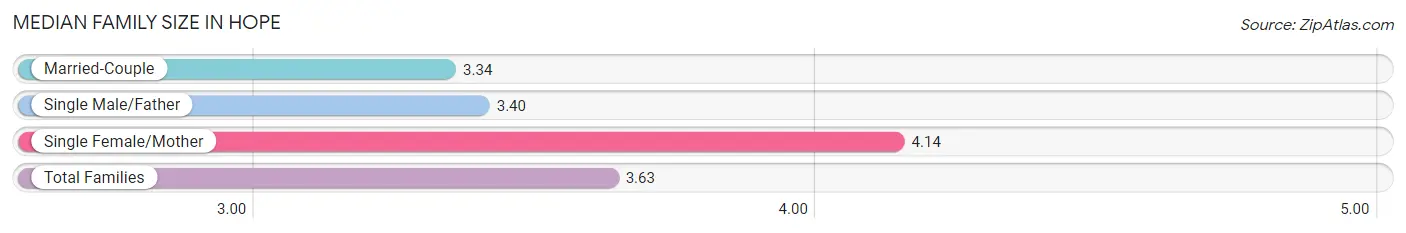
| Family Type | # Families | Family Size |
| Married-Couple | 1,048 (54.0%) | 3.34 |
| Single Male/Father | 208 (10.7%) | 3.40 |
| Single Female/Mother | 685 (35.3%) | 4.14 |
| Total Families | 1,941 (100.0%) | 3.63 |
Median Household Size in Hope
The median household size in Hope is 2.71 persons per household, with single female/mother households (685 | 21.6%) accounting for the largest median household size of 4.3 persons per household. non-family households (1,230 | 38.8%) represent the smallest median household size with 1.08 persons per household.
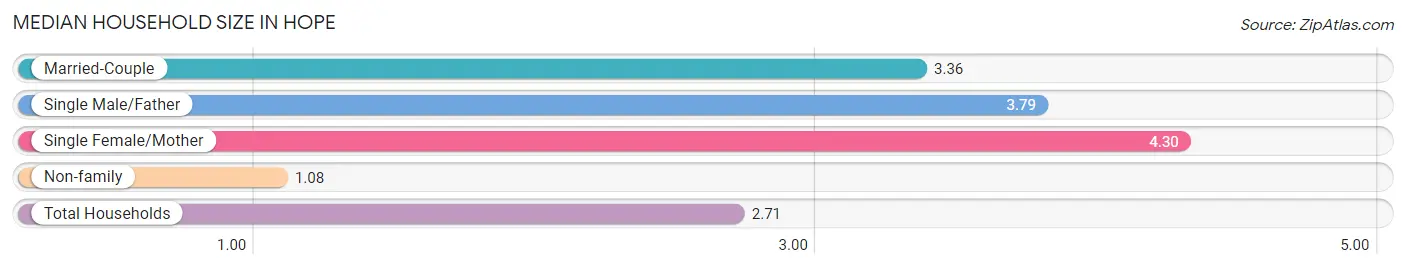
| Household Type | # Households | Household Size |
| Married-Couple | 1,048 (33.1%) | 3.36 |
| Single Male/Father | 208 (6.6%) | 3.79 |
| Single Female/Mother | 685 (21.6%) | 4.30 |
| Non-family | 1,230 (38.8%) | 1.08 |
| Total Households | 3,171 (100.0%) | 2.71 |
Household Size by Marriage Status in Hope
Out of a total of 3,171 households in Hope, 1,941 (61.2%) are family households, while 1,230 (38.8%) are nonfamily households. The most numerous type of family households are 2-person households, comprising 920, and the most common type of nonfamily households are 1-person households, comprising 1,093.
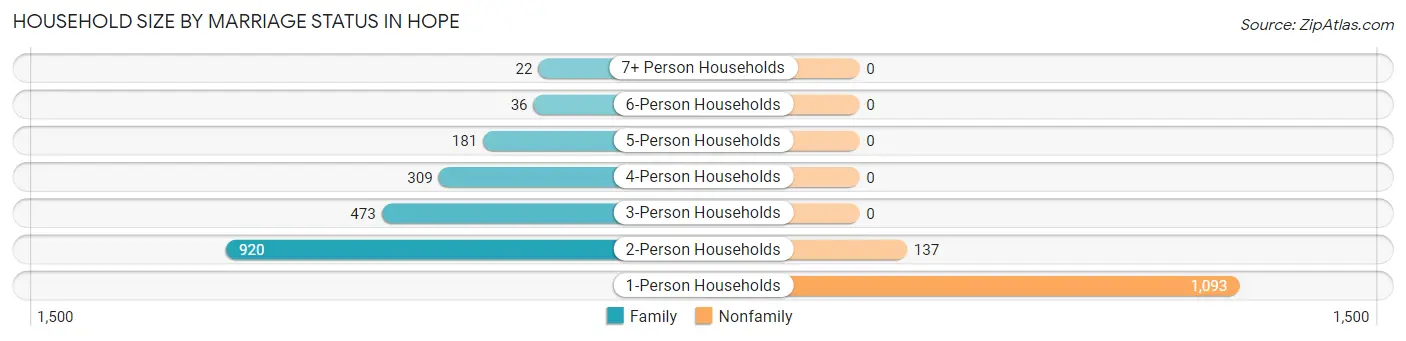
| Household Size | Family Households | Nonfamily Households |
| 1-Person Households | - | 1,093 (34.5%) |
| 2-Person Households | 920 (29.0%) | 137 (4.3%) |
| 3-Person Households | 473 (14.9%) | 0 (0.0%) |
| 4-Person Households | 309 (9.7%) | 0 (0.0%) |
| 5-Person Households | 181 (5.7%) | 0 (0.0%) |
| 6-Person Households | 36 (1.1%) | 0 (0.0%) |
| 7+ Person Households | 22 (0.7%) | 0 (0.0%) |
| Total | 1,941 (61.2%) | 1,230 (38.8%) |
Female Fertility in Hope
Fertility by Age in Hope
Average fertility rate in Hope is 15.0 births per 1,000 women. Women in the age bracket of 20 to 34 years have the highest fertility rate with 45.0 births per 1,000 women. Women in the age bracket of 20 to 34 years acount for 100.0% of all women with births.
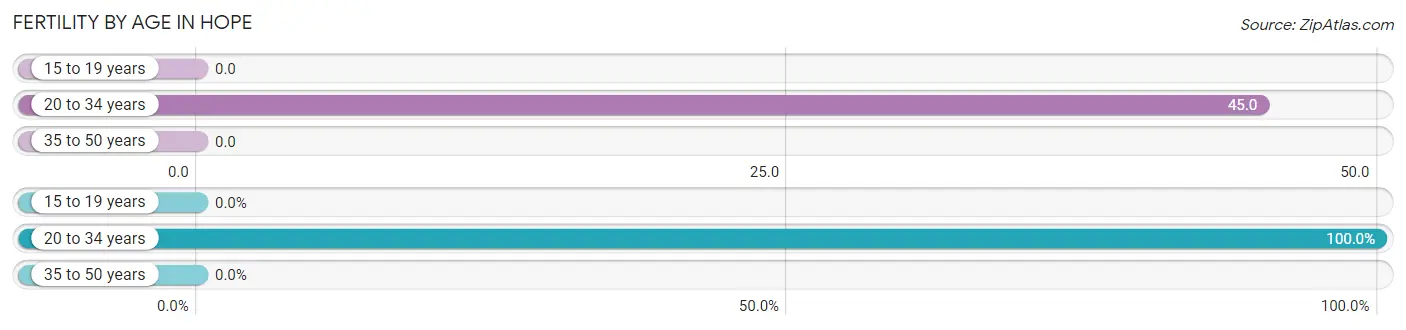
| Age Bracket | Women with Births | Births / 1,000 Women |
| 15 to 19 years | 0 (0.0%) | 0.0 |
| 20 to 34 years | 30 (100.0%) | 45.0 |
| 35 to 50 years | 0 (0.0%) | 0.0 |
| Total | 30 (100.0%) | 15.0 |
Fertility by Age by Marriage Status in Hope
63.3% of women with births (30) in Hope are married. The highest percentage of unmarried women with births falls into 20 to 34 years age bracket with 36.7% of them unmarried at the time of birth, while the lowest percentage of unmarried women with births belong to 20 to 34 years age bracket with 36.7% of them unmarried.
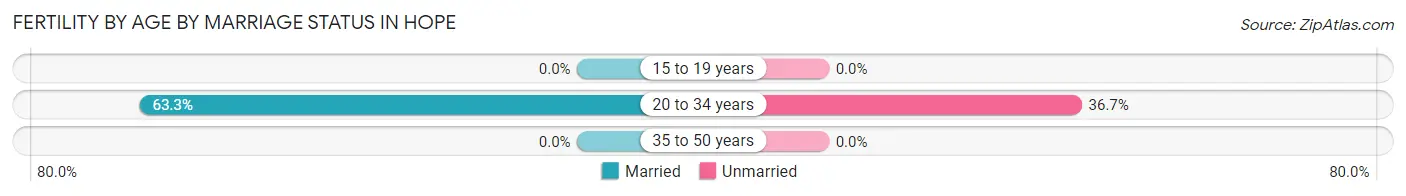
| Age Bracket | Married | Unmarried |
| 15 to 19 years | 0 (0.0%) | 0 (0.0%) |
| 20 to 34 years | 19 (63.3%) | 11 (36.7%) |
| 35 to 50 years | 0 (0.0%) | 0 (0.0%) |
| Total | 19 (63.3%) | 11 (36.7%) |
Fertility by Education in Hope
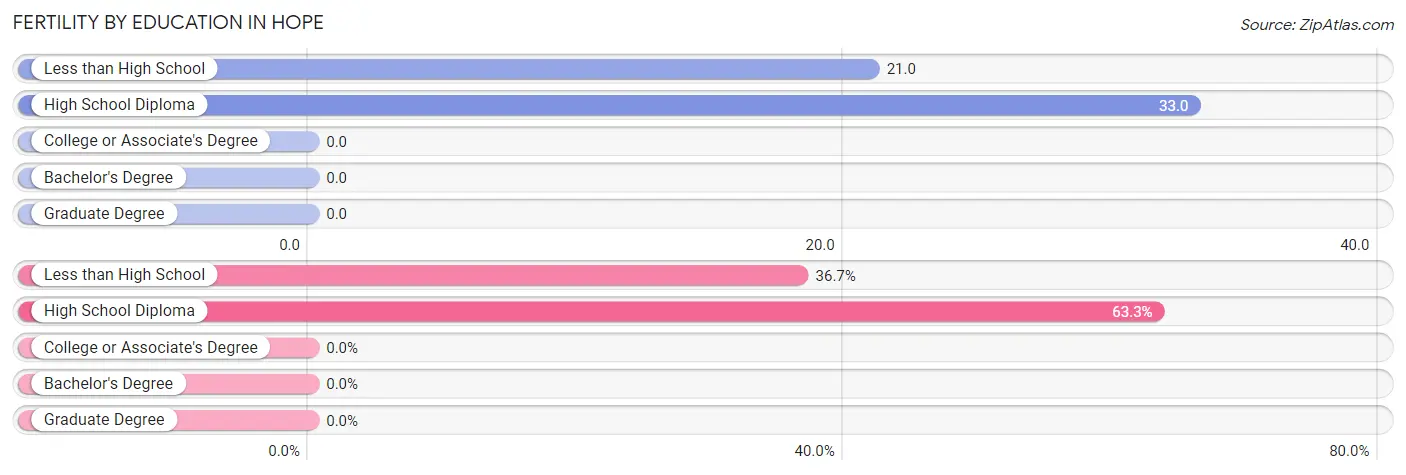
| Educational Attainment | Women with Births | Births / 1,000 Women |
| Less than High School | 11 (36.7%) | 21.0 |
| High School Diploma | 19 (63.3%) | 33.0 |
| College or Associate's Degree | 0 (0.0%) | 0.0 |
| Bachelor's Degree | 0 (0.0%) | 0.0 |
| Graduate Degree | 0 (0.0%) | 0.0 |
| Total | 30 (100.0%) | 15.0 |
Fertility by Education by Marriage Status in Hope
36.7% of women with births in Hope are unmarried. Women with the educational attainment of less than high school are most likely to be married with 100.0% of them married at childbirth, while women with the educational attainment of high school diploma are least likely to be married with 57.9% of them unmarried at childbirth.
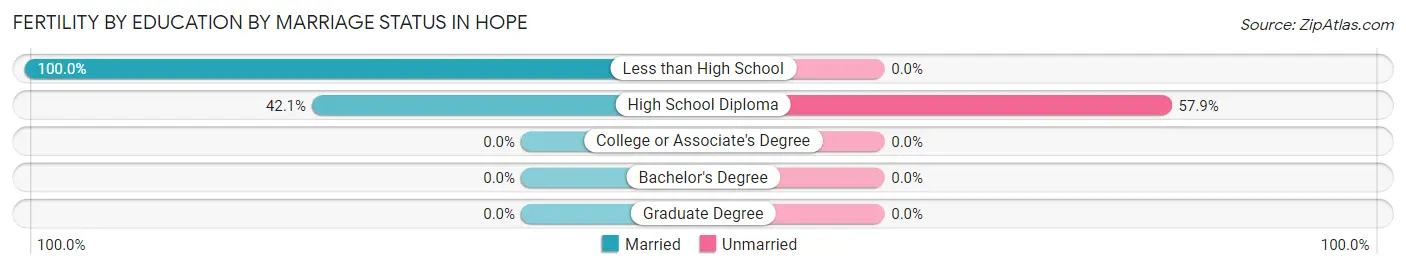
| Educational Attainment | Married | Unmarried |
| Less than High School | 11 (100.0%) | 0 (0.0%) |
| High School Diploma | 8 (42.1%) | 11 (57.9%) |
| College or Associate's Degree | 0 (0.0%) | 0 (0.0%) |
| Bachelor's Degree | 0 (0.0%) | 0 (0.0%) |
| Graduate Degree | 0 (0.0%) | 0 (0.0%) |
| Total | 19 (63.3%) | 11 (36.7%) |
Employment Characteristics in Hope
Employment by Class of Employer in Hope
Among the 3,552 employed individuals in Hope, private company employees (2,786 | 78.4%), state government employees (256 | 7.2%), and local government employees (188 | 5.3%) make up the most common classes of employment.
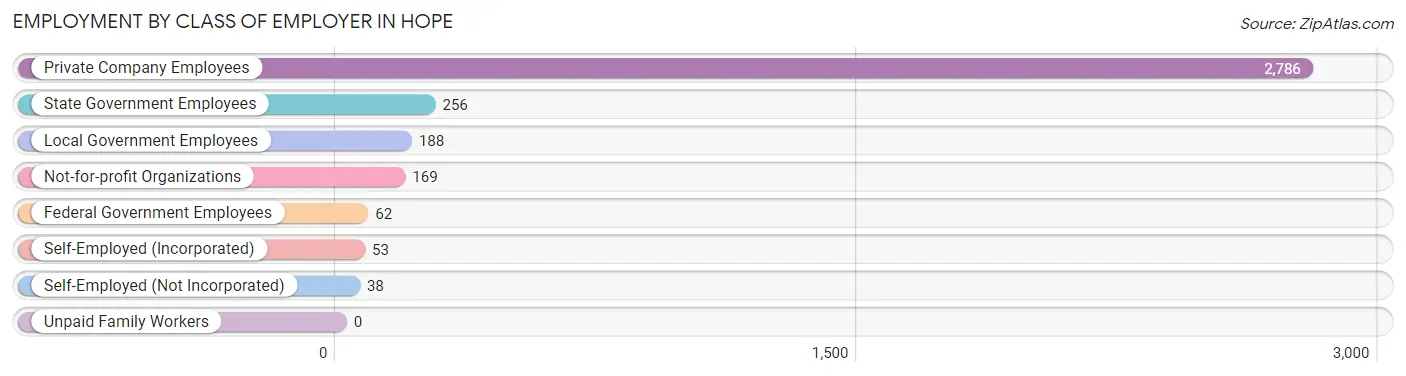
| Employer Class | # Employees | % Employees |
| Private Company Employees | 2,786 | 78.4% |
| Self-Employed (Incorporated) | 53 | 1.5% |
| Self-Employed (Not Incorporated) | 38 | 1.1% |
| Not-for-profit Organizations | 169 | 4.8% |
| Local Government Employees | 188 | 5.3% |
| State Government Employees | 256 | 7.2% |
| Federal Government Employees | 62 | 1.8% |
| Unpaid Family Workers | 0 | 0.0% |
| Total | 3,552 | 100.0% |
Employment Status by Age in Hope
According to the labor force statistics for Hope, out of the total population over 16 years of age (6,601), 56.2% or 3,710 individuals are in the labor force, with 3.9% or 145 of them unemployed. The age group with the highest labor force participation rate is 25 to 29 years, with 99.0% or 309 individuals in the labor force. Within the labor force, the 16 to 19 years age range has the highest percentage of unemployed individuals, with 14.9% or 20 of them being unemployed.
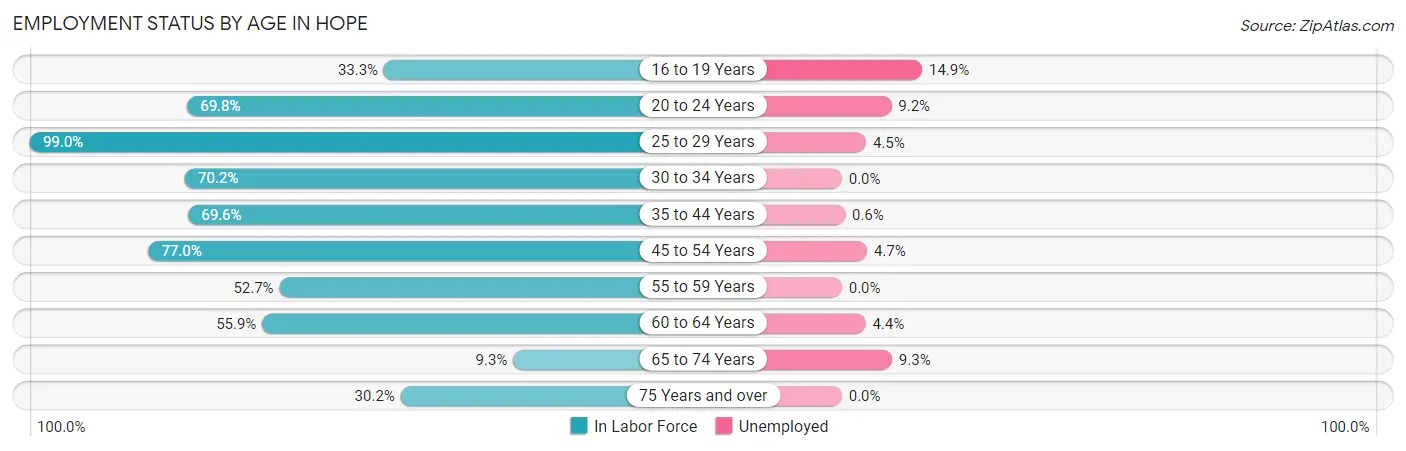
| Age Bracket | In Labor Force | Unemployed |
| 16 to 19 Years | 134 (33.3%) | 20 (14.9%) |
| 20 to 24 Years | 586 (69.8%) | 54 (9.2%) |
| 25 to 29 Years | 309 (99.0%) | 14 (4.5%) |
| 30 to 34 Years | 381 (70.2%) | 0 (0.0%) |
| 35 to 44 Years | 720 (69.6%) | 4 (0.6%) |
| 45 to 54 Years | 738 (77.0%) | 35 (4.7%) |
| 55 to 59 Years | 364 (52.7%) | 0 (0.0%) |
| 60 to 64 Years | 204 (55.9%) | 9 (4.4%) |
| 65 to 74 Years | 75 (9.3%) | 7 (9.3%) |
| 75 Years and over | 196 (30.2%) | 0 (0.0%) |
| Total | 3,710 (56.2%) | 145 (3.9%) |
Employment Status by Educational Attainment in Hope
According to labor force statistics for Hope, 69.6% of individuals (2,716) out of the total population between 25 and 64 years of age (3,903) are in the labor force, with 2.3% or 62 of them being unemployed. The group with the highest labor force participation rate are those with the educational attainment of bachelor's degree or higher, with 95.8% or 542 individuals in the labor force. Within the labor force, individuals with bachelor's degree or higher education have the highest percentage of unemployment, with 5.9% or 32 of them being unemployed.
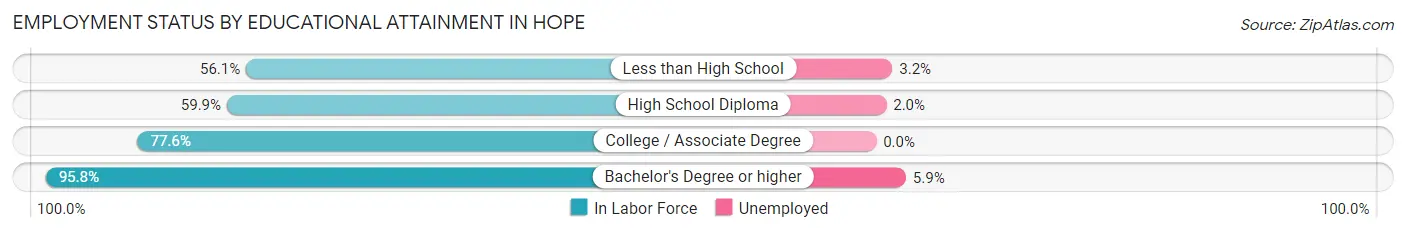
| Educational Attainment | In Labor Force | Unemployed |
| Less than High School | 374 (56.1%) | 21 (3.2%) |
| High School Diploma | 921 (59.9%) | 31 (2.0%) |
| College / Associate Degree | 879 (77.6%) | 0 (0.0%) |
| Bachelor's Degree or higher | 542 (95.8%) | 33 (5.9%) |
| Total | 2,716 (69.6%) | 90 (2.3%) |
Employment Occupations by Sex in Hope
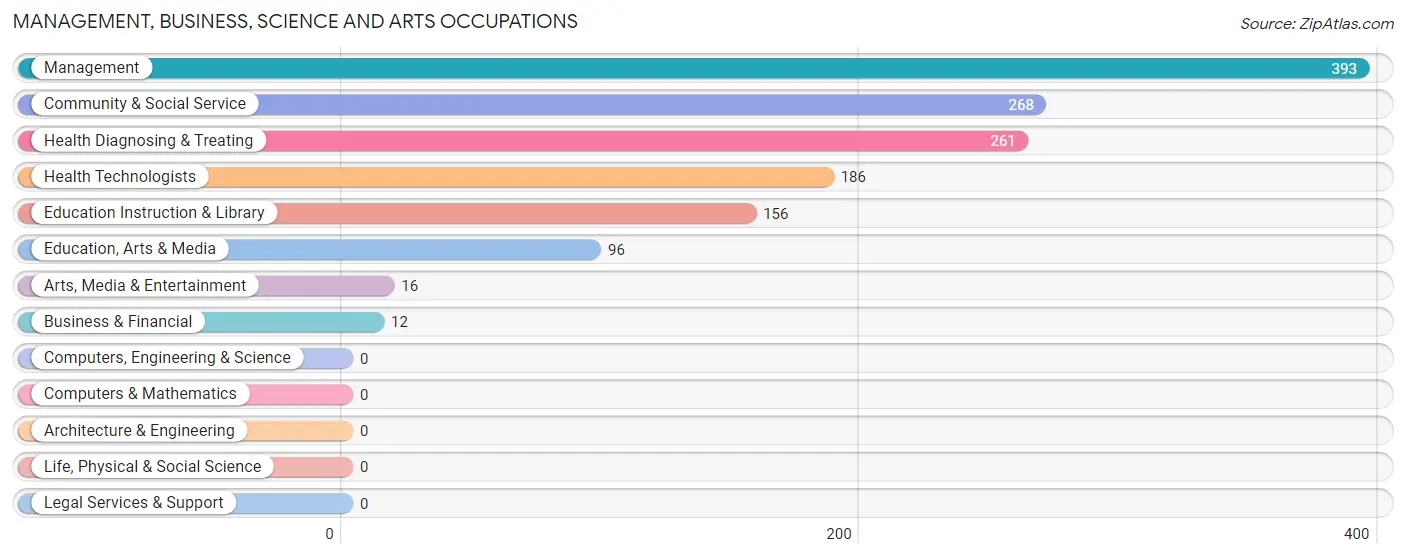
Management, Business, Science and Arts Occupations
The most common Management, Business, Science and Arts occupations in Hope are Management (393 | 11.0%), Community & Social Service (268 | 7.5%), Health Diagnosing & Treating (261 | 7.3%), Health Technologists (186 | 5.2%), and Education Instruction & Library (156 | 4.4%).
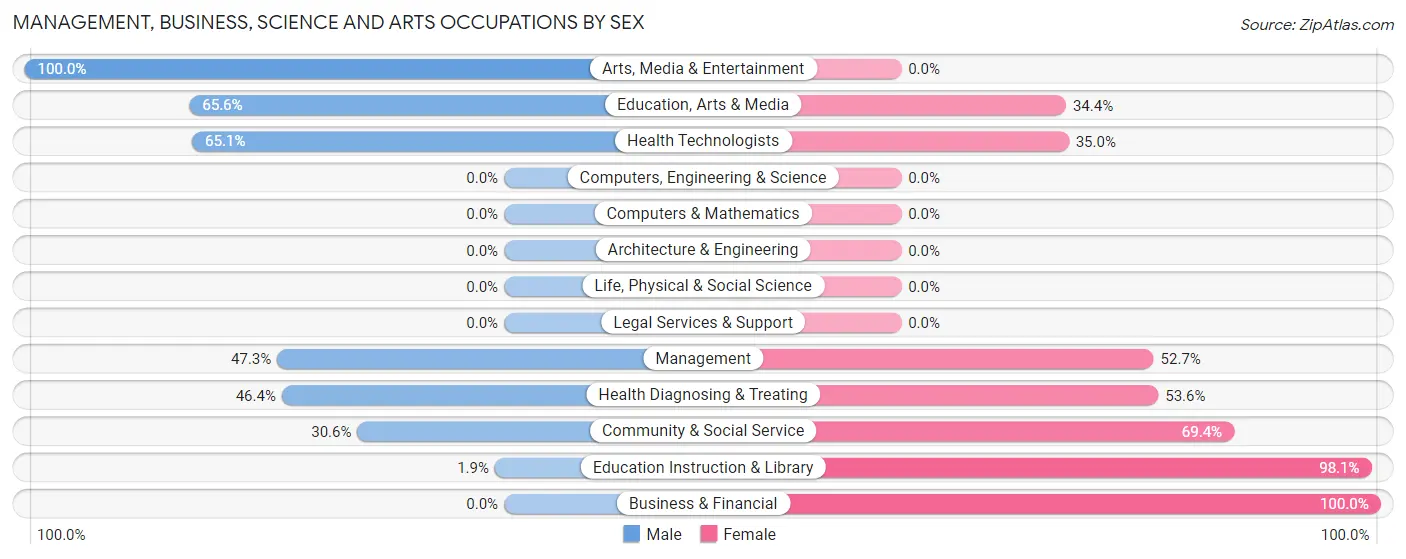
Management, Business, Science and Arts Occupations by Sex
Within the Management, Business, Science and Arts occupations in Hope, the most male-oriented occupations are Arts, Media & Entertainment (100.0%), Education, Arts & Media (65.6%), and Health Technologists (65.0%), while the most female-oriented occupations are Business & Financial (100.0%), Education Instruction & Library (98.1%), and Community & Social Service (69.4%).
| Occupation | Male | Female |
| Management | 186 (47.3%) | 207 (52.7%) |
| Business & Financial | 0 (0.0%) | 12 (100.0%) |
| Computers, Engineering & Science | 0 (0.0%) | 0 (0.0%) |
| Computers & Mathematics | 0 (0.0%) | 0 (0.0%) |
| Architecture & Engineering | 0 (0.0%) | 0 (0.0%) |
| Life, Physical & Social Science | 0 (0.0%) | 0 (0.0%) |
| Community & Social Service | 82 (30.6%) | 186 (69.4%) |
| Education, Arts & Media | 63 (65.6%) | 33 (34.4%) |
| Legal Services & Support | 0 (0.0%) | 0 (0.0%) |
| Education Instruction & Library | 3 (1.9%) | 153 (98.1%) |
| Arts, Media & Entertainment | 16 (100.0%) | 0 (0.0%) |
| Health Diagnosing & Treating | 121 (46.4%) | 140 (53.6%) |
| Health Technologists | 121 (65.0%) | 65 (34.9%) |
| Total (Category) | 389 (41.6%) | 545 (58.4%) |
| Total (Overall) | 1,939 (54.4%) | 1,625 (45.6%) |
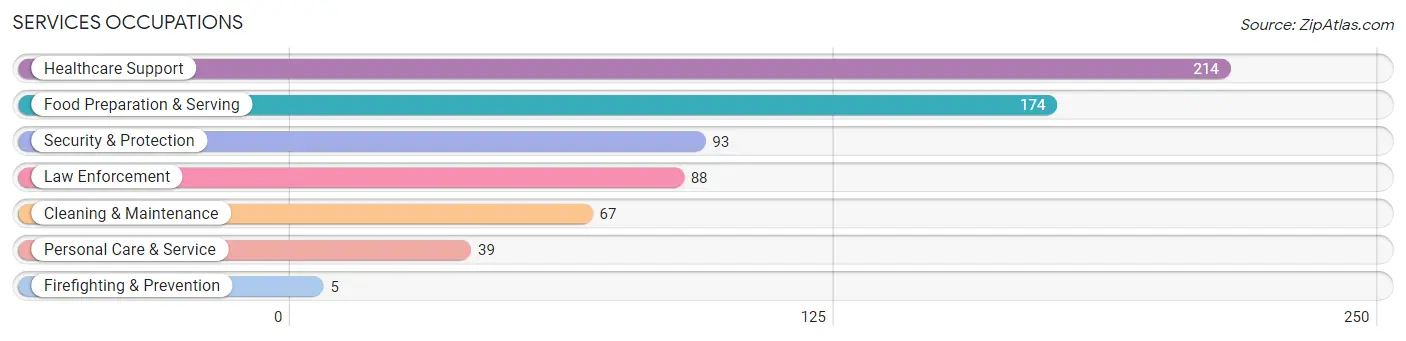
Services Occupations
The most common Services occupations in Hope are Healthcare Support (214 | 6.0%), Food Preparation & Serving (174 | 4.9%), Security & Protection (93 | 2.6%), Law Enforcement (88 | 2.5%), and Cleaning & Maintenance (67 | 1.9%).
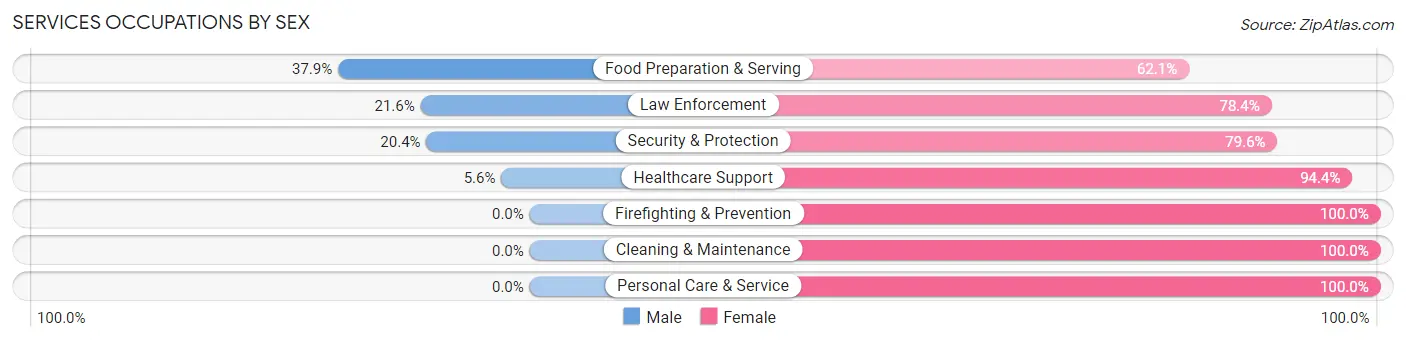
Services Occupations by Sex
Within the Services occupations in Hope, the most male-oriented occupations are Food Preparation & Serving (37.9%), Law Enforcement (21.6%), and Security & Protection (20.4%), while the most female-oriented occupations are Firefighting & Prevention (100.0%), Cleaning & Maintenance (100.0%), and Personal Care & Service (100.0%).
| Occupation | Male | Female |
| Healthcare Support | 12 (5.6%) | 202 (94.4%) |
| Security & Protection | 19 (20.4%) | 74 (79.6%) |
| Firefighting & Prevention | 0 (0.0%) | 5 (100.0%) |
| Law Enforcement | 19 (21.6%) | 69 (78.4%) |
| Food Preparation & Serving | 66 (37.9%) | 108 (62.1%) |
| Cleaning & Maintenance | 0 (0.0%) | 67 (100.0%) |
| Personal Care & Service | 0 (0.0%) | 39 (100.0%) |
| Total (Category) | 97 (16.5%) | 490 (83.5%) |
| Total (Overall) | 1,939 (54.4%) | 1,625 (45.6%) |
Sales and Office Occupations
The most common Sales and Office occupations in Hope are Office & Administration (265 | 7.4%), and Sales & Related (190 | 5.3%).
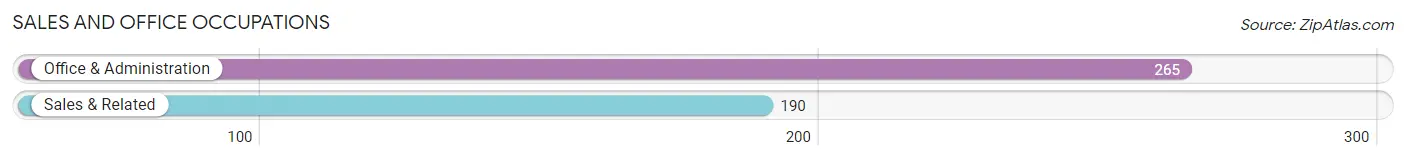
Sales and Office Occupations by Sex
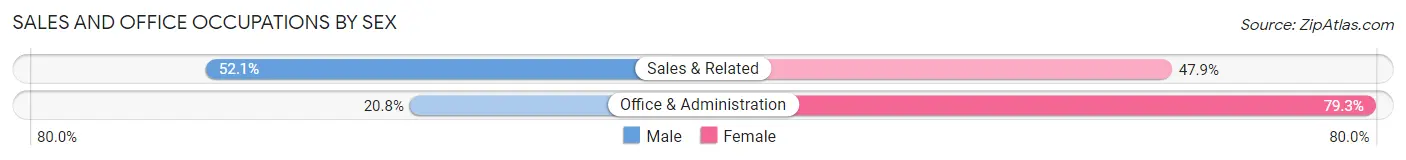
| Occupation | Male | Female |
| Sales & Related | 99 (52.1%) | 91 (47.9%) |
| Office & Administration | 55 (20.7%) | 210 (79.2%) |
| Total (Category) | 154 (33.9%) | 301 (66.1%) |
| Total (Overall) | 1,939 (54.4%) | 1,625 (45.6%) |
Natural Resources, Construction and Maintenance Occupations
The most common Natural Resources, Construction and Maintenance occupations in Hope are Installation, Maintenance & Repair (172 | 4.8%), Construction & Extraction (151 | 4.2%), and Farming, Fishing & Forestry (91 | 2.5%).
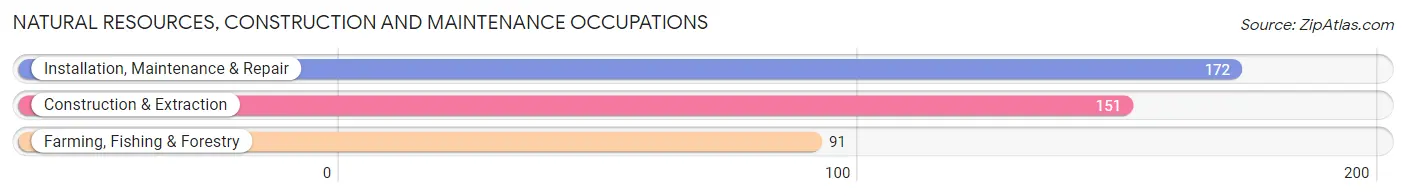
Natural Resources, Construction and Maintenance Occupations by Sex
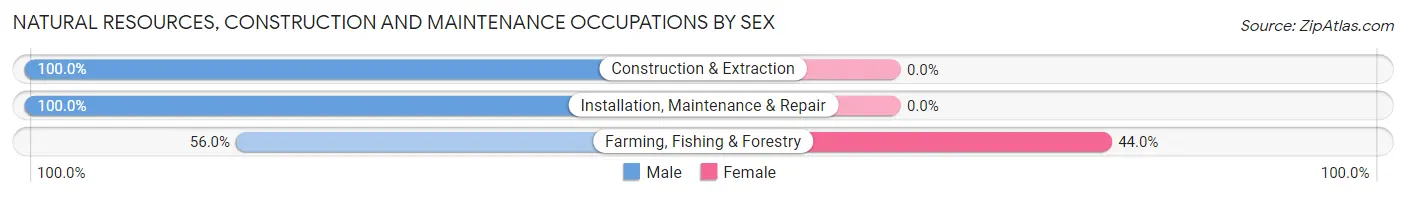
| Occupation | Male | Female |
| Farming, Fishing & Forestry | 51 (56.0%) | 40 (44.0%) |
| Construction & Extraction | 151 (100.0%) | 0 (0.0%) |
| Installation, Maintenance & Repair | 172 (100.0%) | 0 (0.0%) |
| Total (Category) | 374 (90.3%) | 40 (9.7%) |
| Total (Overall) | 1,939 (54.4%) | 1,625 (45.6%) |
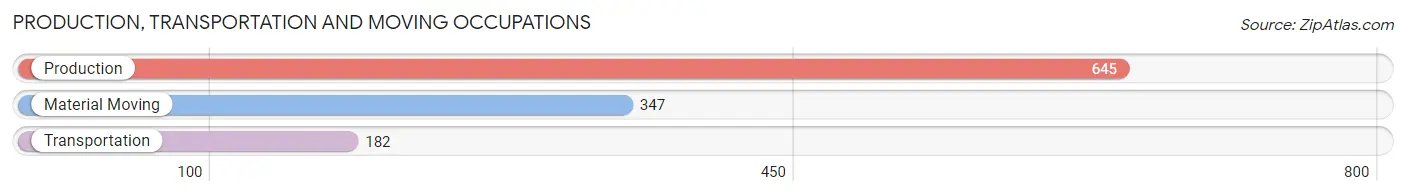
Production, Transportation and Moving Occupations
The most common Production, Transportation and Moving occupations in Hope are Production (645 | 18.1%), Material Moving (347 | 9.7%), and Transportation (182 | 5.1%).
Production, Transportation and Moving Occupations by Sex
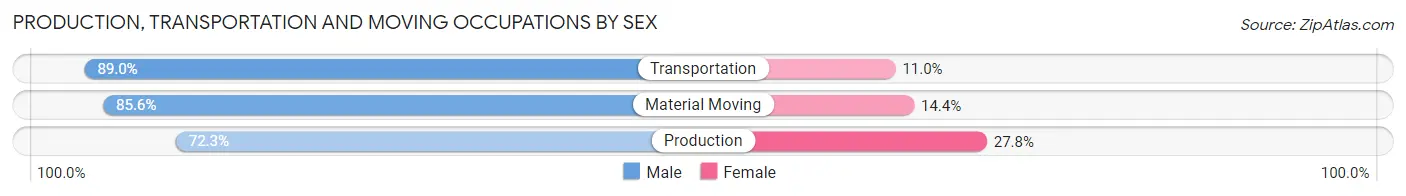
| Occupation | Male | Female |
| Production | 466 (72.3%) | 179 (27.8%) |
| Transportation | 162 (89.0%) | 20 (11.0%) |
| Material Moving | 297 (85.6%) | 50 (14.4%) |
| Total (Category) | 925 (78.8%) | 249 (21.2%) |
| Total (Overall) | 1,939 (54.4%) | 1,625 (45.6%) |
Employment Industries by Sex in Hope
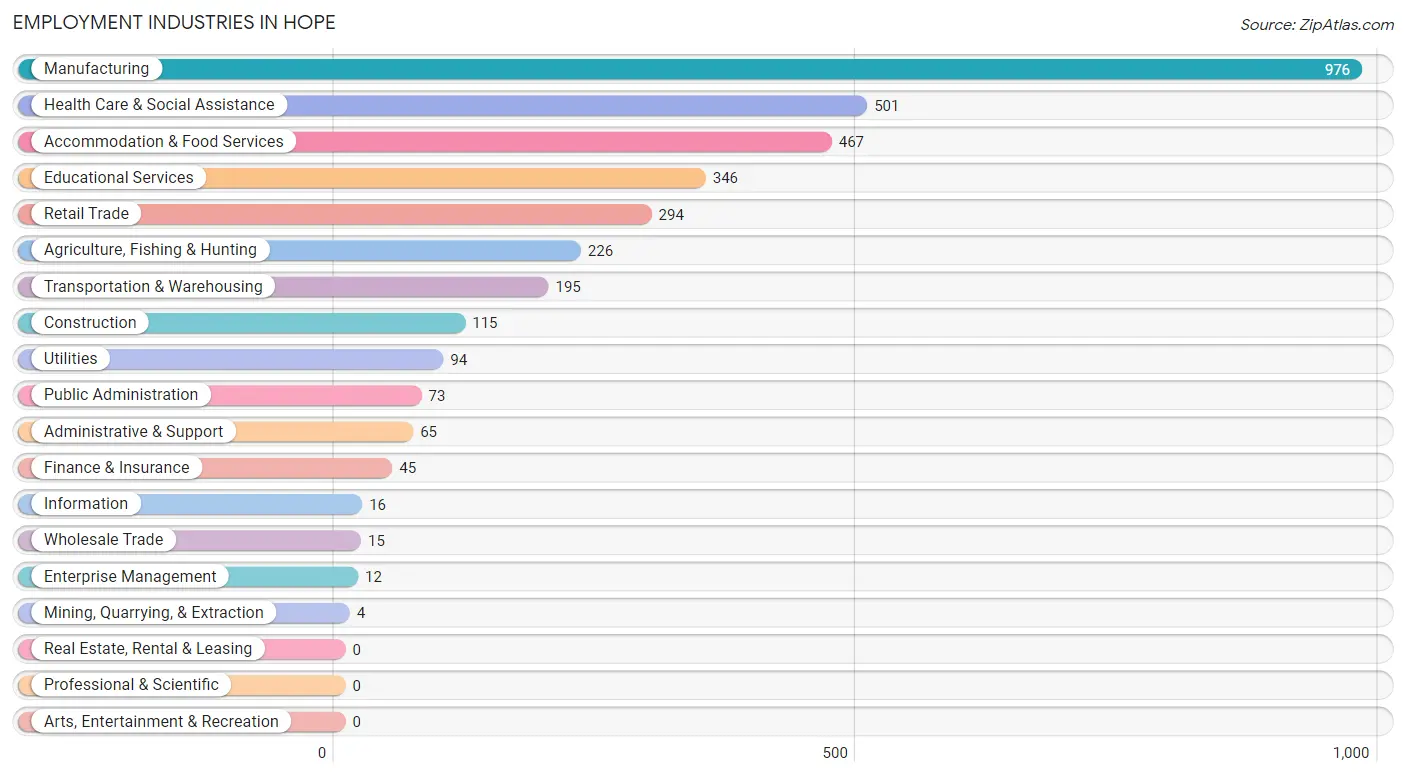
Employment Industries in Hope
The major employment industries in Hope include Manufacturing (976 | 27.4%), Health Care & Social Assistance (501 | 14.1%), Accommodation & Food Services (467 | 13.1%), Educational Services (346 | 9.7%), and Retail Trade (294 | 8.3%).
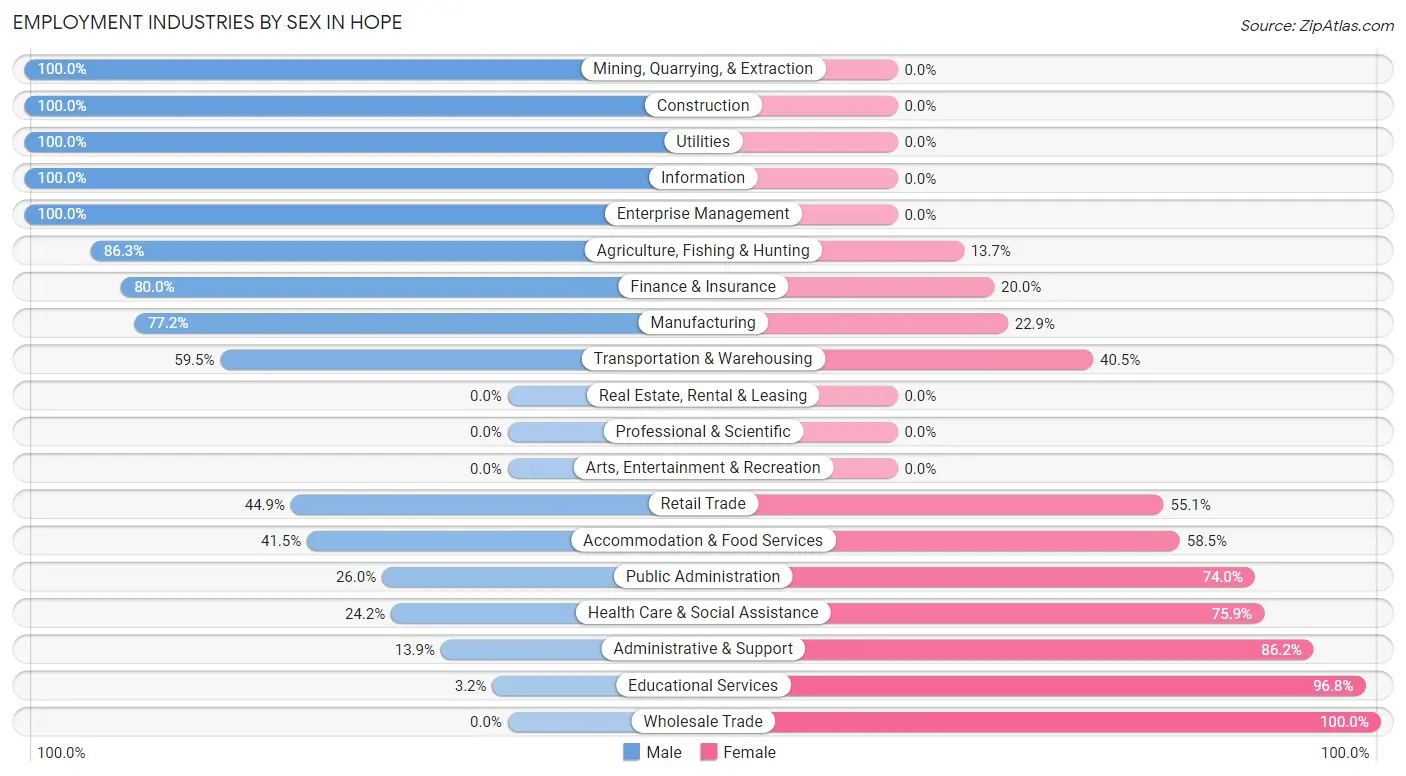
Employment Industries by Sex in Hope
The Hope industries that see more men than women are Mining, Quarrying, & Extraction (100.0%), Construction (100.0%), and Utilities (100.0%), whereas the industries that tend to have a higher number of women are Wholesale Trade (100.0%), Educational Services (96.8%), and Administrative & Support (86.2%).
| Industry | Male | Female |
| Agriculture, Fishing & Hunting | 195 (86.3%) | 31 (13.7%) |
| Mining, Quarrying, & Extraction | 4 (100.0%) | 0 (0.0%) |
| Construction | 115 (100.0%) | 0 (0.0%) |
| Manufacturing | 753 (77.1%) | 223 (22.9%) |
| Wholesale Trade | 0 (0.0%) | 15 (100.0%) |
| Retail Trade | 132 (44.9%) | 162 (55.1%) |
| Transportation & Warehousing | 116 (59.5%) | 79 (40.5%) |
| Utilities | 94 (100.0%) | 0 (0.0%) |
| Information | 16 (100.0%) | 0 (0.0%) |
| Finance & Insurance | 36 (80.0%) | 9 (20.0%) |
| Real Estate, Rental & Leasing | 0 (0.0%) | 0 (0.0%) |
| Professional & Scientific | 0 (0.0%) | 0 (0.0%) |
| Enterprise Management | 12 (100.0%) | 0 (0.0%) |
| Administrative & Support | 9 (13.9%) | 56 (86.2%) |
| Educational Services | 11 (3.2%) | 335 (96.8%) |
| Health Care & Social Assistance | 121 (24.1%) | 380 (75.8%) |
| Arts, Entertainment & Recreation | 0 (0.0%) | 0 (0.0%) |
| Accommodation & Food Services | 194 (41.5%) | 273 (58.5%) |
| Public Administration | 19 (26.0%) | 54 (74.0%) |
| Total | 1,939 (54.4%) | 1,625 (45.6%) |
Education in Hope
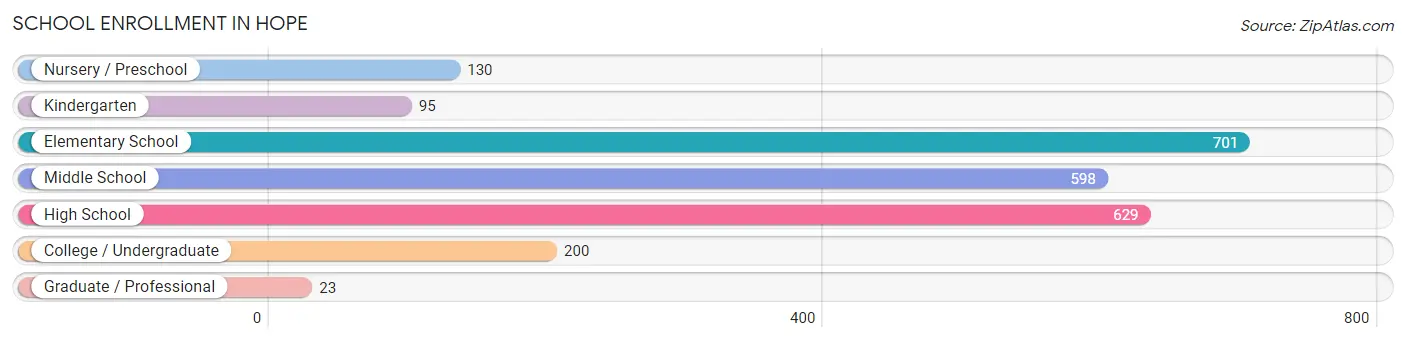
School Enrollment in Hope
The most common levels of schooling among the 2,376 students in Hope are elementary school (701 | 29.5%), high school (629 | 26.5%), and middle school (598 | 25.2%).
| School Level | # Students | % Students |
| Nursery / Preschool | 130 | 5.5% |
| Kindergarten | 95 | 4.0% |
| Elementary School | 701 | 29.5% |
| Middle School | 598 | 25.2% |
| High School | 629 | 26.5% |
| College / Undergraduate | 200 | 8.4% |
| Graduate / Professional | 23 | 1.0% |
| Total | 2,376 | 100.0% |
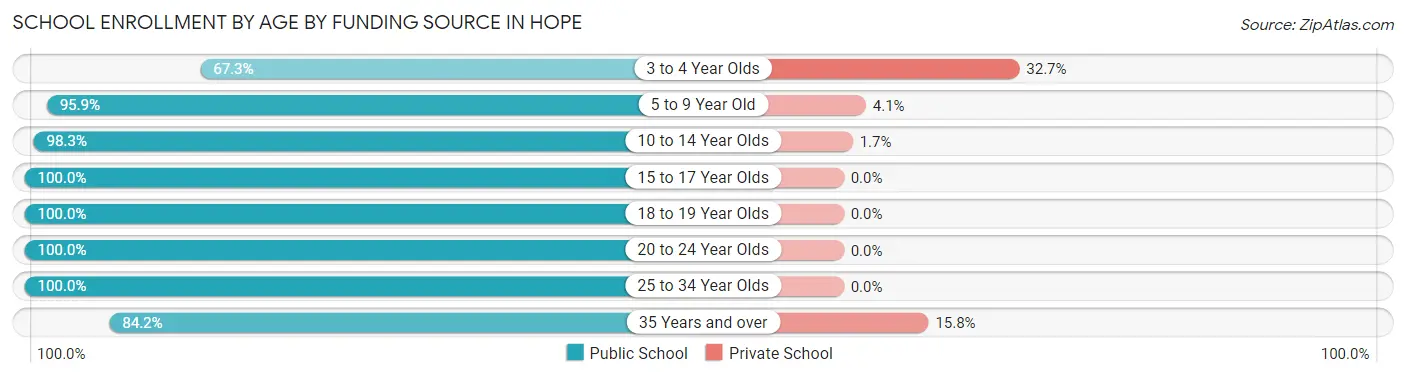
School Enrollment by Age by Funding Source in Hope
Out of a total of 2,376 students who are enrolled in schools in Hope, 76 (3.2%) attend a private institution, while the remaining 2,300 (96.8%) are enrolled in public schools. The age group of 3 to 4 year olds has the highest likelihood of being enrolled in private schools, with 18 (32.7% in the age bracket) enrolled. Conversely, the age group of 15 to 17 year olds has the lowest likelihood of being enrolled in a private school, with 390 (100.0% in the age bracket) attending a public institution.
| Age Bracket | Public School | Private School |
| 3 to 4 Year Olds | 37 (67.3%) | 18 (32.7%) |
| 5 to 9 Year Old | 743 (95.9%) | 32 (4.1%) |
| 10 to 14 Year Olds | 818 (98.3%) | 14 (1.7%) |
| 15 to 17 Year Olds | 390 (100.0%) | 0 (0.0%) |
| 18 to 19 Year Olds | 123 (100.0%) | 0 (0.0%) |
| 20 to 24 Year Olds | 80 (100.0%) | 0 (0.0%) |
| 25 to 34 Year Olds | 45 (100.0%) | 0 (0.0%) |
| 35 Years and over | 64 (84.2%) | 12 (15.8%) |
| Total | 2,300 (96.8%) | 76 (3.2%) |
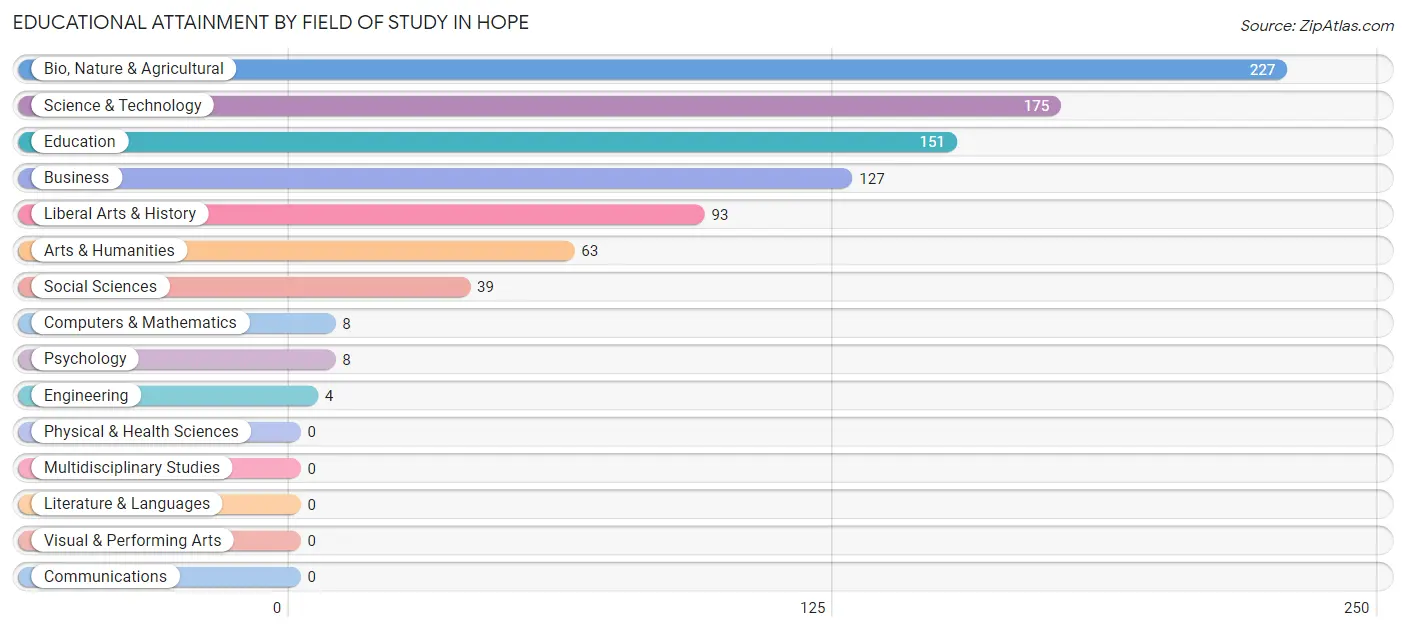
Educational Attainment by Field of Study in Hope
Bio, nature & agricultural (227 | 25.4%), science & technology (175 | 19.6%), education (151 | 16.9%), business (127 | 14.2%), and liberal arts & history (93 | 10.4%) are the most common fields of study among 895 individuals in Hope who have obtained a bachelor's degree or higher.
| Field of Study | # Graduates | % Graduates |
| Computers & Mathematics | 8 | 0.9% |
| Bio, Nature & Agricultural | 227 | 25.4% |
| Physical & Health Sciences | 0 | 0.0% |
| Psychology | 8 | 0.9% |
| Social Sciences | 39 | 4.4% |
| Engineering | 4 | 0.4% |
| Multidisciplinary Studies | 0 | 0.0% |
| Science & Technology | 175 | 19.6% |
| Business | 127 | 14.2% |
| Education | 151 | 16.9% |
| Literature & Languages | 0 | 0.0% |
| Liberal Arts & History | 93 | 10.4% |
| Visual & Performing Arts | 0 | 0.0% |
| Communications | 0 | 0.0% |
| Arts & Humanities | 63 | 7.0% |
| Total | 895 | 100.0% |
Transportation & Commute in Hope
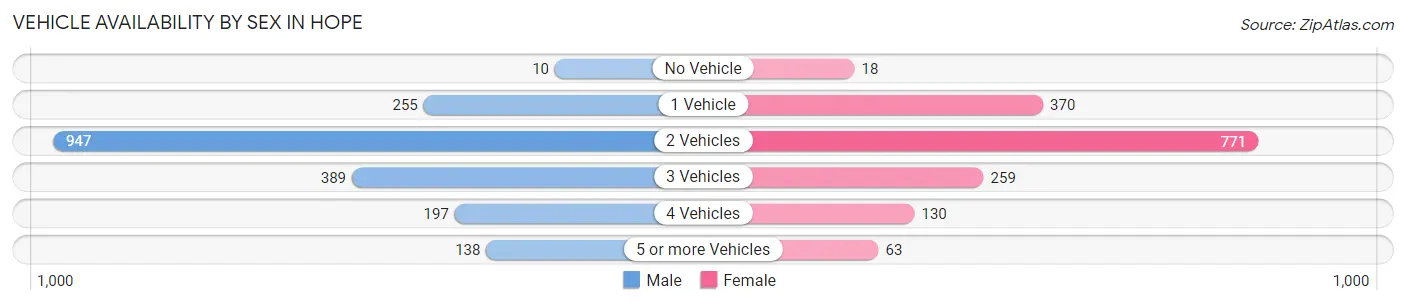
Vehicle Availability by Sex in Hope
The most prevalent vehicle ownership categories in Hope are males with 2 vehicles (947, accounting for 48.9%) and females with 2 vehicles (771, making up 58.8%).
| Vehicles Available | Male | Female |
| No Vehicle | 10 (0.5%) | 18 (1.1%) |
| 1 Vehicle | 255 (13.2%) | 370 (23.0%) |
| 2 Vehicles | 947 (48.9%) | 771 (47.9%) |
| 3 Vehicles | 389 (20.1%) | 259 (16.1%) |
| 4 Vehicles | 197 (10.2%) | 130 (8.1%) |
| 5 or more Vehicles | 138 (7.1%) | 63 (3.9%) |
| Total | 1,936 (100.0%) | 1,611 (100.0%) |
Commute Time in Hope
The most frequently occuring commute durations in Hope are 5 to 9 minutes (894 commuters, 25.5%), 10 to 14 minutes (682 commuters, 19.5%), and 15 to 19 minutes (464 commuters, 13.3%).
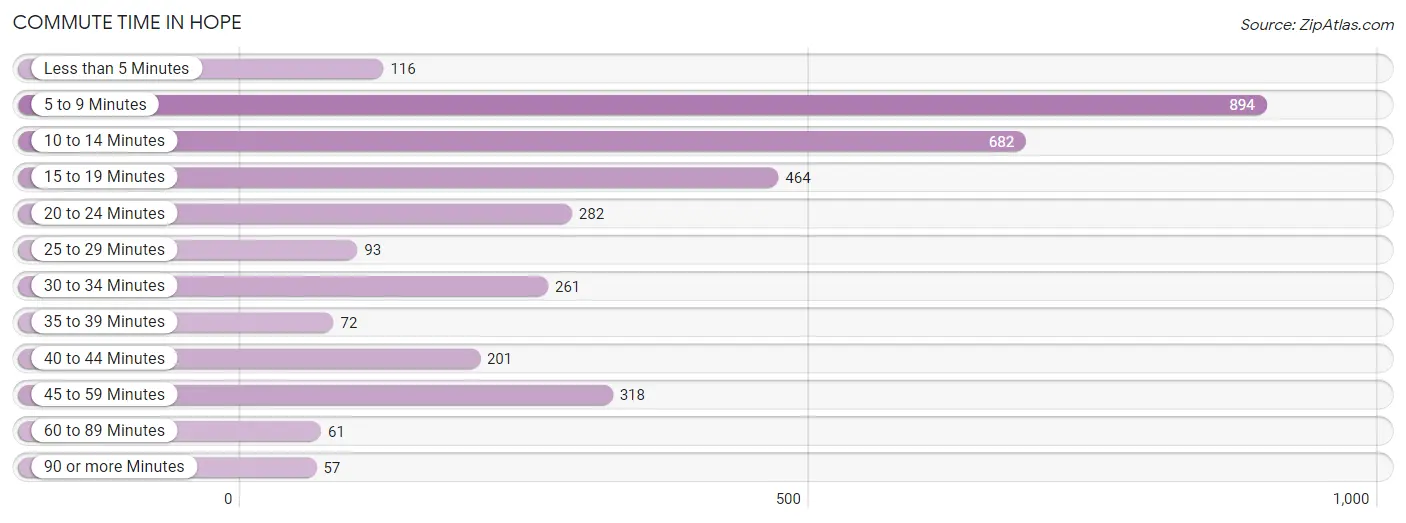
| Commute Time | # Commuters | % Commuters |
| Less than 5 Minutes | 116 | 3.3% |
| 5 to 9 Minutes | 894 | 25.5% |
| 10 to 14 Minutes | 682 | 19.5% |
| 15 to 19 Minutes | 464 | 13.3% |
| 20 to 24 Minutes | 282 | 8.1% |
| 25 to 29 Minutes | 93 | 2.7% |
| 30 to 34 Minutes | 261 | 7.5% |
| 35 to 39 Minutes | 72 | 2.1% |
| 40 to 44 Minutes | 201 | 5.7% |
| 45 to 59 Minutes | 318 | 9.1% |
| 60 to 89 Minutes | 61 | 1.7% |
| 90 or more Minutes | 57 | 1.6% |
Commute Time by Sex in Hope
The most common commute times in Hope are 10 to 14 minutes (373 commuters, 19.4%) for males and 5 to 9 minutes (522 commuters, 33.1%) for females.
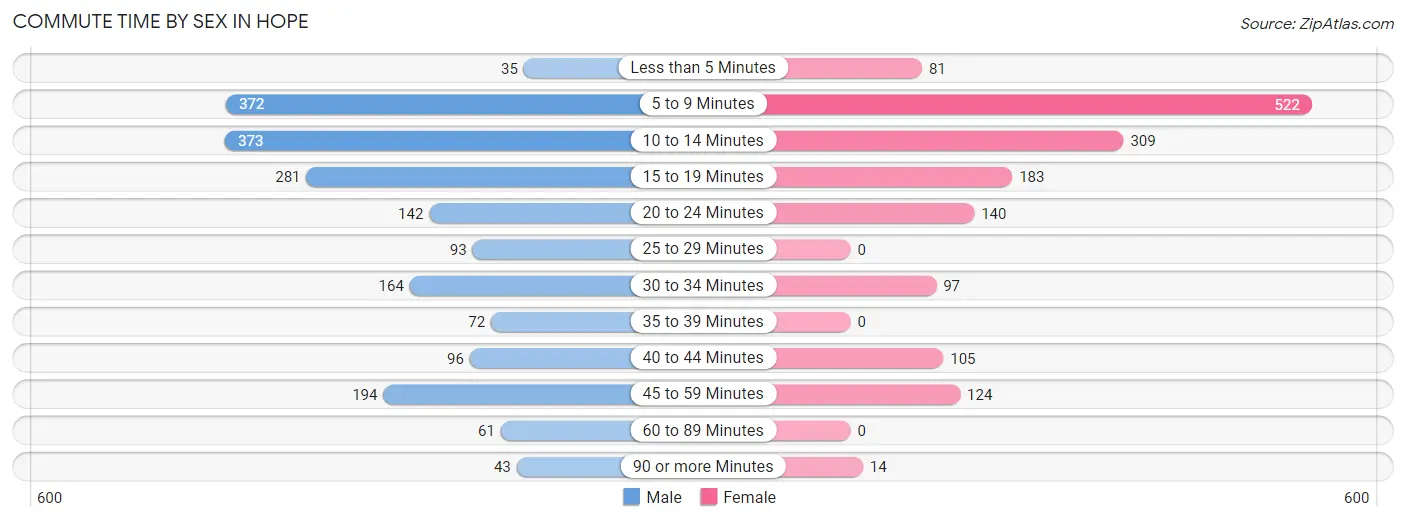
| Commute Time | Male | Female |
| Less than 5 Minutes | 35 (1.8%) | 81 (5.1%) |
| 5 to 9 Minutes | 372 (19.3%) | 522 (33.1%) |
| 10 to 14 Minutes | 373 (19.4%) | 309 (19.6%) |
| 15 to 19 Minutes | 281 (14.6%) | 183 (11.6%) |
| 20 to 24 Minutes | 142 (7.4%) | 140 (8.9%) |
| 25 to 29 Minutes | 93 (4.8%) | 0 (0.0%) |
| 30 to 34 Minutes | 164 (8.5%) | 97 (6.2%) |
| 35 to 39 Minutes | 72 (3.7%) | 0 (0.0%) |
| 40 to 44 Minutes | 96 (5.0%) | 105 (6.7%) |
| 45 to 59 Minutes | 194 (10.1%) | 124 (7.9%) |
| 60 to 89 Minutes | 61 (3.2%) | 0 (0.0%) |
| 90 or more Minutes | 43 (2.2%) | 14 (0.9%) |
Time of Departure to Work by Sex in Hope
The most frequent times of departure to work in Hope are 6:00 AM to 6:29 AM (299, 15.5%) for males and 7:00 AM to 7:29 AM (294, 18.7%) for females.
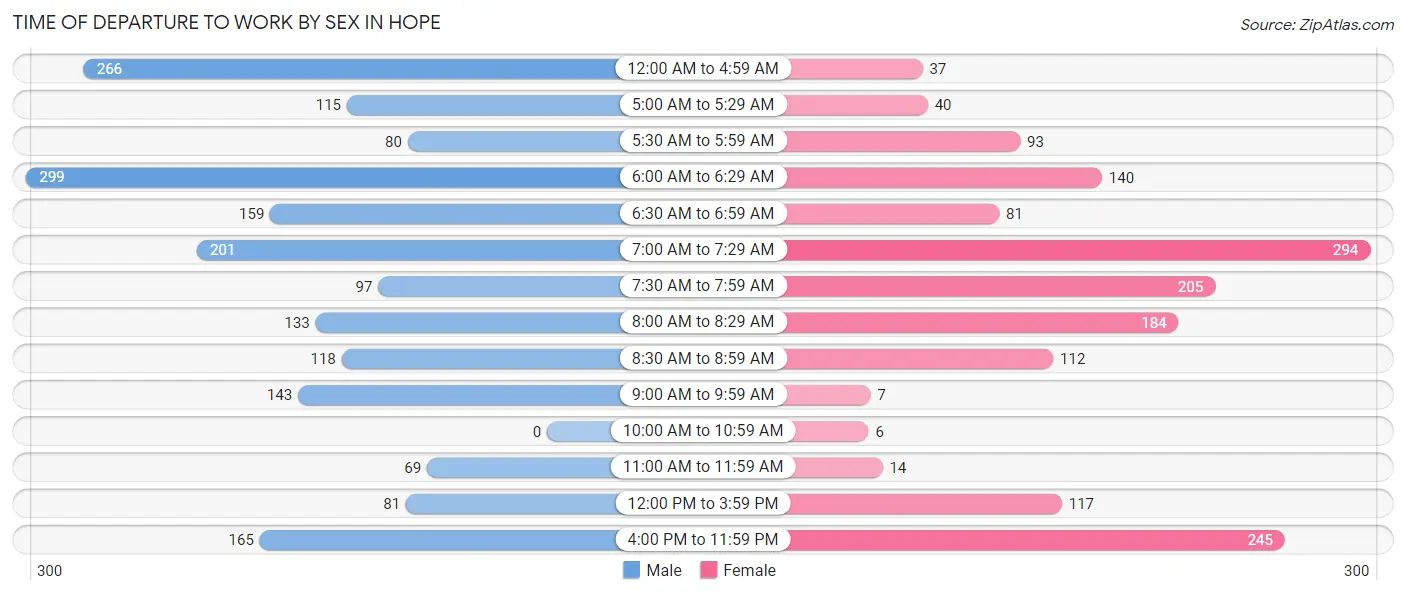
| Time of Departure | Male | Female |
| 12:00 AM to 4:59 AM | 266 (13.8%) | 37 (2.4%) |
| 5:00 AM to 5:29 AM | 115 (6.0%) | 40 (2.5%) |
| 5:30 AM to 5:59 AM | 80 (4.2%) | 93 (5.9%) |
| 6:00 AM to 6:29 AM | 299 (15.5%) | 140 (8.9%) |
| 6:30 AM to 6:59 AM | 159 (8.3%) | 81 (5.1%) |
| 7:00 AM to 7:29 AM | 201 (10.4%) | 294 (18.7%) |
| 7:30 AM to 7:59 AM | 97 (5.0%) | 205 (13.0%) |
| 8:00 AM to 8:29 AM | 133 (6.9%) | 184 (11.7%) |
| 8:30 AM to 8:59 AM | 118 (6.1%) | 112 (7.1%) |
| 9:00 AM to 9:59 AM | 143 (7.4%) | 7 (0.4%) |
| 10:00 AM to 10:59 AM | 0 (0.0%) | 6 (0.4%) |
| 11:00 AM to 11:59 AM | 69 (3.6%) | 14 (0.9%) |
| 12:00 PM to 3:59 PM | 81 (4.2%) | 117 (7.4%) |
| 4:00 PM to 11:59 PM | 165 (8.6%) | 245 (15.6%) |
| Total | 1,926 (100.0%) | 1,575 (100.0%) |
Housing Occupancy in Hope
Occupancy by Ownership in Hope
Of the total 3,171 dwellings in Hope, owner-occupied units account for 1,688 (53.2%), while renter-occupied units make up 1,483 (46.8%).
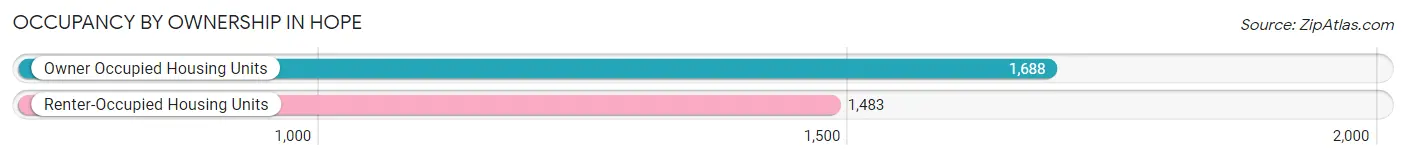
| Occupancy | # Housing Units | % Housing Units |
| Owner Occupied Housing Units | 1,688 | 53.2% |
| Renter-Occupied Housing Units | 1,483 | 46.8% |
| Total Occupied Housing Units | 3,171 | 100.0% |
Occupancy by Household Size in Hope
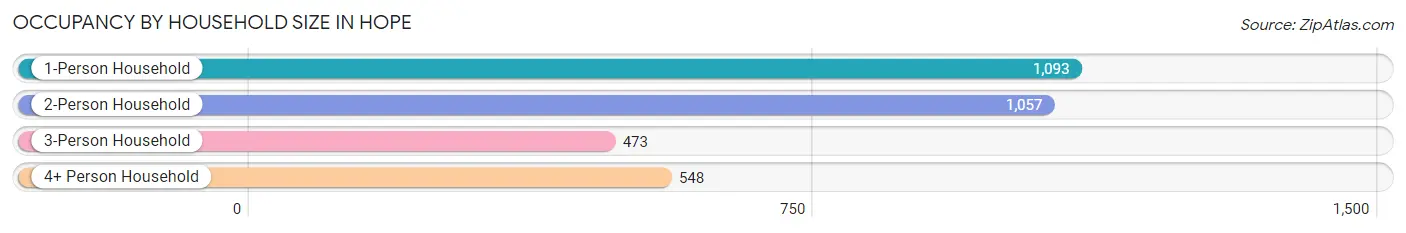
| Household Size | # Housing Units | % Housing Units |
| 1-Person Household | 1,093 | 34.5% |
| 2-Person Household | 1,057 | 33.3% |
| 3-Person Household | 473 | 14.9% |
| 4+ Person Household | 548 | 17.3% |
| Total Housing Units | 3,171 | 100.0% |
Occupancy by Ownership by Household Size in Hope
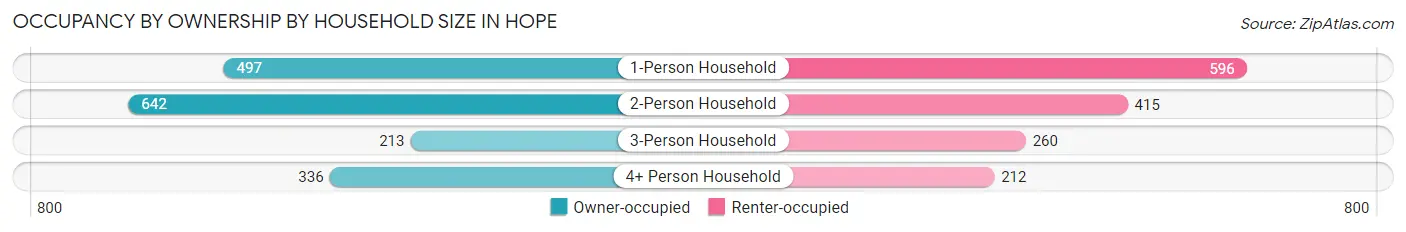
| Household Size | Owner-occupied | Renter-occupied |
| 1-Person Household | 497 (45.5%) | 596 (54.5%) |
| 2-Person Household | 642 (60.7%) | 415 (39.3%) |
| 3-Person Household | 213 (45.0%) | 260 (55.0%) |
| 4+ Person Household | 336 (61.3%) | 212 (38.7%) |
| Total Housing Units | 1,688 (53.2%) | 1,483 (46.8%) |
Occupancy by Educational Attainment in Hope
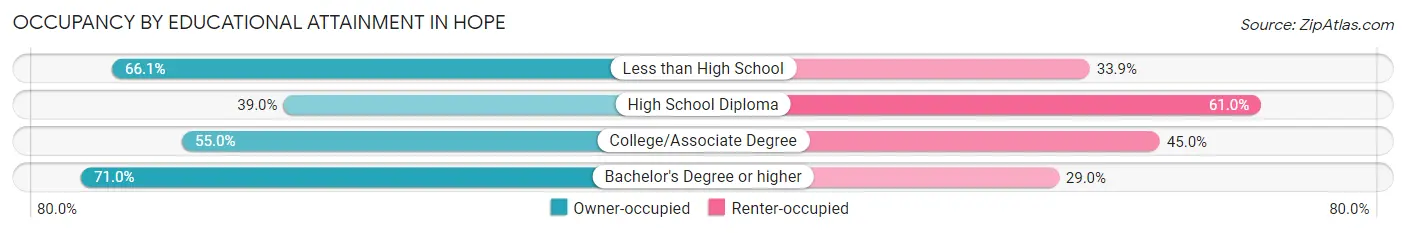
| Household Size | Owner-occupied | Renter-occupied |
| Less than High School | 355 (66.1%) | 182 (33.9%) |
| High School Diploma | 457 (39.0%) | 716 (61.0%) |
| College/Associate Degree | 555 (55.0%) | 454 (45.0%) |
| Bachelor's Degree or higher | 321 (71.0%) | 131 (29.0%) |
Occupancy by Age of Householder in Hope
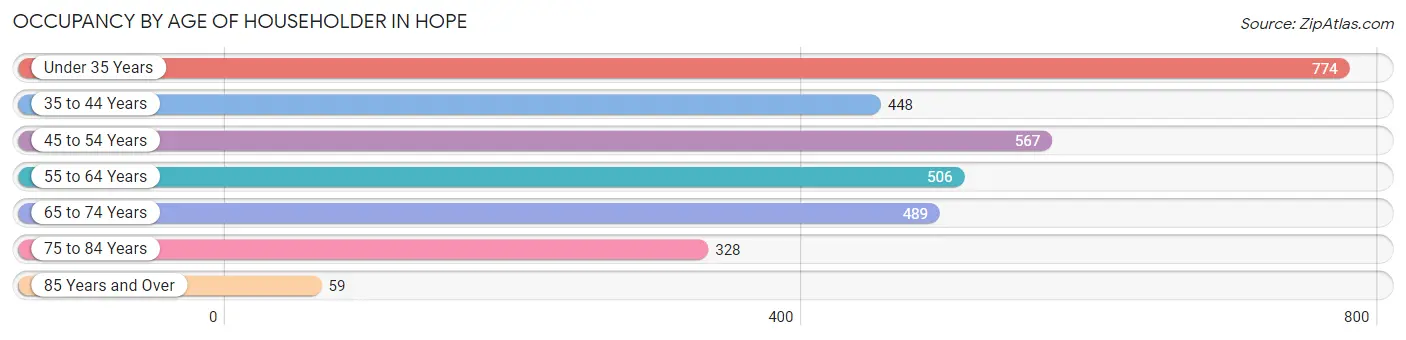
| Age Bracket | # Households | % Households |
| Under 35 Years | 774 | 24.4% |
| 35 to 44 Years | 448 | 14.1% |
| 45 to 54 Years | 567 | 17.9% |
| 55 to 64 Years | 506 | 16.0% |
| 65 to 74 Years | 489 | 15.4% |
| 75 to 84 Years | 328 | 10.3% |
| 85 Years and Over | 59 | 1.9% |
| Total | 3,171 | 100.0% |
Housing Finances in Hope
Median Income by Occupancy in Hope
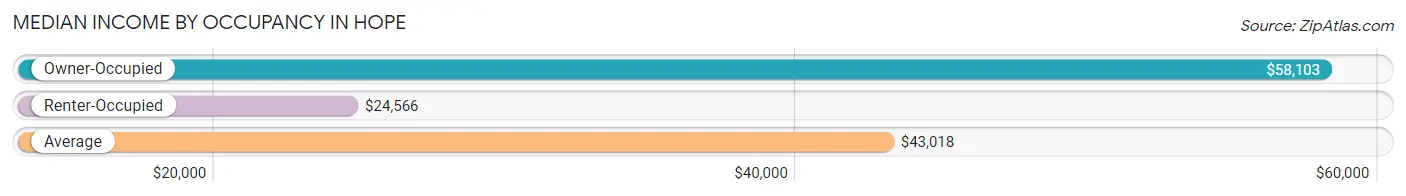
| Occupancy Type | # Households | Median Income |
| Owner-Occupied | 1,688 (53.2%) | $58,103 |
| Renter-Occupied | 1,483 (46.8%) | $24,566 |
| Average | 3,171 (100.0%) | $43,018 |
Occupancy by Householder Income Bracket in Hope
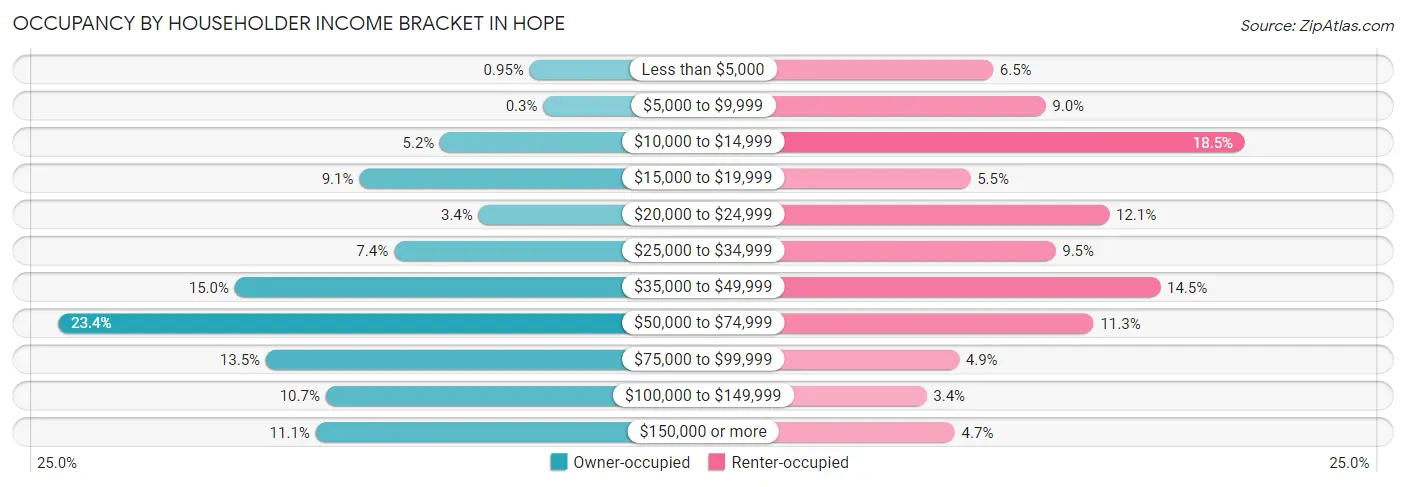
| Income Bracket | Owner-occupied | Renter-occupied |
| Less than $5,000 | 16 (0.9%) | 97 (6.5%) |
| $5,000 to $9,999 | 5 (0.3%) | 134 (9.0%) |
| $10,000 to $14,999 | 88 (5.2%) | 275 (18.5%) |
| $15,000 to $19,999 | 153 (9.1%) | 81 (5.5%) |
| $20,000 to $24,999 | 57 (3.4%) | 179 (12.1%) |
| $25,000 to $34,999 | 125 (7.4%) | 141 (9.5%) |
| $35,000 to $49,999 | 253 (15.0%) | 215 (14.5%) |
| $50,000 to $74,999 | 395 (23.4%) | 168 (11.3%) |
| $75,000 to $99,999 | 228 (13.5%) | 73 (4.9%) |
| $100,000 to $149,999 | 180 (10.7%) | 50 (3.4%) |
| $150,000 or more | 188 (11.1%) | 70 (4.7%) |
| Total | 1,688 (100.0%) | 1,483 (100.0%) |
Monthly Housing Cost Tiers in Hope
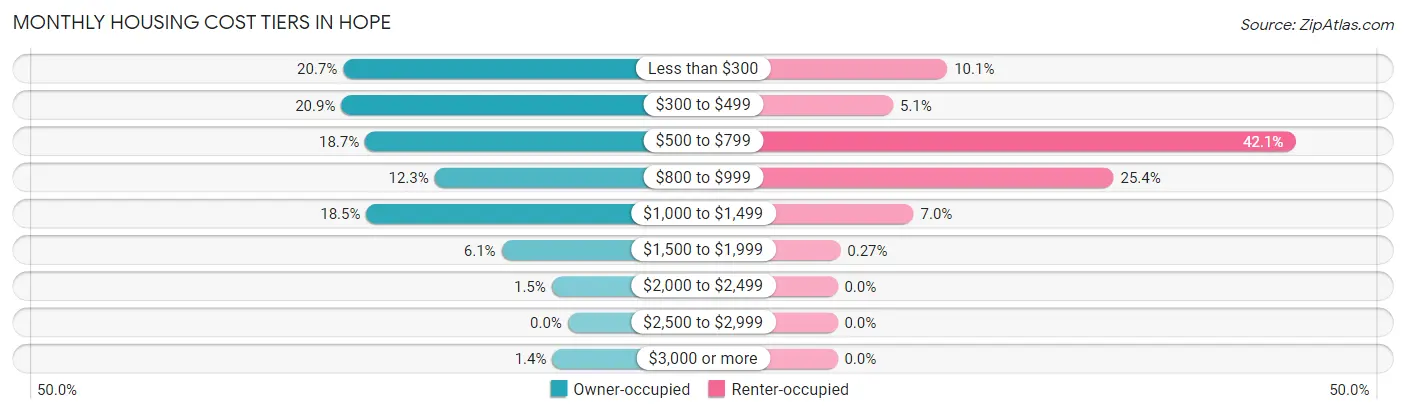
| Monthly Cost | Owner-occupied | Renter-occupied |
| Less than $300 | 349 (20.7%) | 150 (10.1%) |
| $300 to $499 | 352 (20.8%) | 76 (5.1%) |
| $500 to $799 | 315 (18.7%) | 625 (42.1%) |
| $800 to $999 | 207 (12.3%) | 377 (25.4%) |
| $1,000 to $1,499 | 313 (18.5%) | 104 (7.0%) |
| $1,500 to $1,999 | 103 (6.1%) | 4 (0.3%) |
| $2,000 to $2,499 | 25 (1.5%) | 0 (0.0%) |
| $2,500 to $2,999 | 0 (0.0%) | 0 (0.0%) |
| $3,000 or more | 24 (1.4%) | 0 (0.0%) |
| Total | 1,688 (100.0%) | 1,483 (100.0%) |
Physical Housing Characteristics in Hope
Housing Structures in Hope
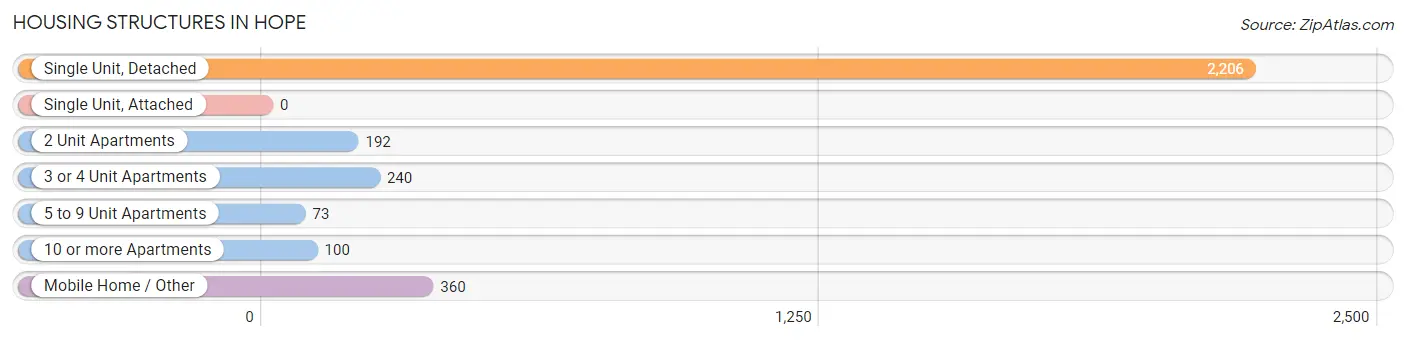
| Structure Type | # Housing Units | % Housing Units |
| Single Unit, Detached | 2,206 | 69.6% |
| Single Unit, Attached | 0 | 0.0% |
| 2 Unit Apartments | 192 | 6.0% |
| 3 or 4 Unit Apartments | 240 | 7.6% |
| 5 to 9 Unit Apartments | 73 | 2.3% |
| 10 or more Apartments | 100 | 3.2% |
| Mobile Home / Other | 360 | 11.4% |
| Total | 3,171 | 100.0% |
Housing Structures by Occupancy in Hope
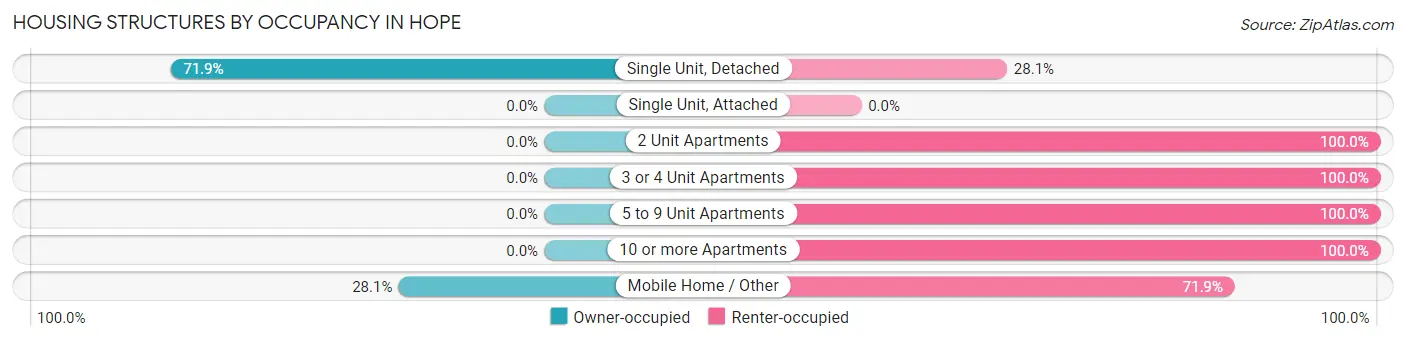
| Structure Type | Owner-occupied | Renter-occupied |
| Single Unit, Detached | 1,587 (71.9%) | 619 (28.1%) |
| Single Unit, Attached | 0 (0.0%) | 0 (0.0%) |
| 2 Unit Apartments | 0 (0.0%) | 192 (100.0%) |
| 3 or 4 Unit Apartments | 0 (0.0%) | 240 (100.0%) |
| 5 to 9 Unit Apartments | 0 (0.0%) | 73 (100.0%) |
| 10 or more Apartments | 0 (0.0%) | 100 (100.0%) |
| Mobile Home / Other | 101 (28.1%) | 259 (71.9%) |
| Total | 1,688 (53.2%) | 1,483 (46.8%) |
Housing Structures by Number of Rooms in Hope
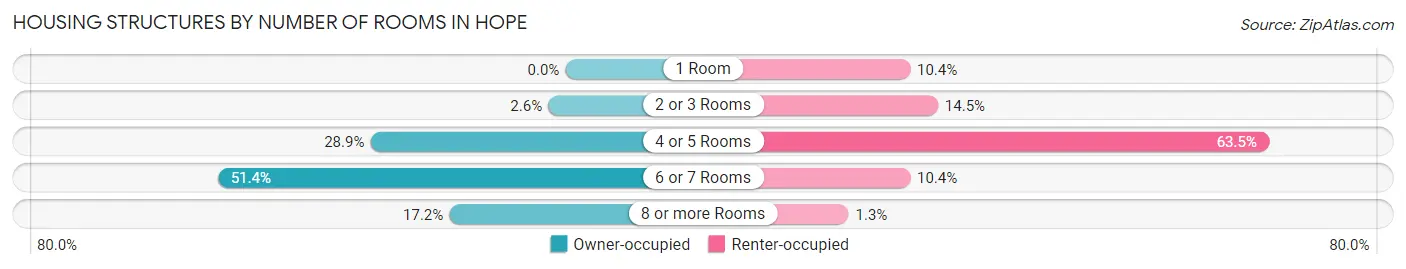
| Number of Rooms | Owner-occupied | Renter-occupied |
| 1 Room | 0 (0.0%) | 154 (10.4%) |
| 2 or 3 Rooms | 43 (2.5%) | 215 (14.5%) |
| 4 or 5 Rooms | 487 (28.8%) | 941 (63.4%) |
| 6 or 7 Rooms | 868 (51.4%) | 154 (10.4%) |
| 8 or more Rooms | 290 (17.2%) | 19 (1.3%) |
| Total | 1,688 (100.0%) | 1,483 (100.0%) |
Housing Structure by Heating Type in Hope
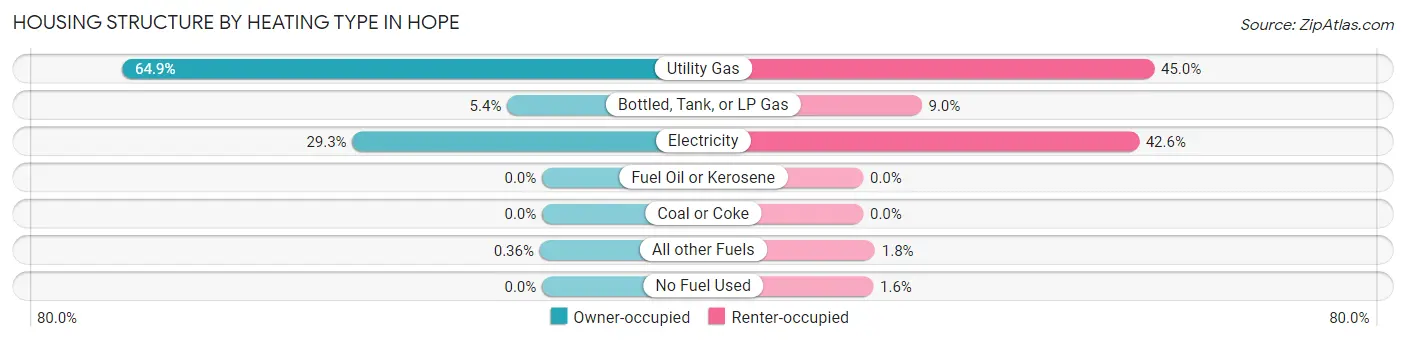
| Heating Type | Owner-occupied | Renter-occupied |
| Utility Gas | 1,096 (64.9%) | 667 (45.0%) |
| Bottled, Tank, or LP Gas | 91 (5.4%) | 134 (9.0%) |
| Electricity | 495 (29.3%) | 632 (42.6%) |
| Fuel Oil or Kerosene | 0 (0.0%) | 0 (0.0%) |
| Coal or Coke | 0 (0.0%) | 0 (0.0%) |
| All other Fuels | 6 (0.4%) | 27 (1.8%) |
| No Fuel Used | 0 (0.0%) | 23 (1.5%) |
| Total | 1,688 (100.0%) | 1,483 (100.0%) |
Household Vehicle Usage in Hope
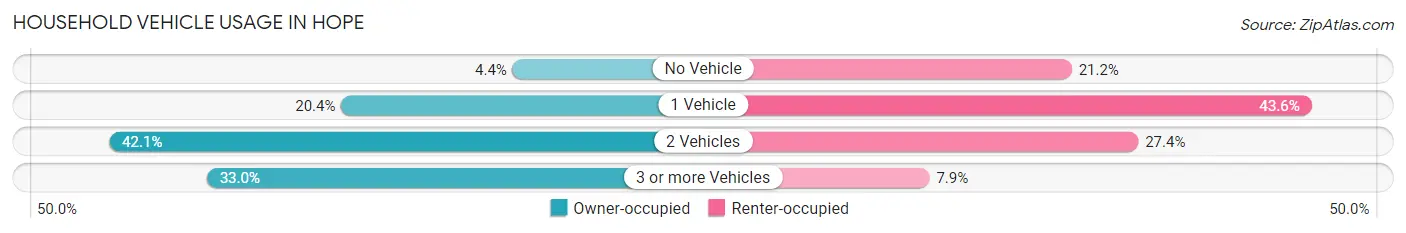
| Vehicles per Household | Owner-occupied | Renter-occupied |
| No Vehicle | 75 (4.4%) | 314 (21.2%) |
| 1 Vehicle | 345 (20.4%) | 646 (43.6%) |
| 2 Vehicles | 711 (42.1%) | 406 (27.4%) |
| 3 or more Vehicles | 557 (33.0%) | 117 (7.9%) |
| Total | 1,688 (100.0%) | 1,483 (100.0%) |
Real Estate & Mortgages in Hope
Real Estate and Mortgage Overview in Hope
| Characteristic | Without Mortgage | With Mortgage |
| Housing Units | 867 | 821 |
| Median Property Value | $85,600 | $105,900 |
| Median Household Income | $50,195 | $82 |
| Monthly Housing Costs | $370 | $24 |
| Real Estate Taxes | $517 | $43 |
Property Value by Mortgage Status in Hope
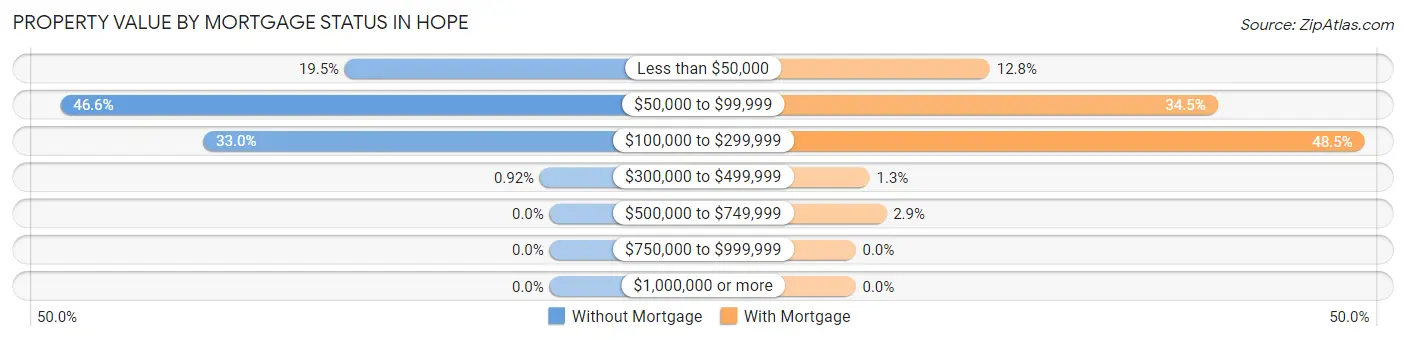
| Property Value | Without Mortgage | With Mortgage |
| Less than $50,000 | 169 (19.5%) | 105 (12.8%) |
| $50,000 to $99,999 | 404 (46.6%) | 283 (34.5%) |
| $100,000 to $299,999 | 286 (33.0%) | 398 (48.5%) |
| $300,000 to $499,999 | 8 (0.9%) | 11 (1.3%) |
| $500,000 to $749,999 | 0 (0.0%) | 24 (2.9%) |
| $750,000 to $999,999 | 0 (0.0%) | 0 (0.0%) |
| $1,000,000 or more | 0 (0.0%) | 0 (0.0%) |
| Total | 867 (100.0%) | 821 (100.0%) |
Household Income by Mortgage Status in Hope
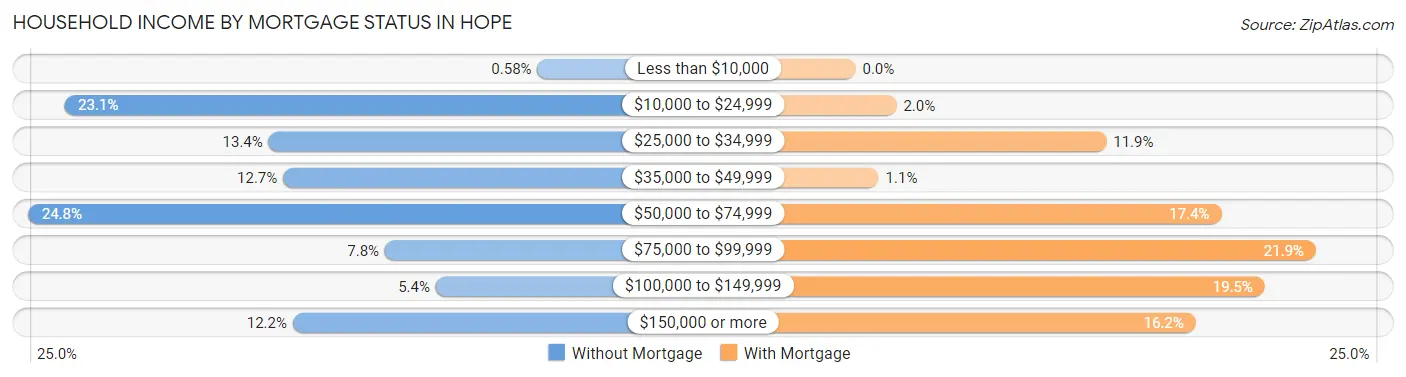
| Household Income | Without Mortgage | With Mortgage |
| Less than $10,000 | 5 (0.6%) | 0 (0.0%) |
| $10,000 to $24,999 | 200 (23.1%) | 16 (1.9%) |
| $25,000 to $34,999 | 116 (13.4%) | 98 (11.9%) |
| $35,000 to $49,999 | 110 (12.7%) | 9 (1.1%) |
| $50,000 to $74,999 | 215 (24.8%) | 143 (17.4%) |
| $75,000 to $99,999 | 68 (7.8%) | 180 (21.9%) |
| $100,000 to $149,999 | 47 (5.4%) | 160 (19.5%) |
| $150,000 or more | 106 (12.2%) | 133 (16.2%) |
| Total | 867 (100.0%) | 821 (100.0%) |
Property Value to Household Income Ratio in Hope
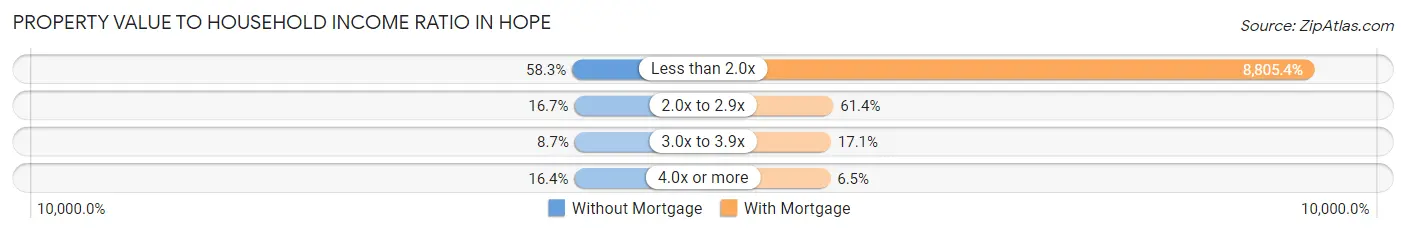
| Value-to-Income Ratio | Without Mortgage | With Mortgage |
| Less than 2.0x | 505 (58.3%) | 72,292 (8,805.4%) |
| 2.0x to 2.9x | 145 (16.7%) | 504 (61.4%) |
| 3.0x to 3.9x | 75 (8.6%) | 140 (17.1%) |
| 4.0x or more | 142 (16.4%) | 53 (6.5%) |
| Total | 867 (100.0%) | 821 (100.0%) |
Real Estate Taxes by Mortgage Status in Hope
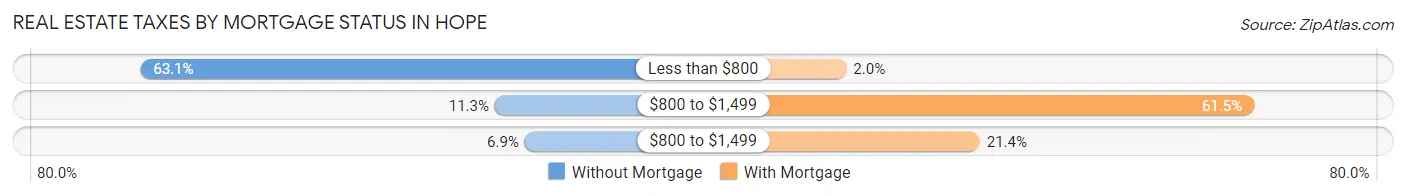
| Property Taxes | Without Mortgage | With Mortgage |
| Less than $800 | 547 (63.1%) | 16 (1.9%) |
| $800 to $1,499 | 98 (11.3%) | 505 (61.5%) |
| $800 to $1,499 | 60 (6.9%) | 176 (21.4%) |
| Total | 867 (100.0%) | 821 (100.0%) |
Health & Disability in Hope
Health Insurance Coverage by Age in Hope
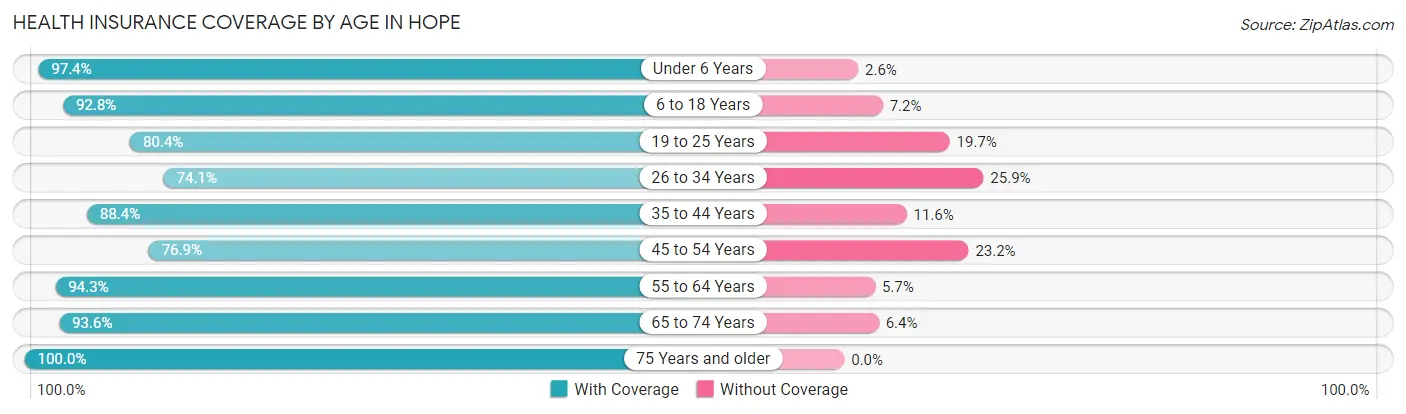
| Age Bracket | With Coverage | Without Coverage |
| Under 6 Years | 683 (97.4%) | 18 (2.6%) |
| 6 to 18 Years | 1,840 (92.8%) | 142 (7.2%) |
| 19 to 25 Years | 822 (80.3%) | 201 (19.7%) |
| 26 to 34 Years | 514 (74.1%) | 180 (25.9%) |
| 35 to 44 Years | 883 (88.4%) | 116 (11.6%) |
| 45 to 54 Years | 717 (76.8%) | 216 (23.2%) |
| 55 to 64 Years | 972 (94.3%) | 59 (5.7%) |
| 65 to 74 Years | 700 (93.6%) | 48 (6.4%) |
| 75 Years and older | 559 (100.0%) | 0 (0.0%) |
| Total | 7,690 (88.7%) | 980 (11.3%) |
Health Insurance Coverage by Citizenship Status in Hope
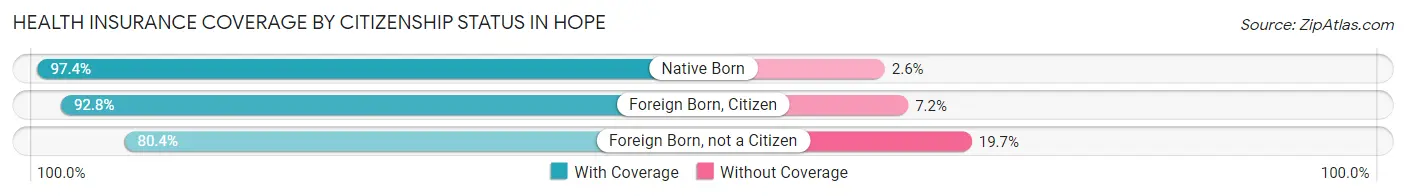
| Citizenship Status | With Coverage | Without Coverage |
| Native Born | 683 (97.4%) | 18 (2.6%) |
| Foreign Born, Citizen | 1,840 (92.8%) | 142 (7.2%) |
| Foreign Born, not a Citizen | 822 (80.3%) | 201 (19.7%) |
Health Insurance Coverage by Household Income in Hope
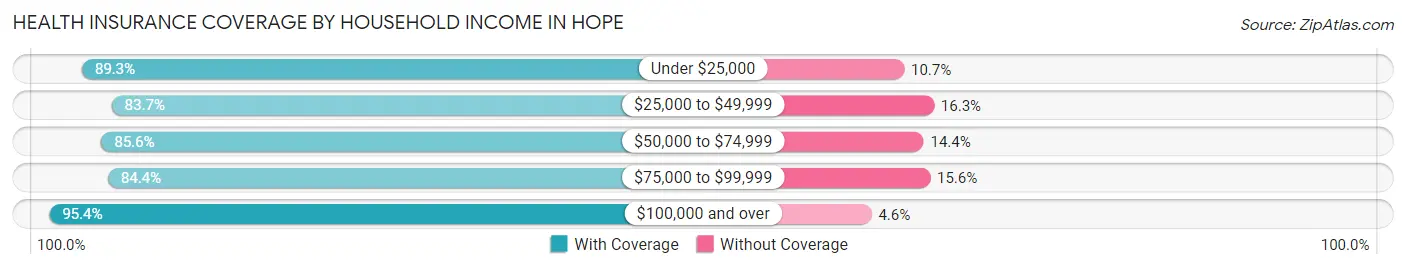
| Household Income | With Coverage | Without Coverage |
| Under $25,000 | 2,382 (89.3%) | 286 (10.7%) |
| $25,000 to $49,999 | 1,128 (83.7%) | 220 (16.3%) |
| $50,000 to $74,999 | 1,346 (85.6%) | 226 (14.4%) |
| $75,000 to $99,999 | 844 (84.4%) | 156 (15.6%) |
| $100,000 and over | 1,899 (95.4%) | 92 (4.6%) |
Public vs Private Health Insurance Coverage by Age in Hope
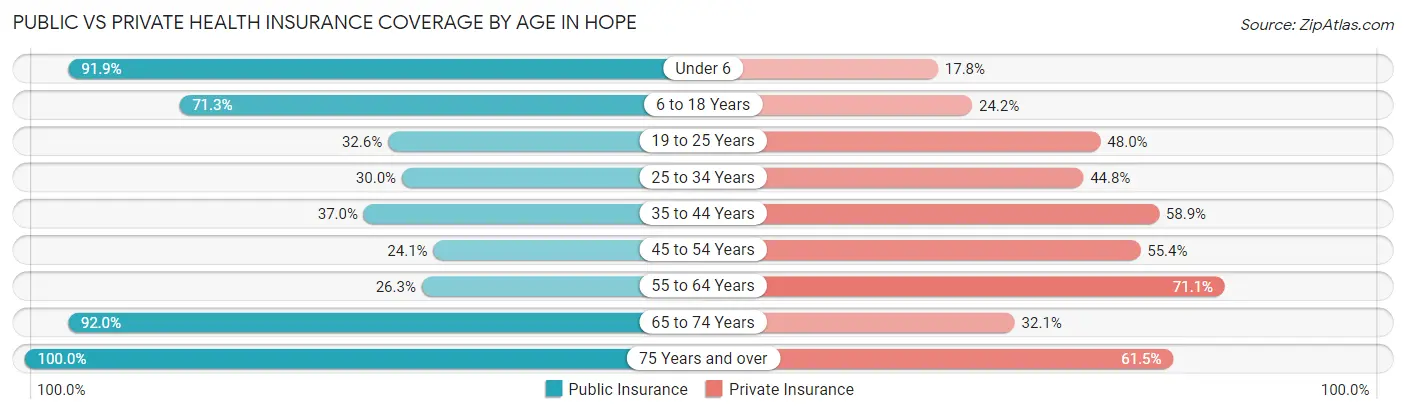
| Age Bracket | Public Insurance | Private Insurance |
| Under 6 | 644 (91.9%) | 125 (17.8%) |
| 6 to 18 Years | 1,413 (71.3%) | 479 (24.2%) |
| 19 to 25 Years | 333 (32.6%) | 491 (48.0%) |
| 25 to 34 Years | 208 (30.0%) | 311 (44.8%) |
| 35 to 44 Years | 370 (37.0%) | 588 (58.9%) |
| 45 to 54 Years | 225 (24.1%) | 517 (55.4%) |
| 55 to 64 Years | 271 (26.3%) | 733 (71.1%) |
| 65 to 74 Years | 688 (92.0%) | 240 (32.1%) |
| 75 Years and over | 559 (100.0%) | 344 (61.5%) |
| Total | 4,711 (54.3%) | 3,828 (44.2%) |
Disability Status by Sex by Age in Hope
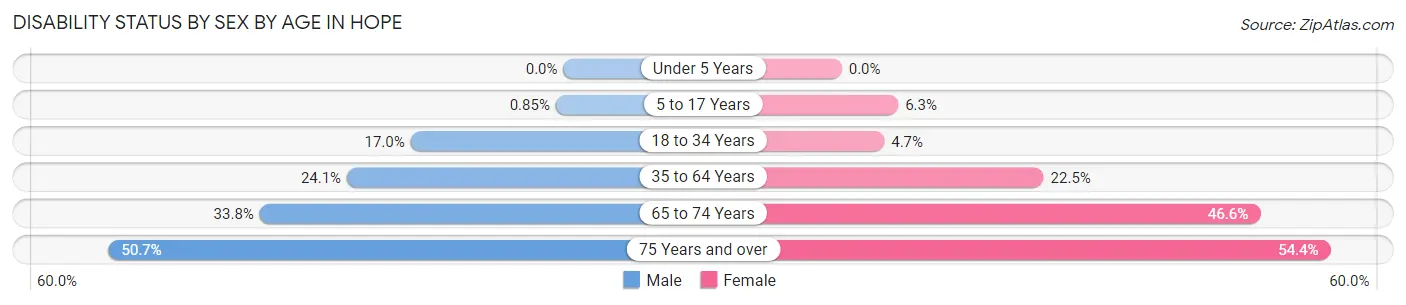
| Age Bracket | Male | Female |
| Under 5 Years | 0 (0.0%) | 0 (0.0%) |
| 5 to 17 Years | 9 (0.9%) | 59 (6.3%) |
| 18 to 34 Years | 184 (17.0%) | 35 (4.7%) |
| 35 to 64 Years | 313 (24.1%) | 374 (22.5%) |
| 65 to 74 Years | 70 (33.8%) | 252 (46.6%) |
| 75 Years and over | 151 (50.7%) | 142 (54.4%) |
Disability Class by Sex by Age in Hope
Disability Class: Hearing Difficulty
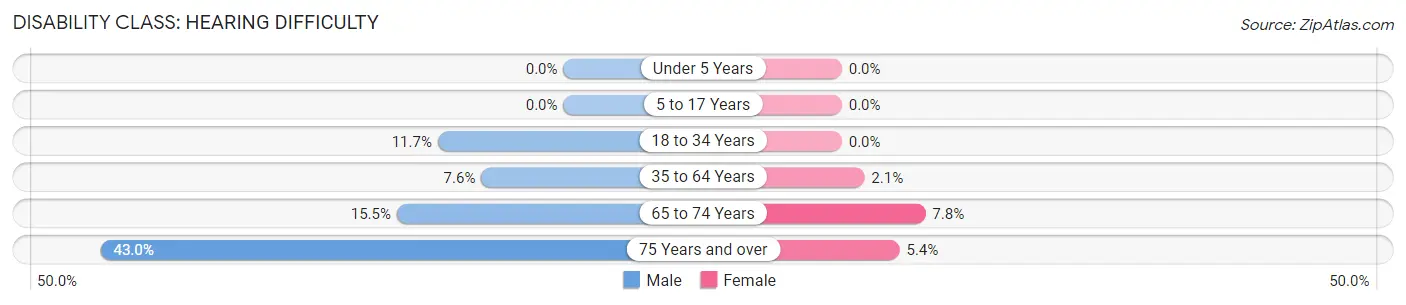
| Age Bracket | Male | Female |
| Under 5 Years | 0 (0.0%) | 0 (0.0%) |
| 5 to 17 Years | 0 (0.0%) | 0 (0.0%) |
| 18 to 34 Years | 126 (11.7%) | 0 (0.0%) |
| 35 to 64 Years | 99 (7.6%) | 35 (2.1%) |
| 65 to 74 Years | 32 (15.5%) | 42 (7.8%) |
| 75 Years and over | 128 (42.9%) | 14 (5.4%) |
Disability Class: Vision Difficulty
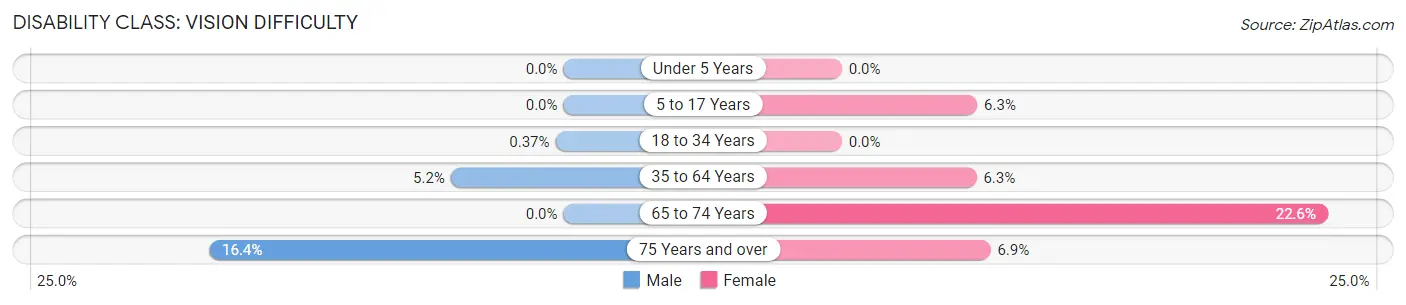
| Age Bracket | Male | Female |
| Under 5 Years | 0 (0.0%) | 0 (0.0%) |
| 5 to 17 Years | 0 (0.0%) | 59 (6.3%) |
| 18 to 34 Years | 4 (0.4%) | 0 (0.0%) |
| 35 to 64 Years | 68 (5.2%) | 104 (6.2%) |
| 65 to 74 Years | 0 (0.0%) | 122 (22.6%) |
| 75 Years and over | 49 (16.4%) | 18 (6.9%) |
Disability Class: Cognitive Difficulty
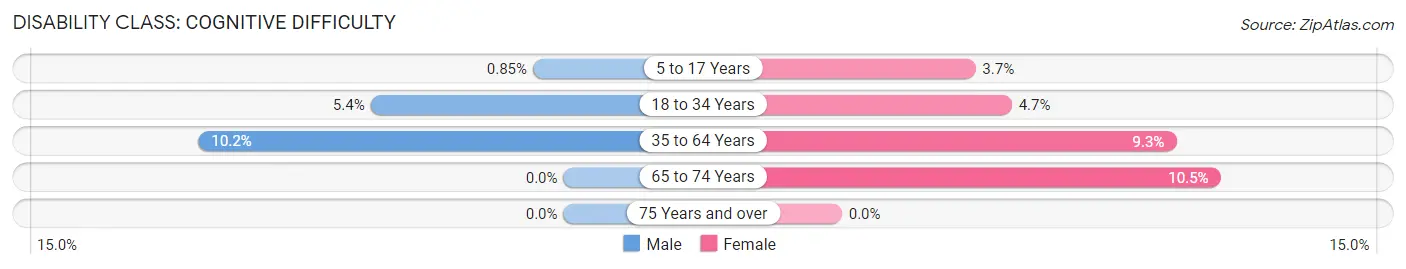
| Age Bracket | Male | Female |
| 5 to 17 Years | 9 (0.9%) | 35 (3.7%) |
| 18 to 34 Years | 58 (5.4%) | 35 (4.7%) |
| 35 to 64 Years | 132 (10.2%) | 155 (9.3%) |
| 65 to 74 Years | 0 (0.0%) | 57 (10.5%) |
| 75 Years and over | 0 (0.0%) | 0 (0.0%) |
Disability Class: Ambulatory Difficulty
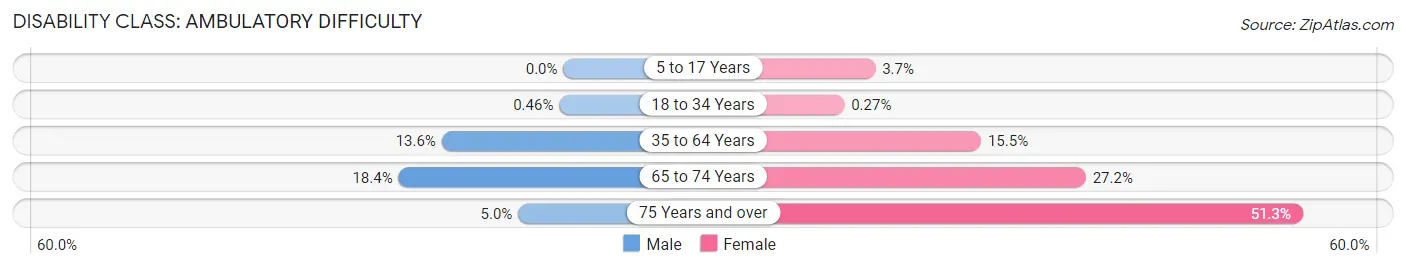
| Age Bracket | Male | Female |
| 5 to 17 Years | 0 (0.0%) | 35 (3.7%) |
| 18 to 34 Years | 5 (0.5%) | 2 (0.3%) |
| 35 to 64 Years | 176 (13.6%) | 258 (15.5%) |
| 65 to 74 Years | 38 (18.4%) | 147 (27.2%) |
| 75 Years and over | 15 (5.0%) | 134 (51.3%) |
Disability Class: Self-Care Difficulty
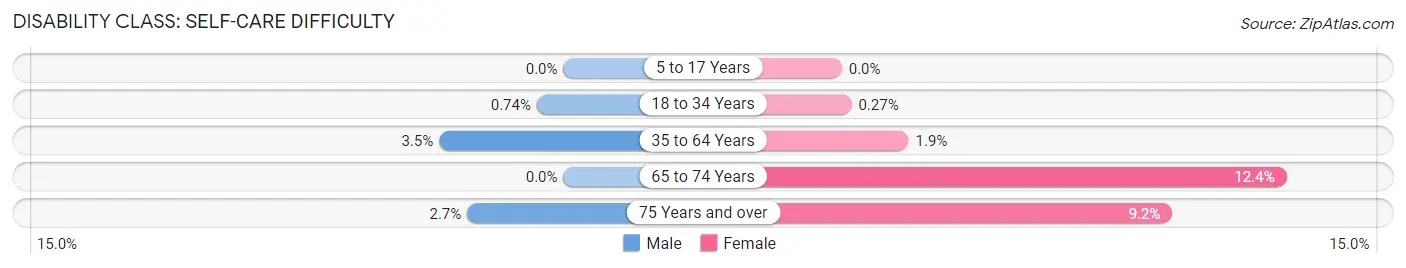
| Age Bracket | Male | Female |
| 5 to 17 Years | 0 (0.0%) | 0 (0.0%) |
| 18 to 34 Years | 8 (0.7%) | 2 (0.3%) |
| 35 to 64 Years | 45 (3.5%) | 31 (1.9%) |
| 65 to 74 Years | 0 (0.0%) | 67 (12.4%) |
| 75 Years and over | 8 (2.7%) | 24 (9.2%) |
Technology Access in Hope
Computing Device Access in Hope
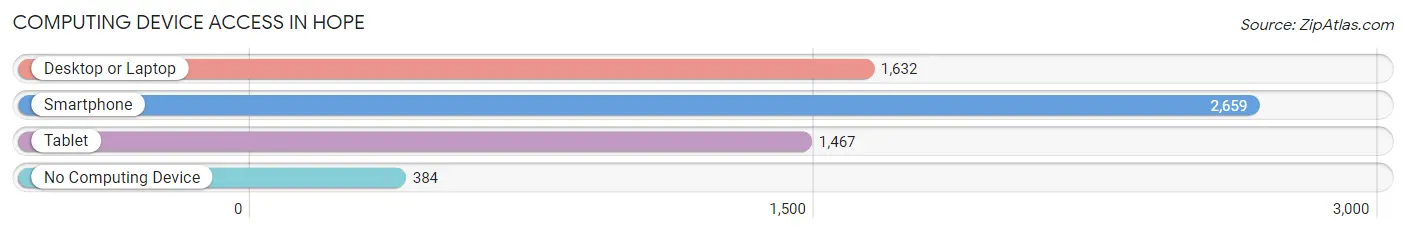
| Device Type | # Households | % Households |
| Desktop or Laptop | 1,632 | 51.5% |
| Smartphone | 2,659 | 83.9% |
| Tablet | 1,467 | 46.3% |
| No Computing Device | 384 | 12.1% |
| Total | 3,171 | 100.0% |
Internet Access in Hope
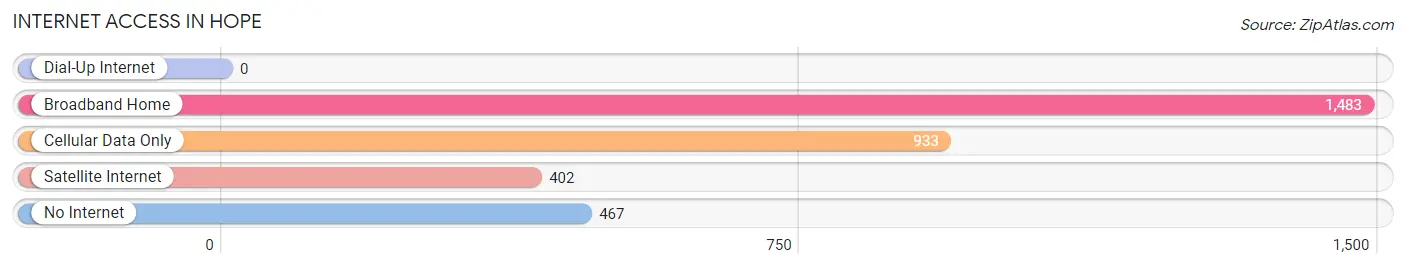
| Internet Type | # Households | % Households |
| Dial-Up Internet | 0 | 0.0% |
| Broadband Home | 1,483 | 46.8% |
| Cellular Data Only | 933 | 29.4% |
| Satellite Internet | 402 | 12.7% |
| No Internet | 467 | 14.7% |
| Total | 3,171 | 100.0% |
Hope Summary
Hope is a city located in Hempstead County, Arkansas, United States. It is the county seat of Hempstead County and the largest city in the county. The population was 10,095 at the 2010 census, an increase of 5.7 percent from the 2000 population of 9,555.
History
Hope was founded in 1873 by James Loughborough, a cotton farmer from Missouri. He named the city after his daughter, Hope Loughborough. The city was incorporated in 1875 and became the county seat of Hempstead County in 1876.
The city was a major center for cotton production and processing in the late 19th and early 20th centuries. The Hope Cotton Oil Mill, established in 1884, was the first cotton oil mill in the state. The city was also home to the first cotton gin in Arkansas, which was built in 1875.
In the early 20th century, Hope was a major railroad hub, with the St. Louis, Iron Mountain and Southern Railway, the Kansas City Southern Railway, and the Missouri Pacific Railroad all having lines that ran through the city.
Geography
Hope is located in southwestern Arkansas, approximately 30 miles east of the Texas border. It is situated in the Ouachita Mountains, a range of low mountains in the southwestern United States. The city is located at the intersection of U.S. Routes 67 and 278.
The city has a total area of 10.3 square miles, all of which is land. The climate is humid subtropical, with hot, humid summers and mild winters.
Economy
Hope is the economic center of Hempstead County. The city's economy is largely based on agriculture, with cotton, soybeans, and rice being the main crops. The city is also home to several manufacturing companies, including Tyson Foods, which has a large poultry processing plant in the city.
The city is also home to several retail stores, including Walmart, which has a large store in the city. The city is also home to several restaurants, including several fast food chains.
Demographics
As of the 2010 census, there were 10,095 people, 3,845 households, and 2,541 families residing in the city. The population density was 983.3 people per square mile. The racial makeup of the city was 57.3% White, 37.7% African American, 0.4% Native American, 0.7% Asian, 0.1% Pacific Islander, 1.7% from other races, and 2.1% from two or more races. Hispanic or Latino of any race were 4.2% of the population.
The median income for a household in the city was $27,917, and the median income for a family was $35,945. The per capita income for the city was $15,845. About 22.2% of families and 27.2% of the population were below the poverty line, including 37.2% of those under age 18 and 17.2% of those age 65 or over.
Common Questions
What is Per Capita Income in Hope?
Per Capita income in Hope is $26,157.
What is the Median Family Income in Hope?
Median Family Income in Hope is $56,506.
What is the Median Household income in Hope?
Median Household Income in Hope is $43,018.
What is Income or Wage Gap in Hope?
Income or Wage Gap in Hope is 19.9%.
Women in Hope earn 80.1 cents for every dollar earned by a man.
What is Inequality or Gini Index in Hope?
Inequality or Gini Index in Hope is 0.52.
What is the Total Population of Hope?
Total Population of Hope is 8,921.
What is the Total Male Population of Hope?
Total Male Population of Hope is 4,484.
What is the Total Female Population of Hope?
Total Female Population of Hope is 4,437.
What is the Ratio of Males per 100 Females in Hope?
There are 101.06 Males per 100 Females in Hope.
What is the Ratio of Females per 100 Males in Hope?
There are 98.95 Females per 100 Males in Hope.
What is the Median Population Age in Hope?
Median Population Age in Hope is 36.2 Years.
What is the Average Family Size in Hope
Average Family Size in Hope is 3.6 People.
What is the Average Household Size in Hope
Average Household Size in Hope is 2.7 People.
How Large is the Labor Force in Hope?
There are 3,710 People in the Labor Forcein in Hope.
What is the Percentage of People in the Labor Force in Hope?
56.2% of People are in the Labor Force in Hope.
What is the Unemployment Rate in Hope?
Unemployment Rate in Hope is 3.9%.