Higden, AR Map & Demographics
Higden Map
Higden Overview
$39,534
PER CAPITA INCOME
$57,188
AVG HOUSEHOLD INCOME
0.42
INEQUALITY / GINI INDEX
94
TOTAL POPULATION
39
MALE POPULATION
55
FEMALE POPULATION
70.91
MALES / 100 FEMALES
141.03
FEMALES / 100 MALES
61.7
MEDIAN AGE
2.3
AVG FAMILY SIZE
2.1
AVG HOUSEHOLD SIZE
37
LABOR FORCE [ PEOPLE ]
46.3%
PERCENT IN LABOR FORCE
18.9%
UNEMPLOYMENT RATE
Higden Zip Codes
Higden Area Codes
Income in Higden
Income Overview in Higden
| Characteristic | Number | Measure |
| Per Capita Income | 94 | $39,534 |
| Median Family Income | 29 | $0 |
| Mean Family Income | 29 | $112,679 |
| Median Household Income | 45 | $57,188 |
| Mean Household Income | 45 | $91,082 |
| Income Deficit | 29 | $0 |
| Wage / Income Gap (%) | 94 | 0.00% |
| Wage / Income Gap ($) | 94 | 100.00¢ per $1 |
| Gini / Inequality Index | 94 | 0.42 |
Earnings by Sex in Higden
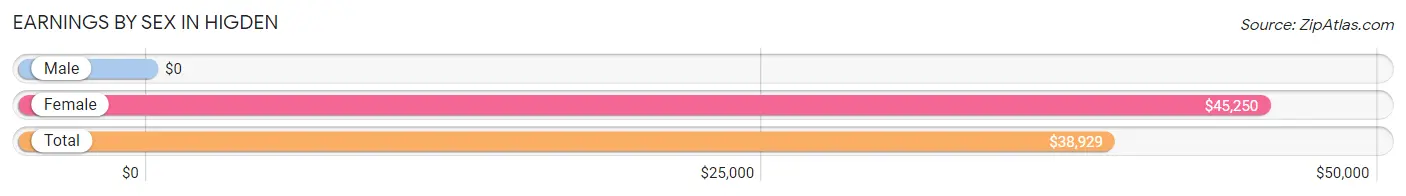
| Sex | Number | Average Earnings |
| Male | 15 (39.5%) | $0 |
| Female | 23 (60.5%) | $45,250 |
| Total | 38 (100.0%) | $38,929 |
Earnings by Sex by Income Bracket in Higden
The most common earnings brackets in Higden are $15,000 to $17,499 for men (6 | 40.0%) and $25,000 to $29,999 for women (7 | 30.4%).
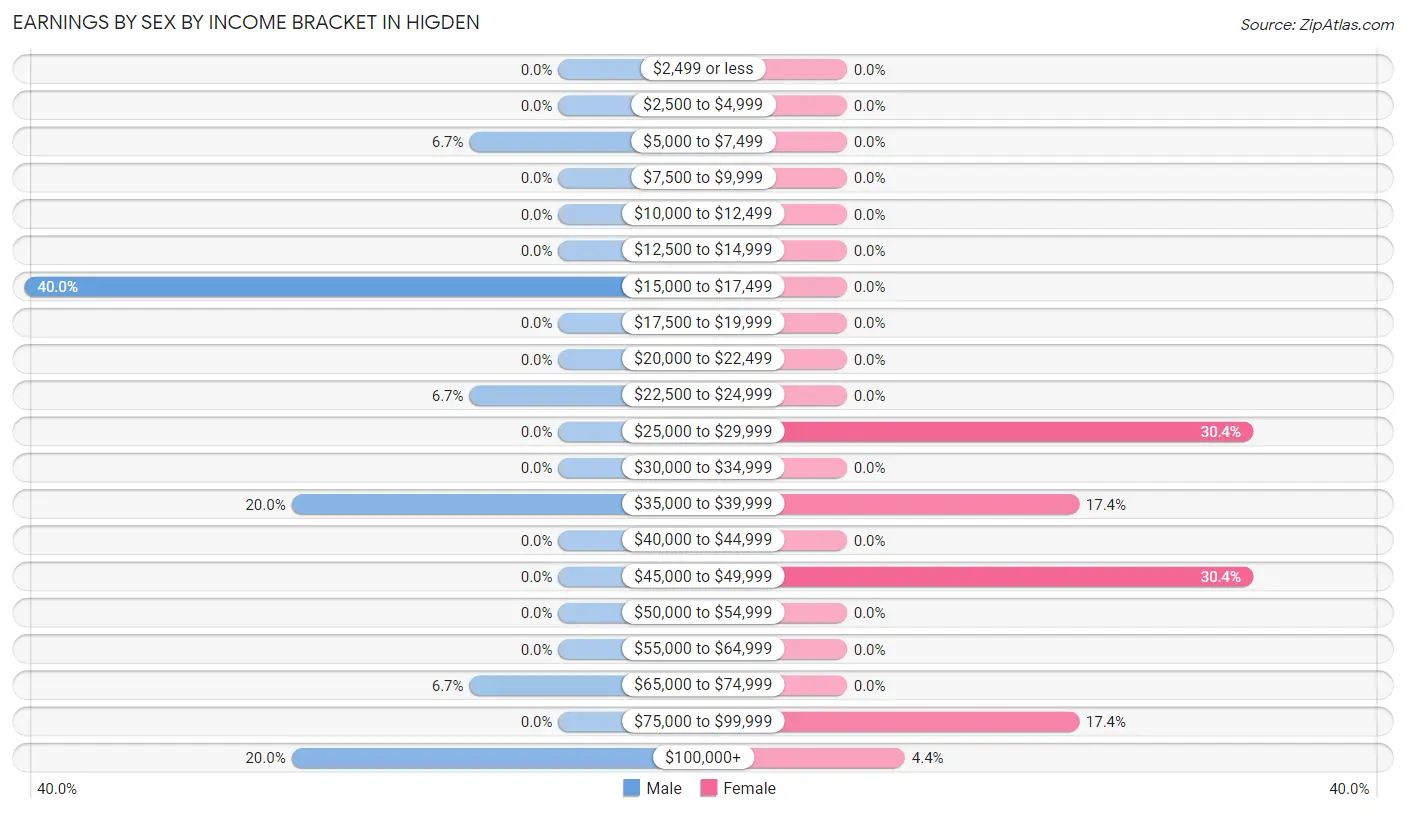
| Income | Male | Female |
| $2,499 or less | 0 (0.0%) | 0 (0.0%) |
| $2,500 to $4,999 | 0 (0.0%) | 0 (0.0%) |
| $5,000 to $7,499 | 1 (6.7%) | 0 (0.0%) |
| $7,500 to $9,999 | 0 (0.0%) | 0 (0.0%) |
| $10,000 to $12,499 | 0 (0.0%) | 0 (0.0%) |
| $12,500 to $14,999 | 0 (0.0%) | 0 (0.0%) |
| $15,000 to $17,499 | 6 (40.0%) | 0 (0.0%) |
| $17,500 to $19,999 | 0 (0.0%) | 0 (0.0%) |
| $20,000 to $22,499 | 0 (0.0%) | 0 (0.0%) |
| $22,500 to $24,999 | 1 (6.7%) | 0 (0.0%) |
| $25,000 to $29,999 | 0 (0.0%) | 7 (30.4%) |
| $30,000 to $34,999 | 0 (0.0%) | 0 (0.0%) |
| $35,000 to $39,999 | 3 (20.0%) | 4 (17.4%) |
| $40,000 to $44,999 | 0 (0.0%) | 0 (0.0%) |
| $45,000 to $49,999 | 0 (0.0%) | 7 (30.4%) |
| $50,000 to $54,999 | 0 (0.0%) | 0 (0.0%) |
| $55,000 to $64,999 | 0 (0.0%) | 0 (0.0%) |
| $65,000 to $74,999 | 1 (6.7%) | 0 (0.0%) |
| $75,000 to $99,999 | 0 (0.0%) | 4 (17.4%) |
| $100,000+ | 3 (20.0%) | 1 (4.3%) |
| Total | 15 (100.0%) | 23 (100.0%) |
Earnings by Sex by Educational Attainment in Higden
| Educational Attainment | Male Income | Female Income |
| Less than High School | - | - |
| High School Diploma | - | - |
| College or Associate's Degree | - | - |
| Bachelor's Degree | - | - |
| Graduate Degree | - | - |
| Total | - | - |
Family Income in Higden
Family Income Brackets in Higden
According to the Higden family income data, there are 12 families falling into the $35,000 to $49,999 income range, which is the most common income bracket and makes up 41.4% of all families.
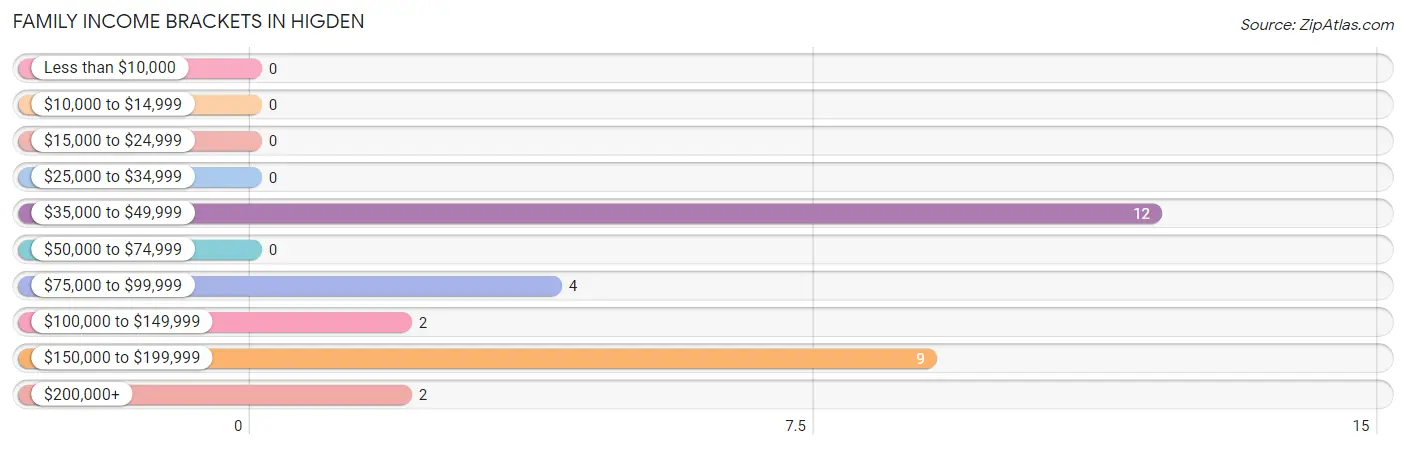
| Income Bracket | # Families | % Families |
| Less than $10,000 | 0 | 0.0% |
| $10,000 to $14,999 | 0 | 0.0% |
| $15,000 to $24,999 | 0 | 0.0% |
| $25,000 to $34,999 | 0 | 0.0% |
| $35,000 to $49,999 | 12 | 41.4% |
| $50,000 to $74,999 | 0 | 0.0% |
| $75,000 to $99,999 | 4 | 13.8% |
| $100,000 to $149,999 | 2 | 6.9% |
| $150,000 to $199,999 | 9 | 31.0% |
| $200,000+ | 2 | 6.9% |
Family Income by Famaliy Size in Higden
| Income Bracket | # Families | Median Income |
| 2-Person Families | 20 (69.0%) | $0 |
| 3-Person Families | 4 (13.8%) | $0 |
| 4-Person Families | 0 (0.0%) | $0 |
| 5-Person Families | 5 (17.2%) | $0 |
| 6-Person Families | 0 (0.0%) | $0 |
| 7+ Person Families | 0 (0.0%) | $0 |
| Total | 29 (100.0%) | $0 |
Family Income by Number of Earners in Higden
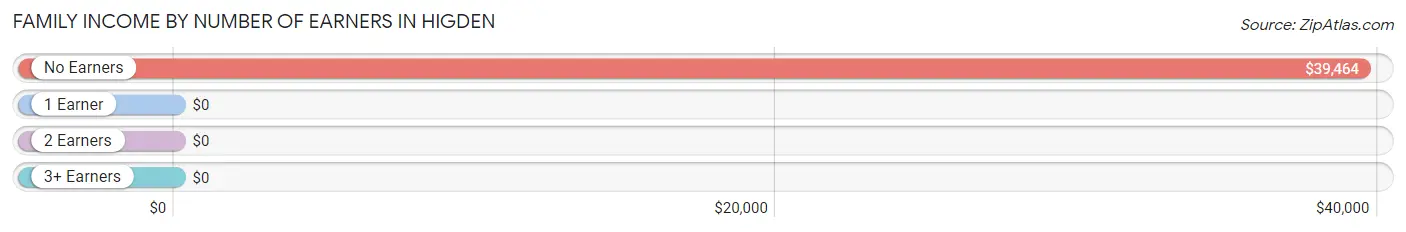
| Number of Earners | # Families | Median Income |
| No Earners | 11 (37.9%) | $39,464 |
| 1 Earner | 9 (31.0%) | $0 |
| 2 Earners | 4 (13.8%) | $0 |
| 3+ Earners | 5 (17.2%) | $0 |
| Total | 29 (100.0%) | $0 |
Household Income in Higden
Household Income Brackets in Higden
With 11 households falling in the category, the $35,000 to $49,999 income range is the most frequent in Higden, accounting for 24.4% of all households.
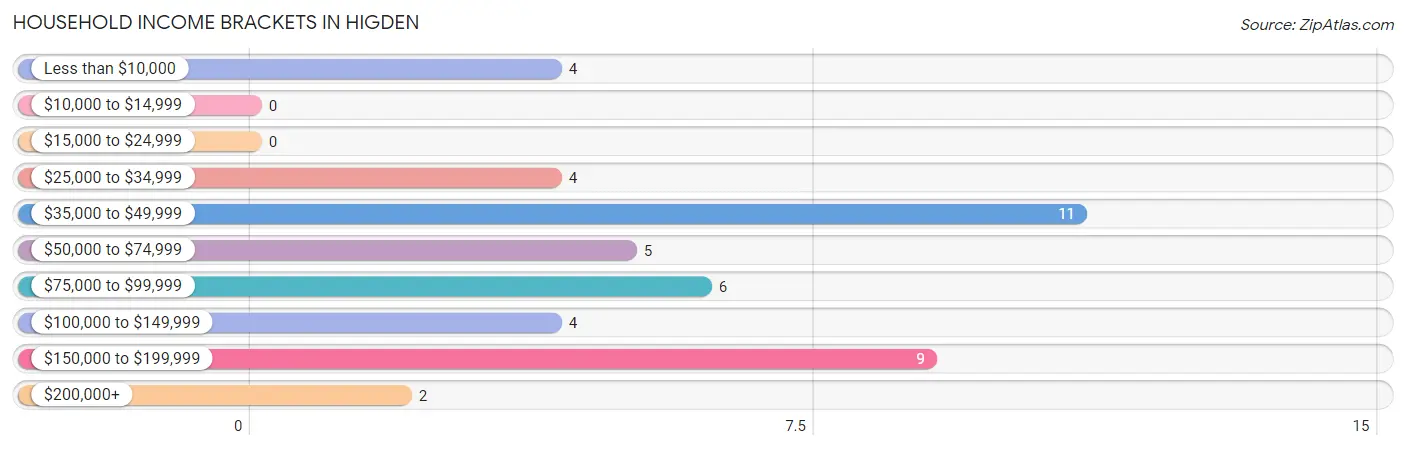
| Income Bracket | # Households | % Households |
| Less than $10,000 | 4 | 8.9% |
| $10,000 to $14,999 | 0 | 0.0% |
| $15,000 to $24,999 | 0 | 0.0% |
| $25,000 to $34,999 | 4 | 8.9% |
| $35,000 to $49,999 | 11 | 24.4% |
| $50,000 to $74,999 | 5 | 11.1% |
| $75,000 to $99,999 | 6 | 13.3% |
| $100,000 to $149,999 | 4 | 8.9% |
| $150,000 to $199,999 | 9 | 20.0% |
| $200,000+ | 2 | 4.4% |
Household Income by Householder Age in Higden
The median household income in Higden is $57,188, with the highest median household income of $103,750 found in the 45 to 64 years age bracket for the primary householder. A total of 10 households (22.2%) fall into this category.
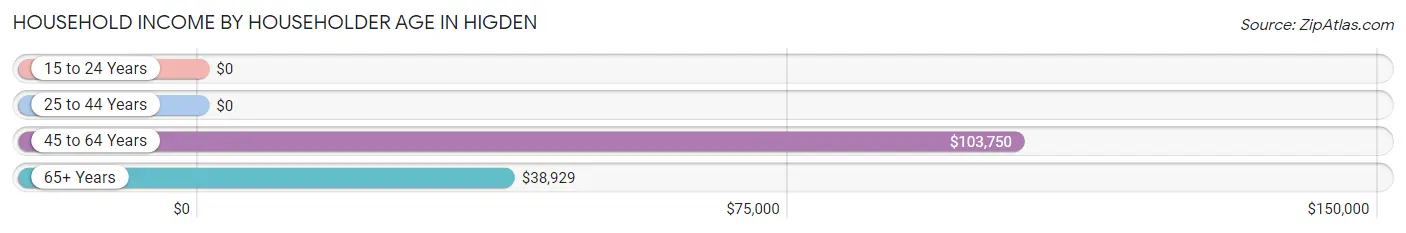
| Income Bracket | # Households | Median Income |
| 15 to 24 Years | 0 (0.0%) | $0 |
| 25 to 44 Years | 11 (24.4%) | $0 |
| 45 to 64 Years | 10 (22.2%) | $103,750 |
| 65+ Years | 24 (53.3%) | $38,929 |
| Total | 45 (100.0%) | $57,188 |
Poverty in Higden
Income Below Poverty by Sex and Age in Higden
With 10.3% poverty level for males and 7.3% for females among the residents of Higden, 65 to 74 year old males and 65 to 74 year old females are the most vulnerable to poverty, with 4 males (36.4%) and 4 females (22.2%) in their respective age groups living below the poverty level.
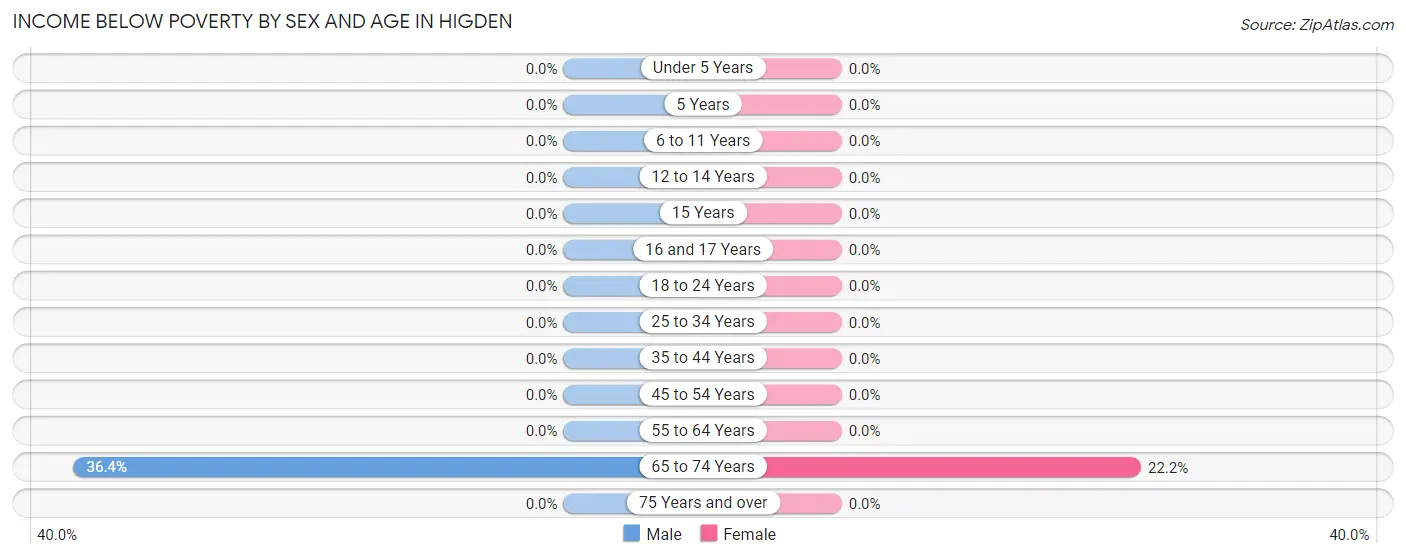
| Age Bracket | Male | Female |
| Under 5 Years | 0 (0.0%) | 0 (0.0%) |
| 5 Years | 0 (0.0%) | 0 (0.0%) |
| 6 to 11 Years | 0 (0.0%) | 0 (0.0%) |
| 12 to 14 Years | 0 (0.0%) | 0 (0.0%) |
| 15 Years | 0 (0.0%) | 0 (0.0%) |
| 16 and 17 Years | 0 (0.0%) | 0 (0.0%) |
| 18 to 24 Years | 0 (0.0%) | 0 (0.0%) |
| 25 to 34 Years | 0 (0.0%) | 0 (0.0%) |
| 35 to 44 Years | 0 (0.0%) | 0 (0.0%) |
| 45 to 54 Years | 0 (0.0%) | 0 (0.0%) |
| 55 to 64 Years | 0 (0.0%) | 0 (0.0%) |
| 65 to 74 Years | 4 (36.4%) | 4 (22.2%) |
| 75 Years and over | 0 (0.0%) | 0 (0.0%) |
| Total | 4 (10.3%) | 4 (7.3%) |
Income Above Poverty by Sex and Age in Higden
According to the poverty statistics in Higden, males aged 6 to 11 years and females aged 12 to 14 years are the age groups that are most secure financially, with 100.0% of males and 100.0% of females in these age groups living above the poverty line.
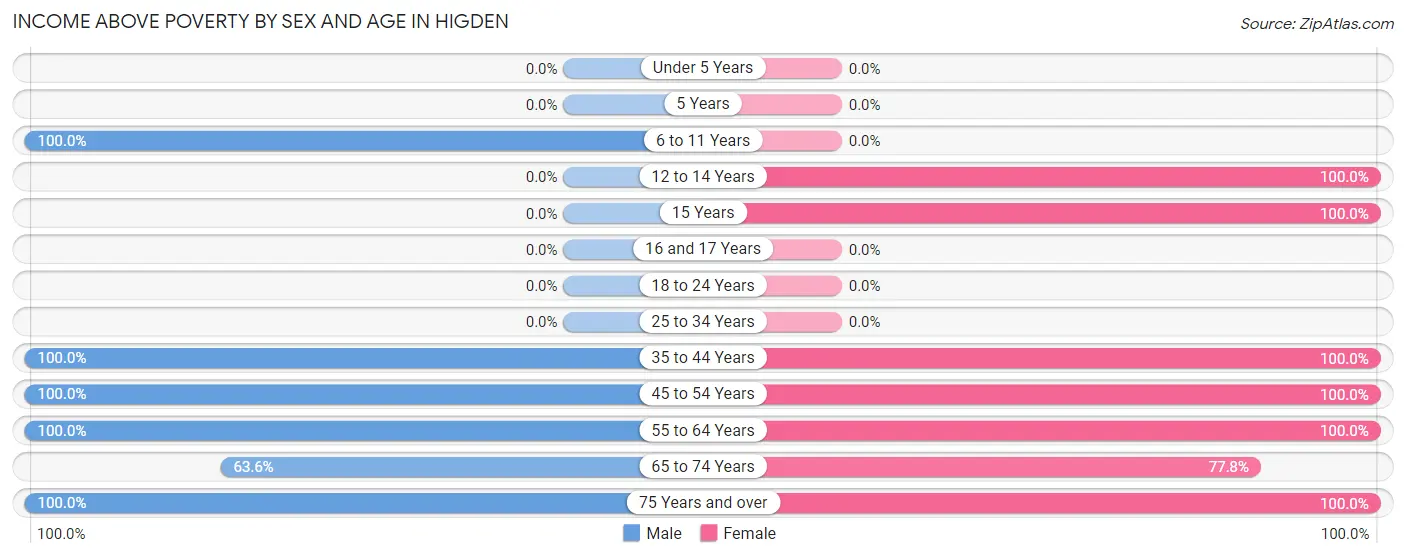
| Age Bracket | Male | Female |
| Under 5 Years | 0 (0.0%) | 0 (0.0%) |
| 5 Years | 0 (0.0%) | 0 (0.0%) |
| 6 to 11 Years | 3 (100.0%) | 0 (0.0%) |
| 12 to 14 Years | 0 (0.0%) | 6 (100.0%) |
| 15 Years | 0 (0.0%) | 5 (100.0%) |
| 16 and 17 Years | 0 (0.0%) | 0 (0.0%) |
| 18 to 24 Years | 0 (0.0%) | 0 (0.0%) |
| 25 to 34 Years | 0 (0.0%) | 0 (0.0%) |
| 35 to 44 Years | 6 (100.0%) | 11 (100.0%) |
| 45 to 54 Years | 3 (100.0%) | 3 (100.0%) |
| 55 to 64 Years | 8 (100.0%) | 5 (100.0%) |
| 65 to 74 Years | 7 (63.6%) | 14 (77.8%) |
| 75 Years and over | 8 (100.0%) | 7 (100.0%) |
| Total | 35 (89.7%) | 51 (92.7%) |
Income Below Poverty Among Married-Couple Families in Higden
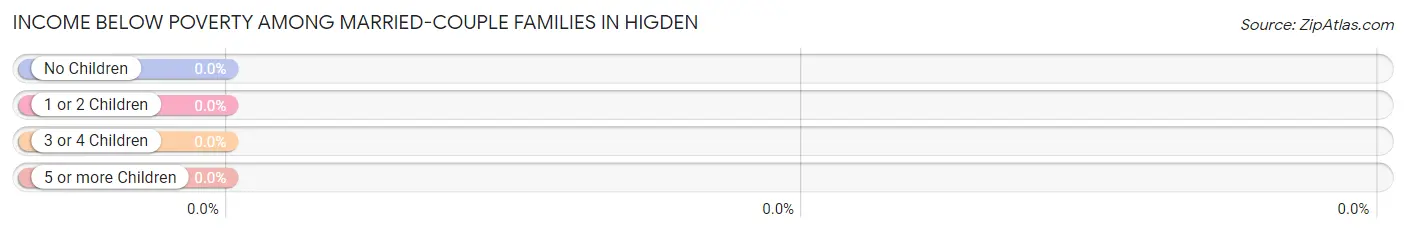
| Children | Above Poverty | Below Poverty |
| No Children | 20 (100.0%) | 0 (0.0%) |
| 1 or 2 Children | 5 (100.0%) | 0 (0.0%) |
| 3 or 4 Children | 0 (0.0%) | 0 (0.0%) |
| 5 or more Children | 0 (0.0%) | 0 (0.0%) |
| Total | 25 (100.0%) | 0 (0.0%) |
Income Below Poverty Among Single-Parent Households in Higden
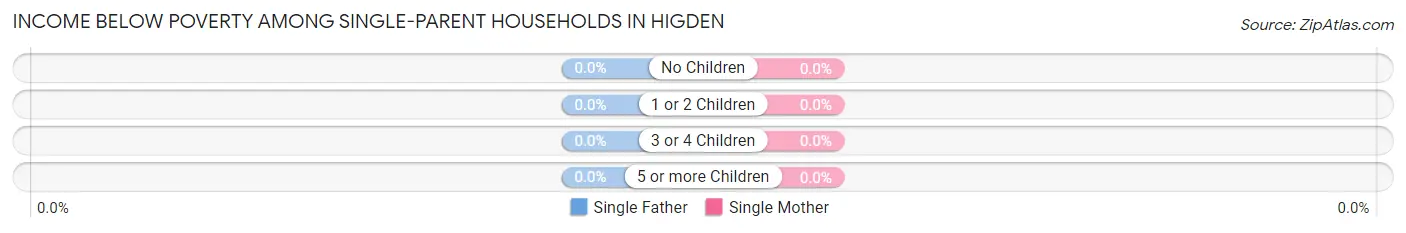
| Children | Single Father | Single Mother |
| No Children | 0 (0.0%) | 0 (0.0%) |
| 1 or 2 Children | 0 (0.0%) | 0 (0.0%) |
| 3 or 4 Children | 0 (0.0%) | 0 (0.0%) |
| 5 or more Children | 0 (0.0%) | 0 (0.0%) |
| Total | 0 (0.0%) | 0 (0.0%) |
Income Below Poverty Among Married-Couple vs Single-Parent Households in Higden
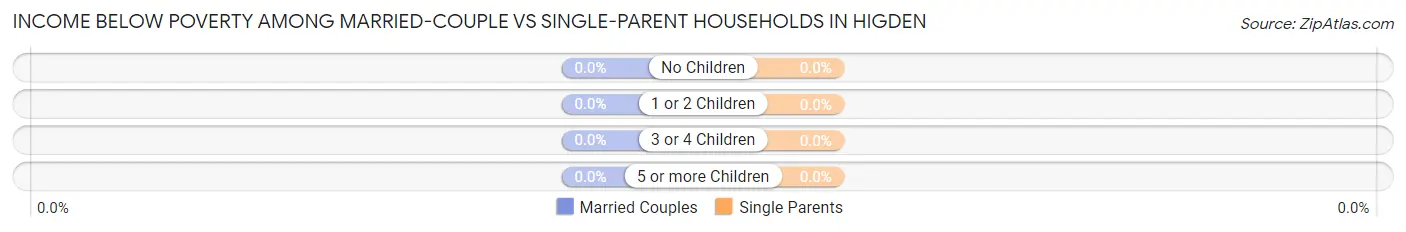
| Children | Married-Couple Families | Single-Parent Households |
| No Children | 0 (0.0%) | 0 (0.0%) |
| 1 or 2 Children | 0 (0.0%) | 0 (0.0%) |
| 3 or 4 Children | 0 (0.0%) | 0 (0.0%) |
| 5 or more Children | 0 (0.0%) | 0 (0.0%) |
| Total | 0 (0.0%) | 0 (0.0%) |
Race in Higden
The most populous races in Higden are , and White / Caucasian (94 | 100.0%).
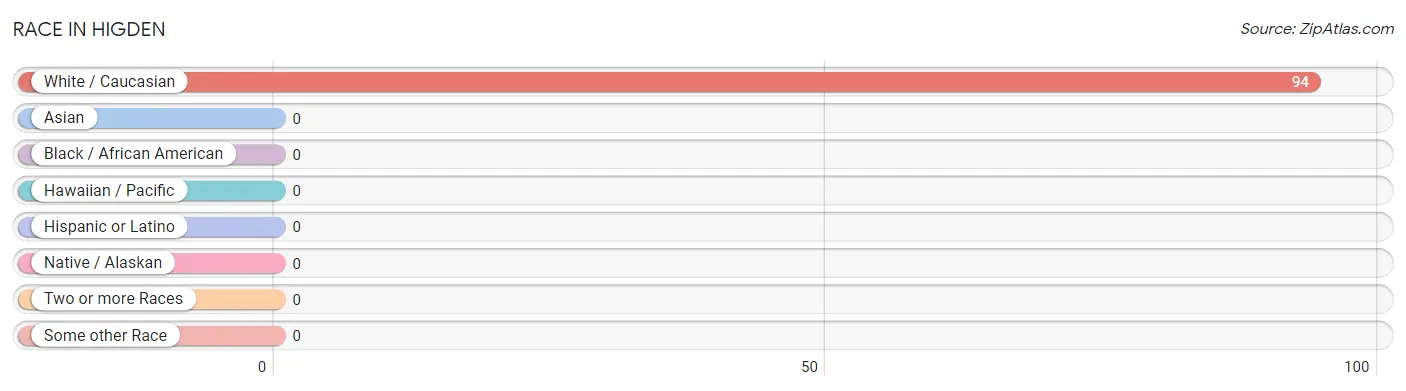
| Race | # Population | % Population |
| Asian | 0 | 0.0% |
| Black / African American | 0 | 0.0% |
| Hawaiian / Pacific | 0 | 0.0% |
| Hispanic or Latino | 0 | 0.0% |
| Native / Alaskan | 0 | 0.0% |
| White / Caucasian | 94 | 100.0% |
| Two or more Races | 0 | 0.0% |
| Some other Race | 0 | 0.0% |
| Total | 94 | 100.0% |
Ancestry in Higden
The most populous ancestries reported in Higden are English (27 | 28.7%), American (20 | 21.3%), German (6 | 6.4%), Irish (2 | 2.1%), and Polish (2 | 2.1%), together accounting for 60.6% of all Higden residents.
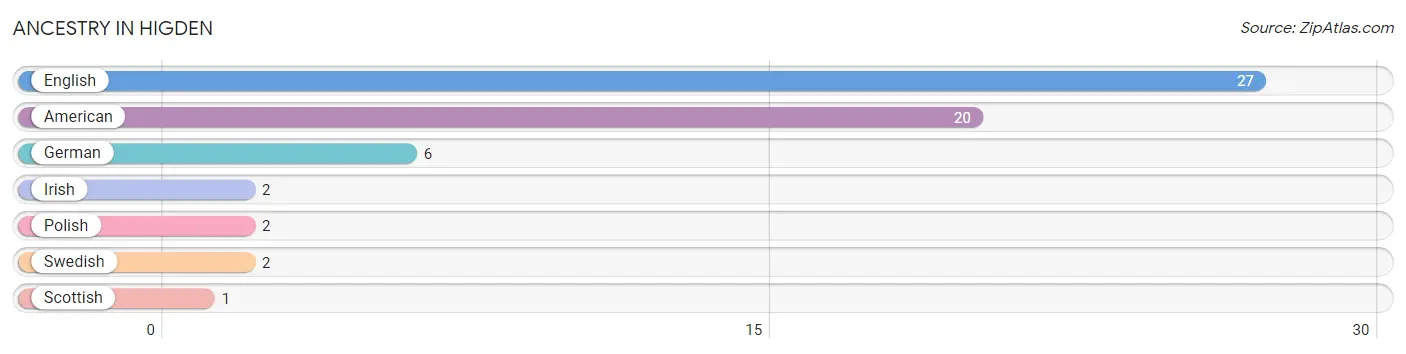
| Ancestry | # Population | % Population |
| American | 20 | 21.3% |
| English | 27 | 28.7% |
| German | 6 | 6.4% |
| Irish | 2 | 2.1% |
| Polish | 2 | 2.1% |
| Scottish | 1 | 1.1% |
| Swedish | 2 | 2.1% | View All 7 Rows |
Immigrants in Higden

| Immigration Origin | # Population | % Population | View All 0 Rows |
Sex and Age in Higden
Sex and Age in Higden
The most populous age groups in Higden are 60 to 64 Years (7 | 17.9%) for men and 65 to 69 Years (14 | 25.5%) for women.
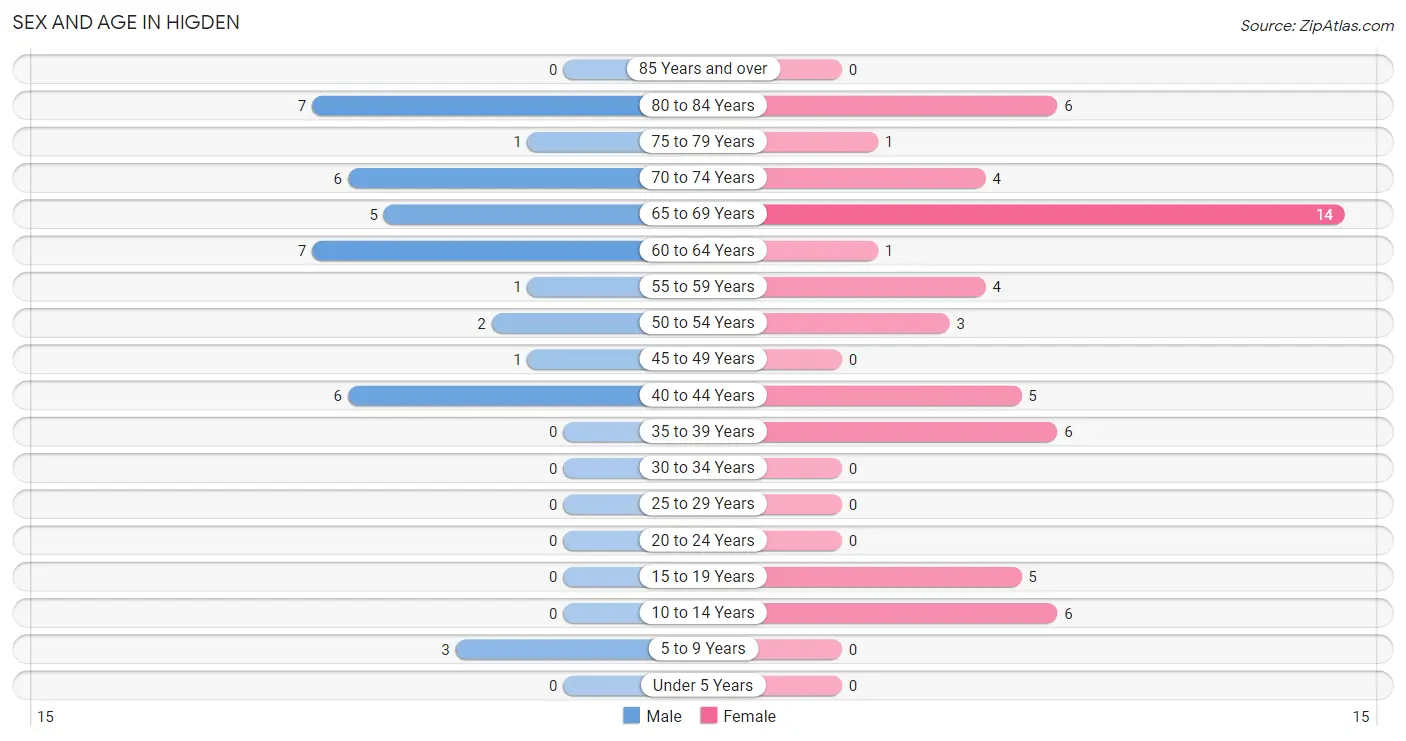
| Age Bracket | Male | Female |
| Under 5 Years | 0 (0.0%) | 0 (0.0%) |
| 5 to 9 Years | 3 (7.7%) | 0 (0.0%) |
| 10 to 14 Years | 0 (0.0%) | 6 (10.9%) |
| 15 to 19 Years | 0 (0.0%) | 5 (9.1%) |
| 20 to 24 Years | 0 (0.0%) | 0 (0.0%) |
| 25 to 29 Years | 0 (0.0%) | 0 (0.0%) |
| 30 to 34 Years | 0 (0.0%) | 0 (0.0%) |
| 35 to 39 Years | 0 (0.0%) | 6 (10.9%) |
| 40 to 44 Years | 6 (15.4%) | 5 (9.1%) |
| 45 to 49 Years | 1 (2.6%) | 0 (0.0%) |
| 50 to 54 Years | 2 (5.1%) | 3 (5.4%) |
| 55 to 59 Years | 1 (2.6%) | 4 (7.3%) |
| 60 to 64 Years | 7 (17.9%) | 1 (1.8%) |
| 65 to 69 Years | 5 (12.8%) | 14 (25.5%) |
| 70 to 74 Years | 6 (15.4%) | 4 (7.3%) |
| 75 to 79 Years | 1 (2.6%) | 1 (1.8%) |
| 80 to 84 Years | 7 (17.9%) | 6 (10.9%) |
| 85 Years and over | 0 (0.0%) | 0 (0.0%) |
| Total | 39 (100.0%) | 55 (100.0%) |
Families and Households in Higden
Median Family Size in Higden
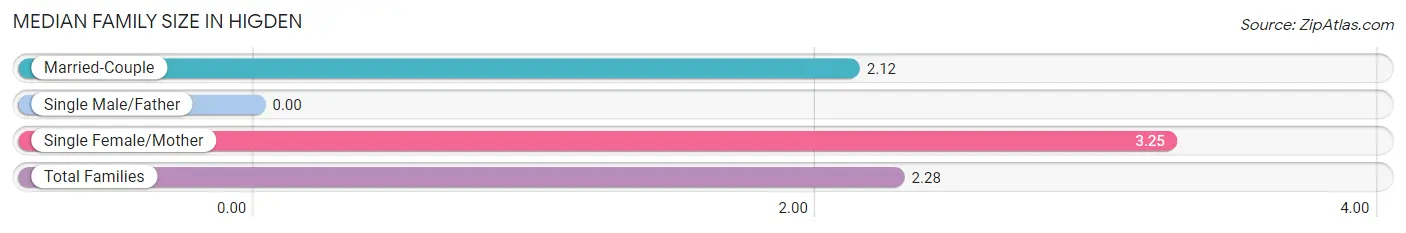
| Family Type | # Families | Family Size |
| Married-Couple | 25 (86.2%) | 2.12 |
| Single Male/Father | 0 (0.0%) | - |
| Single Female/Mother | 4 (13.8%) | 3.25 |
| Total Families | 29 (100.0%) | 2.28 |
Median Household Size in Higden
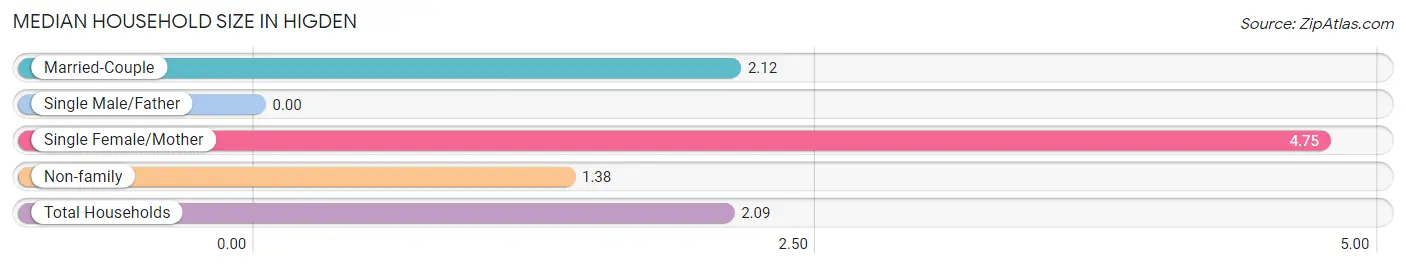
| Household Type | # Households | Household Size |
| Married-Couple | 25 (55.6%) | 2.12 |
| Single Male/Father | 0 (0.0%) | - |
| Single Female/Mother | 4 (8.9%) | 4.75 |
| Non-family | 16 (35.6%) | 1.38 |
| Total Households | 45 (100.0%) | 2.09 |
Household Size by Marriage Status in Higden
Out of a total of 45 households in Higden, 29 (64.4%) are family households, while 16 (35.6%) are nonfamily households. The most numerous type of family households are 2-person households, comprising 20, and the most common type of nonfamily households are 1-person households, comprising 11.
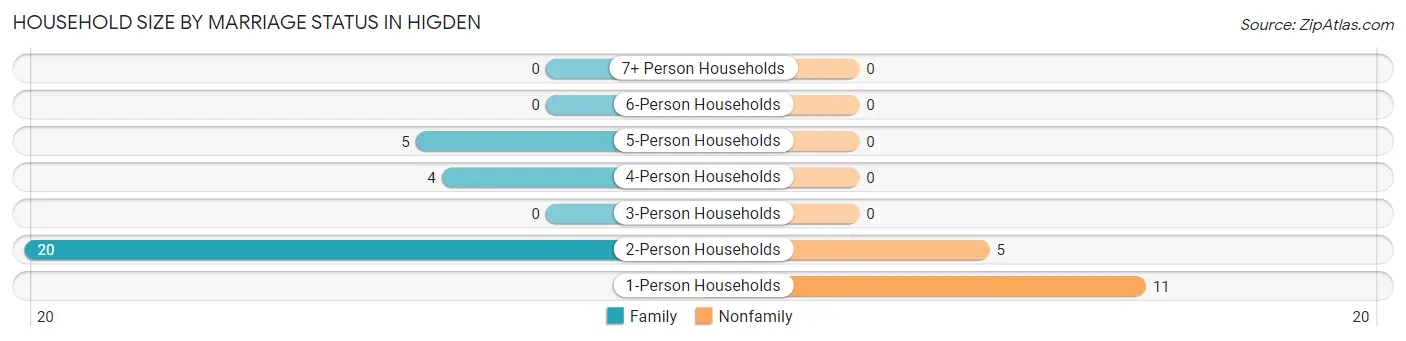
| Household Size | Family Households | Nonfamily Households |
| 1-Person Households | - | 11 (24.4%) |
| 2-Person Households | 20 (44.4%) | 5 (11.1%) |
| 3-Person Households | 0 (0.0%) | 0 (0.0%) |
| 4-Person Households | 4 (8.9%) | 0 (0.0%) |
| 5-Person Households | 5 (11.1%) | 0 (0.0%) |
| 6-Person Households | 0 (0.0%) | 0 (0.0%) |
| 7+ Person Households | 0 (0.0%) | 0 (0.0%) |
| Total | 29 (64.4%) | 16 (35.6%) |
Female Fertility in Higden
Fertility by Age in Higden
| Age Bracket | Women with Births | Births / 1,000 Women |
| 15 to 19 years | 0 (0.0%) | 0.0 |
| 20 to 34 years | 0 (0.0%) | 0.0 |
| 35 to 50 years | 0 (0.0%) | 0.0 |
| Total | 0 (0.0%) | 0.0 |
Fertility by Age by Marriage Status in Higden
| Age Bracket | Married | Unmarried |
| 15 to 19 years | 0 (0.0%) | 0 (0.0%) |
| 20 to 34 years | 0 (0.0%) | 0 (0.0%) |
| 35 to 50 years | 0 (0.0%) | 0 (0.0%) |
| Total | 0 (0.0%) | 0 (0.0%) |
Fertility by Education in Higden
| Educational Attainment | Women with Births | Births / 1,000 Women |
| Less than High School | 0 (0.0%) | 0.0 |
| High School Diploma | 0 (0.0%) | 0.0 |
| College or Associate's Degree | 0 (0.0%) | 0.0 |
| Bachelor's Degree | 0 (0.0%) | 0.0 |
| Graduate Degree | 0 (0.0%) | 0.0 |
| Total | 0 (0.0%) | 0.0 |
Fertility by Education by Marriage Status in Higden
| Educational Attainment | Married | Unmarried |
| Less than High School | 0 (0.0%) | 0 (0.0%) |
| High School Diploma | 0 (0.0%) | 0 (0.0%) |
| College or Associate's Degree | 0 (0.0%) | 0 (0.0%) |
| Bachelor's Degree | 0 (0.0%) | 0 (0.0%) |
| Graduate Degree | 0 (0.0%) | 0 (0.0%) |
| Total | 0 (0.0%) | 0 (0.0%) |
Employment Characteristics in Higden
Employment by Class of Employer in Higden
Among the 30 employed individuals in Higden, private company employees (19 | 63.3%), local government employees (9 | 30.0%), and state government employees (2 | 6.7%) make up the most common classes of employment.
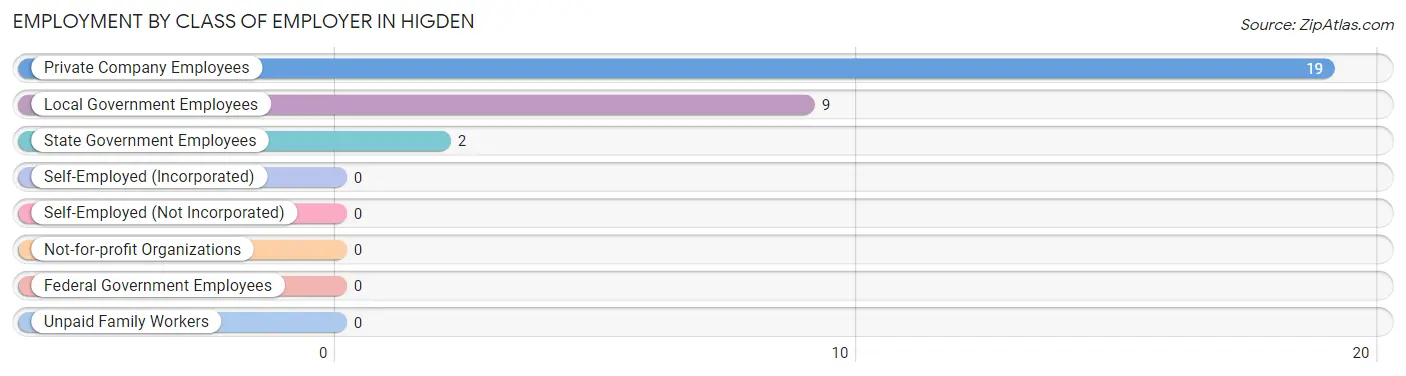
| Employer Class | # Employees | % Employees |
| Private Company Employees | 19 | 63.3% |
| Self-Employed (Incorporated) | 0 | 0.0% |
| Self-Employed (Not Incorporated) | 0 | 0.0% |
| Not-for-profit Organizations | 0 | 0.0% |
| Local Government Employees | 9 | 30.0% |
| State Government Employees | 2 | 6.7% |
| Federal Government Employees | 0 | 0.0% |
| Unpaid Family Workers | 0 | 0.0% |
| Total | 30 | 100.0% |
Employment Status by Age in Higden
According to the labor force statistics for Higden, out of the total population over 16 years of age (80), 46.3% or 37 individuals are in the labor force, with 18.9% or 7 of them unemployed. The age group with the highest labor force participation rate is 35 to 44 years, with 100.0% or 17 individuals in the labor force. Within the labor force, the 45 to 54 years age range has the highest percentage of unemployed individuals, with 50.0% or 1 of them being unemployed.
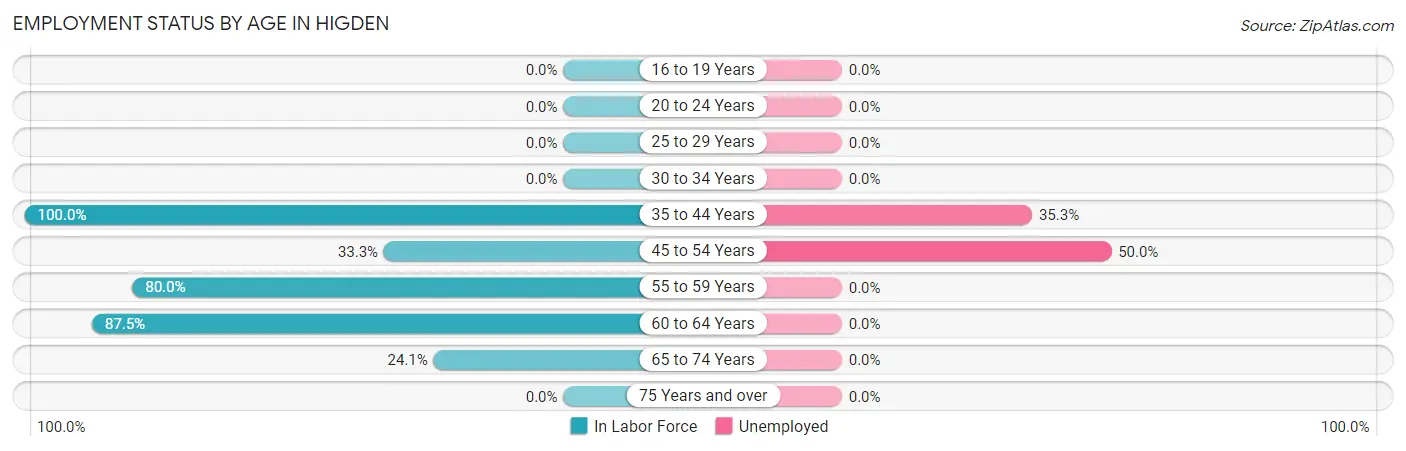
| Age Bracket | In Labor Force | Unemployed |
| 16 to 19 Years | 0 (0.0%) | 0 (0.0%) |
| 20 to 24 Years | 0 (0.0%) | 0 (0.0%) |
| 25 to 29 Years | 0 (0.0%) | 0 (0.0%) |
| 30 to 34 Years | 0 (0.0%) | 0 (0.0%) |
| 35 to 44 Years | 17 (100.0%) | 6 (35.3%) |
| 45 to 54 Years | 2 (33.3%) | 1 (50.0%) |
| 55 to 59 Years | 4 (80.0%) | 0 (0.0%) |
| 60 to 64 Years | 7 (87.5%) | 0 (0.0%) |
| 65 to 74 Years | 7 (24.1%) | 0 (0.0%) |
| 75 Years and over | 0 (0.0%) | 0 (0.0%) |
| Total | 37 (46.3%) | 7 (18.9%) |
Employment Status by Educational Attainment in Higden
According to labor force statistics for Higden, 83.3% of individuals (30) out of the total population between 25 and 64 years of age (36) are in the labor force, with 23.3% or 7 of them being unemployed. The group with the highest labor force participation rate are those with the educational attainment of less than high school, with 100.0% or 1 individuals in the labor force. Within the labor force, individuals with college / associate degree education have the highest percentage of unemployment, with 41.2% or 7 of them being unemployed.
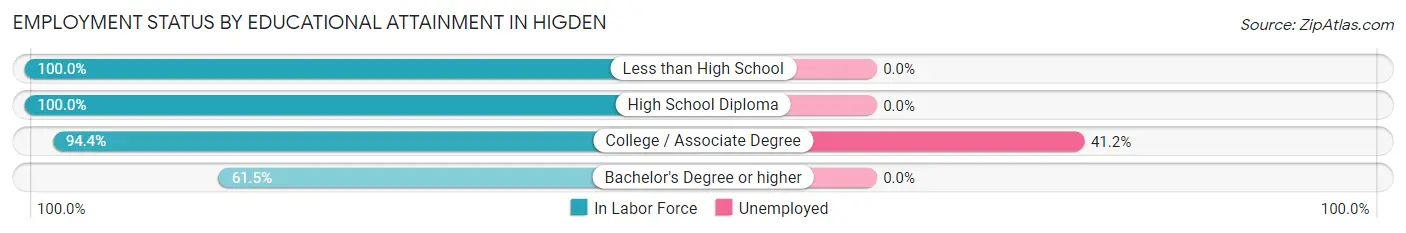
| Educational Attainment | In Labor Force | Unemployed |
| Less than High School | 1 (100.0%) | 0 (0.0%) |
| High School Diploma | 4 (100.0%) | 0 (0.0%) |
| College / Associate Degree | 17 (94.4%) | 7 (41.2%) |
| Bachelor's Degree or higher | 8 (61.5%) | 0 (0.0%) |
| Total | 30 (83.3%) | 8 (23.3%) |
Employment Occupations by Sex in Higden
Management, Business, Science and Arts Occupations
The most common Management, Business, Science and Arts occupations in Higden are Management (13 | 43.3%), Community & Social Service (10 | 33.3%), Education Instruction & Library (10 | 33.3%), Business & Financial (1 | 3.3%), and Health Diagnosing & Treating (1 | 3.3%).
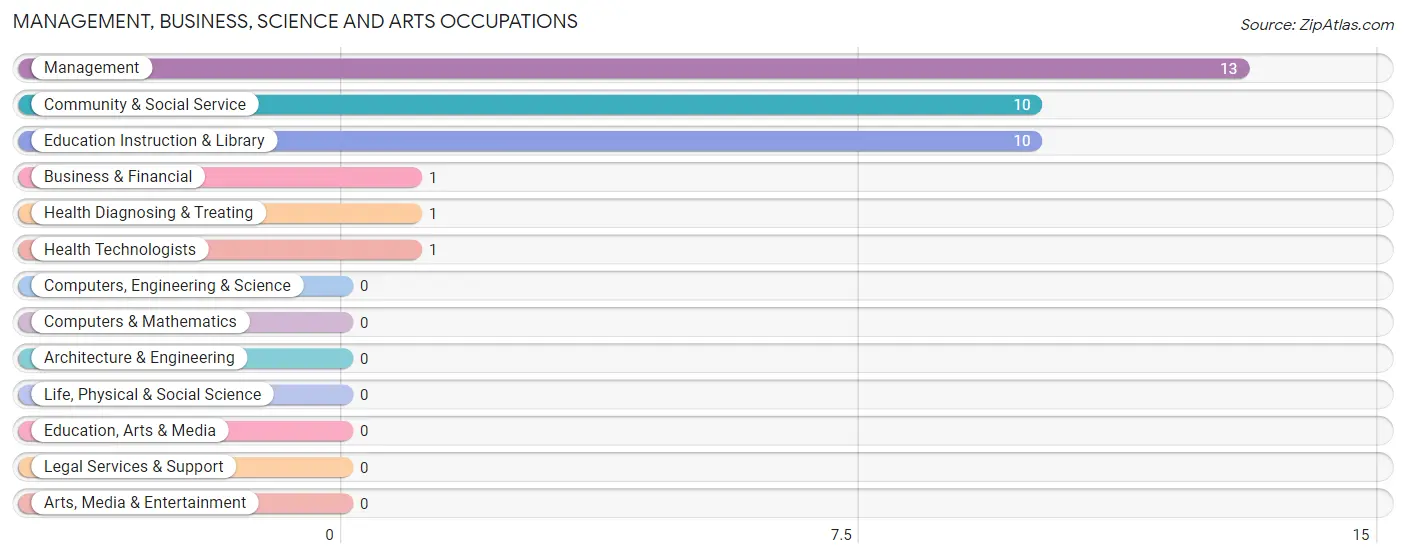
Management, Business, Science and Arts Occupations by Sex
Within the Management, Business, Science and Arts occupations in Higden, the most male-oriented occupations are Health Diagnosing & Treating (100.0%), Health Technologists (100.0%), and Management (38.5%), while the most female-oriented occupations are Business & Financial (100.0%), Community & Social Service (100.0%), and Education Instruction & Library (100.0%).
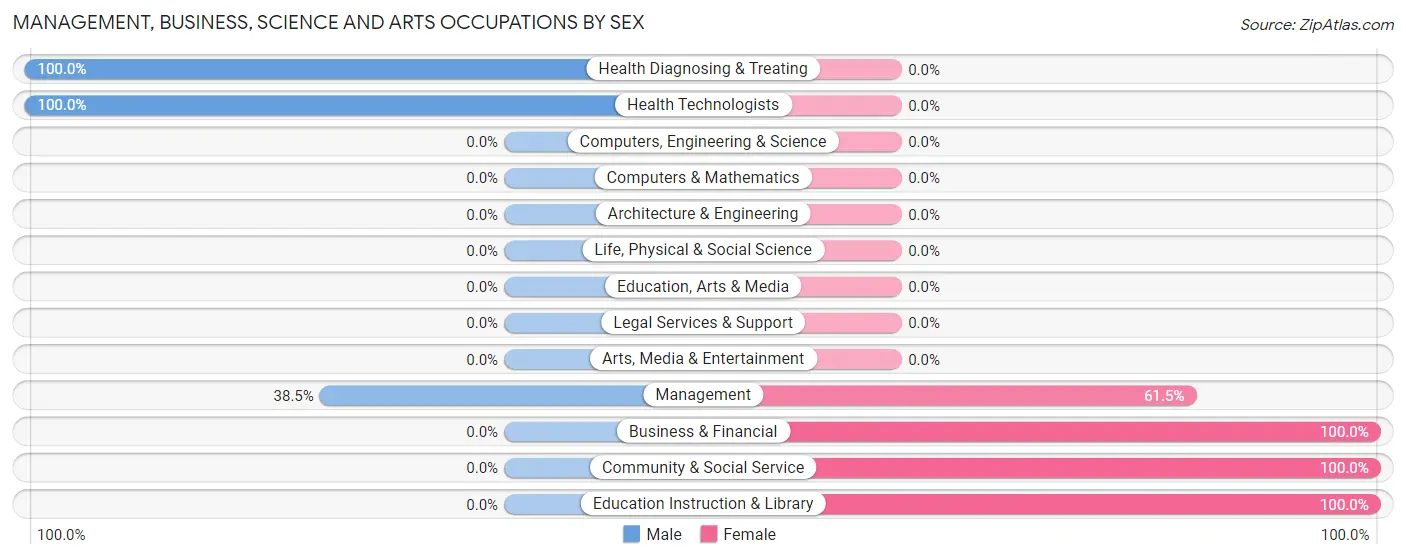
| Occupation | Male | Female |
| Management | 5 (38.5%) | 8 (61.5%) |
| Business & Financial | 0 (0.0%) | 1 (100.0%) |
| Computers, Engineering & Science | 0 (0.0%) | 0 (0.0%) |
| Computers & Mathematics | 0 (0.0%) | 0 (0.0%) |
| Architecture & Engineering | 0 (0.0%) | 0 (0.0%) |
| Life, Physical & Social Science | 0 (0.0%) | 0 (0.0%) |
| Community & Social Service | 0 (0.0%) | 10 (100.0%) |
| Education, Arts & Media | 0 (0.0%) | 0 (0.0%) |
| Legal Services & Support | 0 (0.0%) | 0 (0.0%) |
| Education Instruction & Library | 0 (0.0%) | 10 (100.0%) |
| Arts, Media & Entertainment | 0 (0.0%) | 0 (0.0%) |
| Health Diagnosing & Treating | 1 (100.0%) | 0 (0.0%) |
| Health Technologists | 1 (100.0%) | 0 (0.0%) |
| Total (Category) | 6 (24.0%) | 19 (76.0%) |
| Total (Overall) | 7 (23.3%) | 23 (76.7%) |
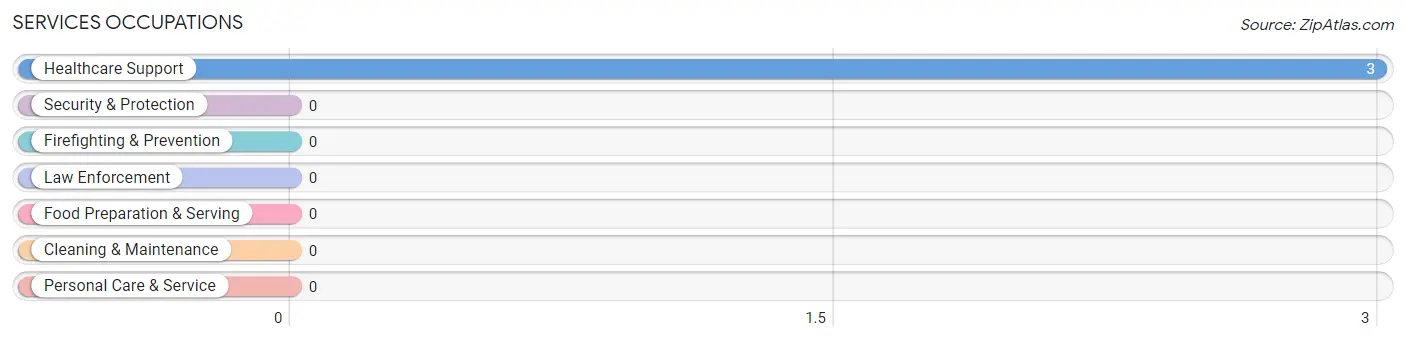
Services Occupations
The most common Services occupations in Higden are , and Healthcare Support (3 | 10.0%).
Services Occupations by Sex
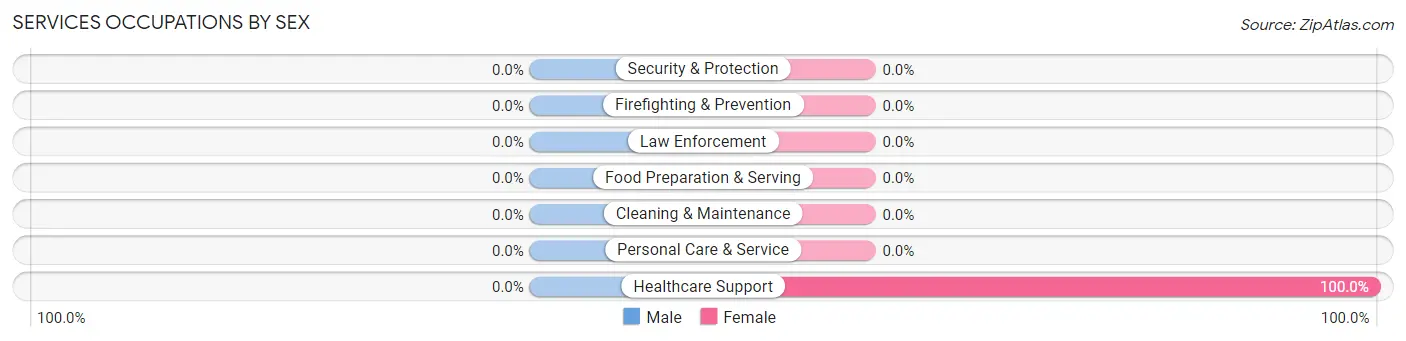
| Occupation | Male | Female |
| Healthcare Support | 0 (0.0%) | 3 (100.0%) |
| Security & Protection | 0 (0.0%) | 0 (0.0%) |
| Firefighting & Prevention | 0 (0.0%) | 0 (0.0%) |
| Law Enforcement | 0 (0.0%) | 0 (0.0%) |
| Food Preparation & Serving | 0 (0.0%) | 0 (0.0%) |
| Cleaning & Maintenance | 0 (0.0%) | 0 (0.0%) |
| Personal Care & Service | 0 (0.0%) | 0 (0.0%) |
| Total (Category) | 0 (0.0%) | 3 (100.0%) |
| Total (Overall) | 7 (23.3%) | 23 (76.7%) |
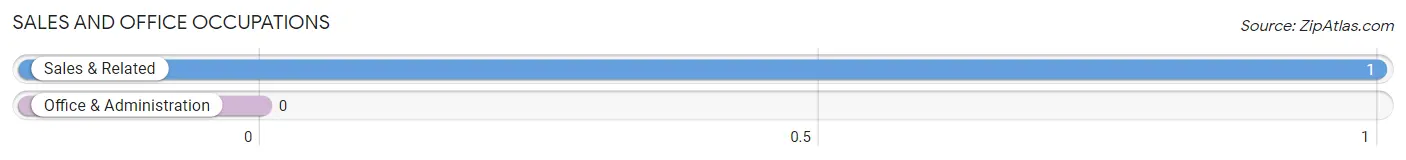
Sales and Office Occupations
The most common Sales and Office occupations in Higden are , and Sales & Related (1 | 3.3%).
Sales and Office Occupations by Sex
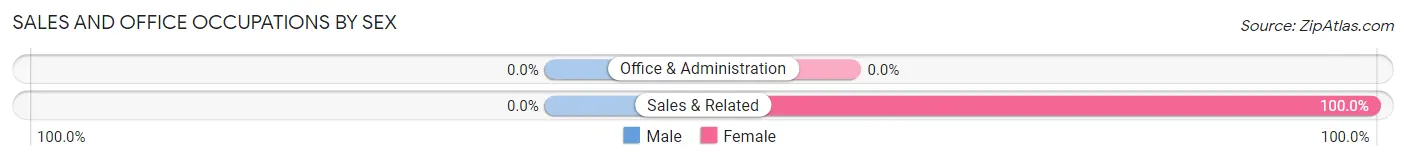
| Occupation | Male | Female |
| Sales & Related | 0 (0.0%) | 1 (100.0%) |
| Office & Administration | 0 (0.0%) | 0 (0.0%) |
| Total (Category) | 0 (0.0%) | 1 (100.0%) |
| Total (Overall) | 7 (23.3%) | 23 (76.7%) |
Natural Resources, Construction and Maintenance Occupations
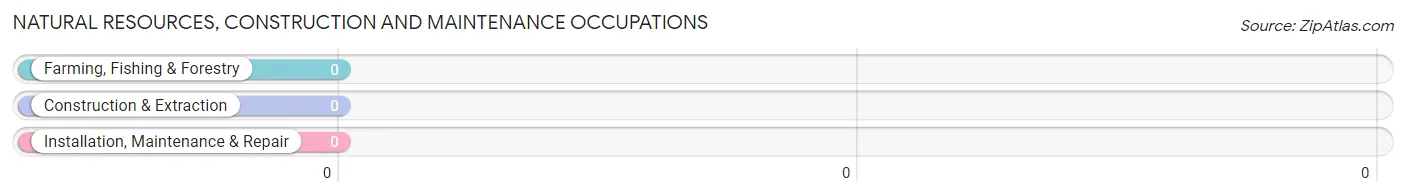
Natural Resources, Construction and Maintenance Occupations by Sex
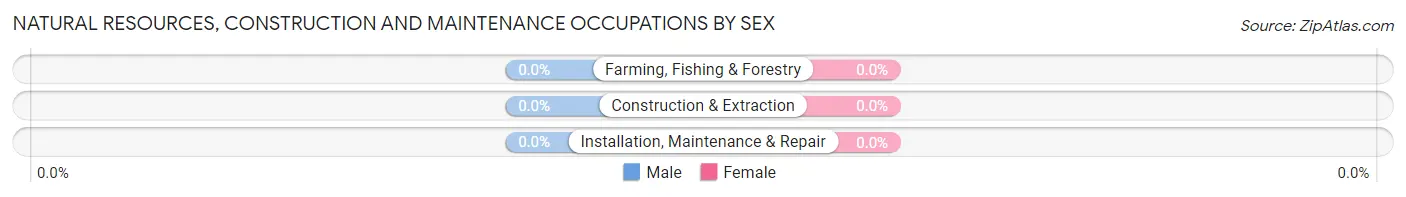
| Occupation | Male | Female |
| Farming, Fishing & Forestry | 0 (0.0%) | 0 (0.0%) |
| Construction & Extraction | 0 (0.0%) | 0 (0.0%) |
| Installation, Maintenance & Repair | 0 (0.0%) | 0 (0.0%) |
| Total (Category) | 0 (0.0%) | 0 (0.0%) |
| Total (Overall) | 7 (23.3%) | 23 (76.7%) |
Production, Transportation and Moving Occupations
The most common Production, Transportation and Moving occupations in Higden are , and Material Moving (1 | 3.3%).
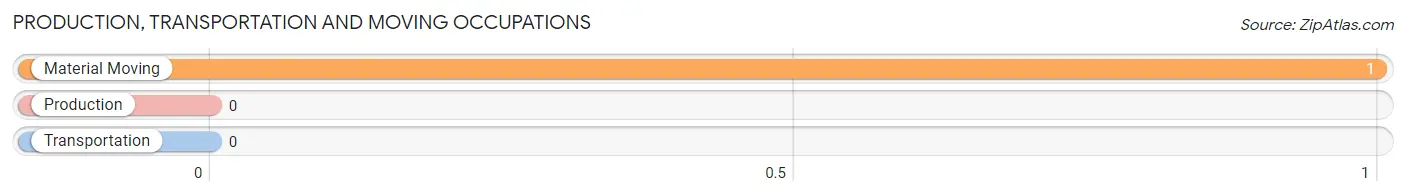
Production, Transportation and Moving Occupations by Sex
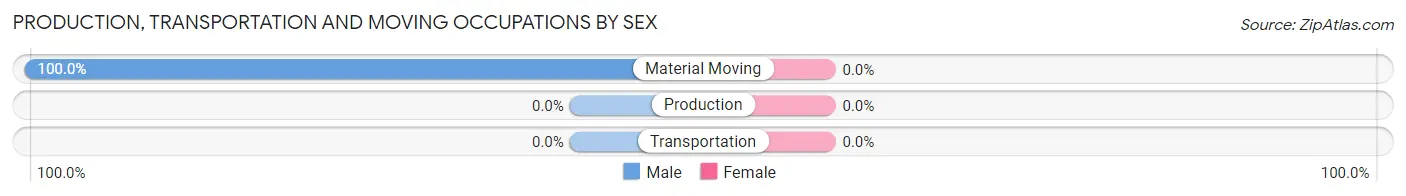
| Occupation | Male | Female |
| Production | 0 (0.0%) | 0 (0.0%) |
| Transportation | 0 (0.0%) | 0 (0.0%) |
| Material Moving | 1 (100.0%) | 0 (0.0%) |
| Total (Category) | 1 (100.0%) | 0 (0.0%) |
| Total (Overall) | 7 (23.3%) | 23 (76.7%) |
Employment Industries by Sex in Higden
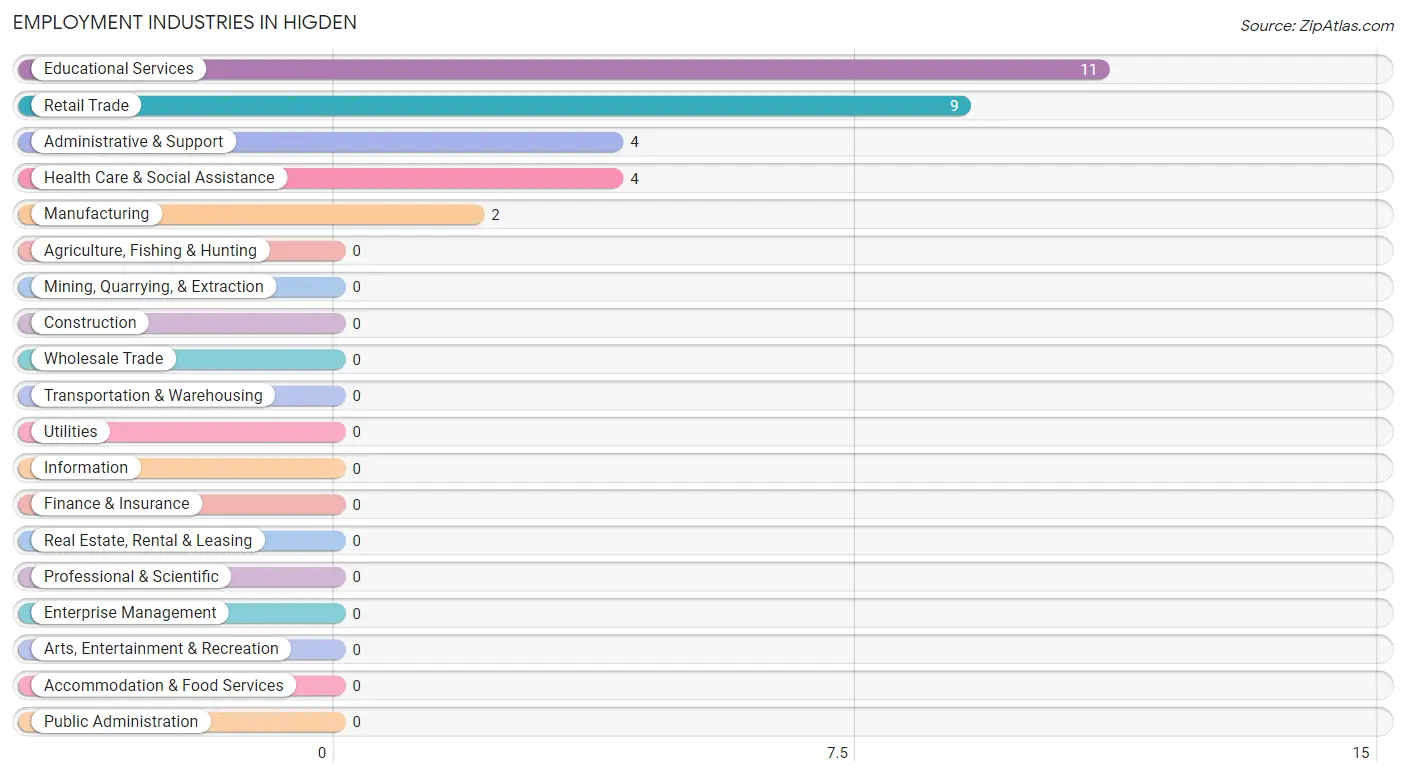
Employment Industries in Higden
The major employment industries in Higden include Educational Services (11 | 36.7%), Retail Trade (9 | 30.0%), Administrative & Support (4 | 13.3%), Health Care & Social Assistance (4 | 13.3%), and Manufacturing (2 | 6.7%).
Employment Industries by Sex in Higden
The Higden industries that see more men than women are Manufacturing (100.0%), Retail Trade (44.4%), and Health Care & Social Assistance (25.0%), whereas the industries that tend to have a higher number of women are Administrative & Support (100.0%), Educational Services (100.0%), and Health Care & Social Assistance (75.0%).
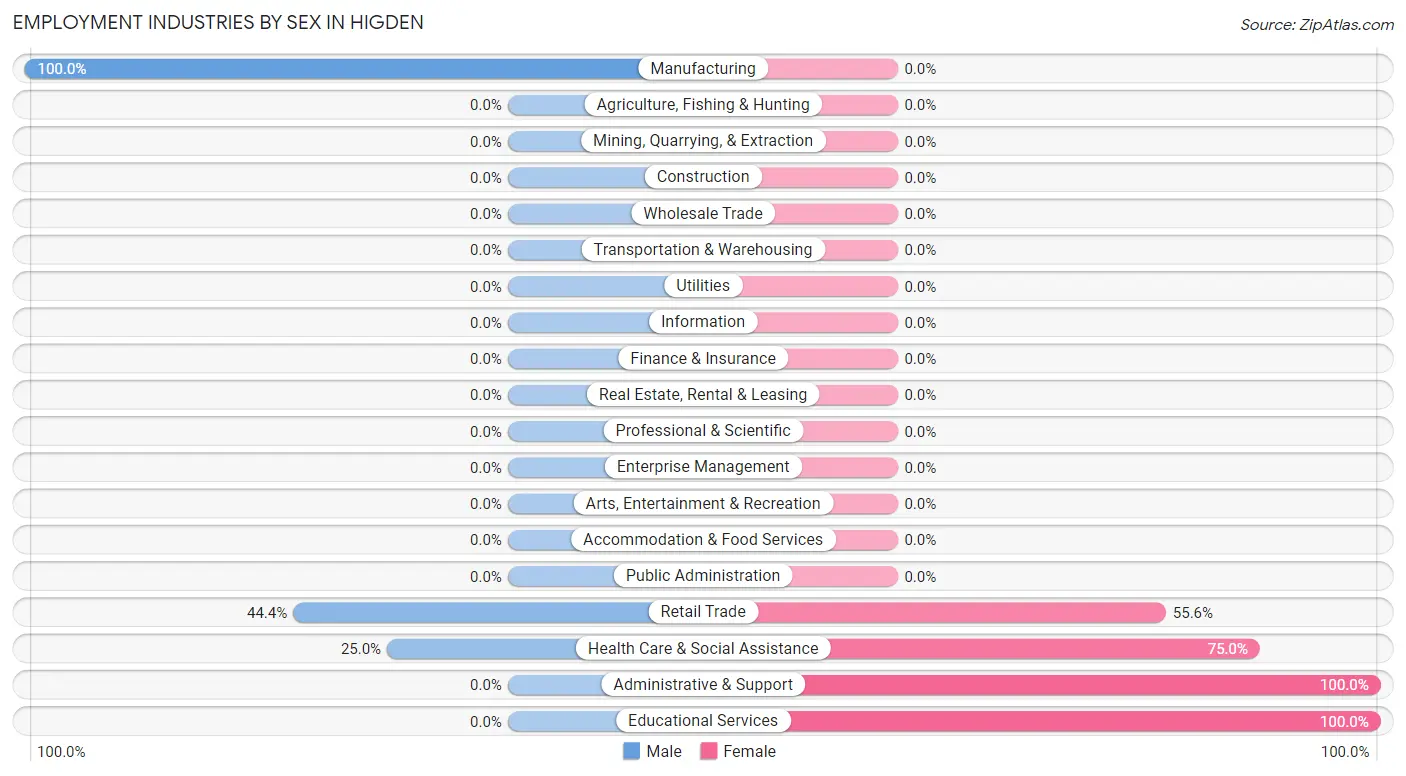
| Industry | Male | Female |
| Agriculture, Fishing & Hunting | 0 (0.0%) | 0 (0.0%) |
| Mining, Quarrying, & Extraction | 0 (0.0%) | 0 (0.0%) |
| Construction | 0 (0.0%) | 0 (0.0%) |
| Manufacturing | 2 (100.0%) | 0 (0.0%) |
| Wholesale Trade | 0 (0.0%) | 0 (0.0%) |
| Retail Trade | 4 (44.4%) | 5 (55.6%) |
| Transportation & Warehousing | 0 (0.0%) | 0 (0.0%) |
| Utilities | 0 (0.0%) | 0 (0.0%) |
| Information | 0 (0.0%) | 0 (0.0%) |
| Finance & Insurance | 0 (0.0%) | 0 (0.0%) |
| Real Estate, Rental & Leasing | 0 (0.0%) | 0 (0.0%) |
| Professional & Scientific | 0 (0.0%) | 0 (0.0%) |
| Enterprise Management | 0 (0.0%) | 0 (0.0%) |
| Administrative & Support | 0 (0.0%) | 4 (100.0%) |
| Educational Services | 0 (0.0%) | 11 (100.0%) |
| Health Care & Social Assistance | 1 (25.0%) | 3 (75.0%) |
| Arts, Entertainment & Recreation | 0 (0.0%) | 0 (0.0%) |
| Accommodation & Food Services | 0 (0.0%) | 0 (0.0%) |
| Public Administration | 0 (0.0%) | 0 (0.0%) |
| Total | 7 (23.3%) | 23 (76.7%) |
Education in Higden
School Enrollment in Higden
The most common levels of schooling among the 16 students in Higden are middle school (6 | 37.5%), high school (5 | 31.2%), and elementary school (3 | 18.8%).
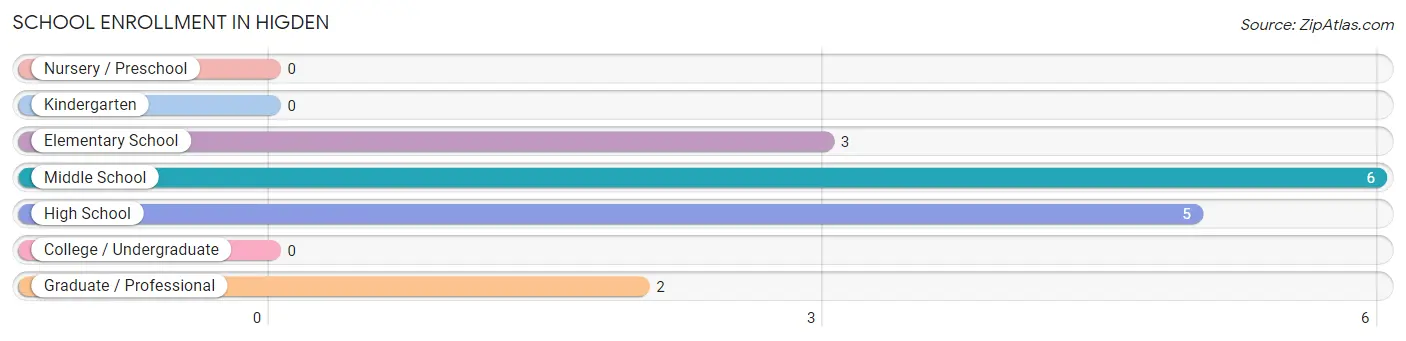
| School Level | # Students | % Students |
| Nursery / Preschool | 0 | 0.0% |
| Kindergarten | 0 | 0.0% |
| Elementary School | 3 | 18.8% |
| Middle School | 6 | 37.5% |
| High School | 5 | 31.2% |
| College / Undergraduate | 0 | 0.0% |
| Graduate / Professional | 2 | 12.5% |
| Total | 16 | 100.0% |
School Enrollment by Age by Funding Source in Higden
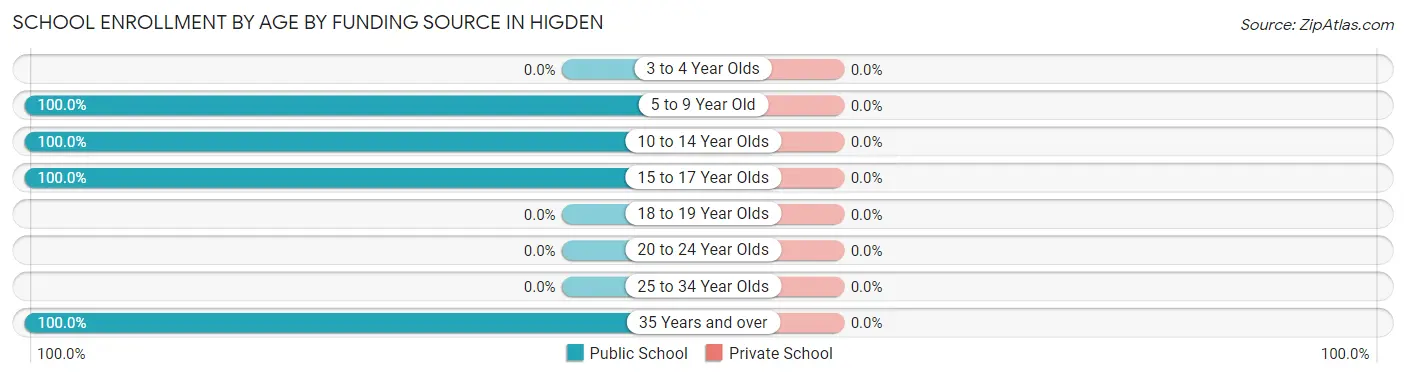
| Age Bracket | Public School | Private School |
| 3 to 4 Year Olds | 0 (0.0%) | 0 (0.0%) |
| 5 to 9 Year Old | 3 (100.0%) | 0 (0.0%) |
| 10 to 14 Year Olds | 6 (100.0%) | 0 (0.0%) |
| 15 to 17 Year Olds | 5 (100.0%) | 0 (0.0%) |
| 18 to 19 Year Olds | 0 (0.0%) | 0 (0.0%) |
| 20 to 24 Year Olds | 0 (0.0%) | 0 (0.0%) |
| 25 to 34 Year Olds | 0 (0.0%) | 0 (0.0%) |
| 35 Years and over | 2 (100.0%) | 0 (0.0%) |
| Total | 16 (100.0%) | 0 (0.0%) |
Educational Attainment by Field of Study in Higden
Business (6 | 18.2%), education (5 | 15.1%), literature & languages (5 | 15.1%), visual & performing arts (5 | 15.1%), and arts & humanities (5 | 15.1%) are the most common fields of study among 33 individuals in Higden who have obtained a bachelor's degree or higher.
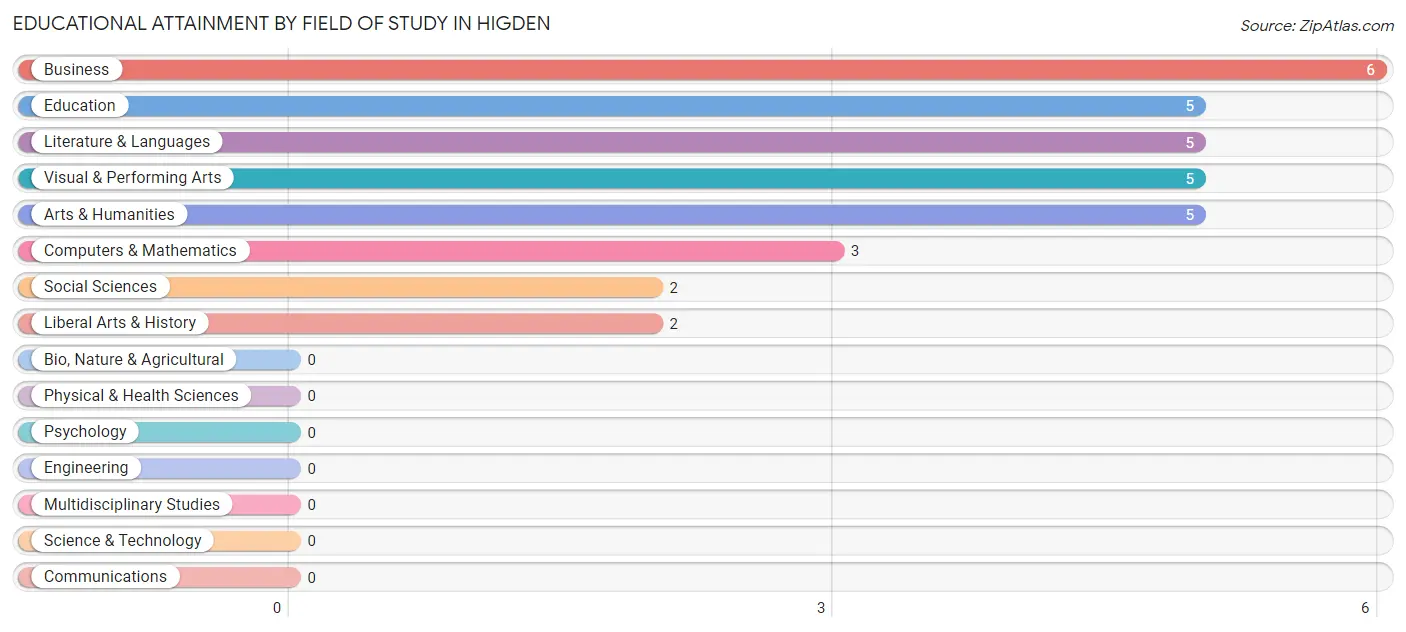
| Field of Study | # Graduates | % Graduates |
| Computers & Mathematics | 3 | 9.1% |
| Bio, Nature & Agricultural | 0 | 0.0% |
| Physical & Health Sciences | 0 | 0.0% |
| Psychology | 0 | 0.0% |
| Social Sciences | 2 | 6.1% |
| Engineering | 0 | 0.0% |
| Multidisciplinary Studies | 0 | 0.0% |
| Science & Technology | 0 | 0.0% |
| Business | 6 | 18.2% |
| Education | 5 | 15.1% |
| Literature & Languages | 5 | 15.1% |
| Liberal Arts & History | 2 | 6.1% |
| Visual & Performing Arts | 5 | 15.1% |
| Communications | 0 | 0.0% |
| Arts & Humanities | 5 | 15.1% |
| Total | 33 | 100.0% |
Transportation & Commute in Higden
Vehicle Availability by Sex in Higden
The most prevalent vehicle ownership categories in Higden are males with 2 vehicles (6, accounting for 85.7%) and females with 2 vehicles (9, making up 26.1%).
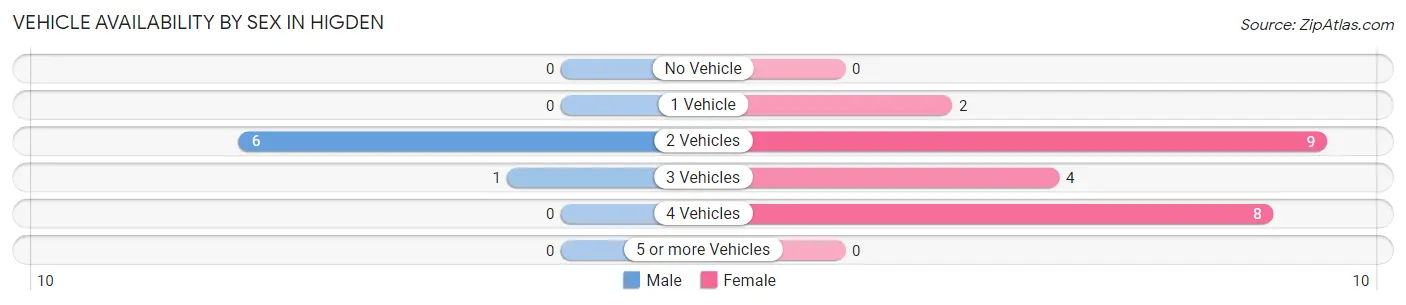
| Vehicles Available | Male | Female |
| No Vehicle | 0 (0.0%) | 0 (0.0%) |
| 1 Vehicle | 0 (0.0%) | 2 (8.7%) |
| 2 Vehicles | 6 (85.7%) | 9 (39.1%) |
| 3 Vehicles | 1 (14.3%) | 4 (17.4%) |
| 4 Vehicles | 0 (0.0%) | 8 (34.8%) |
| 5 or more Vehicles | 0 (0.0%) | 0 (0.0%) |
| Total | 7 (100.0%) | 23 (100.0%) |
Commute Time in Higden
The most frequently occuring commute durations in Higden are 5 to 9 minutes (13 commuters, 43.3%), 60 to 89 minutes (10 commuters, 33.3%), and 20 to 24 minutes (5 commuters, 16.7%).
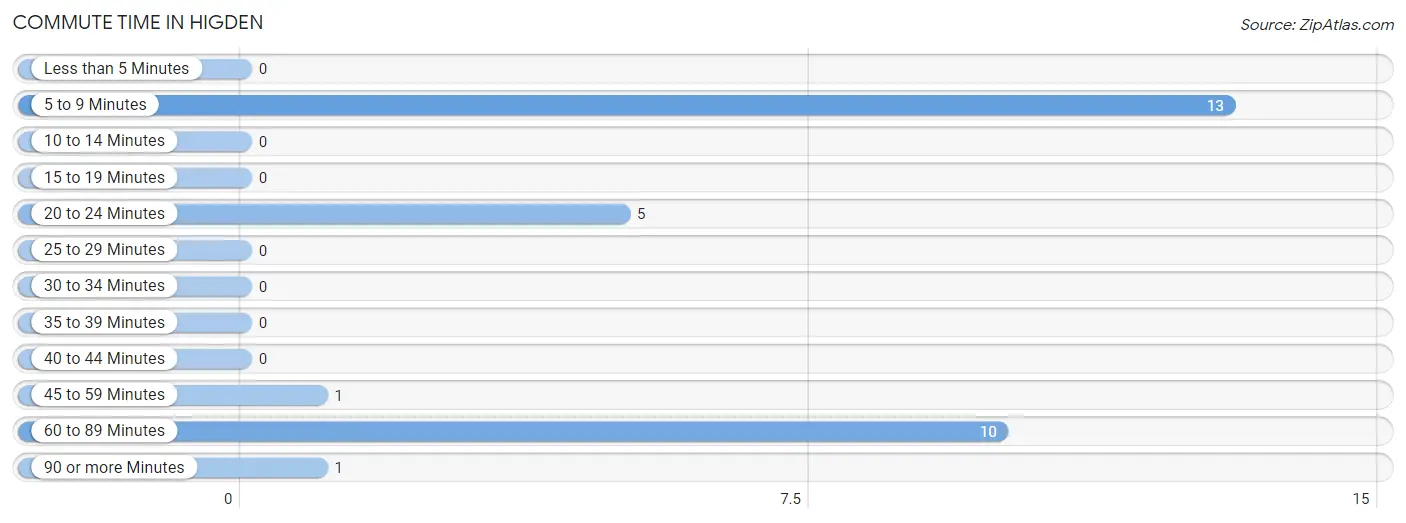
| Commute Time | # Commuters | % Commuters |
| Less than 5 Minutes | 0 | 0.0% |
| 5 to 9 Minutes | 13 | 43.3% |
| 10 to 14 Minutes | 0 | 0.0% |
| 15 to 19 Minutes | 0 | 0.0% |
| 20 to 24 Minutes | 5 | 16.7% |
| 25 to 29 Minutes | 0 | 0.0% |
| 30 to 34 Minutes | 0 | 0.0% |
| 35 to 39 Minutes | 0 | 0.0% |
| 40 to 44 Minutes | 0 | 0.0% |
| 45 to 59 Minutes | 1 | 3.3% |
| 60 to 89 Minutes | 10 | 33.3% |
| 90 or more Minutes | 1 | 3.3% |
Commute Time by Sex in Higden
The most common commute times in Higden are 5 to 9 minutes (3 commuters, 42.9%) for males and 5 to 9 minutes (10 commuters, 43.5%) for females.
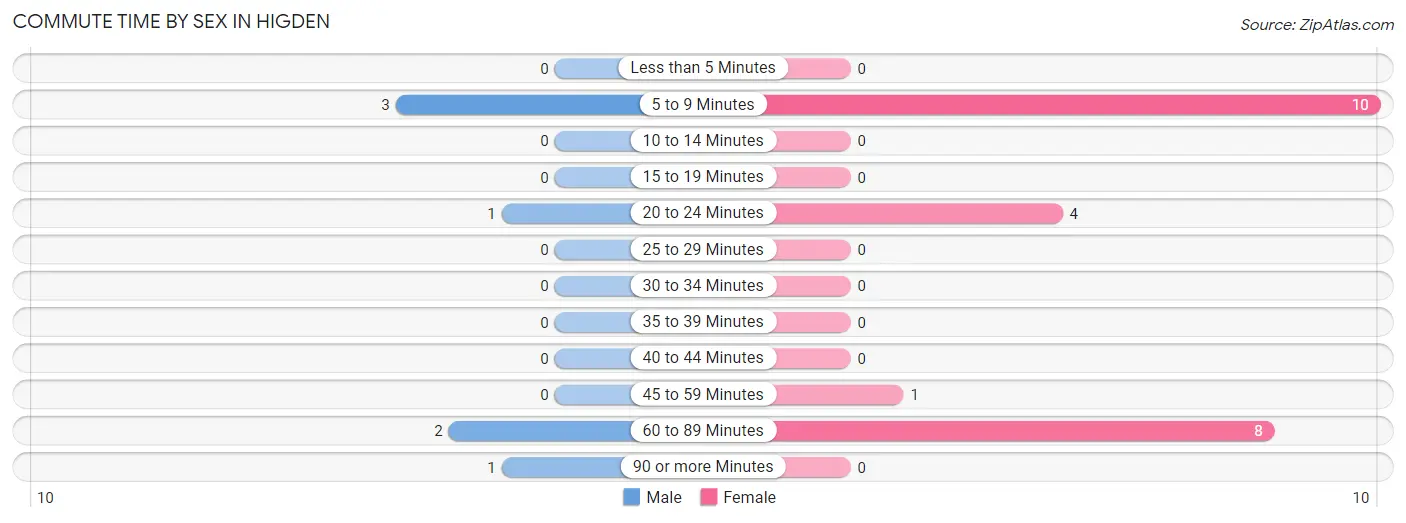
| Commute Time | Male | Female |
| Less than 5 Minutes | 0 (0.0%) | 0 (0.0%) |
| 5 to 9 Minutes | 3 (42.9%) | 10 (43.5%) |
| 10 to 14 Minutes | 0 (0.0%) | 0 (0.0%) |
| 15 to 19 Minutes | 0 (0.0%) | 0 (0.0%) |
| 20 to 24 Minutes | 1 (14.3%) | 4 (17.4%) |
| 25 to 29 Minutes | 0 (0.0%) | 0 (0.0%) |
| 30 to 34 Minutes | 0 (0.0%) | 0 (0.0%) |
| 35 to 39 Minutes | 0 (0.0%) | 0 (0.0%) |
| 40 to 44 Minutes | 0 (0.0%) | 0 (0.0%) |
| 45 to 59 Minutes | 0 (0.0%) | 1 (4.3%) |
| 60 to 89 Minutes | 2 (28.6%) | 8 (34.8%) |
| 90 or more Minutes | 1 (14.3%) | 0 (0.0%) |
Time of Departure to Work by Sex in Higden
The most frequent times of departure to work in Higden are 7:30 AM to 7:59 AM (3, 42.9%) for males and 7:30 AM to 7:59 AM (11, 47.8%) for females.
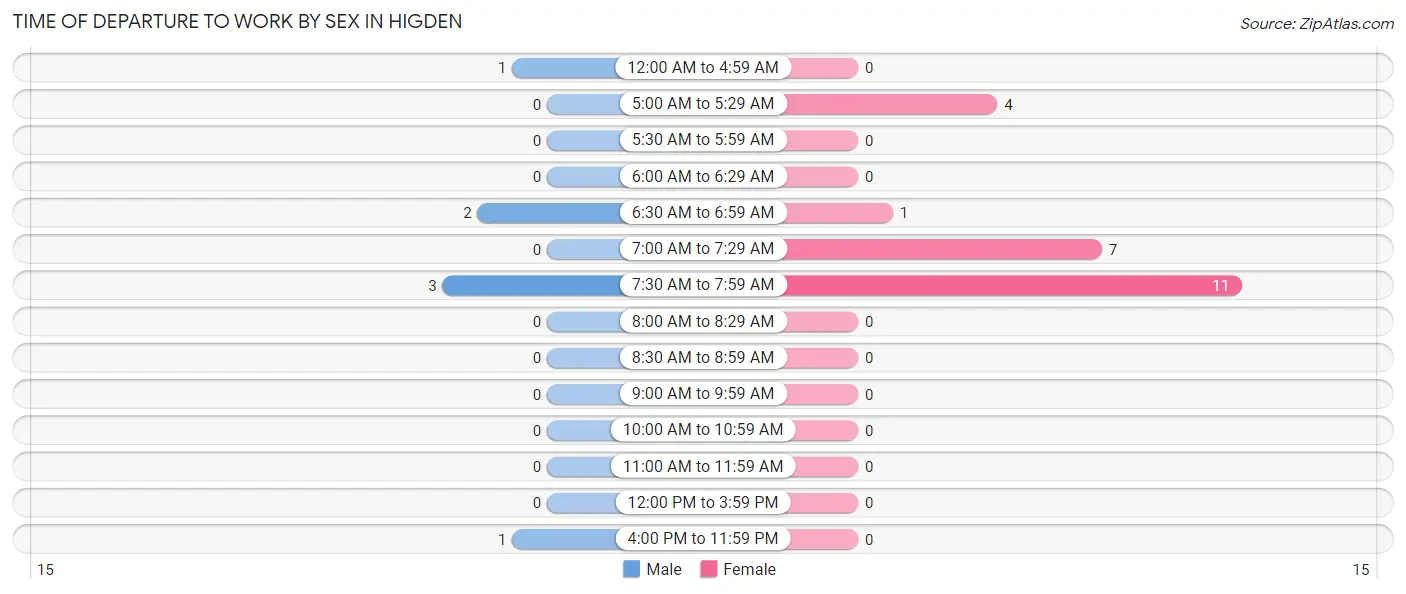
| Time of Departure | Male | Female |
| 12:00 AM to 4:59 AM | 1 (14.3%) | 0 (0.0%) |
| 5:00 AM to 5:29 AM | 0 (0.0%) | 4 (17.4%) |
| 5:30 AM to 5:59 AM | 0 (0.0%) | 0 (0.0%) |
| 6:00 AM to 6:29 AM | 0 (0.0%) | 0 (0.0%) |
| 6:30 AM to 6:59 AM | 2 (28.6%) | 1 (4.3%) |
| 7:00 AM to 7:29 AM | 0 (0.0%) | 7 (30.4%) |
| 7:30 AM to 7:59 AM | 3 (42.9%) | 11 (47.8%) |
| 8:00 AM to 8:29 AM | 0 (0.0%) | 0 (0.0%) |
| 8:30 AM to 8:59 AM | 0 (0.0%) | 0 (0.0%) |
| 9:00 AM to 9:59 AM | 0 (0.0%) | 0 (0.0%) |
| 10:00 AM to 10:59 AM | 0 (0.0%) | 0 (0.0%) |
| 11:00 AM to 11:59 AM | 0 (0.0%) | 0 (0.0%) |
| 12:00 PM to 3:59 PM | 0 (0.0%) | 0 (0.0%) |
| 4:00 PM to 11:59 PM | 1 (14.3%) | 0 (0.0%) |
| Total | 7 (100.0%) | 23 (100.0%) |
Housing Occupancy in Higden
Occupancy by Ownership in Higden
Of the total 45 dwellings in Higden, owner-occupied units account for 45 (100.0%), while renter-occupied units make up 0 (0.0%).
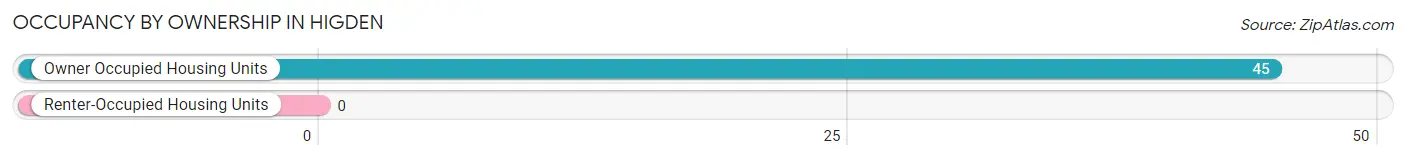
| Occupancy | # Housing Units | % Housing Units |
| Owner Occupied Housing Units | 45 | 100.0% |
| Renter-Occupied Housing Units | 0 | 0.0% |
| Total Occupied Housing Units | 45 | 100.0% |
Occupancy by Household Size in Higden
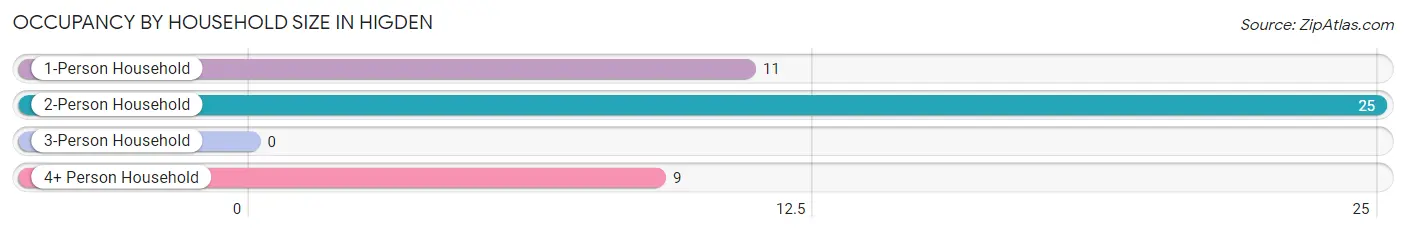
| Household Size | # Housing Units | % Housing Units |
| 1-Person Household | 11 | 24.4% |
| 2-Person Household | 25 | 55.6% |
| 3-Person Household | 0 | 0.0% |
| 4+ Person Household | 9 | 20.0% |
| Total Housing Units | 45 | 100.0% |
Occupancy by Ownership by Household Size in Higden
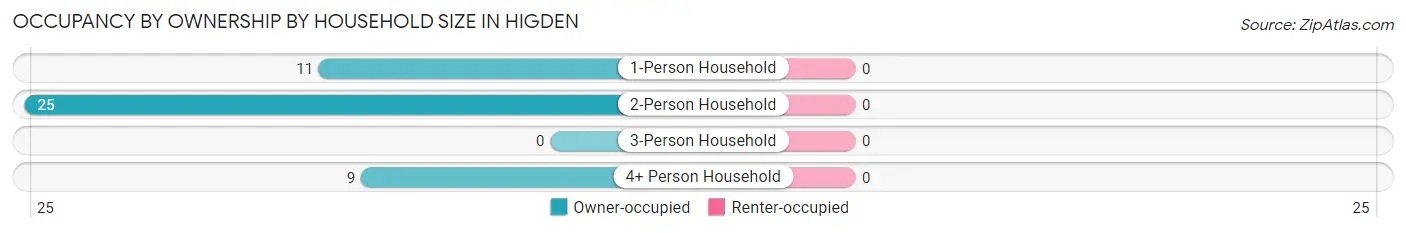
| Household Size | Owner-occupied | Renter-occupied |
| 1-Person Household | 11 (100.0%) | 0 (0.0%) |
| 2-Person Household | 25 (100.0%) | 0 (0.0%) |
| 3-Person Household | 0 (0.0%) | 0 (0.0%) |
| 4+ Person Household | 9 (100.0%) | 0 (0.0%) |
| Total Housing Units | 45 (100.0%) | 0 (0.0%) |
Occupancy by Educational Attainment in Higden
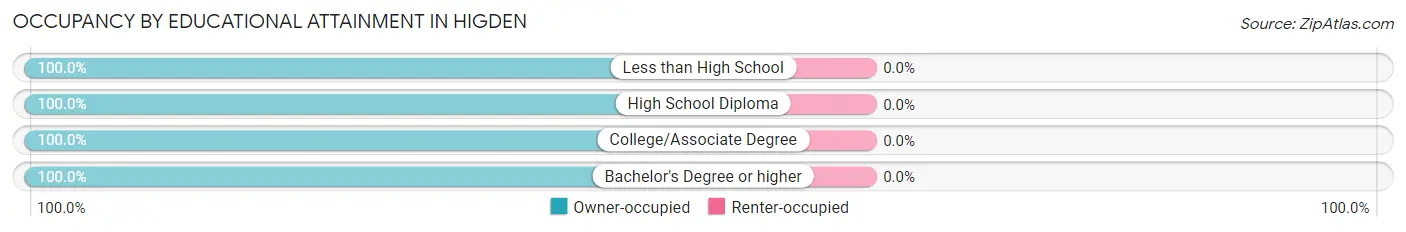
| Household Size | Owner-occupied | Renter-occupied |
| Less than High School | 1 (100.0%) | 0 (0.0%) |
| High School Diploma | 17 (100.0%) | 0 (0.0%) |
| College/Associate Degree | 10 (100.0%) | 0 (0.0%) |
| Bachelor's Degree or higher | 17 (100.0%) | 0 (0.0%) |
Occupancy by Age of Householder in Higden
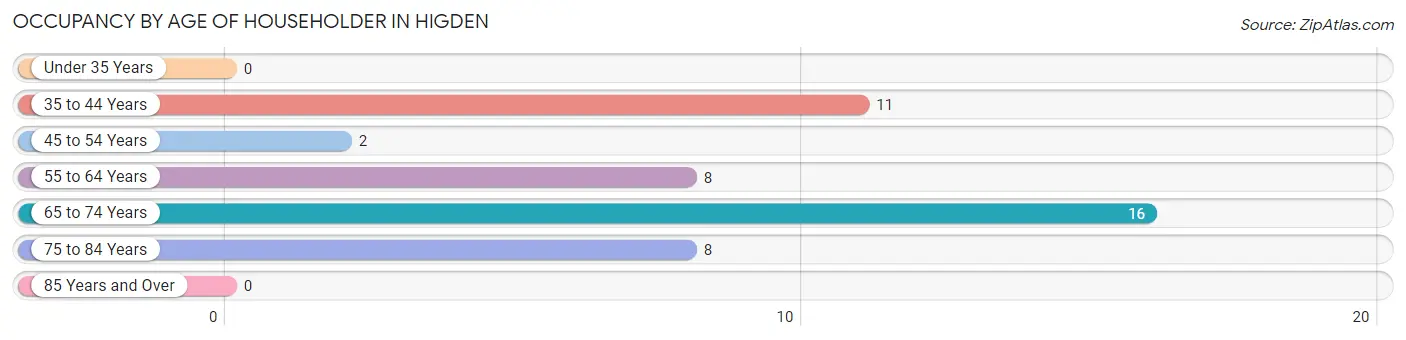
| Age Bracket | # Households | % Households |
| Under 35 Years | 0 | 0.0% |
| 35 to 44 Years | 11 | 24.4% |
| 45 to 54 Years | 2 | 4.4% |
| 55 to 64 Years | 8 | 17.8% |
| 65 to 74 Years | 16 | 35.6% |
| 75 to 84 Years | 8 | 17.8% |
| 85 Years and Over | 0 | 0.0% |
| Total | 45 | 100.0% |
Housing Finances in Higden
Median Income by Occupancy in Higden
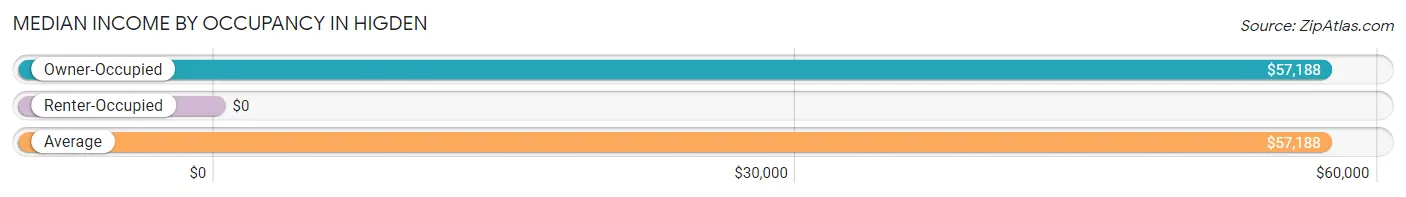
| Occupancy Type | # Households | Median Income |
| Owner-Occupied | 45 (100.0%) | $57,188 |
| Renter-Occupied | 0 (0.0%) | $0 |
| Average | 45 (100.0%) | $57,188 |
Occupancy by Householder Income Bracket in Higden
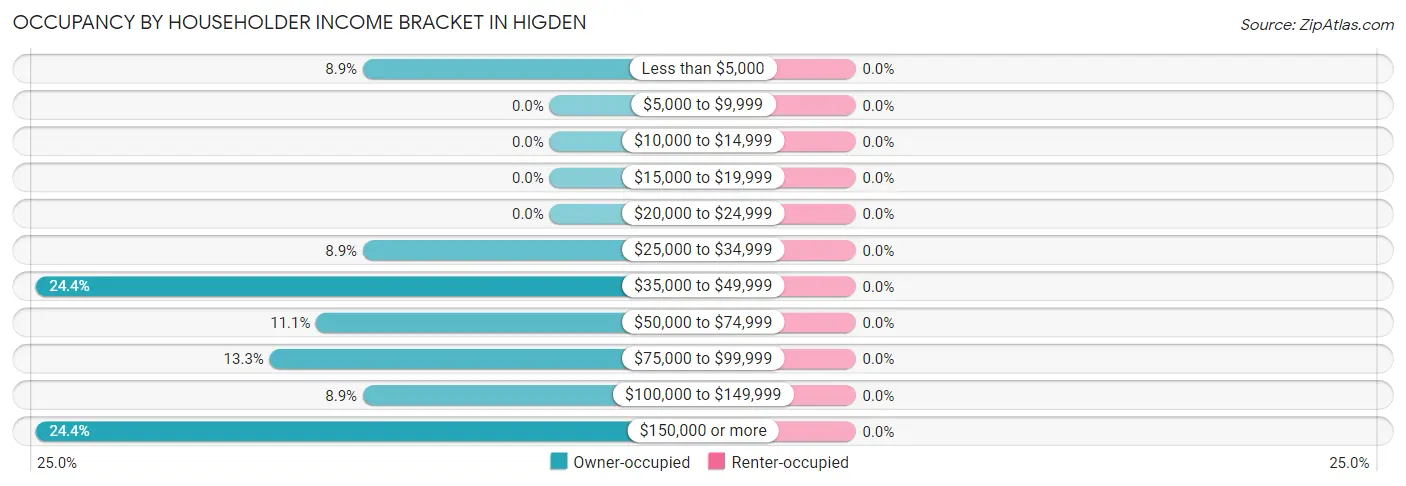
| Income Bracket | Owner-occupied | Renter-occupied |
| Less than $5,000 | 4 (8.9%) | 0 (0.0%) |
| $5,000 to $9,999 | 0 (0.0%) | 0 (0.0%) |
| $10,000 to $14,999 | 0 (0.0%) | 0 (0.0%) |
| $15,000 to $19,999 | 0 (0.0%) | 0 (0.0%) |
| $20,000 to $24,999 | 0 (0.0%) | 0 (0.0%) |
| $25,000 to $34,999 | 4 (8.9%) | 0 (0.0%) |
| $35,000 to $49,999 | 11 (24.4%) | 0 (0.0%) |
| $50,000 to $74,999 | 5 (11.1%) | 0 (0.0%) |
| $75,000 to $99,999 | 6 (13.3%) | 0 (0.0%) |
| $100,000 to $149,999 | 4 (8.9%) | 0 (0.0%) |
| $150,000 or more | 11 (24.4%) | 0 (0.0%) |
| Total | 45 (100.0%) | 0 (0.0%) |
Monthly Housing Cost Tiers in Higden
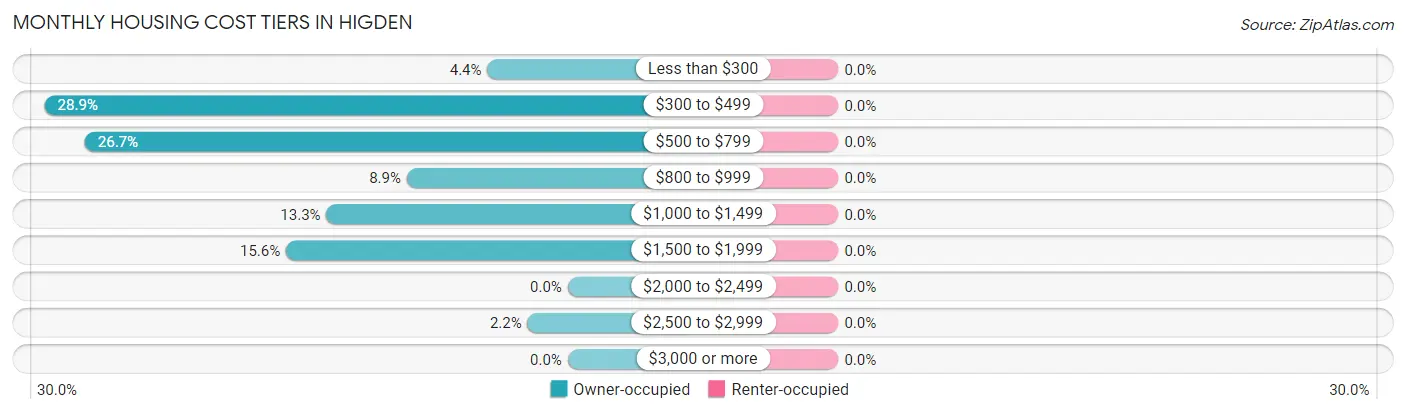
| Monthly Cost | Owner-occupied | Renter-occupied |
| Less than $300 | 2 (4.4%) | 0 (0.0%) |
| $300 to $499 | 13 (28.9%) | 0 (0.0%) |
| $500 to $799 | 12 (26.7%) | 0 (0.0%) |
| $800 to $999 | 4 (8.9%) | 0 (0.0%) |
| $1,000 to $1,499 | 6 (13.3%) | 0 (0.0%) |
| $1,500 to $1,999 | 7 (15.6%) | 0 (0.0%) |
| $2,000 to $2,499 | 0 (0.0%) | 0 (0.0%) |
| $2,500 to $2,999 | 1 (2.2%) | 0 (0.0%) |
| $3,000 or more | 0 (0.0%) | 0 (0.0%) |
| Total | 45 (100.0%) | 0 (0.0%) |
Physical Housing Characteristics in Higden
Housing Structures in Higden
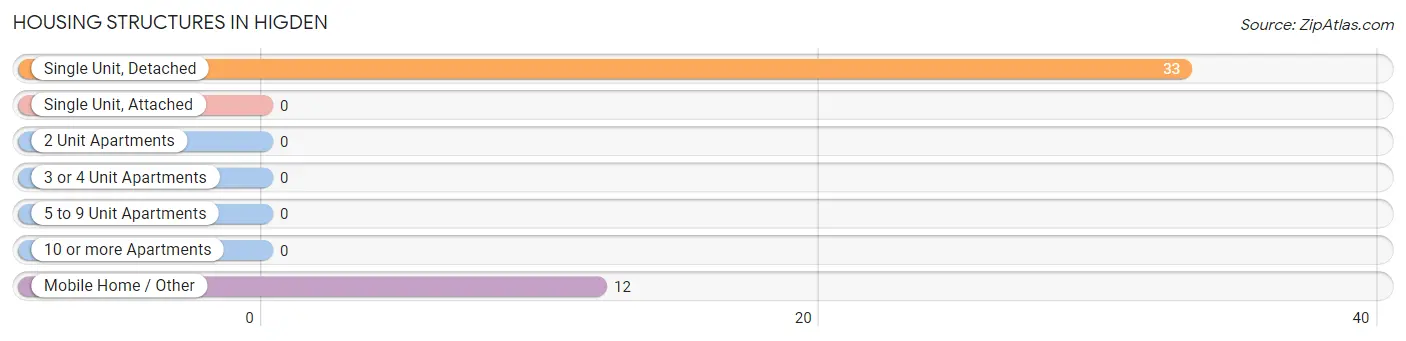
| Structure Type | # Housing Units | % Housing Units |
| Single Unit, Detached | 33 | 73.3% |
| Single Unit, Attached | 0 | 0.0% |
| 2 Unit Apartments | 0 | 0.0% |
| 3 or 4 Unit Apartments | 0 | 0.0% |
| 5 to 9 Unit Apartments | 0 | 0.0% |
| 10 or more Apartments | 0 | 0.0% |
| Mobile Home / Other | 12 | 26.7% |
| Total | 45 | 100.0% |
Housing Structures by Occupancy in Higden
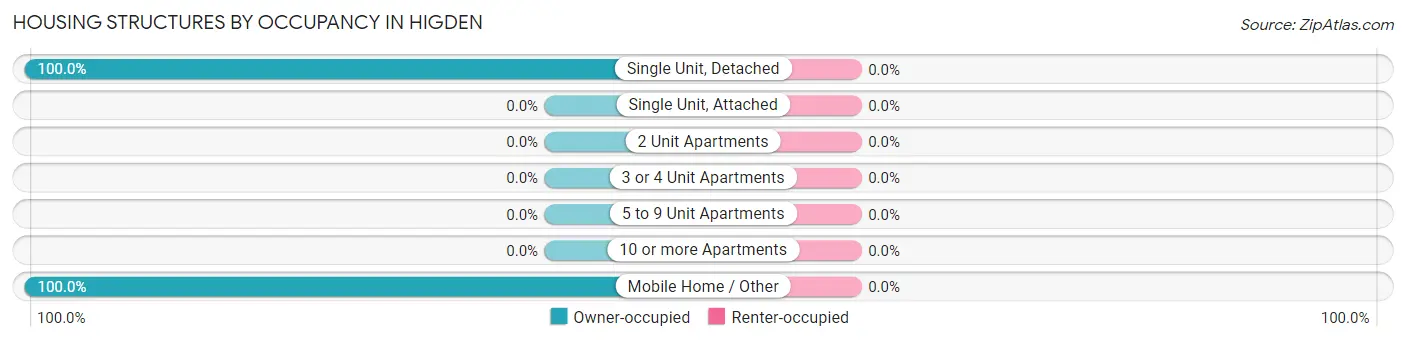
| Structure Type | Owner-occupied | Renter-occupied |
| Single Unit, Detached | 33 (100.0%) | 0 (0.0%) |
| Single Unit, Attached | 0 (0.0%) | 0 (0.0%) |
| 2 Unit Apartments | 0 (0.0%) | 0 (0.0%) |
| 3 or 4 Unit Apartments | 0 (0.0%) | 0 (0.0%) |
| 5 to 9 Unit Apartments | 0 (0.0%) | 0 (0.0%) |
| 10 or more Apartments | 0 (0.0%) | 0 (0.0%) |
| Mobile Home / Other | 12 (100.0%) | 0 (0.0%) |
| Total | 45 (100.0%) | 0 (0.0%) |
Housing Structures by Number of Rooms in Higden
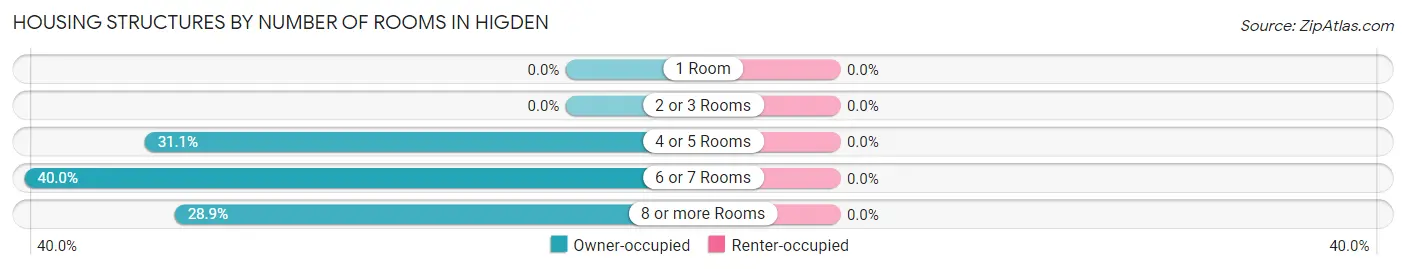
| Number of Rooms | Owner-occupied | Renter-occupied |
| 1 Room | 0 (0.0%) | 0 (0.0%) |
| 2 or 3 Rooms | 0 (0.0%) | 0 (0.0%) |
| 4 or 5 Rooms | 14 (31.1%) | 0 (0.0%) |
| 6 or 7 Rooms | 18 (40.0%) | 0 (0.0%) |
| 8 or more Rooms | 13 (28.9%) | 0 (0.0%) |
| Total | 45 (100.0%) | 0 (0.0%) |
Housing Structure by Heating Type in Higden
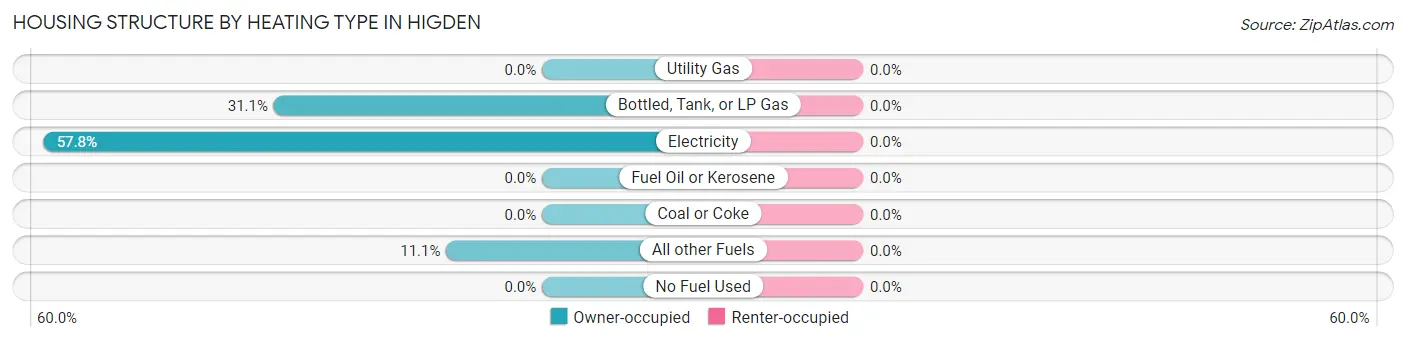
| Heating Type | Owner-occupied | Renter-occupied |
| Utility Gas | 0 (0.0%) | 0 (0.0%) |
| Bottled, Tank, or LP Gas | 14 (31.1%) | 0 (0.0%) |
| Electricity | 26 (57.8%) | 0 (0.0%) |
| Fuel Oil or Kerosene | 0 (0.0%) | 0 (0.0%) |
| Coal or Coke | 0 (0.0%) | 0 (0.0%) |
| All other Fuels | 5 (11.1%) | 0 (0.0%) |
| No Fuel Used | 0 (0.0%) | 0 (0.0%) |
| Total | 45 (100.0%) | 0 (0.0%) |
Household Vehicle Usage in Higden
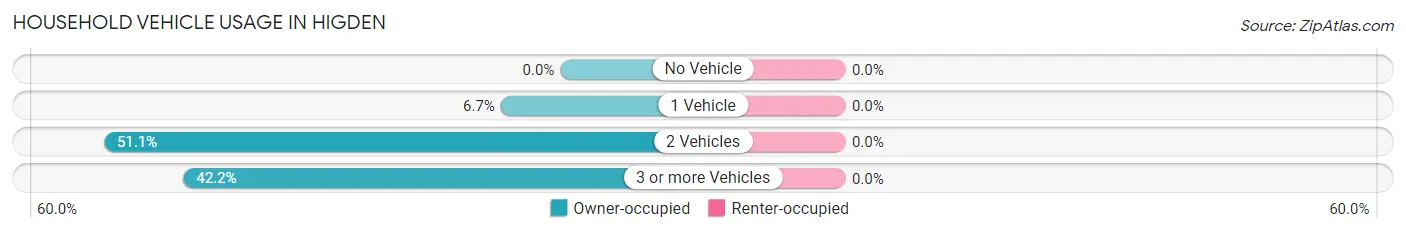
| Vehicles per Household | Owner-occupied | Renter-occupied |
| No Vehicle | 0 (0.0%) | 0 (0.0%) |
| 1 Vehicle | 3 (6.7%) | 0 (0.0%) |
| 2 Vehicles | 23 (51.1%) | 0 (0.0%) |
| 3 or more Vehicles | 19 (42.2%) | 0 (0.0%) |
| Total | 45 (100.0%) | 0 (0.0%) |
Real Estate & Mortgages in Higden
Real Estate and Mortgage Overview in Higden
| Characteristic | Without Mortgage | With Mortgage |
| Housing Units | 26 | 19 |
| Median Property Value | $187,500 | $275,000 |
| Median Household Income | $39,286 | $11 |
| Monthly Housing Costs | $380 | $0 |
| Real Estate Taxes | - | - |
Property Value by Mortgage Status in Higden
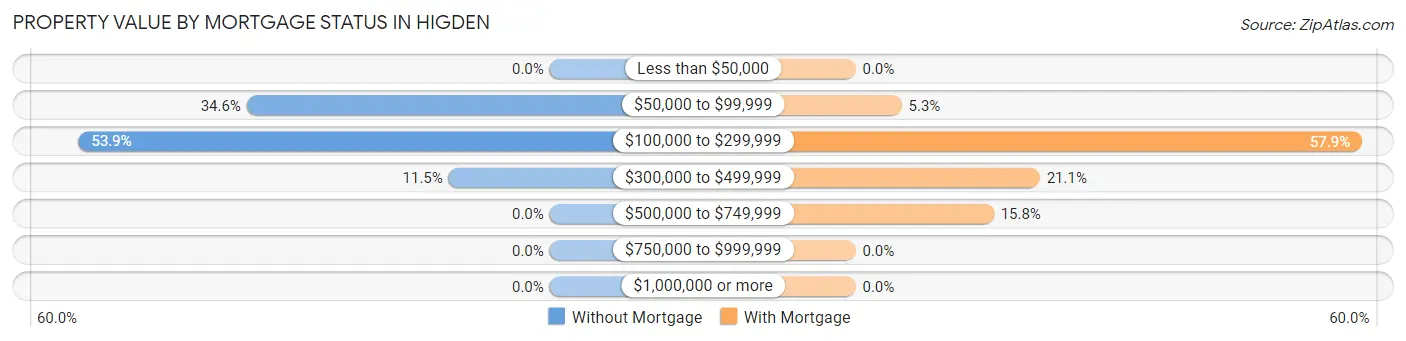
| Property Value | Without Mortgage | With Mortgage |
| Less than $50,000 | 0 (0.0%) | 0 (0.0%) |
| $50,000 to $99,999 | 9 (34.6%) | 1 (5.3%) |
| $100,000 to $299,999 | 14 (53.8%) | 11 (57.9%) |
| $300,000 to $499,999 | 3 (11.5%) | 4 (21.0%) |
| $500,000 to $749,999 | 0 (0.0%) | 3 (15.8%) |
| $750,000 to $999,999 | 0 (0.0%) | 0 (0.0%) |
| $1,000,000 or more | 0 (0.0%) | 0 (0.0%) |
| Total | 26 (100.0%) | 19 (100.0%) |
Household Income by Mortgage Status in Higden
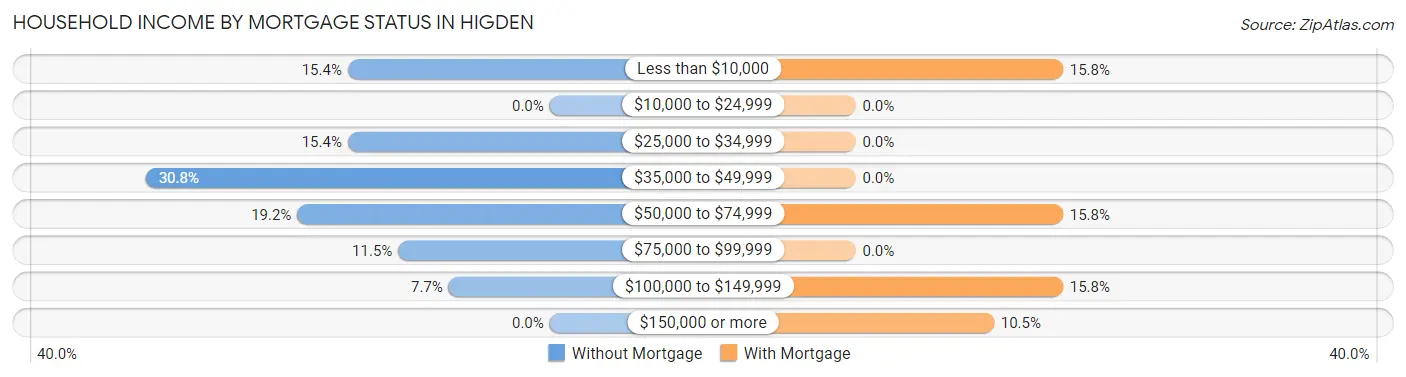
| Household Income | Without Mortgage | With Mortgage |
| Less than $10,000 | 4 (15.4%) | 3 (15.8%) |
| $10,000 to $24,999 | 0 (0.0%) | 0 (0.0%) |
| $25,000 to $34,999 | 4 (15.4%) | 0 (0.0%) |
| $35,000 to $49,999 | 8 (30.8%) | 0 (0.0%) |
| $50,000 to $74,999 | 5 (19.2%) | 3 (15.8%) |
| $75,000 to $99,999 | 3 (11.5%) | 0 (0.0%) |
| $100,000 to $149,999 | 2 (7.7%) | 3 (15.8%) |
| $150,000 or more | 0 (0.0%) | 2 (10.5%) |
| Total | 26 (100.0%) | 19 (100.0%) |
Property Value to Household Income Ratio in Higden
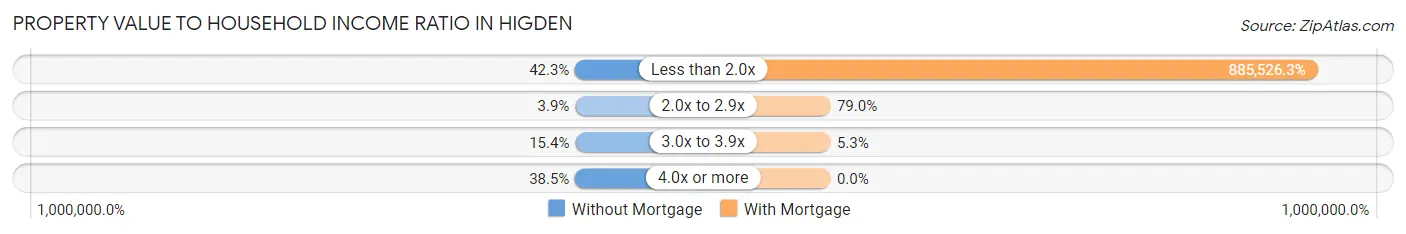
| Value-to-Income Ratio | Without Mortgage | With Mortgage |
| Less than 2.0x | 11 (42.3%) | 168,250 (885,526.3%) |
| 2.0x to 2.9x | 1 (3.8%) | 15 (78.9%) |
| 3.0x to 3.9x | 4 (15.4%) | 1 (5.3%) |
| 4.0x or more | 10 (38.5%) | 0 (0.0%) |
| Total | 26 (100.0%) | 19 (100.0%) |
Real Estate Taxes by Mortgage Status in Higden
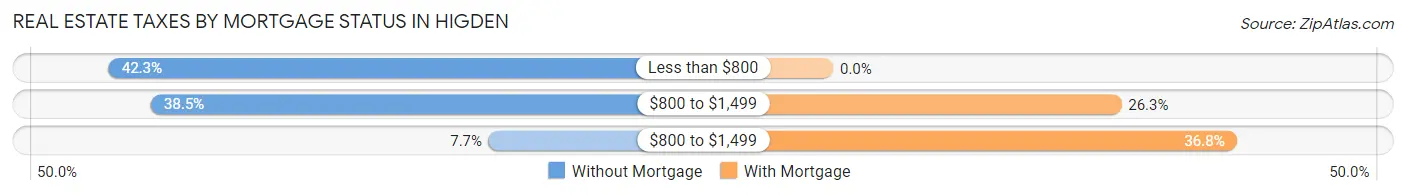
| Property Taxes | Without Mortgage | With Mortgage |
| Less than $800 | 11 (42.3%) | 0 (0.0%) |
| $800 to $1,499 | 10 (38.5%) | 5 (26.3%) |
| $800 to $1,499 | 2 (7.7%) | 7 (36.8%) |
| Total | 26 (100.0%) | 19 (100.0%) |
Health & Disability in Higden
Health Insurance Coverage by Age in Higden
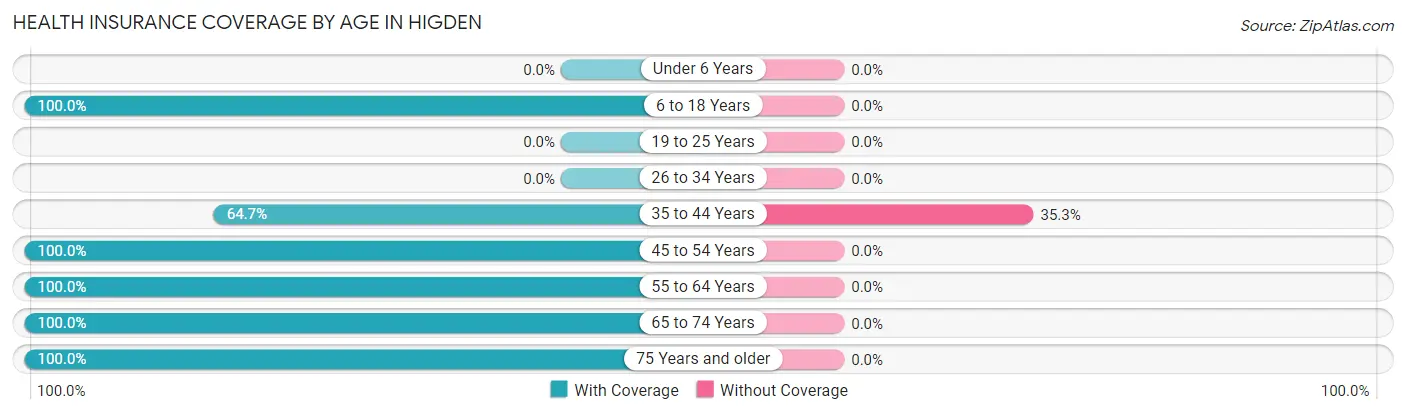
| Age Bracket | With Coverage | Without Coverage |
| Under 6 Years | 0 (0.0%) | 0 (0.0%) |
| 6 to 18 Years | 14 (100.0%) | 0 (0.0%) |
| 19 to 25 Years | 0 (0.0%) | 0 (0.0%) |
| 26 to 34 Years | 0 (0.0%) | 0 (0.0%) |
| 35 to 44 Years | 11 (64.7%) | 6 (35.3%) |
| 45 to 54 Years | 6 (100.0%) | 0 (0.0%) |
| 55 to 64 Years | 13 (100.0%) | 0 (0.0%) |
| 65 to 74 Years | 29 (100.0%) | 0 (0.0%) |
| 75 Years and older | 15 (100.0%) | 0 (0.0%) |
| Total | 88 (93.6%) | 6 (6.4%) |
Health Insurance Coverage by Citizenship Status in Higden
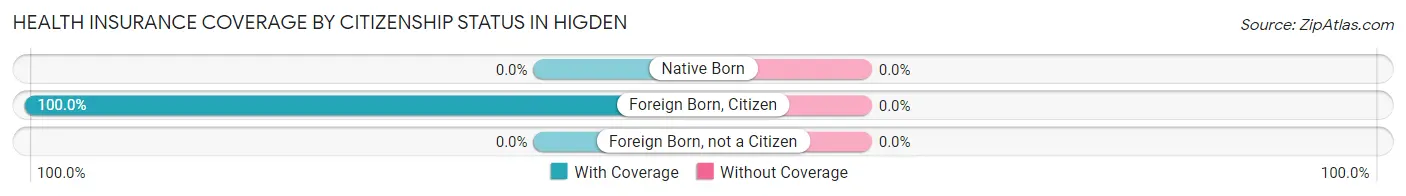
| Citizenship Status | With Coverage | Without Coverage |
| Native Born | 0 (0.0%) | 0 (0.0%) |
| Foreign Born, Citizen | 14 (100.0%) | 0 (0.0%) |
| Foreign Born, not a Citizen | 0 (0.0%) | 0 (0.0%) |
Health Insurance Coverage by Household Income in Higden
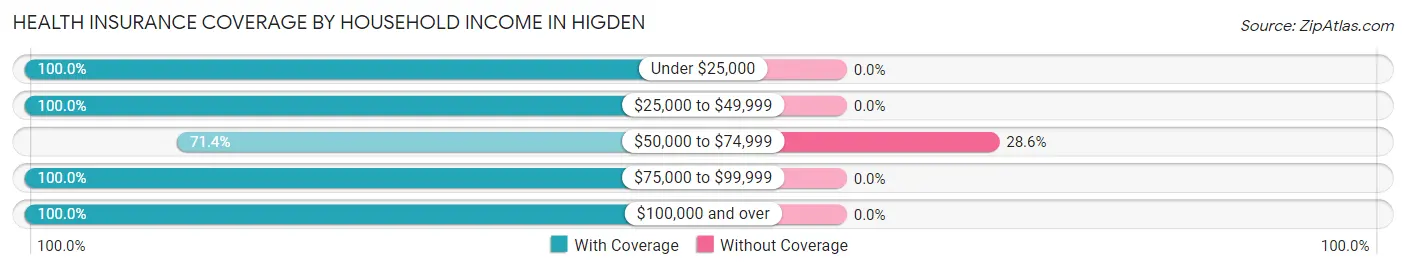
| Household Income | With Coverage | Without Coverage |
| Under $25,000 | 4 (100.0%) | 0 (0.0%) |
| $25,000 to $49,999 | 28 (100.0%) | 0 (0.0%) |
| $50,000 to $74,999 | 15 (71.4%) | 6 (28.6%) |
| $75,000 to $99,999 | 10 (100.0%) | 0 (0.0%) |
| $100,000 and over | 31 (100.0%) | 0 (0.0%) |
Public vs Private Health Insurance Coverage by Age in Higden
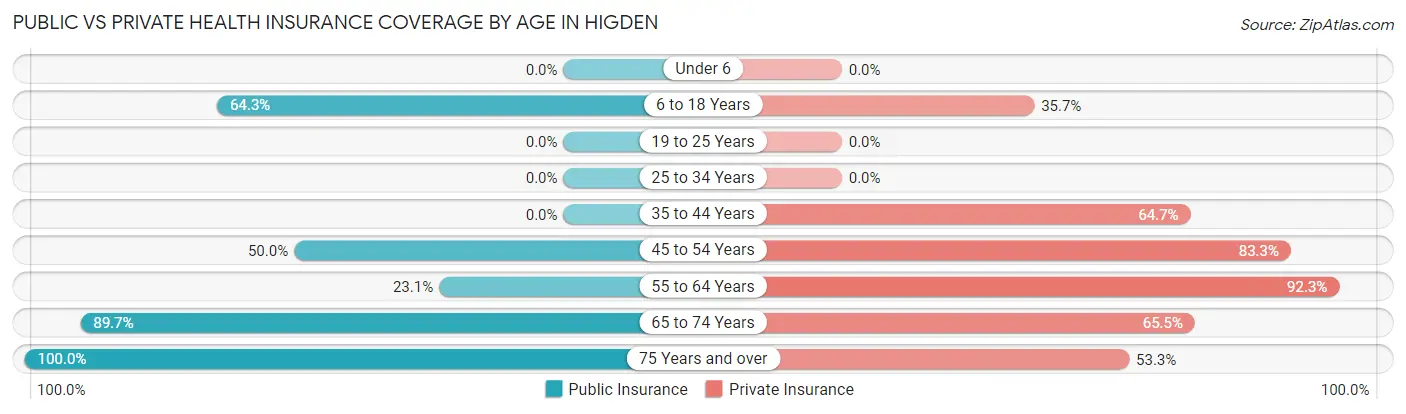
| Age Bracket | Public Insurance | Private Insurance |
| Under 6 | 0 (0.0%) | 0 (0.0%) |
| 6 to 18 Years | 9 (64.3%) | 5 (35.7%) |
| 19 to 25 Years | 0 (0.0%) | 0 (0.0%) |
| 25 to 34 Years | 0 (0.0%) | 0 (0.0%) |
| 35 to 44 Years | 0 (0.0%) | 11 (64.7%) |
| 45 to 54 Years | 3 (50.0%) | 5 (83.3%) |
| 55 to 64 Years | 3 (23.1%) | 12 (92.3%) |
| 65 to 74 Years | 26 (89.7%) | 19 (65.5%) |
| 75 Years and over | 15 (100.0%) | 8 (53.3%) |
| Total | 56 (59.6%) | 60 (63.8%) |
Disability Status by Sex by Age in Higden
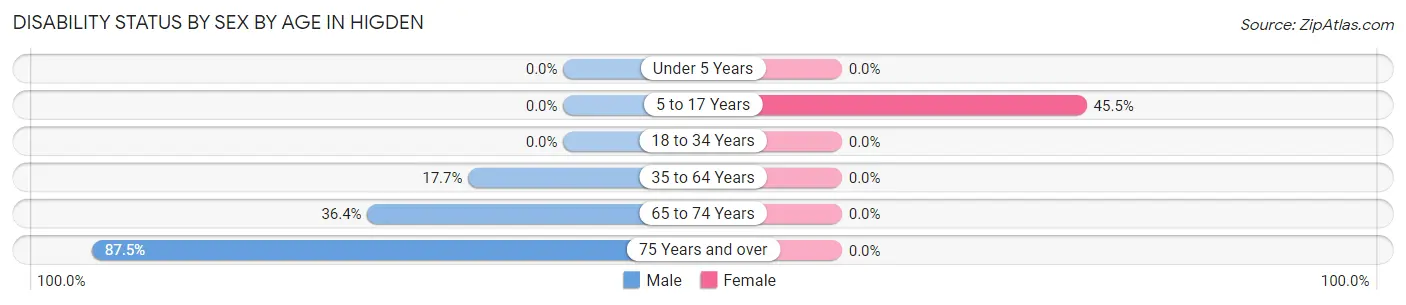
| Age Bracket | Male | Female |
| Under 5 Years | 0 (0.0%) | 0 (0.0%) |
| 5 to 17 Years | 0 (0.0%) | 5 (45.5%) |
| 18 to 34 Years | 0 (0.0%) | 0 (0.0%) |
| 35 to 64 Years | 3 (17.6%) | 0 (0.0%) |
| 65 to 74 Years | 4 (36.4%) | 0 (0.0%) |
| 75 Years and over | 7 (87.5%) | 0 (0.0%) |
Disability Class by Sex by Age in Higden
Disability Class: Hearing Difficulty
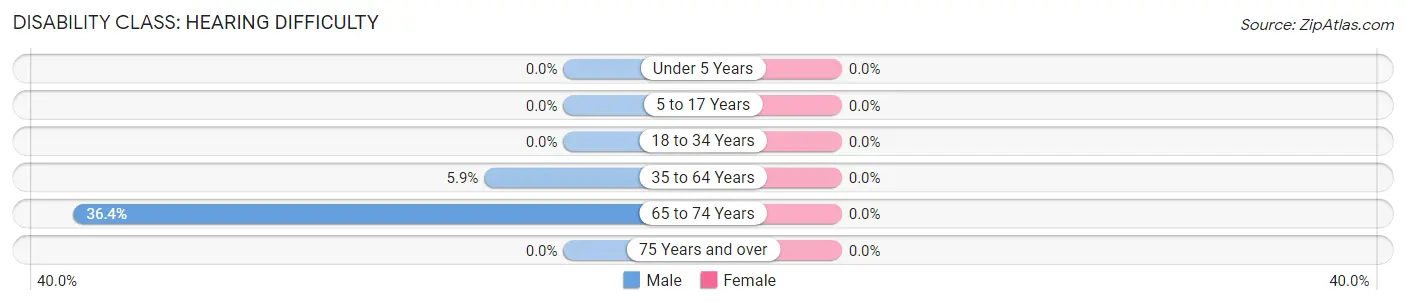
| Age Bracket | Male | Female |
| Under 5 Years | 0 (0.0%) | 0 (0.0%) |
| 5 to 17 Years | 0 (0.0%) | 0 (0.0%) |
| 18 to 34 Years | 0 (0.0%) | 0 (0.0%) |
| 35 to 64 Years | 1 (5.9%) | 0 (0.0%) |
| 65 to 74 Years | 4 (36.4%) | 0 (0.0%) |
| 75 Years and over | 0 (0.0%) | 0 (0.0%) |
Disability Class: Vision Difficulty
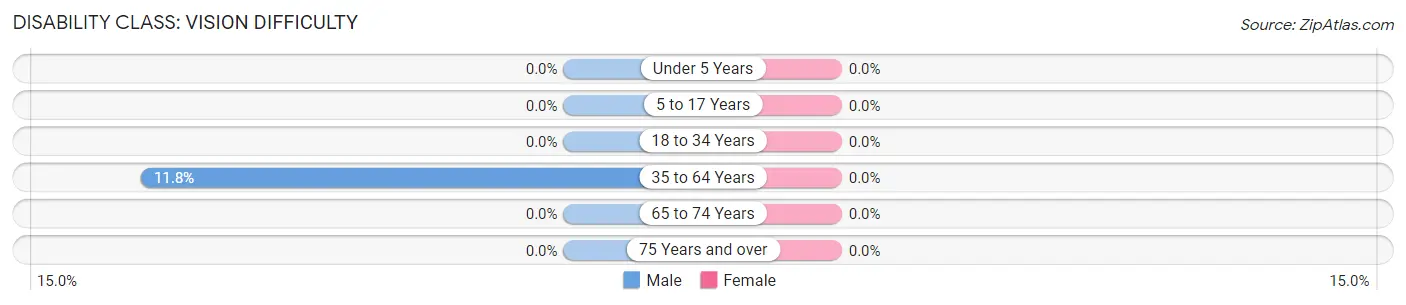
| Age Bracket | Male | Female |
| Under 5 Years | 0 (0.0%) | 0 (0.0%) |
| 5 to 17 Years | 0 (0.0%) | 0 (0.0%) |
| 18 to 34 Years | 0 (0.0%) | 0 (0.0%) |
| 35 to 64 Years | 2 (11.8%) | 0 (0.0%) |
| 65 to 74 Years | 0 (0.0%) | 0 (0.0%) |
| 75 Years and over | 0 (0.0%) | 0 (0.0%) |
Disability Class: Cognitive Difficulty
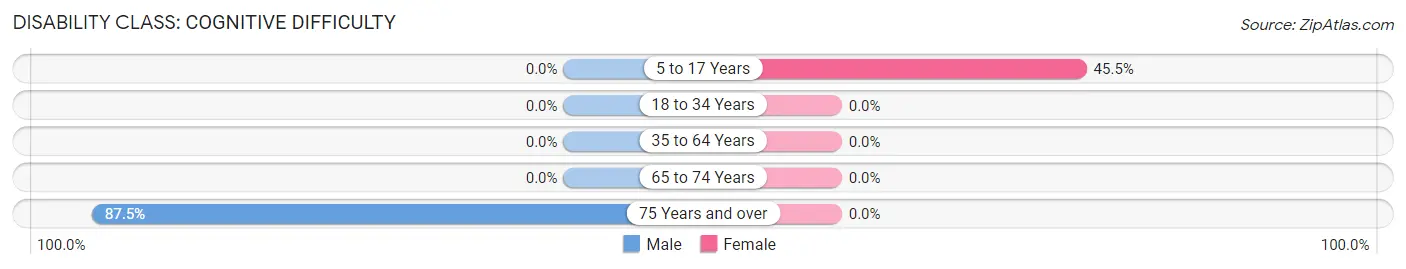
| Age Bracket | Male | Female |
| 5 to 17 Years | 0 (0.0%) | 5 (45.5%) |
| 18 to 34 Years | 0 (0.0%) | 0 (0.0%) |
| 35 to 64 Years | 0 (0.0%) | 0 (0.0%) |
| 65 to 74 Years | 0 (0.0%) | 0 (0.0%) |
| 75 Years and over | 7 (87.5%) | 0 (0.0%) |
Disability Class: Ambulatory Difficulty
| Age Bracket | Male | Female |
| 5 to 17 Years | 0 (0.0%) | 0 (0.0%) |
| 18 to 34 Years | 0 (0.0%) | 0 (0.0%) |
| 35 to 64 Years | 0 (0.0%) | 0 (0.0%) |
| 65 to 74 Years | 0 (0.0%) | 0 (0.0%) |
| 75 Years and over | 0 (0.0%) | 0 (0.0%) |
Disability Class: Self-Care Difficulty
| Age Bracket | Male | Female |
| 5 to 17 Years | 0 (0.0%) | 0 (0.0%) |
| 18 to 34 Years | 0 (0.0%) | 0 (0.0%) |
| 35 to 64 Years | 0 (0.0%) | 0 (0.0%) |
| 65 to 74 Years | 0 (0.0%) | 0 (0.0%) |
| 75 Years and over | 0 (0.0%) | 0 (0.0%) |
Technology Access in Higden
Computing Device Access in Higden
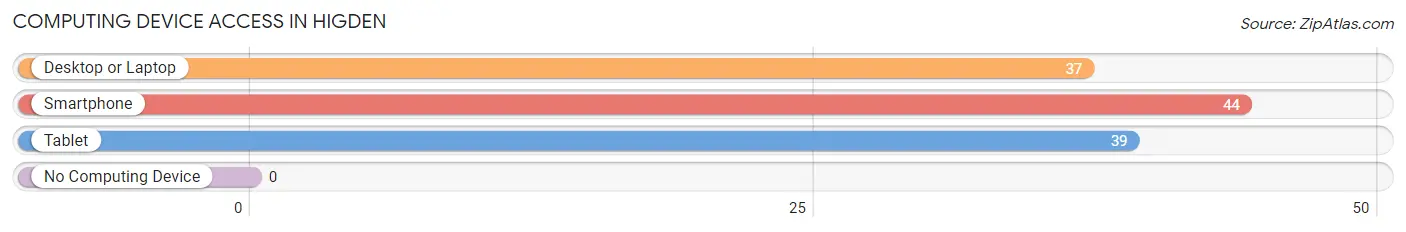
| Device Type | # Households | % Households |
| Desktop or Laptop | 37 | 82.2% |
| Smartphone | 44 | 97.8% |
| Tablet | 39 | 86.7% |
| No Computing Device | 0 | 0.0% |
| Total | 45 | 100.0% |
Internet Access in Higden
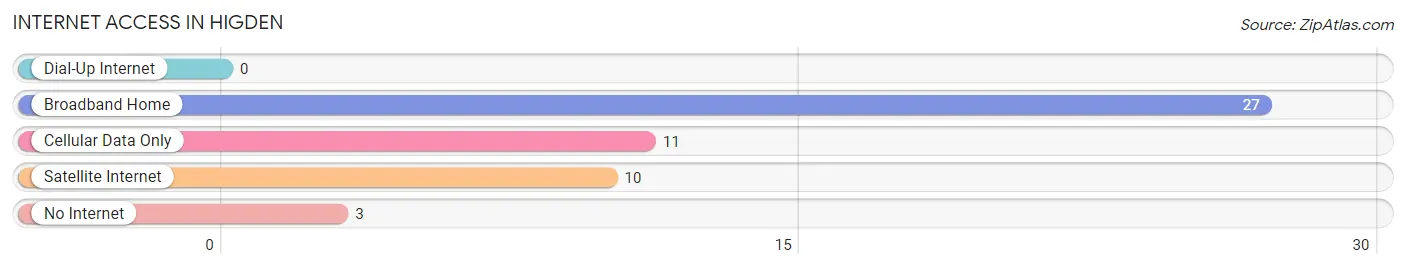
| Internet Type | # Households | % Households |
| Dial-Up Internet | 0 | 0.0% |
| Broadband Home | 27 | 60.0% |
| Cellular Data Only | 11 | 24.4% |
| Satellite Internet | 10 | 22.2% |
| No Internet | 3 | 6.7% |
| Total | 45 | 100.0% |
Higden Summary
History
The small town of Higden, Arkansas is located in Cleburne County in the foothills of the Ozark Mountains. The town was founded in 1883 by a group of settlers from the nearby town of Greers Ferry. The town was named after the Higden family, who were among the first settlers.
The town was originally a farming community, with the main crops being cotton, corn, and wheat. The town also had a sawmill and a gristmill, which provided lumber and grain for the local farmers.
In the early 1900s, the town began to grow and develop. The first school was built in 1906, and the first post office was established in 1907. The town also had a general store, a blacksmith shop, and a few other businesses.
In the 1920s, the town began to experience a period of growth and prosperity. The population increased from around 200 in 1920 to over 500 in 1930. During this time, the town had several churches, a bank, a movie theater, and a variety of other businesses.
The Great Depression hit the town hard, and the population declined to around 300 by 1940. The town was able to recover, however, and by 1950 the population had grown to over 600.
The town continued to grow and develop throughout the 1950s and 1960s. The population reached over 1,000 by 1970, and the town had a variety of businesses, including a grocery store, a hardware store, and a variety of other shops.
Geography
Higden is located in the foothills of the Ozark Mountains in Cleburne County, Arkansas. The town is situated on the banks of the Little Red River, which flows through the area. The town is surrounded by rolling hills and forests, and is located about 25 miles from the nearest major city, Little Rock.
The town has a total area of 1.2 square miles, all of which is land. The town has a humid subtropical climate, with hot, humid summers and mild winters. The average annual temperature is around 65 degrees Fahrenheit, and the average annual precipitation is around 45 inches.
Economy
The economy of Higden is largely based on agriculture. The town is home to several farms, which produce a variety of crops, including cotton, corn, and wheat. The town also has a few small businesses, including a grocery store, a hardware store, and a few other shops.
The town is also home to a few manufacturing companies, which produce a variety of products, including furniture, clothing, and other items. The town also has a few restaurants and bars, which provide employment for local residents.
Demographics
As of the 2010 census, the population of Higden was 1,093. The racial makeup of the town was 97.3% White, 0.7% African American, 0.3% Native American, 0.2% Asian, 0.1% Pacific Islander, and 1.4% from other races. Hispanic or Latino of any race were 1.7% of the population.
The median household income in Higden was $35,625, and the median family income was $41,250. The per capita income was $17,845. About 16.2% of the population was below the poverty line.
Common Questions
What is Per Capita Income in Higden?
Per Capita income in Higden is $39,534.
What is the Median Household income in Higden?
Median Household Income in Higden is $57,188.
What is Inequality or Gini Index in Higden?
Inequality or Gini Index in Higden is 0.42.
What is the Total Population of Higden?
Total Population of Higden is 94.
What is the Total Male Population of Higden?
Total Male Population of Higden is 39.
What is the Total Female Population of Higden?
Total Female Population of Higden is 55.
What is the Ratio of Males per 100 Females in Higden?
There are 70.91 Males per 100 Females in Higden.
What is the Ratio of Females per 100 Males in Higden?
There are 141.03 Females per 100 Males in Higden.
What is the Median Population Age in Higden?
Median Population Age in Higden is 61.7 Years.
What is the Average Family Size in Higden
Average Family Size in Higden is 2.3 People.
What is the Average Household Size in Higden
Average Household Size in Higden is 2.1 People.
How Large is the Labor Force in Higden?
There are 37 People in the Labor Forcein in Higden.
What is the Percentage of People in the Labor Force in Higden?
46.3% of People are in the Labor Force in Higden.
What is the Unemployment Rate in Higden?
Unemployment Rate in Higden is 18.9%.