Hazen, AR Map & Demographics
Hazen Map
Hazen Overview
$24,340
PER CAPITA INCOME
$66,250
AVG FAMILY INCOME
$47,209
AVG HOUSEHOLD INCOME
45.3%
WAGE / INCOME GAP [ % ]
54.7¢/ $1
WAGE / INCOME GAP [ $ ]
0.40
INEQUALITY / GINI INDEX
1,738
TOTAL POPULATION
844
MALE POPULATION
894
FEMALE POPULATION
94.41
MALES / 100 FEMALES
105.92
FEMALES / 100 MALES
43.3
MEDIAN AGE
3.4
AVG FAMILY SIZE
2.8
AVG HOUSEHOLD SIZE
793
LABOR FORCE [ PEOPLE ]
57.9%
PERCENT IN LABOR FORCE
3.3%
UNEMPLOYMENT RATE
Hazen Zip Codes
Hazen Area Codes
Income in Hazen
Income Overview in Hazen
Per Capita Income in Hazen is $24,340, while median incomes of families and households are $66,250 and $47,209 respectively.
| Characteristic | Number | Measure |
| Per Capita Income | 1,738 | $24,340 |
| Median Family Income | 419 | $66,250 |
| Mean Family Income | 419 | $76,225 |
| Median Household Income | 588 | $47,209 |
| Mean Household Income | 588 | $64,189 |
| Income Deficit | 419 | $0 |
| Wage / Income Gap (%) | 1,738 | 45.32% |
| Wage / Income Gap ($) | 1,738 | 54.68¢ per $1 |
| Gini / Inequality Index | 1,738 | 0.40 |
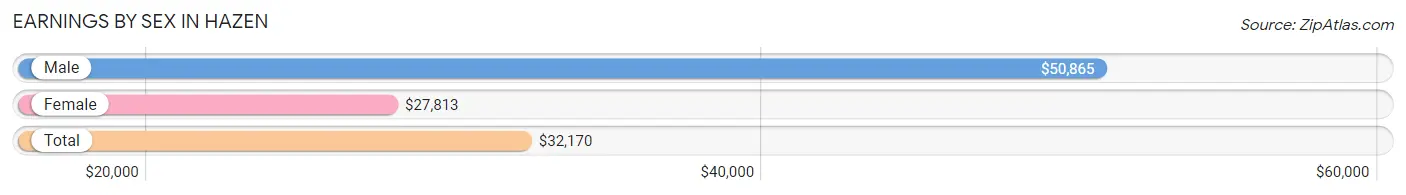
Earnings by Sex in Hazen
Average Earnings in Hazen are $32,170, $50,865 for men and $27,813 for women, a difference of 45.3%.
| Sex | Number | Average Earnings |
| Male | 356 (43.0%) | $50,865 |
| Female | 472 (57.0%) | $27,813 |
| Total | 828 (100.0%) | $32,170 |
Earnings by Sex by Income Bracket in Hazen
The most common earnings brackets in Hazen are $55,000 to $64,999 for men (66 | 18.5%) and $30,000 to $34,999 for women (74 | 15.7%).
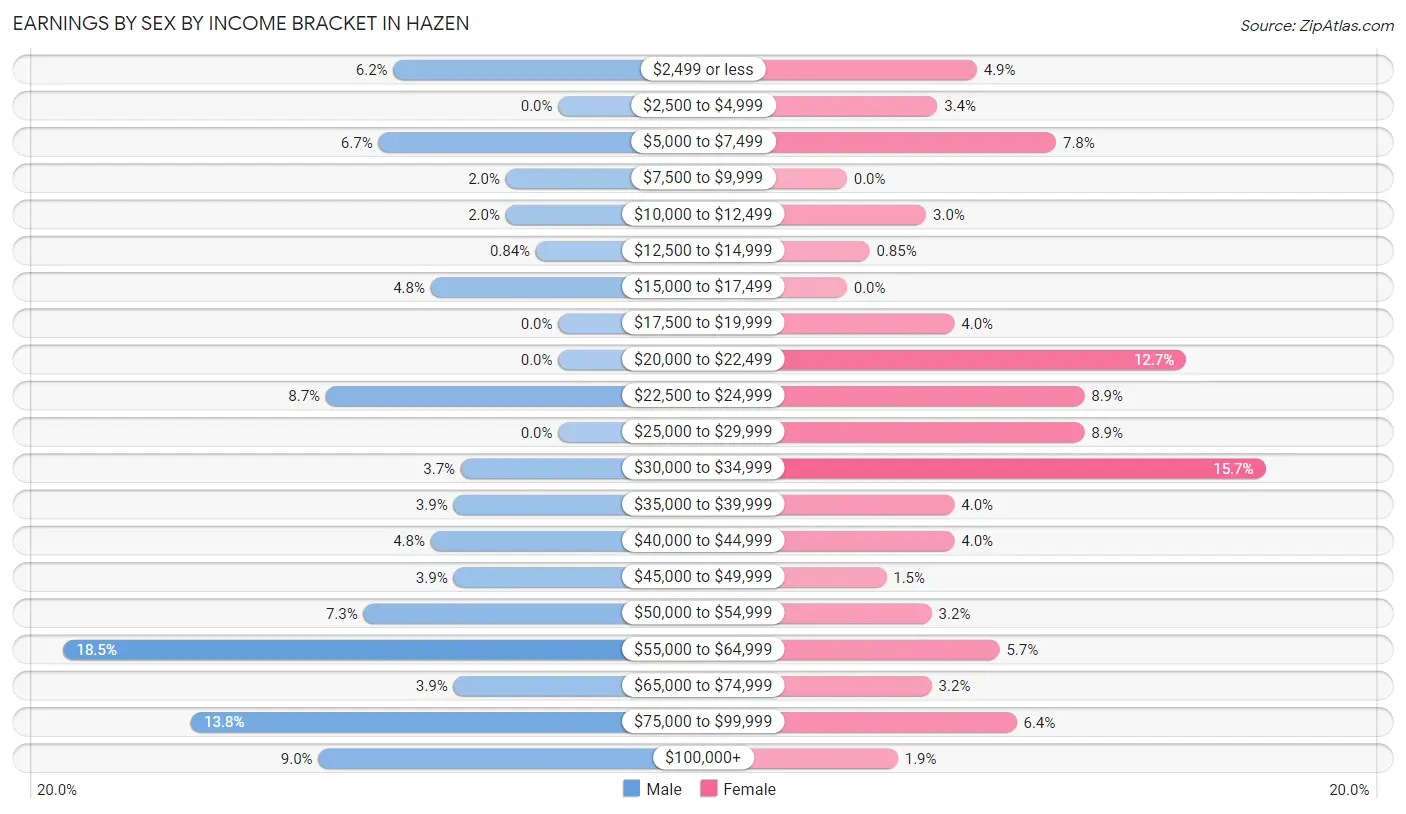
| Income | Male | Female |
| $2,499 or less | 22 (6.2%) | 23 (4.9%) |
| $2,500 to $4,999 | 0 (0.0%) | 16 (3.4%) |
| $5,000 to $7,499 | 24 (6.7%) | 37 (7.8%) |
| $7,500 to $9,999 | 7 (2.0%) | 0 (0.0%) |
| $10,000 to $12,499 | 7 (2.0%) | 14 (3.0%) |
| $12,500 to $14,999 | 3 (0.8%) | 4 (0.9%) |
| $15,000 to $17,499 | 17 (4.8%) | 0 (0.0%) |
| $17,500 to $19,999 | 0 (0.0%) | 19 (4.0%) |
| $20,000 to $22,499 | 0 (0.0%) | 60 (12.7%) |
| $22,500 to $24,999 | 31 (8.7%) | 42 (8.9%) |
| $25,000 to $29,999 | 0 (0.0%) | 42 (8.9%) |
| $30,000 to $34,999 | 13 (3.6%) | 74 (15.7%) |
| $35,000 to $39,999 | 14 (3.9%) | 19 (4.0%) |
| $40,000 to $44,999 | 17 (4.8%) | 19 (4.0%) |
| $45,000 to $49,999 | 14 (3.9%) | 7 (1.5%) |
| $50,000 to $54,999 | 26 (7.3%) | 15 (3.2%) |
| $55,000 to $64,999 | 66 (18.5%) | 27 (5.7%) |
| $65,000 to $74,999 | 14 (3.9%) | 15 (3.2%) |
| $75,000 to $99,999 | 49 (13.8%) | 30 (6.4%) |
| $100,000+ | 32 (9.0%) | 9 (1.9%) |
| Total | 356 (100.0%) | 472 (100.0%) |
Earnings by Sex by Educational Attainment in Hazen
Average earnings in Hazen are $51,779 for men and $28,490 for women, a difference of 45.0%. Men with an educational attainment of bachelor's degree enjoy the highest average annual earnings of $72,500, while those with less than high school education earn the least with $15,588. Women with an educational attainment of graduate degree earn the most with the average annual earnings of $53,333, while those with high school diploma education have the smallest earnings of $21,250.
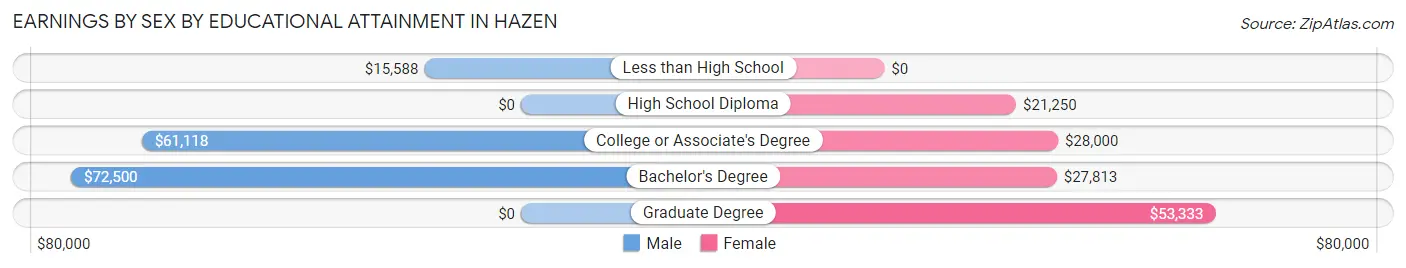
| Educational Attainment | Male Income | Female Income |
| Less than High School | $15,588 | $0 |
| High School Diploma | - | - |
| College or Associate's Degree | $61,118 | $28,000 |
| Bachelor's Degree | $72,500 | $27,813 |
| Graduate Degree | - | - |
| Total | $51,779 | $28,490 |
Family Income in Hazen
Family Income Brackets in Hazen
According to the Hazen family income data, there are 123 families falling into the $35,000 to $49,999 income range, which is the most common income bracket and makes up 29.4% of all families.
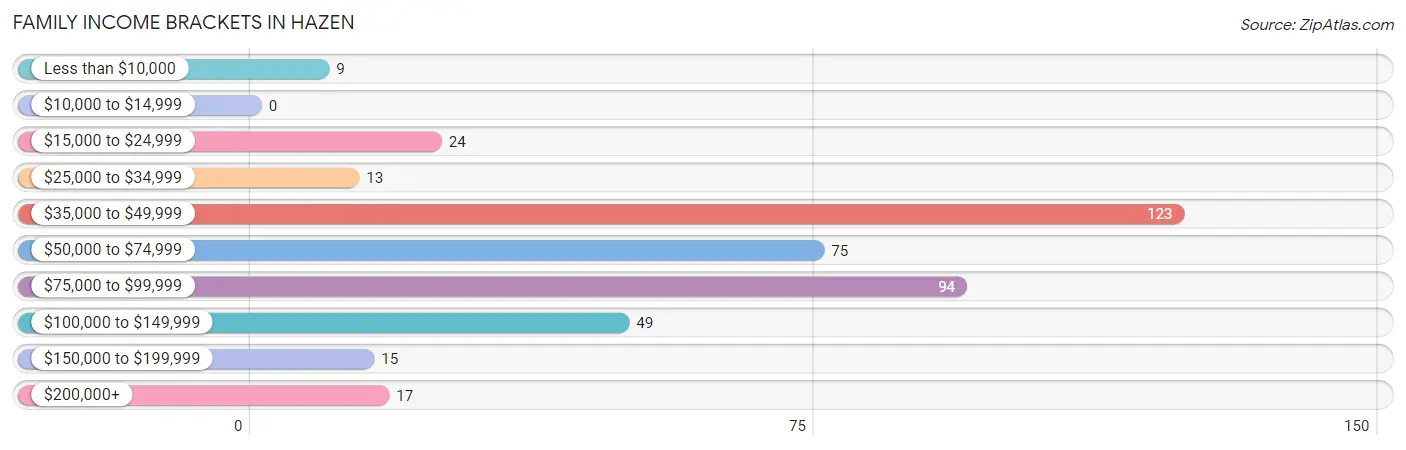
| Income Bracket | # Families | % Families |
| Less than $10,000 | 9 | 2.1% |
| $10,000 to $14,999 | 0 | 0.0% |
| $15,000 to $24,999 | 24 | 5.7% |
| $25,000 to $34,999 | 13 | 3.1% |
| $35,000 to $49,999 | 123 | 29.4% |
| $50,000 to $74,999 | 75 | 17.9% |
| $75,000 to $99,999 | 94 | 22.4% |
| $100,000 to $149,999 | 49 | 11.7% |
| $150,000 to $199,999 | 15 | 3.6% |
| $200,000+ | 17 | 4.1% |
Family Income by Famaliy Size in Hazen
4-person families (84 | 20.1%) account for the highest median family income in Hazen with $83,564 per family, while 2-person families (197 | 47.0%) have the highest median income of $30,625 per family member.
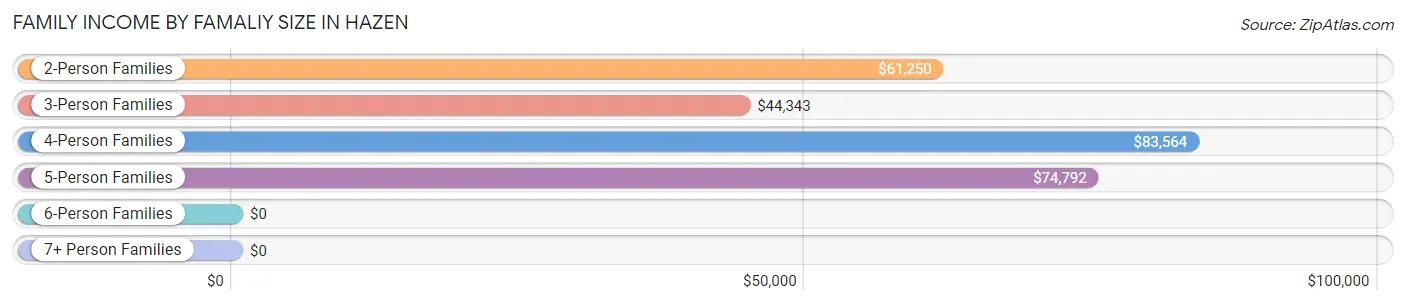
| Income Bracket | # Families | Median Income |
| 2-Person Families | 197 (47.0%) | $61,250 |
| 3-Person Families | 109 (26.0%) | $44,343 |
| 4-Person Families | 84 (20.1%) | $83,564 |
| 5-Person Families | 19 (4.5%) | $74,792 |
| 6-Person Families | 10 (2.4%) | $0 |
| 7+ Person Families | 0 (0.0%) | $0 |
| Total | 419 (100.0%) | $66,250 |
Family Income by Number of Earners in Hazen
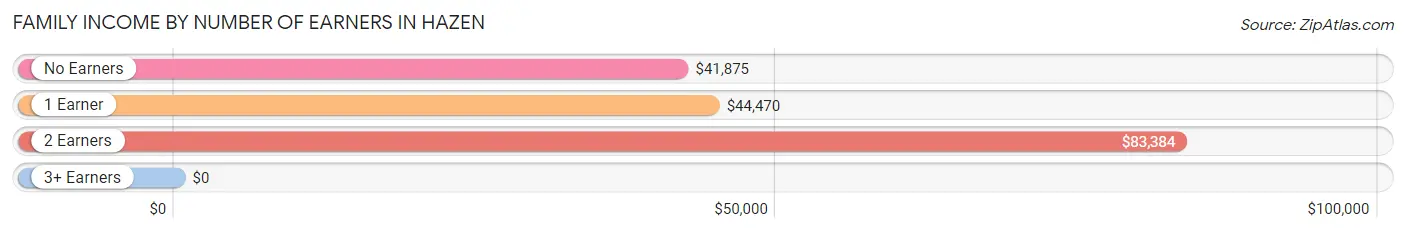
| Number of Earners | # Families | Median Income |
| No Earners | 42 (10.0%) | $41,875 |
| 1 Earner | 117 (27.9%) | $44,470 |
| 2 Earners | 251 (59.9%) | $83,384 |
| 3+ Earners | 9 (2.1%) | $0 |
| Total | 419 (100.0%) | $66,250 |
Household Income in Hazen
Household Income Brackets in Hazen
With 156 households falling in the category, the $35,000 to $49,999 income range is the most frequent in Hazen, accounting for 26.5% of all households. In contrast, only 17 households (2.9%) fall into the $200,000+ income bracket, making it the least populous group.
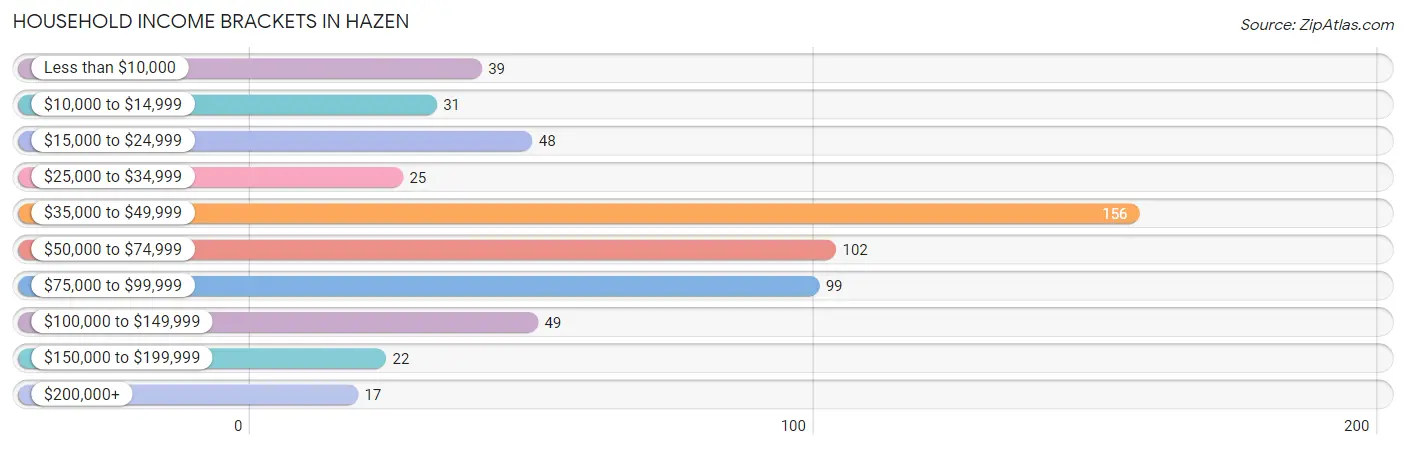
| Income Bracket | # Households | % Households |
| Less than $10,000 | 39 | 6.6% |
| $10,000 to $14,999 | 31 | 5.3% |
| $15,000 to $24,999 | 48 | 8.2% |
| $25,000 to $34,999 | 25 | 4.3% |
| $35,000 to $49,999 | 156 | 26.5% |
| $50,000 to $74,999 | 102 | 17.3% |
| $75,000 to $99,999 | 99 | 16.8% |
| $100,000 to $149,999 | 49 | 8.3% |
| $150,000 to $199,999 | 22 | 3.7% |
| $200,000+ | 17 | 2.9% |
Household Income by Householder Age in Hazen
The median household income in Hazen is $47,209, with the highest median household income of $64,722 found in the 25 to 44 years age bracket for the primary householder. A total of 104 households (17.7%) fall into this category. Meanwhile, the 15 to 24 years age bracket for the primary householder has the lowest median household income of $0, with 14 households (2.4%) in this group.
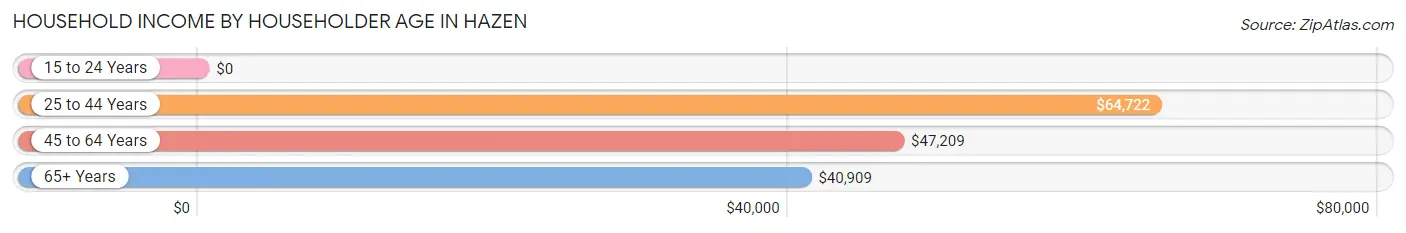
| Income Bracket | # Households | Median Income |
| 15 to 24 Years | 14 (2.4%) | $0 |
| 25 to 44 Years | 104 (17.7%) | $64,722 |
| 45 to 64 Years | 330 (56.1%) | $47,209 |
| 65+ Years | 140 (23.8%) | $40,909 |
| Total | 588 (100.0%) | $47,209 |
Poverty in Hazen
Income Below Poverty by Sex and Age in Hazen
With 14.7% poverty level for males and 17.8% for females among the residents of Hazen, 16 and 17 year old males and 12 to 14 year old females are the most vulnerable to poverty, with 11 males (78.6%) and 9 females (69.2%) in their respective age groups living below the poverty level.
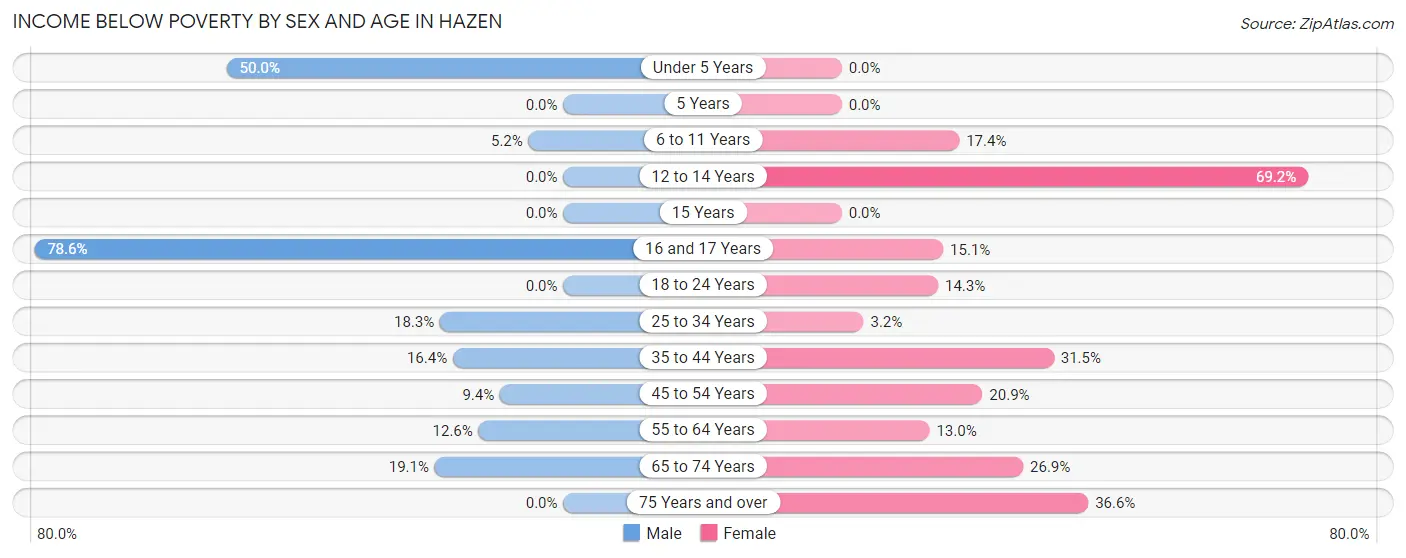
| Age Bracket | Male | Female |
| Under 5 Years | 22 (50.0%) | 0 (0.0%) |
| 5 Years | 0 (0.0%) | 0 (0.0%) |
| 6 to 11 Years | 8 (5.2%) | 15 (17.4%) |
| 12 to 14 Years | 0 (0.0%) | 9 (69.2%) |
| 15 Years | 0 (0.0%) | 0 (0.0%) |
| 16 and 17 Years | 11 (78.6%) | 14 (15.0%) |
| 18 to 24 Years | 0 (0.0%) | 10 (14.3%) |
| 25 to 34 Years | 13 (18.3%) | 4 (3.2%) |
| 35 to 44 Years | 10 (16.4%) | 34 (31.5%) |
| 45 to 54 Years | 11 (9.4%) | 19 (20.9%) |
| 55 to 64 Years | 20 (12.6%) | 22 (13.0%) |
| 65 to 74 Years | 21 (19.1%) | 14 (26.9%) |
| 75 Years and over | 0 (0.0%) | 15 (36.6%) |
| Total | 116 (14.7%) | 156 (17.8%) |
Income Above Poverty by Sex and Age in Hazen
According to the poverty statistics in Hazen, males aged 5 years and females aged under 5 years are the age groups that are most secure financially, with 100.0% of males and 100.0% of females in these age groups living above the poverty line.
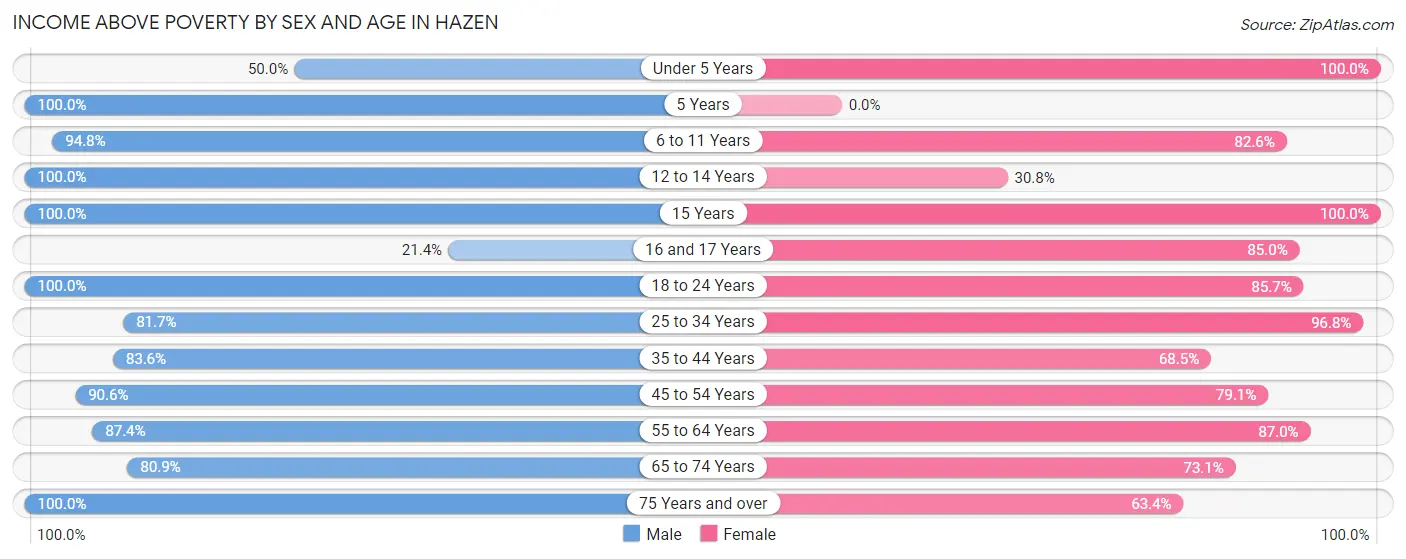
| Age Bracket | Male | Female |
| Under 5 Years | 22 (50.0%) | 21 (100.0%) |
| 5 Years | 12 (100.0%) | 0 (0.0%) |
| 6 to 11 Years | 147 (94.8%) | 71 (82.6%) |
| 12 to 14 Years | 17 (100.0%) | 4 (30.8%) |
| 15 Years | 11 (100.0%) | 10 (100.0%) |
| 16 and 17 Years | 3 (21.4%) | 79 (85.0%) |
| 18 to 24 Years | 8 (100.0%) | 60 (85.7%) |
| 25 to 34 Years | 58 (81.7%) | 120 (96.8%) |
| 35 to 44 Years | 51 (83.6%) | 74 (68.5%) |
| 45 to 54 Years | 106 (90.6%) | 72 (79.1%) |
| 55 to 64 Years | 139 (87.4%) | 147 (87.0%) |
| 65 to 74 Years | 89 (80.9%) | 38 (73.1%) |
| 75 Years and over | 10 (100.0%) | 26 (63.4%) |
| Total | 673 (85.3%) | 722 (82.2%) |
Income Below Poverty Among Married-Couple Families in Hazen
The poverty statistics for married-couple families in Hazen show that 3.0% or 10 of the total 333 families live below the poverty line. Families with no children have the highest poverty rate of 3.6%, comprising of 6 families. On the other hand, families with 3 or 4 children have the lowest poverty rate of 0.0%, which includes 0 families.
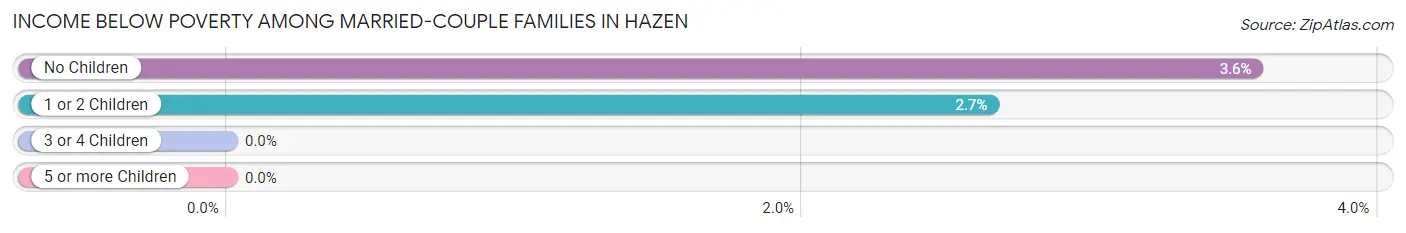
| Children | Above Poverty | Below Poverty |
| No Children | 162 (96.4%) | 6 (3.6%) |
| 1 or 2 Children | 147 (97.4%) | 4 (2.6%) |
| 3 or 4 Children | 14 (100.0%) | 0 (0.0%) |
| 5 or more Children | 0 (0.0%) | 0 (0.0%) |
| Total | 323 (97.0%) | 10 (3.0%) |
Income Below Poverty Among Single-Parent Households in Hazen
According to the poverty data in Hazen, 36.8% or 7 single-father households and 20.9% or 14 single-mother households are living below the poverty line. Among single-father households, those with no children have the highest poverty rate, with 7 households (100.0%) experiencing poverty. Likewise, among single-mother households, those with 3 or 4 children have the highest poverty rate, with 6 households (60.0%) falling below the poverty line.
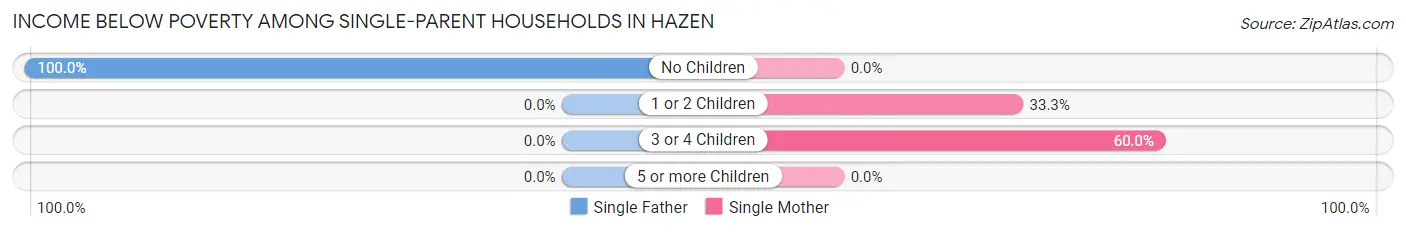
| Children | Single Father | Single Mother |
| No Children | 7 (100.0%) | 0 (0.0%) |
| 1 or 2 Children | 0 (0.0%) | 8 (33.3%) |
| 3 or 4 Children | 0 (0.0%) | 6 (60.0%) |
| 5 or more Children | 0 (0.0%) | 0 (0.0%) |
| Total | 7 (36.8%) | 14 (20.9%) |
Income Below Poverty Among Married-Couple vs Single-Parent Households in Hazen
The poverty data for Hazen shows that 10 of the married-couple family households (3.0%) and 21 of the single-parent households (24.4%) are living below the poverty level. Within the married-couple family households, those with no children have the highest poverty rate, with 6 households (3.6%) falling below the poverty line. Among the single-parent households, those with 3 or 4 children have the highest poverty rate, with 6 household (60.0%) living below poverty.
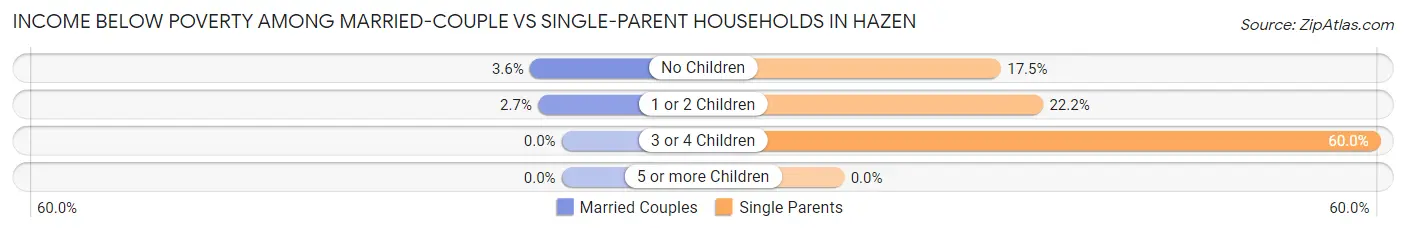
| Children | Married-Couple Families | Single-Parent Households |
| No Children | 6 (3.6%) | 7 (17.5%) |
| 1 or 2 Children | 4 (2.6%) | 8 (22.2%) |
| 3 or 4 Children | 0 (0.0%) | 6 (60.0%) |
| 5 or more Children | 0 (0.0%) | 0 (0.0%) |
| Total | 10 (3.0%) | 21 (24.4%) |
Race in Hazen
The most populous races in Hazen are White / Caucasian (1,271 | 73.1%), Black / African American (350 | 20.1%), and Two or more Races (96 | 5.5%).
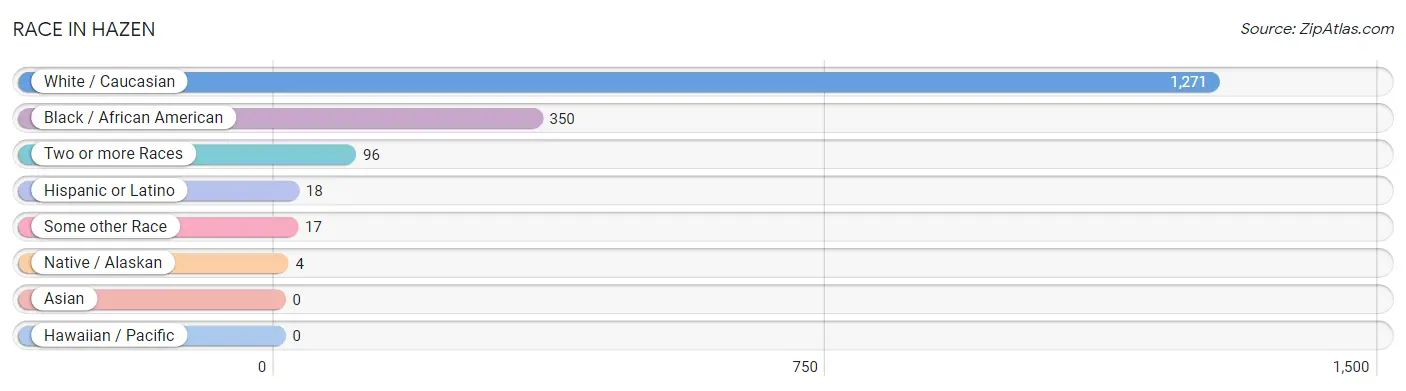
| Race | # Population | % Population |
| Asian | 0 | 0.0% |
| Black / African American | 350 | 20.1% |
| Hawaiian / Pacific | 0 | 0.0% |
| Hispanic or Latino | 18 | 1.0% |
| Native / Alaskan | 4 | 0.2% |
| White / Caucasian | 1,271 | 73.1% |
| Two or more Races | 96 | 5.5% |
| Some other Race | 17 | 1.0% |
| Total | 1,738 | 100.0% |
Ancestry in Hazen
The most populous ancestries reported in Hazen are Irish (328 | 18.9%), Dutch (218 | 12.5%), German (193 | 11.1%), English (122 | 7.0%), and American (19 | 1.1%), together accounting for 50.6% of all Hazen residents.
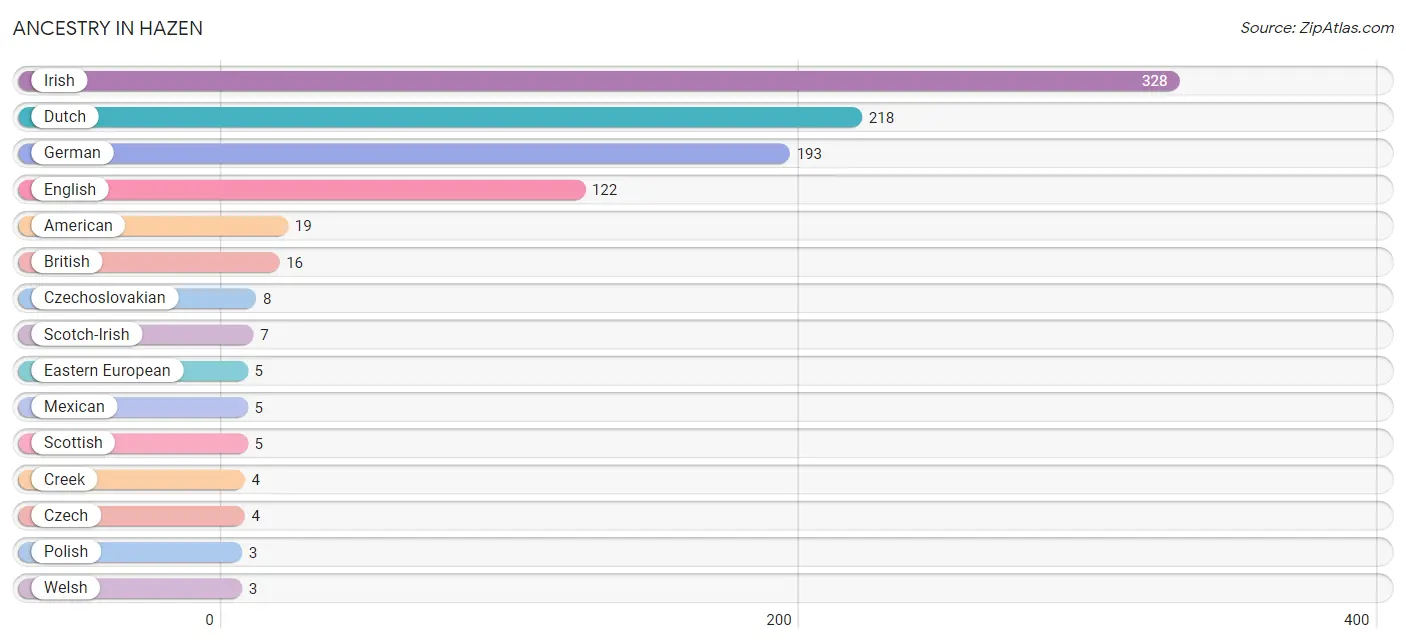
| Ancestry | # Population | % Population |
| American | 19 | 1.1% |
| British | 16 | 0.9% |
| Cherokee | 1 | 0.1% |
| Creek | 4 | 0.2% |
| Czech | 4 | 0.2% |
| Czechoslovakian | 8 | 0.5% |
| Dutch | 218 | 12.5% |
| Eastern European | 5 | 0.3% |
| English | 122 | 7.0% |
| German | 193 | 11.1% |
| Irish | 328 | 18.9% |
| Mexican | 5 | 0.3% |
| Polish | 3 | 0.2% |
| Scotch-Irish | 7 | 0.4% |
| Scottish | 5 | 0.3% |
| Swedish | 1 | 0.1% |
| Welsh | 3 | 0.2% |
| Yugoslavian | 3 | 0.2% | View All 18 Rows |
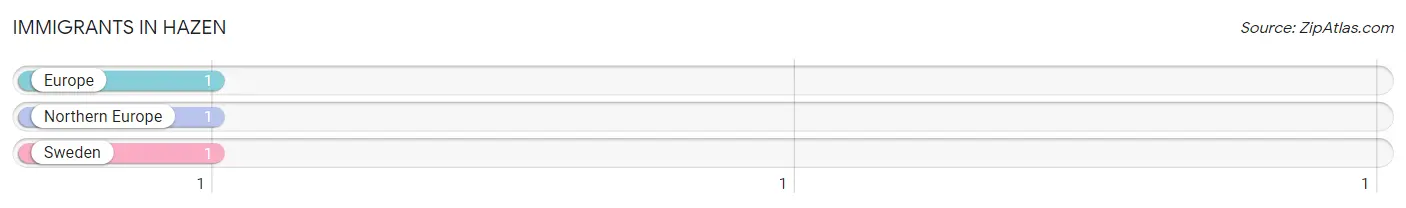
Immigrants in Hazen
The most numerous immigrant groups reported in Hazen came from Europe (1 | 0.1%), Northern Europe (1 | 0.1%), and Sweden (1 | 0.1%), together accounting for 0.2% of all Hazen residents.
| Immigration Origin | # Population | % Population |
| Europe | 1 | 0.1% |
| Northern Europe | 1 | 0.1% |
| Sweden | 1 | 0.1% | View All 3 Rows |
Sex and Age in Hazen
Sex and Age in Hazen
The most populous age groups in Hazen are 10 to 14 Years (144 | 17.1%) for men and 15 to 19 Years (121 | 13.5%) for women.
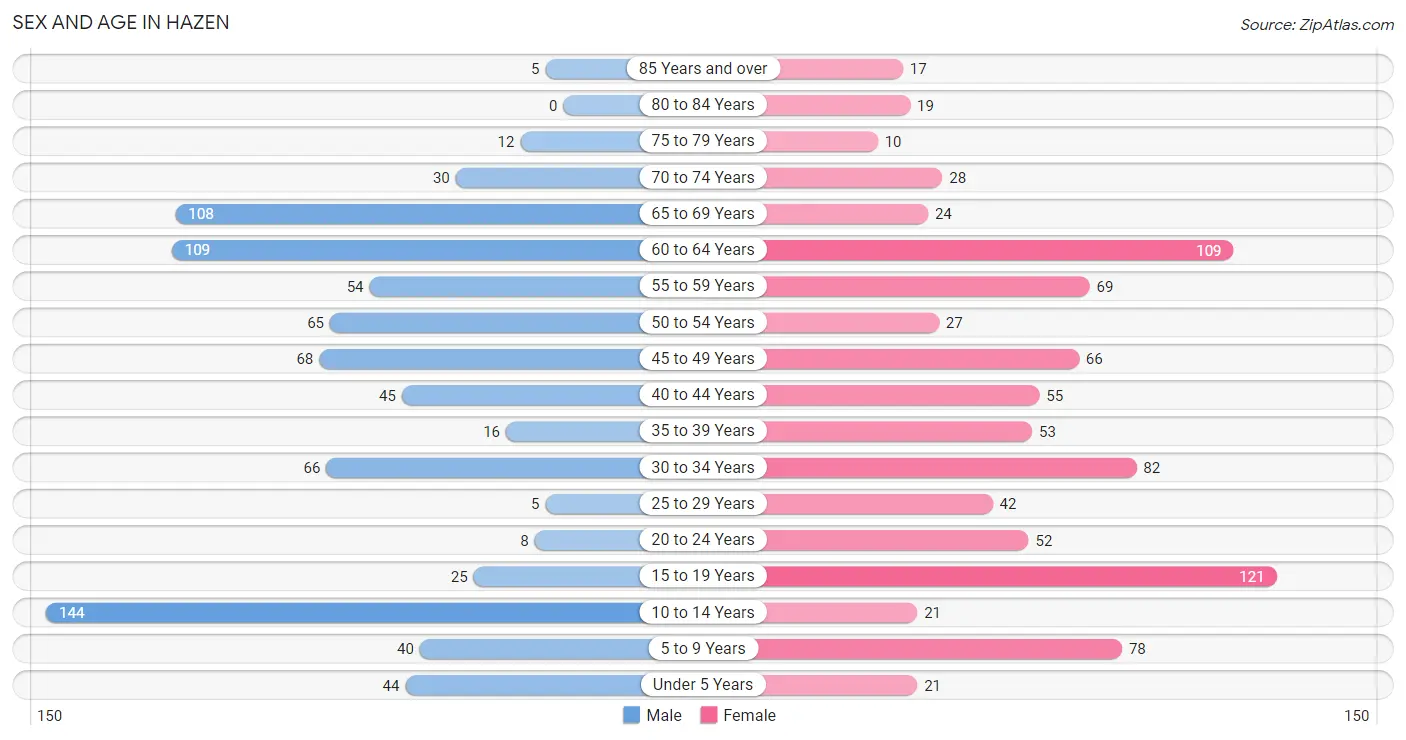
| Age Bracket | Male | Female |
| Under 5 Years | 44 (5.2%) | 21 (2.4%) |
| 5 to 9 Years | 40 (4.7%) | 78 (8.7%) |
| 10 to 14 Years | 144 (17.1%) | 21 (2.4%) |
| 15 to 19 Years | 25 (3.0%) | 121 (13.5%) |
| 20 to 24 Years | 8 (0.9%) | 52 (5.8%) |
| 25 to 29 Years | 5 (0.6%) | 42 (4.7%) |
| 30 to 34 Years | 66 (7.8%) | 82 (9.2%) |
| 35 to 39 Years | 16 (1.9%) | 53 (5.9%) |
| 40 to 44 Years | 45 (5.3%) | 55 (6.1%) |
| 45 to 49 Years | 68 (8.1%) | 66 (7.4%) |
| 50 to 54 Years | 65 (7.7%) | 27 (3.0%) |
| 55 to 59 Years | 54 (6.4%) | 69 (7.7%) |
| 60 to 64 Years | 109 (12.9%) | 109 (12.2%) |
| 65 to 69 Years | 108 (12.8%) | 24 (2.7%) |
| 70 to 74 Years | 30 (3.5%) | 28 (3.1%) |
| 75 to 79 Years | 12 (1.4%) | 10 (1.1%) |
| 80 to 84 Years | 0 (0.0%) | 19 (2.1%) |
| 85 Years and over | 5 (0.6%) | 17 (1.9%) |
| Total | 844 (100.0%) | 894 (100.0%) |
Families and Households in Hazen
Median Family Size in Hazen
The median family size in Hazen is 3.40 persons per family, with single female/mother families (67 | 16.0%) accounting for the largest median family size of 4.18 persons per family. On the other hand, married-couple families (333 | 79.5%) represent the smallest median family size with 3.23 persons per family.
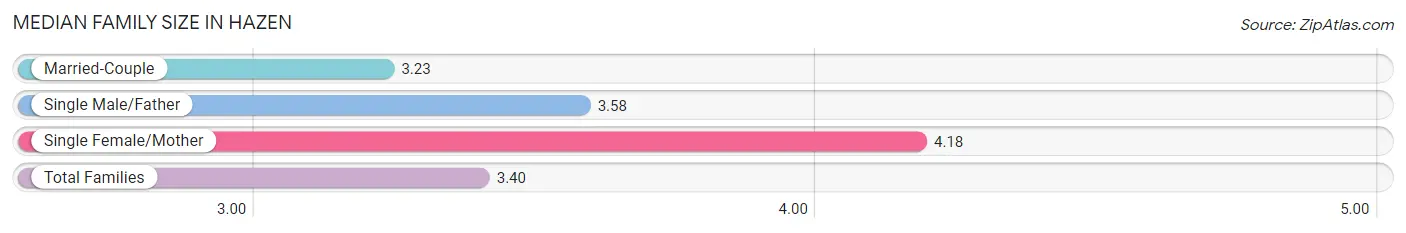
| Family Type | # Families | Family Size |
| Married-Couple | 333 (79.5%) | 3.23 |
| Single Male/Father | 19 (4.5%) | 3.58 |
| Single Female/Mother | 67 (16.0%) | 4.18 |
| Total Families | 419 (100.0%) | 3.40 |
Median Household Size in Hazen
The median household size in Hazen is 2.84 persons per household, with single female/mother households (67 | 11.4%) accounting for the largest median household size of 4.28 persons per household. non-family households (169 | 28.7%) represent the smallest median household size with 1.34 persons per household.
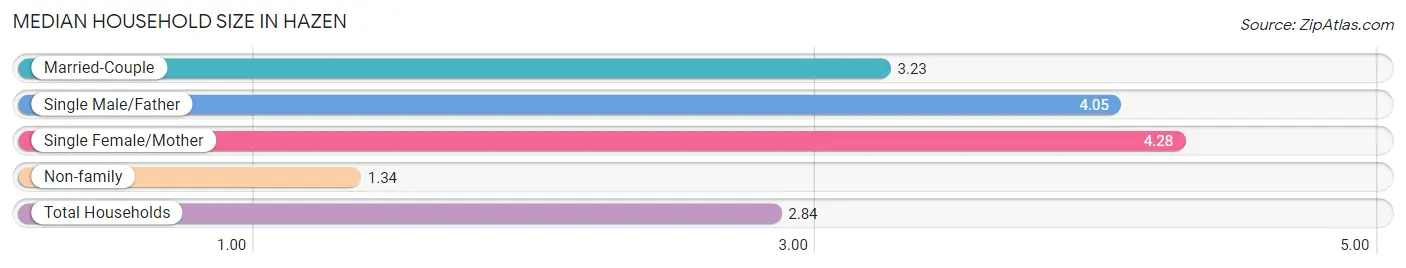
| Household Type | # Households | Household Size |
| Married-Couple | 333 (56.6%) | 3.23 |
| Single Male/Father | 19 (3.2%) | 4.05 |
| Single Female/Mother | 67 (11.4%) | 4.28 |
| Non-family | 169 (28.7%) | 1.34 |
| Total Households | 588 (100.0%) | 2.84 |
Household Size by Marriage Status in Hazen
Out of a total of 588 households in Hazen, 419 (71.3%) are family households, while 169 (28.7%) are nonfamily households. The most numerous type of family households are 2-person households, comprising 185, and the most common type of nonfamily households are 1-person households, comprising 115.
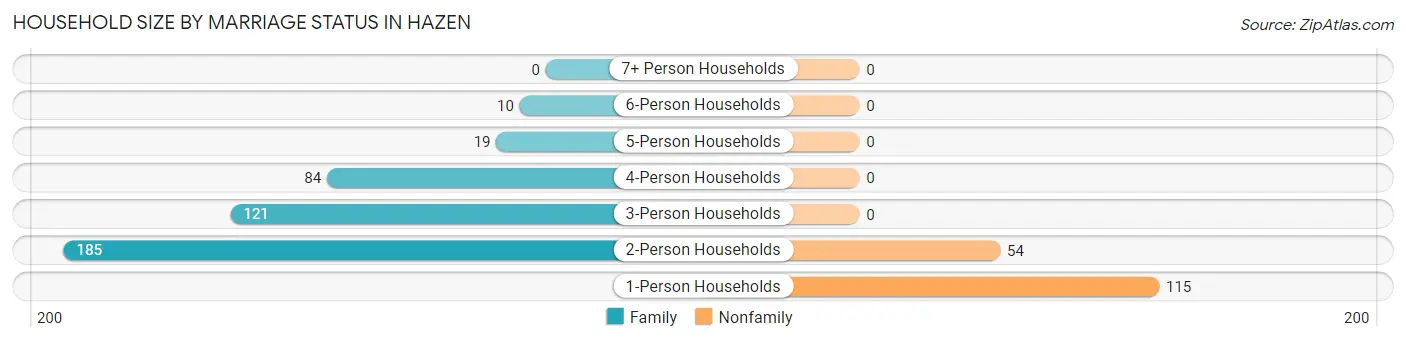
| Household Size | Family Households | Nonfamily Households |
| 1-Person Households | - | 115 (19.6%) |
| 2-Person Households | 185 (31.5%) | 54 (9.2%) |
| 3-Person Households | 121 (20.6%) | 0 (0.0%) |
| 4-Person Households | 84 (14.3%) | 0 (0.0%) |
| 5-Person Households | 19 (3.2%) | 0 (0.0%) |
| 6-Person Households | 10 (1.7%) | 0 (0.0%) |
| 7+ Person Households | 0 (0.0%) | 0 (0.0%) |
| Total | 419 (71.3%) | 169 (28.7%) |
Female Fertility in Hazen
Fertility by Age in Hazen
Average fertility rate in Hazen is 77.0 births per 1,000 women. Women in the age bracket of 20 to 34 years have the highest fertility rate with 210.0 births per 1,000 women. Women in the age bracket of 20 to 34 years acount for 100.0% of all women with births.
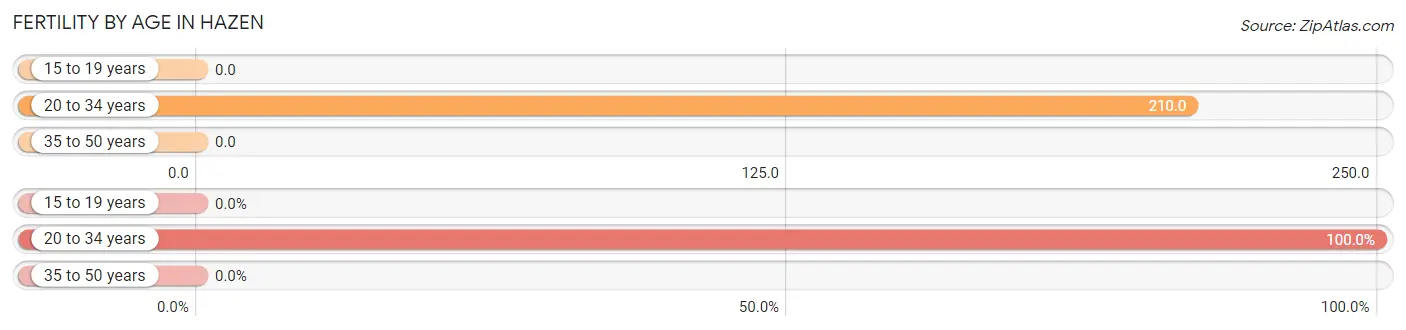
| Age Bracket | Women with Births | Births / 1,000 Women |
| 15 to 19 years | 0 (0.0%) | 0.0 |
| 20 to 34 years | 37 (100.0%) | 210.0 |
| 35 to 50 years | 0 (0.0%) | 0.0 |
| Total | 37 (100.0%) | 77.0 |
Fertility by Age by Marriage Status in Hazen
24.3% of women with births (37) in Hazen are married. The highest percentage of unmarried women with births falls into 20 to 34 years age bracket with 75.7% of them unmarried at the time of birth, while the lowest percentage of unmarried women with births belong to 20 to 34 years age bracket with 75.7% of them unmarried.
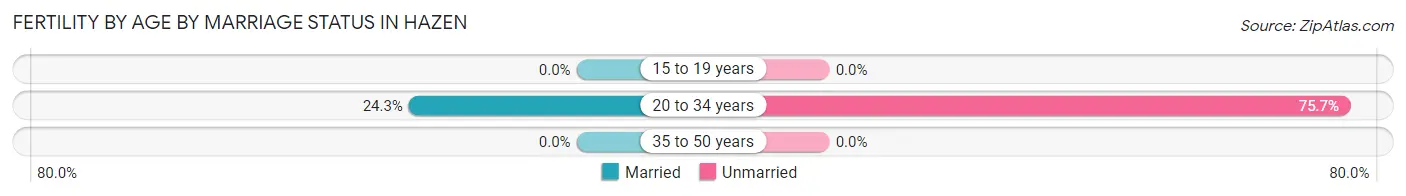
| Age Bracket | Married | Unmarried |
| 15 to 19 years | 0 (0.0%) | 0 (0.0%) |
| 20 to 34 years | 9 (24.3%) | 28 (75.7%) |
| 35 to 50 years | 0 (0.0%) | 0 (0.0%) |
| Total | 9 (24.3%) | 28 (75.7%) |
Fertility by Education in Hazen
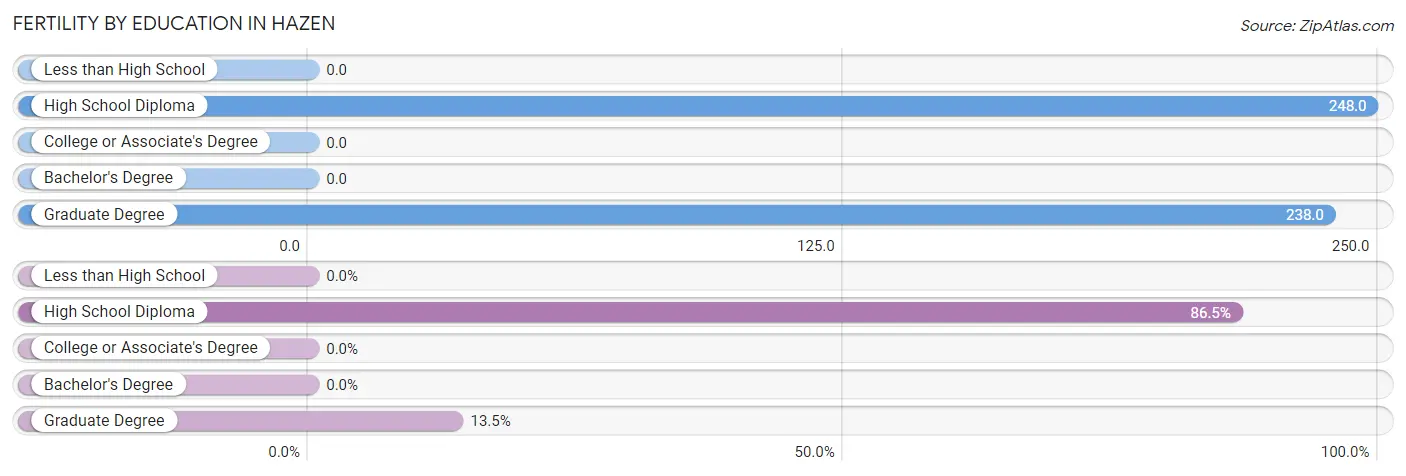
| Educational Attainment | Women with Births | Births / 1,000 Women |
| Less than High School | 0 (0.0%) | 0.0 |
| High School Diploma | 32 (86.5%) | 248.0 |
| College or Associate's Degree | 0 (0.0%) | 0.0 |
| Bachelor's Degree | 0 (0.0%) | 0.0 |
| Graduate Degree | 5 (13.5%) | 238.0 |
| Total | 37 (100.0%) | 77.0 |
Fertility by Education by Marriage Status in Hazen
75.7% of women with births in Hazen are unmarried. Women with the educational attainment of graduate degree are most likely to be married with 100.0% of them married at childbirth, while women with the educational attainment of high school diploma are least likely to be married with 87.5% of them unmarried at childbirth.
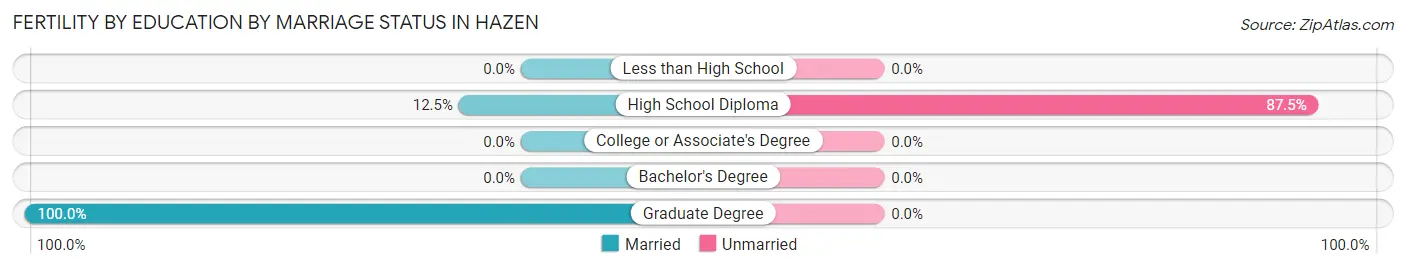
| Educational Attainment | Married | Unmarried |
| Less than High School | 0 (0.0%) | 0 (0.0%) |
| High School Diploma | 4 (12.5%) | 28 (87.5%) |
| College or Associate's Degree | 0 (0.0%) | 0 (0.0%) |
| Bachelor's Degree | 0 (0.0%) | 0 (0.0%) |
| Graduate Degree | 5 (100.0%) | 0 (0.0%) |
| Total | 9 (24.3%) | 28 (75.7%) |
Employment Characteristics in Hazen
Employment by Class of Employer in Hazen
Among the 758 employed individuals in Hazen, private company employees (409 | 54.0%), self-employed (not incorporated) (85 | 11.2%), and not-for-profit organizations (79 | 10.4%) make up the most common classes of employment.
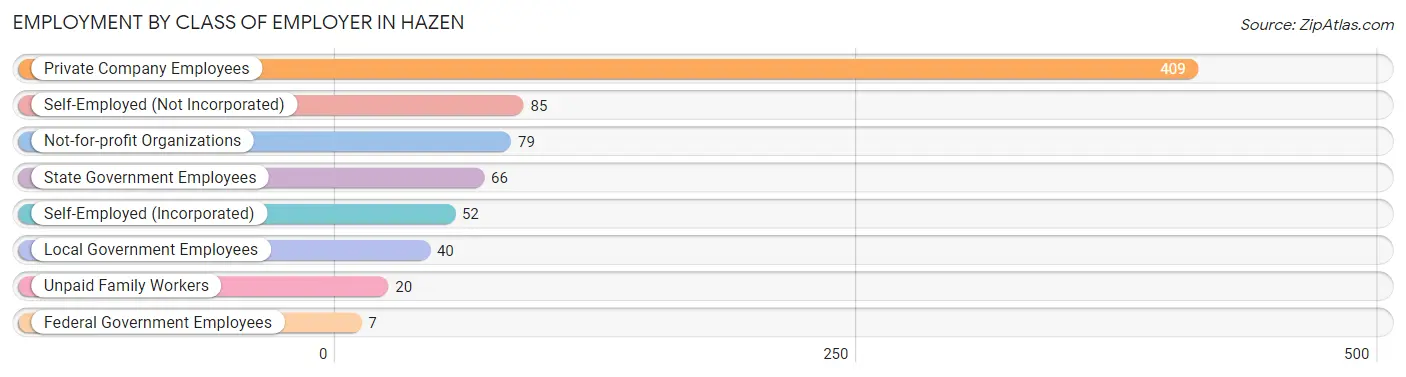
| Employer Class | # Employees | % Employees |
| Private Company Employees | 409 | 54.0% |
| Self-Employed (Incorporated) | 52 | 6.9% |
| Self-Employed (Not Incorporated) | 85 | 11.2% |
| Not-for-profit Organizations | 79 | 10.4% |
| Local Government Employees | 40 | 5.3% |
| State Government Employees | 66 | 8.7% |
| Federal Government Employees | 7 | 0.9% |
| Unpaid Family Workers | 20 | 2.6% |
| Total | 758 | 100.0% |
Employment Status by Age in Hazen
According to the labor force statistics for Hazen, out of the total population over 16 years of age (1,369), 57.9% or 793 individuals are in the labor force, with 3.3% or 26 of them unemployed. The age group with the highest labor force participation rate is 55 to 59 years, with 91.9% or 113 individuals in the labor force. Within the labor force, the 16 to 19 years age range has the highest percentage of unemployed individuals, with 45.5% or 15 of them being unemployed.
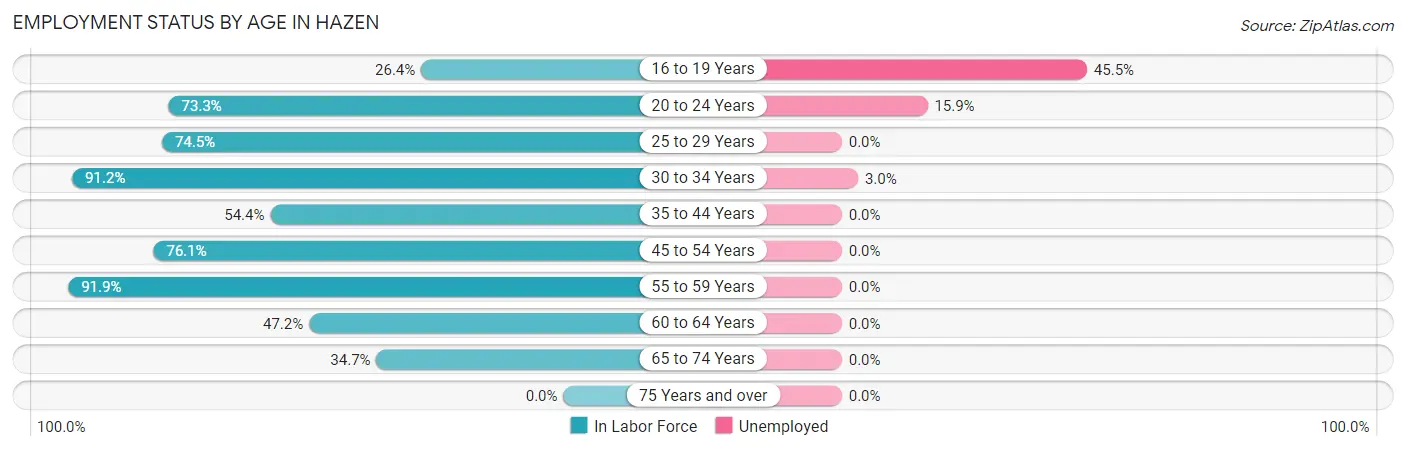
| Age Bracket | In Labor Force | Unemployed |
| 16 to 19 Years | 33 (26.4%) | 15 (45.5%) |
| 20 to 24 Years | 44 (73.3%) | 7 (15.9%) |
| 25 to 29 Years | 35 (74.5%) | 0 (0.0%) |
| 30 to 34 Years | 135 (91.2%) | 4 (3.0%) |
| 35 to 44 Years | 92 (54.4%) | 0 (0.0%) |
| 45 to 54 Years | 172 (76.1%) | 0 (0.0%) |
| 55 to 59 Years | 113 (91.9%) | 0 (0.0%) |
| 60 to 64 Years | 103 (47.2%) | 0 (0.0%) |
| 65 to 74 Years | 66 (34.7%) | 0 (0.0%) |
| 75 Years and over | 0 (0.0%) | 0 (0.0%) |
| Total | 793 (57.9%) | 26 (3.3%) |
Employment Status by Educational Attainment in Hazen
According to labor force statistics for Hazen, 69.8% of individuals (650) out of the total population between 25 and 64 years of age (931) are in the labor force, with 0.6% or 4 of them being unemployed. The group with the highest labor force participation rate are those with the educational attainment of bachelor's degree or higher, with 95.6% or 238 individuals in the labor force. Within the labor force, individuals with less than high school education have the highest percentage of unemployment, with 14.3% or 4 of them being unemployed.
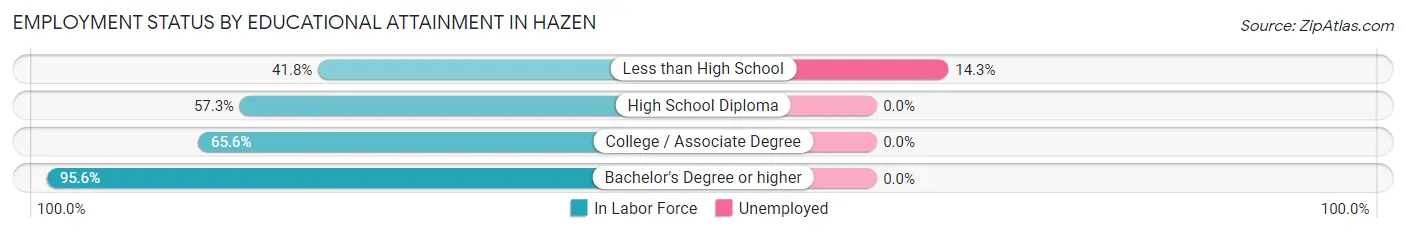
| Educational Attainment | In Labor Force | Unemployed |
| Less than High School | 28 (41.8%) | 10 (14.3%) |
| High School Diploma | 134 (57.3%) | 0 (0.0%) |
| College / Associate Degree | 250 (65.6%) | 0 (0.0%) |
| Bachelor's Degree or higher | 238 (95.6%) | 0 (0.0%) |
| Total | 650 (69.8%) | 6 (0.6%) |
Employment Occupations by Sex in Hazen
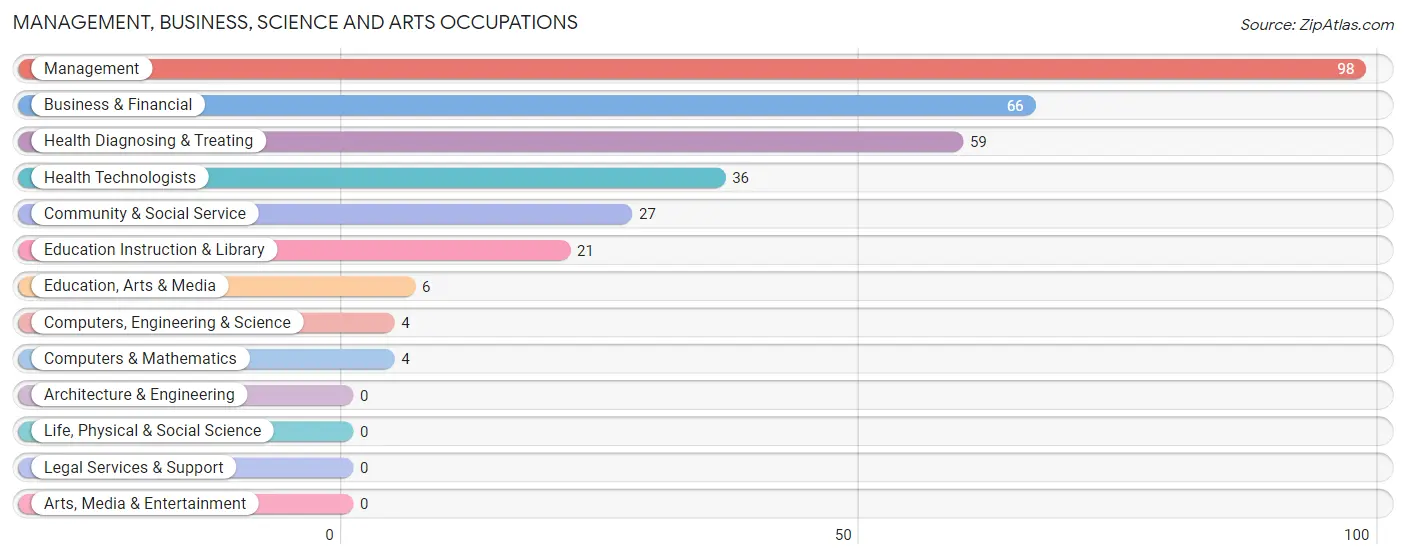
Management, Business, Science and Arts Occupations
The most common Management, Business, Science and Arts occupations in Hazen are Management (98 | 12.8%), Business & Financial (66 | 8.6%), Health Diagnosing & Treating (59 | 7.7%), Health Technologists (36 | 4.7%), and Community & Social Service (27 | 3.5%).
Management, Business, Science and Arts Occupations by Sex
Within the Management, Business, Science and Arts occupations in Hazen, the most male-oriented occupations are Management (85.7%), Education Instruction & Library (28.6%), and Community & Social Service (22.2%), while the most female-oriented occupations are Computers, Engineering & Science (100.0%), Computers & Mathematics (100.0%), and Education, Arts & Media (100.0%).
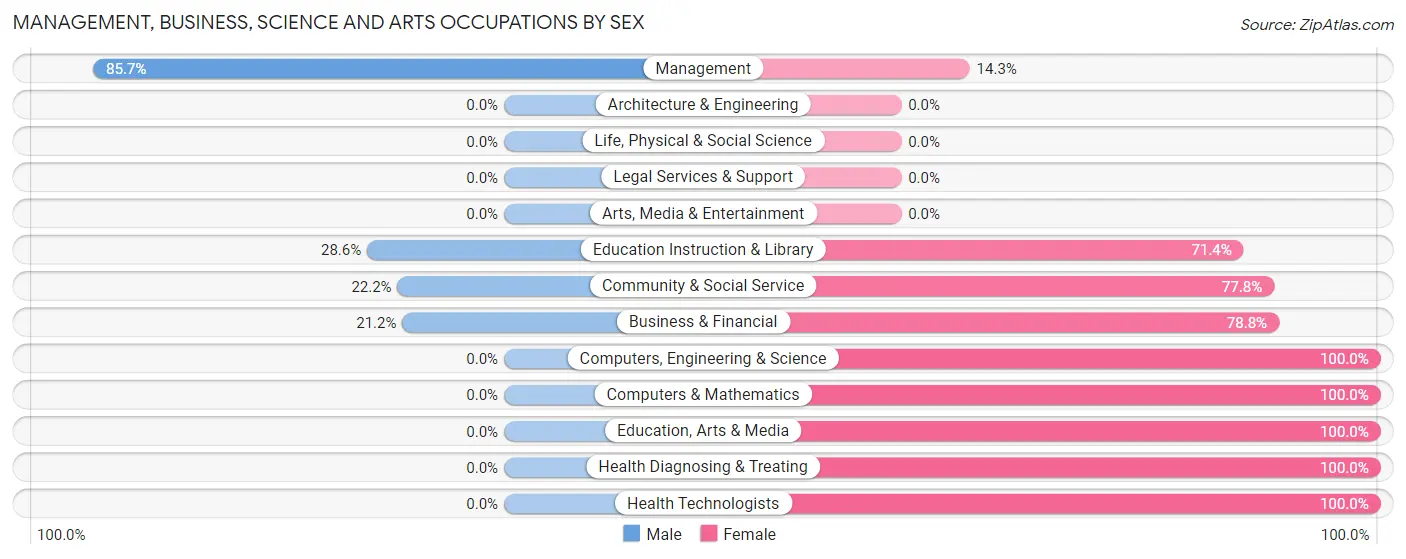
| Occupation | Male | Female |
| Management | 84 (85.7%) | 14 (14.3%) |
| Business & Financial | 14 (21.2%) | 52 (78.8%) |
| Computers, Engineering & Science | 0 (0.0%) | 4 (100.0%) |
| Computers & Mathematics | 0 (0.0%) | 4 (100.0%) |
| Architecture & Engineering | 0 (0.0%) | 0 (0.0%) |
| Life, Physical & Social Science | 0 (0.0%) | 0 (0.0%) |
| Community & Social Service | 6 (22.2%) | 21 (77.8%) |
| Education, Arts & Media | 0 (0.0%) | 6 (100.0%) |
| Legal Services & Support | 0 (0.0%) | 0 (0.0%) |
| Education Instruction & Library | 6 (28.6%) | 15 (71.4%) |
| Arts, Media & Entertainment | 0 (0.0%) | 0 (0.0%) |
| Health Diagnosing & Treating | 0 (0.0%) | 59 (100.0%) |
| Health Technologists | 0 (0.0%) | 36 (100.0%) |
| Total (Category) | 104 (40.9%) | 150 (59.1%) |
| Total (Overall) | 320 (41.7%) | 447 (58.3%) |
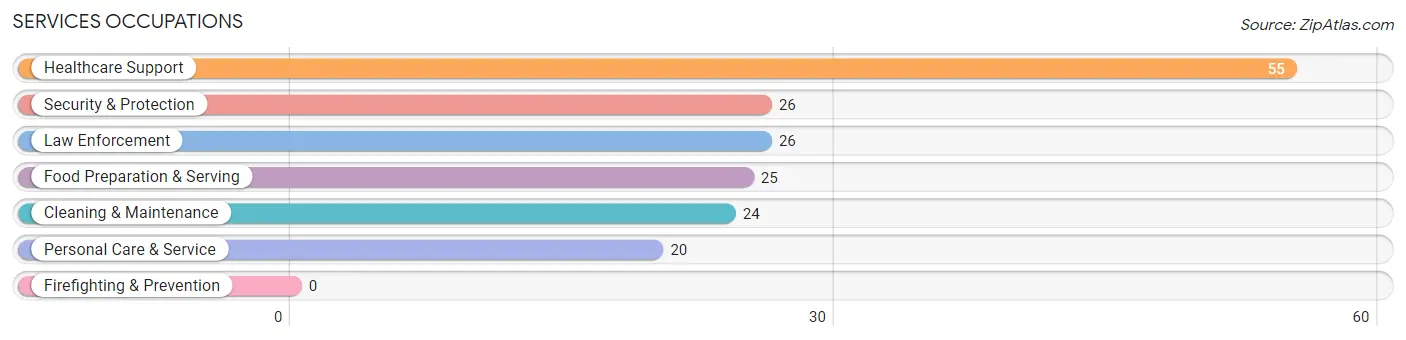
Services Occupations
The most common Services occupations in Hazen are Healthcare Support (55 | 7.2%), Security & Protection (26 | 3.4%), Law Enforcement (26 | 3.4%), Food Preparation & Serving (25 | 3.3%), and Cleaning & Maintenance (24 | 3.1%).
Services Occupations by Sex
Within the Services occupations in Hazen, the most male-oriented occupations are Security & Protection (100.0%), Law Enforcement (100.0%), and Cleaning & Maintenance (50.0%), while the most female-oriented occupations are Healthcare Support (100.0%), Food Preparation & Serving (100.0%), and Personal Care & Service (85.0%).
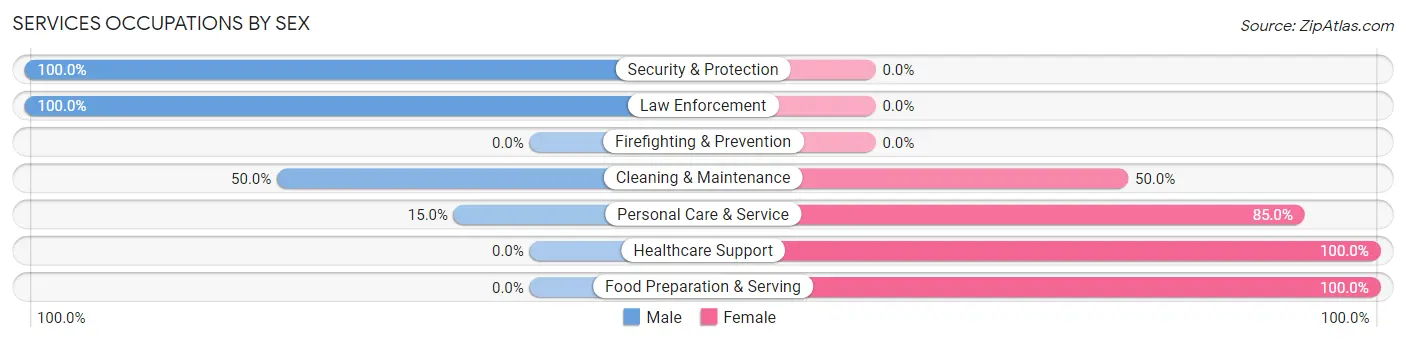
| Occupation | Male | Female |
| Healthcare Support | 0 (0.0%) | 55 (100.0%) |
| Security & Protection | 26 (100.0%) | 0 (0.0%) |
| Firefighting & Prevention | 0 (0.0%) | 0 (0.0%) |
| Law Enforcement | 26 (100.0%) | 0 (0.0%) |
| Food Preparation & Serving | 0 (0.0%) | 25 (100.0%) |
| Cleaning & Maintenance | 12 (50.0%) | 12 (50.0%) |
| Personal Care & Service | 3 (15.0%) | 17 (85.0%) |
| Total (Category) | 41 (27.3%) | 109 (72.7%) |
| Total (Overall) | 320 (41.7%) | 447 (58.3%) |
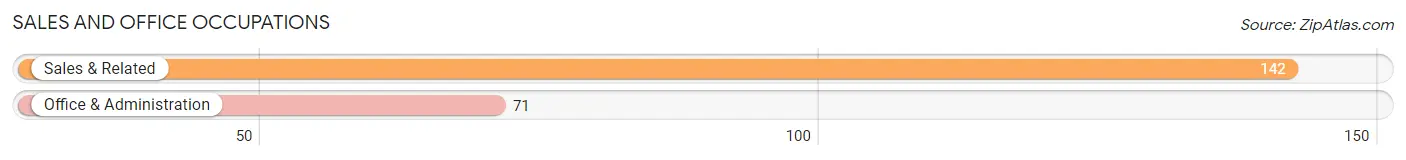
Sales and Office Occupations
The most common Sales and Office occupations in Hazen are Sales & Related (142 | 18.5%), and Office & Administration (71 | 9.3%).
Sales and Office Occupations by Sex
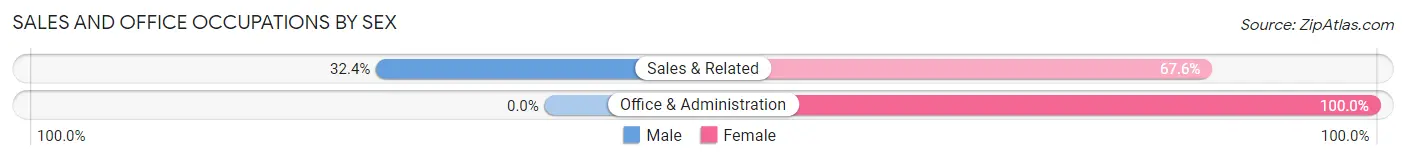
| Occupation | Male | Female |
| Sales & Related | 46 (32.4%) | 96 (67.6%) |
| Office & Administration | 0 (0.0%) | 71 (100.0%) |
| Total (Category) | 46 (21.6%) | 167 (78.4%) |
| Total (Overall) | 320 (41.7%) | 447 (58.3%) |
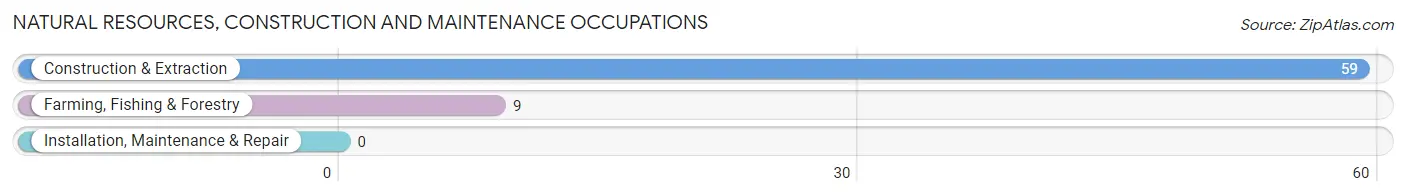
Natural Resources, Construction and Maintenance Occupations
The most common Natural Resources, Construction and Maintenance occupations in Hazen are Construction & Extraction (59 | 7.7%), and Farming, Fishing & Forestry (9 | 1.2%).
Natural Resources, Construction and Maintenance Occupations by Sex
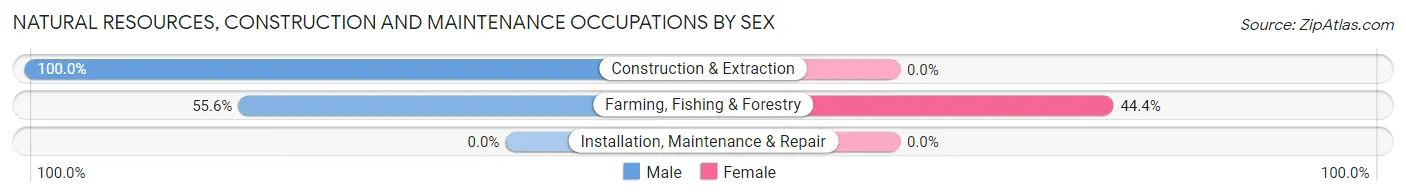
| Occupation | Male | Female |
| Farming, Fishing & Forestry | 5 (55.6%) | 4 (44.4%) |
| Construction & Extraction | 59 (100.0%) | 0 (0.0%) |
| Installation, Maintenance & Repair | 0 (0.0%) | 0 (0.0%) |
| Total (Category) | 64 (94.1%) | 4 (5.9%) |
| Total (Overall) | 320 (41.7%) | 447 (58.3%) |
Production, Transportation and Moving Occupations
The most common Production, Transportation and Moving occupations in Hazen are Transportation (52 | 6.8%), and Production (30 | 3.9%).
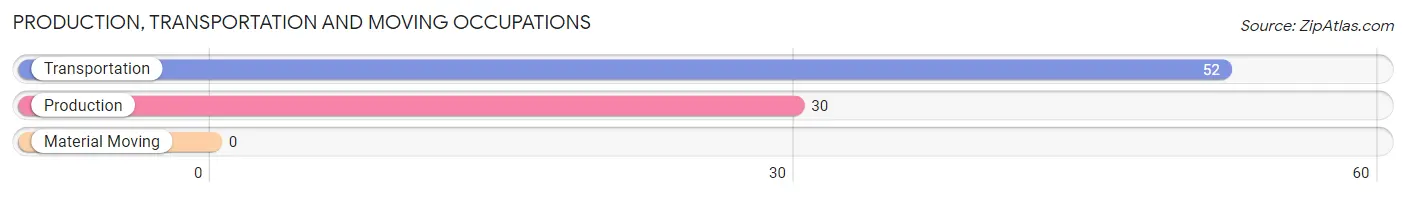
Production, Transportation and Moving Occupations by Sex
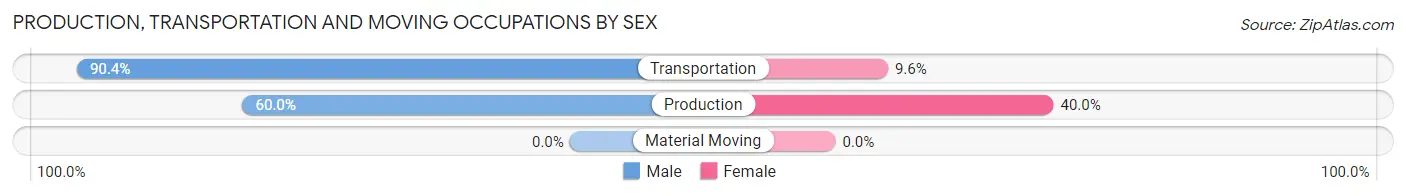
| Occupation | Male | Female |
| Production | 18 (60.0%) | 12 (40.0%) |
| Transportation | 47 (90.4%) | 5 (9.6%) |
| Material Moving | 0 (0.0%) | 0 (0.0%) |
| Total (Category) | 65 (79.3%) | 17 (20.7%) |
| Total (Overall) | 320 (41.7%) | 447 (58.3%) |
Employment Industries by Sex in Hazen
Employment Industries in Hazen
The major employment industries in Hazen include Retail Trade (147 | 19.2%), Professional & Scientific (110 | 14.3%), Public Administration (69 | 9.0%), Health Care & Social Assistance (68 | 8.9%), and Construction (67 | 8.7%).
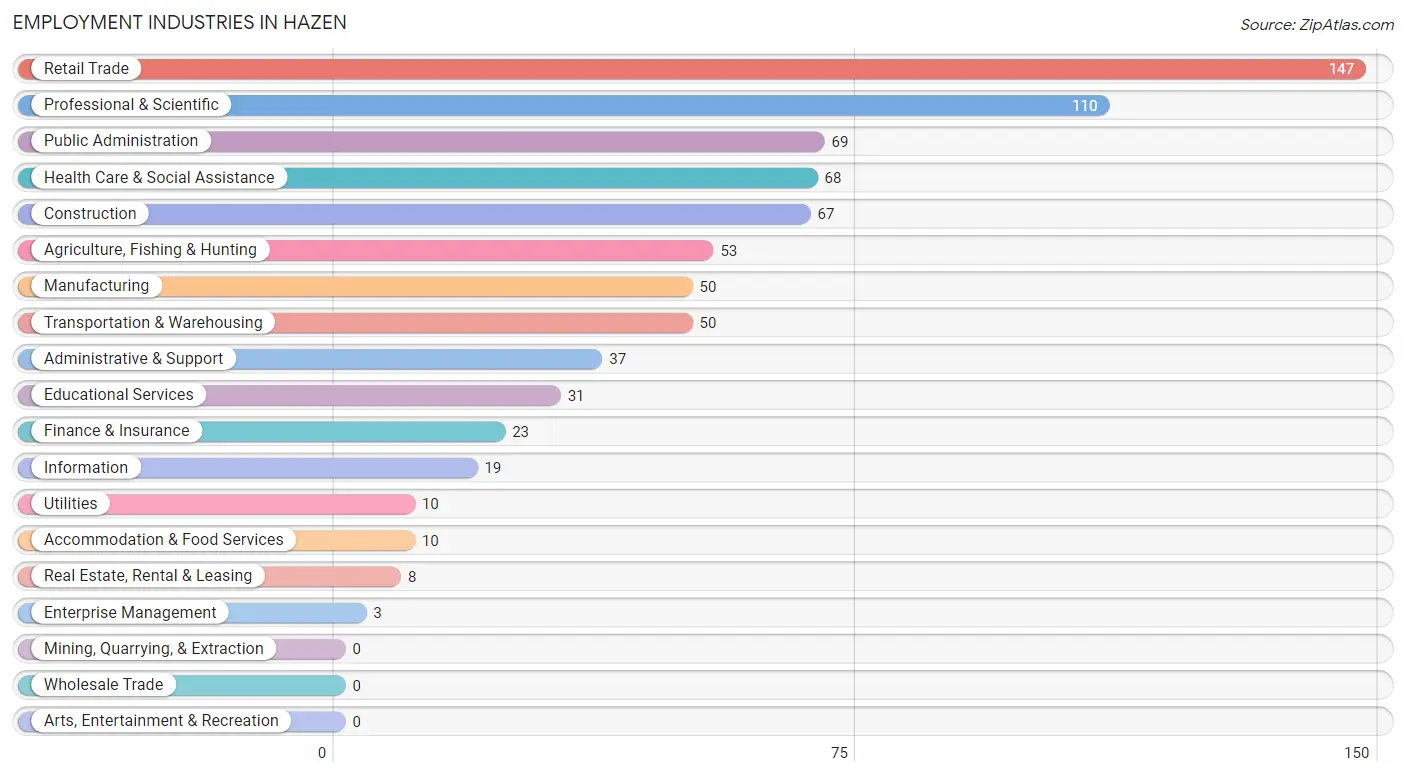
Employment Industries by Sex in Hazen
The Hazen industries that see more men than women are Utilities (100.0%), Transportation & Warehousing (92.0%), and Construction (88.1%), whereas the industries that tend to have a higher number of women are Real Estate, Rental & Leasing (100.0%), Enterprise Management (100.0%), and Health Care & Social Assistance (100.0%).
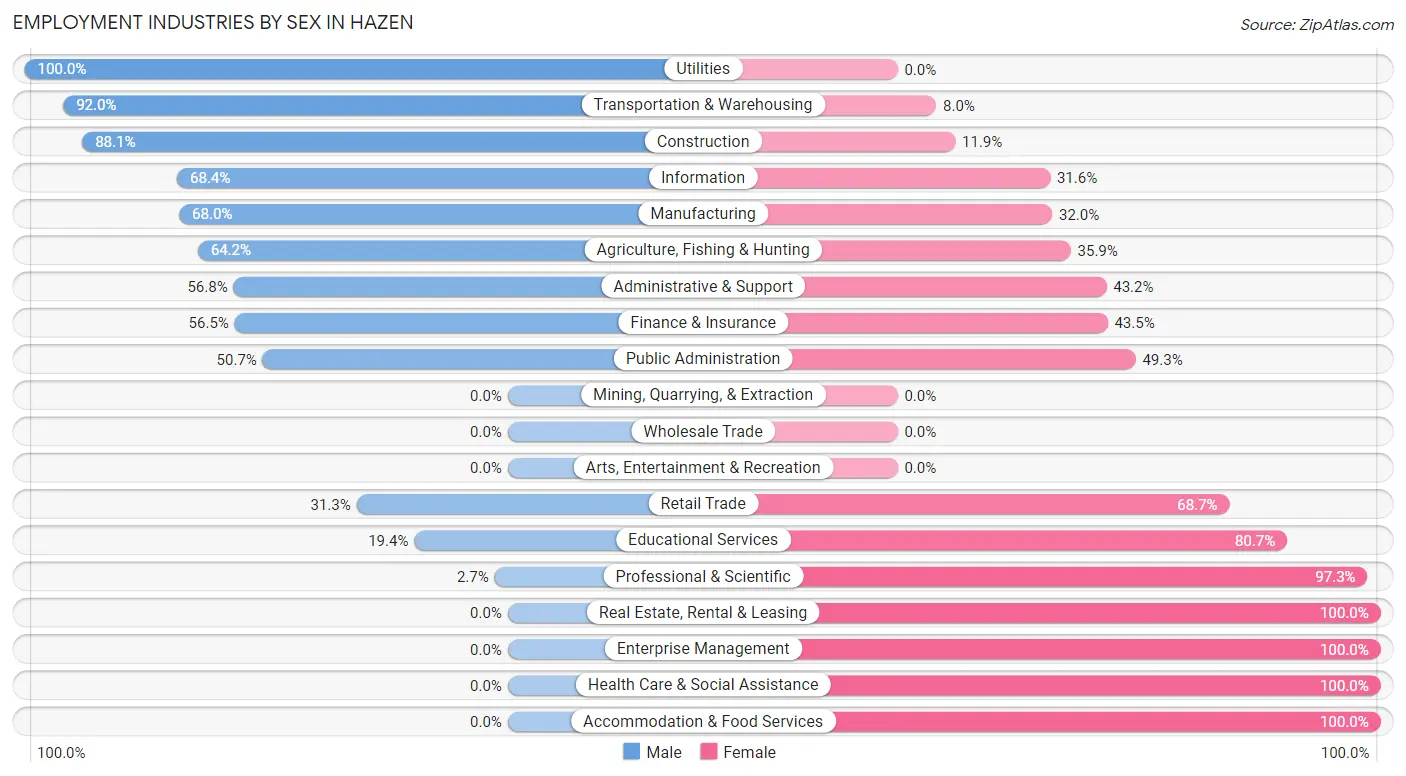
| Industry | Male | Female |
| Agriculture, Fishing & Hunting | 34 (64.1%) | 19 (35.8%) |
| Mining, Quarrying, & Extraction | 0 (0.0%) | 0 (0.0%) |
| Construction | 59 (88.1%) | 8 (11.9%) |
| Manufacturing | 34 (68.0%) | 16 (32.0%) |
| Wholesale Trade | 0 (0.0%) | 0 (0.0%) |
| Retail Trade | 46 (31.3%) | 101 (68.7%) |
| Transportation & Warehousing | 46 (92.0%) | 4 (8.0%) |
| Utilities | 10 (100.0%) | 0 (0.0%) |
| Information | 13 (68.4%) | 6 (31.6%) |
| Finance & Insurance | 13 (56.5%) | 10 (43.5%) |
| Real Estate, Rental & Leasing | 0 (0.0%) | 8 (100.0%) |
| Professional & Scientific | 3 (2.7%) | 107 (97.3%) |
| Enterprise Management | 0 (0.0%) | 3 (100.0%) |
| Administrative & Support | 21 (56.8%) | 16 (43.2%) |
| Educational Services | 6 (19.4%) | 25 (80.6%) |
| Health Care & Social Assistance | 0 (0.0%) | 68 (100.0%) |
| Arts, Entertainment & Recreation | 0 (0.0%) | 0 (0.0%) |
| Accommodation & Food Services | 0 (0.0%) | 10 (100.0%) |
| Public Administration | 35 (50.7%) | 34 (49.3%) |
| Total | 320 (41.7%) | 447 (58.3%) |
Education in Hazen
School Enrollment in Hazen
The most common levels of schooling among the 449 students in Hazen are middle school (166 | 37.0%), high school (119 | 26.5%), and elementary school (114 | 25.4%).
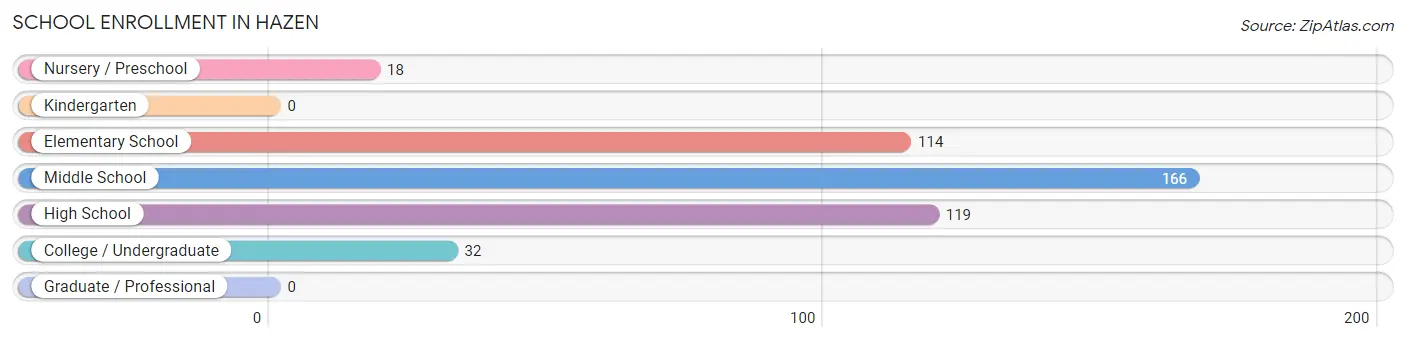
| School Level | # Students | % Students |
| Nursery / Preschool | 18 | 4.0% |
| Kindergarten | 0 | 0.0% |
| Elementary School | 114 | 25.4% |
| Middle School | 166 | 37.0% |
| High School | 119 | 26.5% |
| College / Undergraduate | 32 | 7.1% |
| Graduate / Professional | 0 | 0.0% |
| Total | 449 | 100.0% |
School Enrollment by Age by Funding Source in Hazen
Out of a total of 449 students who are enrolled in schools in Hazen, 12 (2.7%) attend a private institution, while the remaining 437 (97.3%) are enrolled in public schools. The age group of 15 to 17 year olds has the highest likelihood of being enrolled in private schools, with 12 (9.4% in the age bracket) enrolled. Conversely, the age group of 3 to 4 year olds has the lowest likelihood of being enrolled in a private school, with 6 (100.0% in the age bracket) attending a public institution.
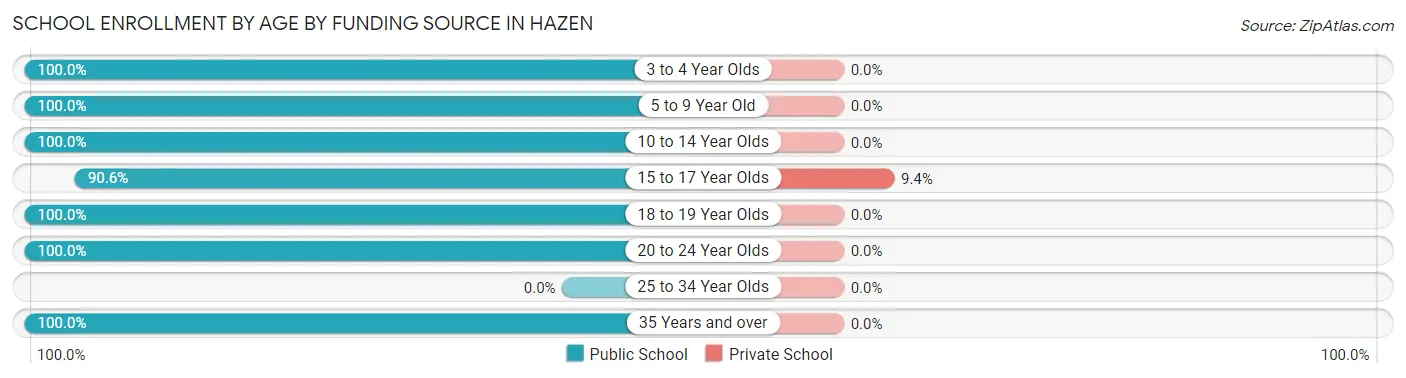
| Age Bracket | Public School | Private School |
| 3 to 4 Year Olds | 6 (100.0%) | 0 (0.0%) |
| 5 to 9 Year Old | 118 (100.0%) | 0 (0.0%) |
| 10 to 14 Year Olds | 165 (100.0%) | 0 (0.0%) |
| 15 to 17 Year Olds | 116 (90.6%) | 12 (9.4%) |
| 18 to 19 Year Olds | 11 (100.0%) | 0 (0.0%) |
| 20 to 24 Year Olds | 15 (100.0%) | 0 (0.0%) |
| 25 to 34 Year Olds | 0 (0.0%) | 0 (0.0%) |
| 35 Years and over | 6 (100.0%) | 0 (0.0%) |
| Total | 437 (97.3%) | 12 (2.7%) |
Educational Attainment by Field of Study in Hazen
Business (105 | 40.4%), education (51 | 19.6%), science & technology (16 | 6.1%), social sciences (15 | 5.8%), and liberal arts & history (15 | 5.8%) are the most common fields of study among 260 individuals in Hazen who have obtained a bachelor's degree or higher.
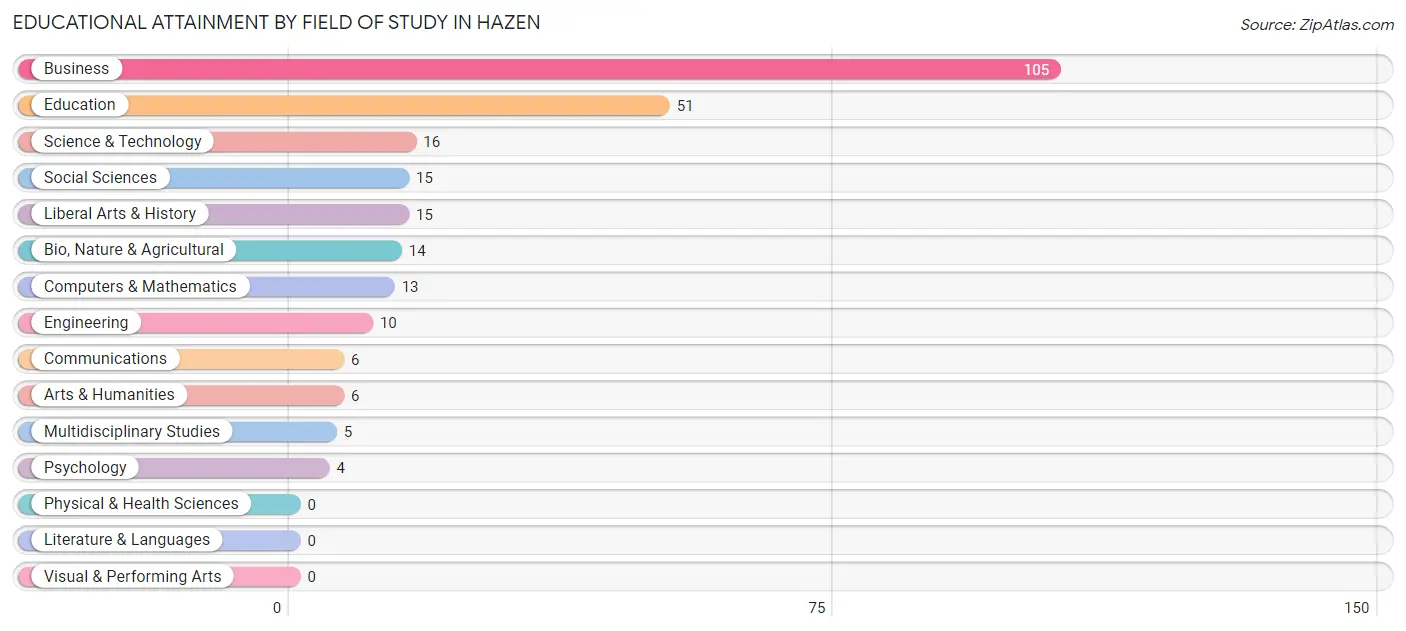
| Field of Study | # Graduates | % Graduates |
| Computers & Mathematics | 13 | 5.0% |
| Bio, Nature & Agricultural | 14 | 5.4% |
| Physical & Health Sciences | 0 | 0.0% |
| Psychology | 4 | 1.5% |
| Social Sciences | 15 | 5.8% |
| Engineering | 10 | 3.8% |
| Multidisciplinary Studies | 5 | 1.9% |
| Science & Technology | 16 | 6.1% |
| Business | 105 | 40.4% |
| Education | 51 | 19.6% |
| Literature & Languages | 0 | 0.0% |
| Liberal Arts & History | 15 | 5.8% |
| Visual & Performing Arts | 0 | 0.0% |
| Communications | 6 | 2.3% |
| Arts & Humanities | 6 | 2.3% |
| Total | 260 | 100.0% |
Transportation & Commute in Hazen
Vehicle Availability by Sex in Hazen
The most prevalent vehicle ownership categories in Hazen are males with 2 vehicles (214, accounting for 67.9%) and females with 2 vehicles (273, making up 48.3%).
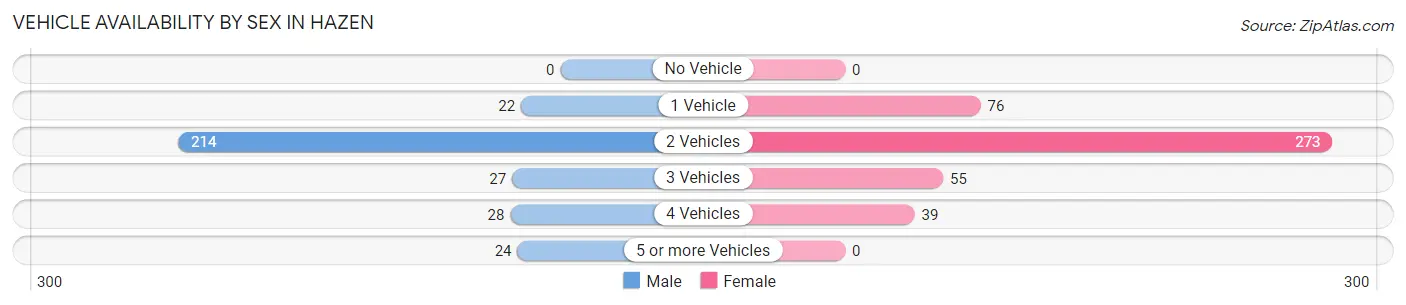
| Vehicles Available | Male | Female |
| No Vehicle | 0 (0.0%) | 0 (0.0%) |
| 1 Vehicle | 22 (7.0%) | 76 (17.2%) |
| 2 Vehicles | 214 (67.9%) | 273 (61.6%) |
| 3 Vehicles | 27 (8.6%) | 55 (12.4%) |
| 4 Vehicles | 28 (8.9%) | 39 (8.8%) |
| 5 or more Vehicles | 24 (7.6%) | 0 (0.0%) |
| Total | 315 (100.0%) | 443 (100.0%) |
Commute Time in Hazen
The most frequently occuring commute durations in Hazen are 5 to 9 minutes (135 commuters, 19.1%), less than 5 minutes (113 commuters, 16.0%), and 30 to 34 minutes (100 commuters, 14.2%).
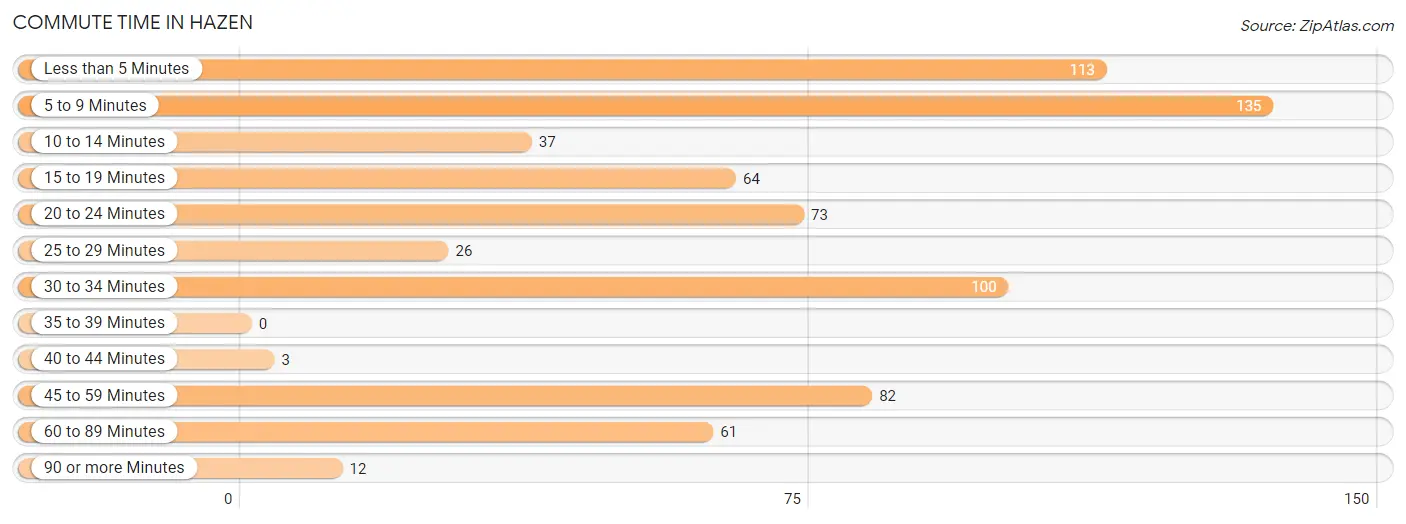
| Commute Time | # Commuters | % Commuters |
| Less than 5 Minutes | 113 | 16.0% |
| 5 to 9 Minutes | 135 | 19.1% |
| 10 to 14 Minutes | 37 | 5.2% |
| 15 to 19 Minutes | 64 | 9.1% |
| 20 to 24 Minutes | 73 | 10.3% |
| 25 to 29 Minutes | 26 | 3.7% |
| 30 to 34 Minutes | 100 | 14.2% |
| 35 to 39 Minutes | 0 | 0.0% |
| 40 to 44 Minutes | 3 | 0.4% |
| 45 to 59 Minutes | 82 | 11.6% |
| 60 to 89 Minutes | 61 | 8.6% |
| 90 or more Minutes | 12 | 1.7% |
Commute Time by Sex in Hazen
The most common commute times in Hazen are 30 to 34 minutes (80 commuters, 26.7%) for males and 5 to 9 minutes (73 commuters, 18.0%) for females.
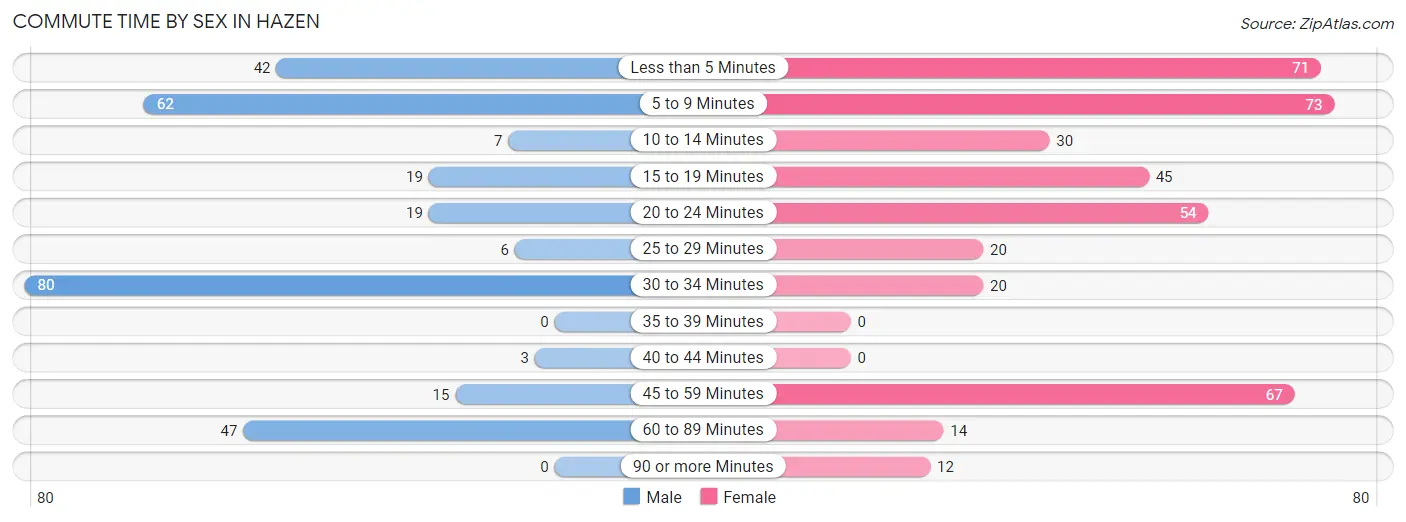
| Commute Time | Male | Female |
| Less than 5 Minutes | 42 (14.0%) | 71 (17.5%) |
| 5 to 9 Minutes | 62 (20.7%) | 73 (18.0%) |
| 10 to 14 Minutes | 7 (2.3%) | 30 (7.4%) |
| 15 to 19 Minutes | 19 (6.3%) | 45 (11.1%) |
| 20 to 24 Minutes | 19 (6.3%) | 54 (13.3%) |
| 25 to 29 Minutes | 6 (2.0%) | 20 (4.9%) |
| 30 to 34 Minutes | 80 (26.7%) | 20 (4.9%) |
| 35 to 39 Minutes | 0 (0.0%) | 0 (0.0%) |
| 40 to 44 Minutes | 3 (1.0%) | 0 (0.0%) |
| 45 to 59 Minutes | 15 (5.0%) | 67 (16.5%) |
| 60 to 89 Minutes | 47 (15.7%) | 14 (3.5%) |
| 90 or more Minutes | 0 (0.0%) | 12 (3.0%) |
Time of Departure to Work by Sex in Hazen
The most frequent times of departure to work in Hazen are 7:00 AM to 7:29 AM (96, 32.0%) for males and 12:00 AM to 4:59 AM (129, 31.8%) for females.
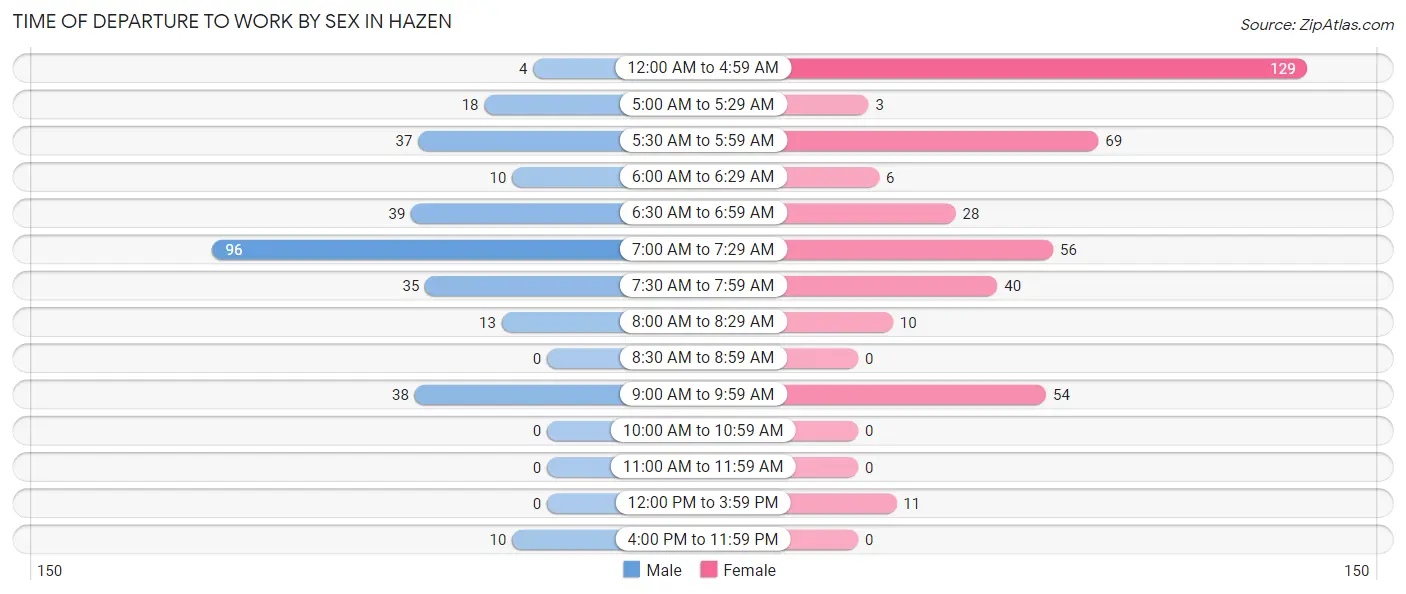
| Time of Departure | Male | Female |
| 12:00 AM to 4:59 AM | 4 (1.3%) | 129 (31.8%) |
| 5:00 AM to 5:29 AM | 18 (6.0%) | 3 (0.7%) |
| 5:30 AM to 5:59 AM | 37 (12.3%) | 69 (17.0%) |
| 6:00 AM to 6:29 AM | 10 (3.3%) | 6 (1.5%) |
| 6:30 AM to 6:59 AM | 39 (13.0%) | 28 (6.9%) |
| 7:00 AM to 7:29 AM | 96 (32.0%) | 56 (13.8%) |
| 7:30 AM to 7:59 AM | 35 (11.7%) | 40 (9.9%) |
| 8:00 AM to 8:29 AM | 13 (4.3%) | 10 (2.5%) |
| 8:30 AM to 8:59 AM | 0 (0.0%) | 0 (0.0%) |
| 9:00 AM to 9:59 AM | 38 (12.7%) | 54 (13.3%) |
| 10:00 AM to 10:59 AM | 0 (0.0%) | 0 (0.0%) |
| 11:00 AM to 11:59 AM | 0 (0.0%) | 0 (0.0%) |
| 12:00 PM to 3:59 PM | 0 (0.0%) | 11 (2.7%) |
| 4:00 PM to 11:59 PM | 10 (3.3%) | 0 (0.0%) |
| Total | 300 (100.0%) | 406 (100.0%) |
Housing Occupancy in Hazen
Occupancy by Ownership in Hazen
Of the total 588 dwellings in Hazen, owner-occupied units account for 445 (75.7%), while renter-occupied units make up 143 (24.3%).
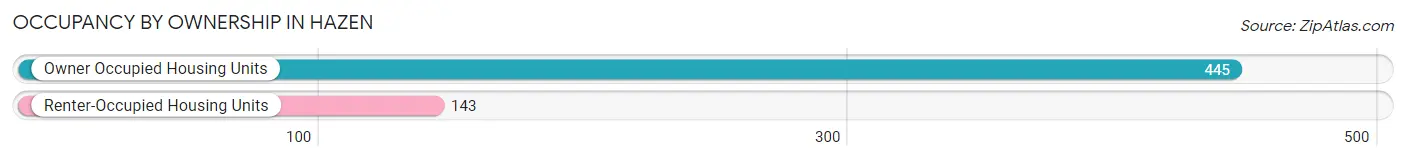
| Occupancy | # Housing Units | % Housing Units |
| Owner Occupied Housing Units | 445 | 75.7% |
| Renter-Occupied Housing Units | 143 | 24.3% |
| Total Occupied Housing Units | 588 | 100.0% |
Occupancy by Household Size in Hazen
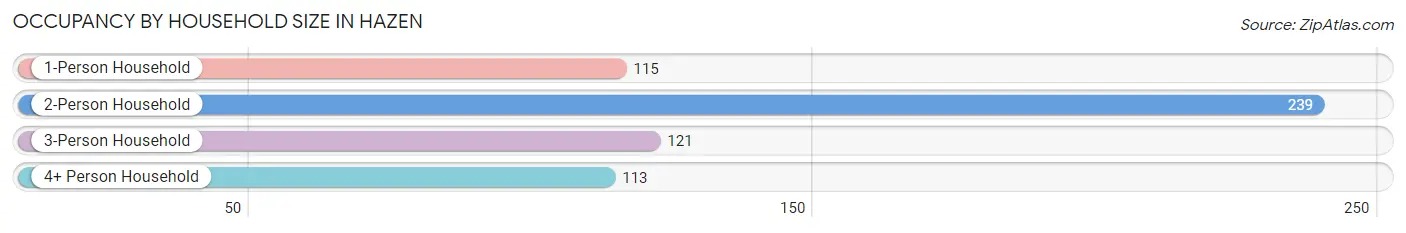
| Household Size | # Housing Units | % Housing Units |
| 1-Person Household | 115 | 19.6% |
| 2-Person Household | 239 | 40.6% |
| 3-Person Household | 121 | 20.6% |
| 4+ Person Household | 113 | 19.2% |
| Total Housing Units | 588 | 100.0% |
Occupancy by Ownership by Household Size in Hazen
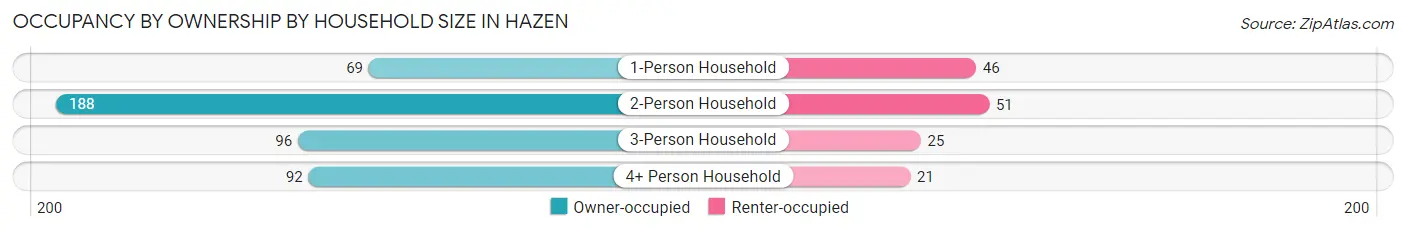
| Household Size | Owner-occupied | Renter-occupied |
| 1-Person Household | 69 (60.0%) | 46 (40.0%) |
| 2-Person Household | 188 (78.7%) | 51 (21.3%) |
| 3-Person Household | 96 (79.3%) | 25 (20.7%) |
| 4+ Person Household | 92 (81.4%) | 21 (18.6%) |
| Total Housing Units | 445 (75.7%) | 143 (24.3%) |
Occupancy by Educational Attainment in Hazen
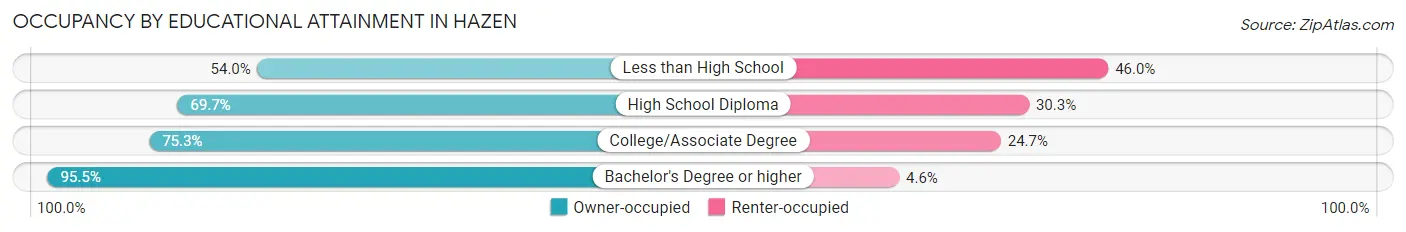
| Household Size | Owner-occupied | Renter-occupied |
| Less than High School | 27 (54.0%) | 23 (46.0%) |
| High School Diploma | 115 (69.7%) | 50 (30.3%) |
| College/Associate Degree | 198 (75.3%) | 65 (24.7%) |
| Bachelor's Degree or higher | 105 (95.5%) | 5 (4.5%) |
Occupancy by Age of Householder in Hazen
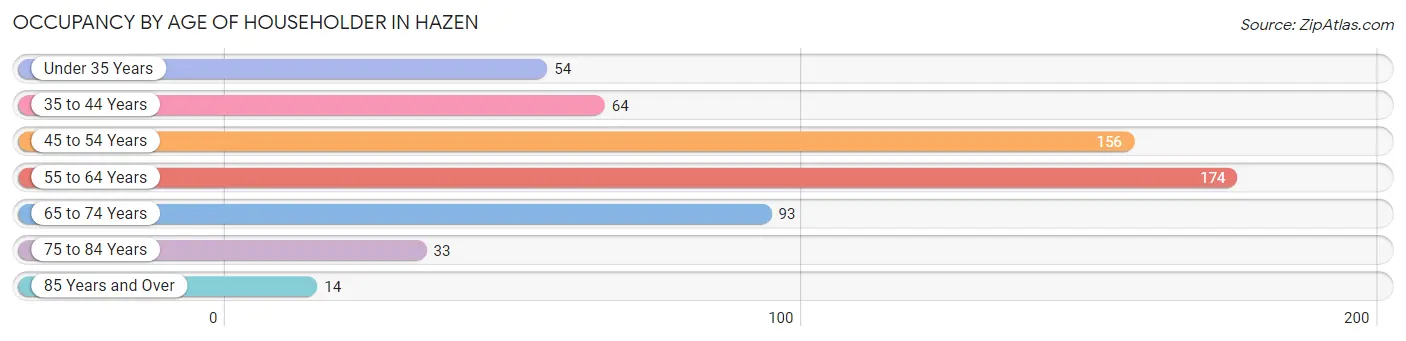
| Age Bracket | # Households | % Households |
| Under 35 Years | 54 | 9.2% |
| 35 to 44 Years | 64 | 10.9% |
| 45 to 54 Years | 156 | 26.5% |
| 55 to 64 Years | 174 | 29.6% |
| 65 to 74 Years | 93 | 15.8% |
| 75 to 84 Years | 33 | 5.6% |
| 85 Years and Over | 14 | 2.4% |
| Total | 588 | 100.0% |
Housing Finances in Hazen
Median Income by Occupancy in Hazen
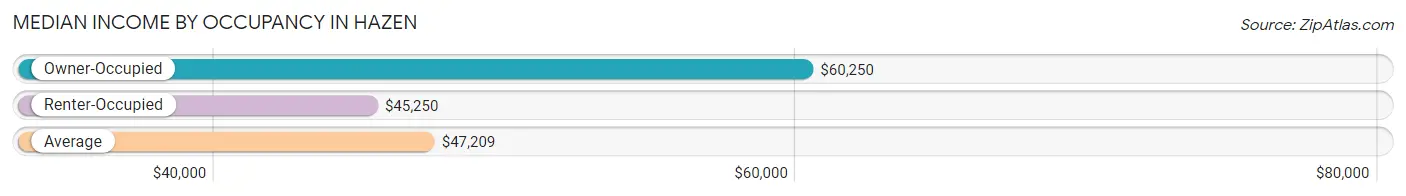
| Occupancy Type | # Households | Median Income |
| Owner-Occupied | 445 (75.7%) | $60,250 |
| Renter-Occupied | 143 (24.3%) | $45,250 |
| Average | 588 (100.0%) | $47,209 |
Occupancy by Householder Income Bracket in Hazen
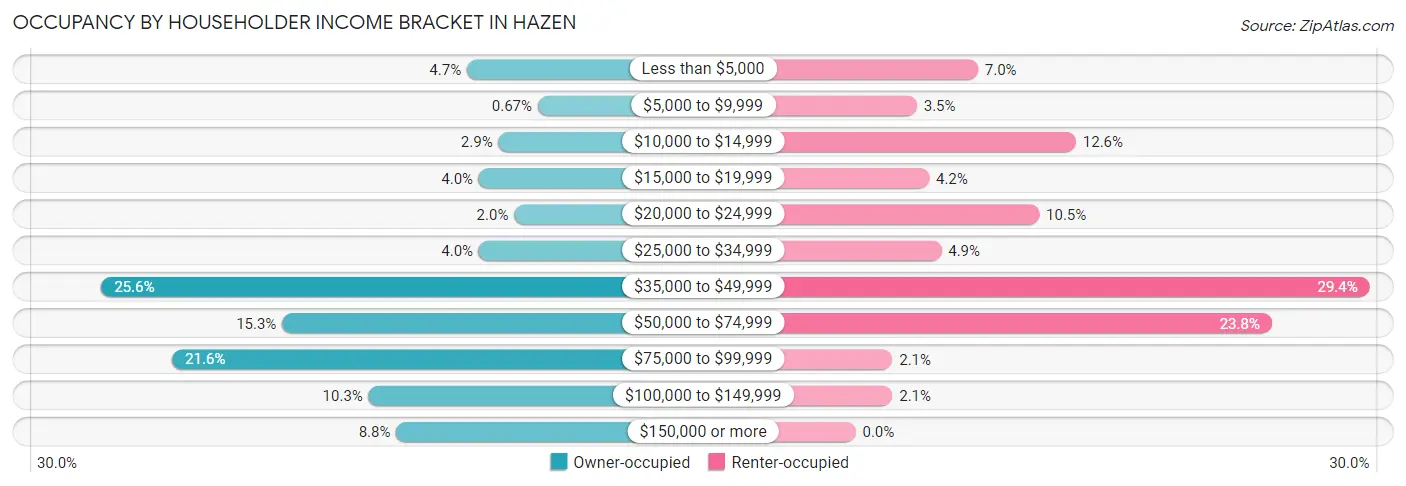
| Income Bracket | Owner-occupied | Renter-occupied |
| Less than $5,000 | 21 (4.7%) | 10 (7.0%) |
| $5,000 to $9,999 | 3 (0.7%) | 5 (3.5%) |
| $10,000 to $14,999 | 13 (2.9%) | 18 (12.6%) |
| $15,000 to $19,999 | 18 (4.0%) | 6 (4.2%) |
| $20,000 to $24,999 | 9 (2.0%) | 15 (10.5%) |
| $25,000 to $34,999 | 18 (4.0%) | 7 (4.9%) |
| $35,000 to $49,999 | 114 (25.6%) | 42 (29.4%) |
| $50,000 to $74,999 | 68 (15.3%) | 34 (23.8%) |
| $75,000 to $99,999 | 96 (21.6%) | 3 (2.1%) |
| $100,000 to $149,999 | 46 (10.3%) | 3 (2.1%) |
| $150,000 or more | 39 (8.8%) | 0 (0.0%) |
| Total | 445 (100.0%) | 143 (100.0%) |
Monthly Housing Cost Tiers in Hazen
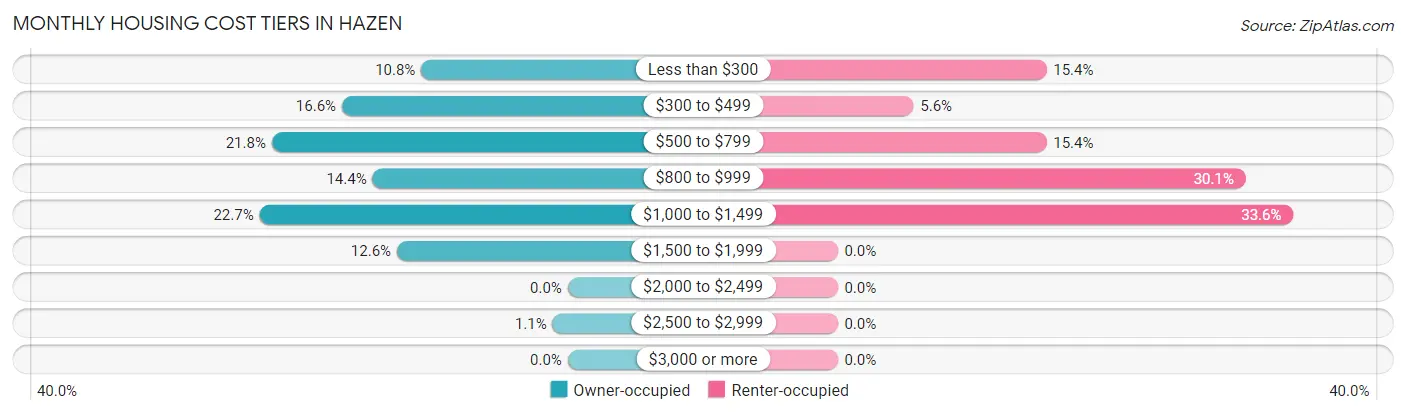
| Monthly Cost | Owner-occupied | Renter-occupied |
| Less than $300 | 48 (10.8%) | 22 (15.4%) |
| $300 to $499 | 74 (16.6%) | 8 (5.6%) |
| $500 to $799 | 97 (21.8%) | 22 (15.4%) |
| $800 to $999 | 64 (14.4%) | 43 (30.1%) |
| $1,000 to $1,499 | 101 (22.7%) | 48 (33.6%) |
| $1,500 to $1,999 | 56 (12.6%) | 0 (0.0%) |
| $2,000 to $2,499 | 0 (0.0%) | 0 (0.0%) |
| $2,500 to $2,999 | 5 (1.1%) | 0 (0.0%) |
| $3,000 or more | 0 (0.0%) | 0 (0.0%) |
| Total | 445 (100.0%) | 143 (100.0%) |
Physical Housing Characteristics in Hazen
Housing Structures in Hazen
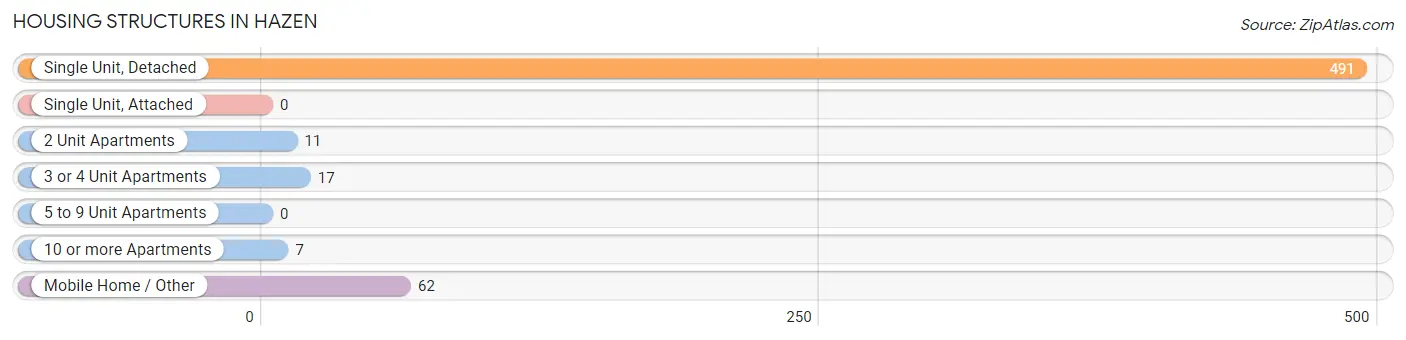
| Structure Type | # Housing Units | % Housing Units |
| Single Unit, Detached | 491 | 83.5% |
| Single Unit, Attached | 0 | 0.0% |
| 2 Unit Apartments | 11 | 1.9% |
| 3 or 4 Unit Apartments | 17 | 2.9% |
| 5 to 9 Unit Apartments | 0 | 0.0% |
| 10 or more Apartments | 7 | 1.2% |
| Mobile Home / Other | 62 | 10.5% |
| Total | 588 | 100.0% |
Housing Structures by Occupancy in Hazen
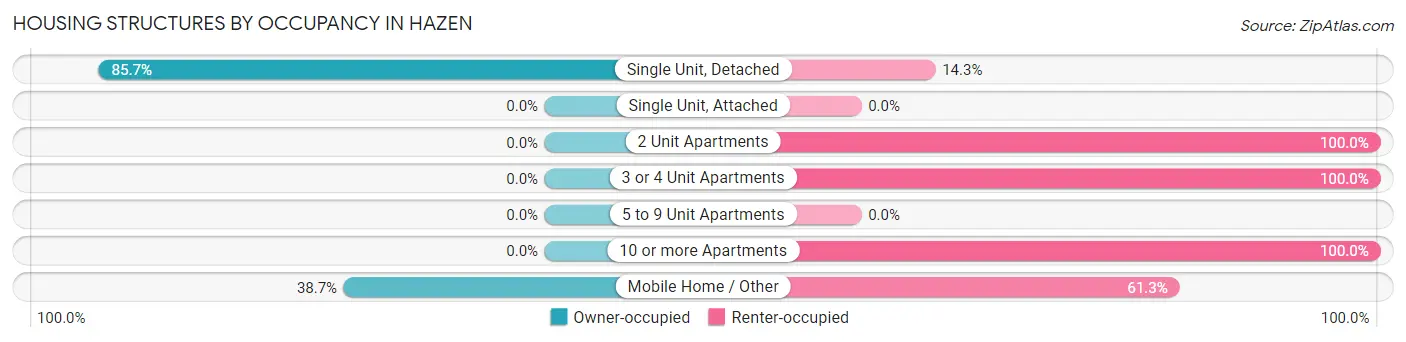
| Structure Type | Owner-occupied | Renter-occupied |
| Single Unit, Detached | 421 (85.7%) | 70 (14.3%) |
| Single Unit, Attached | 0 (0.0%) | 0 (0.0%) |
| 2 Unit Apartments | 0 (0.0%) | 11 (100.0%) |
| 3 or 4 Unit Apartments | 0 (0.0%) | 17 (100.0%) |
| 5 to 9 Unit Apartments | 0 (0.0%) | 0 (0.0%) |
| 10 or more Apartments | 0 (0.0%) | 7 (100.0%) |
| Mobile Home / Other | 24 (38.7%) | 38 (61.3%) |
| Total | 445 (75.7%) | 143 (24.3%) |
Housing Structures by Number of Rooms in Hazen
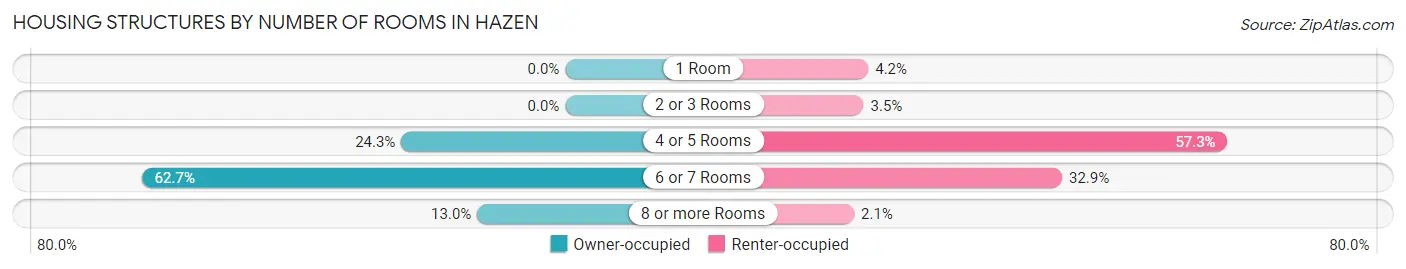
| Number of Rooms | Owner-occupied | Renter-occupied |
| 1 Room | 0 (0.0%) | 6 (4.2%) |
| 2 or 3 Rooms | 0 (0.0%) | 5 (3.5%) |
| 4 or 5 Rooms | 108 (24.3%) | 82 (57.3%) |
| 6 or 7 Rooms | 279 (62.7%) | 47 (32.9%) |
| 8 or more Rooms | 58 (13.0%) | 3 (2.1%) |
| Total | 445 (100.0%) | 143 (100.0%) |
Housing Structure by Heating Type in Hazen
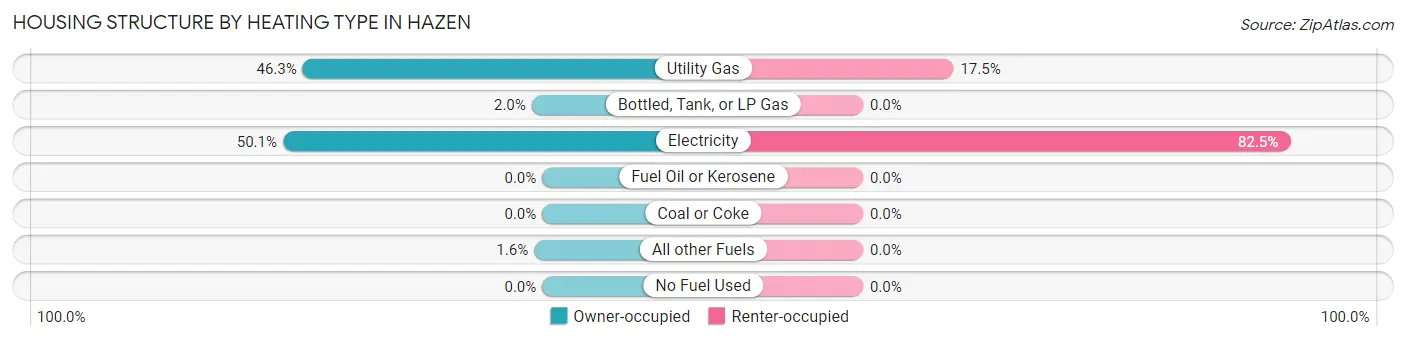
| Heating Type | Owner-occupied | Renter-occupied |
| Utility Gas | 206 (46.3%) | 25 (17.5%) |
| Bottled, Tank, or LP Gas | 9 (2.0%) | 0 (0.0%) |
| Electricity | 223 (50.1%) | 118 (82.5%) |
| Fuel Oil or Kerosene | 0 (0.0%) | 0 (0.0%) |
| Coal or Coke | 0 (0.0%) | 0 (0.0%) |
| All other Fuels | 7 (1.6%) | 0 (0.0%) |
| No Fuel Used | 0 (0.0%) | 0 (0.0%) |
| Total | 445 (100.0%) | 143 (100.0%) |
Household Vehicle Usage in Hazen
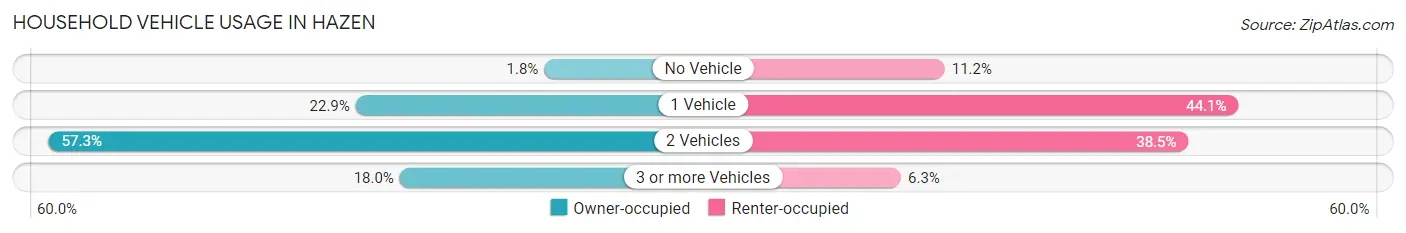
| Vehicles per Household | Owner-occupied | Renter-occupied |
| No Vehicle | 8 (1.8%) | 16 (11.2%) |
| 1 Vehicle | 102 (22.9%) | 63 (44.1%) |
| 2 Vehicles | 255 (57.3%) | 55 (38.5%) |
| 3 or more Vehicles | 80 (18.0%) | 9 (6.3%) |
| Total | 445 (100.0%) | 143 (100.0%) |
Real Estate & Mortgages in Hazen
Real Estate and Mortgage Overview in Hazen
| Characteristic | Without Mortgage | With Mortgage |
| Housing Units | 175 | 270 |
| Median Property Value | $118,800 | $113,300 |
| Median Household Income | $55,938 | $23 |
| Monthly Housing Costs | $389 | $0 |
| Real Estate Taxes | $600 | $70 |
Property Value by Mortgage Status in Hazen
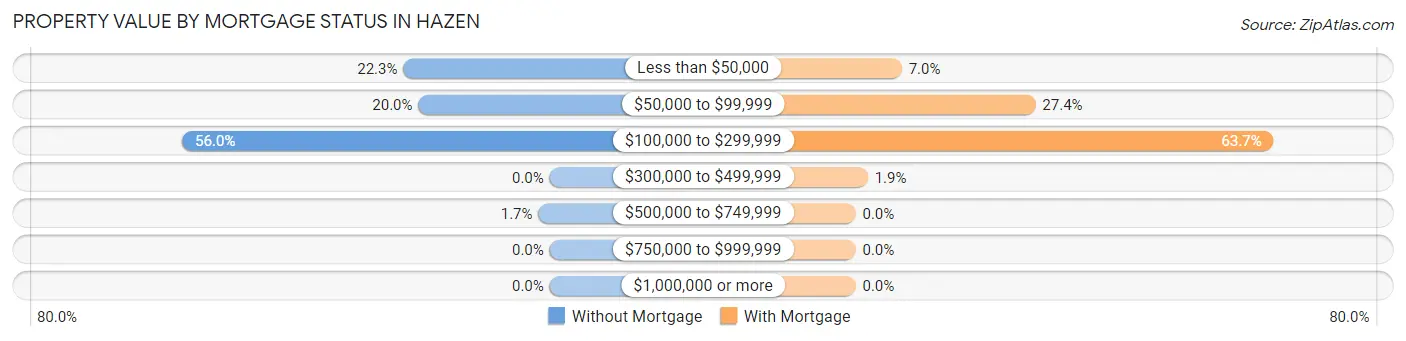
| Property Value | Without Mortgage | With Mortgage |
| Less than $50,000 | 39 (22.3%) | 19 (7.0%) |
| $50,000 to $99,999 | 35 (20.0%) | 74 (27.4%) |
| $100,000 to $299,999 | 98 (56.0%) | 172 (63.7%) |
| $300,000 to $499,999 | 0 (0.0%) | 5 (1.8%) |
| $500,000 to $749,999 | 3 (1.7%) | 0 (0.0%) |
| $750,000 to $999,999 | 0 (0.0%) | 0 (0.0%) |
| $1,000,000 or more | 0 (0.0%) | 0 (0.0%) |
| Total | 175 (100.0%) | 270 (100.0%) |
Household Income by Mortgage Status in Hazen
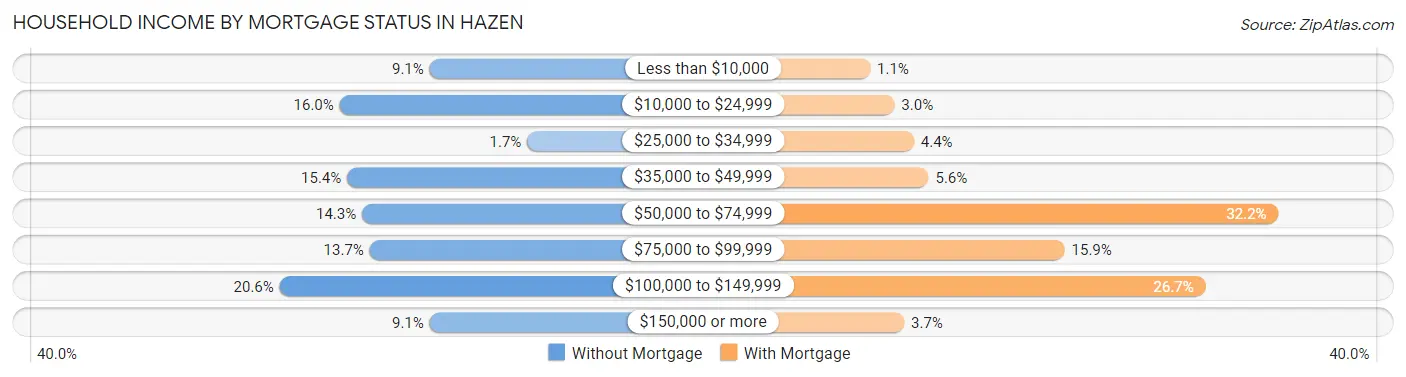
| Household Income | Without Mortgage | With Mortgage |
| Less than $10,000 | 16 (9.1%) | 3 (1.1%) |
| $10,000 to $24,999 | 28 (16.0%) | 8 (3.0%) |
| $25,000 to $34,999 | 3 (1.7%) | 12 (4.4%) |
| $35,000 to $49,999 | 27 (15.4%) | 15 (5.6%) |
| $50,000 to $74,999 | 25 (14.3%) | 87 (32.2%) |
| $75,000 to $99,999 | 24 (13.7%) | 43 (15.9%) |
| $100,000 to $149,999 | 36 (20.6%) | 72 (26.7%) |
| $150,000 or more | 16 (9.1%) | 10 (3.7%) |
| Total | 175 (100.0%) | 270 (100.0%) |
Property Value to Household Income Ratio in Hazen
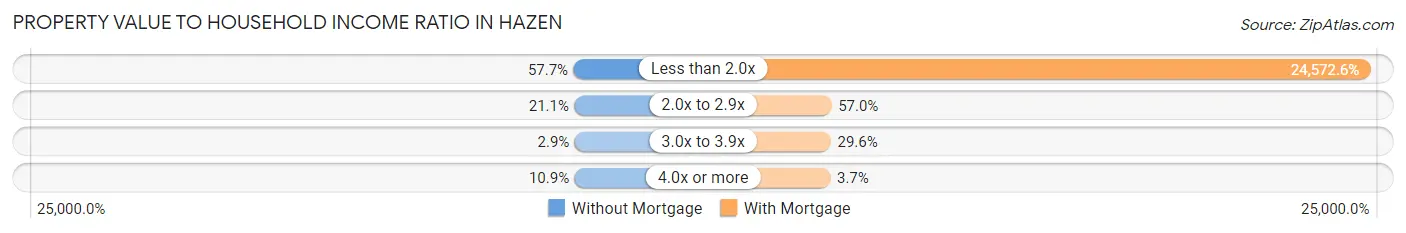
| Value-to-Income Ratio | Without Mortgage | With Mortgage |
| Less than 2.0x | 101 (57.7%) | 66,346 (24,572.6%) |
| 2.0x to 2.9x | 37 (21.1%) | 154 (57.0%) |
| 3.0x to 3.9x | 5 (2.9%) | 80 (29.6%) |
| 4.0x or more | 19 (10.9%) | 10 (3.7%) |
| Total | 175 (100.0%) | 270 (100.0%) |
Real Estate Taxes by Mortgage Status in Hazen
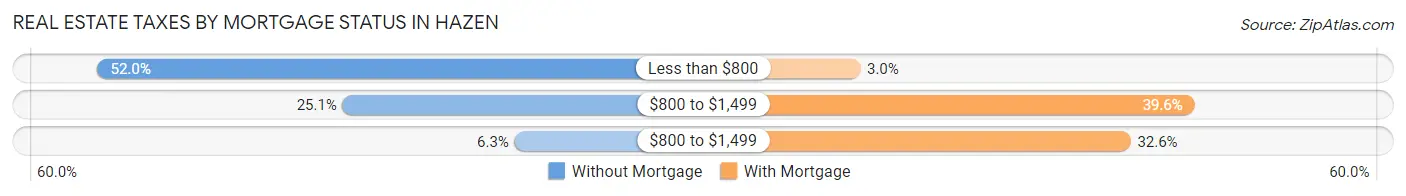
| Property Taxes | Without Mortgage | With Mortgage |
| Less than $800 | 91 (52.0%) | 8 (3.0%) |
| $800 to $1,499 | 44 (25.1%) | 107 (39.6%) |
| $800 to $1,499 | 11 (6.3%) | 88 (32.6%) |
| Total | 175 (100.0%) | 270 (100.0%) |
Health & Disability in Hazen
Health Insurance Coverage by Age in Hazen
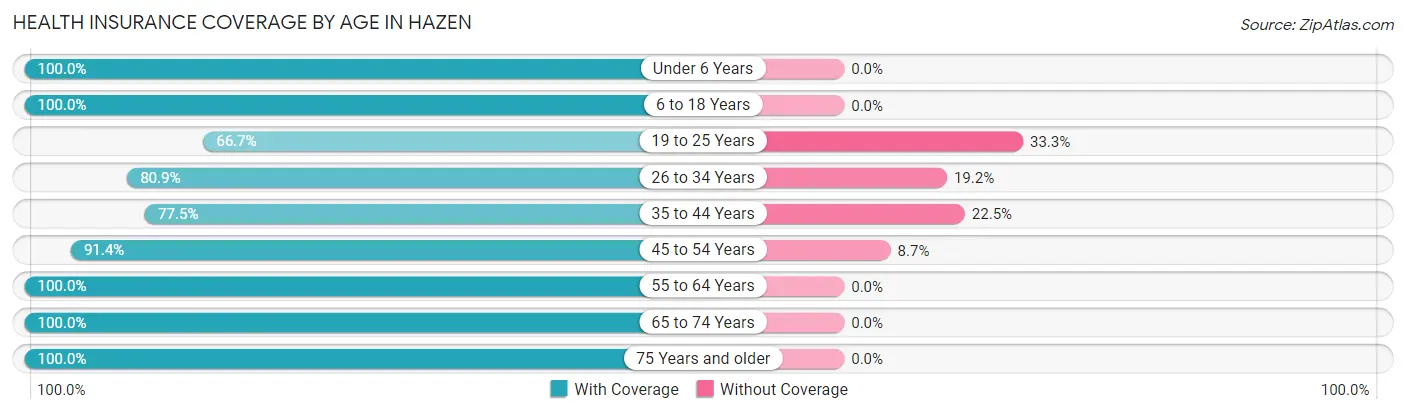
| Age Bracket | With Coverage | Without Coverage |
| Under 6 Years | 77 (100.0%) | 0 (0.0%) |
| 6 to 18 Years | 406 (100.0%) | 0 (0.0%) |
| 19 to 25 Years | 52 (66.7%) | 26 (33.3%) |
| 26 to 34 Years | 152 (80.8%) | 36 (19.2%) |
| 35 to 44 Years | 131 (77.5%) | 38 (22.5%) |
| 45 to 54 Years | 190 (91.3%) | 18 (8.6%) |
| 55 to 64 Years | 328 (100.0%) | 0 (0.0%) |
| 65 to 74 Years | 162 (100.0%) | 0 (0.0%) |
| 75 Years and older | 51 (100.0%) | 0 (0.0%) |
| Total | 1,549 (92.9%) | 118 (7.1%) |
Health Insurance Coverage by Citizenship Status in Hazen
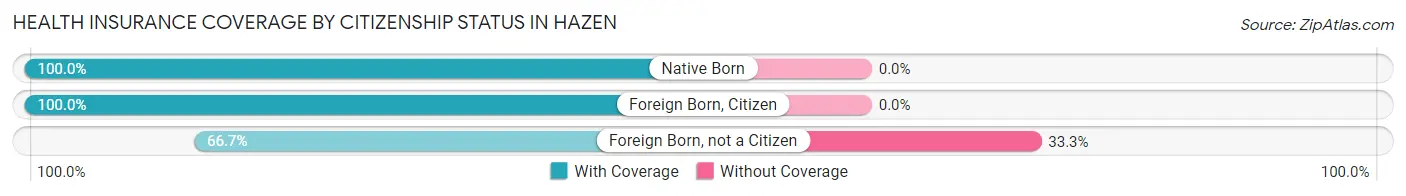
| Citizenship Status | With Coverage | Without Coverage |
| Native Born | 77 (100.0%) | 0 (0.0%) |
| Foreign Born, Citizen | 406 (100.0%) | 0 (0.0%) |
| Foreign Born, not a Citizen | 52 (66.7%) | 26 (33.3%) |
Health Insurance Coverage by Household Income in Hazen
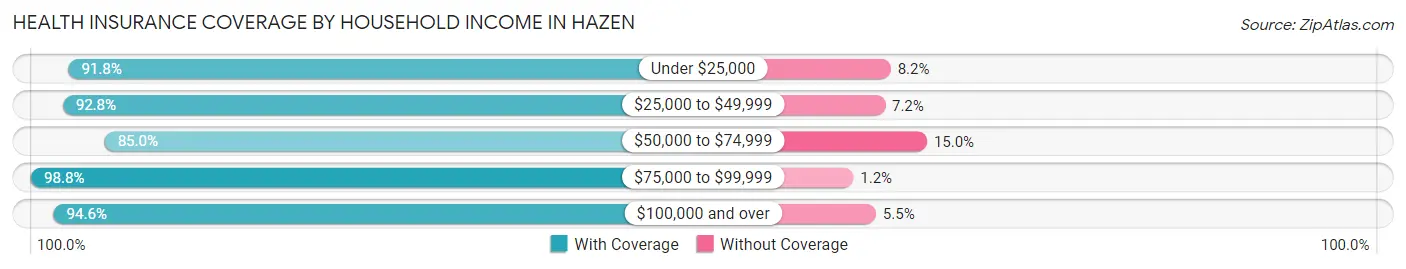
| Household Income | With Coverage | Without Coverage |
| Under $25,000 | 212 (91.8%) | 19 (8.2%) |
| $25,000 to $49,999 | 428 (92.8%) | 33 (7.2%) |
| $50,000 to $74,999 | 266 (85.0%) | 47 (15.0%) |
| $75,000 to $99,999 | 400 (98.8%) | 5 (1.2%) |
| $100,000 and over | 243 (94.6%) | 14 (5.4%) |
Public vs Private Health Insurance Coverage by Age in Hazen
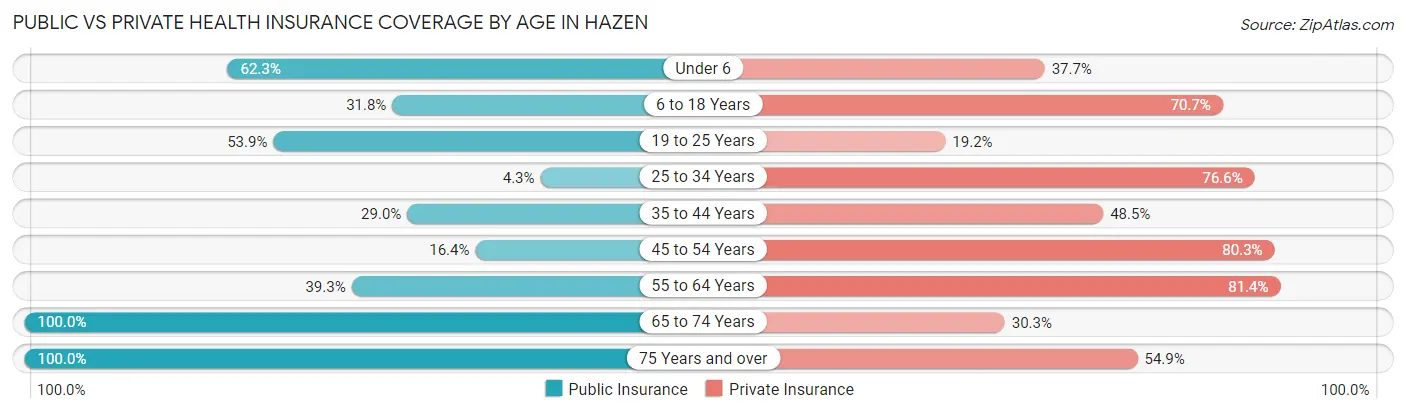
| Age Bracket | Public Insurance | Private Insurance |
| Under 6 | 48 (62.3%) | 29 (37.7%) |
| 6 to 18 Years | 129 (31.8%) | 287 (70.7%) |
| 19 to 25 Years | 42 (53.8%) | 15 (19.2%) |
| 25 to 34 Years | 8 (4.3%) | 144 (76.6%) |
| 35 to 44 Years | 49 (29.0%) | 82 (48.5%) |
| 45 to 54 Years | 34 (16.4%) | 167 (80.3%) |
| 55 to 64 Years | 129 (39.3%) | 267 (81.4%) |
| 65 to 74 Years | 162 (100.0%) | 49 (30.2%) |
| 75 Years and over | 51 (100.0%) | 28 (54.9%) |
| Total | 652 (39.1%) | 1,068 (64.1%) |
Disability Status by Sex by Age in Hazen
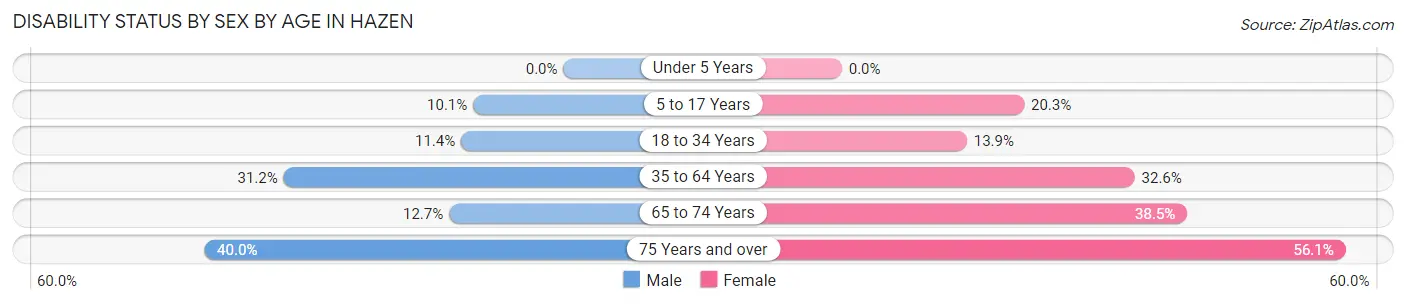
| Age Bracket | Male | Female |
| Under 5 Years | 0 (0.0%) | 0 (0.0%) |
| 5 to 17 Years | 21 (10.1%) | 41 (20.3%) |
| 18 to 34 Years | 9 (11.4%) | 27 (13.9%) |
| 35 to 64 Years | 105 (31.2%) | 120 (32.6%) |
| 65 to 74 Years | 14 (12.7%) | 20 (38.5%) |
| 75 Years and over | 4 (40.0%) | 23 (56.1%) |
Disability Class by Sex by Age in Hazen
Disability Class: Hearing Difficulty
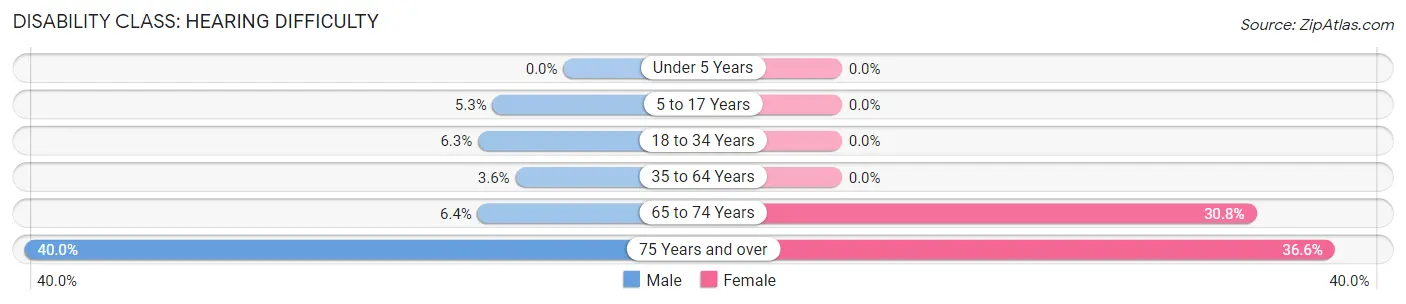
| Age Bracket | Male | Female |
| Under 5 Years | 0 (0.0%) | 0 (0.0%) |
| 5 to 17 Years | 11 (5.3%) | 0 (0.0%) |
| 18 to 34 Years | 5 (6.3%) | 0 (0.0%) |
| 35 to 64 Years | 12 (3.6%) | 0 (0.0%) |
| 65 to 74 Years | 7 (6.4%) | 16 (30.8%) |
| 75 Years and over | 4 (40.0%) | 15 (36.6%) |
Disability Class: Vision Difficulty
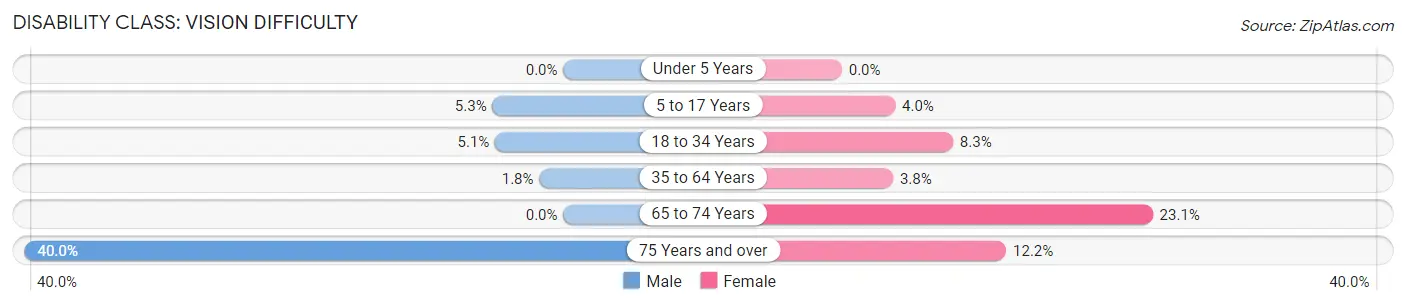
| Age Bracket | Male | Female |
| Under 5 Years | 0 (0.0%) | 0 (0.0%) |
| 5 to 17 Years | 11 (5.3%) | 8 (4.0%) |
| 18 to 34 Years | 4 (5.1%) | 16 (8.3%) |
| 35 to 64 Years | 6 (1.8%) | 14 (3.8%) |
| 65 to 74 Years | 0 (0.0%) | 12 (23.1%) |
| 75 Years and over | 4 (40.0%) | 5 (12.2%) |
Disability Class: Cognitive Difficulty
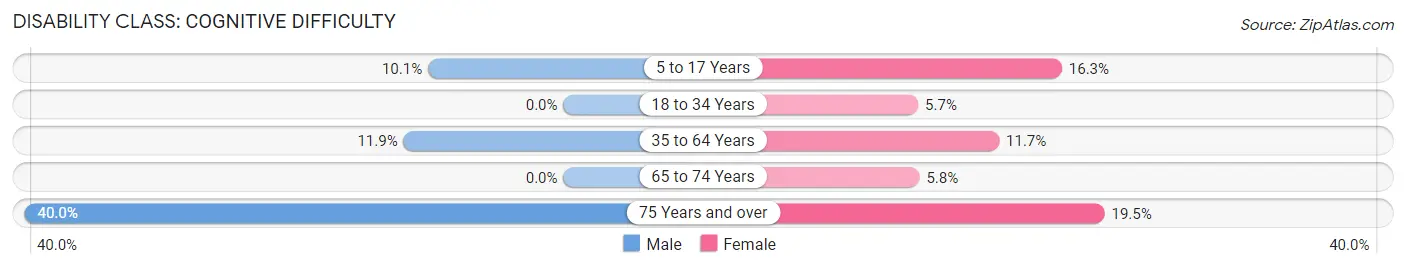
| Age Bracket | Male | Female |
| 5 to 17 Years | 21 (10.1%) | 33 (16.3%) |
| 18 to 34 Years | 0 (0.0%) | 11 (5.7%) |
| 35 to 64 Years | 40 (11.9%) | 43 (11.7%) |
| 65 to 74 Years | 0 (0.0%) | 3 (5.8%) |
| 75 Years and over | 4 (40.0%) | 8 (19.5%) |
Disability Class: Ambulatory Difficulty
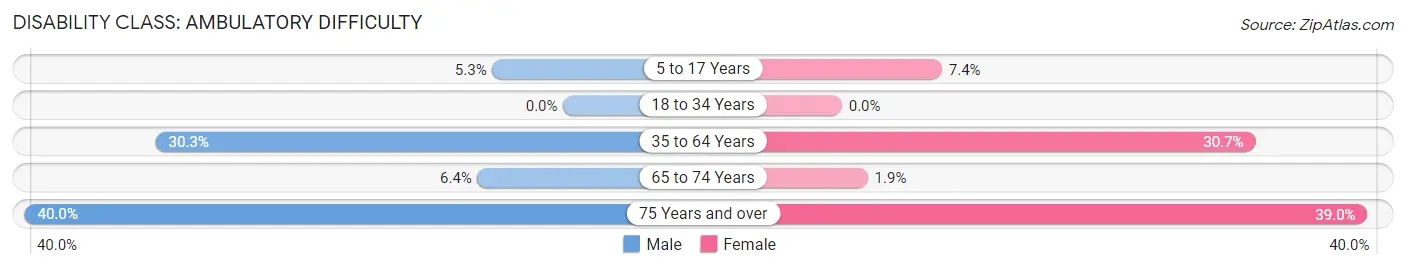
| Age Bracket | Male | Female |
| 5 to 17 Years | 11 (5.3%) | 15 (7.4%) |
| 18 to 34 Years | 0 (0.0%) | 0 (0.0%) |
| 35 to 64 Years | 102 (30.3%) | 113 (30.7%) |
| 65 to 74 Years | 7 (6.4%) | 1 (1.9%) |
| 75 Years and over | 4 (40.0%) | 16 (39.0%) |
Disability Class: Self-Care Difficulty
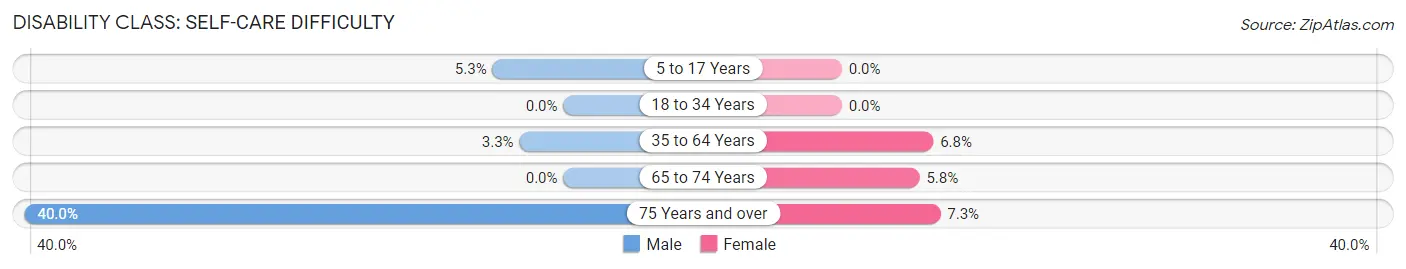
| Age Bracket | Male | Female |
| 5 to 17 Years | 11 (5.3%) | 0 (0.0%) |
| 18 to 34 Years | 0 (0.0%) | 0 (0.0%) |
| 35 to 64 Years | 11 (3.3%) | 25 (6.8%) |
| 65 to 74 Years | 0 (0.0%) | 3 (5.8%) |
| 75 Years and over | 4 (40.0%) | 3 (7.3%) |
Technology Access in Hazen
Computing Device Access in Hazen
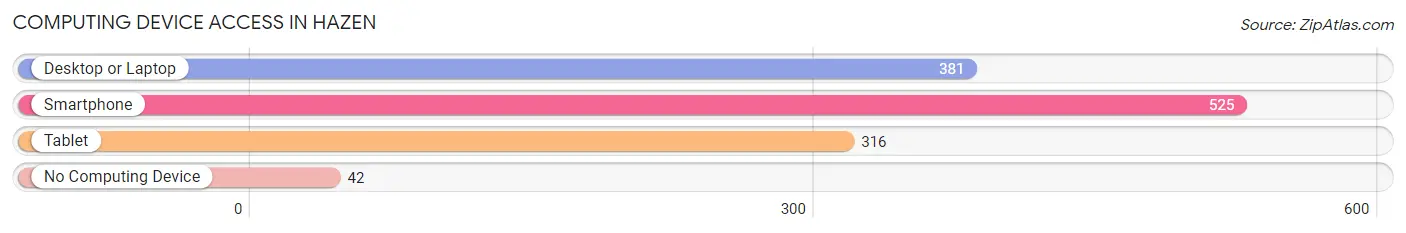
| Device Type | # Households | % Households |
| Desktop or Laptop | 381 | 64.8% |
| Smartphone | 525 | 89.3% |
| Tablet | 316 | 53.7% |
| No Computing Device | 42 | 7.1% |
| Total | 588 | 100.0% |
Internet Access in Hazen
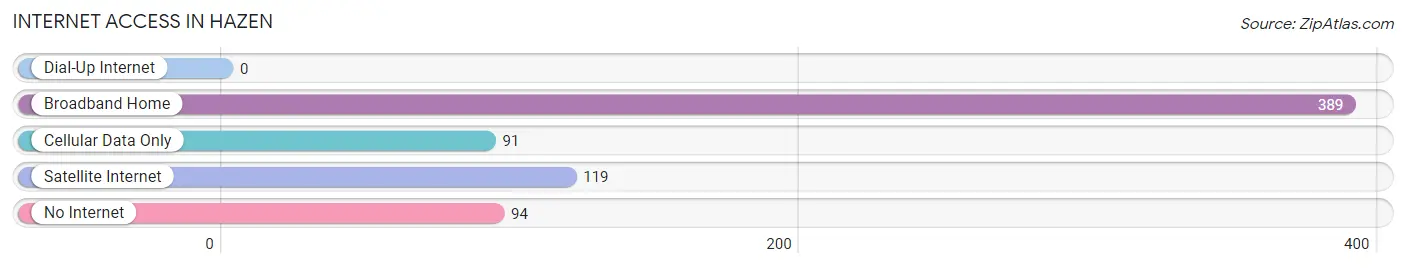
| Internet Type | # Households | % Households |
| Dial-Up Internet | 0 | 0.0% |
| Broadband Home | 389 | 66.2% |
| Cellular Data Only | 91 | 15.5% |
| Satellite Internet | 119 | 20.2% |
| No Internet | 94 | 16.0% |
| Total | 588 | 100.0% |
Hazen Summary
Hazen, Arkansas is a small city located in Prairie County, Arkansas. It is situated on the banks of the White River, approximately 30 miles east of Little Rock. The city has a population of 2,717 people, according to the 2010 census.
History
Hazen was founded in 1883 by the St. Louis, Iron Mountain and Southern Railway. The city was named after the railroad's president, William Hazen. The railroad was instrumental in the development of the city, as it provided transportation for the area's agricultural products.
The city was incorporated in 1887 and was home to a variety of businesses, including a cotton gin, a sawmill, a grist mill, and a brickyard. The city also had a hotel, a bank, and a post office.
In the early 1900s, the city experienced a period of growth and prosperity. The population increased from 500 in 1900 to 1,500 in 1910. The city was home to a variety of businesses, including a cotton gin, a sawmill, a grist mill, and a brickyard.
Geography
Hazen is located in Prairie County, Arkansas. It is situated on the banks of the White River, approximately 30 miles east of Little Rock. The city has a total area of 2.2 square miles, all of which is land.
The city is located in the Arkansas Delta, a flat, alluvial plain that stretches from the Mississippi River to the Ozark Mountains. The area is characterized by flat terrain, fertile soil, and abundant rainfall.
Economy
The economy of Hazen is largely based on agriculture. The city is home to a variety of farms, including cotton, soybean, and rice farms. The city is also home to a variety of businesses, including a cotton gin, a sawmill, a grist mill, and a brickyard.
The city is also home to a variety of manufacturing businesses, including a furniture factory, a clothing factory, and a food processing plant. The city is also home to a variety of retail businesses, including a grocery store, a hardware store, and a variety of restaurants.
Demographics
According to the 2010 census, the population of Hazen was 2,717. The racial makeup of the city was 79.3% White, 18.2% African American, 0.3% Native American, 0.2% Asian, 0.1% Pacific Islander, 0.7% from other races, and 1.4% from two or more races. Hispanic or Latino of any race were 1.7% of the population.
The median household income in Hazen was $30,938, and the median family income was $37,813. The per capita income for the city was $15,945. About 17.2% of families and 20.3% of the population were below the poverty line, including 28.2% of those under age 18 and 16.2% of those age 65 or over.
Conclusion
Hazen, Arkansas is a small city located in Prairie County, Arkansas. It is situated on the banks of the White River, approximately 30 miles east of Little Rock. The city has a population of 2,717 people, according to the 2010 census. The economy of Hazen is largely based on agriculture, and the city is home to a variety of businesses, including a cotton gin, a sawmill, a grist mill, and a brickyard. The racial makeup of the city was 79.3% White, 18.2% African American, 0.3% Native American, 0.2% Asian, 0.1% Pacific Islander, 0.7% from other races, and 1.4% from two or more races. The median household income in Hazen was $30,938, and the median family income was $37,813. About 17.2% of families and 20.3% of the population were below the poverty line.
Common Questions
What is Per Capita Income in Hazen?
Per Capita income in Hazen is $24,340.
What is the Median Family Income in Hazen?
Median Family Income in Hazen is $66,250.
What is the Median Household income in Hazen?
Median Household Income in Hazen is $47,209.
What is Income or Wage Gap in Hazen?
Income or Wage Gap in Hazen is 45.3%.
Women in Hazen earn 54.7 cents for every dollar earned by a man.
What is Inequality or Gini Index in Hazen?
Inequality or Gini Index in Hazen is 0.40.
What is the Total Population of Hazen?
Total Population of Hazen is 1,738.
What is the Total Male Population of Hazen?
Total Male Population of Hazen is 844.
What is the Total Female Population of Hazen?
Total Female Population of Hazen is 894.
What is the Ratio of Males per 100 Females in Hazen?
There are 94.41 Males per 100 Females in Hazen.
What is the Ratio of Females per 100 Males in Hazen?
There are 105.92 Females per 100 Males in Hazen.
What is the Median Population Age in Hazen?
Median Population Age in Hazen is 43.3 Years.
What is the Average Family Size in Hazen
Average Family Size in Hazen is 3.4 People.
What is the Average Household Size in Hazen
Average Household Size in Hazen is 2.8 People.
How Large is the Labor Force in Hazen?
There are 793 People in the Labor Forcein in Hazen.
What is the Percentage of People in the Labor Force in Hazen?
57.9% of People are in the Labor Force in Hazen.
What is the Unemployment Rate in Hazen?
Unemployment Rate in Hazen is 3.3%.