Hatfield, AR Map & Demographics
Hatfield Map
Hatfield Overview
$20,442
PER CAPITA INCOME
$37,035
AVG FAMILY INCOME
$36,635
AVG HOUSEHOLD INCOME
0.38
INEQUALITY / GINI INDEX
499
TOTAL POPULATION
224
MALE POPULATION
275
FEMALE POPULATION
81.45
MALES / 100 FEMALES
122.77
FEMALES / 100 MALES
28.3
MEDIAN AGE
2.4
AVG FAMILY SIZE
2.2
AVG HOUSEHOLD SIZE
259
LABOR FORCE [ PEOPLE ]
62.4%
PERCENT IN LABOR FORCE
3.1%
UNEMPLOYMENT RATE
Hatfield Zip Codes
Hatfield Area Codes
Income in Hatfield
Income Overview in Hatfield
Per Capita Income in Hatfield is $20,442, while median incomes of families and households are $37,035 and $36,635 respectively.
| Characteristic | Number | Measure |
| Per Capita Income | 499 | $20,442 |
| Median Family Income | 175 | $37,035 |
| Mean Family Income | 175 | $57,359 |
| Median Household Income | 224 | $36,635 |
| Mean Household Income | 224 | $51,799 |
| Income Deficit | 175 | $0 |
| Wage / Income Gap (%) | 499 | 0.00% |
| Wage / Income Gap ($) | 499 | 100.00¢ per $1 |
| Gini / Inequality Index | 499 | 0.38 |
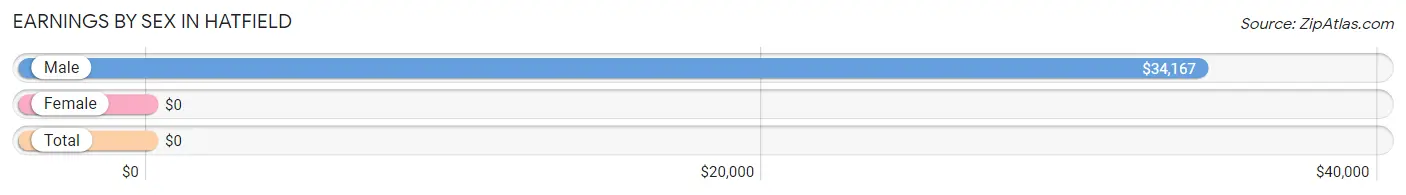
Earnings by Sex in Hatfield
| Sex | Number | Average Earnings |
| Male | 90 (34.6%) | $34,167 |
| Female | 170 (65.4%) | $0 |
| Total | 260 (100.0%) | $0 |
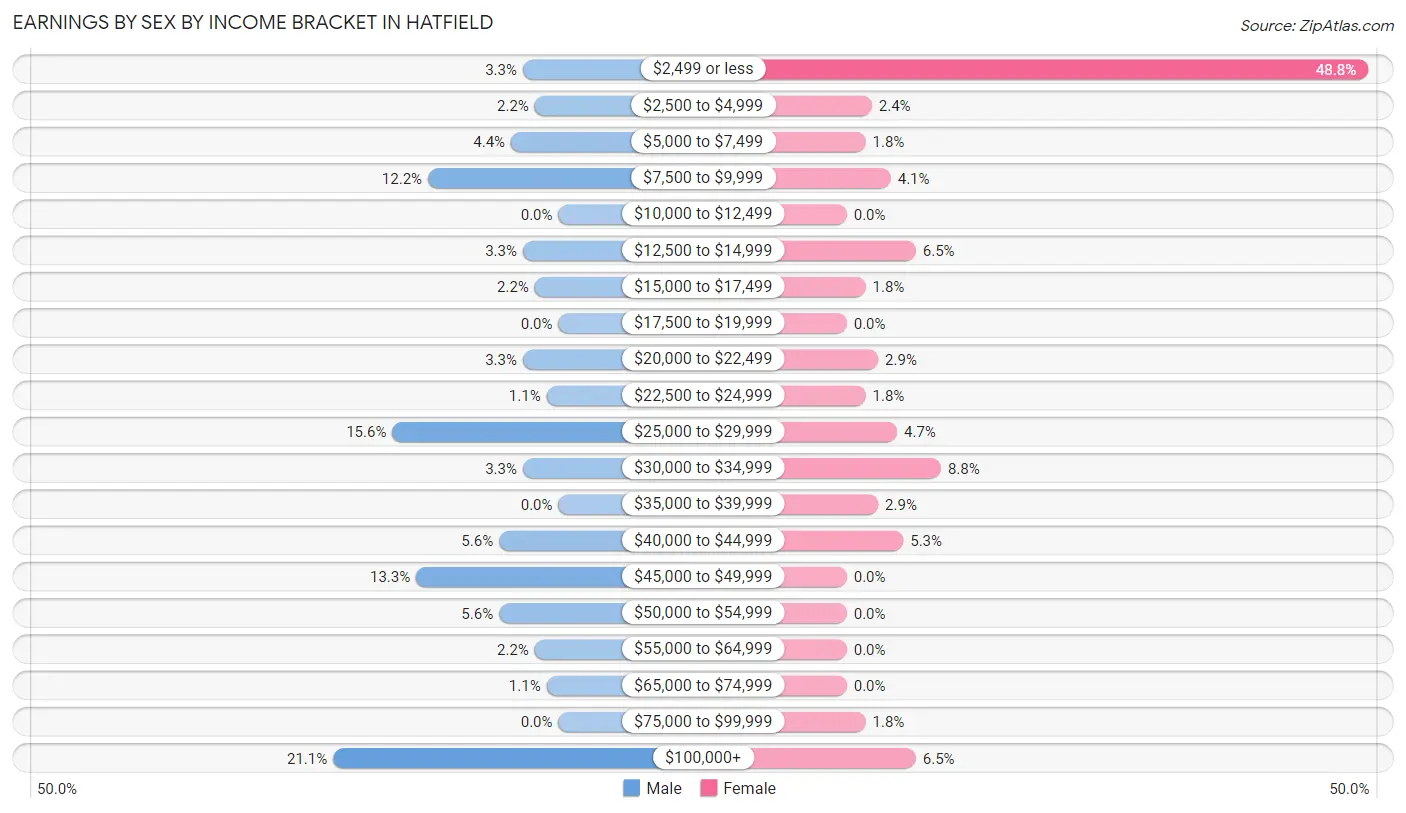
Earnings by Sex by Income Bracket in Hatfield
The most common earnings brackets in Hatfield are $100,000+ for men (19 | 21.1%) and $2,499 or less for women (83 | 48.8%).
| Income | Male | Female |
| $2,499 or less | 3 (3.3%) | 83 (48.8%) |
| $2,500 to $4,999 | 2 (2.2%) | 4 (2.4%) |
| $5,000 to $7,499 | 4 (4.4%) | 3 (1.8%) |
| $7,500 to $9,999 | 11 (12.2%) | 7 (4.1%) |
| $10,000 to $12,499 | 0 (0.0%) | 0 (0.0%) |
| $12,500 to $14,999 | 3 (3.3%) | 11 (6.5%) |
| $15,000 to $17,499 | 2 (2.2%) | 3 (1.8%) |
| $17,500 to $19,999 | 0 (0.0%) | 0 (0.0%) |
| $20,000 to $22,499 | 3 (3.3%) | 5 (2.9%) |
| $22,500 to $24,999 | 1 (1.1%) | 3 (1.8%) |
| $25,000 to $29,999 | 14 (15.6%) | 8 (4.7%) |
| $30,000 to $34,999 | 3 (3.3%) | 15 (8.8%) |
| $35,000 to $39,999 | 0 (0.0%) | 5 (2.9%) |
| $40,000 to $44,999 | 5 (5.6%) | 9 (5.3%) |
| $45,000 to $49,999 | 12 (13.3%) | 0 (0.0%) |
| $50,000 to $54,999 | 5 (5.6%) | 0 (0.0%) |
| $55,000 to $64,999 | 2 (2.2%) | 0 (0.0%) |
| $65,000 to $74,999 | 1 (1.1%) | 0 (0.0%) |
| $75,000 to $99,999 | 0 (0.0%) | 3 (1.8%) |
| $100,000+ | 19 (21.1%) | 11 (6.5%) |
| Total | 90 (100.0%) | 170 (100.0%) |
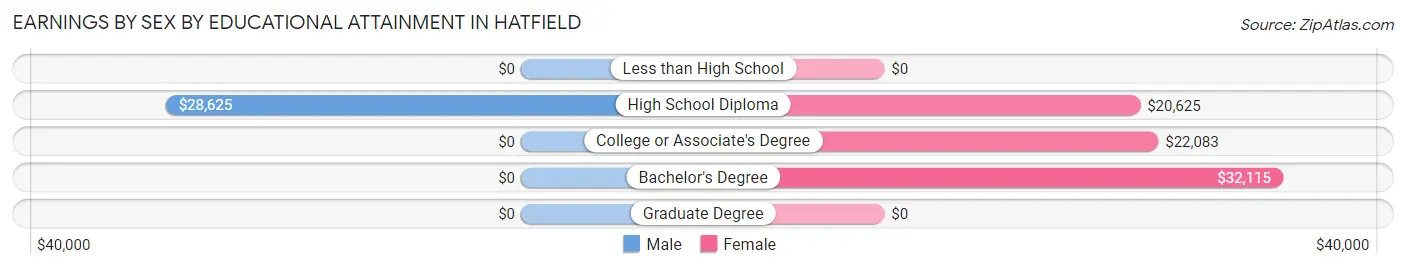
Earnings by Sex by Educational Attainment in Hatfield
Average earnings in Hatfield are $44,750 for men and $26,964 for women, a difference of 39.8%. Men with an educational attainment of high school diploma enjoy the highest average annual earnings of $28,625, while those with high school diploma education earn the least with $28,625. Women with an educational attainment of bachelor's degree earn the most with the average annual earnings of $32,115, while those with high school diploma education have the smallest earnings of $20,625.
| Educational Attainment | Male Income | Female Income |
| Less than High School | - | - |
| High School Diploma | $28,625 | $20,625 |
| College or Associate's Degree | - | - |
| Bachelor's Degree | - | - |
| Graduate Degree | - | - |
| Total | $44,750 | $26,964 |
Family Income in Hatfield
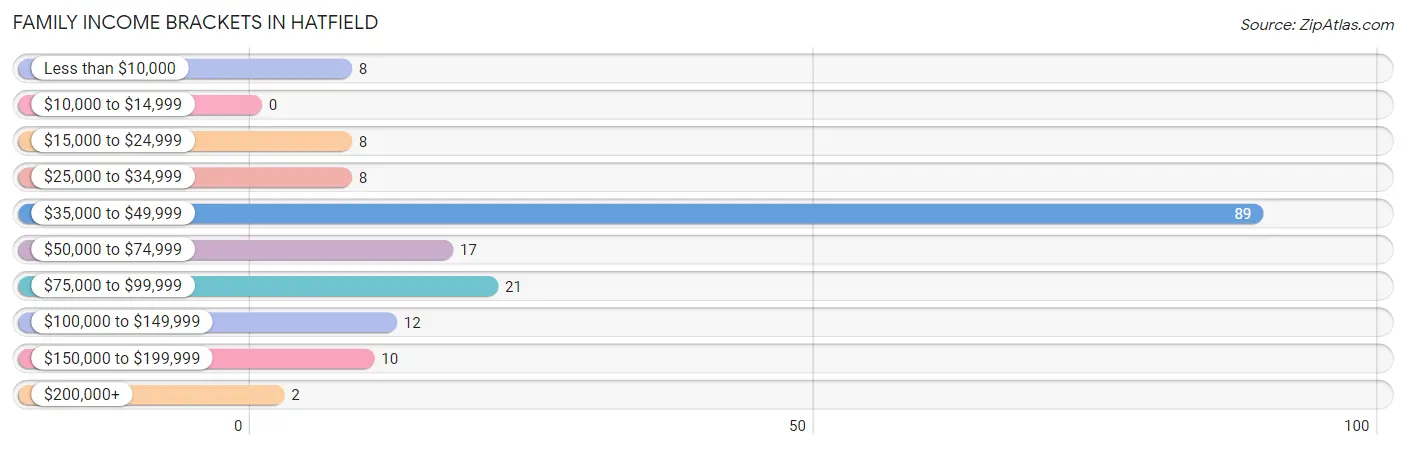
Family Income Brackets in Hatfield
According to the Hatfield family income data, there are 89 families falling into the $35,000 to $49,999 income range, which is the most common income bracket and makes up 50.9% of all families.
| Income Bracket | # Families | % Families |
| Less than $10,000 | 8 | 4.6% |
| $10,000 to $14,999 | 0 | 0.0% |
| $15,000 to $24,999 | 8 | 4.6% |
| $25,000 to $34,999 | 8 | 4.6% |
| $35,000 to $49,999 | 89 | 50.9% |
| $50,000 to $74,999 | 17 | 9.7% |
| $75,000 to $99,999 | 21 | 12.0% |
| $100,000 to $149,999 | 12 | 6.9% |
| $150,000 to $199,999 | 10 | 5.7% |
| $200,000+ | 2 | 1.1% |
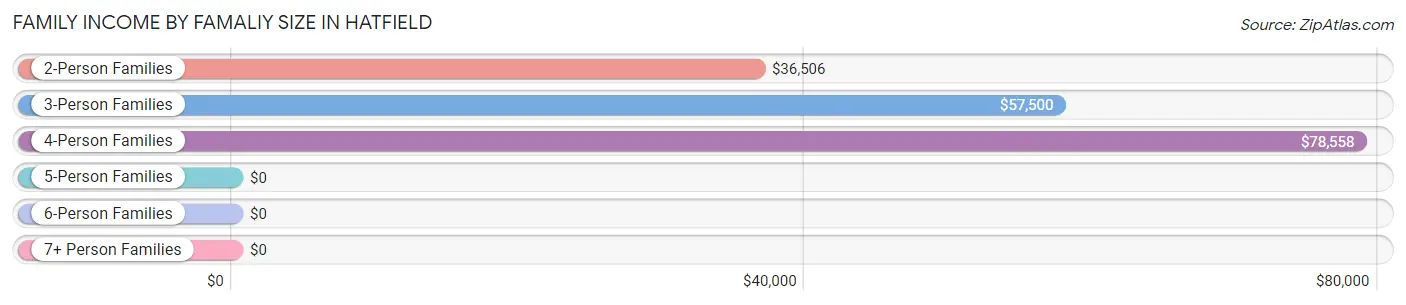
Family Income by Famaliy Size in Hatfield
4-person families (23 | 13.1%) account for the highest median family income in Hatfield with $78,558 per family, while 4-person families (23 | 13.1%) have the highest median income of $19,640 per family member.
| Income Bracket | # Families | Median Income |
| 2-Person Families | 116 (66.3%) | $36,506 |
| 3-Person Families | 26 (14.9%) | $57,500 |
| 4-Person Families | 23 (13.1%) | $78,558 |
| 5-Person Families | 6 (3.4%) | $0 |
| 6-Person Families | 4 (2.3%) | $0 |
| 7+ Person Families | 0 (0.0%) | $0 |
| Total | 175 (100.0%) | $37,035 |
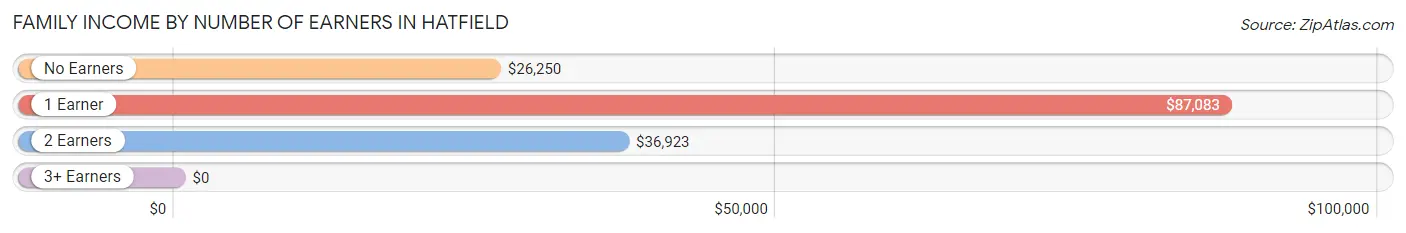
Family Income by Number of Earners in Hatfield
| Number of Earners | # Families | Median Income |
| No Earners | 18 (10.3%) | $26,250 |
| 1 Earner | 25 (14.3%) | $87,083 |
| 2 Earners | 130 (74.3%) | $36,923 |
| 3+ Earners | 2 (1.1%) | $0 |
| Total | 175 (100.0%) | $37,035 |
Household Income in Hatfield
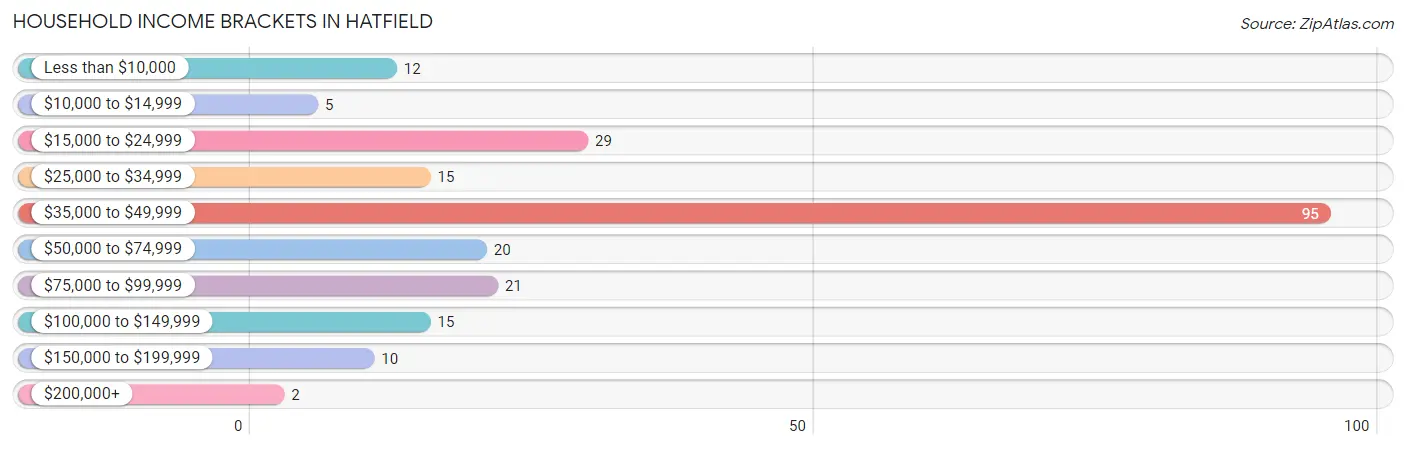
Household Income Brackets in Hatfield
With 95 households falling in the category, the $35,000 to $49,999 income range is the most frequent in Hatfield, accounting for 42.4% of all households. In contrast, only 2 households (0.9%) fall into the $200,000+ income bracket, making it the least populous group.
| Income Bracket | # Households | % Households |
| Less than $10,000 | 12 | 5.4% |
| $10,000 to $14,999 | 5 | 2.2% |
| $15,000 to $24,999 | 29 | 12.9% |
| $25,000 to $34,999 | 15 | 6.7% |
| $35,000 to $49,999 | 95 | 42.4% |
| $50,000 to $74,999 | 20 | 8.9% |
| $75,000 to $99,999 | 21 | 9.4% |
| $100,000 to $149,999 | 15 | 6.7% |
| $150,000 to $199,999 | 10 | 4.5% |
| $200,000+ | 2 | 0.9% |
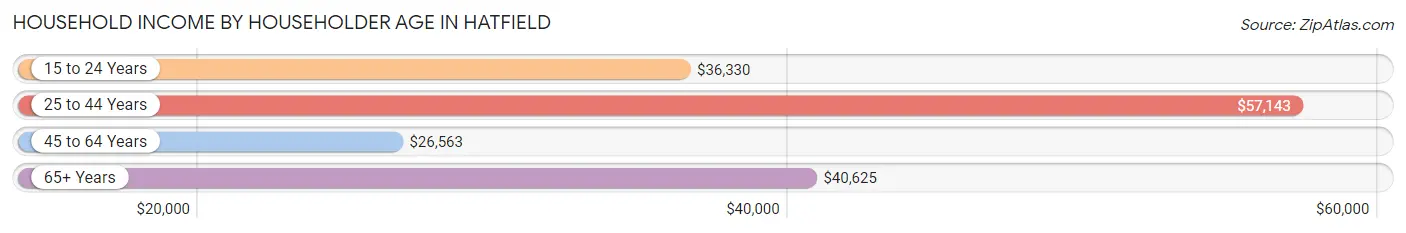
Household Income by Householder Age in Hatfield
The median household income in Hatfield is $36,635, with the highest median household income of $57,143 found in the 25 to 44 years age bracket for the primary householder. A total of 50 households (22.3%) fall into this category. Meanwhile, the 45 to 64 years age bracket for the primary householder has the lowest median household income of $26,563, with 40 households (17.9%) in this group.
| Income Bracket | # Households | Median Income |
| 15 to 24 Years | 83 (37.0%) | $36,330 |
| 25 to 44 Years | 50 (22.3%) | $57,143 |
| 45 to 64 Years | 40 (17.9%) | $26,563 |
| 65+ Years | 51 (22.8%) | $40,625 |
| Total | 224 (100.0%) | $36,635 |
Poverty in Hatfield
Income Below Poverty by Sex and Age in Hatfield
With 19.2% poverty level for males and 14.5% for females among the residents of Hatfield, 55 to 64 year old males and 18 to 24 year old females are the most vulnerable to poverty, with 19 males (67.9%) and 7 females (53.8%) in their respective age groups living below the poverty level.
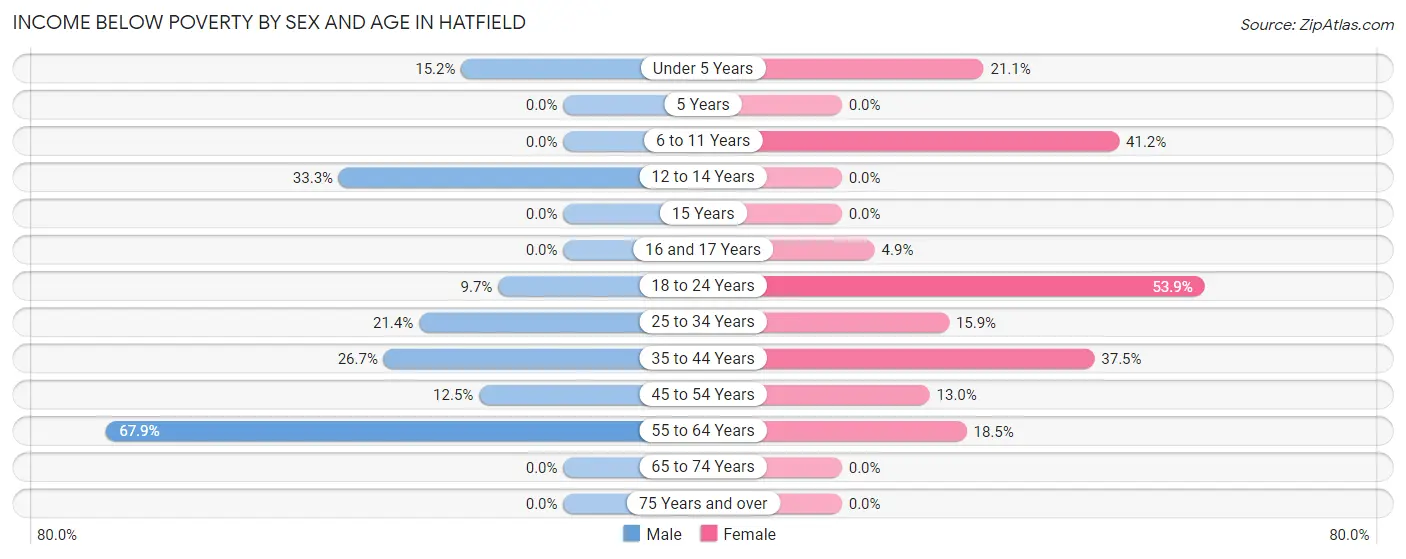
| Age Bracket | Male | Female |
| Under 5 Years | 5 (15.1%) | 4 (21.0%) |
| 5 Years | 0 (0.0%) | 0 (0.0%) |
| 6 to 11 Years | 0 (0.0%) | 7 (41.2%) |
| 12 to 14 Years | 1 (33.3%) | 0 (0.0%) |
| 15 Years | 0 (0.0%) | 0 (0.0%) |
| 16 and 17 Years | 0 (0.0%) | 4 (4.9%) |
| 18 to 24 Years | 3 (9.7%) | 7 (53.8%) |
| 25 to 34 Years | 9 (21.4%) | 7 (15.9%) |
| 35 to 44 Years | 4 (26.7%) | 3 (37.5%) |
| 45 to 54 Years | 2 (12.5%) | 3 (13.0%) |
| 55 to 64 Years | 19 (67.9%) | 5 (18.5%) |
| 65 to 74 Years | 0 (0.0%) | 0 (0.0%) |
| 75 Years and over | 0 (0.0%) | 0 (0.0%) |
| Total | 43 (19.2%) | 40 (14.5%) |
Income Above Poverty by Sex and Age in Hatfield
According to the poverty statistics in Hatfield, males aged 6 to 11 years and females aged 12 to 14 years are the age groups that are most secure financially, with 100.0% of males and 100.0% of females in these age groups living above the poverty line.
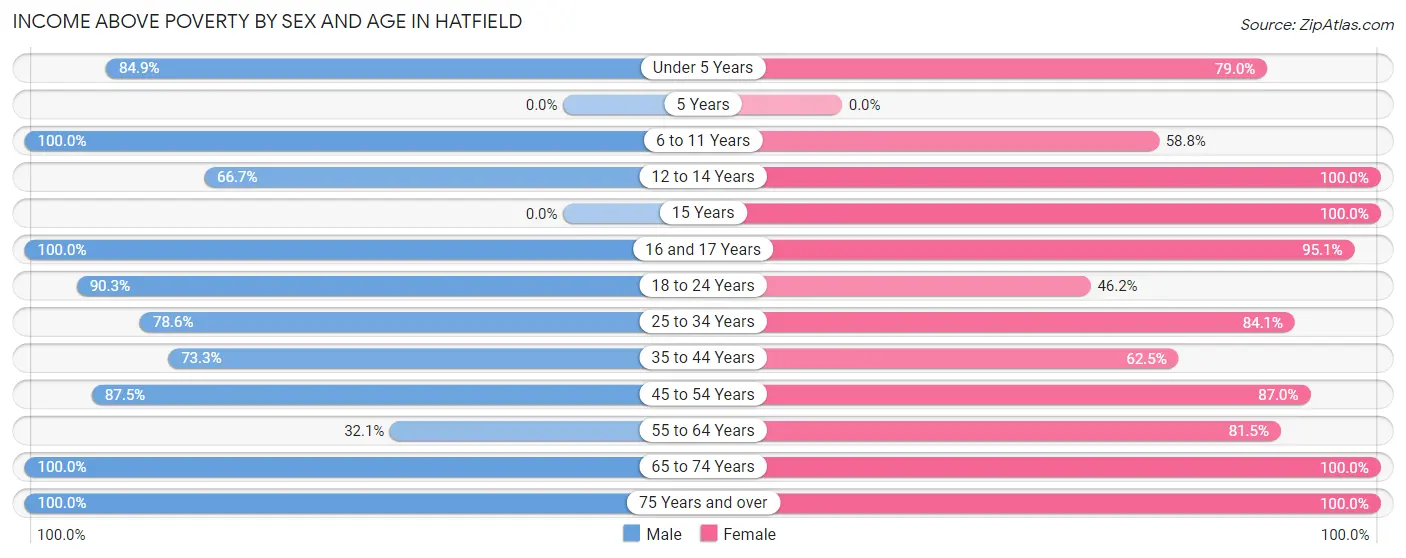
| Age Bracket | Male | Female |
| Under 5 Years | 28 (84.9%) | 15 (78.9%) |
| 5 Years | 0 (0.0%) | 0 (0.0%) |
| 6 to 11 Years | 8 (100.0%) | 10 (58.8%) |
| 12 to 14 Years | 2 (66.7%) | 2 (100.0%) |
| 15 Years | 0 (0.0%) | 2 (100.0%) |
| 16 and 17 Years | 2 (100.0%) | 78 (95.1%) |
| 18 to 24 Years | 28 (90.3%) | 6 (46.2%) |
| 25 to 34 Years | 33 (78.6%) | 37 (84.1%) |
| 35 to 44 Years | 11 (73.3%) | 5 (62.5%) |
| 45 to 54 Years | 14 (87.5%) | 20 (87.0%) |
| 55 to 64 Years | 9 (32.1%) | 22 (81.5%) |
| 65 to 74 Years | 27 (100.0%) | 18 (100.0%) |
| 75 Years and over | 19 (100.0%) | 20 (100.0%) |
| Total | 181 (80.8%) | 235 (85.5%) |
Income Below Poverty Among Married-Couple Families in Hatfield
The poverty statistics for married-couple families in Hatfield show that 6.7% or 10 of the total 150 families live below the poverty line. Families with 3 or 4 children have the highest poverty rate of 44.4%, comprising of 4 families. On the other hand, families with no children have the lowest poverty rate of 2.6%, which includes 3 families.
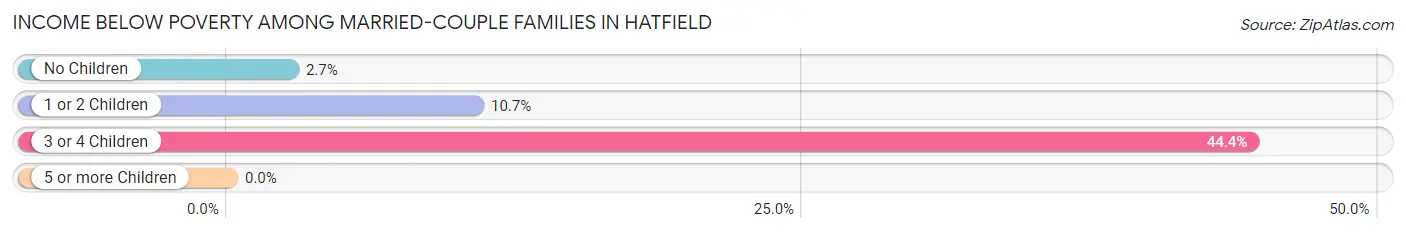
| Children | Above Poverty | Below Poverty |
| No Children | 110 (97.4%) | 3 (2.6%) |
| 1 or 2 Children | 25 (89.3%) | 3 (10.7%) |
| 3 or 4 Children | 5 (55.6%) | 4 (44.4%) |
| 5 or more Children | 0 (0.0%) | 0 (0.0%) |
| Total | 140 (93.3%) | 10 (6.7%) |
Income Below Poverty Among Single-Parent Households in Hatfield
According to the poverty data in Hatfield, 8.3% or 1 single-father households and 23.1% or 3 single-mother households are living below the poverty line. Among single-father households, those with 1 or 2 children have the highest poverty rate, with 1 households (50.0%) experiencing poverty. Likewise, among single-mother households, those with 1 or 2 children have the highest poverty rate, with 3 households (60.0%) falling below the poverty line.
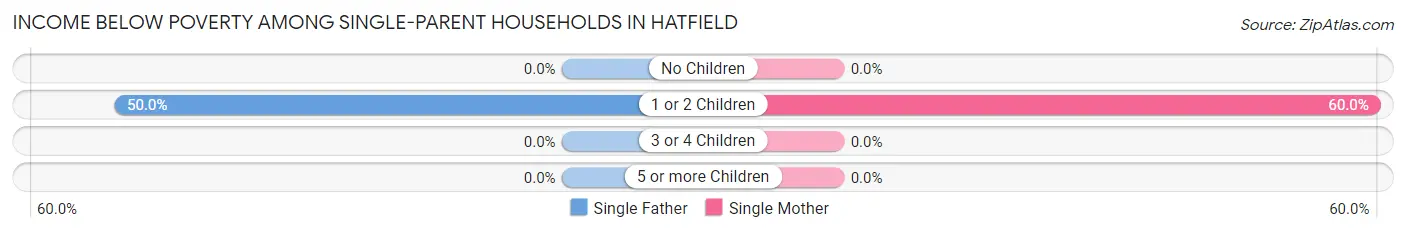
| Children | Single Father | Single Mother |
| No Children | 0 (0.0%) | 0 (0.0%) |
| 1 or 2 Children | 1 (50.0%) | 3 (60.0%) |
| 3 or 4 Children | 0 (0.0%) | 0 (0.0%) |
| 5 or more Children | 0 (0.0%) | 0 (0.0%) |
| Total | 1 (8.3%) | 3 (23.1%) |
Income Below Poverty Among Married-Couple vs Single-Parent Households in Hatfield
The poverty data for Hatfield shows that 10 of the married-couple family households (6.7%) and 4 of the single-parent households (16.0%) are living below the poverty level. Within the married-couple family households, those with 3 or 4 children have the highest poverty rate, with 4 households (44.4%) falling below the poverty line. Among the single-parent households, those with 1 or 2 children have the highest poverty rate, with 4 household (57.1%) living below poverty.
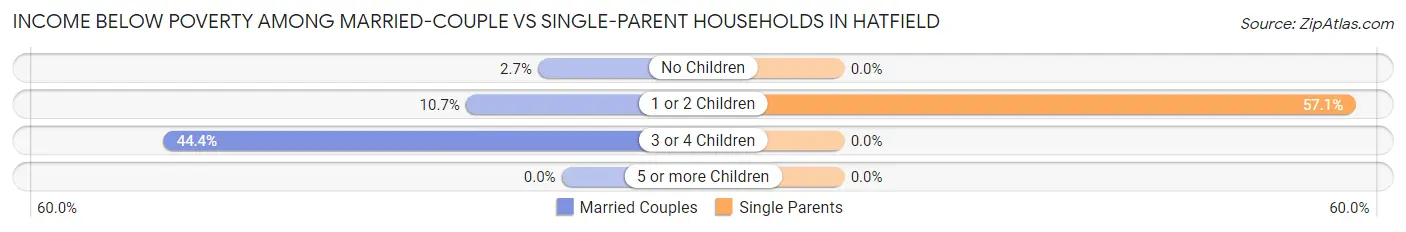
| Children | Married-Couple Families | Single-Parent Households |
| No Children | 3 (2.6%) | 0 (0.0%) |
| 1 or 2 Children | 3 (10.7%) | 4 (57.1%) |
| 3 or 4 Children | 4 (44.4%) | 0 (0.0%) |
| 5 or more Children | 0 (0.0%) | 0 (0.0%) |
| Total | 10 (6.7%) | 4 (16.0%) |
Race in Hatfield
The most populous races in Hatfield are White / Caucasian (461 | 92.4%), Two or more Races (25 | 5.0%), and Hispanic or Latino (16 | 3.2%).
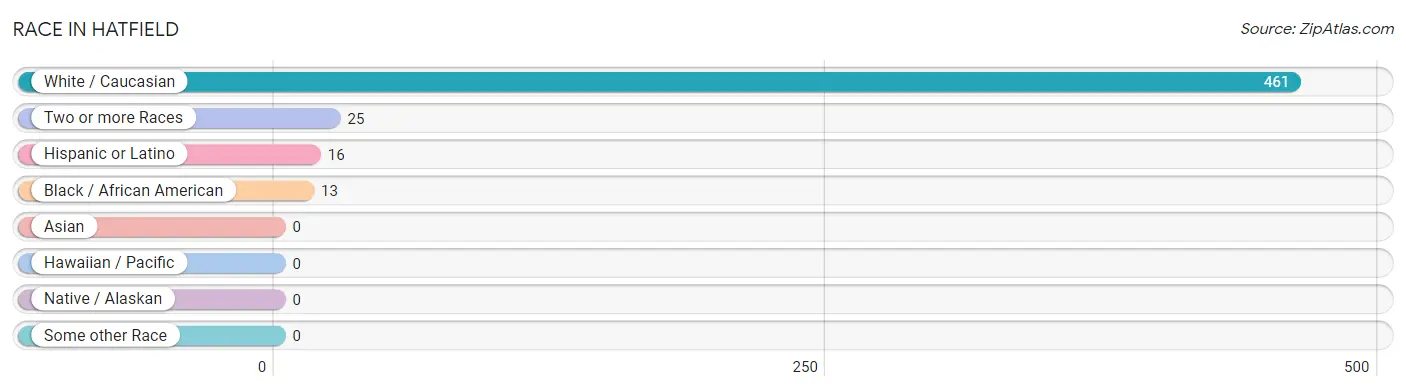
| Race | # Population | % Population |
| Asian | 0 | 0.0% |
| Black / African American | 13 | 2.6% |
| Hawaiian / Pacific | 0 | 0.0% |
| Hispanic or Latino | 16 | 3.2% |
| Native / Alaskan | 0 | 0.0% |
| White / Caucasian | 461 | 92.4% |
| Two or more Races | 25 | 5.0% |
| Some other Race | 0 | 0.0% |
| Total | 499 | 100.0% |
Ancestry in Hatfield
The most populous ancestries reported in Hatfield are Irish (66 | 13.2%), English (51 | 10.2%), German (42 | 8.4%), Dutch (21 | 4.2%), and Welsh (20 | 4.0%), together accounting for 40.1% of all Hatfield residents.
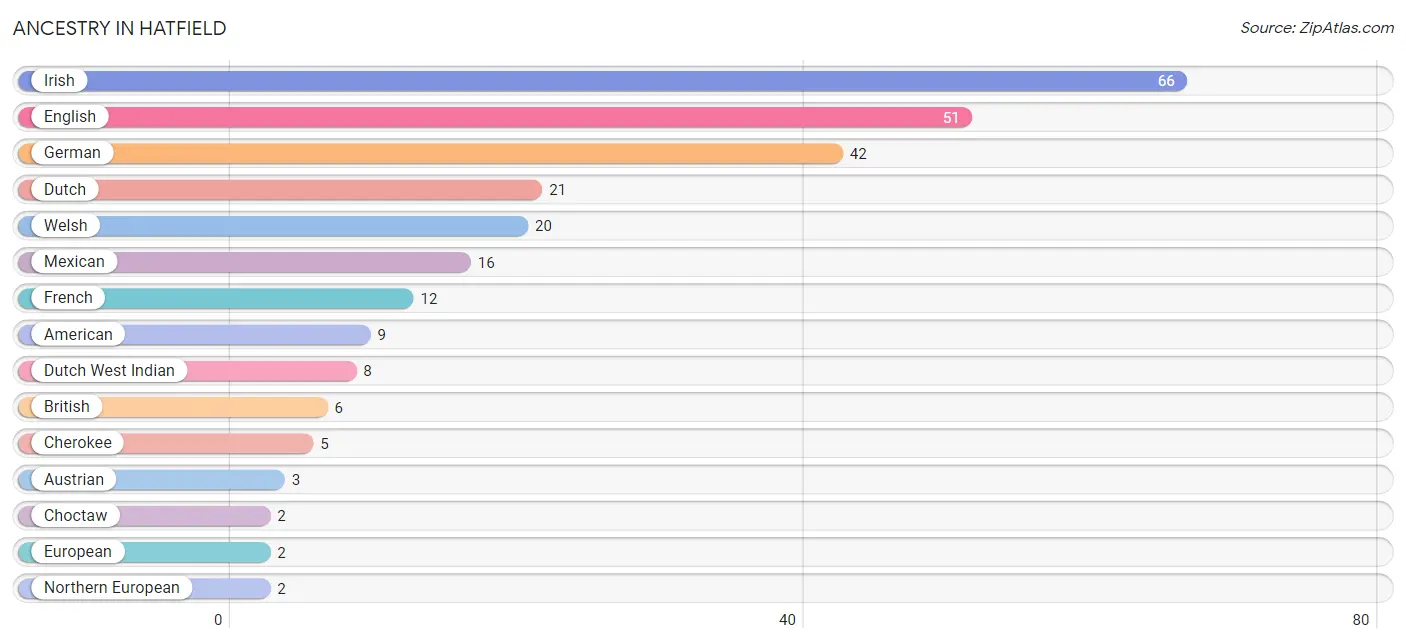
| Ancestry | # Population | % Population |
| American | 9 | 1.8% |
| Austrian | 3 | 0.6% |
| British | 6 | 1.2% |
| Cherokee | 5 | 1.0% |
| Choctaw | 2 | 0.4% |
| Dutch | 21 | 4.2% |
| Dutch West Indian | 8 | 1.6% |
| English | 51 | 10.2% |
| European | 2 | 0.4% |
| French | 12 | 2.4% |
| German | 42 | 8.4% |
| Irish | 66 | 13.2% |
| Mexican | 16 | 3.2% |
| Northern European | 2 | 0.4% |
| Scottish | 2 | 0.4% |
| Welsh | 20 | 4.0% | View All 16 Rows |
Immigrants in Hatfield
The most numerous immigrant groups reported in Hatfield came from Africa (6 | 1.2%), and South Africa (6 | 1.2%), together accounting for 2.4% of all Hatfield residents.
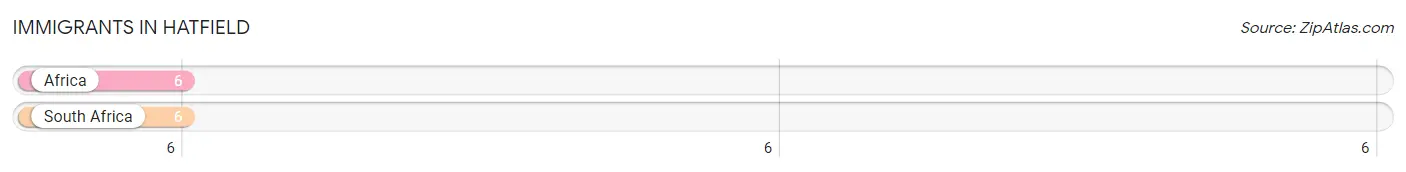
| Immigration Origin | # Population | % Population |
| Africa | 6 | 1.2% |
| South Africa | 6 | 1.2% | View All 2 Rows |
Sex and Age in Hatfield
Sex and Age in Hatfield
The most populous age groups in Hatfield are Under 5 Years (33 | 14.7%) for men and 15 to 19 Years (91 | 33.1%) for women.
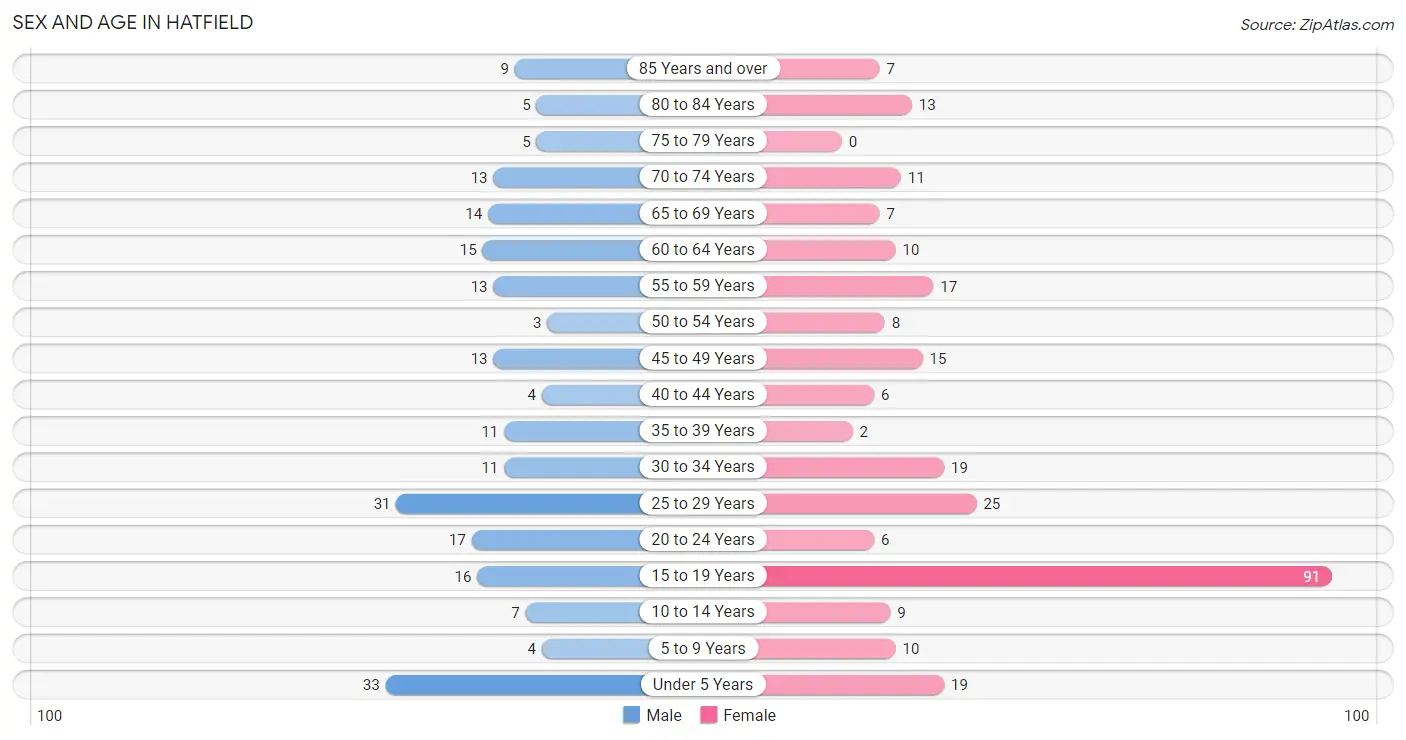
| Age Bracket | Male | Female |
| Under 5 Years | 33 (14.7%) | 19 (6.9%) |
| 5 to 9 Years | 4 (1.8%) | 10 (3.6%) |
| 10 to 14 Years | 7 (3.1%) | 9 (3.3%) |
| 15 to 19 Years | 16 (7.1%) | 91 (33.1%) |
| 20 to 24 Years | 17 (7.6%) | 6 (2.2%) |
| 25 to 29 Years | 31 (13.8%) | 25 (9.1%) |
| 30 to 34 Years | 11 (4.9%) | 19 (6.9%) |
| 35 to 39 Years | 11 (4.9%) | 2 (0.7%) |
| 40 to 44 Years | 4 (1.8%) | 6 (2.2%) |
| 45 to 49 Years | 13 (5.8%) | 15 (5.4%) |
| 50 to 54 Years | 3 (1.3%) | 8 (2.9%) |
| 55 to 59 Years | 13 (5.8%) | 17 (6.2%) |
| 60 to 64 Years | 15 (6.7%) | 10 (3.6%) |
| 65 to 69 Years | 14 (6.2%) | 7 (2.5%) |
| 70 to 74 Years | 13 (5.8%) | 11 (4.0%) |
| 75 to 79 Years | 5 (2.2%) | 0 (0.0%) |
| 80 to 84 Years | 5 (2.2%) | 13 (4.7%) |
| 85 Years and over | 9 (4.0%) | 7 (2.5%) |
| Total | 224 (100.0%) | 275 (100.0%) |
Families and Households in Hatfield
Median Family Size in Hatfield
The median family size in Hatfield is 2.39 persons per family, with single female/mother families (13 | 7.4%) accounting for the largest median family size of 3.69 persons per family. On the other hand, married-couple families (150 | 85.7%) represent the smallest median family size with 2.27 persons per family.
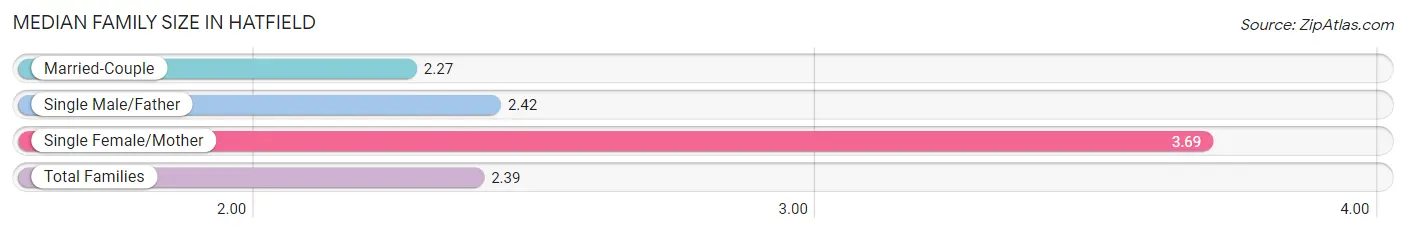
| Family Type | # Families | Family Size |
| Married-Couple | 150 (85.7%) | 2.27 |
| Single Male/Father | 12 (6.9%) | 2.42 |
| Single Female/Mother | 13 (7.4%) | 3.69 |
| Total Families | 175 (100.0%) | 2.39 |
Median Household Size in Hatfield
The median household size in Hatfield is 2.23 persons per household, with single female/mother households (13 | 5.8%) accounting for the largest median household size of 4.46 persons per household. non-family households (49 | 21.9%) represent the smallest median household size with 1.33 persons per household.
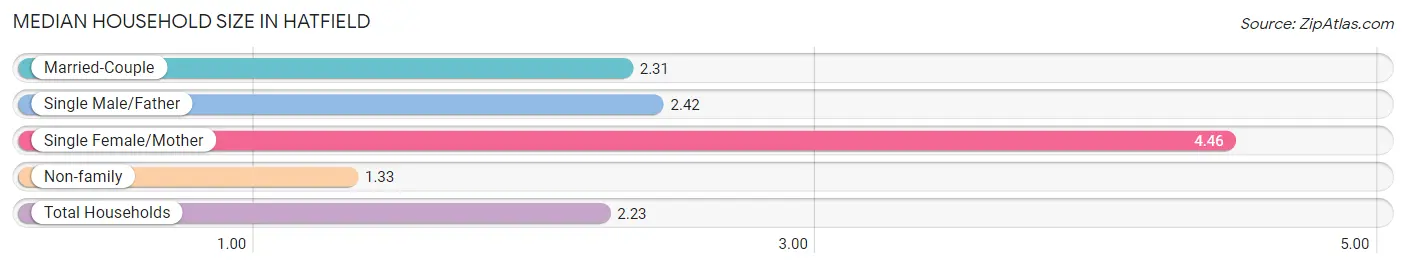
| Household Type | # Households | Household Size |
| Married-Couple | 150 (67.0%) | 2.31 |
| Single Male/Father | 12 (5.4%) | 2.42 |
| Single Female/Mother | 13 (5.8%) | 4.46 |
| Non-family | 49 (21.9%) | 1.33 |
| Total Households | 224 (100.0%) | 2.23 |
Household Size by Marriage Status in Hatfield
Out of a total of 224 households in Hatfield, 175 (78.1%) are family households, while 49 (21.9%) are nonfamily households. The most numerous type of family households are 2-person households, comprising 116, and the most common type of nonfamily households are 1-person households, comprising 44.
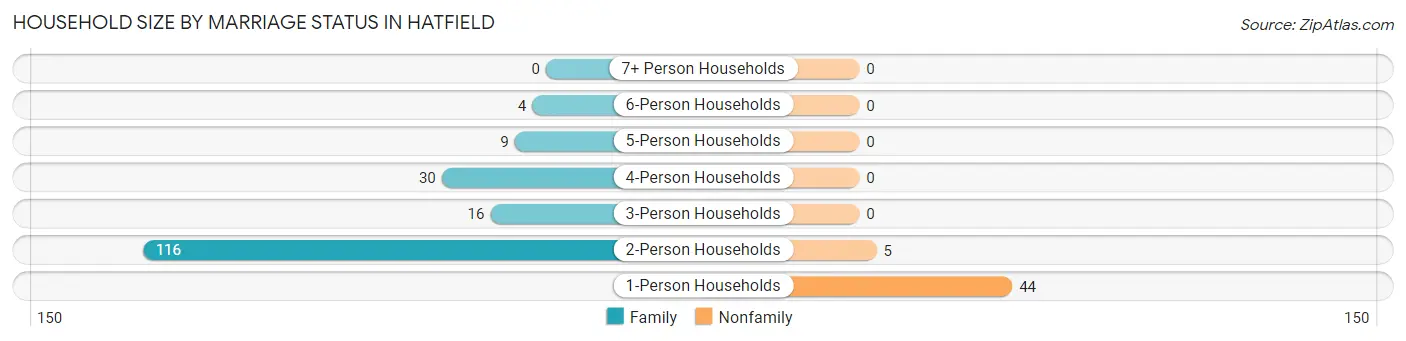
| Household Size | Family Households | Nonfamily Households |
| 1-Person Households | - | 44 (19.6%) |
| 2-Person Households | 116 (51.8%) | 5 (2.2%) |
| 3-Person Households | 16 (7.1%) | 0 (0.0%) |
| 4-Person Households | 30 (13.4%) | 0 (0.0%) |
| 5-Person Households | 9 (4.0%) | 0 (0.0%) |
| 6-Person Households | 4 (1.8%) | 0 (0.0%) |
| 7+ Person Households | 0 (0.0%) | 0 (0.0%) |
| Total | 175 (78.1%) | 49 (21.9%) |
Female Fertility in Hatfield
Fertility by Age in Hatfield
Average fertility rate in Hatfield is 18.0 births per 1,000 women. Women in the age bracket of 20 to 34 years have the highest fertility rate with 60.0 births per 1,000 women. Women in the age bracket of 20 to 34 years acount for 100.0% of all women with births.
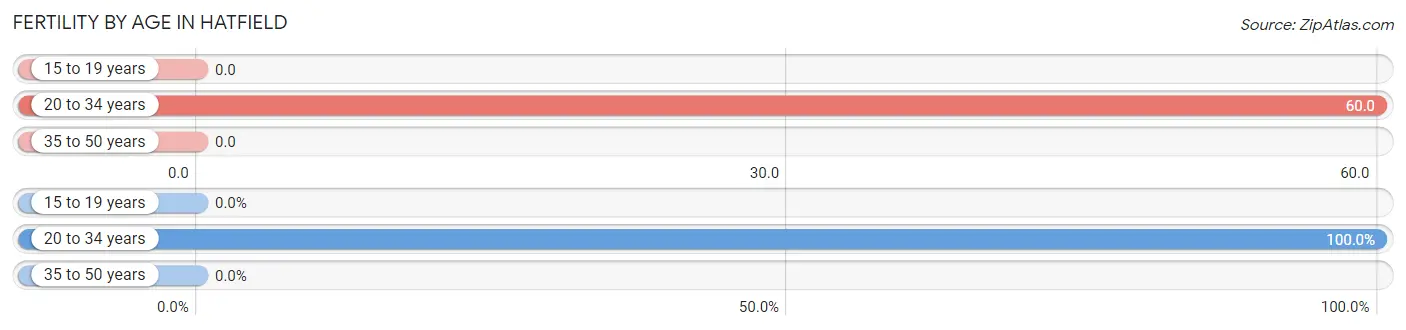
| Age Bracket | Women with Births | Births / 1,000 Women |
| 15 to 19 years | 0 (0.0%) | 0.0 |
| 20 to 34 years | 3 (100.0%) | 60.0 |
| 35 to 50 years | 0 (0.0%) | 0.0 |
| Total | 3 (100.0%) | 18.0 |
Fertility by Age by Marriage Status in Hatfield
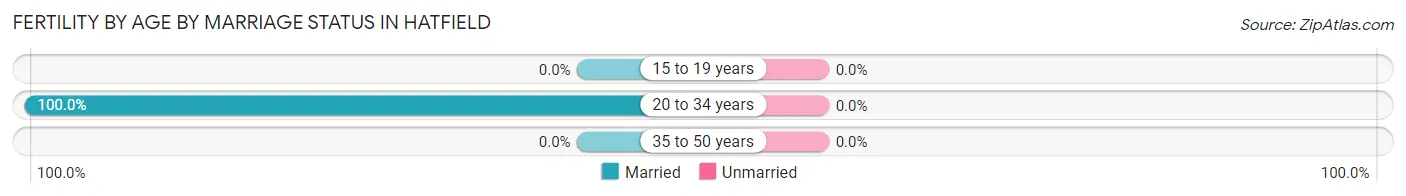
| Age Bracket | Married | Unmarried |
| 15 to 19 years | 0 (0.0%) | 0 (0.0%) |
| 20 to 34 years | 3 (100.0%) | 0 (0.0%) |
| 35 to 50 years | 0 (0.0%) | 0 (0.0%) |
| Total | 3 (100.0%) | 0 (0.0%) |
Fertility by Education in Hatfield
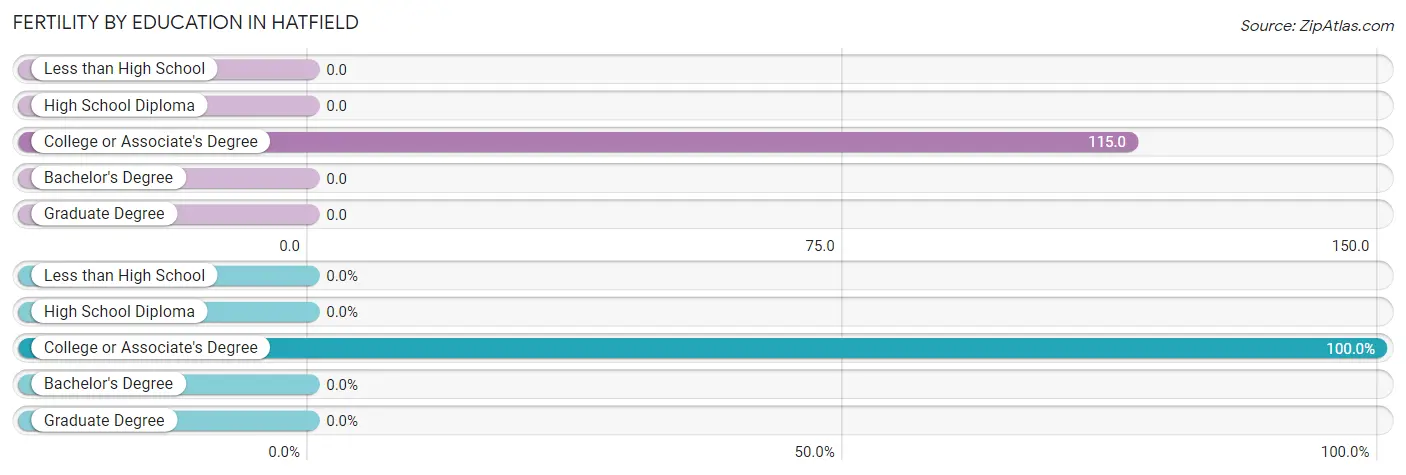
| Educational Attainment | Women with Births | Births / 1,000 Women |
| Less than High School | 0 (0.0%) | 0.0 |
| High School Diploma | 0 (0.0%) | 0.0 |
| College or Associate's Degree | 3 (100.0%) | 115.0 |
| Bachelor's Degree | 0 (0.0%) | 0.0 |
| Graduate Degree | 0 (0.0%) | 0.0 |
| Total | 3 (100.0%) | 18.0 |
Fertility by Education by Marriage Status in Hatfield
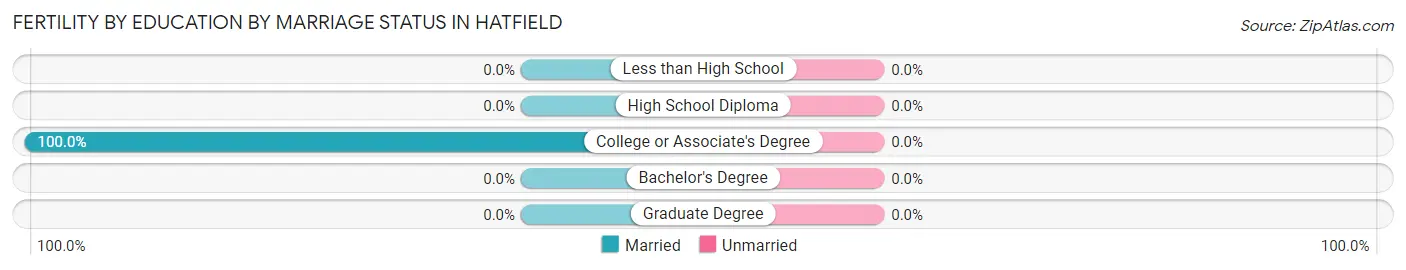
| Educational Attainment | Married | Unmarried |
| Less than High School | 0 (0.0%) | 0 (0.0%) |
| High School Diploma | 0 (0.0%) | 0 (0.0%) |
| College or Associate's Degree | 3 (100.0%) | 0 (0.0%) |
| Bachelor's Degree | 0 (0.0%) | 0 (0.0%) |
| Graduate Degree | 0 (0.0%) | 0 (0.0%) |
| Total | 3 (100.0%) | 0 (0.0%) |
Employment Characteristics in Hatfield
Employment by Class of Employer in Hatfield
Among the 251 employed individuals in Hatfield, private company employees (196 | 78.1%), self-employed (not incorporated) (16 | 6.4%), and not-for-profit organizations (15 | 6.0%) make up the most common classes of employment.
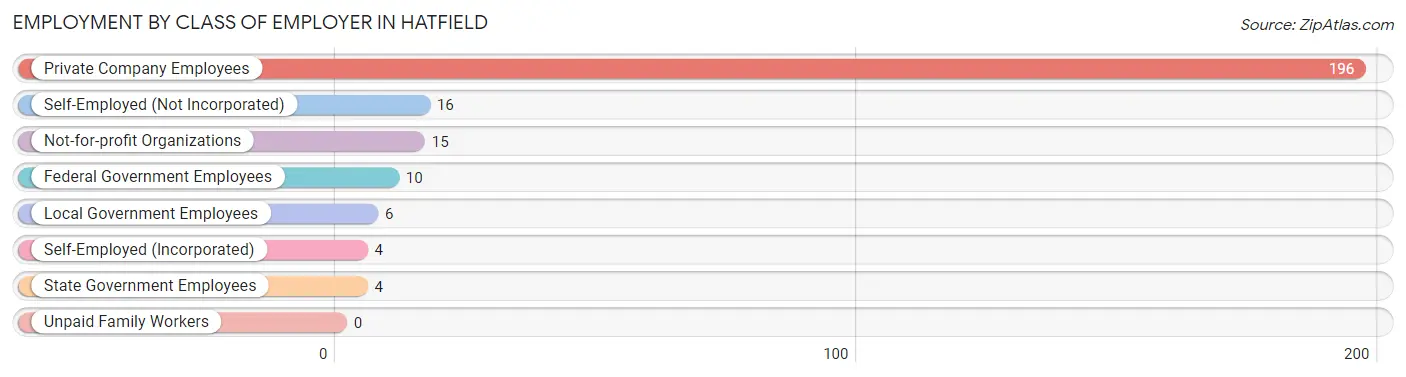
| Employer Class | # Employees | % Employees |
| Private Company Employees | 196 | 78.1% |
| Self-Employed (Incorporated) | 4 | 1.6% |
| Self-Employed (Not Incorporated) | 16 | 6.4% |
| Not-for-profit Organizations | 15 | 6.0% |
| Local Government Employees | 6 | 2.4% |
| State Government Employees | 4 | 1.6% |
| Federal Government Employees | 10 | 4.0% |
| Unpaid Family Workers | 0 | 0.0% |
| Total | 251 | 100.0% |
Employment Status by Age in Hatfield
According to the labor force statistics for Hatfield, out of the total population over 16 years of age (415), 62.4% or 259 individuals are in the labor force, with 3.1% or 8 of them unemployed. The age group with the highest labor force participation rate is 45 to 54 years, with 92.3% or 36 individuals in the labor force. Within the labor force, the 20 to 24 years age range has the highest percentage of unemployed individuals, with 26.7% or 4 of them being unemployed.
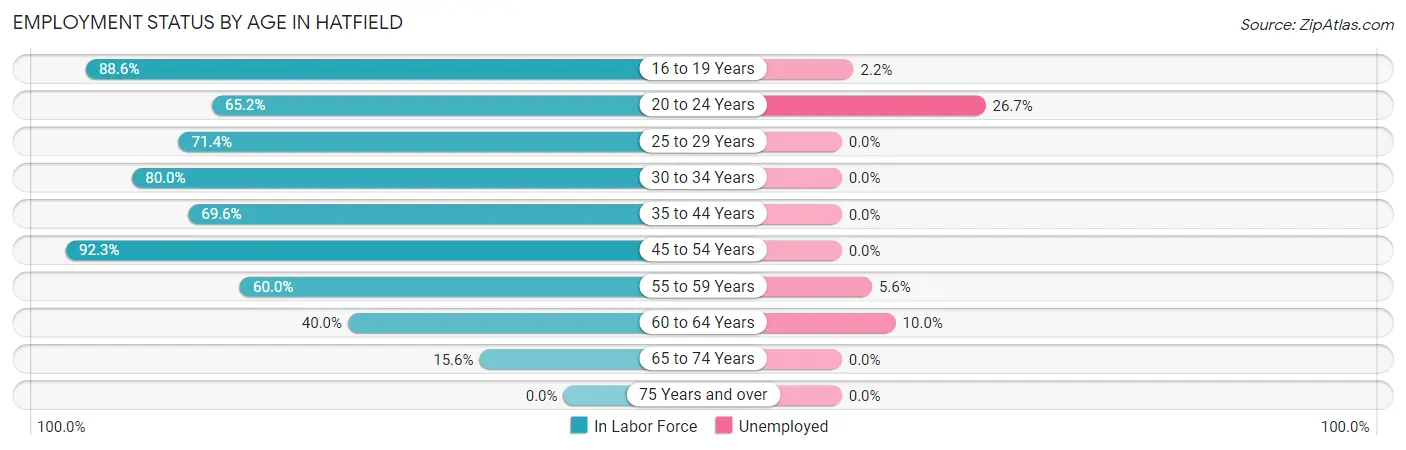
| Age Bracket | In Labor Force | Unemployed |
| 16 to 19 Years | 93 (88.6%) | 2 (2.2%) |
| 20 to 24 Years | 15 (65.2%) | 4 (26.7%) |
| 25 to 29 Years | 40 (71.4%) | 0 (0.0%) |
| 30 to 34 Years | 24 (80.0%) | 0 (0.0%) |
| 35 to 44 Years | 16 (69.6%) | 0 (0.0%) |
| 45 to 54 Years | 36 (92.3%) | 0 (0.0%) |
| 55 to 59 Years | 18 (60.0%) | 1 (5.6%) |
| 60 to 64 Years | 10 (40.0%) | 1 (10.0%) |
| 65 to 74 Years | 7 (15.6%) | 0 (0.0%) |
| 75 Years and over | 0 (0.0%) | 0 (0.0%) |
| Total | 259 (62.4%) | 8 (3.1%) |
Employment Status by Educational Attainment in Hatfield
According to labor force statistics for Hatfield, 70.9% of individuals (144) out of the total population between 25 and 64 years of age (203) are in the labor force, with 1.4% or 2 of them being unemployed. The group with the highest labor force participation rate are those with the educational attainment of bachelor's degree or higher, with 87.8% or 43 individuals in the labor force. Within the labor force, individuals with college / associate degree education have the highest percentage of unemployment, with 2.3% or 1 of them being unemployed.
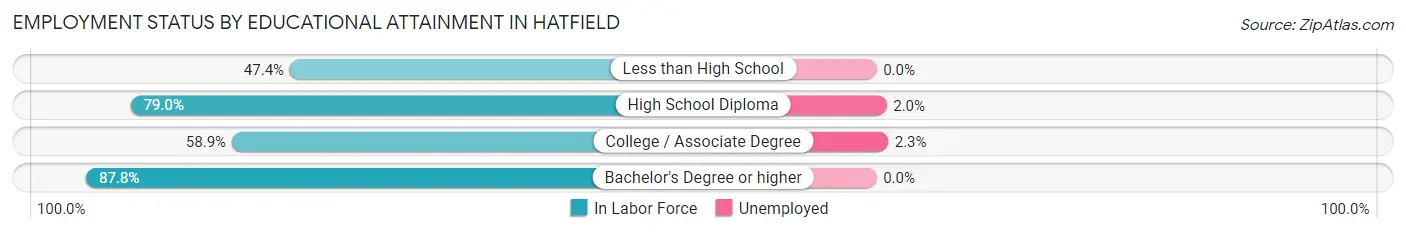
| Educational Attainment | In Labor Force | Unemployed |
| Less than High School | 9 (47.4%) | 0 (0.0%) |
| High School Diploma | 49 (79.0%) | 1 (2.0%) |
| College / Associate Degree | 43 (58.9%) | 2 (2.3%) |
| Bachelor's Degree or higher | 43 (87.8%) | 0 (0.0%) |
| Total | 144 (70.9%) | 3 (1.4%) |
Employment Occupations by Sex in Hatfield
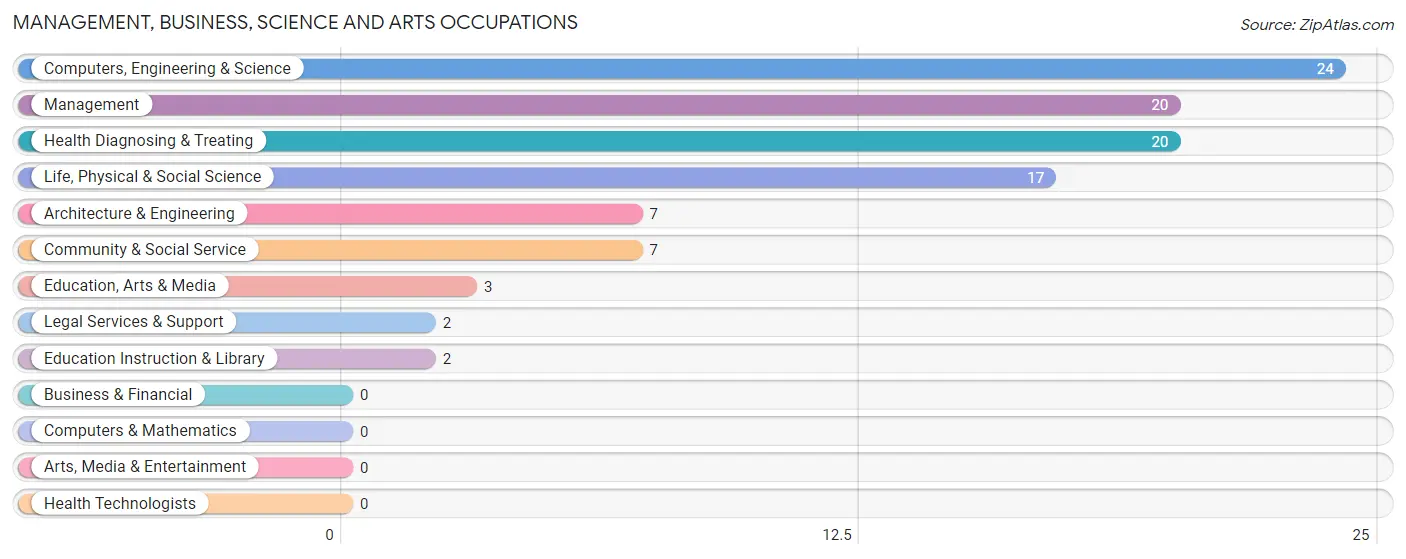
Management, Business, Science and Arts Occupations
The most common Management, Business, Science and Arts occupations in Hatfield are Computers, Engineering & Science (24 | 9.6%), Management (20 | 8.0%), Health Diagnosing & Treating (20 | 8.0%), Life, Physical & Social Science (17 | 6.8%), and Architecture & Engineering (7 | 2.8%).
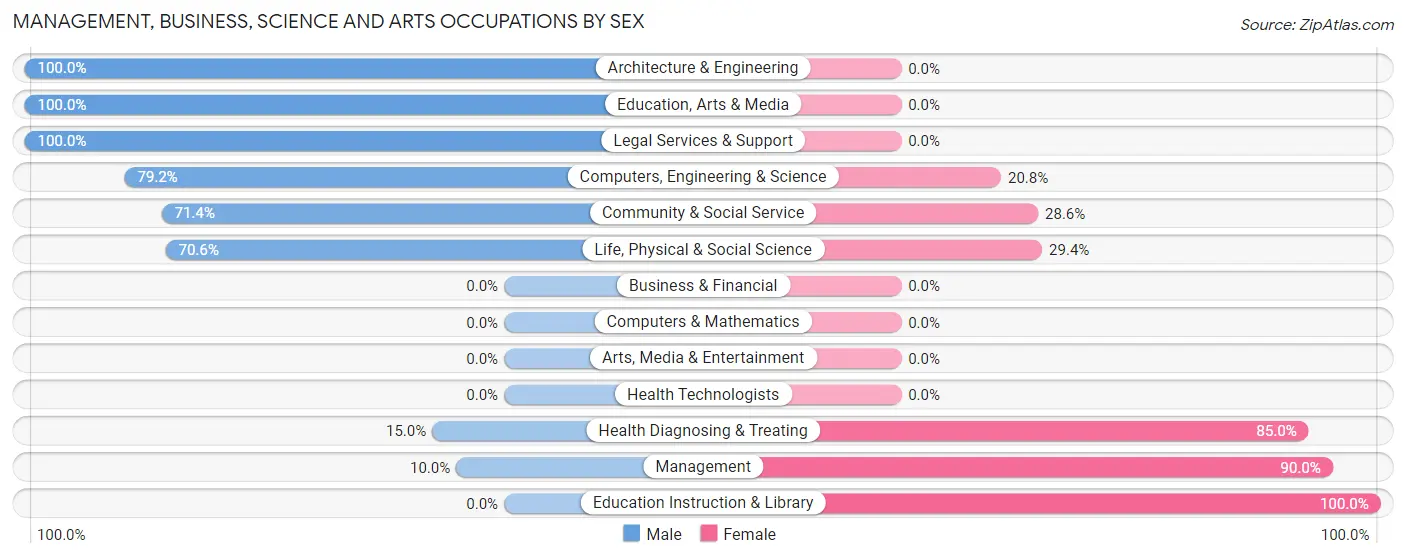
Management, Business, Science and Arts Occupations by Sex
Within the Management, Business, Science and Arts occupations in Hatfield, the most male-oriented occupations are Architecture & Engineering (100.0%), Education, Arts & Media (100.0%), and Legal Services & Support (100.0%), while the most female-oriented occupations are Education Instruction & Library (100.0%), Management (90.0%), and Health Diagnosing & Treating (85.0%).
| Occupation | Male | Female |
| Management | 2 (10.0%) | 18 (90.0%) |
| Business & Financial | 0 (0.0%) | 0 (0.0%) |
| Computers, Engineering & Science | 19 (79.2%) | 5 (20.8%) |
| Computers & Mathematics | 0 (0.0%) | 0 (0.0%) |
| Architecture & Engineering | 7 (100.0%) | 0 (0.0%) |
| Life, Physical & Social Science | 12 (70.6%) | 5 (29.4%) |
| Community & Social Service | 5 (71.4%) | 2 (28.6%) |
| Education, Arts & Media | 3 (100.0%) | 0 (0.0%) |
| Legal Services & Support | 2 (100.0%) | 0 (0.0%) |
| Education Instruction & Library | 0 (0.0%) | 2 (100.0%) |
| Arts, Media & Entertainment | 0 (0.0%) | 0 (0.0%) |
| Health Diagnosing & Treating | 3 (15.0%) | 17 (85.0%) |
| Health Technologists | 0 (0.0%) | 0 (0.0%) |
| Total (Category) | 29 (40.8%) | 42 (59.2%) |
| Total (Overall) | 81 (32.3%) | 170 (67.7%) |
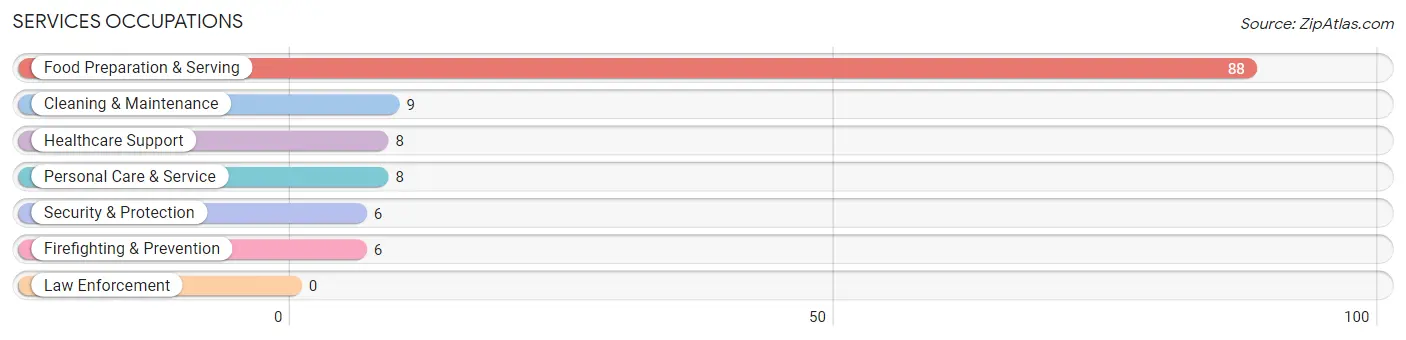
Services Occupations
The most common Services occupations in Hatfield are Food Preparation & Serving (88 | 35.1%), Cleaning & Maintenance (9 | 3.6%), Healthcare Support (8 | 3.2%), Personal Care & Service (8 | 3.2%), and Security & Protection (6 | 2.4%).
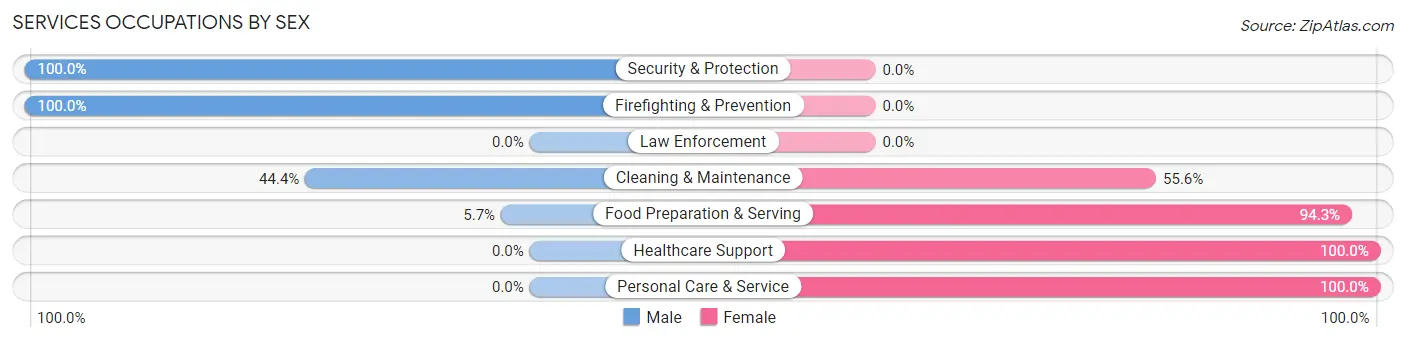
Services Occupations by Sex
Within the Services occupations in Hatfield, the most male-oriented occupations are Security & Protection (100.0%), Firefighting & Prevention (100.0%), and Cleaning & Maintenance (44.4%), while the most female-oriented occupations are Healthcare Support (100.0%), Personal Care & Service (100.0%), and Food Preparation & Serving (94.3%).
| Occupation | Male | Female |
| Healthcare Support | 0 (0.0%) | 8 (100.0%) |
| Security & Protection | 6 (100.0%) | 0 (0.0%) |
| Firefighting & Prevention | 6 (100.0%) | 0 (0.0%) |
| Law Enforcement | 0 (0.0%) | 0 (0.0%) |
| Food Preparation & Serving | 5 (5.7%) | 83 (94.3%) |
| Cleaning & Maintenance | 4 (44.4%) | 5 (55.6%) |
| Personal Care & Service | 0 (0.0%) | 8 (100.0%) |
| Total (Category) | 15 (12.6%) | 104 (87.4%) |
| Total (Overall) | 81 (32.3%) | 170 (67.7%) |
Sales and Office Occupations
The most common Sales and Office occupations in Hatfield are Sales & Related (11 | 4.4%), and Office & Administration (7 | 2.8%).
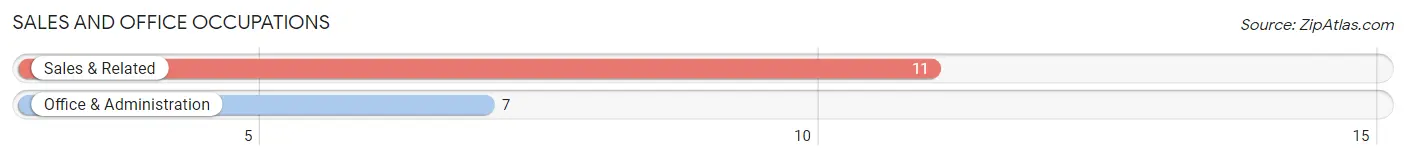
Sales and Office Occupations by Sex
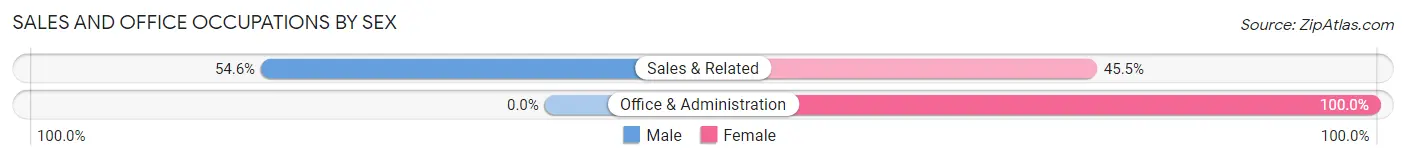
| Occupation | Male | Female |
| Sales & Related | 6 (54.5%) | 5 (45.5%) |
| Office & Administration | 0 (0.0%) | 7 (100.0%) |
| Total (Category) | 6 (33.3%) | 12 (66.7%) |
| Total (Overall) | 81 (32.3%) | 170 (67.7%) |
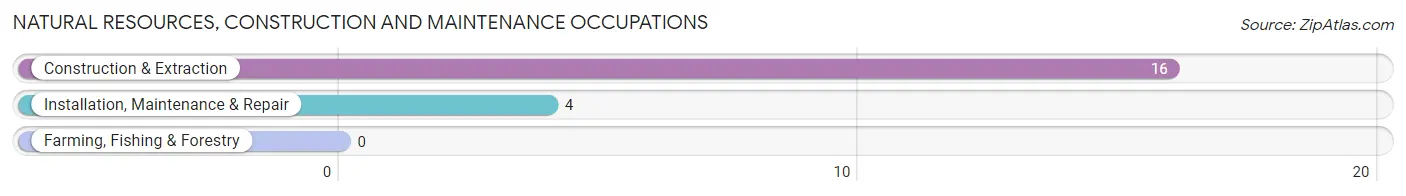
Natural Resources, Construction and Maintenance Occupations
The most common Natural Resources, Construction and Maintenance occupations in Hatfield are Construction & Extraction (16 | 6.4%), and Installation, Maintenance & Repair (4 | 1.6%).
Natural Resources, Construction and Maintenance Occupations by Sex
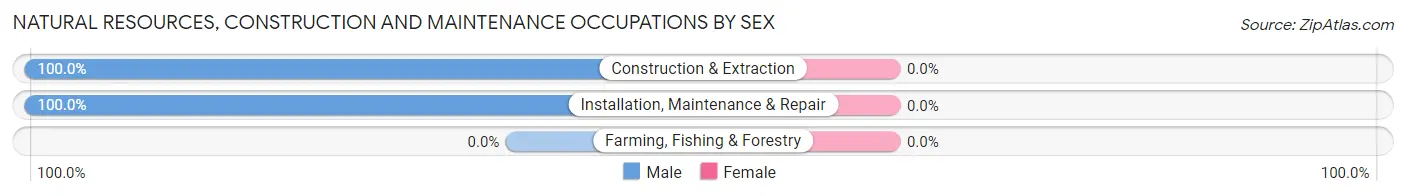
| Occupation | Male | Female |
| Farming, Fishing & Forestry | 0 (0.0%) | 0 (0.0%) |
| Construction & Extraction | 16 (100.0%) | 0 (0.0%) |
| Installation, Maintenance & Repair | 4 (100.0%) | 0 (0.0%) |
| Total (Category) | 20 (100.0%) | 0 (0.0%) |
| Total (Overall) | 81 (32.3%) | 170 (67.7%) |
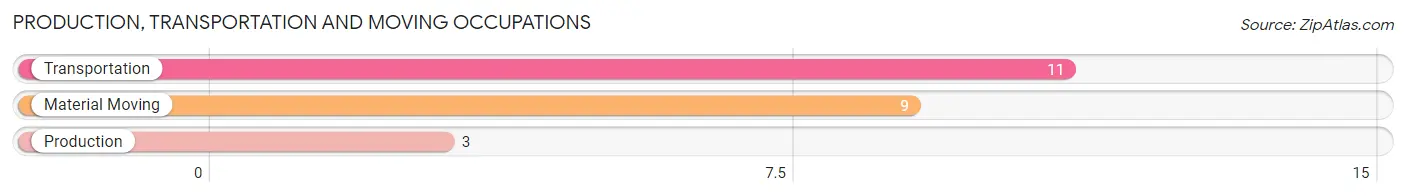
Production, Transportation and Moving Occupations
The most common Production, Transportation and Moving occupations in Hatfield are Transportation (11 | 4.4%), Material Moving (9 | 3.6%), and Production (3 | 1.2%).
Production, Transportation and Moving Occupations by Sex
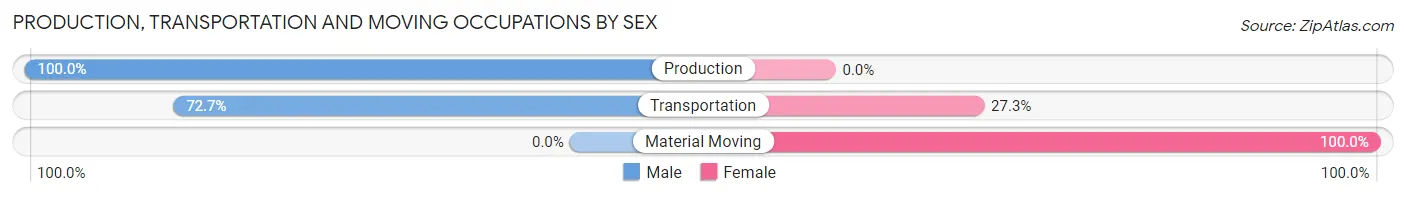
| Occupation | Male | Female |
| Production | 3 (100.0%) | 0 (0.0%) |
| Transportation | 8 (72.7%) | 3 (27.3%) |
| Material Moving | 0 (0.0%) | 9 (100.0%) |
| Total (Category) | 11 (47.8%) | 12 (52.2%) |
| Total (Overall) | 81 (32.3%) | 170 (67.7%) |
Employment Industries by Sex in Hatfield
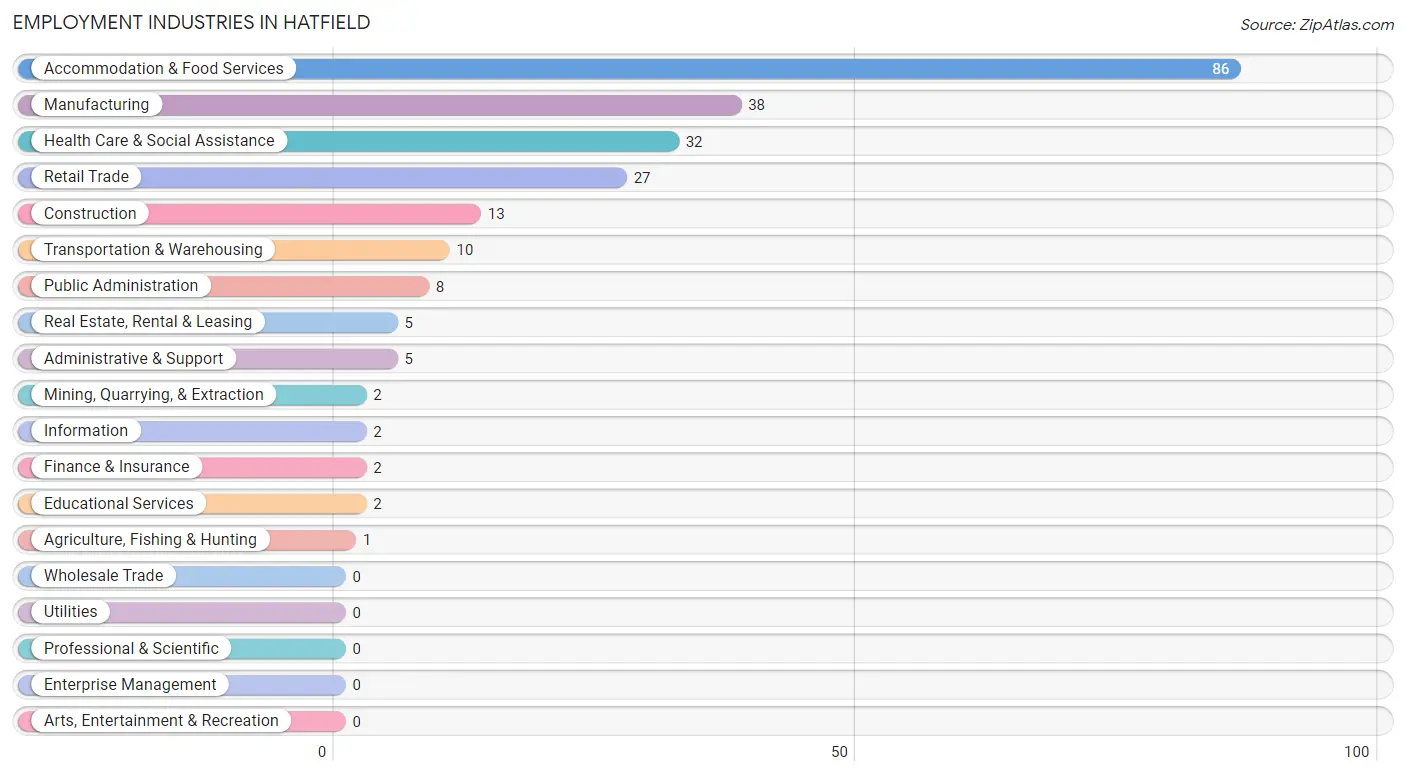
Employment Industries in Hatfield
The major employment industries in Hatfield include Accommodation & Food Services (86 | 34.3%), Manufacturing (38 | 15.1%), Health Care & Social Assistance (32 | 12.8%), Retail Trade (27 | 10.8%), and Construction (13 | 5.2%).
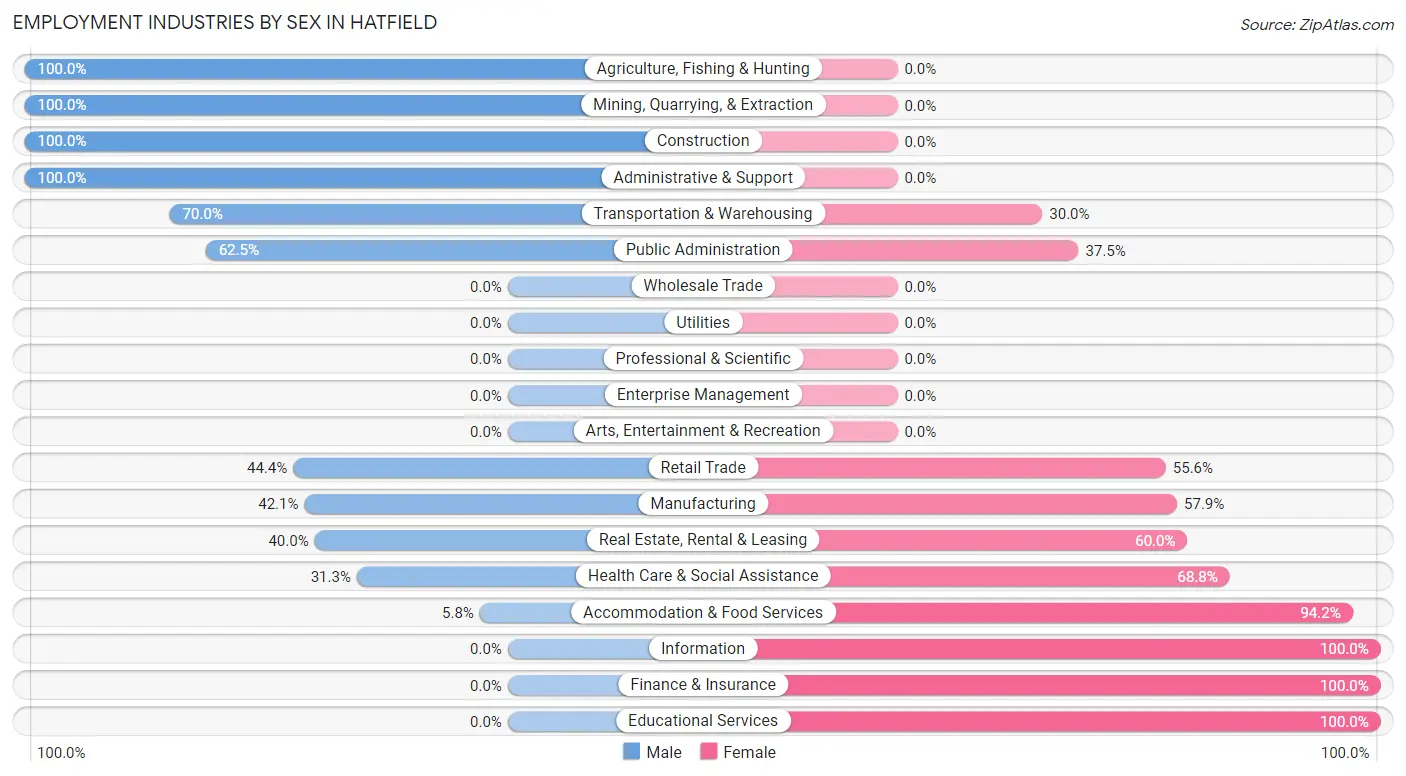
Employment Industries by Sex in Hatfield
The Hatfield industries that see more men than women are Agriculture, Fishing & Hunting (100.0%), Mining, Quarrying, & Extraction (100.0%), and Construction (100.0%), whereas the industries that tend to have a higher number of women are Information (100.0%), Finance & Insurance (100.0%), and Educational Services (100.0%).
| Industry | Male | Female |
| Agriculture, Fishing & Hunting | 1 (100.0%) | 0 (0.0%) |
| Mining, Quarrying, & Extraction | 2 (100.0%) | 0 (0.0%) |
| Construction | 13 (100.0%) | 0 (0.0%) |
| Manufacturing | 16 (42.1%) | 22 (57.9%) |
| Wholesale Trade | 0 (0.0%) | 0 (0.0%) |
| Retail Trade | 12 (44.4%) | 15 (55.6%) |
| Transportation & Warehousing | 7 (70.0%) | 3 (30.0%) |
| Utilities | 0 (0.0%) | 0 (0.0%) |
| Information | 0 (0.0%) | 2 (100.0%) |
| Finance & Insurance | 0 (0.0%) | 2 (100.0%) |
| Real Estate, Rental & Leasing | 2 (40.0%) | 3 (60.0%) |
| Professional & Scientific | 0 (0.0%) | 0 (0.0%) |
| Enterprise Management | 0 (0.0%) | 0 (0.0%) |
| Administrative & Support | 5 (100.0%) | 0 (0.0%) |
| Educational Services | 0 (0.0%) | 2 (100.0%) |
| Health Care & Social Assistance | 10 (31.2%) | 22 (68.8%) |
| Arts, Entertainment & Recreation | 0 (0.0%) | 0 (0.0%) |
| Accommodation & Food Services | 5 (5.8%) | 81 (94.2%) |
| Public Administration | 5 (62.5%) | 3 (37.5%) |
| Total | 81 (32.3%) | 170 (67.7%) |
Education in Hatfield
School Enrollment in Hatfield
The most common levels of schooling among the 58 students in Hatfield are elementary school (20 | 34.5%), high school (19 | 32.8%), and middle school (7 | 12.1%).
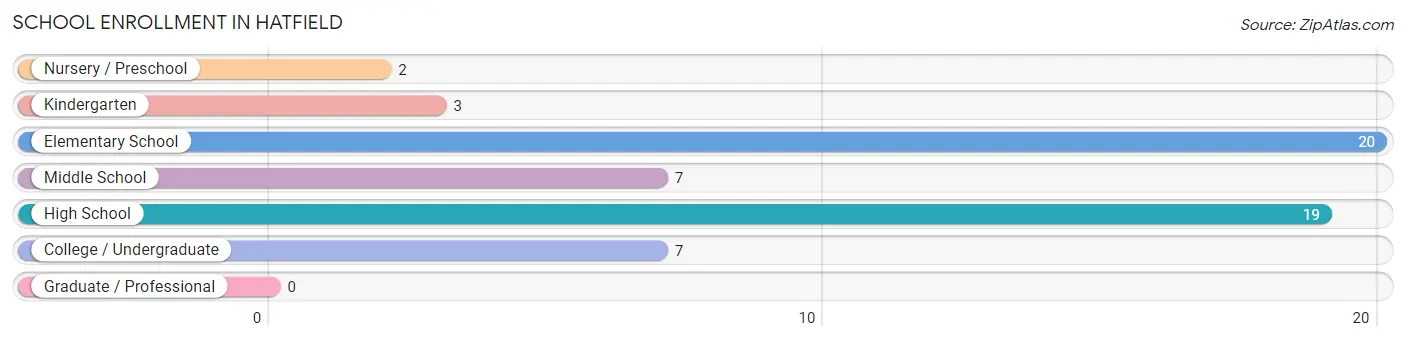
| School Level | # Students | % Students |
| Nursery / Preschool | 2 | 3.5% |
| Kindergarten | 3 | 5.2% |
| Elementary School | 20 | 34.5% |
| Middle School | 7 | 12.1% |
| High School | 19 | 32.8% |
| College / Undergraduate | 7 | 12.1% |
| Graduate / Professional | 0 | 0.0% |
| Total | 58 | 100.0% |
School Enrollment by Age by Funding Source in Hatfield
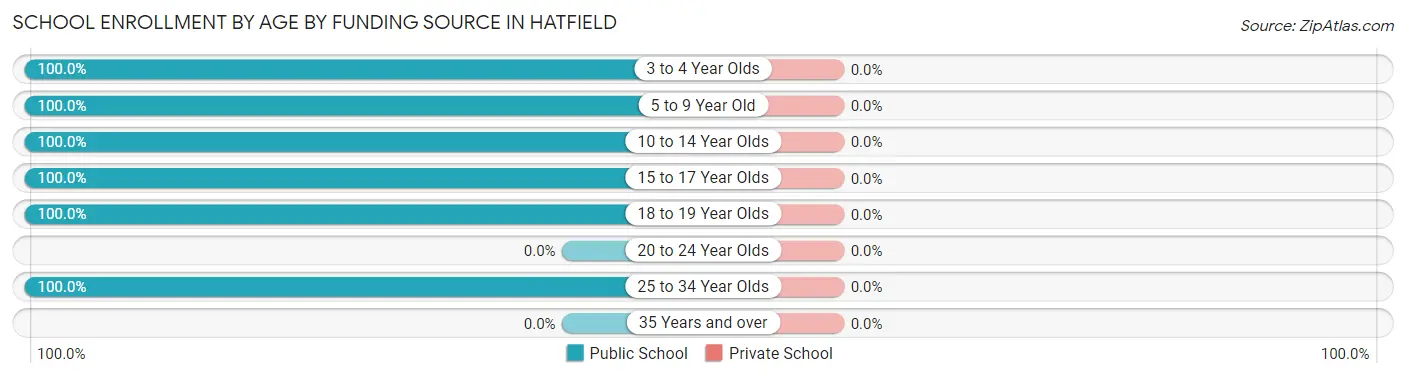
| Age Bracket | Public School | Private School |
| 3 to 4 Year Olds | 2 (100.0%) | 0 (0.0%) |
| 5 to 9 Year Old | 14 (100.0%) | 0 (0.0%) |
| 10 to 14 Year Olds | 16 (100.0%) | 0 (0.0%) |
| 15 to 17 Year Olds | 8 (100.0%) | 0 (0.0%) |
| 18 to 19 Year Olds | 14 (100.0%) | 0 (0.0%) |
| 20 to 24 Year Olds | 0 (0.0%) | 0 (0.0%) |
| 25 to 34 Year Olds | 4 (100.0%) | 0 (0.0%) |
| 35 Years and over | 0 (0.0%) | 0 (0.0%) |
| Total | 58 (100.0%) | 0 (0.0%) |
Educational Attainment by Field of Study in Hatfield
Business (13 | 21.3%), literature & languages (13 | 21.3%), physical & health sciences (12 | 19.7%), education (10 | 16.4%), and arts & humanities (7 | 11.5%) are the most common fields of study among 61 individuals in Hatfield who have obtained a bachelor's degree or higher.
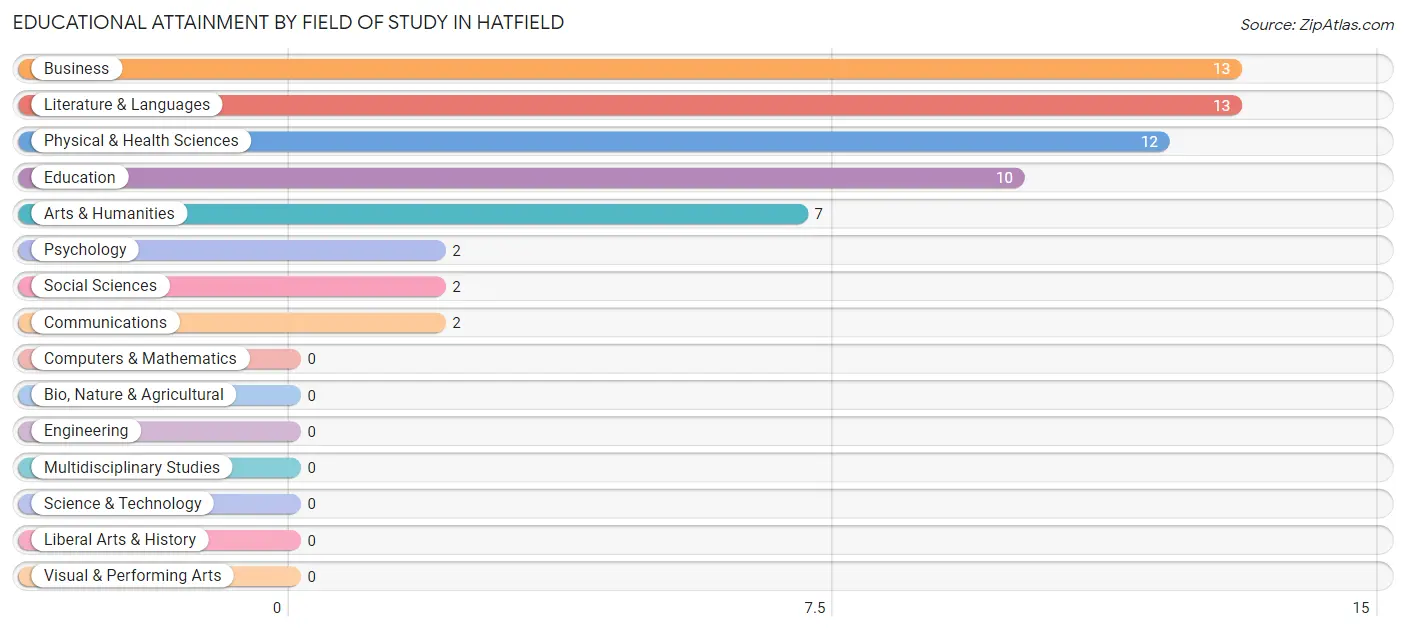
| Field of Study | # Graduates | % Graduates |
| Computers & Mathematics | 0 | 0.0% |
| Bio, Nature & Agricultural | 0 | 0.0% |
| Physical & Health Sciences | 12 | 19.7% |
| Psychology | 2 | 3.3% |
| Social Sciences | 2 | 3.3% |
| Engineering | 0 | 0.0% |
| Multidisciplinary Studies | 0 | 0.0% |
| Science & Technology | 0 | 0.0% |
| Business | 13 | 21.3% |
| Education | 10 | 16.4% |
| Literature & Languages | 13 | 21.3% |
| Liberal Arts & History | 0 | 0.0% |
| Visual & Performing Arts | 0 | 0.0% |
| Communications | 2 | 3.3% |
| Arts & Humanities | 7 | 11.5% |
| Total | 61 | 100.0% |
Transportation & Commute in Hatfield
Vehicle Availability by Sex in Hatfield
The most prevalent vehicle ownership categories in Hatfield are males with 2 vehicles (47, accounting for 58.0%) and females with 2 vehicles (126, making up 27.7%).
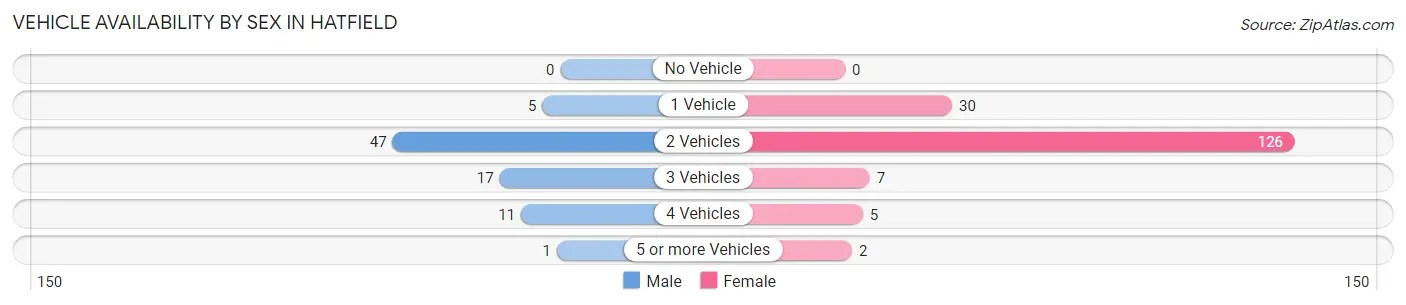
| Vehicles Available | Male | Female |
| No Vehicle | 0 (0.0%) | 0 (0.0%) |
| 1 Vehicle | 5 (6.2%) | 30 (17.6%) |
| 2 Vehicles | 47 (58.0%) | 126 (74.1%) |
| 3 Vehicles | 17 (21.0%) | 7 (4.1%) |
| 4 Vehicles | 11 (13.6%) | 5 (2.9%) |
| 5 or more Vehicles | 1 (1.2%) | 2 (1.2%) |
| Total | 81 (100.0%) | 170 (100.0%) |
Commute Time in Hatfield
The most frequently occuring commute durations in Hatfield are 25 to 29 minutes (78 commuters, 33.6%), 15 to 19 minutes (39 commuters, 16.8%), and 20 to 24 minutes (31 commuters, 13.4%).
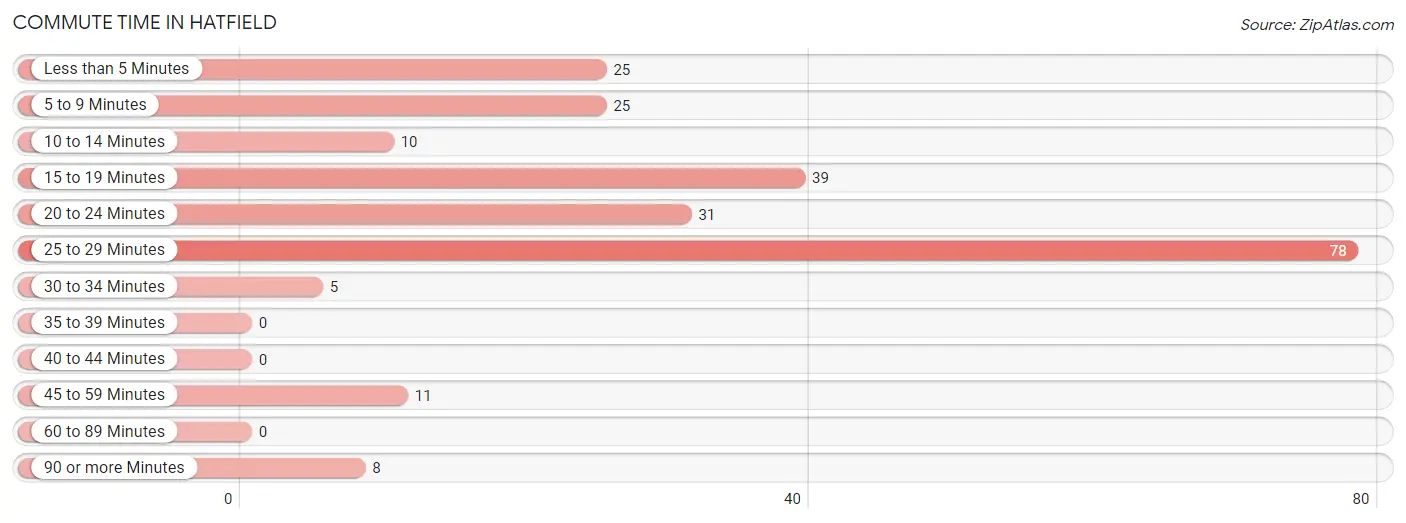
| Commute Time | # Commuters | % Commuters |
| Less than 5 Minutes | 25 | 10.8% |
| 5 to 9 Minutes | 25 | 10.8% |
| 10 to 14 Minutes | 10 | 4.3% |
| 15 to 19 Minutes | 39 | 16.8% |
| 20 to 24 Minutes | 31 | 13.4% |
| 25 to 29 Minutes | 78 | 33.6% |
| 30 to 34 Minutes | 5 | 2.2% |
| 35 to 39 Minutes | 0 | 0.0% |
| 40 to 44 Minutes | 0 | 0.0% |
| 45 to 59 Minutes | 11 | 4.7% |
| 60 to 89 Minutes | 0 | 0.0% |
| 90 or more Minutes | 8 | 3.5% |
Commute Time by Sex in Hatfield
The most common commute times in Hatfield are 15 to 19 minutes (25 commuters, 33.8%) for males and 25 to 29 minutes (78 commuters, 49.4%) for females.
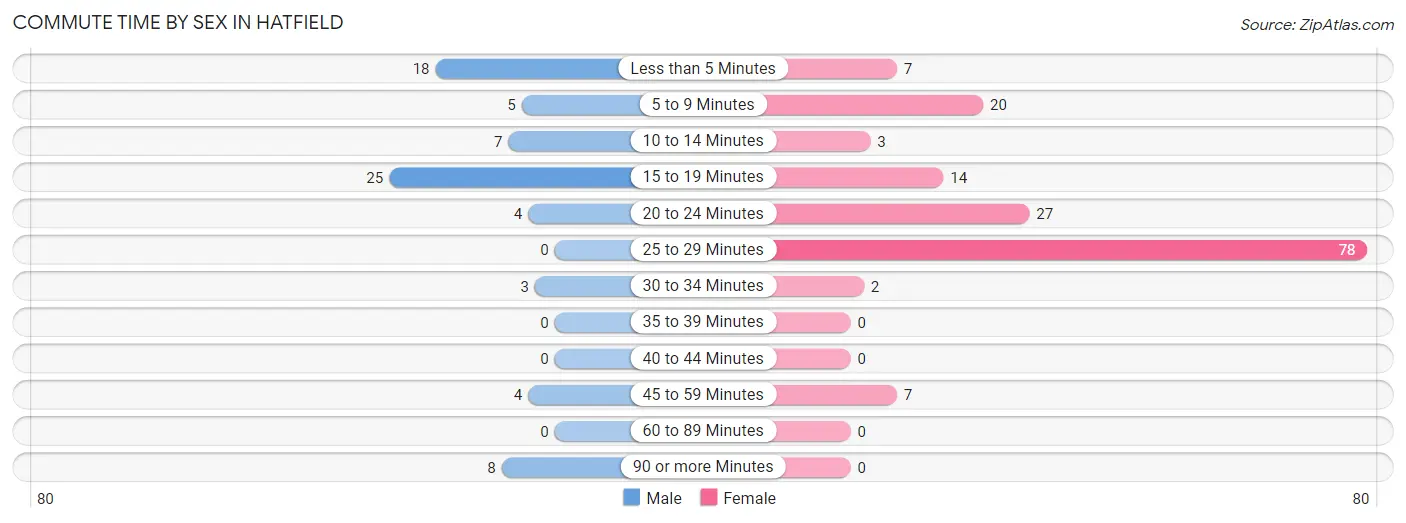
| Commute Time | Male | Female |
| Less than 5 Minutes | 18 (24.3%) | 7 (4.4%) |
| 5 to 9 Minutes | 5 (6.8%) | 20 (12.7%) |
| 10 to 14 Minutes | 7 (9.5%) | 3 (1.9%) |
| 15 to 19 Minutes | 25 (33.8%) | 14 (8.9%) |
| 20 to 24 Minutes | 4 (5.4%) | 27 (17.1%) |
| 25 to 29 Minutes | 0 (0.0%) | 78 (49.4%) |
| 30 to 34 Minutes | 3 (4.1%) | 2 (1.3%) |
| 35 to 39 Minutes | 0 (0.0%) | 0 (0.0%) |
| 40 to 44 Minutes | 0 (0.0%) | 0 (0.0%) |
| 45 to 59 Minutes | 4 (5.4%) | 7 (4.4%) |
| 60 to 89 Minutes | 0 (0.0%) | 0 (0.0%) |
| 90 or more Minutes | 8 (10.8%) | 0 (0.0%) |
Time of Departure to Work by Sex in Hatfield
The most frequent times of departure to work in Hatfield are 7:30 AM to 7:59 AM (24, 32.4%) for males and 7:30 AM to 7:59 AM (93, 58.9%) for females.
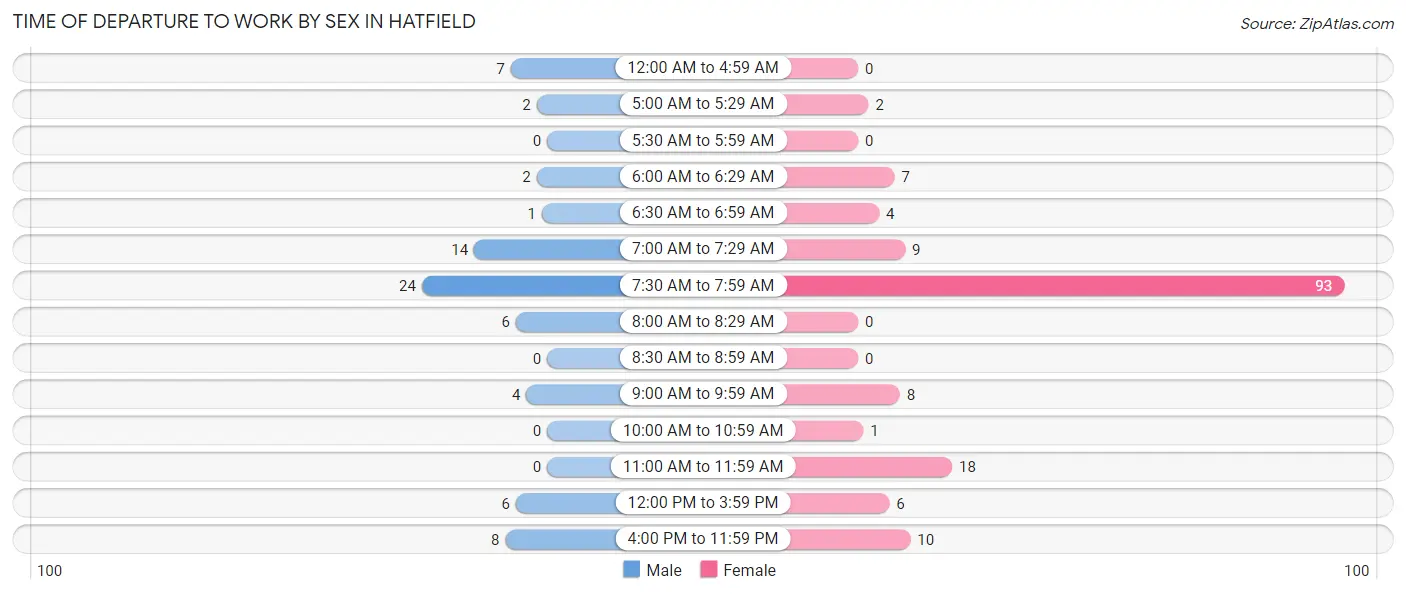
| Time of Departure | Male | Female |
| 12:00 AM to 4:59 AM | 7 (9.5%) | 0 (0.0%) |
| 5:00 AM to 5:29 AM | 2 (2.7%) | 2 (1.3%) |
| 5:30 AM to 5:59 AM | 0 (0.0%) | 0 (0.0%) |
| 6:00 AM to 6:29 AM | 2 (2.7%) | 7 (4.4%) |
| 6:30 AM to 6:59 AM | 1 (1.3%) | 4 (2.5%) |
| 7:00 AM to 7:29 AM | 14 (18.9%) | 9 (5.7%) |
| 7:30 AM to 7:59 AM | 24 (32.4%) | 93 (58.9%) |
| 8:00 AM to 8:29 AM | 6 (8.1%) | 0 (0.0%) |
| 8:30 AM to 8:59 AM | 0 (0.0%) | 0 (0.0%) |
| 9:00 AM to 9:59 AM | 4 (5.4%) | 8 (5.1%) |
| 10:00 AM to 10:59 AM | 0 (0.0%) | 1 (0.6%) |
| 11:00 AM to 11:59 AM | 0 (0.0%) | 18 (11.4%) |
| 12:00 PM to 3:59 PM | 6 (8.1%) | 6 (3.8%) |
| 4:00 PM to 11:59 PM | 8 (10.8%) | 10 (6.3%) |
| Total | 74 (100.0%) | 158 (100.0%) |
Housing Occupancy in Hatfield
Occupancy by Ownership in Hatfield
Of the total 224 dwellings in Hatfield, owner-occupied units account for 98 (43.8%), while renter-occupied units make up 126 (56.2%).
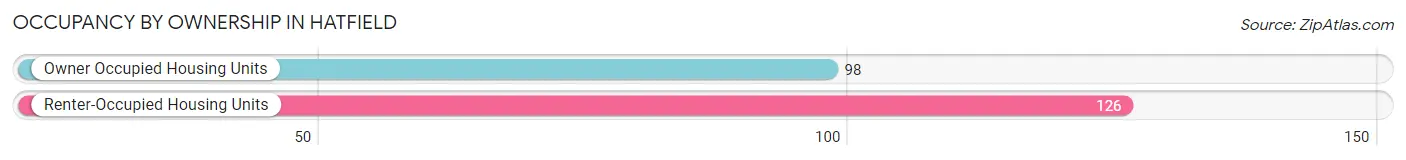
| Occupancy | # Housing Units | % Housing Units |
| Owner Occupied Housing Units | 98 | 43.8% |
| Renter-Occupied Housing Units | 126 | 56.2% |
| Total Occupied Housing Units | 224 | 100.0% |
Occupancy by Household Size in Hatfield
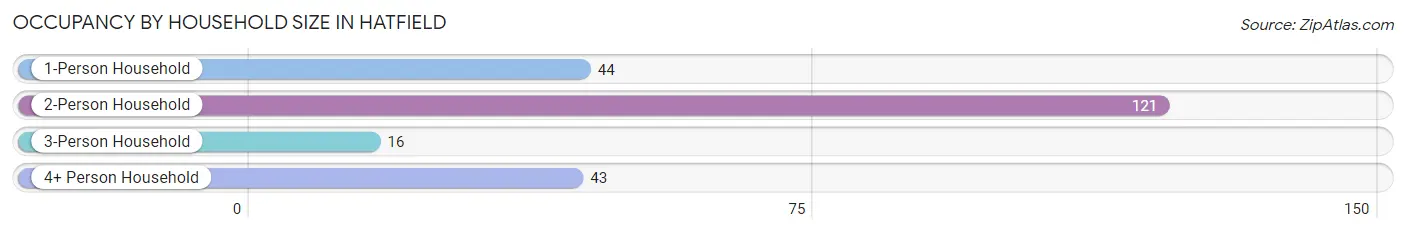
| Household Size | # Housing Units | % Housing Units |
| 1-Person Household | 44 | 19.6% |
| 2-Person Household | 121 | 54.0% |
| 3-Person Household | 16 | 7.1% |
| 4+ Person Household | 43 | 19.2% |
| Total Housing Units | 224 | 100.0% |
Occupancy by Ownership by Household Size in Hatfield
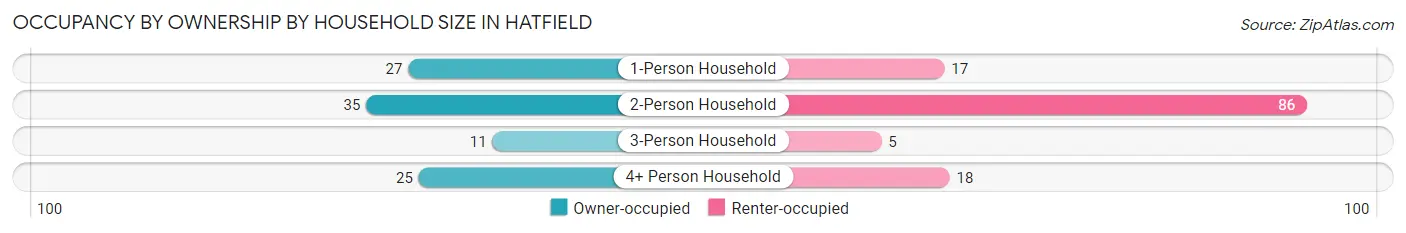
| Household Size | Owner-occupied | Renter-occupied |
| 1-Person Household | 27 (61.4%) | 17 (38.6%) |
| 2-Person Household | 35 (28.9%) | 86 (71.1%) |
| 3-Person Household | 11 (68.8%) | 5 (31.2%) |
| 4+ Person Household | 25 (58.1%) | 18 (41.9%) |
| Total Housing Units | 98 (43.8%) | 126 (56.2%) |
Occupancy by Educational Attainment in Hatfield
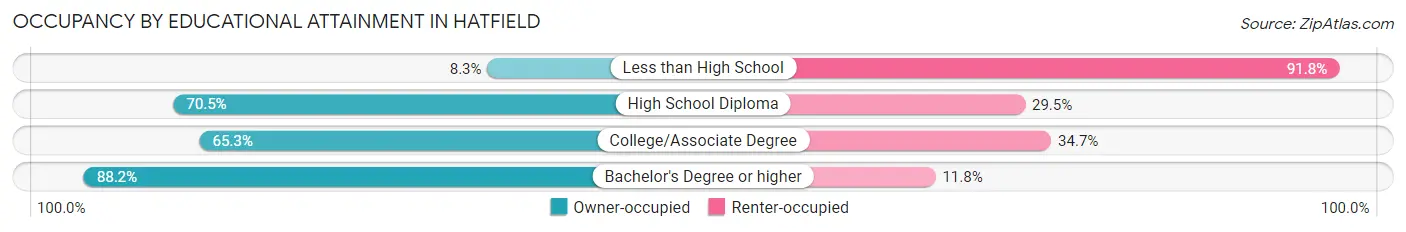
| Household Size | Owner-occupied | Renter-occupied |
| Less than High School | 8 (8.3%) | 89 (91.7%) |
| High School Diploma | 43 (70.5%) | 18 (29.5%) |
| College/Associate Degree | 32 (65.3%) | 17 (34.7%) |
| Bachelor's Degree or higher | 15 (88.2%) | 2 (11.8%) |
Occupancy by Age of Householder in Hatfield
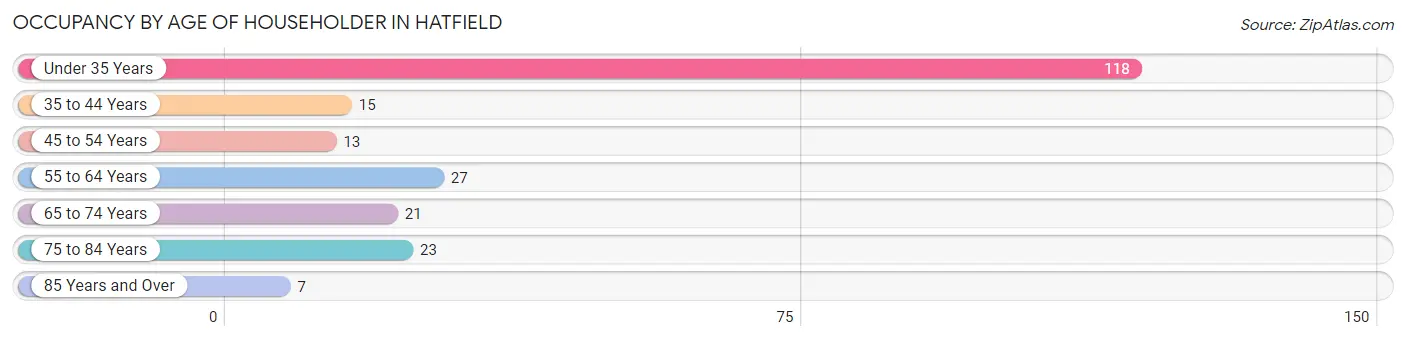
| Age Bracket | # Households | % Households |
| Under 35 Years | 118 | 52.7% |
| 35 to 44 Years | 15 | 6.7% |
| 45 to 54 Years | 13 | 5.8% |
| 55 to 64 Years | 27 | 12.0% |
| 65 to 74 Years | 21 | 9.4% |
| 75 to 84 Years | 23 | 10.3% |
| 85 Years and Over | 7 | 3.1% |
| Total | 224 | 100.0% |
Housing Finances in Hatfield
Median Income by Occupancy in Hatfield
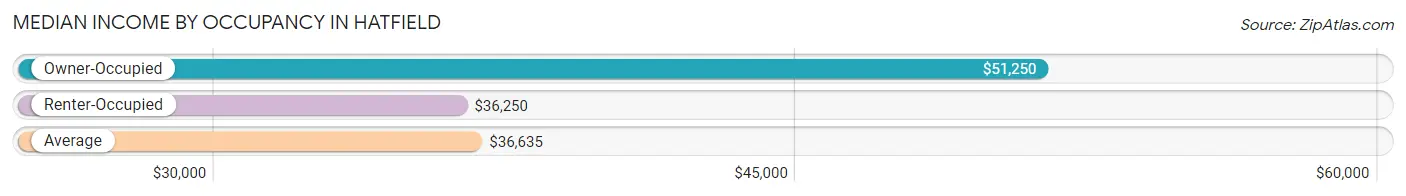
| Occupancy Type | # Households | Median Income |
| Owner-Occupied | 98 (43.8%) | $51,250 |
| Renter-Occupied | 126 (56.2%) | $36,250 |
| Average | 224 (100.0%) | $36,635 |
Occupancy by Householder Income Bracket in Hatfield
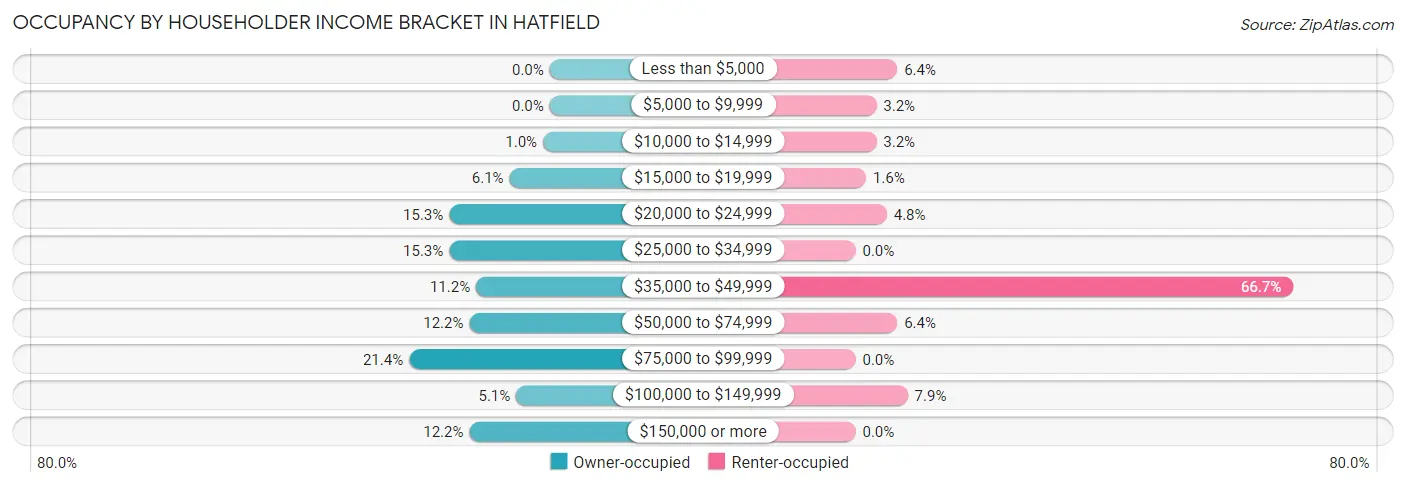
| Income Bracket | Owner-occupied | Renter-occupied |
| Less than $5,000 | 0 (0.0%) | 8 (6.4%) |
| $5,000 to $9,999 | 0 (0.0%) | 4 (3.2%) |
| $10,000 to $14,999 | 1 (1.0%) | 4 (3.2%) |
| $15,000 to $19,999 | 6 (6.1%) | 2 (1.6%) |
| $20,000 to $24,999 | 15 (15.3%) | 6 (4.8%) |
| $25,000 to $34,999 | 15 (15.3%) | 0 (0.0%) |
| $35,000 to $49,999 | 11 (11.2%) | 84 (66.7%) |
| $50,000 to $74,999 | 12 (12.2%) | 8 (6.4%) |
| $75,000 to $99,999 | 21 (21.4%) | 0 (0.0%) |
| $100,000 to $149,999 | 5 (5.1%) | 10 (7.9%) |
| $150,000 or more | 12 (12.2%) | 0 (0.0%) |
| Total | 98 (100.0%) | 126 (100.0%) |
Monthly Housing Cost Tiers in Hatfield
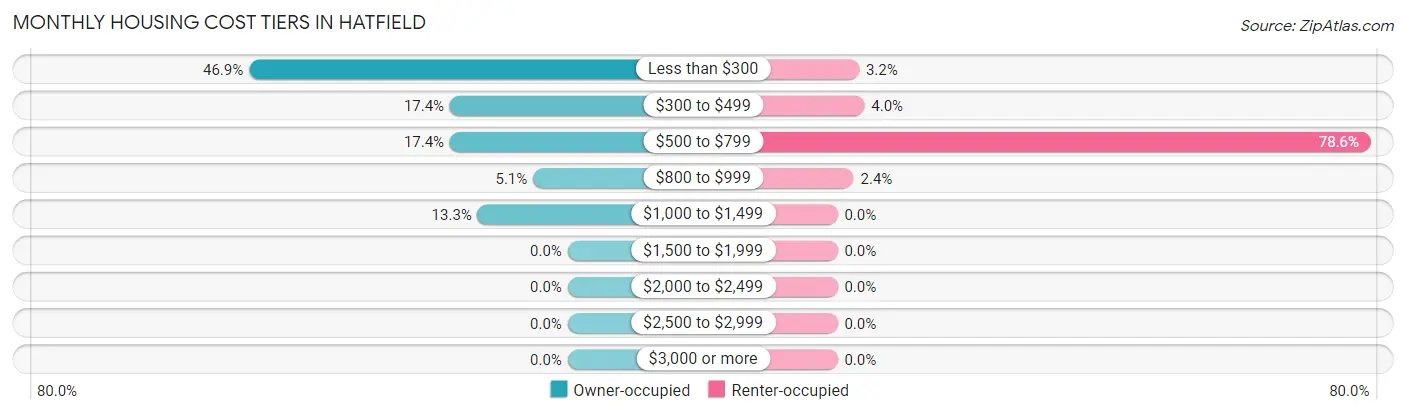
| Monthly Cost | Owner-occupied | Renter-occupied |
| Less than $300 | 46 (46.9%) | 4 (3.2%) |
| $300 to $499 | 17 (17.3%) | 5 (4.0%) |
| $500 to $799 | 17 (17.3%) | 99 (78.6%) |
| $800 to $999 | 5 (5.1%) | 3 (2.4%) |
| $1,000 to $1,499 | 13 (13.3%) | 0 (0.0%) |
| $1,500 to $1,999 | 0 (0.0%) | 0 (0.0%) |
| $2,000 to $2,499 | 0 (0.0%) | 0 (0.0%) |
| $2,500 to $2,999 | 0 (0.0%) | 0 (0.0%) |
| $3,000 or more | 0 (0.0%) | 0 (0.0%) |
| Total | 98 (100.0%) | 126 (100.0%) |
Physical Housing Characteristics in Hatfield
Housing Structures in Hatfield
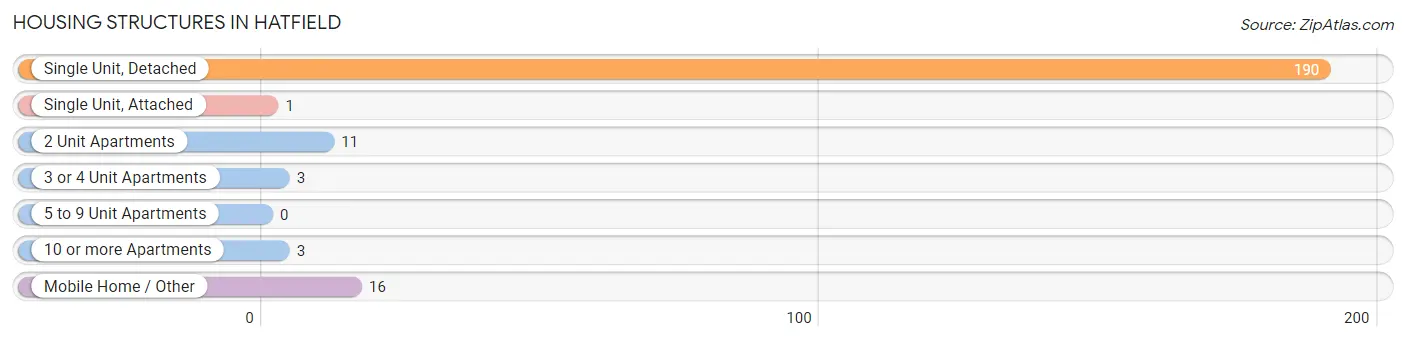
| Structure Type | # Housing Units | % Housing Units |
| Single Unit, Detached | 190 | 84.8% |
| Single Unit, Attached | 1 | 0.4% |
| 2 Unit Apartments | 11 | 4.9% |
| 3 or 4 Unit Apartments | 3 | 1.3% |
| 5 to 9 Unit Apartments | 0 | 0.0% |
| 10 or more Apartments | 3 | 1.3% |
| Mobile Home / Other | 16 | 7.1% |
| Total | 224 | 100.0% |
Housing Structures by Occupancy in Hatfield
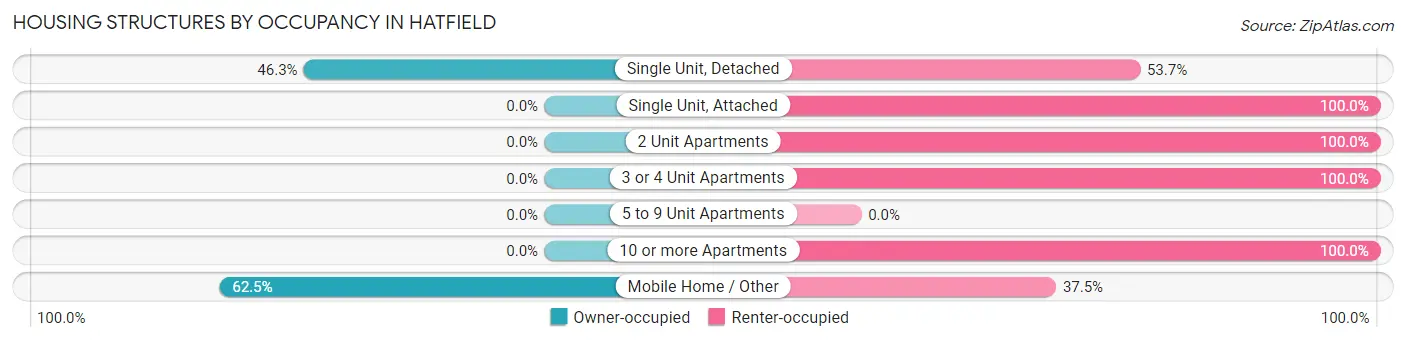
| Structure Type | Owner-occupied | Renter-occupied |
| Single Unit, Detached | 88 (46.3%) | 102 (53.7%) |
| Single Unit, Attached | 0 (0.0%) | 1 (100.0%) |
| 2 Unit Apartments | 0 (0.0%) | 11 (100.0%) |
| 3 or 4 Unit Apartments | 0 (0.0%) | 3 (100.0%) |
| 5 to 9 Unit Apartments | 0 (0.0%) | 0 (0.0%) |
| 10 or more Apartments | 0 (0.0%) | 3 (100.0%) |
| Mobile Home / Other | 10 (62.5%) | 6 (37.5%) |
| Total | 98 (43.8%) | 126 (56.2%) |
Housing Structures by Number of Rooms in Hatfield
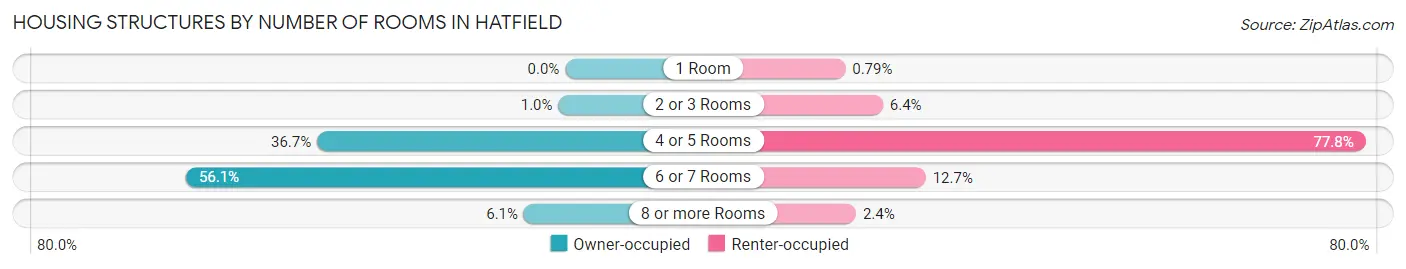
| Number of Rooms | Owner-occupied | Renter-occupied |
| 1 Room | 0 (0.0%) | 1 (0.8%) |
| 2 or 3 Rooms | 1 (1.0%) | 8 (6.4%) |
| 4 or 5 Rooms | 36 (36.7%) | 98 (77.8%) |
| 6 or 7 Rooms | 55 (56.1%) | 16 (12.7%) |
| 8 or more Rooms | 6 (6.1%) | 3 (2.4%) |
| Total | 98 (100.0%) | 126 (100.0%) |
Housing Structure by Heating Type in Hatfield
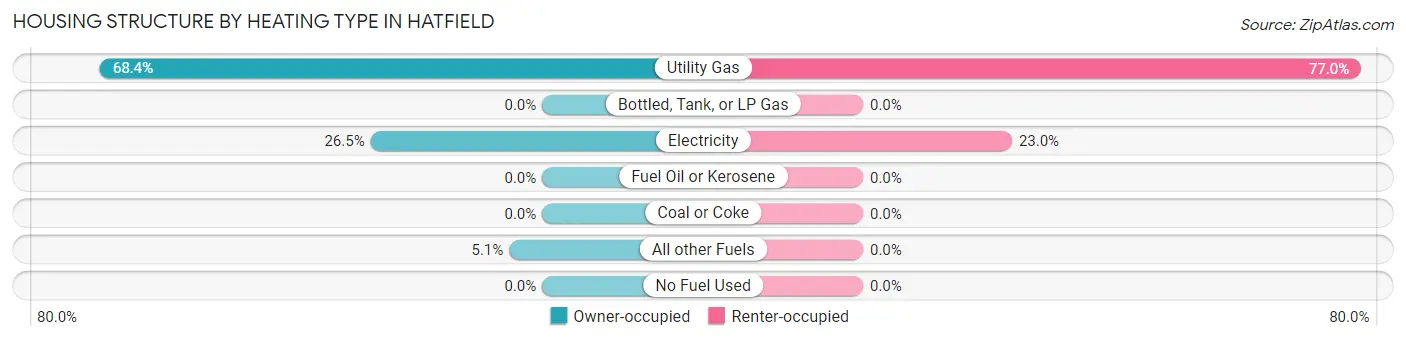
| Heating Type | Owner-occupied | Renter-occupied |
| Utility Gas | 67 (68.4%) | 97 (77.0%) |
| Bottled, Tank, or LP Gas | 0 (0.0%) | 0 (0.0%) |
| Electricity | 26 (26.5%) | 29 (23.0%) |
| Fuel Oil or Kerosene | 0 (0.0%) | 0 (0.0%) |
| Coal or Coke | 0 (0.0%) | 0 (0.0%) |
| All other Fuels | 5 (5.1%) | 0 (0.0%) |
| No Fuel Used | 0 (0.0%) | 0 (0.0%) |
| Total | 98 (100.0%) | 126 (100.0%) |
Household Vehicle Usage in Hatfield
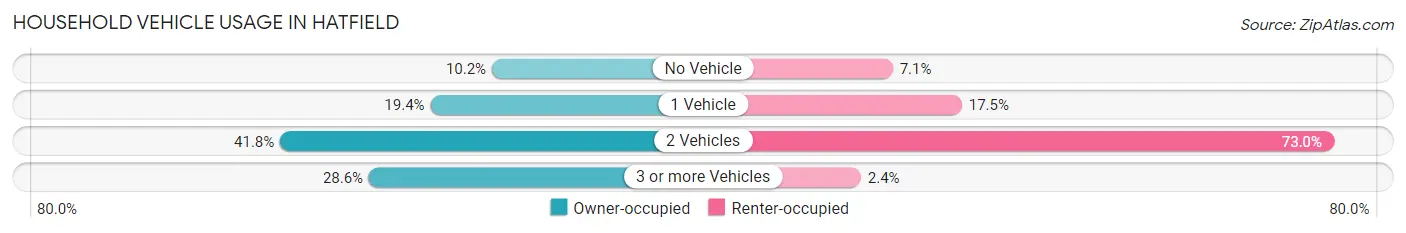
| Vehicles per Household | Owner-occupied | Renter-occupied |
| No Vehicle | 10 (10.2%) | 9 (7.1%) |
| 1 Vehicle | 19 (19.4%) | 22 (17.5%) |
| 2 Vehicles | 41 (41.8%) | 92 (73.0%) |
| 3 or more Vehicles | 28 (28.6%) | 3 (2.4%) |
| Total | 98 (100.0%) | 126 (100.0%) |
Real Estate & Mortgages in Hatfield
Real Estate and Mortgage Overview in Hatfield
| Characteristic | Without Mortgage | With Mortgage |
| Housing Units | 68 | 30 |
| Median Property Value | $112,500 | $76,000 |
| Median Household Income | $41,250 | $10 |
| Monthly Housing Costs | $248 | $0 |
| Real Estate Taxes | $400 | $9 |
Property Value by Mortgage Status in Hatfield
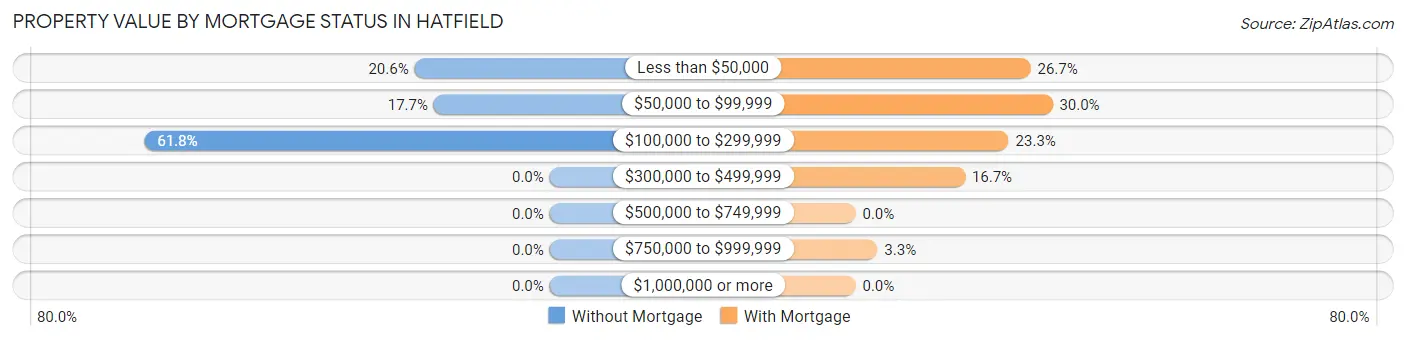
| Property Value | Without Mortgage | With Mortgage |
| Less than $50,000 | 14 (20.6%) | 8 (26.7%) |
| $50,000 to $99,999 | 12 (17.6%) | 9 (30.0%) |
| $100,000 to $299,999 | 42 (61.8%) | 7 (23.3%) |
| $300,000 to $499,999 | 0 (0.0%) | 5 (16.7%) |
| $500,000 to $749,999 | 0 (0.0%) | 0 (0.0%) |
| $750,000 to $999,999 | 0 (0.0%) | 1 (3.3%) |
| $1,000,000 or more | 0 (0.0%) | 0 (0.0%) |
| Total | 68 (100.0%) | 30 (100.0%) |
Household Income by Mortgage Status in Hatfield
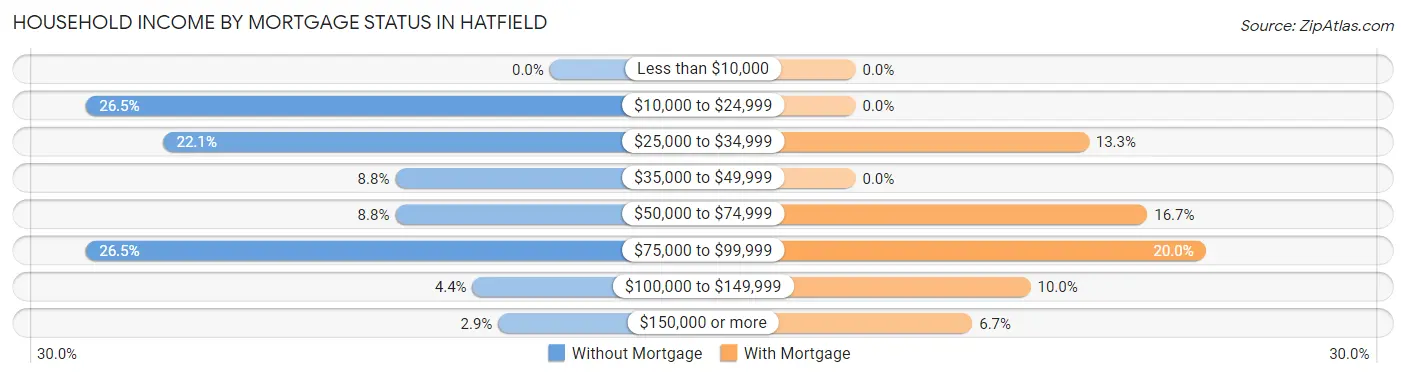
| Household Income | Without Mortgage | With Mortgage |
| Less than $10,000 | 0 (0.0%) | 0 (0.0%) |
| $10,000 to $24,999 | 18 (26.5%) | 0 (0.0%) |
| $25,000 to $34,999 | 15 (22.1%) | 4 (13.3%) |
| $35,000 to $49,999 | 6 (8.8%) | 0 (0.0%) |
| $50,000 to $74,999 | 6 (8.8%) | 5 (16.7%) |
| $75,000 to $99,999 | 18 (26.5%) | 6 (20.0%) |
| $100,000 to $149,999 | 3 (4.4%) | 3 (10.0%) |
| $150,000 or more | 2 (2.9%) | 2 (6.7%) |
| Total | 68 (100.0%) | 30 (100.0%) |
Property Value to Household Income Ratio in Hatfield
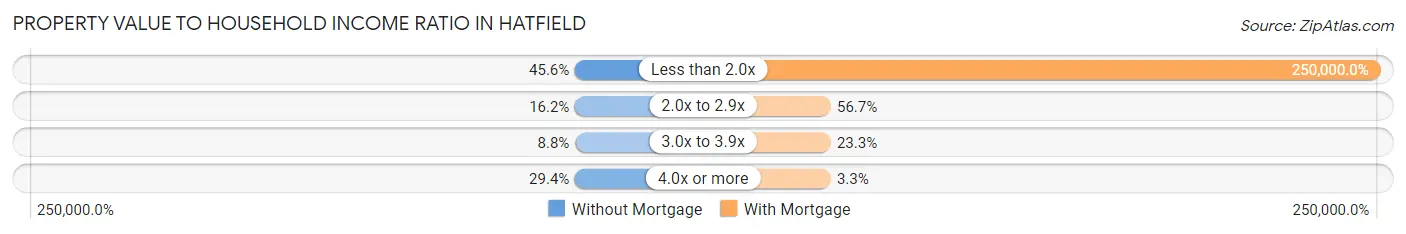
| Value-to-Income Ratio | Without Mortgage | With Mortgage |
| Less than 2.0x | 31 (45.6%) | 75,000 (250,000.0%) |
| 2.0x to 2.9x | 11 (16.2%) | 17 (56.7%) |
| 3.0x to 3.9x | 6 (8.8%) | 7 (23.3%) |
| 4.0x or more | 20 (29.4%) | 1 (3.3%) |
| Total | 68 (100.0%) | 30 (100.0%) |
Real Estate Taxes by Mortgage Status in Hatfield
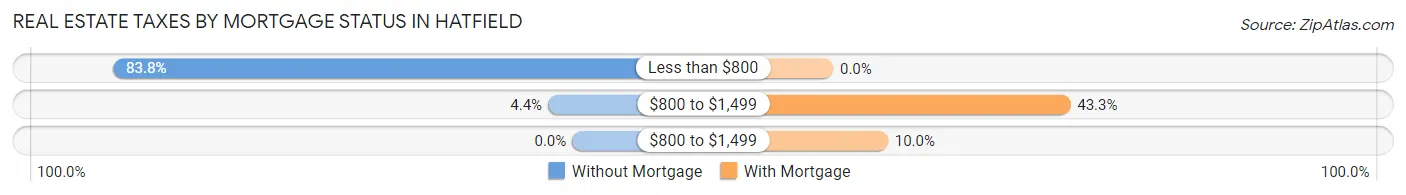
| Property Taxes | Without Mortgage | With Mortgage |
| Less than $800 | 57 (83.8%) | 0 (0.0%) |
| $800 to $1,499 | 3 (4.4%) | 13 (43.3%) |
| $800 to $1,499 | 0 (0.0%) | 3 (10.0%) |
| Total | 68 (100.0%) | 30 (100.0%) |
Health & Disability in Hatfield
Health Insurance Coverage by Age in Hatfield
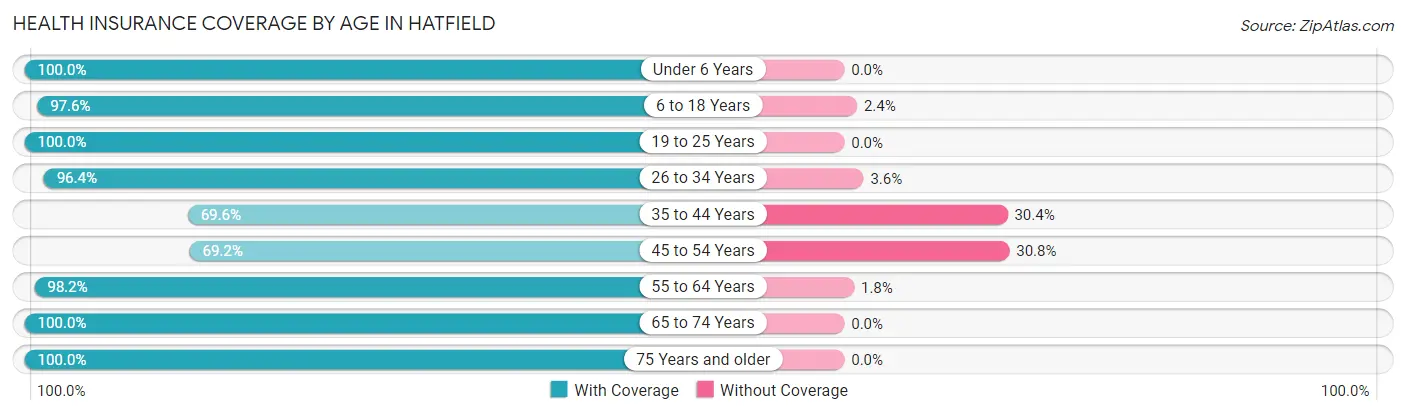
| Age Bracket | With Coverage | Without Coverage |
| Under 6 Years | 52 (100.0%) | 0 (0.0%) |
| 6 to 18 Years | 124 (97.6%) | 3 (2.4%) |
| 19 to 25 Years | 35 (100.0%) | 0 (0.0%) |
| 26 to 34 Years | 81 (96.4%) | 3 (3.6%) |
| 35 to 44 Years | 16 (69.6%) | 7 (30.4%) |
| 45 to 54 Years | 27 (69.2%) | 12 (30.8%) |
| 55 to 64 Years | 54 (98.2%) | 1 (1.8%) |
| 65 to 74 Years | 45 (100.0%) | 0 (0.0%) |
| 75 Years and older | 39 (100.0%) | 0 (0.0%) |
| Total | 473 (94.8%) | 26 (5.2%) |
Health Insurance Coverage by Citizenship Status in Hatfield
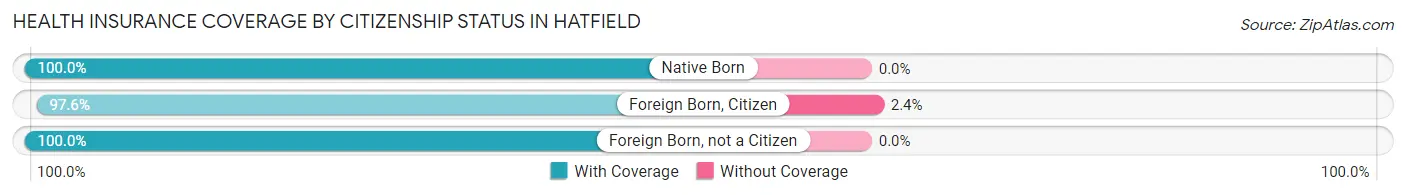
| Citizenship Status | With Coverage | Without Coverage |
| Native Born | 52 (100.0%) | 0 (0.0%) |
| Foreign Born, Citizen | 124 (97.6%) | 3 (2.4%) |
| Foreign Born, not a Citizen | 35 (100.0%) | 0 (0.0%) |
Health Insurance Coverage by Household Income in Hatfield
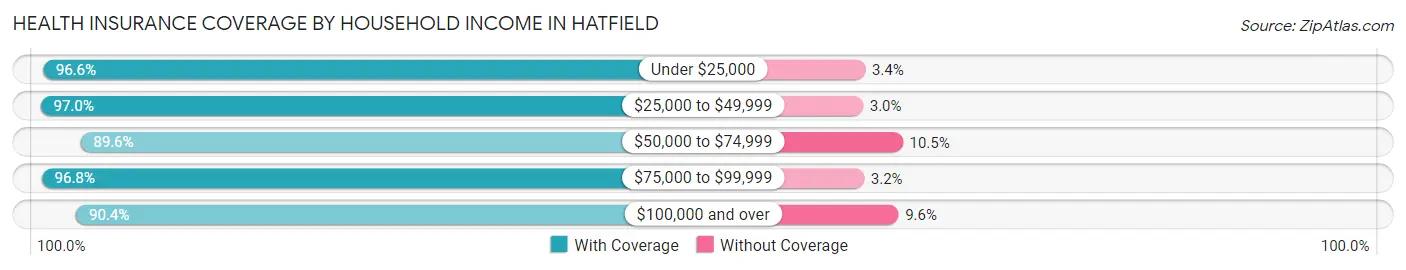
| Household Income | With Coverage | Without Coverage |
| Under $25,000 | 85 (96.6%) | 3 (3.4%) |
| $25,000 to $49,999 | 162 (97.0%) | 5 (3.0%) |
| $50,000 to $74,999 | 60 (89.5%) | 7 (10.4%) |
| $75,000 to $99,999 | 91 (96.8%) | 3 (3.2%) |
| $100,000 and over | 75 (90.4%) | 8 (9.6%) |
Public vs Private Health Insurance Coverage by Age in Hatfield
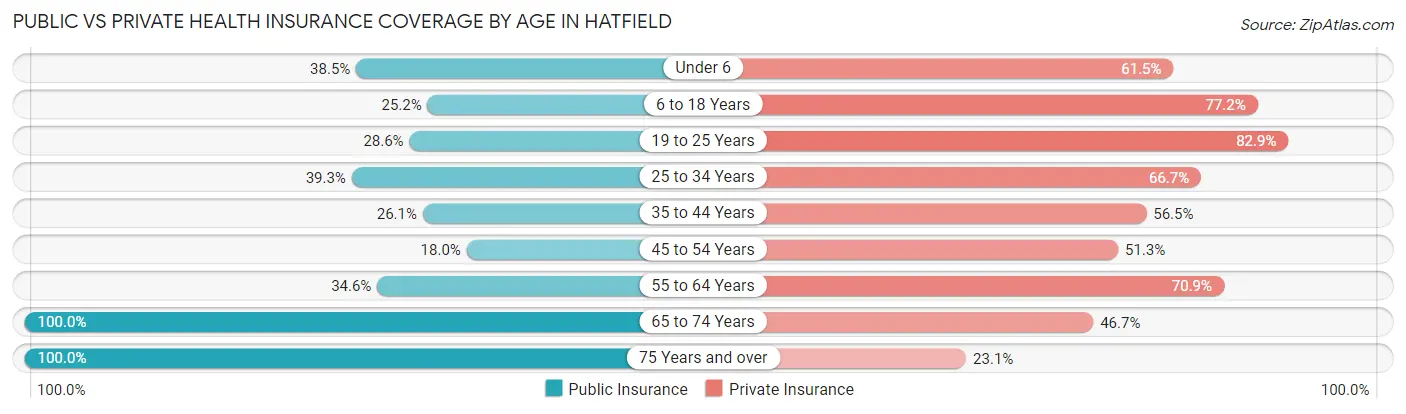
| Age Bracket | Public Insurance | Private Insurance |
| Under 6 | 20 (38.5%) | 32 (61.5%) |
| 6 to 18 Years | 32 (25.2%) | 98 (77.2%) |
| 19 to 25 Years | 10 (28.6%) | 29 (82.9%) |
| 25 to 34 Years | 33 (39.3%) | 56 (66.7%) |
| 35 to 44 Years | 6 (26.1%) | 13 (56.5%) |
| 45 to 54 Years | 7 (17.9%) | 20 (51.3%) |
| 55 to 64 Years | 19 (34.5%) | 39 (70.9%) |
| 65 to 74 Years | 45 (100.0%) | 21 (46.7%) |
| 75 Years and over | 39 (100.0%) | 9 (23.1%) |
| Total | 211 (42.3%) | 317 (63.5%) |
Disability Status by Sex by Age in Hatfield
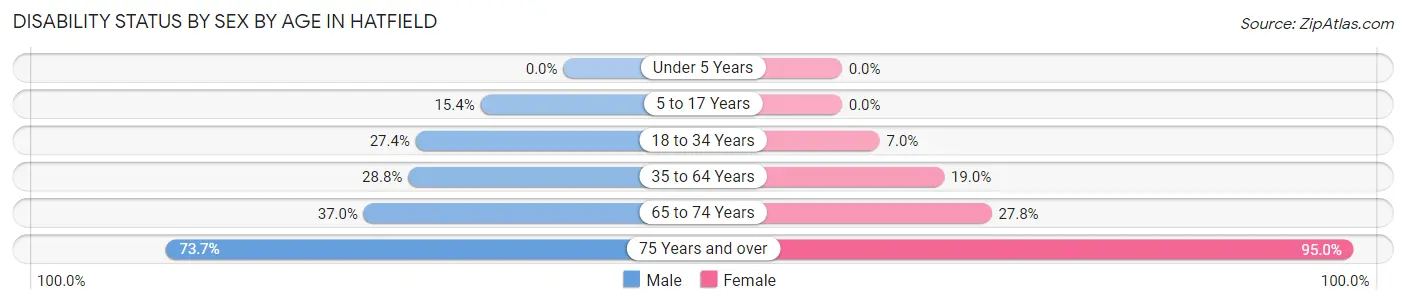
| Age Bracket | Male | Female |
| Under 5 Years | 0 (0.0%) | 0 (0.0%) |
| 5 to 17 Years | 2 (15.4%) | 0 (0.0%) |
| 18 to 34 Years | 20 (27.4%) | 4 (7.0%) |
| 35 to 64 Years | 17 (28.8%) | 11 (19.0%) |
| 65 to 74 Years | 10 (37.0%) | 5 (27.8%) |
| 75 Years and over | 14 (73.7%) | 19 (95.0%) |
Disability Class by Sex by Age in Hatfield
Disability Class: Hearing Difficulty
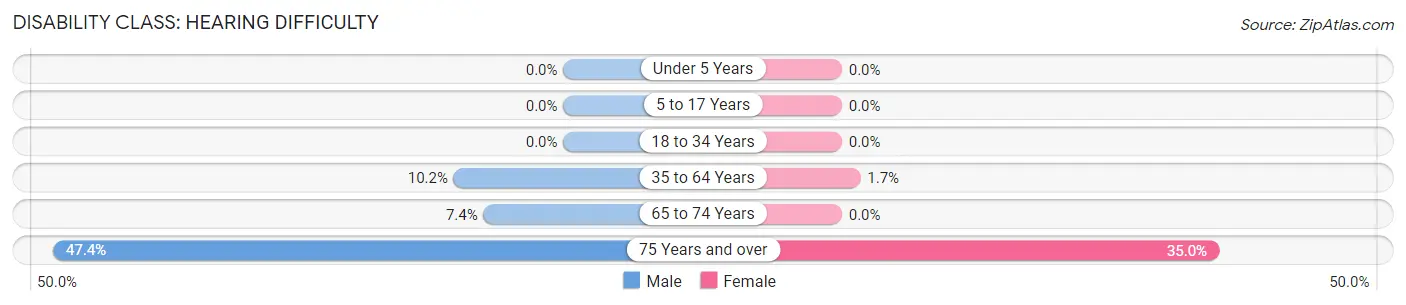
| Age Bracket | Male | Female |
| Under 5 Years | 0 (0.0%) | 0 (0.0%) |
| 5 to 17 Years | 0 (0.0%) | 0 (0.0%) |
| 18 to 34 Years | 0 (0.0%) | 0 (0.0%) |
| 35 to 64 Years | 6 (10.2%) | 1 (1.7%) |
| 65 to 74 Years | 2 (7.4%) | 0 (0.0%) |
| 75 Years and over | 9 (47.4%) | 7 (35.0%) |
Disability Class: Vision Difficulty
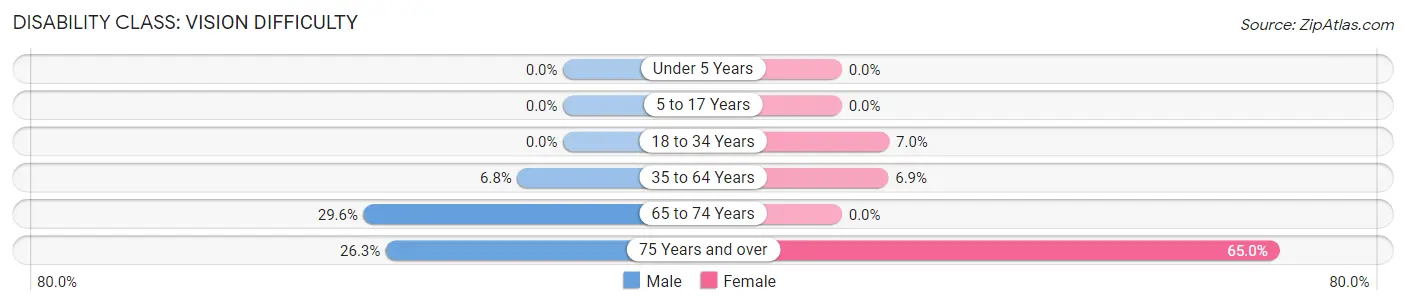
| Age Bracket | Male | Female |
| Under 5 Years | 0 (0.0%) | 0 (0.0%) |
| 5 to 17 Years | 0 (0.0%) | 0 (0.0%) |
| 18 to 34 Years | 0 (0.0%) | 4 (7.0%) |
| 35 to 64 Years | 4 (6.8%) | 4 (6.9%) |
| 65 to 74 Years | 8 (29.6%) | 0 (0.0%) |
| 75 Years and over | 5 (26.3%) | 13 (65.0%) |
Disability Class: Cognitive Difficulty
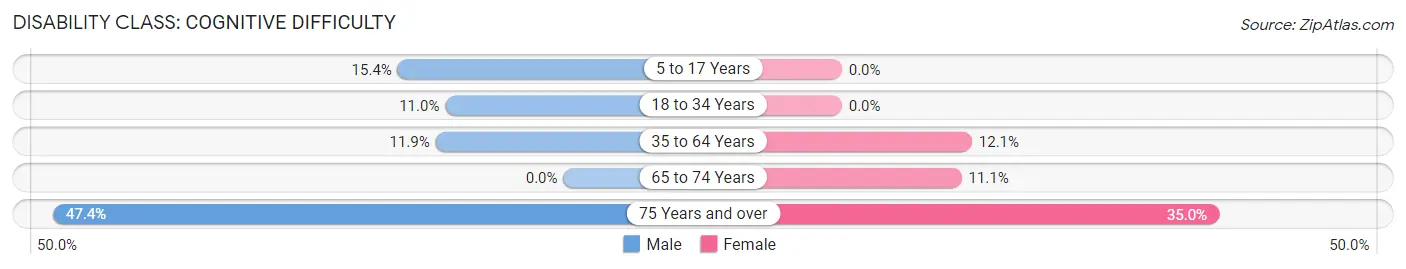
| Age Bracket | Male | Female |
| 5 to 17 Years | 2 (15.4%) | 0 (0.0%) |
| 18 to 34 Years | 8 (11.0%) | 0 (0.0%) |
| 35 to 64 Years | 7 (11.9%) | 7 (12.1%) |
| 65 to 74 Years | 0 (0.0%) | 2 (11.1%) |
| 75 Years and over | 9 (47.4%) | 7 (35.0%) |
Disability Class: Ambulatory Difficulty
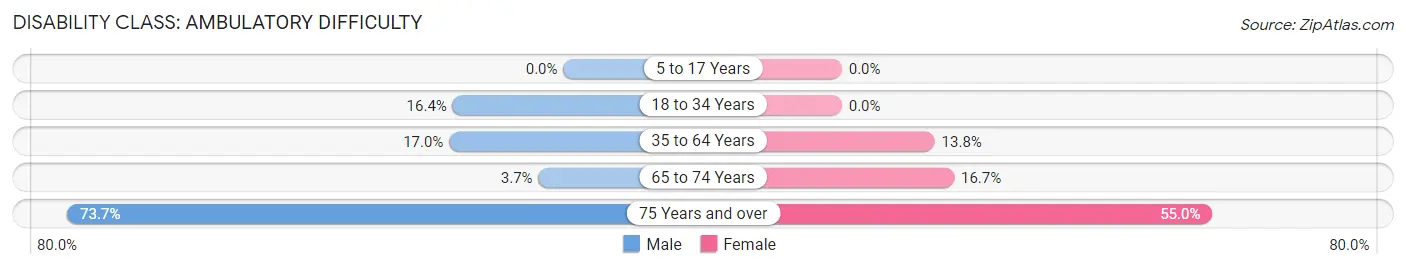
| Age Bracket | Male | Female |
| 5 to 17 Years | 0 (0.0%) | 0 (0.0%) |
| 18 to 34 Years | 12 (16.4%) | 0 (0.0%) |
| 35 to 64 Years | 10 (17.0%) | 8 (13.8%) |
| 65 to 74 Years | 1 (3.7%) | 3 (16.7%) |
| 75 Years and over | 14 (73.7%) | 11 (55.0%) |
Disability Class: Self-Care Difficulty
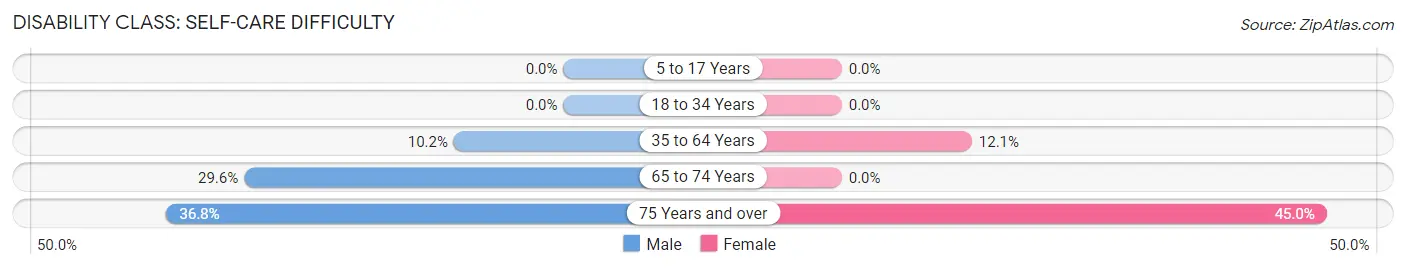
| Age Bracket | Male | Female |
| 5 to 17 Years | 0 (0.0%) | 0 (0.0%) |
| 18 to 34 Years | 0 (0.0%) | 0 (0.0%) |
| 35 to 64 Years | 6 (10.2%) | 7 (12.1%) |
| 65 to 74 Years | 8 (29.6%) | 0 (0.0%) |
| 75 Years and over | 7 (36.8%) | 9 (45.0%) |
Technology Access in Hatfield
Computing Device Access in Hatfield
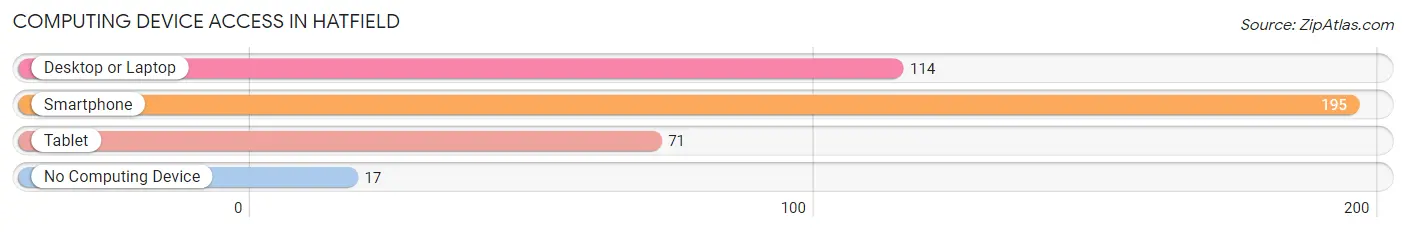
| Device Type | # Households | % Households |
| Desktop or Laptop | 114 | 50.9% |
| Smartphone | 195 | 87.1% |
| Tablet | 71 | 31.7% |
| No Computing Device | 17 | 7.6% |
| Total | 224 | 100.0% |
Internet Access in Hatfield
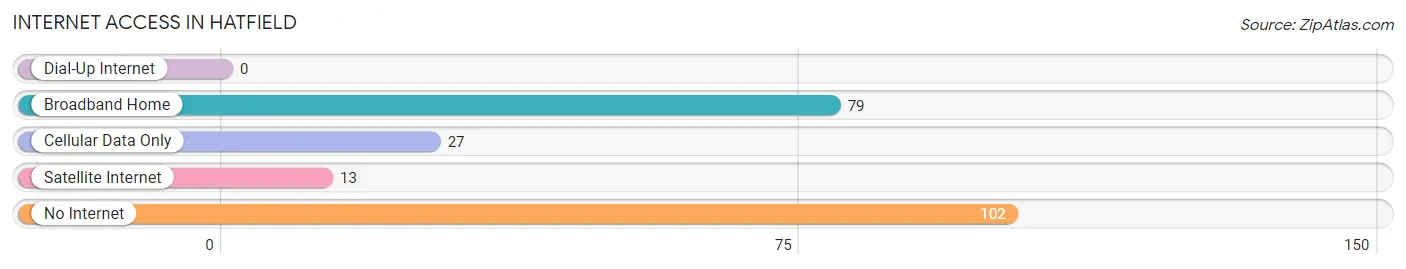
| Internet Type | # Households | % Households |
| Dial-Up Internet | 0 | 0.0% |
| Broadband Home | 79 | 35.3% |
| Cellular Data Only | 27 | 12.0% |
| Satellite Internet | 13 | 5.8% |
| No Internet | 102 | 45.5% |
| Total | 224 | 100.0% |
Hatfield Summary
Hatfield is a small town located in the southwestern corner of Arkansas, in the Ouachita Mountains. It is situated in the county of Polk, and is part of the Fort Smith metropolitan area. The town has a population of approximately 1,000 people, and is known for its rural charm and friendly atmosphere.
History
Hatfield was founded in 1883 by a group of settlers from Tennessee. The town was named after the Hatfield family, who were among the first settlers. The town was originally a farming community, and the main crops grown were cotton, corn, and potatoes. In the early 1900s, the town began to grow and develop, and by the 1920s, it had become a thriving community.
In the 1930s, the Great Depression hit the town hard, and many of the businesses and farms closed. However, the town was able to survive, and by the 1950s, it had become a popular tourist destination. The town was known for its beautiful scenery, and many people came to visit the area.
In the 1960s, the town began to experience a decline in population, as many of the younger residents moved away to find work in larger cities. However, the town was able to remain stable, and by the 1980s, it had become a popular retirement destination.
Geography
Hatfield is located in the Ouachita Mountains, and is surrounded by rolling hills and lush forests. The town is situated at the intersection of two major highways, US Highway 71 and Arkansas Highway 246. The town is located approximately 30 miles south of Fort Smith, and is about an hour and a half drive from Little Rock.
The climate in Hatfield is mild, with hot summers and cool winters. The average temperature in the summer is around 80 degrees Fahrenheit, and in the winter it is around 40 degrees Fahrenheit. The town receives an average of 45 inches of rain per year, and the area is known for its beautiful fall foliage.
Economy
The economy of Hatfield is largely based on tourism and agriculture. The town is home to several small businesses, including restaurants, shops, and a few small manufacturing companies. The town is also home to a number of farms, which produce a variety of crops, including cotton, corn, and potatoes.
The town is also home to a number of recreational activities, including fishing, hunting, and camping. The town is also home to a number of parks and trails, which are popular with visitors and locals alike.
Demographics
As of the 2010 census, the population of Hatfield was 1,000 people. The town is predominantly white, with approximately 95% of the population being Caucasian. The median household income in the town is $35,000, and the median age is 44 years old. The town has a low unemployment rate, and the majority of the population is employed in the tourism and agriculture industries.
Common Questions
What is Per Capita Income in Hatfield?
Per Capita income in Hatfield is $20,442.
What is the Median Family Income in Hatfield?
Median Family Income in Hatfield is $37,035.
What is the Median Household income in Hatfield?
Median Household Income in Hatfield is $36,635.
What is Inequality or Gini Index in Hatfield?
Inequality or Gini Index in Hatfield is 0.38.
What is the Total Population of Hatfield?
Total Population of Hatfield is 499.
What is the Total Male Population of Hatfield?
Total Male Population of Hatfield is 224.
What is the Total Female Population of Hatfield?
Total Female Population of Hatfield is 275.
What is the Ratio of Males per 100 Females in Hatfield?
There are 81.45 Males per 100 Females in Hatfield.
What is the Ratio of Females per 100 Males in Hatfield?
There are 122.77 Females per 100 Males in Hatfield.
What is the Median Population Age in Hatfield?
Median Population Age in Hatfield is 28.3 Years.
What is the Average Family Size in Hatfield
Average Family Size in Hatfield is 2.4 People.
What is the Average Household Size in Hatfield
Average Household Size in Hatfield is 2.2 People.
How Large is the Labor Force in Hatfield?
There are 259 People in the Labor Forcein in Hatfield.
What is the Percentage of People in the Labor Force in Hatfield?
62.4% of People are in the Labor Force in Hatfield.
What is the Unemployment Rate in Hatfield?
Unemployment Rate in Hatfield is 3.1%.