Harrisburg, AR
Harrisburg Map
Harrisburg Overview
2,700
TOTAL POPULATION
1,372
MALE POPULATION
1,328
FEMALE POPULATION
103.31
MALES / 100 FEMALES
96.79
FEMALES / 100 MALES
37.8
MEDIAN AGE
3.0
AVG FAMILY SIZE
2.6
AVG HOUSEHOLD SIZE
$22,944
PER CAPITA INCOME
$53,036
AVG FAMILY INCOME
$48,008
AVG HOUSEHOLD INCOME
10.8%
WAGE / INCOME GAP [ % ]
89.2¢/ $1
WAGE / INCOME GAP [ $ ]
$11,830
FAMILY INCOME DEFICIT
0.46
INEQUALITY / GINI INDEX
1,092
LABOR FORCE [ PEOPLE ]
51.4%
PERCENT IN LABOR FORCE
6.5%
UNEMPLOYMENT RATE
Harrisburg Zip Codes
Harrisburg Area Codes
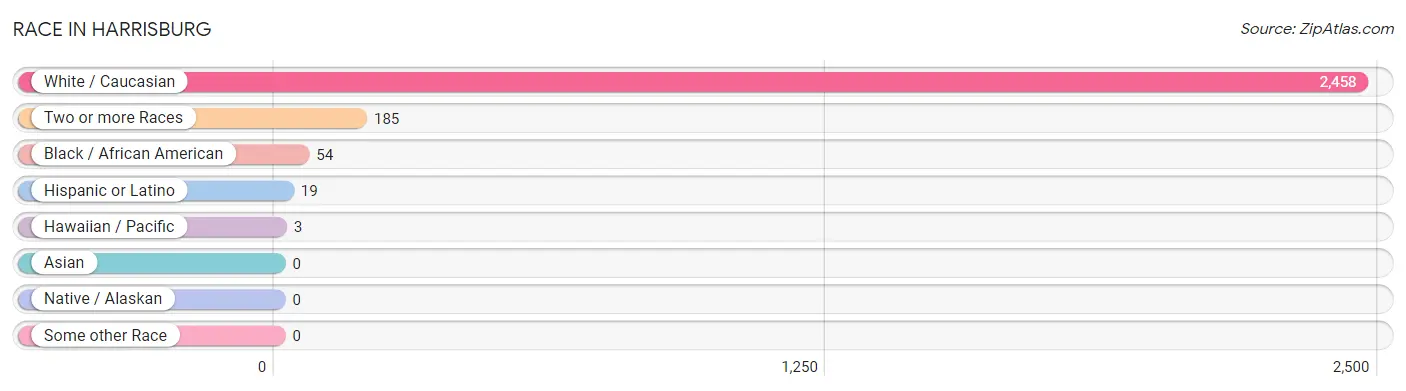
Race in Harrisburg
The most populous races in Harrisburg are White / Caucasian (2,458 | 91.0%), Two or more Races (185 | 6.9%), and Black / African American (54 | 2.0%).
| Race | # Population | % Population |
| Asian | 0 | 0.0% |
| Black / African American | 54 | 2.0% |
| Hawaiian / Pacific | 3 | 0.1% |
| Hispanic or Latino | 19 | 0.7% |
| Native / Alaskan | 0 | 0.0% |
| White / Caucasian | 2,458 | 91.0% |
| Two or more Races | 185 | 6.9% |
| Some other Race | 0 | 0.0% |
| Total | 2,700 | 100.0% |
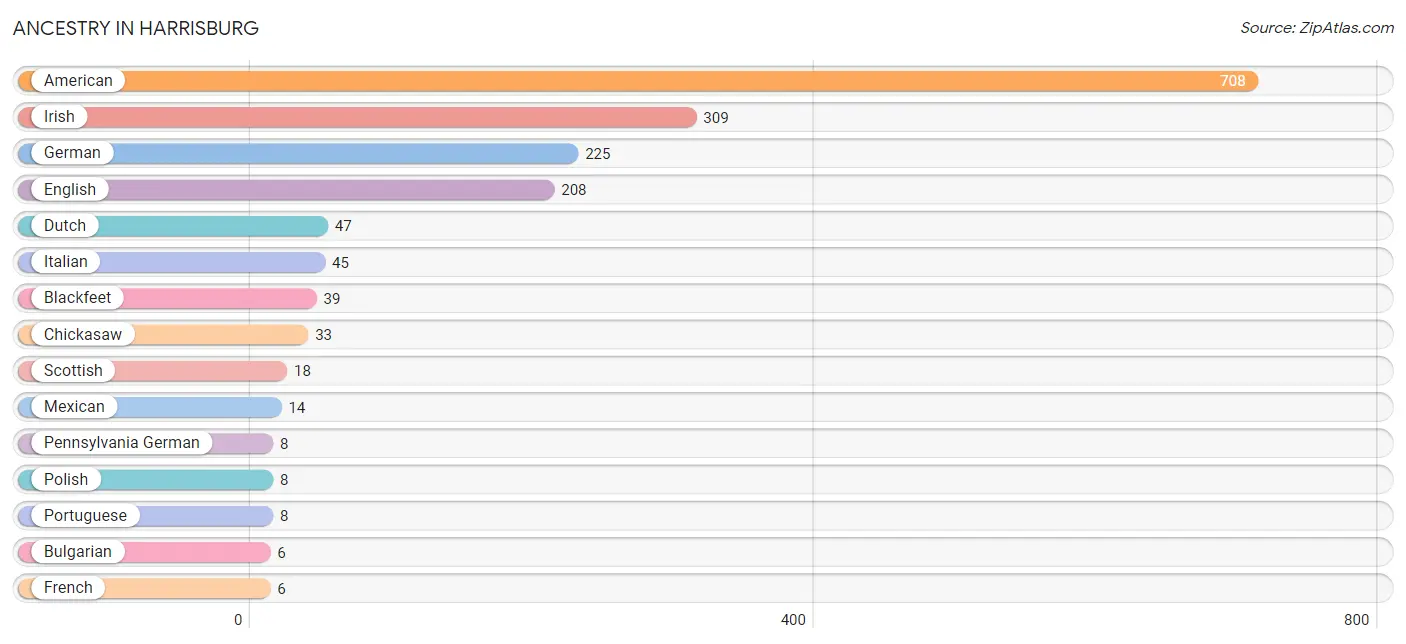
Ancestry in Harrisburg
The most populous ancestries reported in Harrisburg are American (708 | 26.2%), Irish (309 | 11.4%), German (225 | 8.3%), English (208 | 7.7%), and Dutch (47 | 1.7%), together accounting for 55.4% of all Harrisburg residents.
| Ancestry | # Population | % Population |
| American | 708 | 26.2% |
| Blackfeet | 39 | 1.4% |
| British | 5 | 0.2% |
| Bulgarian | 6 | 0.2% |
| Chickasaw | 33 | 1.2% |
| Dutch | 47 | 1.7% |
| English | 208 | 7.7% |
| French | 6 | 0.2% |
| French Canadian | 5 | 0.2% |
| German | 225 | 8.3% |
| Irish | 309 | 11.4% |
| Italian | 45 | 1.7% |
| Mexican | 14 | 0.5% |
| Native Hawaiian | 3 | 0.1% |
| Pennsylvania German | 8 | 0.3% |
| Polish | 8 | 0.3% |
| Portuguese | 8 | 0.3% |
| Scottish | 18 | 0.7% |
| Spanish | 5 | 0.2% | View All 19 Rows |
Immigrants in Harrisburg

| Immigration Origin | # Population | % Population | View All 0 Rows |
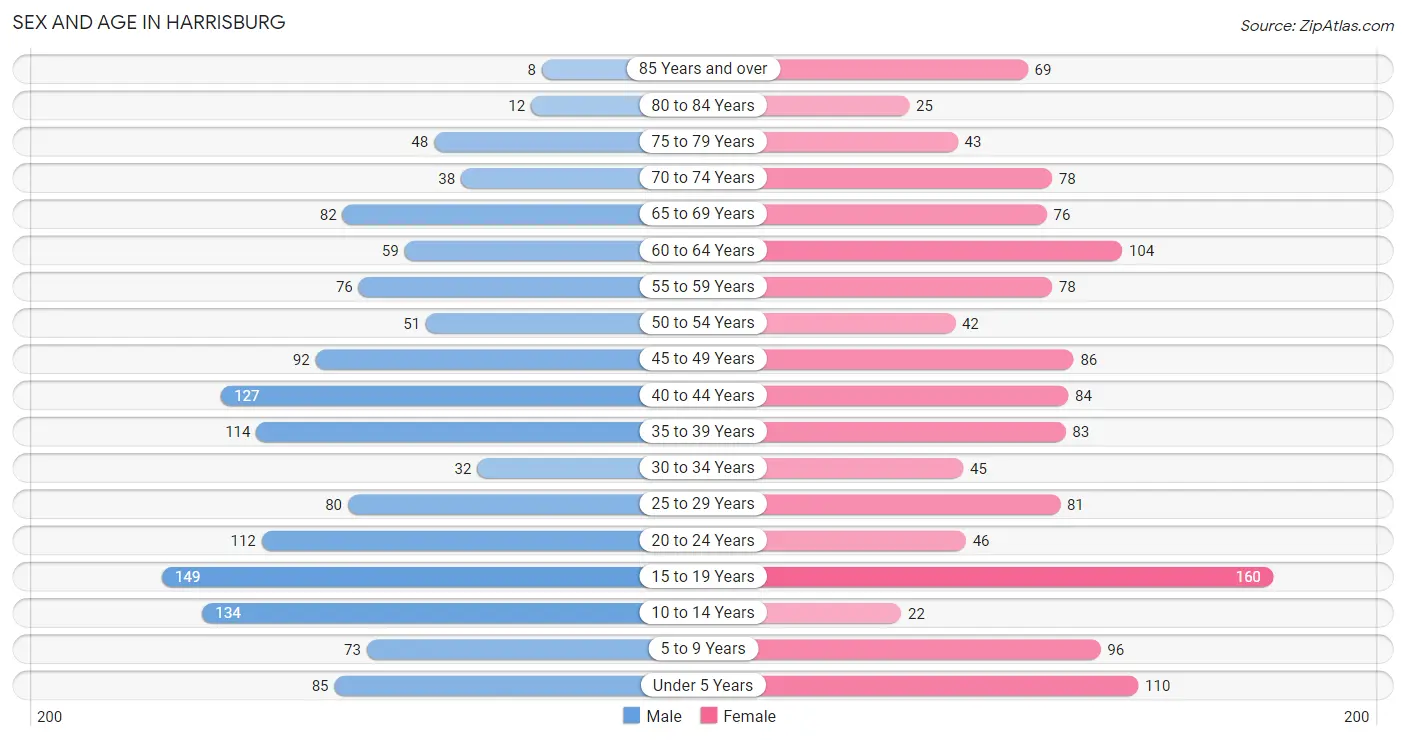
Sex and Age in Harrisburg
Sex and Age in Harrisburg
The most populous age groups in Harrisburg are 15 to 19 Years (149 | 10.9%) for men and 15 to 19 Years (160 | 12.0%) for women.
| Age Bracket | Male | Female |
| Under 5 Years | 85 (6.2%) | 110 (8.3%) |
| 5 to 9 Years | 73 (5.3%) | 96 (7.2%) |
| 10 to 14 Years | 134 (9.8%) | 22 (1.7%) |
| 15 to 19 Years | 149 (10.9%) | 160 (12.0%) |
| 20 to 24 Years | 112 (8.2%) | 46 (3.5%) |
| 25 to 29 Years | 80 (5.8%) | 81 (6.1%) |
| 30 to 34 Years | 32 (2.3%) | 45 (3.4%) |
| 35 to 39 Years | 114 (8.3%) | 83 (6.2%) |
| 40 to 44 Years | 127 (9.3%) | 84 (6.3%) |
| 45 to 49 Years | 92 (6.7%) | 86 (6.5%) |
| 50 to 54 Years | 51 (3.7%) | 42 (3.2%) |
| 55 to 59 Years | 76 (5.5%) | 78 (5.9%) |
| 60 to 64 Years | 59 (4.3%) | 104 (7.8%) |
| 65 to 69 Years | 82 (6.0%) | 76 (5.7%) |
| 70 to 74 Years | 38 (2.8%) | 78 (5.9%) |
| 75 to 79 Years | 48 (3.5%) | 43 (3.2%) |
| 80 to 84 Years | 12 (0.9%) | 25 (1.9%) |
| 85 Years and over | 8 (0.6%) | 69 (5.2%) |
| Total | 1,372 (100.0%) | 1,328 (100.0%) |
Families and Households in Harrisburg
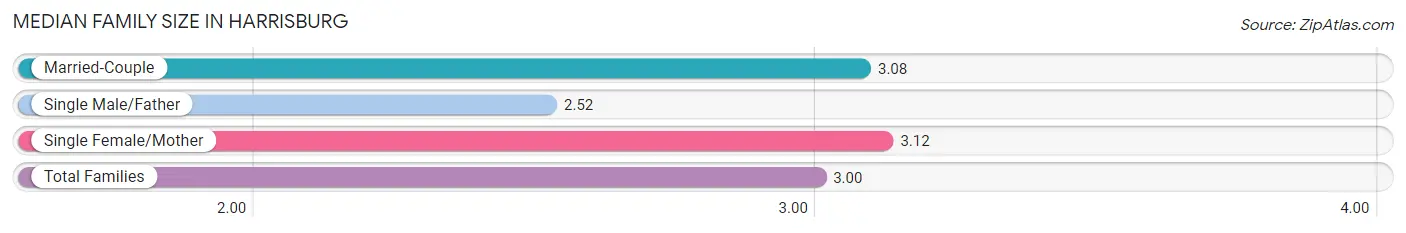
Median Family Size in Harrisburg
The median family size in Harrisburg is 3.00 persons per family, with single female/mother families (216 | 30.9%) accounting for the largest median family size of 3.12 persons per family. On the other hand, single male/father families (121 | 17.3%) represent the smallest median family size with 2.52 persons per family.
| Family Type | # Families | Family Size |
| Married-Couple | 361 (51.7%) | 3.08 |
| Single Male/Father | 121 (17.3%) | 2.52 |
| Single Female/Mother | 216 (30.9%) | 3.12 |
| Total Families | 698 (100.0%) | 3.00 |
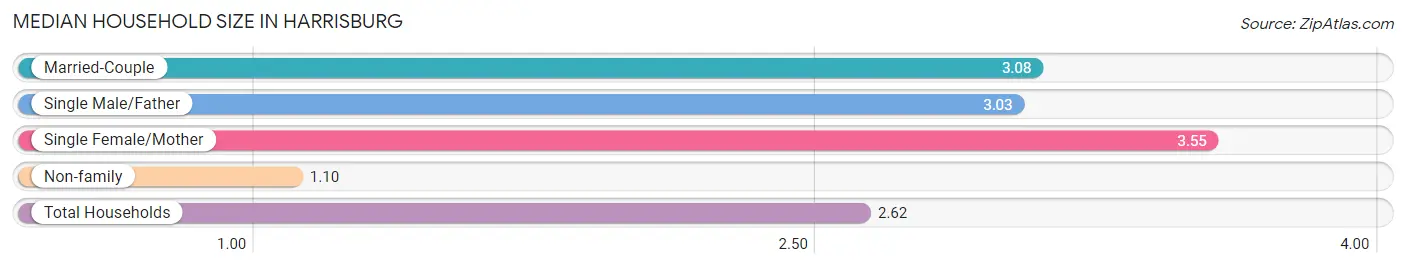
Median Household Size in Harrisburg
The median household size in Harrisburg is 2.62 persons per household, with single female/mother households (216 | 22.3%) accounting for the largest median household size of 3.55 persons per household. non-family households (272 | 28.0%) represent the smallest median household size with 1.10 persons per household.
| Household Type | # Households | Household Size |
| Married-Couple | 361 (37.2%) | 3.08 |
| Single Male/Father | 121 (12.5%) | 3.03 |
| Single Female/Mother | 216 (22.3%) | 3.55 |
| Non-family | 272 (28.0%) | 1.10 |
| Total Households | 970 (100.0%) | 2.62 |
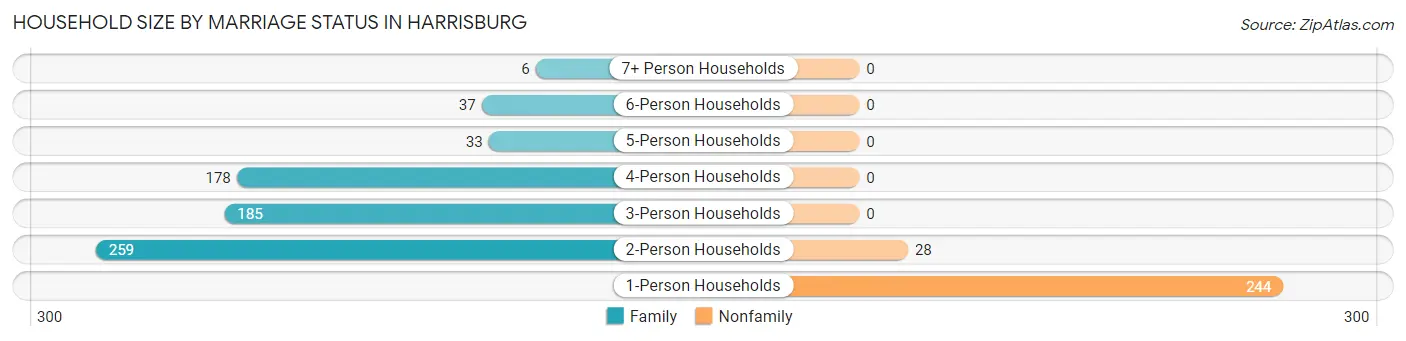
Household Size by Marriage Status in Harrisburg
Out of a total of 970 households in Harrisburg, 698 (72.0%) are family households, while 272 (28.0%) are nonfamily households. The most numerous type of family households are 2-person households, comprising 259, and the most common type of nonfamily households are 1-person households, comprising 244.
| Household Size | Family Households | Nonfamily Households |
| 1-Person Households | - | 244 (25.2%) |
| 2-Person Households | 259 (26.7%) | 28 (2.9%) |
| 3-Person Households | 185 (19.1%) | 0 (0.0%) |
| 4-Person Households | 178 (18.3%) | 0 (0.0%) |
| 5-Person Households | 33 (3.4%) | 0 (0.0%) |
| 6-Person Households | 37 (3.8%) | 0 (0.0%) |
| 7+ Person Households | 6 (0.6%) | 0 (0.0%) |
| Total | 698 (72.0%) | 272 (28.0%) |
Female Fertility in Harrisburg
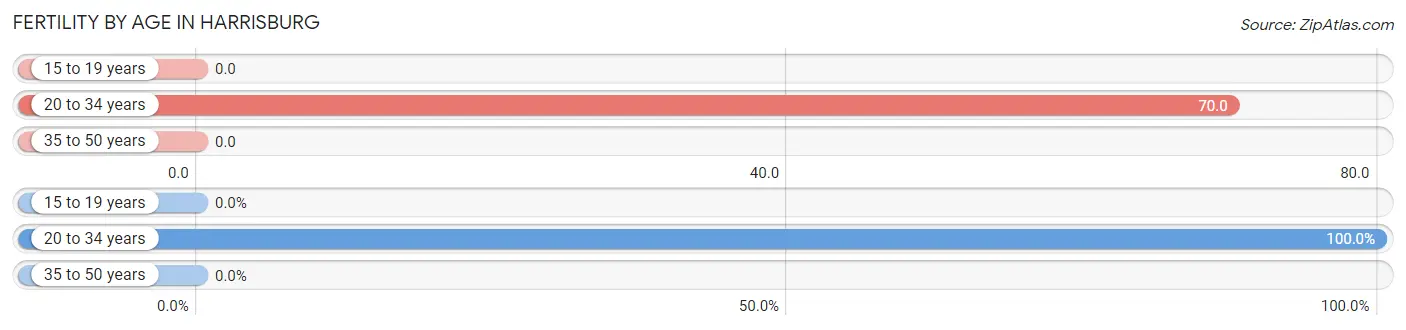
Fertility by Age in Harrisburg
Average fertility rate in Harrisburg is 20.0 births per 1,000 women. Women in the age bracket of 20 to 34 years have the highest fertility rate with 70.0 births per 1,000 women. Women in the age bracket of 20 to 34 years acount for 100.0% of all women with births.
| Age Bracket | Women with Births | Births / 1,000 Women |
| 15 to 19 years | 0 (0.0%) | 0.0 |
| 20 to 34 years | 12 (100.0%) | 70.0 |
| 35 to 50 years | 0 (0.0%) | 0.0 |
| Total | 12 (100.0%) | 20.0 |
Fertility by Age by Marriage Status in Harrisburg
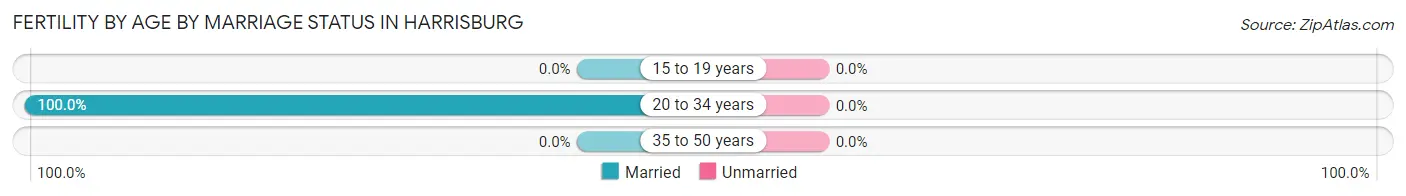
| Age Bracket | Married | Unmarried |
| 15 to 19 years | 0 (0.0%) | 0 (0.0%) |
| 20 to 34 years | 12 (100.0%) | 0 (0.0%) |
| 35 to 50 years | 0 (0.0%) | 0 (0.0%) |
| Total | 12 (100.0%) | 0 (0.0%) |
Fertility by Education in Harrisburg
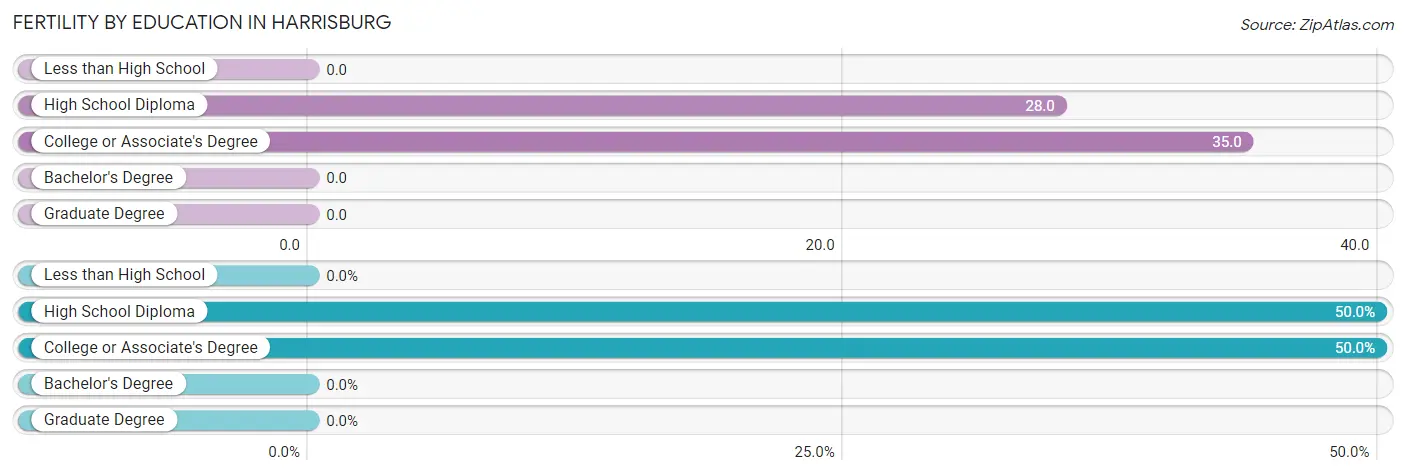
| Educational Attainment | Women with Births | Births / 1,000 Women |
| Less than High School | 0 (0.0%) | 0.0 |
| High School Diploma | 6 (50.0%) | 28.0 |
| College or Associate's Degree | 6 (50.0%) | 35.0 |
| Bachelor's Degree | 0 (0.0%) | 0.0 |
| Graduate Degree | 0 (0.0%) | 0.0 |
| Total | 12 (100.0%) | 20.0 |
Fertility by Education by Marriage Status in Harrisburg
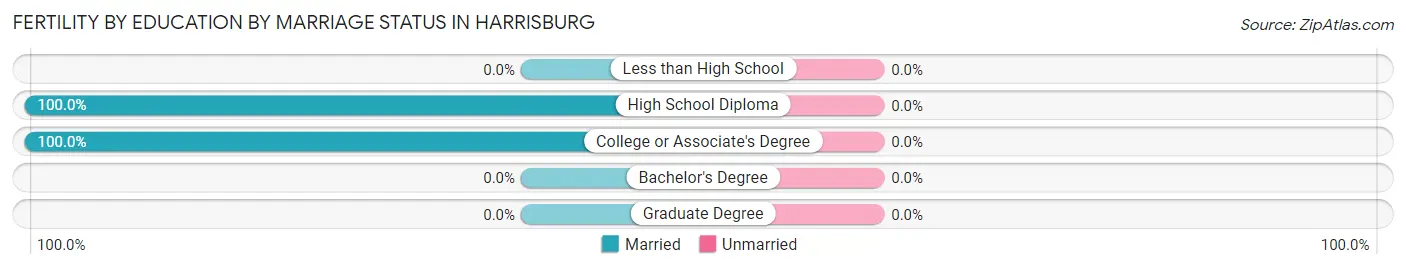
| Educational Attainment | Married | Unmarried |
| Less than High School | 0 (0.0%) | 0 (0.0%) |
| High School Diploma | 6 (100.0%) | 0 (0.0%) |
| College or Associate's Degree | 6 (100.0%) | 0 (0.0%) |
| Bachelor's Degree | 0 (0.0%) | 0 (0.0%) |
| Graduate Degree | 0 (0.0%) | 0 (0.0%) |
| Total | 12 (100.0%) | 0 (0.0%) |
Income in Harrisburg
Income Overview in Harrisburg
Per Capita Income in Harrisburg is $22,944, while median incomes of families and households are $53,036 and $48,008 respectively.
| Characteristic | Number | Measure |
| Per Capita Income | 2,700 | $22,944 |
| Median Family Income | 698 | $53,036 |
| Mean Family Income | 698 | $69,600 |
| Median Household Income | 970 | $48,008 |
| Mean Household Income | 970 | $59,529 |
| Income Deficit | 698 | $11,830 |
| Wage / Income Gap (%) | 2,700 | 10.80% |
| Wage / Income Gap ($) | 2,700 | 89.20¢ per $1 |
| Gini / Inequality Index | 2,700 | 0.46 |
Earnings by Sex in Harrisburg
Average Earnings in Harrisburg are $31,222, $32,301 for men and $28,813 for women, a difference of 10.8%.
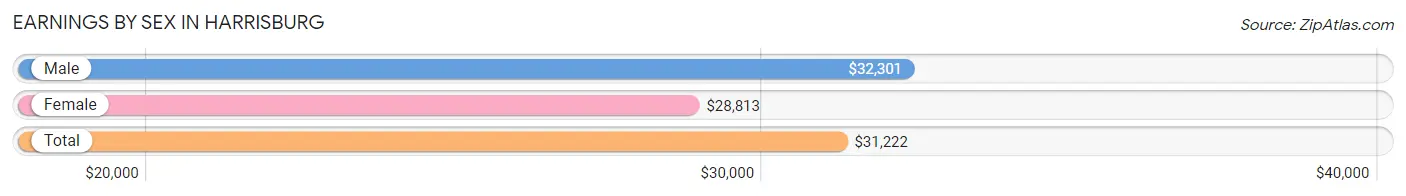
| Sex | Number | Average Earnings |
| Male | 617 (52.5%) | $32,301 |
| Female | 558 (47.5%) | $28,813 |
| Total | 1,175 (100.0%) | $31,222 |
Earnings by Sex by Income Bracket in Harrisburg
The most common earnings brackets in Harrisburg are $30,000 to $34,999 for men (72 | 11.7%) and $20,000 to $22,499 for women (68 | 12.2%).
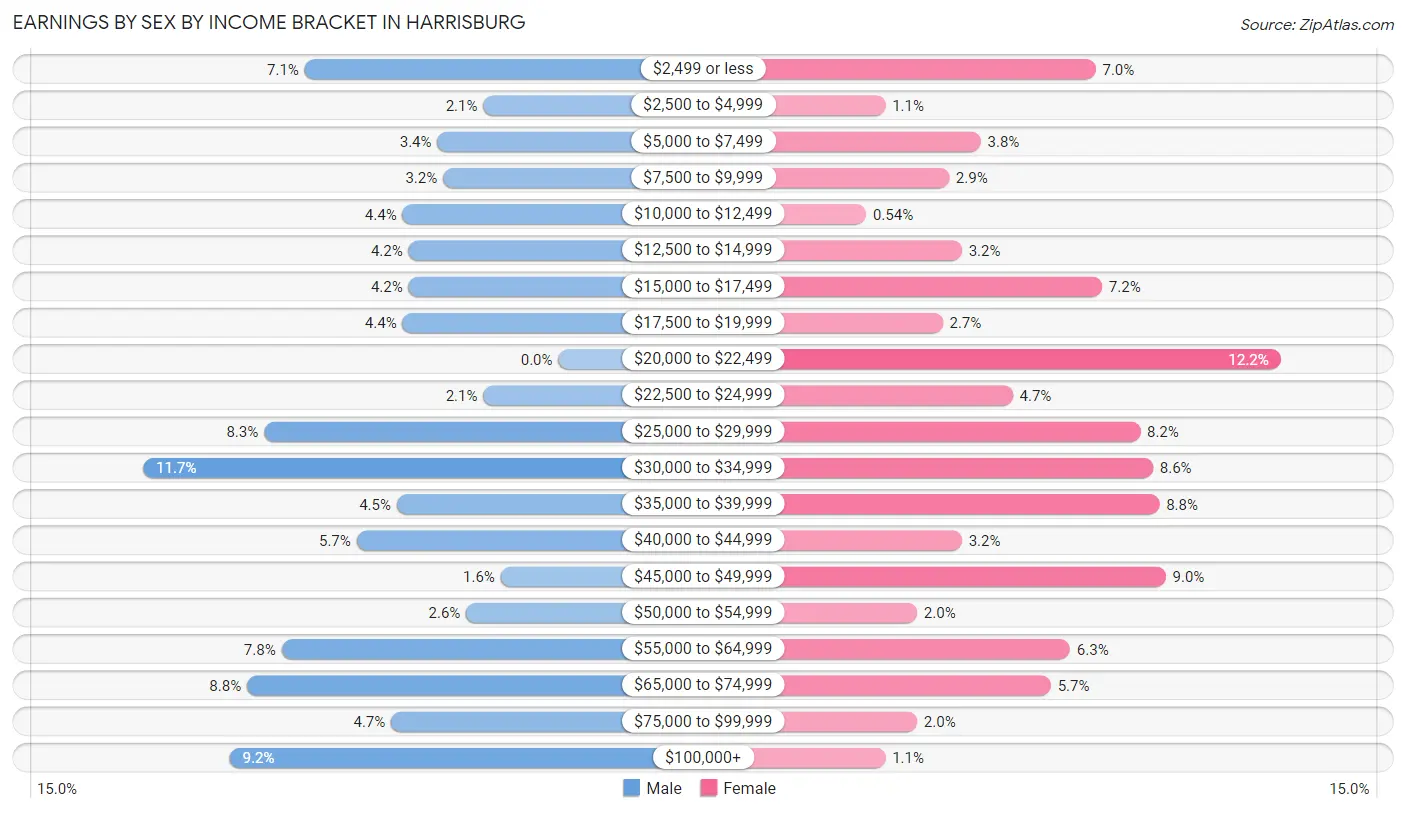
| Income | Male | Female |
| $2,499 or less | 44 (7.1%) | 39 (7.0%) |
| $2,500 to $4,999 | 13 (2.1%) | 6 (1.1%) |
| $5,000 to $7,499 | 21 (3.4%) | 21 (3.8%) |
| $7,500 to $9,999 | 20 (3.2%) | 16 (2.9%) |
| $10,000 to $12,499 | 27 (4.4%) | 3 (0.5%) |
| $12,500 to $14,999 | 26 (4.2%) | 18 (3.2%) |
| $15,000 to $17,499 | 26 (4.2%) | 40 (7.2%) |
| $17,500 to $19,999 | 27 (4.4%) | 15 (2.7%) |
| $20,000 to $22,499 | 0 (0.0%) | 68 (12.2%) |
| $22,500 to $24,999 | 13 (2.1%) | 26 (4.7%) |
| $25,000 to $29,999 | 51 (8.3%) | 46 (8.2%) |
| $30,000 to $34,999 | 72 (11.7%) | 48 (8.6%) |
| $35,000 to $39,999 | 28 (4.5%) | 49 (8.8%) |
| $40,000 to $44,999 | 35 (5.7%) | 18 (3.2%) |
| $45,000 to $49,999 | 10 (1.6%) | 50 (9.0%) |
| $50,000 to $54,999 | 16 (2.6%) | 11 (2.0%) |
| $55,000 to $64,999 | 48 (7.8%) | 35 (6.3%) |
| $65,000 to $74,999 | 54 (8.7%) | 32 (5.7%) |
| $75,000 to $99,999 | 29 (4.7%) | 11 (2.0%) |
| $100,000+ | 57 (9.2%) | 6 (1.1%) |
| Total | 617 (100.0%) | 558 (100.0%) |
Earnings by Sex by Educational Attainment in Harrisburg
Average earnings in Harrisburg are $39,500 for men and $33,984 for women, a difference of 14.0%. Men with an educational attainment of high school diploma enjoy the highest average annual earnings of $50,179, while those with less than high school education earn the least with $27,697. Women with an educational attainment of college or associate's degree earn the most with the average annual earnings of $44,861, while those with high school diploma education have the smallest earnings of $22,196.
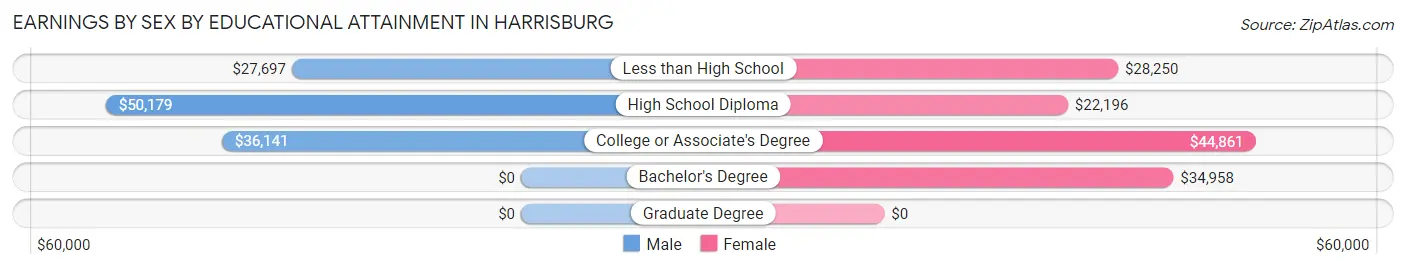
| Educational Attainment | Male Income | Female Income |
| Less than High School | $27,697 | $28,250 |
| High School Diploma | $50,179 | $22,196 |
| College or Associate's Degree | $36,141 | $44,861 |
| Bachelor's Degree | - | - |
| Graduate Degree | - | - |
| Total | $39,500 | $33,984 |
Family Income in Harrisburg
Family Income Brackets in Harrisburg
According to the Harrisburg family income data, there are 153 families falling into the $35,000 to $49,999 income range, which is the most common income bracket and makes up 21.9% of all families. Conversely, the $10,000 to $14,999 income bracket is the least frequent group with only 24 families (3.4%) belonging to this category.
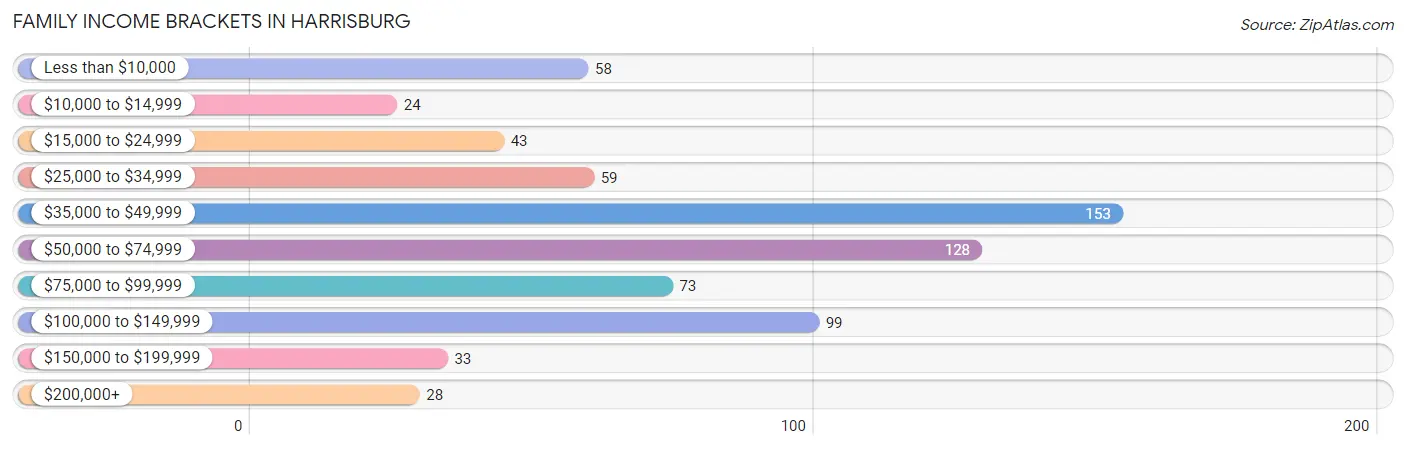
| Income Bracket | # Families | % Families |
| Less than $10,000 | 58 | 8.3% |
| $10,000 to $14,999 | 24 | 3.4% |
| $15,000 to $24,999 | 43 | 6.2% |
| $25,000 to $34,999 | 59 | 8.5% |
| $35,000 to $49,999 | 153 | 21.9% |
| $50,000 to $74,999 | 128 | 18.3% |
| $75,000 to $99,999 | 73 | 10.5% |
| $100,000 to $149,999 | 99 | 14.2% |
| $150,000 to $199,999 | 33 | 4.7% |
| $200,000+ | 28 | 4.0% |
Family Income by Famaliy Size in Harrisburg
4-person families (170 | 24.4%) account for the highest median family income in Harrisburg with $100,962 per family, while 4-person families (170 | 24.4%) have the highest median income of $25,240 per family member.
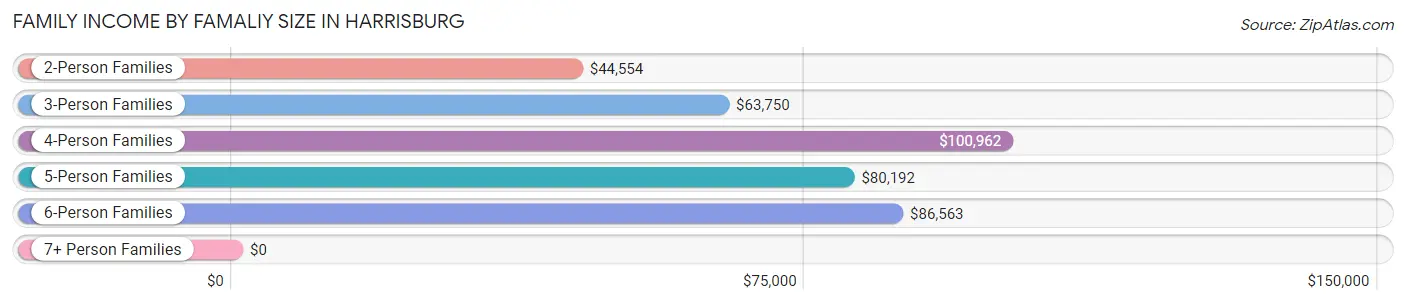
| Income Bracket | # Families | Median Income |
| 2-Person Families | 331 (47.4%) | $44,554 |
| 3-Person Families | 154 (22.1%) | $63,750 |
| 4-Person Families | 170 (24.4%) | $100,962 |
| 5-Person Families | 24 (3.4%) | $80,192 |
| 6-Person Families | 13 (1.9%) | $86,563 |
| 7+ Person Families | 6 (0.9%) | $0 |
| Total | 698 (100.0%) | $53,036 |
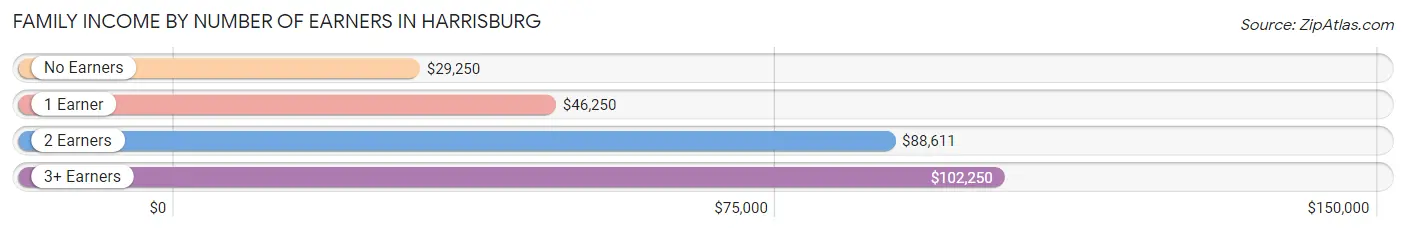
Family Income by Number of Earners in Harrisburg
The median family income in Harrisburg is $53,036, with families comprising 3+ earners (79) having the highest median family income of $102,250, while families with no earners (177) have the lowest median family income of $29,250, accounting for 11.3% and 25.4% of families, respectively.
| Number of Earners | # Families | Median Income |
| No Earners | 177 (25.4%) | $29,250 |
| 1 Earner | 256 (36.7%) | $46,250 |
| 2 Earners | 186 (26.7%) | $88,611 |
| 3+ Earners | 79 (11.3%) | $102,250 |
| Total | 698 (100.0%) | $53,036 |
Household Income in Harrisburg
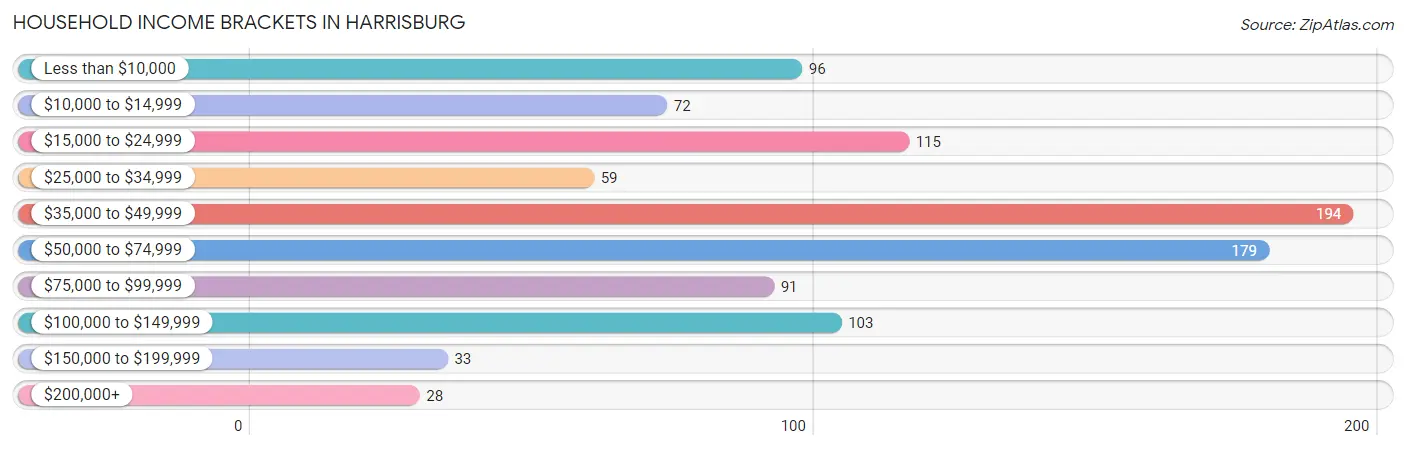
Household Income Brackets in Harrisburg
With 194 households falling in the category, the $35,000 to $49,999 income range is the most frequent in Harrisburg, accounting for 20.0% of all households. In contrast, only 28 households (2.9%) fall into the $200,000+ income bracket, making it the least populous group.
| Income Bracket | # Households | % Households |
| Less than $10,000 | 96 | 9.9% |
| $10,000 to $14,999 | 72 | 7.4% |
| $15,000 to $24,999 | 115 | 11.9% |
| $25,000 to $34,999 | 59 | 6.1% |
| $35,000 to $49,999 | 194 | 20.0% |
| $50,000 to $74,999 | 179 | 18.5% |
| $75,000 to $99,999 | 91 | 9.4% |
| $100,000 to $149,999 | 103 | 10.6% |
| $150,000 to $199,999 | 33 | 3.4% |
| $200,000+ | 28 | 2.9% |
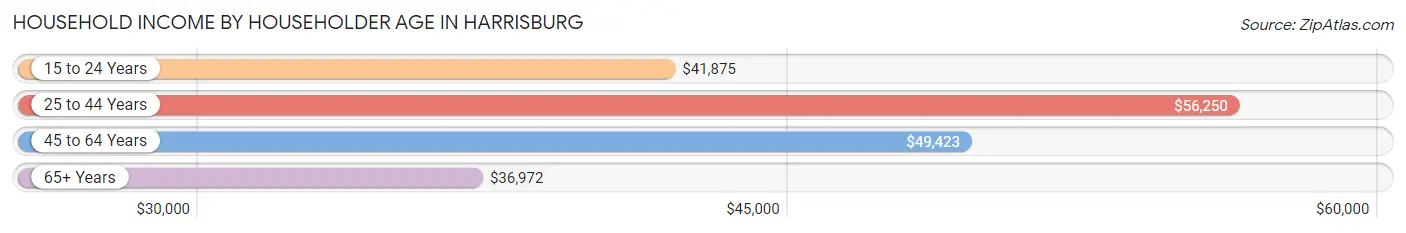
Household Income by Householder Age in Harrisburg
The median household income in Harrisburg is $48,008, with the highest median household income of $56,250 found in the 25 to 44 years age bracket for the primary householder. A total of 323 households (33.3%) fall into this category. Meanwhile, the 65+ years age bracket for the primary householder has the lowest median household income of $36,972, with 317 households (32.7%) in this group.
| Income Bracket | # Households | Median Income |
| 15 to 24 Years | 20 (2.1%) | $41,875 |
| 25 to 44 Years | 323 (33.3%) | $56,250 |
| 45 to 64 Years | 310 (32.0%) | $49,423 |
| 65+ Years | 317 (32.7%) | $36,972 |
| Total | 970 (100.0%) | $48,008 |
Poverty in Harrisburg
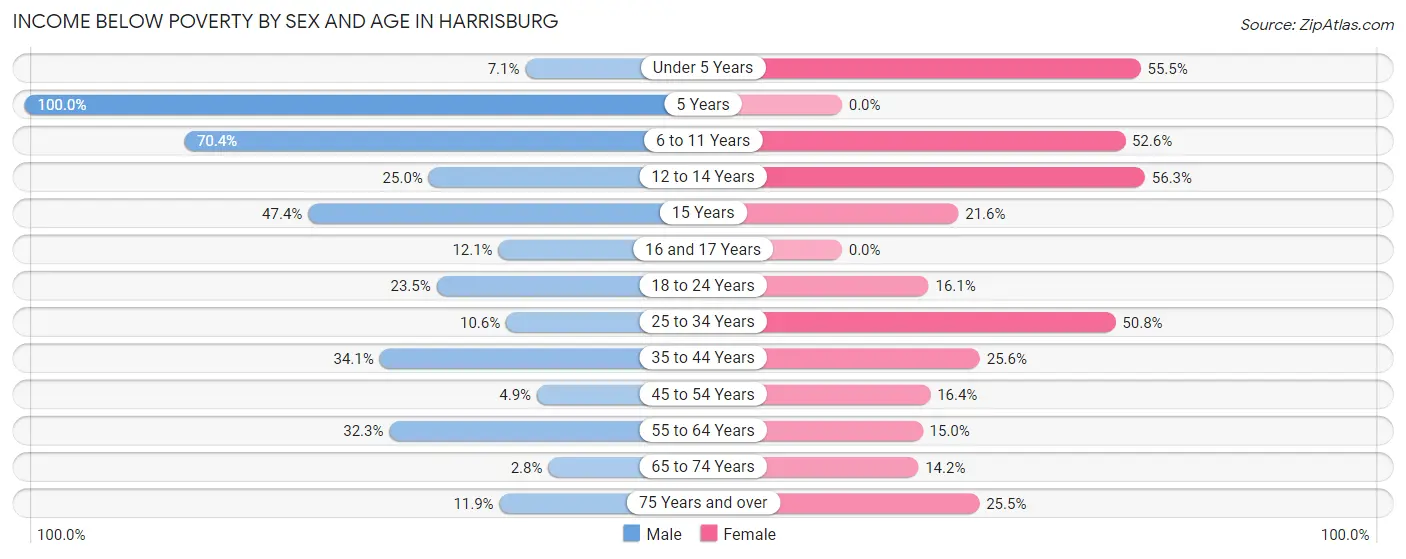
Income Below Poverty by Sex and Age in Harrisburg
With 22.4% poverty level for males and 27.1% for females among the residents of Harrisburg, 5 year old males and 12 to 14 year old females are the most vulnerable to poverty, with 5 males (100.0%) and 9 females (56.2%) in their respective age groups living below the poverty level.
| Age Bracket | Male | Female |
| Under 5 Years | 6 (7.1%) | 61 (55.4%) |
| 5 Years | 5 (100.0%) | 0 (0.0%) |
| 6 to 11 Years | 50 (70.4%) | 41 (52.6%) |
| 12 to 14 Years | 26 (25.0%) | 9 (56.2%) |
| 15 Years | 9 (47.4%) | 8 (21.6%) |
| 16 and 17 Years | 10 (12.0%) | 0 (0.0%) |
| 18 to 24 Years | 32 (23.5%) | 24 (16.1%) |
| 25 to 34 Years | 10 (10.6%) | 64 (50.8%) |
| 35 to 44 Years | 72 (34.1%) | 41 (25.6%) |
| 45 to 54 Years | 7 (4.9%) | 21 (16.4%) |
| 55 to 64 Years | 42 (32.3%) | 27 (15.0%) |
| 65 to 74 Years | 3 (2.8%) | 21 (14.2%) |
| 75 Years and over | 7 (11.9%) | 25 (25.5%) |
| Total | 279 (22.4%) | 342 (27.1%) |
Income Above Poverty by Sex and Age in Harrisburg
According to the poverty statistics in Harrisburg, males aged 65 to 74 years and females aged 5 years are the age groups that are most secure financially, with 97.2% of males and 100.0% of females in these age groups living above the poverty line.
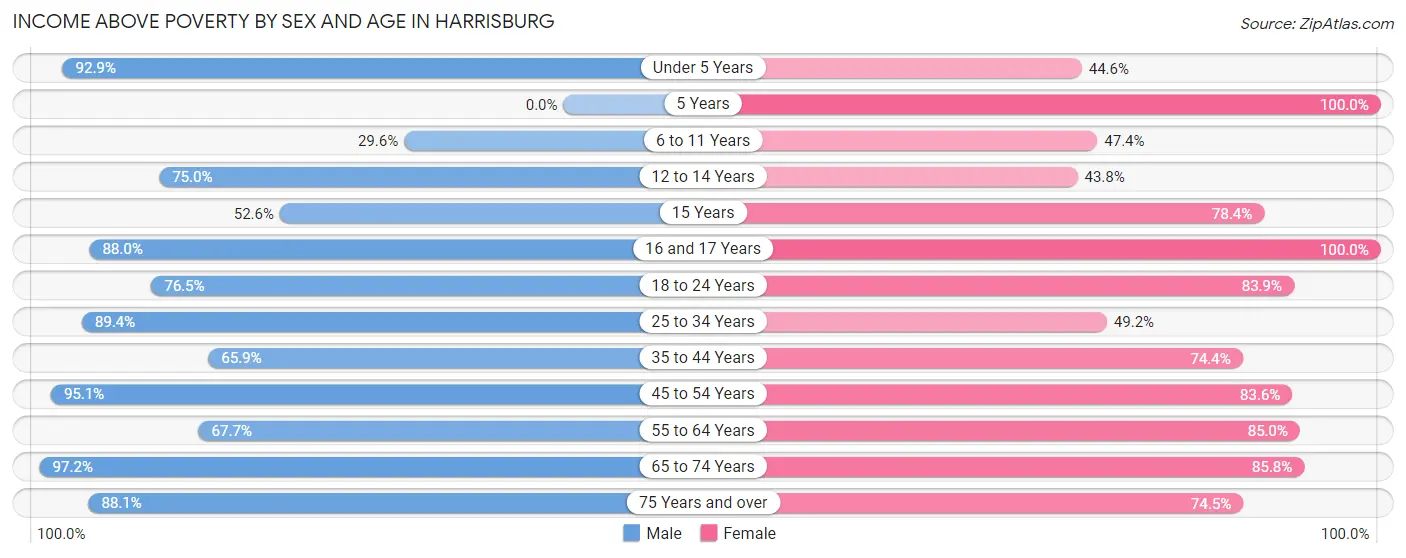
| Age Bracket | Male | Female |
| Under 5 Years | 79 (92.9%) | 49 (44.6%) |
| 5 Years | 0 (0.0%) | 13 (100.0%) |
| 6 to 11 Years | 21 (29.6%) | 37 (47.4%) |
| 12 to 14 Years | 78 (75.0%) | 7 (43.8%) |
| 15 Years | 10 (52.6%) | 29 (78.4%) |
| 16 and 17 Years | 73 (87.9%) | 20 (100.0%) |
| 18 to 24 Years | 104 (76.5%) | 125 (83.9%) |
| 25 to 34 Years | 84 (89.4%) | 62 (49.2%) |
| 35 to 44 Years | 139 (65.9%) | 119 (74.4%) |
| 45 to 54 Years | 136 (95.1%) | 107 (83.6%) |
| 55 to 64 Years | 88 (67.7%) | 153 (85.0%) |
| 65 to 74 Years | 104 (97.2%) | 127 (85.8%) |
| 75 Years and over | 52 (88.1%) | 73 (74.5%) |
| Total | 968 (77.6%) | 921 (72.9%) |
Income Below Poverty Among Married-Couple Families in Harrisburg
The poverty statistics for married-couple families in Harrisburg show that 5.8% or 21 of the total 361 families live below the poverty line. Families with no children have the highest poverty rate of 8.5%, comprising of 17 families. On the other hand, families with 3 or 4 children have the lowest poverty rate of 0.0%, which includes 0 families.
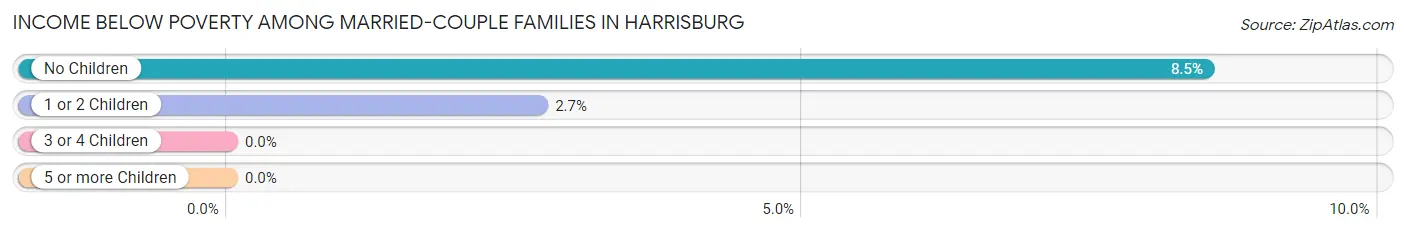
| Children | Above Poverty | Below Poverty |
| No Children | 183 (91.5%) | 17 (8.5%) |
| 1 or 2 Children | 144 (97.3%) | 4 (2.7%) |
| 3 or 4 Children | 13 (100.0%) | 0 (0.0%) |
| 5 or more Children | 0 (0.0%) | 0 (0.0%) |
| Total | 340 (94.2%) | 21 (5.8%) |
Income Below Poverty Among Single-Parent Households in Harrisburg
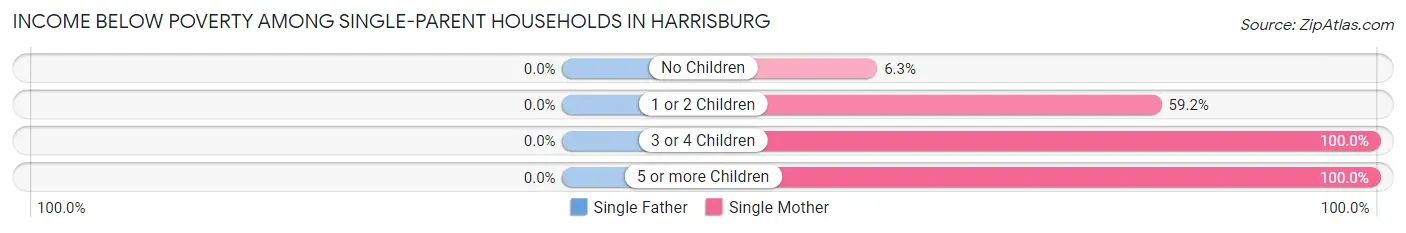
| Children | Single Father | Single Mother |
| No Children | 0 (0.0%) | 4 (6.2%) |
| 1 or 2 Children | 0 (0.0%) | 77 (59.2%) |
| 3 or 4 Children | 0 (0.0%) | 16 (100.0%) |
| 5 or more Children | 0 (0.0%) | 6 (100.0%) |
| Total | 0 (0.0%) | 103 (47.7%) |
Income Below Poverty Among Married-Couple vs Single-Parent Households in Harrisburg
The poverty data for Harrisburg shows that 21 of the married-couple family households (5.8%) and 103 of the single-parent households (30.6%) are living below the poverty level. Within the married-couple family households, those with no children have the highest poverty rate, with 17 households (8.5%) falling below the poverty line. Among the single-parent households, those with 5 or more children have the highest poverty rate, with 6 household (100.0%) living below poverty.
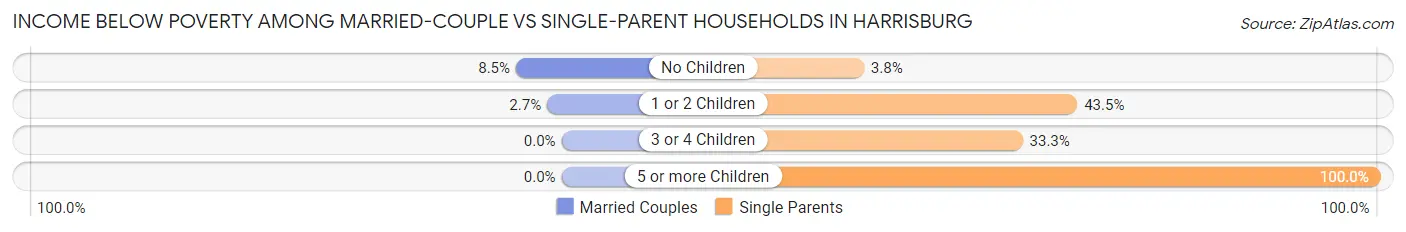
| Children | Married-Couple Families | Single-Parent Households |
| No Children | 17 (8.5%) | 4 (3.8%) |
| 1 or 2 Children | 4 (2.7%) | 77 (43.5%) |
| 3 or 4 Children | 0 (0.0%) | 16 (33.3%) |
| 5 or more Children | 0 (0.0%) | 6 (100.0%) |
| Total | 21 (5.8%) | 103 (30.6%) |
Employment Characteristics in Harrisburg
Employment by Class of Employer in Harrisburg
Among the 994 employed individuals in Harrisburg, private company employees (737 | 74.1%), local government employees (104 | 10.5%), and not-for-profit organizations (46 | 4.6%) make up the most common classes of employment.
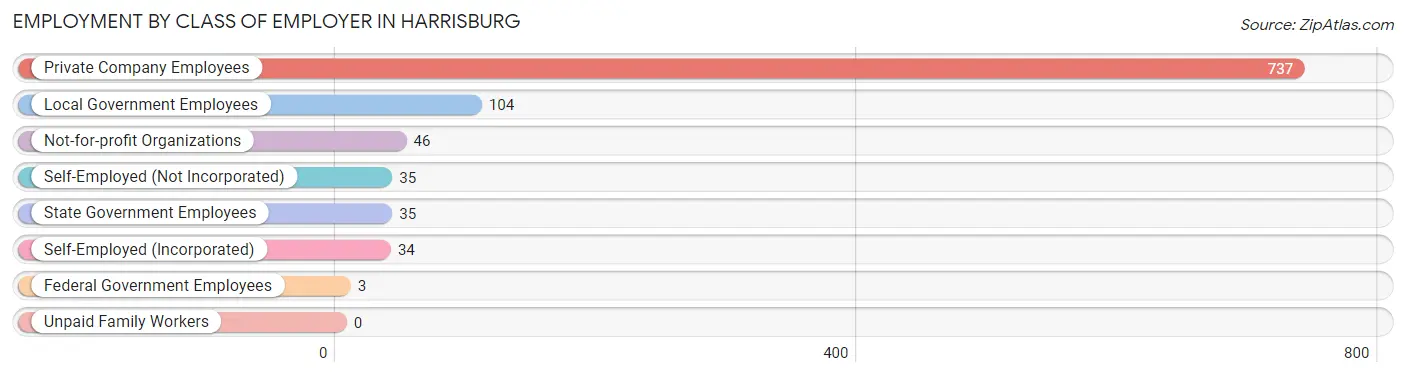
| Employer Class | # Employees | % Employees |
| Private Company Employees | 737 | 74.1% |
| Self-Employed (Incorporated) | 34 | 3.4% |
| Self-Employed (Not Incorporated) | 35 | 3.5% |
| Not-for-profit Organizations | 46 | 4.6% |
| Local Government Employees | 104 | 10.5% |
| State Government Employees | 35 | 3.5% |
| Federal Government Employees | 3 | 0.3% |
| Unpaid Family Workers | 0 | 0.0% |
| Total | 994 | 100.0% |
Employment Status by Age in Harrisburg
According to the labor force statistics for Harrisburg, out of the total population over 16 years of age (2,124), 51.4% or 1,092 individuals are in the labor force, with 6.5% or 71 of them unemployed. The age group with the highest labor force participation rate is 45 to 54 years, with 89.7% or 243 individuals in the labor force. Within the labor force, the 30 to 34 years age range has the highest percentage of unemployed individuals, with 29.4% or 20 of them being unemployed.
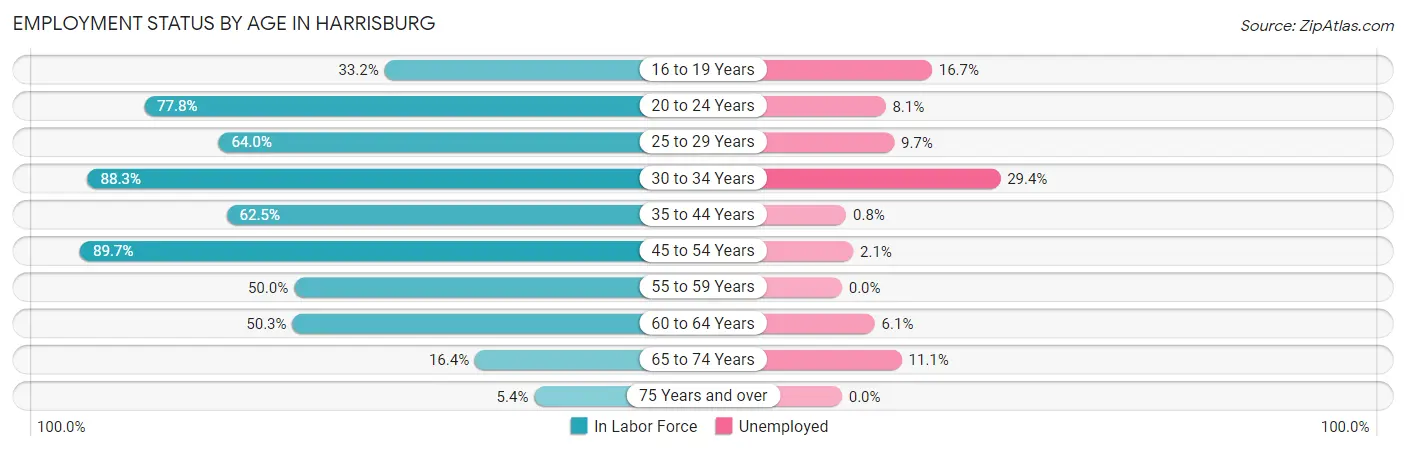
| Age Bracket | In Labor Force | Unemployed |
| 16 to 19 Years | 84 (33.2%) | 14 (16.7%) |
| 20 to 24 Years | 123 (77.8%) | 10 (8.1%) |
| 25 to 29 Years | 103 (64.0%) | 10 (9.7%) |
| 30 to 34 Years | 68 (88.3%) | 20 (29.4%) |
| 35 to 44 Years | 255 (62.5%) | 2 (0.8%) |
| 45 to 54 Years | 243 (89.7%) | 5 (2.1%) |
| 55 to 59 Years | 77 (50.0%) | 0 (0.0%) |
| 60 to 64 Years | 82 (50.3%) | 5 (6.1%) |
| 65 to 74 Years | 45 (16.4%) | 5 (11.1%) |
| 75 Years and over | 11 (5.4%) | 0 (0.0%) |
| Total | 1,092 (51.4%) | 71 (6.5%) |
Employment Status by Educational Attainment in Harrisburg
According to labor force statistics for Harrisburg, 67.1% of individuals (828) out of the total population between 25 and 64 years of age (1,234) are in the labor force, with 5.1% or 42 of them being unemployed. The group with the highest labor force participation rate are those with the educational attainment of bachelor's degree or higher, with 90.1% or 128 individuals in the labor force. Within the labor force, individuals with less than high school education have the highest percentage of unemployment, with 15.0% or 12 of them being unemployed.
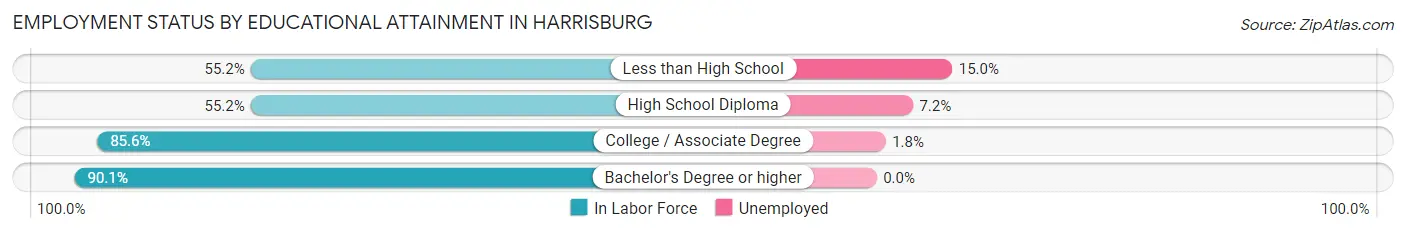
| Educational Attainment | In Labor Force | Unemployed |
| Less than High School | 80 (55.2%) | 22 (15.0%) |
| High School Diploma | 346 (55.2%) | 45 (7.2%) |
| College / Associate Degree | 274 (85.6%) | 6 (1.8%) |
| Bachelor's Degree or higher | 128 (90.1%) | 0 (0.0%) |
| Total | 828 (67.1%) | 63 (5.1%) |
Employment Occupations by Sex in Harrisburg
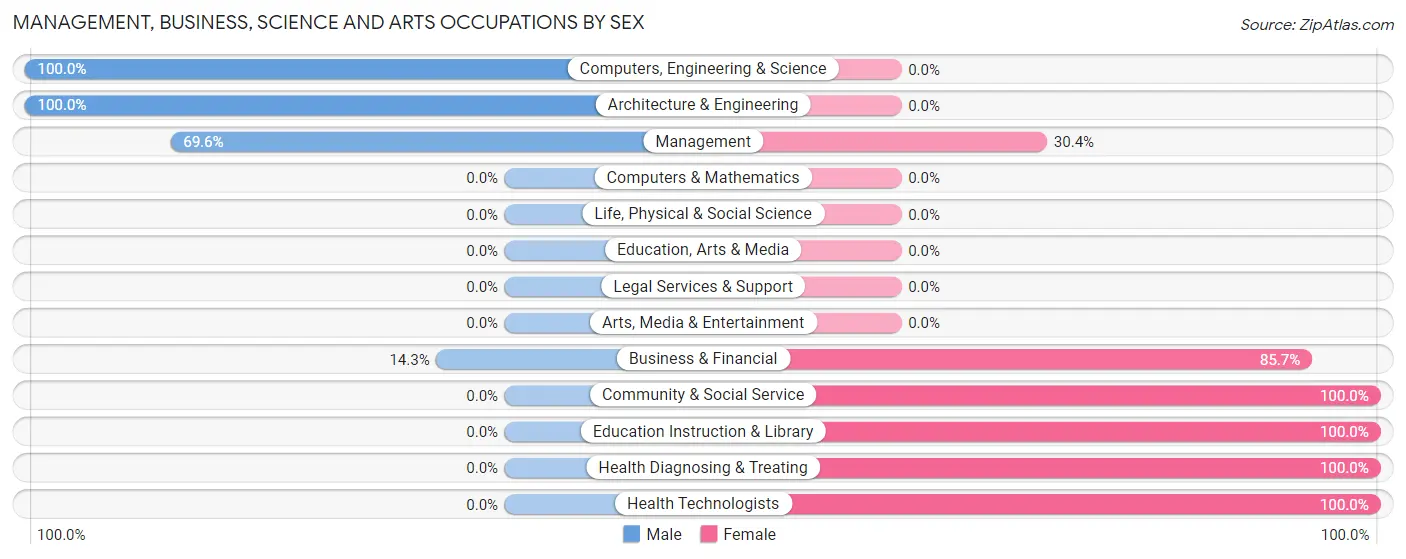
Management, Business, Science and Arts Occupations
The most common Management, Business, Science and Arts occupations in Harrisburg are Management (125 | 12.2%), Health Diagnosing & Treating (106 | 10.4%), Health Technologists (79 | 7.7%), Community & Social Service (41 | 4.0%), and Education Instruction & Library (41 | 4.0%).
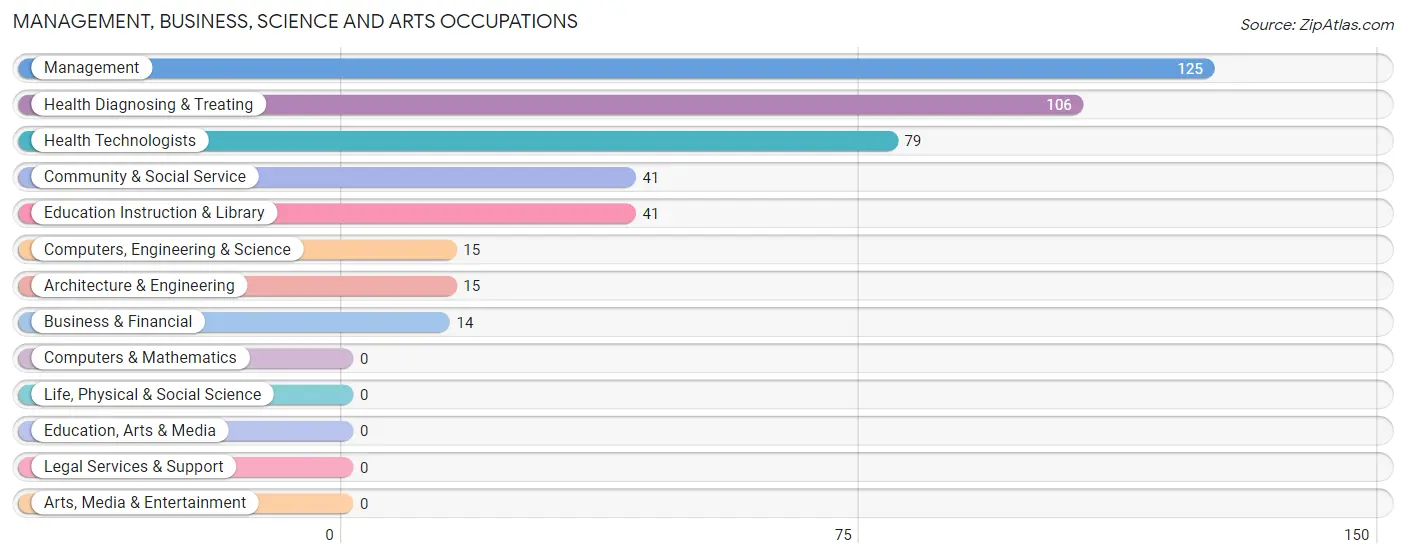
Management, Business, Science and Arts Occupations by Sex
Within the Management, Business, Science and Arts occupations in Harrisburg, the most male-oriented occupations are Computers, Engineering & Science (100.0%), Architecture & Engineering (100.0%), and Management (69.6%), while the most female-oriented occupations are Community & Social Service (100.0%), Education Instruction & Library (100.0%), and Health Diagnosing & Treating (100.0%).
| Occupation | Male | Female |
| Management | 87 (69.6%) | 38 (30.4%) |
| Business & Financial | 2 (14.3%) | 12 (85.7%) |
| Computers, Engineering & Science | 15 (100.0%) | 0 (0.0%) |
| Computers & Mathematics | 0 (0.0%) | 0 (0.0%) |
| Architecture & Engineering | 15 (100.0%) | 0 (0.0%) |
| Life, Physical & Social Science | 0 (0.0%) | 0 (0.0%) |
| Community & Social Service | 0 (0.0%) | 41 (100.0%) |
| Education, Arts & Media | 0 (0.0%) | 0 (0.0%) |
| Legal Services & Support | 0 (0.0%) | 0 (0.0%) |
| Education Instruction & Library | 0 (0.0%) | 41 (100.0%) |
| Arts, Media & Entertainment | 0 (0.0%) | 0 (0.0%) |
| Health Diagnosing & Treating | 0 (0.0%) | 106 (100.0%) |
| Health Technologists | 0 (0.0%) | 79 (100.0%) |
| Total (Category) | 104 (34.5%) | 197 (65.4%) |
| Total (Overall) | 529 (51.9%) | 491 (48.1%) |
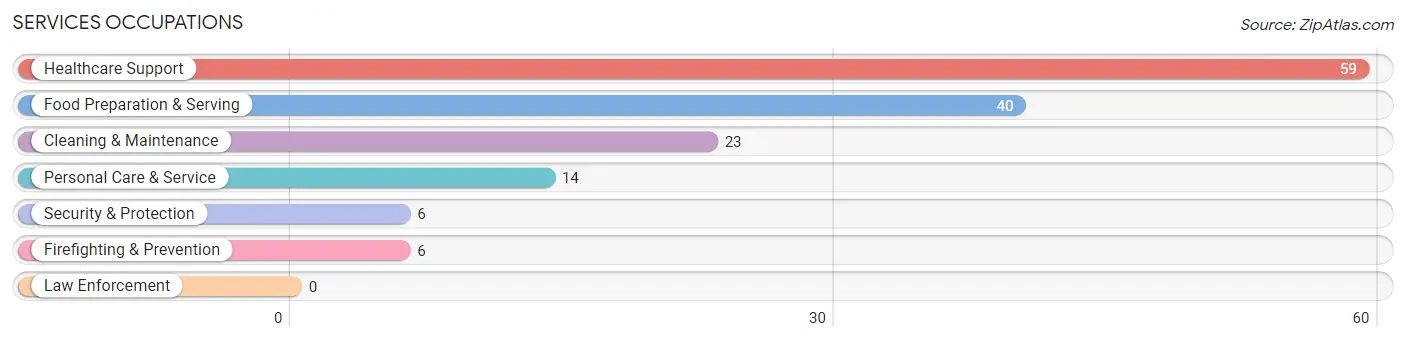
Services Occupations
The most common Services occupations in Harrisburg are Healthcare Support (59 | 5.8%), Food Preparation & Serving (40 | 3.9%), Cleaning & Maintenance (23 | 2.2%), Personal Care & Service (14 | 1.4%), and Security & Protection (6 | 0.6%).
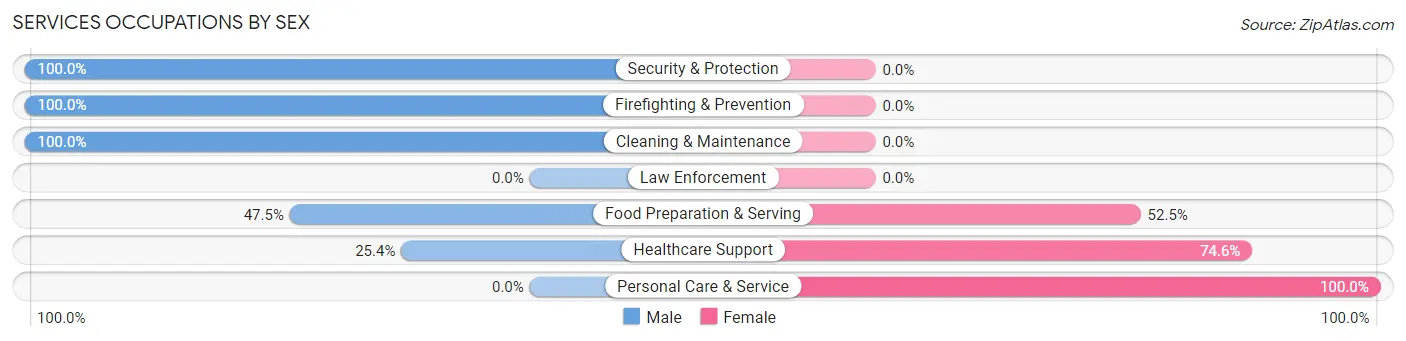
Services Occupations by Sex
Within the Services occupations in Harrisburg, the most male-oriented occupations are Security & Protection (100.0%), Firefighting & Prevention (100.0%), and Cleaning & Maintenance (100.0%), while the most female-oriented occupations are Personal Care & Service (100.0%), Healthcare Support (74.6%), and Food Preparation & Serving (52.5%).
| Occupation | Male | Female |
| Healthcare Support | 15 (25.4%) | 44 (74.6%) |
| Security & Protection | 6 (100.0%) | 0 (0.0%) |
| Firefighting & Prevention | 6 (100.0%) | 0 (0.0%) |
| Law Enforcement | 0 (0.0%) | 0 (0.0%) |
| Food Preparation & Serving | 19 (47.5%) | 21 (52.5%) |
| Cleaning & Maintenance | 23 (100.0%) | 0 (0.0%) |
| Personal Care & Service | 0 (0.0%) | 14 (100.0%) |
| Total (Category) | 63 (44.4%) | 79 (55.6%) |
| Total (Overall) | 529 (51.9%) | 491 (48.1%) |
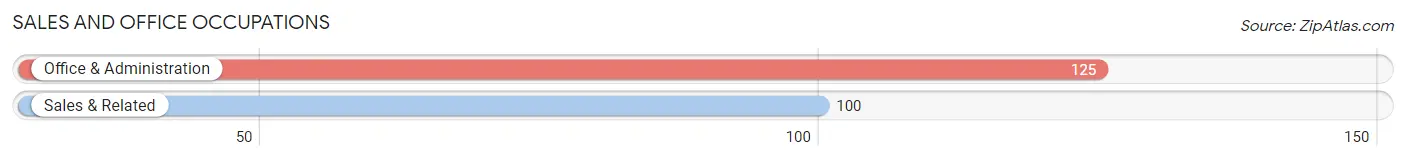
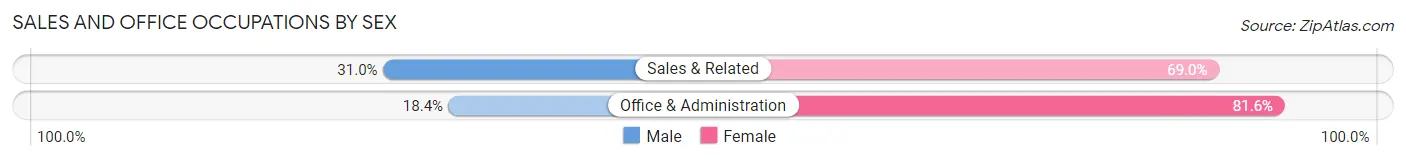
Sales and Office Occupations
The most common Sales and Office occupations in Harrisburg are Office & Administration (125 | 12.2%), and Sales & Related (100 | 9.8%).
Sales and Office Occupations by Sex
| Occupation | Male | Female |
| Sales & Related | 31 (31.0%) | 69 (69.0%) |
| Office & Administration | 23 (18.4%) | 102 (81.6%) |
| Total (Category) | 54 (24.0%) | 171 (76.0%) |
| Total (Overall) | 529 (51.9%) | 491 (48.1%) |
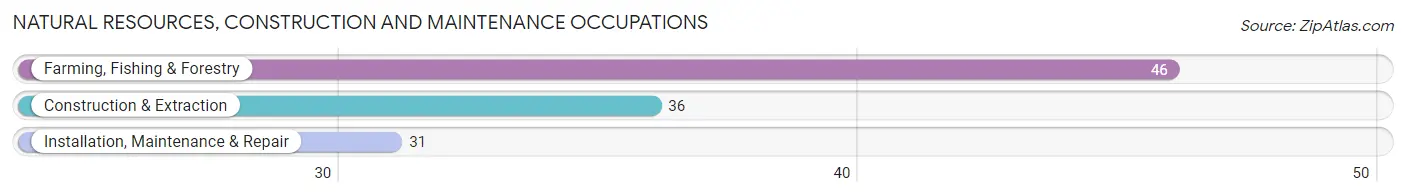
Natural Resources, Construction and Maintenance Occupations
The most common Natural Resources, Construction and Maintenance occupations in Harrisburg are Farming, Fishing & Forestry (46 | 4.5%), Construction & Extraction (36 | 3.5%), and Installation, Maintenance & Repair (31 | 3.0%).
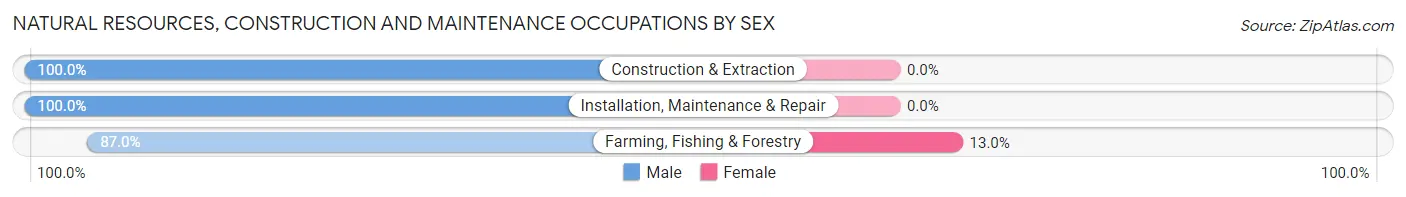
Natural Resources, Construction and Maintenance Occupations by Sex
| Occupation | Male | Female |
| Farming, Fishing & Forestry | 40 (87.0%) | 6 (13.0%) |
| Construction & Extraction | 36 (100.0%) | 0 (0.0%) |
| Installation, Maintenance & Repair | 31 (100.0%) | 0 (0.0%) |
| Total (Category) | 107 (94.7%) | 6 (5.3%) |
| Total (Overall) | 529 (51.9%) | 491 (48.1%) |
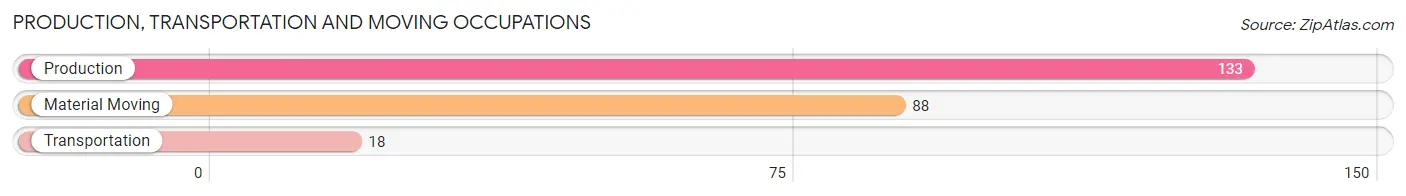
Production, Transportation and Moving Occupations
The most common Production, Transportation and Moving occupations in Harrisburg are Production (133 | 13.0%), Material Moving (88 | 8.6%), and Transportation (18 | 1.8%).
Production, Transportation and Moving Occupations by Sex
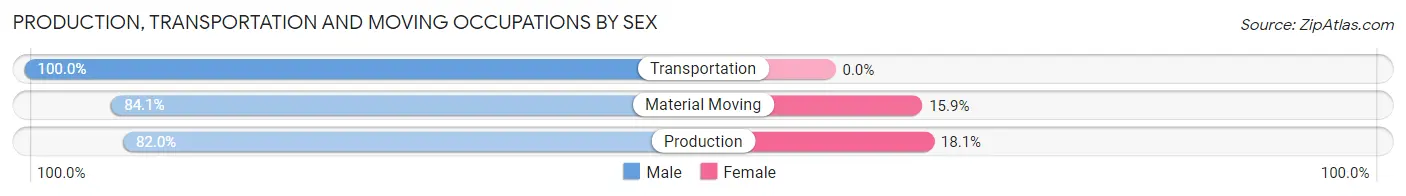
| Occupation | Male | Female |
| Production | 109 (82.0%) | 24 (18.0%) |
| Transportation | 18 (100.0%) | 0 (0.0%) |
| Material Moving | 74 (84.1%) | 14 (15.9%) |
| Total (Category) | 201 (84.1%) | 38 (15.9%) |
| Total (Overall) | 529 (51.9%) | 491 (48.1%) |
Employment Industries by Sex in Harrisburg
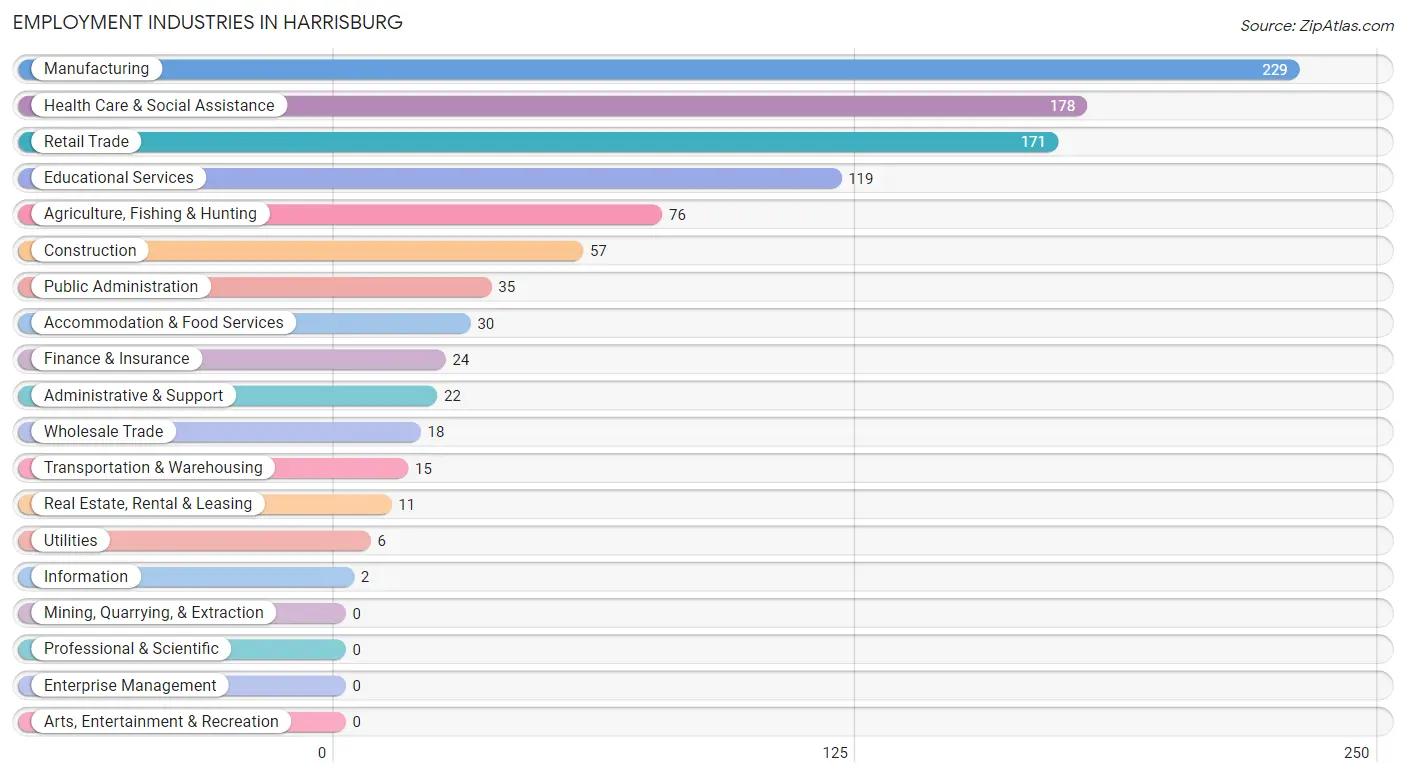
Employment Industries in Harrisburg
The major employment industries in Harrisburg include Manufacturing (229 | 22.5%), Health Care & Social Assistance (178 | 17.4%), Retail Trade (171 | 16.8%), Educational Services (119 | 11.7%), and Agriculture, Fishing & Hunting (76 | 7.4%).
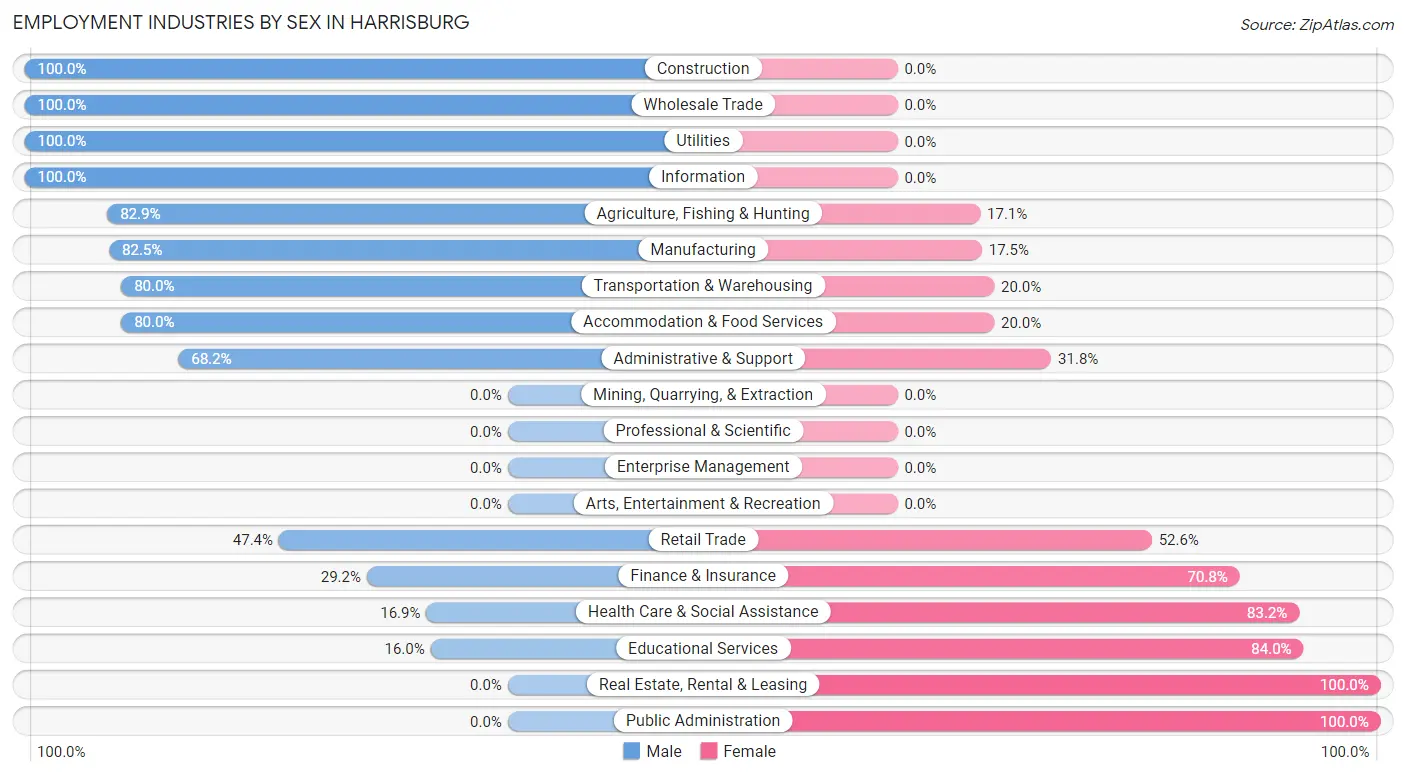
Employment Industries by Sex in Harrisburg
The Harrisburg industries that see more men than women are Construction (100.0%), Wholesale Trade (100.0%), and Utilities (100.0%), whereas the industries that tend to have a higher number of women are Real Estate, Rental & Leasing (100.0%), Public Administration (100.0%), and Educational Services (84.0%).
| Industry | Male | Female |
| Agriculture, Fishing & Hunting | 63 (82.9%) | 13 (17.1%) |
| Mining, Quarrying, & Extraction | 0 (0.0%) | 0 (0.0%) |
| Construction | 57 (100.0%) | 0 (0.0%) |
| Manufacturing | 189 (82.5%) | 40 (17.5%) |
| Wholesale Trade | 18 (100.0%) | 0 (0.0%) |
| Retail Trade | 81 (47.4%) | 90 (52.6%) |
| Transportation & Warehousing | 12 (80.0%) | 3 (20.0%) |
| Utilities | 6 (100.0%) | 0 (0.0%) |
| Information | 2 (100.0%) | 0 (0.0%) |
| Finance & Insurance | 7 (29.2%) | 17 (70.8%) |
| Real Estate, Rental & Leasing | 0 (0.0%) | 11 (100.0%) |
| Professional & Scientific | 0 (0.0%) | 0 (0.0%) |
| Enterprise Management | 0 (0.0%) | 0 (0.0%) |
| Administrative & Support | 15 (68.2%) | 7 (31.8%) |
| Educational Services | 19 (16.0%) | 100 (84.0%) |
| Health Care & Social Assistance | 30 (16.9%) | 148 (83.2%) |
| Arts, Entertainment & Recreation | 0 (0.0%) | 0 (0.0%) |
| Accommodation & Food Services | 24 (80.0%) | 6 (20.0%) |
| Public Administration | 0 (0.0%) | 35 (100.0%) |
| Total | 529 (51.9%) | 491 (48.1%) |
Education in Harrisburg
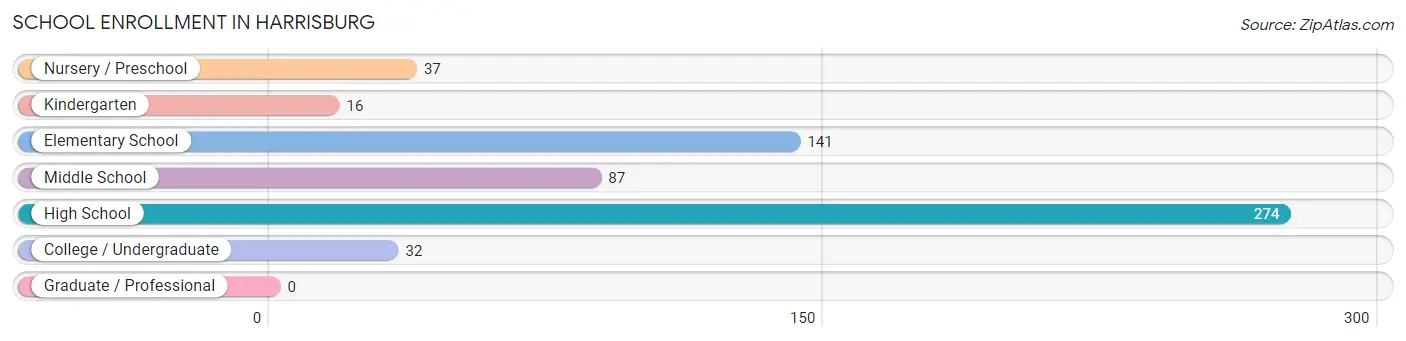
School Enrollment in Harrisburg
The most common levels of schooling among the 587 students in Harrisburg are high school (274 | 46.7%), elementary school (141 | 24.0%), and middle school (87 | 14.8%).
| School Level | # Students | % Students |
| Nursery / Preschool | 37 | 6.3% |
| Kindergarten | 16 | 2.7% |
| Elementary School | 141 | 24.0% |
| Middle School | 87 | 14.8% |
| High School | 274 | 46.7% |
| College / Undergraduate | 32 | 5.4% |
| Graduate / Professional | 0 | 0.0% |
| Total | 587 | 100.0% |
School Enrollment by Age by Funding Source in Harrisburg
Out of a total of 587 students who are enrolled in schools in Harrisburg, 41 (7.0%) attend a private institution, while the remaining 546 (93.0%) are enrolled in public schools. The age group of 18 to 19 year olds has the highest likelihood of being enrolled in private schools, with 18 (21.2% in the age bracket) enrolled. Conversely, the age group of 3 to 4 year olds has the lowest likelihood of being enrolled in a private school, with 24 (100.0% in the age bracket) attending a public institution.
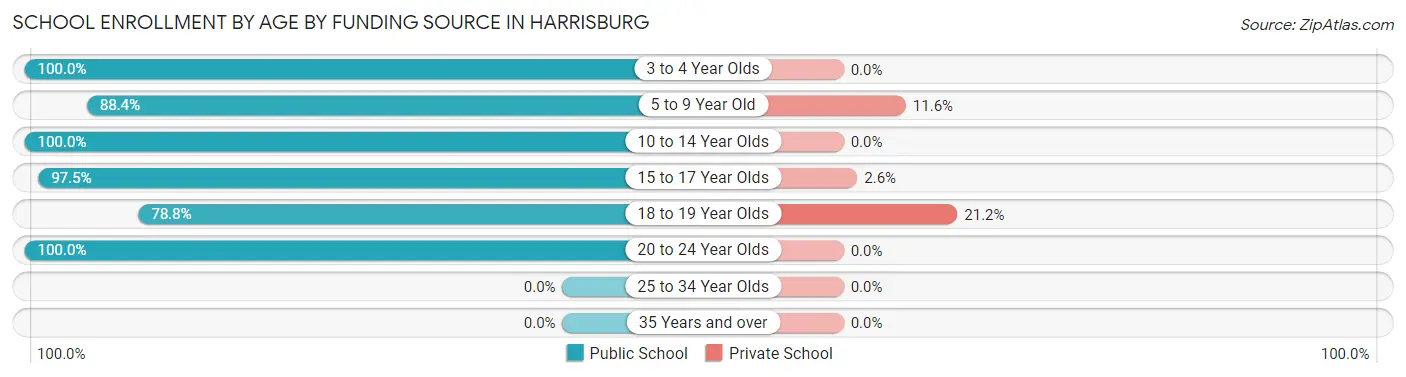
| Age Bracket | Public School | Private School |
| 3 to 4 Year Olds | 24 (100.0%) | 0 (0.0%) |
| 5 to 9 Year Old | 145 (88.4%) | 19 (11.6%) |
| 10 to 14 Year Olds | 144 (100.0%) | 0 (0.0%) |
| 15 to 17 Year Olds | 153 (97.5%) | 4 (2.5%) |
| 18 to 19 Year Olds | 67 (78.8%) | 18 (21.2%) |
| 20 to 24 Year Olds | 13 (100.0%) | 0 (0.0%) |
| 25 to 34 Year Olds | 0 (0.0%) | 0 (0.0%) |
| 35 Years and over | 0 (0.0%) | 0 (0.0%) |
| Total | 546 (93.0%) | 41 (7.0%) |
Educational Attainment by Field of Study in Harrisburg
Science & technology (55 | 27.1%), business (46 | 22.7%), engineering (25 | 12.3%), education (25 | 12.3%), and bio, nature & agricultural (19 | 9.4%) are the most common fields of study among 203 individuals in Harrisburg who have obtained a bachelor's degree or higher.
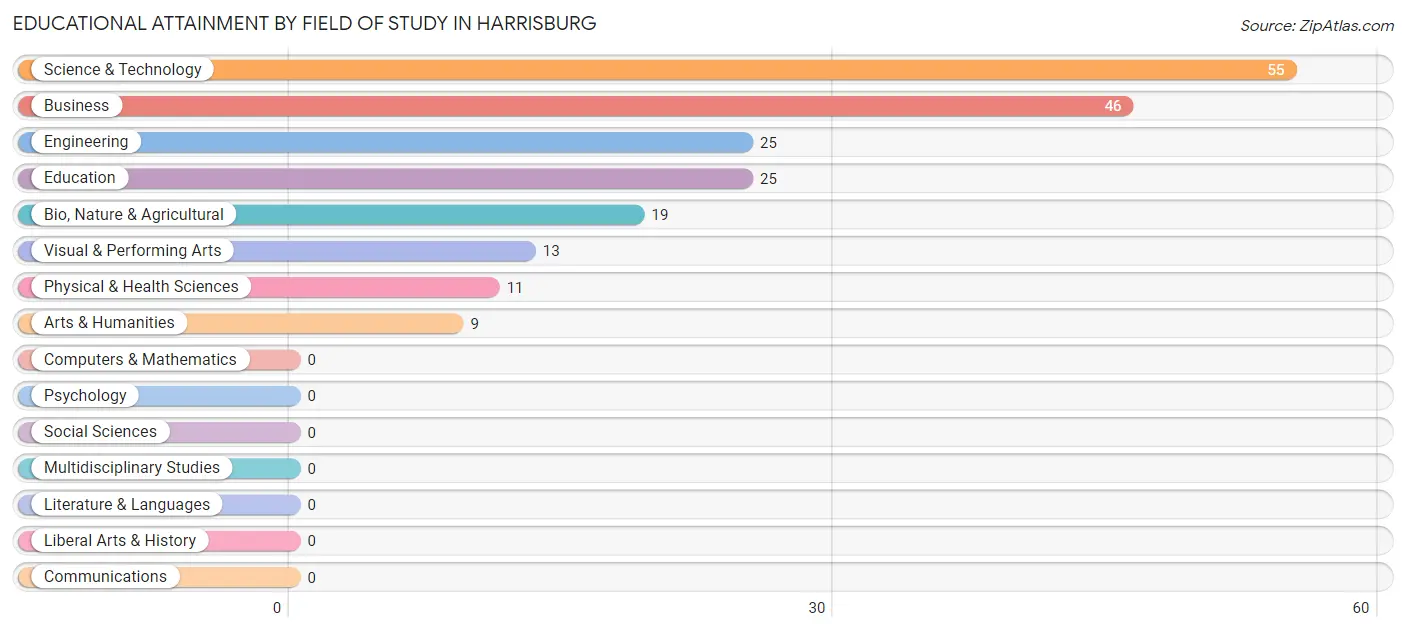
| Field of Study | # Graduates | % Graduates |
| Computers & Mathematics | 0 | 0.0% |
| Bio, Nature & Agricultural | 19 | 9.4% |
| Physical & Health Sciences | 11 | 5.4% |
| Psychology | 0 | 0.0% |
| Social Sciences | 0 | 0.0% |
| Engineering | 25 | 12.3% |
| Multidisciplinary Studies | 0 | 0.0% |
| Science & Technology | 55 | 27.1% |
| Business | 46 | 22.7% |
| Education | 25 | 12.3% |
| Literature & Languages | 0 | 0.0% |
| Liberal Arts & History | 0 | 0.0% |
| Visual & Performing Arts | 13 | 6.4% |
| Communications | 0 | 0.0% |
| Arts & Humanities | 9 | 4.4% |
| Total | 203 | 100.0% |
Transportation & Commute in Harrisburg
Vehicle Availability by Sex in Harrisburg
The most prevalent vehicle ownership categories in Harrisburg are males with 2 vehicles (228, accounting for 43.3%) and females with 2 vehicles (204, making up 49.0%).
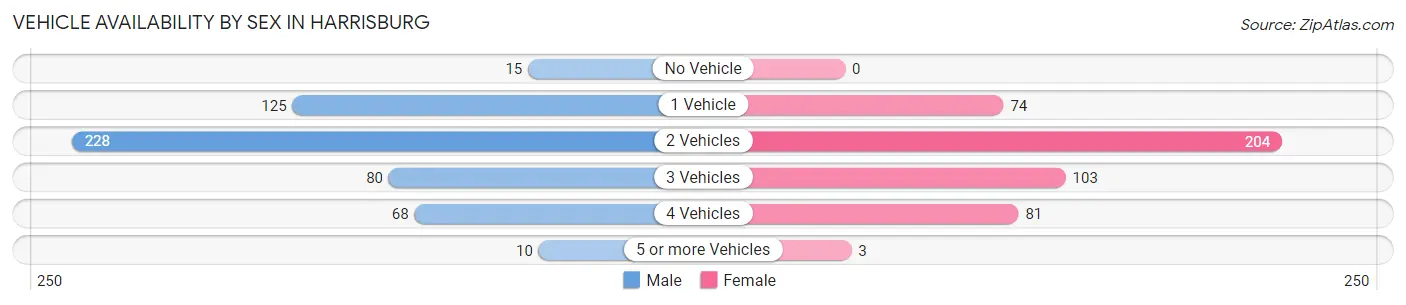
| Vehicles Available | Male | Female |
| No Vehicle | 15 (2.9%) | 0 (0.0%) |
| 1 Vehicle | 125 (23.8%) | 74 (15.9%) |
| 2 Vehicles | 228 (43.3%) | 204 (43.9%) |
| 3 Vehicles | 80 (15.2%) | 103 (22.2%) |
| 4 Vehicles | 68 (12.9%) | 81 (17.4%) |
| 5 or more Vehicles | 10 (1.9%) | 3 (0.6%) |
| Total | 526 (100.0%) | 465 (100.0%) |
Commute Time in Harrisburg
The most frequently occuring commute durations in Harrisburg are 30 to 34 minutes (209 commuters, 21.5%), 5 to 9 minutes (172 commuters, 17.7%), and less than 5 minutes (102 commuters, 10.5%).
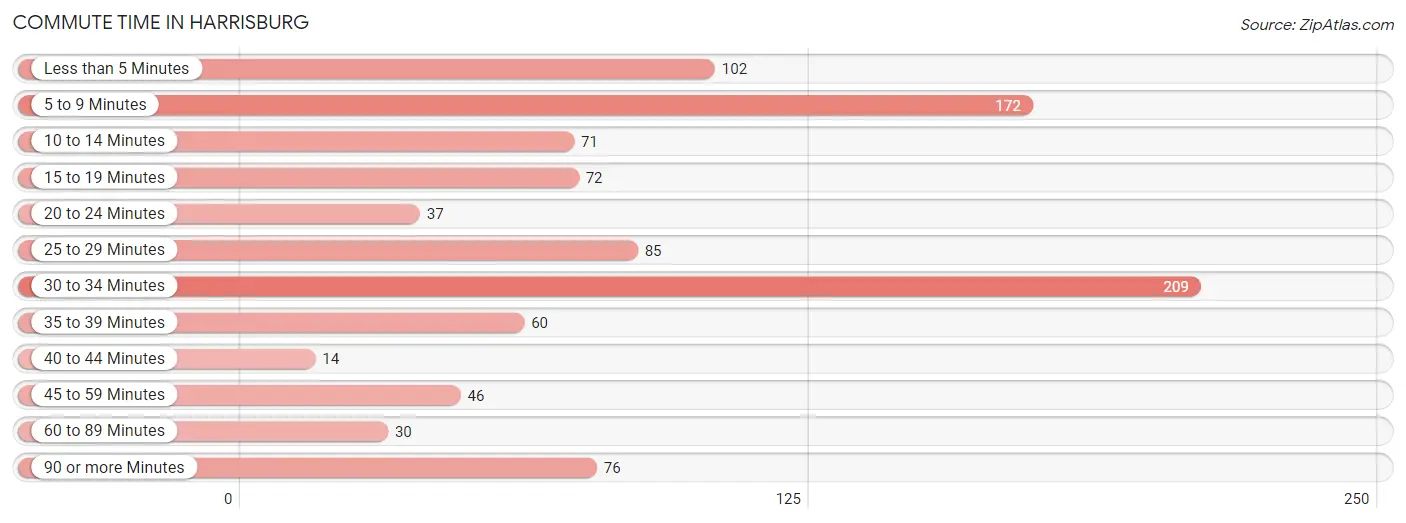
| Commute Time | # Commuters | % Commuters |
| Less than 5 Minutes | 102 | 10.5% |
| 5 to 9 Minutes | 172 | 17.7% |
| 10 to 14 Minutes | 71 | 7.3% |
| 15 to 19 Minutes | 72 | 7.4% |
| 20 to 24 Minutes | 37 | 3.8% |
| 25 to 29 Minutes | 85 | 8.7% |
| 30 to 34 Minutes | 209 | 21.5% |
| 35 to 39 Minutes | 60 | 6.2% |
| 40 to 44 Minutes | 14 | 1.4% |
| 45 to 59 Minutes | 46 | 4.7% |
| 60 to 89 Minutes | 30 | 3.1% |
| 90 or more Minutes | 76 | 7.8% |
Commute Time by Sex in Harrisburg
The most common commute times in Harrisburg are 30 to 34 minutes (125 commuters, 23.6%) for males and 5 to 9 minutes (94 commuters, 21.1%) for females.
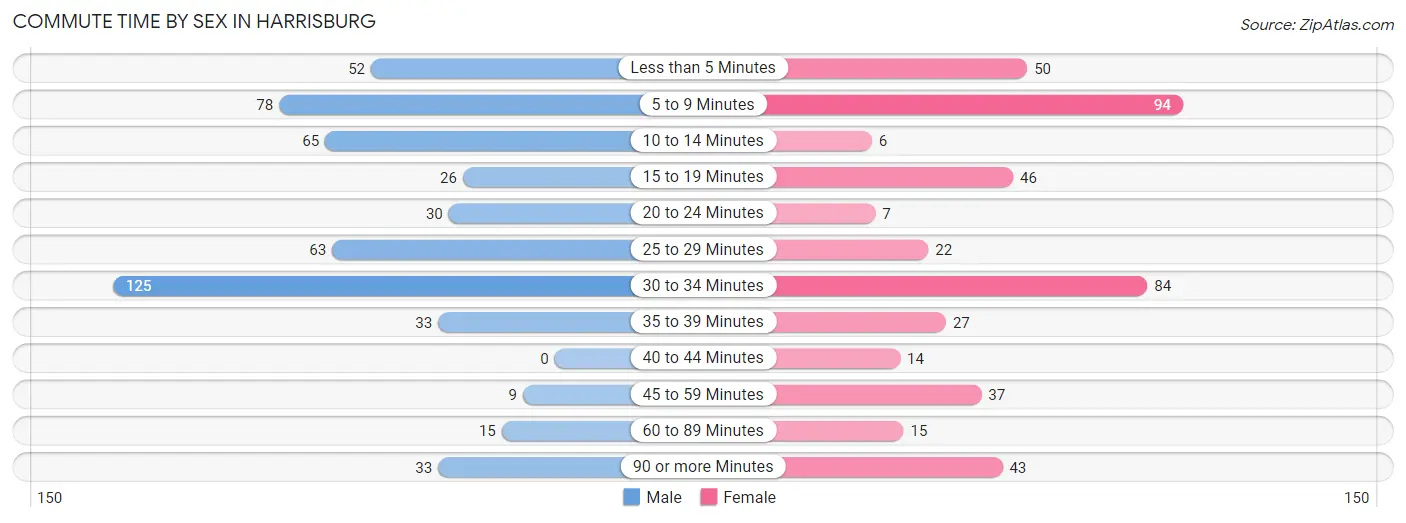
| Commute Time | Male | Female |
| Less than 5 Minutes | 52 (9.8%) | 50 (11.2%) |
| 5 to 9 Minutes | 78 (14.7%) | 94 (21.1%) |
| 10 to 14 Minutes | 65 (12.3%) | 6 (1.3%) |
| 15 to 19 Minutes | 26 (4.9%) | 46 (10.3%) |
| 20 to 24 Minutes | 30 (5.7%) | 7 (1.6%) |
| 25 to 29 Minutes | 63 (11.9%) | 22 (4.9%) |
| 30 to 34 Minutes | 125 (23.6%) | 84 (18.9%) |
| 35 to 39 Minutes | 33 (6.2%) | 27 (6.1%) |
| 40 to 44 Minutes | 0 (0.0%) | 14 (3.2%) |
| 45 to 59 Minutes | 9 (1.7%) | 37 (8.3%) |
| 60 to 89 Minutes | 15 (2.8%) | 15 (3.4%) |
| 90 or more Minutes | 33 (6.2%) | 43 (9.7%) |
Time of Departure to Work by Sex in Harrisburg
The most frequent times of departure to work in Harrisburg are 12:00 AM to 4:59 AM (153, 28.9%) for males and 8:00 AM to 8:29 AM (101, 22.7%) for females.
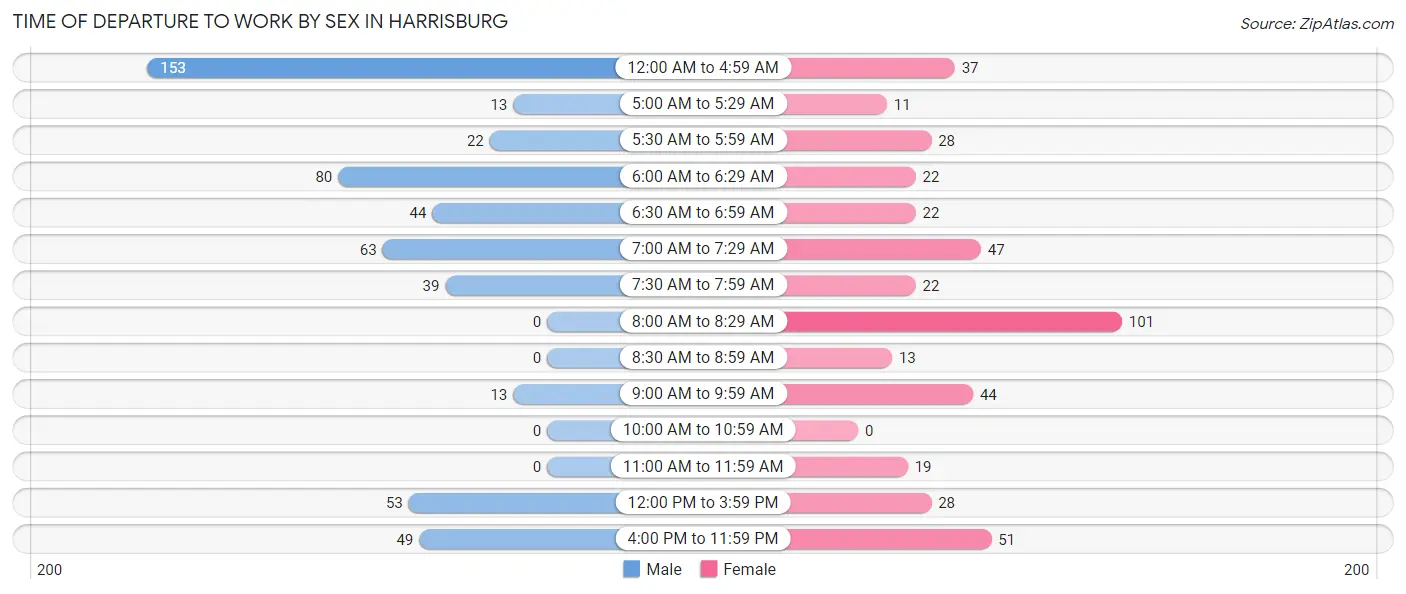
| Time of Departure | Male | Female |
| 12:00 AM to 4:59 AM | 153 (28.9%) | 37 (8.3%) |
| 5:00 AM to 5:29 AM | 13 (2.5%) | 11 (2.5%) |
| 5:30 AM to 5:59 AM | 22 (4.2%) | 28 (6.3%) |
| 6:00 AM to 6:29 AM | 80 (15.1%) | 22 (4.9%) |
| 6:30 AM to 6:59 AM | 44 (8.3%) | 22 (4.9%) |
| 7:00 AM to 7:29 AM | 63 (11.9%) | 47 (10.6%) |
| 7:30 AM to 7:59 AM | 39 (7.4%) | 22 (4.9%) |
| 8:00 AM to 8:29 AM | 0 (0.0%) | 101 (22.7%) |
| 8:30 AM to 8:59 AM | 0 (0.0%) | 13 (2.9%) |
| 9:00 AM to 9:59 AM | 13 (2.5%) | 44 (9.9%) |
| 10:00 AM to 10:59 AM | 0 (0.0%) | 0 (0.0%) |
| 11:00 AM to 11:59 AM | 0 (0.0%) | 19 (4.3%) |
| 12:00 PM to 3:59 PM | 53 (10.0%) | 28 (6.3%) |
| 4:00 PM to 11:59 PM | 49 (9.3%) | 51 (11.5%) |
| Total | 529 (100.0%) | 445 (100.0%) |
Housing Occupancy in Harrisburg
Occupancy by Ownership in Harrisburg
Of the total 970 dwellings in Harrisburg, owner-occupied units account for 524 (54.0%), while renter-occupied units make up 446 (46.0%).
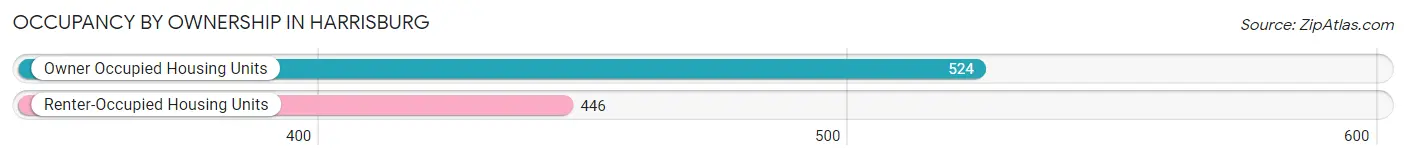
| Occupancy | # Housing Units | % Housing Units |
| Owner Occupied Housing Units | 524 | 54.0% |
| Renter-Occupied Housing Units | 446 | 46.0% |
| Total Occupied Housing Units | 970 | 100.0% |
Occupancy by Household Size in Harrisburg
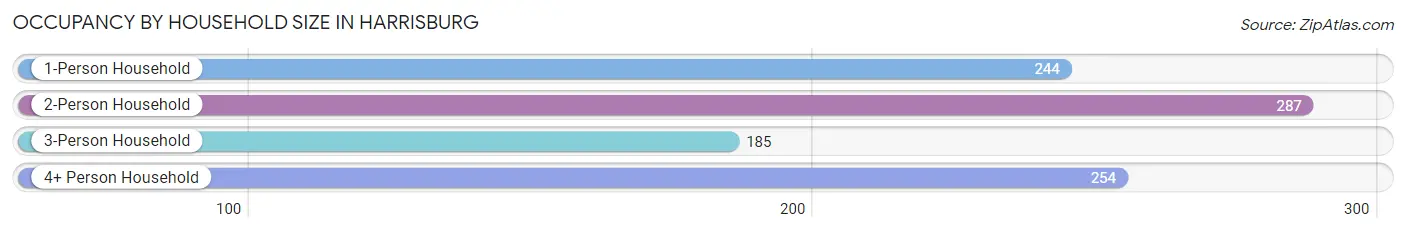
| Household Size | # Housing Units | % Housing Units |
| 1-Person Household | 244 | 25.2% |
| 2-Person Household | 287 | 29.6% |
| 3-Person Household | 185 | 19.1% |
| 4+ Person Household | 254 | 26.2% |
| Total Housing Units | 970 | 100.0% |
Occupancy by Ownership by Household Size in Harrisburg
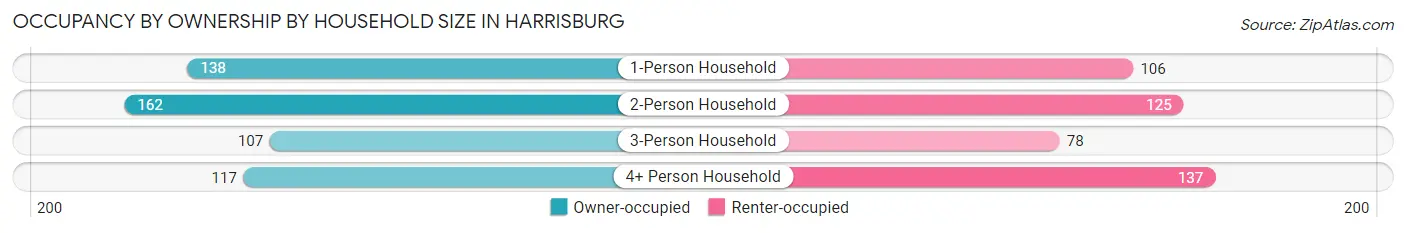
| Household Size | Owner-occupied | Renter-occupied |
| 1-Person Household | 138 (56.6%) | 106 (43.4%) |
| 2-Person Household | 162 (56.5%) | 125 (43.5%) |
| 3-Person Household | 107 (57.8%) | 78 (42.2%) |
| 4+ Person Household | 117 (46.1%) | 137 (53.9%) |
| Total Housing Units | 524 (54.0%) | 446 (46.0%) |
Occupancy by Educational Attainment in Harrisburg
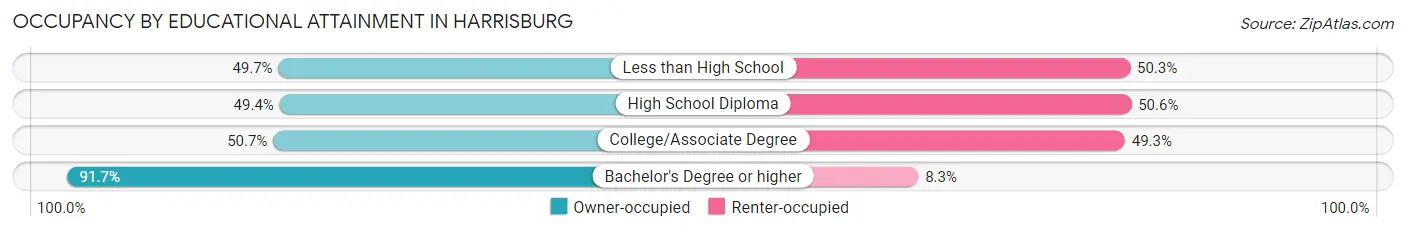
| Household Size | Owner-occupied | Renter-occupied |
| Less than High School | 76 (49.7%) | 77 (50.3%) |
| High School Diploma | 217 (49.4%) | 222 (50.6%) |
| College/Associate Degree | 143 (50.7%) | 139 (49.3%) |
| Bachelor's Degree or higher | 88 (91.7%) | 8 (8.3%) |
Occupancy by Age of Householder in Harrisburg
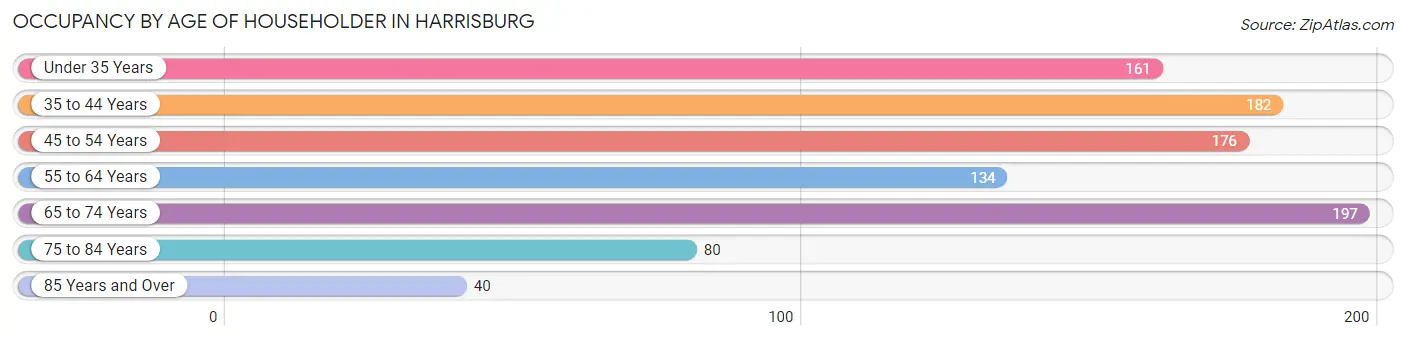
| Age Bracket | # Households | % Households |
| Under 35 Years | 161 | 16.6% |
| 35 to 44 Years | 182 | 18.8% |
| 45 to 54 Years | 176 | 18.1% |
| 55 to 64 Years | 134 | 13.8% |
| 65 to 74 Years | 197 | 20.3% |
| 75 to 84 Years | 80 | 8.3% |
| 85 Years and Over | 40 | 4.1% |
| Total | 970 | 100.0% |
Housing Finances in Harrisburg
Median Income by Occupancy in Harrisburg
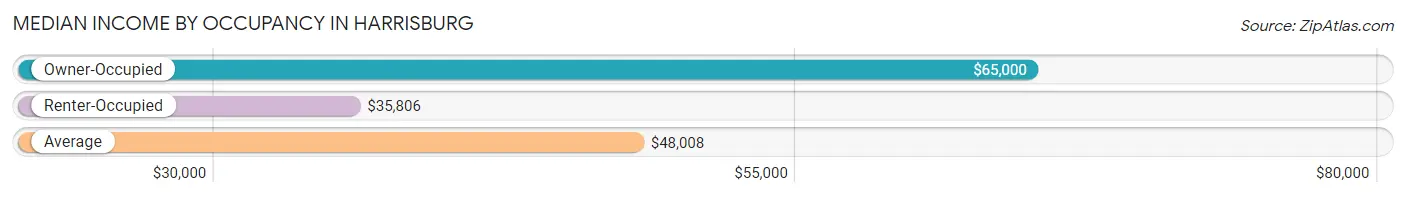
| Occupancy Type | # Households | Median Income |
| Owner-Occupied | 524 (54.0%) | $65,000 |
| Renter-Occupied | 446 (46.0%) | $35,806 |
| Average | 970 (100.0%) | $48,008 |
Occupancy by Householder Income Bracket in Harrisburg
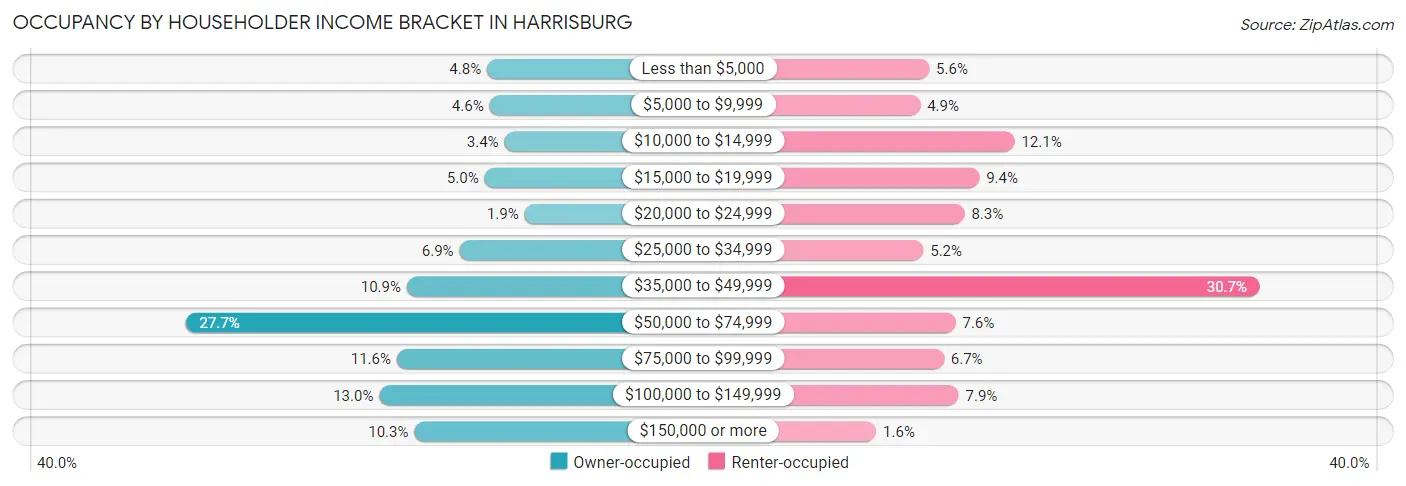
| Income Bracket | Owner-occupied | Renter-occupied |
| Less than $5,000 | 25 (4.8%) | 25 (5.6%) |
| $5,000 to $9,999 | 24 (4.6%) | 22 (4.9%) |
| $10,000 to $14,999 | 18 (3.4%) | 54 (12.1%) |
| $15,000 to $19,999 | 26 (5.0%) | 42 (9.4%) |
| $20,000 to $24,999 | 10 (1.9%) | 37 (8.3%) |
| $25,000 to $34,999 | 36 (6.9%) | 23 (5.2%) |
| $35,000 to $49,999 | 57 (10.9%) | 137 (30.7%) |
| $50,000 to $74,999 | 145 (27.7%) | 34 (7.6%) |
| $75,000 to $99,999 | 61 (11.6%) | 30 (6.7%) |
| $100,000 to $149,999 | 68 (13.0%) | 35 (7.9%) |
| $150,000 or more | 54 (10.3%) | 7 (1.6%) |
| Total | 524 (100.0%) | 446 (100.0%) |
Monthly Housing Cost Tiers in Harrisburg
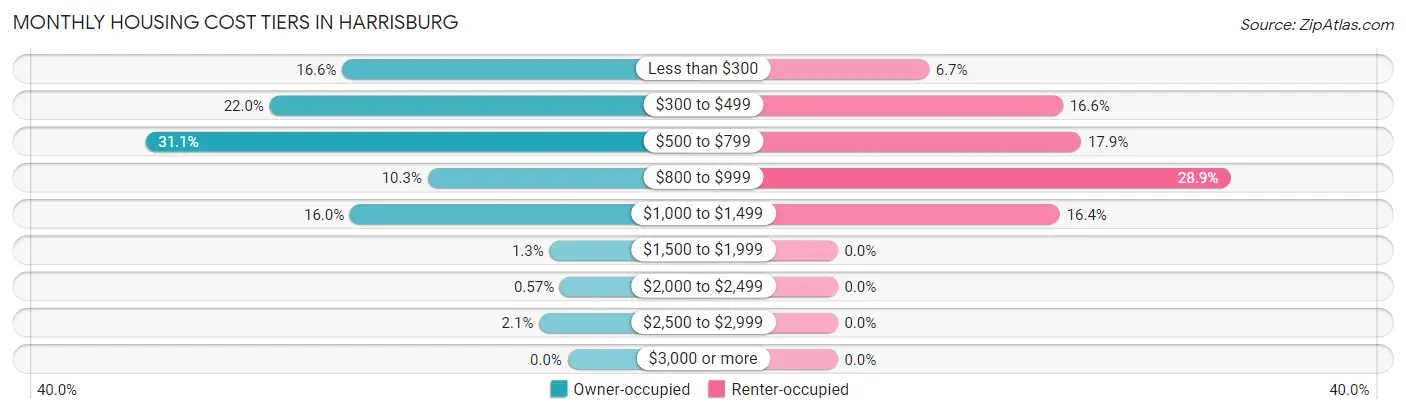
| Monthly Cost | Owner-occupied | Renter-occupied |
| Less than $300 | 87 (16.6%) | 30 (6.7%) |
| $300 to $499 | 115 (22.0%) | 74 (16.6%) |
| $500 to $799 | 163 (31.1%) | 80 (17.9%) |
| $800 to $999 | 54 (10.3%) | 129 (28.9%) |
| $1,000 to $1,499 | 84 (16.0%) | 73 (16.4%) |
| $1,500 to $1,999 | 7 (1.3%) | 0 (0.0%) |
| $2,000 to $2,499 | 3 (0.6%) | 0 (0.0%) |
| $2,500 to $2,999 | 11 (2.1%) | 0 (0.0%) |
| $3,000 or more | 0 (0.0%) | 0 (0.0%) |
| Total | 524 (100.0%) | 446 (100.0%) |
Physical Housing Characteristics in Harrisburg
Housing Structures in Harrisburg
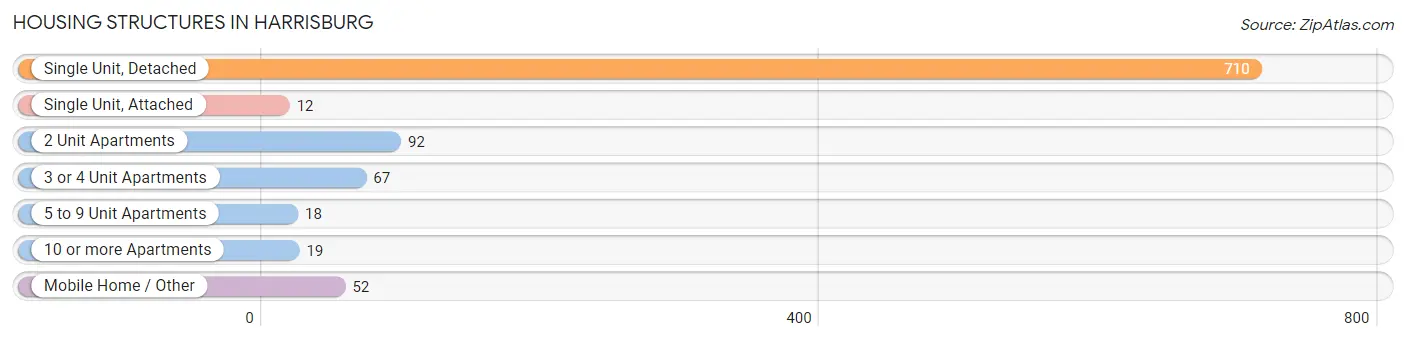
| Structure Type | # Housing Units | % Housing Units |
| Single Unit, Detached | 710 | 73.2% |
| Single Unit, Attached | 12 | 1.2% |
| 2 Unit Apartments | 92 | 9.5% |
| 3 or 4 Unit Apartments | 67 | 6.9% |
| 5 to 9 Unit Apartments | 18 | 1.9% |
| 10 or more Apartments | 19 | 2.0% |
| Mobile Home / Other | 52 | 5.4% |
| Total | 970 | 100.0% |
Housing Structures by Occupancy in Harrisburg
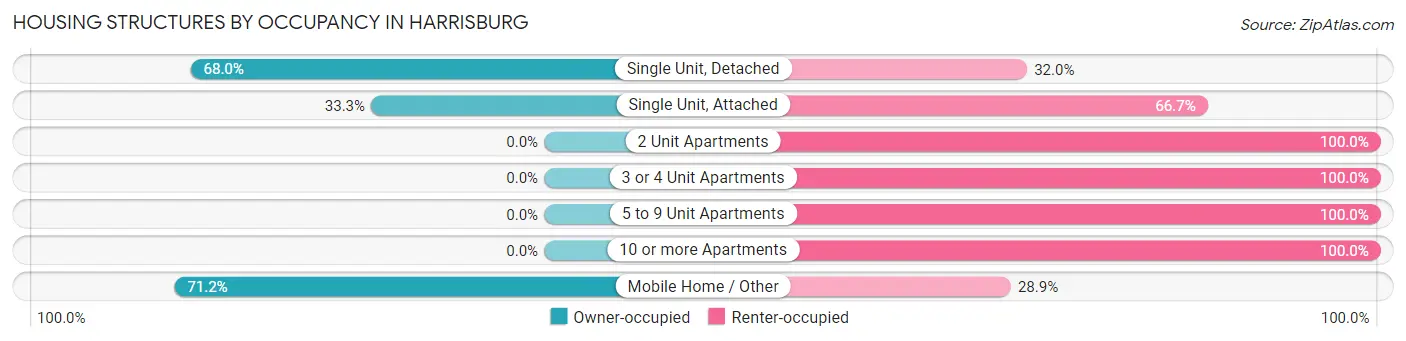
| Structure Type | Owner-occupied | Renter-occupied |
| Single Unit, Detached | 483 (68.0%) | 227 (32.0%) |
| Single Unit, Attached | 4 (33.3%) | 8 (66.7%) |
| 2 Unit Apartments | 0 (0.0%) | 92 (100.0%) |
| 3 or 4 Unit Apartments | 0 (0.0%) | 67 (100.0%) |
| 5 to 9 Unit Apartments | 0 (0.0%) | 18 (100.0%) |
| 10 or more Apartments | 0 (0.0%) | 19 (100.0%) |
| Mobile Home / Other | 37 (71.2%) | 15 (28.8%) |
| Total | 524 (54.0%) | 446 (46.0%) |
Housing Structures by Number of Rooms in Harrisburg
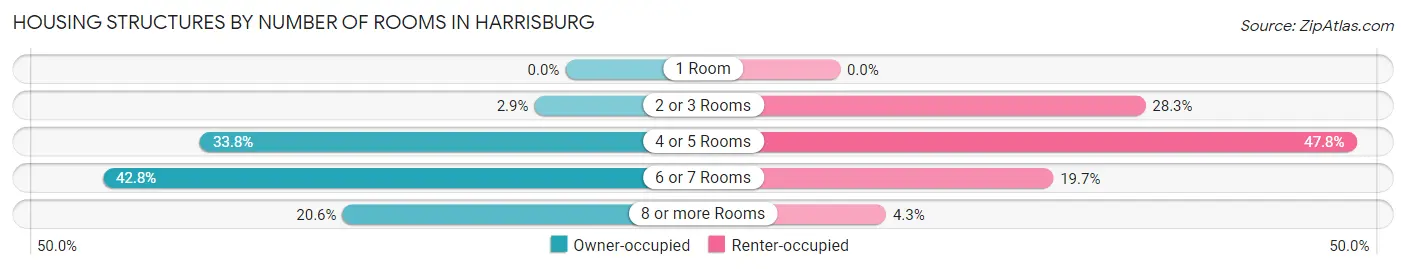
| Number of Rooms | Owner-occupied | Renter-occupied |
| 1 Room | 0 (0.0%) | 0 (0.0%) |
| 2 or 3 Rooms | 15 (2.9%) | 126 (28.2%) |
| 4 or 5 Rooms | 177 (33.8%) | 213 (47.8%) |
| 6 or 7 Rooms | 224 (42.7%) | 88 (19.7%) |
| 8 or more Rooms | 108 (20.6%) | 19 (4.3%) |
| Total | 524 (100.0%) | 446 (100.0%) |
Housing Structure by Heating Type in Harrisburg
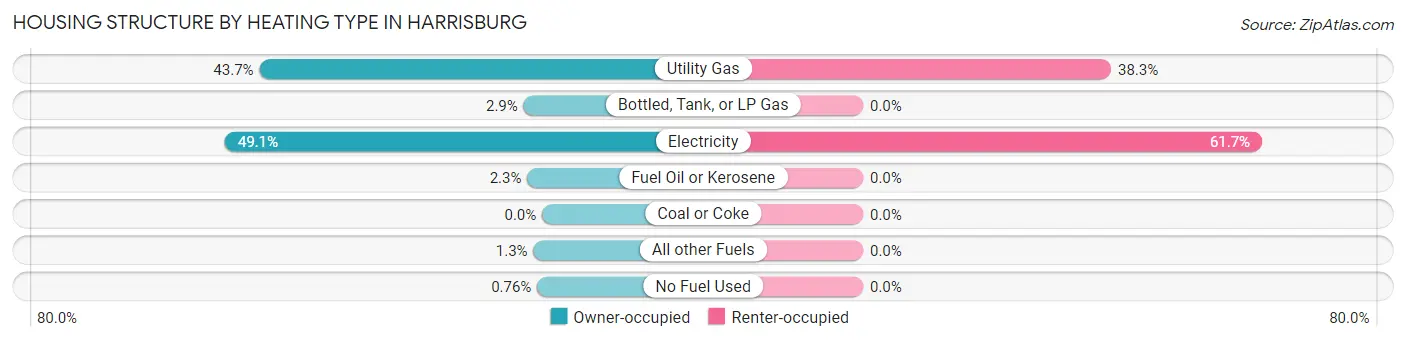
| Heating Type | Owner-occupied | Renter-occupied |
| Utility Gas | 229 (43.7%) | 171 (38.3%) |
| Bottled, Tank, or LP Gas | 15 (2.9%) | 0 (0.0%) |
| Electricity | 257 (49.0%) | 275 (61.7%) |
| Fuel Oil or Kerosene | 12 (2.3%) | 0 (0.0%) |
| Coal or Coke | 0 (0.0%) | 0 (0.0%) |
| All other Fuels | 7 (1.3%) | 0 (0.0%) |
| No Fuel Used | 4 (0.8%) | 0 (0.0%) |
| Total | 524 (100.0%) | 446 (100.0%) |
Household Vehicle Usage in Harrisburg
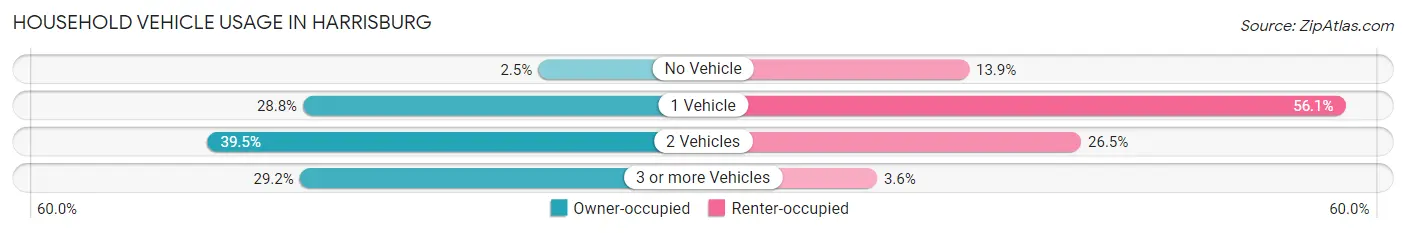
| Vehicles per Household | Owner-occupied | Renter-occupied |
| No Vehicle | 13 (2.5%) | 62 (13.9%) |
| 1 Vehicle | 151 (28.8%) | 250 (56.0%) |
| 2 Vehicles | 207 (39.5%) | 118 (26.5%) |
| 3 or more Vehicles | 153 (29.2%) | 16 (3.6%) |
| Total | 524 (100.0%) | 446 (100.0%) |
Real Estate & Mortgages in Harrisburg
Real Estate and Mortgage Overview in Harrisburg
| Characteristic | Without Mortgage | With Mortgage |
| Housing Units | 290 | 234 |
| Median Property Value | $100,500 | $111,400 |
| Median Household Income | $53,000 | $41 |
| Monthly Housing Costs | $376 | $0 |
| Real Estate Taxes | $483 | $0 |
Property Value by Mortgage Status in Harrisburg
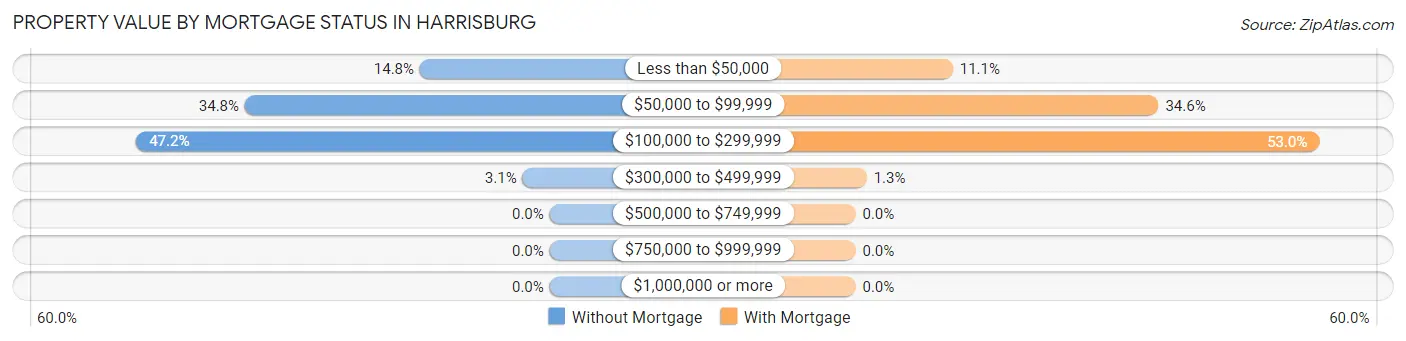
| Property Value | Without Mortgage | With Mortgage |
| Less than $50,000 | 43 (14.8%) | 26 (11.1%) |
| $50,000 to $99,999 | 101 (34.8%) | 81 (34.6%) |
| $100,000 to $299,999 | 137 (47.2%) | 124 (53.0%) |
| $300,000 to $499,999 | 9 (3.1%) | 3 (1.3%) |
| $500,000 to $749,999 | 0 (0.0%) | 0 (0.0%) |
| $750,000 to $999,999 | 0 (0.0%) | 0 (0.0%) |
| $1,000,000 or more | 0 (0.0%) | 0 (0.0%) |
| Total | 290 (100.0%) | 234 (100.0%) |
Household Income by Mortgage Status in Harrisburg
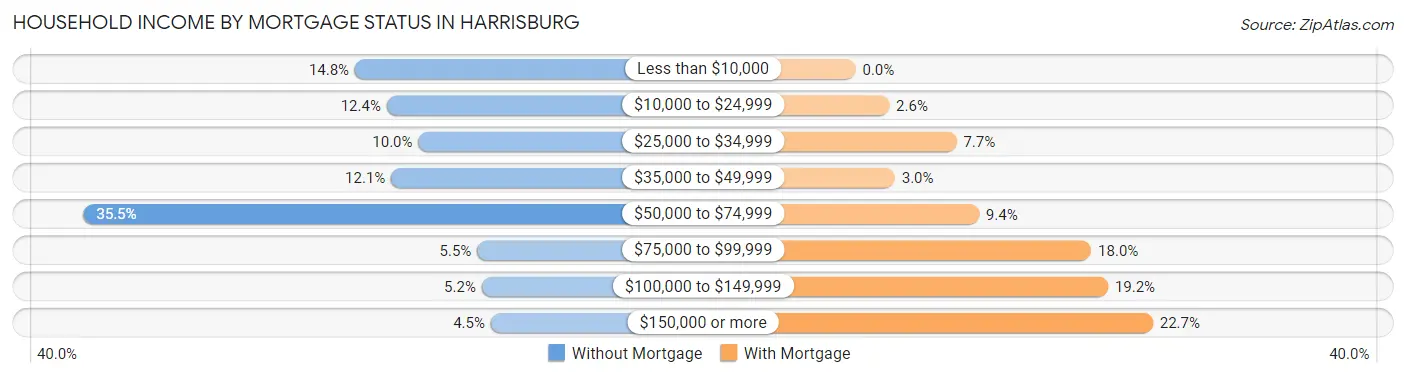
| Household Income | Without Mortgage | With Mortgage |
| Less than $10,000 | 43 (14.8%) | 0 (0.0%) |
| $10,000 to $24,999 | 36 (12.4%) | 6 (2.6%) |
| $25,000 to $34,999 | 29 (10.0%) | 18 (7.7%) |
| $35,000 to $49,999 | 35 (12.1%) | 7 (3.0%) |
| $50,000 to $74,999 | 103 (35.5%) | 22 (9.4%) |
| $75,000 to $99,999 | 16 (5.5%) | 42 (17.9%) |
| $100,000 to $149,999 | 15 (5.2%) | 45 (19.2%) |
| $150,000 or more | 13 (4.5%) | 53 (22.7%) |
| Total | 290 (100.0%) | 234 (100.0%) |
Property Value to Household Income Ratio in Harrisburg
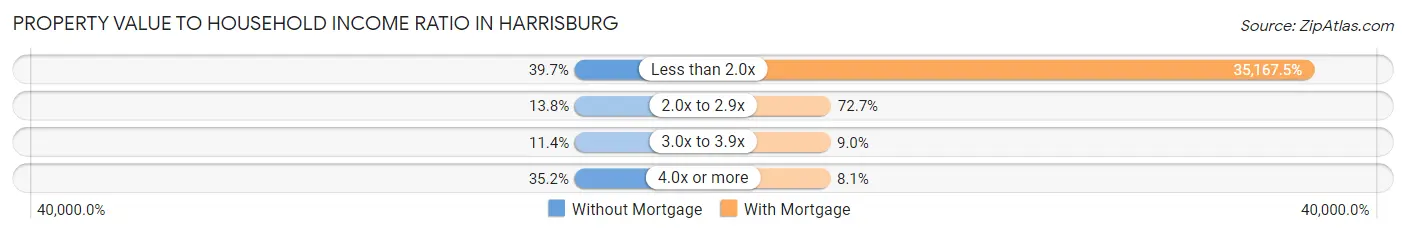
| Value-to-Income Ratio | Without Mortgage | With Mortgage |
| Less than 2.0x | 115 (39.7%) | 82,292 (35,167.5%) |
| 2.0x to 2.9x | 40 (13.8%) | 170 (72.7%) |
| 3.0x to 3.9x | 33 (11.4%) | 21 (9.0%) |
| 4.0x or more | 102 (35.2%) | 19 (8.1%) |
| Total | 290 (100.0%) | 234 (100.0%) |
Real Estate Taxes by Mortgage Status in Harrisburg
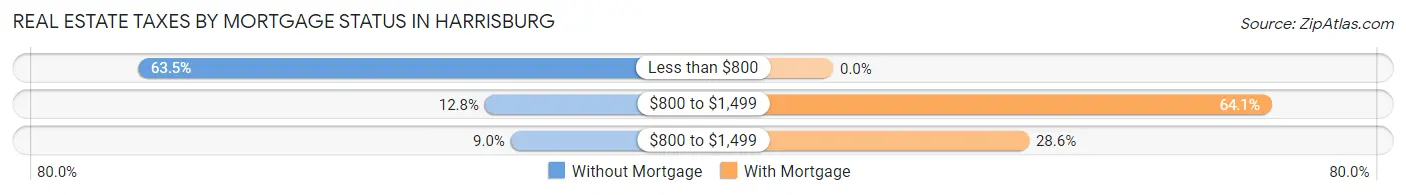
| Property Taxes | Without Mortgage | With Mortgage |
| Less than $800 | 184 (63.4%) | 0 (0.0%) |
| $800 to $1,499 | 37 (12.8%) | 150 (64.1%) |
| $800 to $1,499 | 26 (9.0%) | 67 (28.6%) |
| Total | 290 (100.0%) | 234 (100.0%) |
Health & Disability in Harrisburg
Health Insurance Coverage by Age in Harrisburg
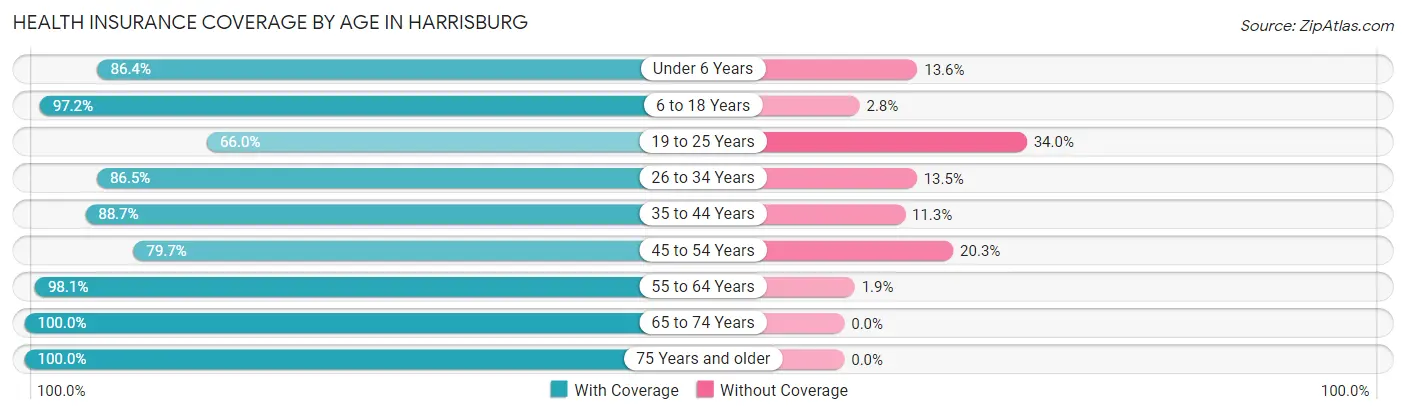
| Age Bracket | With Coverage | Without Coverage |
| Under 6 Years | 184 (86.4%) | 29 (13.6%) |
| 6 to 18 Years | 548 (97.2%) | 16 (2.8%) |
| 19 to 25 Years | 161 (66.0%) | 83 (34.0%) |
| 26 to 34 Years | 141 (86.5%) | 22 (13.5%) |
| 35 to 44 Years | 329 (88.7%) | 42 (11.3%) |
| 45 to 54 Years | 216 (79.7%) | 55 (20.3%) |
| 55 to 64 Years | 304 (98.1%) | 6 (1.9%) |
| 65 to 74 Years | 255 (100.0%) | 0 (0.0%) |
| 75 Years and older | 157 (100.0%) | 0 (0.0%) |
| Total | 2,295 (90.1%) | 253 (9.9%) |
Health Insurance Coverage by Citizenship Status in Harrisburg
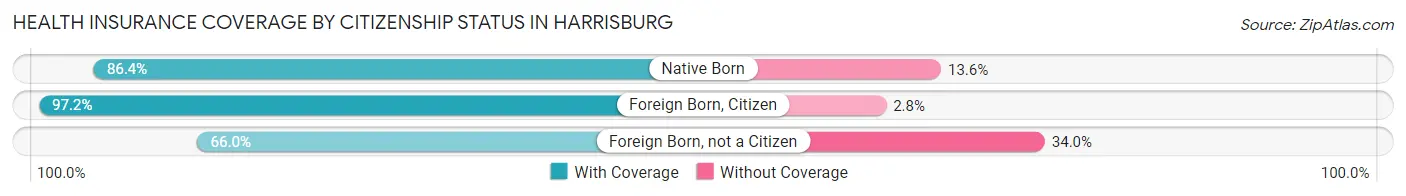
| Citizenship Status | With Coverage | Without Coverage |
| Native Born | 184 (86.4%) | 29 (13.6%) |
| Foreign Born, Citizen | 548 (97.2%) | 16 (2.8%) |
| Foreign Born, not a Citizen | 161 (66.0%) | 83 (34.0%) |
Health Insurance Coverage by Household Income in Harrisburg
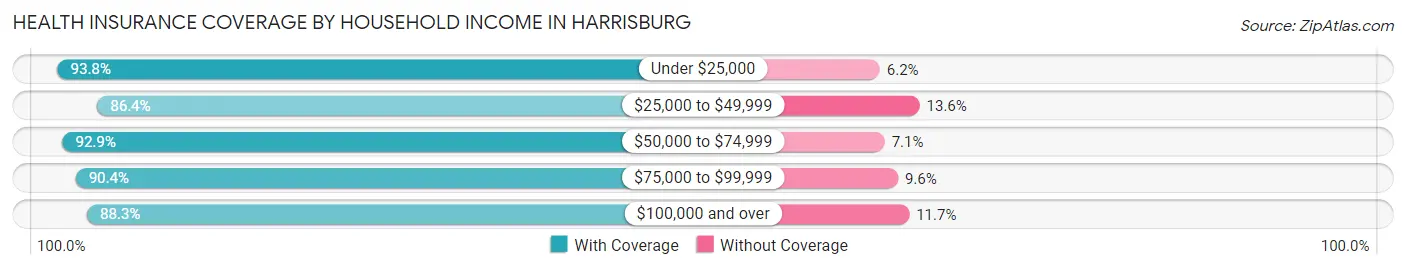
| Household Income | With Coverage | Without Coverage |
| Under $25,000 | 530 (93.8%) | 35 (6.2%) |
| $25,000 to $49,999 | 557 (86.4%) | 88 (13.6%) |
| $50,000 to $74,999 | 418 (92.9%) | 32 (7.1%) |
| $75,000 to $99,999 | 236 (90.4%) | 25 (9.6%) |
| $100,000 and over | 551 (88.3%) | 73 (11.7%) |
Public vs Private Health Insurance Coverage by Age in Harrisburg
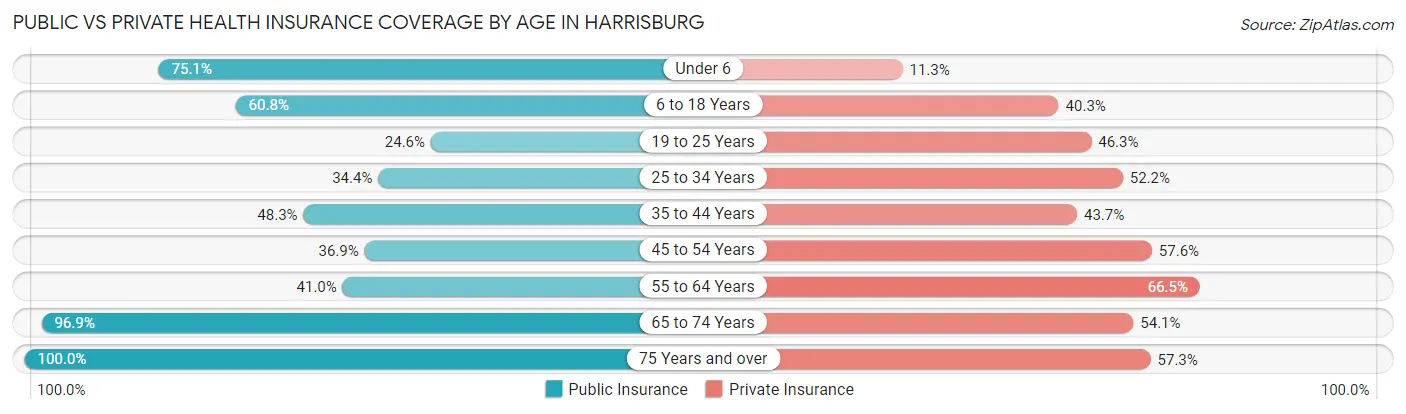
| Age Bracket | Public Insurance | Private Insurance |
| Under 6 | 160 (75.1%) | 24 (11.3%) |
| 6 to 18 Years | 343 (60.8%) | 227 (40.3%) |
| 19 to 25 Years | 60 (24.6%) | 113 (46.3%) |
| 25 to 34 Years | 56 (34.4%) | 85 (52.1%) |
| 35 to 44 Years | 179 (48.2%) | 162 (43.7%) |
| 45 to 54 Years | 100 (36.9%) | 156 (57.6%) |
| 55 to 64 Years | 127 (41.0%) | 206 (66.4%) |
| 65 to 74 Years | 247 (96.9%) | 138 (54.1%) |
| 75 Years and over | 157 (100.0%) | 90 (57.3%) |
| Total | 1,429 (56.1%) | 1,201 (47.1%) |
Disability Status by Sex by Age in Harrisburg
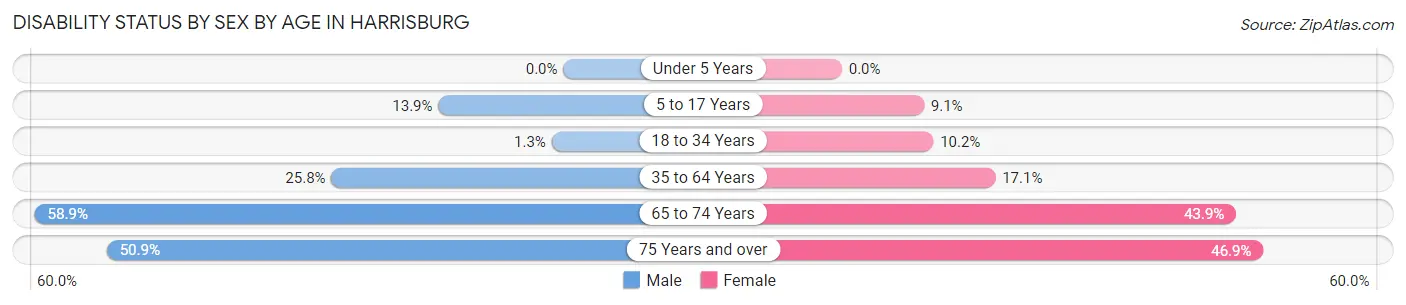
| Age Bracket | Male | Female |
| Under 5 Years | 0 (0.0%) | 0 (0.0%) |
| 5 to 17 Years | 43 (13.9%) | 16 (9.1%) |
| 18 to 34 Years | 3 (1.3%) | 28 (10.2%) |
| 35 to 64 Years | 125 (25.8%) | 80 (17.1%) |
| 65 to 74 Years | 63 (58.9%) | 65 (43.9%) |
| 75 Years and over | 30 (50.8%) | 46 (46.9%) |
Disability Class by Sex by Age in Harrisburg
Disability Class: Hearing Difficulty
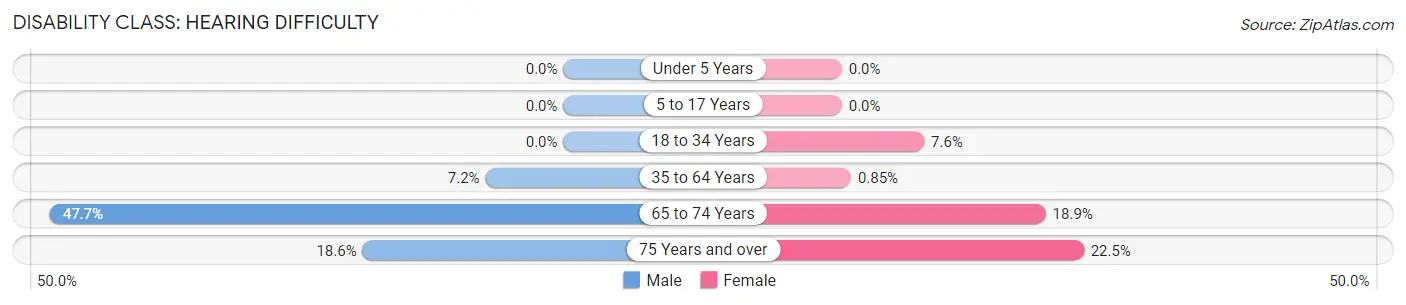
| Age Bracket | Male | Female |
| Under 5 Years | 0 (0.0%) | 0 (0.0%) |
| 5 to 17 Years | 0 (0.0%) | 0 (0.0%) |
| 18 to 34 Years | 0 (0.0%) | 21 (7.6%) |
| 35 to 64 Years | 35 (7.2%) | 4 (0.9%) |
| 65 to 74 Years | 51 (47.7%) | 28 (18.9%) |
| 75 Years and over | 11 (18.6%) | 22 (22.5%) |
Disability Class: Vision Difficulty
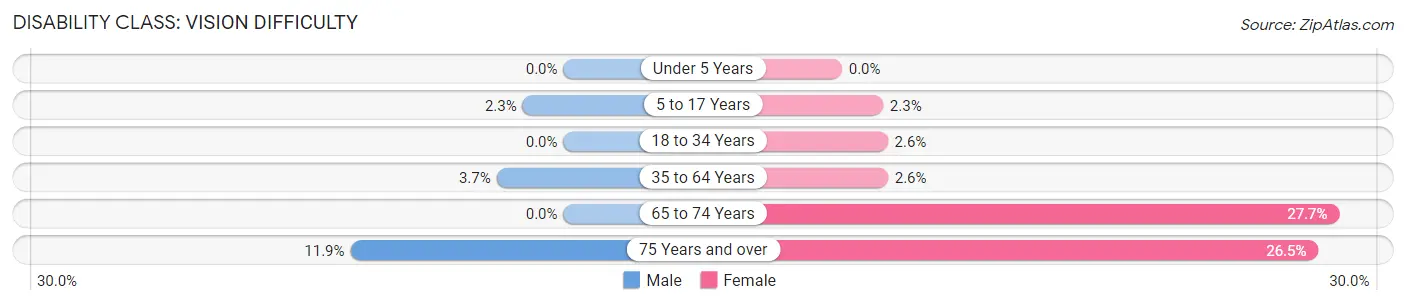
| Age Bracket | Male | Female |
| Under 5 Years | 0 (0.0%) | 0 (0.0%) |
| 5 to 17 Years | 7 (2.3%) | 4 (2.3%) |
| 18 to 34 Years | 0 (0.0%) | 7 (2.5%) |
| 35 to 64 Years | 18 (3.7%) | 12 (2.6%) |
| 65 to 74 Years | 0 (0.0%) | 41 (27.7%) |
| 75 Years and over | 7 (11.9%) | 26 (26.5%) |
Disability Class: Cognitive Difficulty
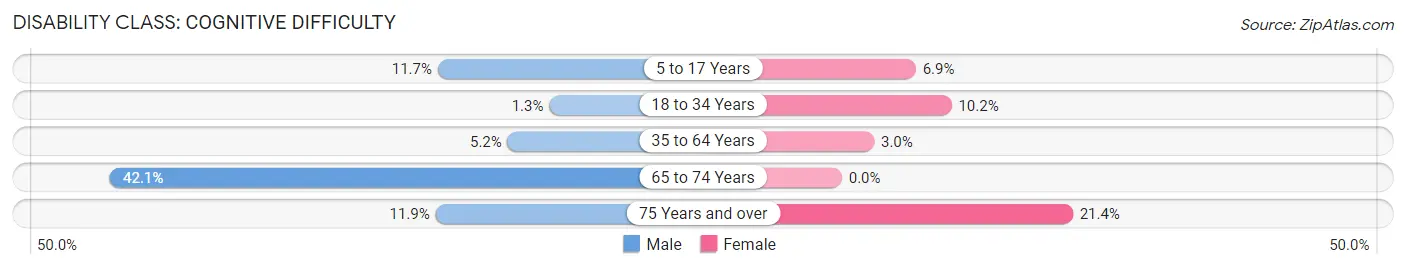
| Age Bracket | Male | Female |
| 5 to 17 Years | 36 (11.7%) | 12 (6.9%) |
| 18 to 34 Years | 3 (1.3%) | 28 (10.2%) |
| 35 to 64 Years | 25 (5.2%) | 14 (3.0%) |
| 65 to 74 Years | 45 (42.1%) | 0 (0.0%) |
| 75 Years and over | 7 (11.9%) | 21 (21.4%) |
Disability Class: Ambulatory Difficulty
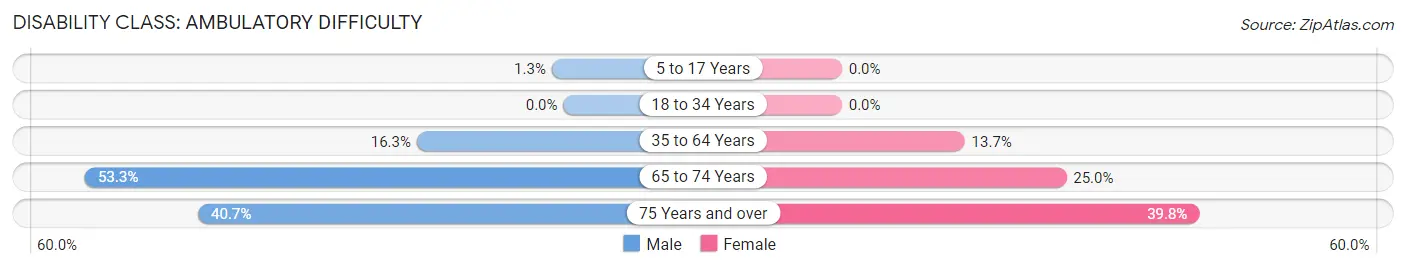
| Age Bracket | Male | Female |
| 5 to 17 Years | 4 (1.3%) | 0 (0.0%) |
| 18 to 34 Years | 0 (0.0%) | 0 (0.0%) |
| 35 to 64 Years | 79 (16.3%) | 64 (13.7%) |
| 65 to 74 Years | 57 (53.3%) | 37 (25.0%) |
| 75 Years and over | 24 (40.7%) | 39 (39.8%) |
Disability Class: Self-Care Difficulty
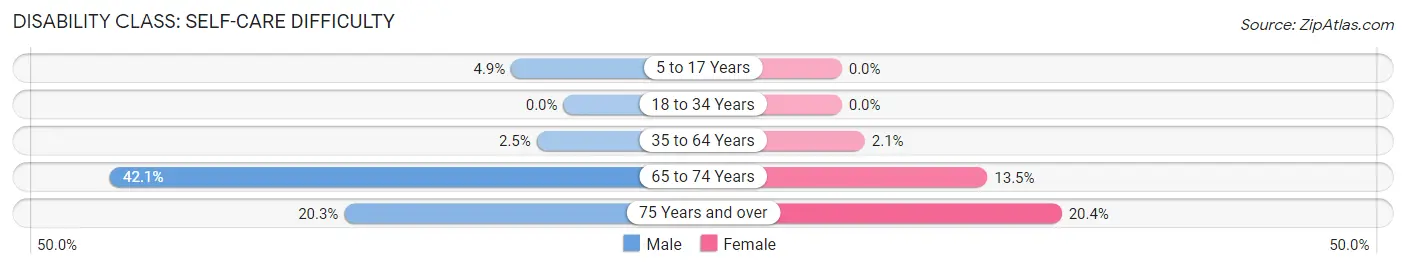
| Age Bracket | Male | Female |
| 5 to 17 Years | 15 (4.9%) | 0 (0.0%) |
| 18 to 34 Years | 0 (0.0%) | 0 (0.0%) |
| 35 to 64 Years | 12 (2.5%) | 10 (2.1%) |
| 65 to 74 Years | 45 (42.1%) | 20 (13.5%) |
| 75 Years and over | 12 (20.3%) | 20 (20.4%) |
Technology Access in Harrisburg
Computing Device Access in Harrisburg
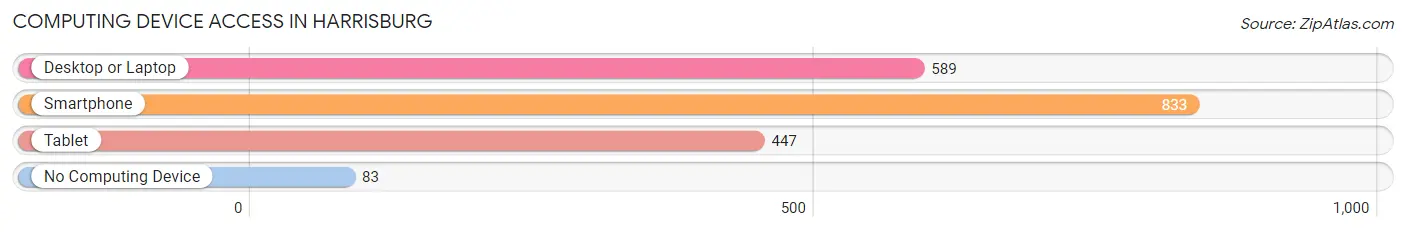
| Device Type | # Households | % Households |
| Desktop or Laptop | 589 | 60.7% |
| Smartphone | 833 | 85.9% |
| Tablet | 447 | 46.1% |
| No Computing Device | 83 | 8.6% |
| Total | 970 | 100.0% |
Internet Access in Harrisburg
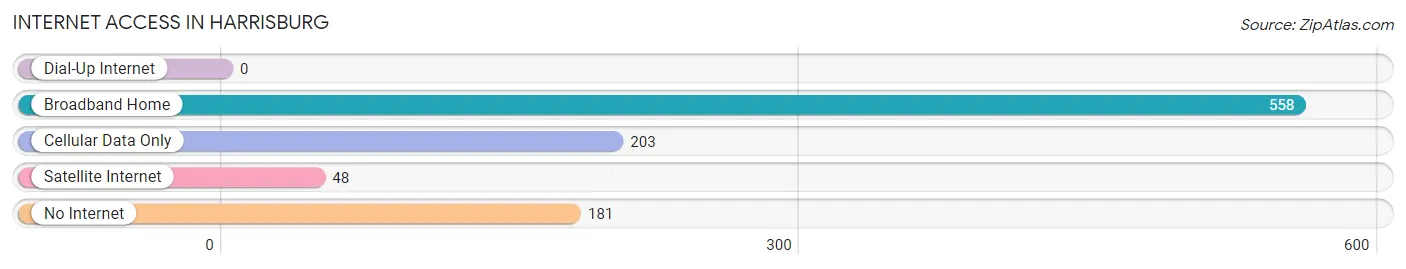
| Internet Type | # Households | % Households |
| Dial-Up Internet | 0 | 0.0% |
| Broadband Home | 558 | 57.5% |
| Cellular Data Only | 203 | 20.9% |
| Satellite Internet | 48 | 5.0% |
| No Internet | 181 | 18.7% |
| Total | 970 | 100.0% |
Harrisburg Summary
Harrisburg, Arkansas is a small city located in Poinsett County in the northeast corner of the state. It is situated on the banks of the St. Francis River, and is the county seat of Poinsett County. The city has a population of 2,817 as of the 2010 census, and is part of the Jonesboro, Arkansas Metropolitan Statistical Area.
History
The area that is now Harrisburg was first settled in the early 1800s by settlers from Tennessee and Kentucky. The town was originally known as “Harrisburg” after the first settler, William Harris. The town was officially incorporated in 1876.
In the late 1800s, Harrisburg was a thriving agricultural center, with cotton, corn, and wheat being the main crops. The town also had a number of sawmills and gristmills, as well as a number of stores and businesses.
In the early 1900s, the town began to decline as the railroad bypassed it. The town was further hurt by the Great Depression, and by the 1940s, the population had dropped to just over 500.
In the 1950s, the town began to experience a resurgence, as the timber industry began to boom in the area. The town also began to attract new businesses, and the population began to grow again.
Geography
Harrisburg is located in the northeast corner of Arkansas, in Poinsett County. It is situated on the banks of the St. Francis River, and is about 25 miles south of Jonesboro, Arkansas.
The city has a total area of 2.3 square miles, all of which is land. The city is located in the Arkansas Delta region, and is characterized by flat, fertile land.
Economy
The economy of Harrisburg is largely based on agriculture and timber. The city is home to a number of farms, and the surrounding area is known for its cotton, corn, and soybean production.
The timber industry is also an important part of the local economy. The city is home to a number of sawmills and wood-processing plants, and the surrounding area is known for its hardwood forests.
The city is also home to a number of small businesses, including restaurants, retail stores, and service providers.
Demographics
As of the 2010 census, Harrisburg had a population of 2,817. The racial makeup of the city was 79.3% White, 17.7% African American, 0.3% Native American, 0.2% Asian, 0.1% Pacific Islander, 0.7% from other races, and 1.9% from two or more races. Hispanic or Latino of any race were 2.2% of the population.
The median income for a household in the city was $30,938, and the median income for a family was $37,917. The per capita income for the city was $15,945. About 17.2% of families and 20.3% of the population were below the poverty line, including 28.2% of those under age 18 and 16.2% of those age 65 or over.
Common Questions
What is the Total Population of Harrisburg?
Total Population of Harrisburg is 2,700.
What is the Total Male Population of Harrisburg?
Total Male Population of Harrisburg is 1,372.
What is the Total Female Population of Harrisburg?
Total Female Population of Harrisburg is 1,328.
What is the Ratio of Males per 100 Females in Harrisburg?
There are 103.31 Males per 100 Females in Harrisburg.
What is the Ratio of Females per 100 Males in Harrisburg?
There are 96.79 Females per 100 Males in Harrisburg.
What is the Median Population Age in Harrisburg?
Median Population Age in Harrisburg is 37.8 Years.
What is the Average Family Size in Harrisburg
Average Family Size in Harrisburg is 3.0 People.
What is the Average Household Size in Harrisburg
Average Household Size in Harrisburg is 2.6 People.
What is Per Capita Income in Harrisburg?
Per Capita income in Harrisburg is $22,944.
What is the Median Family Income in Harrisburg?
Median Family Income in Harrisburg is $53,036.
What is the Median Household income in Harrisburg?
Median Household Income in Harrisburg is $48,008.
What is Income or Wage Gap in Harrisburg?
Income or Wage Gap in Harrisburg is 10.8%.
Women in Harrisburg earn 89.2 cents for every dollar earned by a man.
What is Family Income Deficit in Harrisburg?
Family Income Deficit in Harrisburg is $11,830.
Families that are below poverty line in Harrisburg earn $11,830 less on average than the poverty threshold level.
What is Inequality or Gini Index in Harrisburg?
Inequality or Gini Index in Harrisburg is 0.46.
How Large is the Labor Force in Harrisburg?
There are 1,092 People in the Labor Forcein in Harrisburg.
What is the Percentage of People in the Labor Force in Harrisburg?
51.4% of People are in the Labor Force in Harrisburg.
What is the Unemployment Rate in Harrisburg?
Unemployment Rate in Harrisburg is 6.5%.