Harrell, AR Map & Demographics
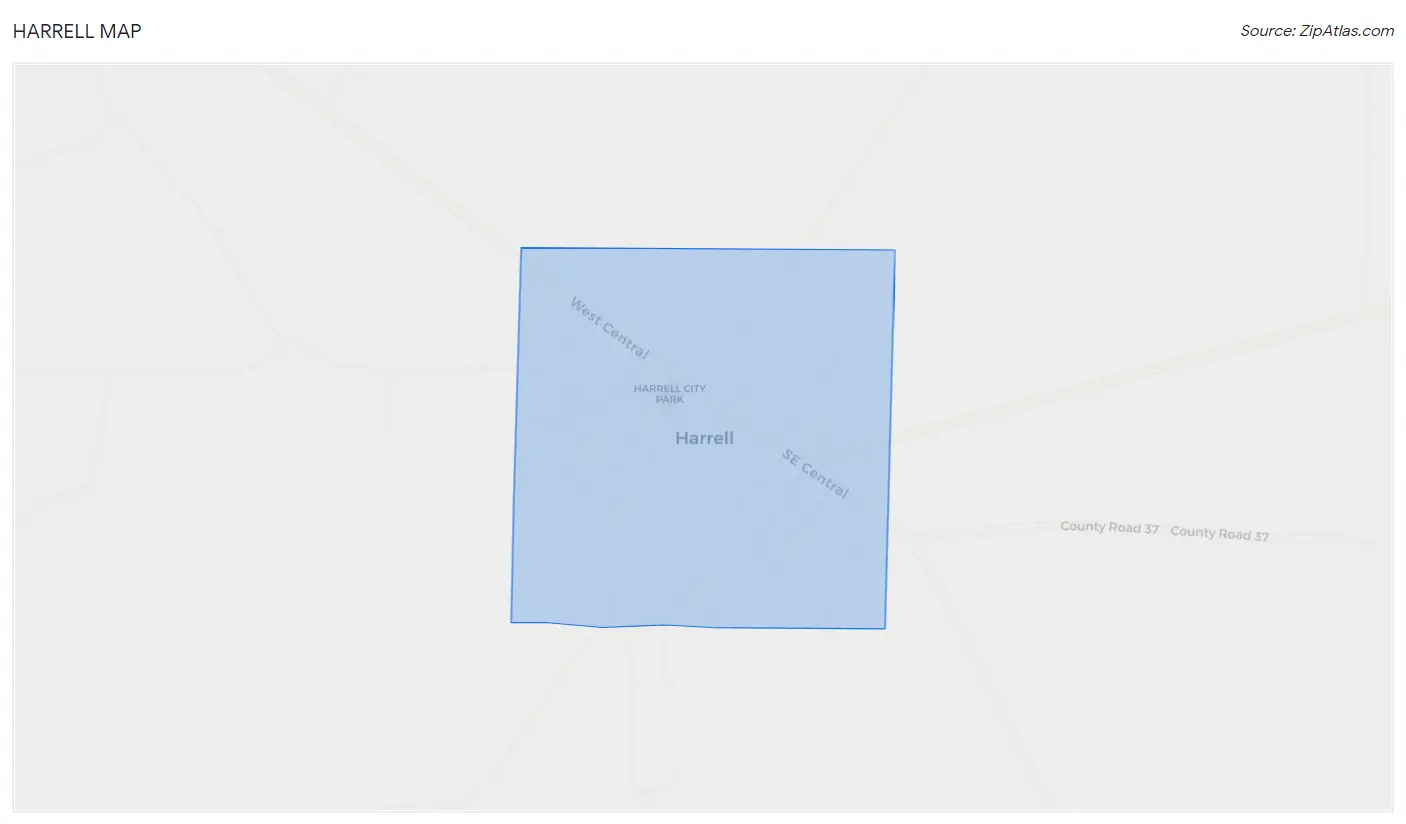
Harrell Map
Harrell Overview
$31,194
PER CAPITA INCOME
$93,000
AVG FAMILY INCOME
$88,750
AVG HOUSEHOLD INCOME
7.2%
WAGE / INCOME GAP [ % ]
92.8¢/ $1
WAGE / INCOME GAP [ $ ]
0.28
INEQUALITY / GINI INDEX
281
TOTAL POPULATION
126
MALE POPULATION
155
FEMALE POPULATION
81.29
MALES / 100 FEMALES
123.02
FEMALES / 100 MALES
48.3
MEDIAN AGE
2.5
AVG FAMILY SIZE
2.3
AVG HOUSEHOLD SIZE
110
LABOR FORCE [ PEOPLE ]
44.9%
PERCENT IN LABOR FORCE
13.6%
UNEMPLOYMENT RATE
Harrell Zip Codes
Harrell Area Codes
Income in Harrell
Income Overview in Harrell
Per Capita Income in Harrell is $31,194, while median incomes of families and households are $93,000 and $88,750 respectively.
| Characteristic | Number | Measure |
| Per Capita Income | 281 | $31,194 |
| Median Family Income | 104 | $93,000 |
| Mean Family Income | 104 | $83,025 |
| Median Household Income | 122 | $88,750 |
| Mean Household Income | 122 | $78,744 |
| Income Deficit | 104 | $0 |
| Wage / Income Gap (%) | 281 | 7.18% |
| Wage / Income Gap ($) | 281 | 92.82¢ per $1 |
| Gini / Inequality Index | 281 | 0.28 |
Earnings by Sex in Harrell
Average Earnings in Harrell are $41,458, $42,083 for men and $39,063 for women, a difference of 7.2%.
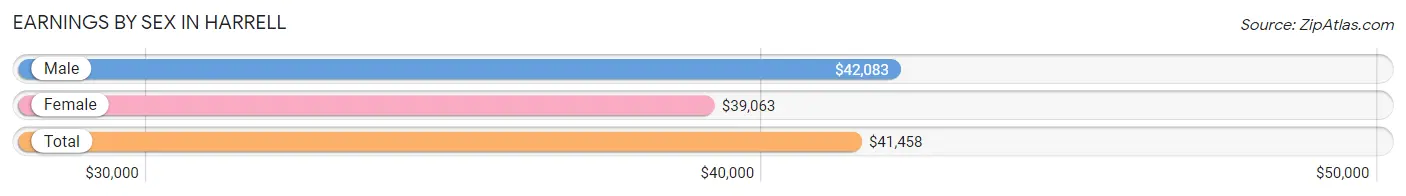
| Sex | Number | Average Earnings |
| Male | 36 (36.4%) | $42,083 |
| Female | 63 (63.6%) | $39,063 |
| Total | 99 (100.0%) | $41,458 |
Earnings by Sex by Income Bracket in Harrell
The most common earnings brackets in Harrell are $40,000 to $44,999 for men (6 | 16.7%) and $55,000 to $64,999 for women (22 | 34.9%).
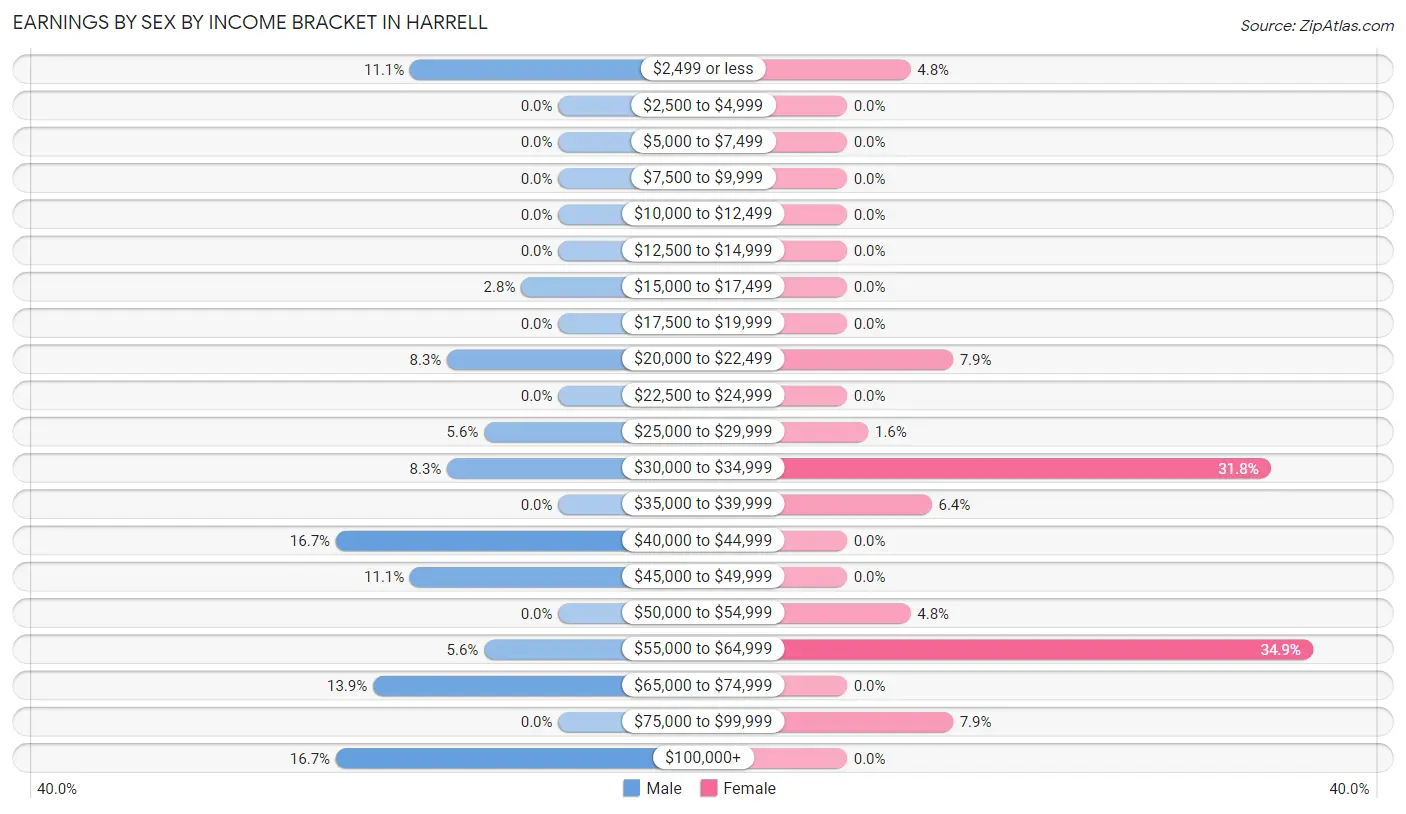
| Income | Male | Female |
| $2,499 or less | 4 (11.1%) | 3 (4.8%) |
| $2,500 to $4,999 | 0 (0.0%) | 0 (0.0%) |
| $5,000 to $7,499 | 0 (0.0%) | 0 (0.0%) |
| $7,500 to $9,999 | 0 (0.0%) | 0 (0.0%) |
| $10,000 to $12,499 | 0 (0.0%) | 0 (0.0%) |
| $12,500 to $14,999 | 0 (0.0%) | 0 (0.0%) |
| $15,000 to $17,499 | 1 (2.8%) | 0 (0.0%) |
| $17,500 to $19,999 | 0 (0.0%) | 0 (0.0%) |
| $20,000 to $22,499 | 3 (8.3%) | 5 (7.9%) |
| $22,500 to $24,999 | 0 (0.0%) | 0 (0.0%) |
| $25,000 to $29,999 | 2 (5.6%) | 1 (1.6%) |
| $30,000 to $34,999 | 3 (8.3%) | 20 (31.8%) |
| $35,000 to $39,999 | 0 (0.0%) | 4 (6.4%) |
| $40,000 to $44,999 | 6 (16.7%) | 0 (0.0%) |
| $45,000 to $49,999 | 4 (11.1%) | 0 (0.0%) |
| $50,000 to $54,999 | 0 (0.0%) | 3 (4.8%) |
| $55,000 to $64,999 | 2 (5.6%) | 22 (34.9%) |
| $65,000 to $74,999 | 5 (13.9%) | 0 (0.0%) |
| $75,000 to $99,999 | 0 (0.0%) | 5 (7.9%) |
| $100,000+ | 6 (16.7%) | 0 (0.0%) |
| Total | 36 (100.0%) | 63 (100.0%) |
Earnings by Sex by Educational Attainment in Harrell
Average earnings in Harrell are $55,000 for men and $51,667 for women, a difference of 6.1%. Men with an educational attainment of high school diploma enjoy the highest average annual earnings of $40,000, while those with high school diploma education earn the least with $40,000. Women with an educational attainment of high school diploma earn the most with the average annual earnings of $60,556, while those with college or associate's degree education have the smallest earnings of $33,333.
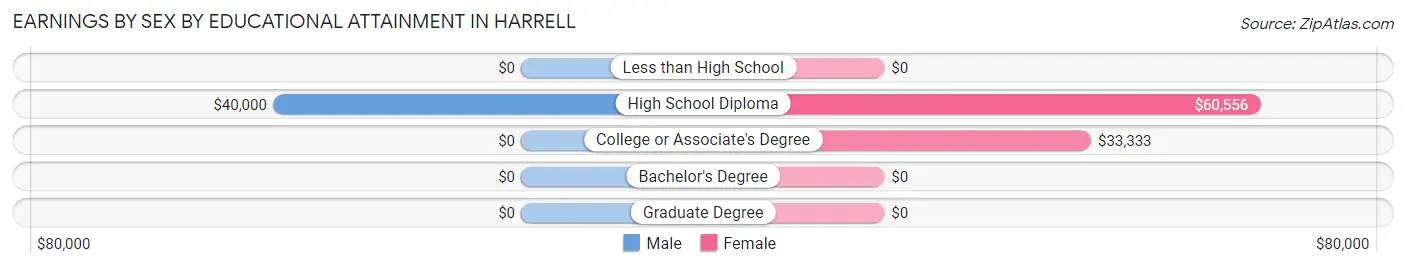
| Educational Attainment | Male Income | Female Income |
| Less than High School | - | - |
| High School Diploma | $40,000 | $60,556 |
| College or Associate's Degree | - | - |
| Bachelor's Degree | - | - |
| Graduate Degree | - | - |
| Total | $55,000 | $51,667 |
Family Income in Harrell
Family Income Brackets in Harrell
According to the Harrell family income data, there are 40 families falling into the $100,000 to $149,999 income range, which is the most common income bracket and makes up 38.5% of all families.
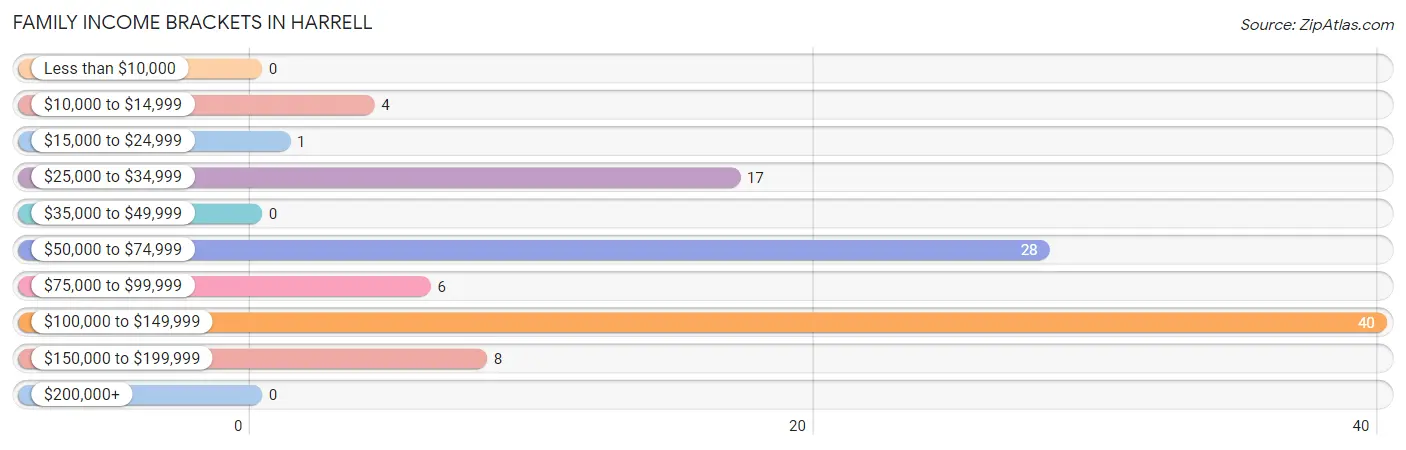
| Income Bracket | # Families | % Families |
| Less than $10,000 | 0 | 0.0% |
| $10,000 to $14,999 | 4 | 3.8% |
| $15,000 to $24,999 | 1 | 1.0% |
| $25,000 to $34,999 | 17 | 16.3% |
| $35,000 to $49,999 | 0 | 0.0% |
| $50,000 to $74,999 | 28 | 26.9% |
| $75,000 to $99,999 | 6 | 5.8% |
| $100,000 to $149,999 | 40 | 38.5% |
| $150,000 to $199,999 | 8 | 7.7% |
| $200,000+ | 0 | 0.0% |
Family Income by Famaliy Size in Harrell
2-person families (77 | 74.0%) account for the highest median family income in Harrell with $100,250 per family, while 2-person families (77 | 74.0%) have the highest median income of $50,125 per family member.
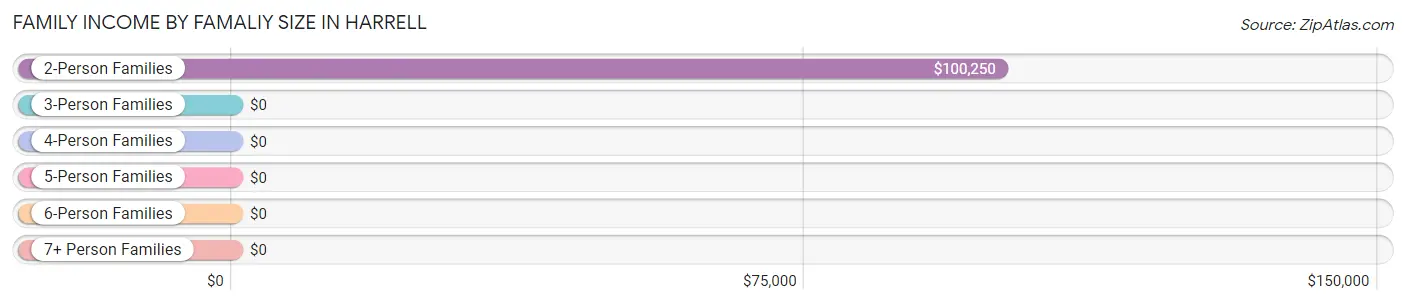
| Income Bracket | # Families | Median Income |
| 2-Person Families | 77 (74.0%) | $100,250 |
| 3-Person Families | 8 (7.7%) | $0 |
| 4-Person Families | 11 (10.6%) | $0 |
| 5-Person Families | 8 (7.7%) | $0 |
| 6-Person Families | 0 (0.0%) | $0 |
| 7+ Person Families | 0 (0.0%) | $0 |
| Total | 104 (100.0%) | $93,000 |
Family Income by Number of Earners in Harrell
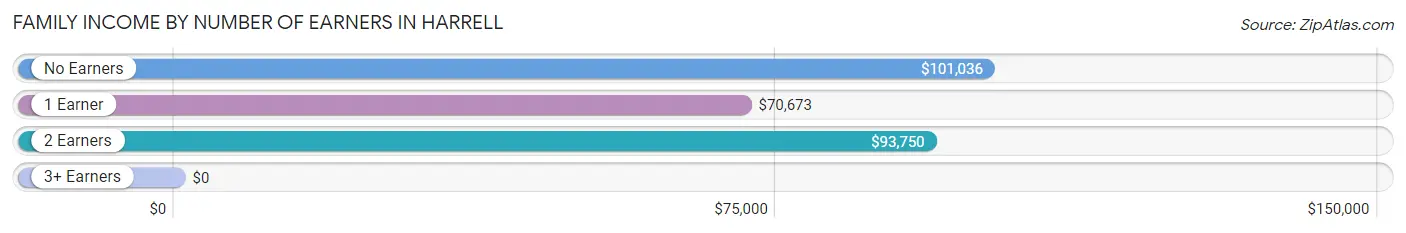
| Number of Earners | # Families | Median Income |
| No Earners | 41 (39.4%) | $101,036 |
| 1 Earner | 43 (41.3%) | $70,673 |
| 2 Earners | 15 (14.4%) | $93,750 |
| 3+ Earners | 5 (4.8%) | $0 |
| Total | 104 (100.0%) | $93,000 |
Household Income in Harrell
Household Income Brackets in Harrell
With 40 households falling in the category, the $100,000 to $149,999 income range is the most frequent in Harrell, accounting for 32.8% of all households.
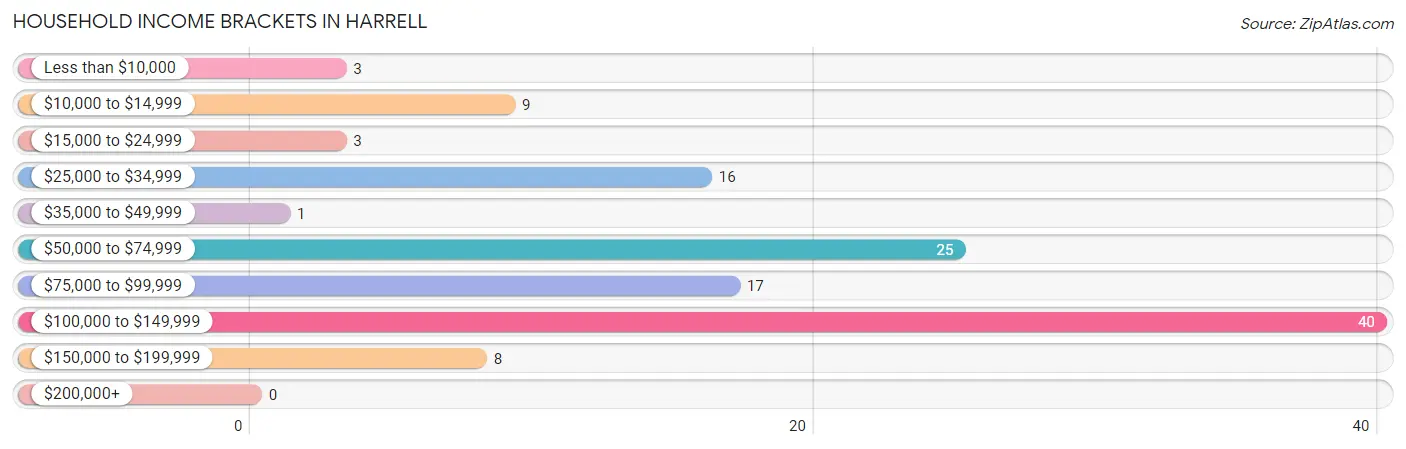
| Income Bracket | # Households | % Households |
| Less than $10,000 | 3 | 2.5% |
| $10,000 to $14,999 | 9 | 7.4% |
| $15,000 to $24,999 | 3 | 2.5% |
| $25,000 to $34,999 | 16 | 13.1% |
| $35,000 to $49,999 | 1 | 0.8% |
| $50,000 to $74,999 | 25 | 20.5% |
| $75,000 to $99,999 | 17 | 13.9% |
| $100,000 to $149,999 | 40 | 32.8% |
| $150,000 to $199,999 | 8 | 6.6% |
| $200,000+ | 0 | 0.0% |
Household Income by Householder Age in Harrell
The median household income in Harrell is $88,750, with the highest median household income of $100,500 found in the 65+ years age bracket for the primary householder. A total of 56 households (45.9%) fall into this category.
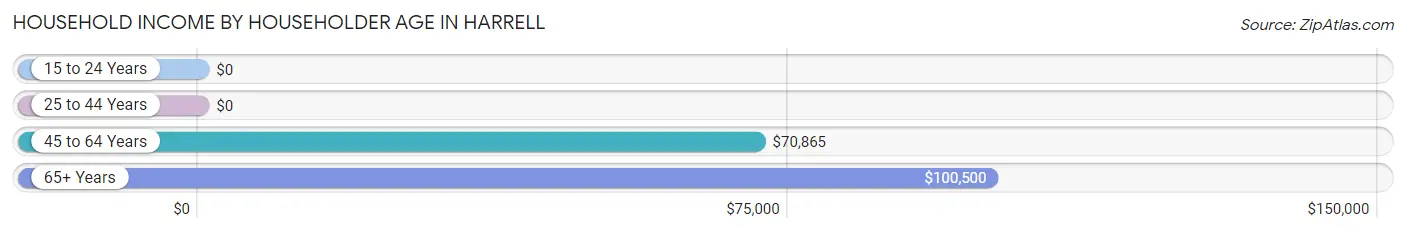
| Income Bracket | # Households | Median Income |
| 15 to 24 Years | 0 (0.0%) | $0 |
| 25 to 44 Years | 15 (12.3%) | $0 |
| 45 to 64 Years | 51 (41.8%) | $70,865 |
| 65+ Years | 56 (45.9%) | $100,500 |
| Total | 122 (100.0%) | $88,750 |
Poverty in Harrell
Income Below Poverty by Sex and Age in Harrell
With 4.8% poverty level for males and 9.7% for females among the residents of Harrell, 55 to 64 year old males and 55 to 64 year old females are the most vulnerable to poverty, with 4 males (36.4%) and 7 females (28.0%) in their respective age groups living below the poverty level.
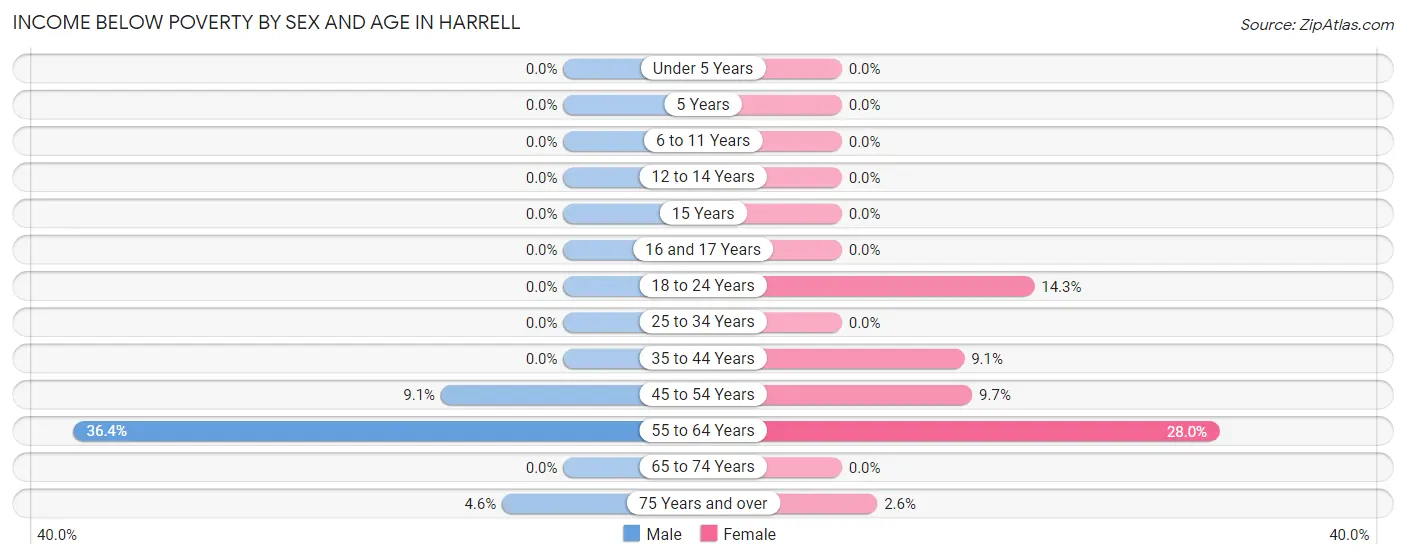
| Age Bracket | Male | Female |
| Under 5 Years | 0 (0.0%) | 0 (0.0%) |
| 5 Years | 0 (0.0%) | 0 (0.0%) |
| 6 to 11 Years | 0 (0.0%) | 0 (0.0%) |
| 12 to 14 Years | 0 (0.0%) | 0 (0.0%) |
| 15 Years | 0 (0.0%) | 0 (0.0%) |
| 16 and 17 Years | 0 (0.0%) | 0 (0.0%) |
| 18 to 24 Years | 0 (0.0%) | 3 (14.3%) |
| 25 to 34 Years | 0 (0.0%) | 0 (0.0%) |
| 35 to 44 Years | 0 (0.0%) | 1 (9.1%) |
| 45 to 54 Years | 1 (9.1%) | 3 (9.7%) |
| 55 to 64 Years | 4 (36.4%) | 7 (28.0%) |
| 65 to 74 Years | 0 (0.0%) | 0 (0.0%) |
| 75 Years and over | 1 (4.5%) | 1 (2.6%) |
| Total | 6 (4.8%) | 15 (9.7%) |
Income Above Poverty by Sex and Age in Harrell
According to the poverty statistics in Harrell, males aged under 5 years and females aged under 5 years are the age groups that are most secure financially, with 100.0% of males and 100.0% of females in these age groups living above the poverty line.
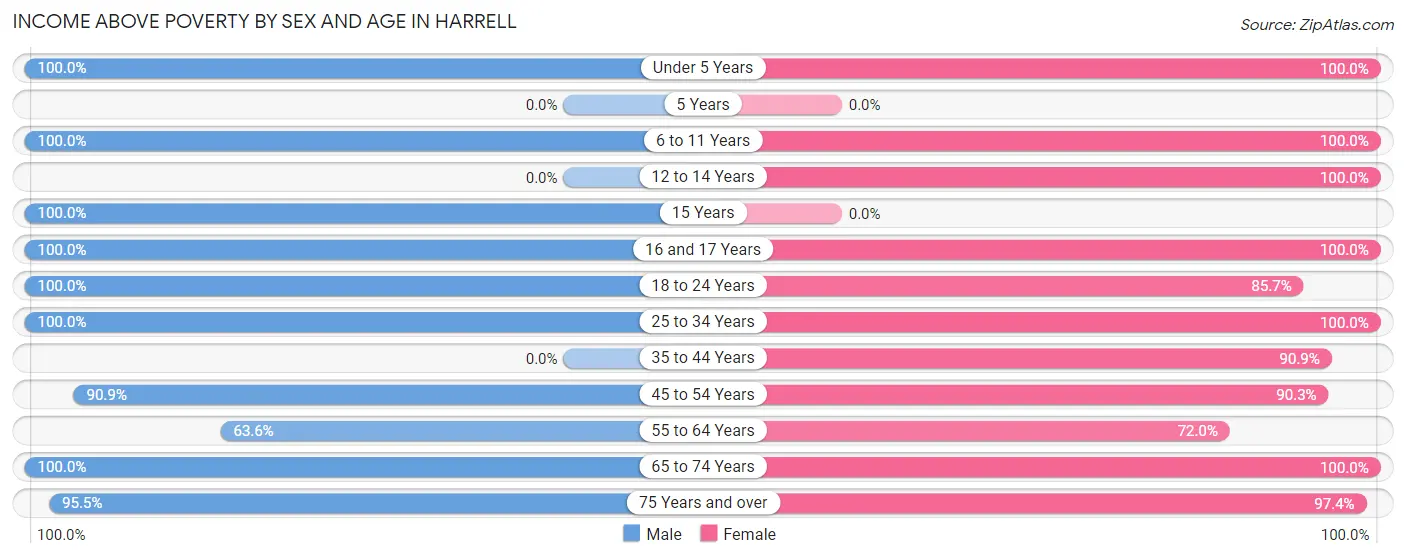
| Age Bracket | Male | Female |
| Under 5 Years | 13 (100.0%) | 5 (100.0%) |
| 5 Years | 0 (0.0%) | 0 (0.0%) |
| 6 to 11 Years | 10 (100.0%) | 2 (100.0%) |
| 12 to 14 Years | 0 (0.0%) | 4 (100.0%) |
| 15 Years | 2 (100.0%) | 0 (0.0%) |
| 16 and 17 Years | 3 (100.0%) | 3 (100.0%) |
| 18 to 24 Years | 20 (100.0%) | 18 (85.7%) |
| 25 to 34 Years | 19 (100.0%) | 10 (100.0%) |
| 35 to 44 Years | 0 (0.0%) | 10 (90.9%) |
| 45 to 54 Years | 10 (90.9%) | 28 (90.3%) |
| 55 to 64 Years | 7 (63.6%) | 18 (72.0%) |
| 65 to 74 Years | 15 (100.0%) | 5 (100.0%) |
| 75 Years and over | 21 (95.5%) | 37 (97.4%) |
| Total | 120 (95.2%) | 140 (90.3%) |
Income Below Poverty Among Married-Couple Families in Harrell
The poverty statistics for married-couple families in Harrell show that 7.3% or 5 of the total 68 families live below the poverty line. Families with no children have the highest poverty rate of 8.8%, comprising of 5 families. On the other hand, families with 1 or 2 children have the lowest poverty rate of 0.0%, which includes 0 families.
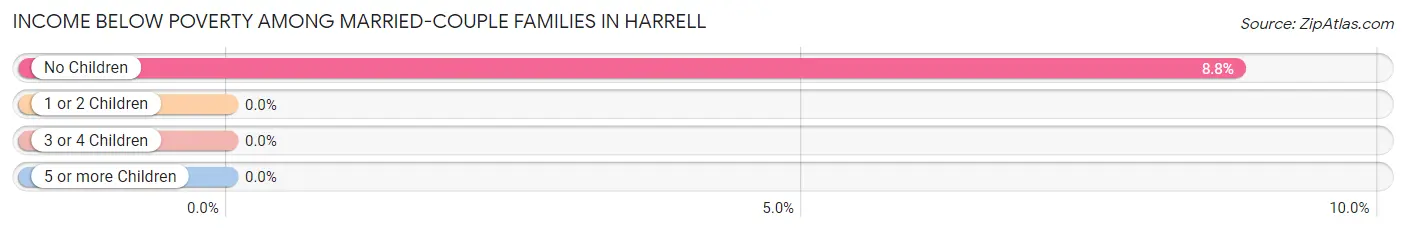
| Children | Above Poverty | Below Poverty |
| No Children | 52 (91.2%) | 5 (8.8%) |
| 1 or 2 Children | 11 (100.0%) | 0 (0.0%) |
| 3 or 4 Children | 0 (0.0%) | 0 (0.0%) |
| 5 or more Children | 0 (0.0%) | 0 (0.0%) |
| Total | 63 (92.6%) | 5 (7.3%) |
Income Below Poverty Among Single-Parent Households in Harrell
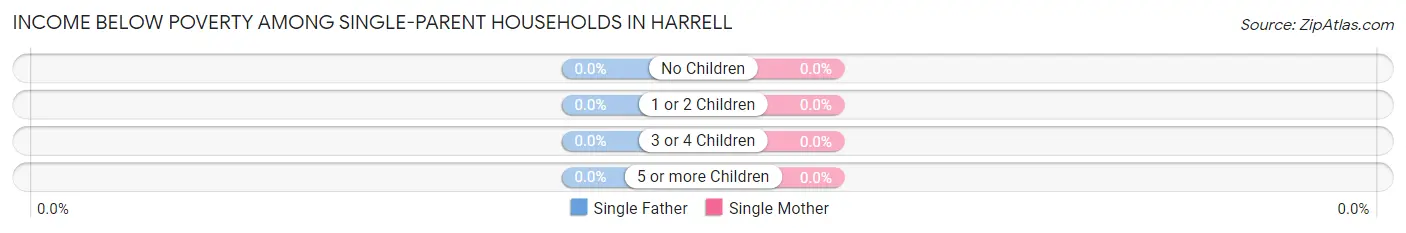
| Children | Single Father | Single Mother |
| No Children | 0 (0.0%) | 0 (0.0%) |
| 1 or 2 Children | 0 (0.0%) | 0 (0.0%) |
| 3 or 4 Children | 0 (0.0%) | 0 (0.0%) |
| 5 or more Children | 0 (0.0%) | 0 (0.0%) |
| Total | 0 (0.0%) | 0 (0.0%) |
Income Below Poverty Among Married-Couple vs Single-Parent Households in Harrell
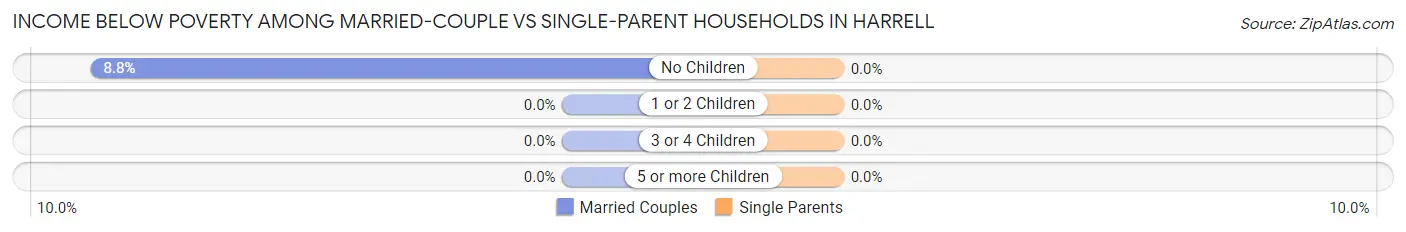
| Children | Married-Couple Families | Single-Parent Households |
| No Children | 5 (8.8%) | 0 (0.0%) |
| 1 or 2 Children | 0 (0.0%) | 0 (0.0%) |
| 3 or 4 Children | 0 (0.0%) | 0 (0.0%) |
| 5 or more Children | 0 (0.0%) | 0 (0.0%) |
| Total | 5 (7.3%) | 0 (0.0%) |
Race in Harrell
The most populous races in Harrell are White / Caucasian (187 | 66.5%), and Black / African American (94 | 33.5%).
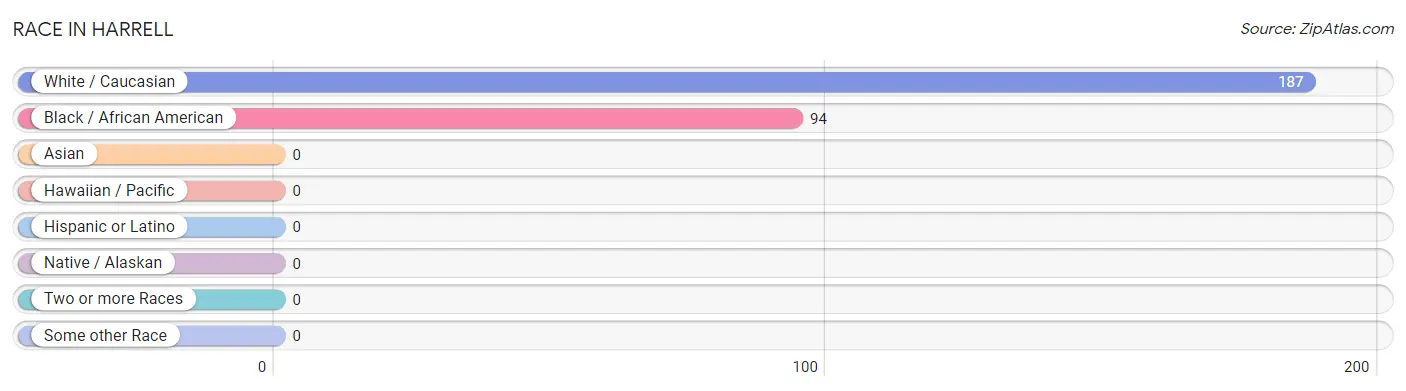
| Race | # Population | % Population |
| Asian | 0 | 0.0% |
| Black / African American | 94 | 33.5% |
| Hawaiian / Pacific | 0 | 0.0% |
| Hispanic or Latino | 0 | 0.0% |
| Native / Alaskan | 0 | 0.0% |
| White / Caucasian | 187 | 66.5% |
| Two or more Races | 0 | 0.0% |
| Some other Race | 0 | 0.0% |
| Total | 281 | 100.0% |
Ancestry in Harrell
The most populous ancestries reported in Harrell are Irish (16 | 5.7%), German (13 | 4.6%), American (11 | 3.9%), and Scottish (1 | 0.4%), together accounting for 14.6% of all Harrell residents.
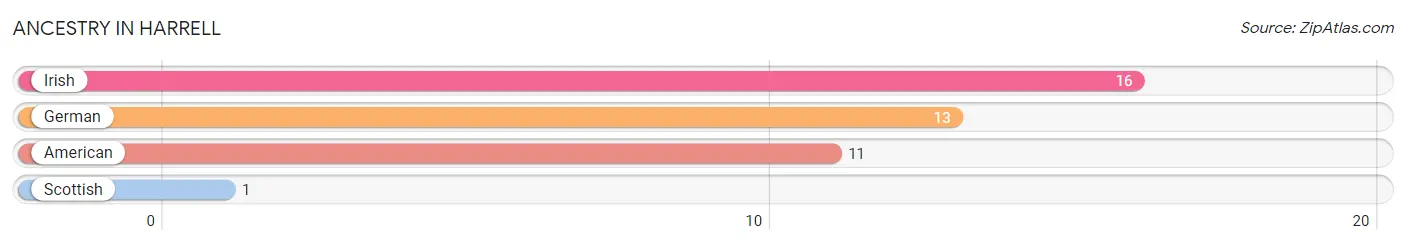
| Ancestry | # Population | % Population |
| American | 11 | 3.9% |
| German | 13 | 4.6% |
| Irish | 16 | 5.7% |
| Scottish | 1 | 0.4% | View All 4 Rows |
Immigrants in Harrell

| Immigration Origin | # Population | % Population | View All 0 Rows |
Sex and Age in Harrell
Sex and Age in Harrell
The most populous age groups in Harrell are 75 to 79 Years (21 | 16.7%) for men and 75 to 79 Years (38 | 24.5%) for women.
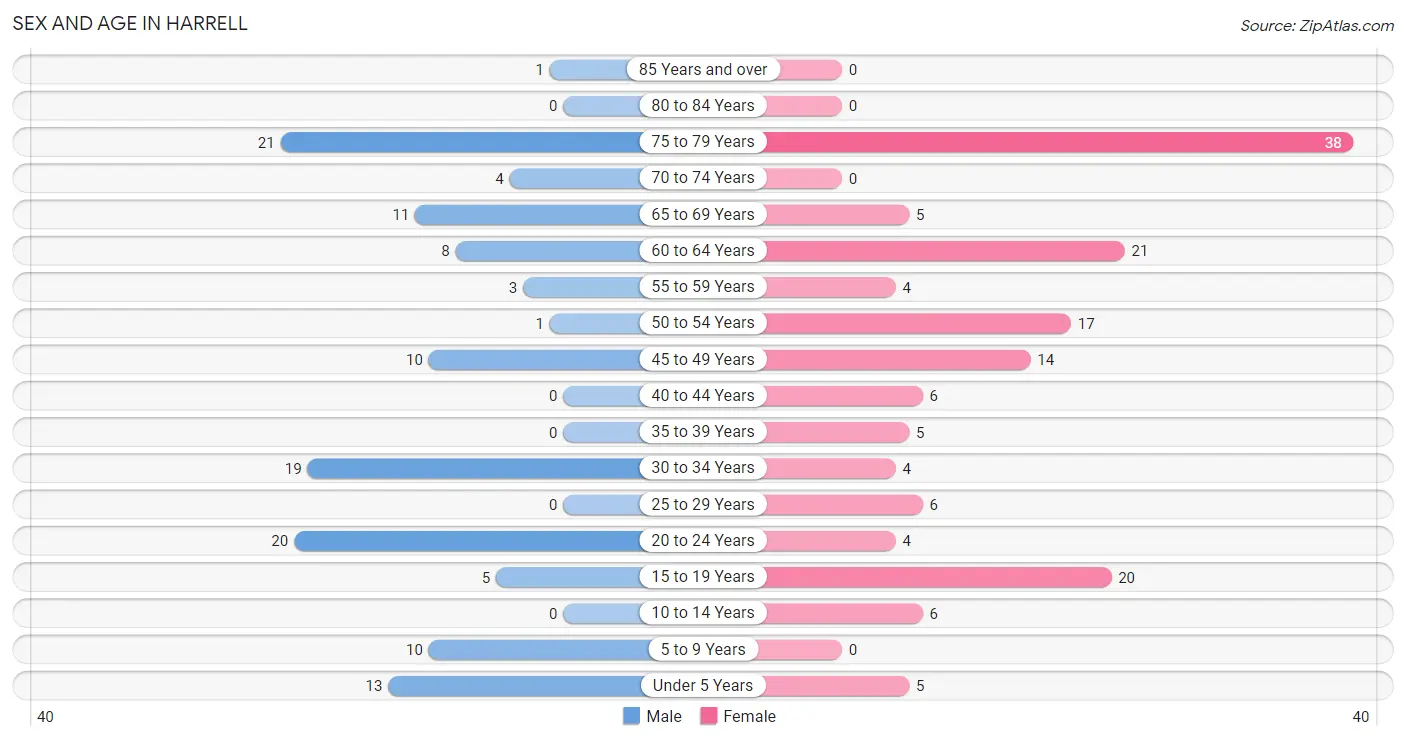
| Age Bracket | Male | Female |
| Under 5 Years | 13 (10.3%) | 5 (3.2%) |
| 5 to 9 Years | 10 (7.9%) | 0 (0.0%) |
| 10 to 14 Years | 0 (0.0%) | 6 (3.9%) |
| 15 to 19 Years | 5 (4.0%) | 20 (12.9%) |
| 20 to 24 Years | 20 (15.9%) | 4 (2.6%) |
| 25 to 29 Years | 0 (0.0%) | 6 (3.9%) |
| 30 to 34 Years | 19 (15.1%) | 4 (2.6%) |
| 35 to 39 Years | 0 (0.0%) | 5 (3.2%) |
| 40 to 44 Years | 0 (0.0%) | 6 (3.9%) |
| 45 to 49 Years | 10 (7.9%) | 14 (9.0%) |
| 50 to 54 Years | 1 (0.8%) | 17 (11.0%) |
| 55 to 59 Years | 3 (2.4%) | 4 (2.6%) |
| 60 to 64 Years | 8 (6.4%) | 21 (13.6%) |
| 65 to 69 Years | 11 (8.7%) | 5 (3.2%) |
| 70 to 74 Years | 4 (3.2%) | 0 (0.0%) |
| 75 to 79 Years | 21 (16.7%) | 38 (24.5%) |
| 80 to 84 Years | 0 (0.0%) | 0 (0.0%) |
| 85 Years and over | 1 (0.8%) | 0 (0.0%) |
| Total | 126 (100.0%) | 155 (100.0%) |
Families and Households in Harrell
Median Family Size in Harrell
The median family size in Harrell is 2.49 persons per family, with single male/father families (8 | 7.7%) accounting for the largest median family size of 5.13 persons per family. On the other hand, married-couple families (68 | 65.4%) represent the smallest median family size with 2.06 persons per family.
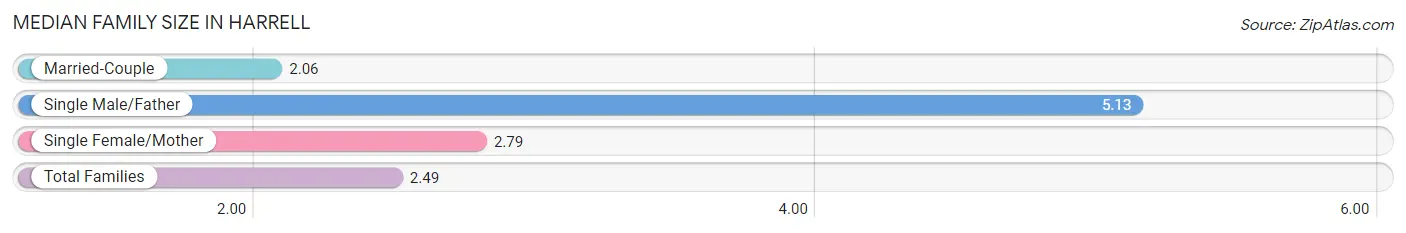
| Family Type | # Families | Family Size |
| Married-Couple | 68 (65.4%) | 2.06 |
| Single Male/Father | 8 (7.7%) | 5.13 |
| Single Female/Mother | 28 (26.9%) | 2.79 |
| Total Families | 104 (100.0%) | 2.49 |
Median Household Size in Harrell
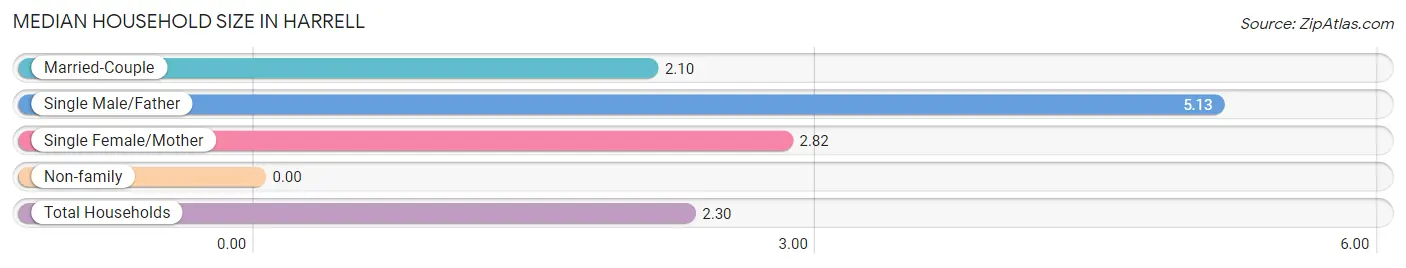
| Household Type | # Households | Household Size |
| Married-Couple | 68 (55.7%) | 2.10 |
| Single Male/Father | 8 (6.6%) | 5.13 |
| Single Female/Mother | 28 (23.0%) | 2.82 |
| Non-family | 18 (14.7%) | - |
| Total Households | 122 (100.0%) | 2.30 |
Household Size by Marriage Status in Harrell
Out of a total of 122 households in Harrell, 104 (85.3%) are family households, while 18 (14.7%) are nonfamily households. The most numerous type of family households are 2-person households, comprising 74, and the most common type of nonfamily households are 1-person households, comprising 18.
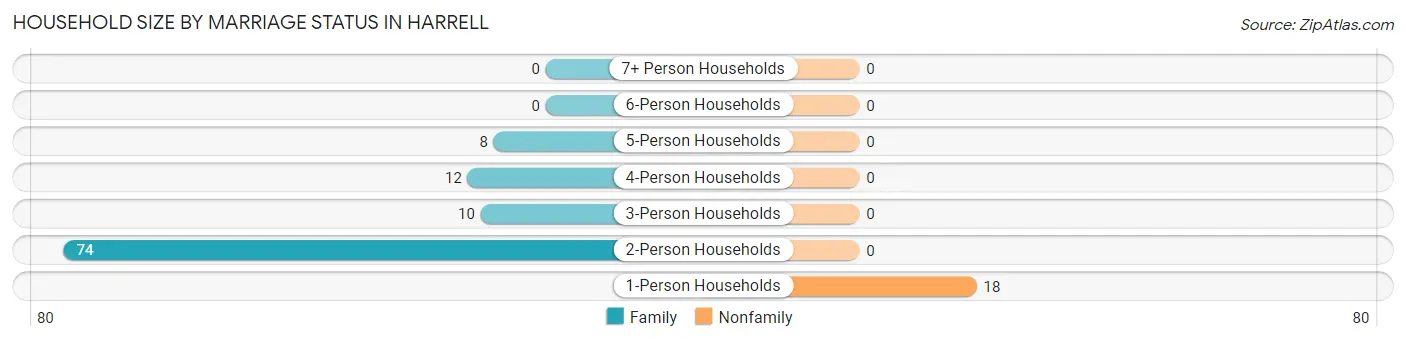
| Household Size | Family Households | Nonfamily Households |
| 1-Person Households | - | 18 (14.7%) |
| 2-Person Households | 74 (60.7%) | 0 (0.0%) |
| 3-Person Households | 10 (8.2%) | 0 (0.0%) |
| 4-Person Households | 12 (9.8%) | 0 (0.0%) |
| 5-Person Households | 8 (6.6%) | 0 (0.0%) |
| 6-Person Households | 0 (0.0%) | 0 (0.0%) |
| 7+ Person Households | 0 (0.0%) | 0 (0.0%) |
| Total | 104 (85.3%) | 18 (14.7%) |
Female Fertility in Harrell
Fertility by Age in Harrell
Average fertility rate in Harrell is 154.0 births per 1,000 women. Women in the age bracket of 15 to 19 years have the highest fertility rate with 500.0 births per 1,000 women. Women in the age bracket of 15 to 19 years acount for 100.0% of all women with births.
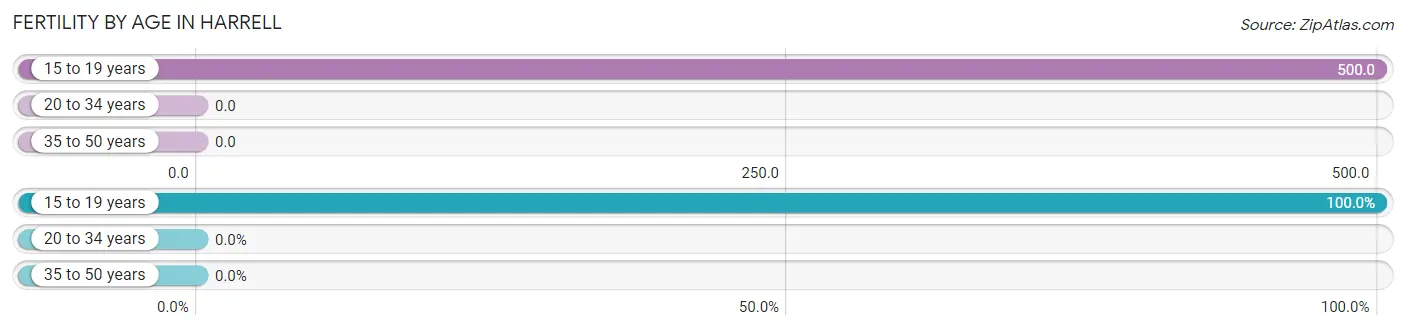
| Age Bracket | Women with Births | Births / 1,000 Women |
| 15 to 19 years | 10 (100.0%) | 500.0 |
| 20 to 34 years | 0 (0.0%) | 0.0 |
| 35 to 50 years | 0 (0.0%) | 0.0 |
| Total | 10 (100.0%) | 154.0 |
Fertility by Age by Marriage Status in Harrell
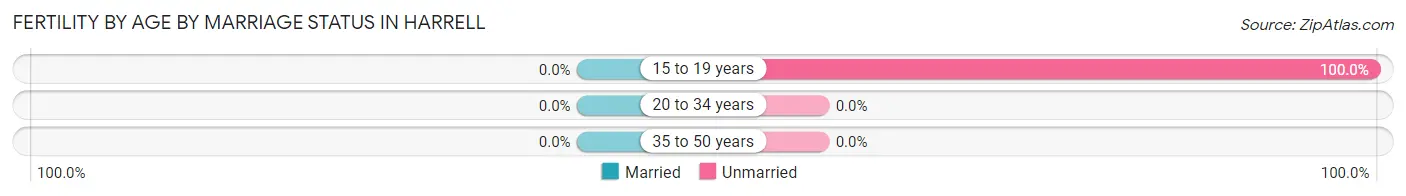
| Age Bracket | Married | Unmarried |
| 15 to 19 years | 0 (0.0%) | 10 (100.0%) |
| 20 to 34 years | 0 (0.0%) | 0 (0.0%) |
| 35 to 50 years | 0 (0.0%) | 0 (0.0%) |
| Total | 0 (0.0%) | 10 (100.0%) |
Fertility by Education in Harrell
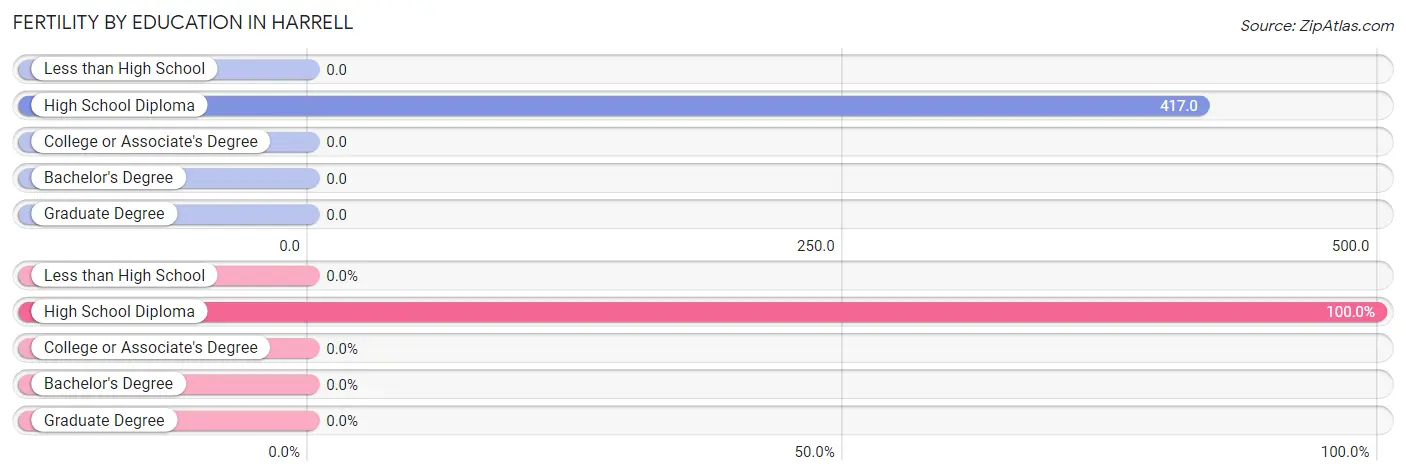
| Educational Attainment | Women with Births | Births / 1,000 Women |
| Less than High School | 0 (0.0%) | 0.0 |
| High School Diploma | 10 (100.0%) | 417.0 |
| College or Associate's Degree | 0 (0.0%) | 0.0 |
| Bachelor's Degree | 0 (0.0%) | 0.0 |
| Graduate Degree | 0 (0.0%) | 0.0 |
| Total | 10 (100.0%) | 154.0 |
Fertility by Education by Marriage Status in Harrell
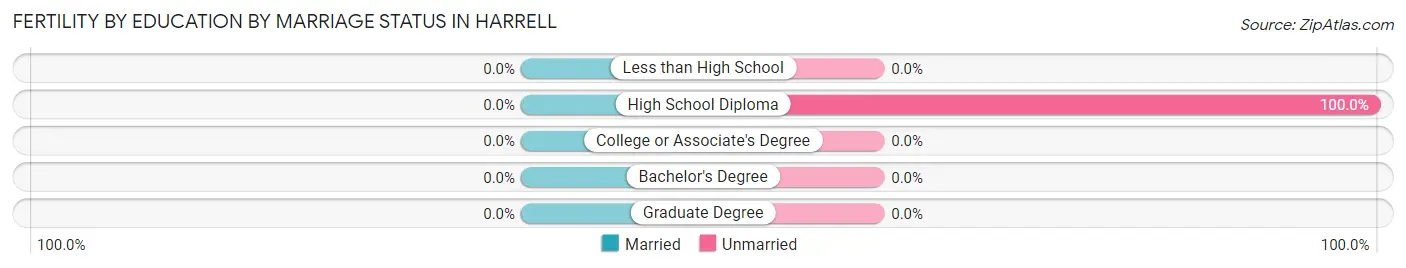
| Educational Attainment | Married | Unmarried |
| Less than High School | 0 (0.0%) | 0 (0.0%) |
| High School Diploma | 0 (0.0%) | 10 (100.0%) |
| College or Associate's Degree | 0 (0.0%) | 0 (0.0%) |
| Bachelor's Degree | 0 (0.0%) | 0 (0.0%) |
| Graduate Degree | 0 (0.0%) | 0 (0.0%) |
| Total | 0 (0.0%) | 10 (100.0%) |
Employment Characteristics in Harrell
Employment by Class of Employer in Harrell
Among the 95 employed individuals in Harrell, private company employees (73 | 76.8%), state government employees (8 | 8.4%), and self-employed (not incorporated) (7 | 7.4%) make up the most common classes of employment.
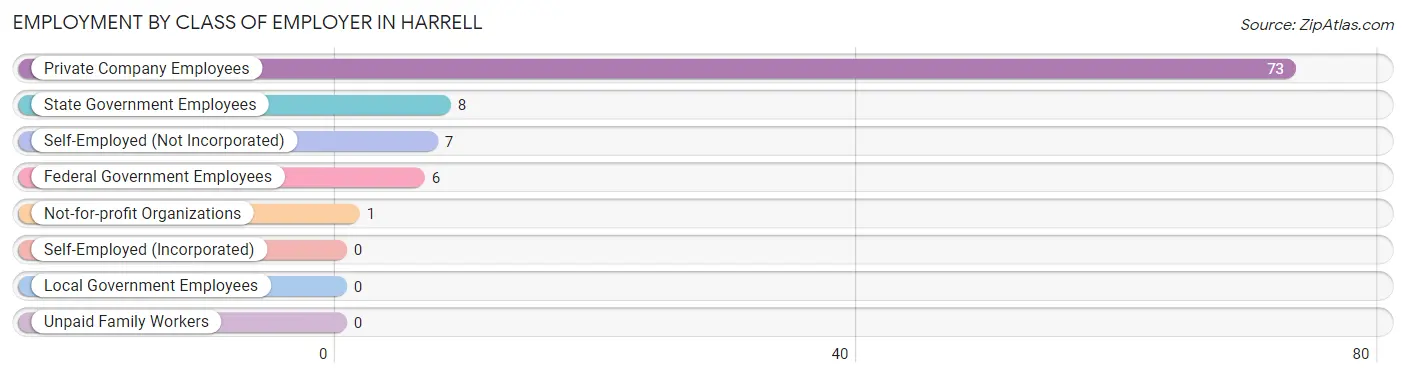
| Employer Class | # Employees | % Employees |
| Private Company Employees | 73 | 76.8% |
| Self-Employed (Incorporated) | 0 | 0.0% |
| Self-Employed (Not Incorporated) | 7 | 7.4% |
| Not-for-profit Organizations | 1 | 1.1% |
| Local Government Employees | 0 | 0.0% |
| State Government Employees | 8 | 8.4% |
| Federal Government Employees | 6 | 6.3% |
| Unpaid Family Workers | 0 | 0.0% |
| Total | 95 | 100.0% |
Employment Status by Age in Harrell
According to the labor force statistics for Harrell, out of the total population over 16 years of age (245), 44.9% or 110 individuals are in the labor force, with 13.6% or 15 of them unemployed. The age group with the highest labor force participation rate is 20 to 24 years, with 100.0% or 24 individuals in the labor force. Within the labor force, the 16 to 19 years age range has the highest percentage of unemployed individuals, with 100.0% or 4 of them being unemployed.
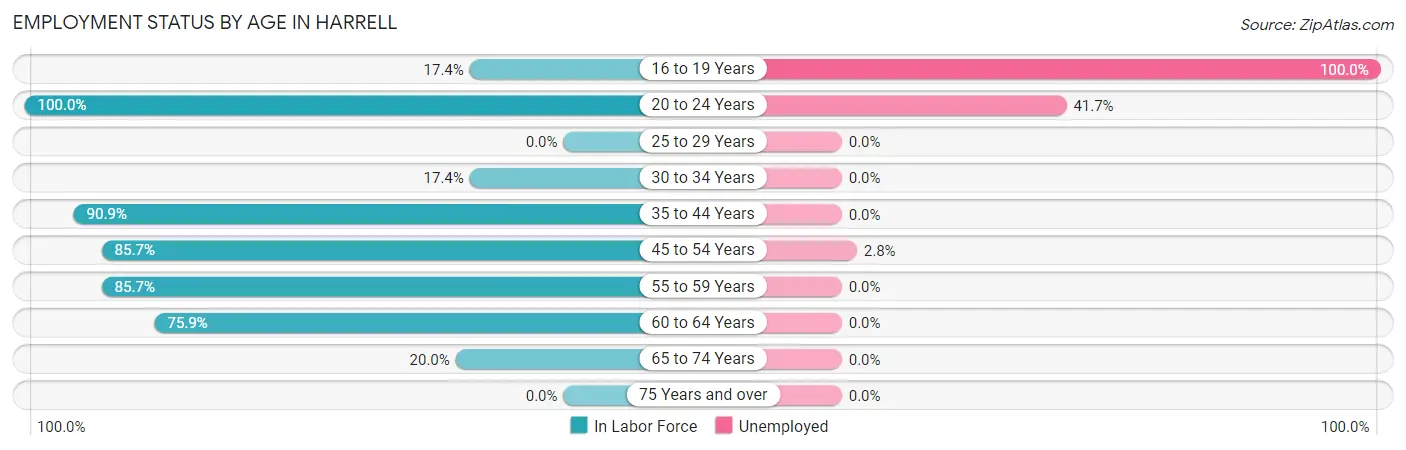
| Age Bracket | In Labor Force | Unemployed |
| 16 to 19 Years | 4 (17.4%) | 4 (100.0%) |
| 20 to 24 Years | 24 (100.0%) | 10 (41.7%) |
| 25 to 29 Years | 0 (0.0%) | 0 (0.0%) |
| 30 to 34 Years | 4 (17.4%) | 0 (0.0%) |
| 35 to 44 Years | 10 (90.9%) | 0 (0.0%) |
| 45 to 54 Years | 36 (85.7%) | 1 (2.8%) |
| 55 to 59 Years | 6 (85.7%) | 0 (0.0%) |
| 60 to 64 Years | 22 (75.9%) | 0 (0.0%) |
| 65 to 74 Years | 4 (20.0%) | 0 (0.0%) |
| 75 Years and over | 0 (0.0%) | 0 (0.0%) |
| Total | 110 (44.9%) | 15 (13.6%) |
Employment Status by Educational Attainment in Harrell
According to labor force statistics for Harrell, 66.1% of individuals (78) out of the total population between 25 and 64 years of age (118) are in the labor force, with 1.3% or 1 of them being unemployed. The group with the highest labor force participation rate are those with the educational attainment of bachelor's degree or higher, with 100.0% or 8 individuals in the labor force. Within the labor force, individuals with high school diploma education have the highest percentage of unemployment, with 2.4% or 1 of them being unemployed.
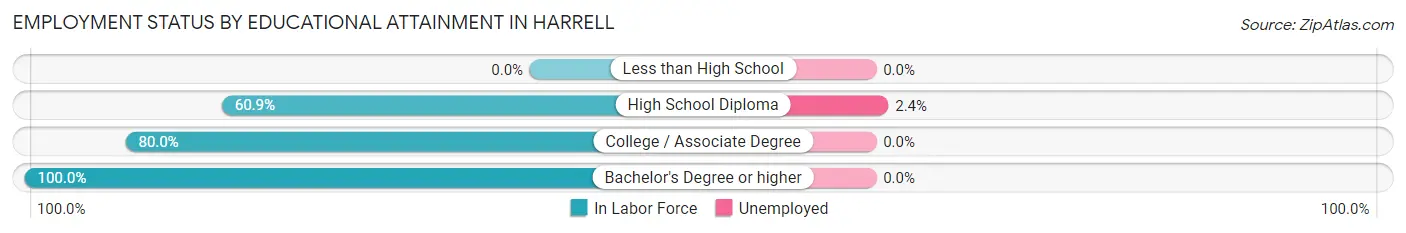
| Educational Attainment | In Labor Force | Unemployed |
| Less than High School | 0 (0.0%) | 0 (0.0%) |
| High School Diploma | 42 (60.9%) | 2 (2.4%) |
| College / Associate Degree | 28 (80.0%) | 0 (0.0%) |
| Bachelor's Degree or higher | 8 (100.0%) | 0 (0.0%) |
| Total | 78 (66.1%) | 2 (1.3%) |
Employment Occupations by Sex in Harrell
Management, Business, Science and Arts Occupations
The most common Management, Business, Science and Arts occupations in Harrell are Management (12 | 12.6%), Computers, Engineering & Science (1 | 1.1%), and Computers & Mathematics (1 | 1.1%).
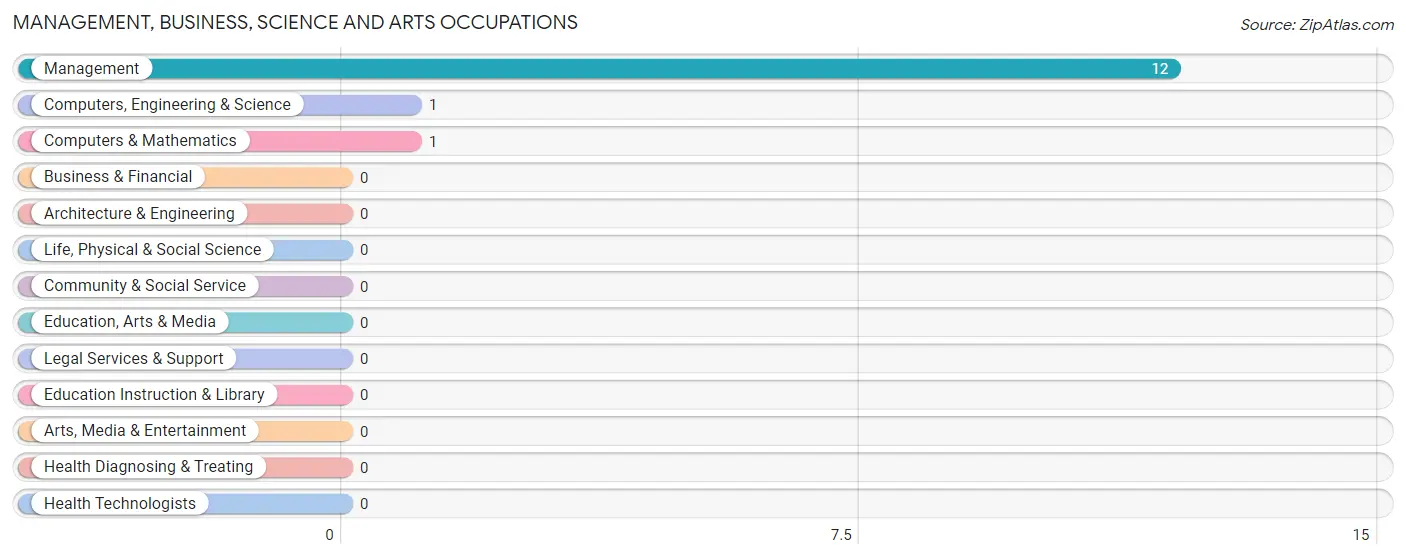
Management, Business, Science and Arts Occupations by Sex
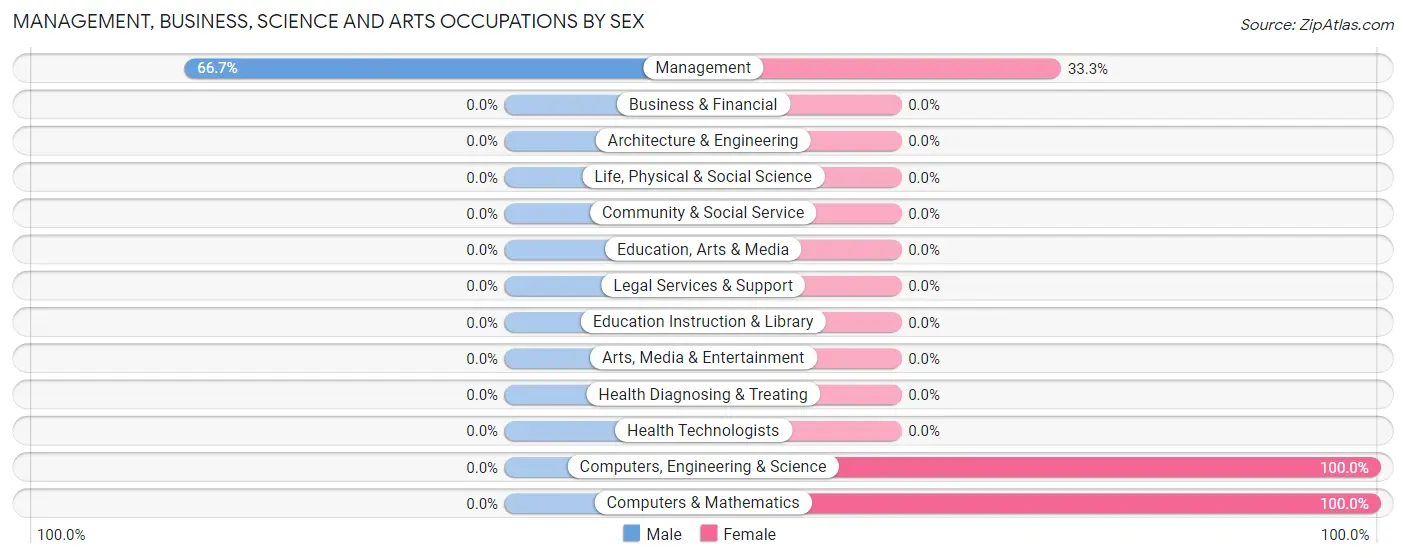
| Occupation | Male | Female |
| Management | 8 (66.7%) | 4 (33.3%) |
| Business & Financial | 0 (0.0%) | 0 (0.0%) |
| Computers, Engineering & Science | 0 (0.0%) | 1 (100.0%) |
| Computers & Mathematics | 0 (0.0%) | 1 (100.0%) |
| Architecture & Engineering | 0 (0.0%) | 0 (0.0%) |
| Life, Physical & Social Science | 0 (0.0%) | 0 (0.0%) |
| Community & Social Service | 0 (0.0%) | 0 (0.0%) |
| Education, Arts & Media | 0 (0.0%) | 0 (0.0%) |
| Legal Services & Support | 0 (0.0%) | 0 (0.0%) |
| Education Instruction & Library | 0 (0.0%) | 0 (0.0%) |
| Arts, Media & Entertainment | 0 (0.0%) | 0 (0.0%) |
| Health Diagnosing & Treating | 0 (0.0%) | 0 (0.0%) |
| Health Technologists | 0 (0.0%) | 0 (0.0%) |
| Total (Category) | 8 (61.5%) | 5 (38.5%) |
| Total (Overall) | 35 (36.8%) | 60 (63.2%) |
Services Occupations
The most common Services occupations in Harrell are , and Healthcare Support (6 | 6.3%).
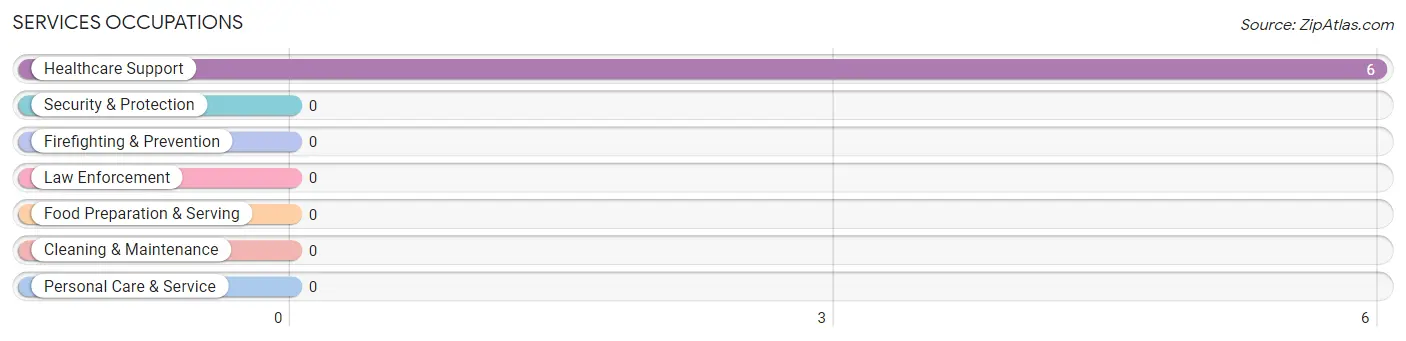
Services Occupations by Sex
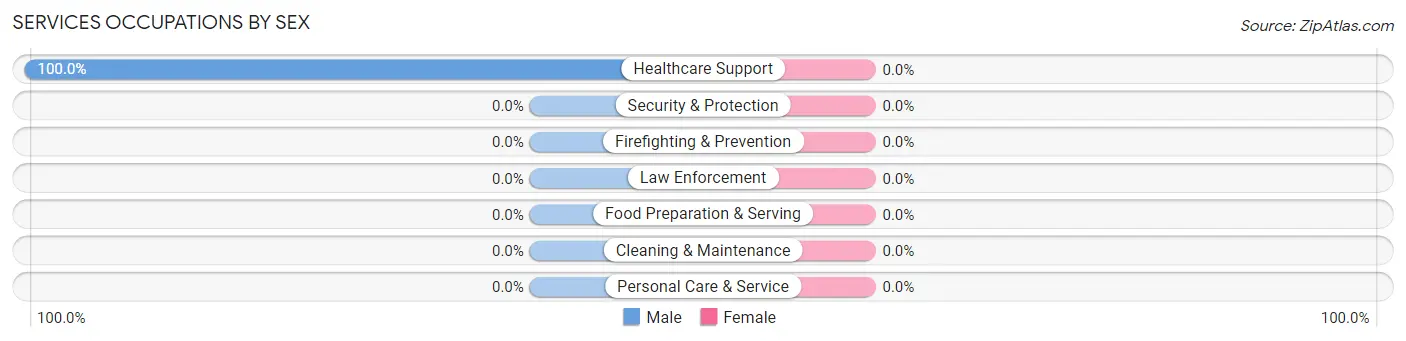
| Occupation | Male | Female |
| Healthcare Support | 6 (100.0%) | 0 (0.0%) |
| Security & Protection | 0 (0.0%) | 0 (0.0%) |
| Firefighting & Prevention | 0 (0.0%) | 0 (0.0%) |
| Law Enforcement | 0 (0.0%) | 0 (0.0%) |
| Food Preparation & Serving | 0 (0.0%) | 0 (0.0%) |
| Cleaning & Maintenance | 0 (0.0%) | 0 (0.0%) |
| Personal Care & Service | 0 (0.0%) | 0 (0.0%) |
| Total (Category) | 6 (100.0%) | 0 (0.0%) |
| Total (Overall) | 35 (36.8%) | 60 (63.2%) |
Sales and Office Occupations
The most common Sales and Office occupations in Harrell are , and Office & Administration (15 | 15.8%).
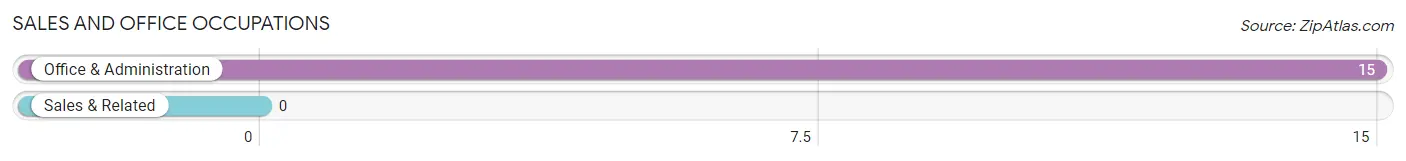
Sales and Office Occupations by Sex
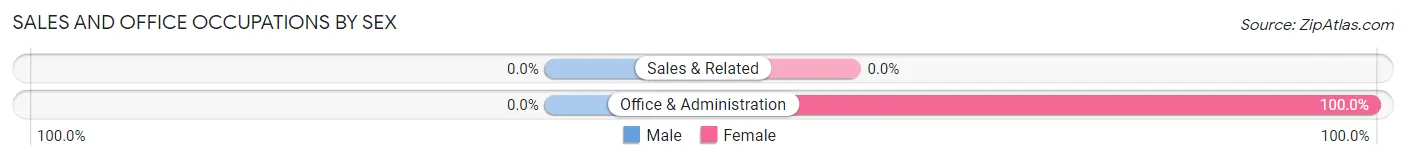
| Occupation | Male | Female |
| Sales & Related | 0 (0.0%) | 0 (0.0%) |
| Office & Administration | 0 (0.0%) | 15 (100.0%) |
| Total (Category) | 0 (0.0%) | 15 (100.0%) |
| Total (Overall) | 35 (36.8%) | 60 (63.2%) |
Natural Resources, Construction and Maintenance Occupations
The most common Natural Resources, Construction and Maintenance occupations in Harrell are Installation, Maintenance & Repair (9 | 9.5%), and Construction & Extraction (3 | 3.2%).
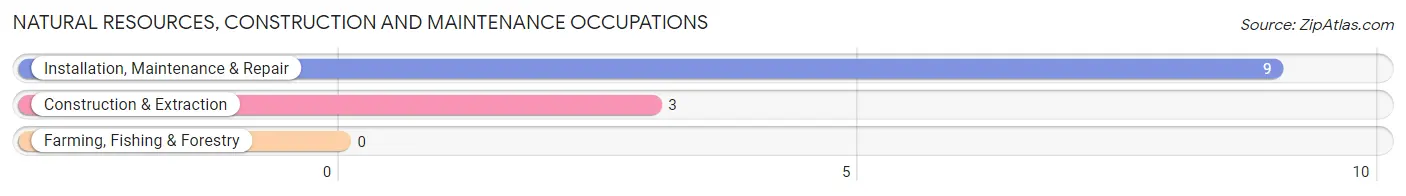
Natural Resources, Construction and Maintenance Occupations by Sex
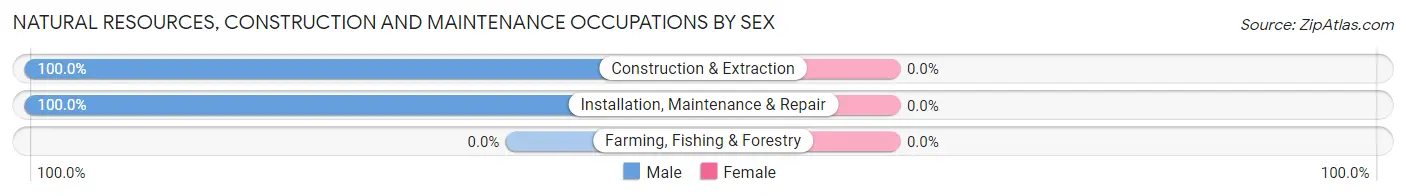
| Occupation | Male | Female |
| Farming, Fishing & Forestry | 0 (0.0%) | 0 (0.0%) |
| Construction & Extraction | 3 (100.0%) | 0 (0.0%) |
| Installation, Maintenance & Repair | 9 (100.0%) | 0 (0.0%) |
| Total (Category) | 12 (100.0%) | 0 (0.0%) |
| Total (Overall) | 35 (36.8%) | 60 (63.2%) |
Production, Transportation and Moving Occupations
The most common Production, Transportation and Moving occupations in Harrell are Production (36 | 37.9%), Material Moving (7 | 7.4%), and Transportation (6 | 6.3%).
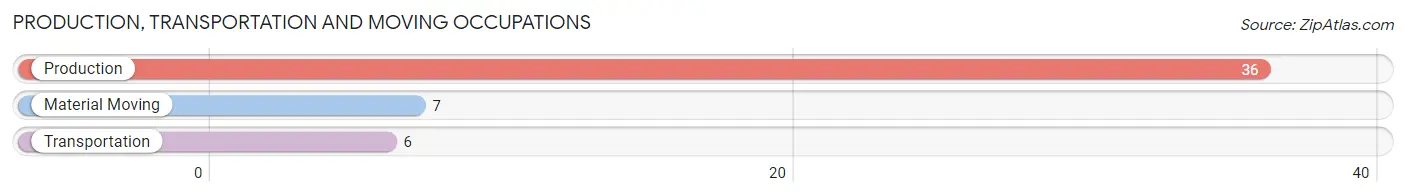
Production, Transportation and Moving Occupations by Sex
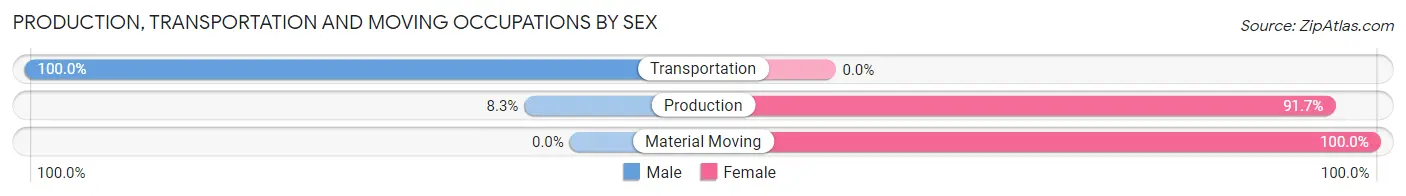
| Occupation | Male | Female |
| Production | 3 (8.3%) | 33 (91.7%) |
| Transportation | 6 (100.0%) | 0 (0.0%) |
| Material Moving | 0 (0.0%) | 7 (100.0%) |
| Total (Category) | 9 (18.4%) | 40 (81.6%) |
| Total (Overall) | 35 (36.8%) | 60 (63.2%) |
Employment Industries by Sex in Harrell
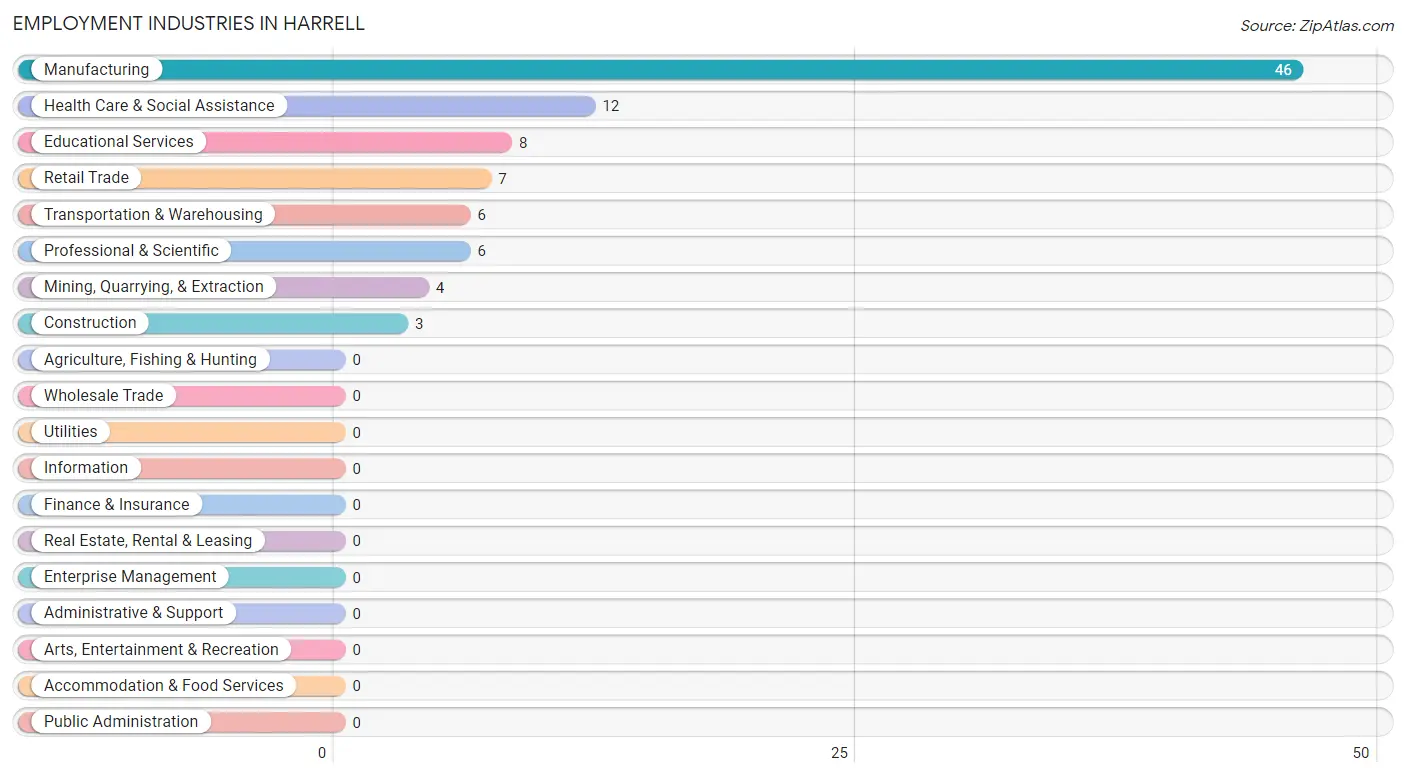
Employment Industries in Harrell
The major employment industries in Harrell include Manufacturing (46 | 48.4%), Health Care & Social Assistance (12 | 12.6%), Educational Services (8 | 8.4%), Retail Trade (7 | 7.4%), and Transportation & Warehousing (6 | 6.3%).
Employment Industries by Sex in Harrell
The Harrell industries that see more men than women are Mining, Quarrying, & Extraction (100.0%), Construction (100.0%), and Transportation & Warehousing (100.0%), whereas the industries that tend to have a higher number of women are Retail Trade (100.0%), Professional & Scientific (100.0%), and Educational Services (100.0%).
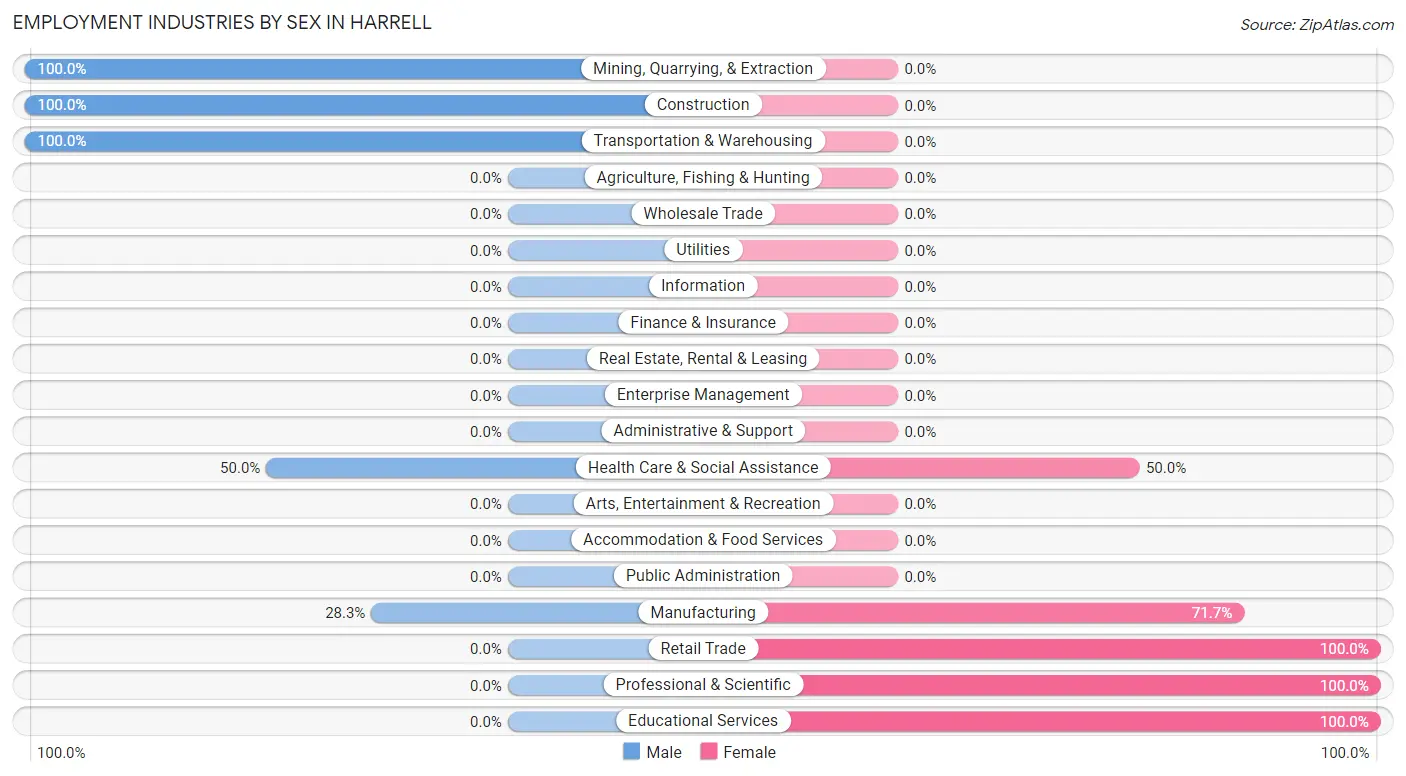
| Industry | Male | Female |
| Agriculture, Fishing & Hunting | 0 (0.0%) | 0 (0.0%) |
| Mining, Quarrying, & Extraction | 4 (100.0%) | 0 (0.0%) |
| Construction | 3 (100.0%) | 0 (0.0%) |
| Manufacturing | 13 (28.3%) | 33 (71.7%) |
| Wholesale Trade | 0 (0.0%) | 0 (0.0%) |
| Retail Trade | 0 (0.0%) | 7 (100.0%) |
| Transportation & Warehousing | 6 (100.0%) | 0 (0.0%) |
| Utilities | 0 (0.0%) | 0 (0.0%) |
| Information | 0 (0.0%) | 0 (0.0%) |
| Finance & Insurance | 0 (0.0%) | 0 (0.0%) |
| Real Estate, Rental & Leasing | 0 (0.0%) | 0 (0.0%) |
| Professional & Scientific | 0 (0.0%) | 6 (100.0%) |
| Enterprise Management | 0 (0.0%) | 0 (0.0%) |
| Administrative & Support | 0 (0.0%) | 0 (0.0%) |
| Educational Services | 0 (0.0%) | 8 (100.0%) |
| Health Care & Social Assistance | 6 (50.0%) | 6 (50.0%) |
| Arts, Entertainment & Recreation | 0 (0.0%) | 0 (0.0%) |
| Accommodation & Food Services | 0 (0.0%) | 0 (0.0%) |
| Public Administration | 0 (0.0%) | 0 (0.0%) |
| Total | 35 (36.8%) | 60 (63.2%) |
Education in Harrell
School Enrollment in Harrell
The most common levels of schooling among the 39 students in Harrell are high school (12 | 30.8%), elementary school (10 | 25.6%), and nursery / preschool (8 | 20.5%).
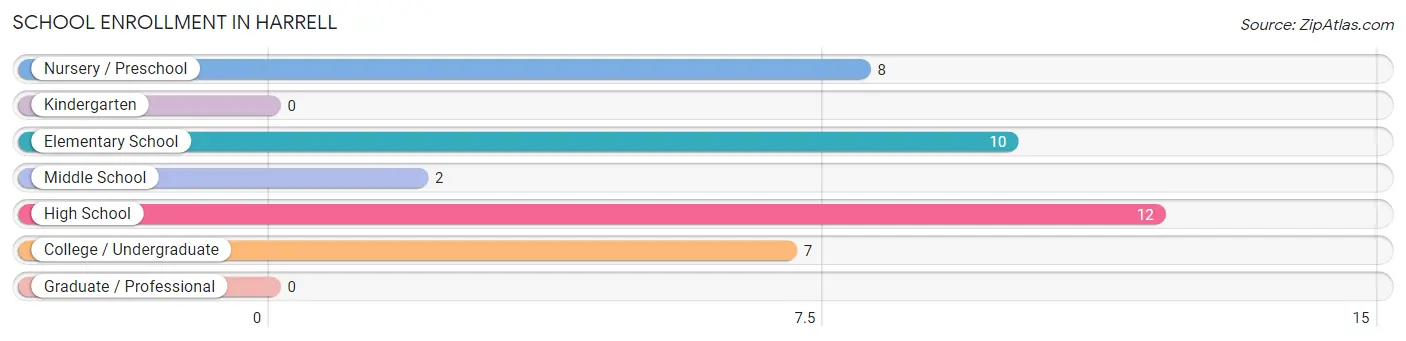
| School Level | # Students | % Students |
| Nursery / Preschool | 8 | 20.5% |
| Kindergarten | 0 | 0.0% |
| Elementary School | 10 | 25.6% |
| Middle School | 2 | 5.1% |
| High School | 12 | 30.8% |
| College / Undergraduate | 7 | 17.9% |
| Graduate / Professional | 0 | 0.0% |
| Total | 39 | 100.0% |
School Enrollment by Age by Funding Source in Harrell
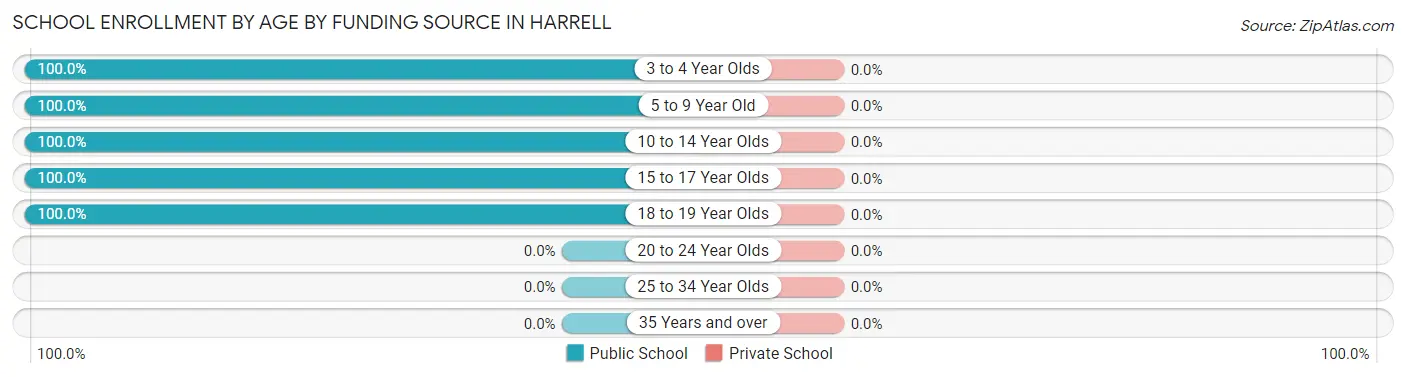
| Age Bracket | Public School | Private School |
| 3 to 4 Year Olds | 8 (100.0%) | 0 (0.0%) |
| 5 to 9 Year Old | 10 (100.0%) | 0 (0.0%) |
| 10 to 14 Year Olds | 6 (100.0%) | 0 (0.0%) |
| 15 to 17 Year Olds | 8 (100.0%) | 0 (0.0%) |
| 18 to 19 Year Olds | 7 (100.0%) | 0 (0.0%) |
| 20 to 24 Year Olds | 0 (0.0%) | 0 (0.0%) |
| 25 to 34 Year Olds | 0 (0.0%) | 0 (0.0%) |
| 35 Years and over | 0 (0.0%) | 0 (0.0%) |
| Total | 39 (100.0%) | 0 (0.0%) |
Educational Attainment by Field of Study in Harrell
Education (35 | 81.4%), and liberal arts & history (8 | 18.6%) are the most common fields of study among 43 individuals in Harrell who have obtained a bachelor's degree or higher.
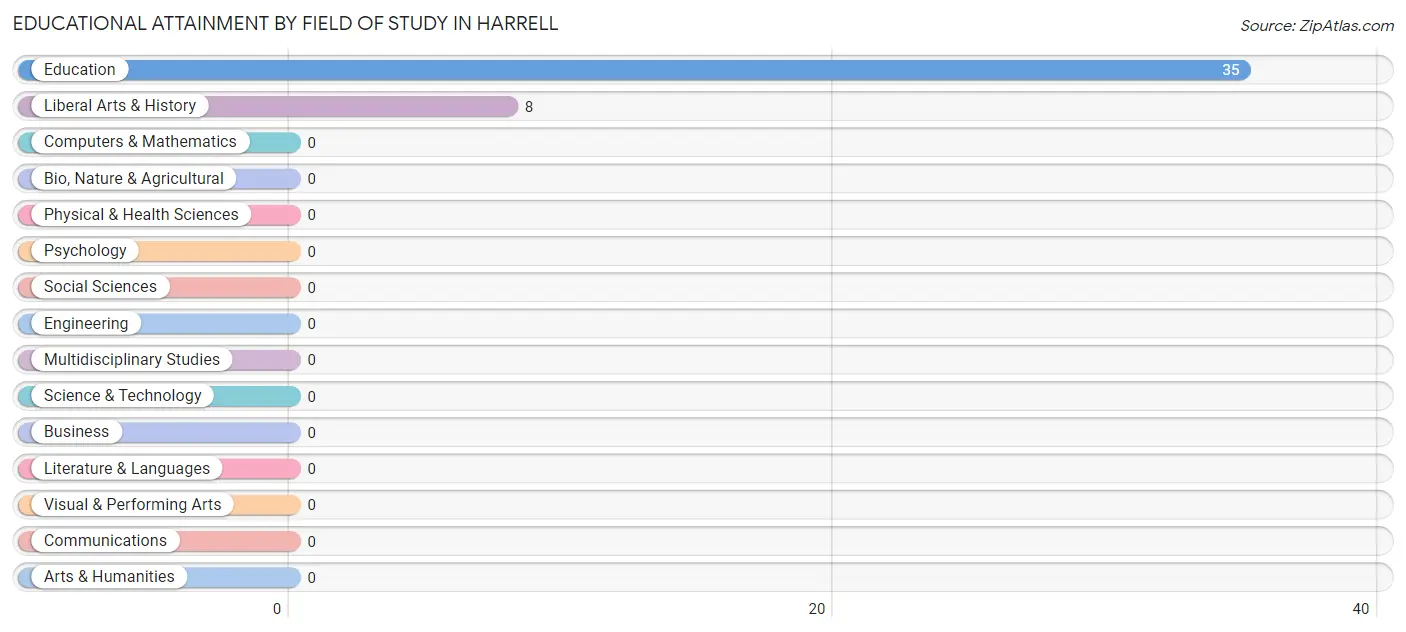
| Field of Study | # Graduates | % Graduates |
| Computers & Mathematics | 0 | 0.0% |
| Bio, Nature & Agricultural | 0 | 0.0% |
| Physical & Health Sciences | 0 | 0.0% |
| Psychology | 0 | 0.0% |
| Social Sciences | 0 | 0.0% |
| Engineering | 0 | 0.0% |
| Multidisciplinary Studies | 0 | 0.0% |
| Science & Technology | 0 | 0.0% |
| Business | 0 | 0.0% |
| Education | 35 | 81.4% |
| Literature & Languages | 0 | 0.0% |
| Liberal Arts & History | 8 | 18.6% |
| Visual & Performing Arts | 0 | 0.0% |
| Communications | 0 | 0.0% |
| Arts & Humanities | 0 | 0.0% |
| Total | 43 | 100.0% |
Transportation & Commute in Harrell
Vehicle Availability by Sex in Harrell
The most prevalent vehicle ownership categories in Harrell are males with 2 vehicles (15, accounting for 42.9%) and females with 2 vehicles (9, making up 25.0%).
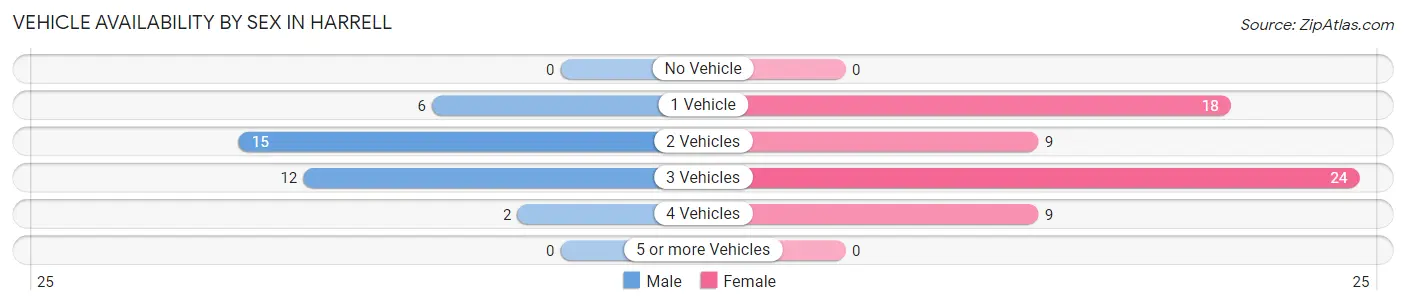
| Vehicles Available | Male | Female |
| No Vehicle | 0 (0.0%) | 0 (0.0%) |
| 1 Vehicle | 6 (17.1%) | 18 (30.0%) |
| 2 Vehicles | 15 (42.9%) | 9 (15.0%) |
| 3 Vehicles | 12 (34.3%) | 24 (40.0%) |
| 4 Vehicles | 2 (5.7%) | 9 (15.0%) |
| 5 or more Vehicles | 0 (0.0%) | 0 (0.0%) |
| Total | 35 (100.0%) | 60 (100.0%) |
Commute Time in Harrell
The most frequently occuring commute durations in Harrell are 30 to 34 minutes (26 commuters, 27.4%), 10 to 14 minutes (14 commuters, 14.7%), and 25 to 29 minutes (12 commuters, 12.6%).
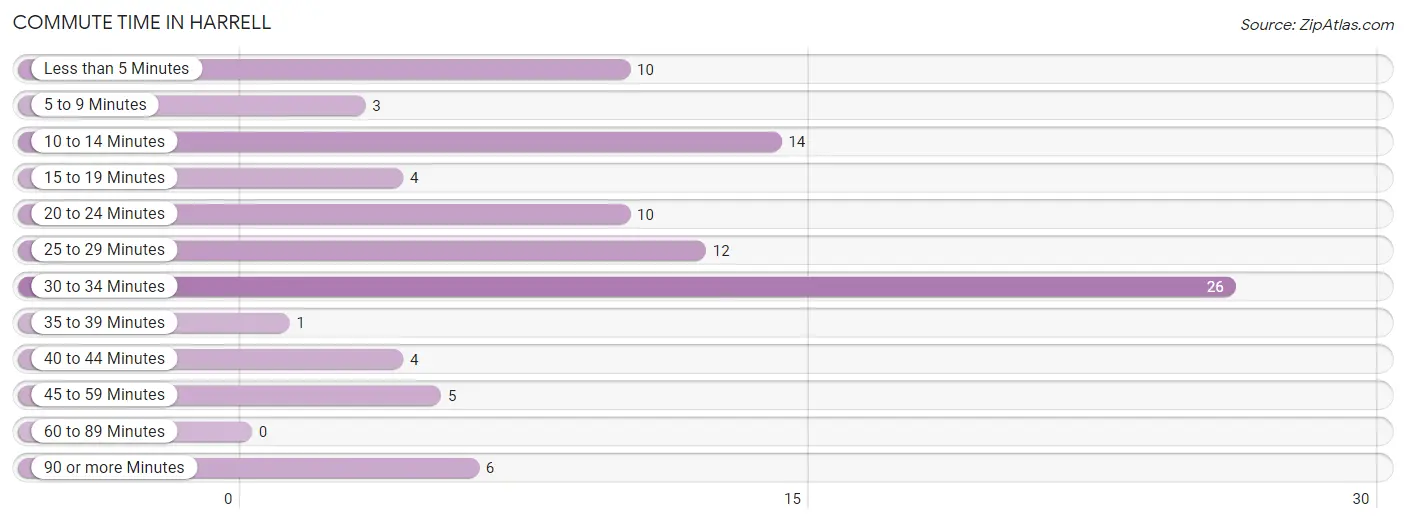
| Commute Time | # Commuters | % Commuters |
| Less than 5 Minutes | 10 | 10.5% |
| 5 to 9 Minutes | 3 | 3.2% |
| 10 to 14 Minutes | 14 | 14.7% |
| 15 to 19 Minutes | 4 | 4.2% |
| 20 to 24 Minutes | 10 | 10.5% |
| 25 to 29 Minutes | 12 | 12.6% |
| 30 to 34 Minutes | 26 | 27.4% |
| 35 to 39 Minutes | 1 | 1.1% |
| 40 to 44 Minutes | 4 | 4.2% |
| 45 to 59 Minutes | 5 | 5.3% |
| 60 to 89 Minutes | 0 | 0.0% |
| 90 or more Minutes | 6 | 6.3% |
Commute Time by Sex in Harrell
The most common commute times in Harrell are 10 to 14 minutes (10 commuters, 28.6%) for males and 30 to 34 minutes (19 commuters, 31.7%) for females.
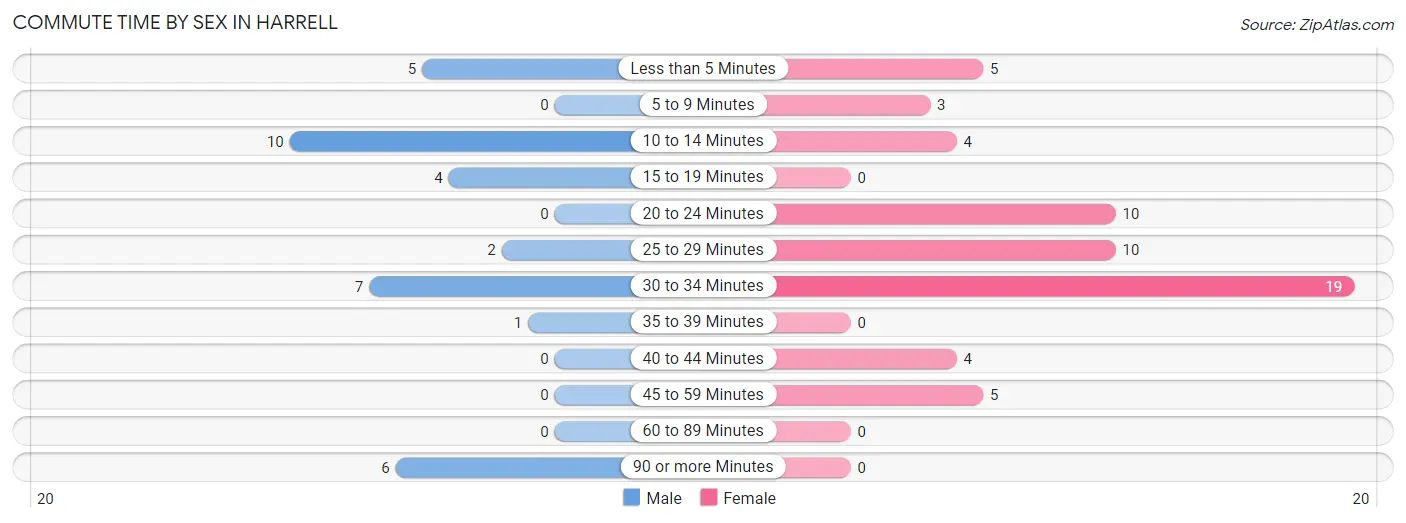
| Commute Time | Male | Female |
| Less than 5 Minutes | 5 (14.3%) | 5 (8.3%) |
| 5 to 9 Minutes | 0 (0.0%) | 3 (5.0%) |
| 10 to 14 Minutes | 10 (28.6%) | 4 (6.7%) |
| 15 to 19 Minutes | 4 (11.4%) | 0 (0.0%) |
| 20 to 24 Minutes | 0 (0.0%) | 10 (16.7%) |
| 25 to 29 Minutes | 2 (5.7%) | 10 (16.7%) |
| 30 to 34 Minutes | 7 (20.0%) | 19 (31.7%) |
| 35 to 39 Minutes | 1 (2.9%) | 0 (0.0%) |
| 40 to 44 Minutes | 0 (0.0%) | 4 (6.7%) |
| 45 to 59 Minutes | 0 (0.0%) | 5 (8.3%) |
| 60 to 89 Minutes | 0 (0.0%) | 0 (0.0%) |
| 90 or more Minutes | 6 (17.1%) | 0 (0.0%) |
Time of Departure to Work by Sex in Harrell
The most frequent times of departure to work in Harrell are 6:00 AM to 6:29 AM (9, 25.7%) for males and 6:30 AM to 6:59 AM (13, 21.7%) for females.
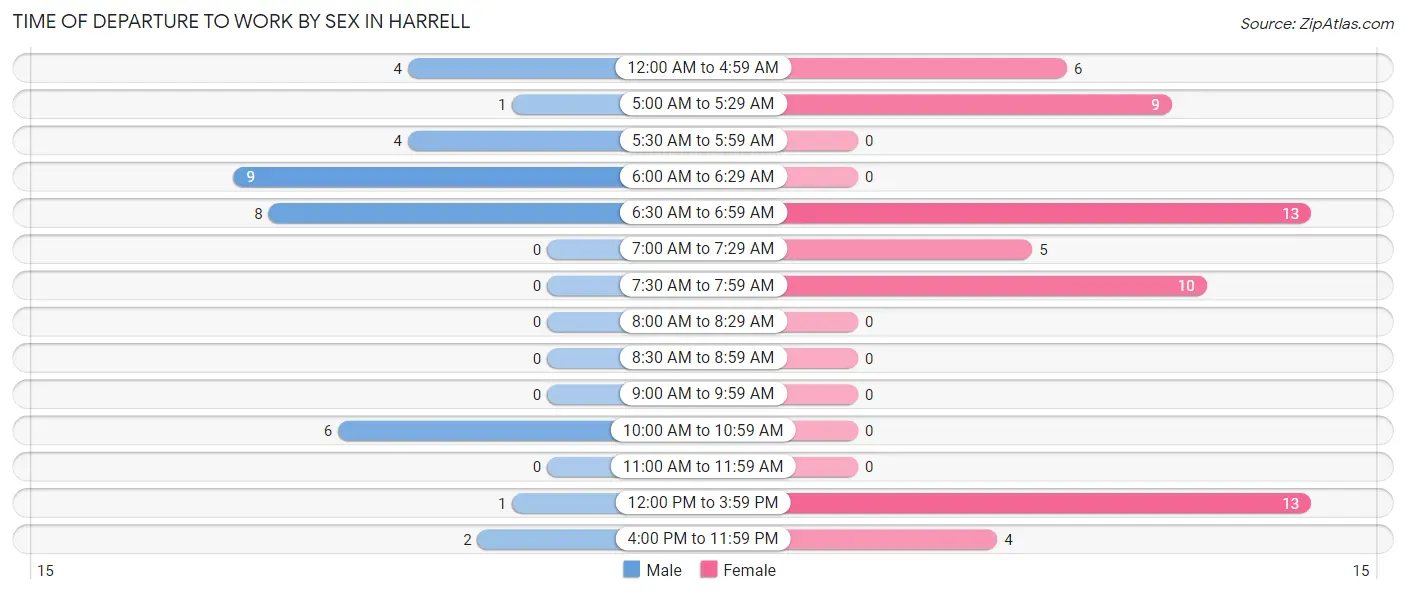
| Time of Departure | Male | Female |
| 12:00 AM to 4:59 AM | 4 (11.4%) | 6 (10.0%) |
| 5:00 AM to 5:29 AM | 1 (2.9%) | 9 (15.0%) |
| 5:30 AM to 5:59 AM | 4 (11.4%) | 0 (0.0%) |
| 6:00 AM to 6:29 AM | 9 (25.7%) | 0 (0.0%) |
| 6:30 AM to 6:59 AM | 8 (22.9%) | 13 (21.7%) |
| 7:00 AM to 7:29 AM | 0 (0.0%) | 5 (8.3%) |
| 7:30 AM to 7:59 AM | 0 (0.0%) | 10 (16.7%) |
| 8:00 AM to 8:29 AM | 0 (0.0%) | 0 (0.0%) |
| 8:30 AM to 8:59 AM | 0 (0.0%) | 0 (0.0%) |
| 9:00 AM to 9:59 AM | 0 (0.0%) | 0 (0.0%) |
| 10:00 AM to 10:59 AM | 6 (17.1%) | 0 (0.0%) |
| 11:00 AM to 11:59 AM | 0 (0.0%) | 0 (0.0%) |
| 12:00 PM to 3:59 PM | 1 (2.9%) | 13 (21.7%) |
| 4:00 PM to 11:59 PM | 2 (5.7%) | 4 (6.7%) |
| Total | 35 (100.0%) | 60 (100.0%) |
Housing Occupancy in Harrell
Occupancy by Ownership in Harrell
Of the total 122 dwellings in Harrell, owner-occupied units account for 117 (95.9%), while renter-occupied units make up 5 (4.1%).
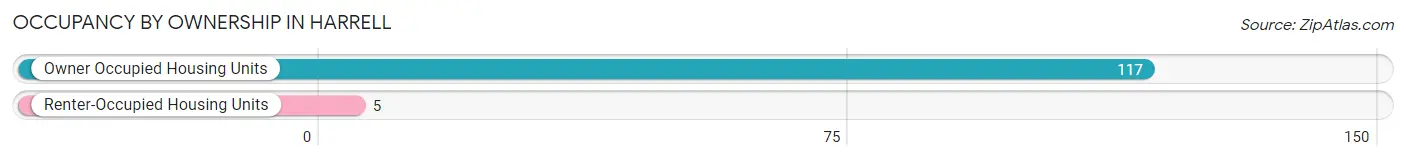
| Occupancy | # Housing Units | % Housing Units |
| Owner Occupied Housing Units | 117 | 95.9% |
| Renter-Occupied Housing Units | 5 | 4.1% |
| Total Occupied Housing Units | 122 | 100.0% |
Occupancy by Household Size in Harrell
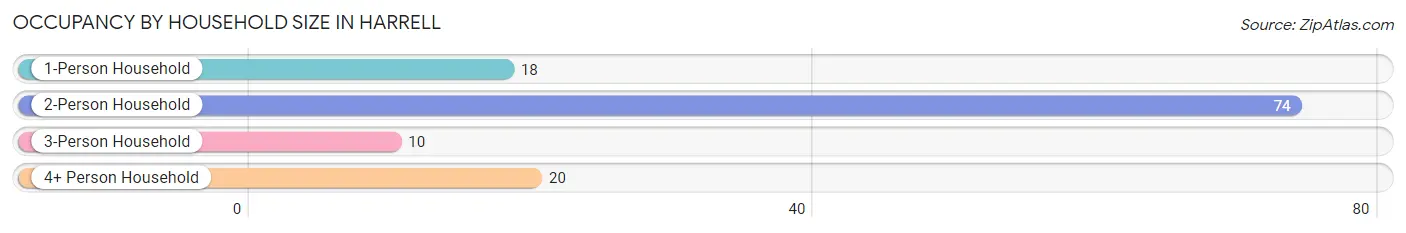
| Household Size | # Housing Units | % Housing Units |
| 1-Person Household | 18 | 14.7% |
| 2-Person Household | 74 | 60.7% |
| 3-Person Household | 10 | 8.2% |
| 4+ Person Household | 20 | 16.4% |
| Total Housing Units | 122 | 100.0% |
Occupancy by Ownership by Household Size in Harrell
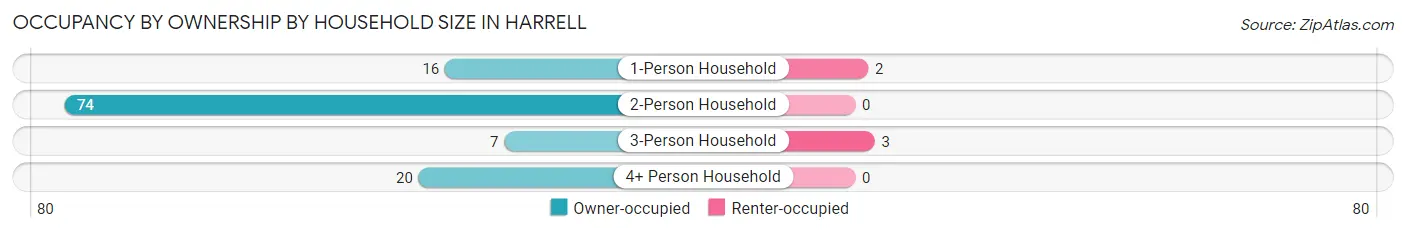
| Household Size | Owner-occupied | Renter-occupied |
| 1-Person Household | 16 (88.9%) | 2 (11.1%) |
| 2-Person Household | 74 (100.0%) | 0 (0.0%) |
| 3-Person Household | 7 (70.0%) | 3 (30.0%) |
| 4+ Person Household | 20 (100.0%) | 0 (0.0%) |
| Total Housing Units | 117 (95.9%) | 5 (4.1%) |
Occupancy by Educational Attainment in Harrell
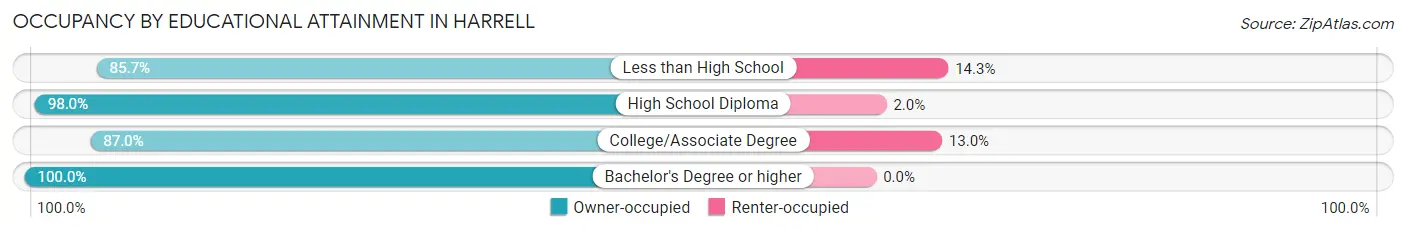
| Household Size | Owner-occupied | Renter-occupied |
| Less than High School | 6 (85.7%) | 1 (14.3%) |
| High School Diploma | 48 (98.0%) | 1 (2.0%) |
| College/Associate Degree | 20 (87.0%) | 3 (13.0%) |
| Bachelor's Degree or higher | 43 (100.0%) | 0 (0.0%) |
Occupancy by Age of Householder in Harrell
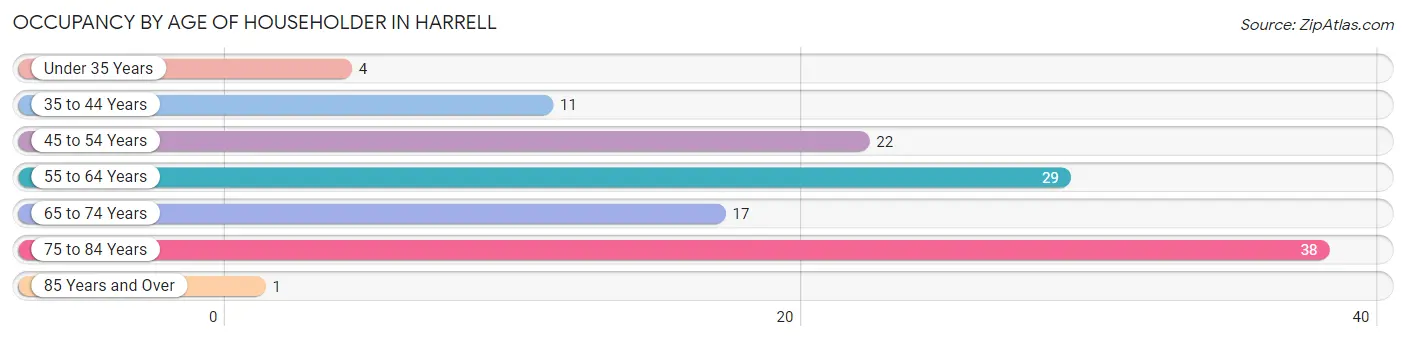
| Age Bracket | # Households | % Households |
| Under 35 Years | 4 | 3.3% |
| 35 to 44 Years | 11 | 9.0% |
| 45 to 54 Years | 22 | 18.0% |
| 55 to 64 Years | 29 | 23.8% |
| 65 to 74 Years | 17 | 13.9% |
| 75 to 84 Years | 38 | 31.1% |
| 85 Years and Over | 1 | 0.8% |
| Total | 122 | 100.0% |
Housing Finances in Harrell
Median Income by Occupancy in Harrell
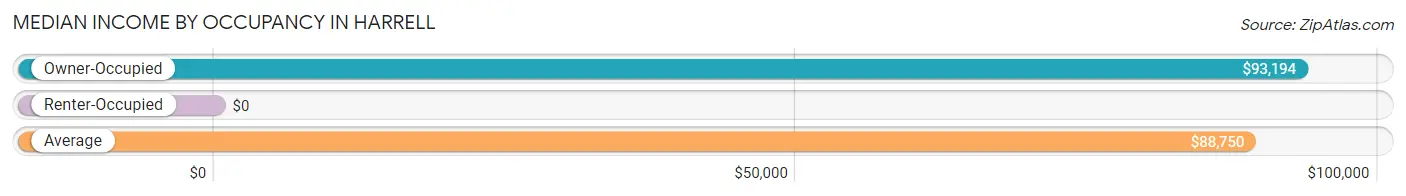
| Occupancy Type | # Households | Median Income |
| Owner-Occupied | 117 (95.9%) | $93,194 |
| Renter-Occupied | 5 (4.1%) | $0 |
| Average | 122 (100.0%) | $88,750 |
Occupancy by Householder Income Bracket in Harrell
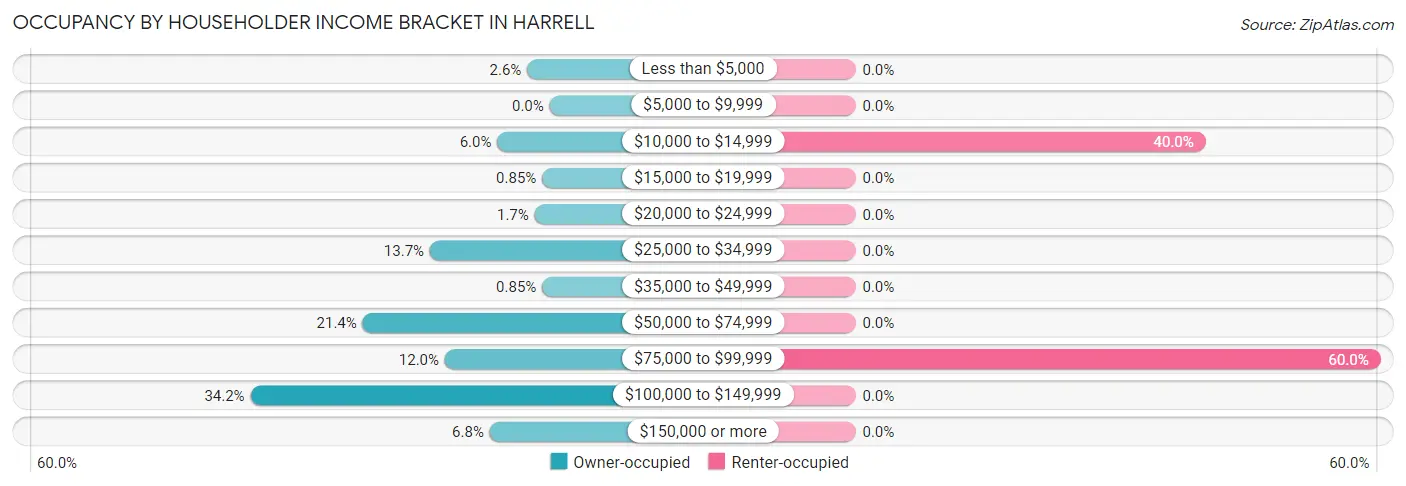
| Income Bracket | Owner-occupied | Renter-occupied |
| Less than $5,000 | 3 (2.6%) | 0 (0.0%) |
| $5,000 to $9,999 | 0 (0.0%) | 0 (0.0%) |
| $10,000 to $14,999 | 7 (6.0%) | 2 (40.0%) |
| $15,000 to $19,999 | 1 (0.9%) | 0 (0.0%) |
| $20,000 to $24,999 | 2 (1.7%) | 0 (0.0%) |
| $25,000 to $34,999 | 16 (13.7%) | 0 (0.0%) |
| $35,000 to $49,999 | 1 (0.9%) | 0 (0.0%) |
| $50,000 to $74,999 | 25 (21.4%) | 0 (0.0%) |
| $75,000 to $99,999 | 14 (12.0%) | 3 (60.0%) |
| $100,000 to $149,999 | 40 (34.2%) | 0 (0.0%) |
| $150,000 or more | 8 (6.8%) | 0 (0.0%) |
| Total | 117 (100.0%) | 5 (100.0%) |
Monthly Housing Cost Tiers in Harrell
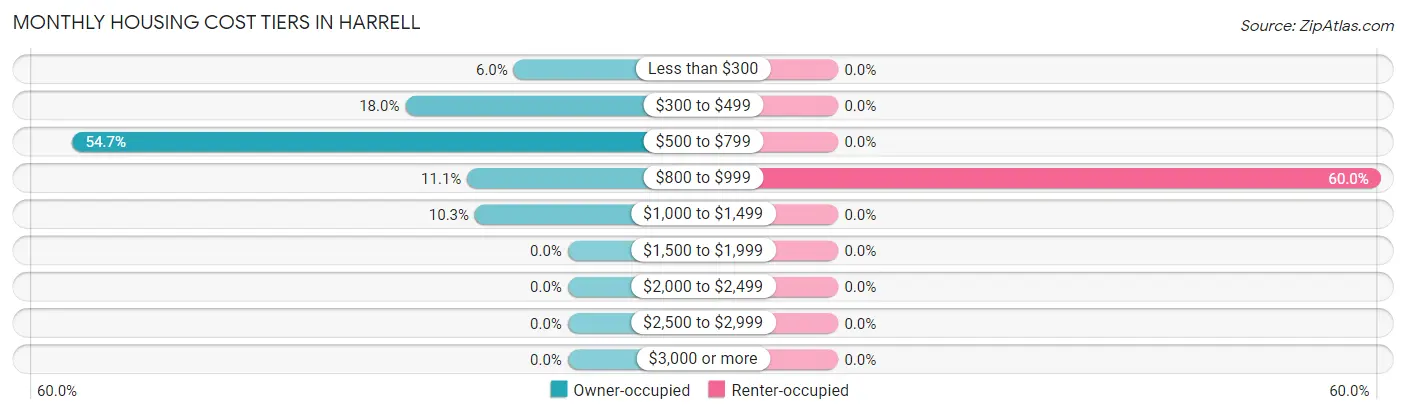
| Monthly Cost | Owner-occupied | Renter-occupied |
| Less than $300 | 7 (6.0%) | 0 (0.0%) |
| $300 to $499 | 21 (17.9%) | 0 (0.0%) |
| $500 to $799 | 64 (54.7%) | 0 (0.0%) |
| $800 to $999 | 13 (11.1%) | 3 (60.0%) |
| $1,000 to $1,499 | 12 (10.3%) | 0 (0.0%) |
| $1,500 to $1,999 | 0 (0.0%) | 0 (0.0%) |
| $2,000 to $2,499 | 0 (0.0%) | 0 (0.0%) |
| $2,500 to $2,999 | 0 (0.0%) | 0 (0.0%) |
| $3,000 or more | 0 (0.0%) | 0 (0.0%) |
| Total | 117 (100.0%) | 5 (100.0%) |
Physical Housing Characteristics in Harrell
Housing Structures in Harrell
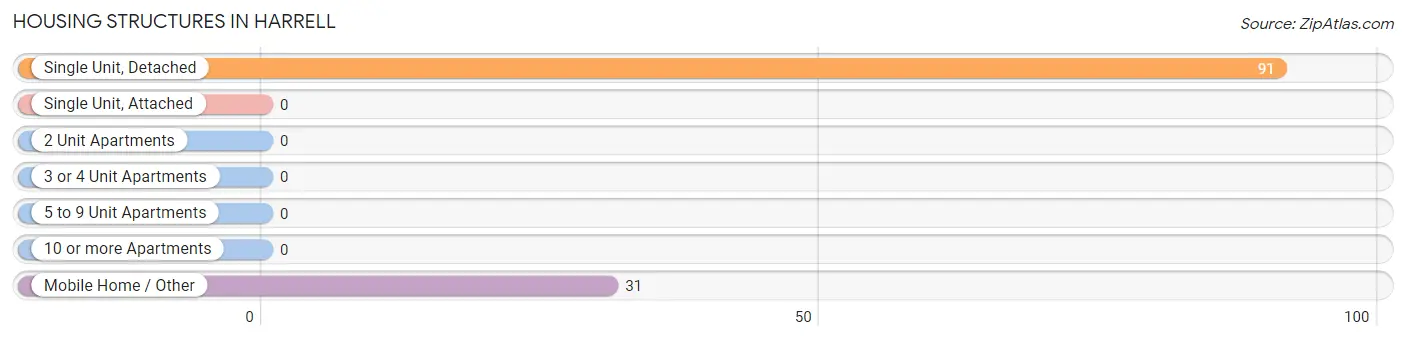
| Structure Type | # Housing Units | % Housing Units |
| Single Unit, Detached | 91 | 74.6% |
| Single Unit, Attached | 0 | 0.0% |
| 2 Unit Apartments | 0 | 0.0% |
| 3 or 4 Unit Apartments | 0 | 0.0% |
| 5 to 9 Unit Apartments | 0 | 0.0% |
| 10 or more Apartments | 0 | 0.0% |
| Mobile Home / Other | 31 | 25.4% |
| Total | 122 | 100.0% |
Housing Structures by Occupancy in Harrell
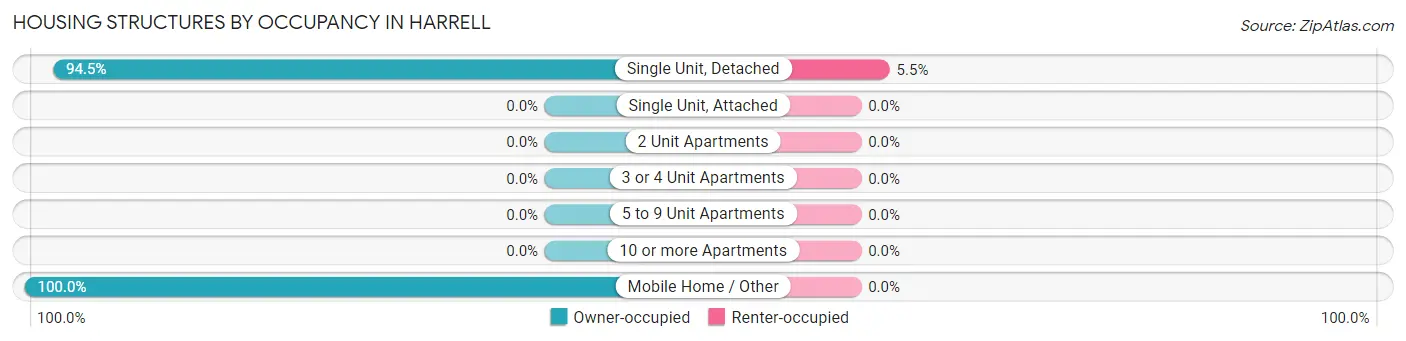
| Structure Type | Owner-occupied | Renter-occupied |
| Single Unit, Detached | 86 (94.5%) | 5 (5.5%) |
| Single Unit, Attached | 0 (0.0%) | 0 (0.0%) |
| 2 Unit Apartments | 0 (0.0%) | 0 (0.0%) |
| 3 or 4 Unit Apartments | 0 (0.0%) | 0 (0.0%) |
| 5 to 9 Unit Apartments | 0 (0.0%) | 0 (0.0%) |
| 10 or more Apartments | 0 (0.0%) | 0 (0.0%) |
| Mobile Home / Other | 31 (100.0%) | 0 (0.0%) |
| Total | 117 (95.9%) | 5 (4.1%) |
Housing Structures by Number of Rooms in Harrell
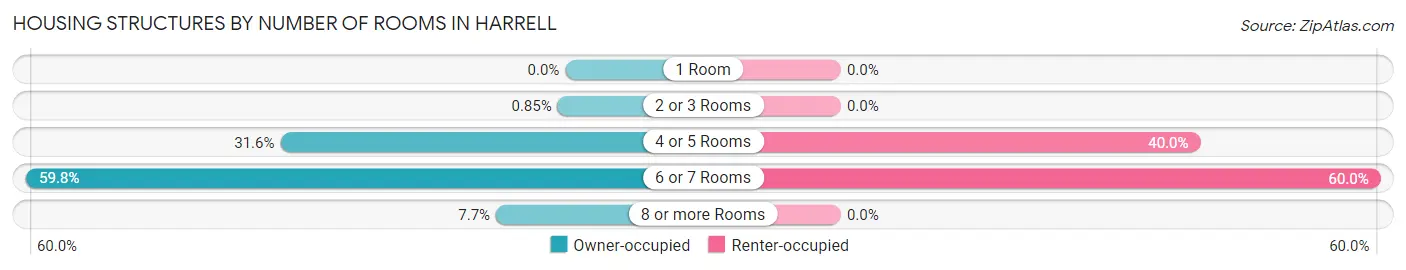
| Number of Rooms | Owner-occupied | Renter-occupied |
| 1 Room | 0 (0.0%) | 0 (0.0%) |
| 2 or 3 Rooms | 1 (0.9%) | 0 (0.0%) |
| 4 or 5 Rooms | 37 (31.6%) | 2 (40.0%) |
| 6 or 7 Rooms | 70 (59.8%) | 3 (60.0%) |
| 8 or more Rooms | 9 (7.7%) | 0 (0.0%) |
| Total | 117 (100.0%) | 5 (100.0%) |
Housing Structure by Heating Type in Harrell
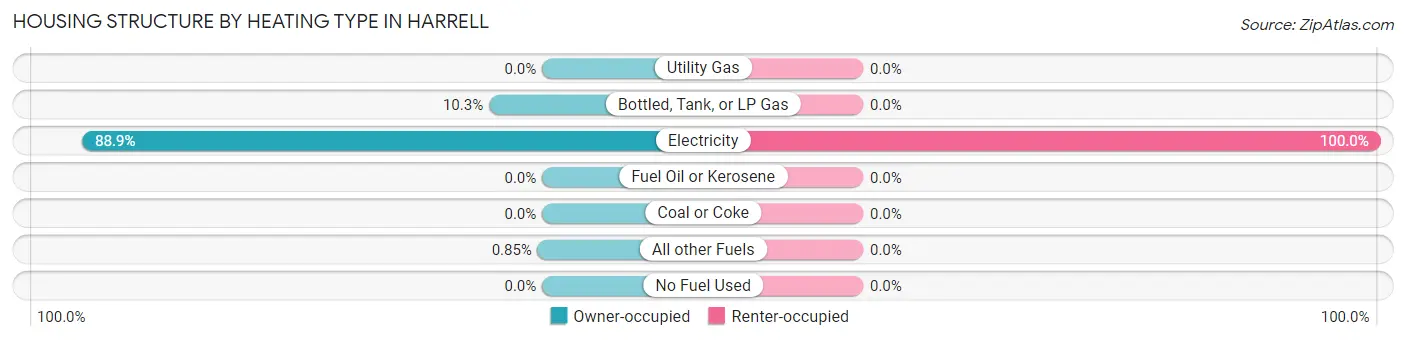
| Heating Type | Owner-occupied | Renter-occupied |
| Utility Gas | 0 (0.0%) | 0 (0.0%) |
| Bottled, Tank, or LP Gas | 12 (10.3%) | 0 (0.0%) |
| Electricity | 104 (88.9%) | 5 (100.0%) |
| Fuel Oil or Kerosene | 0 (0.0%) | 0 (0.0%) |
| Coal or Coke | 0 (0.0%) | 0 (0.0%) |
| All other Fuels | 1 (0.9%) | 0 (0.0%) |
| No Fuel Used | 0 (0.0%) | 0 (0.0%) |
| Total | 117 (100.0%) | 5 (100.0%) |
Household Vehicle Usage in Harrell
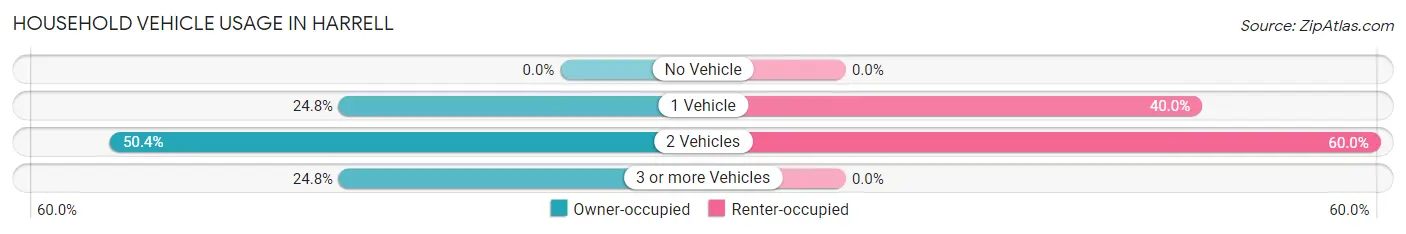
| Vehicles per Household | Owner-occupied | Renter-occupied |
| No Vehicle | 0 (0.0%) | 0 (0.0%) |
| 1 Vehicle | 29 (24.8%) | 2 (40.0%) |
| 2 Vehicles | 59 (50.4%) | 3 (60.0%) |
| 3 or more Vehicles | 29 (24.8%) | 0 (0.0%) |
| Total | 117 (100.0%) | 5 (100.0%) |
Real Estate & Mortgages in Harrell
Real Estate and Mortgage Overview in Harrell
| Characteristic | Without Mortgage | With Mortgage |
| Housing Units | 79 | 38 |
| Median Property Value | $101,800 | $142,900 |
| Median Household Income | $100,107 | $3 |
| Monthly Housing Costs | $526 | $0 |
| Real Estate Taxes | $199 | $5 |
Property Value by Mortgage Status in Harrell
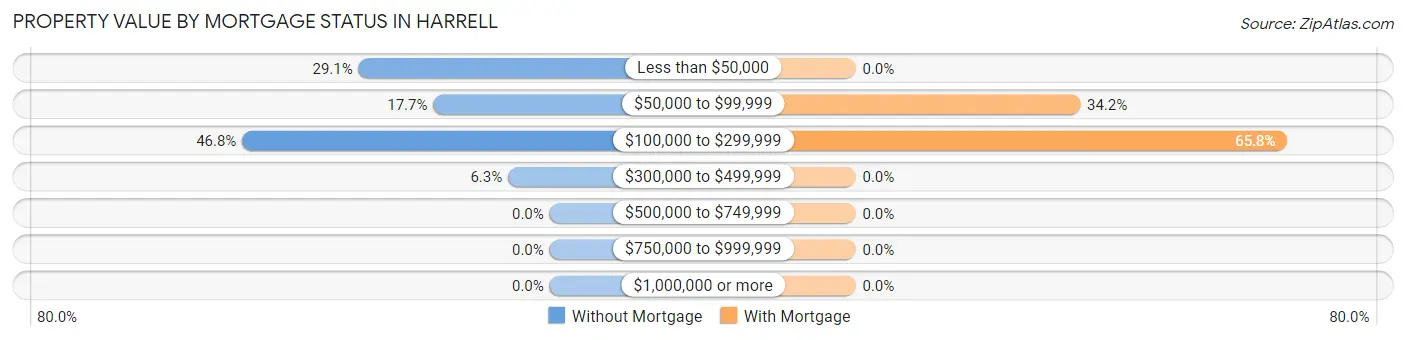
| Property Value | Without Mortgage | With Mortgage |
| Less than $50,000 | 23 (29.1%) | 0 (0.0%) |
| $50,000 to $99,999 | 14 (17.7%) | 13 (34.2%) |
| $100,000 to $299,999 | 37 (46.8%) | 25 (65.8%) |
| $300,000 to $499,999 | 5 (6.3%) | 0 (0.0%) |
| $500,000 to $749,999 | 0 (0.0%) | 0 (0.0%) |
| $750,000 to $999,999 | 0 (0.0%) | 0 (0.0%) |
| $1,000,000 or more | 0 (0.0%) | 0 (0.0%) |
| Total | 79 (100.0%) | 38 (100.0%) |
Household Income by Mortgage Status in Harrell
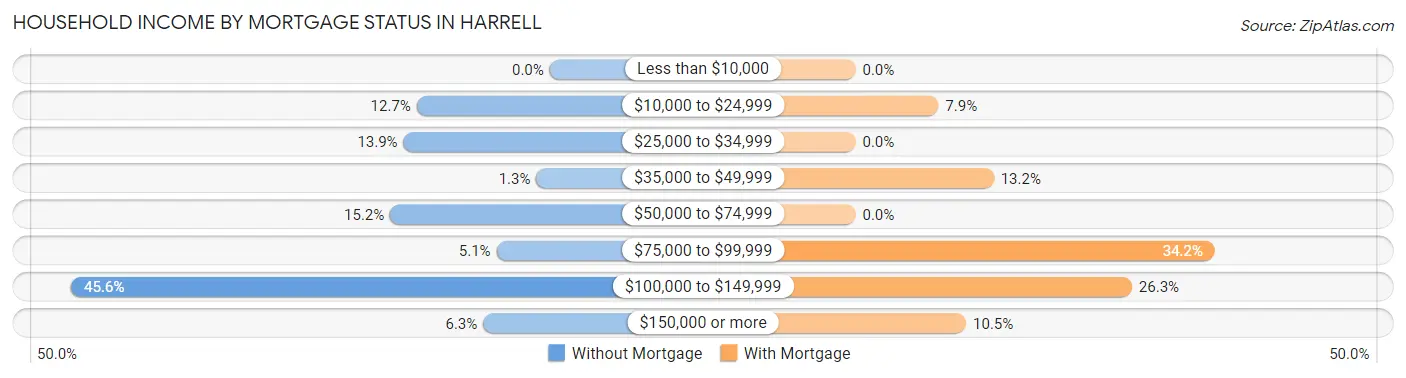
| Household Income | Without Mortgage | With Mortgage |
| Less than $10,000 | 0 (0.0%) | 0 (0.0%) |
| $10,000 to $24,999 | 10 (12.7%) | 3 (7.9%) |
| $25,000 to $34,999 | 11 (13.9%) | 0 (0.0%) |
| $35,000 to $49,999 | 1 (1.3%) | 5 (13.2%) |
| $50,000 to $74,999 | 12 (15.2%) | 0 (0.0%) |
| $75,000 to $99,999 | 4 (5.1%) | 13 (34.2%) |
| $100,000 to $149,999 | 36 (45.6%) | 10 (26.3%) |
| $150,000 or more | 5 (6.3%) | 4 (10.5%) |
| Total | 79 (100.0%) | 38 (100.0%) |
Property Value to Household Income Ratio in Harrell
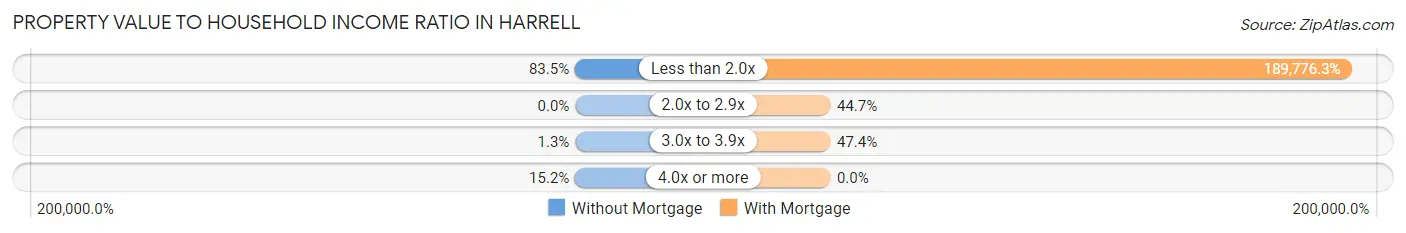
| Value-to-Income Ratio | Without Mortgage | With Mortgage |
| Less than 2.0x | 66 (83.5%) | 72,115 (189,776.3%) |
| 2.0x to 2.9x | 0 (0.0%) | 17 (44.7%) |
| 3.0x to 3.9x | 1 (1.3%) | 18 (47.4%) |
| 4.0x or more | 12 (15.2%) | 0 (0.0%) |
| Total | 79 (100.0%) | 38 (100.0%) |
Real Estate Taxes by Mortgage Status in Harrell
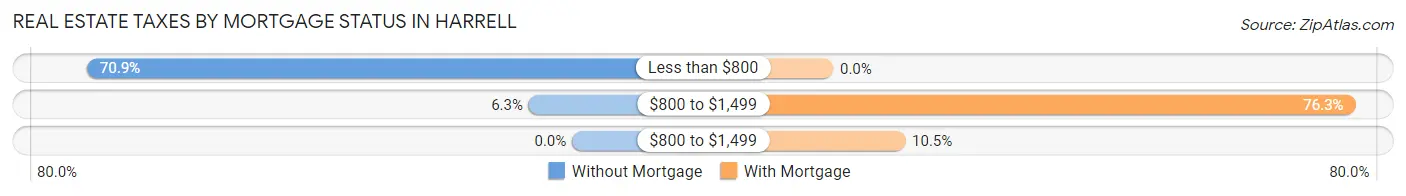
| Property Taxes | Without Mortgage | With Mortgage |
| Less than $800 | 56 (70.9%) | 0 (0.0%) |
| $800 to $1,499 | 5 (6.3%) | 29 (76.3%) |
| $800 to $1,499 | 0 (0.0%) | 4 (10.5%) |
| Total | 79 (100.0%) | 38 (100.0%) |
Health & Disability in Harrell
Health Insurance Coverage by Age in Harrell
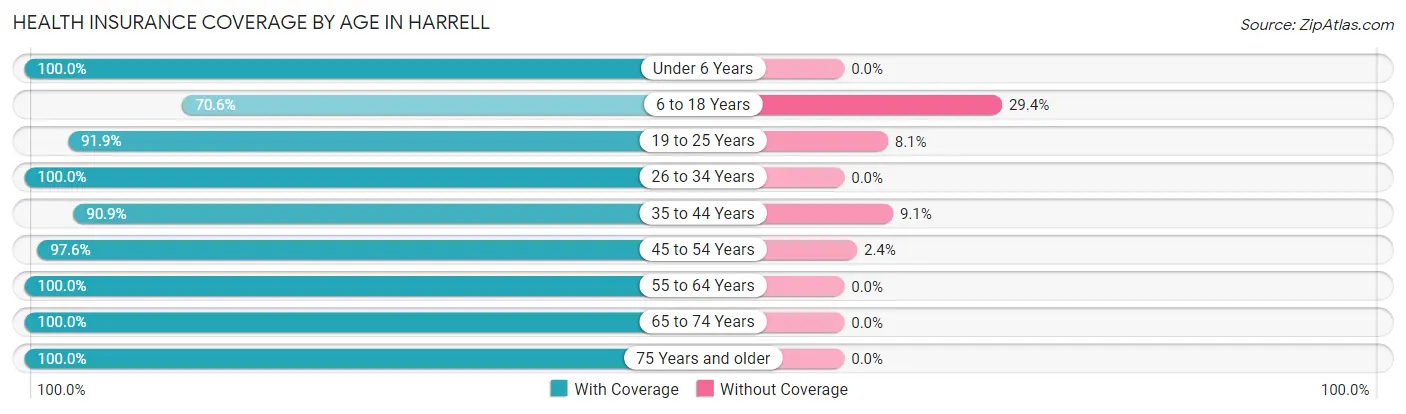
| Age Bracket | With Coverage | Without Coverage |
| Under 6 Years | 18 (100.0%) | 0 (0.0%) |
| 6 to 18 Years | 24 (70.6%) | 10 (29.4%) |
| 19 to 25 Years | 34 (91.9%) | 3 (8.1%) |
| 26 to 34 Years | 23 (100.0%) | 0 (0.0%) |
| 35 to 44 Years | 10 (90.9%) | 1 (9.1%) |
| 45 to 54 Years | 41 (97.6%) | 1 (2.4%) |
| 55 to 64 Years | 36 (100.0%) | 0 (0.0%) |
| 65 to 74 Years | 20 (100.0%) | 0 (0.0%) |
| 75 Years and older | 60 (100.0%) | 0 (0.0%) |
| Total | 266 (94.7%) | 15 (5.3%) |
Health Insurance Coverage by Citizenship Status in Harrell
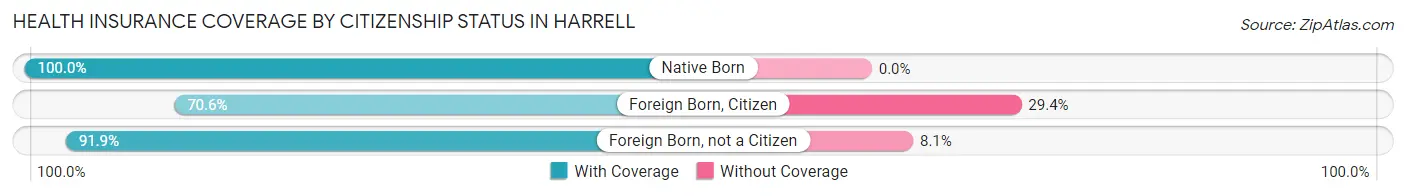
| Citizenship Status | With Coverage | Without Coverage |
| Native Born | 18 (100.0%) | 0 (0.0%) |
| Foreign Born, Citizen | 24 (70.6%) | 10 (29.4%) |
| Foreign Born, not a Citizen | 34 (91.9%) | 3 (8.1%) |
Health Insurance Coverage by Household Income in Harrell
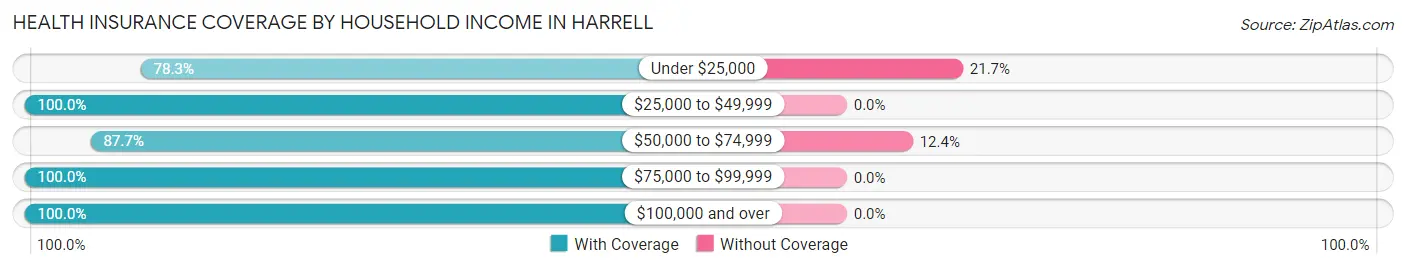
| Household Income | With Coverage | Without Coverage |
| Under $25,000 | 18 (78.3%) | 5 (21.7%) |
| $25,000 to $49,999 | 48 (100.0%) | 0 (0.0%) |
| $50,000 to $74,999 | 71 (87.6%) | 10 (12.3%) |
| $75,000 to $99,999 | 36 (100.0%) | 0 (0.0%) |
| $100,000 and over | 93 (100.0%) | 0 (0.0%) |
Public vs Private Health Insurance Coverage by Age in Harrell
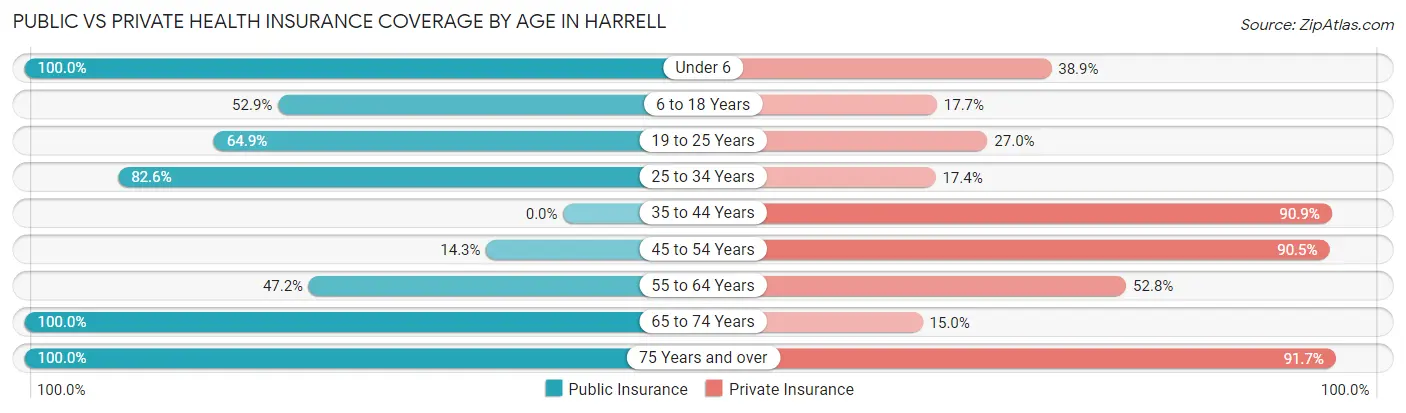
| Age Bracket | Public Insurance | Private Insurance |
| Under 6 | 18 (100.0%) | 7 (38.9%) |
| 6 to 18 Years | 18 (52.9%) | 6 (17.6%) |
| 19 to 25 Years | 24 (64.9%) | 10 (27.0%) |
| 25 to 34 Years | 19 (82.6%) | 4 (17.4%) |
| 35 to 44 Years | 0 (0.0%) | 10 (90.9%) |
| 45 to 54 Years | 6 (14.3%) | 38 (90.5%) |
| 55 to 64 Years | 17 (47.2%) | 19 (52.8%) |
| 65 to 74 Years | 20 (100.0%) | 3 (15.0%) |
| 75 Years and over | 60 (100.0%) | 55 (91.7%) |
| Total | 182 (64.8%) | 152 (54.1%) |
Disability Status by Sex by Age in Harrell
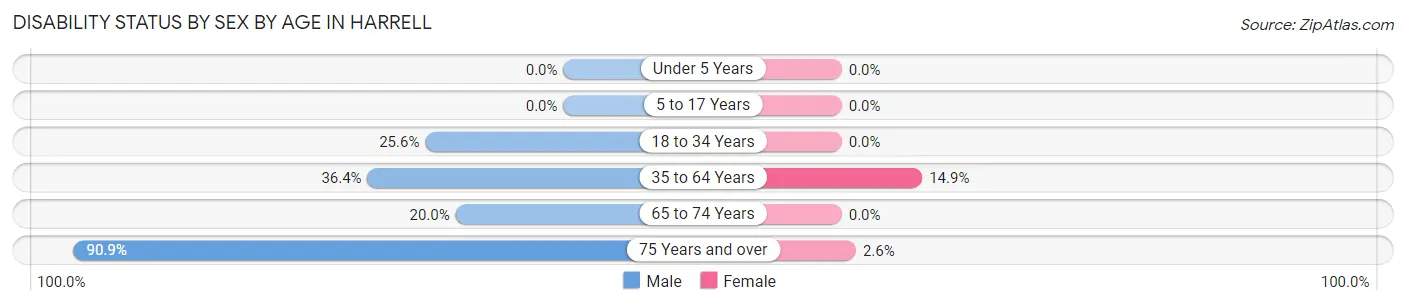
| Age Bracket | Male | Female |
| Under 5 Years | 0 (0.0%) | 0 (0.0%) |
| 5 to 17 Years | 0 (0.0%) | 0 (0.0%) |
| 18 to 34 Years | 10 (25.6%) | 0 (0.0%) |
| 35 to 64 Years | 8 (36.4%) | 10 (14.9%) |
| 65 to 74 Years | 3 (20.0%) | 0 (0.0%) |
| 75 Years and over | 20 (90.9%) | 1 (2.6%) |
Disability Class by Sex by Age in Harrell
Disability Class: Hearing Difficulty
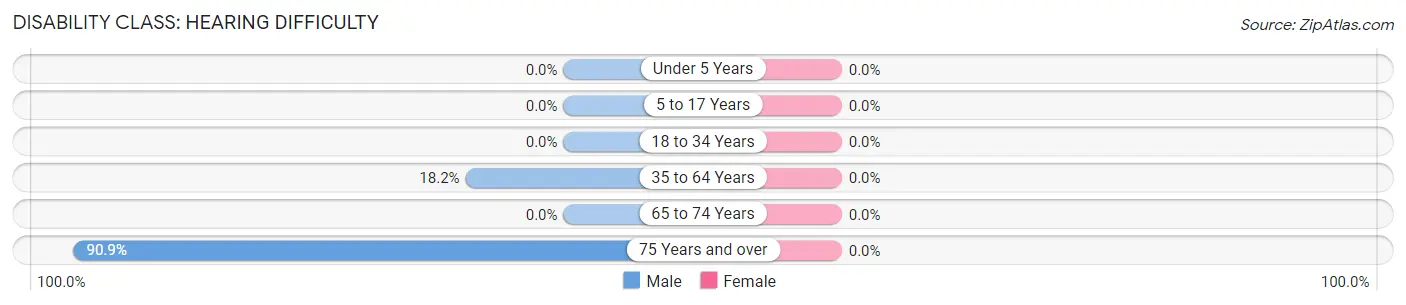
| Age Bracket | Male | Female |
| Under 5 Years | 0 (0.0%) | 0 (0.0%) |
| 5 to 17 Years | 0 (0.0%) | 0 (0.0%) |
| 18 to 34 Years | 0 (0.0%) | 0 (0.0%) |
| 35 to 64 Years | 4 (18.2%) | 0 (0.0%) |
| 65 to 74 Years | 0 (0.0%) | 0 (0.0%) |
| 75 Years and over | 20 (90.9%) | 0 (0.0%) |
Disability Class: Vision Difficulty
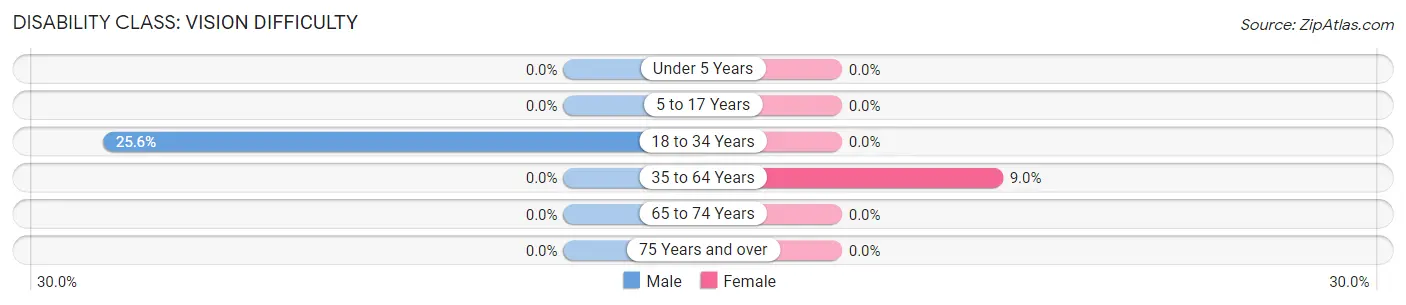
| Age Bracket | Male | Female |
| Under 5 Years | 0 (0.0%) | 0 (0.0%) |
| 5 to 17 Years | 0 (0.0%) | 0 (0.0%) |
| 18 to 34 Years | 10 (25.6%) | 0 (0.0%) |
| 35 to 64 Years | 0 (0.0%) | 6 (9.0%) |
| 65 to 74 Years | 0 (0.0%) | 0 (0.0%) |
| 75 Years and over | 0 (0.0%) | 0 (0.0%) |
Disability Class: Cognitive Difficulty
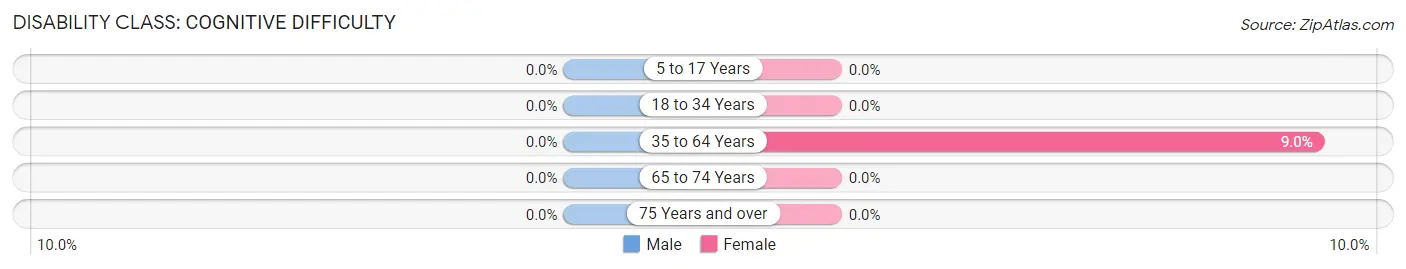
| Age Bracket | Male | Female |
| 5 to 17 Years | 0 (0.0%) | 0 (0.0%) |
| 18 to 34 Years | 0 (0.0%) | 0 (0.0%) |
| 35 to 64 Years | 0 (0.0%) | 6 (9.0%) |
| 65 to 74 Years | 0 (0.0%) | 0 (0.0%) |
| 75 Years and over | 0 (0.0%) | 0 (0.0%) |
Disability Class: Ambulatory Difficulty
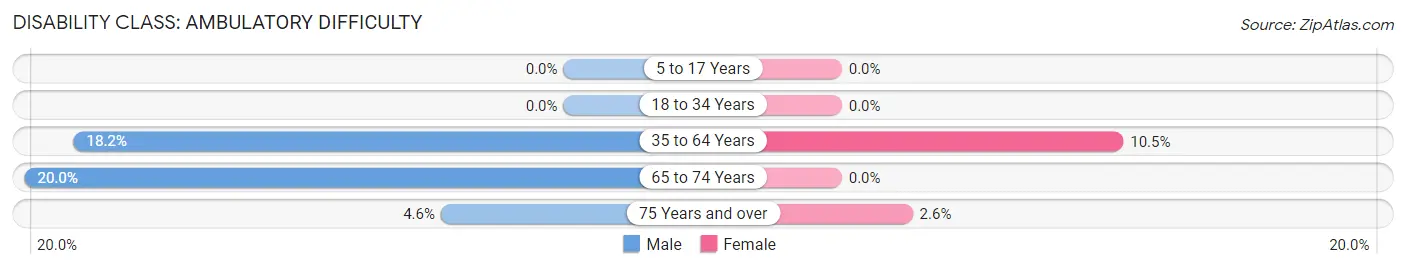
| Age Bracket | Male | Female |
| 5 to 17 Years | 0 (0.0%) | 0 (0.0%) |
| 18 to 34 Years | 0 (0.0%) | 0 (0.0%) |
| 35 to 64 Years | 4 (18.2%) | 7 (10.4%) |
| 65 to 74 Years | 3 (20.0%) | 0 (0.0%) |
| 75 Years and over | 1 (4.5%) | 1 (2.6%) |
Disability Class: Self-Care Difficulty
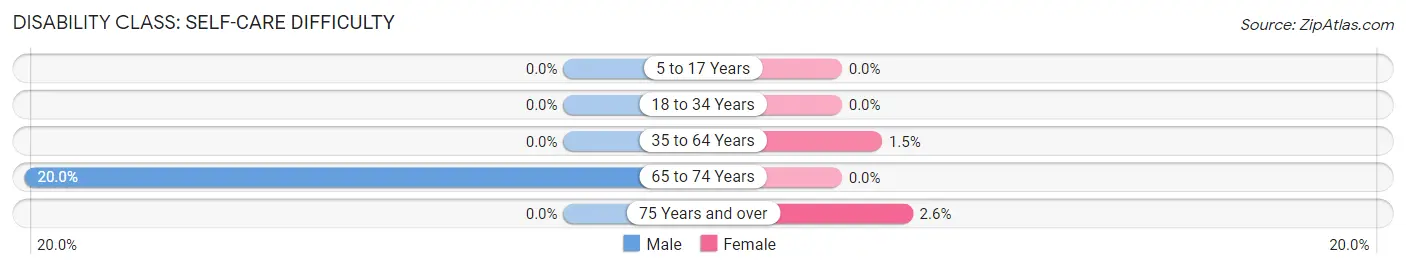
| Age Bracket | Male | Female |
| 5 to 17 Years | 0 (0.0%) | 0 (0.0%) |
| 18 to 34 Years | 0 (0.0%) | 0 (0.0%) |
| 35 to 64 Years | 0 (0.0%) | 1 (1.5%) |
| 65 to 74 Years | 3 (20.0%) | 0 (0.0%) |
| 75 Years and over | 0 (0.0%) | 1 (2.6%) |
Technology Access in Harrell
Computing Device Access in Harrell
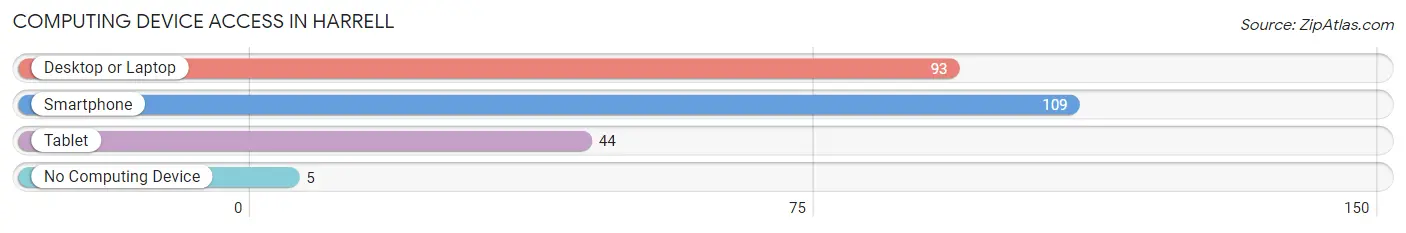
| Device Type | # Households | % Households |
| Desktop or Laptop | 93 | 76.2% |
| Smartphone | 109 | 89.3% |
| Tablet | 44 | 36.1% |
| No Computing Device | 5 | 4.1% |
| Total | 122 | 100.0% |
Internet Access in Harrell
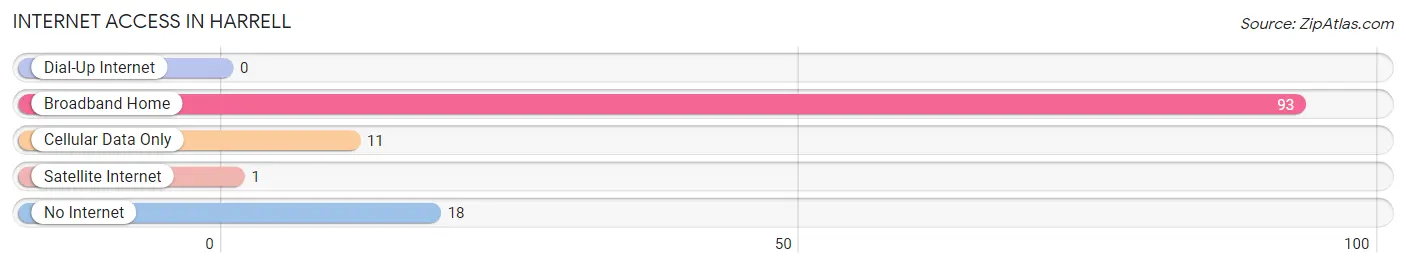
| Internet Type | # Households | % Households |
| Dial-Up Internet | 0 | 0.0% |
| Broadband Home | 93 | 76.2% |
| Cellular Data Only | 11 | 9.0% |
| Satellite Internet | 1 | 0.8% |
| No Internet | 18 | 14.7% |
| Total | 122 | 100.0% |
Harrell Summary
Harrell is a small unincorporated community located in the northern part of Arkansas, in the United States. It is situated in the foothills of the Ozark Mountains, in the Ozark National Forest. The community is located in Madison County, and is part of the Fayetteville–Springdale–Rogers Metropolitan Statistical Area.
History
Harrell was first settled in the late 1800s by a group of settlers from Tennessee. The community was named after the Harrell family, who were among the first settlers. The first post office was established in 1891, and the town was incorporated in 1895.
The town was a thriving community in the early 1900s, with a population of over 500 people. It had a school, a church, a general store, and a blacksmith shop. The town was also home to a number of businesses, including a sawmill, a gristmill, and a cotton gin.
In the 1920s, the town began to decline as the population began to move away. By the 1940s, the population had dropped to just over 200 people. The decline continued until the 1970s, when the population had dropped to just over 100 people.
Geography
Harrell is located in the northern part of Arkansas, in the Ozark National Forest. It is situated in the foothills of the Ozark Mountains, and is part of the Fayetteville–Springdale–Rogers Metropolitan Statistical Area. The town is located at an elevation of 1,000 feet (305 m).
The town is located on the banks of the White River, which flows through the area. The White River is a tributary of the Arkansas River, and is a popular destination for fishing and boating.
Economy
The economy of Harrell is largely based on agriculture and forestry. The town is home to a number of farms, which produce a variety of crops, including corn, soybeans, wheat, and hay. The town is also home to a number of timber companies, which harvest timber from the surrounding forests.
The town is also home to a number of small businesses, including a general store, a gas station, and a restaurant. The town is also home to a number of bed and breakfasts, which cater to tourists who come to the area to enjoy the natural beauty of the Ozark Mountains.
Demographics
As of the 2010 census, the population of Harrell was estimated to be 109 people. The racial makeup of the town was 97.2% White, 0.9% African American, 0.9% Native American, and 0.9% from other races. The median household income was estimated to be $30,000, and the median age was estimated to be 44 years.
Conclusion
Harrell is a small unincorporated community located in the northern part of Arkansas, in the United States. It is situated in the foothills of the Ozark Mountains, in the Ozark National Forest. The town was first settled in the late 1800s by a group of settlers from Tennessee, and was incorporated in 1895. The economy of Harrell is largely based on agriculture and forestry, and the town is home to a number of small businesses. As of the 2010 census, the population of Harrell was estimated to be 109 people.
Common Questions
What is Per Capita Income in Harrell?
Per Capita income in Harrell is $31,194.
What is the Median Family Income in Harrell?
Median Family Income in Harrell is $93,000.
What is the Median Household income in Harrell?
Median Household Income in Harrell is $88,750.
What is Income or Wage Gap in Harrell?
Income or Wage Gap in Harrell is 7.2%.
Women in Harrell earn 92.8 cents for every dollar earned by a man.
What is Inequality or Gini Index in Harrell?
Inequality or Gini Index in Harrell is 0.28.
What is the Total Population of Harrell?
Total Population of Harrell is 281.
What is the Total Male Population of Harrell?
Total Male Population of Harrell is 126.
What is the Total Female Population of Harrell?
Total Female Population of Harrell is 155.
What is the Ratio of Males per 100 Females in Harrell?
There are 81.29 Males per 100 Females in Harrell.
What is the Ratio of Females per 100 Males in Harrell?
There are 123.02 Females per 100 Males in Harrell.
What is the Median Population Age in Harrell?
Median Population Age in Harrell is 48.3 Years.
What is the Average Family Size in Harrell
Average Family Size in Harrell is 2.5 People.
What is the Average Household Size in Harrell
Average Household Size in Harrell is 2.3 People.
How Large is the Labor Force in Harrell?
There are 110 People in the Labor Forcein in Harrell.
What is the Percentage of People in the Labor Force in Harrell?
44.9% of People are in the Labor Force in Harrell.
What is the Unemployment Rate in Harrell?
Unemployment Rate in Harrell is 13.6%.