Hardy, AR Map & Demographics
Hardy Map
Hardy Overview
$19,139
PER CAPITA INCOME
$57,899
AVG FAMILY INCOME
$33,984
AVG HOUSEHOLD INCOME
62.8%
WAGE / INCOME GAP [ % ]
37.2¢/ $1
WAGE / INCOME GAP [ $ ]
0.46
INEQUALITY / GINI INDEX
763
TOTAL POPULATION
340
MALE POPULATION
423
FEMALE POPULATION
80.38
MALES / 100 FEMALES
124.41
FEMALES / 100 MALES
50.2
MEDIAN AGE
2.4
AVG FAMILY SIZE
1.9
AVG HOUSEHOLD SIZE
299
LABOR FORCE [ PEOPLE ]
46.1%
PERCENT IN LABOR FORCE
3.7%
UNEMPLOYMENT RATE
Hardy Zip Codes
Hardy Area Codes
Income in Hardy
Income Overview in Hardy
Per Capita Income in Hardy is $19,139, while median incomes of families and households are $57,899 and $33,984 respectively.
| Characteristic | Number | Measure |
| Per Capita Income | 763 | $19,139 |
| Median Family Income | 250 | $57,899 |
| Mean Family Income | 250 | $55,434 |
| Median Household Income | 409 | $33,984 |
| Mean Household Income | 409 | $39,072 |
| Income Deficit | 250 | $0 |
| Wage / Income Gap (%) | 763 | 62.82% |
| Wage / Income Gap ($) | 763 | 37.18¢ per $1 |
| Gini / Inequality Index | 763 | 0.46 |
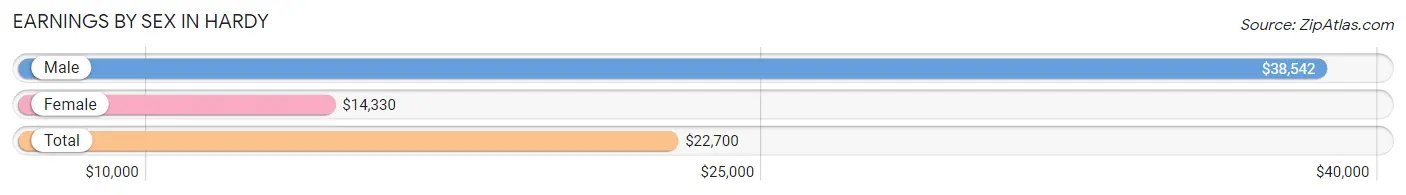
Earnings by Sex in Hardy
Average Earnings in Hardy are $22,700, $38,542 for men and $14,330 for women, a difference of 62.8%.
| Sex | Number | Average Earnings |
| Male | 147 (46.8%) | $38,542 |
| Female | 167 (53.2%) | $14,330 |
| Total | 314 (100.0%) | $22,700 |
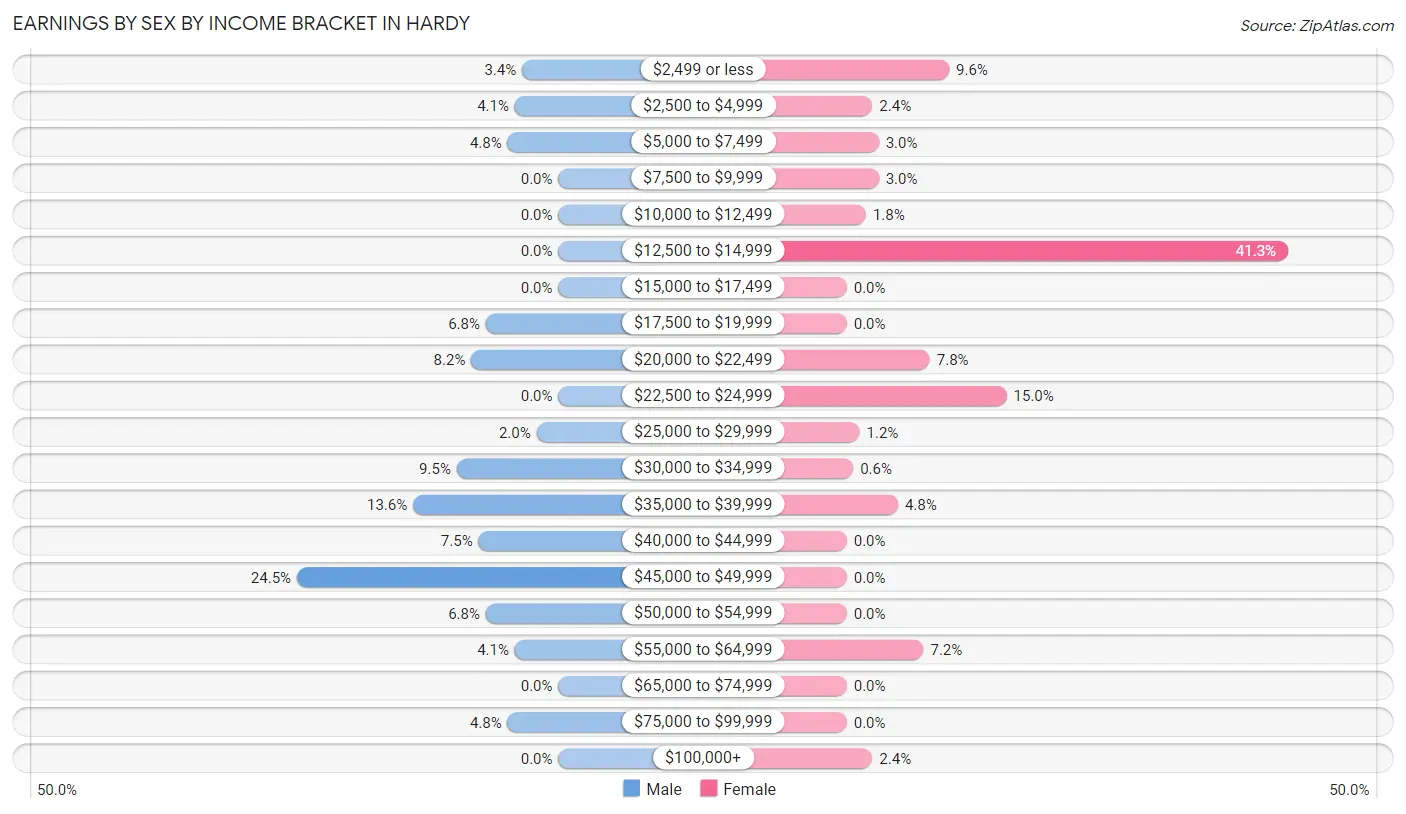
Earnings by Sex by Income Bracket in Hardy
The most common earnings brackets in Hardy are $45,000 to $49,999 for men (36 | 24.5%) and $12,500 to $14,999 for women (69 | 41.3%).
| Income | Male | Female |
| $2,499 or less | 5 (3.4%) | 16 (9.6%) |
| $2,500 to $4,999 | 6 (4.1%) | 4 (2.4%) |
| $5,000 to $7,499 | 7 (4.8%) | 5 (3.0%) |
| $7,500 to $9,999 | 0 (0.0%) | 5 (3.0%) |
| $10,000 to $12,499 | 0 (0.0%) | 3 (1.8%) |
| $12,500 to $14,999 | 0 (0.0%) | 69 (41.3%) |
| $15,000 to $17,499 | 0 (0.0%) | 0 (0.0%) |
| $17,500 to $19,999 | 10 (6.8%) | 0 (0.0%) |
| $20,000 to $22,499 | 12 (8.2%) | 13 (7.8%) |
| $22,500 to $24,999 | 0 (0.0%) | 25 (15.0%) |
| $25,000 to $29,999 | 3 (2.0%) | 2 (1.2%) |
| $30,000 to $34,999 | 14 (9.5%) | 1 (0.6%) |
| $35,000 to $39,999 | 20 (13.6%) | 8 (4.8%) |
| $40,000 to $44,999 | 11 (7.5%) | 0 (0.0%) |
| $45,000 to $49,999 | 36 (24.5%) | 0 (0.0%) |
| $50,000 to $54,999 | 10 (6.8%) | 0 (0.0%) |
| $55,000 to $64,999 | 6 (4.1%) | 12 (7.2%) |
| $65,000 to $74,999 | 0 (0.0%) | 0 (0.0%) |
| $75,000 to $99,999 | 7 (4.8%) | 0 (0.0%) |
| $100,000+ | 0 (0.0%) | 4 (2.4%) |
| Total | 147 (100.0%) | 167 (100.0%) |
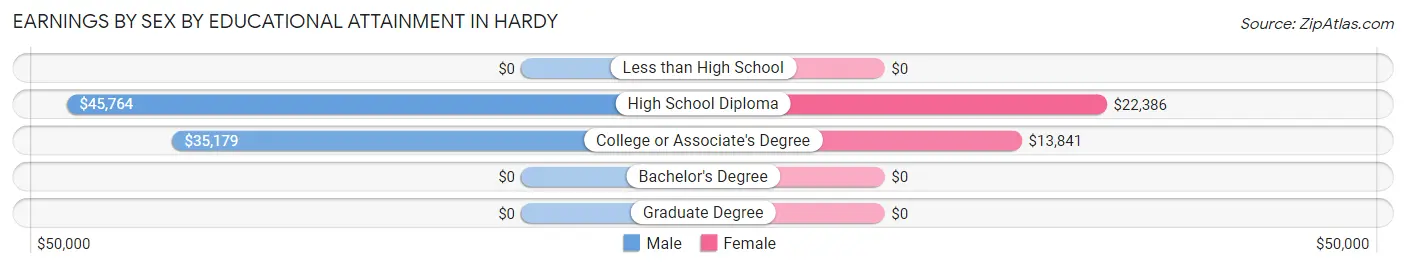
Earnings by Sex by Educational Attainment in Hardy
Average earnings in Hardy are $39,583 for men and $14,275 for women, a difference of 63.9%. Men with an educational attainment of high school diploma enjoy the highest average annual earnings of $45,764, while those with college or associate's degree education earn the least with $35,179. Women with an educational attainment of high school diploma earn the most with the average annual earnings of $22,386, while those with college or associate's degree education have the smallest earnings of $13,841.
| Educational Attainment | Male Income | Female Income |
| Less than High School | - | - |
| High School Diploma | $45,764 | $22,386 |
| College or Associate's Degree | $35,179 | $13,841 |
| Bachelor's Degree | - | - |
| Graduate Degree | - | - |
| Total | $39,583 | $14,275 |
Family Income in Hardy
Family Income Brackets in Hardy
According to the Hardy family income data, there are 111 families falling into the $50,000 to $74,999 income range, which is the most common income bracket and makes up 44.4% of all families.
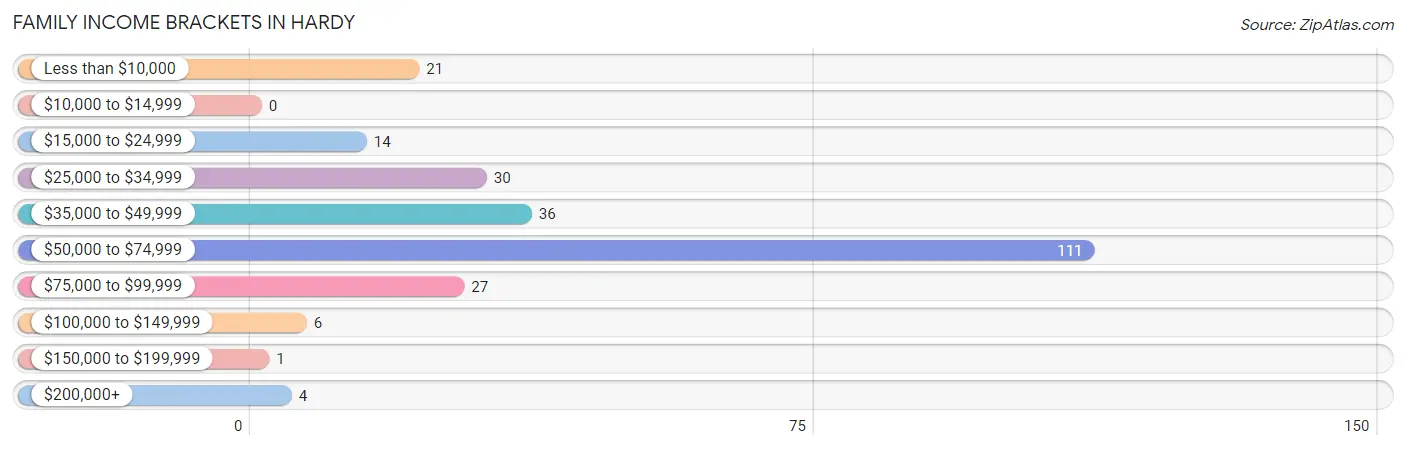
| Income Bracket | # Families | % Families |
| Less than $10,000 | 21 | 8.4% |
| $10,000 to $14,999 | 0 | 0.0% |
| $15,000 to $24,999 | 14 | 5.6% |
| $25,000 to $34,999 | 30 | 12.0% |
| $35,000 to $49,999 | 36 | 14.4% |
| $50,000 to $74,999 | 111 | 44.4% |
| $75,000 to $99,999 | 27 | 10.8% |
| $100,000 to $149,999 | 6 | 2.4% |
| $150,000 to $199,999 | 1 | 0.4% |
| $200,000+ | 4 | 1.6% |
Family Income by Famaliy Size in Hardy
3-person families (19 | 7.6%) account for the highest median family income in Hardy with $77,625 per family, while 3-person families (19 | 7.6%) have the highest median income of $25,875 per family member.
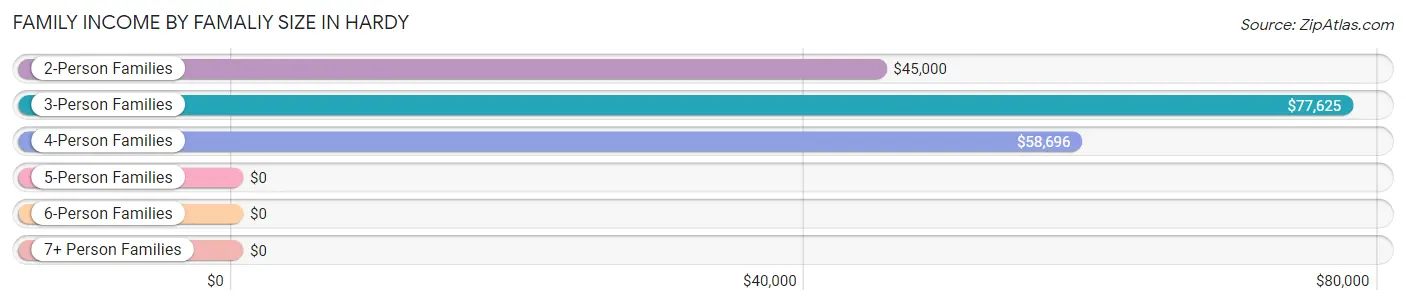
| Income Bracket | # Families | Median Income |
| 2-Person Families | 142 (56.8%) | $45,000 |
| 3-Person Families | 19 (7.6%) | $77,625 |
| 4-Person Families | 86 (34.4%) | $58,696 |
| 5-Person Families | 0 (0.0%) | $0 |
| 6-Person Families | 3 (1.2%) | $0 |
| 7+ Person Families | 0 (0.0%) | $0 |
| Total | 250 (100.0%) | $57,899 |
Family Income by Number of Earners in Hardy
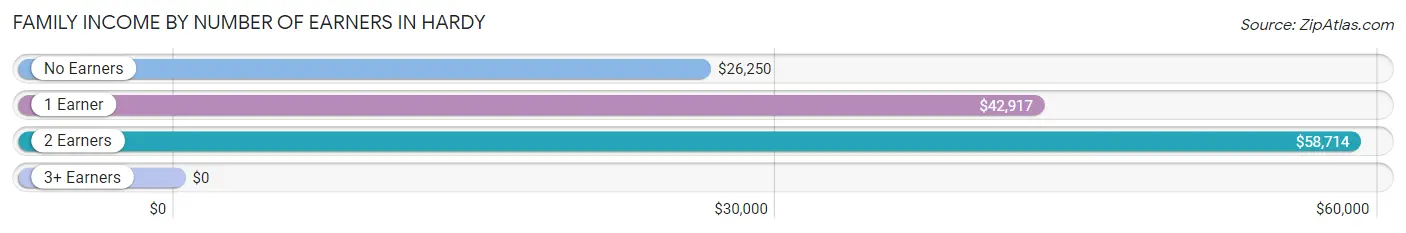
| Number of Earners | # Families | Median Income |
| No Earners | 63 (25.2%) | $26,250 |
| 1 Earner | 49 (19.6%) | $42,917 |
| 2 Earners | 125 (50.0%) | $58,714 |
| 3+ Earners | 13 (5.2%) | $0 |
| Total | 250 (100.0%) | $57,899 |
Household Income in Hardy
Household Income Brackets in Hardy
With 115 households falling in the category, the $50,000 to $74,999 income range is the most frequent in Hardy, accounting for 28.1% of all households. In contrast, only 1 households (0.2%) fall into the $150,000 to $199,999 income bracket, making it the least populous group.
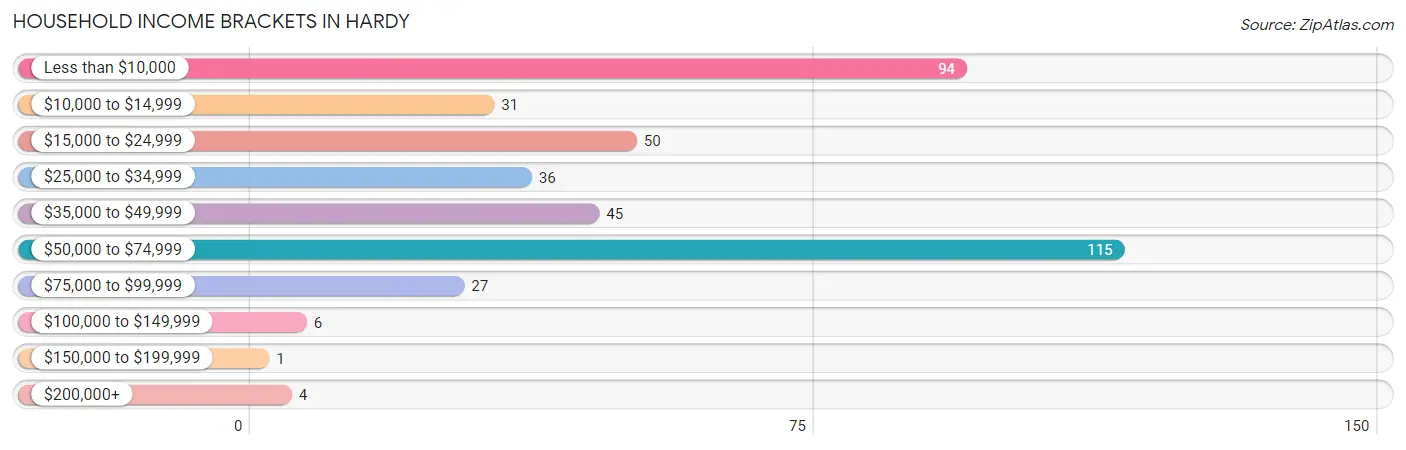
| Income Bracket | # Households | % Households |
| Less than $10,000 | 94 | 23.0% |
| $10,000 to $14,999 | 31 | 7.6% |
| $15,000 to $24,999 | 50 | 12.2% |
| $25,000 to $34,999 | 36 | 8.8% |
| $35,000 to $49,999 | 45 | 11.0% |
| $50,000 to $74,999 | 115 | 28.1% |
| $75,000 to $99,999 | 27 | 6.6% |
| $100,000 to $149,999 | 6 | 1.5% |
| $150,000 to $199,999 | 1 | 0.2% |
| $200,000+ | 4 | 1.0% |
Household Income by Householder Age in Hardy
The median household income in Hardy is $33,984, with the highest median household income of $58,315 found in the 25 to 44 years age bracket for the primary householder. A total of 113 households (27.6%) fall into this category.
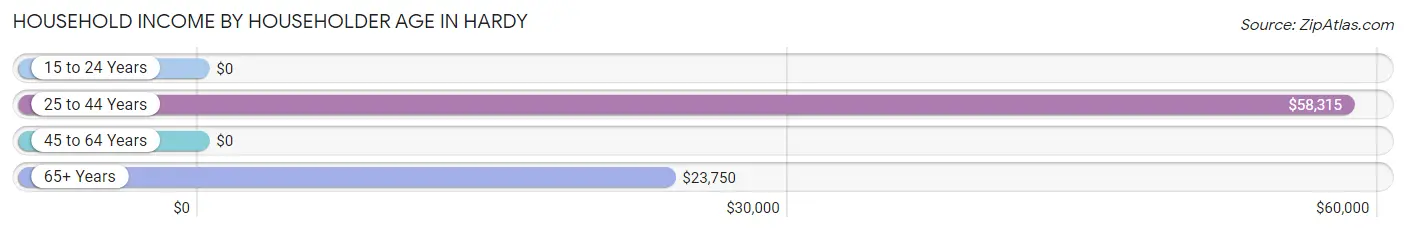
| Income Bracket | # Households | Median Income |
| 15 to 24 Years | 0 (0.0%) | $0 |
| 25 to 44 Years | 113 (27.6%) | $58,315 |
| 45 to 64 Years | 103 (25.2%) | $0 |
| 65+ Years | 193 (47.2%) | $23,750 |
| Total | 409 (100.0%) | $33,984 |
Poverty in Hardy
Income Below Poverty by Sex and Age in Hardy
With 18.8% poverty level for males and 25.1% for females among the residents of Hardy, 55 to 64 year old males and 15 year old females are the most vulnerable to poverty, with 23 males (71.9%) and 4 females (100.0%) in their respective age groups living below the poverty level.
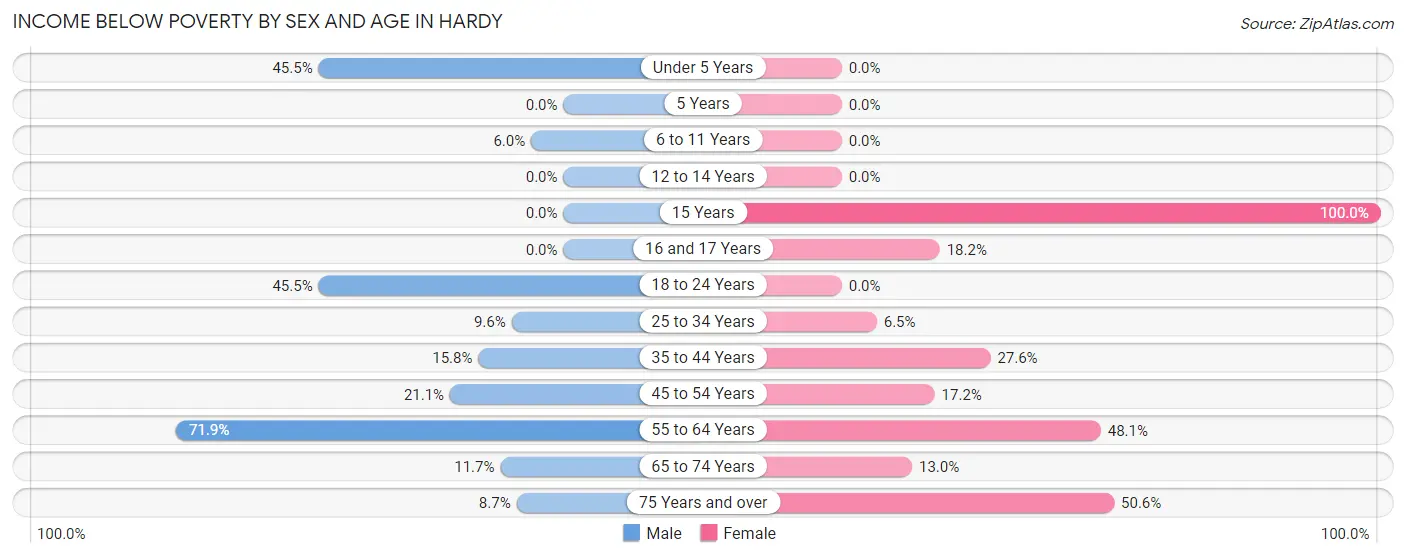
| Age Bracket | Male | Female |
| Under 5 Years | 5 (45.5%) | 0 (0.0%) |
| 5 Years | 0 (0.0%) | 0 (0.0%) |
| 6 to 11 Years | 3 (6.0%) | 0 (0.0%) |
| 12 to 14 Years | 0 (0.0%) | 0 (0.0%) |
| 15 Years | 0 (0.0%) | 4 (100.0%) |
| 16 and 17 Years | 0 (0.0%) | 2 (18.2%) |
| 18 to 24 Years | 5 (45.5%) | 0 (0.0%) |
| 25 to 34 Years | 5 (9.6%) | 5 (6.5%) |
| 35 to 44 Years | 6 (15.8%) | 8 (27.6%) |
| 45 to 54 Years | 4 (21.0%) | 10 (17.2%) |
| 55 to 64 Years | 23 (71.9%) | 25 (48.1%) |
| 65 to 74 Years | 11 (11.7%) | 6 (13.0%) |
| 75 Years and over | 2 (8.7%) | 46 (50.5%) |
| Total | 64 (18.8%) | 106 (25.1%) |
Income Above Poverty by Sex and Age in Hardy
According to the poverty statistics in Hardy, males aged 12 to 14 years and females aged under 5 years are the age groups that are most secure financially, with 100.0% of males and 100.0% of females in these age groups living above the poverty line.
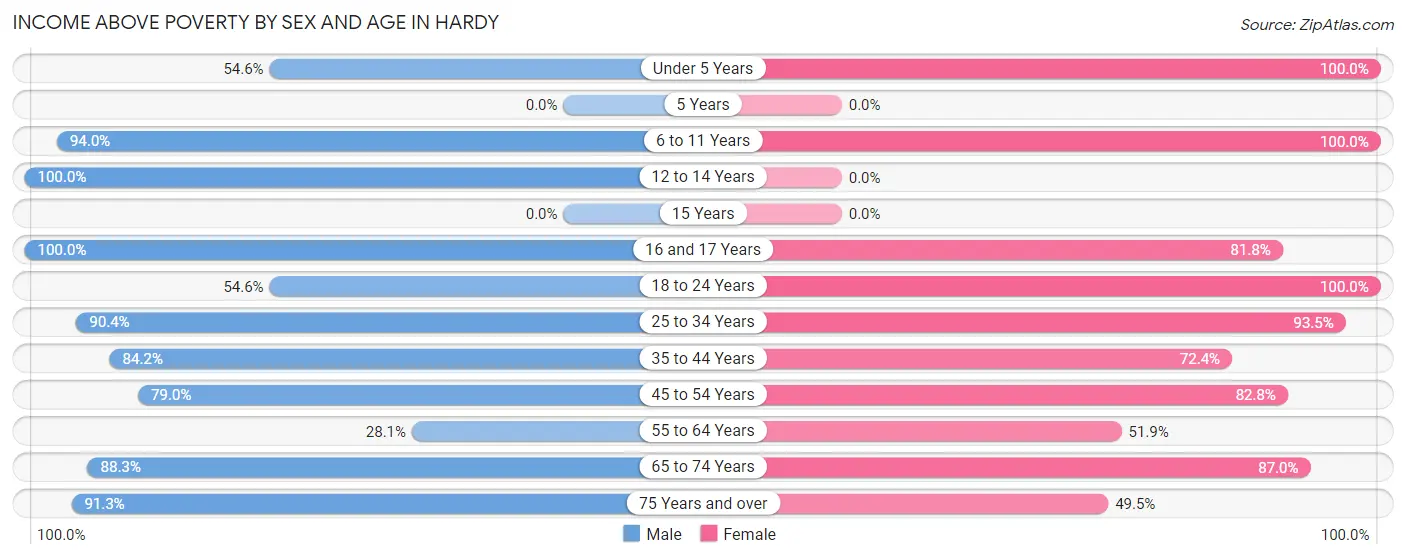
| Age Bracket | Male | Female |
| Under 5 Years | 6 (54.5%) | 35 (100.0%) |
| 5 Years | 0 (0.0%) | 0 (0.0%) |
| 6 to 11 Years | 47 (94.0%) | 8 (100.0%) |
| 12 to 14 Years | 6 (100.0%) | 0 (0.0%) |
| 15 Years | 0 (0.0%) | 0 (0.0%) |
| 16 and 17 Years | 4 (100.0%) | 9 (81.8%) |
| 18 to 24 Years | 6 (54.5%) | 12 (100.0%) |
| 25 to 34 Years | 47 (90.4%) | 72 (93.5%) |
| 35 to 44 Years | 32 (84.2%) | 21 (72.4%) |
| 45 to 54 Years | 15 (78.9%) | 48 (82.8%) |
| 55 to 64 Years | 9 (28.1%) | 27 (51.9%) |
| 65 to 74 Years | 83 (88.3%) | 40 (87.0%) |
| 75 Years and over | 21 (91.3%) | 45 (49.4%) |
| Total | 276 (81.2%) | 317 (74.9%) |
Income Below Poverty Among Married-Couple Families in Hardy
The poverty statistics for married-couple families in Hardy show that 7.3% or 14 of the total 191 families live below the poverty line. Families with no children have the highest poverty rate of 9.1%, comprising of 9 families. On the other hand, families with 1 or 2 children have the lowest poverty rate of 5.4%, which includes 5 families.
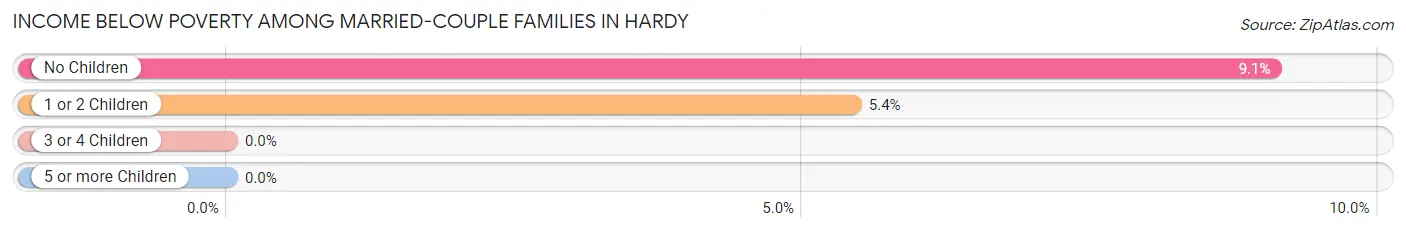
| Children | Above Poverty | Below Poverty |
| No Children | 90 (90.9%) | 9 (9.1%) |
| 1 or 2 Children | 87 (94.6%) | 5 (5.4%) |
| 3 or 4 Children | 0 (0.0%) | 0 (0.0%) |
| 5 or more Children | 0 (0.0%) | 0 (0.0%) |
| Total | 177 (92.7%) | 14 (7.3%) |
Income Below Poverty Among Single-Parent Households in Hardy
According to the poverty data in Hardy, 29.4% or 5 single-father households and 19.1% or 8 single-mother households are living below the poverty line. Among single-father households, those with no children have the highest poverty rate, with 5 households (45.5%) experiencing poverty. Likewise, among single-mother households, those with 1 or 2 children have the highest poverty rate, with 8 households (57.1%) falling below the poverty line.
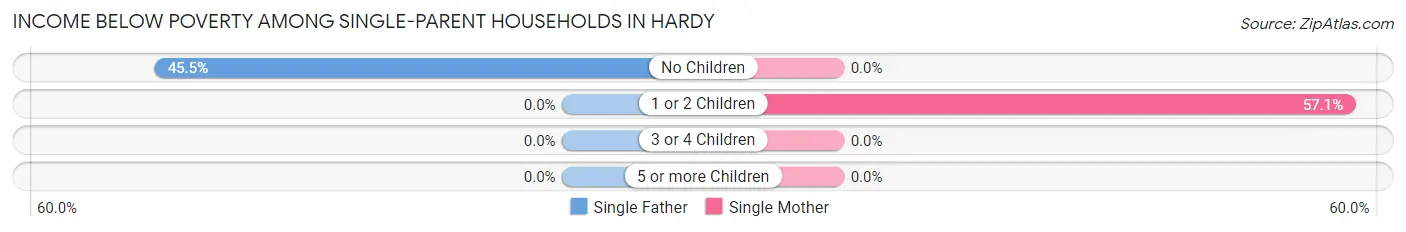
| Children | Single Father | Single Mother |
| No Children | 5 (45.5%) | 0 (0.0%) |
| 1 or 2 Children | 0 (0.0%) | 8 (57.1%) |
| 3 or 4 Children | 0 (0.0%) | 0 (0.0%) |
| 5 or more Children | 0 (0.0%) | 0 (0.0%) |
| Total | 5 (29.4%) | 8 (19.1%) |
Income Below Poverty Among Married-Couple vs Single-Parent Households in Hardy
The poverty data for Hardy shows that 14 of the married-couple family households (7.3%) and 13 of the single-parent households (22.0%) are living below the poverty level. Within the married-couple family households, those with no children have the highest poverty rate, with 9 households (9.1%) falling below the poverty line. Among the single-parent households, those with 1 or 2 children have the highest poverty rate, with 8 household (40.0%) living below poverty.
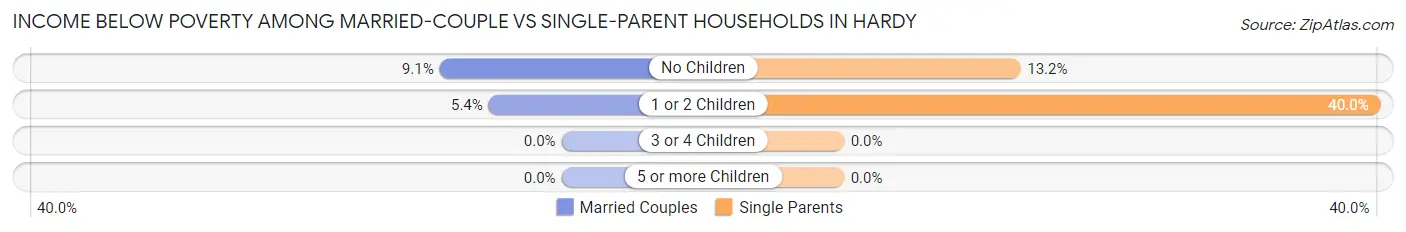
| Children | Married-Couple Families | Single-Parent Households |
| No Children | 9 (9.1%) | 5 (13.2%) |
| 1 or 2 Children | 5 (5.4%) | 8 (40.0%) |
| 3 or 4 Children | 0 (0.0%) | 0 (0.0%) |
| 5 or more Children | 0 (0.0%) | 0 (0.0%) |
| Total | 14 (7.3%) | 13 (22.0%) |
Race in Hardy
The most populous races in Hardy are White / Caucasian (729 | 95.5%), and Asian (34 | 4.5%).
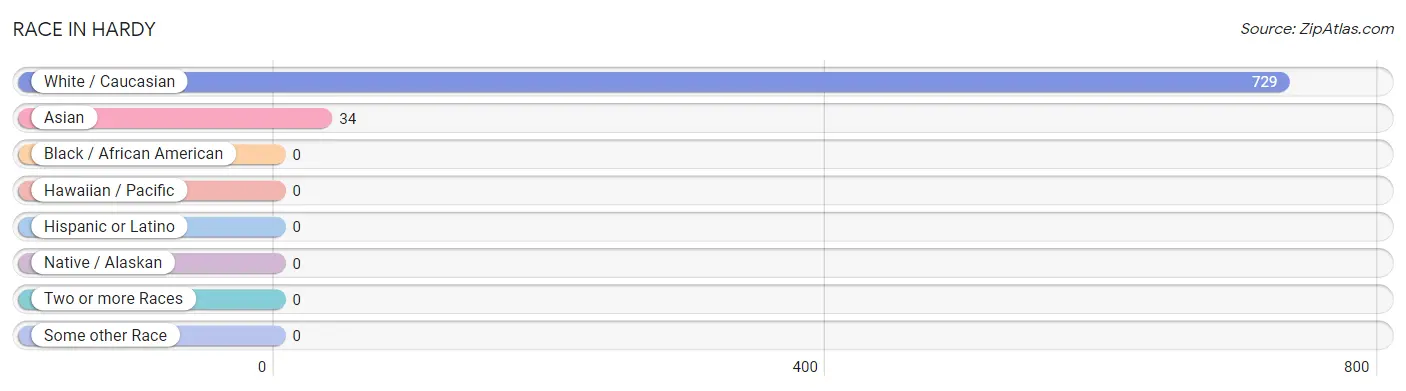
| Race | # Population | % Population |
| Asian | 34 | 4.5% |
| Black / African American | 0 | 0.0% |
| Hawaiian / Pacific | 0 | 0.0% |
| Hispanic or Latino | 0 | 0.0% |
| Native / Alaskan | 0 | 0.0% |
| White / Caucasian | 729 | 95.5% |
| Two or more Races | 0 | 0.0% |
| Some other Race | 0 | 0.0% |
| Total | 763 | 100.0% |
Ancestry in Hardy
The most populous ancestries reported in Hardy are English (145 | 19.0%), American (74 | 9.7%), Irish (74 | 9.7%), German (68 | 8.9%), and Italian (33 | 4.3%), together accounting for 51.6% of all Hardy residents.
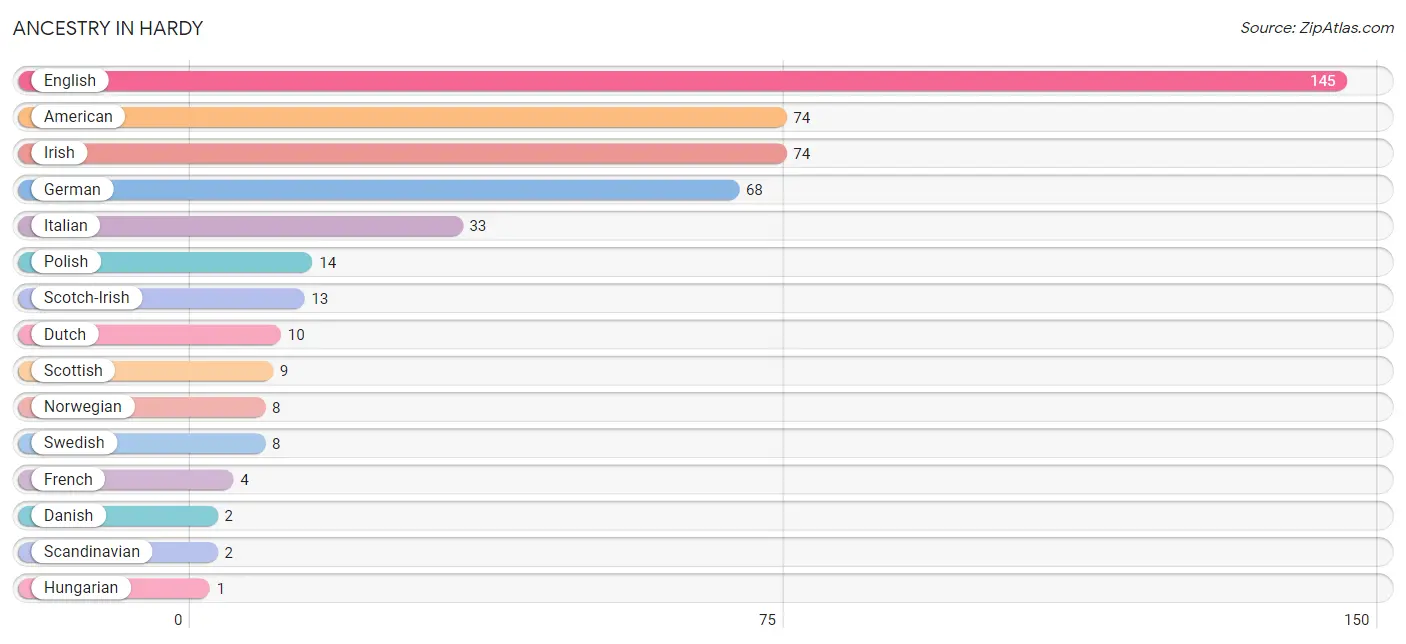
| Ancestry | # Population | % Population |
| American | 74 | 9.7% |
| Danish | 2 | 0.3% |
| Dutch | 10 | 1.3% |
| English | 145 | 19.0% |
| French | 4 | 0.5% |
| German | 68 | 8.9% |
| Hungarian | 1 | 0.1% |
| Irish | 74 | 9.7% |
| Italian | 33 | 4.3% |
| Norwegian | 8 | 1.1% |
| Polish | 14 | 1.8% |
| Scandinavian | 2 | 0.3% |
| Scotch-Irish | 13 | 1.7% |
| Scottish | 9 | 1.2% |
| Swedish | 8 | 1.1% | View All 15 Rows |
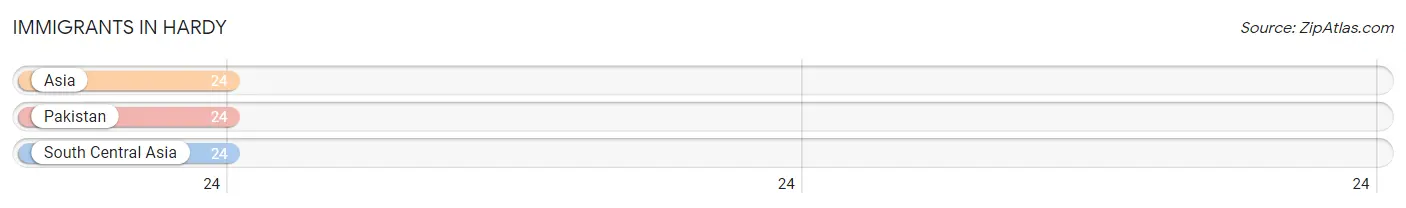
Immigrants in Hardy
The most numerous immigrant groups reported in Hardy came from Asia (24 | 3.2%), Pakistan (24 | 3.2%), and South Central Asia (24 | 3.2%), together accounting for 9.5% of all Hardy residents.
| Immigration Origin | # Population | % Population |
| Asia | 24 | 3.2% |
| Pakistan | 24 | 3.2% |
| South Central Asia | 24 | 3.2% | View All 3 Rows |
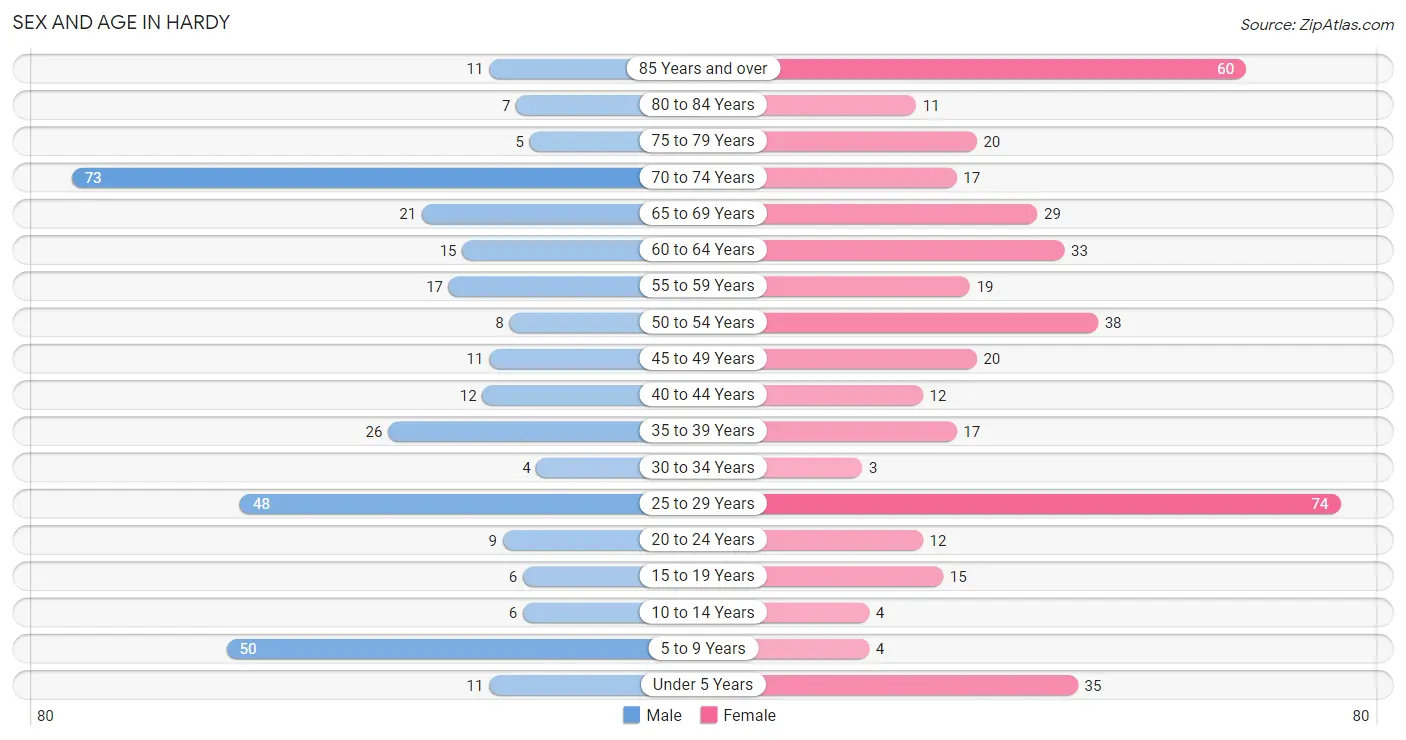
Sex and Age in Hardy
Sex and Age in Hardy
The most populous age groups in Hardy are 70 to 74 Years (73 | 21.5%) for men and 25 to 29 Years (74 | 17.5%) for women.
| Age Bracket | Male | Female |
| Under 5 Years | 11 (3.2%) | 35 (8.3%) |
| 5 to 9 Years | 50 (14.7%) | 4 (0.9%) |
| 10 to 14 Years | 6 (1.8%) | 4 (0.9%) |
| 15 to 19 Years | 6 (1.8%) | 15 (3.5%) |
| 20 to 24 Years | 9 (2.6%) | 12 (2.8%) |
| 25 to 29 Years | 48 (14.1%) | 74 (17.5%) |
| 30 to 34 Years | 4 (1.2%) | 3 (0.7%) |
| 35 to 39 Years | 26 (7.6%) | 17 (4.0%) |
| 40 to 44 Years | 12 (3.5%) | 12 (2.8%) |
| 45 to 49 Years | 11 (3.2%) | 20 (4.7%) |
| 50 to 54 Years | 8 (2.4%) | 38 (9.0%) |
| 55 to 59 Years | 17 (5.0%) | 19 (4.5%) |
| 60 to 64 Years | 15 (4.4%) | 33 (7.8%) |
| 65 to 69 Years | 21 (6.2%) | 29 (6.9%) |
| 70 to 74 Years | 73 (21.5%) | 17 (4.0%) |
| 75 to 79 Years | 5 (1.5%) | 20 (4.7%) |
| 80 to 84 Years | 7 (2.1%) | 11 (2.6%) |
| 85 Years and over | 11 (3.2%) | 60 (14.2%) |
| Total | 340 (100.0%) | 423 (100.0%) |
Families and Households in Hardy
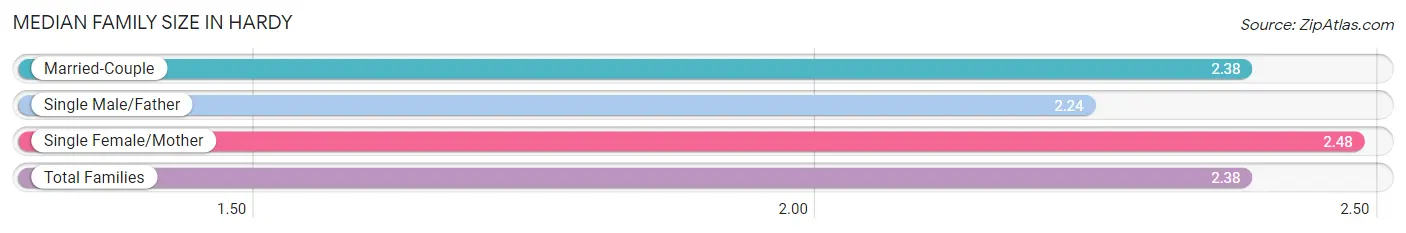
Median Family Size in Hardy
The median family size in Hardy is 2.38 persons per family, with single female/mother families (42 | 16.8%) accounting for the largest median family size of 2.48 persons per family. On the other hand, single male/father families (17 | 6.8%) represent the smallest median family size with 2.24 persons per family.
| Family Type | # Families | Family Size |
| Married-Couple | 191 (76.4%) | 2.38 |
| Single Male/Father | 17 (6.8%) | 2.24 |
| Single Female/Mother | 42 (16.8%) | 2.48 |
| Total Families | 250 (100.0%) | 2.38 |
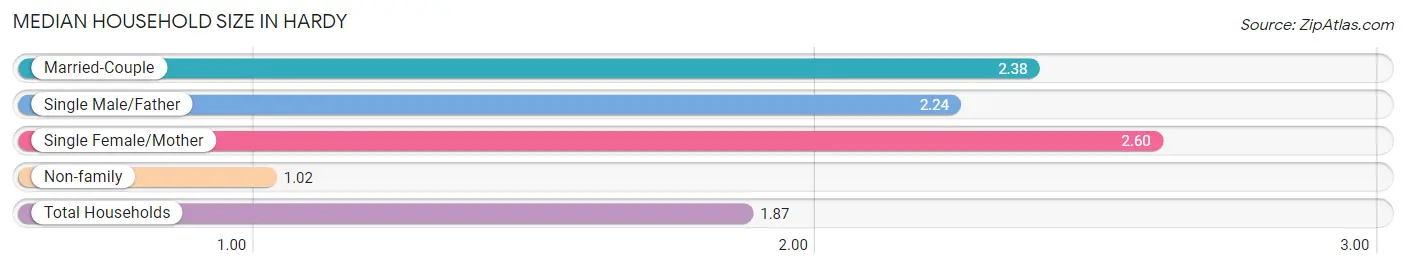
Median Household Size in Hardy
The median household size in Hardy is 1.87 persons per household, with single female/mother households (42 | 10.3%) accounting for the largest median household size of 2.6 persons per household. non-family households (159 | 38.9%) represent the smallest median household size with 1.02 persons per household.
| Household Type | # Households | Household Size |
| Married-Couple | 191 (46.7%) | 2.38 |
| Single Male/Father | 17 (4.2%) | 2.24 |
| Single Female/Mother | 42 (10.3%) | 2.60 |
| Non-family | 159 (38.9%) | 1.02 |
| Total Households | 409 (100.0%) | 1.87 |
Household Size by Marriage Status in Hardy
Out of a total of 409 households in Hardy, 250 (61.1%) are family households, while 159 (38.9%) are nonfamily households. The most numerous type of family households are 2-person households, comprising 138, and the most common type of nonfamily households are 1-person households, comprising 155.
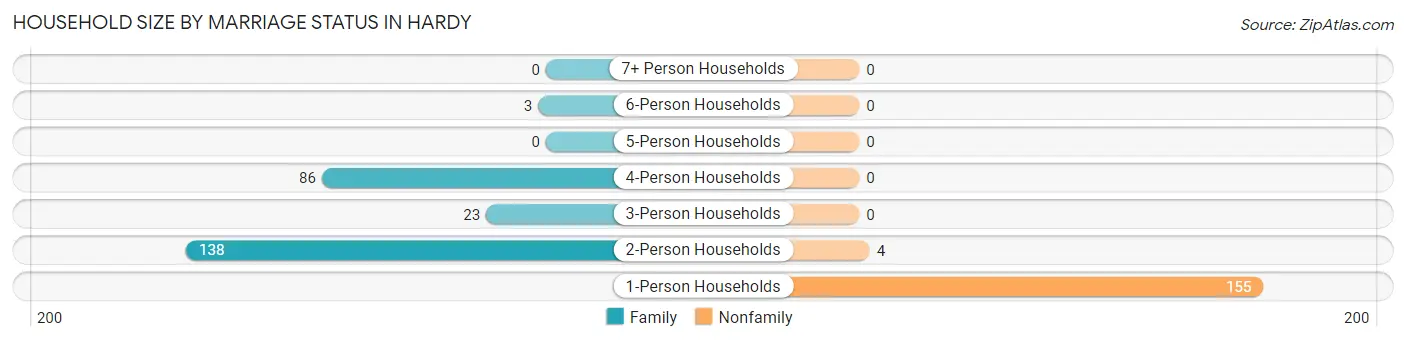
| Household Size | Family Households | Nonfamily Households |
| 1-Person Households | - | 155 (37.9%) |
| 2-Person Households | 138 (33.7%) | 4 (1.0%) |
| 3-Person Households | 23 (5.6%) | 0 (0.0%) |
| 4-Person Households | 86 (21.0%) | 0 (0.0%) |
| 5-Person Households | 0 (0.0%) | 0 (0.0%) |
| 6-Person Households | 3 (0.7%) | 0 (0.0%) |
| 7+ Person Households | 0 (0.0%) | 0 (0.0%) |
| Total | 250 (61.1%) | 159 (38.9%) |
Female Fertility in Hardy
Fertility by Age in Hardy
| Age Bracket | Women with Births | Births / 1,000 Women |
| 15 to 19 years | 0 (0.0%) | 0.0 |
| 20 to 34 years | 0 (0.0%) | 0.0 |
| 35 to 50 years | 0 (0.0%) | 0.0 |
| Total | 0 (0.0%) | 0.0 |
Fertility by Age by Marriage Status in Hardy
| Age Bracket | Married | Unmarried |
| 15 to 19 years | 0 (0.0%) | 0 (0.0%) |
| 20 to 34 years | 0 (0.0%) | 0 (0.0%) |
| 35 to 50 years | 0 (0.0%) | 0 (0.0%) |
| Total | 0 (0.0%) | 0 (0.0%) |
Fertility by Education in Hardy
| Educational Attainment | Women with Births | Births / 1,000 Women |
| Less than High School | 0 (0.0%) | 0.0 |
| High School Diploma | 0 (0.0%) | 0.0 |
| College or Associate's Degree | 0 (0.0%) | 0.0 |
| Bachelor's Degree | 0 (0.0%) | 0.0 |
| Graduate Degree | 0 (0.0%) | 0.0 |
| Total | 0 (0.0%) | 0.0 |
Fertility by Education by Marriage Status in Hardy
| Educational Attainment | Married | Unmarried |
| Less than High School | 0 (0.0%) | 0 (0.0%) |
| High School Diploma | 0 (0.0%) | 0 (0.0%) |
| College or Associate's Degree | 0 (0.0%) | 0 (0.0%) |
| Bachelor's Degree | 0 (0.0%) | 0 (0.0%) |
| Graduate Degree | 0 (0.0%) | 0 (0.0%) |
| Total | 0 (0.0%) | 0 (0.0%) |
Employment Characteristics in Hardy
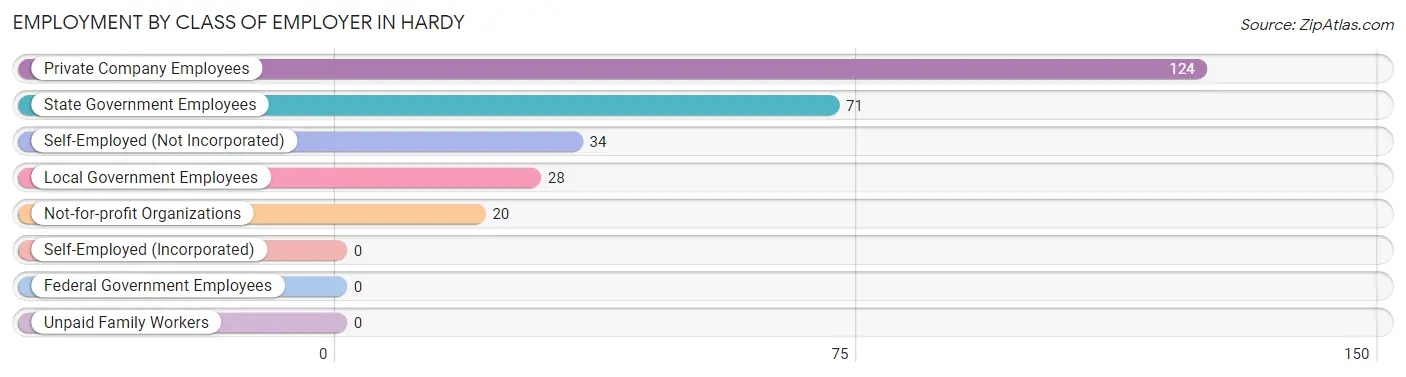
Employment by Class of Employer in Hardy
Among the 277 employed individuals in Hardy, private company employees (124 | 44.8%), state government employees (71 | 25.6%), and self-employed (not incorporated) (34 | 12.3%) make up the most common classes of employment.
| Employer Class | # Employees | % Employees |
| Private Company Employees | 124 | 44.8% |
| Self-Employed (Incorporated) | 0 | 0.0% |
| Self-Employed (Not Incorporated) | 34 | 12.3% |
| Not-for-profit Organizations | 20 | 7.2% |
| Local Government Employees | 28 | 10.1% |
| State Government Employees | 71 | 25.6% |
| Federal Government Employees | 0 | 0.0% |
| Unpaid Family Workers | 0 | 0.0% |
| Total | 277 | 100.0% |
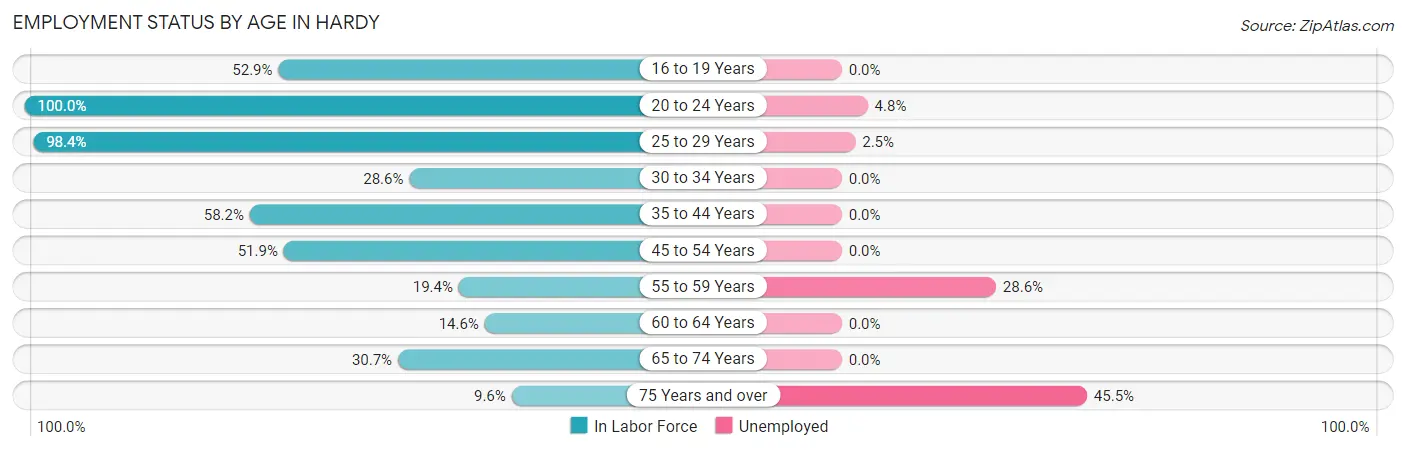
Employment Status by Age in Hardy
According to the labor force statistics for Hardy, out of the total population over 16 years of age (649), 46.1% or 299 individuals are in the labor force, with 3.7% or 11 of them unemployed. The age group with the highest labor force participation rate is 20 to 24 years, with 100.0% or 21 individuals in the labor force. Within the labor force, the 75 years and over age range has the highest percentage of unemployed individuals, with 45.5% or 5 of them being unemployed.
| Age Bracket | In Labor Force | Unemployed |
| 16 to 19 Years | 9 (52.9%) | 0 (0.0%) |
| 20 to 24 Years | 21 (100.0%) | 1 (4.8%) |
| 25 to 29 Years | 120 (98.4%) | 3 (2.5%) |
| 30 to 34 Years | 2 (28.6%) | 0 (0.0%) |
| 35 to 44 Years | 39 (58.2%) | 0 (0.0%) |
| 45 to 54 Years | 40 (51.9%) | 0 (0.0%) |
| 55 to 59 Years | 7 (19.4%) | 2 (28.6%) |
| 60 to 64 Years | 7 (14.6%) | 0 (0.0%) |
| 65 to 74 Years | 43 (30.7%) | 0 (0.0%) |
| 75 Years and over | 11 (9.6%) | 5 (45.5%) |
| Total | 299 (46.1%) | 11 (3.7%) |
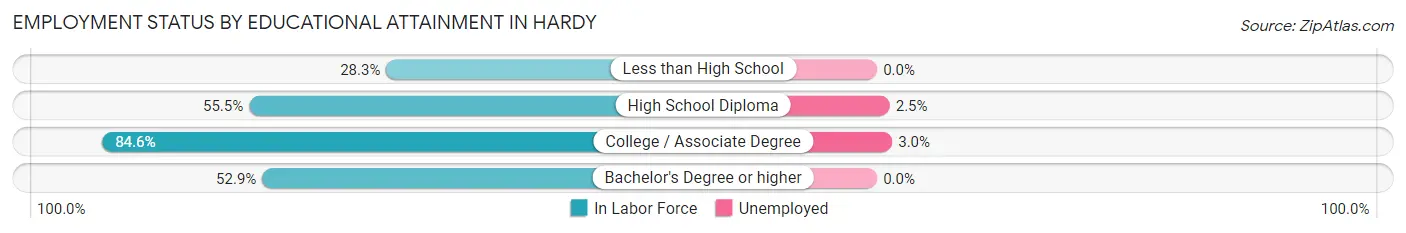
Employment Status by Educational Attainment in Hardy
According to labor force statistics for Hardy, 60.2% of individuals (215) out of the total population between 25 and 64 years of age (357) are in the labor force, with 2.3% or 5 of them being unemployed. The group with the highest labor force participation rate are those with the educational attainment of college / associate degree, with 84.6% or 99 individuals in the labor force. Within the labor force, individuals with college / associate degree education have the highest percentage of unemployment, with 3.0% or 3 of them being unemployed.
| Educational Attainment | In Labor Force | Unemployed |
| Less than High School | 17 (28.3%) | 0 (0.0%) |
| High School Diploma | 81 (55.5%) | 4 (2.5%) |
| College / Associate Degree | 99 (84.6%) | 4 (3.0%) |
| Bachelor's Degree or higher | 18 (52.9%) | 0 (0.0%) |
| Total | 215 (60.2%) | 8 (2.3%) |
Employment Occupations by Sex in Hardy
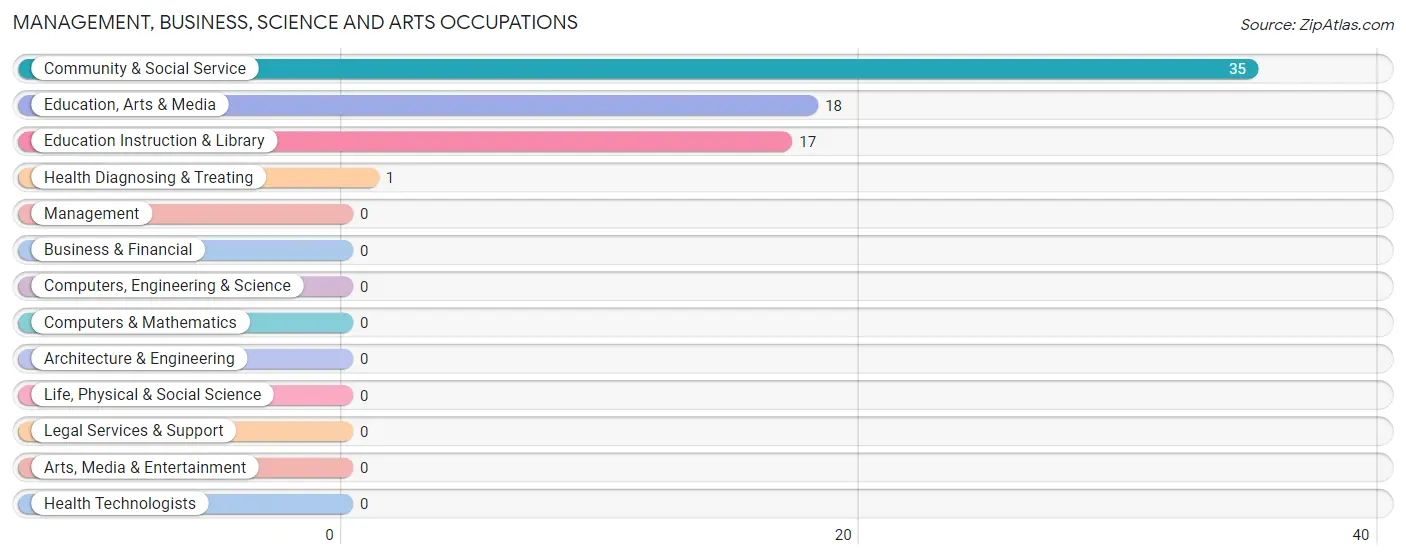
Management, Business, Science and Arts Occupations
The most common Management, Business, Science and Arts occupations in Hardy are Community & Social Service (35 | 12.1%), Education, Arts & Media (18 | 6.2%), Education Instruction & Library (17 | 5.9%), and Health Diagnosing & Treating (1 | 0.4%).
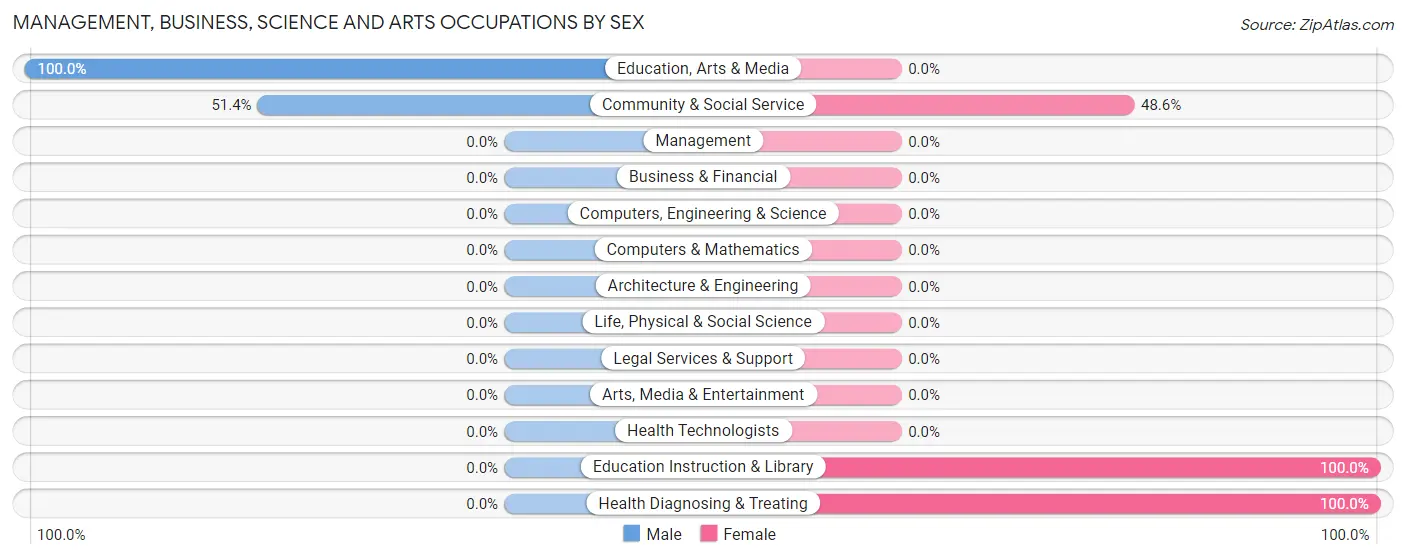
Management, Business, Science and Arts Occupations by Sex
Within the Management, Business, Science and Arts occupations in Hardy, the most male-oriented occupations are Education, Arts & Media (100.0%), and Community & Social Service (51.4%), while the most female-oriented occupations are Education Instruction & Library (100.0%), Health Diagnosing & Treating (100.0%), and Community & Social Service (48.6%).
| Occupation | Male | Female |
| Management | 0 (0.0%) | 0 (0.0%) |
| Business & Financial | 0 (0.0%) | 0 (0.0%) |
| Computers, Engineering & Science | 0 (0.0%) | 0 (0.0%) |
| Computers & Mathematics | 0 (0.0%) | 0 (0.0%) |
| Architecture & Engineering | 0 (0.0%) | 0 (0.0%) |
| Life, Physical & Social Science | 0 (0.0%) | 0 (0.0%) |
| Community & Social Service | 18 (51.4%) | 17 (48.6%) |
| Education, Arts & Media | 18 (100.0%) | 0 (0.0%) |
| Legal Services & Support | 0 (0.0%) | 0 (0.0%) |
| Education Instruction & Library | 0 (0.0%) | 17 (100.0%) |
| Arts, Media & Entertainment | 0 (0.0%) | 0 (0.0%) |
| Health Diagnosing & Treating | 0 (0.0%) | 1 (100.0%) |
| Health Technologists | 0 (0.0%) | 0 (0.0%) |
| Total (Category) | 18 (50.0%) | 18 (50.0%) |
| Total (Overall) | 145 (50.3%) | 143 (49.6%) |
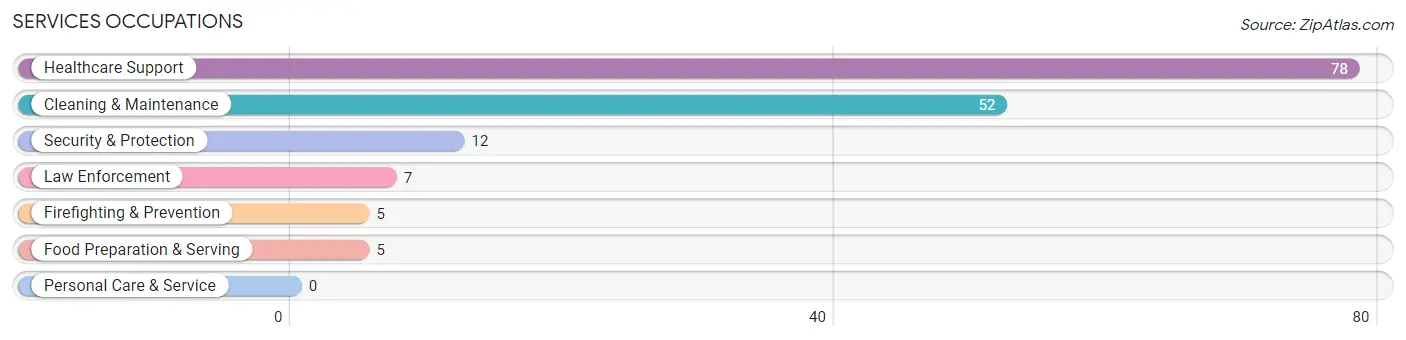
Services Occupations
The most common Services occupations in Hardy are Healthcare Support (78 | 27.1%), Cleaning & Maintenance (52 | 18.1%), Security & Protection (12 | 4.2%), Law Enforcement (7 | 2.4%), and Firefighting & Prevention (5 | 1.7%).
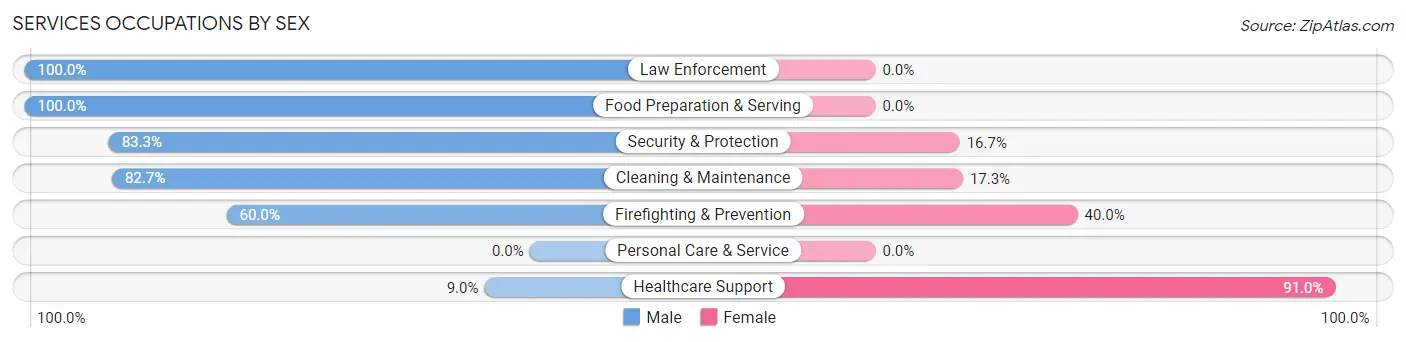
Services Occupations by Sex
Within the Services occupations in Hardy, the most male-oriented occupations are Law Enforcement (100.0%), Food Preparation & Serving (100.0%), and Security & Protection (83.3%), while the most female-oriented occupations are Healthcare Support (91.0%), Firefighting & Prevention (40.0%), and Cleaning & Maintenance (17.3%).
| Occupation | Male | Female |
| Healthcare Support | 7 (9.0%) | 71 (91.0%) |
| Security & Protection | 10 (83.3%) | 2 (16.7%) |
| Firefighting & Prevention | 3 (60.0%) | 2 (40.0%) |
| Law Enforcement | 7 (100.0%) | 0 (0.0%) |
| Food Preparation & Serving | 5 (100.0%) | 0 (0.0%) |
| Cleaning & Maintenance | 43 (82.7%) | 9 (17.3%) |
| Personal Care & Service | 0 (0.0%) | 0 (0.0%) |
| Total (Category) | 65 (44.2%) | 82 (55.8%) |
| Total (Overall) | 145 (50.3%) | 143 (49.6%) |
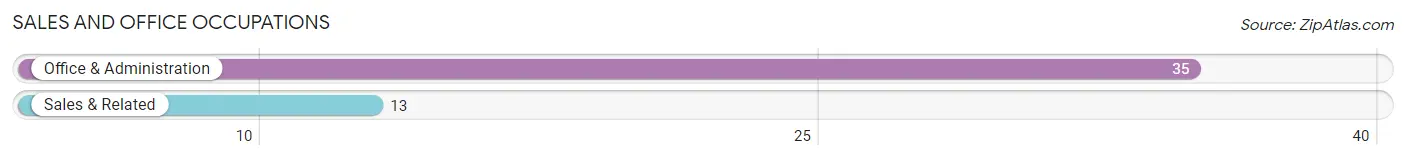
Sales and Office Occupations
The most common Sales and Office occupations in Hardy are Office & Administration (35 | 12.1%), and Sales & Related (13 | 4.5%).
Sales and Office Occupations by Sex
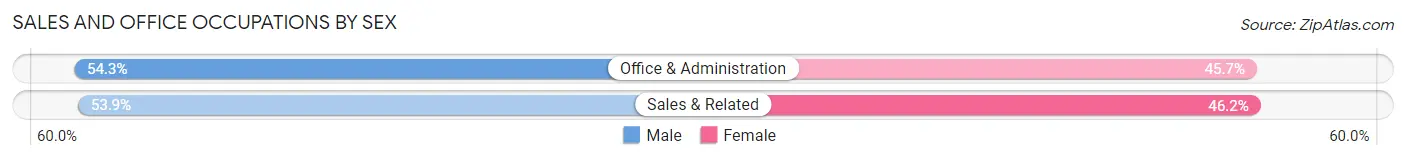
| Occupation | Male | Female |
| Sales & Related | 7 (53.8%) | 6 (46.2%) |
| Office & Administration | 19 (54.3%) | 16 (45.7%) |
| Total (Category) | 26 (54.2%) | 22 (45.8%) |
| Total (Overall) | 145 (50.3%) | 143 (49.6%) |
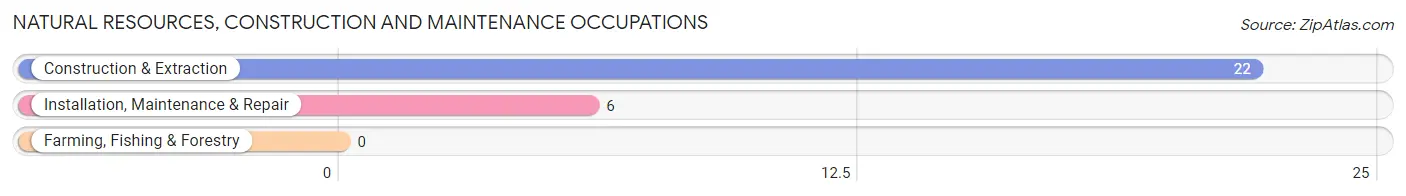
Natural Resources, Construction and Maintenance Occupations
The most common Natural Resources, Construction and Maintenance occupations in Hardy are Construction & Extraction (22 | 7.6%), and Installation, Maintenance & Repair (6 | 2.1%).
Natural Resources, Construction and Maintenance Occupations by Sex
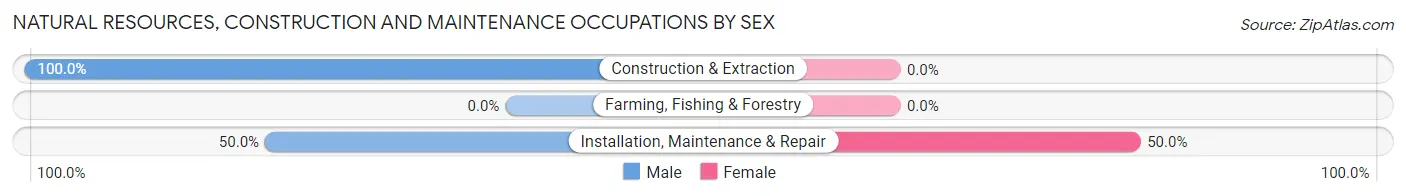
| Occupation | Male | Female |
| Farming, Fishing & Forestry | 0 (0.0%) | 0 (0.0%) |
| Construction & Extraction | 22 (100.0%) | 0 (0.0%) |
| Installation, Maintenance & Repair | 3 (50.0%) | 3 (50.0%) |
| Total (Category) | 25 (89.3%) | 3 (10.7%) |
| Total (Overall) | 145 (50.3%) | 143 (49.6%) |
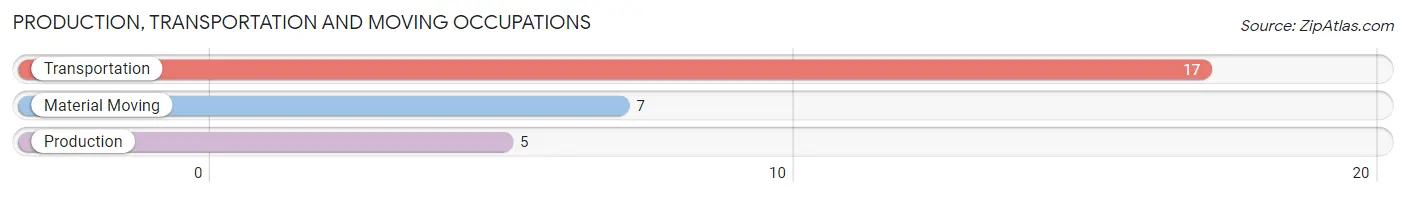
Production, Transportation and Moving Occupations
The most common Production, Transportation and Moving occupations in Hardy are Transportation (17 | 5.9%), Material Moving (7 | 2.4%), and Production (5 | 1.7%).
Production, Transportation and Moving Occupations by Sex
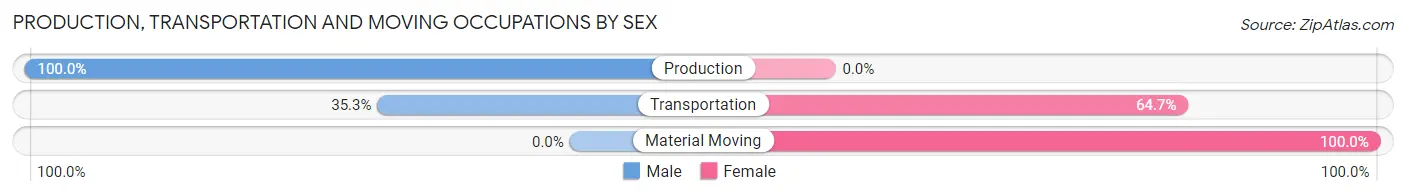
| Occupation | Male | Female |
| Production | 5 (100.0%) | 0 (0.0%) |
| Transportation | 6 (35.3%) | 11 (64.7%) |
| Material Moving | 0 (0.0%) | 7 (100.0%) |
| Total (Category) | 11 (37.9%) | 18 (62.1%) |
| Total (Overall) | 145 (50.3%) | 143 (49.6%) |
Employment Industries by Sex in Hardy
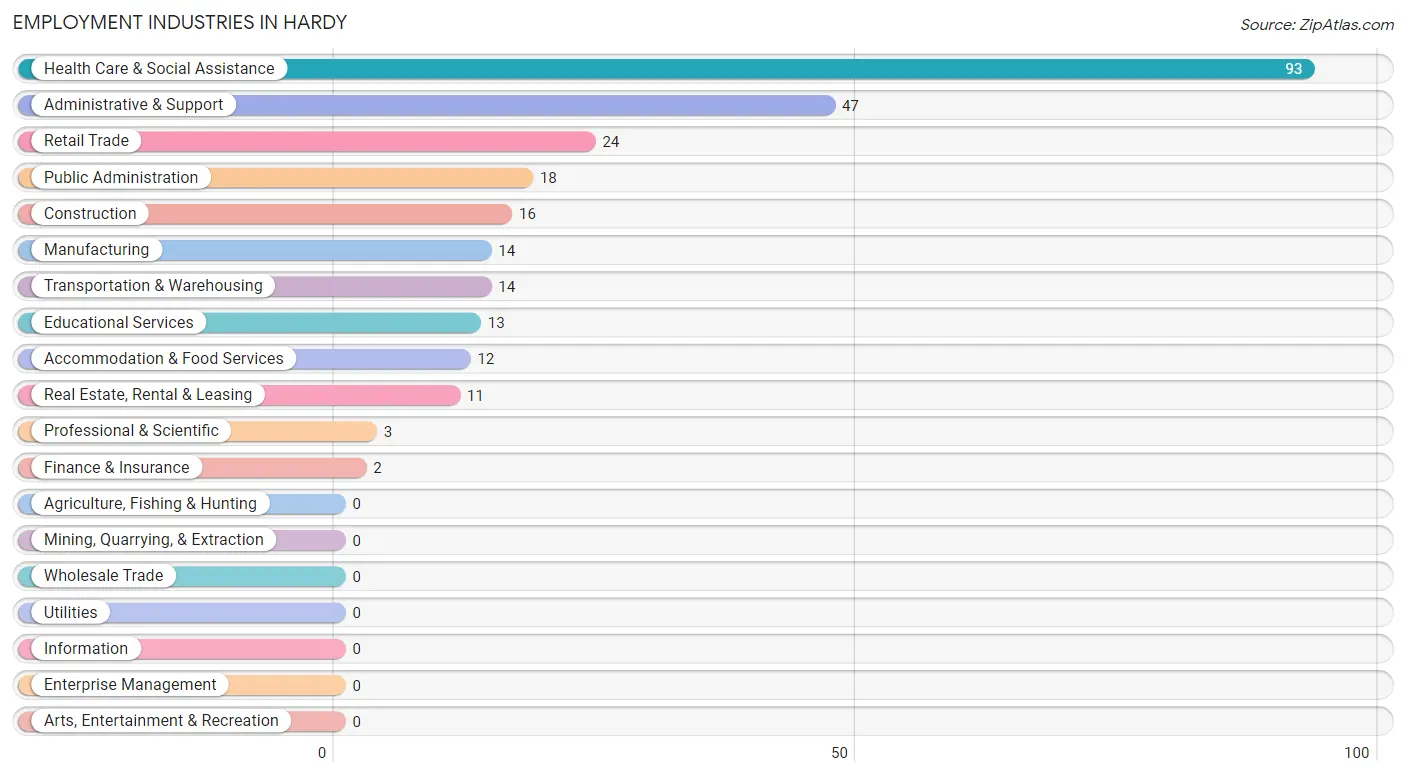
Employment Industries in Hardy
The major employment industries in Hardy include Health Care & Social Assistance (93 | 32.3%), Administrative & Support (47 | 16.3%), Retail Trade (24 | 8.3%), Public Administration (18 | 6.2%), and Construction (16 | 5.6%).
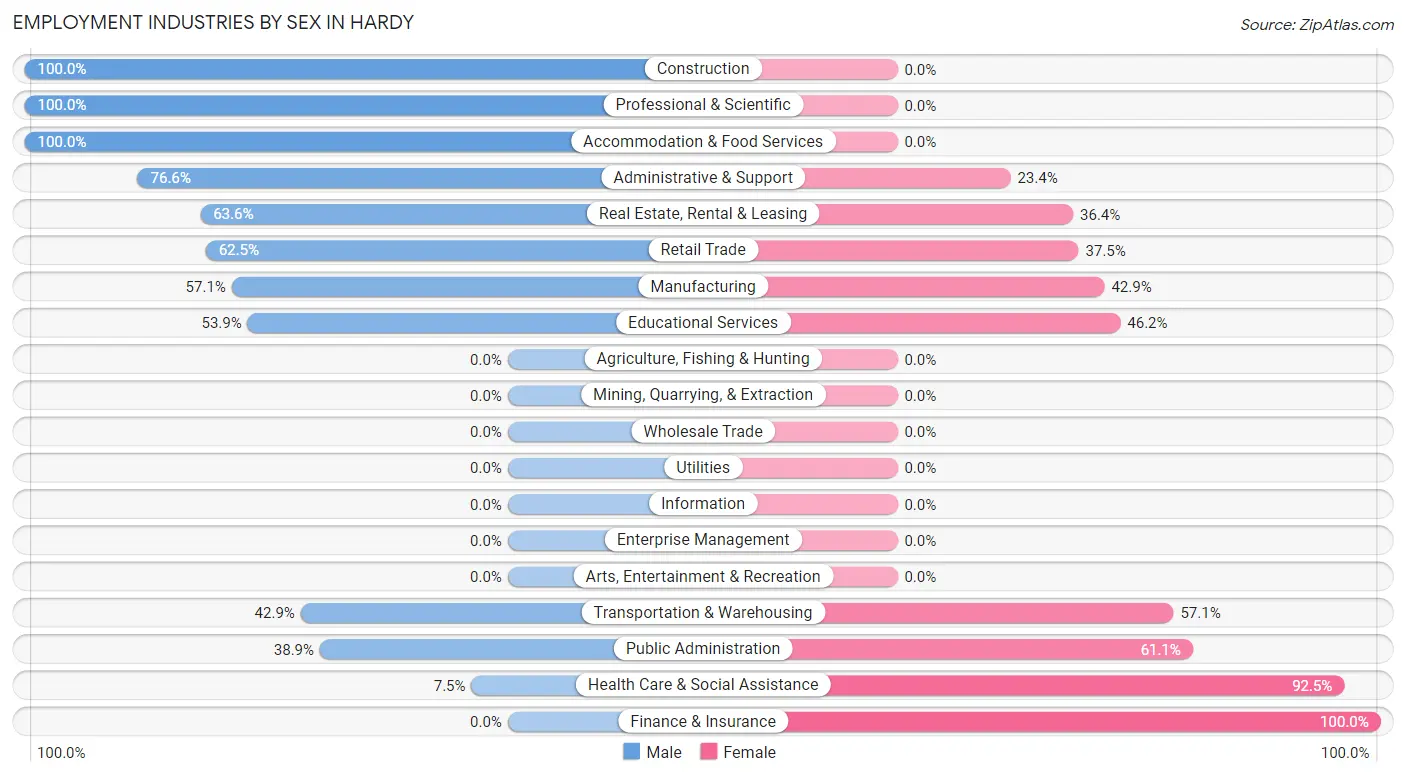
Employment Industries by Sex in Hardy
The Hardy industries that see more men than women are Construction (100.0%), Professional & Scientific (100.0%), and Accommodation & Food Services (100.0%), whereas the industries that tend to have a higher number of women are Finance & Insurance (100.0%), Health Care & Social Assistance (92.5%), and Public Administration (61.1%).
| Industry | Male | Female |
| Agriculture, Fishing & Hunting | 0 (0.0%) | 0 (0.0%) |
| Mining, Quarrying, & Extraction | 0 (0.0%) | 0 (0.0%) |
| Construction | 16 (100.0%) | 0 (0.0%) |
| Manufacturing | 8 (57.1%) | 6 (42.9%) |
| Wholesale Trade | 0 (0.0%) | 0 (0.0%) |
| Retail Trade | 15 (62.5%) | 9 (37.5%) |
| Transportation & Warehousing | 6 (42.9%) | 8 (57.1%) |
| Utilities | 0 (0.0%) | 0 (0.0%) |
| Information | 0 (0.0%) | 0 (0.0%) |
| Finance & Insurance | 0 (0.0%) | 2 (100.0%) |
| Real Estate, Rental & Leasing | 7 (63.6%) | 4 (36.4%) |
| Professional & Scientific | 3 (100.0%) | 0 (0.0%) |
| Enterprise Management | 0 (0.0%) | 0 (0.0%) |
| Administrative & Support | 36 (76.6%) | 11 (23.4%) |
| Educational Services | 7 (53.8%) | 6 (46.2%) |
| Health Care & Social Assistance | 7 (7.5%) | 86 (92.5%) |
| Arts, Entertainment & Recreation | 0 (0.0%) | 0 (0.0%) |
| Accommodation & Food Services | 12 (100.0%) | 0 (0.0%) |
| Public Administration | 7 (38.9%) | 11 (61.1%) |
| Total | 145 (50.3%) | 143 (49.6%) |
Education in Hardy
School Enrollment in Hardy
The most common levels of schooling among the 87 students in Hardy are elementary school (49 | 56.3%), high school (25 | 28.7%), and nursery / preschool (5 | 5.8%).
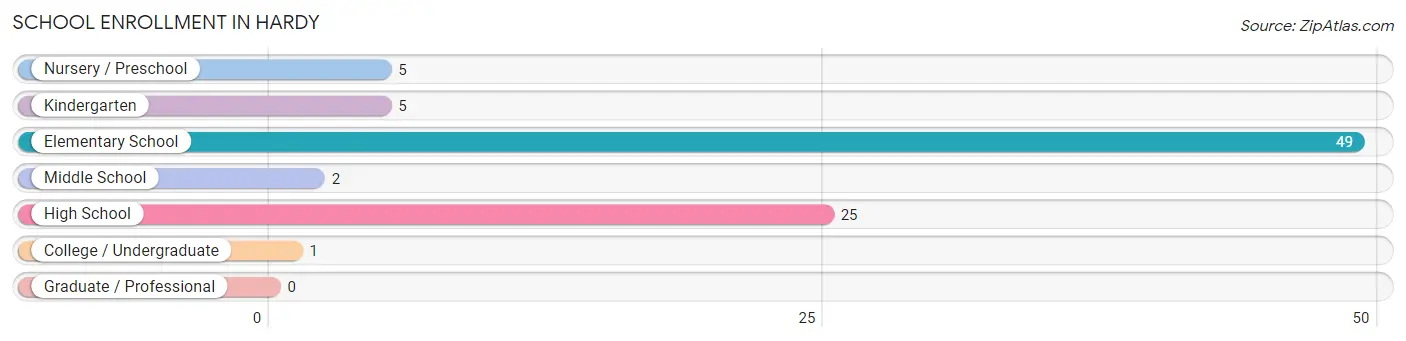
| School Level | # Students | % Students |
| Nursery / Preschool | 5 | 5.8% |
| Kindergarten | 5 | 5.8% |
| Elementary School | 49 | 56.3% |
| Middle School | 2 | 2.3% |
| High School | 25 | 28.7% |
| College / Undergraduate | 1 | 1.1% |
| Graduate / Professional | 0 | 0.0% |
| Total | 87 | 100.0% |
School Enrollment by Age by Funding Source in Hardy
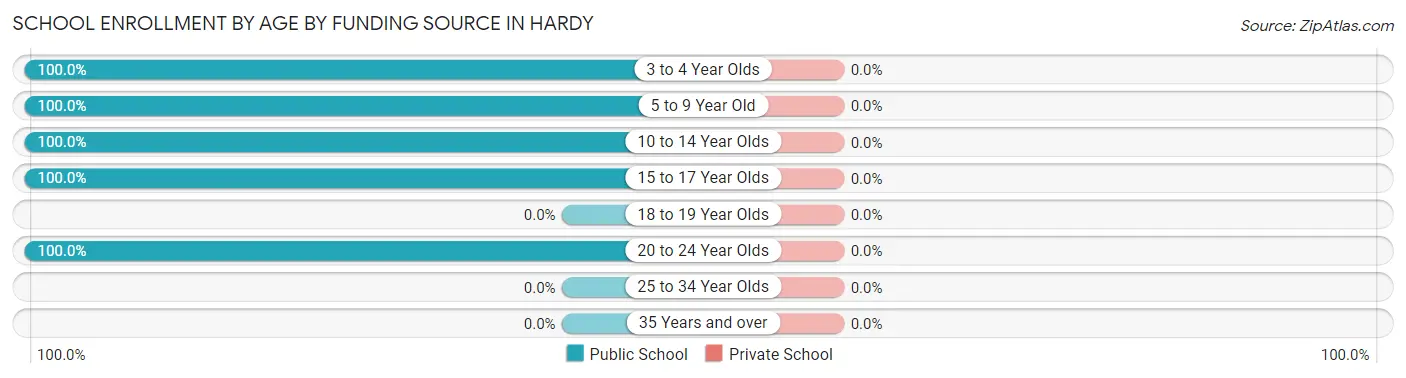
| Age Bracket | Public School | Private School |
| 3 to 4 Year Olds | 5 (100.0%) | 0 (0.0%) |
| 5 to 9 Year Old | 54 (100.0%) | 0 (0.0%) |
| 10 to 14 Year Olds | 8 (100.0%) | 0 (0.0%) |
| 15 to 17 Year Olds | 19 (100.0%) | 0 (0.0%) |
| 18 to 19 Year Olds | 0 (0.0%) | 0 (0.0%) |
| 20 to 24 Year Olds | 1 (100.0%) | 0 (0.0%) |
| 25 to 34 Year Olds | 0 (0.0%) | 0 (0.0%) |
| 35 Years and over | 0 (0.0%) | 0 (0.0%) |
| Total | 87 (100.0%) | 0 (0.0%) |
Educational Attainment by Field of Study in Hardy
Science & technology (16 | 19.5%), business (16 | 19.5%), literature & languages (8 | 9.8%), liberal arts & history (8 | 9.8%), and psychology (7 | 8.5%) are the most common fields of study among 82 individuals in Hardy who have obtained a bachelor's degree or higher.
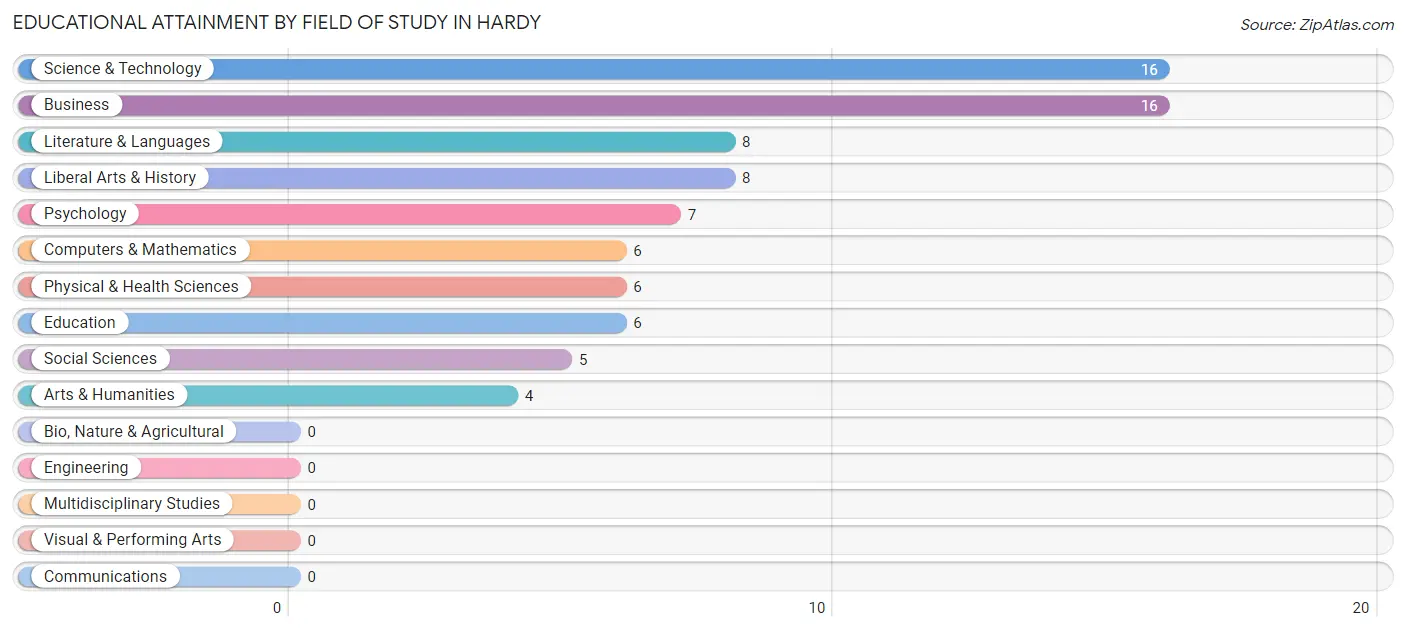
| Field of Study | # Graduates | % Graduates |
| Computers & Mathematics | 6 | 7.3% |
| Bio, Nature & Agricultural | 0 | 0.0% |
| Physical & Health Sciences | 6 | 7.3% |
| Psychology | 7 | 8.5% |
| Social Sciences | 5 | 6.1% |
| Engineering | 0 | 0.0% |
| Multidisciplinary Studies | 0 | 0.0% |
| Science & Technology | 16 | 19.5% |
| Business | 16 | 19.5% |
| Education | 6 | 7.3% |
| Literature & Languages | 8 | 9.8% |
| Liberal Arts & History | 8 | 9.8% |
| Visual & Performing Arts | 0 | 0.0% |
| Communications | 0 | 0.0% |
| Arts & Humanities | 4 | 4.9% |
| Total | 82 | 100.0% |
Transportation & Commute in Hardy
Vehicle Availability by Sex in Hardy
The most prevalent vehicle ownership categories in Hardy are males with 2 vehicles (56, accounting for 41.8%) and females with 2 vehicles (104, making up 39.2%).
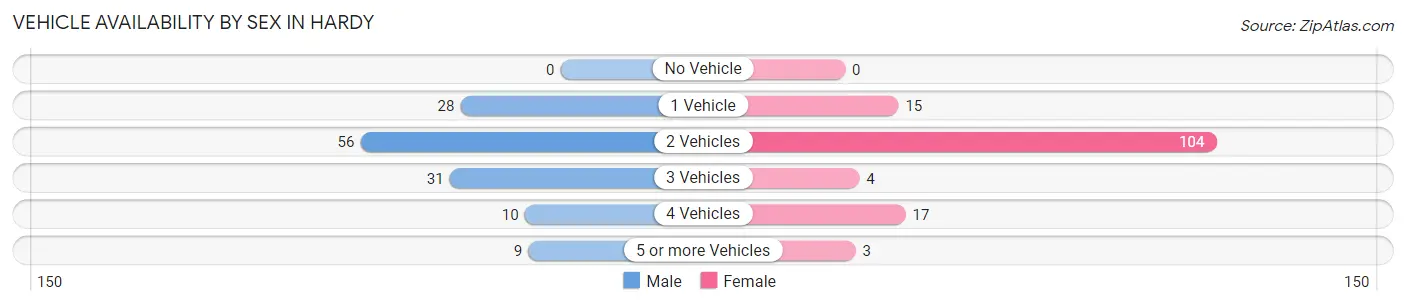
| Vehicles Available | Male | Female |
| No Vehicle | 0 (0.0%) | 0 (0.0%) |
| 1 Vehicle | 28 (20.9%) | 15 (10.5%) |
| 2 Vehicles | 56 (41.8%) | 104 (72.7%) |
| 3 Vehicles | 31 (23.1%) | 4 (2.8%) |
| 4 Vehicles | 10 (7.5%) | 17 (11.9%) |
| 5 or more Vehicles | 9 (6.7%) | 3 (2.1%) |
| Total | 134 (100.0%) | 143 (100.0%) |
Commute Time in Hardy
The most frequently occuring commute durations in Hardy are 45 to 59 minutes (76 commuters, 30.3%), less than 5 minutes (40 commuters, 15.9%), and 60 to 89 minutes (36 commuters, 14.3%).
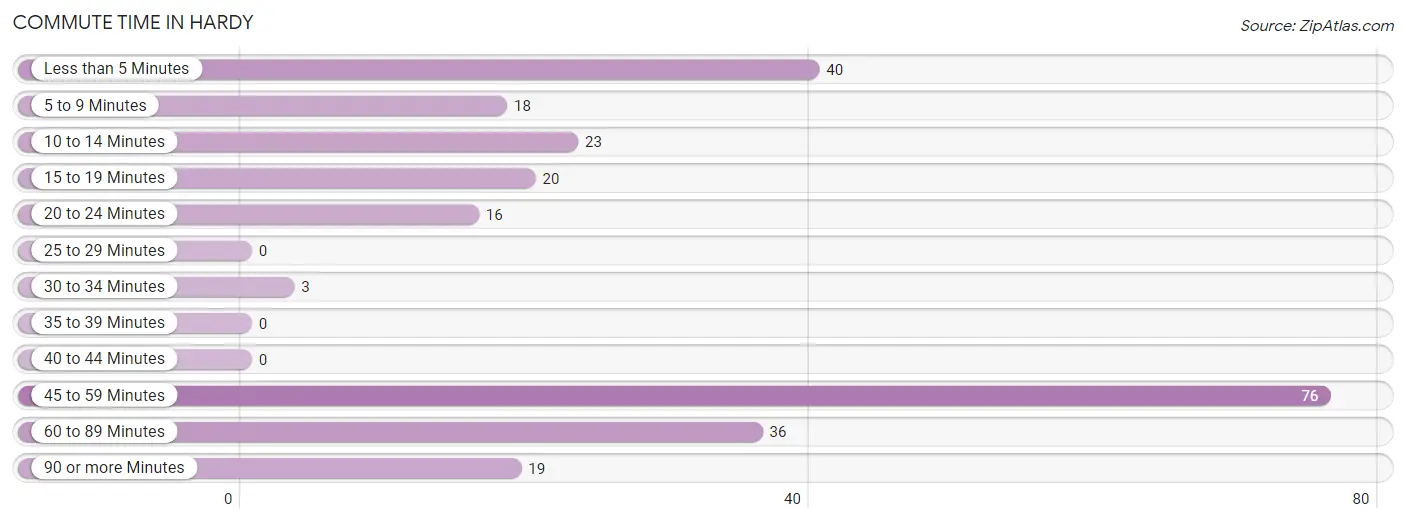
| Commute Time | # Commuters | % Commuters |
| Less than 5 Minutes | 40 | 15.9% |
| 5 to 9 Minutes | 18 | 7.2% |
| 10 to 14 Minutes | 23 | 9.2% |
| 15 to 19 Minutes | 20 | 8.0% |
| 20 to 24 Minutes | 16 | 6.4% |
| 25 to 29 Minutes | 0 | 0.0% |
| 30 to 34 Minutes | 3 | 1.2% |
| 35 to 39 Minutes | 0 | 0.0% |
| 40 to 44 Minutes | 0 | 0.0% |
| 45 to 59 Minutes | 76 | 30.3% |
| 60 to 89 Minutes | 36 | 14.3% |
| 90 or more Minutes | 19 | 7.6% |
Commute Time by Sex in Hardy
The most common commute times in Hardy are 60 to 89 minutes (36 commuters, 30.8%) for males and 45 to 59 minutes (69 commuters, 51.5%) for females.
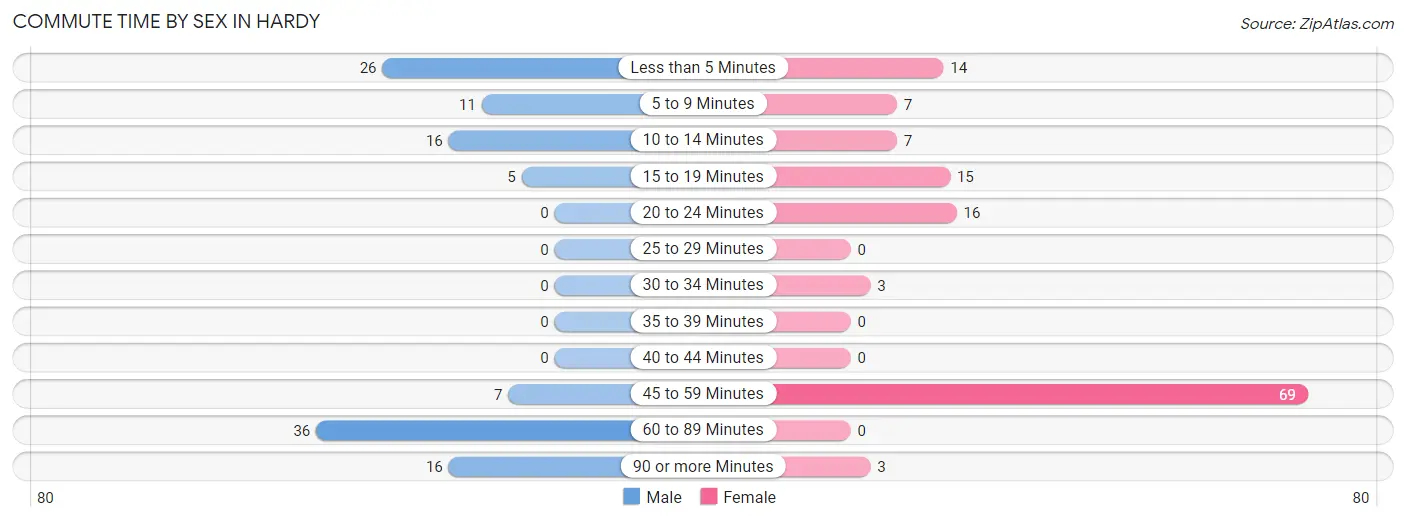
| Commute Time | Male | Female |
| Less than 5 Minutes | 26 (22.2%) | 14 (10.4%) |
| 5 to 9 Minutes | 11 (9.4%) | 7 (5.2%) |
| 10 to 14 Minutes | 16 (13.7%) | 7 (5.2%) |
| 15 to 19 Minutes | 5 (4.3%) | 15 (11.2%) |
| 20 to 24 Minutes | 0 (0.0%) | 16 (11.9%) |
| 25 to 29 Minutes | 0 (0.0%) | 0 (0.0%) |
| 30 to 34 Minutes | 0 (0.0%) | 3 (2.2%) |
| 35 to 39 Minutes | 0 (0.0%) | 0 (0.0%) |
| 40 to 44 Minutes | 0 (0.0%) | 0 (0.0%) |
| 45 to 59 Minutes | 7 (6.0%) | 69 (51.5%) |
| 60 to 89 Minutes | 36 (30.8%) | 0 (0.0%) |
| 90 or more Minutes | 16 (13.7%) | 3 (2.2%) |
Time of Departure to Work by Sex in Hardy
The most frequent times of departure to work in Hardy are 6:00 AM to 6:29 AM (59, 50.4%) for males and 8:30 AM to 8:59 AM (69, 51.5%) for females.
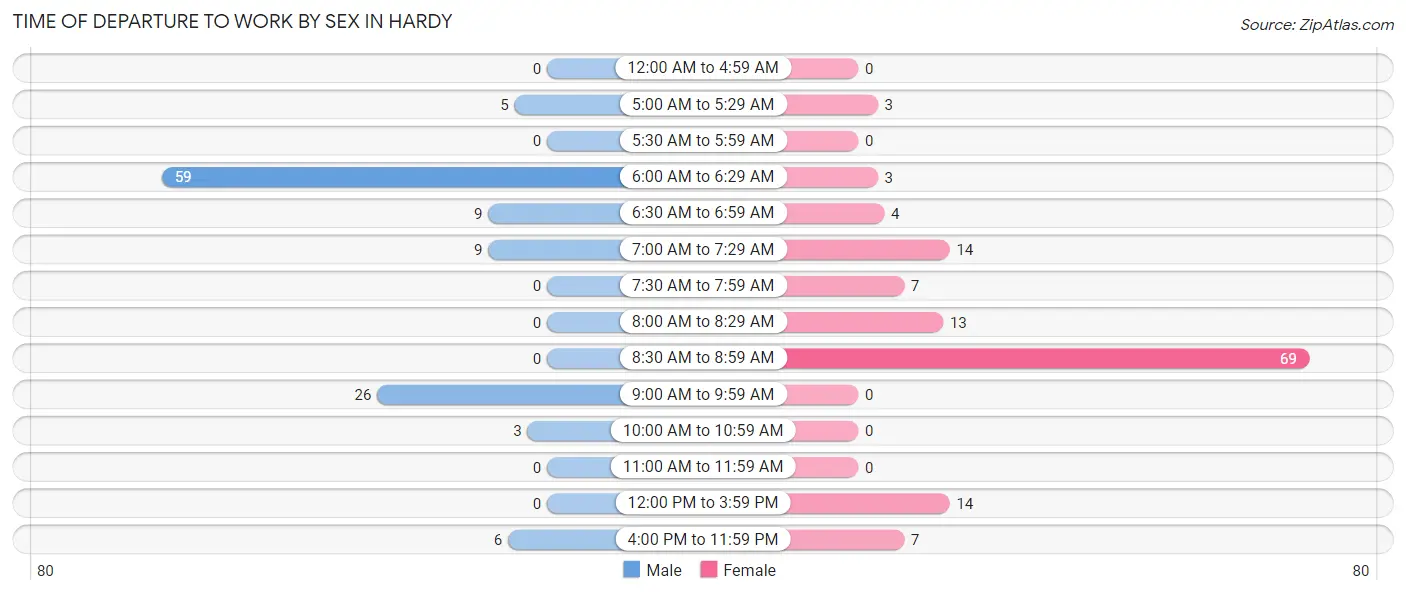
| Time of Departure | Male | Female |
| 12:00 AM to 4:59 AM | 0 (0.0%) | 0 (0.0%) |
| 5:00 AM to 5:29 AM | 5 (4.3%) | 3 (2.2%) |
| 5:30 AM to 5:59 AM | 0 (0.0%) | 0 (0.0%) |
| 6:00 AM to 6:29 AM | 59 (50.4%) | 3 (2.2%) |
| 6:30 AM to 6:59 AM | 9 (7.7%) | 4 (3.0%) |
| 7:00 AM to 7:29 AM | 9 (7.7%) | 14 (10.4%) |
| 7:30 AM to 7:59 AM | 0 (0.0%) | 7 (5.2%) |
| 8:00 AM to 8:29 AM | 0 (0.0%) | 13 (9.7%) |
| 8:30 AM to 8:59 AM | 0 (0.0%) | 69 (51.5%) |
| 9:00 AM to 9:59 AM | 26 (22.2%) | 0 (0.0%) |
| 10:00 AM to 10:59 AM | 3 (2.6%) | 0 (0.0%) |
| 11:00 AM to 11:59 AM | 0 (0.0%) | 0 (0.0%) |
| 12:00 PM to 3:59 PM | 0 (0.0%) | 14 (10.4%) |
| 4:00 PM to 11:59 PM | 6 (5.1%) | 7 (5.2%) |
| Total | 117 (100.0%) | 134 (100.0%) |
Housing Occupancy in Hardy
Occupancy by Ownership in Hardy
Of the total 409 dwellings in Hardy, owner-occupied units account for 302 (73.8%), while renter-occupied units make up 107 (26.2%).
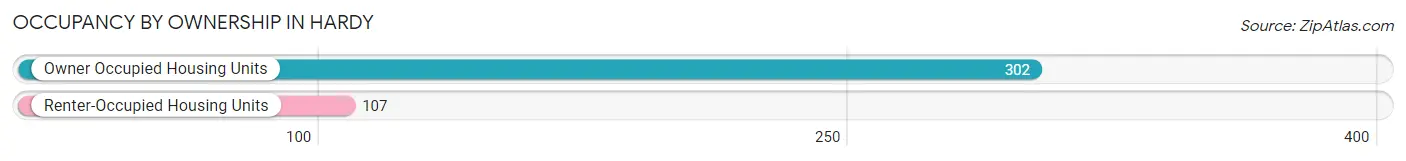
| Occupancy | # Housing Units | % Housing Units |
| Owner Occupied Housing Units | 302 | 73.8% |
| Renter-Occupied Housing Units | 107 | 26.2% |
| Total Occupied Housing Units | 409 | 100.0% |
Occupancy by Household Size in Hardy
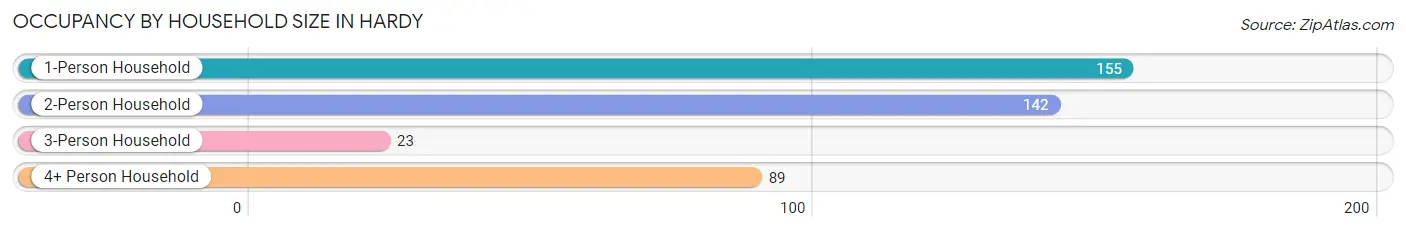
| Household Size | # Housing Units | % Housing Units |
| 1-Person Household | 155 | 37.9% |
| 2-Person Household | 142 | 34.7% |
| 3-Person Household | 23 | 5.6% |
| 4+ Person Household | 89 | 21.8% |
| Total Housing Units | 409 | 100.0% |
Occupancy by Ownership by Household Size in Hardy
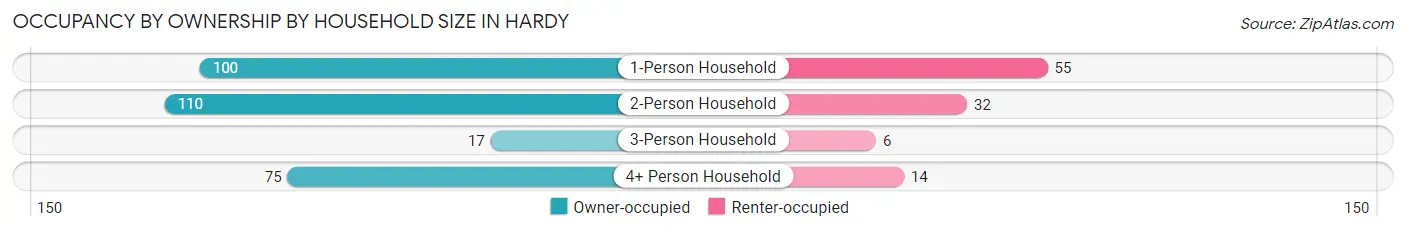
| Household Size | Owner-occupied | Renter-occupied |
| 1-Person Household | 100 (64.5%) | 55 (35.5%) |
| 2-Person Household | 110 (77.5%) | 32 (22.5%) |
| 3-Person Household | 17 (73.9%) | 6 (26.1%) |
| 4+ Person Household | 75 (84.3%) | 14 (15.7%) |
| Total Housing Units | 302 (73.8%) | 107 (26.2%) |
Occupancy by Educational Attainment in Hardy
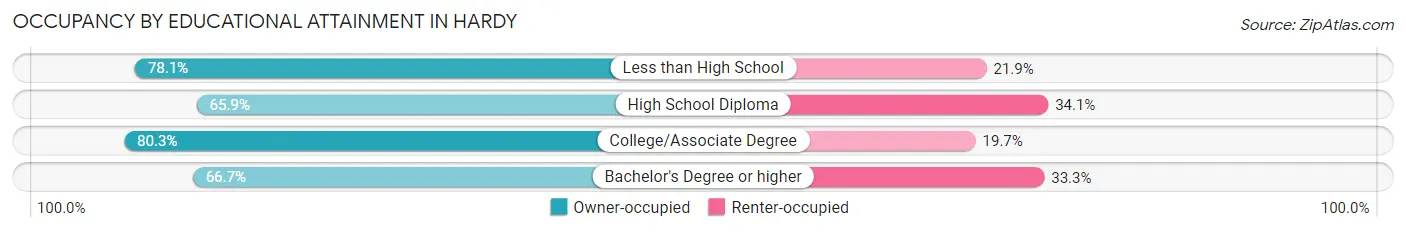
| Household Size | Owner-occupied | Renter-occupied |
| Less than High School | 75 (78.1%) | 21 (21.9%) |
| High School Diploma | 85 (65.9%) | 44 (34.1%) |
| College/Associate Degree | 114 (80.3%) | 28 (19.7%) |
| Bachelor's Degree or higher | 28 (66.7%) | 14 (33.3%) |
Occupancy by Age of Householder in Hardy
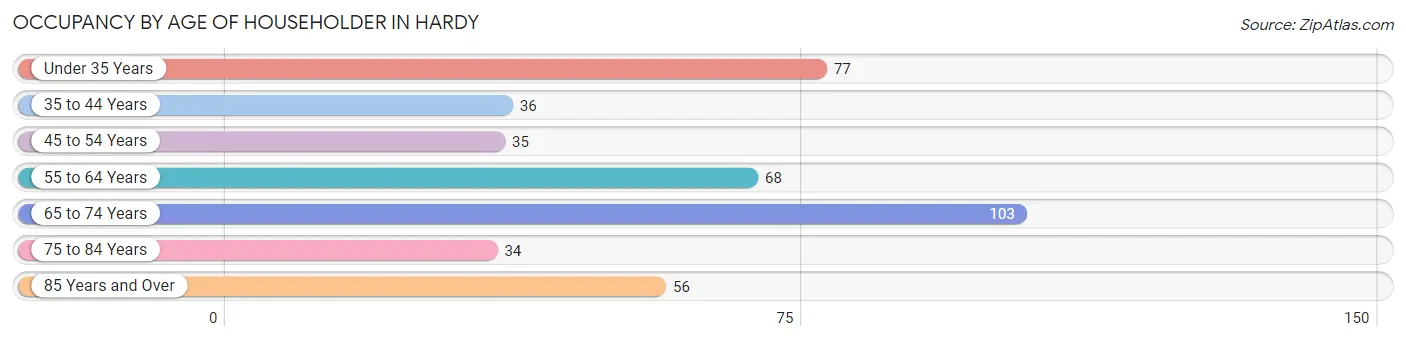
| Age Bracket | # Households | % Households |
| Under 35 Years | 77 | 18.8% |
| 35 to 44 Years | 36 | 8.8% |
| 45 to 54 Years | 35 | 8.6% |
| 55 to 64 Years | 68 | 16.6% |
| 65 to 74 Years | 103 | 25.2% |
| 75 to 84 Years | 34 | 8.3% |
| 85 Years and Over | 56 | 13.7% |
| Total | 409 | 100.0% |
Housing Finances in Hardy
Median Income by Occupancy in Hardy
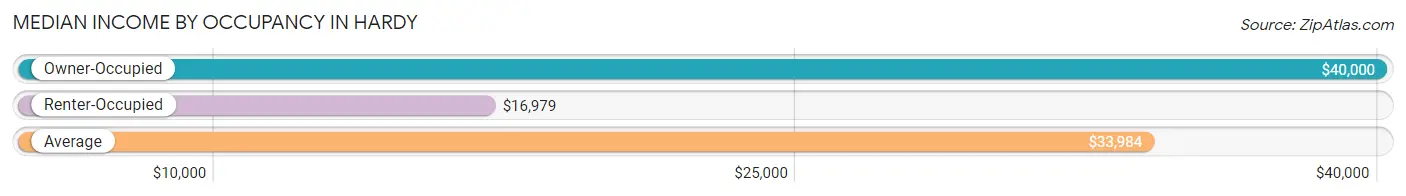
| Occupancy Type | # Households | Median Income |
| Owner-Occupied | 302 (73.8%) | $40,000 |
| Renter-Occupied | 107 (26.2%) | $16,979 |
| Average | 409 (100.0%) | $33,984 |
Occupancy by Householder Income Bracket in Hardy
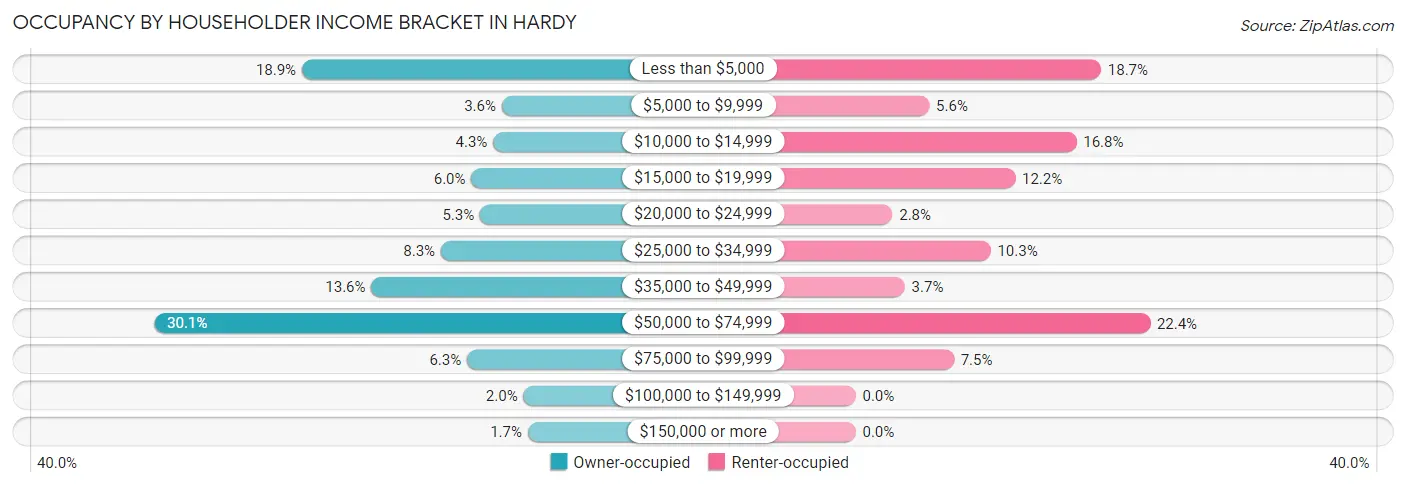
| Income Bracket | Owner-occupied | Renter-occupied |
| Less than $5,000 | 57 (18.9%) | 20 (18.7%) |
| $5,000 to $9,999 | 11 (3.6%) | 6 (5.6%) |
| $10,000 to $14,999 | 13 (4.3%) | 18 (16.8%) |
| $15,000 to $19,999 | 18 (6.0%) | 13 (12.1%) |
| $20,000 to $24,999 | 16 (5.3%) | 3 (2.8%) |
| $25,000 to $34,999 | 25 (8.3%) | 11 (10.3%) |
| $35,000 to $49,999 | 41 (13.6%) | 4 (3.7%) |
| $50,000 to $74,999 | 91 (30.1%) | 24 (22.4%) |
| $75,000 to $99,999 | 19 (6.3%) | 8 (7.5%) |
| $100,000 to $149,999 | 6 (2.0%) | 0 (0.0%) |
| $150,000 or more | 5 (1.7%) | 0 (0.0%) |
| Total | 302 (100.0%) | 107 (100.0%) |
Monthly Housing Cost Tiers in Hardy
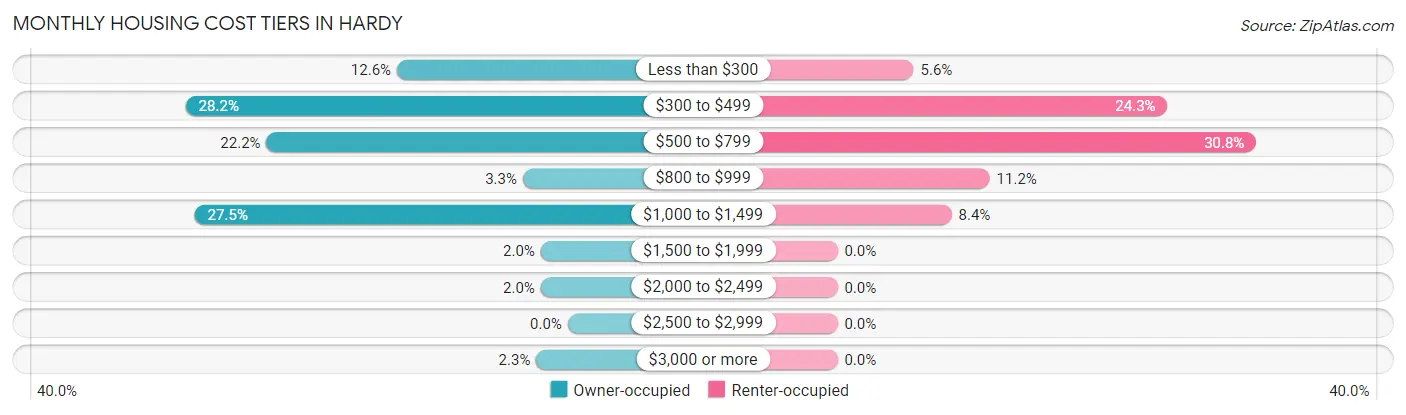
| Monthly Cost | Owner-occupied | Renter-occupied |
| Less than $300 | 38 (12.6%) | 6 (5.6%) |
| $300 to $499 | 85 (28.1%) | 26 (24.3%) |
| $500 to $799 | 67 (22.2%) | 33 (30.8%) |
| $800 to $999 | 10 (3.3%) | 12 (11.2%) |
| $1,000 to $1,499 | 83 (27.5%) | 9 (8.4%) |
| $1,500 to $1,999 | 6 (2.0%) | 0 (0.0%) |
| $2,000 to $2,499 | 6 (2.0%) | 0 (0.0%) |
| $2,500 to $2,999 | 0 (0.0%) | 0 (0.0%) |
| $3,000 or more | 7 (2.3%) | 0 (0.0%) |
| Total | 302 (100.0%) | 107 (100.0%) |
Physical Housing Characteristics in Hardy
Housing Structures in Hardy
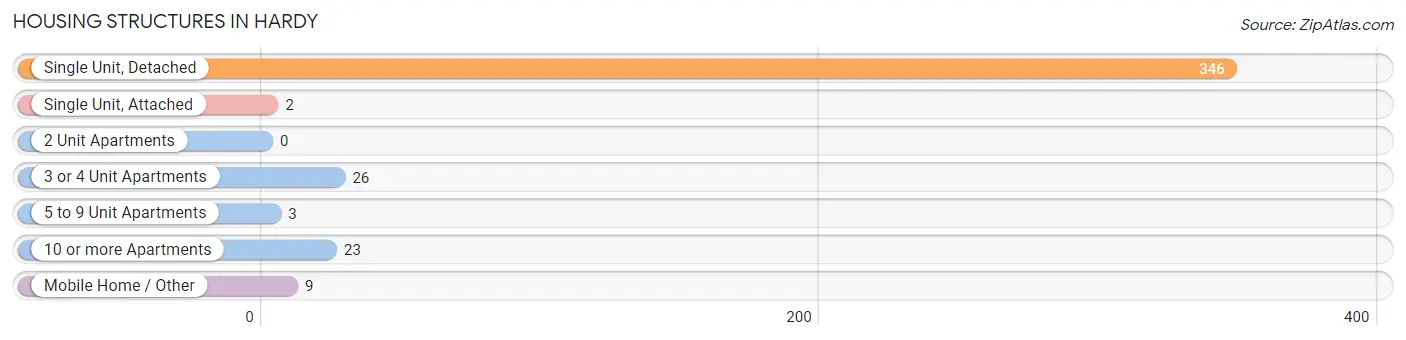
| Structure Type | # Housing Units | % Housing Units |
| Single Unit, Detached | 346 | 84.6% |
| Single Unit, Attached | 2 | 0.5% |
| 2 Unit Apartments | 0 | 0.0% |
| 3 or 4 Unit Apartments | 26 | 6.4% |
| 5 to 9 Unit Apartments | 3 | 0.7% |
| 10 or more Apartments | 23 | 5.6% |
| Mobile Home / Other | 9 | 2.2% |
| Total | 409 | 100.0% |
Housing Structures by Occupancy in Hardy
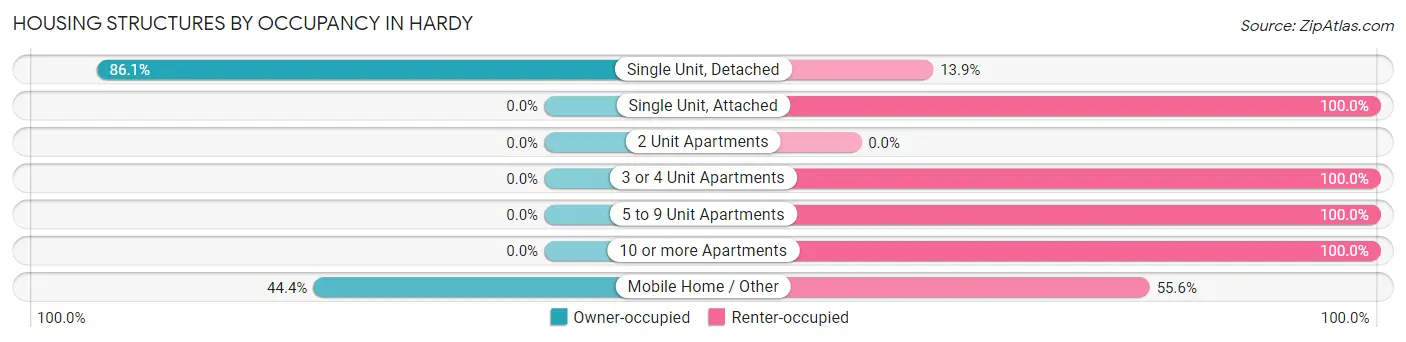
| Structure Type | Owner-occupied | Renter-occupied |
| Single Unit, Detached | 298 (86.1%) | 48 (13.9%) |
| Single Unit, Attached | 0 (0.0%) | 2 (100.0%) |
| 2 Unit Apartments | 0 (0.0%) | 0 (0.0%) |
| 3 or 4 Unit Apartments | 0 (0.0%) | 26 (100.0%) |
| 5 to 9 Unit Apartments | 0 (0.0%) | 3 (100.0%) |
| 10 or more Apartments | 0 (0.0%) | 23 (100.0%) |
| Mobile Home / Other | 4 (44.4%) | 5 (55.6%) |
| Total | 302 (73.8%) | 107 (26.2%) |
Housing Structures by Number of Rooms in Hardy
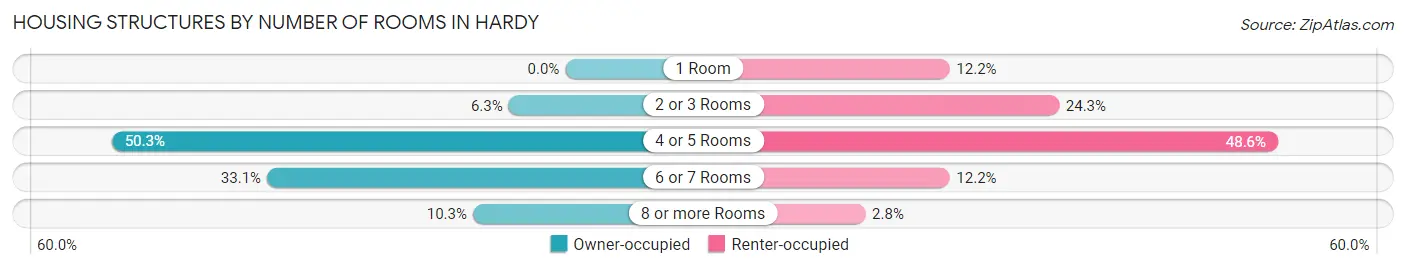
| Number of Rooms | Owner-occupied | Renter-occupied |
| 1 Room | 0 (0.0%) | 13 (12.1%) |
| 2 or 3 Rooms | 19 (6.3%) | 26 (24.3%) |
| 4 or 5 Rooms | 152 (50.3%) | 52 (48.6%) |
| 6 or 7 Rooms | 100 (33.1%) | 13 (12.1%) |
| 8 or more Rooms | 31 (10.3%) | 3 (2.8%) |
| Total | 302 (100.0%) | 107 (100.0%) |
Housing Structure by Heating Type in Hardy
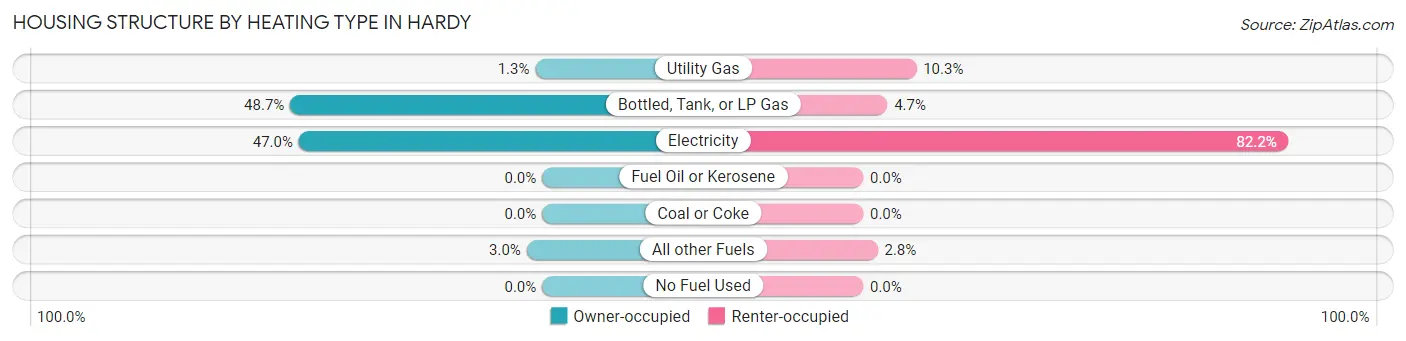
| Heating Type | Owner-occupied | Renter-occupied |
| Utility Gas | 4 (1.3%) | 11 (10.3%) |
| Bottled, Tank, or LP Gas | 147 (48.7%) | 5 (4.7%) |
| Electricity | 142 (47.0%) | 88 (82.2%) |
| Fuel Oil or Kerosene | 0 (0.0%) | 0 (0.0%) |
| Coal or Coke | 0 (0.0%) | 0 (0.0%) |
| All other Fuels | 9 (3.0%) | 3 (2.8%) |
| No Fuel Used | 0 (0.0%) | 0 (0.0%) |
| Total | 302 (100.0%) | 107 (100.0%) |
Household Vehicle Usage in Hardy
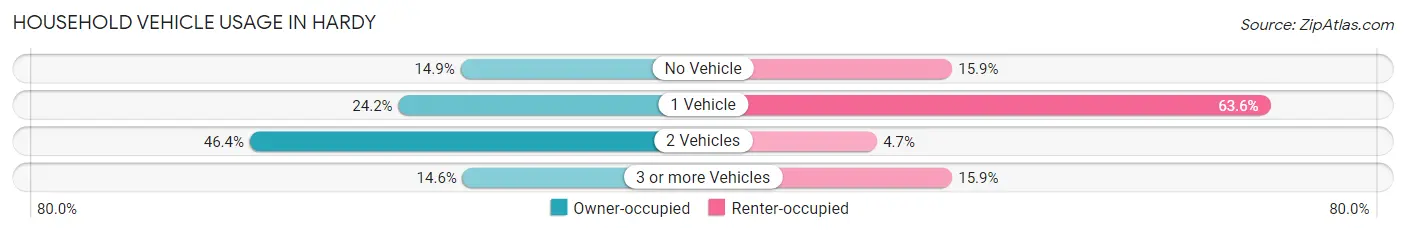
| Vehicles per Household | Owner-occupied | Renter-occupied |
| No Vehicle | 45 (14.9%) | 17 (15.9%) |
| 1 Vehicle | 73 (24.2%) | 68 (63.5%) |
| 2 Vehicles | 140 (46.4%) | 5 (4.7%) |
| 3 or more Vehicles | 44 (14.6%) | 17 (15.9%) |
| Total | 302 (100.0%) | 107 (100.0%) |
Real Estate & Mortgages in Hardy
Real Estate and Mortgage Overview in Hardy
| Characteristic | Without Mortgage | With Mortgage |
| Housing Units | 147 | 155 |
| Median Property Value | $75,000 | $58,400 |
| Median Household Income | - | - |
| Monthly Housing Costs | $408 | $4 |
| Real Estate Taxes | $285 | $5 |
Property Value by Mortgage Status in Hardy
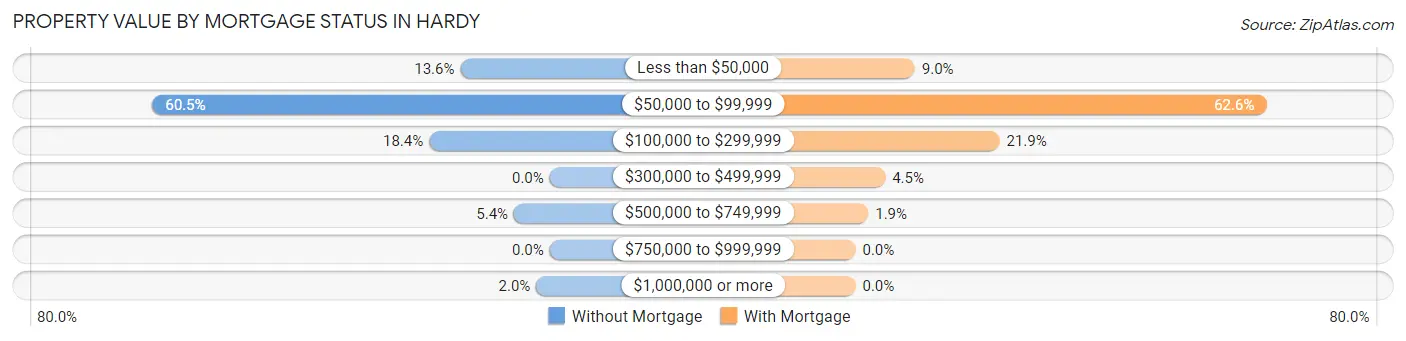
| Property Value | Without Mortgage | With Mortgage |
| Less than $50,000 | 20 (13.6%) | 14 (9.0%) |
| $50,000 to $99,999 | 89 (60.5%) | 97 (62.6%) |
| $100,000 to $299,999 | 27 (18.4%) | 34 (21.9%) |
| $300,000 to $499,999 | 0 (0.0%) | 7 (4.5%) |
| $500,000 to $749,999 | 8 (5.4%) | 3 (1.9%) |
| $750,000 to $999,999 | 0 (0.0%) | 0 (0.0%) |
| $1,000,000 or more | 3 (2.0%) | 0 (0.0%) |
| Total | 147 (100.0%) | 155 (100.0%) |
Household Income by Mortgage Status in Hardy
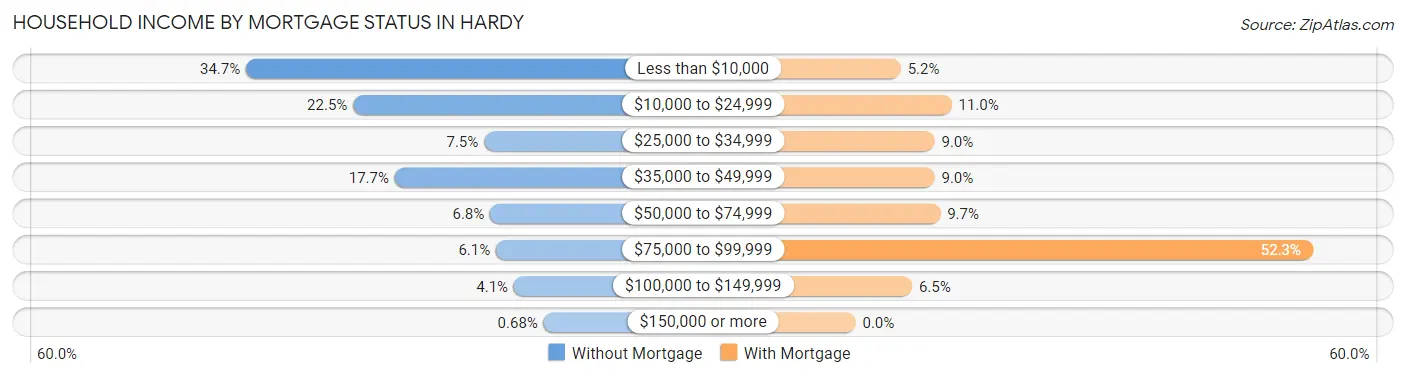
| Household Income | Without Mortgage | With Mortgage |
| Less than $10,000 | 51 (34.7%) | 8 (5.2%) |
| $10,000 to $24,999 | 33 (22.5%) | 17 (11.0%) |
| $25,000 to $34,999 | 11 (7.5%) | 14 (9.0%) |
| $35,000 to $49,999 | 26 (17.7%) | 14 (9.0%) |
| $50,000 to $74,999 | 10 (6.8%) | 15 (9.7%) |
| $75,000 to $99,999 | 9 (6.1%) | 81 (52.3%) |
| $100,000 to $149,999 | 6 (4.1%) | 10 (6.5%) |
| $150,000 or more | 1 (0.7%) | 0 (0.0%) |
| Total | 147 (100.0%) | 155 (100.0%) |
Property Value to Household Income Ratio in Hardy
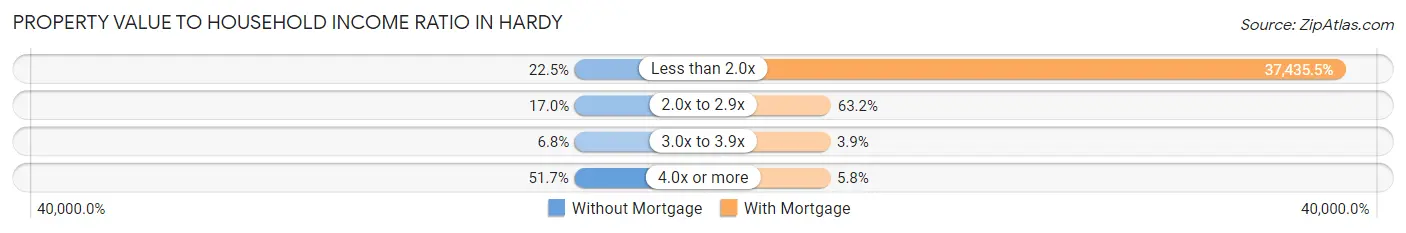
| Value-to-Income Ratio | Without Mortgage | With Mortgage |
| Less than 2.0x | 33 (22.5%) | 58,025 (37,435.5%) |
| 2.0x to 2.9x | 25 (17.0%) | 98 (63.2%) |
| 3.0x to 3.9x | 10 (6.8%) | 6 (3.9%) |
| 4.0x or more | 76 (51.7%) | 9 (5.8%) |
| Total | 147 (100.0%) | 155 (100.0%) |
Real Estate Taxes by Mortgage Status in Hardy
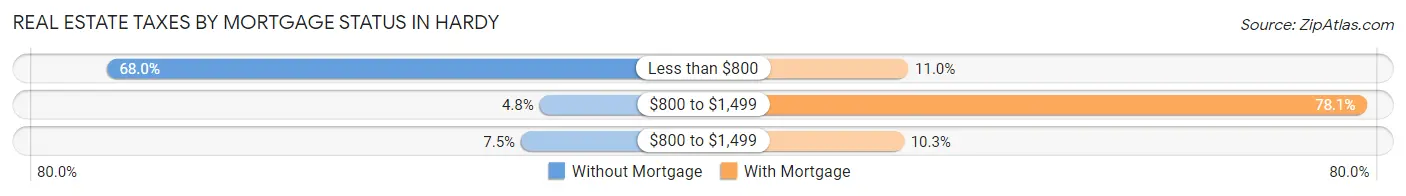
| Property Taxes | Without Mortgage | With Mortgage |
| Less than $800 | 100 (68.0%) | 17 (11.0%) |
| $800 to $1,499 | 7 (4.8%) | 121 (78.1%) |
| $800 to $1,499 | 11 (7.5%) | 16 (10.3%) |
| Total | 147 (100.0%) | 155 (100.0%) |
Health & Disability in Hardy
Health Insurance Coverage by Age in Hardy
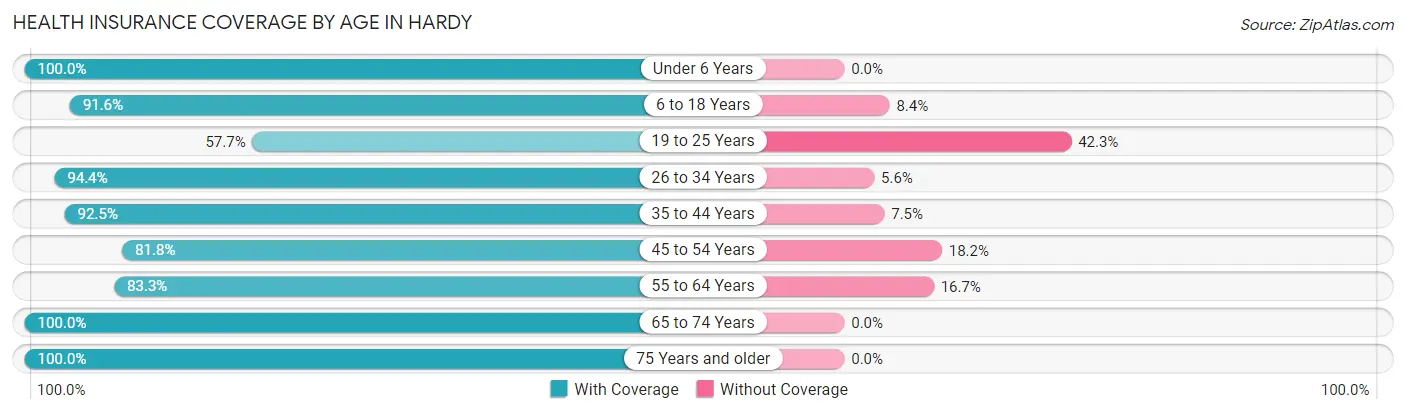
| Age Bracket | With Coverage | Without Coverage |
| Under 6 Years | 46 (100.0%) | 0 (0.0%) |
| 6 to 18 Years | 76 (91.6%) | 7 (8.4%) |
| 19 to 25 Years | 15 (57.7%) | 11 (42.3%) |
| 26 to 34 Years | 119 (94.4%) | 7 (5.6%) |
| 35 to 44 Years | 62 (92.5%) | 5 (7.5%) |
| 45 to 54 Years | 63 (81.8%) | 14 (18.2%) |
| 55 to 64 Years | 70 (83.3%) | 14 (16.7%) |
| 65 to 74 Years | 140 (100.0%) | 0 (0.0%) |
| 75 Years and older | 114 (100.0%) | 0 (0.0%) |
| Total | 705 (92.4%) | 58 (7.6%) |
Health Insurance Coverage by Citizenship Status in Hardy
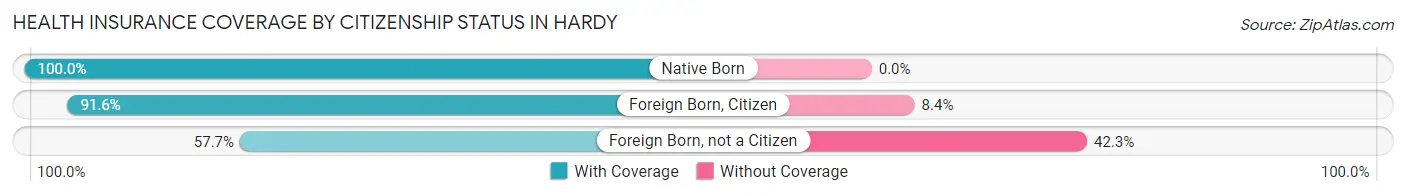
| Citizenship Status | With Coverage | Without Coverage |
| Native Born | 46 (100.0%) | 0 (0.0%) |
| Foreign Born, Citizen | 76 (91.6%) | 7 (8.4%) |
| Foreign Born, not a Citizen | 15 (57.7%) | 11 (42.3%) |
Health Insurance Coverage by Household Income in Hardy
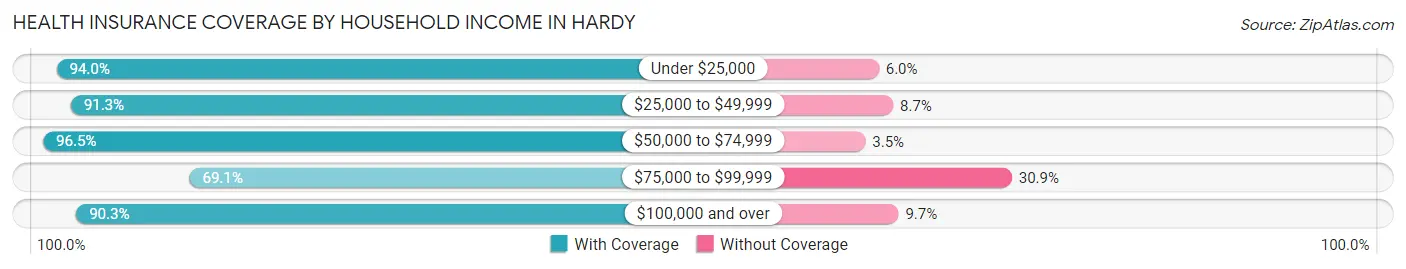
| Household Income | With Coverage | Without Coverage |
| Under $25,000 | 204 (94.0%) | 13 (6.0%) |
| $25,000 to $49,999 | 158 (91.3%) | 15 (8.7%) |
| $50,000 to $74,999 | 277 (96.5%) | 10 (3.5%) |
| $75,000 to $99,999 | 38 (69.1%) | 17 (30.9%) |
| $100,000 and over | 28 (90.3%) | 3 (9.7%) |
Public vs Private Health Insurance Coverage by Age in Hardy
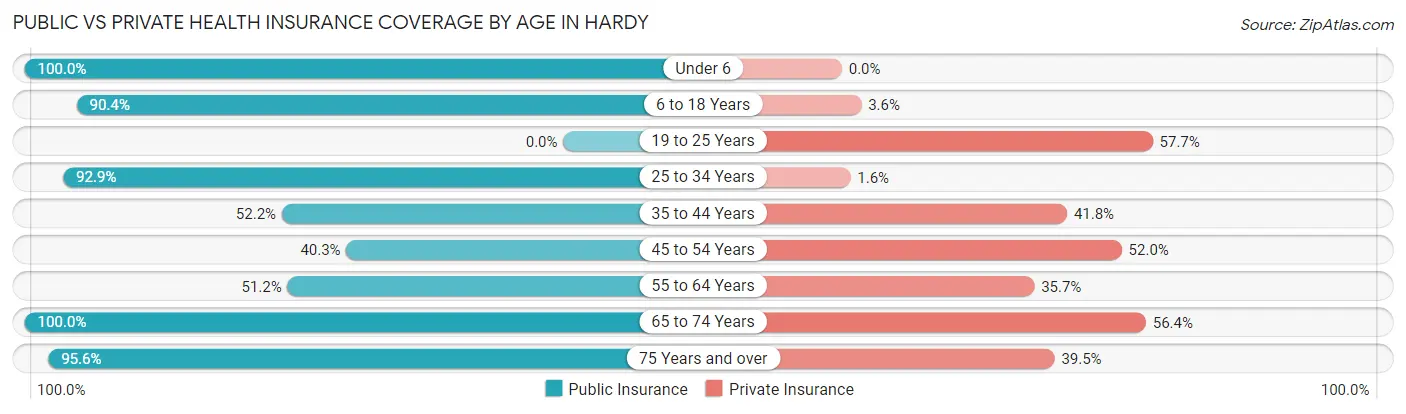
| Age Bracket | Public Insurance | Private Insurance |
| Under 6 | 46 (100.0%) | 0 (0.0%) |
| 6 to 18 Years | 75 (90.4%) | 3 (3.6%) |
| 19 to 25 Years | 0 (0.0%) | 15 (57.7%) |
| 25 to 34 Years | 117 (92.9%) | 2 (1.6%) |
| 35 to 44 Years | 35 (52.2%) | 28 (41.8%) |
| 45 to 54 Years | 31 (40.3%) | 40 (51.9%) |
| 55 to 64 Years | 43 (51.2%) | 30 (35.7%) |
| 65 to 74 Years | 140 (100.0%) | 79 (56.4%) |
| 75 Years and over | 109 (95.6%) | 45 (39.5%) |
| Total | 596 (78.1%) | 242 (31.7%) |
Disability Status by Sex by Age in Hardy
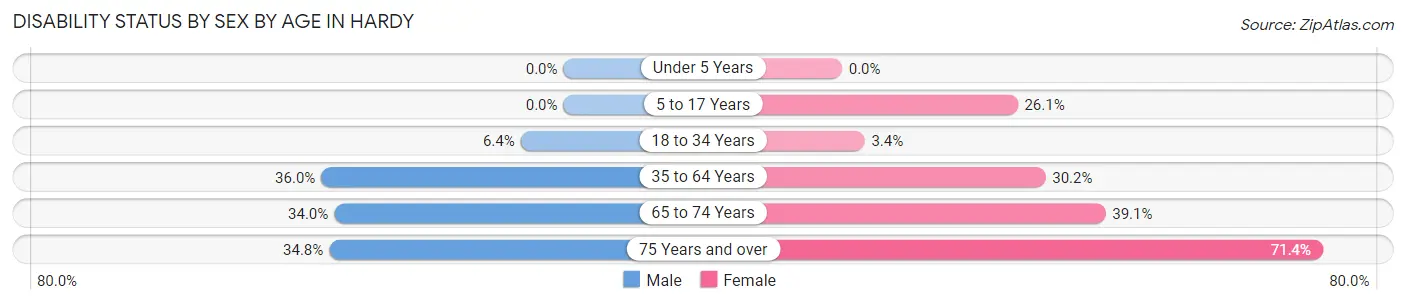
| Age Bracket | Male | Female |
| Under 5 Years | 0 (0.0%) | 0 (0.0%) |
| 5 to 17 Years | 0 (0.0%) | 6 (26.1%) |
| 18 to 34 Years | 4 (6.4%) | 3 (3.4%) |
| 35 to 64 Years | 32 (36.0%) | 42 (30.2%) |
| 65 to 74 Years | 32 (34.0%) | 18 (39.1%) |
| 75 Years and over | 8 (34.8%) | 65 (71.4%) |
Disability Class by Sex by Age in Hardy
Disability Class: Hearing Difficulty
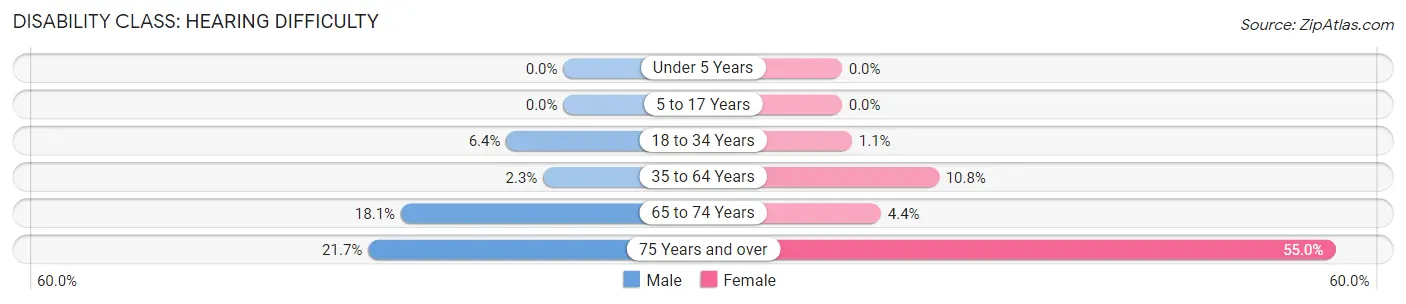
| Age Bracket | Male | Female |
| Under 5 Years | 0 (0.0%) | 0 (0.0%) |
| 5 to 17 Years | 0 (0.0%) | 0 (0.0%) |
| 18 to 34 Years | 4 (6.4%) | 1 (1.1%) |
| 35 to 64 Years | 2 (2.2%) | 15 (10.8%) |
| 65 to 74 Years | 17 (18.1%) | 2 (4.3%) |
| 75 Years and over | 5 (21.7%) | 50 (54.9%) |
Disability Class: Vision Difficulty
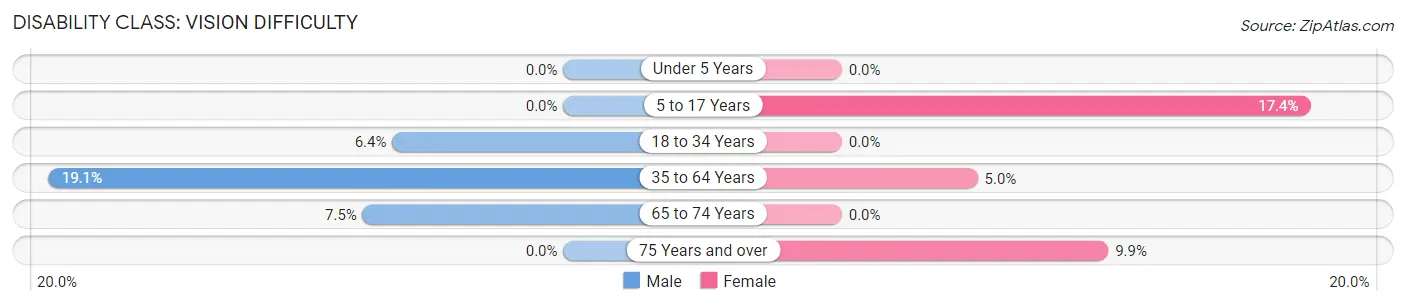
| Age Bracket | Male | Female |
| Under 5 Years | 0 (0.0%) | 0 (0.0%) |
| 5 to 17 Years | 0 (0.0%) | 4 (17.4%) |
| 18 to 34 Years | 4 (6.4%) | 0 (0.0%) |
| 35 to 64 Years | 17 (19.1%) | 7 (5.0%) |
| 65 to 74 Years | 7 (7.4%) | 0 (0.0%) |
| 75 Years and over | 0 (0.0%) | 9 (9.9%) |
Disability Class: Cognitive Difficulty
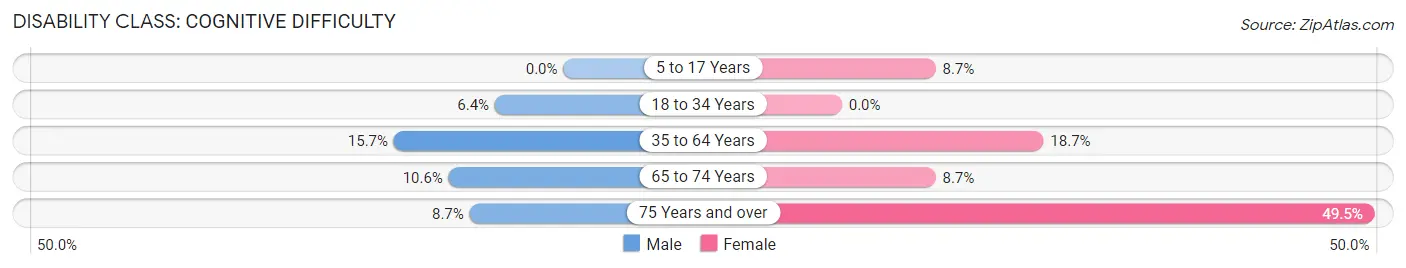
| Age Bracket | Male | Female |
| 5 to 17 Years | 0 (0.0%) | 2 (8.7%) |
| 18 to 34 Years | 4 (6.4%) | 0 (0.0%) |
| 35 to 64 Years | 14 (15.7%) | 26 (18.7%) |
| 65 to 74 Years | 10 (10.6%) | 4 (8.7%) |
| 75 Years and over | 2 (8.7%) | 45 (49.4%) |
Disability Class: Ambulatory Difficulty
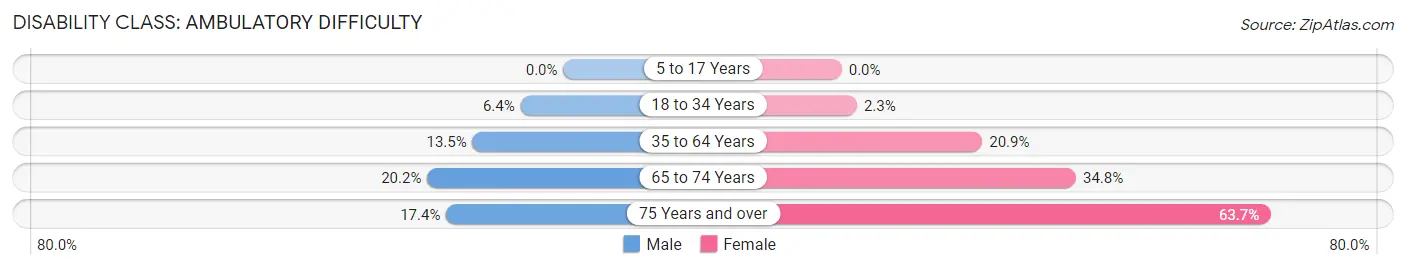
| Age Bracket | Male | Female |
| 5 to 17 Years | 0 (0.0%) | 0 (0.0%) |
| 18 to 34 Years | 4 (6.4%) | 2 (2.2%) |
| 35 to 64 Years | 12 (13.5%) | 29 (20.9%) |
| 65 to 74 Years | 19 (20.2%) | 16 (34.8%) |
| 75 Years and over | 4 (17.4%) | 58 (63.7%) |
Disability Class: Self-Care Difficulty
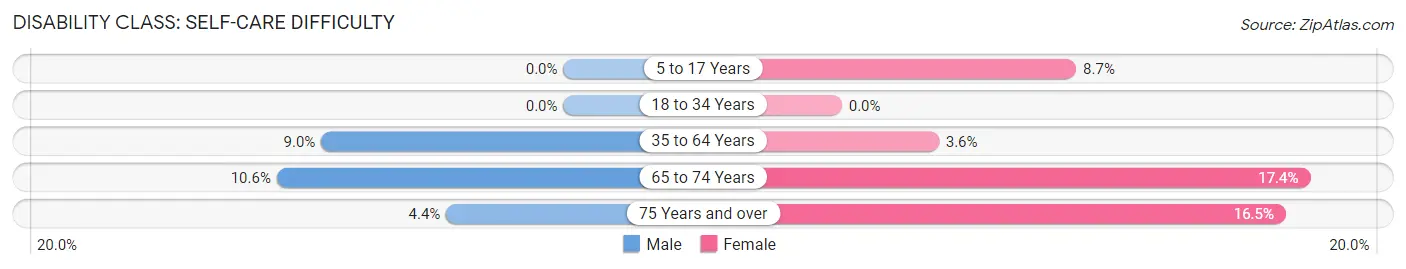
| Age Bracket | Male | Female |
| 5 to 17 Years | 0 (0.0%) | 2 (8.7%) |
| 18 to 34 Years | 0 (0.0%) | 0 (0.0%) |
| 35 to 64 Years | 8 (9.0%) | 5 (3.6%) |
| 65 to 74 Years | 10 (10.6%) | 8 (17.4%) |
| 75 Years and over | 1 (4.3%) | 15 (16.5%) |
Technology Access in Hardy
Computing Device Access in Hardy
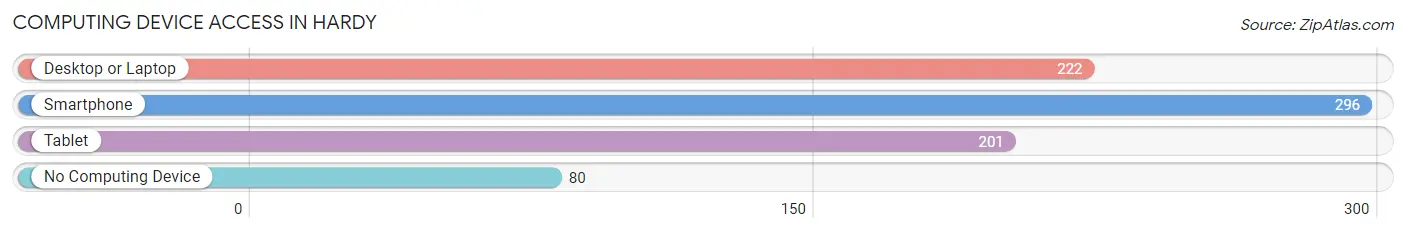
| Device Type | # Households | % Households |
| Desktop or Laptop | 222 | 54.3% |
| Smartphone | 296 | 72.4% |
| Tablet | 201 | 49.1% |
| No Computing Device | 80 | 19.6% |
| Total | 409 | 100.0% |
Internet Access in Hardy
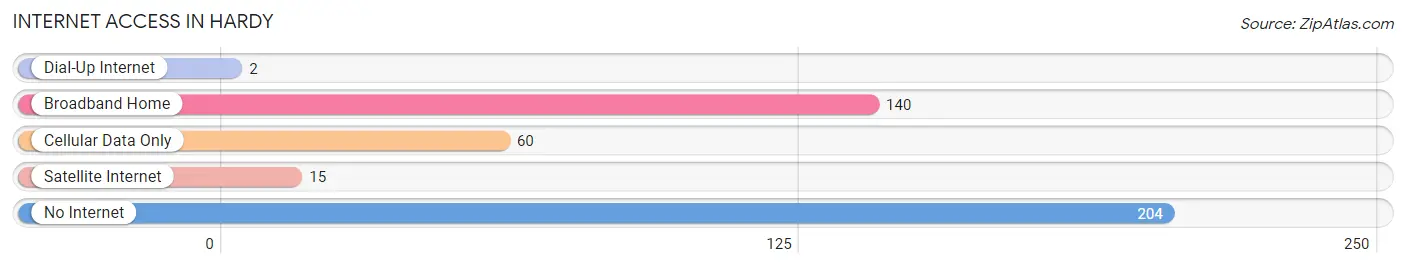
| Internet Type | # Households | % Households |
| Dial-Up Internet | 2 | 0.5% |
| Broadband Home | 140 | 34.2% |
| Cellular Data Only | 60 | 14.7% |
| Satellite Internet | 15 | 3.7% |
| No Internet | 204 | 49.9% |
| Total | 409 | 100.0% |
Hardy Summary
Hardy, Arkansas is a small town located in the northeast corner of the state, in Sharp County. It is situated on the banks of the Spring River, and is surrounded by the Ozark Mountains. The town was founded in 1883, and was named after the first postmaster, William Hardy. The population of Hardy in 2000 was 1,817.
Geography
Hardy is located in the foothills of the Ozark Mountains, and is situated on the banks of the Spring River. The town is located in the northeast corner of the state, in Sharp County. The town is located at an elevation of 545 feet above sea level. The climate in Hardy is mild, with temperatures ranging from the mid-30s in the winter to the mid-80s in the summer.
Economy
The economy of Hardy is largely based on agriculture and tourism. The town is home to several farms, which produce a variety of crops, including corn, soybeans, wheat, and hay. The town is also home to several small businesses, including restaurants, retail stores, and service providers. Tourism is also an important part of the local economy, as the town is located near several popular attractions, including the Ozark National Forest, the Buffalo National River, and the Blanchard Springs Caverns.
Demographics
In 2000, the population of Hardy was 1,817. The racial makeup of the town was 97.3% White, 0.7% African American, 0.3% Native American, 0.2% Asian, 0.1% Pacific Islander, 0.3% from other races, and 1.2% from two or more races. Hispanic or Latino of any race were 1.2% of the population. The median household income in 2000 was $25,938, and the median family income was $31,250.
Conclusion
Hardy, Arkansas is a small town located in the northeast corner of the state, in Sharp County. It is situated on the banks of the Spring River, and is surrounded by the Ozark Mountains. The town was founded in 1883, and was named after the first postmaster, William Hardy. The economy of Hardy is largely based on agriculture and tourism, and the population of the town in 2000 was 1,817. The racial makeup of the town was 97.3% White, 0.7% African American, 0.3% Native American, 0.2% Asian, 0.1% Pacific Islander, 0.3% from other races, and 1.2% from two or more races. The median household income in 2000 was $25,938, and the median family income was $31,250.
Common Questions
What is Per Capita Income in Hardy?
Per Capita income in Hardy is $19,139.
What is the Median Family Income in Hardy?
Median Family Income in Hardy is $57,899.
What is the Median Household income in Hardy?
Median Household Income in Hardy is $33,984.
What is Income or Wage Gap in Hardy?
Income or Wage Gap in Hardy is 62.8%.
Women in Hardy earn 37.2 cents for every dollar earned by a man.
What is Inequality or Gini Index in Hardy?
Inequality or Gini Index in Hardy is 0.46.
What is the Total Population of Hardy?
Total Population of Hardy is 763.
What is the Total Male Population of Hardy?
Total Male Population of Hardy is 340.
What is the Total Female Population of Hardy?
Total Female Population of Hardy is 423.
What is the Ratio of Males per 100 Females in Hardy?
There are 80.38 Males per 100 Females in Hardy.
What is the Ratio of Females per 100 Males in Hardy?
There are 124.41 Females per 100 Males in Hardy.
What is the Median Population Age in Hardy?
Median Population Age in Hardy is 50.2 Years.
What is the Average Family Size in Hardy
Average Family Size in Hardy is 2.4 People.
What is the Average Household Size in Hardy
Average Household Size in Hardy is 1.9 People.
How Large is the Labor Force in Hardy?
There are 299 People in the Labor Forcein in Hardy.
What is the Percentage of People in the Labor Force in Hardy?
46.1% of People are in the Labor Force in Hardy.
What is the Unemployment Rate in Hardy?
Unemployment Rate in Hardy is 3.7%.